- Phân tích
- Tin tức và các công cụ
- Tin tức thị trường
Tin tức thì trường
- EUR/USD trimmed to the downside on Friday, extending into a three day down streak.
- EU inflation brought no surprises, US PCE inflation kept rate bets on balance.
- Coming up next week: Last US NFP jobs data print before next Fed rate call.
EUR/USD tilted further into the red on Friday, extending a downside move into a third straight day and dragging Fiber down to 1.1050 to round out the trading week. EU inflation figures released early Friday failed to impress anybody in particular, and US Personal Consumption Expenditure Price Index (PCE) didn’t stray far from forecasts, keeping broad-market bets on rate cuts aimed squarely at the Federal Reserve’s (Fed) next rate call on September 18.
US PCE figures for July didn’t deliver any notable surprises to round out the trading week. MoM US core PCE inflation held steady at 0.2%, as expected, but the YoY core PCE inflation figure held steady at 2.5% versus the anticipated move up to 2.6%.
Rate markets are holding firmly to 30% odds of an initial double cut for 50 bps from the Federal Reserve (Fed) on September 18, with the remaining 70% leaning into a single quarter-point cut. Overall, rate traders are pricing in 100 bps in total cuts in 2024, according to CME’s FedWatch Tool.
With PCE inflation data out of the way and not giving any warning signs, the way is paved to next week’s Nonfarm Payrolls (NFP) print, one of the last key pieces of economic data standing in the way of the Fed and rate-cut-hungry markets. Next week will also open on a quiet note, with US exchanges slated to remain shuttered for the Labor Day holiday. Some Purchasing Managers Index (PMI) releases are also scattered throughout the trading week.
EUR/USD price forecast
A third downside has tilted Fiber firmly into a bearish pullback, and EUR/USD price action is already halfway to the nearest technical level at the 50-day Exponential Moving Average (EMA) rising through 1.0950.
While EUR/USD is still trading firmly in bull country north of the 200-day EMA at 1.0855, bids have dropped the Fiber precipitously from yearly peaks reached earlier this week, and bearish momentum could develop some heat.
EUR/USD daily chart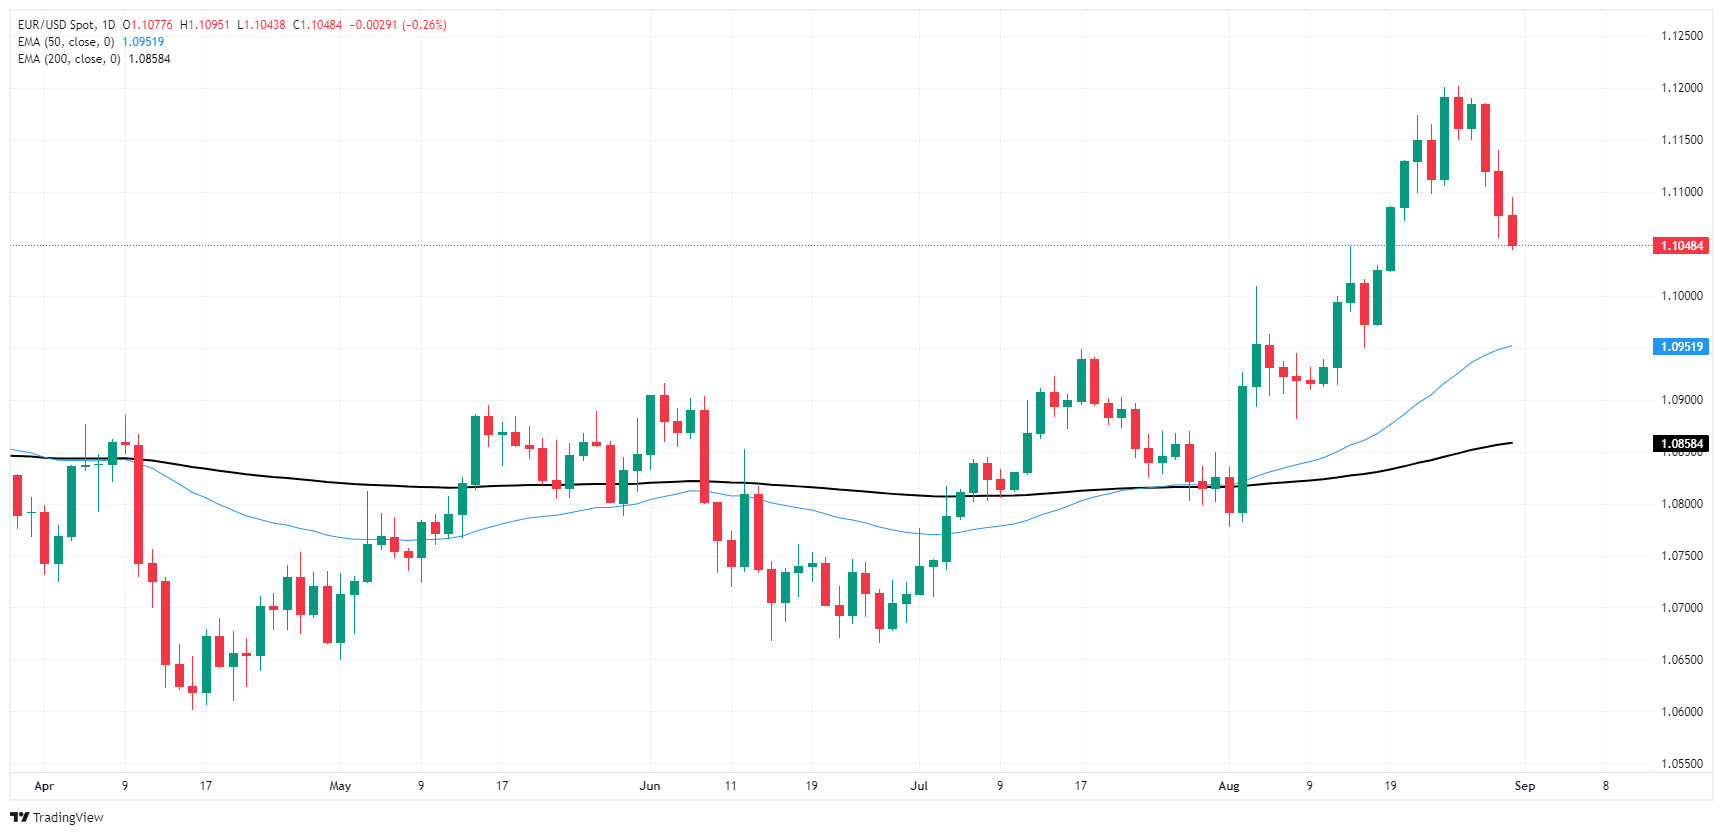
Euro FAQs
The Euro is the currency for the 20 European Union countries that belong to the Eurozone. It is the second most heavily traded currency in the world behind the US Dollar. In 2022, it accounted for 31% of all foreign exchange transactions, with an average daily turnover of over $2.2 trillion a day. EUR/USD is the most heavily traded currency pair in the world, accounting for an estimated 30% off all transactions, followed by EUR/JPY (4%), EUR/GBP (3%) and EUR/AUD (2%).
The European Central Bank (ECB) in Frankfurt, Germany, is the reserve bank for the Eurozone. The ECB sets interest rates and manages monetary policy. The ECB’s primary mandate is to maintain price stability, which means either controlling inflation or stimulating growth. Its primary tool is the raising or lowering of interest rates. Relatively high interest rates – or the expectation of higher rates – will usually benefit the Euro and vice versa. The ECB Governing Council makes monetary policy decisions at meetings held eight times a year. Decisions are made by heads of the Eurozone national banks and six permanent members, including the President of the ECB, Christine Lagarde.
Eurozone inflation data, measured by the Harmonized Index of Consumer Prices (HICP), is an important econometric for the Euro. If inflation rises more than expected, especially if above the ECB’s 2% target, it obliges the ECB to raise interest rates to bring it back under control. Relatively high interest rates compared to its counterparts will usually benefit the Euro, as it makes the region more attractive as a place for global investors to park their money.
Data releases gauge the health of the economy and can impact on the Euro. Indicators such as GDP, Manufacturing and Services PMIs, employment, and consumer sentiment surveys can all influence the direction of the single currency. A strong economy is good for the Euro. Not only does it attract more foreign investment but it may encourage the ECB to put up interest rates, which will directly strengthen the Euro. Otherwise, if economic data is weak, the Euro is likely to fall. Economic data for the four largest economies in the euro area (Germany, France, Italy and Spain) are especially significant, as they account for 75% of the Eurozone’s economy.
Another significant data release for the Euro is the Trade Balance. This indicator measures the difference between what a country earns from its exports and what it spends on imports over a given period. If a country produces highly sought after exports then its currency will gain in value purely from the extra demand created from foreign buyers seeking to purchase these goods. Therefore, a positive net Trade Balance strengthens a currency and vice versa for a negative balance.
- NZD/USD and declined by 0.15% to 0.6250 in Friday's session
- The RSI is near 70, indicating the pair is overbought and vulnerable to selling pressure.
- The MACD is showing decreasing green bars, suggesting weakening bullish momentum.
The NZD/USD pair declined to 0.6250 in Friday's session, retreating from recent highs. The technical indicators suggest a potential correction in the near term.
The Relative Strength Index (RSI) is currently at 66, indicating that the pair is near the overbought threshold which may suggest that selling pressure could emerge soon. Furthermore, the Moving Average Convergence Divergence (MACD) is showing decreasing green bars, indicating that the bullish momentum is weakening. The volume has been declining in recent sessions, which could be a sign of waning interest in the NZD/USD pair.
NZD/USD daily chart
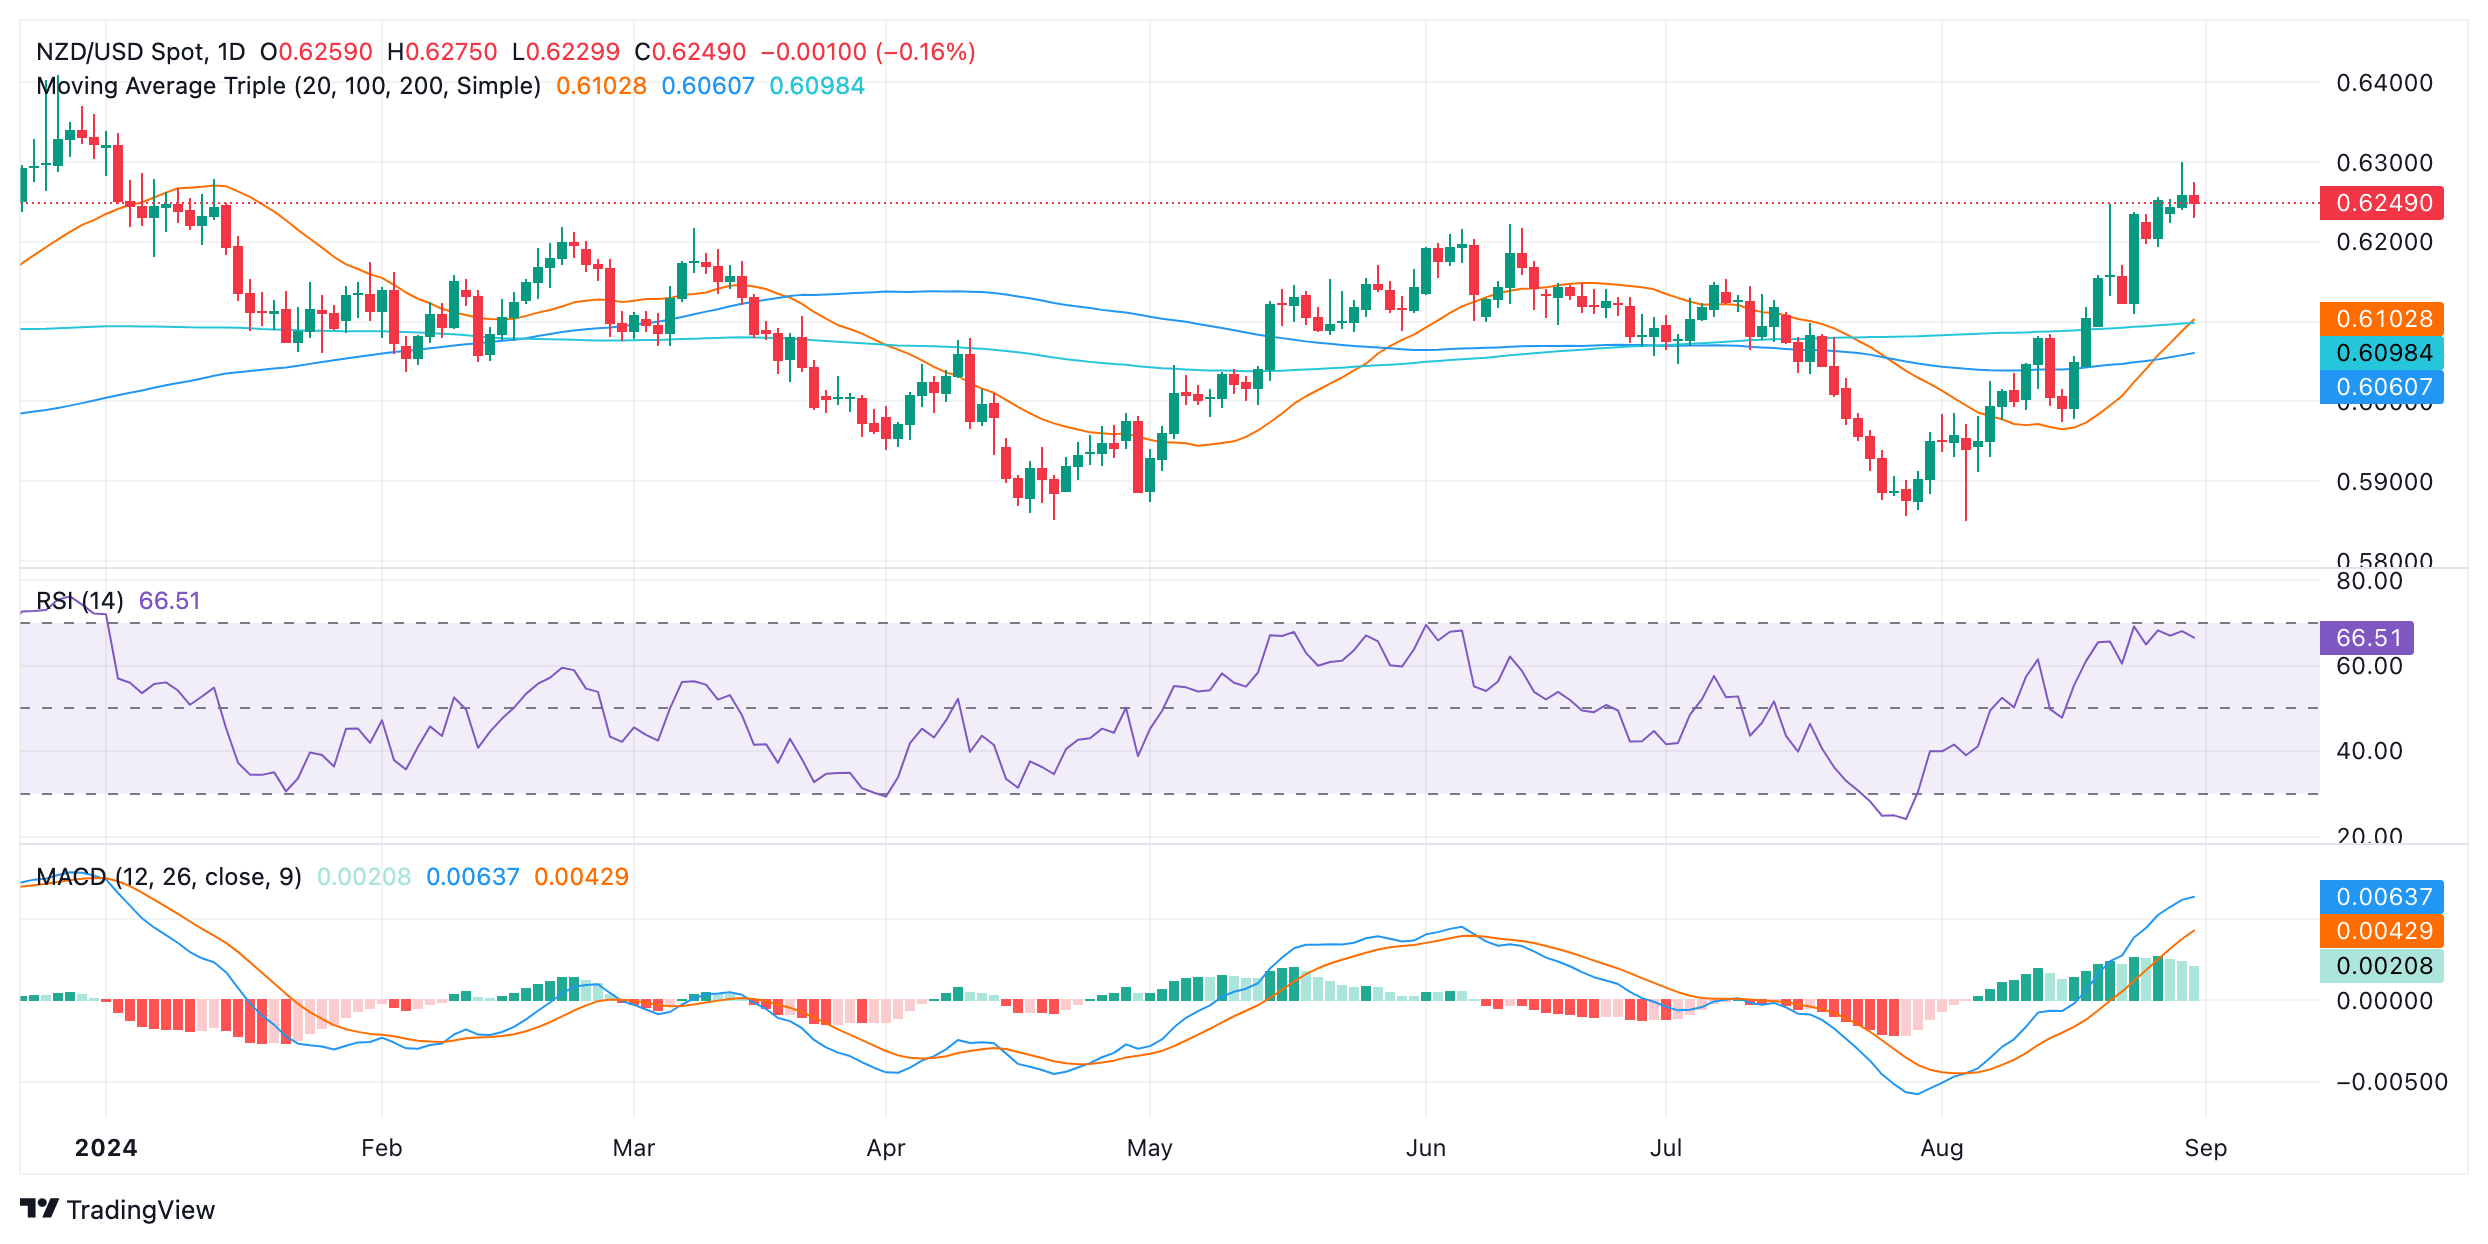
The NZD/USD pair is facing supports at the 0.6230-0.6200 zone which could be used to consolidate in the coming sessions as a healthy correction is necessary before the next upward leg. A break below the 0.6200 support could flash an alarm but the outlook by now is bullish.
- USD/JPY maintains a downward bias, needing to break key resistances for a bullish shift.
- Short-term buyer momentum faces obstacles at 146.93 (Senkou Span A) and 148.46 (Kijun-Sen), with an eye on the 149.39 peak.
- Mixed RSI signals suggest short-term buyer dominance but an unclear broader trend.
- A drop below 145.39 (Tenkan-Sen) could trigger further losses, with supports at 143.44 (August 26 low) and 141.69 (August 5 low).
The USD/JPY rallied past the 146.00 figure for the first time of the week, as US Treasury bond yields rose sharply following the release of the Fed’s favorite inflation report. The US 10-year Treasury note yield rose four and a half basis points to 3.909%, underpinning the major towards 146.17 after bouncing off daily lows of 145.56.
USD/JPY Price Forecast: Technical outlook
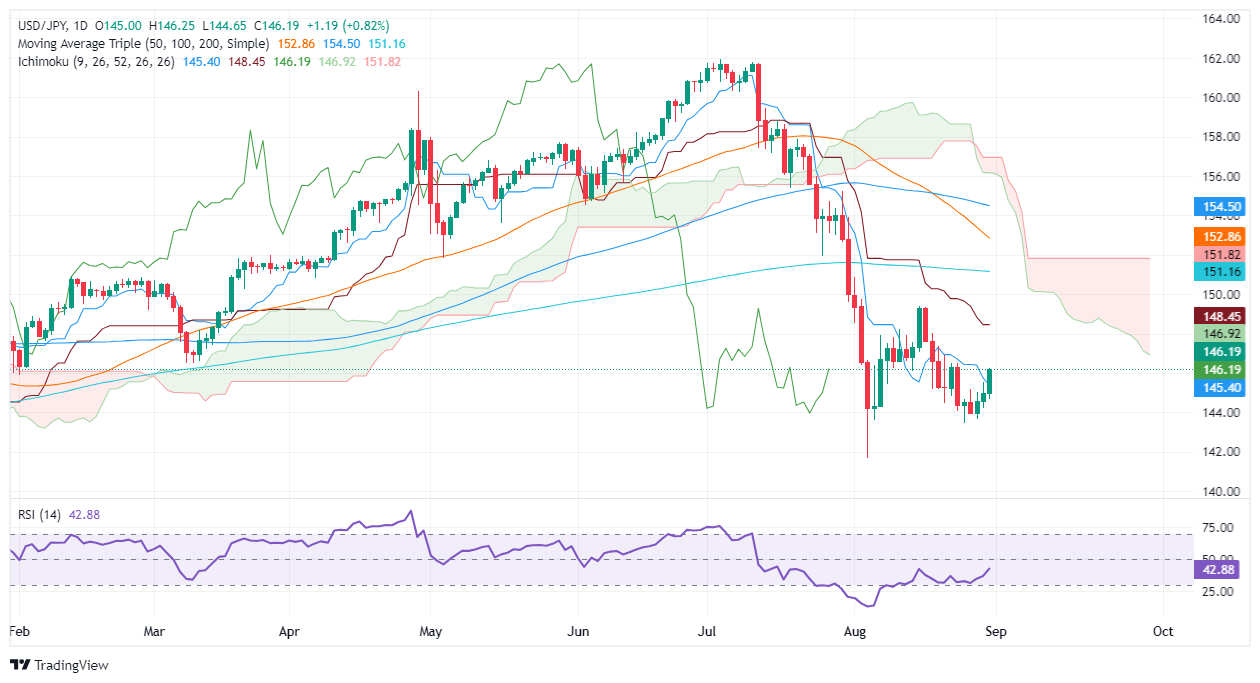
The USD/JPY is downward biased despite surpassing above the Tenkan-Sen lying at 145.39. The Relative Strength Index (RSI) shows that momentum is mixed, with the indicator being at bearish territory but aiming up.
Short-term buyers are in charge, but they must push the USD/JPY spot price above the Senkou Span A at 146.93 and clear the Kijun-Sen at 148.46 before they can clear the latest cycle high at 149.39, the August 15 daily high.
Conversely, a USD/JPY move below the Tenkan-Sen will expose the latest cycle low, seen at 143.44, the August 26 low. The pair could extend its losses past that level, and sellers could target August 5 through 141.69.
USD/JPY Price Action – Daily Chart
Japanese Yen FAQs
The Japanese Yen (JPY) is one of the world’s most traded currencies. Its value is broadly determined by the performance of the Japanese economy, but more specifically by the Bank of Japan’s policy, the differential between Japanese and US bond yields, or risk sentiment among traders, among other factors.
One of the Bank of Japan’s mandates is currency control, so its moves are key for the Yen. The BoJ has directly intervened in currency markets sometimes, generally to lower the value of the Yen, although it refrains from doing it often due to political concerns of its main trading partners. The current BoJ ultra-loose monetary policy, based on massive stimulus to the economy, has caused the Yen to depreciate against its main currency peers. This process has exacerbated more recently due to an increasing policy divergence between the Bank of Japan and other main central banks, which have opted to increase interest rates sharply to fight decades-high levels of inflation.
The BoJ’s stance of sticking to ultra-loose monetary policy has led to a widening policy divergence with other central banks, particularly with the US Federal Reserve. This supports a widening of the differential between the 10-year US and Japanese bonds, which favors the US Dollar against the Japanese Yen.
The Japanese Yen is often seen as a safe-haven investment. This means that in times of market stress, investors are more likely to put their money in the Japanese currency due to its supposed reliability and stability. Turbulent times are likely to strengthen the Yen’s value against other currencies seen as more risky to invest in.
- USD recovered after signs of sticky inflation on July's PCE.
- Recovery momentum in AUD throughout August has been supported mainly by the weak USD and improved conditions of risk-related assets.
- RBA's hawkish stance continues to benefit the Aussie.
The AUD/USD declined by 0.70% to 0.6750 in Friday's session as the USD strengthened in response to July's Personal Consumption Expenditures (PCE) figures. Despite this, the Reserve Bank of Australia's (RBA) hawkish stance may limit further declines in the AUD.
Despite a complex economic outlook for Australia, the RBA has taken a rigid stance in response to persistent inflation. As a result, financial markets now anticipate a modest 25-basis-point reduction in interest rates by 2024.
Daily digest market movers: Australian Dollar takes a breather, fundamentals still favor further upside
- RBA maintains OCR at 4.35%, signaling a cautious approach and ongoing inflation concerns.
- Governor Bullock emphasizes RBA's readiness to hike rates further if necessary.
- Copper and iron ore price gains also contributed to AUD upside momentum.
- US PCE inflation data showed core inflation rising 2.6%, slower than estimated and indicating a sticky underlying inflation.
- Divergence between Federal Reserve (Fed) and RBA might limit the pair's downside.
AUD/USD technical outlook: Bearish momentum appears, pair loses 0.6800
The Relative Strength Index (RSI) is currently at 58, pointing down, indicating that selling pressure is increasing. The Moving Average Convergence Divergence (MACD) is showing flat green bars, suggesting that the bullish traction is running out of gas.
However, it all points to buyers taking a breather after August's furious rally, which saw indicators near overbought terrain.
Key support levels to watch are 0.6750 and 0.6730, while resistance levels to consider are 0.6800 (previous support) and 0.6830.
Australian Dollar FAQs
One of the most significant factors for the Australian Dollar (AUD) is the level of interest rates set by the Reserve Bank of Australia (RBA). Because Australia is a resource-rich country another key driver is the price of its biggest export, Iron Ore. The health of the Chinese economy, its largest trading partner, is a factor, as well as inflation in Australia, its growth rate and Trade Balance. Market sentiment – whether investors are taking on more risky assets (risk-on) or seeking safe-havens (risk-off) – is also a factor, with risk-on positive for AUD.
The Reserve Bank of Australia (RBA) influences the Australian Dollar (AUD) by setting the level of interest rates that Australian banks can lend to each other. This influences the level of interest rates in the economy as a whole. The main goal of the RBA is to maintain a stable inflation rate of 2-3% by adjusting interest rates up or down. Relatively high interest rates compared to other major central banks support the AUD, and the opposite for relatively low. The RBA can also use quantitative easing and tightening to influence credit conditions, with the former AUD-negative and the latter AUD-positive.
China is Australia’s largest trading partner so the health of the Chinese economy is a major influence on the value of the Australian Dollar (AUD). When the Chinese economy is doing well it purchases more raw materials, goods and services from Australia, lifting demand for the AUD, and pushing up its value. The opposite is the case when the Chinese economy is not growing as fast as expected. Positive or negative surprises in Chinese growth data, therefore, often have a direct impact on the Australian Dollar and its pairs.
Iron Ore is Australia’s largest export, accounting for $118 billion a year according to data from 2021, with China as its primary destination. The price of Iron Ore, therefore, can be a driver of the Australian Dollar. Generally, if the price of Iron Ore rises, AUD also goes up, as aggregate demand for the currency increases. The opposite is the case if the price of Iron Ore falls. Higher Iron Ore prices also tend to result in a greater likelihood of a positive Trade Balance for Australia, which is also positive of the AUD.
The Trade Balance, which is the difference between what a country earns from its exports versus what it pays for its imports, is another factor that can influence the value of the Australian Dollar. If Australia produces highly sought after exports, then its currency will gain in value purely from the surplus demand created from foreign buyers seeking to purchase its exports versus what it spends to purchase imports. Therefore, a positive net Trade Balance strengthens the AUD, with the opposite effect if the Trade Balance is negative.
- Gold falls below $2,500 following US PCE report, boosting likelihood of September Fed rate cut.
- Fed's cautious policy easing strategy stirs uncertainty; markets favor a 25 bps cut.
- Traders' bets on a 25 bps rate cut rise to 69%; odds for a 50 bps reduction fall to 31%, per CME FedWatch Tool.
Gold prices tumbled over 0.90% on Friday, below the $2,500 figure for the second day in the week after a report from the US Department of Commerce revealed that inflation continues to edge lower, according to July’s core Personal Consumption Expenditures Price Index (PCE). At the time of writing, the XAU/USD trades at $2,497 after hitting a high of $2,526.
Data from the US Bureau of Economic Analysis (BEA) showed that the Federal Reserve’s (Fed) favorite inflation gauge, the core PCE, came slightly below estimates though it matched June’s report. The data supports the Fed’s intentions to begin easing monetary policy as soon as the upcoming September meeting, though uncertainty lies in the size of the first interest rate cut.
Even though Fed policymakers adopted a “gradualism” stance, investors speculate that they could cut as high as 50 basis points (bps), according to the CME FedWatch Tool data. Nevertheless, next Friday's US Nonfarm Payrolls report will be crucial following Fed Chair Jerome Powell’s statement that employment risks are tilted to the upside.
After the US PCE report, traders raised bets of a 25 bps rate cut by the Fed at the September meeting, with odds at 69%, while the chances for a 50 bps cut came down to 31%.
Bullion prices are headed for a 2% gain in August after Gold hit an all-time high of $2,531 on August 20.
Ahead of the next week, the US economic docket will be busy, with the release of ISM Manufacturing and Services PMIs, jobs data and the Balance of Trade.
Daily digest market movers: Gold price retreats as traders trim 50-bps rate cut odds
- December 2024 Chicago Board of Trade (CBOT) fed funds future rates contract hints that investors are eyeing 97 basis points of Fed easing this year.
- US core PCE reading for July showed that prices increased by 2.6% YoY, unchanged from the previous month but slightly below the 2.7% YoY estimate. The headline PCE came in at 2.5% YoY, underperforming the forecast of a 2.6% rise.
- Consumer spending rose while income growth was sluggish, raising concerns about whether Americans can maintain their current spending pace.
- According to the University of Michigan (UoM), US Consumer Sentiment increased from 66.4 in July to 67.9 in August.
- Inflation expectations for one year dipped from 2.9% to 2.8%, while medium-term expectations — over five years — remained steady at 3%.
Technical outlook: Gold price rally halts, retreats below $2,500
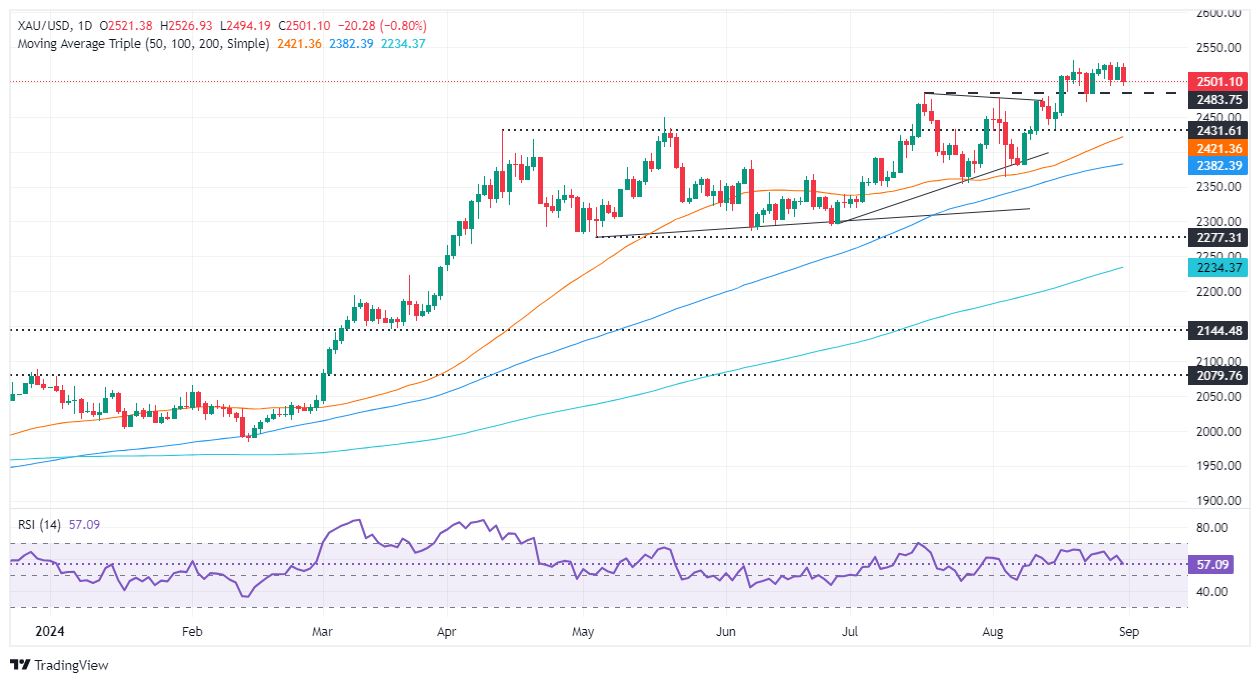
Gold price remains upwardly biased despite dipping below $2,500, but a ‘bearish engulfing’ chart pattern looms. The Relative Strength Index (RSI) shows that sellers are in charge in the short term despite showing mixed readings as the RSI edges down but is in bullish territory.
If XAU/USD achieves a daily close below $2,500, the next support would be the August 22 low at $2,470. Once surpassed, the next stop would be the confluence of the August 15 swing low and the 50-day Simple Moving Average (SMA) at $2,431.
Conversely, if XAU/USD stays above $2,500, the next resistance would be the ATH, and the following resistance would be the $2,550 mark. A breach of the latter will expose $2,600.
Gold FAQs
Gold has played a key role in human’s history as it has been widely used as a store of value and medium of exchange. Currently, apart from its shine and usage for jewelry, the precious metal is widely seen as a safe-haven asset, meaning that it is considered a good investment during turbulent times. Gold is also widely seen as a hedge against inflation and against depreciating currencies as it doesn’t rely on any specific issuer or government.
Central banks are the biggest Gold holders. In their aim to support their currencies in turbulent times, central banks tend to diversify their reserves and buy Gold to improve the perceived strength of the economy and the currency. High Gold reserves can be a source of trust for a country’s solvency. Central banks added 1,136 tonnes of Gold worth around $70 billion to their reserves in 2022, according to data from the World Gold Council. This is the highest yearly purchase since records began. Central banks from emerging economies such as China, India and Turkey are quickly increasing their Gold reserves.
Gold has an inverse correlation with the US Dollar and US Treasuries, which are both major reserve and safe-haven assets. When the Dollar depreciates, Gold tends to rise, enabling investors and central banks to diversify their assets in turbulent times. Gold is also inversely correlated with risk assets. A rally in the stock market tends to weaken Gold price, while sell-offs in riskier markets tend to favor the precious metal.
The price can move due to a wide range of factors. Geopolitical instability or fears of a deep recession can quickly make Gold price escalate due to its safe-haven status. As a yield-less asset, Gold tends to rise with lower interest rates, while higher cost of money usually weighs down on the yellow metal. Still, most moves depend on how the US Dollar (USD) behaves as the asset is priced in dollars (XAU/USD). A strong Dollar tends to keep the price of Gold controlled, whereas a weaker Dollar is likely to push Gold prices up.
- The Canadian Dollar is on the high side for Friday, but flows remain thin.
- Canada printed a better-than-expected GDP result in Q2.
- Next week brings another BoC rate call, 25 bps cut expected.
The Canadian Dollar (CAD) recovered some slight ground against most of its major currency peers on Friday, but trading remains thin as market flows struggle to find interest in the CAD. The Canadian Dollar also failed to spark a bid against the Greenback, waffling into the low side against the USD after an upside beat in Canadian Gross Domestic Product (GDP) growth failed to generate a meaningful bullish bid.
Canada is set to go dark for a long weekend, leaving next week’s opening volleys an even thinner affair than usual. A looming rate cut from the Bank of Canada (BoC) will also keep CAD flows trimmed thinner than usual.
Daily digest market movers
- Canadian GDP in the second quarter ticked up to 0.5% from the previous 0.4%.
- Annualized Canadian Q2 GDP also jumped to 2.1% from the previous 1.8%, thumping the expected downshift to 1.6%.
- Despite the overall upbeat swing in the print, MoM GDP stumbled, printing at a flat 0.0% compared to the previous 0.2% and missing the median market forecast of 0.1%.
- Global markets are gearing up for a quiet open next week with both CAD and USD markets shuttered for the long weekend.
- The BoC is broadly expected to deliver yet another rate trim of 25 bps next Wednesday, bringing the main reference rate down to 4.25%.
Canadian Dollar price forecast
The Canadian Dollar (CAD) screeched to a halt against the Greenback on Friday, pulling into the day’s midrange and sticking close to the day’s opening bids. A bullish bid beneath the CAD is slowly rolling over from a brief pause into a possible pullback, leaving USD/CAD poised for a rebound back toward the 200-day Exponential Moving Average (EMA).
USD/CAD daily chart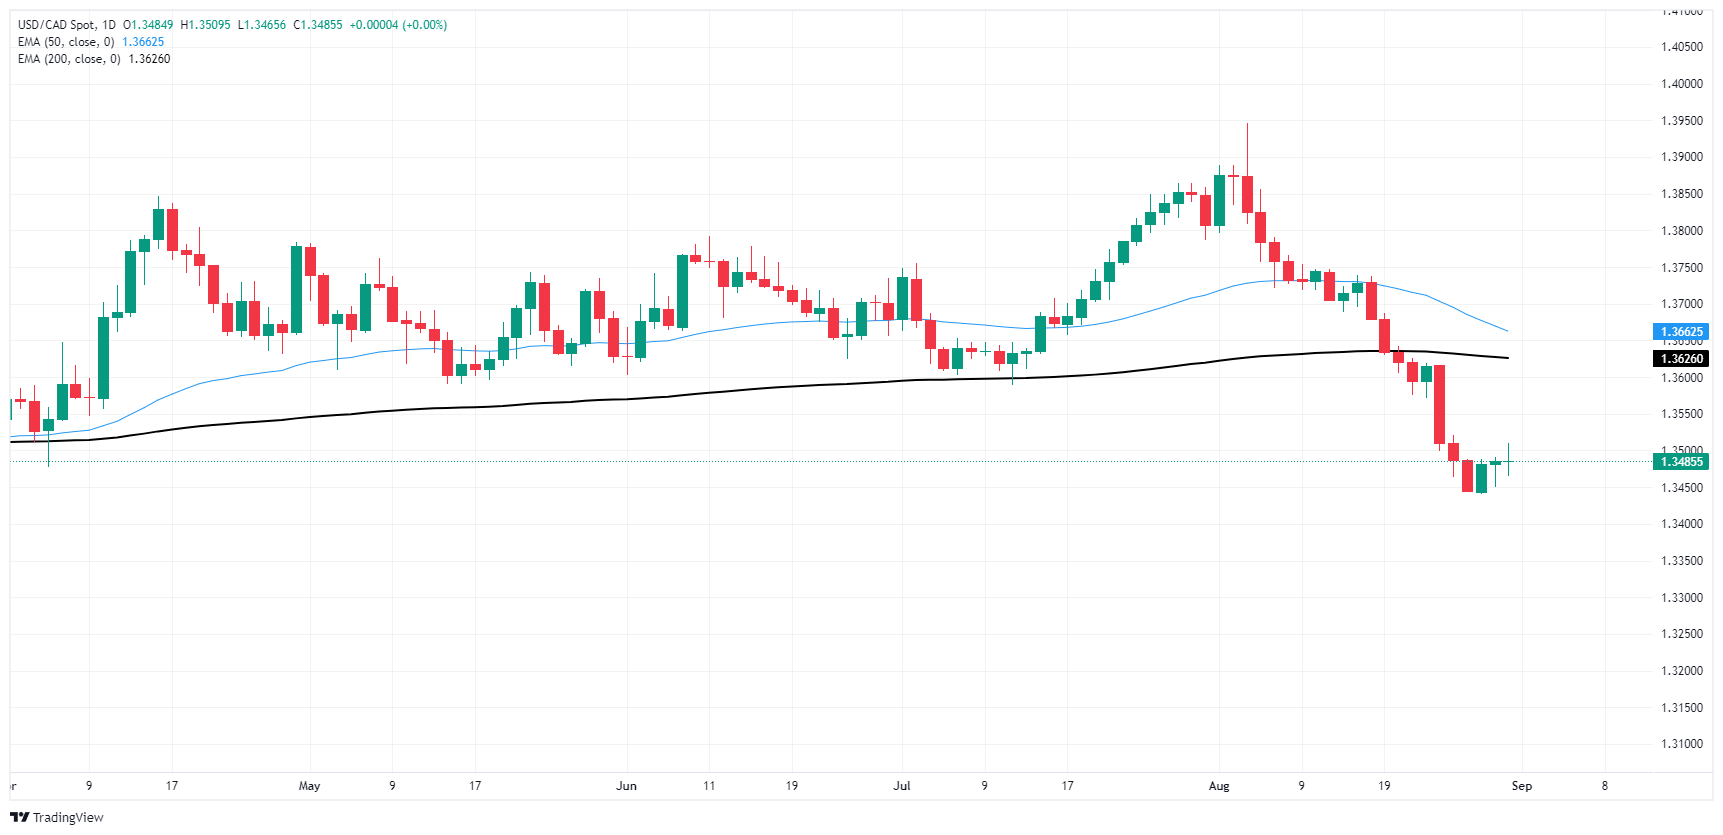
Canadian Dollar FAQs
The key factors driving the Canadian Dollar (CAD) are the level of interest rates set by the Bank of Canada (BoC), the price of Oil, Canada’s largest export, the health of its economy, inflation and the Trade Balance, which is the difference between the value of Canada’s exports versus its imports. Other factors include market sentiment – whether investors are taking on more risky assets (risk-on) or seeking safe-havens (risk-off) – with risk-on being CAD-positive. As its largest trading partner, the health of the US economy is also a key factor influencing the Canadian Dollar.
The Bank of Canada (BoC) has a significant influence on the Canadian Dollar by setting the level of interest rates that banks can lend to one another. This influences the level of interest rates for everyone. The main goal of the BoC is to maintain inflation at 1-3% by adjusting interest rates up or down. Relatively higher interest rates tend to be positive for the CAD. The Bank of Canada can also use quantitative easing and tightening to influence credit conditions, with the former CAD-negative and the latter CAD-positive.
The price of Oil is a key factor impacting the value of the Canadian Dollar. Petroleum is Canada’s biggest export, so Oil price tends to have an immediate impact on the CAD value. Generally, if Oil price rises CAD also goes up, as aggregate demand for the currency increases. The opposite is the case if the price of Oil falls. Higher Oil prices also tend to result in a greater likelihood of a positive Trade Balance, which is also supportive of the CAD.
While inflation had always traditionally been thought of as a negative factor for a currency since it lowers the value of money, the opposite has actually been the case in modern times with the relaxation of cross-border capital controls. Higher inflation tends to lead central banks to put up interest rates which attracts more capital inflows from global investors seeking a lucrative place to keep their money. This increases demand for the local currency, which in Canada’s case is the Canadian Dollar.
Macroeconomic data releases gauge the health of the economy and can have an impact on the Canadian Dollar. Indicators such as GDP, Manufacturing and Services PMIs, employment, and consumer sentiment surveys can all influence the direction of the CAD. A strong economy is good for the Canadian Dollar. Not only does it attract more foreign investment but it may encourage the Bank of Canada to put up interest rates, leading to a stronger currency. If economic data is weak, however, the CAD is likely to fall.
- US inflation, as measured by the PCE Price Index, remained unchanged at 2.5% YoY in July.
- The USD is gaining due to the strength of its economy while inflation is coming down
- The labor market is still the focus for September's decision
On Friday, the US Dollar, measured by the US Dollar Index (DXY), extended gains after the release of July's Personal Consumption Expenditures (PCE) Index, which showed inflation continuing to be kept at bay.
With inflation coming down and economic activity steady, the outlook justifies rate cuts by the Federal Reserve (Fed), whose chairman has already stated that there will be a cut in September. However, the PCE print may not have been dovish enough to persuade the central bank to start with a 50-basis-point cut.
Daily digest market movers: DXY gains ground after PCE figures
- Personal Consumption Expenditures (PCE) Price Index, the Federal Reserve's (Fed) preferred inflation gauge, remained unchanged at 2.5% on a yearly basis in July, below the market expectation of 2.6%.
- Core PCE Price Index, excluding volatile food and energy prices, also matched June's increase at 2.6%, below the market forecast of 2.7%.
- The data suggests that inflation is coming down, but the pace of the cutting cycle will be dictated by the incoming labor market data.
- CME FedWatch tool now shows a near 30% probability of a 50-basis-point rate cut in September, which has slightly declined.
Technical outlook: Bullish momentum increases, target now at 102.00
Technical analysis indicates a potential recovery for the DXY index. The Relative Strength Index (RSI) is trending upward, while the Moving Average Convergence Divergence (MACD) is printing lower red bars. If the DXY remains above the 101.00 level, it could trigger a rally toward the 20-day Simple Moving Average (SMA) at 102.00. That being said, the overall outlook is negative, but a recovery of the mentioned SMA might flip the table.
Key support levels are at 100.50, 100.30 and 100.00, while resistance levels are at 101.70, 101.80 and 102.00.
US Dollar FAQs
The US Dollar (USD) is the official currency of the United States of America, and the ‘de facto’ currency of a significant number of other countries where it is found in circulation alongside local notes. It is the most heavily traded currency in the world, accounting for over 88% of all global foreign exchange turnover, or an average of $6.6 trillion in transactions per day, according to data from 2022. Following the second world war, the USD took over from the British Pound as the world’s reserve currency. For most of its history, the US Dollar was backed by Gold, until the Bretton Woods Agreement in 1971 when the Gold Standard went away.
The most important single factor impacting on the value of the US Dollar is monetary policy, which is shaped by the Federal Reserve (Fed). The Fed has two mandates: to achieve price stability (control inflation) and foster full employment. Its primary tool to achieve these two goals is by adjusting interest rates. When prices are rising too quickly and inflation is above the Fed’s 2% target, the Fed will raise rates, which helps the USD value. When inflation falls below 2% or the Unemployment Rate is too high, the Fed may lower interest rates, which weighs on the Greenback.
In extreme situations, the Federal Reserve can also print more Dollars and enact quantitative easing (QE). QE is the process by which the Fed substantially increases the flow of credit in a stuck financial system. It is a non-standard policy measure used when credit has dried up because banks will not lend to each other (out of the fear of counterparty default). It is a last resort when simply lowering interest rates is unlikely to achieve the necessary result. It was the Fed’s weapon of choice to combat the credit crunch that occurred during the Great Financial Crisis in 2008. It involves the Fed printing more Dollars and using them to buy US government bonds predominantly from financial institutions. QE usually leads to a weaker US Dollar.
Quantitative tightening (QT) is the reverse process whereby the Federal Reserve stops buying bonds from financial institutions and does not reinvest the principal from the bonds it holds maturing in new purchases. It is usually positive for the US Dollar.
- The Dow Jones clipped a new record high bid to round out the trading week.
- US PCE inflation held steady in July, teasing investors without giving further hope.
- Coming up next week: US long weekend, PMI figures, and another NFP print.
The Dow Jones Industrial Average (DJIA) tipped into a fresh record intraday high on Friday, echoing Monday’s record-setting bidding action. However, investors pulled back from the brink after US inflation data kept rate cut bets on the rails.
US Personal Consumption Expenditure Price Index (PCE) figures for July didn’t deliver any notable surprises to round out the trading week. MoM US core PCE inflation held steady at 0.2%, as expected, but the YoY core PCE inflation figure held steady at 2.5% versus the anticipated move up to 2.6%.
Rate markets are holding firmly to 30% odds of an initial double cut for 50 bps from the Federal Reserve (Fed) on September 18, with the remaining 70% leaning into a single quarter-point cut. Overall, rate traders are pricing in 100 bps in total cuts in 2024, according to CME’s FedWatch Tool.
With PCE inflation data out of the way and not giving any warning signs, the way is paved to next week’s Nonfarm Payrolls (NFP) print, one of the last key pieces of economic data standing in the way of the Fed and rate-cut-hungry markets. Next week will also open on a quiet note, with US exchanges slated to remain shuttered for the Labor Day holiday. Some Purchasing Managers Index (PMI) releases are also scattered throughout the trading week.
Dow Jones news
It’s been a mixed bag for the Dow Jones on Friday. Roughly half of the index’s constituent securities are in the green for the day, and the DJIA eked out a fresh all-time intraday high of 41,497 before easing back to the day’s opening bids. On the low end, Salesforce (CRM) backslid 1.8%, falling to $252.35 per share, while American Express (AXP) contracted a little over 1%, easing to $252.25.
On the high side, Intel (INTC) rallied over 9% at its peak, surging to its highest bids in nearly a month after rumors emerged the company is looking to pivot some of its core operations into more profitable sectors.
Dow Jones price forecast
Bullish momentum continues to strain against its tether, keeping the Dow Jones testing new record highs and keeping price action pinned deep in bull country. The index is trading well north of the 200-day Exponential Moving Average (EMA) at 38,513, and the nearest technical floor in place to catch a downside correction is parked at the 50-day EMA just above the 40,000 major price handle.
The Dow Jones has climbed over 8% from August’s deep swing low to 38,382, touching new record highs twice in a single week. Despite closing in the green for three straight weeks, topside momentum is starting to wane, and bidders might want to watch out for a transitional period giving way to a fast drop that could gain speed as it kicks out near-term stops.
Dow Jones daily chart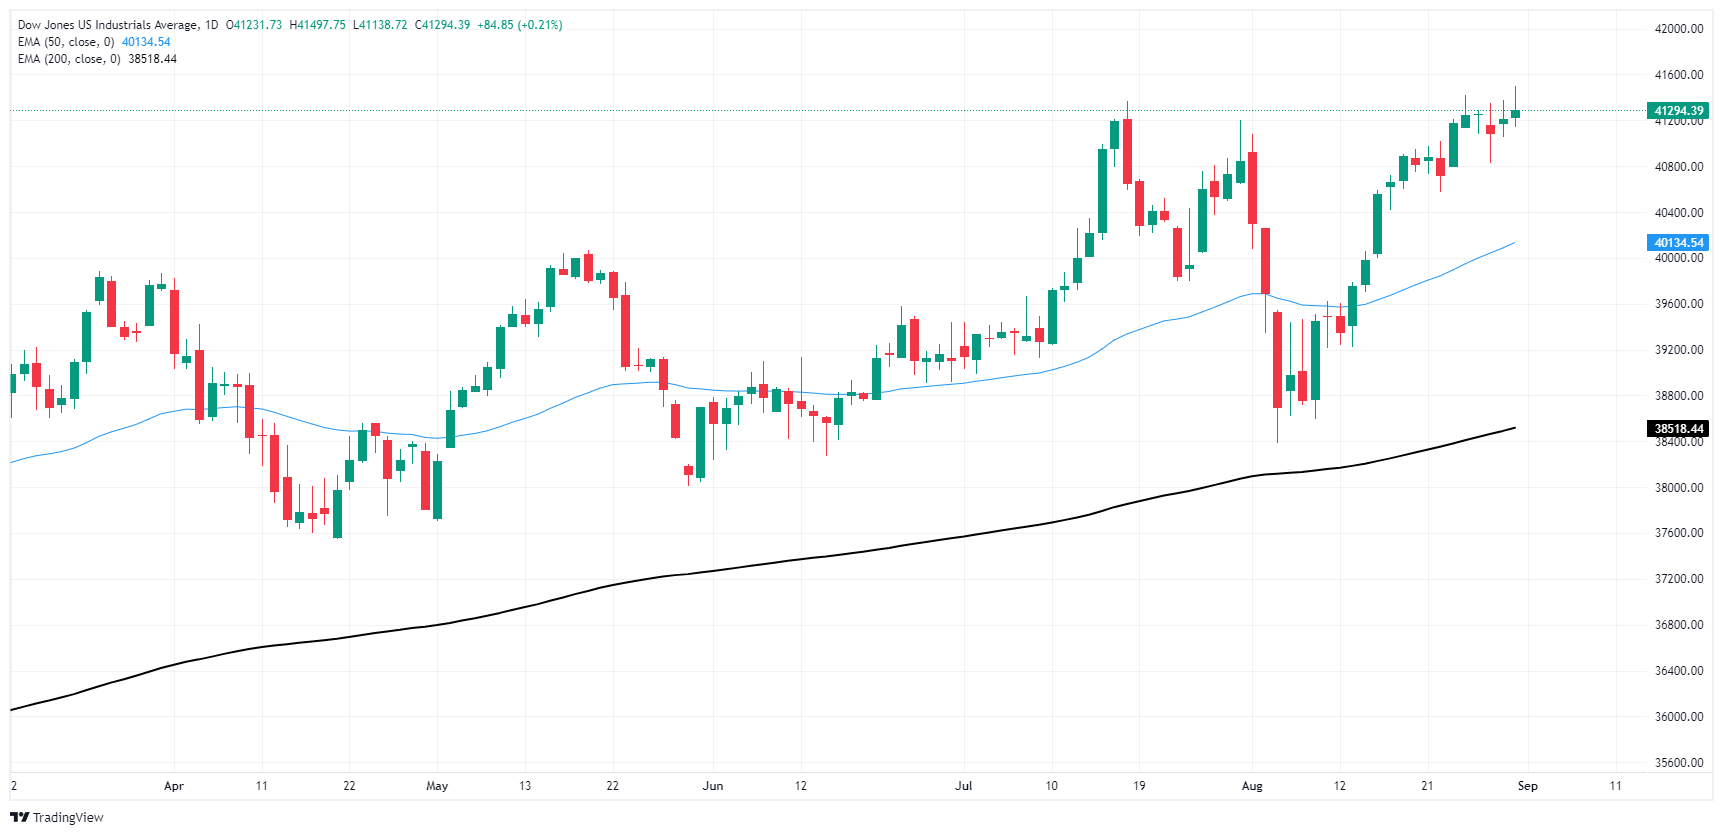
Dow Jones FAQs
The Dow Jones Industrial Average, one of the oldest stock market indices in the world, is compiled of the 30 most traded stocks in the US. The index is price-weighted rather than weighted by capitalization. It is calculated by summing the prices of the constituent stocks and dividing them by a factor, currently 0.152. The index was founded by Charles Dow, who also founded the Wall Street Journal. In later years it has been criticized for not being broadly representative enough because it only tracks 30 conglomerates, unlike broader indices such as the S&P 500.
Many different factors drive the Dow Jones Industrial Average (DJIA). The aggregate performance of the component companies revealed in quarterly company earnings reports is the main one. US and global macroeconomic data also contributes as it impacts on investor sentiment. The level of interest rates, set by the Federal Reserve (Fed), also influences the DJIA as it affects the cost of credit, on which many corporations are heavily reliant. Therefore, inflation can be a major driver as well as other metrics which impact the Fed decisions.
Dow Theory is a method for identifying the primary trend of the stock market developed by Charles Dow. A key step is to compare the direction of the Dow Jones Industrial Average (DJIA) and the Dow Jones Transportation Average (DJTA) and only follow trends where both are moving in the same direction. Volume is a confirmatory criteria. The theory uses elements of peak and trough analysis. Dow’s theory posits three trend phases: accumulation, when smart money starts buying or selling; public participation, when the wider public joins in; and distribution, when the smart money exits.
There are a number of ways to trade the DJIA. One is to use ETFs which allow investors to trade the DJIA as a single security, rather than having to buy shares in all 30 constituent companies. A leading example is the SPDR Dow Jones Industrial Average ETF (DIA). DJIA futures contracts enable traders to speculate on the future value of the index and Options provide the right, but not the obligation, to buy or sell the index at a predetermined price in the future. Mutual funds enable investors to buy a share of a diversified portfolio of DJIA stocks thus providing exposure to the overall index.
- Mexican Peso strengthens against US Dollar as core PCE inflation falls below expectations, boosting prospects for Fed rate cuts.
- Ongoing political uncertainties in Mexico dampen Peso’s demand.
- Banxico cuts GDP forecasts for 2024 and 2025, indicating slower growth and potential rate cuts.
The Mexican Peso recovered some ground on Friday against the Greenback after the Federal Reserve’s (Fed) preferred inflation gauge, the core Personal Consumption Price Expenditures Price Index (PCE), was a tenth lower than expected, suggesting that the disinflation process has evolved. This gives the Fed the green light to begin cutting rates, which is a headwind for the US Dollar. At the time of writing, the USD/MXN trades at 19.64, down 1.01%.
Mexico’s economic docket was absent during the week. However, political uncertainty linked to the judiciary reform and the dissolution of autonomous bodies in bills pushed by President Andres Manuel Lopez Obrador might keep investors nervous as the new Mexican Congress takes office.
Aside from this, the Bank of Mexico (Banxico) is downwardly reviewing economic growth as it estimates the Gross Domestic Product (GDP) for 2024 to drop from 2.4% to 1.5% and from 1.5% to 1.2% for 2025 after revealing its Q2 2024 quarterly revision.
Banxico Governor Victoria Rodriguez Ceja warned that adjustments to the primary reference rates would be gradual only when macroeconomic conditions allowed them.
Regarding this, most banks expect Banxico to reduce rates by at least 50 basis points (bps) for the remainder of 2024. This would pressure the Mexican currency, which has already depreciated 15.38% in year-to-date (YTD) figures.
Across the border, the US Bureau of Economic Analysis revealed that the disinflation process continues. The Fed’s favorite inflation gauge, the core PCE, dipped on an annual basis, while the headline figures remained unchanged.
In the meantime, the University of Michigan (UoM) Consumer Sentiment survey in August improved for the first time in five months and exceeded the preliminary reading announced two weeks ago.
The UoM poll revealed that inflation expectations for one-year dipped, while for a five-year period they remained unchanged.
Daily digest market movers: Mexican Peso counterattacks, shrugging off political uncertainty
- Mexican President Andres Manuel Lopez Obrador's decision to pause relations with the US and Canadian ambassadors this week will continue to weigh on the Mexican Peso.
- US core PCE reading for July showed that prices rose by 2.6%, unchanged from the previous month but less than the 2.7% YoY estimates. The headline PCE stood at 2.5% YoY, beneath forecasts of a 2.6% rise.
- Same report reveals that consumer spending rose while income growth was sluggish, raising doubts that Americans would keep the pace.
- According to the UoM, US Consumer Sentiment in August rose from 66.4 in July to 67.9. Inflation expectations for one year dipped from 2.9% to 2.8%, and for a medium-term — five years — stood at 3%.
- Data from the Chicago Board of Trade (CBOT) suggests the Fed will cut at least 97 basis points (bps), according to the fed funds rate futures contract for December 2024.
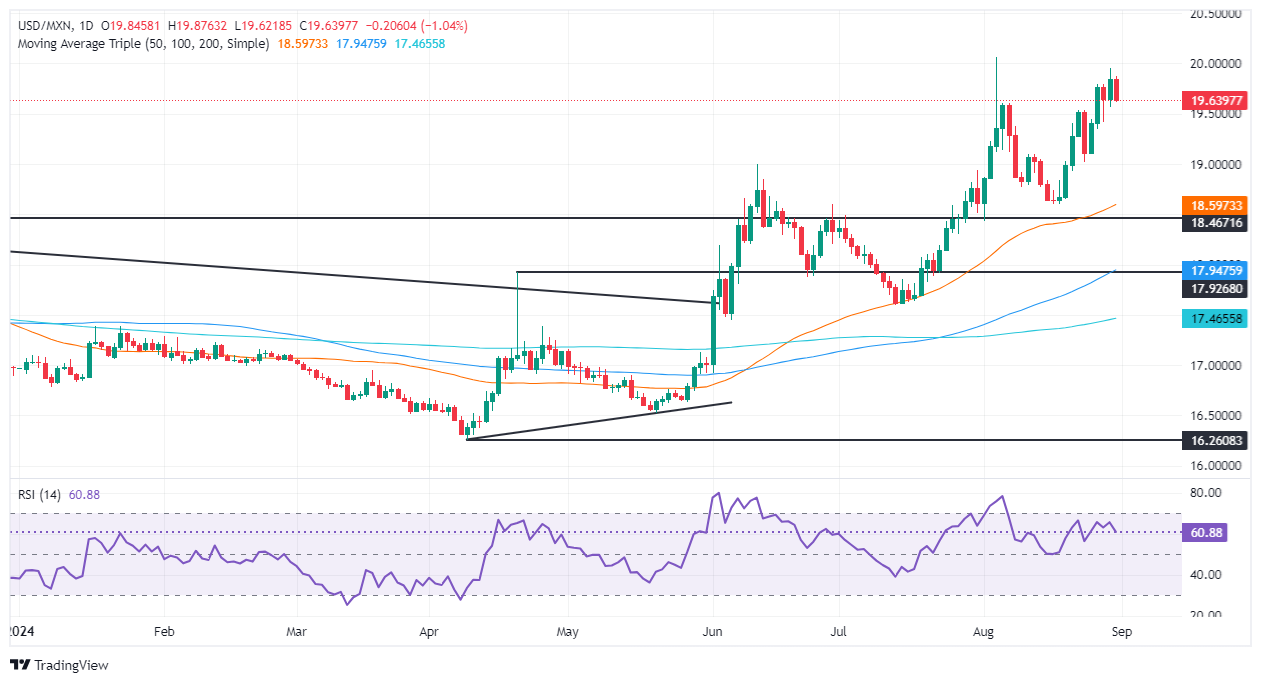
Technical outlook: Mexican Peso climbs as USD/MXN drops below 19.70
The USD/MXN uptrend remains intact, although the exotic pair dived toward the 19.65 figure as traders grow confident the Fed will begin its easing cycle, reducing the interest rate differential between the US and Mexico.
The Relative Strength Index (RSI) is mixed, in bullish territory but aiming lower, showing that sellers have the upper hand in the near term.
On further USD/MXN weakness, the first support would be 19.50. A breach of the latter will expose the August 23 swing low of 19.02 before giving way for sellers eyeing a test of the 50-day Simple Moving Average (SMA) at 18.59.
However, if the pair remains above 19.50, a challenge of the 20.00 figure is on the cards. Once that level is surpassed, the next stop would be the year-to-date (YTD) high at 20.22, followed by the September 28, 2022, daily high at 20.57. If those two levels are surrendered, the next stop would be the August 2, 2022, swing high at 20.82, ahead of 21.00.
Mexican Peso FAQs
The Mexican Peso (MXN) is the most traded currency among its Latin American peers. Its value is broadly determined by the performance of the Mexican economy, the country’s central bank’s policy, the amount of foreign investment in the country and even the levels of remittances sent by Mexicans who live abroad, particularly in the United States. Geopolitical trends can also move MXN: for example, the process of nearshoring – or the decision by some firms to relocate manufacturing capacity and supply chains closer to their home countries – is also seen as a catalyst for the Mexican currency as the country is considered a key manufacturing hub in the American continent. Another catalyst for MXN is Oil prices as Mexico is a key exporter of the commodity.
The main objective of Mexico’s central bank, also known as Banxico, is to maintain inflation at low and stable levels (at or close to its target of 3%, the midpoint in a tolerance band of between 2% and 4%). To this end, the bank sets an appropriate level of interest rates. When inflation is too high, Banxico will attempt to tame it by raising interest rates, making it more expensive for households and businesses to borrow money, thus cooling demand and the overall economy. Higher interest rates are generally positive for the Mexican Peso (MXN) as they lead to higher yields, making the country a more attractive place for investors. On the contrary, lower interest rates tend to weaken MXN.
Macroeconomic data releases are key to assess the state of the economy and can have an impact on the Mexican Peso (MXN) valuation. A strong Mexican economy, based on high economic growth, low unemployment and high confidence is good for MXN. Not only does it attract more foreign investment but it may encourage the Bank of Mexico (Banxico) to increase interest rates, particularly if this strength comes together with elevated inflation. However, if economic data is weak, MXN is likely to depreciate.
As an emerging-market currency, the Mexican Peso (MXN) tends to strive during risk-on periods, or when investors perceive that broader market risks are low and thus are eager to engage with investments that carry a higher risk. Conversely, MXN tends to weaken at times of market turbulence or economic uncertainty as investors tend to sell higher-risk assets and flee to the more-stable safe havens.
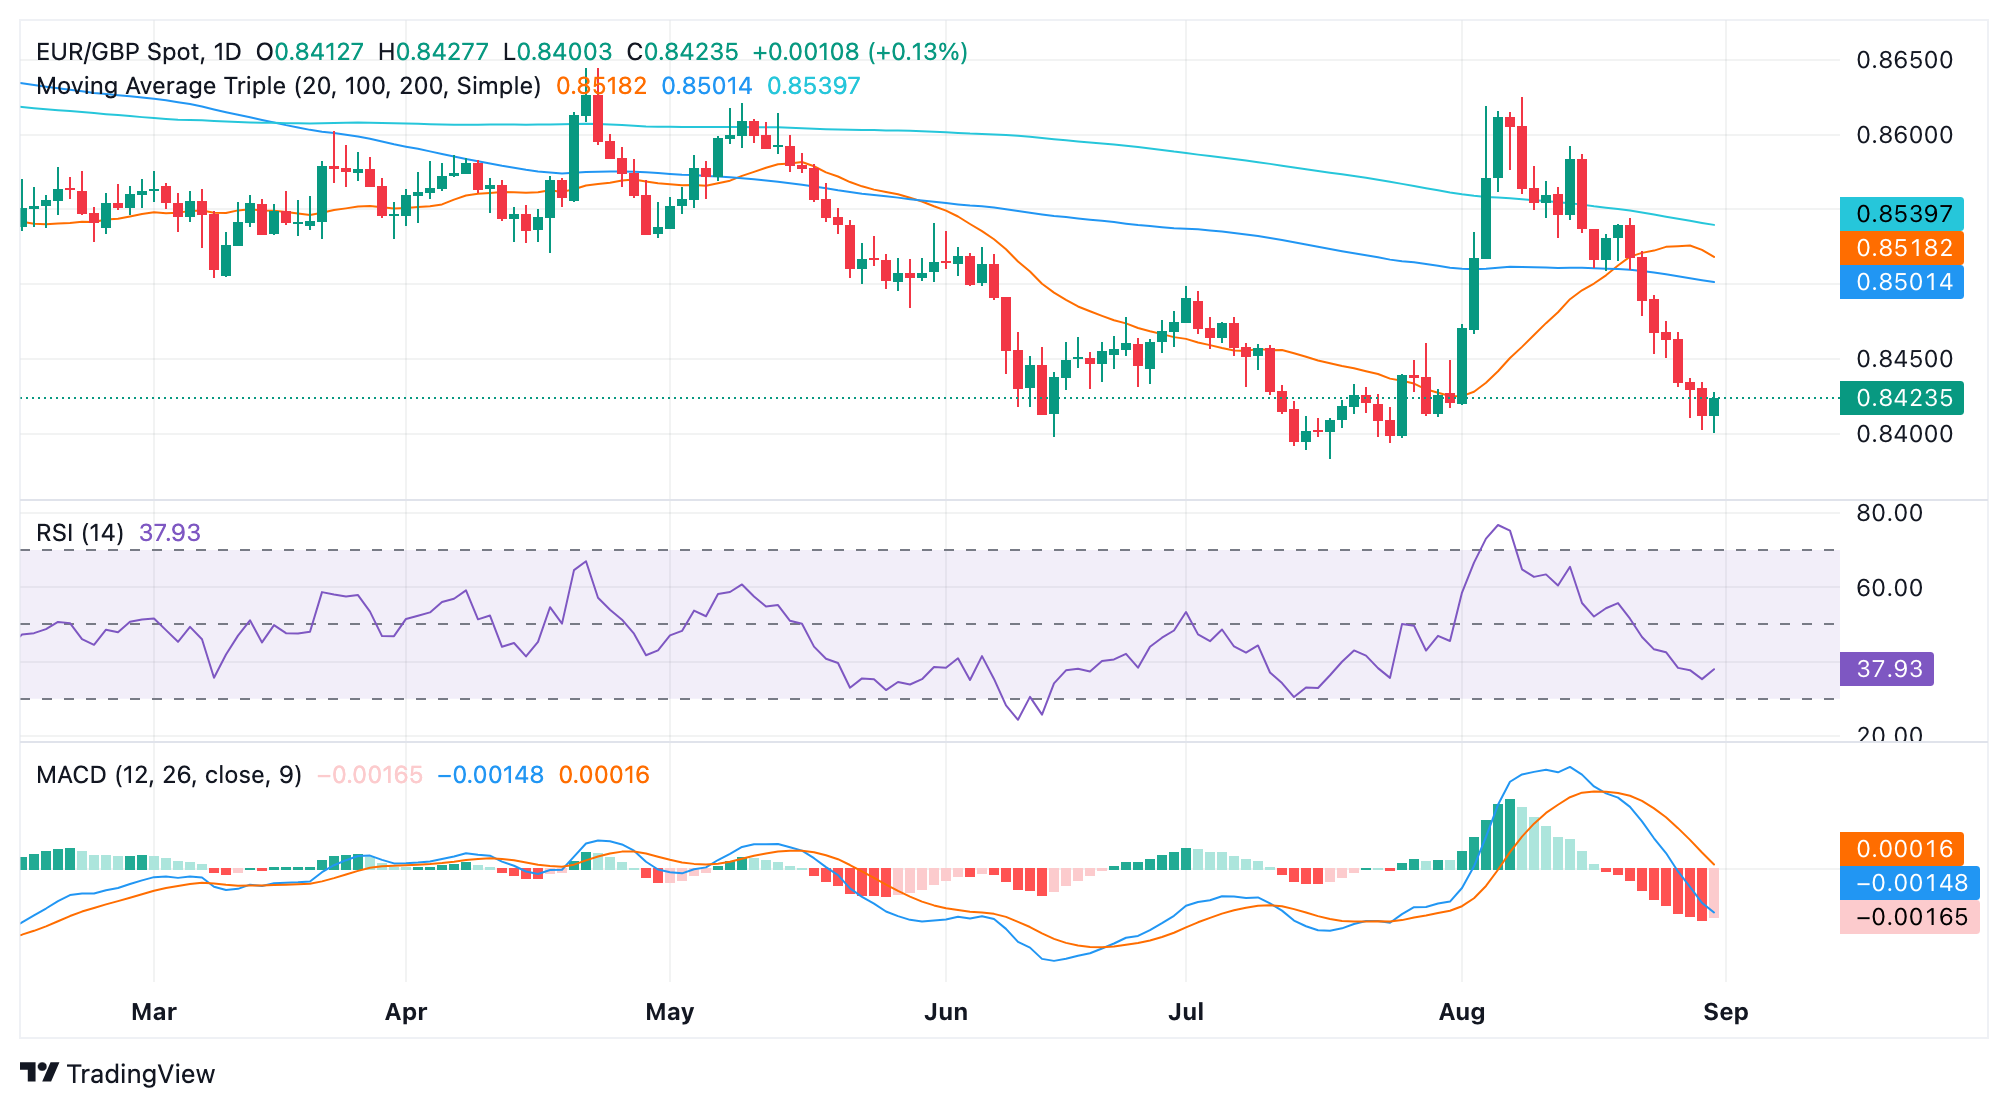
- EUR/GBP stopped the bleeding on Friday and rose slightly above 0.8400.
- Technical indicators remain aligned with the prevailing bearish trend.
- Daily RSI remains near oversold terrain
In Friday's session, the EUR/GBP rose to 0.8420. However, upward movements seem to only be corrective and sellers take a breather after multiple sessions of losses.
The Relative Strength Index (RSI) is currently at 37 seeing a flat slope. The Moving Average Convergence Divergence (MACD) prints red bars, reinforcing the selling pressure.
Overall, technical indicators lack upside conviction. The pair could make an attempt to test the support at 0.8450, and if that gives way the next resistance is seen at 0.8500. With indicators near extreme conditions, the cross is set to side-ways trade in the next sessions above the 0.8400 area. Despite bullish traction being non-existent, the cross might get a push from fundamentals. On the technical side, the outlook is bearish with the cross shedding more than 1% in August.
EUR/GBP daily chart
- GBP/USD shows upward bias on daily chart, yet short-term RSI presents mixed signals.
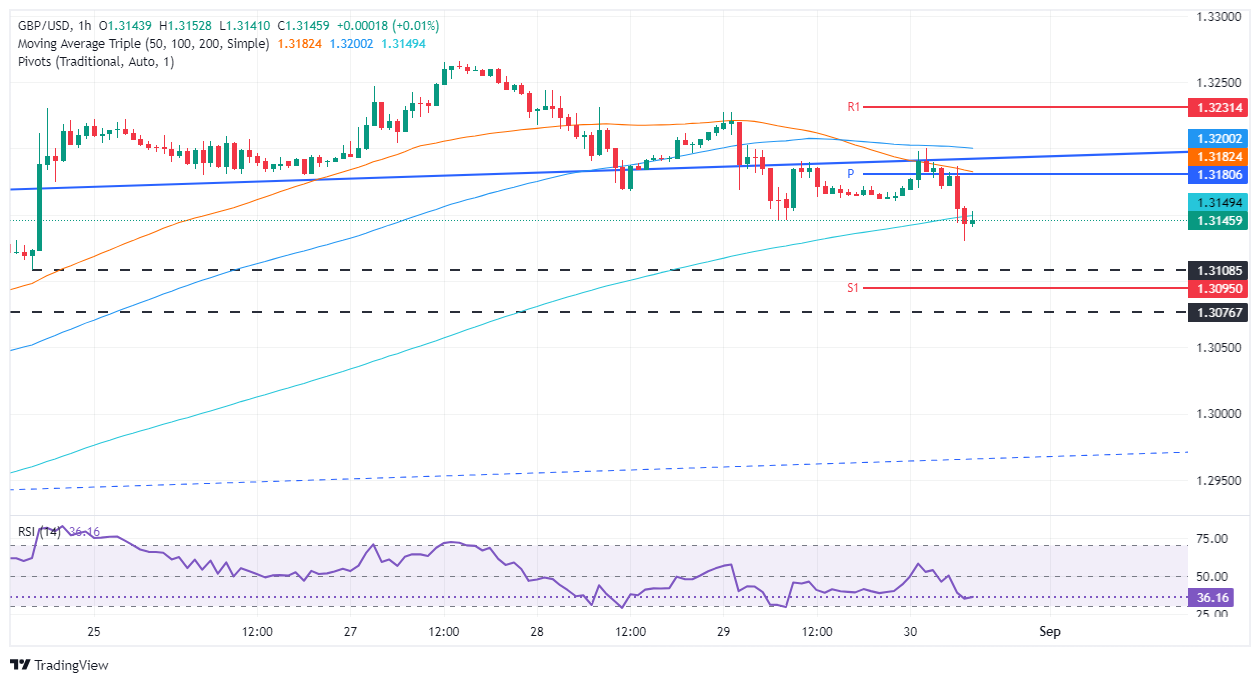
- Hourly chart reveals bearish trend with the pair below 50, 100, and 200-HMAs; sellers aim for 1.3108 and potentially 1.3100.
- Additional supports at August 22 low of 1.3076 and August 20 high of 1.3052.
- Buyers reclaiming 200-HMA at 1.3148 could push recovery to 1.3182 (50-HMA) and 1.3200.
The GBP/USD extends its losing streak to three days yet has bounced off daily/weekly lows of 1.3129 and exchanges hands at 1.3149, down a modest 0.14%. Data from the United States (US) spurred a leg-down in the currency pair as the Fed’s preferred gauge for inflation came as expected, hinting that the US Federal Reserve could cut rates at the upcoming September meeting.
GBP/USD Price Forecast: Technical outlook
Daily, the GBP/USD remains upward biased despite retreating toward the 1.3120 area. In the short term, sellers are in charge, as revealed by the Relative Strength Index (RSI), which is bullish but aiming lower and showing mixed readings.
Zooming into the hourly chart, the GBP/USD is bearishly biased, as the exchange rate remains below the 50, 100, and 200-hour moving averages (HMAs), with sellers eyeing last Friday's low of 1.3108. Once cleared could pave the way for testing the 1.3100 figure. A further downside is seen at the August 22 swing low of 1.3076, ahead of the August 20 high at 1.3052.
If GBP/USD buyers reclaim the 200-HMA at 1.3148, this could sponsor a recovery toward the 50-HMA at 1.3182 ahead of 1.3200.
GBP/USD Price Action – Hourly Chart
British Pound PRICE Today
The table below shows the percentage change of British Pound (GBP) against listed major currencies today. British Pound was the strongest against the Japanese Yen.
| USD | EUR | GBP | JPY | CAD | AUD | NZD | CHF | |
|---|---|---|---|---|---|---|---|---|
| USD | 0.02% | 0.11% | 0.38% | -0.06% | 0.16% | -0.02% | 0.19% | |
| EUR | -0.02% | 0.08% | 0.39% | -0.09% | 0.15% | -0.06% | 0.17% | |
| GBP | -0.11% | -0.08% | 0.29% | -0.17% | 0.07% | -0.14% | 0.06% | |
| JPY | -0.38% | -0.39% | -0.29% | -0.43% | -0.19% | -0.40% | -0.20% | |
| CAD | 0.06% | 0.09% | 0.17% | 0.43% | 0.23% | 0.05% | 0.23% | |
| AUD | -0.16% | -0.15% | -0.07% | 0.19% | -0.23% | -0.20% | 0.00% | |
| NZD | 0.02% | 0.06% | 0.14% | 0.40% | -0.05% | 0.20% | 0.20% | |
| CHF | -0.19% | -0.17% | -0.06% | 0.20% | -0.23% | -0.01% | -0.20% |
The heat map shows percentage changes of major currencies against each other. The base currency is picked from the left column, while the quote currency is picked from the top row. For example, if you pick the British Pound from the left column and move along the horizontal line to the US Dollar, the percentage change displayed in the box will represent GBP (base)/USD (quote).
House price data from Nationwide fell 0.2% in August but UK lending data suggest some renewed vigour in the UK housing market as house hunters anticipate easier BoE policy, Scotiabank’s Chief FX Strategist Shaun Osborne notes.
GBP holds bulk of gains
“Mortgage approvals rose 62k in July, the strongest in close to two years. Net lending secured on dwellings rose GBP2.8bn, meanwhile. Sterling is up marginally on the day but spot is consolidating.”
“GBP price action over the week suggests the rally in the pound has stalled but the technical jury is still out on whether a deeper reversal or correction lower will develop. Short-term price action reflects some drift in the pound from this week’s peak and some signs of stronger fading interest on minor GBP gains.”
“GBP support is 1.3125. Resistance is 1.3200/05.”
- EUR/GBP remains on the backfoot amid sheer weakness in the Euro.
- Sof Eurozone inflation prompts ECB rate cut bets.
- The BoE is expected to deliver one more interest rate cut this year.
The EUR/GBP pair is all set to conclude the week in red for the third straight week. The asset remains on the backfoot as the Euro (EUR) weakens, with financial market participants seeming to be confident that the European Central Bank (ECB) will cut interest rates again in September after announcing the first in the June meeting.
The ECB is almost certain to reduce its key borrowing rates next month as price pressures in the Eurozone economy have declined expectedly in August and its economic outlook is uncertain, with growing fears that the German economy could enter a recession.
Flash Eurozone Harmonized Index of Consumer Prices (HICP) report for August, released in Friday’s European trading hours, reported that the headline and core inflation- which excludes volatile items like energy, food, alcohol and tobacco- decelerated expectedly to 2.2% and 2.8%, respectively. Month-on-month core HICP rose by 0.3% after contracting in July.
Market speculation for ECB rate cuts in September was already firm as German HICP returned to the bank’s target of 2% in August, according to the data released on Thursday.
"Fading inflationary pressure combined with fading growth momentum offers an almost perfect macro backdrop for another rate cut," said Carsten Brzeski, global head of macro at ING, in a note on Thursday.
Meanwhile, the Pound Sterling (GBP) exhibits sheer strength against its major peers on expectations that the Bank of England’s (BoE) policy-easing cycle would be slower. The BoE is expected to cut interest rates one more time this year. The central bank pivoted to policy normalization in its recent policy meeting on August 1.
Economic Indicator
Core Harmonized Index of Consumer Prices (YoY)
The Core Harmonized Index of Consumer Prices (HICP) measures changes in the prices of a representative basket of goods and services in the European Monetary Union. The HICP, – released by Eurostat on a monthly basis, is harmonized because the same methodology is used across all member states and their contribution is weighted. The YoY reading compares prices in the reference month to a year earlier. Core HICP excludes volatile components like food, energy, alcohol, and tobacco. The Core HICP is a key indicator to measure inflation and changes in purchasing trends. Generally, a high reading is seen as bullish for the Euro (EUR), while a low reading is seen as bearish.
Read more.Last release: Fri Aug 30, 2024 09:00 (Prel)
Frequency: Monthly
Actual: 2.8%
Consensus: 2.8%
Previous: 2.9%
Source: Eurostat
Eurozone August CPI rose a preliminary 0.2% in the month and was 2.2% higher over the year, down from 2.6% in July and in line with expectations, Scotiabank’s Chief FX Strategist Shaun Osborne notes.
EUR consolidates
“Core inflation eased a tenth to at 2.8% Y/Y from July’s read and services inflation rose to 4.2%, from 4%. Core and services inflation suggest a cautious approach to ECB rate cuts ahead. ECB Governor Muller said that confidence in a September rate cut (which is fully priced in) is growing but the policy path after that is 'less certain'.”
“Softer trends in the EUR may be developing. A soft close on the week suggests some developing reversal potential on the longer run charts. Intraday price action rather suggests the EUR is consolidating this week’s losses in a tight range, but the EUR is clearly having some trouble holding even minor gains to the 1.11 area for now.”
“Weakness through 1.1050/55 support may see the EUR edge back to 1.0990/00.”
- USD/CAD reclaims 1.3500 as the US Dollar rises sharply.
- A steady rise in the US core PCE inflation forced traders to pare Fed large rate cut bets.
- The Canadian economy expanded at a faster-than-expected pace of 2.1% in the second quarter of this year.
The USD/CAD pair climbs to near the psychological resistance of 1.3500 in Friday’s New York session. The Loonie asset gains as the US Dollar (USD) rises sharply even though the United States (US) Personal Consumption Expenditure inflation (PCE) data came in softer-than-expected but grew steadily.
The US Dollar Index (DXY), which tracks the Greenback’s value against six major currencies, posts a fresh weekly high around 101.60. Market sentiment appears to asset-specific as the S&P 500 has opened with strong gains, while risk-perceived currencies have come under pressure.
The core PCE inflation data, a Federal Reserve’s (Fed) preferred inflation gauge, rose steadily by 2.6% but remained lower than estimates of 2.7%. On month-on-month, the underlying inflation grew in line with estimates and the prior release of 0.2%. The inflation data is unlikely to weigh on market expectations that the Fed will start reducing interest rates from the September meeting as policymakers seem to be more concerned about deteriorating labor market strength.
While signs of stickiness in price pressures from the inflation have diminished bets supporting the Fed to start the policy-easing cycle aggressively. According to the CME FedWatch tool, the likelihood of a 50 basis points (bps) interest rate reduction has reduced to 30.5% from 36% recorded a week ago.
Meanwhile, the Canadian Dollar (CAD) underperforms the US Dollar despite Canada’s Q2 Gross Domestic Product (GDP) surprisingly coming in stronger than expected. The economy rose at a robust pace of 2.1% from the estimates of 1.6% and the former release of 1.8%, upwardly revised from 1.7%. However, market expectations for more interest rate cuts by the Bank of Canada (BoC) this year remain firm amid easing price pressures.
- USD/CAD has broken above a key trendline and probably reversed trend.
- There is a possibility it could start trending higher if the break holds and prices move above 1.3520-25.
USD/CAD is decisively breaking above a key trendline for the downtrend it has been in since the start of August.
The break comes after the release of higher-than-expected Canadian GDP data strengthened the Canadian Dollar (CAD). It probably means the short-term downtrend is reversing, although more upside is required for confirmation.
USD/CAD 4-hour Chart
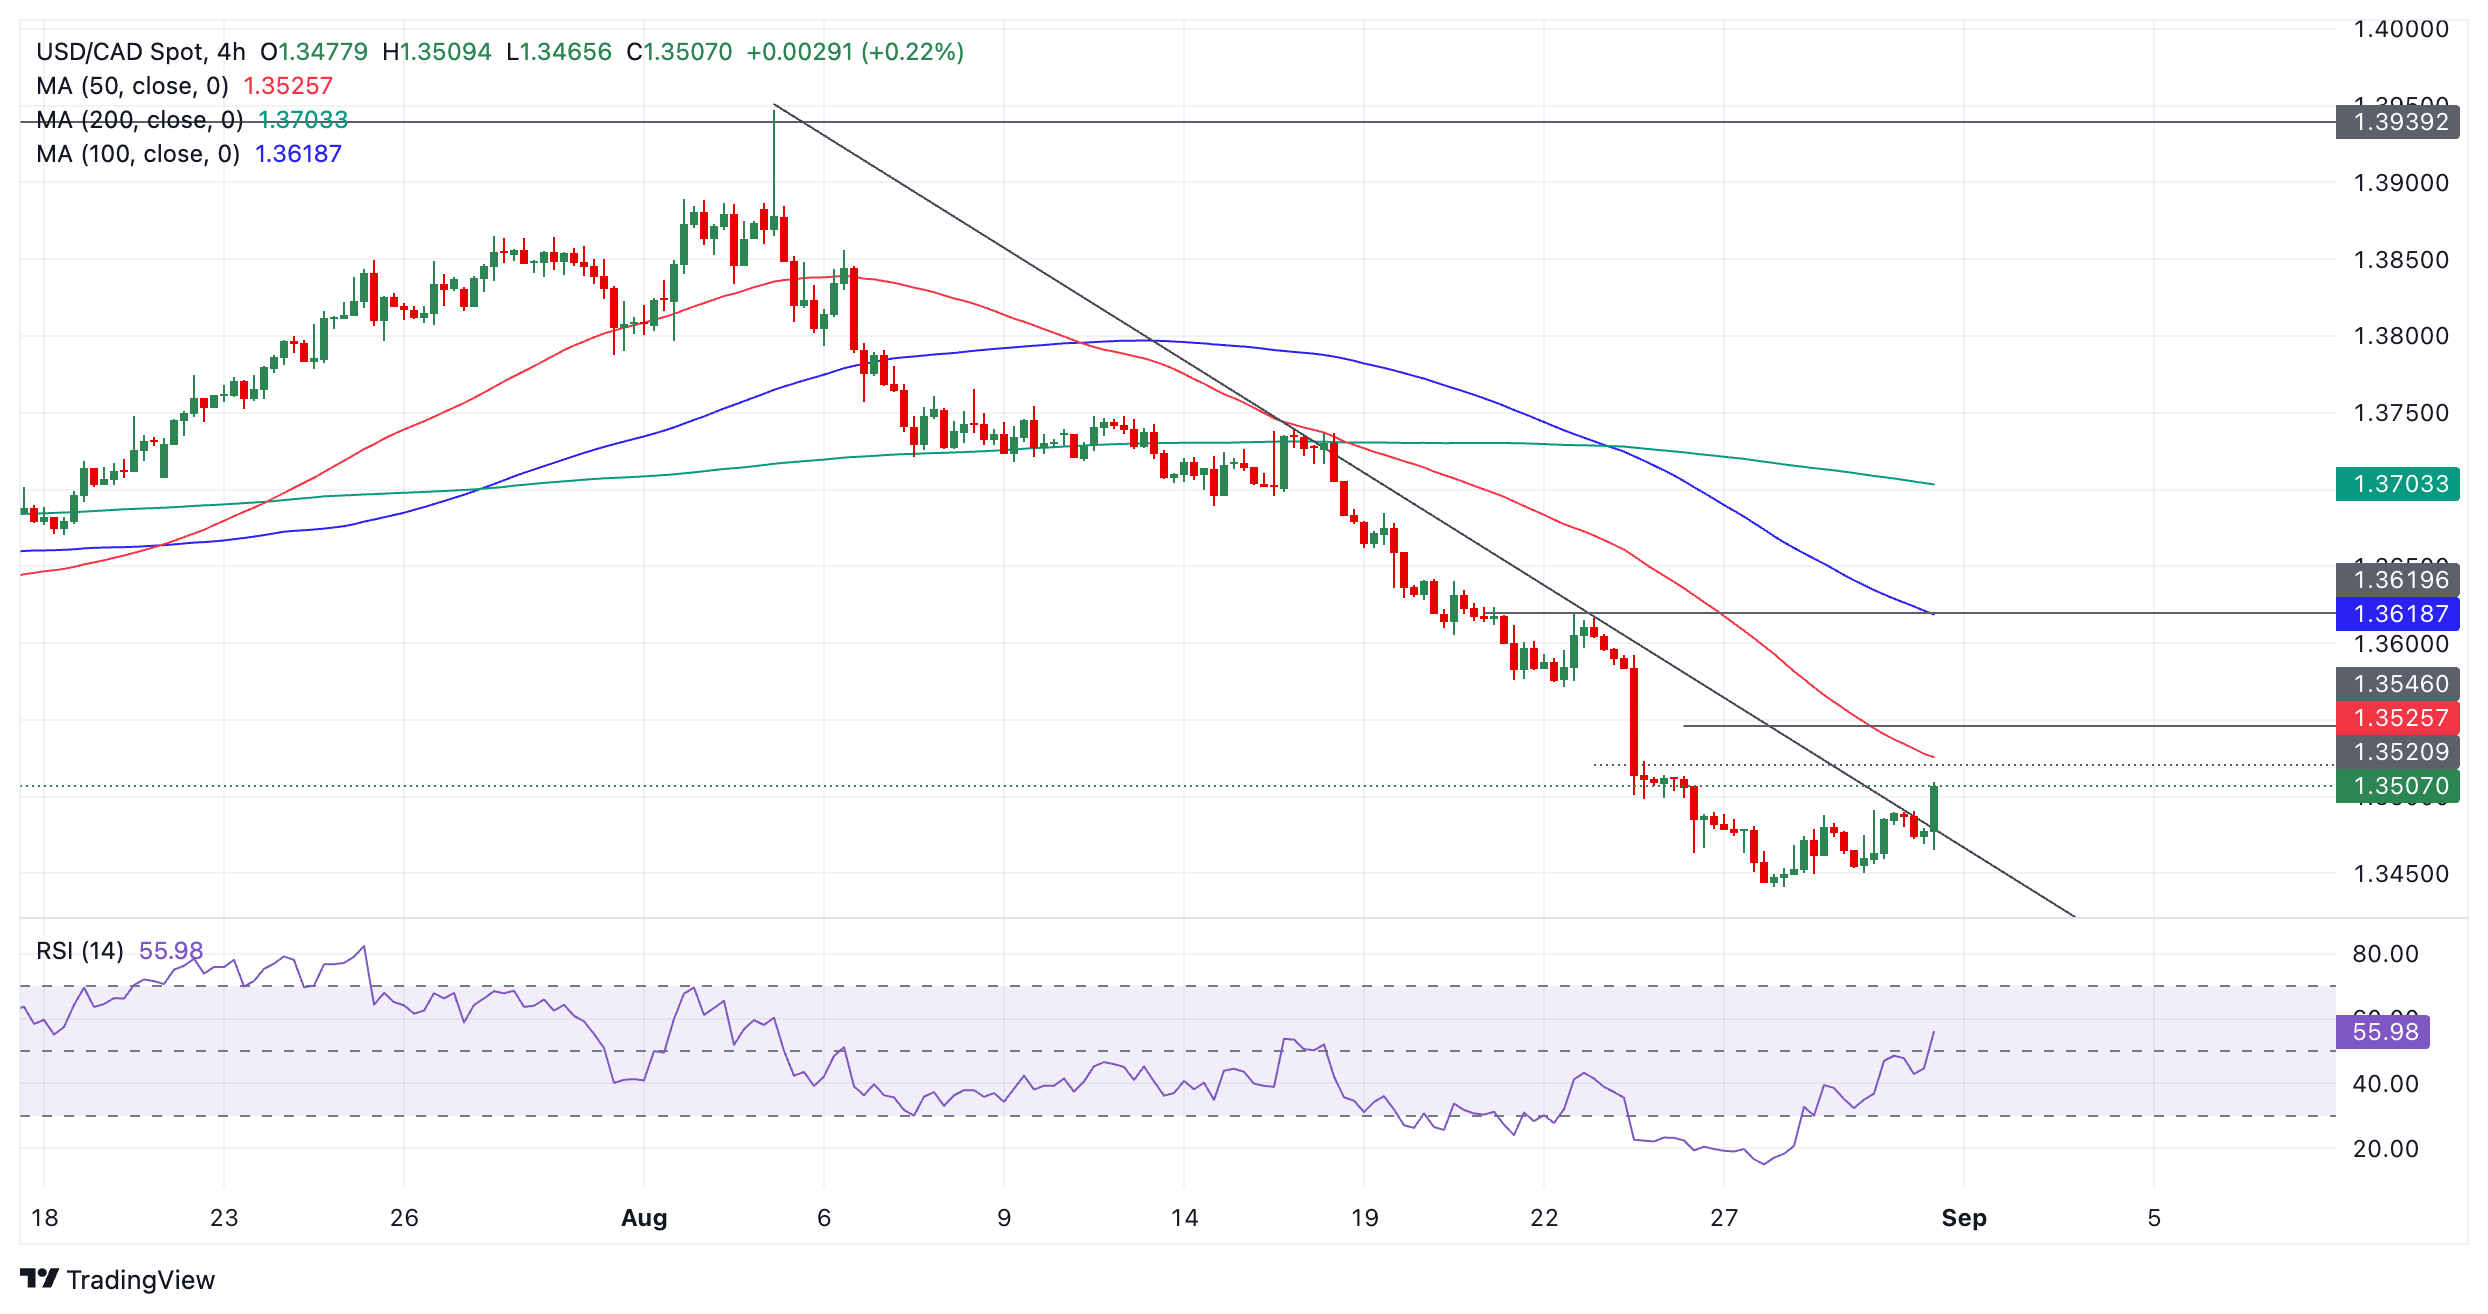
The trendline break was accompanied by a rise in the Relative Strength Index (RSI) momentum indicator out of its oversold zone, which provides a buy signal. This indicates either an extended correction higher is likely, or a complete reversal of the hitherto bear trend.
A close above 1.3520-25 and the trendline would bring into doubt the bearish bias and could indicate early signs of a reversal. Such a break could see the pair move up to 1.3593. A move above the latter would give a surer sign of a reversal of the trend.
If the break fails to hold and prices pull back down and close below the trend line, the bear trend might extend lower. The next bearish target is situated at 1.3380 – the swing lows of October 2023 and January 2024. This is followed by the bottom of the range at 1.3222.
According to the International Copper Study Group, around 11.1 million tons of Copper ore were produced in the first half of this year, an increase of 3.1% over the same period last year. However, this increase is entirely attributable to the first quarter of this year, Commerzbank’s analyst Barbara Lambrecht notes.
Producers are responding to the expected increase in demand
“In the second quarter, however, production did not increase compared to the second quarter of last year. As a result, primary Copper production from ores has increased more than mining production over the last three months. This is likely to lead to more subdued production of refined Copper in the coming months, as this will put pressure on the margins of Copper smelters.”
“At the same time, a major mining company and the government in Zambia independently announced last week that they intend to significantly expand Copper ore production in the coming years. The mining company is currently considering doubling production at an Australian mine from the current 322,000 tons to potentially 650,000 tons by early 2030.
“Meanwhile, in Zambia, the government plans to increase production from about 760,000 tons in 2023 to 3 million tons by 2031. The long-term expansion of production shows that producers are responding to the expected significant increase in demand for Copper as part of the green transformation. In the short term, however, the scarcity of Copper ore is more of a limiting factor.”
The CAD is trading marginally higher on the session, reflecting the bid for risk assets on the day, Scotiabank’s Chief FX Strategist Shaun Osborne notes.
CAD holds marginal gain ahead of June and Q2 GDP
“Narrower US/Canada short-term spreads continue to provide some broader backing for the CAD, although gains are still running a little ahead of fair value (1.3522) which may limit scope for additional CAD strength.”
“Canadian GDP is expected to advance marginally in June (0.1%) and hold up relatively well on the quarter; the consensus call anticipates growth of 1.8% (SAAR) for Q2, a little ahead of Q1’s 1.7%. Some GDP-tracking models indicate growth may be a little better than the consensus (2% or so).”
“Spot remains in consolidation mode—off the lows from earlier in the week but not really showing any major signs of reversing recent losses. Overnight price action suggests some minor softness in the USD developing from the 1.3490 area tested overnight. Price action since Tuesday implies a potential bear flag in development which means that USD losses may resume below the bear flag base at 1.3450/55.”
While the Palladium price continued to extend its gains in August, Platinum seems to have run out of steam again: yesterday, Platinum slipped below USD 950 per troy ounce, Commerzbank’s analyst Barbara Lambrecht notes.
Platinum runs out of steam again
“At first glance, the new car registration figures in Europe did little to lift the mood. In July, just 0.2% more cars were registered than in the previous year. In the first seven months as a whole, however, the increase was just under 4%.”
“On a positive note, sales of hybrid vehicles, in which Platinum is increasingly being used according to the World Platinum Investment Council, continued to grow: Growth here was a good 25%, which is even slightly higher than the average growth rate for the first half of the year.”
- Canada's economy grew at a stronger pace than expected in Q2.
- USD/CAD trades marginally lower on the day below 1.3500.
Canada's real Gross Domestic Product (GDP) expanded at an annual rate of 2.1% in the second quarter, Statistics Canada reported on Friday. This reading followed the 1.8% growth recorded in the first quarter and came in better than the market expectation of 1.6%.
On a quarterly basis, Canada's real GDP expanded 0.5% after growing 0.4% in Q1.
Market reaction
These figures don't seem to be having a noticeable impact on USD/CAD's action. At the time of press, the pair was down 0.1% on the day at 1.3460.
- EUR/JPY is recovering after several days of weakness after Eurozone inflation comes out as expected.
- It had been speculated the result would fall below expectations because of weaker-than-forecast German and Spanish inflation on Thursday.
- Japanese data showed an uptick in inflation in Tokyo which suggests the BoJ could raise rates, supporting JPY.
EUR/JPY is trading a quarter of a percent higher at just above 161.00 on Friday, after the release of Eurozone inflation data for July met economists’ expectations.
Lower-than-expected German and Spanish inflation released prior to the region-wide figure, on Thursday, had set the scene for a similar below-expectations fall in Eurozone-wide inflation. However, this was not in the end the case, and the Euro rebounded on the news.
The annual Consumer Price Index (CPI) in the Eurozone rose 2.2% in August in line with estimates, and was lower than the 2.6% rise reported in July. Although this marked the lowest increase in Eurozone consumer prices since July of 2021 and contrasted with the rest of the year – in which inflation hovered between 2.4% - 2.6% – that it was in line with estimates was supportive for the Euro and EUR/JPY.
The data is unlikely to change the European Central Bank’s (ECB) gradual and cautious, data-dependent stance on reducing interest rates, according to Nordea Bank. That the ECB will probably not be cutting interest rates aggressively is propping up the Euro, since higher-for-longer interest rates attract greater inflows of foreign capital.
“Headline inflation dropped to 2.2% y/y in August – the closest it has been to the ECB’s inflation target since 2021 – but risks remain: Wage growth remains high and will keep core inflation sticky for the rest of this year,” says Anders Svendson, Chief Analyst at Nordea Bank.
One reason for the ECB’s “cautious and gradual” approach is services inflation which remains elevated at 4.2% and is unlikely to fall much before 2025 given the generous forecast for wage increases during the second half of 2024.
“Negotiated wage growth will stay high in the second half of the year, which is likely to keep service price inflation high as well,” says Svendson.
In addition, core CPI inflation remains relatively high at 2.8% and is “proving sticky” according to the analyst.
EUR/JPY may remain range bound as the Japanese Yen (JPY) gains support from recent Japanese data. This showed inflation in Tokyo, as measured by the Tokyo Consumer Price Index rising above economists’ estimates.
Annual flash Tokyo CPI ex fresh food for July came out at 2.4% compared to 2.2% in the previous month and beating expectations of 2.2%, according to data from the Statistics Bureau of Japan released on Thursday. This suggests the possibility that Japan-wide inflation could show a similar rise. This, in turn, would support the case for the Bank of Japan (BoJ) pressing ahead with raising interest rates in Japan, supporting the Yen in the process.
Employment data released at the same time as the Tokyo CPI, however, was not as strong. The Japanese Unemployment Rate unexpectedly rose to 2.7% in July from 2.5% in June.
Analysts at Capital Economics dismissed the rise in unemployment, however, saying “our conviction that the Bank (BoJ) will press ahead with another rate hike is growing.”
“The jump in the unemployment rate in July is a lagged response to the weakness in economic activity around the turn of the year,” said Marcel Thieliant, Head of Asia-Pacific at Capital Economics.
“Given that the July industrial production and retail sales data are pointing to another decent rise in Q3 GDP, the labor market should tighten again before long. And with the Tokyo CPI suggesting that underlying inflation is leveling off around the Bank of Japan’s 2% target,” he added.
An orderly end to the week looks in store ahead of the long weekend in North America. Stocks, bonds and crude oil are trading positively on the session while the US Dollar (USD) is consolidating this week’s gains and is trading narrowly mixed against the core G10 majors. The pro-risk backdrop to markets is giving a boost to high beta FX, with the ZAR and MXN leading gains on the day, Scotiabank’s Chief FX Strategist Shaun Osborne notes.
Focus on next week’s risk events
“The USD picked up a bit more support around yesterday’s data. GDP was revised higher and the details under the hood looked positive. Weekly claims were in line with expectations and while continuing claims were also in line with forecasts, this series is holding around post-pandemic highs, suggesting workers are having some difficulty in finding jobs. Other indicators suggest a softer labour market while a Bloomberg report notes that signs of a weaker labour markets are evident in recent regional Fed surveys.”
“This could be reflected in the Fed’s Beige Book when it is released next Wednesday, ahead of the NFP data a week today. Today’s core July PCE data is expected to show prices rising at a moderate 0.2% M/M but edge up a tenth over June’s 2.6%. Optically, slightly faster core PCE growth in the year may not sit well with the idea of Fed easing but the Fed Chair’s attention is squarely on employment now and a soft jobs report next week will bolster expectations of aggressive Fed rate cuts ahead.”
“The USD looks set to close out the week with a gain—the DXY’s first in six weeks—but the rebound is not enough (yet) to signal a reversal in recent losses and short-term price signals are starting to suggest some softness may be creeping back into the DXY on the day. A further recovery in the CNY, which is trading at its highest in more than a year and appears to have broken its longer-term bear trend, may also be a block on additional USD gains.”
The production losses in Libya are spreading rapidly: According to media reports, oil production has now been cut back by up to 700 thousand barrels per day and all export ports in the east of the country are closed, Commerzbank’s analyst Barbara Lambrecht notes.
Shortfall may rise to 1 million barrels per day
“Fears are being voiced that the shortfall could rise to 1 million barrels per day. OPEC member Iraq is also set to produce less oil in future. During a visit by OPEC Secretary General Al Ghais, the Prime Minister of Iraq – as well as the government in Kazakhstan at the beginning of the week – once again promised to comply with his announced production cuts in future.”
“However, both countries have continued to produce above target until recently, despite newly presented plans, which undermines the motivation and discipline of the other OPEC+ countries in the long term.”
Provided that 7.1130 is not breached, the US Dollar (USD) could continue to decline; the likelihood of it reaching 7.0636 is not high. In the longer run, boost in momentum has increased the chance of USD dropping to and potentially breaking below 7.0636, UOB Group FX analysts Quek Ser Leang and Lee Sue Ann notes.
USD continues to decline
24-HOUR VIEW: “The sharp selloff in USD that sent it plunging by 0.52% (NY close of 7.0943) was surprising (we were expecting sideways trading). What is not surprising is the decline has resulted in a strong increase in momentum. Today, provided that 7.1130 (minor resistance at 7.1010) is not breached, USD could continue to decline. That said, the likelihood of it reaching 7.0636, the low registered early this month, is not high. There is another support level at 7.0770.”
1-3 WEEKS VIEW: “On Monday (26 Aug, spot at 7.1100), we indicated that ‘there is potential for USD to decline to the July’s low of 7.0636.’ Yesterday (29 Aug, spot at 7.1290), we indicated that “downward momentum is slowing, and should USD breach 7.1460 (‘strong resistance level’), it would mean that USD is not declining further. USD subsequently sold off sharply, dropping to a low of 7.0859. The boost in momentum has increased the chance of USD dropping to and potentially breaking below 7.0636. Looking ahead, the next level to watch below 7.0636 is 7.0400. On the upside, the ‘strong resistance’ level has moved lower to 7.1350 from 7.1460.”
There is no end to the ups and downs on the oil market: after the price of a barrel of Brent crude climbed well above the $80 mark at the beginning of the week in the wake of geopolitical tensions and the threat of production losses in Libya, it initially fell sharply again. The price of crude oil has now levelled off at $80 per barrel, Commerzbank’s commodity analyst Barbara Lambrecht notes.
OPEC+ countries face a production dilemma
“The decisive factor is obviously the increasing speculation that the eight OPEC+ states will indeed gradually withdraw their voluntary production cuts - as announced at the beginning of June. Until now, the majority of market participants had assumed that the producing countries would take the built-in exit option and only increase their oil production later, referring to the current market conditions. The longer this remains open, the more the oil price threatens to come under pressure.”
“No announcement means more oil in the future. There is no doubt that the decision is not an easy one: the producing countries outside OPEC+ have actually increased their market share at the expense of OPEC+. In addition, there are also some dissenters within OPEC+ who are producing more than agreed. Against this backdrop, heavyweight Saudi Arabia is having to bear more and more of the burden.”
“On the other hand, the attempt to force the competition out of the market by increasing supply has been ‘paid for’ in the past with a massive drop in prices. We therefore continue to assume that the eight volunteers – led by Saudi Arabia – will once again postpone the gradual increase in production in order to avoid a further short-term drop in prices, given the already low prices and fragile demand in China.”
- The US Dollar eases on Friday after some hawkish ECB comments weighed on the DXY.
- Traders’ eyes are on the US PCE Price Index data on Friday.
- The US Dollar Index popped above 101.00, holding above it.
The US Dollar (USD) trades flat to a touch softer on Friday after comments from European Central Bank Executive Board member Isabel Schnabel left European trading with a hawkish undertone. Although recent figures in the Eurozone might be pointing to disinflation, ECB’s Schnabel said that the scenario of a few consecutive rate cuts is not on the table as the ECB needs to remain cautious. This gave some oomph to the Euro (EUR) against the US Dollar (USD). Still, the US Dollar is trading only slightly softer against several other currencies as traders keep their powder dry ahead of the last bit of important economic data this Friday.
This main economic data point will be the core Personal Consumption Expenditures (PCE) Price Index, the favourite inflation gauge of the US Federal Reserve (Fed). With most analysts expecting another soft number, the PCE component under the US Gross Domestic Product release from Thursday was downwardly revised, suggesting that price pressures in the second quarter were milder than previously thought.
Daily digest market movers: Make or break
- In early Asian trading, the Chinese offshore Yuan reached its strongest level against the US Dollar since June 2023, hitting 7.0710 in USD/CNH.
- At 12:30 GMT, the Personal Consumption Expenditures (CPE) numbers for July will be released:
- Headline PCE is expected to come in a touch stronger at 0.2% on the month, up from the 0.1% increase seen in June. The yearly component should head higher as well to 2.6% from 2.5%.
- Core PCE on the month is expected to grow by 0.2%, the same pace as in June. The yearly number should head to 2.7% from 2.6%.
- Personal Income should grow at a stable 0.2% while Personal Spending is expected to tick up from 0.3% to 0.5%.
- At 13:45, the Chicago Purchase Managers Index for August will be released. The previous number was at 45.3, in contraction. The August number is anticipated to remain in contraction at 45.5.
- The last data for this Friday will be the final University of Michigan numbers for August:
- Consumer Sentiment is expected to head from 67.8 to 68.
- The 5-year Inflation expectations number should remain stable at 3%.
- Equities are set to close this week on a positive note. Asian indices all closed in the green. European and US equities are far from done for this Friday, although they are up on the day.
- The CME Fedwatch Tool shows a 67.5% chance of a 25 basis points (bps) interest rate cut by the Fed in September against a 32.5% chance for a 50 bps cut. Another 25 bps cut (if September is a 25 bps cut) is expected in November by 48.4%, while there is a 42.4% chance that rates will be 75 bps (25 bps + 50 bps) below the current levels and a 9.2% probability of rates being 100 (25 bps + 75 bps) basis points lower.
- The US 10-year benchmark rate trades at 3.86%, close to its peak for this week near 3.87%.
Economic Indicator
Core Personal Consumption Expenditures - Price Index (MoM)
The Core Personal Consumption Expenditures (PCE), released by the US Bureau of Economic Analysis on a monthly basis, measures the changes in the prices of goods and services purchased by consumers in the United States (US). The PCE Price Index is also the Federal Reserve’s (Fed) preferred gauge of inflation. The MoM figure compares the prices of goods in the reference month to the previous month.The core reading excludes the so-called more volatile food and energy components to give a more accurate measurement of price pressures. Generally, a high reading is bullish for the US Dollar (USD), while a low reading is bearish.
Read more.Next release: Fri Aug 30, 2024 12:30
Frequency: Monthly
Consensus: 0.2%
Previous: 0.2%
Source: US Bureau of Economic Analysis
After publishing the GDP report, the US Bureau of Economic Analysis releases the Personal Consumption Expenditures (PCE) Price Index data alongside the monthly changes in Personal Spending and Personal Income. FOMC policymakers use the annual Core PCE Price Index, which excludes volatile food and energy prices, as their primary gauge of inflation. A stronger-than-expected reading could help the USD outperform its rivals as it would hint at a possible hawkish shift in the Fed’s forward guidance and vice versa.
US Dollar Index Technical Analysis: Weekly close even more important than last week
The US Dollar Index (DXY) could be trading in a flashback moment to July 2023. The DXY back then had a rough few weeks as well, even breaking briefly below 100.00 to 99.58. What followed the week thereafter was a stellar rally of 11 consecutive weeks of gains. If the PCE inflation number comes in substantially higher then markets might revisit 2023 all over again.
For a recovery, the DXY faces a long road ahead. First, 101.90 is the level to reclaim. A steep 2% uprising would be needed to get the index to 103.18. A very heavy resistance level near 104.00 not only holds a pivotal technical value, but it also bears the 200-day Simple Moving Average (SMA) as the second heavyweight to cap price action.
On the downside, 100.62 (the low from December 28) tries to hold support, although it looks rather feeble. Should it break, the low from July 14, 2023, at 99.58 will be the ultimate level to look out for. Once that level gives way, early levels from 2023 are coming in near 97.73.
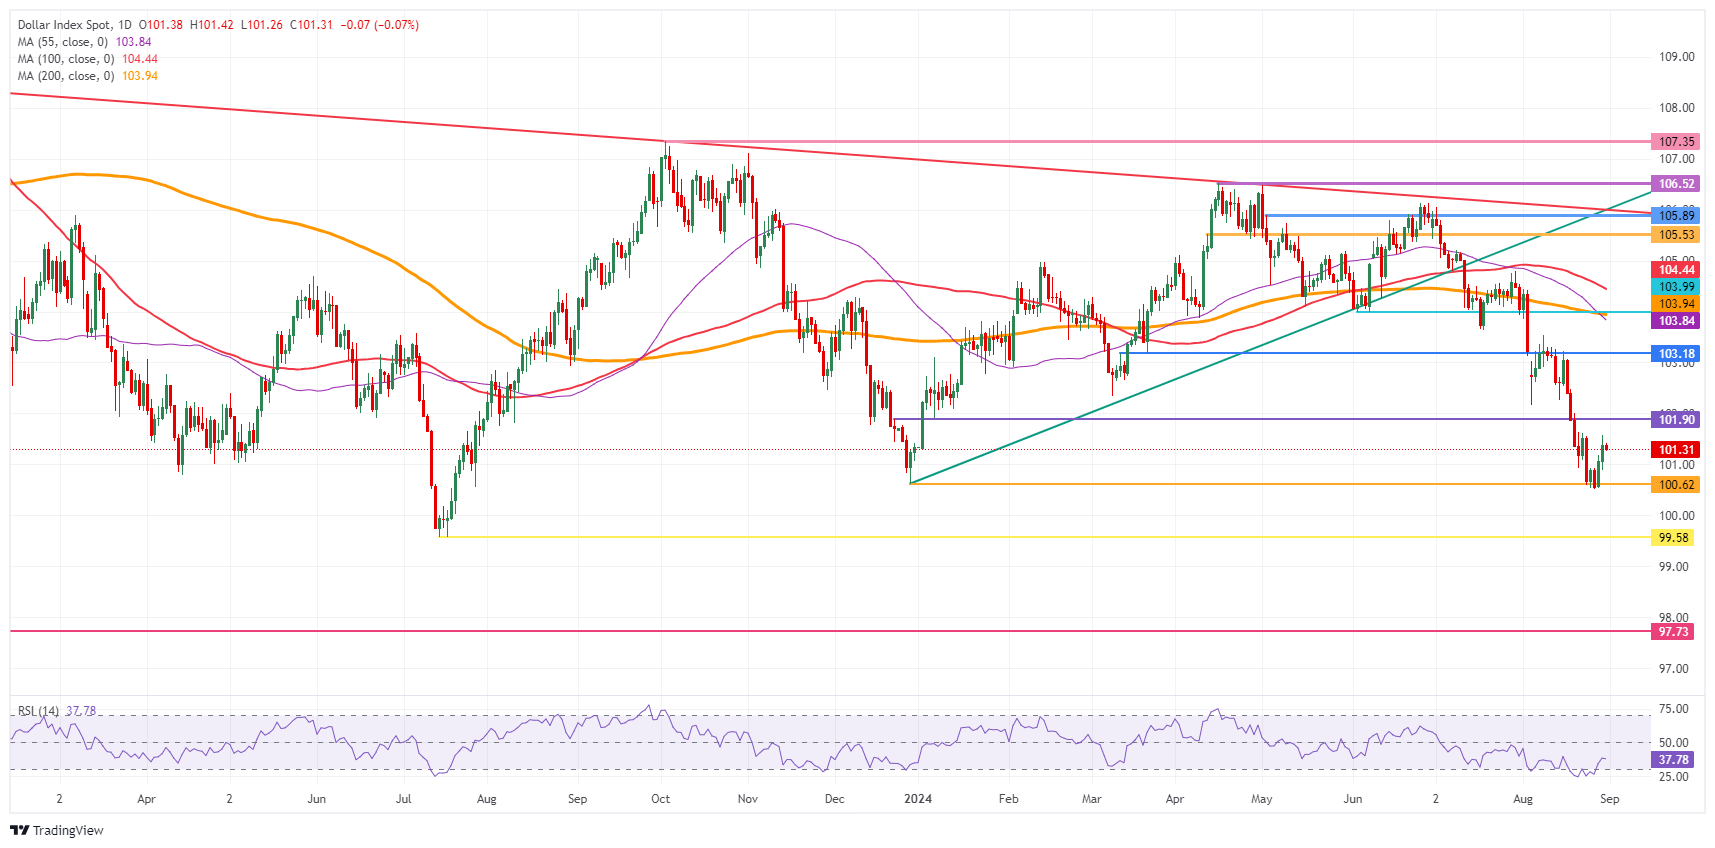
US Dollar Index: Daily Chart
Inflation FAQs
Inflation measures the rise in the price of a representative basket of goods and services. Headline inflation is usually expressed as a percentage change on a month-on-month (MoM) and year-on-year (YoY) basis. Core inflation excludes more volatile elements such as food and fuel which can fluctuate because of geopolitical and seasonal factors. Core inflation is the figure economists focus on and is the level targeted by central banks, which are mandated to keep inflation at a manageable level, usually around 2%.
The Consumer Price Index (CPI) measures the change in prices of a basket of goods and services over a period of time. It is usually expressed as a percentage change on a month-on-month (MoM) and year-on-year (YoY) basis. Core CPI is the figure targeted by central banks as it excludes volatile food and fuel inputs. When Core CPI rises above 2% it usually results in higher interest rates and vice versa when it falls below 2%. Since higher interest rates are positive for a currency, higher inflation usually results in a stronger currency. The opposite is true when inflation falls.
Although it may seem counter-intuitive, high inflation in a country pushes up the value of its currency and vice versa for lower inflation. This is because the central bank will normally raise interest rates to combat the higher inflation, which attract more global capital inflows from investors looking for a lucrative place to park their money.
Formerly, Gold was the asset investors turned to in times of high inflation because it preserved its value, and whilst investors will often still buy Gold for its safe-haven properties in times of extreme market turmoil, this is not the case most of the time. This is because when inflation is high, central banks will put up interest rates to combat it. Higher interest rates are negative for Gold because they increase the opportunity-cost of holding Gold vis-a-vis an interest-bearing asset or placing the money in a cash deposit account. On the flipside, lower inflation tends to be positive for Gold as it brings interest rates down, making the bright metal a more viable investment alternative.
Scope for the US Dollar (USD) to advance, but it does seem to have enough momentum to break the strong resistance at 145.70. In the longer run, downward momentum is slowing; if USD breaches 145.70, it would mean that 141.66 is not coming into view for now, UOB Group FX analysts Quek Ser Leang and Lee Sue Ann notes.
Bulls target resistance at 145.70
24-HOUR VIEW: “Yesterday, we expected USD to trade in a range between 143.80 and 145.20. However, USD rose to 145.55 before pulling back sharply, and quickly, closing at 144.98 (+0.28%). Upward momentum has increased, albeit not much. Today, there is scope for USD to advance, but it does not seem to have enough momentum to break the strong resistance at 145.70. On the downside, support levels are at 144.40 and 144.00.”
1-3 WEEKS VIEW: “In our most recent narrative was from Monday (26 Aug, spot at 143.85), we indicated that USD ‘remains under pressure.’ We also indicated that ‘the increase in momentum from last Friday has increased the chance of it reaching 141.66, the low registered early this month.’ Since then, USD not been able to make further progress on the downside. Downward momentum is slowing, and if USD breaches 145.70 (no change in ‘strong resistance’ level), it would mean that 141.66 is not coming into view for now.”
The DXY Index appreciated a second day by 0.28% to 101.38 overnight, DBS Senior FX Strategist Philip Wee notes.
ECB and FOMC meetings weigh on the EUR
“The Greenback’s initial boost came from a weaker Euro (EUR) on negative monthly inflation readings for Germany’s regions in August and later from resilient US consumer spending that lifted the US Treasury 10Y yield by 2.7 bps to 3.86%.”
“The US Bureau of Economic Analysis revised 2Q24 GDP growth to an annualized 3.0% QoQ saar vs. the advance estimate of 2.8% a month ago, and personal consumption expenditure growth to 2.9% from 2.3% previously.”
“EUR/USD depreciated by 0.4% to 1.1077 from markets increasing odds for a 25 bps rate cut at the European Central Bank meeting on September 12 and reducing bets for a 50 bps cut at the FOMC meeting on September 18.”
- USD/JPY is stuck moving sideways on the 4-hour Chart used to analyze the short-term trend.
- It needs to break higher or lower to confirm directionality – otherwise it will continue oscillating.
USD/JPY has been trading in a messy range all through August with little clear direction.
The pair is likely in a “sideways” trend therefore, which will probably continue until a breakout in one direction or another confirms a directional trend.
USD/JPY 4-hour Chart
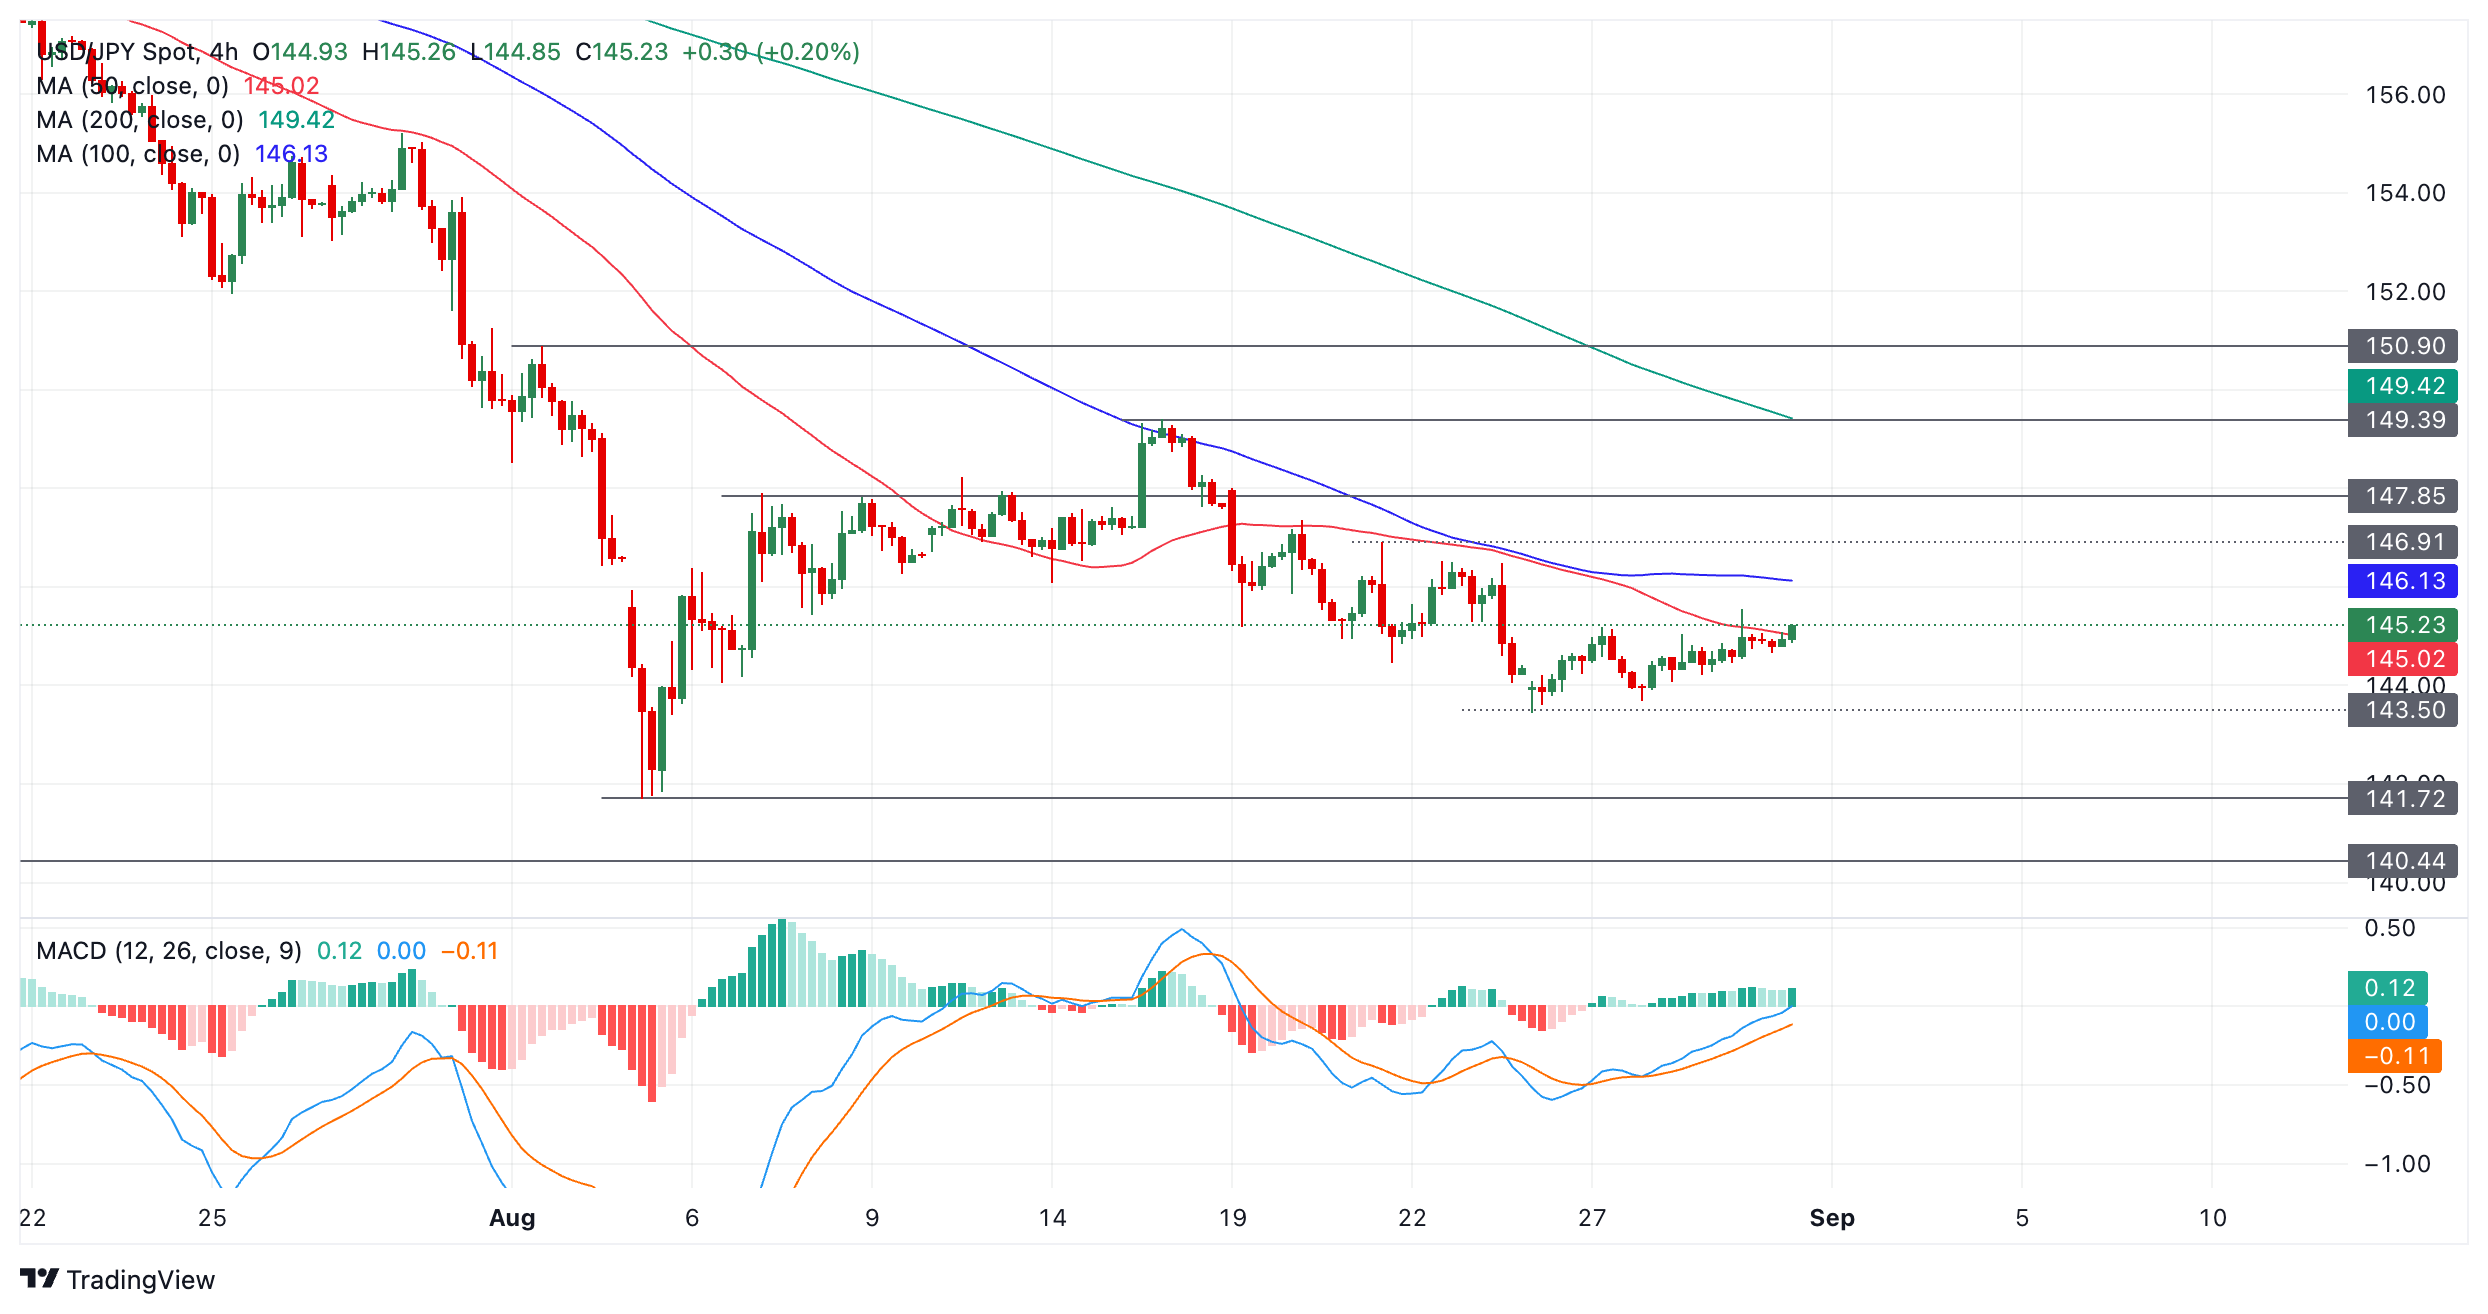
A break above 146.91 would provide a sign that bulls are getting the upper hand and probably lead to a move up to 147.85, then perhaps the August highs at around 149.39.
To the downside, a break below 143.45 (August 26 low) would confirm more downside, probably to around the 141.70s where the August lows are.
The Moving Average Convergence Divergence (MACD) is above its signal line and rising, supporting a very mildly bullish outlook, although it has not quite broken above zero yet, so it remains unconfirmed.
- Silver price stays in a tight range near $29.50 with US PCE inflation under the spotlight.
- US annual core PCE inflation is estimated to have accelerated to 2.7% in July.
- The Fed is almost certain to start reducing interest rates from September.
Silver price (XAG/USD) trades in a tight range near $29.50 in Friday’s European session. The white metal consolidates as investors have sidelined ahead of the United States (US) Personal Consumption Expenditure inflation (PCE) for August, which will be published at 12:30 GMT.
Economists expect that the annual core PCE inflation, which excludes volatile food and energy prices, rose at a higher pace of 2.7% from June’s reading of 2.6%, with monthly figures growing steadily by 0.2%. Though the Fed is widely anticipated to start reducing interest rates in September, the inflation data will influence speculation about the potential rate cut size.
According to the CME FedWatch tool, 30-day Federal Funds Futures pricing data shows that the likelihood of a probability of a 50-basis points (bps) interest rate reduction in September is 33%, while the rest are favoring a cut by 25 bps.
Ahead of the US inflation data, 10-year US Treasury yields edge lower to 3.86%. The US Dollar Index (DXY), which tracks the Greenback’s value against six major currencies, trades in a tight range near 101.50. The US Dollar (USD) holds Thursday’s recovery move, driven by better-than-preliminary estimated Q2 Gross Domestic Product (GDP) growth. As per the revised estimates, the US economy expanded at a faster pace of 3% than the flash estimate of 2.8% on an annualized basis.
Silver technical analysis
Silver price remains sideways near $29.50, oscillating inside Thursday’s trading range. The white metal continues to take support from the 20-day Exponential Moving Average (EMA), which trades around $29.00.
August 26 high of $30.20 will be the major resistance for the Silver price bulls.
The 14-day Relative Strength Index (RSI) hovers inside the 40.00-60.00 range, suggesting indecisiveness among market participants.
Silver daily chart
Silver FAQs
Silver is a precious metal highly traded among investors. It has been historically used as a store of value and a medium of exchange. Although less popular than Gold, traders may turn to Silver to diversify their investment portfolio, for its intrinsic value or as a potential hedge during high-inflation periods. Investors can buy physical Silver, in coins or in bars, or trade it through vehicles such as Exchange Traded Funds, which track its price on international markets.
Silver prices can move due to a wide range of factors. Geopolitical instability or fears of a deep recession can make Silver price escalate due to its safe-haven status, although to a lesser extent than Gold's. As a yieldless asset, Silver tends to rise with lower interest rates. Its moves also depend on how the US Dollar (USD) behaves as the asset is priced in dollars (XAG/USD). A strong Dollar tends to keep the price of Silver at bay, whereas a weaker Dollar is likely to propel prices up. Other factors such as investment demand, mining supply – Silver is much more abundant than Gold – and recycling rates can also affect prices.
Silver is widely used in industry, particularly in sectors such as electronics or solar energy, as it has one of the highest electric conductivity of all metals – more than Copper and Gold. A surge in demand can increase prices, while a decline tends to lower them. Dynamics in the US, Chinese and Indian economies can also contribute to price swings: for the US and particularly China, their big industrial sectors use Silver in various processes; in India, consumers’ demand for the precious metal for jewellery also plays a key role in setting prices.
Silver prices tend to follow Gold's moves. When Gold prices rise, Silver typically follows suit, as their status as safe-haven assets is similar. The Gold/Silver ratio, which shows the number of ounces of Silver needed to equal the value of one ounce of Gold, may help to determine the relative valuation between both metals. Some investors may consider a high ratio as an indicator that Silver is undervalued, or Gold is overvalued. On the contrary, a low ratio might suggest that Gold is undervalued relative to Silver.
Instead of continuing to rise, New Zealand Dollar (NZD) is likely to trade in a range of 0.6230/0.6290. In the longer run, NZD is expected to continue to advance; it remains to be seen if the y-t-d high of 0.6320 is within reach, UOB Group FX analysts Quek Ser Leang and Lee Sue Ann notes.
Bulls are pushing towards 0.6290
24-HOUR VIEW: “After our expectation for NZD to test 0.6265 two days ago did not materialise, we highlighted yesterday that ‘the underlying tone still seems firm, and we continue to see chance for NZD to test 0.6265.’ However, we held the view that ‘a sustained rise above this level appears unlikely.’ NZD rose more than expected, as it soared to 0.6298, and then pulled back sharply, closing at 0.6257 (+0.18%). The pullback in overbought conditions suggests that instead of continuing to rise, NZD is likely to trade in a range of 0.6230/0.6290.”
1-3 WEEKS VIEW: “Our most recent narrative was from Monday (26 Aug, spot at 0.6230), wherein “while we continue to expect NZD to advance, conditions are severely overbought, and it remains to be seen if the year-to-date high of 0.6320 is within reach.” Yesterday, although NZD rose to 0.6298, there is no clear increase in momentum. In other words, it remains to be seen if the y-t-d high of 0.6320 is within reach. On the downside, a breach of 0.6200 (‘strong support’ level previously at 0.6180) would indicate that NZD is not strengthening further.”
The South African Rand intraday reached a one-year high during yesterday's trading session, pushing USD/ZAR below the 17.7 level. However, the ZAR gave back some of its gains in later trading, Commerzbank’s FX Analyst Volkmar Baur notes.
Disinflation paves the way for lower interest rates
“Yesterday's movement was driven by better-than-expected producer prices. These fell to an annualized rate of 4.2% in July, down from 4.6% in June. On average, analysts were expecting a drop to 4.5%. This is another positive signal for the SARB, which could start cutting interest rates as early as September.”
“Normally, rate cuts are always associated with a weaker currency. However, the situation in South Africa is somewhat different. The disinflation here is not due to a weakening of demand, but to a structural improvement on the supply side. There have been no power cuts in South Africa for several months, which may not sound very impressive at first, but this has not happened in South Africa for years.”
“Disinflation is therefore paving the way for lower interest rates, which could lead to further investment and ongoing structural improvements. This positive development reduces the risk premium that the foreign exchange market has placed on South Africa in recent years and strengthens the Rand.”
The Gold price is scratching last week's all-time high and could still climb a little higher. But the upward momentum seems to be gone for now, Commerzbank’s commodity analyst Barbara Lambrecht notes.
Upward momentum seems to be gone
“After all, some expectations of interest rate cuts have been priced in. At first glance, the impact of the high price level on physical demand for Gold in China, the largest sales market, appears to have eased somewhat: Gold imports from Hong Kong climbed by 6% compared to the previous month. In net terms, i.e. excluding exports, the increase was as much as 17%.”
“In absolute terms, however, the level remained low compared to the average purchases in the first three months at a good 31 tons or 26 tons net, which was certainly also due to the fact that the Chinese central bank has not made any more purchases since May.”
“The buying interest of ETF investors is also recovering, albeit somewhat hesitantly: after all, holdings are now almost 3% higher than the multi-year low in mid-May and thus as high as they were last in mid-February.”
- Crude Oil trades broadly stable, back to its opening levels from Monday after a volatile week.
- The Libyan outage could still cause concerns about supply in the short term.
- The US Dollar Index trades above 101.00 ahead of July’s PCE inflation release.
Crude Oil prices are afloat around $75.50 on Friday after a sprint higher on Thursday. Markets are dialing in on the Libyan political turmoil, which could result in an unforeseen shortfall of roughly 1 million barrels per day in the near term. Meanwhile, Houthi rebels have released footage of their attack on the Greek vessel, which is still burning in the Red Sea.
The US Dollar Index (DXY), which tracks the performance of the US Dollar against a bucket of currencies, is popping back above 101.00. All eyes this Friday are on the Personal Consumption Expenditures (PCE) Price Index release for July. The core PCE element is the Fed’s favourite gauge to measure how inflation is behaving and could be the catalyst that predicts how big the rate cut in September will be.
At the time of writing, Crude Oil (WTI) trades at $75.42 and Brent Crude at $78.80
Oil news and market movers: Libya back on the table
- Bloomberg reports that the sudden supply disruption from Libya could result in a shortage of 1 million barrels a day, according to consultants Rapidan Energy Group. That would account for roughly 1% of global supply.
- Indonesia’s state-owned Pertamina is trying to buy Russian Oil for November delivery to Cilacap, Balikpapan and Balongan. The total amount would be around 5 million barrels, Reuters reports.
- The Greek-flagged crude Oil tanker Sounion is still burning and might be leaking oil in the Red Sea. Yemen’s Houthi rebels have agreed to allow tugboats and rescue ships to reach the damaged tanker, CNBC reports.
- Near 17:00 GMT, the weekly Baker Hughes US Oil Rig Count will be released. The previous release was a steady 483.
Economic Indicator
Baker Hughes US Oil Rig Count
The Baker Hughes Rig Counts are an important business barometer for the drilling industry and its suppliers. When drilling rigs are active they consume products and services produced by the oil service industry. The active rig count acts as a leading indicator of demand for products used in drilling, completing, producing and processing hydrocarbons. This particular case represents the number of rigs drilling exclusively for oil.
Read more.Next release: Fri Aug 30, 2024 17:00
Frequency: Irregular
Consensus: -
Previous: 483
Source: Baker Hughes
Oil Technical Analysis: Another vital close this Friday
Crude Oil is set to make a pivotal choice in this Friday’s close. . Its fate seems to be going hand in hand with that of the US Dollar Index, with technical elements that result in either a recovery or more downturn to come. For Crude, the key level to hold is $75.50 in order to still be able to retest upside levels.
On that upside, the double level at $77.55 aligns with both a descending trendline and the 200-day Simple Moving Average (SMA). In case bulls are able to break above it, the 100-day SMA at $78.54 could trigger a rejection.
On the downside, the low from August 5 at $71.17 emerges as the first support. Under $70.00, the $68.00 big figure is the first level to watch followed by $67.11, which is the lowest point from the triple bottom seen back in June 2023.
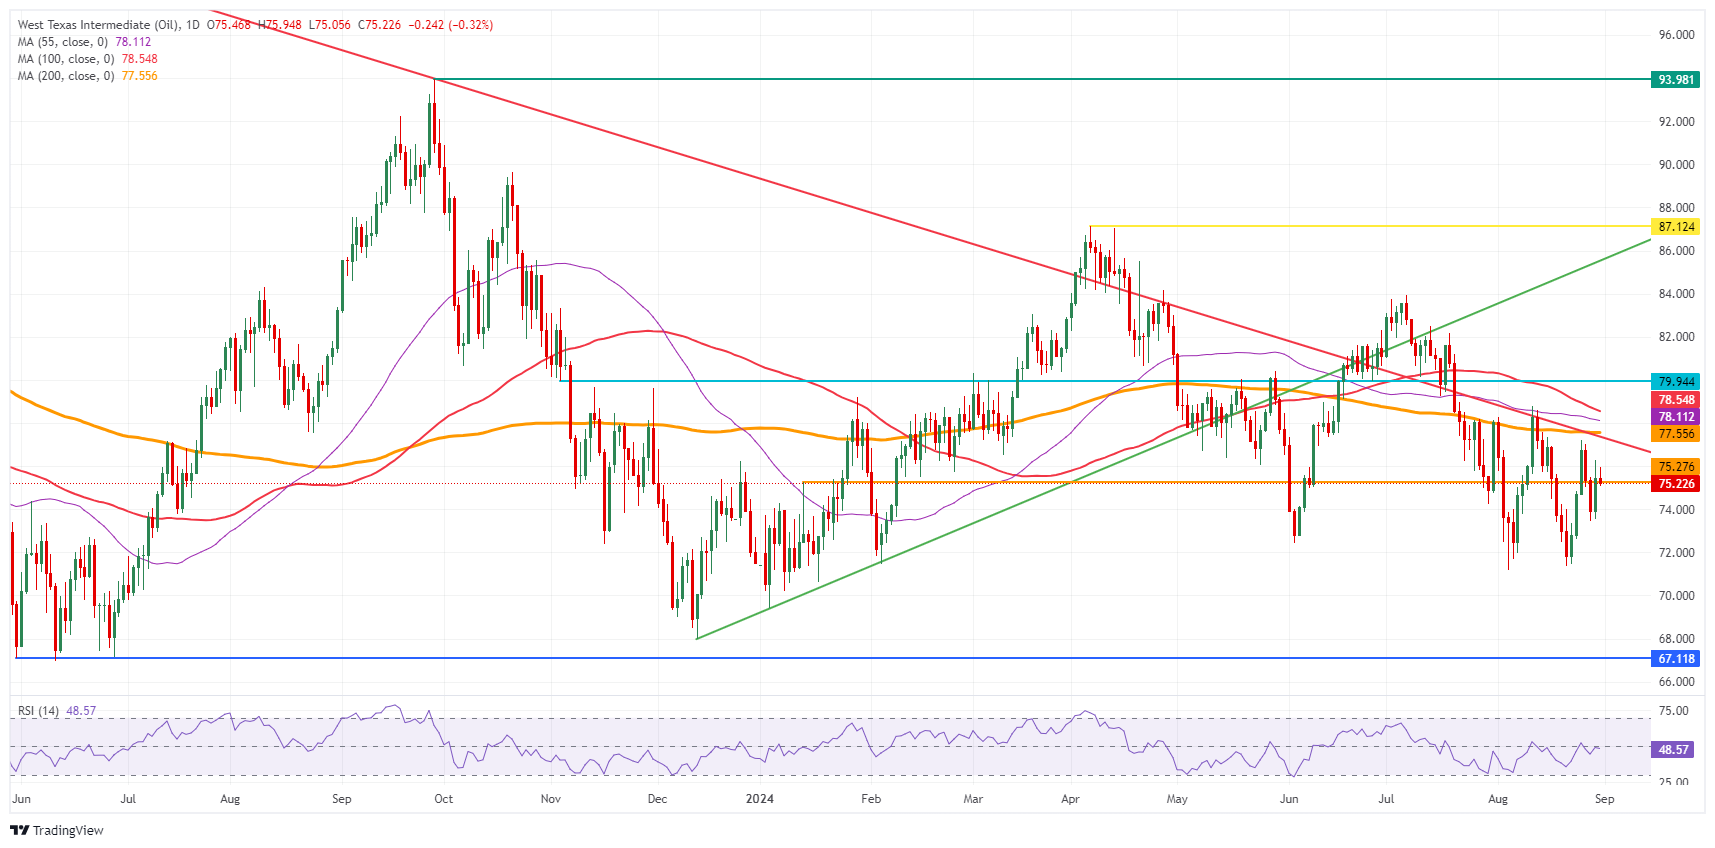
US WTI Crude Oil: Daily Chart
WTI Oil FAQs
WTI Oil is a type of Crude Oil sold on international markets. The WTI stands for West Texas Intermediate, one of three major types including Brent and Dubai Crude. WTI is also referred to as “light” and “sweet” because of its relatively low gravity and sulfur content respectively. It is considered a high quality Oil that is easily refined. It is sourced in the United States and distributed via the Cushing hub, which is considered “The Pipeline Crossroads of the World”. It is a benchmark for the Oil market and WTI price is frequently quoted in the media.
Like all assets, supply and demand are the key drivers of WTI Oil price. As such, global growth can be a driver of increased demand and vice versa for weak global growth. Political instability, wars, and sanctions can disrupt supply and impact prices. The decisions of OPEC, a group of major Oil-producing countries, is another key driver of price. The value of the US Dollar influences the price of WTI Crude Oil, since Oil is predominantly traded in US Dollars, thus a weaker US Dollar can make Oil more affordable and vice versa.
The weekly Oil inventory reports published by the American Petroleum Institute (API) and the Energy Information Agency (EIA) impact the price of WTI Oil. Changes in inventories reflect fluctuating supply and demand. If the data shows a drop in inventories it can indicate increased demand, pushing up Oil price. Higher inventories can reflect increased supply, pushing down prices. API’s report is published every Tuesday and EIA’s the day after. Their results are usually similar, falling within 1% of each other 75% of the time. The EIA data is considered more reliable, since it is a government agency.
OPEC (Organization of the Petroleum Exporting Countries) is a group of 13 Oil-producing nations who collectively decide production quotas for member countries at twice-yearly meetings. Their decisions often impact WTI Oil prices. When OPEC decides to lower quotas, it can tighten supply, pushing up Oil prices. When OPEC increases production, it has the opposite effect. OPEC+ refers to an expanded group that includes ten extra non-OPEC members, the most notable of which is Russia.
The Australian Dollar (AUD) is expected to trade in a range, probably between 0.6775 and 0.6820. In the longer run, there has been no further increase in momentum; if AUD breaks below 0.6730, it would mean that 0.6870 is not coming into view, UOB Group FX analysts Quek Ser Leang and Lee Sue Ann notes.
Moves up towards 0.6820
24-HOUR VIEW: “Our view of AUD consolidating in a range of 0.6760/0.6810 yesterday was incorrect. Instead of consolidating, AUD rose to 0.6824, pulling back to close at 0.6798 (+0.20%). The advance did not result in a significant increase in momentum. Today, we expect AUD to trade in a range, probably between 0.6775 and 0.6820.”
1-3 WEEKS VIEW: “There is not much to add to our update from yesterday (29 Aug, spot at 0.6780). As highlighted, the price action over the past couple of days did not result in further increase in momentum. From here, if AUD breaks below 0.6730 (no change in ‘strong support’ level), it would mean that the major resistance at 0.6870 is not coming into view.”
- NZD/USD has pulled back down to support but remains in an uptrend which will probably resume.
- The breakout from the range on Thursday gave a bullish signal and suggests substantial gains.
NZD/USD pulls back to support in the 0.6250s after making a higher high. The correction is in line with the Relative Strength Index exiting overbought, which has given a sell signal.
The short-term trend is bullish, however, and given “the trend is your friend” the odds favor a recovery and extension to higher highs.
Thursday’s break above the August 20 high confirmed a breakout and indicated substantial probable gains on the horizon.
NZD/USD 4-hour Chart
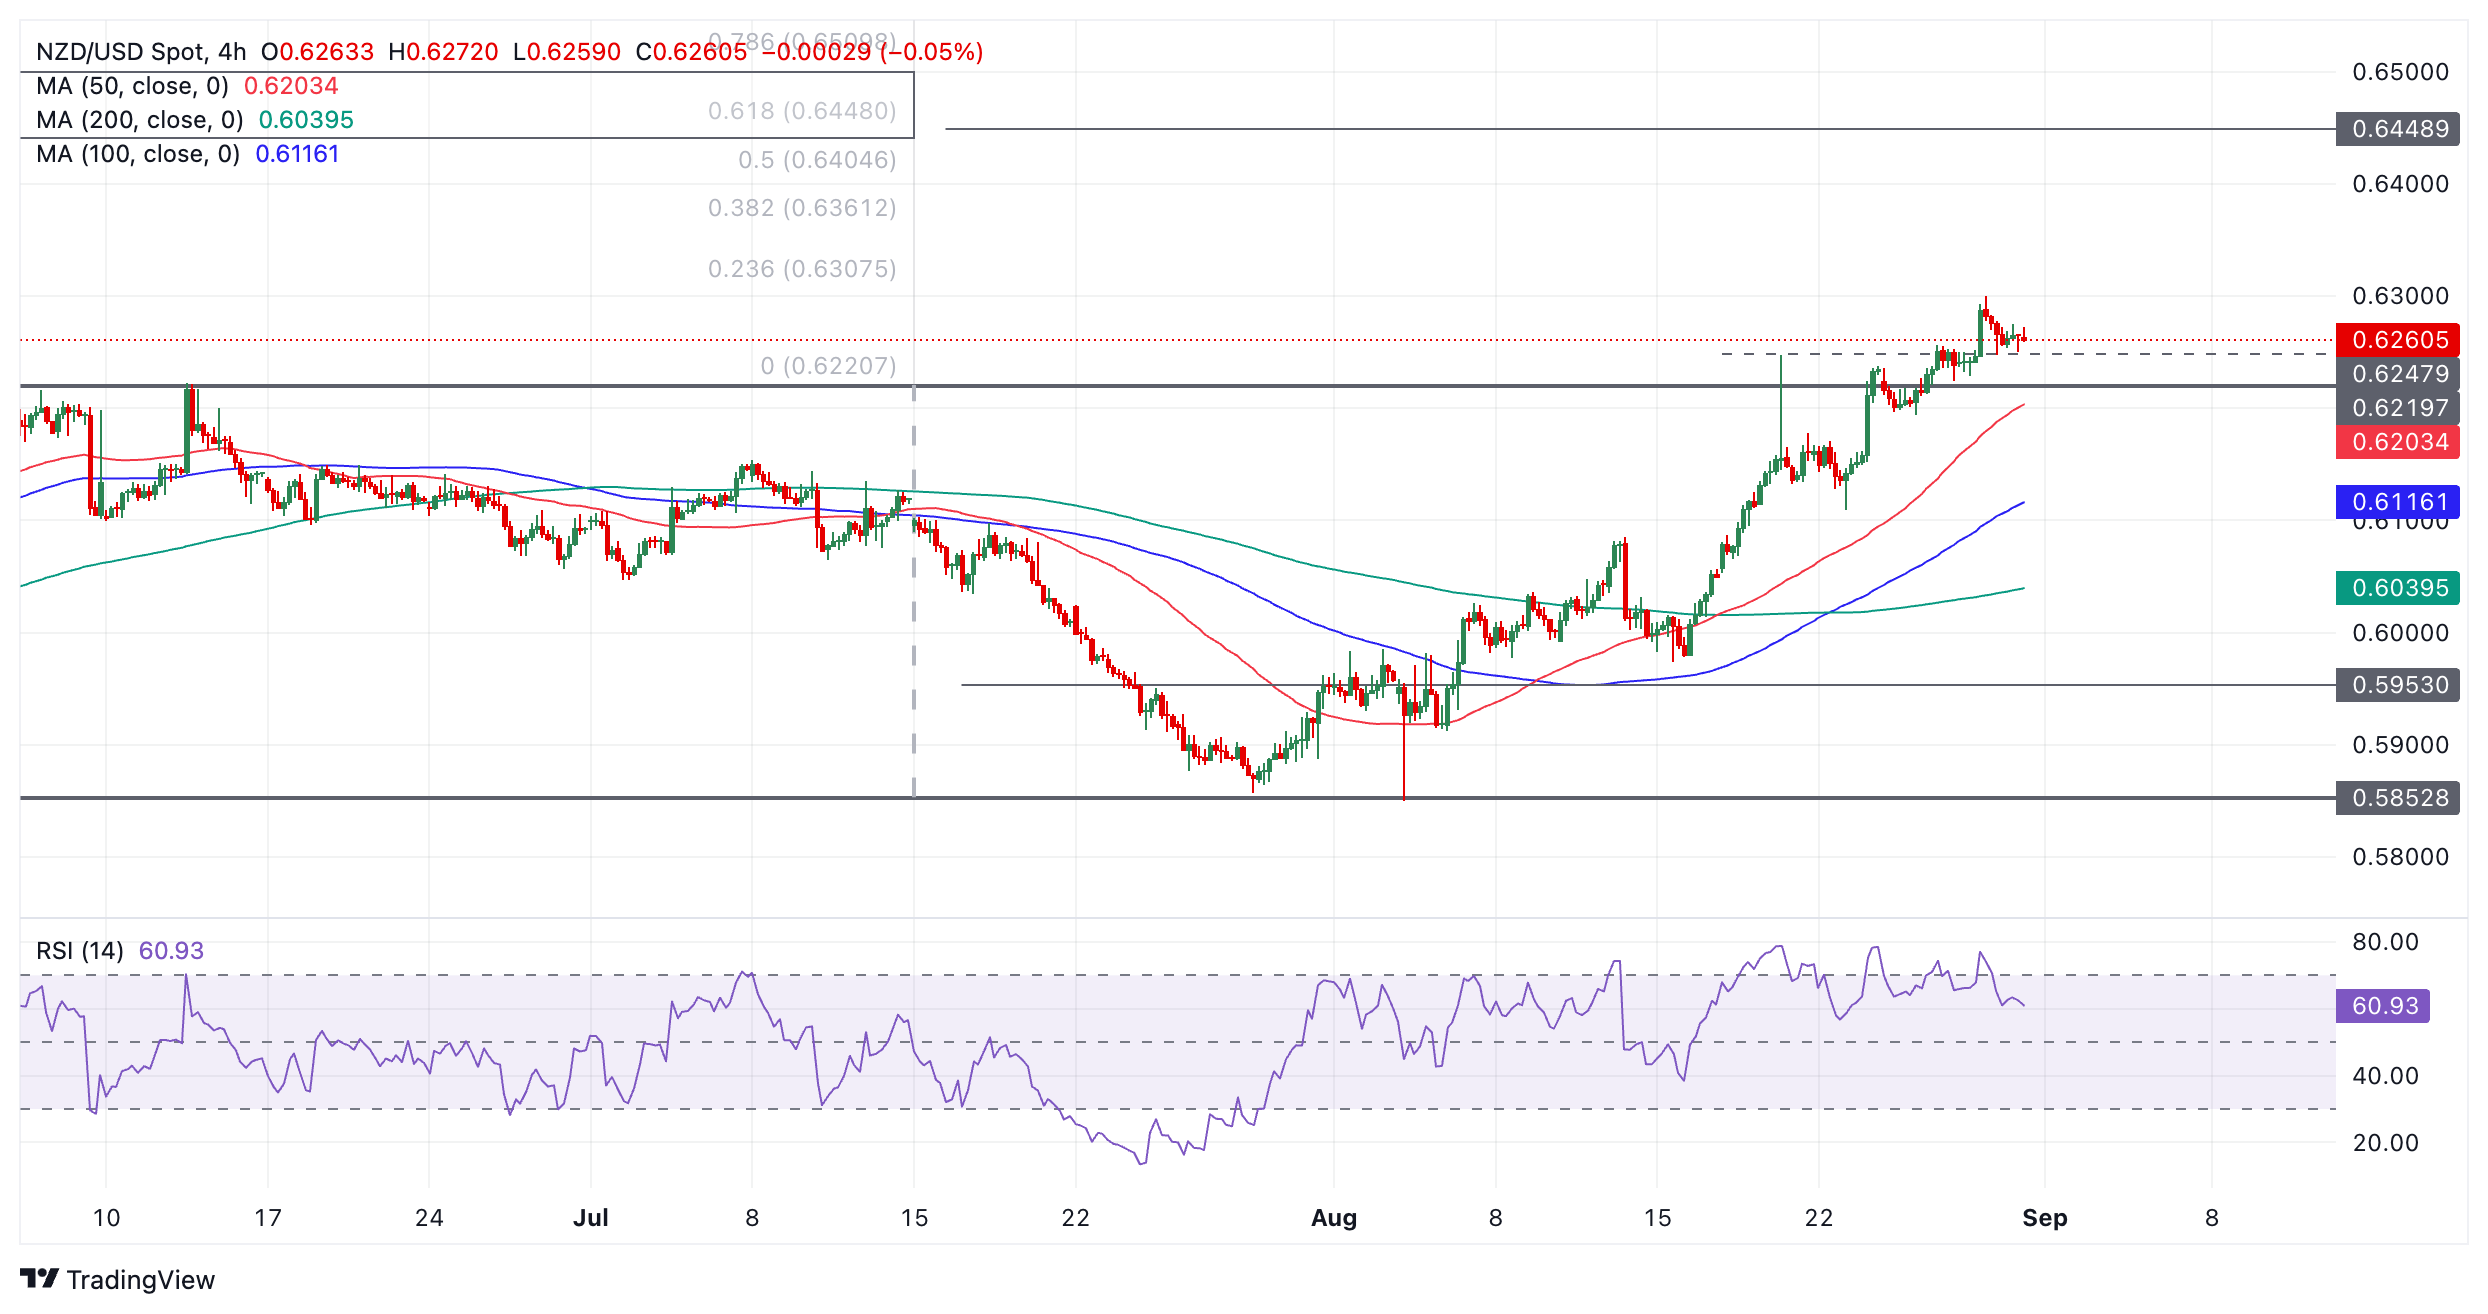
The next target is at 0.6409, the December 2023 high. This is a conservative target for the pair – the breakout from the range activates an upside target that is higher at 0.6448, calculated by taking the 0.618 ratio of the height of the range and extrapolating it higher.
According to the State Administration of Foreign Exchange (SAFE), 53% of China's foreign trade was denominated in renminbi last month. This means that the use of the RMB has developed very strongly in recent years. It was only last year that the RMB overtook the US dollar as the number one currency. Before the pandemic, about twice as much of China's foreign trade was priced in US dollars than in the domestic currency, Commerzbank’s FX Analyst Volkmar Baur notes.
China adapts its monetary policy to the US economic situation
“The relative stability of CNY/USD in recent months is often cited as a key factor. Indeed, the historical volatility of the CNY/USD exchange rate has been significantly lower on average this year than in recent years, at times reaching its lowest level in 9 years. If the CNY were to fluctuate more against the USD, the argument goes, trading partners would not be persuaded to price goods in CNY. Therefore, it is (or was) necessary to manage the CNY more closely against the USD.”
“What China is doing with the renminbi is exactly wrong. By focusing its monetary policy on managing its currency in relation to the USD, it is adapting its monetary policy to the US economic situation instead of focusing on its own situation. At the moment, this means that China's monetary policy appears to be too restrictive in the face of very low inflation and weak economic growth.”
“At some point, however, the Chinese central bank will have to decouple from the USD. It is possible that, due to a certain path dependency, many trading partners will continue to price their goods in RMB, even if the CNY fluctuates more against the USD again. However, it is also possible that many will then switch back to the USD. In that case, the temporarily higher share of the RMB in China's foreign trade would be a Pyrrhic victory.”
- The Mexican Peso is rising as risk assets rebound on a more upbeat market mood.
- Strong US data has reduced the chances of a hard landing for the US economy.
- USD/MXN continues to make higher highs in line with the dominant uptrend.
The Mexican Peso (MXN) edges higher in its most-traded pairs on Friday as market sentiment improves following the release of stronger-than-expected US data indicating a hard landing for the US economy is now less likely. The generally upbeat sentiment, in turn, benefits the risk-on MXN.
The overall trend for the Peso of the last weeks, however, has been bearish as slowing economic growth, political factors and expectations the Bank of Mexico (Banxico) will continue with its easing cycle, all weigh.
At the time of writing, one US Dollar (USD) buys 19.76 Mexican Pesos, EUR/MXN trades at 21.90, and GBP/MXN at 26.05.
Mexican Peso tracks riskier assets higher
The Mexican Peso edges higher on Friday, tracking riskier assets in general after the release of US annualized Gross Domestic Product (GDP) for the second quarter was revised up to 3.0% growth compared to the preliminary estimate’s 2.8%, in data released Thursday.
Spirits were further lifted after US Initial Jobless Claims data came out slightly lower than expected at 231K, when 232K had been forecast. This was also below the upwardly-revised 233K of the previous week. Given the Fed’s new focus on “the risks to employment,” this helped instill more confidence the economy might manage to achieve a soft landing.
That said, the Mexican Peso still faces domestic headwinds. The Bank of Mexico (Banxico) quarterly report for Q2, released on Wednesday, revealed a downward revision to the bank’s GDP forecasts for 2024 and 2025. Banxico now expects growth to slow to 1.5% in 2024, down from 2.4% in the previous report. In 2025, it expects the economy to grow by 1.2% from 1.5% previously anticipated. These revisions indicate Banxico will feel more pressure to lower interest rates to support growth.
On the subject of adjusting interest rates, the report stated: “Looking ahead, the Board foresees that the inflationary environment may allow for discussing reference rate adjustments.”
Banxico did not change its inflation forecasts from those announced in its August policy meeting, but said it had included new factors such as the (inflationary) impact of a weaker Peso. It continues to see inflation falling steadily towards the bank’s 3.0% target, which it expects to hit in the last quarter of 2025. It mentioned the course of services sector inflation as a key factor in its decision making.
Most analysts foresee Banxico making substantial rate cuts before the end of the year.
- Banorte expects a 25 basis point (bps) rate cut in September and interest rates to end the year at 10.25% (rates are at 10.75% currently).
- Citibanamex expects a quarter of percentage rate cuts in September, November, and December, with Banxico’s reference rate hitting 10.00% by year-end.
- Monex expects the bank’s reference rate to end the year at 10.25% with a cut in September, and November and December meetings “live”.
- Goldman Sachs anticipates rate cuts of 25 bps each in the three remaining meetings of the year, bringing the interest rate down to 10.00% by year’s end.
- Capital Economics foresees 50 bps of cuts before the end of 2024, bringing the reference rate down to 10.25%.
Political risks are a further bearish background factor for the Peso. The government’s proposed reform of the judicial system has elicited criticism from members of the judiciary themselves – with protests in Mexico City – foreign diplomats and investors alike.
The Mexican government chose to “pause” diplomatic relations with the US after the US ambassador publicly criticized the reforms, and Canada has also broken diplomatic ties. If the stand-off escalates, there is a chance it could negatively impact free trade between the three countries, with negative implications for the Mexican Peso.
At the same time, the Peso potentially stands to benefit from an escalating trade war between North America and China. Given its role as an intermediary manufacturer for Chinese goods entering North America, the escalation of tariffs – most recently by Canada – could find it well positioned to benefit from the fallout.
Technical Analysis: USD/MXN makes higher highs
USD/MXN trades steadily higher within a broader rising channel. It has established an uptrend and given “the trend is your friend” the odds favor longs over shorts.
USD/MXN 4-hour Chart
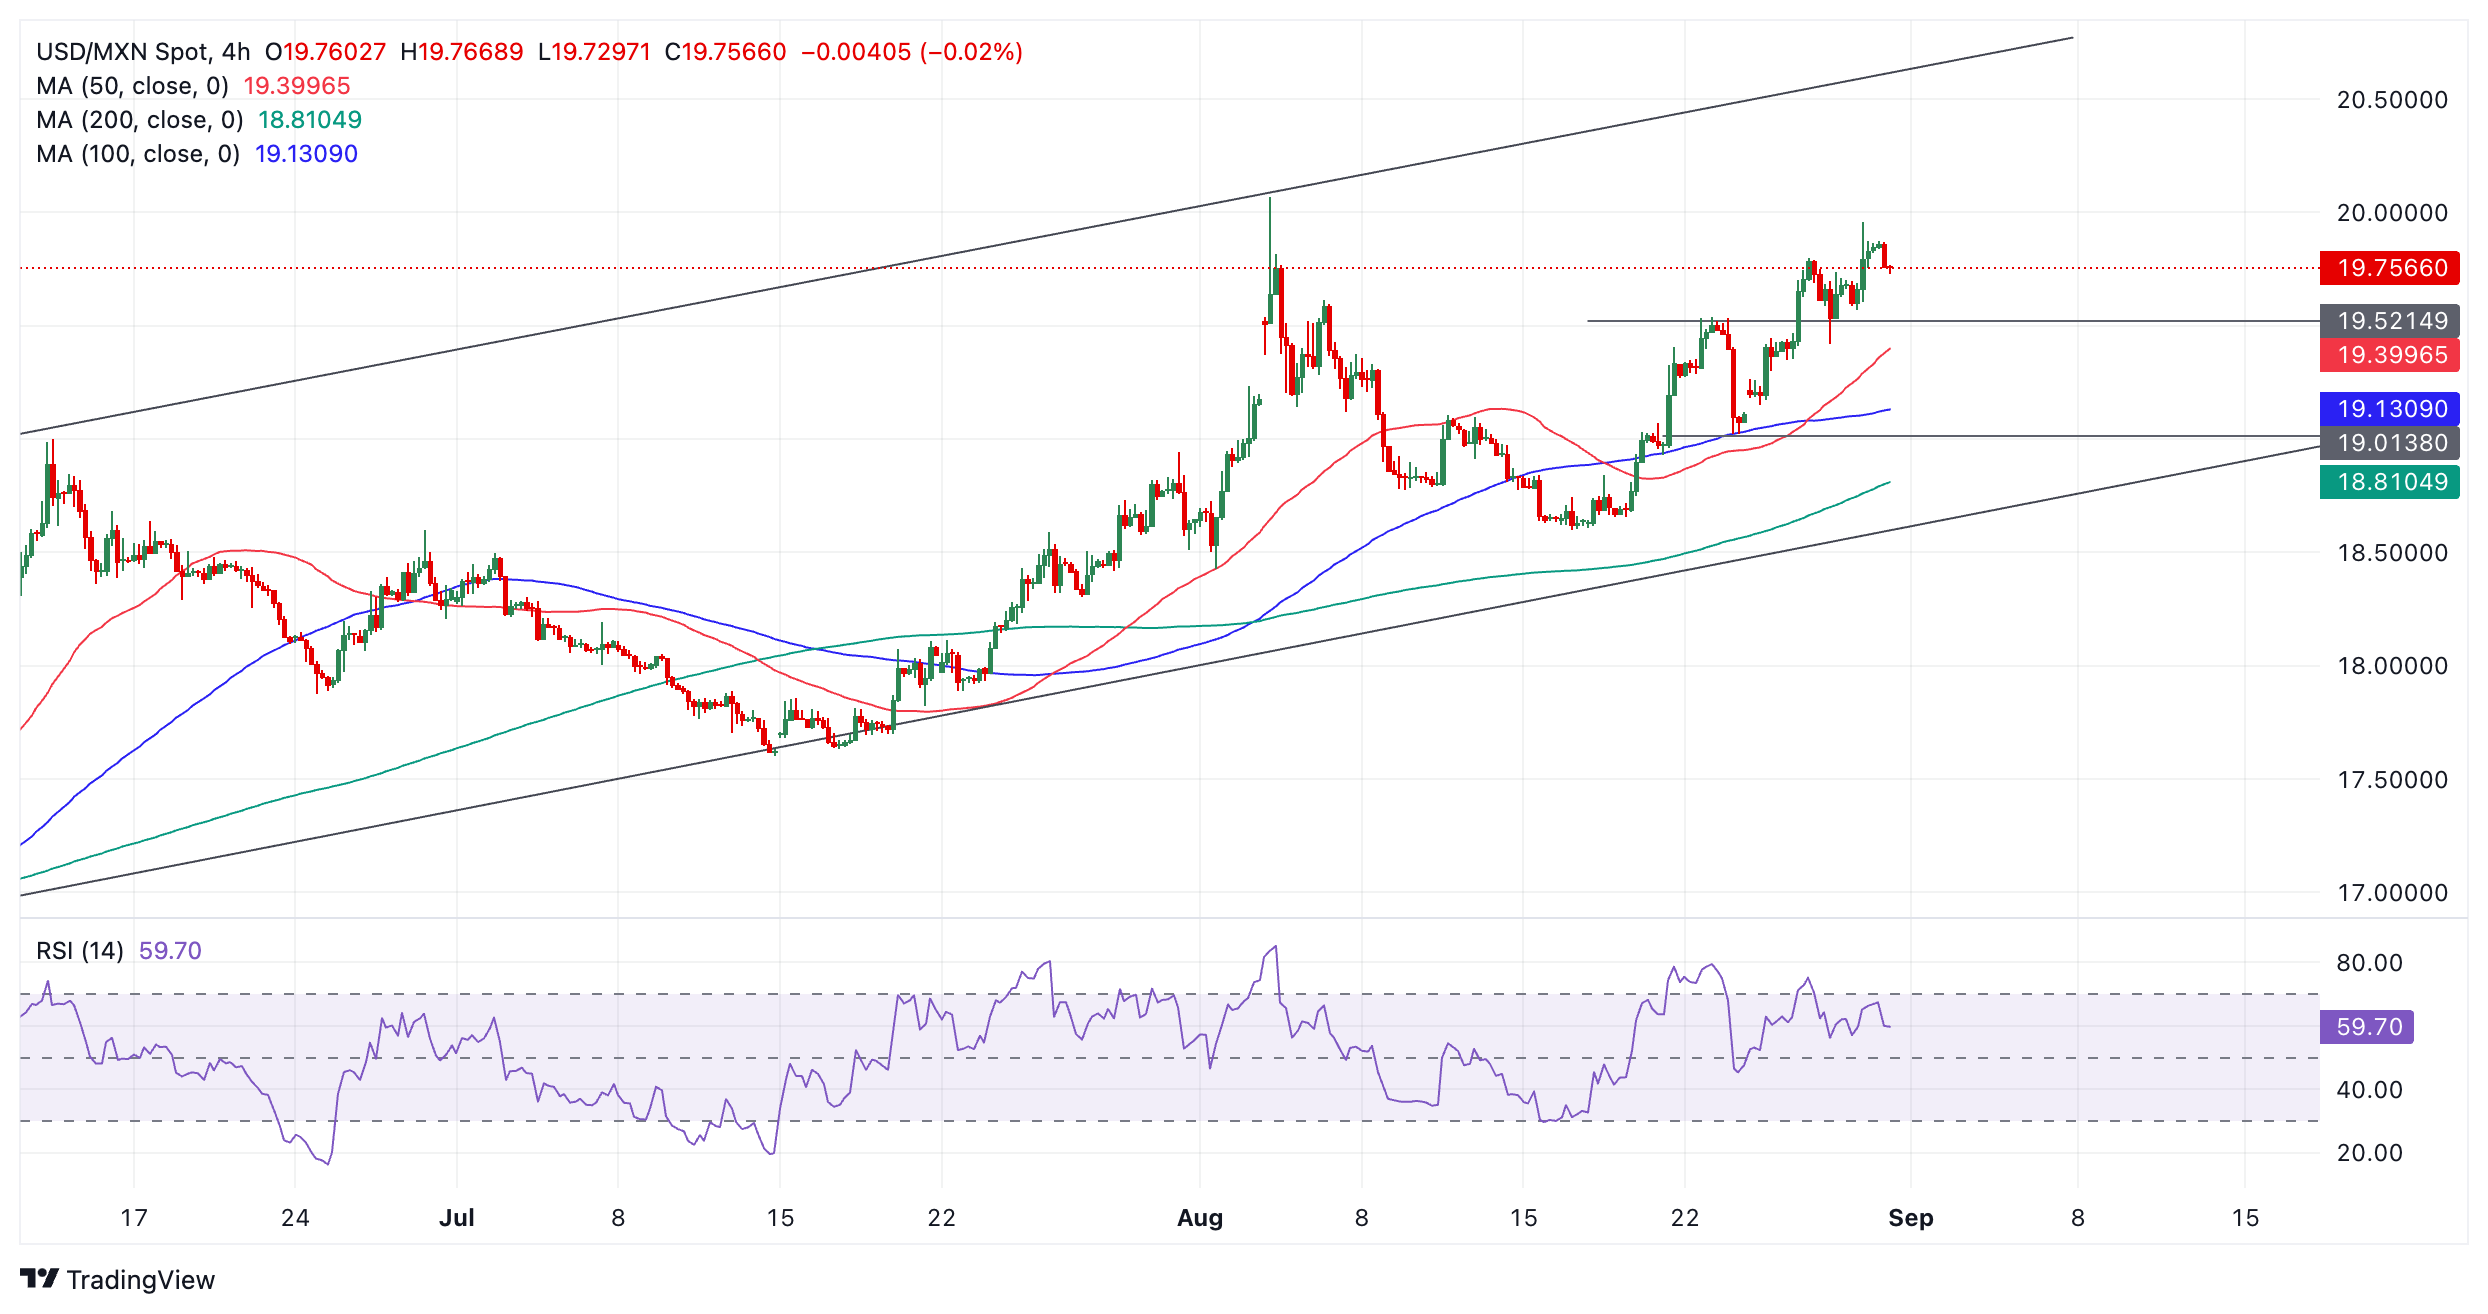
The pair made a higher high of 19.95 on Thursday, from which it is currently pulling back. Once the correction has finished, however, it will probably resume its uptrend towards a target at the upper channel line in the 20.60s.
That said, the Relative Strength Index (RSI) is making lower highs at the same time as price is making higher highs – a sign of bearish divergence. This suggests an underlying lack of bullish strength in the rally, which could be a warning signal of deeper downside corrections to come.
Economic Indicator
Gross Domestic Product Annualized
The real Gross Domestic Product (GDP) Annualized, released quarterly by the US Bureau of Economic Analysis, measures the value of the final goods and services produced in the United States in a given period of time. Changes in GDP are the most popular indicator of the nation’s overall economic health. The data is expressed at an annualized rate, which means that the rate has been adjusted to reflect the amount GDP would have changed over a year’s time, had it continued to grow at that specific rate. Generally speaking, a high reading is seen as bullish for the US Dollar (USD), while a low reading is seen as bearish.
Read more.Last release: Thu Aug 29, 2024 12:30 (Prel)
Frequency: Quarterly
Actual: 3%
Consensus: 2.8%
Previous: 2.8%
Source: US Bureau of Economic Analysis
The US Bureau of Economic Analysis (BEA) releases the Gross Domestic Product (GDP) growth on an annualized basis for each quarter. After publishing the first estimate, the BEA revises the data two more times, with the third release representing the final reading. Usually, the first estimate is the main market mover and a positive surprise is seen as a USD-positive development while a disappointing print is likely to weigh on the greenback. Market participants usually dismiss the second and third releases as they are generally not significant enough to meaningfully alter the growth picture.
The Pound Sterling (GBP) is expected to trade in a 1.3145/1.3215 range. In the longer run, rapid slowdown in momentum suggests the likelihood of GBP rising to 1.3320 has diminished, UOB Group FX analysts Quek Ser Leang and Lee Sue Ann notes.
Rapid slowdown in momentum
24-HOUR VIEW: “While we noted an increase in downward momentum yesterday, we indicated that ‘it does not appear to be enough for GBP to break the strong support at 1.3145.’ However, GBP weakened more than expected, almost breaching 1.3145 as it reached a low of 1.3146. GBP closed at 1.3170 (-0.16%). Despite the decline, downward momentum has not increased much. Instead of continuing to weaken, GBP is expected to trade in a 1.3145/1.3215 range today.”
1-3 WEEKS VIEW: “Our update from yesterday (29 Aug, spot at 1.3195) is still valid. As highlighted, there has been a rapid slowdown in upward momentum. While our ‘strong support’ level at 1.3145 has not been breached yet, the slowdown in momentum suggests the likelihood of GBP rising to 1.3320 has diminished. GBP must break and remain above 1.3250 in the next 1 to 2 days, or a breach of the ‘strong support’ level would not be surprising.”
- AUD/USD moves higher to near 0.6800 despite flat Aussie Retail Sales data for July.
- The RBA is unlikely to pivot to policy normalization this year.
- Investors await the US core PCE inflation for July and Caixin Manufacturing PMI for August.
The AUD/USD pair gains to near 0.6800 in Friday’s European session. The Aussie asset rises as the Australian Dollar (AUD) remains firm even though the Australian Retail Sales were reported flat in July in Asian trading hours, and China’s Manufacturing PMI is expected to have contracted consecutively for the second month in August.
The Australian Bureau of Statistics reported on early Friday that there was no growth in Retail Sales in July, while economists forecasted them to rise at a slower pace of 0.3% from 0.5% in June. Flat Retail Sales appear to be the outcome of the lower spending power of households due to high inflation and the restrictive monetary policy stance of the Reserve Bank of Australia (RBA).
Despite a slowdown in Australian consumer spending, the RBA is unlikely to cut interest rates sooner as its battle against inflation appears to be much more fierce than what other nations are facing. Recent inflation data showed that the monthly Consumer Price Index (CPI) decelerated to 3.5% from 3.8% in June but remained higher than estimates of 3.4%. According to the market speculation, the RBA is expected to keep its Official Cash Rate (OCR) at 4.35% by the year.
Meanwhile, a Reuters poll showed on Friday that China’s factory PMI, which will be published on Monday, is expected to come in below 50.0. A level that separates growth mark from contraction. This would prompt the scale of monetary stimulus to uplift poor economic prospects. Being a proxy for China’s economic prospects, the Australian Dollar will be negatively influenced by weak data.
On the Unites States (US) front, investors await the Personal Consumption Expenditure Price Index (PCE) data for July, which will be published at 12:30 GMT. The report is expected to show that the annual core PCE inflation, which excludes volatile food and energy prices, rose at a higher pace of 2.7% from June’s reading of 2.6%, with monthly figures growing steadily by 0.2%. The inflation data will significantly influence market speculation for Fed interest rate cuts in September.
The Fed is widely anticipated to start reducing its borrowing rates in September but traders are divide over the likely rate-cut size.
Australian Dollar FAQs
One of the most significant factors for the Australian Dollar (AUD) is the level of interest rates set by the Reserve Bank of Australia (RBA). Because Australia is a resource-rich country another key driver is the price of its biggest export, Iron Ore. The health of the Chinese economy, its largest trading partner, is a factor, as well as inflation in Australia, its growth rate and Trade Balance. Market sentiment – whether investors are taking on more risky assets (risk-on) or seeking safe-havens (risk-off) – is also a factor, with risk-on positive for AUD.
The Reserve Bank of Australia (RBA) influences the Australian Dollar (AUD) by setting the level of interest rates that Australian banks can lend to each other. This influences the level of interest rates in the economy as a whole. The main goal of the RBA is to maintain a stable inflation rate of 2-3% by adjusting interest rates up or down. Relatively high interest rates compared to other major central banks support the AUD, and the opposite for relatively low. The RBA can also use quantitative easing and tightening to influence credit conditions, with the former AUD-negative and the latter AUD-positive.
China is Australia’s largest trading partner so the health of the Chinese economy is a major influence on the value of the Australian Dollar (AUD). When the Chinese economy is doing well it purchases more raw materials, goods and services from Australia, lifting demand for the AUD, and pushing up its value. The opposite is the case when the Chinese economy is not growing as fast as expected. Positive or negative surprises in Chinese growth data, therefore, often have a direct impact on the Australian Dollar and its pairs.
Iron Ore is Australia’s largest export, accounting for $118 billion a year according to data from 2021, with China as its primary destination. The price of Iron Ore, therefore, can be a driver of the Australian Dollar. Generally, if the price of Iron Ore rises, AUD also goes up, as aggregate demand for the currency increases. The opposite is the case if the price of Iron Ore falls. Higher Iron Ore prices also tend to result in a greater likelihood of a positive Trade Balance for Australia, which is also positive of the AUD.
The Trade Balance, which is the difference between what a country earns from its exports versus what it pays for its imports, is another factor that can influence the value of the Australian Dollar. If Australia produces highly sought after exports, then its currency will gain in value purely from the surplus demand created from foreign buyers seeking to purchase its exports versus what it spends to purchase imports. Therefore, a positive net Trade Balance strengthens the AUD, with the opposite effect if the Trade Balance is negative.
Data out of Japan this morning is mixed. On the one hand, inflation rose slightly more than expected, but on the other hand, the economy is still fragile, UOB Group FX analysts Quek Ser Leang and Lee Sue Ann notes.
BoJ not to raise rates in September
“Prices in the Tokyo area rose 2.6% in August, which was above analysts' expectations. The inflation rate for the Tokyo area is always released three weeks before the national figures, but is considered a good indicator of the national trend. However, excluding food and energy, prices rose only 1.3% year-on-year, although this was slightly higher than the previous month's 1.1%.”
“At the same time, the economy remains shaky. Both industrial production and retail sales fell short of expectations in July, while the unemployment rate rose slightly from 2.5% to 2.7%. All in all, these data do not paint a picture of an economy that desperately needs a rate hike. On the other hand, the BoJ never tires of emphasizing that it is ready to raise rates further if the situation evolves more or less as expected – which, by and large, can be said of today's data.
“Nevertheless, we think that the fundamental picture will prevail for the time being and that the BoJ will not raise rates again at its next meeting in September.”
Euro (EUR) is likely to trade in a 1.1050/1.1125 range. In the longer run, upward momentum has largely dissipated, and EUR is expected to trade in a range between 1.1040 and 1.1200, UOB Group FX analysts Quek Ser Leang and Lee Sue Ann notes.
The 1.1040 support may become a magnet for EUR
24-HOUR VIEW: “After EUR fell sharply two days ago, we indicated yesterday that 'the sharp and swift drop seems to be overextended.' However, we were of the view that 'there is room for EUR to decline further to 1.1095 before stabilization is likely.' We highlighted that 'the major support at 1.1040 is unlikely to come under threat.' Although our view of a lower EUR was not wrong, it fell more than expected, reaching a low of 1.1054 before recovering. Conditions are severely oversold now, and EUR is unlikely to weaken much further. Today, EUR is more likely to trade in a 1.1050/1.1125 range.”
1-3 WEEKS VIEW: “We highlighted yesterday (29 Aug, spot at 1.1125) that upward momentum has largely dissipated. We expected EUR to trade in a range between 1.1040 and 1.1200. There is no change in our view. Looking ahead, as long as EUR does not break clearly below 1.1040, there is still chance for EUR to rise to 1.1200 later on. Conversely, if EUR breaks clearly below 1.1040, it could trigger a deeper pullback to 1.0890.”
Silver prices (XAG/USD) rose on Friday, according to FXStreet data. Silver trades at $29.53 per troy ounce, up 0.38% from the $29.42 it cost on Thursday.
Silver prices have increased by 24.10% since the beginning of the year.
| Unit measure | Silver Price Today in USD |
|---|---|
| Troy Ounce | 29.53 |
| 1 Gram | 0.95 |
The Gold/Silver ratio, which shows the number of ounces of Silver needed to equal the value of one ounce of Gold, stood at 85.48 on Friday, down from 85.71 on Thursday.
Silver FAQs
Silver is a precious metal highly traded among investors. It has been historically used as a store of value and a medium of exchange. Although less popular than Gold, traders may turn to Silver to diversify their investment portfolio, for its intrinsic value or as a potential hedge during high-inflation periods. Investors can buy physical Silver, in coins or in bars, or trade it through vehicles such as Exchange Traded Funds, which track its price on international markets.
Silver prices can move due to a wide range of factors. Geopolitical instability or fears of a deep recession can make Silver price escalate due to its safe-haven status, although to a lesser extent than Gold's. As a yieldless asset, Silver tends to rise with lower interest rates. Its moves also depend on how the US Dollar (USD) behaves as the asset is priced in dollars (XAG/USD). A strong Dollar tends to keep the price of Silver at bay, whereas a weaker Dollar is likely to propel prices up. Other factors such as investment demand, mining supply – Silver is much more abundant than Gold – and recycling rates can also affect prices.
Silver is widely used in industry, particularly in sectors such as electronics or solar energy, as it has one of the highest electric conductivity of all metals – more than Copper and Gold. A surge in demand can increase prices, while a decline tends to lower them. Dynamics in the US, Chinese and Indian economies can also contribute to price swings: for the US and particularly China, their big industrial sectors use Silver in various processes; in India, consumers’ demand for the precious metal for jewellery also plays a key role in setting prices.
Silver prices tend to follow Gold's moves. When Gold prices rise, Silver typically follows suit, as their status as safe-haven assets is similar. The Gold/Silver ratio, which shows the number of ounces of Silver needed to equal the value of one ounce of Gold, may help to determine the relative valuation between both metals. Some investors may consider a high ratio as an indicator that Silver is undervalued, or Gold is overvalued. On the contrary, a low ratio might suggest that Gold is undervalued relative to Silver.
(An automation tool was used in creating this post.)
German inflation figures were the main focus for EUR/USD on Thursday. After the Spanish CPI figures came in slightly below expectations, causing some temporary weakness in the Euro, the German regional CPI figures caused EUR/USD to drop below the 1.11 level. The official figures then confirmed the pre-announcements – at 1.9%, the inflation rate was below the central bank's target for the first time in 3 years, Commerzbank’s FX Analyst Volkmar Baur notes.
EUR/USD to be moved by euro area inflation
“More inflation data is due today: First up at 10am (UTC+1) are inflation rates for the euro area. The Fed's preferred inflation gauge for the US, the PCE deflator, will be released at 1:30 pm. However, neither figure is likely to have the same impact on the exchange rate as yesterday's. In the case of the Euro figures, this is because a number of national statistical offices have already published their figures yesterday.”
“A downward surprise is expected. The Bloomberg survey of economists conducted before yesterday's figures still shows an expectation of 2.2%, and the harmonized CPI YoY came out as expected. The situation is similar for the US figures. Consumer (CPI) and producer (PPI) prices are always released in the middle of the month in the US, with most of the components of these indices going directly into the PCE deflator. Again, the potential for surprises is limited.”
“In addition, the focus in the US is now clearly on next week's labor market data. Statements by Fed members in recent weeks have made this clear. Inflation no longer stands in the way of a rate cut. It now depends on the labor market how fast and how much interest rates will fall. Meanwhile, the situation in the euro area is still different. The economy is already weaker. It is the persistence of inflation that makes ECB members cautious about further rate cuts. If an inflation number is going to move the EUR/USD again today, it is more likely to be the euro area one.”
- Annual core HICP inflation in Eurozone edged lower to 2.8%.
- EUR/USD continues to trade in a narrow channel below 1.1100.
The Harmonized Index of Consumer Prices (HICP), the European Central Bank's (ECB) preferred gauge of inflation, rose 2.2% on a yearly basis in August's flash estimate, Eurostat reported on Friday. This reading followed the 2.6% increase recorded in July and matched the market expectation. On a monthly basis, the HICP rose 0.2% after staying unchanged in July.
The core HICP, which excludes prices of volatile items such as food and energy, increased 0.3% on a monthly basis in August and rose 2.8% annually. Both of these prints came in line with analysts' estimate.
Market reaction
These numbers failed to trigger a noticeable reaction in the Euro. At the time of press, EUR/USD was virtually unchanged on the day at 1.1080.
- The Pound Sterling bounces back from 1.3150 as the US Dollar trades subdued ahead of US core PCE inflation data for July.
- Investors see the annual core PCE inflation accelerating to 2.7% from 2.6% in June.
- The policy-easing spell from the BoE is expected to be slower than that of its major peers.
The Pound Sterling (GBP) finds cushion near 1.3150 after a two-day sell-off against the US Dollar (USD) in Friday’s London session. The GBP/USD pair gains ground as the US Dollar exhibits a subdued performance in the countdown to the release of the United States (US) Personal Consumption Expenditure Price Index (PCE) data for July, which will be published at 12:30 GMT. The US Dollar Index (DXY), which tracks the Greenback’s value against six major currencies, falls slightly to 101.30.
Economists expect that the annual core PCE inflation, which excludes volatile food and energy prices, rose at a higher pace of 2.7% from June’s reading of 2.6%, with monthly figures growing steadily by 0.2%.
Historically, the impact of the PCE inflation data has been high as it is the Federal Reserve’s (Fed) preferred inflation gauge for decision-making on interest rates. This time, the impact of the underlying inflation data is expected to remain limited on the US Dollar and market speculation for the Fed’s interest rate cut path this year unless there is a significant deviation from estimates and the former release.
With increased confidence that inflation is on track to sustainably decline to the Fed’s target of 2%, officials are now worried about growing risks to US labor market strength. “The balance of risks to our mandate has changed”, said Fed Chair Jerome Powell last week in his speech at the Jackson Hole (JH) Symposium. The comments from some other Fed policymakers have also indicated that the central bank won’t hesitate to reduce its key borrowing rates aggressively in case of further evidence of a sharp deterioration in the labor market emerges.
Currently, financial market participants expect that the Fed is almost certain to start reducing interest rates in September. However, traders remain split over the likely size by which the Fed will begin its long-awaited policy-easing. According to the CME FedWatch tool, the probability of a 50-basis-points (bps) interest-rate reduction in September is 32.5%, while the rest are favoring a cut by 25 bps.
Daily digest market movers: Pound Sterling outperforms its major peers
- The Pound Sterling performs strongly against its major peers on Friday, with investors gaining confidence that the policy-easing cycle by the Bank of England (BoE) will be gradual in the remainder of the year compared with that of its peer central banks.
- According to money market pricing data, the BoE is expected to cut interest rates by 40 bps in the remaining year, while the European Central Bank (ECB) is projected to do the same by 65 bps, Reuters reported. In the same time frame, the Fed is estimated to cut its key borrowing rates by 100 bps, according to the CME FedWatch tool.
- Firm speculation for BoE’s shallow policy-easing cycle is the result of the improved economic outlook in the United Kingdom (UK). In July, the International Monetary Fund (IMF) raised the Gross Domestic Product (GDP) target for this year to 0.7%. Fiscal plans of the new Labour government led by Prime Minister Keir Starmer, which include planning reform and closer trade ties with the European Union, will prompt economic activity, analysts at Goldman Sachs said.
Technical Analysis: Pound Sterling finds cushion near 1.3150
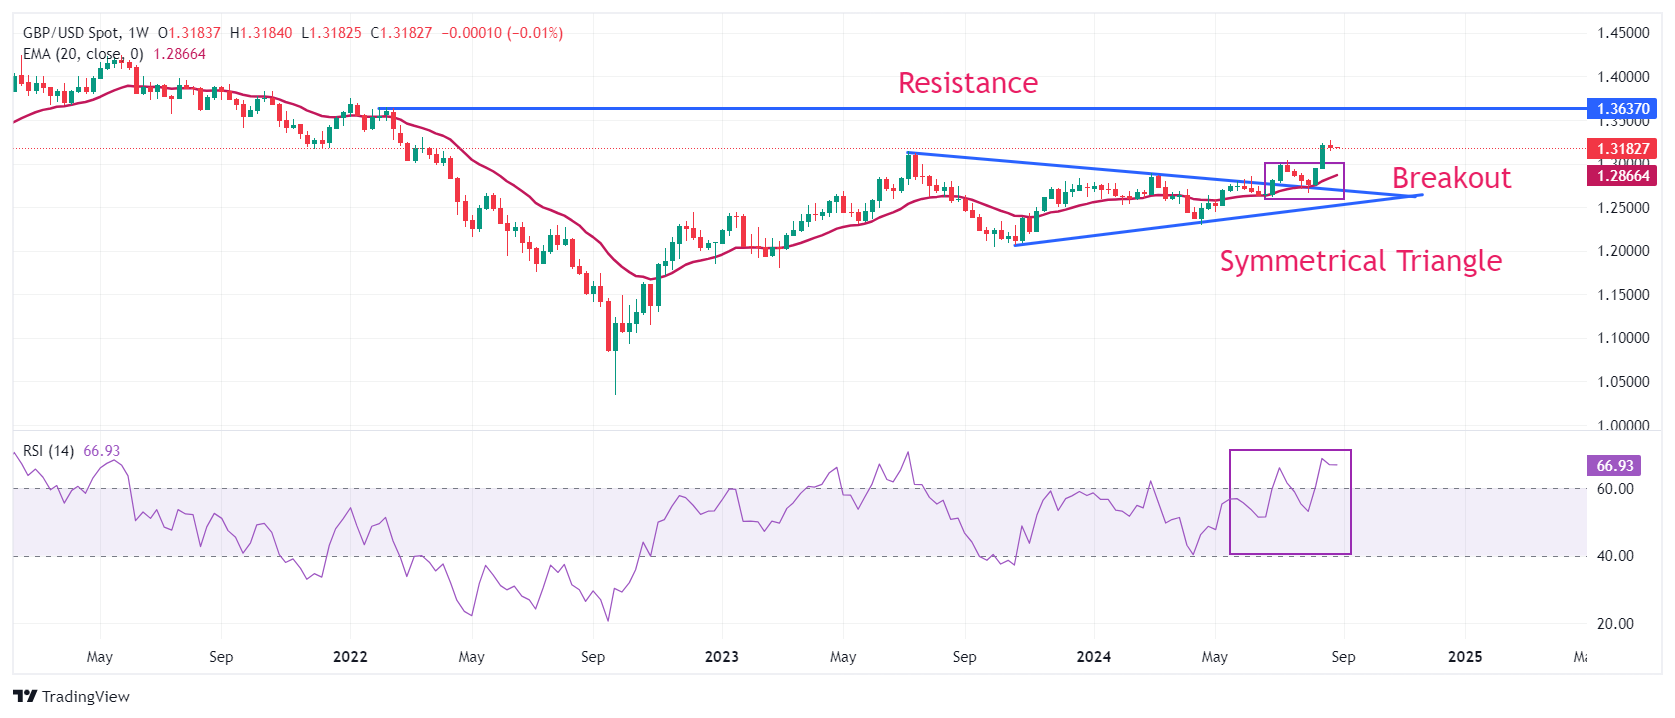
The Pound Sterling rebounds after a mild corrective move to near 1.3150 against the US Dollar. The near-term appeal of the GBP/USD pair remains firm as it holds the breakout of the Rising Channel chart formation on the weekly time frame. If bullish momentum extends, the Cable is expected to rise towards the psychological resistance of 1.3500 and the February 4, 2022, high of 1.3640 after breaking above a fresh two-and-a-half-year high of 1.3266 against the US Dollar.
The upward-sloping 20-week Exponential Moving Average (EMA) near 1.3000 suggests a strong upside trend.
The 14-period Relative Strength Index (RSI) oscillates in the bullish range of 60.00-80.00, suggesting a strong upside momentum. Still, it is close to overbought levels at around 70.00, increasing the chances of a corrective pullback. On the downside, the psychological level of 1.3000 will be the crucial support for the Pound Sterling bulls.
Pound Sterling FAQs
The Pound Sterling (GBP) is the oldest currency in the world (886 AD) and the official currency of the United Kingdom. It is the fourth most traded unit for foreign exchange (FX) in the world, accounting for 12% of all transactions, averaging $630 billion a day, according to 2022 data. Its key trading pairs are GBP/USD, aka ‘Cable’, which accounts for 11% of FX, GBP/JPY, or the ‘Dragon’ as it is known by traders (3%), and EUR/GBP (2%). The Pound Sterling is issued by the Bank of England (BoE).
The single most important factor influencing the value of the Pound Sterling is monetary policy decided by the Bank of England. The BoE bases its decisions on whether it has achieved its primary goal of “price stability” – a steady inflation rate of around 2%. Its primary tool for achieving this is the adjustment of interest rates. When inflation is too high, the BoE will try to rein it in by raising interest rates, making it more expensive for people and businesses to access credit. This is generally positive for GBP, as higher interest rates make the UK a more attractive place for global investors to park their money. When inflation falls too low it is a sign economic growth is slowing. In this scenario, the BoE will consider lowering interest rates to cheapen credit so businesses will borrow more to invest in growth-generating projects.
Data releases gauge the health of the economy and can impact the value of the Pound Sterling. Indicators such as GDP, Manufacturing and Services PMIs, and employment can all influence the direction of the GBP. A strong economy is good for Sterling. Not only does it attract more foreign investment but it may encourage the BoE to put up interest rates, which will directly strengthen GBP. Otherwise, if economic data is weak, the Pound Sterling is likely to fall.
Another significant data release for the Pound Sterling is the Trade Balance. This indicator measures the difference between what a country earns from its exports and what it spends on imports over a given period. If a country produces highly sought-after exports, its currency will benefit purely from the extra demand created from foreign buyers seeking to purchase these goods. Therefore, a positive net Trade Balance strengthens a currency and vice versa for a negative balance.
- USD/CAD inches lower due to rise in crude Oil prices.
- The WTI price gains ground due to supply concerns in the Middle East.
- The US Dollar holds its position ahead of the US PCE Price Index.
USD/CAD snaps its two-day winning streak, trading around 1.3480 during the European session on Friday. The downside of the USD/CAD pair could be attributed to the commodity-linked Canadian Dollar (CAD), which receives support from higher crude Oil prices. Given the fact that Canada is the largest Oil exporter to the United States (US).
The West Texas Intermediate (WTI) Oil price continues to rise, trading around $75.70 per barrel at the time of writing. This increase is driven by supply concerns in the Middle East. Worries about reduced Libyan Oil supplies and Iraq's plans to curb production are contributing to these supply fears, which in turn are bolstering Oil prices.
The downside for the USD/CAD pair may be limited, as the US Dollar continues to hold its recent gains after stronger-than-expected economic data released on Thursday. However, dovish comments from the Federal Reserve could restrain further upward movement for the Greenback.
Federal Reserve Atlanta President Raphael Bostic, a prominent hawk on the FOMC, indicated on Thursday that it might be "time to move" on rate cuts due to further cooling inflation and a higher-than-expected unemployment rate. However, he wants to wait for confirmation from the upcoming monthly jobs report and two inflation reports before the Fed's September meeting.
Investors await July’s US Personal Consumption Expenditure (PCE) Price Index scheduled to be released later in the North American Session, seeking clues about the future direction of US interest rates.
Canadian Dollar FAQs
The key factors driving the Canadian Dollar (CAD) are the level of interest rates set by the Bank of Canada (BoC), the price of Oil, Canada’s largest export, the health of its economy, inflation and the Trade Balance, which is the difference between the value of Canada’s exports versus its imports. Other factors include market sentiment – whether investors are taking on more risky assets (risk-on) or seeking safe-havens (risk-off) – with risk-on being CAD-positive. As its largest trading partner, the health of the US economy is also a key factor influencing the Canadian Dollar.
The Bank of Canada (BoC) has a significant influence on the Canadian Dollar by setting the level of interest rates that banks can lend to one another. This influences the level of interest rates for everyone. The main goal of the BoC is to maintain inflation at 1-3% by adjusting interest rates up or down. Relatively higher interest rates tend to be positive for the CAD. The Bank of Canada can also use quantitative easing and tightening to influence credit conditions, with the former CAD-negative and the latter CAD-positive.
The price of Oil is a key factor impacting the value of the Canadian Dollar. Petroleum is Canada’s biggest export, so Oil price tends to have an immediate impact on the CAD value. Generally, if Oil price rises CAD also goes up, as aggregate demand for the currency increases. The opposite is the case if the price of Oil falls. Higher Oil prices also tend to result in a greater likelihood of a positive Trade Balance, which is also supportive of the CAD.
While inflation had always traditionally been thought of as a negative factor for a currency since it lowers the value of money, the opposite has actually been the case in modern times with the relaxation of cross-border capital controls. Higher inflation tends to lead central banks to put up interest rates which attracts more capital inflows from global investors seeking a lucrative place to keep their money. This increases demand for the local currency, which in Canada’s case is the Canadian Dollar.
Macroeconomic data releases gauge the health of the economy and can have an impact on the Canadian Dollar. Indicators such as GDP, Manufacturing and Services PMIs, employment, and consumer sentiment surveys can all influence the direction of the CAD. A strong economy is good for the Canadian Dollar. Not only does it attract more foreign investment but it may encourage the Bank of Canada to put up interest rates, leading to a stronger currency. If economic data is weak, however, the CAD is likely to fall.
Here is what you need to know on Friday, August 30:
The US Dollar (USD) Index seems to have entered a consolidation phase slightly below 101.50 on Friday, after posting gains for two consecutive days. Eurostat will release the Harmonized Index of Consumer Prices (HICP) for August in the European session. Ahead of the weekend, investors will pay close attention to the July Personal Consumption Expenditures (PCE) Price Index data, the Federal Reserve's preferred gauge of inflation.
US Dollar PRICE This week
The table below shows the percentage change of US Dollar (USD) against listed major currencies this week. US Dollar was the strongest against the Euro.
| USD | EUR | GBP | JPY | CAD | AUD | NZD | CHF | |
|---|---|---|---|---|---|---|---|---|
| USD | 0.99% | 0.28% | 0.45% | -0.24% | -0.17% | -0.56% | -0.01% | |
| EUR | -0.99% | -0.76% | -0.53% | -1.21% | -1.24% | -1.52% | -0.97% | |
| GBP | -0.28% | 0.76% | 0.11% | -0.52% | -0.49% | -0.84% | -0.28% | |
| JPY | -0.45% | 0.53% | -0.11% | -0.66% | -0.53% | -0.78% | -0.37% | |
| CAD | 0.24% | 1.21% | 0.52% | 0.66% | 0.06% | -0.28% | 0.23% | |
| AUD | 0.17% | 1.24% | 0.49% | 0.53% | -0.06% | -0.30% | 0.26% | |
| NZD | 0.56% | 1.52% | 0.84% | 0.78% | 0.28% | 0.30% | 0.55% | |
| CHF | 0.01% | 0.97% | 0.28% | 0.37% | -0.23% | -0.26% | -0.55% |
The heat map shows percentage changes of major currencies against each other. The base currency is picked from the left column, while the quote currency is picked from the top row. For example, if you pick the US Dollar from the left column and move along the horizontal line to the Japanese Yen, the percentage change displayed in the box will represent USD (base)/JPY (quote).
The USD benefited from upbeat macroeconomic data releases on Thursday and gathered strength against its major rivals. The US Bureau of Economic Analysis announced that it revised the annualized Gross Domestic Product (GDP) growth for the second quarter higher to 3% from 2.8% in the previous estimate. Additionally, the US Department of Labor reported that the weekly Initial Jobless Claims edged slightly lower to 231,000 in the week ending August 24 from 233,000. Early Friday, US stock index futures trade marginally higher and the benchmark 10-year US Treasury bond yield fluctuates at around 3.85%.
During the Asian trading hours, the data from Australia showed that Retail Sales remained unchanged on a monthly basis in July. This reading followed the 0.5% increase recorded in June and came in worse than analysts' estimate of 0.3%. AUD/USD showed no reaction to this data and was last seen moving sideways near 0.6800.
EUR/USD closed in negative territory on Thursday, pressured by the renewed USD strength. The pair holds steady slightly below 1.1100 in the early European session.
GBP/USD registered losses for the second straight on Thursday and dropped to a fresh weekly low below 1.3150. The pair struggles to gather recovery momentum on Friday but holds above 1.3150.
The Tokyo Consumer Price Index (CPI) rose 3.6% on a yearly basis in August, up from 2.2% in July, the data from Japan showed early Friday. The Unemployment Rate edged higher to 2.7% and Industrial Production grew by 2.8% on a monthly basis. USD/JPY largely ignored these figures and was last seen trading marginally lower on the day slightly below 145.00.
Following Wednesday's sharp decline, Gold regained its traction on Thursday and rose nearly 0.7%. XAU/USD moves up and down in a narrow range at around $2,520 in the European morning on Friday.
Inflation FAQs
Inflation measures the rise in the price of a representative basket of goods and services. Headline inflation is usually expressed as a percentage change on a month-on-month (MoM) and year-on-year (YoY) basis. Core inflation excludes more volatile elements such as food and fuel which can fluctuate because of geopolitical and seasonal factors. Core inflation is the figure economists focus on and is the level targeted by central banks, which are mandated to keep inflation at a manageable level, usually around 2%.
The Consumer Price Index (CPI) measures the change in prices of a basket of goods and services over a period of time. It is usually expressed as a percentage change on a month-on-month (MoM) and year-on-year (YoY) basis. Core CPI is the figure targeted by central banks as it excludes volatile food and fuel inputs. When Core CPI rises above 2% it usually results in higher interest rates and vice versa when it falls below 2%. Since higher interest rates are positive for a currency, higher inflation usually results in a stronger currency. The opposite is true when inflation falls.
Although it may seem counter-intuitive, high inflation in a country pushes up the value of its currency and vice versa for lower inflation. This is because the central bank will normally raise interest rates to combat the higher inflation, which attract more global capital inflows from investors looking for a lucrative place to park their money.
Formerly, Gold was the asset investors turned to in times of high inflation because it preserved its value, and whilst investors will often still buy Gold for its safe-haven properties in times of extreme market turmoil, this is not the case most of the time. This is because when inflation is high, central banks will put up interest rates to combat it. Higher interest rates are negative for Gold because they increase the opportunity-cost of holding Gold vis-a-vis an interest-bearing asset or placing the money in a cash deposit account. On the flipside, lower inflation tends to be positive for Gold as it brings interest rates down, making the bright metal a more viable investment alternative.
- EUR/USD trades sideways below 1.1100 as investors await key inflation data from the Eurozone as well as the US.
- Soft German inflation boosted hopes of another ECB interest-rate cut in September.
- Upwardly revised US Q2 GDP slightly reduces the chances that the Fed will opt for a bigger rate cut.
EUR/USD trades in a very tight range below 1.1100 in Friday’s European session, with investors focusing on the Eurozone flash Harmonized Index of Consumer Prices (HICP) for August and the United States (US) Personal Consumption Expenditure Price Index (PCE) for July, which will be published at 09:00 GMT and 12:30 GMT, respectively.
The Eurozone HICP report is expected to show that the headline inflation decelerated sharply to 2.2% from 2.6% in July due to lower energy prices. In the same period, the core HICP – which excludes volatile components like food, energy, alcohol, and tobacco – is estimated to have grown by 2.8%, slower than the former release of 2.9%.
The preliminary inflation data is expected to influence market speculation for the European Central Bank's (ECB) September interest rate cuts and, more broadly, the policy-easing path for the remainder of the year.
Financial market participants already seem to be confident that the ECB will cut its key borrowing rates in September again. The ECB pivoted to policy-normalization in June but left interest rates unchanged in August. Market expectations for ECB September rate cuts increased sharply after data released on Thursday showed that price pressures in the Eurozone’s largest nation, Germany, returned to 2% for the first time in more than three years. Also, the economy is exposed to a technical recession as it contracted by 0.1% in the second quarter of this year and its economic outlook is vulnerable. Other Eurozone economies, such as France or Spain, have also seen a significant inflation decline in August.
"Fading inflationary pressure combined with fading growth momentum offers an almost perfect macro backdrop for another rate cut," said Carsten Brzeski, global head of macro at ING, in a note on Thursday.
The ECB is also expected to deliver an additional interest rate cut somewhere in the last quarter of this year.
Daily digest market movers: EUR/USD trades sideways ahead of key inflation data
- EUR/USD trades with caution as the US Dollar (USD) consolidates ahead of the US PCE inflation data for July. The US Dollar Index (DXY), which tracks the Greenback’s value against six major currencies, trades slightly below a fresh weekly high of 101.58.
- Investors await the US inflation data to get fresh cues about the likely monetary policy action by the Federal Reserve (Fed) in the September meeting. The PCE report is expected to show that year-over-year core inflation rose at a slightly faster pace of 2.7% from 2.6% in June, with monthly figures growing steadily by 0.2%.
- Currently, financial markets seem to be confident that the Fed will start reducing interest rates in September. However, traders remain split over the potential size by which the Fed will pivot to policy-normalization.
- According to the CME FedWatch tool, 30-day Federal Funds Futures pricing data shows that the likelihood of a probability of 50-basis points (bps) interest rate reduction in September is 33%, while the rest are favoring a cut by 25 bps.
- The likelihood of a bigger rate cut has fallen slightly after the US Bureau of Economic Analysis (BEA) reported that the pace at which the economy grew in the second quarter was higher than previously estimated. The agency reported that the economy grew at a robust pace of 3% on an annualized basis, against the preliminary estimates of 2.8%.
Technical Analysis: EUR/USD consolidates below 1.1100
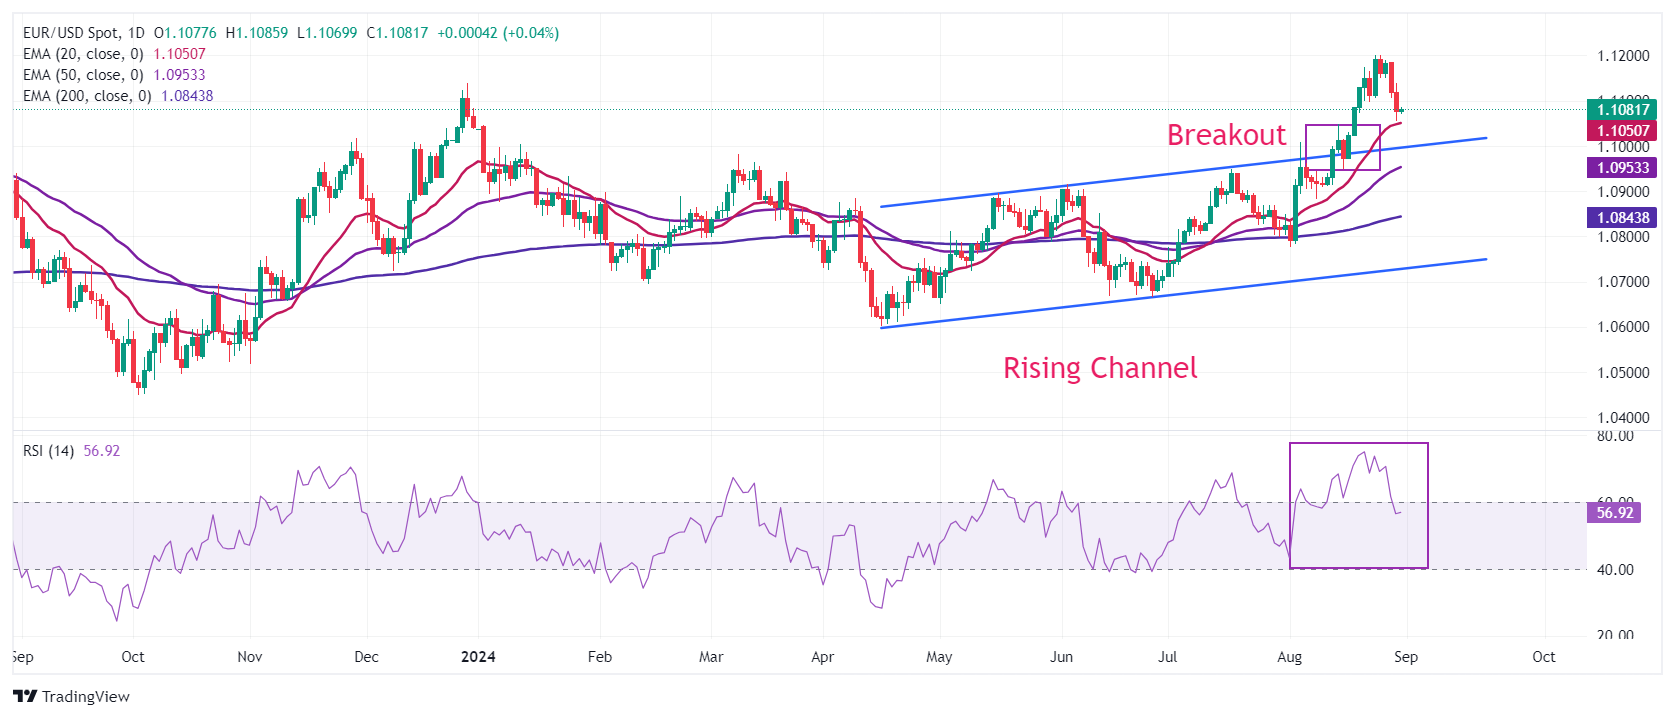
EUR/USD trades inside Thursday’s trading range after steading below the crucial resistance of 1.1100. The near-term outlook of the major currency pair is still firm as all short-to-long-term Exponential Moving Averages (EMAs) are sloping higher. Also, the major currency pair holds the breakout of the Rising Channel formation on a daily timeframe.
The 14-day Relative Strength Index (RSI) has declined below 60.00 after turning overbought near 75.00.
On the upside, a recent high of 1.1200 and the July 2023 high at 1.1275 will be the next stop for the Euro bulls. The downside is expected to remain cushioned near the psychological support of 1.1000.
Euro FAQs
The Euro is the currency for the 20 European Union countries that belong to the Eurozone. It is the second most heavily traded currency in the world behind the US Dollar. In 2022, it accounted for 31% of all foreign exchange transactions, with an average daily turnover of over $2.2 trillion a day. EUR/USD is the most heavily traded currency pair in the world, accounting for an estimated 30% off all transactions, followed by EUR/JPY (4%), EUR/GBP (3%) and EUR/AUD (2%).
The European Central Bank (ECB) in Frankfurt, Germany, is the reserve bank for the Eurozone. The ECB sets interest rates and manages monetary policy. The ECB’s primary mandate is to maintain price stability, which means either controlling inflation or stimulating growth. Its primary tool is the raising or lowering of interest rates. Relatively high interest rates – or the expectation of higher rates – will usually benefit the Euro and vice versa. The ECB Governing Council makes monetary policy decisions at meetings held eight times a year. Decisions are made by heads of the Eurozone national banks and six permanent members, including the President of the ECB, Christine Lagarde.
Eurozone inflation data, measured by the Harmonized Index of Consumer Prices (HICP), is an important econometric for the Euro. If inflation rises more than expected, especially if above the ECB’s 2% target, it obliges the ECB to raise interest rates to bring it back under control. Relatively high interest rates compared to its counterparts will usually benefit the Euro, as it makes the region more attractive as a place for global investors to park their money.
Data releases gauge the health of the economy and can impact on the Euro. Indicators such as GDP, Manufacturing and Services PMIs, employment, and consumer sentiment surveys can all influence the direction of the single currency. A strong economy is good for the Euro. Not only does it attract more foreign investment but it may encourage the ECB to put up interest rates, which will directly strengthen the Euro. Otherwise, if economic data is weak, the Euro is likely to fall. Economic data for the four largest economies in the euro area (Germany, France, Italy and Spain) are especially significant, as they account for 75% of the Eurozone’s economy.
Another significant data release for the Euro is the Trade Balance. This indicator measures the difference between what a country earns from its exports and what it spends on imports over a given period. If a country produces highly sought after exports then its currency will gain in value purely from the extra demand created from foreign buyers seeking to purchase these goods. Therefore, a positive net Trade Balance strengthens a currency and vice versa for a negative balance.
- Gold is edging lower on Friday after the release of positive US data dialed down expectations of interest rates dropping in the US.
- Traders now await the US core Personal Consumption Expenditures inflation data for further intel on US rates.
- Technically, XAU/USD trends sideways, with odds still favoring an eventual break higher given the broader uptrend.
Gold (XAU/USD) edges lower to trade in the $2,510s on Friday as safe-haven demand dries up. Asian stocks are higher after market sentiment turned positive following the release of surprisingly upbeat data from the US, which suggested the economy is unlikely to be heading for a hard landing.
Gold loses upside momentum after US data
Gold treads water under key resistance at $2,531, the August and new all-time high, after data from the US on Thursday showed that annualized Gross Domestic Product (GDP) growth was revised up to 3.0% in Q2 from 2.8% in the preliminary reading. That, and the slight fall in Initial Jobless Claims below estimates, helped dispel concerns the US economy was heading into a recession.
The data suggests the Federal Reserve (Fed) will probably take a more gradual approach to cutting interest rates, although markets are still pricing in around 100 basis points (1.00%) of cuts before year end. The expectation of interest rates falling is positive for Gold because it reduces the opportunity cost of holding the non-interest paying asset, making it more attractive to investors.
China could hold key to Gold price outlook
Gold saw some support after data from the World Gold Council (WGC) released Tuesday showed overall Chinese Gold imports rose by a net 17% in July, the first month of increases since March. North American funds also noted a modest increase in net inflows of 8 metric tons ($403 million) last week, according to the WGC.
Indeed, the long-term outlook for Chinese demand looks positive, according to research by advisory service Capital Economics. A slowdown in the economy will make Gold a more attractive safe-haven asset for investors and the People’s Bank of China (PBoC), already a major buyer, will probably increase its Gold reserves which remain relatively low in comparison to other countries (3% versus 9% for India, for example). Efforts by the BRICS to de-Dollarize, with Gold as the most likely replacement, is a further factor likely to increase long-term demand.
That said, Capital Economics does not see increased demand from China in the short term.
“A combination of cyclical factors point towards gold demand in China weakening in the near term,” Capital Economics warns. “Higher prices are already weighing heavily on jewelry demand, fiscal stimulus should provide a much-needed lift to the economy, and we expect stock market performance to pick up given that local equities seem lowly valued to us.”
Traders are now looking ahead to the release of the Fed’s preferred gauge of inflation, the Personal Consumption Expenditures (PCE) Price Index. Economists expect the core PCE inflation gauge to rise to 2.7% in July from 2.6% in June YoY. Any divergence from this estimate will likely impact Gold price: higher inflation will weaken Gold by suggesting the Fed needs to keep interest rates elevated for longer; the opposite would be the case from a lower-than-expected result.
Another risk to Gold price in the near-term is extreme long positioning in the derivatives market, according to Daniel Ghali, Senior Commodity Strategist at TD Securities, who claims the long trade is now overcrowded.
“Downside risks are now more potent. The ship is crowded. In fact, it has scarcely been as crowded as it is today. Do you have a slot secured on the lifeboat?” adds the strategist.
On Thursday, TD Securities announced they are entering a tactical short position in the commodity, with an entry at $2,533, a target at $2,300, and a stop loss at $2,675.
Technical Analysis: Mini-range extends but overall trend remains bullish
Gold (XAU/USD) continues trading within a mini-range above its prior range. The short-term trend could now probably be characterized as “sideways” and therefore more likely than not to continue oscillating until a breakout occurs to break the pattern.
Gold’s medium and long-term trends remain bullish, which given “the trend is your friend,” means the odds favor an eventual breakout higher materializing.
XAU/USD 4-hour Chart
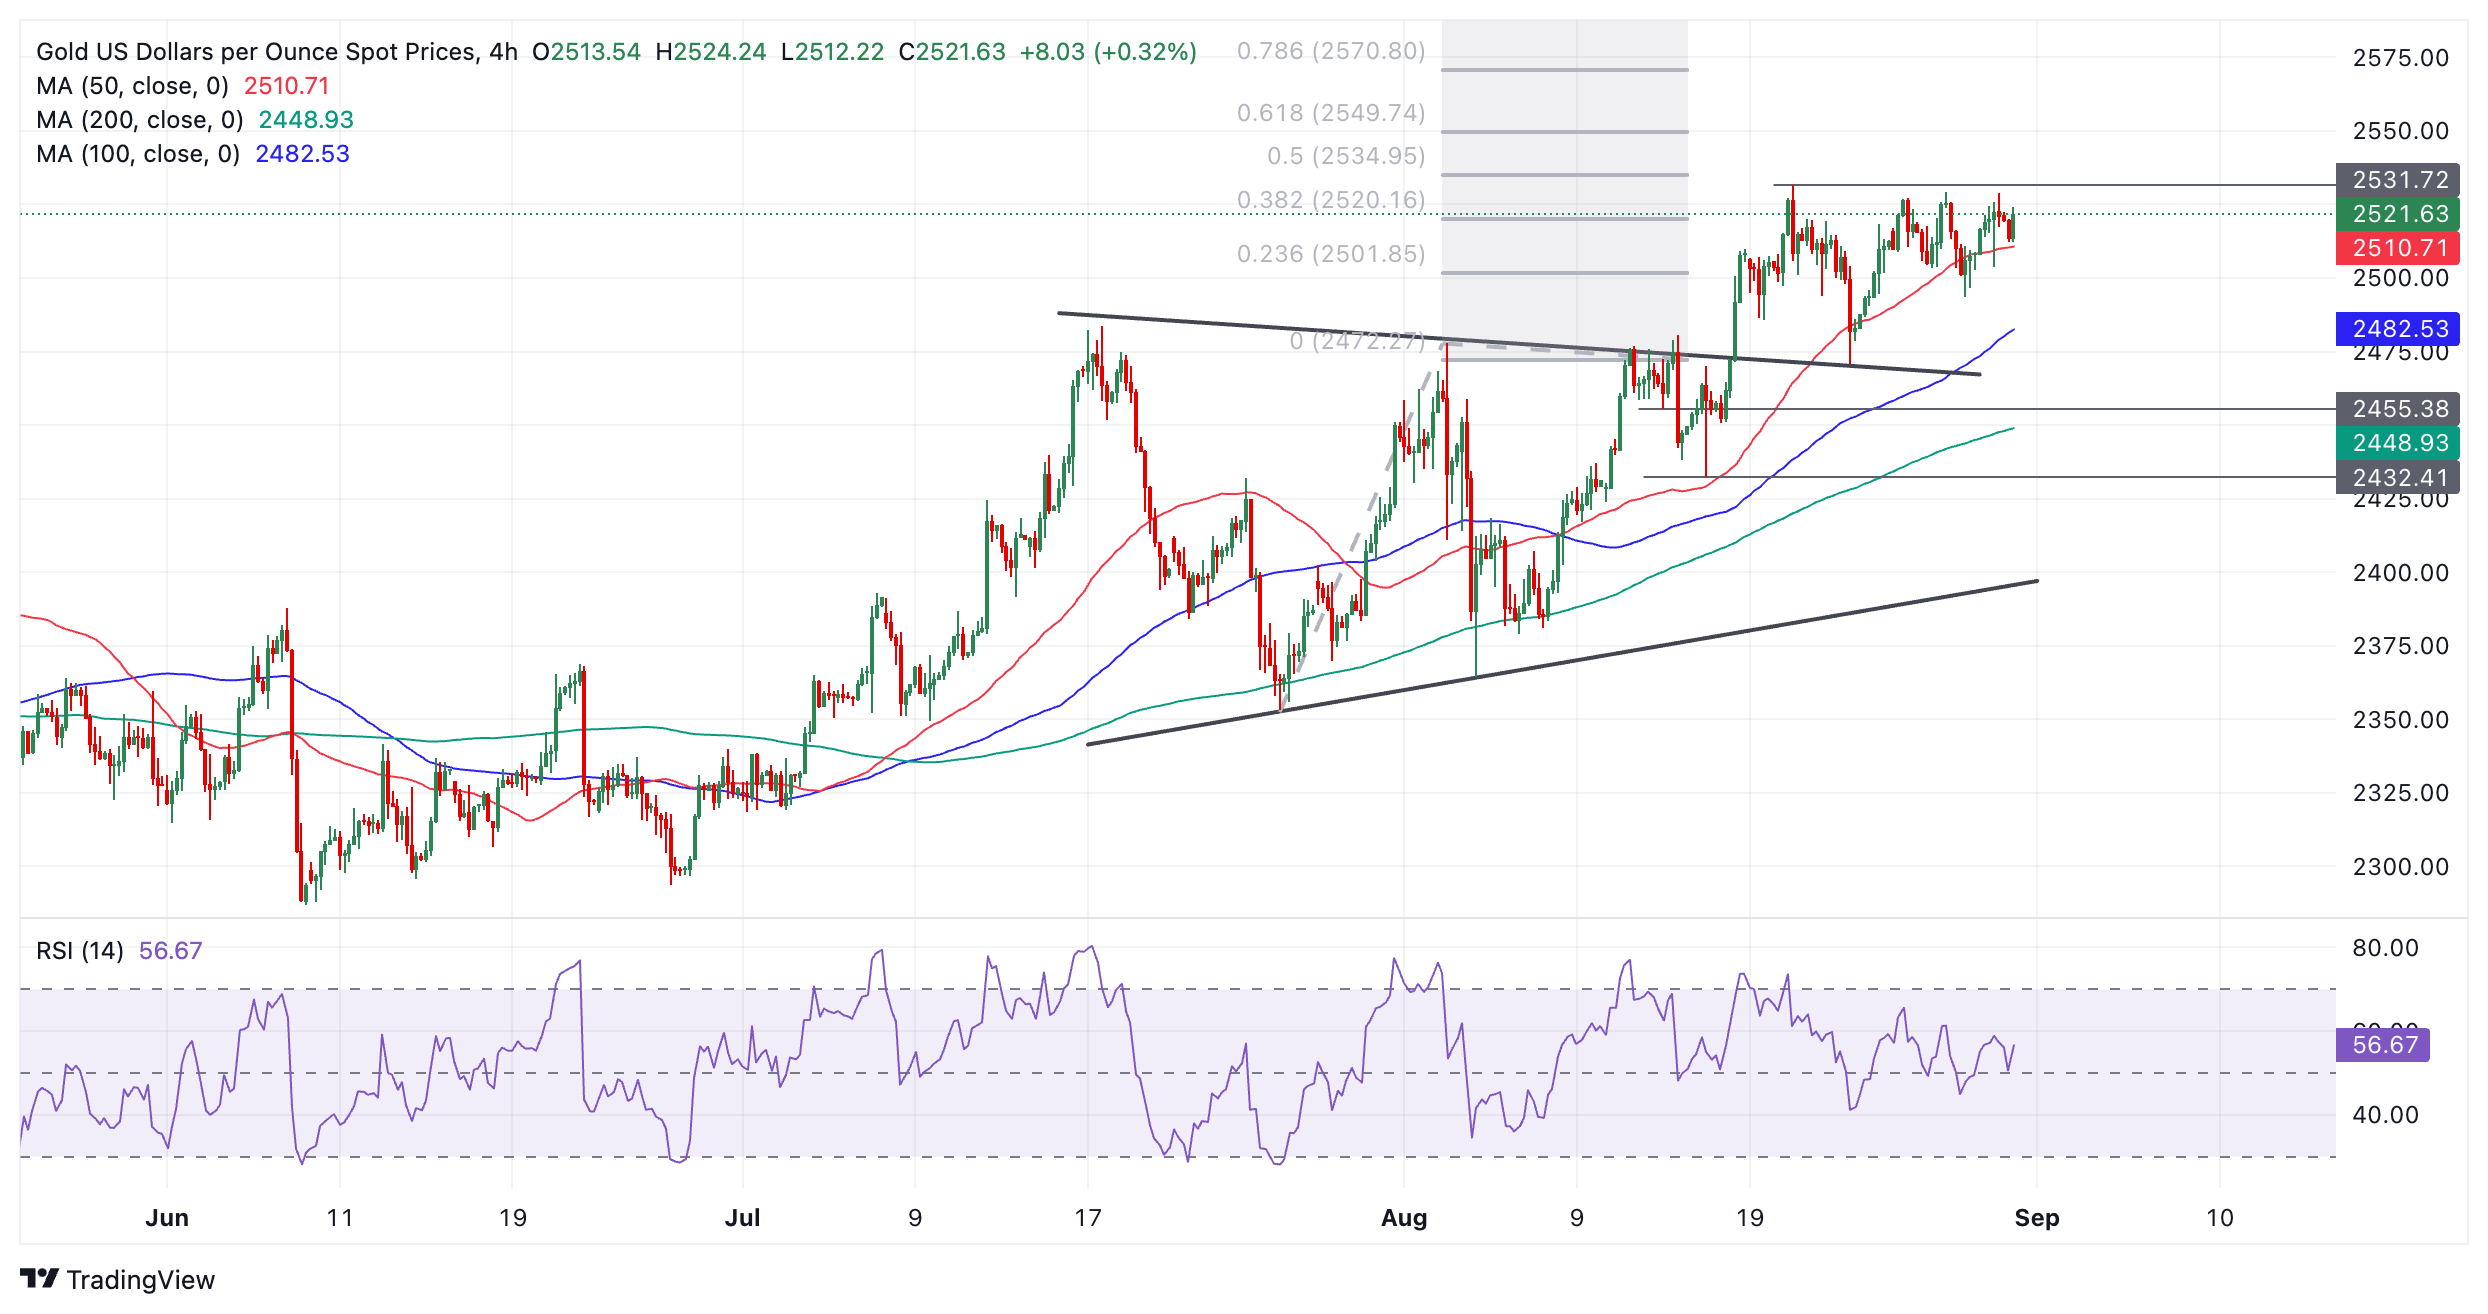
The breakout from the prior range (which also resembles an incomplete triangle pattern) that occurred on August 14 generated an upside target at roughly $2,550, calculated by taking the 0.618 Fibonacci ratio of the range’s height and extrapolating it higher. This target is the minimum expectation for the follow-through from a breakout based on principles of technical analysis.
A break above the $2,531 August 20 all-time high would provide confirmation of a continuation higher towards the $2,550 target.
Alternatively, a break back inside the range would negate the upside projected target. Such a move would be confirmed on a daily close below $2,470 (August 22 low). It would change the picture for Gold and suggest the commodity might be starting a short-term downtrend.
Economic Indicator
Gross Domestic Product Annualized
The real Gross Domestic Product (GDP) Annualized, released quarterly by the US Bureau of Economic Analysis, measures the value of the final goods and services produced in the United States in a given period of time. Changes in GDP are the most popular indicator of the nation’s overall economic health. The data is expressed at an annualized rate, which means that the rate has been adjusted to reflect the amount GDP would have changed over a year’s time, had it continued to grow at that specific rate. Generally speaking, a high reading is seen as bullish for the US Dollar (USD), while a low reading is seen as bearish.
Read more.Last release: Thu Aug 29, 2024 12:30 (Prel)
Frequency: Quarterly
Actual: 3%
Consensus: 2.8%
Previous: 2.8%
Source: US Bureau of Economic Analysis
The US Bureau of Economic Analysis (BEA) releases the Gross Domestic Product (GDP) growth on an annualized basis for each quarter. After publishing the first estimate, the BEA revises the data two more times, with the third release representing the final reading. Usually, the first estimate is the main market mover and a positive surprise is seen as a USD-positive development while a disappointing print is likely to weigh on the greenback. Market participants usually dismiss the second and third releases as they are generally not significant enough to meaningfully alter the growth picture.
- USD/CHF gains momentum near 0.8480 in Friday’s early European session.
- US GDP expanded more than expected in Q2; Initial Jobless Claims fell last week.
- The Swiss KOF Leading Indicator improved to 101.6 in August from 101.0 in July, better than expected.
The USD/CHF pair extends its recovery around 0.8480 on Friday during the early European trading hours. The uptick of the pair is supported by the stronger US Dollar (USD) after the stronger-than-expected US growth number. Traders will shift their attention to the US Personal Consumption Expenditure (PCE) inflation data on Friday, which might offer some hint about the US interest rate outlook.
The US Gross Domestic Product (GDP) expanded faster than expected in the second quarter, reducing bets for a larger 50 basis points (bps) rate cut by the Federal Reserve (Fed) in September and lifting the Greenback. In the second estimate of GDP released by the Bureau of Economic Analysis (BEA) on Thursday, US GDP grew at a 3.0% annualized rate in Q2 from 2.8% in the initial estimate. Elsewhere, US Initial jobless claims fell to 231,000 for the week ended August 24, below the 232,000 estimated.
The headline Personal Consumption Expenditures (PCE) Price Index is projected to show an increase of 2.6% YoY in July. The Fed's preferred inflation gauge, as measured by the core PCE, is estimated to rise to 2.7% YoY in July from 2.6% in June. The hotter-than-expected reading could dampen the expectation of a larger Fed rate cut and underpin the USD.
On the Swiss front, data released by the KOF Swiss Economic Institute revealed that the country’s KOF Leading Indicator came in at 101.6 in August versus 101.0 in July, better than the estimation of 100.6.
Meanwhile, the ongoing geopolitical tensions in the Middle East and Russia-Ukraine might boost the safe-haven currency like the Swiss Franc (CHF). The Sky News reported late Thursday that Russia carried out several air attacks on Ukraine this week, costing Moscow an estimated USD1.3 billion. Meanwhile, Ukraine has warned it is closely monitoring its border with Belarus after a recent buildup of troops there.
Swiss economy FAQs
Switzerland is the ninth-largest economy measured by nominal Gross Domestic Product (GDP) in the European continent. Measured by GDP per capita – a broad measure of average living standards –, the country ranks among the highest in the world, meaning that it is one the richest countries globally. Switzerland tends to be in the top spots in global rankings about living standards, development indexes, competitiveness or innovation.
Switzerland is an open, free-market economy mainly based on the services sector. The Swiss economy has a strong export sector, and the neighboring European Union (EU) is its main trading partner. Switzerland is a leading exporter of watches and clocks, and hosts leading firms in the food, chemicals and pharmaceutical industries. The country is considered to be an international tax haven, with significantly low corporate and income tax rates compared with its European neighbors.
As a high-income country, the growth rate of the Swiss economy has diminished over the last decades. Still, its political and economic stability, its high education levels, top-tier firms in several industries and its tax-haven status have made it a preferred destination for foreign investment. This has generally benefited the Swiss Franc (CHF), which has historically kept relatively strong against its main currency peers. Generally, a good performance of the Swiss economy – based on high growth, low unemployment and stable prices – tends to appreciate CHF. Conversely, if economic data points to weakening momentum, CHF is likely to depreciate.
Switzerland isn’t a commodity exporter, so in general commodity prices aren’t a key driver of the Swiss Franc (CHF). However, there is a slight correlation with both Gold and Oil prices. With Gold, CHF’s status as a safe-haven and the fact that the currency used to be backed by the precious metal means that both assets tend to move in the same direction. With Oil, a paper released by the Swiss National Bank (SNB) suggests that the rise in Oil prices could negatively influence CHF valuation, as Switzerland is a net importer of fuel.
- EUR/GBP extends its losing streak due to hawkish sentiment surrounding the BoE maintaining higher rates for a longer.
- BoE Governor Bailey also advised against hastening additional rate cuts at the Jackson Hole Symposium last week.
- The cooled-off inflation in Germany and Spain has fueled expectations of a rate cut by the European Central Bank.
EUR/GBP continues its losing streak for the eighth consecutive session, trading around 0.8410 during the early European hours on Friday. The EUR/GBP cross may extend its decline as the Pound Sterling (GBP) receives support from hawkish sentiment surrounding the Bank of England (BoE) maintaining higher interest rates for a longer period compared to the European Central Bank (ECB).
At the Jackson Hole Symposium last week, BoE Governor Andrew Bailey stated that the second-round effects of inflationary pressures would be less significant than anticipated. However, Bailey also advised against hastening additional interest rate cuts, according to Reuters. The BoE reduced rates by 25 basis points to 5% on August 1, and money markets are pricing in an additional 40 basis points of cuts by the end of the year.
In August, UK Nationwide Housing Prices experienced a 2.4% year-on-year increase, up from 2.1% in July. This marked the sixth consecutive period of rising house prices and the strongest growth since December 2022. However, on a monthly basis, house prices declined by 0.2%, following a 0.3% increase in July, defying market expectations of a 0.3% rise.
In the Eurozone, Consumer Price Index (CPI) data from Germany and Spain indicated that inflation cooled further in August. This development has fueled expectations of an interest rate cut by the European Central Bank (ECB), weakening the Euro and undermining the EUR/GBP cross.
Carsten Brzeski, ING’s global head of macroeconomics, described the outcome as "great news for the ECB," noting that a slowing economy and cooling inflation create a "perfect macro backdrop" for lower interest rates. However, Brzeski cautioned that service inflation remains a concern.
Traders are now eagerly awaiting the flash estimate of the Eurozone Harmonized Index of Consumer Prices (HICP) for August and the Unemployment Rate for July later in the day, looking for additional insights into the Eurozone's economic condition.
Interest rates FAQs
Interest rates are charged by financial institutions on loans to borrowers and are paid as interest to savers and depositors. They are influenced by base lending rates, which are set by central banks in response to changes in the economy. Central banks normally have a mandate to ensure price stability, which in most cases means targeting a core inflation rate of around 2%. If inflation falls below target the central bank may cut base lending rates, with a view to stimulating lending and boosting the economy. If inflation rises substantially above 2% it normally results in the central bank raising base lending rates in an attempt to lower inflation.
Higher interest rates generally help strengthen a country’s currency as they make it a more attractive place for global investors to park their money.
Higher interest rates overall weigh on the price of Gold because they increase the opportunity cost of holding Gold instead of investing in an interest-bearing asset or placing cash in the bank. If interest rates are high that usually pushes up the price of the US Dollar (USD), and since Gold is priced in Dollars, this has the effect of lowering the price of Gold.
The Fed funds rate is the overnight rate at which US banks lend to each other. It is the oft-quoted headline rate set by the Federal Reserve at its FOMC meetings. It is set as a range, for example 4.75%-5.00%, though the upper limit (in that case 5.00%) is the quoted figure. Market expectations for future Fed funds rate are tracked by the CME FedWatch tool, which shapes how many financial markets behave in anticipation of future Federal Reserve monetary policy decisions.
European Central Bank (ECB) policymaker Isabel Schnabel said on Friday that “the pace of policy easing cannot be mechanical. It needs to rest on data and analysis.”
Additional quotes
Incoming data have broadly confirmed the baseline outlook.
Confidence is not knowledge.
History will not judge our intentions but our success in delivering on our mandate.
The closer policy rates get to the upper band of estimates of the neutral rate of interest the more cautious we should be to avoid that policy itself becomes a factor slowing.
Wage pass-through may be stronger than expected.
It is conceivable, however, that the conditions on which the modal outlook rests do not materialize.
In the alternative scenario, growth in unit labor costs would not come down as quickly as projected.
Headline inflation understates scale of challenge.
Domestic inflation remains high.
Soft landing looks more likely than recession.
Market reaction
EUR/USD is posting small gains near 1.1085, up 0.05% on the day, little changed by these comments.
ECB FAQs
The European Central Bank (ECB) in Frankfurt, Germany, is the reserve bank for the Eurozone. The ECB sets interest rates and manages monetary policy for the region. The ECB primary mandate is to maintain price stability, which means keeping inflation at around 2%. Its primary tool for achieving this is by raising or lowering interest rates. Relatively high interest rates will usually result in a stronger Euro and vice versa. The ECB Governing Council makes monetary policy decisions at meetings held eight times a year. Decisions are made by heads of the Eurozone national banks and six permanent members, including the President of the ECB, Christine Lagarde.
In extreme situations, the European Central Bank can enact a policy tool called Quantitative Easing. QE is the process by which the ECB prints Euros and uses them to buy assets – usually government or corporate bonds – from banks and other financial institutions. QE usually results in a weaker Euro. QE is a last resort when simply lowering interest rates is unlikely to achieve the objective of price stability. The ECB used it during the Great Financial Crisis in 2009-11, in 2015 when inflation remained stubbornly low, as well as during the covid pandemic.
Quantitative tightening (QT) is the reverse of QE. It is undertaken after QE when an economic recovery is underway and inflation starts rising. Whilst in QE the European Central Bank (ECB) purchases government and corporate bonds from financial institutions to provide them with liquidity, in QT the ECB stops buying more bonds, and stops reinvesting the principal maturing on the bonds it already holds. It is usually positive (or bullish) for the Euro.
- Silver price gains ground as rising odds of a Fed rate cut reduce the opportunity cost of holding bullion assets.
- Atlanta Fed President Raphael Bostic suggested that it might be "time to move" on implementing rate cuts.
- Israel's military and the Palestinian militant group Hamas have agreed to three-day pauses in fighting.
Silver price (XAG/USD) extends its gains for the second successive day, trading around $29.50 per troy ounce during the Asian hours on Friday. Non-yielding Silver is benefiting from a lower opportunity cost as expectations grow for a US Federal Reserve interest rate cut in September.
Investors await July’s US Personal Consumption Expenditure (PCE) Price Index scheduled to be released later in the North American Session, seeking clues about the future direction of US interest rates.
Federal Reserve Atlanta President Raphael Bostic, a prominent hawk on the FOMC, indicated on Thursday that it might be "time to move" on rate cuts due to further cooling inflation and a higher-than-expected unemployment rate. However, he wants to wait for confirmation from the upcoming monthly jobs report and two inflation reports before the Fed's September meeting.
On the geopolitical front, safe-haven bullion may encounter a challenge as Israel's military and the Palestinian militant group Hamas have agreed to three-day pauses in fighting in Gaza. These pauses are intended to allow the first round of vaccinations for 640,000 children against polio, according to a senior WHO official, as reported by Reuters on Thursday.
In other news reported by Reuters, Israeli troops killed a local commander of the Iranian-backed Islamic Jihad movement and four other militants in the West Bank on Thursday. The incident occurred during one of the largest assaults in the Israeli-occupied territory in months, marking a significant escalation in the ongoing conflict.
Silver FAQs
Silver is a precious metal highly traded among investors. It has been historically used as a store of value and a medium of exchange. Although less popular than Gold, traders may turn to Silver to diversify their investment portfolio, for its intrinsic value or as a potential hedge during high-inflation periods. Investors can buy physical Silver, in coins or in bars, or trade it through vehicles such as Exchange Traded Funds, which track its price on international markets.
Silver prices can move due to a wide range of factors. Geopolitical instability or fears of a deep recession can make Silver price escalate due to its safe-haven status, although to a lesser extent than Gold's. As a yieldless asset, Silver tends to rise with lower interest rates. Its moves also depend on how the US Dollar (USD) behaves as the asset is priced in dollars (XAG/USD). A strong Dollar tends to keep the price of Silver at bay, whereas a weaker Dollar is likely to propel prices up. Other factors such as investment demand, mining supply – Silver is much more abundant than Gold – and recycling rates can also affect prices.
Silver is widely used in industry, particularly in sectors such as electronics or solar energy, as it has one of the highest electric conductivity of all metals – more than Copper and Gold. A surge in demand can increase prices, while a decline tends to lower them. Dynamics in the US, Chinese and Indian economies can also contribute to price swings: for the US and particularly China, their big industrial sectors use Silver in various processes; in India, consumers’ demand for the precious metal for jewellery also plays a key role in setting prices.
Silver prices tend to follow Gold's moves. When Gold prices rise, Silver typically follows suit, as their status as safe-haven assets is similar. The Gold/Silver ratio, which shows the number of ounces of Silver needed to equal the value of one ounce of Gold, may help to determine the relative valuation between both metals. Some investors may consider a high ratio as an indicator that Silver is undervalued, or Gold is overvalued. On the contrary, a low ratio might suggest that Gold is undervalued relative to Silver.
- The core Personal Consumption Expenditures Price Index is seen rising 0.2% MoM and 2.7% YoY in July.
- Markets fully price in an interest-rate cut by the US Federal Reserve in September.
- A hotter-than-expected PCE inflation data could rescue the US Dollar ahead of next week’s Nonfarm Payrolls.
The United States (US) Bureau of Economic Analysis (BEA) will release the high-impact core Personal Consumption Expenditures (PCE) Price Index, the Federal Reserve’s (Fed) preferred inflation gauge, on Friday at 12:30 GMT.
The PCE inflation data could shape the next direction for the US Dollar (USD) heading into the Nonfarm Payrolls week.
PCE Index: What to expect from the Federal Reserve’s preferred inflation measure?
The core PCE Price Index is set to rise 0.2% over the month in July, at the same pace as seen in June. On year, core PCE is projected to grow by 2.7%, while the headline annual PCE inflation is seen ticking higher to 2.6% in the same period.
The core PCE Price Index, which excludes volatile food and energy prices, has a significant impact on the market’s pricing of the Fed’s interest rates outlook. The gauge is closely monitored by the central bank and market participants, as it’s not distorted by base effects and provides a clear view of underlying inflation by excluding volatile items.
Data published by the BLS earlier this month showed that the US Consumer Price Index (CPI) rose 2.9% on a yearly basis in July while the core CPI increased 3.2% in the same period, a tad slower than June’s rise of 3.3%.
Previewing the PCE inflation report, “Core PCE inflation likely stayed under control, with prices advancing at a soft 0.13% MoM pace in July. Given shelter price strength acted as a driver of core CPI inflation, the core PCE will not increase as much,” TD Securities analysts said.
“Headline PCE inflation likely printed 0.12% MoM. We also expect personal spending to provide a solid Q3 start, rising firmly at 0.5% MoM and 0.4% MoM in real terms,” they added.
How will the Personal Consumption Expenditures Price Index affect EUR/USD?
The US Dollar is languishing near yearly lows against its major rivals in the lead-up to the release of the Fed’s favorite preferred inflation measure. The Dollar downtrend has propelled the EUR/USD pair to the highest level in thirteen months near 1.1200.
Markets have fully priced in a rate cut by the Fed in September, with the odds leaning in favor of a 25 basis points (bps) rate reduction over a 50 bps move.
In case the monthly or the headline core PCE reading comes in hotter-than-expected in July, the US Dollar is likely to receive a much-needed boost, as the data would pour cold water on recent expectations of aggressive Fed rate cuts this year. In response, the EUR/USD pair could stage a correction from over one-year highs. On the other hand, a slower-than-expected increase in the core figures could trigger a fresh USD sell-off, triggering a fresh leg higher in EUR/USD.
The initial reaction to the PCE report, however, could be limited, as traders might resort to position readjustments on the final trading day of the week while gearing up for the next week’s critical US employment data.
FXStreet’s Analyst Dhwani Mehta offers a brief technical outlook for EUR/USD and explains:
“The EUR/USD uptrend remains intact so long as the 1.1107 support holds on a daily closing basis. That level is the 23.6% Fibonacci Retracement (Fibo) level of the August rally from 1.0775 to 1.1202, 13-month highs. The 14-day Relative Strength Index (RSI) stays firm well above 50, justifying the major’s bullish potential.”
“Acceptance above the 13-month high of 1.1202 is needed on a daily closing basis to challenge the 1.1250 psychological level. Alternatively, a sustained break below the abovementioned 23.6% Fibo support at 1.1107 could open up the downside toward the 38.2% Fibo level of the same advance, aligned at 1.1045.”
Economic Indicator
Personal Consumption Expenditures - Price Index (MoM)
The Personal Consumption Expenditures (PCE), released by the US Bureau of Economic Analysis on a monthly basis, measures the changes in the prices of goods and services purchased by consumers in the United States (US).. The MoM figure compares prices in the reference month to the previous month. Price changes may cause consumers to switch from buying one good to another and the PCE Deflator can account for such substitutions. This makes it the preferred measure of inflation for the Federal Reserve. Generally speaking, a high reading is bullish for the US Dollar (USD), while a low reading is bearish.
Read more.Next release: Fri Aug 30, 2024 12:30
Frequency: Monthly
Consensus: 0.2%
Previous: 0.1%
Source: US Bureau of Economic Analysis
Inflation FAQs
Inflation measures the rise in the price of a representative basket of goods and services. Headline inflation is usually expressed as a percentage change on a month-on-month (MoM) and year-on-year (YoY) basis. Core inflation excludes more volatile elements such as food and fuel which can fluctuate because of geopolitical and seasonal factors. Core inflation is the figure economists focus on and is the level targeted by central banks, which are mandated to keep inflation at a manageable level, usually around 2%.
The Consumer Price Index (CPI) measures the change in prices of a basket of goods and services over a period of time. It is usually expressed as a percentage change on a month-on-month (MoM) and year-on-year (YoY) basis. Core CPI is the figure targeted by central banks as it excludes volatile food and fuel inputs. When Core CPI rises above 2% it usually results in higher interest rates and vice versa when it falls below 2%. Since higher interest rates are positive for a currency, higher inflation usually results in a stronger currency. The opposite is true when inflation falls.
Although it may seem counter-intuitive, high inflation in a country pushes up the value of its currency and vice versa for lower inflation. This is because the central bank will normally raise interest rates to combat the higher inflation, which attract more global capital inflows from investors looking for a lucrative place to park their money.
Formerly, Gold was the asset investors turned to in times of high inflation because it preserved its value, and whilst investors will often still buy Gold for its safe-haven properties in times of extreme market turmoil, this is not the case most of the time. This is because when inflation is high, central banks will put up interest rates to combat it. Higher interest rates are negative for Gold because they increase the opportunity-cost of holding Gold vis-a-vis an interest-bearing asset or placing the money in a cash deposit account. On the flipside, lower inflation tends to be positive for Gold as it brings interest rates down, making the bright metal a more viable investment alternative.
- NZD/USD trades in positive territory around 0.6260 in Friday’s early European session.
- The upbeat US GDP growth report supports the USD, but higher Fed rate cut bets might cap its upside.
- The optimism in New Zealand’s business confidence boosts the Kiwi.
The NZD/USD pair extends the rally near 0.6260 during the early European session on Friday. The pair is set to close weekly gains for the fifth consecutive week, bolstered by firmer speculation that the Federal Reserve (Fed) will start easing its monetary policy in September. The release of the US Personal Consumption Expenditure (PCE) inflation data will be in the spotlight on Friday.
The US economy grew at an annualized rate of 3.0% for the second quarter (Q2) from 2.8% in the initial estimate, the Bureau of Economic Analysis (BEA) showed Thursday. This figure came in stronger than the expectation of 2.8%. Meanwhile, the number of Americans filing new applications for jobless benefits for the week ending August 24 dropped to 231,000 from 233,000 in the previous week, below the consensus of 232,000.
The encouraging US economic data on Thursday provides some support for the Greenback. However, the upside seems limited as traders anticipate the US Fed to lower its borrowing costs next month. The rate futures markets have priced in around 66% odds of a 25 basis points (bps) rate cut in September, but the chance of a deeper rate cut stands at 34%, down from 36.5% before the US GDP data, according to the CME FedWatch Tool.
Investors will take more cues from the key US inflation data, which is due later on Friday. Any signs of elevated inflation in the US economy could dampen the hope for a Fed rate cut in September. This, in turn, might support the USD and cap the upside for NZD/USD. On Thursday, Atlanta Fed President Raphael Bostic said that there is still a distance to go on inflation. Bostic added that the central bank should wait for more employment and inflation report data before cutting rates.
On the Kiwi front, the recent New Zealand’s ANZ Business Outlook survey, which climbed to its highest level in a decade, boosts the New Zealand Dollar (NZD). The headline business confidence measure in the survey jumped to 51.0 in August, while the expected own activity measure surged to a seven-year high of 37.0.
New Zealand Dollar FAQs
The New Zealand Dollar (NZD), also known as the Kiwi, is a well-known traded currency among investors. Its value is broadly determined by the health of the New Zealand economy and the country’s central bank policy. Still, there are some unique particularities that also can make NZD move. The performance of the Chinese economy tends to move the Kiwi because China is New Zealand’s biggest trading partner. Bad news for the Chinese economy likely means less New Zealand exports to the country, hitting the economy and thus its currency. Another factor moving NZD is dairy prices as the dairy industry is New Zealand’s main export. High dairy prices boost export income, contributing positively to the economy and thus to the NZD.
The Reserve Bank of New Zealand (RBNZ) aims to achieve and maintain an inflation rate between 1% and 3% over the medium term, with a focus to keep it near the 2% mid-point. To this end, the bank sets an appropriate level of interest rates. When inflation is too high, the RBNZ will increase interest rates to cool the economy, but the move will also make bond yields higher, increasing investors’ appeal to invest in the country and thus boosting NZD. On the contrary, lower interest rates tend to weaken NZD. The so-called rate differential, or how rates in New Zealand are or are expected to be compared to the ones set by the US Federal Reserve, can also play a key role in moving the NZD/USD pair.
Macroeconomic data releases in New Zealand are key to assess the state of the economy and can impact the New Zealand Dollar’s (NZD) valuation. A strong economy, based on high economic growth, low unemployment and high confidence is good for NZD. High economic growth attracts foreign investment and may encourage the Reserve Bank of New Zealand to increase interest rates, if this economic strength comes together with elevated inflation. Conversely, if economic data is weak, NZD is likely to depreciate.
The New Zealand Dollar (NZD) tends to strengthen during risk-on periods, or when investors perceive that broader market risks are low and are optimistic about growth. This tends to lead to a more favorable outlook for commodities and so-called ‘commodity currencies’ such as the Kiwi. Conversely, NZD tends to weaken at times of market turbulence or economic uncertainty as investors tend to sell higher-risk assets and flee to the more-stable safe havens.
- WTI price tends to advance due to rising supply concerns in the Middle East.
- Libya's Oil exports were halted at several ports due to a standoff between rival political factions.
- Iraq plans to reduce its Oil output to between 3.85 million and 3.9 million barrels per day beginning next month.
The West Texas Intermediate (WTI) Oil price continues to rise, trading around $75.50 per barrel during Friday's Asian session. This increase is driven by supply concerns in the Middle East. Worries about reduced Libyan Oil supplies and Iraq's plans to curb production are contributing to these supply fears, which in turn are bolstering Oil prices.
On Thursday, over half of Libya's Oil production, roughly 700,000 barrels per day (bpd), was offline, and exports were suspended at several ports due to a standoff between rival political factions. According to Rapidan Energy Group, as reported by Reuters, Libya's production losses could escalate to between 900,000 and 1 million bpd and potentially persist for several weeks.
In addition, Iraqi Oil supplies are anticipated to decline as the country has exceeded its quota set by the Organization of the Petroleum Exporting Countries (OPEC) and its allies. According to a source with direct knowledge, Iraq plans to cut its Oil output to between 3.85 million and 3.9 million barrels per day (bpd) starting next month, as reported by Reuters on Thursday.
Nevertheless, the rise in WTI prices might be limited by weakened global demand for crude Oil. Persistent concerns about China's economy, the world's largest Oil importer, continue to dampen Oil demand. On the other hand, the US economy has shown modest growth, which has positively impacted investor confidence. In the second quarter, the US Gross Domestic Product (GDP) grew at an annualized rate of 3.0%, surpassing both the forecasted and previous growth rate of 2.8%.
WTI prices may find support from the growing likelihood of an interest rate cut by the Federal Reserve starting in September. On Thursday, Federal Reserve Atlanta President Raphael Bostic, known for his hawkish stance on the Federal Open Market Committee (FOMC), suggested it might be "time to move" on rate cuts. This indication comes in response to further cooling inflation and a higher-than-expected unemployment rate.
WTI Oil FAQs
WTI Oil is a type of Crude Oil sold on international markets. The WTI stands for West Texas Intermediate, one of three major types including Brent and Dubai Crude. WTI is also referred to as “light” and “sweet” because of its relatively low gravity and sulfur content respectively. It is considered a high quality Oil that is easily refined. It is sourced in the United States and distributed via the Cushing hub, which is considered “The Pipeline Crossroads of the World”. It is a benchmark for the Oil market and WTI price is frequently quoted in the media.
Like all assets, supply and demand are the key drivers of WTI Oil price. As such, global growth can be a driver of increased demand and vice versa for weak global growth. Political instability, wars, and sanctions can disrupt supply and impact prices. The decisions of OPEC, a group of major Oil-producing countries, is another key driver of price. The value of the US Dollar influences the price of WTI Crude Oil, since Oil is predominantly traded in US Dollars, thus a weaker US Dollar can make Oil more affordable and vice versa.
The weekly Oil inventory reports published by the American Petroleum Institute (API) and the Energy Information Agency (EIA) impact the price of WTI Oil. Changes in inventories reflect fluctuating supply and demand. If the data shows a drop in inventories it can indicate increased demand, pushing up Oil price. Higher inventories can reflect increased supply, pushing down prices. API’s report is published every Tuesday and EIA’s the day after. Their results are usually similar, falling within 1% of each other 75% of the time. The EIA data is considered more reliable, since it is a government agency.
OPEC (Organization of the Petroleum Exporting Countries) is a group of 13 Oil-producing nations who collectively decide production quotas for member countries at twice-yearly meetings. Their decisions often impact WTI Oil prices. When OPEC decides to lower quotas, it can tighten supply, pushing up Oil prices. When OPEC increases production, it has the opposite effect. OPEC+ refers to an expanded group that includes ten extra non-OPEC members, the most notable of which is Russia.
Gold prices fell in India on Friday, according to data compiled by FXStreet.
The price for Gold stood at 6,777.57 Indian Rupees (INR) per gram, down compared with the INR 6,796.77 it cost on Thursday.
The price for Gold decreased to INR 79,052.29 per tola from INR 79,276.15 per tola a day earlier.
| Unit measure | Gold Price in INR |
|---|---|
| 1 Gram | 6,777.57 |
| 10 Grams | 67,775.73 |
| Tola | 79,052.29 |
| Troy Ounce | 210,804.60 |
FXStreet calculates Gold prices in India by adapting international prices (USD/INR) to the local currency and measurement units. Prices are updated daily based on the market rates taken at the time of publication. Prices are just for reference and local rates could diverge slightly.
Gold FAQs
Gold has played a key role in human’s history as it has been widely used as a store of value and medium of exchange. Currently, apart from its shine and usage for jewelry, the precious metal is widely seen as a safe-haven asset, meaning that it is considered a good investment during turbulent times. Gold is also widely seen as a hedge against inflation and against depreciating currencies as it doesn’t rely on any specific issuer or government.
Central banks are the biggest Gold holders. In their aim to support their currencies in turbulent times, central banks tend to diversify their reserves and buy Gold to improve the perceived strength of the economy and the currency. High Gold reserves can be a source of trust for a country’s solvency. Central banks added 1,136 tonnes of Gold worth around $70 billion to their reserves in 2022, according to data from the World Gold Council. This is the highest yearly purchase since records began. Central banks from emerging economies such as China, India and Turkey are quickly increasing their Gold reserves.
Gold has an inverse correlation with the US Dollar and US Treasuries, which are both major reserve and safe-haven assets. When the Dollar depreciates, Gold tends to rise, enabling investors and central banks to diversify their assets in turbulent times. Gold is also inversely correlated with risk assets. A rally in the stock market tends to weaken Gold price, while sell-offs in riskier markets tend to favor the precious metal.
The price can move due to a wide range of factors. Geopolitical instability or fears of a deep recession can quickly make Gold price escalate due to its safe-haven status. As a yield-less asset, Gold tends to rise with lower interest rates, while higher cost of money usually weighs down on the yellow metal. Still, most moves depend on how the US Dollar (USD) behaves as the asset is priced in dollars (XAU/USD). A strong Dollar tends to keep the price of Gold controlled, whereas a weaker Dollar is likely to push Gold prices up.
(An automation tool was used in creating this post.)
- GBP/USD loses ground as traders adopt caution ahead of US Personal Consumption Expenditure Price Index data.
- US Gross Domestic Product grew at 3.0% in Q2, exceeding both the expected and previous growth rate of 2.8%.
- The Pound Sterling may gain ground as traders expect the BoE to maintain higher rates for a longer period.
GBP/USD loses ground for the third successive session, trading around 1.3160 during the Asian hours on Friday. This downside could be attributed to the improved US Dollar (USD) following stronger-than-expected economic data released on Thursday. Investors await July’s US Personal Consumption Expenditure (PCE) Price Index scheduled to be released later in the North American Session.
The US Gross Domestic Product Annualized grew at 3.0% in the second quarter, exceeding both the expected and previous growth rate of 2.8%. Additionally, Initial Jobless Claims showed that the number of people filing for unemployment benefits fell to 231,000 for the week ending August 23, down from the previous 233,000 and slightly below the expected 232,000.
However, dovish remarks from the Federal Reserve could constrain further gains for the Greenback. Federal Reserve Atlanta President Raphael Bostic, a prominent hawk on the FOMC, indicated on Thursday that it might be "time to move" on rate cuts due to further cooling inflation and a higher-than-expected unemployment rate. However, Bostic wants to wait for confirmation from the upcoming monthly jobs report and two inflation reports before the Fed's September meeting.
The downside for the Pound Sterling (GBP) may be limited, as traders anticipate that the Bank of England (BoE) will maintain higher interest rates for a longer period compared to the US Federal Reserve (Fed). The BoE reduced rates by 25 basis points to 5% on August 1, and money markets are pricing in an additional 40 basis points of cuts by the end of the year.
In his speech at the Jackson Hole Symposium last week, BoE Governor Andrew Bailey indicated that the second-round effects of inflationary pressures would be less significant than anticipated. However, Bailey also advised against hastening additional interest rate cuts, according to Reuters.
British Pound PRICE Today
The table below shows the percentage change of the British Pound (GBP) against listed major currencies today. The British Pound was the strongest against the Swiss Franc.
| USD | EUR | GBP | JPY | CAD | AUD | NZD | CHF | |
|---|---|---|---|---|---|---|---|---|
| USD | 0.02% | 0.02% | -0.13% | 0.00% | -0.14% | -0.13% | 0.03% | |
| EUR | -0.02% | -0.00% | -0.14% | -0.01% | -0.16% | -0.17% | 0.02% | |
| GBP | -0.02% | 0.00% | -0.13% | -0.01% | -0.16% | -0.16% | 0.01% | |
| JPY | 0.13% | 0.14% | 0.13% | 0.14% | -0.00% | -0.02% | 0.17% | |
| CAD | -0.00% | 0.01% | 0.01% | -0.14% | -0.16% | -0.13% | 0.02% | |
| AUD | 0.14% | 0.16% | 0.16% | 0.00% | 0.16% | -0.01% | 0.17% | |
| NZD | 0.13% | 0.17% | 0.16% | 0.02% | 0.13% | 0.00% | 0.17% | |
| CHF | -0.03% | -0.02% | -0.01% | -0.17% | -0.02% | -0.17% | -0.17% |
The heat map shows percentage changes of major currencies against each other. The base currency is picked from the left column, while the quote currency is picked from the top row. For example, if you pick the British Pound from the left column and move along the horizontal line to the US Dollar, the percentage change displayed in the box will represent GBP (base)/USD (quote).
- The Indian Rupee strengthens in Friday’s Asian session.
- A positive trend in Indian equities supports the INR, while higher crude oil prices might cap its upside.
- The Indian GDP Quarterly for Q1 and US PCE inflation data will take center stage on Friday.
The Indian Rupee (INR) edges higher on Friday despite the stronger US Dollar. India's boosted weight in the MSCI Emerging Market Index could lead to significant foreign investment, stabilizing the INR in the near term. However, the recovery of crude oil prices might cap the upside for the local currency as India is the world’s third-biggest oil importer and consumer.
The Indian GDP Quarterly for the first quarter of fiscal 2024-25 (FY25) is due on Friday, which is estimated to grow 6.9% YoY in Q1. On the US docket, the Personal Consumption Expenditure (PCE) inflation data will be in the spotlight as it could offer some hints as to whether the Fed will implement a 25 or 50 basis points (bps) rate cut at the upcoming September meeting.
Daily Digest Market Movers: Indian Rupee is influenced by domestic equity inflows and global factors
- Indian equities' increased weightage in MSCI's emerging market index, effective Friday, is expected to attract as much as $3 billion in inflows, according to Nuvama Alternative and Quantitative Research.
- The US annualized Gross Domestic Product (GDP) growth for the second quarter (Q2) was revised higher to 3.0% from 2.8% in the initial estimate, better than the 2.8% estimated, according to the Bureau of Economic Analysis (BEA) on Thursday.
- The number of Americans filing new applications for jobless benefits for the week ending August 24 declined to 231K from 233K in the previous week. This figure was below the consensus of 232K.
- Atlanta Fed President Raphael Bostic said on Thursday that there is still a distance to go on inflation, adding that the Fed should wait for more employment and inflation reports data before cutting rates.
- According to the CME FedWatch Tool, the rate futures markets are now pricing in a nearly 66% chance of a 25 basis points (bps) rate cut in September, but the odds of a deeper rate cut stands at 34%, down from 36.5% before the US GDP data.
Technical Analysis: USD/INR’s broader trend remains constructive
The Indian Rupee trades stronger on the day. The USD/INR pair faced a rejection from the 84.00 barrier on Wednesday, but the bullish outlook remains intact as the pair is above the key 100-day Exponential Moving Average (EMA) on the daily timeframe. However, further consolidation in the near term cannot be ruled out as the 14-day Relative Strength Index (RSI) hovers around the midline, indicating the neutral momentum for USD/INR.
The ascending trendline and psychological level of 84.00 appear to be a tough nut to crack for the pair. Sustained bullish momentum will see a rally to the record high of 84.24 en route to 84.50.
On the flip side, the first downside target is located near the low of August 20 at 83.77. Any follow-through selling will see a drop to the 100-day EMA at 83.61.
US Dollar price today
The table below shows the percentage change of US Dollar (USD) against listed major currencies today. US Dollar was the weakest against the Japanese Yen.
| USD | EUR | GBP | CAD | AUD | JPY | NZD | CHF | |
| USD | 0.04% | 0.00% | -0.02% | -0.09% | -0.12% | -0.06% | 0.04% | |
| EUR | -0.04% | -0.04% | -0.07% | -0.13% | -0.16% | -0.10% | -0.01% | |
| GBP | 0.00% | 0.04% | -0.05% | -0.10% | -0.12% | -0.08% | 0.04% | |
| CAD | 0.02% | 0.07% | 0.04% | -0.06% | -0.10% | -0.02% | 0.07% | |
| AUD | 0.09% | 0.13% | 0.09% | 0.06% | -0.03% | 0.02% | 0.12% | |
| JPY | 0.12% | 0.16% | 0.13% | 0.08% | 0.03% | 0.05% | 0.15% | |
| NZD | 0.05% | 0.11% | 0.06% | 0.02% | -0.03% | -0.06% | 0.10% | |
| CHF | -0.04% | 0.00% | -0.04% | -0.08% | -0.14% | -0.16% | -0.10% |
The heat map shows percentage changes of major currencies against each other. The base currency is picked from the left column, while the quote currency is picked from the top row. For example, if you pick the Euro from the left column and move along the horizontal line to the Japanese Yen, the percentage change displayed in the box will represent EUR (base)/JPY (quote).
Indian Rupee FAQs
The Indian Rupee (INR) is one of the most sensitive currencies to external factors. The price of Crude Oil (the country is highly dependent on imported Oil), the value of the US Dollar – most trade is conducted in USD – and the level of foreign investment, are all influential. Direct intervention by the Reserve Bank of India (RBI) in FX markets to keep the exchange rate stable, as well as the level of interest rates set by the RBI, are further major influencing factors on the Rupee.
The Reserve Bank of India (RBI) actively intervenes in forex markets to maintain a stable exchange rate, to help facilitate trade. In addition, the RBI tries to maintain the inflation rate at its 4% target by adjusting interest rates. Higher interest rates usually strengthen the Rupee. This is due to the role of the ‘carry trade’ in which investors borrow in countries with lower interest rates so as to place their money in countries’ offering relatively higher interest rates and profit from the difference.
Macroeconomic factors that influence the value of the Rupee include inflation, interest rates, the economic growth rate (GDP), the balance of trade, and inflows from foreign investment. A higher growth rate can lead to more overseas investment, pushing up demand for the Rupee. A less negative balance of trade will eventually lead to a stronger Rupee. Higher interest rates, especially real rates (interest rates less inflation) are also positive for the Rupee. A risk-on environment can lead to greater inflows of Foreign Direct and Indirect Investment (FDI and FII), which also benefit the Rupee.
Higher inflation, particularly, if it is comparatively higher than India’s peers, is generally negative for the currency as it reflects devaluation through oversupply. Inflation also increases the cost of exports, leading to more Rupees being sold to purchase foreign imports, which is Rupee-negative. At the same time, higher inflation usually leads to the Reserve Bank of India (RBI) raising interest rates and this can be positive for the Rupee, due to increased demand from international investors. The opposite effect is true of lower inflation.
- The Japanese Yen appreciates as increasing Tokyo inflation figures strengthen the BoJ’s hawkish stance on its policy outlook.
- Tokyo's CPI rose to 2.6% YoY in August, up from 2.2% in July.
- The US Dollar holds its ground following stronger-than-expected economic data from Thursday.
The Japanese Yen (JPY) retraces its recent gains against the US Dollar (USD) following the Tokyo Consumer Price Index (CPI) data released on Friday. The increase in Tokyo inflation strengthens the Bank of Japan’s (BoJ) hawkish monetary policy stance, supporting the JPY and putting downward pressure on the USD/JPY pair.
Tokyo's Consumer Price Index (CPI) increased to 2.6% year-on-year in August, up from 2.2% in July. Core CPI also rose to 1.6% YoY in August, compared to the previous 1.5%. Additionally, Japan’s Unemployment Rate unexpectedly climbed to 2.7% in July, up from both the market estimate and June's 2.5%, marking the highest jobless rate since August 2023.
The downside for the USD/JPY pair may be capped, as the US Dollar maintains its recent gains following stronger-than-expected economic data released on Thursday. However, dovish remarks from the Federal Reserve could constrain further gains for the Greenback.
Investors await July’s US Personal Consumption Expenditure (PCE) Price Index scheduled to be released later in the North American Session, seeking clues about the future direction of US interest rates.
Daily Digest Market Movers: Japanese Yen inches higher following Tokyo inflation data
- According to the CME FedWatch Tool, markets are fully anticipating at least a 25 basis point (bps) rate cut by the Fed at its September meeting.
- Federal Reserve Atlanta President Raphael Bostic, a prominent hawk on the FOMC, indicated on Thursday that it might be "time to move" on rate cuts due to further cooling inflation and a higher-than-expected unemployment rate. However, he wants to wait for confirmation from the upcoming monthly jobs report and two inflation reports before the Fed's September meeting.
- The US Gross Domestic Product (GDP) grew at an annualized rate of 3.0% in the second quarter, exceeding both the expected and previous growth rate of 2.8%. Additionally, Initial Jobless Claims showed that the number of people filing for unemployment benefits fell to 231,000 for the week ending August 23, down from the previous 233,000 and slightly below the expected 232,000.
- US Core Personal Consumption Expenditures (QoQ), the Federal Reserve's preferred measure of underlying inflation, increased by 2.8% in the second quarter, slightly below the market forecast of 2.9%. This marks a significant deceleration from the 3.7% growth observed in the first quarter.
- Japan’s Finance Minister Shunichi Suzuki stated on Tuesday that foreign exchange rates are influenced by a variety of factors, including monetary policies, interest rate differentials, geopolitical risks, and market sentiment. Suzuki added that it is difficult to predict how these factors will impact FX rates.
- Bank of Japan (BoJ) Governor Kazuo Ueda addressed the Japanese parliament on Friday, stating that he is “not considering selling long-term Japanese government bonds (JGBs) as a tool for adjusting interest rates.” He noted that any reduction in JGB purchases would only account for about 7-8% of the balance sheet, which is a relatively small decrease. Ueda added that if the economy aligns with their projections, there could be a phase where they might adjust interest rates slightly further.
Technical Analysis: USD/JPY remains below 145.00
USD/JPY trades around 144.80 on Friday. Daily chart analysis indicates that the pair is positioned above the downtrend line, which points to a weakening bearish bias. Nonetheless, the 14-day Relative Strength Index (RSI) remains above 30, signaling a confirmation of the bearish trend.
On the downside, the USD/JPY pair could test the immediate downtrend line around the level of 144.50. A break below this level could lead the pair to navigate the area around the seven-month low of 141.69, recorded on August 5, followed by the next throwback support at 140.25.
Regarding resistance, the USD/JPY pair may test the immediate barrier at the nine-day Exponential Moving Average (EMA) around 145.15. A move above this level could open the door for the pair to approach the resistance area near 154.50.
USD/JPY: Daily Chart
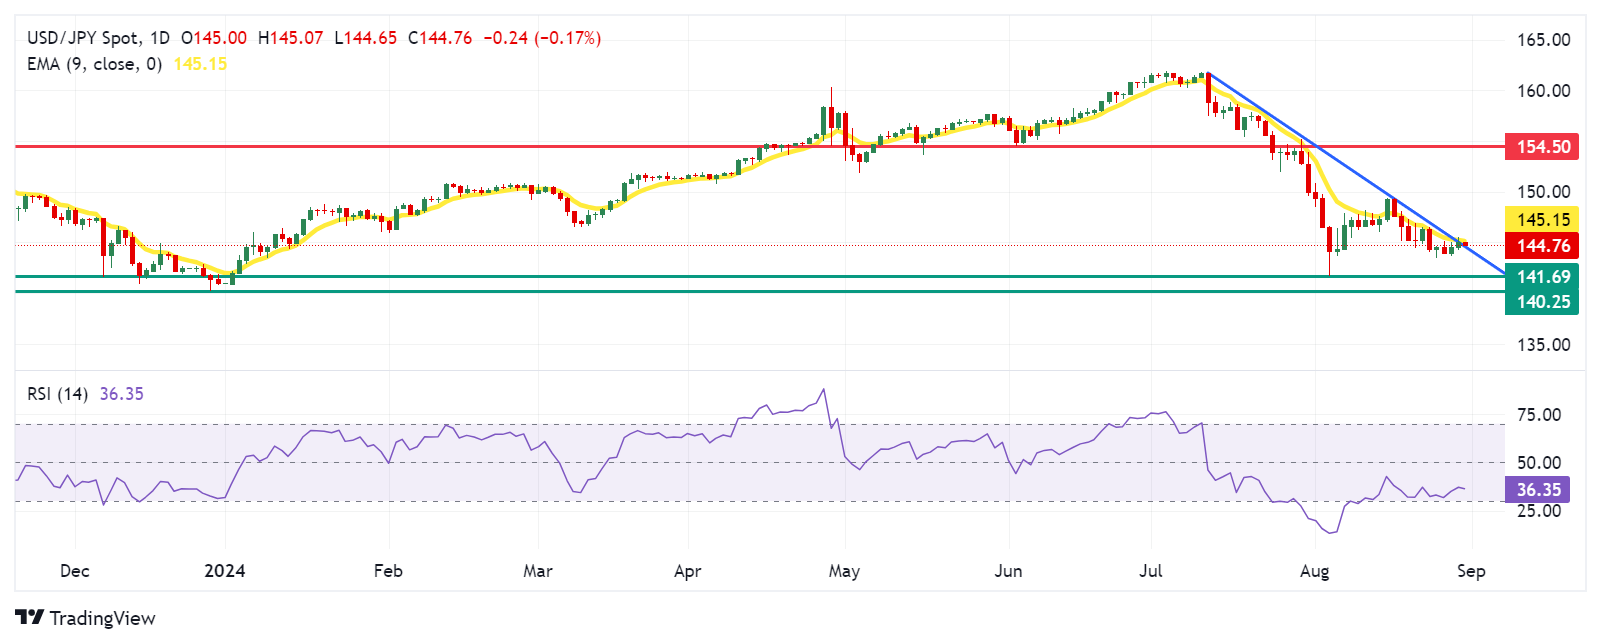
Japanese Yen PRICE Today
The table below shows the percentage change of Japanese Yen (JPY) against listed major currencies today. Japanese Yen was the strongest against the Euro.
| USD | EUR | GBP | JPY | CAD | AUD | NZD | CHF | |
|---|---|---|---|---|---|---|---|---|
| USD | 0.04% | 0.05% | -0.14% | 0.00% | -0.03% | -0.14% | 0.00% | |
| EUR | -0.04% | -0.00% | -0.19% | -0.03% | -0.07% | -0.20% | -0.03% | |
| GBP | -0.05% | 0.00% | -0.19% | -0.03% | -0.07% | -0.19% | -0.03% | |
| JPY | 0.14% | 0.19% | 0.19% | 0.17% | 0.13% | -0.00% | 0.18% | |
| CAD | -0.01% | 0.03% | 0.03% | -0.17% | -0.06% | -0.15% | 0.00% | |
| AUD | 0.03% | 0.07% | 0.07% | -0.13% | 0.06% | -0.13% | 0.04% | |
| NZD | 0.14% | 0.20% | 0.19% | 0.00% | 0.15% | 0.13% | 0.16% | |
| CHF | -0.01% | 0.03% | 0.03% | -0.18% | -0.00% | -0.04% | -0.16% |
The heat map shows percentage changes of major currencies against each other. The base currency is picked from the left column, while the quote currency is picked from the top row. For example, if you pick the Japanese Yen from the left column and move along the horizontal line to the US Dollar, the percentage change displayed in the box will represent JPY (base)/USD (quote).
Japanese Yen FAQs
The Japanese Yen (JPY) is one of the world’s most traded currencies. Its value is broadly determined by the performance of the Japanese economy, but more specifically by the Bank of Japan’s policy, the differential between Japanese and US bond yields, or risk sentiment among traders, among other factors.
One of the Bank of Japan’s mandates is currency control, so its moves are key for the Yen. The BoJ has directly intervened in currency markets sometimes, generally to lower the value of the Yen, although it refrains from doing it often due to political concerns of its main trading partners. The current BoJ ultra-loose monetary policy, based on massive stimulus to the economy, has caused the Yen to depreciate against its main currency peers. This process has exacerbated more recently due to an increasing policy divergence between the Bank of Japan and other main central banks, which have opted to increase interest rates sharply to fight decades-high levels of inflation.
The BoJ’s stance of sticking to ultra-loose monetary policy has led to a widening policy divergence with other central banks, particularly with the US Federal Reserve. This supports a widening of the differential between the 10-year US and Japanese bonds, which favors the US Dollar against the Japanese Yen.
The Japanese Yen is often seen as a safe-haven investment. This means that in times of market stress, investors are more likely to put their money in the Japanese currency due to its supposed reliability and stability. Turbulent times are likely to strengthen the Yen’s value against other currencies seen as more risky to invest in.
| Raw materials | Closed | Change, % |
|---|---|---|
| Silver | 29.408 | 0.94 |
| Gold | 252.168 | 0.61 |
| Palladium | 974.26 | 3.48 |
- Gold price drops in Friday’s early Asian session.
- The stronger US GDP growth drags Gold price lower, but rising Fed rate cut expectations might help limit its losses.
- All eyes are on the US PCE inflation data, which is due later on Friday.
Gold price (XAU/USD) loses momentum amid the firmer US Dollar (USD) on Friday. The upbeat US growth report and Initial Jobless Claims have pushed back the expectation of a deeper rate cut by the US Federal Reserve (Fed) in September, which weighs on the non-yielding gold. Nonetheless, the escalating geopolitical tensions in the Middle East and the war between Russia and Ukraine might boost the safe-haven demand, benefiting the yellow metal.
Investors will closely monitor the US inflation data for further insights on the potential size of the Fed rate cut. The core Personal Consumption Expenditures (PCE) Price Index, the Fed's preferred gauge of inflation, is estimated to show an increase of 2.7% YoY in July, compared to 2.6% in June. A softer-than-expected PCE reading could trigger the Fed to start a rate-cutting cycle, which acts as a tailwind for XAU/USD.
Daily Digest Market Movers: Gold price loses ground, reaffirmed Fed rate cut bets might cap its downside
- Russia carried out several air attacks on Ukraine this week, costing Moscow an estimated £1.1 billion. Meanwhile, Ukraine has warned it is closely watching its border with Belarus after a recent buildup of troops there, per Sky News.
- US Gross Domestic Product (GDP) grew at an annual rate of 3.0% in the second quarter (Q2), the Department of Commerce reported in its second estimate released on Thursday. The figure came in stronger than the estimations and the initial estimate of 2.8%.
- The US weekly Initial Jobless Claims for the week ending August 24 declined to 231K from 233K in the previous week, below the market consensus of 232K.
- Atlanta Fed President Raphael Bostic said on Thursday that it might be "time to move" on rate cuts as inflation cools down further and the unemployment rate rises more than he estimated, but he wants to see more evidence from the monthly jobs report and two inflation reports due before the next Fed meeting.
- The markets are now pricing in around 66% of a 25 basis points (bps) rate cut in September, but the possibility of a larger rate cut stands at 34%, down from 36.5% before the US GDP data, according to the CME FedWatch Tool.
Technical Analysis: Gold price keeps the bullish vibe in the longer term
The Gold price edges lower on the day. The precious metal remains capped under a five-month-old ascending channel upper boundary and the all-time high. However, the overall outlook of the precious metal is strongly in favor of the bulls on the daily timeframe, with the price holding above the key 100-day Exponential Moving Average (EMA). Additionally, the 14-day Relative Strength Index (RSI) stands near 60.75, suggesting potential bullish momentum in the near term.
The key resistance level for the yellow metal is seen near the confluence of the all-time high and the upper boundary of the trend channel of $2,530. Further north, the next hurdle emerges at the $2,600 psychological mark.
On the other hand, the initial downside target for XAU/USD could be the $2,500 round figure. A decisive break below this level could expose further downside potential towards $2,432 (the low of August 15) en route to $2,382 (100-day EMA).
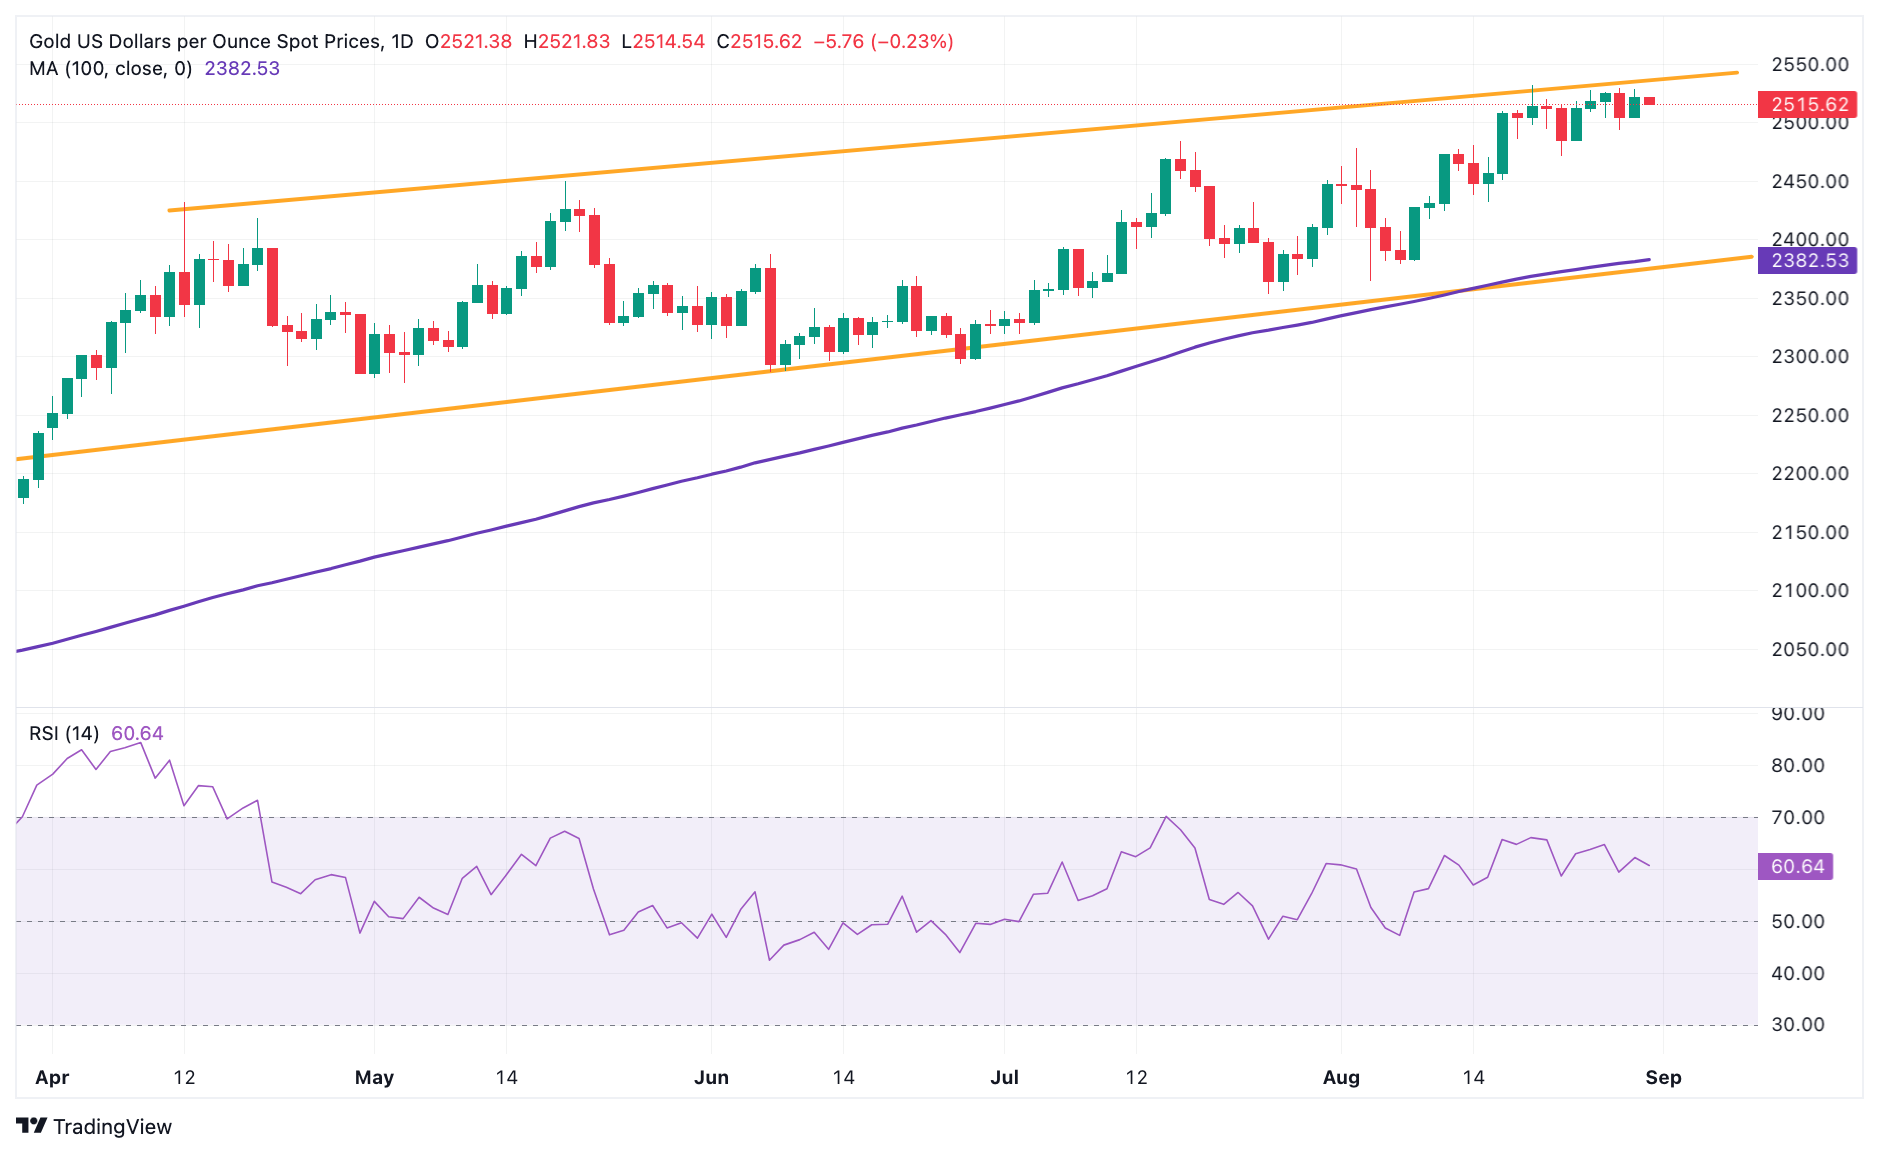
Gold FAQs
Gold has played a key role in human’s history as it has been widely used as a store of value and medium of exchange. Currently, apart from its shine and usage for jewelry, the precious metal is widely seen as a safe-haven asset, meaning that it is considered a good investment during turbulent times. Gold is also widely seen as a hedge against inflation and against depreciating currencies as it doesn’t rely on any specific issuer or government.
Central banks are the biggest Gold holders. In their aim to support their currencies in turbulent times, central banks tend to diversify their reserves and buy Gold to improve the perceived strength of the economy and the currency. High Gold reserves can be a source of trust for a country’s solvency. Central banks added 1,136 tonnes of Gold worth around $70 billion to their reserves in 2022, according to data from the World Gold Council. This is the highest yearly purchase since records began. Central banks from emerging economies such as China, India and Turkey are quickly increasing their Gold reserves.
Gold has an inverse correlation with the US Dollar and US Treasuries, which are both major reserve and safe-haven assets. When the Dollar depreciates, Gold tends to rise, enabling investors and central banks to diversify their assets in turbulent times. Gold is also inversely correlated with risk assets. A rally in the stock market tends to weaken Gold price, while sell-offs in riskier markets tend to favor the precious metal.
The price can move due to a wide range of factors. Geopolitical instability or fears of a deep recession can quickly make Gold price escalate due to its safe-haven status. As a yield-less asset, Gold tends to rise with lower interest rates, while higher cost of money usually weighs down on the yellow metal. Still, most moves depend on how the US Dollar (USD) behaves as the asset is priced in dollars (XAU/USD). A strong Dollar tends to keep the price of Gold controlled, whereas a weaker Dollar is likely to push Gold prices up.
- The Australian Dollar holds its position after Retail Sales reported no growth in July.
- Australia’s Retail Sales stagnated month-on-month in July, against the expected 0.3% increase.
- The US Dollar received support following stronger-than-expected US GDP data for Q2.
The Australian Dollar (AUD) remains steady against the stable US Dollar (USD) following the Retail Sales report on Friday, which showed no growth month-on-month in July, falling short of the anticipated 0.3% and the previous 0.5% increase. However, stronger-than-expected US Gross Domestic Product (GDP) data for the second quarter released on Thursday has put pressure on the AUD/USD pair.
The AUD/USD pair could see further gains as July’s higher-than-expected Monthly Consumer Price Index (CPI) has bolstered expectations that the Reserve Bank of Australia (RBA) may adopt a more hawkish policy stance. Recent RBA Minutes also showed that board members agreed that a rate cut would be unlikely soon.
The US Dollar found support from better-than-expected economic data, but dovish comments from Federal Reserve officials could limit its gains. On Thursday, Atlanta Fed President Raphael Bostic suggested it might be "time to move" on rate cuts as inflation continues to cool and the unemployment rate rises more than anticipated, per Reuters.
According to the CME FedWatch Tool, markets are fully anticipating at least a 25 basis point (bps) rate cut by the Fed at its September meeting. Investors will be paying close attention to Friday’s release of the US Personal Consumption Expenditure (PCE) Price Index for July, seeking clues about the future direction of US interest rates.
Daily Digest Market Movers: Australian Dollar inches higher following Retail Sales data
- The US Gross Domestic Product (GDP) grew at an annualized rate of 3.0% in the second quarter, exceeding both the expected and previous growth rate of 2.8%. Additionally, Initial Jobless Claims showed that the number of people filing for unemployment benefits fell to 231,000 for the week ending August 23, down from the previous 233,000 and slightly below the expected 232,000.
- US Core Personal Consumption Expenditures (QoQ), the Federal Reserve's preferred measure of underlying inflation, increased by 2.8% in the second quarter, slightly below the market forecast of 2.9%. This marks a significant deceleration from the 3.7% growth observed in the first quarter.
- Australia's Private Capital Expenditure unexpectedly declined by 2.2% in the second quarter, reversing from an upwardly revised 1.9% expansion in the previous period and falling short of market expectations for a 1.0% increase. This marks the first contraction in new capital expenditure since the third quarter of 2023.
- Australia's Monthly Consumer Price Index (CPI) increased by 3.5% year-on-year in July, down from June's 3.8% but slightly above the market consensus of 3.4%. Despite the slight decrease, this marks the lowest CPI figure since March.
- San Francisco Federal Reserve President Mary Daly stated on Monday in an interview with Bloomberg TV that "the time is upon us" to begin cutting interest rates, likely starting with a quarter-percentage point reduction. Daly suggested that if inflation continues to slow gradually and the labor market maintains a "steady, sustainable" pace of job growth, it would be reasonable to "adjust policy at the regular, normal cadence."
- FOMC Minutes for July’s policy meeting indicated that most Fed officials agreed last month that they would likely cut their benchmark interest rate at the upcoming meeting in September as long as inflation continued to cool.
- On Tuesday, the RBA Minutes suggested that the board members had considered a rate hike earlier this month before ultimately deciding that maintaining current rates would better balance the risks. Additionally, RBA members agreed that a rate cut is unlikely soon.
Technical Analysis: Australian Dollar holds position near 0.6800
The Australian Dollar trades around 0.6790 on Friday. Analyzing the daily chart, the AUD/USD pair appears to be testing the lower boundary of its ascending channel, indicating a potential reinforcement of the bullish bias. However, the 14-day Relative Strength Index (RSI) remains just below the 70 mark, which continues to support the ongoing bullish trend.
Regarding resistance, the AUD/USD pair is testing the immediate barrier at the lower boundary of the ascending channel, near the seven-month high of 0.6798. A break above this level could open the path for the pair to target the region around the upper boundary of the ascending channel, near the 0.6920 level.
On the downside, the AUD/USD pair may find support near the nine-day Exponential Moving Average (EMA) at the 0.6761 level. A drop below this EMA could weaken the bullish bias and exert downward pressure, potentially leading the pair to test the throwback level at 0.6575, followed by another throwback level at 0.6470.
AUD/USD: Daily Chart
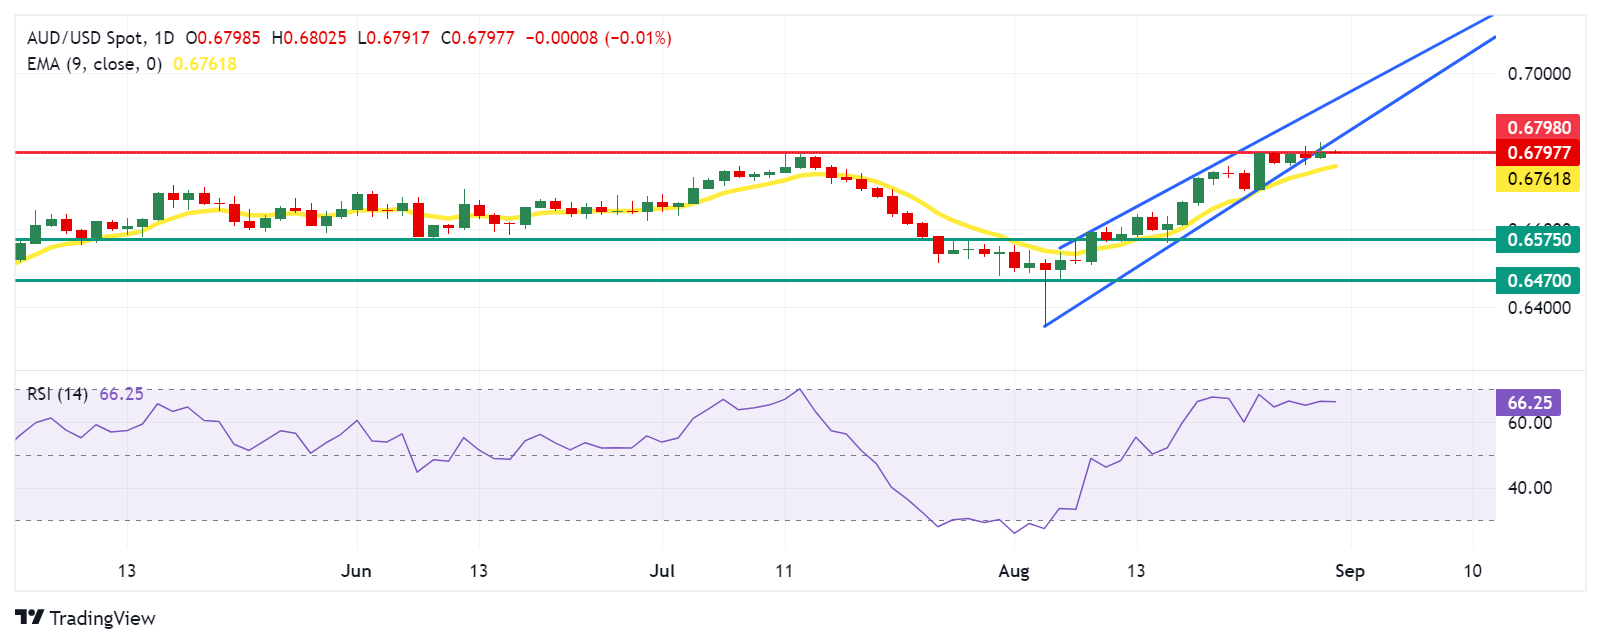
Australian Dollar PRICE Today
The table below shows the percentage change of Australian Dollar (AUD) against listed major currencies today. Australian Dollar was the strongest against the US Dollar.
| USD | EUR | GBP | JPY | CAD | AUD | NZD | CHF | |
|---|---|---|---|---|---|---|---|---|
| USD | -0.00% | 0.00% | -0.10% | -0.02% | 0.03% | -0.13% | -0.02% | |
| EUR | 0.00% | 0.00% | -0.10% | -0.02% | 0.04% | -0.14% | -0.02% | |
| GBP | -0.01% | -0.00% | -0.10% | -0.02% | 0.03% | -0.14% | -0.02% | |
| JPY | 0.10% | 0.10% | 0.10% | 0.11% | 0.16% | -0.03% | 0.11% | |
| CAD | 0.02% | 0.02% | 0.02% | -0.11% | 0.04% | -0.11% | -0.00% | |
| AUD | -0.03% | -0.04% | -0.03% | -0.16% | -0.04% | -0.18% | -0.05% | |
| NZD | 0.13% | 0.14% | 0.14% | 0.03% | 0.11% | 0.18% | 0.13% | |
| CHF | 0.02% | 0.02% | 0.02% | -0.11% | 0.00% | 0.05% | -0.13% |
The heat map shows percentage changes of major currencies against each other. The base currency is picked from the left column, while the quote currency is picked from the top row. For example, if you pick the Australian Dollar from the left column and move along the horizontal line to the US Dollar, the percentage change displayed in the box will represent AUD (base)/USD (quote).
Australian Dollar FAQs
One of the most significant factors for the Australian Dollar (AUD) is the level of interest rates set by the Reserve Bank of Australia (RBA). Because Australia is a resource-rich country another key driver is the price of its biggest export, Iron Ore. The health of the Chinese economy, its largest trading partner, is a factor, as well as inflation in Australia, its growth rate and Trade Balance. Market sentiment – whether investors are taking on more risky assets (risk-on) or seeking safe-havens (risk-off) – is also a factor, with risk-on positive for AUD.
The Reserve Bank of Australia (RBA) influences the Australian Dollar (AUD) by setting the level of interest rates that Australian banks can lend to each other. This influences the level of interest rates in the economy as a whole. The main goal of the RBA is to maintain a stable inflation rate of 2-3% by adjusting interest rates up or down. Relatively high interest rates compared to other major central banks support the AUD, and the opposite for relatively low. The RBA can also use quantitative easing and tightening to influence credit conditions, with the former AUD-negative and the latter AUD-positive.
China is Australia’s largest trading partner so the health of the Chinese economy is a major influence on the value of the Australian Dollar (AUD). When the Chinese economy is doing well it purchases more raw materials, goods and services from Australia, lifting demand for the AUD, and pushing up its value. The opposite is the case when the Chinese economy is not growing as fast as expected. Positive or negative surprises in Chinese growth data, therefore, often have a direct impact on the Australian Dollar and its pairs.
Iron Ore is Australia’s largest export, accounting for $118 billion a year according to data from 2021, with China as its primary destination. The price of Iron Ore, therefore, can be a driver of the Australian Dollar. Generally, if the price of Iron Ore rises, AUD also goes up, as aggregate demand for the currency increases. The opposite is the case if the price of Iron Ore falls. Higher Iron Ore prices also tend to result in a greater likelihood of a positive Trade Balance for Australia, which is also positive of the AUD.
The Trade Balance, which is the difference between what a country earns from its exports versus what it pays for its imports, is another factor that can influence the value of the Australian Dollar. If Australia produces highly sought after exports, then its currency will gain in value purely from the surplus demand created from foreign buyers seeking to purchase its exports versus what it spends to purchase imports. Therefore, a positive net Trade Balance strengthens the AUD, with the opposite effect if the Trade Balance is negative.
Australia’s Retail Sales, a measure of the country’s consumer spending, remained flat at 0% MoM in July after increasing by 0.5% in June, the official data published by the Australian Bureau of Statistics (ABS) showed on Friday.
The reading came in below the market expectations of a 0.3% growth.
Market reaction to Australia’s Retail Sales data
At the time of writing, the AUD/USD pair is down 0.06% on the day at 0.6794.
Australian Dollar FAQs
One of the most significant factors for the Australian Dollar (AUD) is the level of interest rates set by the Reserve Bank of Australia (RBA). Because Australia is a resource-rich country another key driver is the price of its biggest export, Iron Ore. The health of the Chinese economy, its largest trading partner, is a factor, as well as inflation in Australia, its growth rate and Trade Balance. Market sentiment – whether investors are taking on more risky assets (risk-on) or seeking safe-havens (risk-off) – is also a factor, with risk-on positive for AUD.
The Reserve Bank of Australia (RBA) influences the Australian Dollar (AUD) by setting the level of interest rates that Australian banks can lend to each other. This influences the level of interest rates in the economy as a whole. The main goal of the RBA is to maintain a stable inflation rate of 2-3% by adjusting interest rates up or down. Relatively high interest rates compared to other major central banks support the AUD, and the opposite for relatively low. The RBA can also use quantitative easing and tightening to influence credit conditions, with the former AUD-negative and the latter AUD-positive.
China is Australia’s largest trading partner so the health of the Chinese economy is a major influence on the value of the Australian Dollar (AUD). When the Chinese economy is doing well it purchases more raw materials, goods and services from Australia, lifting demand for the AUD, and pushing up its value. The opposite is the case when the Chinese economy is not growing as fast as expected. Positive or negative surprises in Chinese growth data, therefore, often have a direct impact on the Australian Dollar and its pairs.
Iron Ore is Australia’s largest export, accounting for $118 billion a year according to data from 2021, with China as its primary destination. The price of Iron Ore, therefore, can be a driver of the Australian Dollar. Generally, if the price of Iron Ore rises, AUD also goes up, as aggregate demand for the currency increases. The opposite is the case if the price of Iron Ore falls. Higher Iron Ore prices also tend to result in a greater likelihood of a positive Trade Balance for Australia, which is also positive of the AUD.
The Trade Balance, which is the difference between what a country earns from its exports versus what it pays for its imports, is another factor that can influence the value of the Australian Dollar. If Australia produces highly sought after exports, then its currency will gain in value purely from the surplus demand created from foreign buyers seeking to purchase its exports versus what it spends to purchase imports. Therefore, a positive net Trade Balance strengthens the AUD, with the opposite effect if the Trade Balance is negative.
The People’s Bank of China (PBOC) set the USD/CNY central rate for the trading session ahead on Friday at 7.1124, as against the previous day's fix of 7.1280 and 7.1116 Reuters estimates.
The Swiss National Bank (SNB) Chairman Thomas Jordan on Thursday acknowledged difficulties that the strong Swiss Franc is causing for Swiss industry, which is already dealing with weaker demand from other European countries, per Reuters.
Key quotes
The mandate of the SNB is to maintain price stability—a crucial precondition for society and a good functioning economy.
Price stability is a crucial precondition for prosperity.
Germany and Europe are the main markets for industry. If the growth is weak there, this automatically affects demand for our industrial goods.
The exchange rate ... does not make the situation easier. It makes it difficult for the industry,
Market reaction
At the time of press, the USD/CHF pair was down 0.03% on the day at 0.8471.
SNB FAQs
The Swiss National Bank (SNB) is the country’s central bank. As an independent central bank, its mandate is to ensure price stability in the medium and long term. To ensure price stability, the SNB aims to maintain appropriate monetary conditions, which are determined by the interest rate level and exchange rates. For the SNB, price stability means a rise in the Swiss Consumer Price Index (CPI) of less than 2% per year.
The Swiss National Bank (SNB) Governing Board decides the appropriate level of its policy rate according to its price stability objective. When inflation is above target or forecasted to be above target in the foreseeable future, the bank will attempt to tame excessive price growth by raising its policy rate. Higher interest rates are generally positive for the Swiss Franc (CHF) as they lead to higher yields, making the country a more attractive place for investors. On the contrary, lower interest rates tend to weaken CHF.
Yes. The Swiss National Bank (SNB) has regularly intervened in the foreign exchange market in order to avoid the Swiss Franc (CHF) appreciating too much against other currencies. A strong CHF hurts the competitiveness of the country’s powerful export sector. Between 2011 and 2015, the SNB implemented a peg to the Euro to limit the CHF advance against it. The bank intervenes in the market using its hefty foreign exchange reserves, usually by buying foreign currencies such as the US Dollar or the Euro. During episodes of high inflation, particularly due to energy, the SNB refrains from intervening markets as a strong CHF makes energy imports cheaper, cushioning the price shock for Swiss households and businesses.
The SNB meets once a quarter – in March, June, September and December – to conduct its monetary policy assessment. Each of these assessments results in a monetary policy decision and the publication of a medium-term inflation forecast.
The European Central Bank (ECB) policymaker Joachim Nagel said on Thursday that the ECB should avoid lowering interest rates too fast because it has yet to bring inflation down to 2% even if that goal is now in sight, per Reuters.
Key quotes
There is the risk that a somewhat stronger recovery could delay a return to the inflation target.
While our 2% target is in sight, we have not reached it.
A timely return to price stability cannot be taken for granted.
Market reaction
At the time of press, the EUR/USD pair was up 0.04% on the day at 1.1082.
ECB FAQs
The European Central Bank (ECB) in Frankfurt, Germany, is the reserve bank for the Eurozone. The ECB sets interest rates and manages monetary policy for the region. The ECB primary mandate is to maintain price stability, which means keeping inflation at around 2%. Its primary tool for achieving this is by raising or lowering interest rates. Relatively high interest rates will usually result in a stronger Euro and vice versa. The ECB Governing Council makes monetary policy decisions at meetings held eight times a year. Decisions are made by heads of the Eurozone national banks and six permanent members, including the President of the ECB, Christine Lagarde.
In extreme situations, the European Central Bank can enact a policy tool called Quantitative Easing. QE is the process by which the ECB prints Euros and uses them to buy assets – usually government or corporate bonds – from banks and other financial institutions. QE usually results in a weaker Euro. QE is a last resort when simply lowering interest rates is unlikely to achieve the objective of price stability. The ECB used it during the Great Financial Crisis in 2009-11, in 2015 when inflation remained stubbornly low, as well as during the covid pandemic.
Quantitative tightening (QT) is the reverse of QE. It is undertaken after QE when an economic recovery is underway and inflation starts rising. Whilst in QE the European Central Bank (ECB) purchases government and corporate bonds from financial institutions to provide them with liquidity, in QT the ECB stops buying more bonds, and stops reinvesting the principal maturing on the bonds it already holds. It is usually positive (or bullish) for the Euro.
| Index | Change, points | Closed | Change, % |
|---|---|---|---|
| NIKKEI 225 | -9.23 | 38362.53 | -0.02 |
| Hang Seng | 93.87 | 17786.32 | 0.53 |
| KOSPI | -27.55 | 2662.28 | -1.02 |
| ASX 200 | -26.3 | 8045.1 | -0.33 |
| DAX | 130.28 | 18912.57 | 0.69 |
| CAC 40 | 63.28 | 7640.95 | 0.84 |
| Dow Jones | 243.63 | 41335.05 | 0.59 |
| S&P 500 | -0.22 | 5591.96 | -0 |
| NASDAQ Composite | -39.6 | 17516.43 | -0.23 |
Russia carried out several air attacks on Ukraine this week, costing Moscow an estimated £1.1 billion. Meanwhile, Ukraine has warned it is closely watching on its border with Belarus after a recent buildup of troops there, according to Sky News.
Last week, Kyiv's foreign ministry accused Minsk of concentrating a "significant number of personnel" in the Gomel area near Ukraine's northern border "under the guise of exercises."
Market reaction
At the time of writing, the gold price (XAU/USD) is trading 0.12% lower on the day to trade at $2,518.
Risk sentiment FAQs
In the world of financial jargon the two widely used terms “risk-on” and “risk off'' refer to the level of risk that investors are willing to stomach during the period referenced. In a “risk-on” market, investors are optimistic about the future and more willing to buy risky assets. In a “risk-off” market investors start to ‘play it safe’ because they are worried about the future, and therefore buy less risky assets that are more certain of bringing a return, even if it is relatively modest.
Typically, during periods of “risk-on”, stock markets will rise, most commodities – except Gold – will also gain in value, since they benefit from a positive growth outlook. The currencies of nations that are heavy commodity exporters strengthen because of increased demand, and Cryptocurrencies rise. In a “risk-off” market, Bonds go up – especially major government Bonds – Gold shines, and safe-haven currencies such as the Japanese Yen, Swiss Franc and US Dollar all benefit.
The Australian Dollar (AUD), the Canadian Dollar (CAD), the New Zealand Dollar (NZD) and minor FX like the Ruble (RUB) and the South African Rand (ZAR), all tend to rise in markets that are “risk-on”. This is because the economies of these currencies are heavily reliant on commodity exports for growth, and commodities tend to rise in price during risk-on periods. This is because investors foresee greater demand for raw materials in the future due to heightened economic activity.
The major currencies that tend to rise during periods of “risk-off” are the US Dollar (USD), the Japanese Yen (JPY) and the Swiss Franc (CHF). The US Dollar, because it is the world’s reserve currency, and because in times of crisis investors buy US government debt, which is seen as safe because the largest economy in the world is unlikely to default. The Yen, from increased demand for Japanese government bonds, because a high proportion are held by domestic investors who are unlikely to dump them – even in a crisis. The Swiss Franc, because strict Swiss banking laws offer investors enhanced capital protection.
| Pare | Closed | Change, % |
|---|---|---|
| AUDUSD | 0.67972 | 0.19 |
| EURJPY | 160.644 | 0.01 |
| EURUSD | 1.1078 | -0.38 |
| GBPJPY | 190.921 | 0.2 |
| GBPUSD | 1.31644 | -0.21 |
| NZDUSD | 0.6256 | 0.19 |
| USDCAD | 1.34845 | 0.06 |
| USDCHF | 0.84707 | 0.64 |
| USDJPY | 145.019 | 0.41 |
- EUR/USD trades stronger near 1.1080 in Friday’s early Asian session.
- US GDP expanded more than expected in Q2.
- Cooling inflation from Germany and Spain supports the case for an ECB rate cut in September.
The EUR/USD pair recovers some lost ground around 1.1080, snapping the two-day losing streak on Friday during the early Asian session. However, the upside might be limited as traders might prefer to wait on the sidelines ahead of the German July Retail Sales and US July Personal Consumption Expenditure (PCE) Price Index.
The US Gross Domestic Product (GDP) growth rate rose at an annual rate of 3.0% in the second quarter (Q2), the Department of Commerce reported in its second estimate released on Thursday. The figure was better than the forecast of 2.8 and the initial estimate of 2.8%.
The report suggested that the US could avoid recession and dampen the hope for a larger 50 basis-point (bp) rate cut in September by the Federal Reserve (Fed). This, in turn, provides some support to the US Dollar (USD). Financial markets are now pricing in nearly 66% of a 25 basis points (bps) rate cut in September, but the chance of a deeper rate cut stands at 34%, down from 36.5% before the US GDP data, according to the CME FedWatch Tool.
Across the pond, the Consumer Price Index (CPI) data from Germany and Spain showed that inflation looks to have cooled further in August, prompting the expectation of an interest rate cut by the European Central Bank (ECB) and undermining the Euro (EUR). ING’s global head of macroeconomics, Carsten Brzeski, said that the outcome was “great news for the ECB” and further stated that a slowing economy and cooling inflation make a “perfect macro backdrop” for lower rates. Nonetheless, emphasized that service inflation isn't dead yet.
ECB FAQs
The European Central Bank (ECB) in Frankfurt, Germany, is the reserve bank for the Eurozone. The ECB sets interest rates and manages monetary policy for the region. The ECB primary mandate is to maintain price stability, which means keeping inflation at around 2%. Its primary tool for achieving this is by raising or lowering interest rates. Relatively high interest rates will usually result in a stronger Euro and vice versa. The ECB Governing Council makes monetary policy decisions at meetings held eight times a year. Decisions are made by heads of the Eurozone national banks and six permanent members, including the President of the ECB, Christine Lagarde.
In extreme situations, the European Central Bank can enact a policy tool called Quantitative Easing. QE is the process by which the ECB prints Euros and uses them to buy assets – usually government or corporate bonds – from banks and other financial institutions. QE usually results in a weaker Euro. QE is a last resort when simply lowering interest rates is unlikely to achieve the objective of price stability. The ECB used it during the Great Financial Crisis in 2009-11, in 2015 when inflation remained stubbornly low, as well as during the covid pandemic.
Quantitative tightening (QT) is the reverse of QE. It is undertaken after QE when an economic recovery is underway and inflation starts rising. Whilst in QE the European Central Bank (ECB) purchases government and corporate bonds from financial institutions to provide them with liquidity, in QT the ECB stops buying more bonds, and stops reinvesting the principal maturing on the bonds it already holds. It is usually positive (or bullish) for the Euro.


© 2000-2026. Bản quyền Teletrade.
Trang web này được quản lý bởi Teletrade D.J. LLC 2351 LLC 2022 (Euro House, Richmond Hill Road, Kingstown, VC0100, St. Vincent and the Grenadines).
Thông tin trên trang web không phải là cơ sở để đưa ra quyết định đầu tư và chỉ được cung cấp cho mục đích làm quen.
Giao dịch trên thị trường tài chính (đặc biệt là giao dịch sử dụng các công cụ biên) mở ra những cơ hội lớn và tạo điều kiện cho các nhà đầu tư sẵn sàng mạo hiểm để thu lợi nhuận, tuy nhiên nó mang trong mình nguy cơ rủi ro khá cao. Chính vì vậy trước khi tiến hành giao dịch cần phải xem xét mọi mặt vấn đề chấp nhận tiến hành giao dịch cụ thể xét theo quan điểm của nguồn lực tài chính sẵn có và mức độ am hiểu thị trường tài chính.
Sử dụng thông tin: sử dụng toàn bộ hay riêng biệt các dữ liệu trên trang web của công ty TeleTrade như một nguồn cung cấp thông tin nhất định. Việc sử dụng tư liệu từ trang web cần kèm theo liên kết đến trang teletrade.vn. Việc tự động thu thập số liệu cũng như thông tin từ trang web TeleTrade đều không được phép.
Xin vui lòng liên hệ với pr@teletrade.global nếu có câu hỏi.
ngân hàng