- Phân tích
- Tin tức và các công cụ
- Tin tức thị trường
Tin tức thì trường
| Time | Country | Event | Period | Previous value | Forecast |
|---|---|---|---|---|---|
| 01:00 | China | Non-Manufacturing PMI | July | 54.4 | |
| 01:00 | China | Manufacturing PMI | July | 50.9 | 50.7 |
| 01:30 | Australia | Private Sector Credit, y/y | June | 3.2% | |
| 01:30 | Australia | Private Sector Credit, m/m | June | -0.1% | |
| 01:30 | Australia | Producer price index, y/y | Quarter II | 1.3% | |
| 01:30 | Australia | Producer price index, q / q | Quarter II | 0.2% | |
| 05:00 | Japan | Housing Starts, y/y | June | -12.3% | -13.7% |
| 05:00 | Japan | Consumer Confidence | July | 28.4 | |
| 05:30 | France | GDP, q/q | Quarter II | -5.3% | -15.2% |
| 06:00 | Germany | Retail sales, real unadjusted, y/y | June | 3.8% | 3% |
| 06:00 | Germany | Retail sales, real adjusted | June | 13.9% | -3.3% |
| 06:30 | Switzerland | Retail Sales (MoM) | June | 30.7% | |
| 06:30 | Switzerland | Retail Sales Y/Y | June | 6.6% | |
| 06:45 | France | CPI, y/y | July | 0.2% | 0.3% |
| 06:45 | France | CPI, m/m | July | 0.1% | -0.1% |
| 06:45 | France | Consumer spending | June | 36.6% | 5.1% |
| 09:00 | Eurozone | Harmonized CPI, Y/Y | July | 0.3% | 0.2% |
| 09:00 | Eurozone | Harmonized CPI ex EFAT, Y/Y | July | 0.8% | 0.8% |
| 09:00 | Eurozone | GDP (YoY) | Quarter II | -3.1% | -14.5% |
| 09:00 | Eurozone | GDP (QoQ) | Quarter II | -3.6% | -12% |
| 12:30 | Canada | Industrial Product Price Index, y/y | June | -4.9% | |
| 12:30 | Canada | Industrial Product Price Index, m/m | June | 1.2% | 0.5% |
| 12:30 | U.S. | Personal spending | June | 8.2% | 5.5% |
| 12:30 | Canada | GDP (m/m) | May | -11.6% | 3.5% |
| 12:30 | U.S. | Employment Cost Index | Quarter II | 0.8% | 0.6% |
| 12:30 | U.S. | PCE price index ex food, energy, Y/Y | June | 1% | 1% |
| 12:30 | U.S. | PCE price index ex food, energy, m/m | June | 0.1% | 0.2% |
| 12:30 | U.S. | Personal Income, m/m | June | -4.2% | -0.5% |
| 13:45 | U.S. | Chicago Purchasing Managers' Index | July | 36.6 | 43.9 |
| 14:00 | U.S. | Reuters/Michigan Consumer Sentiment Index | July | 78.1 | 73 |
| 17:00 | U.S. | Baker Hughes Oil Rig Count | July | 181 |
According to ActionForex, analysts at RBC Financial Group note that the drop in economic activity in Q2 was already widely known to have been unprecedented.
"The 33% (annualized) drop in GDP in the quarter was close to expectations but was still alone more than twice the total 6-quarter peak-to-trough drop in the 2008/09 recession. Weakness was widespread with households and businesses pulling back as containment measures kept workers (and spenders) at home across broad swaths of the economy. That meant that even spending that is normally resilient in an economic downturn was exceptionally soft. The (record) 35% drop in consumer spending in Q2 was led by a whopping 63% (annualized) drop in health-care spending as non-COVID services shut down."
"The Q2 weakness was related to containment measures and consumer fear of going out rather than a drop in household purchasing power. Indeed, household disposable incomes surged 42% in Q2, and the saving rate spiked to 25.7% on average, as unprecedented government income supports helped to offset unprecedented wage losses."
"Easing virus containment measures over May and June meant that household spending was likely significantly stronger at the end of the quarter than at the beginning. We expect tomorrow’s monthly spending report will show consumers purchased about 3% less goods and services than a year ago in June, still not good but significantly better than the 16% year-over-year drop in April. Still, business spending has, to-date, been slower to bounce back. The US Federal Reserve will keep interest rates low for the foreseeable future. But it remains unclear that further significant fiscal stimulus can work its way through congress, and that has left downside risks for near-term household incomes if additional support measures cannot be approved."
"The resurgence of virus spread in much of the United States will stunt the pace of the near-term economic rebound, and is a reminder that there are limits to the extent that the economy can rebound to a ‘new normal’ in the absence of a vaccine or more effective treatments. Initial jobless claims have ticked higher over the last two weeks and are still at historically unprecedented levels. We continue to expect GDP will remain sharply below year-ago levels (-5%), and the unemployment rate elevated, at the end of this year."
- "We see the Chinese Communist Party for what it is: the central threat of our times"
- Says other countries are supporting U.S. initiatives like push not to use Huawei Technologies Co. equipment in 5G networks and stepped-up maritime maneuvers in the South China Sea
- "Our vigorous diplomacy has helped lead an international awakening to the threat of the CCP. Senators, the tide is turning"
- Notes difficulty of forming an international alliance, given China’s economic strength
James Knightley, Chief International Economist at ING, notes that U.S. GDP declined at an annualised rate of 32.9% in 2Q 2020, not quite as bad as feared (consensus -34.5%), but this is still the biggest decline on record.
"For those who prefer non-annualised numbers, it was a 9.5% quarter-on-quarter drop. The details show that consumer spending was the main drag, falling 34.6% annualised, while fixed investment fell by 29.9%, led by a 38.7% plunge in residential investment. Inventory drawdowns meant this component subtracted 4 percentage points from headline GDP. On the positive side, government spending rose 2.7%, while net exports were a net positive contributor, adding a rather paltry 0.7 percentage points to headline GDP."
"When combined with the 5% annualised fall in 1Q GDP it means the US economy contracted 10.6% peak-to-trough in the first half of the year. The true decline between mid-March and the end of April when the lockdowns were at their most intense was likely much greater, possible even double the 10.6% figure, given evidence of a sharp bounce-back in consumer activity through May and June."
"So we now know how deep the deepest ever contraction in US economic activity was, but this is old news given financial markets are priced for a very vigorous recovery. However, Covid-19 is far from beaten and while there is optimism about a vaccine, the timing and its efficacy are still unknown."
"Meanwhile, a renewed spike in cases is forcing state Governors to backtrack on reopening plans, which is closing businesses, with workers losing their jobs. At the same time, the US$600 a week unemployment benefit boost to 30 million plus claimants has effectively ended and will likely be replaced with something much smaller in size."
"With virus fears on the rise, jobs being lost and incomes squeezed, we feel the recovery could be much bumpier than markets seemingly do, and think we are in for some data disappointment over the next couple of months – starting with next week’s payrolls number."
U.S. stock-index futures fell on Thursday, as investors digested poor macro data and awaited Big Tech’s earnings reports after the bell.
Global Stocks:
Index/commodity | Last | Today's Change, points | Today's Change, % |
Nikkei | 22,339.23 | -57.88 | -0.26% |
Hang Seng | 24,710.59 | -172.55 | -0.69% |
Shanghai | 3,286.82 | -7.73 | -0.23% |
S&P/ASX | 6,051.10 | +44.70 | +0.74% |
FTSE | 6,023.57 | -107.89 | -1.76% |
CAC | 4,887.51 | -71.23 | -1.44% |
DAX | 12,488.64 | -333.62 | -2.60% |
Crude oil | $40.55 | -1.74% | |
Gold | $1,941.60 | -0.60% |
FXStreet notes that sentiment towards the USD has deteriorated sharply in recent weeks as fiscal commitment is questioned. On the other side of the pond, EU fiscal intervention buys the euro some time, economists at ANZ Bank apprise. EUR/USD recorded tops in levels last seen in May 2018 just beyond 1.18 the figure on Wednesday and is set to retain the upside bias.
“Failure by Congress to agree the next phase of the fiscal stimulus before supplementary unemployment benefits expired, a loss of momentum in high-frequency activity indicators and an easing bias at the Fed are weighing on the currency. Fed funds are not expected to rise until 2025, cementing expectations of lasting yield erosion whilst futures contracts are flirting with the idea of negative policy rates from mid-next year.”
“The surge in demand for gold and simmering US-China geopolitical tensions have also detracted from the USD’s safe-haven status.”
“The EU has agreed a EUR 672.5 billion Recovery and Resilience Fund (RRF), equivalent to 4.8% of nominal GDP. The weighting of the package towards fiscally weaker EU countries coupled with the ECB’s pandemic bond purchases has shelved EA crisis risks. That policy intervention is welcome, is seen in a rising appetite for EUR.”
(company / ticker / price / change ($/%) / volume)
3M Co | MMM | 154.51 | -1.74(-1.11%) | 4441 |
ALCOA INC. | AA | 12.97 | -0.21(-1.59%) | 6699 |
ALTRIA GROUP INC. | MO | 41.6 | -0.03(-0.07%) | 4539 |
Amazon.com Inc., NASDAQ | AMZN | 3,021.00 | -12.53(-0.41%) | 56263 |
American Express Co | AXP | 95.25 | -1.44(-1.49%) | 3988 |
AMERICAN INTERNATIONAL GROUP | AIG | 32.15 | -0.52(-1.59%) | 5757 |
Apple Inc. | AAPL | 376.75 | -3.41(-0.90%) | 363615 |
AT&T Inc | T | 29.41 | -0.15(-0.51%) | 48545 |
Boeing Co | BA | 163.52 | -2.49(-1.50%) | 202888 |
Caterpillar Inc | CAT | 138.95 | -1.58(-1.12%) | 3592 |
Chevron Corp | CVX | 88.94 | -1.13(-1.25%) | 12761 |
Cisco Systems Inc | CSCO | 45.85 | -0.86(-1.84%) | 101458 |
Citigroup Inc., NYSE | C | 51.49 | -1.03(-1.96%) | 58060 |
Deere & Company, NYSE | DE | 178.5 | -1.75(-0.97%) | 3585 |
E. I. du Pont de Nemours and Co | DD | 54.99 | -0.23(-0.42%) | 5393 |
Exxon Mobil Corp | XOM | 43.48 | -0.55(-1.25%) | 52018 |
Facebook, Inc. | FB | 231.1 | -2.19(-0.94%) | 115617 |
FedEx Corporation, NYSE | FDX | 176.49 | 6.94(4.09%) | 103635 |
Ford Motor Co. | F | 6.81 | -0.11(-1.59%) | 441722 |
Freeport-McMoRan Copper & Gold Inc., NYSE | FCX | 13.09 | -0.21(-1.58%) | 42881 |
General Electric Co | GE | 6.52 | -0.07(-1.06%) | 933798 |
General Motors Company, NYSE | GM | 25.45 | -0.44(-1.70%) | 73709 |
Goldman Sachs | GS | 199.91 | -2.67(-1.32%) | 22094 |
Google Inc. | GOOG | 1,509.00 | -13.02(-0.86%) | 10977 |
Hewlett-Packard Co. | HPQ | 16.91 | -0.17(-1.00%) | 14766 |
Home Depot Inc | HD | 262.72 | -1.94(-0.73%) | 4151 |
HONEYWELL INTERNATIONAL INC. | HON | 152.07 | -2.51(-1.62%) | 335 |
Intel Corp | INTC | 47.53 | -0.54(-1.12%) | 411096 |
International Business Machines Co... | IBM | 124.25 | -1.07(-0.85%) | 6026 |
International Paper Company | IP | 38 | 1.25(3.40%) | 21876 |
Johnson & Johnson | JNJ | 149.4 | 2.86(1.95%) | 87669 |
JPMorgan Chase and Co | JPM | 98.13 | -1.55(-1.56%) | 98737 |
McDonald's Corp | MCD | 194.3 | -1.91(-0.97%) | 7728 |
Merck & Co Inc | MRK | 79.02 | -0.33(-0.42%) | 25823 |
Microsoft Corp | MSFT | 201.35 | -2.71(-1.33%) | 281603 |
Nike | NKE | 96.06 | -0.91(-0.94%) | 4634 |
Pfizer Inc | PFE | 38.71 | -0.17(-0.44%) | 134371 |
Procter & Gamble Co | PG | 130.3 | 1.99(1.55%) | 151482 |
Starbucks Corporation, NASDAQ | SBUX | 76.82 | -0.60(-0.78%) | 24845 |
Tesla Motors, Inc., NASDAQ | TSLA | 1,490.00 | -9.11(-0.61%) | 109504 |
The Coca-Cola Co | KO | 47.6 | -0.42(-0.87%) | 12528 |
Travelers Companies Inc | TRV | 115.36 | -1.49(-1.28%) | 514 |
Twitter, Inc., NYSE | TWTR | 36.7 | -0.46(-1.24%) | 14943 |
UnitedHealth Group Inc | UNH | 302 | -4.68(-1.53%) | 983 |
Verizon Communications Inc | VZ | 57.15 | -0.30(-0.52%) | 5557 |
Visa | V | 197.03 | -1.55(-0.78%) | 12503 |
Wal-Mart Stores Inc | WMT | 130.04 | -0.65(-0.50%) | 14255 |
Walt Disney Co | DIS | 114.9 | -0.71(-0.61%) | 40204 |
Yandex N.V., NASDAQ | YNDX | 56.26 | -1.35(-2.34%) | 9174 |
Walmart (WMT) initiated with a Neutral at MKM Partners; target $147
The Commerce
Department released on Thursday its "advance" estimate for the U.S.
gross domestic product (GDP) for the second quarter of 2020, which revealed the
U.S. economy shrank less than forecast in the reviewed period.
According to
the estimate, the U.S. real GDP declined at an annual rate of 32.9 percent
q-o-q last quarter, following a 5.0 percent q-o-q contraction in the first
quarter of 2020, reflecting the response to COVID-19, as
"stay-at-home" orders issued in March and April were partially lifted
in some areas of the country in May and June, and government pandemic
assistance payments were distributed to households and businesses. That marked
the steepest pace of contraction in GDP on record.
Economists had
expected GDP to plunge by 34.1 percent.
According to
the report, the decline in real GDP in the second quarter reflected decreases
in personal consumption expenditures (PCE), exports, private inventory investment,
nonresidential fixed investment, residential fixed investment, and state and
local government spending, which were partly offset by an increase in federal government
spending. Meanwhile, imports, which are a subtraction in the calculation of
GDP, fell.
The data from
the Labor Department revealed on Thursday the number of applications for
unemployment was roughly in line with expectations last week as the U.S. continues
to grapple with the economic impacts of the coronavirus pandemic.
According to
the report, the initial claims for unemployment benefits totaled 1,434,000 for
the week ended July 25. That brought the number of job losses over the past
nineteen weeks (since the U.S. went into coronavirus lockdown in mid-March) to more
than 54.1 million.
Economists had
expected 1,450,000 new claims last week.
Claims for the
prior week were revised upwardly to 1,422,000 from the initial estimate of 1,416,000.
Meanwhile, the
four-week moving average of claims rose to 1,368,500 from an upwardly revised
1,362,000 in the previous week.
Continuing
claims increased to 17,018,000 million from a downwardly revised 16,151,000 in
the previous week.
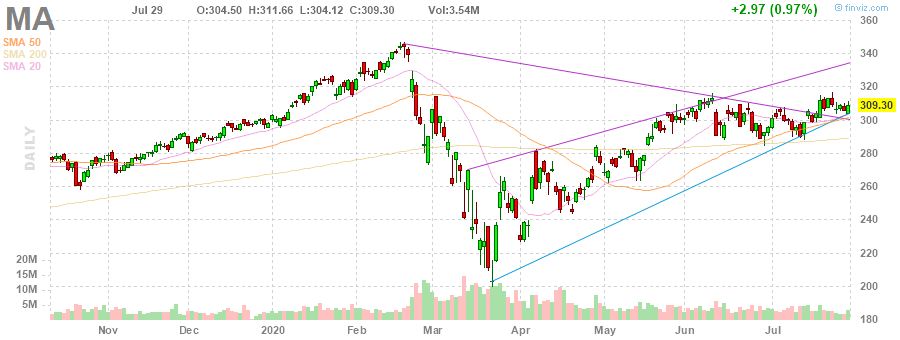
MasterCard (MA) reported Q2 FY 2020 earnings of $1.36 per share (versus $1.89 per share in Q2 FY 2019), beating analysts’ consensus estimate of $1.18 per share.
The company’s quarterly revenues amounted to $3.300 bln (-19.8% y/y), beating analysts’ consensus estimate of $3.259 bln.
MA rose to $313.00 (+1.20%) in pre-market trading.
Germany's
Federal Statistical Office (Destatis) reported on Thursday the country’s
consumer price index (CPI) is expected to decrease 0.5 m-o-m in July after increasing
0.6 percent m-o-m in the previous month. This represents the biggest monthly decline since January.
On the y-o-y
basis, Germany’s inflation rate is seen to edge down 0.1 percent this month,
following a 0.9 percent advance in June.
Economists had
predicted inflation would drop 0.2 percent m-o-m but increase 0.2 percent y-o-y
in July.
According to
the report, food price growth decelerated to 1.2 percent y-o-y in July from 4.4
percent y-o-y in June, while energy prices fell 6.7 percent y-o-y after a 6.2 percent
y-o-y drop in the previous month. Services costs rose 1.2 percent y-o-y in July,
following a 1.4 percent y-o-y gain as in June.
Meanwhile, the
harmonized index of consumer prices for Germany (HICP), which is calculated for
European purposes, is expected to fall 0.5 percent m-o-m and to be flat y-o-y.
| Time | Country | Event | Period | Previous value | Forecast | Actual |
|---|---|---|---|---|---|---|
| 07:00 | Switzerland | KOF Leading Indicator | July | 60.6 | 75 | 85.7 |
| 07:55 | Germany | Unemployment Change | July | 68 | 43 | -18 |
| 07:55 | Germany | Unemployment Rate s.a. | July | 6.4% | 6.5% | 6.4% |
| 08:00 | Eurozone | ECB Economic Bulletin | ||||
| 08:00 | Germany | GDP (YoY) | Quarter II | -2.3% | -11.3% | -11.7% |
| 08:00 | Germany | GDP (QoQ) | Quarter II | -2.0% | -9% | -10.1% |
| 09:00 | Eurozone | Industrial confidence | July | -21.6 | -17 | -16.2 |
| 09:00 | Eurozone | Consumer Confidence | July | -14.7 | -15 | -15 |
| 09:00 | Eurozone | Economic sentiment index | July | 75.8 | 81 | 82.3 |
| 09:00 | Eurozone | Unemployment Rate | June | 7.7% | 7.7% | 7.8% |
| 12:00 | Germany | CPI, m/m | July | 0.6% | -0.2% | -0.5% |
| 12:00 | Germany | CPI, y/y | July | 0.9% | 0.2% | -0.1% |
EUR fell against most major currencies in the European session on Thursday, as Germany's Q2 GDP data revealed a record decline in output of Europe's largest economy, disappointing market participants. EUR retreated against USD, GBP, CHF and JPY, but was higher against AUD, CAD and NZD.
Destatis reported that its preliminary estimate showed that Germany's GDP declined 10.1 percent q/q in the second quarter of 2020 after dropping 2 percent q/q in the first quarter. This was the largest decrease since the records began in 1970. Economists had forecast a slump of 9 percent q/q. Steep falls were recorded for exports and imports of goods and services as well as for household consumption and capital formation in machinery and equipment. General government, however, raised its spending in efforts to support the economy amid the coronacrisis. In y/y terms, the country's GDP plunged 11.7 percent in the second quarter versus economists' forecast for a decline of 11.3 percent.
Federal Employment Agency, in its turn, reported that Germany's unemployment decreased by 18,000 to 2.923 million in July, while economists had forecast an increase of 43,000. This was the first drop since February. At the same time, the jobless rate remained at 6.4 percent (the highest since August 2015) versus economists' forecast for a rate of 6.5 percent.
FXStreet reports that economists at Credit Suisse note that Euro Stoxx 50 has fallen sharply, near 2% down on a day to 3237, with support seen at the 63-day average and the important end of June low at 3170/50, which if broken would trigger a top.
“Euro Stoxx remains capped by its 200-day average, currently seen at 3349, and has fallen sharply below 3277 in today’s open, which keeps the immediate risk lower within this range, with support seen next at 3241, ahead of the 63-day average and the important end of June low at 3170/50. Despite the current weakness, only a close below here would be seen raising the prospect of a more important turn lower.”
“Resistance is seen at 3281 initially, with the immediate risk seen lower in the range whilst below 3311/17. Only a close back above the 200-day average at 3349 though would be seen reasserting an upward bias with resistance then seen next at 3380, then 3401.”
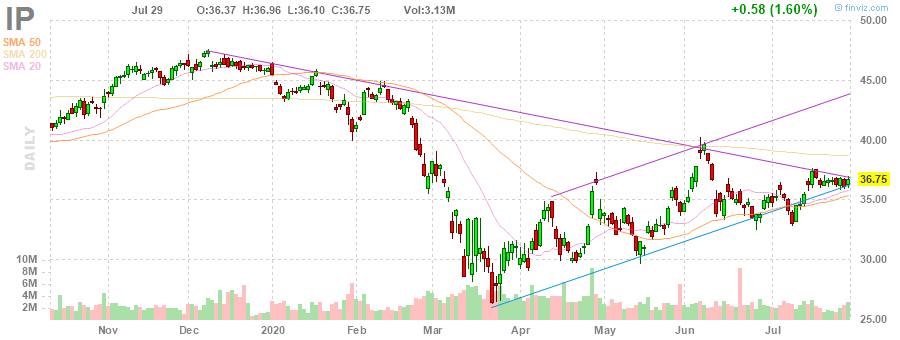
Int'l Paper (IP) reported Q2 FY 2020 earnings of $0.77 per share (versus $1.15 per share in Q2 FY 2019), beating analysts’ consensus estimate of $0.39 per share.
The company’s quarterly revenues amounted to $4.866 bln (-14.1% y/y), missing analysts’ consensus estimate of $4.974 bln.
IP rose to $37.70 (+2.59%) in pre-market trading.
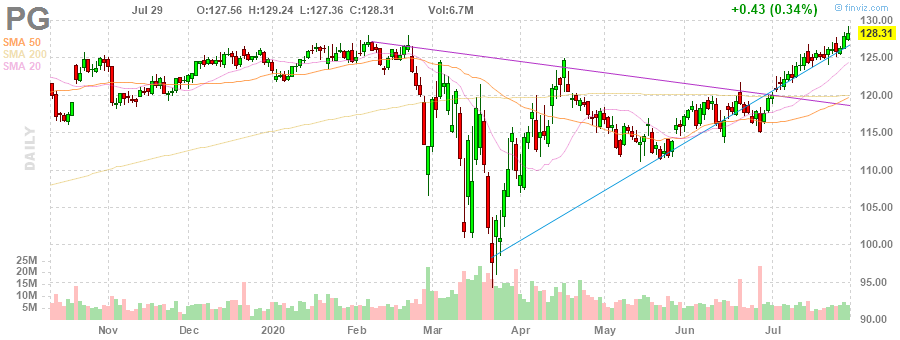
Procter & Gamble (PG) reported Q4 FY 2020 earnings of $1.16 per share (versus $1.10 per share in Q4 FY 2019), beating analysts’ consensus estimate of $1.01 per share.
The company’s quarterly revenues amounted to $17.698 bln (+3.5% y/y), beating analysts’ consensus estimate of $16.974 bln.
The company also issued guidance for FY 2021, projecting EPS of +3-7% (implying $5.27-5.48) versus analysts’ consensus estimate of $5.23 and revenues of +1-3% (implying $71.66-73.08 bln) versus analysts’ consensus estimate of $71.68 bln.
PG rose to $131.00 (+2.10%) in pre-market trading.
FXStreet reports that gold has seen its expected move to new record highs and strategists at Credit Suisse are starting to see signs of temporary overextension. Therefore, they expect the yellow metal to experience a consolidation phase before resuming the uptrend towards the $2000 psychological mark.
“Gold strength has accelerated dramatically again and we have now seen the long-looked for move to a new record high above $1921. With near-term signs of overextension now showing a pullback/consolidation should clearly be allowed for after such a strong and headline-grabbing move.”
“Our bias remains though to view weakness as corrective only and we maintain our core bullish bias with resistance then seen next at the psychological $2000 barrier, before what we see as its next tougher resistance test at Fibonacci projection resistance at $2075/80. Whilst our bias would be to look for a consolidation phase to unfold from here, a direct break can see resistance at $2175/80 next, then $2295/2300.”
“Support for a pullback is seen at $1804/1796, then $1765, with $1671 ideally holding.”
- Monetary policy should be more flexible, appropriate
- To keep reasonable growth in money supply and aggregate financing
- Chinese economy still faces relatively big uncertainties
- Current economic situation is still complex and severe
FXStreet reports that according to economists at Credit Suisse, the S&P 500 is expected for now to be capped at the top of its February “pandemic” gap at 3328/38. At the same time, the VIX continues to hold key support and is set for a fresh rise.
“While support at 3198 holds though the immediate bias can stay higher for now for a test on the top of the February gap at 3328/38. We continue though to look for this to remain tough resistance for now for lengthier consolidation. However, a break in due course should clear the way for a challenge on the 3394 record high.”
“Below 3198 can mark a minor top to reinforce the likelihood for further range-trading with support then seen back at 3128/16, which we would look to hold. A break though can see a retest of support from the 200-day average, currently seen at 3046, but with only a close back below here seen raising the risk we are seeing the construction of a potentially important top.”
“The VIX continues to (just) hold key support from the top of its 2019 range at 24.81/23.54 and we look for a fresh attempt to set a near-term base above 28.58, for a rise back to 33.67 initially. A close below 23.54 though would be seen opening the door to more ‘normal’ conditions with support seen at 20 next.”
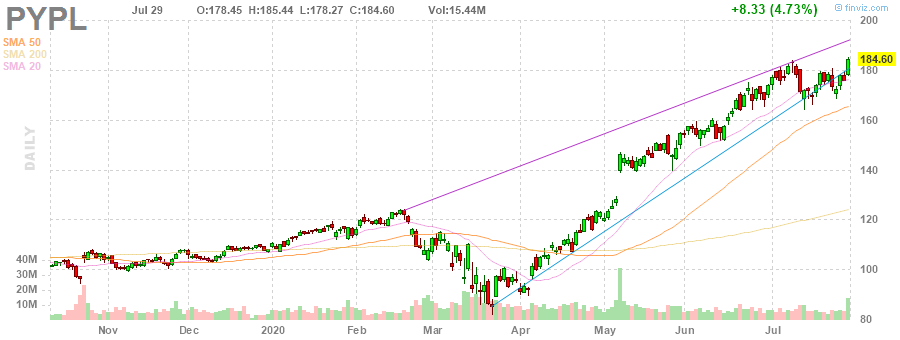
PayPal (PYPL) reported Q2 FY 2020 earnings of $1.07 per share (versus $0.86 per share in Q2 FY 2019), beating analysts’ consensus estimate of $0.88 per share.
The company’s quarterly revenues amounted to $5.260 bln (+22.0% y/y), beating analysts’ consensus estimate of $4.994 bln.
The company issued upside guidance for Q3 FY 2020, projecting revenues growth of ~23% (25% on FX neutral basis), equating to revenue of approximately $5.385 bln versus analysts’ consensus estimate of $5.06 bln.
For FY 2020, it guided EPS growth of ~25%, equating to $3.88 versus analysts’ consensus estimate of $3.39 and revenues growth of ~17% (~19% on FX neutral basis), equating to revenue of approximately $20.79 bln versus analysts’ consensus estimate of $20.37 bln.
PYPL rose to $189.90 (+2.87%) in pre-market trading.
FXStreet notes that the pace of recovery over the next 18 months will define the US economic outlook over the next 3-5 years. Morgan Stanley outlines four scenarios for life after COVID.
“Base Case: Navigating a New Normal. A vaccine arrives in the spring of 2021, following a second wave of rising infection rates and business tightening in the fall of 2020. Real GDP returns to pre-COVID levels by the end of 2021 but with subdued near-term productivity growth, lower capital expenditures from businesses and higher unemployment levels through 2025. In this case, consumers could remain cautious with wallets, resulting in an elevated savings rate of 10% and subdued spending habits. One area where spending could pick up is housing.”
“Base Case +: Getting Back to Normal. A slightly more positive scenario, compared to the base case, assumes a viable vaccine in the spring of 2021 but without a severe outbreak in the fall and, consequently, less risk aversion among consumers and businesses. Productivity would pick up and help bring GDP growth closer to 2%, enabling growth to resume pre-COVID levels by 2025.”
“Bull Case: Riding a Robust Recovery. A vaccine arrives well before the spring of 2021, and low-risk aversion among consumers and businesses brings a swift return to life as normal. All told, life after COVID wouldn’t be materially different than before the pandemic. Bull-case outlook pegs average GDP growth at 2.4% through 2025. This optimistic outlook has unemployment levels falling back to 3.5%, saving levels drifting down to 7.3% and inflation rising 2.5%. Notably, this scenario could double productivity growth to as high as 2%, thanks to greater workforce engagement and technology improvements.”
“Bear Case: Dealing with Deep Scars. No vaccine for two to five years. This results in a crisis of consumer confidence, a surge in savings, structurally higher unemployment and lasting economic damage. Should more unemployment become permanent, rather than temporary, the effects on the labor market can be significant over time.”
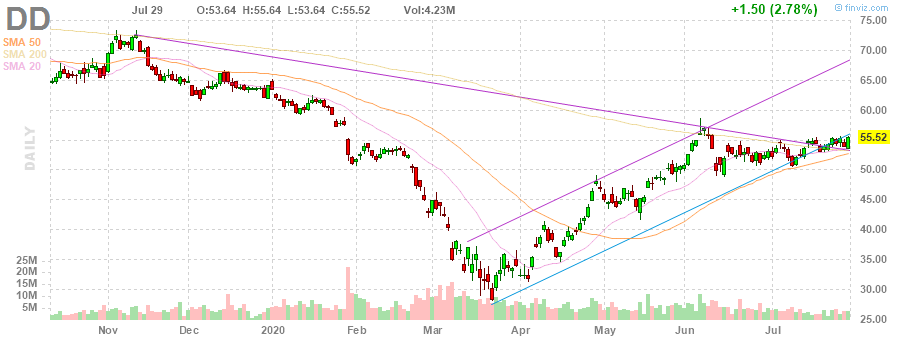
DuPont (DD) reported Q2 FY 2020 earnings of $0.70 per share (versus $0.97 per share in Q2 FY 2019), beating analysts’ consensus estimate of $0.58 per share.
The company’s quarterly revenues amounted to $4.828 bln (-11.7% y/y), beating analysts’ consensus estimate of $4.711 bln.
DD stood at $55.22 (0.0%) in pre-market trading.
The company also issued guidance for Q3 FY 2020, projecting EPS of $0.71-0.73 versus analysts’ consensus estimate of $0.71 and revenues slightly up sequentially versus analysts’ consensus estimate of $5.01 bln.
FXStreet reports that in an interview with Kitco News Mike McGlone, Senior Commodity Strategist at Bloomberg Intelligence, said that the gold is not yet overvalued fundamentally and that there is more room for the upside heading into the US Presidential elections due this November.
“Recommend investors look to buy gold on dips as the price could continue to hover around $2,000 through the U.S. November elections.”
"In the short term, we have gold about 21% above its 52-week mean, that's the most since the peak in 2011. You don't want to be the first buyer at these levels. Anytime gold gets this high above its 52-week average, you got to expect consolidation."
“Gold will need to get “stupidly” expensive before this rally ends and that could mean prices above $4,000 an ounce.”
"Basically, after 2008, gold dropped around $700 and then it rallied around three times to the peak in 2011. So just a simple rhyme of history means we get to near $4,500 and it's about time. You just have to look at debt to GDP, look at central bank balance sheets, and they're just on an upward trajectory."
"Investors should continue to watch equity markets. With bonds providing investors with no yield, a bear market in equities would drive gold's safe-haven appeal, he said.
"Now the rock is beating stocks. There's a sense in the market that the bull market in stocks is over… and gold should take off. That, to me, is the next big trade."
FXStreet reports that Fed's meeting does little to change the collective FX market psychology and the weak USD mantra remains firmly in place. Economists at TD Securities prefer to focus on pairs that have lagged the weak USD move, therefore, they remain focused on USD/JPY downside.
“The inclusion of a virus-dependent outlook is notable. This introduces an element of uncertainty around the USD, that is not kind to the reserve currency given that COVID cases are ravaging across the US. If anything, today's Fed meeting will only reinforce that weak USD outlook mantra that has taken hold of market psychology. We prefer to focus this in pairs where this is less advanced. Here, USD/JPY looks poised to slide further.”
“The break of the 106 pivot is significant and only adds to the risk/reward appeal of adding to longs. The recent push through multi-year horizontal support in USD/CHF may add to further downside pressure in USD/JPY. There, 104.50/60 will be key support ahead of the more significant 104 psychological support.”
CNBC reports that governments need to “spend an awful lot of of money” to protect their economies as global authorities seek to revive growth amid the coronavirus pandemic. That’s according to Rob Carnell, chief economist and head of research for Asia Pacific at ING.
“What’s needed is huge amounts of spending,” Carnell told CNBC. “You’ve got an economic potential in your economy which could get wiped out if you don’t, you know, protect it.”
Carnell said it was a fiscal issue rather than a monetary problem, and advised governments to “spend the money now.”
“Don’t worry about what the ratings agencies are gonna do because it’s not gonna be an issue if you got no economy left once a vaccine — if a vaccine comes through and we start to move back to normal — and all your business has gone bust and everybody’s unemployed,” he said.
However, he acknowledged that there are limitations and fiscal policy — which may include government spending or taxation — could become a “problem.”
“Unless you keep on spending at exactly the same pace ... it delivers contraction,” he said.
Using the U.S. as an example, where lawmakers are currently debating over plans for more coronavirus relief, Carnell argued that the fiscal support was a “contraction” rather than “stimulus.” The Republican coronavirus relief bill unveiled Monday included plans to cut the enhanced unemployment benefits from $600 to $200 per week, on top of what recipients get from states.
“We know .. the stimulus programs, the amounts of money that are going to be offered to furloughed, unemployed workers, and the supplementary unemployment benefit schemes are gonna be lower than before,” he said. “You’re saying to these people: ‘Okay we might give you some more money but you’re basically gonna need to take a pay cut.’”
“That’s not really stimulus,” Carnell said. “In the language that I use ... that’s contraction.”
Governments need to be “prepared to keep on spending” once they start, or risk facing such problems, he added.
According to the report from European Commission, In July 2020, the recovery of the Economic Sentiment Indicator (ESI) continued. Registering a sharp increase in the euro area (+6.5 points up to 82.3) and the EU (+6.9 points up to 81.8),1 the ESI in both regions has so far recovered around half of the combined losses of March and April. Also the Employment Expectations Indicator (EEI) improved markedly for the third month in a row (by 4.0 points to 87.0 in the euro area and by 4.1 points to 87.0 in the EU).
In the euro area, the ESI’s recovery was driven by sharp confidence increases in industry, services, and retail trade. By contrast, confidence worsened slightly in construction and remained broadly stable among consumers.
From a country perspective, the ESI continued to recover in all the largest euro-area economies, namely in Spain (+7.5), Italy (+6.7), Germany (+6.5), the Netherlands (+5.3), and France (+4.8). All in all, in these countries, between 40 and 60% of confidence losses suffered during the lockdown were recovered.
According to the report from Eurostat, in June 2020, the month when COVID-19 containment measures started being phased out in most Member States, the euro area seasonally-adjusted unemployment rate was 7.8%, up from 7.7% in May 2020. Unemployment was expected to remain at 7.7%. The EU unemployment rate was 7.1% in June 2020, up from 7.0% in May 2020.
Eurostat estimates that 15.023 million men and women in the EU, of whom 12.685 million in the euro area, were unemployed in June 2020. Compared with May 2020, the number of persons unemployed increased by 281 000 in the EU and by 203 000 in the euro area.
In June 2020, 2.962 million young persons (under 25) were unemployed in the EU, of whom 2.360 million were in the euro area. In June 2020, the youth unemployment rate was 16.8% in the EU and 17.0% in the euro area, up from 16.2% and 16.5% respectively in the previous month. Compared with May 2020, youth unemployment increased by 124 000 in the EU and by 80 000 in the euro area.
In June 2020, the unemployment rate for women was 7.5% in the EU, up from 7.3% in May 2020. The unemployment rate for men was 6.7% in June 2020, up from 6.6% in May 2020. In the euro area, the unemployment rate for women increased from 8.1% in May 2020 to 8.3% in June 2020 while it increased from 7.3% to 7.4% for men.
FXStreet reports that there is still room for USD/CNH to re-visit the 6.9645 level in the short-term horizon, noted FX Strategists at UOB Group.
24-hour view: “USD traded between 6.9950 and 7.0095 yesterday, narrower than our expected sideway-trading range of 6.9930/7.0140 before closing slightly lower at 6.9980 (-0.11%). The underlying tone has weakened somewhat and the bias for today is for a lower USD. That said, any weakness is likely limited to a test of 6.9820. Resistance is at 7.0050 followed by 7.0100.”
Next 1-3 weeks: “Our latest narrative was from last Thursday (23 Jul, spot at 7.0155) wherein USD ‘is in a corrective rebound but any advance is expected to face solid resistance at 7.0400’. USD subsequently popped to a high of 7.0301 but has since eased off. For now, there is no change in our view but the underlying tone has softened and from here, a break of 6.9750 would indicate that the correction phase has ended. To look at it another way, a breach of 6.9750 would increase the risk of USD moving below the month-to-date low at 6.9645. For now, the prospect for such a move is not high but it would continue to increase as long as USD does not move above 7.0300 within these few days.”
Reuters reports that China's trade environment is still beset by severe challenges as external uncertainties rise, the commerce ministry said on Thursday.
China will roll out new policies to support trade, ministry spokesman Gao Feng told reporters during an online briefing.
He said the government will utilise export credit insurance policies to fend off risks related to export orders and expand export credit support to small and micro trade companies.
According to the report from Federal Statistical Office (Destatis), the gross domestic product (GDP) fell a price-, seasonally and calendar-adjusted 10.1% on the first quarter of 2020. Economists had expected a 9.0% decrease. This was the largest decline since the beginning of quarterly GDP calculations for Germany in 1970. It was much larger than during the financial market and economic crisis (-4.7% in first quarter of 2009). Destatis also reports that in the second quarter of 2020 a massive slump was recorded for exports and imports of goods and services as well as for household final consumption expenditure and capital formation in machinery and equipment. General government, however, raised its final consumption expenditure during the crisis.
The German economy slumped also in a year-on-year comparison. The GDP in the second quarter of 2020 was down a price-adjusted 11.7% (also calendar-adjusted) on a year earlier. Again, such large decreases had not been observed even during the financial market and economic crisis of 2008/2009. The largest decrease on the same quarter of the preceding year had been recorded in the second quarter of 2009 (-7.9%).
In addition to calculating first data for the second quarter of 2020, the Federal Statistical Office reviewed the results published earlier and included new statistical information in the calculations (as from 2015), as usual. This resulted in changes of up to 0.4 percentage points of the gross domestic product data published so far.
FXStreet reports that following almost 6-weeks of sideways movement, the AUD/USD market broke through resistance levels around 0.7070-80 (highs of July 2019) and climbed higher. Patrick Bennett from CIBC Capital Markets forecasts the aussie trading at 0.70 and 0.72 by the third and fourth quarter respectively.
“The driver for gains has been a combination of upbeat messaging from the RBA, demand for Australian bonds by Japanese investors, broad global risk appetite underpinned by policy support and a related weaker USD environment. Considering those positive factors, it is not difficult to anticipate further gains from present levels. We have therefore revised our forecasts higher.”
“Still, the escalation in virus cases in the state of Victoria, and lurking tension between Australia and China, are risks to the outlook. Our medium-term view is to be buyers of weakness in the AUD, not to chase the market higher from already rich levels.”
| Time | Country | Event | Period | Previous value | Forecast | Actual |
|---|---|---|---|---|---|---|
| 01:00 | New Zealand | ANZ Business Confidence | July | -34.4 | -31.8 | |
| 01:30 | Australia | Export Price Index, q/q | Quarter II | 2.7% | -2.4% | |
| 01:30 | Australia | Import Price Index, q/q | Quarter II | -1% | -1.9% | |
| 01:30 | Australia | Building Permits, m/m | June | -15.8% | 1.5% | -4.9% |
| 07:00 | Switzerland | KOF Leading Indicator | July | 60.6 | 75 | 85.7 |
The US dollar is strengthening against the euro, yen and other world currencies after falling the day before on the back of very soft statements from the Federal reserve system (Fed).
Despite the fact that the Federal reserve has not announced new policy easing measures, the warning of Central Bank Governor Jerome Powell that the outlook for the US economy has deteriorated due to the increase in the incidence of COVID-19, as well as the statement that the Fed is ready to maintain the current stimulus policy for a long time, indicate a "dovish" attitude of the Central Bank.
Fed kept the interest rate in the range of 0% to 0.25% per annum at the end of the meeting on July 28-29, and also promised to continue buying assets "at least at the same pace", that is, US Treasuries worth at least $80 billion a month and mortgage bonds worth $40 billion a month.
Some experts expect the dollar to strengthen, noting that some technical indicators indicate the possibility of the us currency leaving the oversold territory.
The ICE index, which tracks the dynamics of the us dollar against six currencies (euro, swiss franc, yen, canadian dollar, pound sterling and swedish krona), rose 0.1% from the beginning of the session.
According to the report from KOF Economic Research Agency, economic Barometer rises strongly in July for the second month in a row. This is the strongest monthly upward movement that the barometer has ever shown. However, the downward move in April was even more pronounced. The economic prospects for the Swiss economy therefore remain subdued.
The KOF Economic Barometer shows an extraordinarily strong increase of 25.1 points in July. From 60.6 (revised from 59.4) points in June, the barometer rose to 85.7 points. Despite this positive development, the value remains clearly below its long-term average. Responsible for the current easing are primarily the indicator groups for the manufacturing sector, the other services sector and foreign demand. To a lesser extent, the indicators for private consumption, construction activity and the financial and insurance services sector are contributing to the improvement. Only the accommodation and food service activities cannot follow the broad positive development.
In the manufacturing sector, the outlook is brightening in all segments. The improvement is particularly pronounced in the metal industry, the electrical industry, the wood, glass, stone and earths industry, mechanical engineering and the chemical, pharmaceutical and plastics industry. With the exception of the wood industry, the development in these industries is likely to remain below average in a longer-term comparison.
In the goods producing sector (manufacturing and construction), the indicators for the business situation and for the further development of new orders and production activity are more favourable than before. However, also other aspects, such as employment or export prospects and the competitive position, are no longer as negative as in recent months.
FXStreet reports that a test of the 0.7200 region appears to be losing momentum in NZD/USD, noted FX Strategists at UOB Group.
24-hour view: “Our expectation for NZD ‘to retest the 0.6700’ level did not materialize as it traded in a relatively quiet manner between 0.6642 and 0.6678. The price action offers no fresh clues and NZD could trade sideways for today, likely between 0.6635 and 0.6680.”
Next 1-3 weeks: “We highlighted on Tuesday (28 Jul, spot at 0.6685) that ‘a break of 0.6700 would shift the focus to 0.6755’. NZD subsequently edged to a high of 0.6702 and has not been able to make much headway on the upside. Momentum has deteriorated and the odds for further NZD strength have diminished. From here, a breach of 0.6600 (no change in ‘strong support’ level) would indicate the current mild upward pressure has eased. Only an unlikely daily closing above 0.6700 would indicate that NZD is ready to move higher in a sustained manner.”
According to the report from Society of Motor Manufacturers and Traders (SMMT), UK car production declined -48.2% in June with 56,594 units made. Although post-shutdown production slowly ramped up in the month, strict social distancing measures and weak demand across global markets continued to restrict output.
June manufacturing for the domestic market was down by -63.8%, reflecting the gradual easing of the UK’s retail lockdown.1 Production for export also fell, by a substantial -45.0%, although overseas orders accounted for nine out of 10 vehicles built as key global markets, including in the EU, China, US, South Korea and Japan, opened for business earlier than the UK.
While June marked a vast improvement on April and May, when only a combined 5,511 cars were built, the performance rounded off the worst first six months for UK car production since 1954. Just 381,357 cars have been built since January, a decline of -42.8% and representing a loss of 285,164 units.
As a consequence of the crisis, at least 11,349 job cuts have already been announced across the industry, including manufacturing, supply chain and retail. Furthermore, new analysis suggests car production losses could total 1.46 million units by 2025 – worth just over £40 billion – if no FTA is in place by the end of 2020, forcing the sector to trade on WTO terms with full tariffs applied.
Significant questions remain about the nature of trading conditions from 1 January, with uncertainty about customs procedures, regulation and damaging tariffs causing real concern. According to the latest survey of SMMT members, this lack of clarity is now severely hampering nine in 10 companies’ (93.5%) ability to prepare for the end of the transition period.
The coronavirus crisis has exacerbated this, with six in 10 (61.3%) automotive companies saying Covid-19 has diverted resources away from Brexit preparations, while more than seven out of 10 (77.4%) view securing a tariff and quota free FTA as crucial to their future success.
EUR/USD
Resistance levels (open interest**, contracts)
$1.1858 (2789)
$1.1832 (1087)
$1.1813 (914)
Price at time of writing this review: $1.1760
Support levels (open interest**, contracts):
$1.1664 (147)
$1.1628 (155)
$1.1587 (973)
Comments:
- Overall open interest on the CALL options and PUT options with the expiration date August, 7 is 55850 contracts (according to data from July, 29) with the maximum number of contracts with strike price $1,1400 (4029);
GBP/USD
Resistance levels (open interest**, contracts)
$1.3128 (2188)
$1.3059 (2482)
$1.2998 (1146)
Price at time of writing this review: $1.2958
Support levels (open interest**, contracts):
$1.2884 (227)
$1.2780 (124)
$1.2691 (227)
Comments:
- Overall open interest on the CALL options with the expiration date August, 7 is 20788 contracts, with the maximum number of contracts with strike price $1,3000 (2482);
- Overall open interest on the PUT options with the expiration date August, 7 is 20142 contracts, with the maximum number of contracts with strike price $1,2400 (1526);
- The ratio of PUT/CALL was 0.97 versus 0.94 from the previous trading day according to data from July, 29
* - The Chicago Mercantile Exchange bulletin (CME) is used for the calculation.
** - Open interest takes into account the total number of option contracts that are open at the moment.
French economic activity may return to pre-virus levels in early 2022
French government must spend wisely
Restoring private sector and household confidence is key to the recovery
eFXdata reports that Bank of America Global Research discusses EUR/USD technical outlook and highlights a bullish setup on a weekly close above 1.1760.
"EUR/$: 12 year old downtrend line narrowly broken. Ending the third week of July, euro closed at 1.1656 which is above its weekly closing resistance line at 1.1644 (a small bullish breakout). To further confirm this break, look for a second weekly close above 1.1644 and/or a weekly close above 1.1760 which is more than 1% above this trend line," BofA notes.
If this occurs then it supports the bullish evidence building in and to buy a forthcoming Aug/Sept dip. In the aforementioned report we also highlight a trend line at 1.1820. Note that a 38.2% retracement of the decline beginning in 2009 is at 1.2550," BofA adds.
| Raw materials | Closed | Change, % |
|---|---|---|
| Brent | 43.66 | 1.23 |
| Silver | 24.23 | -0.45 |
| Gold | 1970.553 | 0.61 |
| Palladium | 2167.92 | -4.88 |
| Index | Change, points | Closed | Change, % |
|---|---|---|---|
| NIKKEI 225 | -260.27 | 22397.11 | -1.15 |
| Hang Seng | 110.38 | 24883.14 | 0.45 |
| KOSPI | 6.17 | 2263.16 | 0.27 |
| ASX 200 | -14.1 | 6006.4 | -0.23 |
| FTSE 100 | 2.2 | 6131.46 | 0.04 |
| DAX | -13.02 | 12822.26 | -0.1 |
| CAC 40 | 29.8 | 4958.74 | 0.6 |
| Dow Jones | 160.29 | 26539.57 | 0.61 |
| S&P 500 | 40 | 3258.44 | 1.24 |
| NASDAQ Composite | 140.85 | 10542.94 | 1.35 |
| Time | Country | Event | Period | Previous value | Forecast |
|---|---|---|---|---|---|
| 01:00 | New Zealand | ANZ Business Confidence | July | -34.4 | |
| 01:30 | Australia | Export Price Index, q/q | Quarter II | 2.7% | |
| 01:30 | Australia | Import Price Index, q/q | Quarter II | -1% | |
| 01:30 | Australia | Building Permits, m/m | June | -16.4% | 1.5% |
| 06:00 | United Kingdom | Nationwide house price index, y/y | July | -0.1% | -0.3% |
| 06:00 | United Kingdom | Nationwide house price index | July | -1.4% | -0.1% |
| 07:00 | Switzerland | KOF Leading Indicator | July | 59.4 | 75 |
| 07:55 | Germany | Unemployment Change | July | 69 | 43 |
| 07:55 | Germany | Unemployment Rate s.a. | July | 6.4% | 6.5% |
| 08:00 | Eurozone | ECB Economic Bulletin | |||
| 08:00 | Germany | GDP (YoY) | Quarter II | -2.3% | -11.3% |
| 08:00 | Germany | GDP (QoQ) | Quarter II | -2.2% | -9% |
| 09:00 | Eurozone | Industrial confidence | July | -21.7 | -17 |
| 09:00 | Eurozone | Consumer Confidence | July | -14.7 | -15 |
| 09:00 | Eurozone | Economic sentiment index | July | 75.7 | 81 |
| 09:00 | Eurozone | Unemployment Rate | June | 7.4% | 7.7% |
| 12:00 | Germany | CPI, m/m | July | 0.6% | -0.2% |
| 12:00 | Germany | CPI, y/y | July | 0.9% | 0.2% |
| 12:30 | U.S. | Continuing Jobless Claims | July | 16197 | 16200 |
| 12:30 | U.S. | PCE price index, q/q | Quarter II | 1.3% | |
| 12:30 | U.S. | Initial Jobless Claims | July | 1416 | 1450 |
| 12:30 | U.S. | GDP, q/q | Quarter II | -5% | -34.1% |
| 23:30 | Japan | Unemployment Rate | June | 2.9% | 3.1% |
| 23:50 | Japan | Industrial Production (MoM) | June | -8.9% | 1.2% |
| 23:50 | Japan | Industrial Production (YoY) | June | -26.3% |
| Pare | Closed | Change, % |
|---|---|---|
| AUDUSD | 0.71884 | 0.46 |
| EURJPY | 123.706 | 0.48 |
| EURUSD | 1.17909 | 0.61 |
| GBPJPY | 136.355 | 0.4 |
| GBPUSD | 1.29965 | 0.52 |
| NZDUSD | 0.66692 | 0.21 |
| USDCAD | 1.33319 | -0.34 |
| USDCHF | 0.91198 | -0.55 |
| USDJPY | 104.923 | -0.11 |


© 2000-2026. Bản quyền Teletrade.
Trang web này được quản lý bởi Teletrade D.J. LLC 2351 LLC 2022 (Euro House, Richmond Hill Road, Kingstown, VC0100, St. Vincent and the Grenadines).
Thông tin trên trang web không phải là cơ sở để đưa ra quyết định đầu tư và chỉ được cung cấp cho mục đích làm quen.
Giao dịch trên thị trường tài chính (đặc biệt là giao dịch sử dụng các công cụ biên) mở ra những cơ hội lớn và tạo điều kiện cho các nhà đầu tư sẵn sàng mạo hiểm để thu lợi nhuận, tuy nhiên nó mang trong mình nguy cơ rủi ro khá cao. Chính vì vậy trước khi tiến hành giao dịch cần phải xem xét mọi mặt vấn đề chấp nhận tiến hành giao dịch cụ thể xét theo quan điểm của nguồn lực tài chính sẵn có và mức độ am hiểu thị trường tài chính.
Sử dụng thông tin: sử dụng toàn bộ hay riêng biệt các dữ liệu trên trang web của công ty TeleTrade như một nguồn cung cấp thông tin nhất định. Việc sử dụng tư liệu từ trang web cần kèm theo liên kết đến trang teletrade.vn. Việc tự động thu thập số liệu cũng như thông tin từ trang web TeleTrade đều không được phép.
Xin vui lòng liên hệ với pr@teletrade.global nếu có câu hỏi.
ngân hàng