- Phân tích
- Tin tức và các công cụ
- Tin tức thị trường
Tin tức thì trường
| Time | Country | Event | Period | Previous value | Forecast |
|---|---|---|---|---|---|
| 01:00 | China | Non-Manufacturing PMI | July | 54.2 | 54.0 |
| 01:00 | China | Manufacturing PMI | July | 49.4 | 49.6 |
| 01:00 | New Zealand | ANZ Business Confidence | July | -38.1 | -34.9 |
| 01:30 | Australia | Private Sector Credit, m/m | June | 0.2% | 0.3% |
| 01:30 | Australia | Private Sector Credit, y/y | June | 3.6% | |
| 01:30 | Australia | Trimmed Mean CPI q/q | Quarter II | 0.3% | 0.4% |
| 01:30 | Australia | CPI, y/y | Quarter II | 1.3% | 1.5% |
| 01:30 | Australia | CPI, q/q | Quarter II | 0% | 0.5% |
| 01:30 | Australia | Trimmed Mean CPI y/y | Quarter II | 1.6% | 1.5% |
| 05:00 | Japan | Housing Starts, y/y | June | -8.7% | -3.4% |
| 05:00 | Japan | Construction Orders, y/y | June | -16.9% | |
| 05:00 | Japan | Consumer Confidence | July | 38.7 | 38.6 |
| 06:00 | United Kingdom | Nationwide house price index, y/y | July | 0.5% | 0.1% |
| 06:00 | United Kingdom | Nationwide house price index | July | 0.1% | 0.2% |
| 06:00 | Germany | Retail sales, real adjusted | June | -0.6% | 0.5% |
| 06:00 | Germany | Retail sales, real unadjusted, y/y | June | 4% | 2.7% |
| 06:45 | France | CPI, y/y | July | 1.2% | |
| 06:45 | France | CPI, m/m | July | 0.2% | |
| 07:55 | Germany | Unemployment Change | July | -1 | 2 |
| 07:55 | Germany | Unemployment Rate s.a. | July | 5% | 5% |
| 09:00 | Eurozone | Harmonized CPI ex EFAT, Y/Y | July | 1.1% | 1% |
| 09:00 | Eurozone | Harmonized CPI, Y/Y | July | 1.3% | 1.1% |
| 09:00 | Eurozone | Unemployment Rate | June | 7.5% | 7.5% |
| 09:00 | Eurozone | GDP (YoY) | Quarter II | 1.2% | 1% |
| 09:00 | Eurozone | GDP (QoQ) | Quarter II | 0.4% | 0.2% |
| 12:15 | U.S. | ADP Employment Report | July | 102 | 150 |
| 12:30 | Canada | Industrial Product Price Index, y/y | June | 0.6% | |
| 12:30 | Canada | Industrial Product Price Index, m/m | June | 0.1% | -0.1% |
| 12:30 | Canada | GDP (m/m) | May | 0.3% | 0.1% |
| 12:30 | U.S. | Employment Cost Index | Quarter II | 0.7% | 0.7% |
| 13:45 | U.S. | Chicago Purchasing Managers' Index | July | 49.7 | 50.5 |
| 14:30 | U.S. | Crude Oil Inventories | July | -10.835 | -1.818 |
| 18:00 | U.S. | Fed Interest Rate Decision | 2.5% | 2.25% | |
| 18:00 | U.S. | FOMC Statement | |||
| 18:30 | U.S. | FOMC Press Conference | |||
| 22:30 | Australia | AIG Manufacturing Index | July | 49.4 |
Major US stock indexes fell slightly, as technology company shares came under pressure due to heightened concerns about the US trade deal with China, as well as before the publication of Apple's quarterly reports (AAPL). In addition, investors are preparing to announce the outcome of the July Fed meeting on Wednesday.
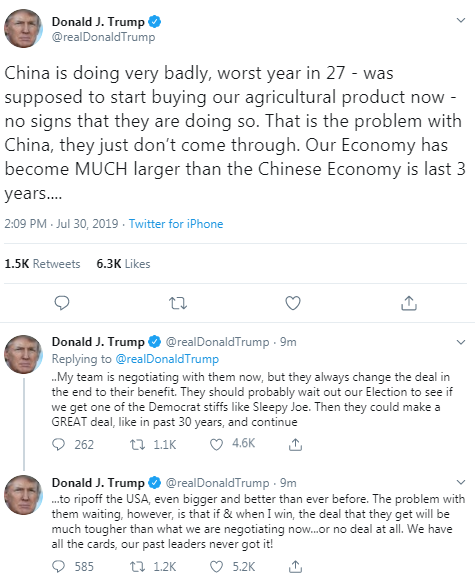
US President Trump resumed his attacks on China, weakening investors' hopes that the two largest economies in the world would reach a trade deal. On Tuesday, when a new round of US-China trade negotiations began in Shanghai, Trump said in a series of Twitter messages that China is not keeping its promise to buy more American agricultural products. He also warned China not to wait for the completion of his first term, adding that if he was re-elected at the November 2020 presidential election, the result could be a lack of agreement or tougher conditions.
The two-day meeting of the Federal Open Market Committee (FOMC) started today, the results of which will be announced tomorrow at 18:00 GMT. Investors expect the Central Bank for the first time since 2008 to cut rates by 25 basis points. The Fed, which seeks to keep inflation at 2%, has experienced growth problems in recent months, despite a healthy economy and low unemployment. This may indicate that the current level of rates may be too high, even if they are well below historical standards. Of particular interest to the markets will be prompting from the Fed on the possibility of further rate cuts in the coming months. Economists basically expect one to three rate cuts this year.
Meanwhile, in the US, the quarterly reporting season continues. Over 52% of the S & P 500 companies have reported quarterly results. According to FactSet, their 75% of these companies showed higher than expected earnings for the reporting period. After the close of the trading session, the release of Apple's quarterly reports (AAPL), Advanced Micro (AMD), Baidu (BIDU) and others is expected.
Market participants also received several important macroeconomic reports. Thus, the report of the US Department of Commerce showed that personal income and expenses in the United States increased in June in accordance with economists' forecasts. According to the report, in June, personal income increased by 0.4%, which corresponds to the downwardly revised May figure. Personal expenses rose 0.3% in June after rising 0.5% in May. Expenditures were expected to increase by 0.3%.
The Conference Board report indicated that the consumer confidence index in July rose to 135.7 (1985 = 100) from 124.3 in June. Analysts had expected the index to grow only to 125.0. According to the report, the current situation index, based on consumers ’assessment of current business and labor market conditions, rose from 164.3 to 170.9, while the expectations index, based on short-term consumer forecasts for income, business, and labor market conditions, rose from 97.6 to 112.2.
Most of the components of DOW finished trading in the red (21 out of 30). Pfizer Inc. shares turned out to be an outsider. (PFE; -6.62%). The growth leader was the shares of The Procter & Gamble Co. (PG; + 3.62%).
Most sectors of the S & P recorded a decline. The largest decline was shown by the technology sector (-0.7%). The sector of conglomerates grew the most (+ 0.9%).
At the time of closing:
Dow 27,198.15 -23.20 -0.09%
S & P 500 3,013.18 -7.79 -0.26%
Nasdaq 100 8,273.61 -19.72 -0.24%
| Time | Country | Event | Period | Previous value | Forecast |
|---|---|---|---|---|---|
| 01:00 | China | Non-Manufacturing PMI | July | 54.2 | 54.0 |
| 01:00 | China | Manufacturing PMI | July | 49.4 | 49.6 |
| 01:00 | New Zealand | ANZ Business Confidence | July | -38.1 | -34.9 |
| 01:30 | Australia | Private Sector Credit, m/m | June | 0.2% | 0.3% |
| 01:30 | Australia | Private Sector Credit, y/y | June | 3.6% | |
| 01:30 | Australia | Trimmed Mean CPI q/q | Quarter II | 0.3% | 0.4% |
| 01:30 | Australia | CPI, y/y | Quarter II | 1.3% | 1.5% |
| 01:30 | Australia | CPI, q/q | Quarter II | 0% | 0.5% |
| 01:30 | Australia | Trimmed Mean CPI y/y | Quarter II | 1.6% | 1.5% |
| 05:00 | Japan | Housing Starts, y/y | June | -8.7% | -3.4% |
| 05:00 | Japan | Construction Orders, y/y | June | -16.9% | |
| 05:00 | Japan | Consumer Confidence | July | 38.7 | 38.6 |
| 06:00 | United Kingdom | Nationwide house price index, y/y | July | 0.5% | 0.1% |
| 06:00 | United Kingdom | Nationwide house price index | July | 0.1% | 0.2% |
| 06:00 | Germany | Retail sales, real adjusted | June | -0.6% | 0.5% |
| 06:00 | Germany | Retail sales, real unadjusted, y/y | June | 4% | 2.7% |
| 06:45 | France | CPI, y/y | July | 1.2% | |
| 06:45 | France | CPI, m/m | July | 0.2% | |
| 07:55 | Germany | Unemployment Change | July | -1 | 2 |
| 07:55 | Germany | Unemployment Rate s.a. | July | 5% | 5% |
| 09:00 | Eurozone | Harmonized CPI ex EFAT, Y/Y | July | 1.1% | 1% |
| 09:00 | Eurozone | Harmonized CPI, Y/Y | July | 1.3% | 1.1% |
| 09:00 | Eurozone | Unemployment Rate | June | 7.5% | 7.5% |
| 09:00 | Eurozone | GDP (YoY) | Quarter II | 1.2% | 1% |
| 09:00 | Eurozone | GDP (QoQ) | Quarter II | 0.4% | 0.2% |
| 12:15 | U.S. | ADP Employment Report | July | 102 | 150 |
| 12:30 | Canada | Industrial Product Price Index, y/y | June | 0.6% | |
| 12:30 | Canada | Industrial Product Price Index, m/m | June | 0.1% | -0.1% |
| 12:30 | Canada | GDP (m/m) | May | 0.3% | 0.1% |
| 12:30 | U.S. | Employment Cost Index | Quarter II | 0.7% | 0.7% |
| 13:45 | U.S. | Chicago Purchasing Managers' Index | July | 49.7 | 50.5 |
| 14:30 | U.S. | Crude Oil Inventories | July | -10.835 | -1.818 |
| 18:00 | U.S. | Fed Interest Rate Decision | 2.5% | 2.25% | |
| 18:00 | U.S. | FOMC Statement | |||
| 18:30 | U.S. | FOMC Press Conference | |||
| 22:30 | Australia | AIG Manufacturing Index | July | 49.4 |
- We are not aiming for a no-deal Brexit and we don't think that is where it will end up
- Says to EU "the ball is in your court"
- The withdrawal agreement won't work
The National
Association of Realtors (NAR) announced on Tuesday its seasonally adjusted
pending home sales index (PHSI) surged 2.8 percent m-o-m to 108.3 in June, up
from 105.4 in May..
Economists had
expected pending home sales to rise 0.5 percent m-o-m in June.
On y-o-y basis,
the index increased 1.6 percent, snapping a 17-month streak of annual declines.
According to
the report, the pending home sales rose all four regions in m-o-m terms and
compared to June 2018. Pending home sales in the South increased 1.3 percent
m-o-m to an index of 125.7 in June, which was 1.4 percent higher than last
June. The PHSI in the Northeast climbed 2.7 percent m-o-m to 94.5 and was now
0.9 percent higher than a year ago. The index in the West surged 5.4 percent
m-o-m to 96.8 and increased 2.5 percent above a year ago. The indicator in the
Midwest grew 3.3 percent m-o-m to 103.6 and rose 1.7 percent y-o-y.
The Conference
Board announced on Tuesday its U.S. consumer confidence gauge rose 11.4 points
to 135.7 in July from 124.3 in June.
Economists had
expected consumer confidence to come in at 125.
June’s consumer
confidence reading was revised up from originally estimated 121.5.
The survey
showed that the expectations surged from 97.6 last month to 112.2 this month,
while the present situation index increased from 164.3 to 170.9.
Lynn Franco,
Senior Director of Economic Indicators at The Conference Board, noted, “After a
sharp decline in June, driven by an escalation in trade and tariff tensions,
Consumer Confidence rebounded in July to its highest level this year. Consumers
are once again optimistic about current and prospective business and labor
market conditions. In addition, their expectations regarding their financial
outlook also improved. These high levels of confidence should continue to
support robust spending in the near-term despite slower growth in GDP.”
S&P
reported on Tuesday its Case-Shiller Home Price Index, which tracks home prices
in 20 U.S. metropolitan areas, rose 2.4 percent y-o-y in May, following an unrevised
2.5 percent y-o-y increase in April. That was the smallest annual advance in
house prices since August 2012.
Economists had
expected an advance of 2.4 percent y-o-y.
Las Vegas (+6.4
percent y-o-y), Phoenix (+5.7 percent y-o-y) and Tampa (+5.1 percent y-o-y)
recorded the highest y-o-y gains in May.
Meanwhile, the
S&P/Case-Shiller U.S. National Home Price Index, which measures all nine
U.S. census divisions, was up 3.4 percent y-o-y in May, down from 3.5 percent
y-o-y in the previous month.
“Nationally,
year-over-year home price gains were lower in May than in April, but not
dramatically so and a broad-based moderation continued,” noted Philip Murphy,
Managing Director and Global Head of Index Governance at S&P Dow Jones
Indices. “Among 20 major U.S. city home price indices, the average YOY gain has
been declining for the past year or so and now stands at the moderate nominal YOY
rate of 3.1%”.
Carsten Brzeski, the chief economist at ING Germany, notes the just-released first estimate, based on the results of several regional states, revealed that German headline inflation came in at 1.1% year-on-year in July, down from 1.5% in June.
- "The national inflation measure actually increased to 1.7% YoY from 1.6% in June. This year’s strong discrepancy between the national and the European measure of German inflation is mainly caused by methodological changes to the measurement of package holidays in the European measure and changes to the weights of different components in the national measure.
- Looking at the available components in several regional states, there were opposing trends in price developments. While prices for heating oil have started to drop compared with last year, reflecting lower global prices, prices for electricity and gas are still up. At the same time, prices for food have started to accelerate, probably early signs of the dry and warm summer, while costs for education and communication continue to fall. Overall, these diverging trends seem to offset each other, keeping core inflation measures broadly unchanged.
- Earlier today, fading consumer confidence sent another warning signal that the industrial slump of the last 12 months, as well as ongoing global uncertainty, have finally started to leave their mark on the domestic economy.
- Looking ahead, with negative base effects from oil prices and the cooling economic outlook, German headline inflation will, in our view, continue to fluctuate between 1% and 1.5% in the coming months, adding to the arguments for new ECB action in September."
U.S. stock-index futures fell on Tuesday amid renewed trade concerns and ahead of Fed’s rate decision.
Global Stocks:
Index/commodity | Last | Today's Change, points | Today's Change, % |
Nikkei | 21,709.31 | +92.51 | +0.43% |
Hang Seng | 28,146.50 | +40.09 | +0.14% |
Shanghai | 2,952.34 | +11.33 | +0.39% |
S&P/ASX | 6,845.10 | +19.30 | +0.28% |
FTSE | 7,672.13 | -14.48 | -0.19% |
CAC | 5,528.29 | -72.81 | -1.30% |
DAX | 12,174.09 | -243.38 | -1.96% |
Crude oil | 57.12 | +0.44% | |
Gold | 1,429.30 | +0.63% |
Analysts at TD Securities think that sentiment among manufacturers likely improved in July but not enough to move back into expansion for the Chinese economy.
- “We expect the PMI to edge higher to 49.9 in July from 49.4 in June, as the impact of the US-China trade truce filters through. Also despite a weak Q2 GDP outcome, activity indicators picked up momentum in June, which likely carried through into July amid ongoing easy liquidity and phased cuts in the RRR for small and medium-sized companies.”
(company / ticker / price / change ($/%) / volume)
3M Co | MMM | 175.98 | -0.78(-0.44%) | 1982 |
ALCOA INC. | AA | 23.2 | 0.08(0.35%) | 200 |
ALTRIA GROUP INC. | MO | 49.85 | -0.46(-0.91%) | 34898 |
Amazon.com Inc., NASDAQ | AMZN | 1,894.00 | -18.45(-0.96%) | 35272 |
American Express Co | AXP | 126.85 | -0.34(-0.27%) | 209 |
Apple Inc. | AAPL | 207.81 | -1.87(-0.89%) | 187227 |
AT&T Inc | T | 34.25 | -0.09(-0.26%) | 34197 |
Boeing Co | BA | 338.39 | -1.82(-0.54%) | 17963 |
Caterpillar Inc | CAT | 133.68 | -0.78(-0.58%) | 13633 |
Chevron Corp | CVX | 124.48 | 0.25(0.20%) | 400 |
Cisco Systems Inc | CSCO | 56.7 | -0.23(-0.40%) | 5924 |
Citigroup Inc., NYSE | C | 71.25 | -0.51(-0.71%) | 8601 |
Exxon Mobil Corp | XOM | 75.05 | -0.29(-0.38%) | 1856 |
Facebook, Inc. | FB | 193.85 | -2.09(-1.07%) | 85701 |
FedEx Corporation, NYSE | FDX | 172 | -0.60(-0.35%) | 397 |
Ford Motor Co. | F | 9.57 | -0.03(-0.31%) | 56222 |
Freeport-McMoRan Copper & Gold Inc., NYSE | FCX | 11.41 | -0.20(-1.72%) | 10176 |
General Electric Co | GE | 10.39 | 0.01(0.10%) | 58230 |
General Motors Company, NYSE | GM | 40.6 | -0.08(-0.20%) | 7662 |
Goldman Sachs | GS | 219 | -1.32(-0.60%) | 1666 |
Google Inc. | GOOG | 1,228.00 | -11.41(-0.92%) | 4257 |
Hewlett-Packard Co. | HPQ | 21.69 | 0.19(0.88%) | 417 |
Intel Corp | INTC | 51.66 | -0.85(-1.62%) | 105490 |
International Business Machines Co... | IBM | 150.2 | -0.68(-0.45%) | 2944 |
Johnson & Johnson | JNJ | 133 | -0.02(-0.02%) | 2821 |
JPMorgan Chase and Co | JPM | 115.1 | -0.75(-0.65%) | 9249 |
McDonald's Corp | MCD | 214 | -0.98(-0.46%) | 5121 |
Merck & Co Inc | MRK | 84.9 | 2.41(2.92%) | 89545 |
Microsoft Corp | MSFT | 139.82 | -1.21(-0.86%) | 59721 |
Nike | NKE | 86.81 | -0.81(-0.92%) | 2915 |
Pfizer Inc | PFE | 40.5 | -0.95(-2.29%) | 221175 |
Procter & Gamble Co | PG | 121.01 | 5.01(4.32%) | 385315 |
Starbucks Corporation, NASDAQ | SBUX | 97.51 | -0.51(-0.52%) | 7059 |
Tesla Motors, Inc., NASDAQ | TSLA | 232.1 | -3.67(-1.56%) | 52894 |
The Coca-Cola Co | KO | 53.95 | -0.04(-0.07%) | 2837 |
Twitter, Inc., NYSE | TWTR | 41.03 | -0.47(-1.13%) | 45429 |
UnitedHealth Group Inc | UNH | 252.82 | -1.00(-0.39%) | 1315 |
Verizon Communications Inc | VZ | 57.2 | -0.17(-0.30%) | 2335 |
Visa | V | 182.5 | -0.71(-0.39%) | 8978 |
Wal-Mart Stores Inc | WMT | 112.2 | -0.07(-0.06%) | 355 |
Walt Disney Co | DIS | 146.1 | -0.29(-0.20%) | 8658 |
Yandex N.V., NASDAQ | YNDX | 40.1 | 0.76(1.93%) | 71060 |
Pfizer (PFE) downgraded to Neutral from Buy at BofA/Merrill
Pfizer (PFE) downgraded to Equal-Weight from Overweight at Morgan Stanley; target lowered to $40
McDonald's (MCD) downgraded to Hold from Buy at DZ Bank
Micron (MU) upgraded to Equal-Weight from Underweight at Morgan Stanley; target raised to $48
The Commerce
Department reported on Tuesday that consumer spending in the U.S. rose 0.3
percent m-o-m in June, following a revised 0.5 percent m-o-m gain in May (originally
a 0.4 percent m-o-m increase). Economists had forecast the reading to show a 0.3
percent m-o-m growth.
Meanwhile,
consumer income climbed 0.4 percent m-o-m in June, the same pace as in the
previous month (revised from +0.5 percent m-o-m). Economists had forecast a 0.4
percent m-o-m advance.
The June
increase in personal income primarily reflected increases in wages and
salaries, government social benefits to persons, and supplements to wages and
salaries.
The personal
consumption expenditures (PCE) price index, excluding the volatile categories
of food and energy, which is the Fed's preferred inflation measure, edged up
0.1 percent m-o-m in June, following a revised 0.1 percent m-o-m advance in the
prior month (originally a 0.2 percent m-o-m gain). Economists had projected the
index would increase 0.2 percent m-o-m.
In the 12
months through June, the core PCE increased 1.4 percent, the same pace as in
the 12 months through May (revised from +1.5 percent m-o-m). Economists had
forecast a gain of 1.7 percent y-o-y.
- "It's a temporary notice give at the month-end to grant us more lending quotas," told Reuters one of the sources.
Germany's
Federal Statistical Office reported on Tuesday the country’s consumer price
index (CPI) is expected to increase 0.5 percent m-o-m in July, following a 0.3
percent m-o-m advance in the previous month.
On the y-o-y
basis, Germany’s inflation rate is seen to rise 1.7 percent this month after a
1.6 percent gain in June. That marked the fastest pace since April.
Economists had
predicted inflation would increase 0.3 percent m-o-m and 1.5 percent y-o-y in
July.
According to
the report, food price growth accelerated to 2.1 percent y-o-y in July from 1.2
percent y-o-y in June, while energy inflation slowed to 2.4 percent y-o-y from 2.5
percent y-o-y. Services costs climbed 1.5 percent y-o-y, following a 1.9
percent y-o-y jump in the previous month.
Bert Colijn, a senior Eurozone economist at ING, notes the Economic Sentiment Indicator declined from 103.3 to 102.7 in July.
- "Worries about the eurozone economy persist in the third quarter, with economic sentiment continuing to decline in July. While consumer confidence improved, businesses shared a view of deteriorating sentiment across sectors.
- For the service sector, this is especially worrying, as it's defied the manufacturing downturn quite successfully up to now. Still, the underlying indicators provide some reason for cautious optimism as the decline was mainly due to a deterioration in expectations of future demand.
- The industrial picture is more troubling. Order books continue to deteriorate, causing businesses to be more pessimistic about future production. This also impacts hiring plans as employment expectations continue to deteriorate. Most worrying, however, is the alarming drop in production observed in recent months, which plummeted in Germany, the Czech Republic and Slovakia in July. This is in line with very weak PMI results published last week and indicates that things may get worse before they get better.
- Eurozone GDP data for 2Q will be released tomorrow and a slowdown from 1Q is widely expected. With alarming July survey data, the question is whether 3Q can come in much better.
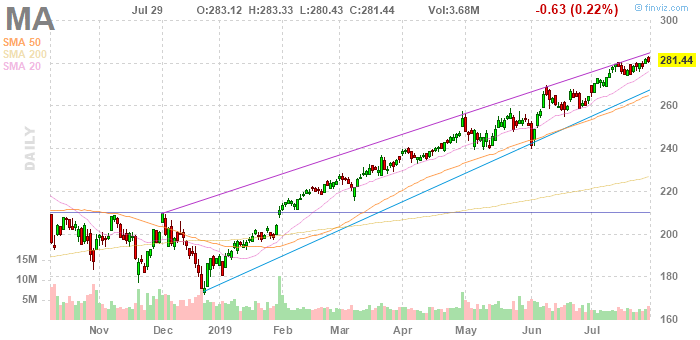
MasterCard (MA) reported Q2 FY 2019 earnings of $1.89 per share (versus $1.66 in Q2 FY 2018), beating analysts’ consensus estimate of $1.83.
The company’s quarterly revenues amounted to $4.113 bln (+12.2% y/y), generally in line with analysts’ consensus estimate of $4.083 bln.
MA fell to $281.01 (-0.15%) in pre-market trading.
TD Securities' analysts are expecting the U.S. personal spending to have maintained its strong pace at 0.4% m/m in June, closing the second quarter at a decent clip.
- “In the details, we expect a 0.5% m/m advance in services spending to be the main driver behind the June gain, with a rise in spending in nondurables (+0.3%) also helping on the headline. Moreover, we forecast income to rise 0.3% m/m, a tad slower than in the prior month.
- Separately, look for the release of the Conference Board's consumer confidence indicator, where the market expects a modest rebound to a still-high 125.0 level in July.”
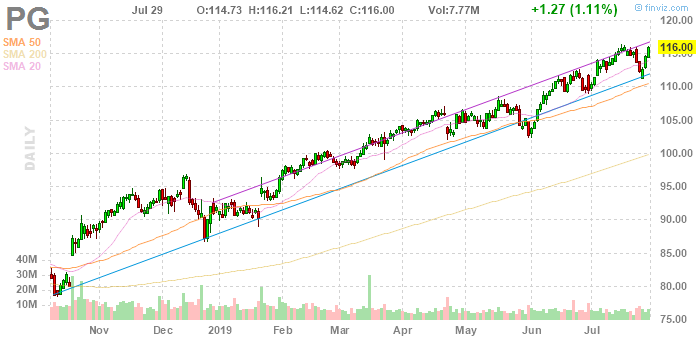
Procter & Gamble (PG) reported Q4 FY 2019 earnings of $1.10 per share (versus $0.94 in Q4 FY 2018), beating analysts’ consensus estimate of $1.05.
The company’s quarterly revenues amounted to $17.094 bln (+3.6% y/y), beating analysts’ consensus estimate of $16.864 bln.
PG rose to $120.64 (+4.00%) in pre-market trading.
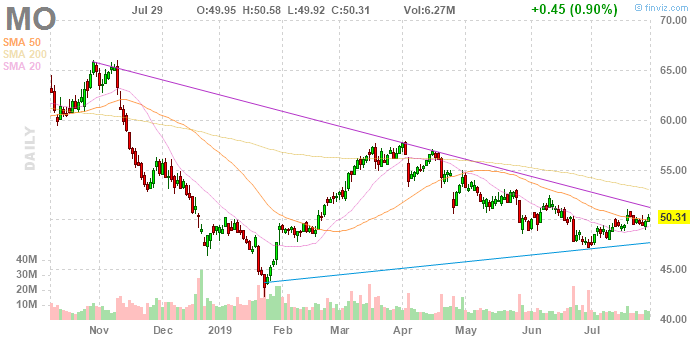
Altria (MO) reported Q2 FY 2019 earnings of $1.10 per share (versus $1.01 in Q2 FY 2018), in line with analysts’ consensus estimate.
The company’s quarterly revenues amounted to $5.193 bln (+6.4% y/y), beating analysts’ consensus estimate of $5.078 bln.
The company also reaffirmed guidance for FY 2019, projecting EPS of $4.15-4.27 versus analysts’ consensus estimate of $4.18.
MO rose to $50.50 (+0.38%) in pre-market trading.
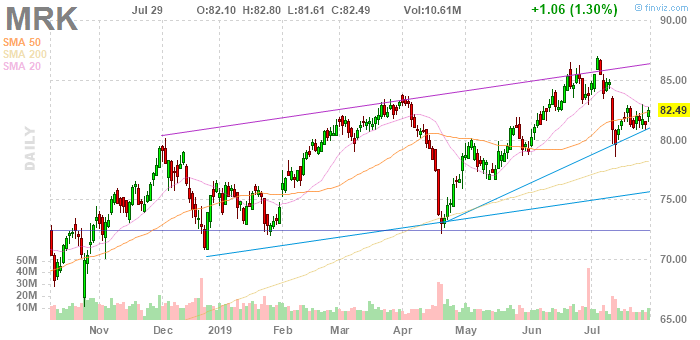
Merck (MRK) reported Q2 FY 2019 earnings of $1.30 per share (versus $1.06 in Q2 FY 2018), beating analysts’ consensus estimate of $1.16.
The company’s quarterly revenues amounted to $11.760 bln (+12.4% y/y), beating analysts’ consensus estimate of $10.943 bln.
The company also raised FY 2019 EPS guidance to $4.84-4.94 from $4.67-4.79 versus analysts’ consensus estimate of $4.82 and FY 2019 revenue guidance to $45.2-46.2 bln from $43.9-45.1 bln versus analysts’ consensus estimate of $44.68 bln.
MRK rose to $85.23 (+3.32%) in pre-market trading.
James Knightley, ING's chief international economist in London, suggests that after June’s incredibly strong jobs growth of 224,000, which was above every one of the 75 forecasts in Bloomberg's survey of analysts, there is obviously the risk of a softer outcome for July.
- "We are looking for 170,000, which would be broadly in line with the six-month moving average. This also tallies with evidence from the latest Federal Reserve Beige Book, which based on data up to July 8 reported that “employment grew at a modest pace, slightly slower than the previous reporting period."
- Given the early (2nd August) release date we, unfortunately, haven’t got much up to date information specifically for July, but certainly the recently released regional manufacturing surveys offer encouragement that firms are still expanding and need workers. The consensus range of expectations for July payrolls growth is pretty broad from a low of 74,000 up to 224,000.
- Nonetheless, we think there may be a little upside risk to the consensus estimate for wages given the demand-supply imbalance in the jobs market. We expect wage growth of 0.3%MoM, 3.2%YoY versus the market forecast of 0.2%/3.1%.
- After 3.6% readings in both April and May, the unemployment rate ticked higher to 3.7% in June. We expect to see a return to 3.6% for July, which would also be the lowest reading since December 1969.
- The participation rate tends to be quite a choppy series, so if we do see that move higher once again it would make a 3.7% unemployment rate look more likely. A higher unemployment rate, for this reason, would certainly not be a signal we should be concerned."
Analysts at Standard Chartered note that China’s property market experienced a recovery in the first half of 2019, but overall sentiment remained subdued.
- “The CDSI, which is based on our semi-annual proprietary China developer survey, rose to 44.7 in July from 39.0 in January, staying in contractionary territory. The forward-looking sub-indices show that while housing developers are making concerted efforts to accelerate construction and increase sales, policies targeting overheating cities and indebted developers are dampening their outlook.”
- Economic operations remained within a reasonable range in the first half of 2019
- Economy faces increasing downwards pressure
- To stabilize investment in the manufacturing sector
- Reaffirms efforts to stabilize employment, investment and foreign trade
- To make fiscal policy more effective
- Says won't resort to using property/real estate as short-term stimulus measure
- To boost consumption with more reform-linked measures
- Says will continue to cut fees, taxes
- Will keep monetary policy neither too tight or too loose
- Will keep liquidity reasonably ample
- Will deal with trade issue with effective measures
Karen Jones, analyst at Commerzbank, suggests that USD/JPY is approaching key resistance offered by the 108.99 July high, while its intraday Elliott wave counts have turned positive.
“A close above here looks increasingly likely and would imply that the market has based near term and initiate recovery to the 200 day ma at 110.52. Support is offered by the 107.32 uptrend which would be likely to act as a near term break point to the 106.78 recent low and eventually 105.87, the 78.6% retracement of the move seen this year. The 110.67 April 21 high guards the 2015-2019 downtrend at 111.81. We look for the market to remain capped by its 111.81 2015-2019 downtrend. Only above here would target the 114.55 October 2018 high.”
The number of insolvent companies in England and Wales hit its highest in more than five years in the second quarter of 2019, according to official data released on Tuesday.
The Insolvency Service, a government agency, said 4,321 companies entered insolvency in the April-June period on an underlying basis which excludes "bulk" closures of personal service companies. This was up from 4,213 in the first quarter and marked the biggest total since early 2014.
The number of personal insolvencies declined for a second quarter running after hitting an eight-year high at the end of 2018, dropping to 30,937 in the second quarter from 31,346 in the first three months of 2019.
European Commission said, in July 2019, the Business Climate Indicator (BCI) for the euro area decreased markedly (by 0.29 points to -0.12). Managers’ assessments of past production, their production expectations, as well as their views on overall and export order books deteriorated. Only their assessment of the level of stocks improved.
In July 2019, the Economic Sentiment Indicator (ESI) decreased slightly in both the euro area (by 0.6 points to 102.7) and the EU (by -0.3 points to 102.0).
The deterioration of euro-area sentiment resulted from lower confidence in industry, services, retail trade and construction, while confidence improved slightly among consumers.
Industry confidence registered a marked decrease (−1.8), which moved the indicator clearly below its long-term average. The slight decline in services confidence (−0.4) was driven by managers' more pessimistic demand expectations, while their views on the past business situation and past demand remained broadly unchanged. The slight increase in consumer confidence (+0.6) reflected households’ more positive assessments of their past financial situation and their expectations about the general economic situation.
The decline in retail trade confidence (−0.8) resulted from more negative views on the present business situation as well as more negative expectations. The marked decrease in construction confidence (−2.6) resulted from a sharp decrease in managers' employment expectations, and a strong worsening of their assessment of the level of order books. Finally, financial services confidence (not included in the ESI) decreased markedly (−4.6), reflecting strong deterioration in managers' demand expectations and their assessment of the past business situation, while appraisals of past demand improved.
Germany's Constitutional Court on Tuesday rejected a challenge to the European Central Bank's authority to supervise the euro zone's biggest banks, dismissing yet another German objection to the central bank's powers.
The court said that ECB's Single Supervisory Mechanism and the EU's separate Single Resolution Mechanism, used to close unviable banks, were both in line with German law and did not constitute an overreach of EU powers.
The suit, brought by academics, including law professor Markus Kerber, follows several other failed challenges of ECB power, including its right to buy government bonds.
Nomura Research discusses its expectations for the market reaction to this week's FOMC policy meeting.
"Barring a radically dovish surprise from the FOMC at its meeting next week (30-31 July), we expect the meeting to be followed by an increase in the number of investors choosing to "sell the fact", particularly among quick-moving hedge funds. Already, hedge funds' overall long exposure to US equities seems to have plateaued. In the US bond market as well, directional traders (CTAs, global macro hedge funds) have accumulated large net long positions," Nomura argues. Judging from the positions that investors have already established, we think an overall selling bias may develop in both the stock market and the bond market as investors make position adjustments," Nomura adds.
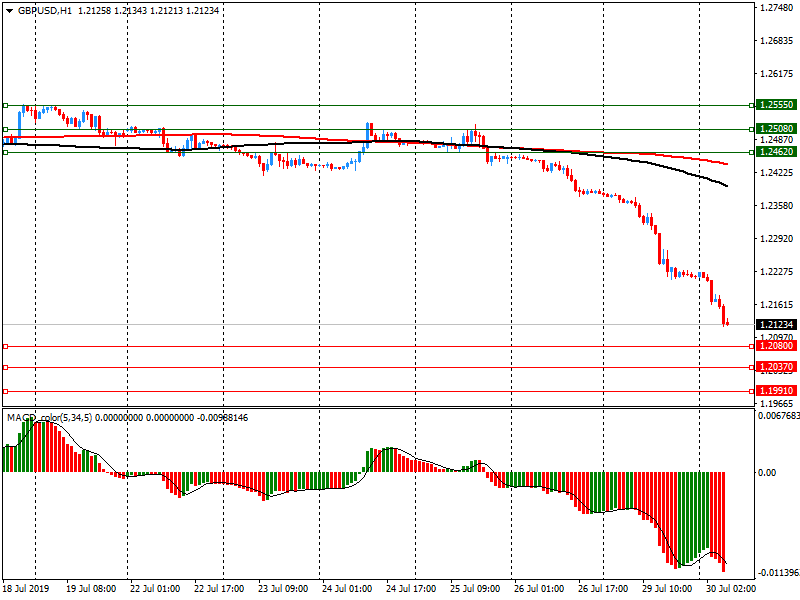
According to Karen Jones, analyst at Commerzbank, GBP/USD pair remains under pressure and is now approaching 1.2108, the 78.6% retracement of the entire move up from the 2016 low.
“The 1.2108 level guards the 1.1988 January 2017 low and the 1.1491 3 rd October low (according to CQG). Intraday rebounds are indicated to be likely to hold in the 1.2350 are. It stays negative while contained by 2 month downtrend at 1.2504 today. Above the downtrend this would introduce scope to the 55 day ma at 1.2616 and the June high at 1.2784. A rise above the June high at 1.2784 would indicate that a bottom is being formed (not favoured).”
Karen Jones, analyst at Commerzbank, suggests that USD/CHF pair looks set to test more important resistance.
“This is offered by the recent high at .9951, the 50% retracement at .9967 and the 200 day ma at .9979. This is tough resistance and only above here will negate our negative bias for a slide to .9695, the 25th June low. Currently the intraday Elliott wave counts are conflicting but we favour initial failure here. Above the 200 moving average lies the mid-June high at 1.0014. Longer term we target .9211/.9188, the 2018 low. Only a close above 1.0014 (high 19th June) would alleviate immediate downside pressure and target 1.0097 and possibly 1.0128 before failure again (November and March highs at 1.0124/28).”
According to the report from KOF Economic Research Agency, economic Barometer has climbed in July. After the indicator value remained stable in the previous month, the economic prospects are no longer quite as unfavourable as before. However, the Barometer continues to indicate below-average momentum.
The KOF Economic Barometer has risen by 3.3 points in July to 97.1 from 93.8 in June (revised from 93.6). Economists had expected a decrease to 93.0.
Slightly more favourable signals than before are coming from manufacturing, other services, accommodation and food service activities as well as financial and insurance services. Construction is contributing slightly to the positive development. Consumer prospects are practically unchanged. On the other hand, the indicators for demand from abroad have a dampening effect.
In the goods producing sectors (manufacturing and construction), the barometer is strengthened above all by indicators on the competitive situation and the number of employees. On the other hand, the indicators for the purchase of intermediate products are directed downwards. On the whole, the prospects for the manufacturing industry have brightened visibly.
National Institute of Statistics and Economic Studies (Insee) said, in June 2019, household consumption expenditure on goods fell slightly in volume (–0.1% after +0.3%). Economists had expected a 0.2% increase
In June, food consumption fell sharply (–1.1% after +0.2%). This decrease concerned both the consumption of agricultural goods (fresh fruits and vegetables) and the purchases of processed agri-food products. Over the whole quarter, food consumption fell again (–0.2% after –1.1%).
Manufactured good consumption increased again (+0.7% after +0.5%), supported in particular by durable good purchases. Over the whole quarter, however, purchases of manufactured goods fell (–0.3% after +0.7%).
Consumption of durable manufactured goods rose again (+0.8% after +0.4%), mainly due to the dynamism of transport equipment sales (+2.5%), despite the decline in housing equipment consumption (–1.6%). Over the whole quarter, however, durable good purchases fell sharply (–0.6% after +0.7%).
In June, energy consumption increased slightly (+0.2% after +0.0%). The increase in fuel expenditure (+2.9%) was partially offset by the decrease in gas and electricity consumption (–2.1%). Over the whole quarter, energy expenses increased (+0.8% after +0.9%).
BOJ won't hesitate to add easing measures if risks are high
ECB and Fed are changing stance amid global uncertainty
Need to be mindful of effects of policy shift by others
BOJ now pledges to take easing steps if price momentum is lost, rather than "consider" to take easing steps
Inflation remains weak despite tight labour market
Risks for the economy, inflation are tilted towards the downside
Risks from overseas' economies are high
It will take time to hit 2% inflation target
BOJ won't hesitate to add easing if price momentum is lost
According to the report from GfK Group, German consumer morale worsened for the third month in a row heading into August as a global economic downturn, trade disputes and Brexit uncertainty fuel worker fears of losing their jobs and their income.
The GfK consumer sentiment indicator edged down to 9.7 from 9.8 a month earlier. It was the lowest reading since April 2017 and in line with market expectations.
"The trade war with the United States, ongoing Brexit discussions and the global economic slowdown continue to drive fears of a recession," GfK researcher Rolf Buerkl said. Consumers with jobs in export-driven sectors in particular, such as the car industry and their suppliers, are affected the most, he said.
The GfK sub-indicator measuring consumers' economic expectations dropped to -3.7, falling below its average of zero points for the first time since March 2016 and hitting the lowest level since November 2015. The propensity to buy as measured by the GfK also deteriorated to reach its lowest in nearly four years.
"The primary threat to consumer confidence is the persistently increasing fear of job losses," Buerkl said. Household spending could weaken in coming months if the trend continues, he said. Income expectations recovered after a drop in the previous month, suggesting consumers still count on further pay increases in coming months, GfK said.
According to the report from Insee, in Q2 2019, GDP in volume terms decelerated slightly: +0.2% after +0.3%. Economists had expected a 0.3% increase.
Household consumption expenditures decelerated (+0.2% after +0.4%), while total gross fixed capital formation accelerated sharply (GFCF: +0.9% after +0.5%). Overall, final domestic demand excluding inventory changes accelerated slightly: it contributed 0.4 points to GDP growth, after 0.3 points in the previous quarter.
Imports remained almost stable in Q1 (+0.1% after +1.1%) and exports grew at the same pace than previously (+0.2%). All in all, foreign trade balance did not contribute to GDP growth: 0.0 points, after −0.3 points during the previous quarter. Changes in inventories contributed negatively to GDP growth (−0.2 points after +0.3 points).
Production of goods and services grew at almost the same pace as in the two previous quarters (+0.4% after +0.5% during three quarters). It was stable in goods (+0.0% after +0.5%), while it grew at the same pace in services (+0.5%). Output in manufactured goods fell back this quarter (−0.4% after +0.5%), mainly because production of refineries (one of them being in maintenance) and in transport equipment fell back. Production in construction decelerated (+0.3% after +0.6%).
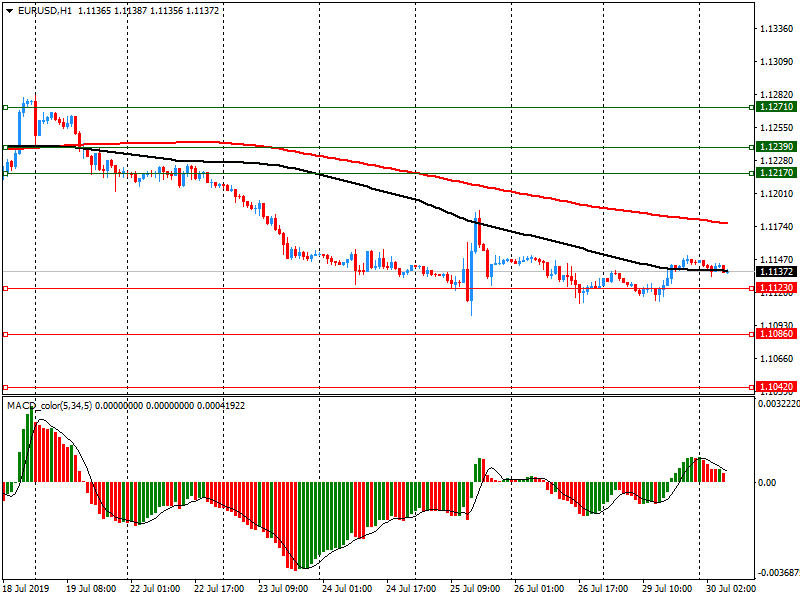
EUR/USD
Resistance levels (open interest**, contracts)
$1.1271 (3149)
$1.1239 (1543)
$1.1217 (383)
Price at time of writing this review: $1.1137
Support levels (open interest**, contracts):
$1.1123 (3365)
$1.1086 (4717)
$1.1042 (2733)
Comments:
- Overall open interest on the CALL options and PUT options with the expiration date August, 9 is 73922 contracts (according to data from July, 29) with the maximum number of contracts with strike price $1,1100 (4717);
GBP/USD
Resistance levels (open interest**, contracts)
$1.2555 (839)
$1.2508 (949)
$1.2462 (334)
Price at time of writing this review: $1.2123
Support levels (open interest**, contracts):
$1.2080 (178)
$1.2037 (160)
$1.1991 (34)
Comments:
- Overall open interest on the CALL options with the expiration date August, 9 is 16286 contracts, with the maximum number of contracts with strike price $1,3000 (2051);
- Overall open interest on the PUT options with the expiration date August, 9 is 19543 contracts, with the maximum number of contracts with strike price $1,2450 (2401);
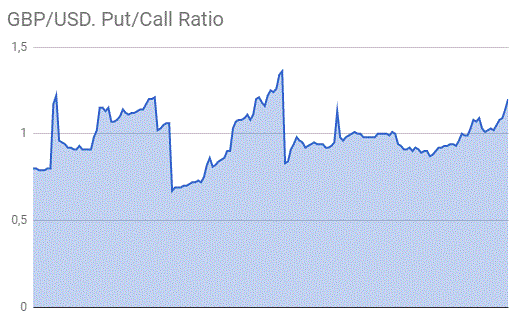
- The ratio of PUT/CALL was 1.20 versus 1.14 from the previous trading day according to data from July, 29
* - The Chicago Mercantile Exchange bulletin (CME) is used for the calculation.
** - Open interest takes into account the total number of option contracts that are open at the moment.
| Raw materials | Closed | Change, % |
|---|---|---|
| Brent | 63.71 | 0.97 |
| WTI | 57.04 | 1.62 |
| Silver | 16.43 | 0.37 |
| Gold | 1426.557 | 0.56 |
| Palladium | 1552.3 | 1.62 |
| Index | Change, points | Closed | Change, % |
|---|---|---|---|
| NIKKEI 225 | -41.35 | 21616.8 | -0.19 |
| Hang Seng | -291.33 | 28106.41 | -1.03 |
| KOSPI | -36.78 | 2029.48 | -1.78 |
| ASX 200 | 32.4 | 6825.8 | 0.48 |
| FTSE 100 | 137.55 | 7686.61 | 1.82 |
| DAX | -2.43 | 12417.47 | -0.02 |
| Dow Jones | 28.9 | 27221.35 | 0.11 |
| S&P 500 | -4.89 | 3020.97 | -0.16 |
| NASDAQ Composite | -36.88 | 8293.33 | -0.44 |
| Pare | Closed | Change, % |
|---|---|---|
| AUDUSD | 0.69004 | -0.12 |
| EURJPY | 121.276 | 0.3 |
| EURUSD | 1.11444 | 0.17 |
| GBPJPY | 132.947 | -1.19 |
| GBPUSD | 1.22166 | -1.32 |
| NZDUSD | 0.663 | -0.04 |
| USDCAD | 1.31592 | -0.05 |
| USDCHF | 0.99148 | -0.17 |
| USDJPY | 108.816 | 0.14 |
© 2000-2026. Bản quyền Teletrade.
Trang web này được quản lý bởi Teletrade D.J. LLC 2351 LLC 2022 (Euro House, Richmond Hill Road, Kingstown, VC0100, St. Vincent and the Grenadines).
Thông tin trên trang web không phải là cơ sở để đưa ra quyết định đầu tư và chỉ được cung cấp cho mục đích làm quen.
Giao dịch trên thị trường tài chính (đặc biệt là giao dịch sử dụng các công cụ biên) mở ra những cơ hội lớn và tạo điều kiện cho các nhà đầu tư sẵn sàng mạo hiểm để thu lợi nhuận, tuy nhiên nó mang trong mình nguy cơ rủi ro khá cao. Chính vì vậy trước khi tiến hành giao dịch cần phải xem xét mọi mặt vấn đề chấp nhận tiến hành giao dịch cụ thể xét theo quan điểm của nguồn lực tài chính sẵn có và mức độ am hiểu thị trường tài chính.
Sử dụng thông tin: sử dụng toàn bộ hay riêng biệt các dữ liệu trên trang web của công ty TeleTrade như một nguồn cung cấp thông tin nhất định. Việc sử dụng tư liệu từ trang web cần kèm theo liên kết đến trang teletrade.vn. Việc tự động thu thập số liệu cũng như thông tin từ trang web TeleTrade đều không được phép.
Xin vui lòng liên hệ với pr@teletrade.global nếu có câu hỏi.


