- Phân tích
- Tin tức và các công cụ
- Tin tức thị trường
Tin tức thì trường
| Time | Country | Event | Period | Previous value | Forecast |
|---|---|---|---|---|---|
| 00:30 | Japan | Manufacturing PMI | June | 38.4 | 37.8 |
| 01:45 | China | Markit/Caixin Manufacturing PMI | June | 50.7 | 50.5 |
| 05:00 | Japan | Consumer Confidence | June | 24.0 | |
| 06:00 | United Kingdom | Nationwide house price index, y/y | June | 1.8% | 1% |
| 06:00 | United Kingdom | Nationwide house price index | June | -1.7% | -0.7% |
| 06:00 | Germany | Retail sales, real unadjusted, y/y | May | -6.5% | -3.5% |
| 06:00 | Germany | Retail sales, real adjusted | May | -5.3% | 3.9% |
| 07:30 | Switzerland | Manufacturing PMI | June | 42.1 | 48.3 |
| 07:50 | France | Manufacturing PMI | June | 40.6 | 52.1 |
| 07:55 | Germany | Manufacturing PMI | June | 36.6 | 44.6 |
| 07:55 | Germany | Unemployment Change | June | 238 | 120 |
| 07:55 | Germany | Unemployment Rate s.a. | June | 6.3% | 6.6% |
| 08:00 | Eurozone | Manufacturing PMI | June | 39.4 | 46.9 |
| 08:30 | United Kingdom | Purchasing Manager Index Manufacturing | June | 40.7 | 50.1 |
| 12:15 | U.S. | ADP Employment Report | June | -2760 | |
| 13:45 | U.S. | Manufacturing PMI | June | 39.8 | 49.6 |
| 14:00 | U.S. | Construction Spending, m/m | May | -2.9% | 1% |
| 14:00 | U.S. | FOMC Member Charles Evans Speaks | |||
| 14:00 | U.S. | ISM Manufacturing | June | 43.1 | 49.4 |
| 14:30 | U.S. | Crude Oil Inventories | June | 1.442 | -0.95 |
| 18:00 | U.S. | FOMC meeting minutes |
- Some short-term economic indicators are now starting to look better but they [ECB] are expecting the recovery to be slow
- We could stop bond purchases even before the envelope exhausted if situation improves enough but could also expand if situation worsens
- We should not draw dogmatic lines on negative rates
- We are likely to see a number of credit events and defaults
The Conference
Board announced on Tuesday its U.S. consumer confidence surged 12.2 points to 98.1
in June from 85.9 in May.
Economists had
expected consumer confidence to come in at 91.8.
May’s consumer
confidence reading was revised down from originally estimated 86.6.
The survey
showed that the expectations index increased from 97.6 last month to 106.0 this
month. Meanwhile, the present situation index rose from 68.4 in May to 86.2.
“Consumer
Confidence partially rebounded in June but remains well below pre-pandemic
levels,” noted Lynn Franco, Senior Director of Economic Indicators at The
Conference Board. “The re-opening of the economy and relative improvement in
unemployment claims helped improve consumers’ assessment of current conditions,
but the Present Situation Index suggests that economic conditions remain weak.
Looking ahead, consumers are less pessimistic about the short-term outlook, but
do not foresee a significant pickup in economic activity. Faced with an
uncertain and uneven path to recovery, and a potential COVID-19 resurgence,
it’s too soon to say that consumers have turned the corner and are ready to
begin spending at pre-pandemic levels.”
MNI Indicators’
report revealed on Tuesday that business activity in Chicago picked up this
month, as Covid-19 related shutdowns eased somewhat.
The MNI Chicago
Business Barometer, also known as Chicago purchasing manager's index (PMI) came
in at 36.6 in June, up from a 38-year low of 32.3 in May. Economists had
forecast the index to increase to 45.0.
Over Q2,
however, business sentiment fell 11.8 points to 34.8, hitting the lowest level
since Q1 2009.
A reading above
50 indicates improving conditions, while a reading below this level shows
worsening of the situation.
According to
the report, New Orders and Production recorded their largest monthly gains in
June, while Supplier Deliveries and Employment faltered.
S&P
reported on Tuesday its Case-Shiller Home Price Index, which tracks home prices
in 20 U.S. metropolitan areas, surged 4.0 percent y-o-y in April, following an
unrevised 3.9 percent y-o-y increase in March.
Economists had
expected an advance of 4.0 percent y-o-y.
Phoenix (+8.8
percent y-o-y), Seattle (+7.3 percent y-o-y) and Minneapolis (+6.4 percent
y-o-y) recorded the highest y-o-y advances in April. Overall, 12 of the 19
cities reported greater price gains in the year ending April versus the year
ending March.
Meanwhile, the
S&P/Case-Shiller U.S. National Home Price Index, which measures all nine
U.S. census divisions, climbed 4.7 percent y-o-y in April, up from 4.6 percent
y-o-y in the previous month.
"April’s
housing price data continue to be remarkably stable," noted Craig J.
Lazzara, Managing Director and Global Head of Index Investment Strategy at
S&P Dow Jones Indices. “April’s year-over-year gains were ahead of March’s,
continuing a trend of gently accelerating home prices that began last fall.
Results in April continued to be broad-based. Prices rose in each of the 19
cities for which we have reported data, and price increases accelerated in 12
cities”, he added.
U.S. stock-index futures fell moderately on Tuesday as investors continued to worry that the recent surge in global coronavirus infections could put at risk a near-term recovery.
Global Stocks:
Index/commodity | Last | Today's Change, points | Today's Change, % |
Nikkei | 22,288.14 | +293.10 | +1.33% |
Hang Seng | 24,427.19 | +125.91 | +0.52% |
Shanghai | 2,984.67 | +23.16 | +0.78% |
S&P/ASX | 5,897.90 | +82.90 | +1.43% |
FTSE | 6,169.09 | -56.68 | -0.91% |
CAC | 4,928.51 | -16.95 | -0.34% |
DAX | 12,236.80 | +4.68 | +0.04% |
Crude oil | $39.04 | -1.66% | |
Gold | $1,780.20 | -0.06% |
FXStreet notes that gold is trading near seven-year highs, currently at $1770, and Commerzbank’s Karen Jones is looking for the yellow metal to reach the top of the 49-year channel at 1981.56.
“Gold uptrend at 1735 has resumed its up move and has eroded its May high at 1765.61. This guards the 1791.16/1803.29 highs from February and October 2012 and November 2011. This area is considered to be the last defence for the 1921.50 September 2011 high. Please note there is room for an overshoot to the top of a 49-year channel at 1981 and this is our long-term target.”
“Immediate support is the three-month uptrend at 1735, but while above 1661.84 (the mid-April low), an immediate upside pressure should be maintained. Only failure here would allow for a slightly deeper retracement to 1645 and potentially 1608 (50% retracement).”
“A longer-term positive bias will be preserved while gold trades above the 1451.45/1445.53 November and March lows.”
(company / ticker / price / change ($/%) / volume)
3M Co | MMM | 154.83 | -0.74(-0.48%) | 589 |
ALCOA INC. | AA | 10.89 | -0.10(-0.91%) | 7359 |
Amazon.com Inc., NASDAQ | AMZN | 2,687.25 | 6.87(0.26%) | 17301 |
American Express Co | AXP | 94.67 | 0.15(0.16%) | 4476 |
AMERICAN INTERNATIONAL GROUP | AIG | 31.31 | 0.63(2.05%) | 641 |
Apple Inc. | AAPL | 360.05 | -1.73(-0.48%) | 227105 |
AT&T Inc | T | 30.05 | 0.14(0.47%) | 98164 |
Boeing Co | BA | 189.23 | -5.26(-2.70%) | 969986 |
Caterpillar Inc | CAT | 124.88 | -0.37(-0.30%) | 24099 |
Chevron Corp | CVX | 87.01 | -0.66(-0.75%) | 11055 |
Cisco Systems Inc | CSCO | 45.97 | -0.18(-0.39%) | 20412 |
Citigroup Inc., NYSE | C | 50.28 | -0.01(-0.02%) | 52667 |
E. I. du Pont de Nemours and Co | DD | 52.5 | 0.03(0.06%) | 174 |
Exxon Mobil Corp | XOM | 43.8 | -0.52(-1.17%) | 58173 |
Facebook, Inc. | FB | 220.35 | -0.29(-0.13%) | 135514 |
FedEx Corporation, NYSE | FDX | 135.49 | 0.94(0.70%) | 13817 |
Ford Motor Co. | F | 5.99 | -0.02(-0.33%) | 281533 |
Freeport-McMoRan Copper & Gold Inc., NYSE | FCX | 11.03 | -0.01(-0.09%) | 8044 |
General Electric Co | GE | 6.79 | -0.01(-0.15%) | 511311 |
General Motors Company, NYSE | GM | 25.2 | -0.10(-0.40%) | 15801 |
Goldman Sachs | GS | 193.63 | 0.16(0.08%) | 6981 |
Google Inc. | GOOG | 1,397.00 | 2.03(0.15%) | 2854 |
Hewlett-Packard Co. | HPQ | 17.1 | -0.03(-0.18%) | 742 |
Home Depot Inc | HD | 246.25 | 0.13(0.05%) | 4248 |
Intel Corp | INTC | 58.75 | 0.48(0.82%) | 37662 |
International Business Machines Co... | IBM | 119.68 | -0.07(-0.06%) | 3727 |
Johnson & Johnson | JNJ | 139.46 | 0.42(0.30%) | 4935 |
JPMorgan Chase and Co | JPM | 93.38 | 0.38(0.41%) | 92010 |
McDonald's Corp | MCD | 182.71 | -0.09(-0.05%) | 2030 |
Merck & Co Inc | MRK | 76.6 | 0.48(0.63%) | 11306 |
Microsoft Corp | MSFT | 197.92 | -0.52(-0.26%) | 59644 |
Nike | NKE | 95.6 | -0.27(-0.28%) | 6320 |
Pfizer Inc | PFE | 32.64 | -0.00(-0.00%) | 34701 |
Procter & Gamble Co | PG | 117.65 | -0.01(-0.01%) | 3785 |
Starbucks Corporation, NASDAQ | SBUX | 73.18 | -0.30(-0.41%) | 11392 |
Tesla Motors, Inc., NASDAQ | TSLA | 1,007.72 | -1.63(-0.16%) | 115841 |
The Coca-Cola Co | KO | 44.38 | 0.02(0.05%) | 17869 |
Twitter, Inc., NYSE | TWTR | 29.57 | 0.08(0.27%) | 58749 |
Verizon Communications Inc | VZ | 54.95 | 0.26(0.48%) | 29403 |
Visa | V | 191 | -0.38(-0.20%) | 2401 |
Wal-Mart Stores Inc | WMT | 119.21 | 0.15(0.13%) | 13831 |
Walt Disney Co | DIS | 111.27 | -0.25(-0.22%) | 21538 |
Yandex N.V., NASDAQ | YNDX | 48.4 | -0.84(-1.71%) | 7006 |
HP (HPQ) initiated with a Market Perform at Cowen; target $18
Statistics
Canada announced on Tuesday that the country’s gross domestic product (GDP)
dropped 11.6 percent m-o-m in April, following a revised 7.5 percent m-o-m fall
in March (originally a 7.2 percent m-o-m contraction). This was the largest
monthly decline in GDP since the series started in 1961 but was better than economists’
forecast of a 13.0 percent m-o-m decrease.
According to
the report, 25 of 26 all sectors recorded declines in April. Manufacturing tumbled
22.5 percent m-o-m in April as all subsectors contracted as many factories were
either completely shut down or operated at a much lower capacity to slow down
the spread of COVID-19. In addition, the construction sector fell 22.9 percent
m-o-m in April, retail trade contracted 22.9 percent m-o-m, the transportation
and warehousing sector dropped 23.1 percent m-o-m, the accommodation and food
services sector plunged 42.4 percent m-o-m. and wholesale trade fell 17.9
percent m-o-m. Meanwhile, information
and communication technologies industries recorded a 0.4 percent m-o-m advance in April.
| Time | Country | Event | Period | Previous value | Forecast | Actual |
|---|---|---|---|---|---|---|
| 06:00 | United Kingdom | Business Investment, y/y | Quarter I | 2.3% | 0.7% | 0.8% |
| 06:00 | United Kingdom | Current account, bln | Quarter I | -9.2 | -15.4 | -21.1 |
| 06:00 | United Kingdom | Business Investment, q/q | Quarter I | -0.3% | 0% | -0.3% |
| 06:00 | United Kingdom | GDP, q/q | Quarter I | 0.0% | -2% | -2.2% |
| 06:00 | United Kingdom | GDP, y/y | Quarter I | 1.1% | -1.6% | -1.7% |
| 06:30 | Switzerland | Retail Sales (MoM) | May | -14.7% | 30.7 | |
| 06:30 | Switzerland | Retail Sales Y/Y | May | -18.8% | 6.6% | |
| 06:45 | France | CPI, m/m | June | 0.1% | -0.1% | |
| 06:45 | France | Consumer spending | May | -19.1% | 30% | 36.6% |
| 06:45 | France | CPI, y/y | June | 0.4% | 0.1% | |
| 07:00 | Switzerland | KOF Leading Indicator | June | 49.6 | 77 | 59.4 |
| 09:00 | Eurozone | Harmonized CPI ex EFAT, Y/Y | June | 0.9% | 0.8% | 0.8% |
| 09:00 | Eurozone | Harmonized CPI, Y/Y | June | 0.1% | 0.1% | 0.3% |
| 10:00 | United Kingdom | MPC Member Andy Haldane Speaks | ||||
| 11:00 | U.S. | FOMC Member Williams Speaks | ||||
| 12:30 | Canada | GDP (m/m) | April | -7.2% | -13% |
GBP fell against most major currencies in the European session on Thursday, weighed down by poor GDP data, lingering fears that Britain will leave the EU without a trade deal, as well as growing concerns that the recent surge in global coronavirus infections could put at risk a near-term recovery.
The Office for National Statistics (ONS) reported the Uk's economy shrank by 2.2% in the first quarter of 2020 instead of a 2.0 percent decrease estimated initially. That was the largest drop in UK GDP since the third quarter of 1979. Economists had forecast the reading to be unrevised. In y/y terms, GDP fell 1.7 percent in the first quarter, revised down from 1.6 percent estimated in May.
Meanwhile, the UK's PM Boris Johnson pledged to make the country the most attractive place to invest and set up a company. He said that finance minister Rishi Sunak would set out plans for "Phase One" of the economy next week.
Coronavirus resurgence concerns and risks of a no-deal Brexit also continued to keep the pound under pressure.
FXStreet reports that differences in age cohorts’ attitudes toward the stock market may be at play, according to Liz Ann Sonders who advises reacting to a full market cycle condensed into a few months by rebalancing rather than trying to anticipate the market’s short-term peaks and valleys.
“Since June 8, which was the most recent peak, the S&P 500 initially suffered a -7.1% pullback through June 11, followed by a 4.3% rally through June 23, and another selloff since then of -3.9%. The most recent peak in the S&P 500 corresponded to the point at which COVID-19 cases shot up again—likely not coincidentally.”
“The peak in the S&P 500 also came within the same time frame as the recent peak in the Federal Reserve’s balance sheet (which has had two consecutive weeks of slight declines). Related, the peak in the S&P 500 also came just after the peak in the 13-week percentage change in M2 money supply. In essence, the ‘shock and awe’ stage of Fed policy announcements is, for now, in the rear-view mirror.”
“I think there is a relationship between the virus and investor sentiment in terms of age cohorts. Much of the speculation in the stock market over the past few months has been concentrated among younger/newer investors and traders.”
“We’ve been recommending that investors remain at their long-term strategic equity allocations; but ‘react’ to the larger swings by considering rebalancing more frequently. This allows portfolios to ‘stay in gear’ by trimming into strength and adding into weakness; vs. trying to time short-term peaks and troughs (which is always extremely difficult).”
FXStreet notes that a very weak report is well-anticipated at this point and economists at TD Securities expect the Canadian GDP to contract by 12% MoM versus the market consensus of a 12.2% contraction. USD/CAD might be more sensitive to an upside surprise.
“Industry-level GDP will confirm another historic contraction in April with output expected to fall 12% MoM for an 18% drop from February, slightly worse than flash estimates from Statistics Canada. We expect a fairly even performance across goods and services and there are few industries where we see any scope for higher output.”
“We think the CAD might demonstrate more sensitivity on an upside surprise. Overall however, we think USD/CAD has put in good work to form a base around 1.35. Meanwhile, the 1.3680/3730 air pocket will be a crucial pivot zone that will pave the way to further topside if it does not hold near-term. Our bias in the coming weeks leans that way.”
FXStreet reports that analysts at Credit Suisse apprise that the S&P 500 ideally holds below 3086 to keep the immediate risk lower within its broader consolidation/corrective phase for a move back below its 200-day average, currently at 3021.
“Our bias remains for 3086 to continue to ideally cap with support seen at 3032 initially, then the 200-day average at 3021. A close back below here should add further weight to our consolidation/corrective view with support seen next at 3000 ahead of 2987 and then more importantly at the June low at 2966.”
“Beneath the June low at 2966 remains needed to see a further price top complete to further reinforce the likelihood for further weakness with support seen next at the 63-day average at 2923. Our ‘ideal’ roadmap is for an eventual test of the 38.2% retracement of the entire rally from March at 2835.”
“Above 3086 can clear the way for further strength in what would look increasingly like a high-level consolidation range with resistance seen next at 3127/3, then more importantly at 3153/56.”
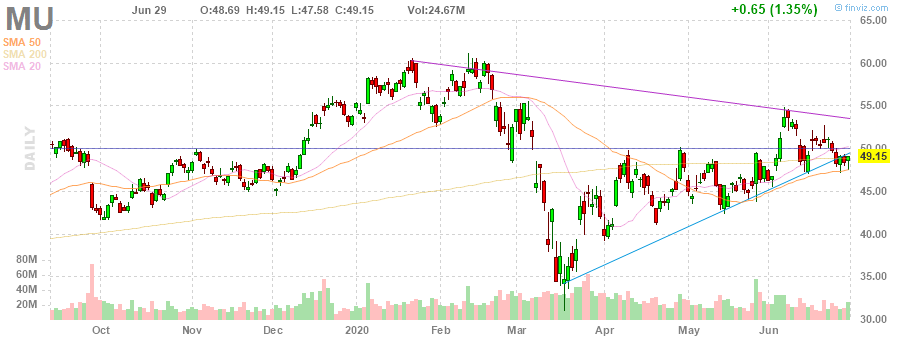
Micron Technology (MU) reported Q3 FY 2020 earnings of $0.82 per share (versus $1.05 per share in Q3 FY 2019), beating analysts’ consensus estimate of $0.68 per share.
The company’s quarterly revenues amounted to $5.438 bln (+13.6% y/y), beating analysts’ consensus estimate of $5.052 bln.
The company also issued upside guidance for Q4 FY 2020, projecting EPS of $0.95-1.15 versus analysts’ consensus estimate of $0.80 and revenues of $5.75-6.25 bln versus analysts’ consensus estimate of $5.51 bln.
MU rose to $51.75 (+5.30%) in pre-market trading.
FXStreet notes that USD/CHF posted a bullish ‘key reversal day’ yesterday to suggest a deeper correction to the upside. The pair appreciates nearly 0.1% so far today to 0.9520, approaching the top of the last 12 days trading range at 0.9553 which ideally caps, per Credit Suisse.
“USD/CHF saw a sharp reversal higher on Monday, posting a bullish ‘key reversal day’ to suggest we might see further corrective upside in the near-term, which ideally is then capped by 0.9553.”
“Post the corrective phase, we look for weakness to resume, with support seen initially at 0.9508, then 0.9479, ahead of 0.9442/33 and 0.9425/20, where we expect to see a first attempt to hold. Removal of here would then expose the current June low at 0.9376, beneath which would see the recently completed ‘hammer’ candlestick negated and we would then expect to see another leg lower. Support is seen thereafter at the 78.6% retracement of the March 2020 surge at 0.9337/21, where we also could see fresh buyers at first.”
“Above 0.9553 in contrast would see a minor base established to suggest a deeper correction higher, with next key resistance area seen at 0.9628/51.”
- We cannot be prisoners of the coronavirus crisis
- We were able to avert a far worse disaster
- Still awaiting for the full economic reverberations to appear
- Government is committed to "unite" and "level up" the UK
- Says that will not use austerity to respond to the crisis
- Finance minister Sunak will set out plans for "Phase One" of economy next week
- This is a chance to be radical and be bold
- We will have "infrastructure revolution" and build enough homes
- We will make UK the most attractive place to invest and set up a company
- We will shortly bring forward the most radical reform of our planning system since WW2
- Risks to the economy remain considerable, two-sided
- In my view, risks are slightly more evenly balanced than in May; they remain skewed to the downside
- In my view, positive news on demand has more than counterbalanced the rise in downside risks to employment
- Monetary policy can do relatively little to avoid problems caused by structural or sectoral shifts in the economy; With interest rates along yield curve close to zero, there is also simply less room for monetary manoeuvre than in the past
- It is more important than ever that central banks are not over-burdened and that anchor of price stability is not disturbed
FXStreet reports that some weakness will bring opportunities to reset long trades in the NZD/USD pair at 0.60 while economists ANZ Bank has updated kiwi’s forecast to 0.65 for the rest of the year.
“Despite having re-opened the domestic economy, beyond an initial bounce-back, the New Zealand economy remains vulnerable to a weak global demand and no international tourism. Although the hole in GDP is likely behind us, the full economic impact of the recession will become clear over the rest of 2020.”
“The NZDs outperformance alongside other risk currencies has been tempered by a dovish central bank. We think this dovishness will linger, as the RBNZ eventually increases its large-scale asset purchases and toys with unconventional policy measures such as negative rates and the purchase of foreign bonds.”
“Against the JPY and the USD we expect consolidation and tactical retracement to offer opportunity for entry given the improved global backdrop.”
“To reflect a more balanced outlook, we have lifted our NZD/USD forecast to 0.65 for the remainder of 2020, recognising the role of liquidity and fiscal support in limiting downside to the global story.”
Reuters reports that a V-shaped recovery of the German economy from the impact of the coronavirus pandemic is unlikely, with two thirds of companies expecting a return to normalcy in 2021 at the earliest, business association DIHK said on Tuesday.
"The V is off the table," DIHK said, adding that its survey of 8,500 companies confirms its forecast for a 10% slump in Germany's economy this year.
The association added that four out of five companies expect their sales to decline this year. "These numbers show the great uncertainty among our companies."
Germany is planning to implement stimulus measures worth more than 130 billion euros ($146 billion) overall to cushion the blow of the pandemic, including a temporary cut in value-added tax and funds to rescue small firms from bankruptcy.
DIHK said bridging aid and stimulus measures were important but cautioned: "Nothing is more important for companies than the chance to be able to generate sales again."
FXStreet reports that some weakness will bring opportunities to reset long trades in the AUD/USD pair at 0.65 while the Reserve Bank of Australia (RBA) will likely act if the aussie surges above 0.70, according to economists at ANZ Bank.
“The transmission clusters across Victoria in particular have challenged the growing expectation of a pronounced bounce back in the domestic economy. Instead, if we apply consumer uncertainty to the many industries hit by the pandemic and shutdowns, the growth path for Australia is more mixed.”
“For the RBA, currency appreciation above 0.70, out of line with fundamentals, will likely draw policy considerations that would see the domestic rates curve flatten.”
“For July, we think there is scope for tactical downside for the AUD given the negative news flow and stretched risk appetite. With global central bank support unlikely to waver, we see this as a buy-the-dip opportunity, particularly against the JPY and USD crosses. We think there will be opportunities to re-enter long positions at around USD0.65.”
“With the AUD having led the recovery, there remains scope for catchup appreciation across the Asian FX complex, which would see Asia/AUD modestly supported. Our year-end targets have lifted and anchored near fair-value of 0.70, representing the more balanced environment that the AUD now sits within.”
According to the report from Eurostat, in June 2020, a month in which many COVID-19 containment measures have been gradually lifted, Euro area annual inflation is expected to be 0.3%, up from 0.1% in May. Meanwhile, the core figures steadied at +0.8% in the reported month when compared to +0.8% expectations and +0.9% previous.
Looking at the main components of euro area inflation, food, alcohol & tobacco is expected to have the highest annual rate in June (3.1%, compared with 3.4% in May), followed by services (1.2%, compared with 1.3% in May), non-energy industrial goods (0.2%, stable compared with May) and energy (-9.4%, compared with -11.9% in May)
FXStreet reports that EUR/CHF’s a-b-c correction has terminated ahead of the 55-day ma at 1.0622 and Karen Jones, Team Head FICC Technical Analysis Research at Commerzbank, now expects a retest of the 1.0915 June high.
“EUR/CHF has completed an a-b-c’ correction, which has halted ahead of the 55-day ma at 1.0622. This has held the downside and provoked recovery and we look for a retest of the 2018-2020 downtrend at 1.0873 this week and the 1.0915 June high. Initial resistance is the 200-day ma at 1.0750.”
“A close above 1.0915 will target the 1.1058/75 October 2019 high and the 38.2% retracement down from the 2018 peak. Above here would target the 200-week ma at 1.1141.”
“Below the 55-day would retarget the 1.0577 low and this guards the 1.0509/00 support (not favoured).”
Bloomberg reports that confidence among U.S. chief executives plummeted to the lowest level since the financial crisis and more than a quarter don’t see conditions at their companies recovering until after 2021 as the coronavirus reverberates through the economy.
The Business Roundtable’s second-quarter economic outlook index, which measures hiring and capital spending plans as well as sales expectations, slumped by 38.4 points to 34.3 from the previous quarter, the Washington-based lobbying group said Monday. Readings below 50 are consistent with a recession, which the National Bureau of Economic Research said the economy entered in February.
Some 27% see business conditions fully recovering at their firms after next year, underscoring the toll of the pandemic and state lockdowns of businesses that have started to lift. The CEOs project the economy will shrink 3.8% this year after hiring and capital investment plans declined along with sales expectations.
In the survey of 136 CEOs conducted June 1-22, all executives said they have already adopted, or plan to adopt, physical distancing measures at their facilities, while 95% have expanded flexible work arrangements. In light of recent increases in Covid-19 cases in several states, the group urged officials to take more steps to mitigate the spread of the disease.
“We urge lawmakers at the federal, state and local levels to coordinate as much as possible to control further spread of this virus,” Walmart Inc. CEO Doug McMillon, the Business Roundtable’s chairman, said in a statement.
Reuters reports that confidence among British businesses improved in June for the first time since January ahead of the latest relaxation of the country's coronavirus lockdown, according to a survey published by Lloyds Bank on Tuesday.
Business confidence rose by three percentage points to its highest level since March but remained deeply in negative territory at -30%, the survey showed.
Slightly fewer companies expected to lay off staff - 41% compared with 44% in May - and the proportion planning a pay freeze edged down.
"While the results suggest the economy may be starting to see some improvement, trading conditions remain difficult for most firms as the majority are still experiencing disruption to supply chains," said Hann-Ju Ho, senior economist at Lloyds Bank Commercial Banking.
Confidence among construction firms rebounded strongly by 30 points, followed by smaller improvements for retailers and manufacturers while services reported a fall as the hospitality and education sectors continued to face lockdown restrictions.
The survey was conducted between June 1 and June 15, after the reopening of non-essential retailers but before Prime Minister Boris Johnson said on June 23 that bars, restaurants and other consumer-facing businesses could reopen from July 4.
FXStreet reports that gold consolidates in a familiar range around $1770 as investors will be listening today to US Fed Chair Powell for insights into future monetary policy amid the fresh outbreak of coronavirus cases, per ANZ Bank.
“Gold was steady, with prices trading just below $1,800/oz as safe-haven assets remain in demand amid the rising infections of COVID-19. Cases have exceeded 10 million worldwide, with an acceleration in America, Brazil and India. This is raising expectations of further stimulus measures from central banks.”
“Insight into the US Fed’s outlook may be revealed this week, with Chairman Jerome Powell and US Treasury Secretary Steven Mnuchin testifying before the House Financial Services Committee.”
“Investors continue to pile into the physical market. Exchange traded funds are on track for their 14th week of net inflows, according to Bloomberg data.”
This comes on the back of the US announcing that it will pare back its special status treatment of Hong Kong, saying that they will take back some trade benefits it affords Hong Kong; adding that further measures are also being evaluated.
According to the report from KOF Economic Research Agency, the economic barometer increases significantly in June. After the sharp declines of the last three months, the barometer is thus rising again for the first time. However, with a value comparable to April, the barometer is still considerably below its long-term average. As a result, the prospects of the Swiss economy are very subdued, but brightening up somewhat compared to the previous months.
The KOF Economic Barometer rises by 9.8 points in June, from 49.6 (revised from 53.2) to 59.4. The negative tendencies of the indicator groups of the individual sectors, which had led to a halving of the barometer value since the beginning of the year, now seem to have been halted. The outlook for the manufacturing sector remains at a very low level, but is brightening up the strongest compared to the other sectors. Also starting from a very low level, the sets of indicators from other services and construction are sending slightly more positive signals. By contrast, the prospects for the hospitality industry and those of consumers remain bleak.
Within the manufacturing sector, all sub-indicators point in an upward direction. The outlook for the metal industry, which has slumped sharply in previous months, is now brightening up most strongly compared to other sectors. In a comparable manner, indicators from the mechanical engineering industry, the wood, glass, stone and earth industry, the electrical industry and the textile and clothing industry are sending a somewhat more positive signal. By contrast, the outlook for the chemical, pharmaceutical and plastics industry remains virtually unchanged.
The incipient trend reversal, starting from a historically low level, within the good producing sector (manufacturing and construction) is mainly due to indicators for the assessment of order backlogs, production and the overall business situation. The assessment of intermediate goods also contributes to the somewhat brighter development of the good producing sector.
| Time | Country | Event | Period | Previous value | Forecast | Actual |
|---|---|---|---|---|---|---|
| 01:00 | China | Non-Manufacturing PMI | June | 53.6 | 54.4 | |
| 01:00 | New Zealand | ANZ Business Confidence | June | -41.8 | -34.4 | |
| 01:00 | China | Manufacturing PMI | June | 50.6 | 50.4 | 50.9 |
| 01:30 | Australia | Private Sector Credit, y/y | May | 3.6% | 3.2% | |
| 01:30 | Australia | Private Sector Credit, m/m | May | 0.0% | 0.2% | -0.1% |
| 02:30 | Australia | RBA Assist Gov Debelle Speaks | ||||
| 05:00 | Japan | Construction Orders, y/y | May | -14.2% | -6.1% | |
| 05:00 | Japan | Housing Starts, y/y | May | -12.9% | -15.9% | -12.3% |
| 06:00 | United Kingdom | Business Investment, y/y | Quarter I | 2.3% | 0.7% | 0.8% |
| 06:00 | United Kingdom | Current account, bln | Quarter I | -9.2 | -15.4 | -21.1 |
| 06:00 | United Kingdom | Business Investment, q/q | Quarter I | -0.3% | 0% | -0.3% |
| 06:00 | United Kingdom | GDP, q/q | Quarter I | 0.0% | -2% | -2.2% |
| 06:00 | United Kingdom | GDP, y/y | Quarter I | 1.1% | -1.6% | -1.7% |
| 06:30 | Switzerland | Retail Sales (MoM) | May | -14.7% | 30.7 | |
| 06:30 | Switzerland | Retail Sales Y/Y | May | -18.8% | 6.6% | |
| 06:45 | France | CPI, m/m | June | 0.1% | -0.1% | |
| 06:45 | France | Consumer spending | May | -19.1% | 30% | 36.6% |
| 06:45 | France | CPI, y/y | June | 0.4% | 0.1% | |
| 07:00 | Switzerland | KOF Leading Indicator | June | 53.2 | 77 | 59.4 |
In today's Asian trading, the US dollar rose against the euro and the Japanese yen.
The ICE Dollar index, which shows the value of the US dollar against six major world currencies, rose 0.18% from the previous day.
The US economy is experiencing a period of" extreme uncertainty", especially in connection with the ongoing attempts to limit the spread of the coronavirus, noted in a speech by Jerome Powell, head of the US Federal Reserve, prepared to address the financial services committee of the US House of Representatives.
Powell noted the importance of curbing the rate of spread of the coronavirus against the backdrop of the recovery of the US economy after the most significant fall in decades.
"We have entered an important new phase and have done so earlier than expected," reported in the text of Powell's speech. "While we welcome this surge in economic activity, it also presents us with new challenges, particularly the need to contain the virus."
The UK economy in the 1st quarter fell by 2.2% compared to the previous three months, according to final data from the Office for National statistics (ONS). This is the highest decrease since the third quarter of 1979. Relative to January-March 2019, the drop in GDP was 1.7%. Previously, it was announced that the first indicator would be reduced by 2% and the second by 1.6%. Analysts did not expect a revision of both indicators.
According to the report from INSEE, over a year, the Consumer Price Index (CPI) should rise by 0.1% in June 2020, after +0.4% in the previous month, according to the provisional estimate made at the end of the month. This drop in inflation should result from a slowdown in service and food prices and an accentuated fall in the prices of manufactured products. Contrariwise, energy prices should drop less than in May. Finally, tobacco prices should increase year on year at the same pace as in the previous month.
Over one month, consumer prices should edge down by 0.1%, after +0.1% in the previous month. Food prices should sharply fall back, those of services and tobacco should slow down and those of manufactured products should drop more. Contrariwise, energy prices should rebound, after four months of sharp decrease.
Year on year, the Harmonised Index of Consumer Prices should slow down, to +0.1%, after +0.4% in May. Over one month, it should fall back by 0.1%, after +0.2% in the previous month.
According to the report from Federal Statistical Office, turnover adjusted for sales days and holidays rose in the retail sector by 5.6% in nominal terms in May 2020 compared with the previous year. Seasonally adjusted, nominal turnover rose by 30.2% compared with the previous month.
Real turnover adjusted for sales days and holidays rose in the retail sector by 6.6% in May 2020 compared with the previous year. Real growth takes inflation into consideration. Compared with the previous month, real, seasonally adjusted retail trade turnover registered an increase of 30.7%.
Adjusted for sales days and holidays, the retail sector excluding service stations showed an 8.2% increase in nominal turnover in May 2020 compared with May 2019 (in real terms +8.9%). Retail sales of food, drinks and tobacco registered an increase in nominal turnover of 20.8% (in real terms +20.1%), whereas the non-food sector registered a nominal negative of 3.2% (in real terms –1.7%). Sectors that have been negatively affected by the crisis reported varying growth patterns: While “other household equipment, textiles, DIY and furniture” saw gains (+16.5%; in real terms +18.4%), in the sector “other goods (clothing, chemists, watches and jewellery)” (–20.8%; in real terms –20.2%) turnover fell again although less than in April. Sustained and increased turnover growth were recorded by the sectors “market stalls, retail sale via mail order houses or via internet” (+29.4%; in real terms +30.0%) and “information and communication equipment” (+31.3%; in real terms +42.5%).
Excluding service stations, the retail sector showed a seasonally adjusted increase in nominal turnover of 32.1% compared with the previous month (in real terms +32.2%). Retail sales of food, drinks and tobacco registered a plus of 13.3% (in real terms +13.7%). The non-food sector showed a plus of 61.2% (in real terms +61.4%).
According to the report from Office for National Statistics, UK gross domestic product (GDP) in volume terms fell by 2.2% in Quarter 1 (Jan to Mar) 2020, revised downwards by 0.2 percentage points from the first quarterly estimate; this is now the joint largest fall in UK GDP since Quarter 3 (July to Sept) 1979. Economists had expected a 2.0% decrease.
When compared with the same quarter a year ago, UK GDP decreased by 1.7% in Quarter 1 2020, a downward revision of 0.1 percentage points from the previous estimate. Economists had expected a 1.6% decrease.
This release captures the first direct effects of the coronavirus (COVID-19) pandemic, and the government measures taken to reduce transmission of the virus.
The services, production and construction sectors provided a negative contribution to growth in the output approach to GDP in Quarter 1 2020; with services output falling by a record 2.3% in the latest quarter.
Household consumption declined by 2.9% in Quarter 1 2020, revised downwards by 1.2 percentage points from the first quarterly estimate; this is now the largest decline in household consumption since Quarter 3 (July to Sept) 1979.
UK GDP increased by 1.5% between 2018 and 2019, revised upwards by 0.1 percentage points from the previous estimate.
The households saving ratio increased to 8.6% in Quarter 1 2020, compared with 6.6% in Quarter 4 (Oct to Dec) 2019.
RTTNews reports that the manufacturing sector in China continued to expand in June, and at a slightly faster rate, the latest survey from the National Bureau of Statistics showed on Tuesday with a manufacturing PMI score of 50.9.
That beat expectations for 50.4 and was up from 50.6 in May. It also moves further above the boom-or-bust line of 50 that separates expansion from contraction.
The bureau also noted that its non-manufacturing index came in with a score of 54.4. That also beat expectations for 54.1 and was up from 53.6 in the previous month.
EUR/USD
Resistance levels (open interest**, contracts)
$1.1317 (2049)
$1.1286 (1863)
$1.1268 (1172)
Price at time of writing this review: $1.1232
Support levels (open interest**, contracts):
$1.1186 (866)
$1.1145 (1479)
$1.1098 (2362)
Comments:
- Overall open interest on the CALL options and PUT options with the expiration date July, 2 is 57535 contracts (according to data from June, 29) with the maximum number of contracts with strike price $1,1100 (2362);
GBP/USD
Resistance levels (open interest**, contracts)
$1.2502 (508)
$1.2455 (758)
$1.2372 (850)
Price at time of writing this review: $1.2290
Support levels (open interest**, contracts):
$1.2220 (1292)
$1.2183 (836)
$1.2140 (650)
Comments:
- Overall open interest on the CALL options with the expiration date July, 2 is 16186 contracts, with the maximum number of contracts with strike price $1,2800 (1689);
- Overall open interest on the PUT options with the expiration date July, 2 is 19094 contracts, with the maximum number of contracts with strike price $1,2550 (1473);
- The ratio of PUT/CALL was 1.18 versus 1.17 from the previous trading day according to data from June, 29
* - The Chicago Mercantile Exchange bulletin (CME) is used for the calculation.
** - Open interest takes into account the total number of option contracts that are open at the moment.
| Raw materials | Closed | Change, % |
|---|---|---|
| Brent | 41.66 | 3.55 |
| Silver | 17.83 | 0.06 |
| Gold | 1772.475 | 0.09 |
| Palladium | 1892.21 | 0.96 |
| Index | Change, points | Closed | Change, % |
|---|---|---|---|
| NIKKEI 225 | -517.04 | 21995.04 | -2.3 |
| Hang Seng | -248.71 | 24301.28 | -1.01 |
| KOSPI | -41.17 | 2093.48 | -1.93 |
| ASX 200 | -89.1 | 5815 | -1.51 |
| FTSE 100 | 66.47 | 6225.77 | 1.08 |
| DAX | 142.73 | 12232.12 | 1.18 |
| CAC 40 | 35.82 | 4945.46 | 0.73 |
| Dow Jones | 580.25 | 25595.8 | 2.32 |
| S&P 500 | 44.19 | 3053.24 | 1.47 |
| NASDAQ Composite | 116.93 | 9874.15 | 1.2 |
| Time | Country | Event | Period | Previous value | Forecast |
|---|---|---|---|---|---|
| 01:00 | China | Non-Manufacturing PMI | June | 53.6 | |
| 01:00 | New Zealand | ANZ Business Confidence | June | -41.8 | |
| 01:00 | China | Manufacturing PMI | June | 50.6 | 50.4 |
| 01:30 | Australia | Private Sector Credit, y/y | May | 3.6% | |
| 01:30 | Australia | Private Sector Credit, m/m | May | 0.0% | 0.2% |
| 02:30 | Australia | RBA Assist Gov Debelle Speaks | |||
| 05:00 | Japan | Construction Orders, y/y | May | -14.2% | |
| 05:00 | Japan | Housing Starts, y/y | May | -12.9% | -15.9% |
| 06:00 | United Kingdom | Nationwide house price index, y/y | June | 1.8% | |
| 06:00 | United Kingdom | Nationwide house price index | June | -1.7% | |
| 06:00 | United Kingdom | Business Investment, y/y | Quarter I | 1.8% | 0.7% |
| 06:00 | United Kingdom | Current account, bln | Quarter I | -5.6 | -15.8 |
| 06:00 | United Kingdom | Business Investment, q/q | Quarter I | -0.5% | 0% |
| 06:00 | United Kingdom | GDP, q/q | Quarter I | 0.0% | -2% |
| 06:00 | United Kingdom | GDP, y/y | Quarter I | 1.1% | -1.6% |
| 06:30 | Switzerland | Retail Sales (MoM) | May | -14.7% | |
| 06:30 | Switzerland | Retail Sales Y/Y | May | -19.9% | |
| 06:45 | France | CPI, m/m | June | 0.1% | |
| 06:45 | France | Consumer spending | May | -20.2% | 25% |
| 06:45 | France | CPI, y/y | June | 0.4% | |
| 07:00 | Switzerland | KOF Leading Indicator | June | 53.2 | 77 |
| 09:00 | Eurozone | Harmonized CPI ex EFAT, Y/Y | June | 0.9% | 0.8% |
| 09:00 | Eurozone | Harmonized CPI, Y/Y | June | 0.1% | 0.1% |
| 10:00 | United Kingdom | MPC Member Andy Haldane Speaks | |||
| 11:00 | U.S. | FOMC Member Williams Speaks | |||
| 12:30 | Canada | GDP (m/m) | April | -7.2% | -12.3% |
| 13:00 | U.S. | S&P/Case-Shiller Home Price Indices, y/y | April | 3.9% | 3.7% |
| 13:45 | U.S. | Chicago Purchasing Managers' Index | June | 32.3 | 44.5 |
| 14:00 | U.S. | Consumer confidence | June | 86.6 | 90 |
| 15:00 | U.S. | FOMC Member Williams Speaks | |||
| 15:05 | U.S. | FOMC Member Brainard Speaks | |||
| 16:30 | U.S. | Fed Chair Powell Testimony | |||
| 18:00 | U.S. | FOMC Member Bostic Speaks | |||
| 18:00 | U.S. | FOMC Member Kashkari Speaks | |||
| 22:30 | Australia | AIG Manufacturing Index | June | 41.6 | |
| 23:50 | Japan | BoJ Tankan. Non-Manufacturing Index | Quarter II | 8 | -18 |
| 23:50 | Japan | BoJ Tankan. Manufacturing Index | Quarter II | -8 | -31 |
| Pare | Closed | Change, % |
|---|---|---|
| AUDUSD | 0.6865 | 0.24 |
| EURJPY | 120.894 | 0.58 |
| EURUSD | 1.1239 | 0.15 |
| GBPJPY | 132.247 | 0.1 |
| GBPUSD | 1.22964 | -0.3 |
| NZDUSD | 0.64197 | 0.17 |
| USDCAD | 1.36586 | -0.17 |
| USDCHF | 0.95096 | 0.39 |
| USDJPY | 107.561 | 0.43 |


© 2000-2026. Bản quyền Teletrade.
Trang web này được quản lý bởi Teletrade D.J. LLC 2351 LLC 2022 (Euro House, Richmond Hill Road, Kingstown, VC0100, St. Vincent and the Grenadines).
Thông tin trên trang web không phải là cơ sở để đưa ra quyết định đầu tư và chỉ được cung cấp cho mục đích làm quen.
Giao dịch trên thị trường tài chính (đặc biệt là giao dịch sử dụng các công cụ biên) mở ra những cơ hội lớn và tạo điều kiện cho các nhà đầu tư sẵn sàng mạo hiểm để thu lợi nhuận, tuy nhiên nó mang trong mình nguy cơ rủi ro khá cao. Chính vì vậy trước khi tiến hành giao dịch cần phải xem xét mọi mặt vấn đề chấp nhận tiến hành giao dịch cụ thể xét theo quan điểm của nguồn lực tài chính sẵn có và mức độ am hiểu thị trường tài chính.
Sử dụng thông tin: sử dụng toàn bộ hay riêng biệt các dữ liệu trên trang web của công ty TeleTrade như một nguồn cung cấp thông tin nhất định. Việc sử dụng tư liệu từ trang web cần kèm theo liên kết đến trang teletrade.vn. Việc tự động thu thập số liệu cũng như thông tin từ trang web TeleTrade đều không được phép.
Xin vui lòng liên hệ với pr@teletrade.global nếu có câu hỏi.
ngân hàng