- Phân tích
- Tin tức và các công cụ
- Tin tức thị trường
Tin tức thì trường
Federal Reserve Bank of Atlanta President Bostic said on Thursday that there is still a distance to go on inflation, adding that the central bank should wait for more data before cutting rates.
Key quotes
Inflation has more room to decline.
Sees solid employment despite the historical context.
Waits for more data before considering a rate cut.
Prefers waiting longer, even if it means being cautious.
It would not be good to cut rates only to have to raise them again.
Market reaction
The US Dollar Index (DXY) is trading 0.06% lower on the day at 101.00, as of writing.
Fed FAQs
Monetary policy in the US is shaped by the Federal Reserve (Fed). The Fed has two mandates: to achieve price stability and foster full employment. Its primary tool to achieve these goals is by adjusting interest rates. When prices are rising too quickly and inflation is above the Fed’s 2% target, it raises interest rates, increasing borrowing costs throughout the economy. This results in a stronger US Dollar (USD) as it makes the US a more attractive place for international investors to park their money. When inflation falls below 2% or the Unemployment Rate is too high, the Fed may lower interest rates to encourage borrowing, which weighs on the Greenback.
The Federal Reserve (Fed) holds eight policy meetings a year, where the Federal Open Market Committee (FOMC) assesses economic conditions and makes monetary policy decisions. The FOMC is attended by twelve Fed officials – the seven members of the Board of Governors, the president of the Federal Reserve Bank of New York, and four of the remaining eleven regional Reserve Bank presidents, who serve one-year terms on a rotating basis.
In extreme situations, the Federal Reserve may resort to a policy named Quantitative Easing (QE). QE is the process by which the Fed substantially increases the flow of credit in a stuck financial system. It is a non-standard policy measure used during crises or when inflation is extremely low. It was the Fed’s weapon of choice during the Great Financial Crisis in 2008. It involves the Fed printing more Dollars and using them to buy high grade bonds from financial institutions. QE usually weakens the US Dollar.
Quantitative tightening (QT) is the reverse process of QE, whereby the Federal Reserve stops buying bonds from financial institutions and does not reinvest the principal from the bonds it holds maturing, to purchase new bonds. It is usually positive for the value of the US Dollar.
- USD/CAD trades with mild losses around 1.3480 in Thursday’s early Asian session.
- The Fed's dovish remarks continue to weigh on the US Dollar.
- The BoC is expected to cut more interest rates in its September meeting next week.
The USD/CAD pair trades on a weaker note near 1.3480 during the early Asian session on Thursday. The US Federal Reserve (Fed) Chair Jerome Powell signalled that the central bank is ready to ease its monetary policy this year, which weighed on the Greenback in the previous session. Investors await the preliminary US Q2 Gross Domestic Product (Q2) and the Fed's Raphael Bostic speech on Thursday for fresh drivers.
Fed Chair Jerome Powell hinted at Jackson Hole last week that cutting the interest rates is finally on the horizon, saying that “the time has come for policy to adjust.” Markets are now pricing in around 25-35% for a 50 basis points (bps) Fed rate cut, with 100 bps of easing still seen by year-end. Market players will closely watch the US employment report, as any signs of weakness in the labor market could trigger a deeper rate cut by the Fed and continue to undermine the US Dollar (USD).
The usual weekly Initial Jobless Claims for the week ending August 24 are estimated to remain unchanged at 232K compared to the previous reading. The attention will shift to the US Nonfarm Payrolls for August next week, which might offer some hints about the size of the Fed rate cut.
On the CAD’s front, economists expect the Bank of Canada (BoC) to cut additional interest rates for a third consecutive meeting next week due to persistent economic weakness, rising unemployment, and cooling down inflation. This, in turn, might drag the Canadian Dollar (CAD) lower against the Greenback.
Canadian Dollar FAQs
The key factors driving the Canadian Dollar (CAD) are the level of interest rates set by the Bank of Canada (BoC), the price of Oil, Canada’s largest export, the health of its economy, inflation and the Trade Balance, which is the difference between the value of Canada’s exports versus its imports. Other factors include market sentiment – whether investors are taking on more risky assets (risk-on) or seeking safe-havens (risk-off) – with risk-on being CAD-positive. As its largest trading partner, the health of the US economy is also a key factor influencing the Canadian Dollar.
The Bank of Canada (BoC) has a significant influence on the Canadian Dollar by setting the level of interest rates that banks can lend to one another. This influences the level of interest rates for everyone. The main goal of the BoC is to maintain inflation at 1-3% by adjusting interest rates up or down. Relatively higher interest rates tend to be positive for the CAD. The Bank of Canada can also use quantitative easing and tightening to influence credit conditions, with the former CAD-negative and the latter CAD-positive.
The price of Oil is a key factor impacting the value of the Canadian Dollar. Petroleum is Canada’s biggest export, so Oil price tends to have an immediate impact on the CAD value. Generally, if Oil price rises CAD also goes up, as aggregate demand for the currency increases. The opposite is the case if the price of Oil falls. Higher Oil prices also tend to result in a greater likelihood of a positive Trade Balance, which is also supportive of the CAD.
While inflation had always traditionally been thought of as a negative factor for a currency since it lowers the value of money, the opposite has actually been the case in modern times with the relaxation of cross-border capital controls. Higher inflation tends to lead central banks to put up interest rates which attracts more capital inflows from global investors seeking a lucrative place to keep their money. This increases demand for the local currency, which in Canada’s case is the Canadian Dollar.
Macroeconomic data releases gauge the health of the economy and can have an impact on the Canadian Dollar. Indicators such as GDP, Manufacturing and Services PMIs, employment, and consumer sentiment surveys can all influence the direction of the CAD. A strong economy is good for the Canadian Dollar. Not only does it attract more foreign investment but it may encourage the Bank of Canada to put up interest rates, leading to a stronger currency. If economic data is weak, however, the CAD is likely to fall.
- EUR/USD slipped back below 1.1150 as bidders struggle to maintain balance.
- A breakdown in bullish market sentiment is giving the Greenback room to breathe.
- EU and US inflation prints due at the end of the week to dominate investor attention.
EUR/USD trimmed recent gains on Wednesday, stepping lower after clipping fresh highs for the year as broad-market anticipation of Federal Reserve (Fed) rate cuts in September keeps broad-market risk appetite pinned to the ceiling.
There is little of note on the economic calendar for the middle range of the trading week, but Thursday will bring an update on US Gross Domestic Product (GDP) figures, which will be closely watched. However, little movement is expected as markets have broadly priced in Q2 annualized GDP growth to hold steady near 2.8%.
Friday’s data docket shows promise for markets slipping into a boredom trance, with a fresh print of pan-EU Harmonized Index of Consumer Prices (HICP) inflation due early in the European market session. Core EU HICP inflation is expected to continue trimming lower across the board, forecast to print at 2.8% YoY in August compared to the previous print of 2.9%.
US Personal Consumption Expenditure Price Index (PCE) inflation due on Friday remains the week’s key print, and investors are shuffling their feet while they wait for signs that inflation will continue to ease, or at least not rise, fast enough that the Federal Reserve (Fed) will be kept on rails to deliver a hotly-anticipated rate cut on September 18.
EUR/USD price forecast
EUR/USD slipped back below the 1.1150 level on Wednesday as bidders struggle to keep the Fiber moving north. The pair is still testing the waters well north of the 200-day Exponential Moving Average (EMA) at 1.0850, but a sustained slide will quickly see price action tumble back to the 50-day EMA near 1.0940.
EUR/USD daily chart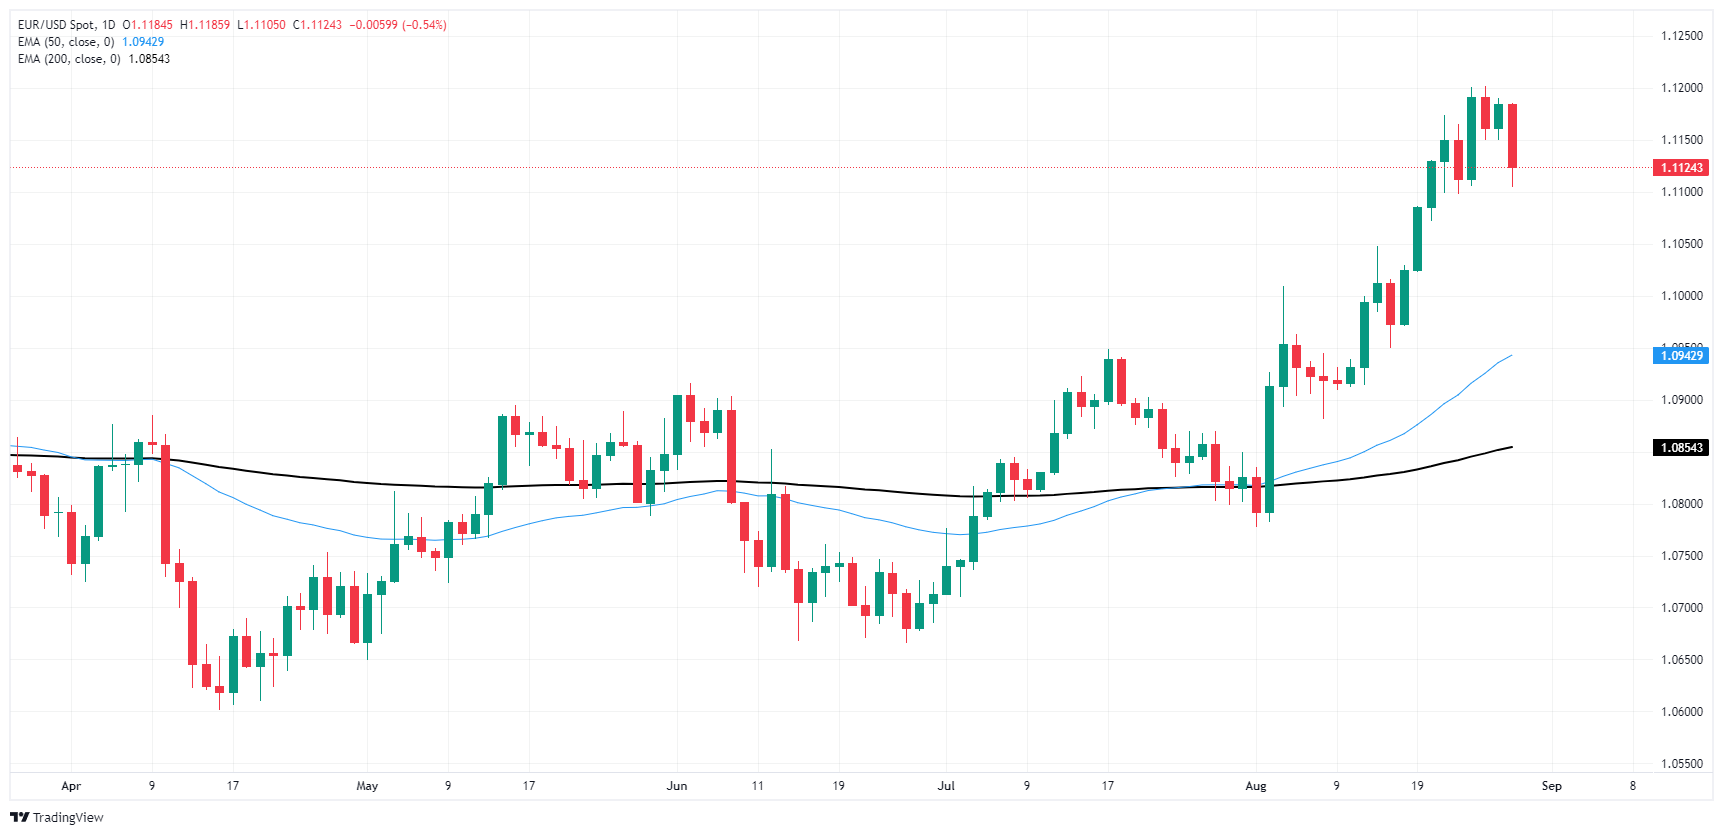
Euro FAQs
The Euro is the currency for the 20 European Union countries that belong to the Eurozone. It is the second most heavily traded currency in the world behind the US Dollar. In 2022, it accounted for 31% of all foreign exchange transactions, with an average daily turnover of over $2.2 trillion a day. EUR/USD is the most heavily traded currency pair in the world, accounting for an estimated 30% off all transactions, followed by EUR/JPY (4%), EUR/GBP (3%) and EUR/AUD (2%).
The European Central Bank (ECB) in Frankfurt, Germany, is the reserve bank for the Eurozone. The ECB sets interest rates and manages monetary policy. The ECB’s primary mandate is to maintain price stability, which means either controlling inflation or stimulating growth. Its primary tool is the raising or lowering of interest rates. Relatively high interest rates – or the expectation of higher rates – will usually benefit the Euro and vice versa. The ECB Governing Council makes monetary policy decisions at meetings held eight times a year. Decisions are made by heads of the Eurozone national banks and six permanent members, including the President of the ECB, Christine Lagarde.
Eurozone inflation data, measured by the Harmonized Index of Consumer Prices (HICP), is an important econometric for the Euro. If inflation rises more than expected, especially if above the ECB’s 2% target, it obliges the ECB to raise interest rates to bring it back under control. Relatively high interest rates compared to its counterparts will usually benefit the Euro, as it makes the region more attractive as a place for global investors to park their money.
Data releases gauge the health of the economy and can impact on the Euro. Indicators such as GDP, Manufacturing and Services PMIs, employment, and consumer sentiment surveys can all influence the direction of the single currency. A strong economy is good for the Euro. Not only does it attract more foreign investment but it may encourage the ECB to put up interest rates, which will directly strengthen the Euro. Otherwise, if economic data is weak, the Euro is likely to fall. Economic data for the four largest economies in the euro area (Germany, France, Italy and Spain) are especially significant, as they account for 75% of the Eurozone’s economy.
Another significant data release for the Euro is the Trade Balance. This indicator measures the difference between what a country earns from its exports and what it spends on imports over a given period. If a country produces highly sought after exports then its currency will gain in value purely from the extra demand created from foreign buyers seeking to purchase these goods. Therefore, a positive net Trade Balance strengthens a currency and vice versa for a negative balance.
- GBP/USD slid back below 1.3200 on Wednesday.
- Recent bullish market flows are taking a breather.
- Rate-cut-hungry markets look ahead to Friday’s US PCE inflation.
GBP/USD fell back below 1.3200 on Wednesday after near-term bullish momentum eased. Markets have piled into a one-sided risk appetite stance as investors hunker down for the long wait to an anticipated kickoff of a rate-cutting cycle from the Federal Reserve (Fed) in September.
UK economic data remains limited this week, leaving the Pound Sterling exposed to broad-market sentiment flows. US Gross Domestic Product (GDP) figures are slated to release on Thursday, but little movement is expected as markets have broadly priced in Q2 annualized GDP growth to hold steady near 2.8%.
US Personal Consumption Expenditure Price Index (PCE) inflation due on Friday remains the week’s key print, and investors are shuffling their feet while they wait for signs that inflation will continue to ease, or at least not rise, fast enough that the Federal Reserve (Fed) will be kept on rails to deliver a hotly-anticipated rate cut on September 18.
GBP/USD price forecast
GBP/USD gave up ground on Wednesday, retreating from fresh 29-month highs hit this week. Downside momentum remains limited for the time being, but bids have slipped back below the 1.3200 handle and bearish momentum has plenty of room to run with price action trading well north of the 200-day Exponential Moving Average (EMA) at 1.2695.
GBP/USD daily chart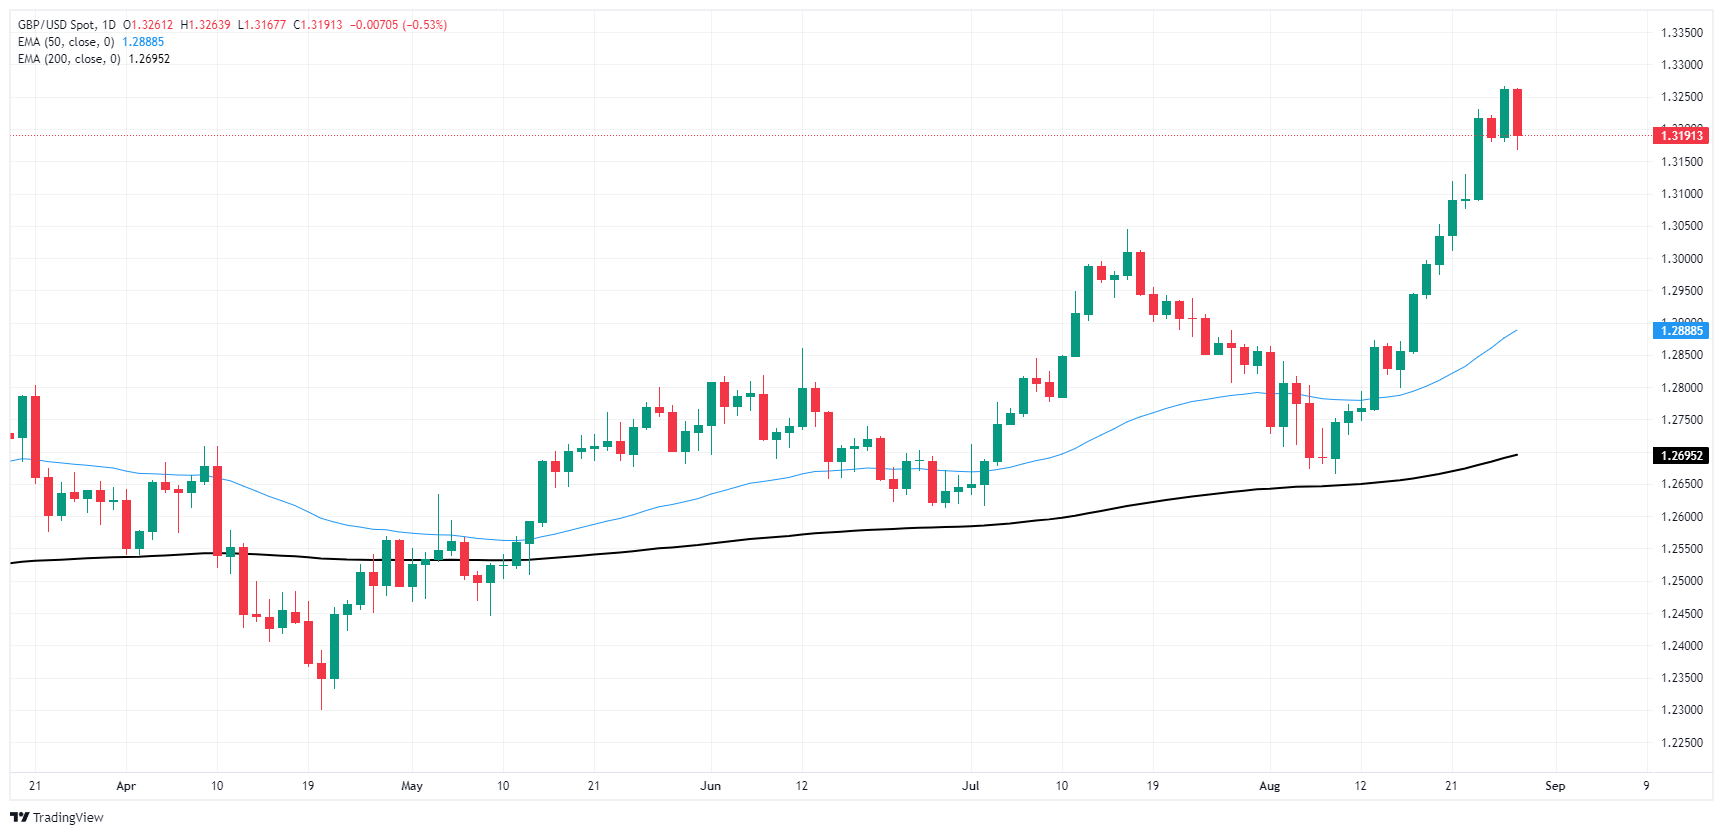
Pound Sterling FAQs
The Pound Sterling (GBP) is the oldest currency in the world (886 AD) and the official currency of the United Kingdom. It is the fourth most traded unit for foreign exchange (FX) in the world, accounting for 12% of all transactions, averaging $630 billion a day, according to 2022 data. Its key trading pairs are GBP/USD, aka ‘Cable’, which accounts for 11% of FX, GBP/JPY, or the ‘Dragon’ as it is known by traders (3%), and EUR/GBP (2%). The Pound Sterling is issued by the Bank of England (BoE).
The single most important factor influencing the value of the Pound Sterling is monetary policy decided by the Bank of England. The BoE bases its decisions on whether it has achieved its primary goal of “price stability” – a steady inflation rate of around 2%. Its primary tool for achieving this is the adjustment of interest rates. When inflation is too high, the BoE will try to rein it in by raising interest rates, making it more expensive for people and businesses to access credit. This is generally positive for GBP, as higher interest rates make the UK a more attractive place for global investors to park their money. When inflation falls too low it is a sign economic growth is slowing. In this scenario, the BoE will consider lowering interest rates to cheapen credit so businesses will borrow more to invest in growth-generating projects.
Data releases gauge the health of the economy and can impact the value of the Pound Sterling. Indicators such as GDP, Manufacturing and Services PMIs, and employment can all influence the direction of the GBP. A strong economy is good for Sterling. Not only does it attract more foreign investment but it may encourage the BoE to put up interest rates, which will directly strengthen GBP. Otherwise, if economic data is weak, the Pound Sterling is likely to fall.
Another significant data release for the Pound Sterling is the Trade Balance. This indicator measures the difference between what a country earns from its exports and what it spends on imports over a given period. If a country produces highly sought-after exports, its currency will benefit purely from the extra demand created from foreign buyers seeking to purchase these goods. Therefore, a positive net Trade Balance strengthens a currency and vice versa for a negative balance.
- Silver's uptrend tested as it nears key support at 50 and 100-DMAs between $29.17 and $29.13.
- RSI neutral, indicating potential for more downside if direction doesn't solidify.
- Below $29.00, silver may target the August 12 high of $28.03, with support at the August 14 low of $27.18.
- Upside move reclaiming $30.00 could push towards June 21 high at $30.84 and July 11 peak at $31.75.
Silver prices tumbled toward a critical confluence technical level on Wednesday, after bulls failed to sustain the grey’s metal quote above the $30.00 a troy ounce level. Therefore, the XAG/USD finished yesterday’s session with losses of 2.84%, yet as Thursday’s Asian session begins, the XAG/USD trades at $29.10, virtually unchanged.
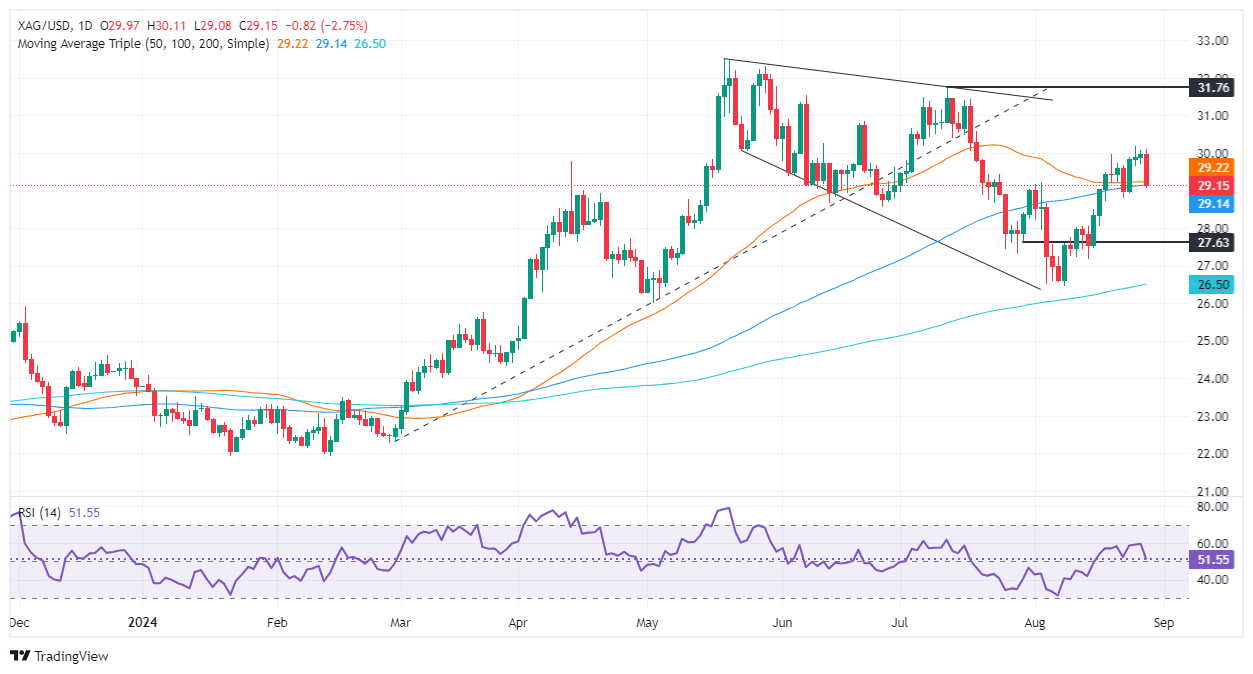
XAG/USD Price Forecast: Technical outlook
Silver’s uptrend remains in place, but since the XAG/USD rallied from around $26.45 to $30.18, the non-yielding metal has dropped toward the current spot prices, which is also the confluence of the 50 and 100-day moving averages (DMAs) at $29.17-$29.13, respectively.
Momentum indicates that neither buyers nor sellers are in charge, as the Relative Strength Index (RSI) is neutral.
That said, if XAG/USD drops below $29.00, this could exacerbate a test of the August 12 high turned support at $28.03. Silver could challenge the August 14 swing low of $27.18 on further weakness.
Conversely, if XAG/USD climbs above $30.00, this could exacerbate a challenge of June 21 daily high at $30.84, before testing the latest swing high reached on July 11 at $31.75.
XAG/USD Price Action – Daily Chart
Silver FAQs
Silver is a precious metal highly traded among investors. It has been historically used as a store of value and a medium of exchange. Although less popular than Gold, traders may turn to Silver to diversify their investment portfolio, for its intrinsic value or as a potential hedge during high-inflation periods. Investors can buy physical Silver, in coins or in bars, or trade it through vehicles such as Exchange Traded Funds, which track its price on international markets.
Silver prices can move due to a wide range of factors. Geopolitical instability or fears of a deep recession can make Silver price escalate due to its safe-haven status, although to a lesser extent than Gold's. As a yieldless asset, Silver tends to rise with lower interest rates. Its moves also depend on how the US Dollar (USD) behaves as the asset is priced in dollars (XAG/USD). A strong Dollar tends to keep the price of Silver at bay, whereas a weaker Dollar is likely to propel prices up. Other factors such as investment demand, mining supply – Silver is much more abundant than Gold – and recycling rates can also affect prices.
Silver is widely used in industry, particularly in sectors such as electronics or solar energy, as it has one of the highest electric conductivity of all metals – more than Copper and Gold. A surge in demand can increase prices, while a decline tends to lower them. Dynamics in the US, Chinese and Indian economies can also contribute to price swings: for the US and particularly China, their big industrial sectors use Silver in various processes; in India, consumers’ demand for the precious metal for jewellery also plays a key role in setting prices.
Silver prices tend to follow Gold's moves. When Gold prices rise, Silver typically follows suit, as their status as safe-haven assets is similar. The Gold/Silver ratio, which shows the number of ounces of Silver needed to equal the value of one ounce of Gold, may help to determine the relative valuation between both metals. Some investors may consider a high ratio as an indicator that Silver is undervalued, or Gold is overvalued. On the contrary, a low ratio might suggest that Gold is undervalued relative to Silver.
- NZD/JPY rose to 90.20 in Wednesday's session.
- The RSI is rising within neutral terrain, indicating increasing buying pressure.
- The MACD is flat green, suggesting that the buyer’s traction remains weak.
The NZD/JPY pair rebounded slightly in Wednesday's following session to settle around 90.20. Technical indicators are hinting that the pair might be approaching a bullish breakout in the short term as buyers seem to be waiting for a catalyst to test the 90.50 area.
The Relative Strength Index (RSI) is rising towards neutral terrain, currently at 49, indicating that buying pressure is increasing. This reading suggests that the pair is likely to continue its upward movement and challenge the resistance at 90.50. The Moving Average Convergence Divergence (MACD) is also showing a neutral bias, with flat green bars indicating that the bullish momentum is neither gaining nor losing strength.
NZD/JPY daily chart
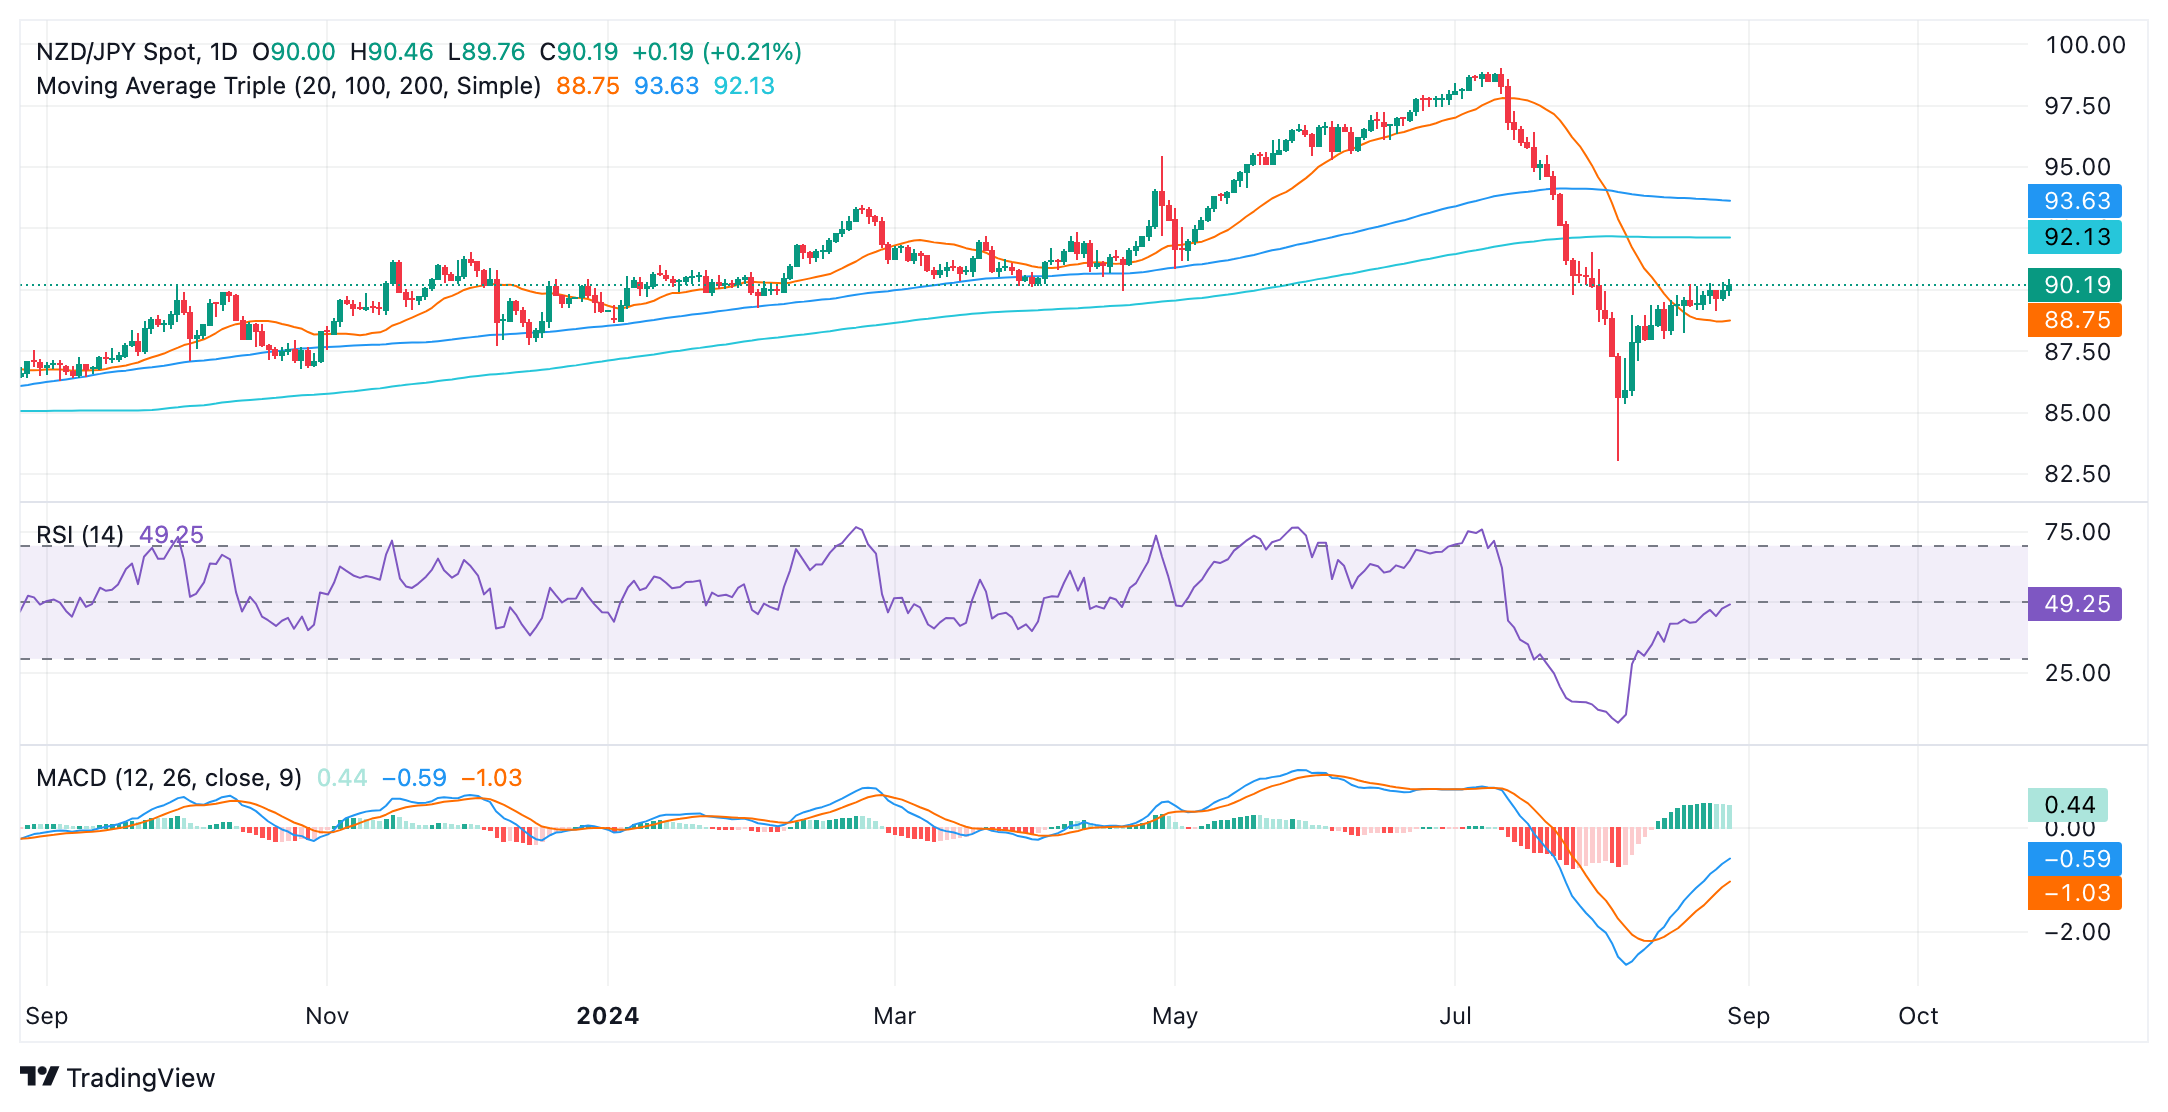
As the pair seems to be gaining strength and with the RSI rising, the cross might continue trading within the 89.20-90.50 channel. A break above these levels might set the pace for the short term.
.
- The Canadian Dollar rose on Wednesday, supported by other markets.
- A lack of data from Canada leaves CAD at the mercy of sentiment.
- Canadian GDP figures set to be overshadowed by US PCE inflation.
The Canadian Dollar (CAD) drifted higher on Wednesday, bolstered more by overall market flows than any intrinsic bidding power behind the CAD itself. Markets have overspent on bullish risk appetite in the face of looming Federal Reserve (Fed) interest rate cuts expected in September, giving the Canadian Dollar room to breathe and pare back recent gains against the Greenback.
Canada remains broadly absent from this week’s economic calendar, with Friday’s Canadian Gross Domestic Product (GDP) figures slated to be entirely eclipsed by US Personal Consumption Expenditure Price Index (PCE) inflation data due to release at the same time.
Daily digest market movers
- An overall retreat in overextended market sentiment has sapped momentum from bidders, giving the Greenback a leg up and a chance to recover against a long side opposite the CAD.
- Canada is widely expected to report a slight downtick in annualized GDP on Friday, forecast to print at 1.6% in Q2 versus the previous 1.7%.
- Core US PCE inflation is expected to print at 2.7% YoY, a slight rise from the previous 2.6%.
- A below-expectations print in US PCE inflation will surely ignite a fresh broad-market splurge on rate cut expectations, while an above-forecast release will send rate cut hopes scurrying into the shadows.
- US GDP figures due on Thursday could also throw a spanner in the works, but the release is likely to be muted with US annualized QoQ expected to hold steady at 2.8%.
Canadian Dollar price forecast
The Canadian Dollar (CAD) shed weight on Wednesday, paring back recent gains against the Greenback, but only slightly. USD/CAD is still churning chart paper on the south side of the 1.3500 handle, and a near-term plunge from recent chart highs near 1.3950 has left long-term moving averages in the dust.
USD/CAD daily chart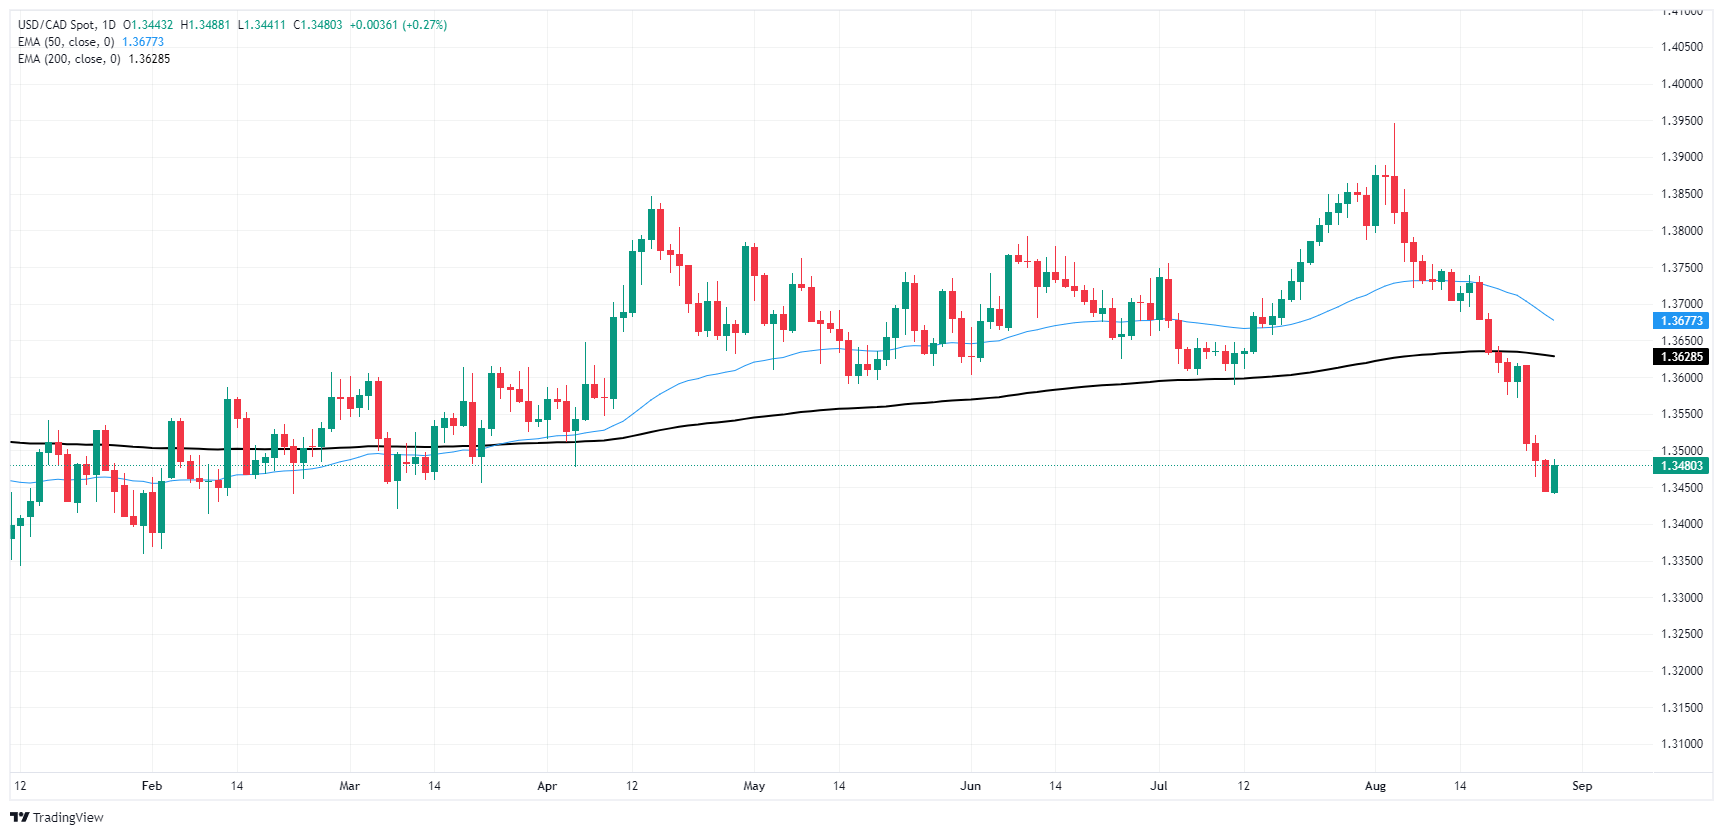
Canadian Dollar FAQs
The key factors driving the Canadian Dollar (CAD) are the level of interest rates set by the Bank of Canada (BoC), the price of Oil, Canada’s largest export, the health of its economy, inflation and the Trade Balance, which is the difference between the value of Canada’s exports versus its imports. Other factors include market sentiment – whether investors are taking on more risky assets (risk-on) or seeking safe-havens (risk-off) – with risk-on being CAD-positive. As its largest trading partner, the health of the US economy is also a key factor influencing the Canadian Dollar.
The Bank of Canada (BoC) has a significant influence on the Canadian Dollar by setting the level of interest rates that banks can lend to one another. This influences the level of interest rates for everyone. The main goal of the BoC is to maintain inflation at 1-3% by adjusting interest rates up or down. Relatively higher interest rates tend to be positive for the CAD. The Bank of Canada can also use quantitative easing and tightening to influence credit conditions, with the former CAD-negative and the latter CAD-positive.
The price of Oil is a key factor impacting the value of the Canadian Dollar. Petroleum is Canada’s biggest export, so Oil price tends to have an immediate impact on the CAD value. Generally, if Oil price rises CAD also goes up, as aggregate demand for the currency increases. The opposite is the case if the price of Oil falls. Higher Oil prices also tend to result in a greater likelihood of a positive Trade Balance, which is also supportive of the CAD.
While inflation had always traditionally been thought of as a negative factor for a currency since it lowers the value of money, the opposite has actually been the case in modern times with the relaxation of cross-border capital controls. Higher inflation tends to lead central banks to put up interest rates which attracts more capital inflows from global investors seeking a lucrative place to keep their money. This increases demand for the local currency, which in Canada’s case is the Canadian Dollar.
Macroeconomic data releases gauge the health of the economy and can have an impact on the Canadian Dollar. Indicators such as GDP, Manufacturing and Services PMIs, employment, and consumer sentiment surveys can all influence the direction of the CAD. A strong economy is good for the Canadian Dollar. Not only does it attract more foreign investment but it may encourage the Bank of Canada to put up interest rates, leading to a stronger currency. If economic data is weak, however, the CAD is likely to fall.
- Australian Dollar slides lower on CPI release.
- RBA has stated last week that rate cuts are not on the table.
- Markets are confident of a single 25 bps cut by year's end.
The Australian Dollar retreated against its US counterpart following the release of Australia's latest inflation data. The soft inflation data has reinforced expectations that the Reserve Bank of Australia (RBA) will cut interest rates later this year. A slowdown in household spending further suggests that the economic cycle in Australia may be easing.
Amidst a complex economic landscape in Australia, the RBA is concerned over persistent inflation and have prompted a cautious approach. With the soft figures released on Wednesday, the markets now anticipate a modest 25 basis point rate reduction in 2024.
Daily digest market movers: Australian Dollar declines on CPI data
- Australia's July Consumer Price Index (CPI) came in at 3.5% YoY, slightly higher than expected but still within the RBA's target range.
- Trimmed mean inflation fell to 3.8% y/y, its lowest level since January.
- The RBA has indicated that it is unlikely to cut interest rates in the near term, but the market continues to expect a 25 bp cut by year-end.
- If the RBA signals a hawkish approach, the downside for the Aussie is limited.
AUD/USD Technical Outlook: Pair sees slight decline, key levels in play
The AUD/USD pair experienced a slight decline on Wednesday, as buyers continued to lock in profits from last week’s rally. The Relative Strength Index (RSI) fell to 60, indicating a lean towards a neutral market sentiment. The Moving Average Convergence Divergence (MACD) shows flat green bars, suggesting a lack of momentum.
After last week’s gains, the pair has been consolidating within a range of 0.6750-0.6820, and a break above these levels might set the pace of the pair in the next sessions.
Australian Dollar FAQs
One of the most significant factors for the Australian Dollar (AUD) is the level of interest rates set by the Reserve Bank of Australia (RBA). Because Australia is a resource-rich country another key driver is the price of its biggest export, Iron Ore. The health of the Chinese economy, its largest trading partner, is a factor, as well as inflation in Australia, its growth rate and Trade Balance. Market sentiment – whether investors are taking on more risky assets (risk-on) or seeking safe-havens (risk-off) – is also a factor, with risk-on positive for AUD.
The Reserve Bank of Australia (RBA) influences the Australian Dollar (AUD) by setting the level of interest rates that Australian banks can lend to each other. This influences the level of interest rates in the economy as a whole. The main goal of the RBA is to maintain a stable inflation rate of 2-3% by adjusting interest rates up or down. Relatively high interest rates compared to other major central banks support the AUD, and the opposite for relatively low. The RBA can also use quantitative easing and tightening to influence credit conditions, with the former AUD-negative and the latter AUD-positive.
China is Australia’s largest trading partner so the health of the Chinese economy is a major influence on the value of the Australian Dollar (AUD). When the Chinese economy is doing well it purchases more raw materials, goods and services from Australia, lifting demand for the AUD, and pushing up its value. The opposite is the case when the Chinese economy is not growing as fast as expected. Positive or negative surprises in Chinese growth data, therefore, often have a direct impact on the Australian Dollar and its pairs.
Iron Ore is Australia’s largest export, accounting for $118 billion a year according to data from 2021, with China as its primary destination. The price of Iron Ore, therefore, can be a driver of the Australian Dollar. Generally, if the price of Iron Ore rises, AUD also goes up, as aggregate demand for the currency increases. The opposite is the case if the price of Iron Ore falls. Higher Iron Ore prices also tend to result in a greater likelihood of a positive Trade Balance for Australia, which is also positive of the AUD.
The Trade Balance, which is the difference between what a country earns from its exports versus what it pays for its imports, is another factor that can influence the value of the Australian Dollar. If Australia produces highly sought after exports, then its currency will gain in value purely from the surplus demand created from foreign buyers seeking to purchase its exports versus what it spends to purchase imports. Therefore, a positive net Trade Balance strengthens the AUD, with the opposite effect if the Trade Balance is negative.
- NZD/USD stood neutral around 0.6240, testing critical support.
- The RSI is declining, indicating potential selling pressure and a shift in momentum.
In Wednesday's session, the NZD/USD traded around 0.6240 near crucial support levels. There are signals of a possible consolidation period as buyers pause after the rally which pushed the pair close to January's highs near 0.6250.
The technical indicators paint a neutral picture with the bullish momentum flattening. The Relative Strength Index (RSI) has retreated from overbought territory and currently points downwards, indicating a potential shift in momentum and a build-up of selling pressure. A fall below the 50 level would further underscore this bearish sentiment. In addition, the Moving Average Convergence Divergence (MACD) prints flat green bars.
NZD/USD daily chart
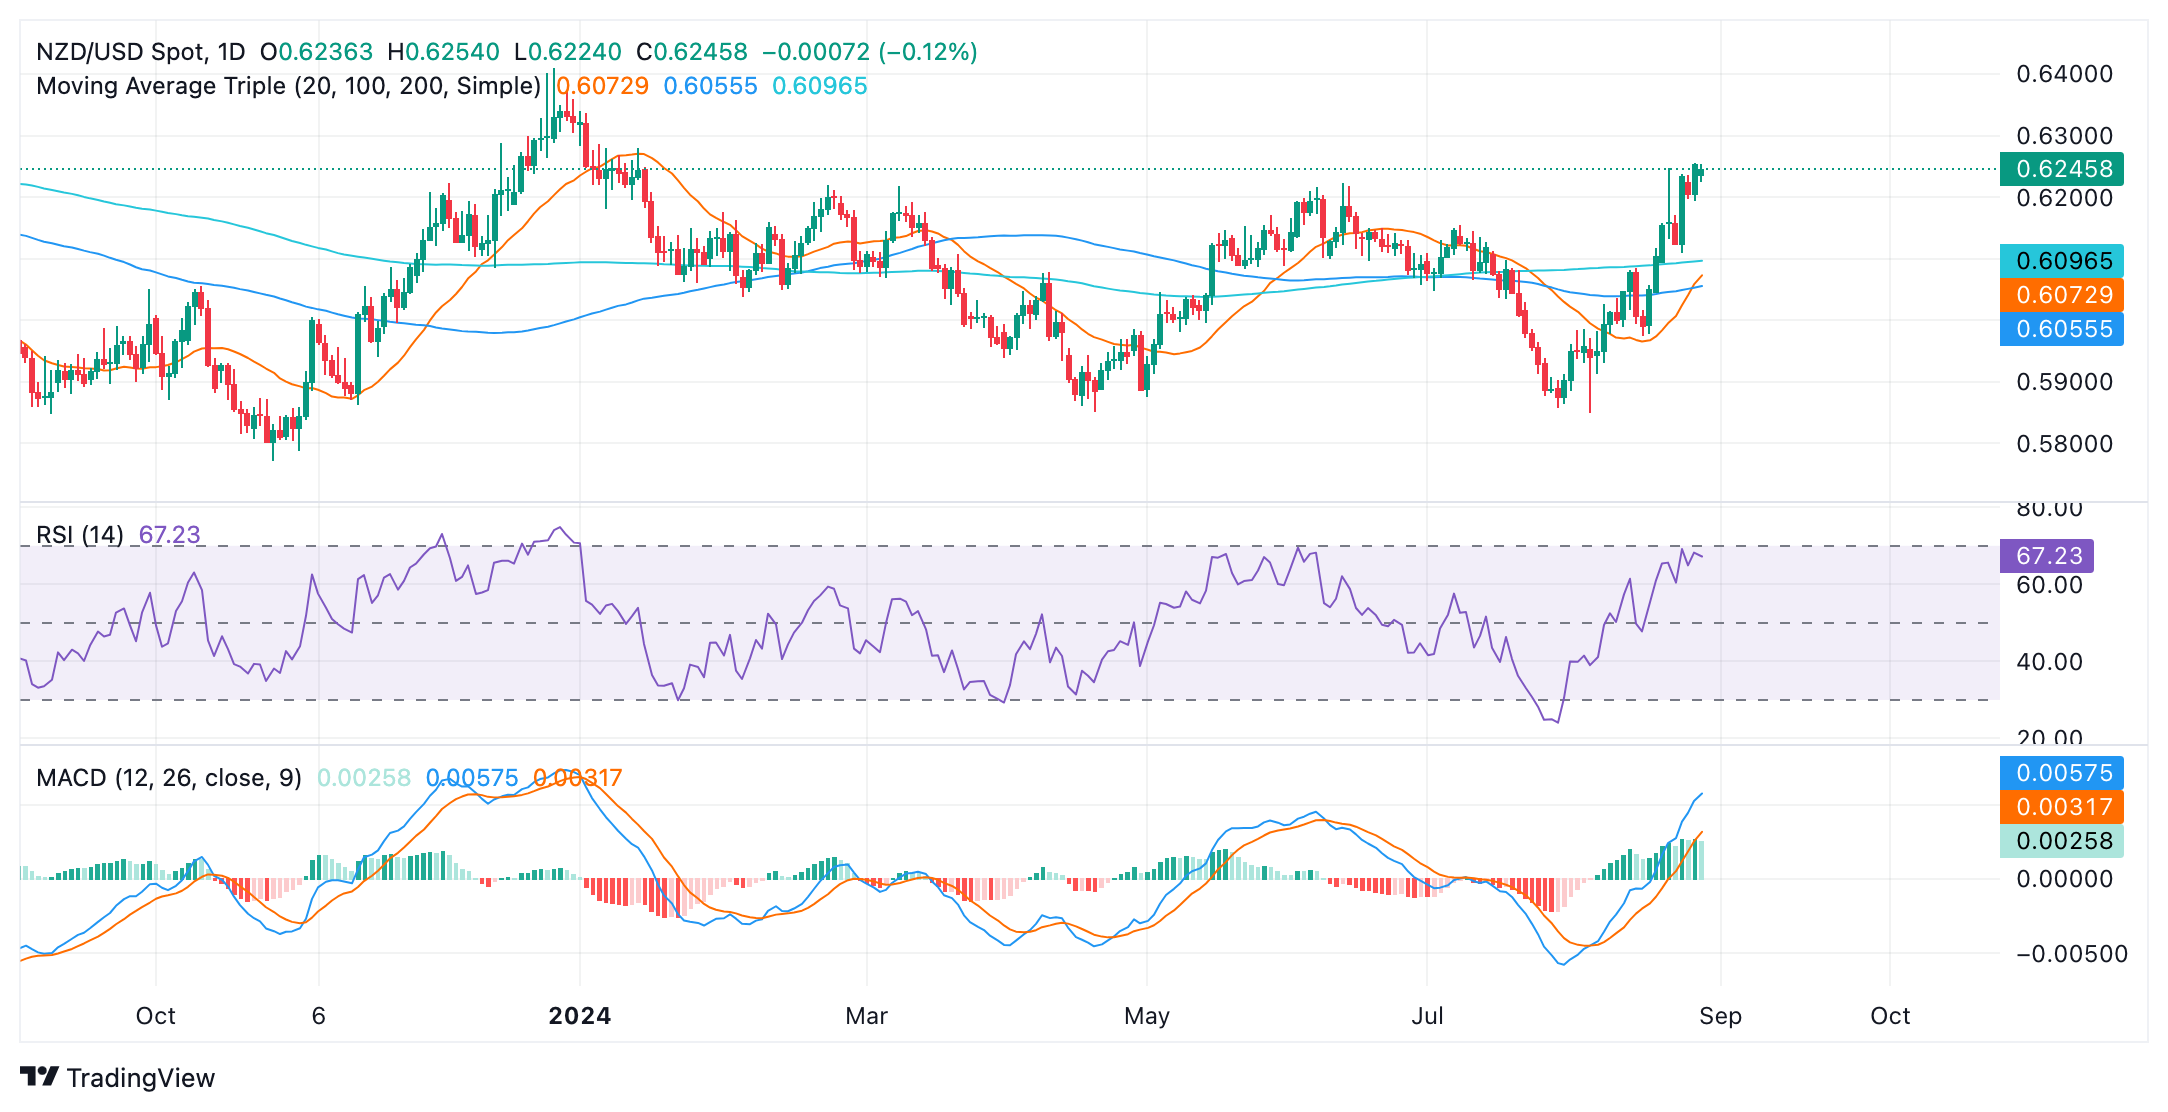
The key support levels for the NZD/USD pair lie at 0.6200 and 0.6150. A breach of 0.6150 could trigger a deeper decline towards 0.6100, a significant support zone. On the flip side, immediate resistance can be found at 0.6255. A consolidation above this level could open doors for a move towards the 0.6300 area.
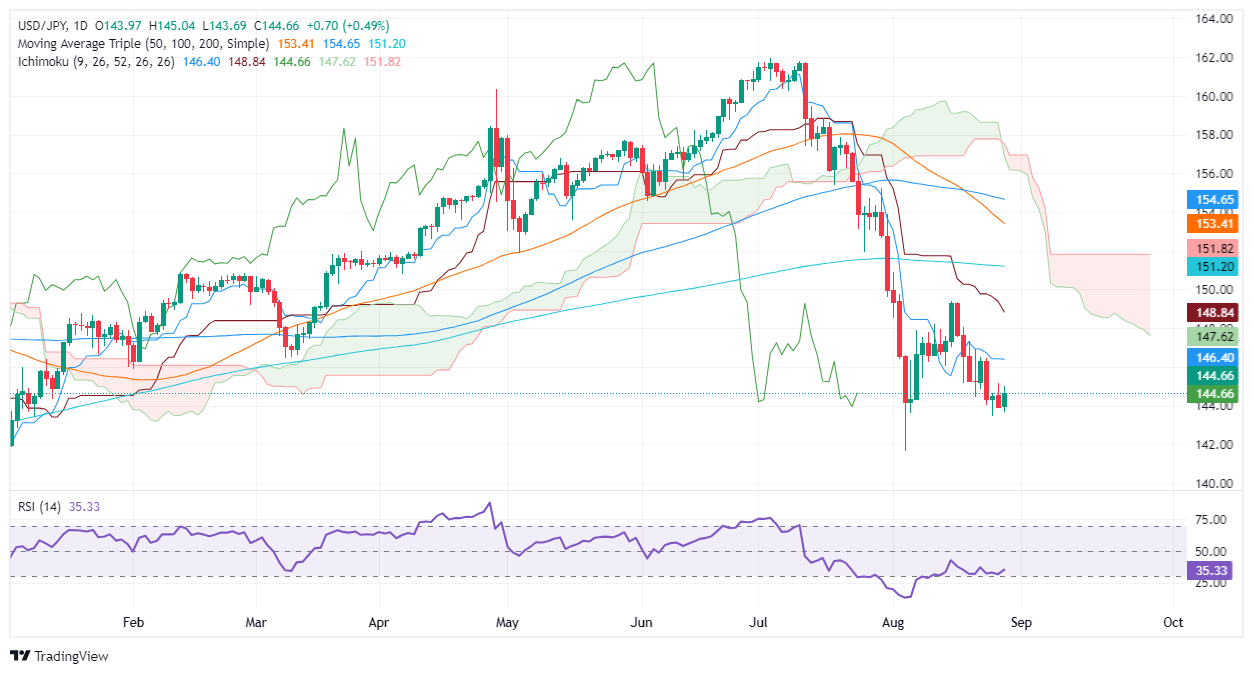
- USD/JPY rises 0.50%, crossing 144.00; downtrend persists with limited momentum for further gains.
- Key resistance at 145.00 crucial for bullish continuation; next targets at 146.39 (Tenkan-Sen), 146.48, and 148.84 (Kijun-Sen).
- If 145.00 isn't breached, may retest 144.00 with supports at 143.44 (August 26 low) and 141.69 (August 5 low).
The USD/JPY reverses its course and registers decent gains of over 0.50% on Wednesday as the Greenback gains some steam, yet it remains vulnerable to the release of crucial data over the remainder of the week. The pair trades at 144.73 after bouncing off daily lows of 143.68.
USD/JPY Price Forecast: Technical outlook
The USD/JPY downtrend remains intact, yet buyers stepped in and pushed the exchange rate above 144.00, with buyers unable to crack the 145.00 figure decisively. Momentum suggests that sellers had lost some steam as the Relative Strength Index (RSI) aims up, but they remain in charge.
For a bullish continuation, USD/JPY buyers must reclaim 145.00. Once surpassed, the Tenkan Sen at 146.39 would be next, followed by the March 11 daily low-turned resistance at 146.48 and the Kijun-Sen at 148.84.
Conversely, if USD/JPY remains below 145.00, this could pave the way for testing the 144.00 figure. Further downside lies at the August 26 low of 143.44, followed by the latest cycle low at 141.69, the August 5 low.
USD/JPY Price Action – Daily Chart
Japanese Yen FAQs
The Japanese Yen (JPY) is one of the world’s most traded currencies. Its value is broadly determined by the performance of the Japanese economy, but more specifically by the Bank of Japan’s policy, the differential between Japanese and US bond yields, or risk sentiment among traders, among other factors.
One of the Bank of Japan’s mandates is currency control, so its moves are key for the Yen. The BoJ has directly intervened in currency markets sometimes, generally to lower the value of the Yen, although it refrains from doing it often due to political concerns of its main trading partners. The current BoJ ultra-loose monetary policy, based on massive stimulus to the economy, has caused the Yen to depreciate against its main currency peers. This process has exacerbated more recently due to an increasing policy divergence between the Bank of Japan and other main central banks, which have opted to increase interest rates sharply to fight decades-high levels of inflation.
The BoJ’s stance of sticking to ultra-loose monetary policy has led to a widening policy divergence with other central banks, particularly with the US Federal Reserve. This supports a widening of the differential between the 10-year US and Japanese bonds, which favors the US Dollar against the Japanese Yen.
The Japanese Yen is often seen as a safe-haven investment. This means that in times of market stress, investors are more likely to put their money in the Japanese currency due to its supposed reliability and stability. Turbulent times are likely to strengthen the Yen’s value against other currencies seen as more risky to invest in.
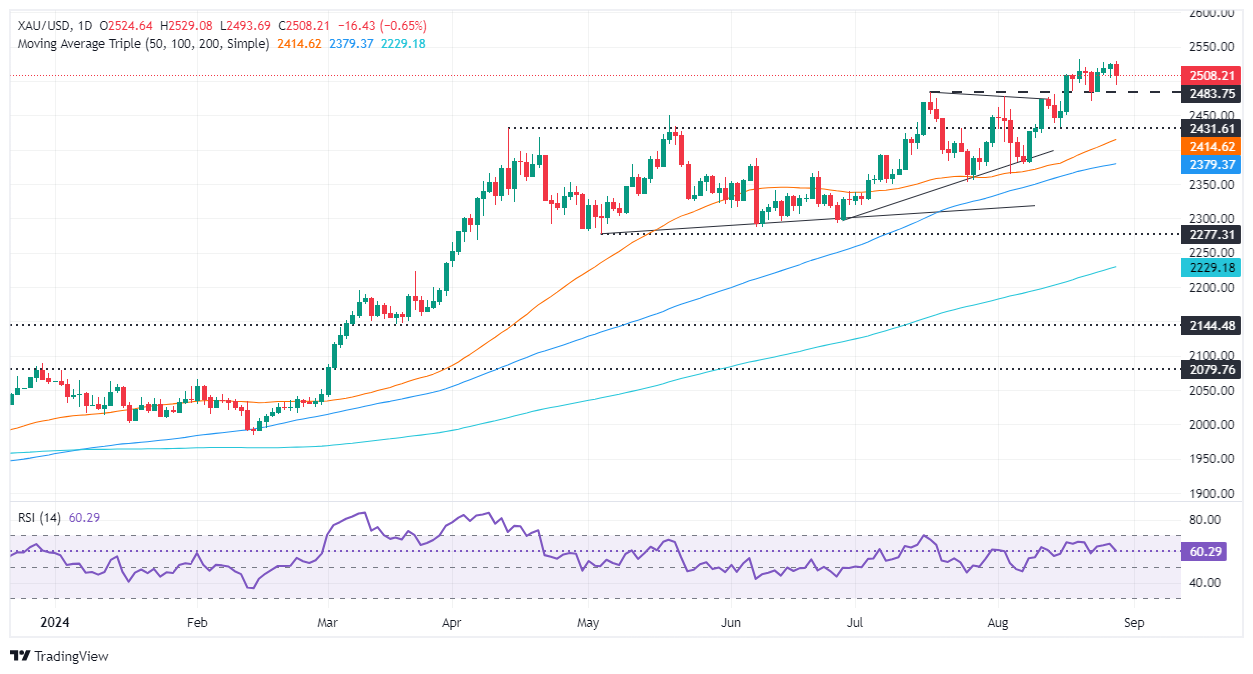
- Gold drops 0.70% to $2,504 as US Dollar strengthens and Treasury yields rise following Powell's dovish policy comments.
- DXY up 0.60% to 101.15, propelled by rising 10-year Treasury yield at 3.841%, challenging non-yielding assets like Gold.
- Market anticipates key US data: GDP estimates, Initial Jobless Claims and core PCE inflation gauge this week.
- Gold sees inflows and demand from China yet contends with a stronger US Dollar and rising yields.
Gold prices dropped more than 0.70% on Wednesday as the Greenback staged a comeback after Federal Reserve (Fed) Chair Jerome Powell hinted that the US central bank is ready to ease policy, because policymakers are worried about a weak labor market. The XAU/USD trades at $2,504 after retreating from a daily peak of $2,529.
Wall Street trades with losses ahead of Nvidia’s fiscal Q2 2025 earnings report. The US Dollar hits a three-day high underpinned by heightened US Treasury bond yields, with the US Dollar Index (DXY) sitting at 101.15, gaining 0.60%.
Despite that, the golden metal hovers above $2,500 even though the US 10-year Treasury note yield rises two basis points to 3.841%, a headwind for the non-yielding metal.
Sources cited by Reuters noted, “We're seeing a little pressure coming from a bit firmer dollar. And at this point, we're waiting for further information to drive this market either one direction or the other based on that inflationary data.”
Meanwhile, bullion prices are expected to rise further in the aftermath of Powell’s speech at Jackson Hole, in which he said the time has come to begin lowering borrowing costs amid increased confidence that inflation is headed toward the Fed’s 2% goal.
He added that the risks of the dual mandate are skewed toward the downside of inflation and the upside of employment. The sudden shift suggests that upcoming jobs market data will be crucial to assess the pace and size of the upcoming interest rate cuts.
According to the World Gold Council, XAU/USD prices also benefitted from a modest increase in net inflows of 8 metric tons ($403 million) last week, led by North American funds. Moreover, China’s net Gold imports rose by 17% in July, marking the first month of increases since March, data showed on Tuesday.
The US economic docket is scarce on Wednesday, but Thursday and Friday will be busy. On Thursday, the second estimate of Gross Domestic Product (GDP) is expected to show the economy continues to grow above trend. At the same time, the US Department of Labor will release Initial Jobless Claims for the week ending August 24.
On Friday, the Fed’s preferred inflation gauge, the core Personal Consumption Expenditures Price Index (PCE) is expected to tick a tenth higher, according to the consensus.
The December 2024 Chicago Board of Trade (CBOT) fed funds future rates contract hints that investors are eyeing 100 basis points of Fed easing this year, up from Monday’s 97. This implies that traders estimate a 50 bps interest rate cut at September’s meeting, though odds for lowering rates of that size lie at 36.5%, according to the CME FedWatch Tool.
Daily digest market movers: Gold price retreats as traders brace for US data
- If US economic data continues to be weak, the Gold price uptrend is likely to persist, fueling speculation about a larger rate cut by the Fed.
- Gross Domestic Product (GDP) figures for Q2 in the second estimate are expected to improve from 1.4% to 2.8%.
- Initial Jobless Claims for the week ending August 24 are expected to remain unchanged at 232K compared to the previous reading. Weakness in the labor market could increase the chances of a bigger rate cut by the Fed.
- The core Personal Consumption Expenditures (PCE) Price Index is expected to rise from 2.6% to 2.7% YoY.
- Next week, the US economic docket will feature the August Nonfarm Payrolls report, which could be crucial to assess the size of the Fed’s first rate cut at the September meeting.
Technical outlook: Gold’s uptrend is intact despite posting losses, aiming toward $2,500
Gold’s uptrend remains intact, even though the yellow metal hit a daily low beneath the $2,500 figure at $2,493. The Relative Strength Index (RSI) shows bullish momentum has faded, yet buyers are looming amid the ongoing pullback.
If XAU/USD drops below $2,500, the first support would be the July 17 peak at $2,483. If surpassed, the $2,450 psychological mark would emerge as the next support, followed by the 50-day Simple Moving Average (SMA) at $2,414.
Conversely, if bullion prices stick above $2,500, the next resistance would be the all-time high at $2,531. On further strength, Gold could test $2,550 before challenging $2,600.
Gold FAQs
Gold has played a key role in human’s history as it has been widely used as a store of value and medium of exchange. Currently, apart from its shine and usage for jewelry, the precious metal is widely seen as a safe-haven asset, meaning that it is considered a good investment during turbulent times. Gold is also widely seen as a hedge against inflation and against depreciating currencies as it doesn’t rely on any specific issuer or government.
Central banks are the biggest Gold holders. In their aim to support their currencies in turbulent times, central banks tend to diversify their reserves and buy Gold to improve the perceived strength of the economy and the currency. High Gold reserves can be a source of trust for a country’s solvency. Central banks added 1,136 tonnes of Gold worth around $70 billion to their reserves in 2022, according to data from the World Gold Council. This is the highest yearly purchase since records began. Central banks from emerging economies such as China, India and Turkey are quickly increasing their Gold reserves.
Gold has an inverse correlation with the US Dollar and US Treasuries, which are both major reserve and safe-haven assets. When the Dollar depreciates, Gold tends to rise, enabling investors and central banks to diversify their assets in turbulent times. Gold is also inversely correlated with risk assets. A rally in the stock market tends to weaken Gold price, while sell-offs in riskier markets tend to favor the precious metal.
The price can move due to a wide range of factors. Geopolitical instability or fears of a deep recession can quickly make Gold price escalate due to its safe-haven status. As a yield-less asset, Gold tends to rise with lower interest rates, while higher cost of money usually weighs down on the yellow metal. Still, most moves depend on how the US Dollar (USD) behaves as the asset is priced in dollars (XAU/USD). A strong Dollar tends to keep the price of Gold controlled, whereas a weaker Dollar is likely to push Gold prices up.
- The Dow Jones shed three quarters of a percent amid cautious market flows.
- The midweek market session has investors looking ahead to US PCE inflation.
- China GDP downgrade has investors concerned about physical trade.
The Dow Jones Industrial Average (DJIA) trimmed near-term gains on Wednesday, backsliding 300 points in the midweek market session. A downgrade to China’s Gross Domestic Product (GDP) forecast has investors concerned about a possible overhang in global trade, but most of the market is buckling down for the wait to Friday’s US Personal Consumption Expenditure Price Index (PCE) inflation print.
Equities pared back across the board after UBS trimmed its forecasts of Chinese GDP growth in 2024 and 2025. The Fitch ratings agency also issued a warning about performance in several of China’s business sectors in the second half of 2024 in a double-punch to market expectations of Chinese growth forecasts.
According to UBS, Chinese GDP growth is expected to clock in at 4.6% for 2024 compared to the previous expectation of 4.9%, and its 2025 forecast has been shifted down to just 4.0% from 4.6%. From Fitch Ratings, China’s ongoing property development slump is expected to remain a drag on issuers across several sectors, crimping growth and activity prospects in a measurable way through the last half of the year.
This week, investors will be closely watching Friday’s US PCE Price Index inflation reading for July. It is anticipated that YoY PCE inflation will increase to 2.7% from the current 2.6%, while the MoM figure is expected to remain unchanged at 0.2%. Those who are anticipating a reduction in interest rates will be looking for the inflation data to be lower than anticipated. However, if the inflation data exceeds expectations, it could unsettle investor sentiment and throw a wrench in current rate cut forecasts.
Dow Jones news
Tepid risk appetite on Wednesday has most of the Dow Jones in the red for the midweek market session. Gains are being led by Merck & Co Inc. (MRK), which rose around 0.6% to $163.90 per share, while Nike (NKE) fell 3.5% to $82.30 per share.
The moment is almost here. Despite a number of showstopping earnings calls this season, everyone has been waiting for Nvidia (NVDA) to release fiscal 2025 Q2 results, which finally arrive after the closing bell on Wednesday.
Dow Jones price forecast
The Dow Jones’ midweek pullback is picking up speed, with the equity index backsliding nine-tenths of one percent and shedding over 350 points. The DJIA has once again fallen below the 41,000 handle as near-term bullish momentum takes a pause and overextended price action snaps lower.
With bullish pressure running out of gas near fresh all-time highs beyond 41,250, bids are poised for an extended backslide to the 50-day Exponential Moving Average (EMA) rising through 40,000. Despite a near-term crimp in bidding momentum, short positions in the Dow Jones are unlikely to find a clear path all the way back to the index’s last major swing low below 38,500.
Dow Jones daily chart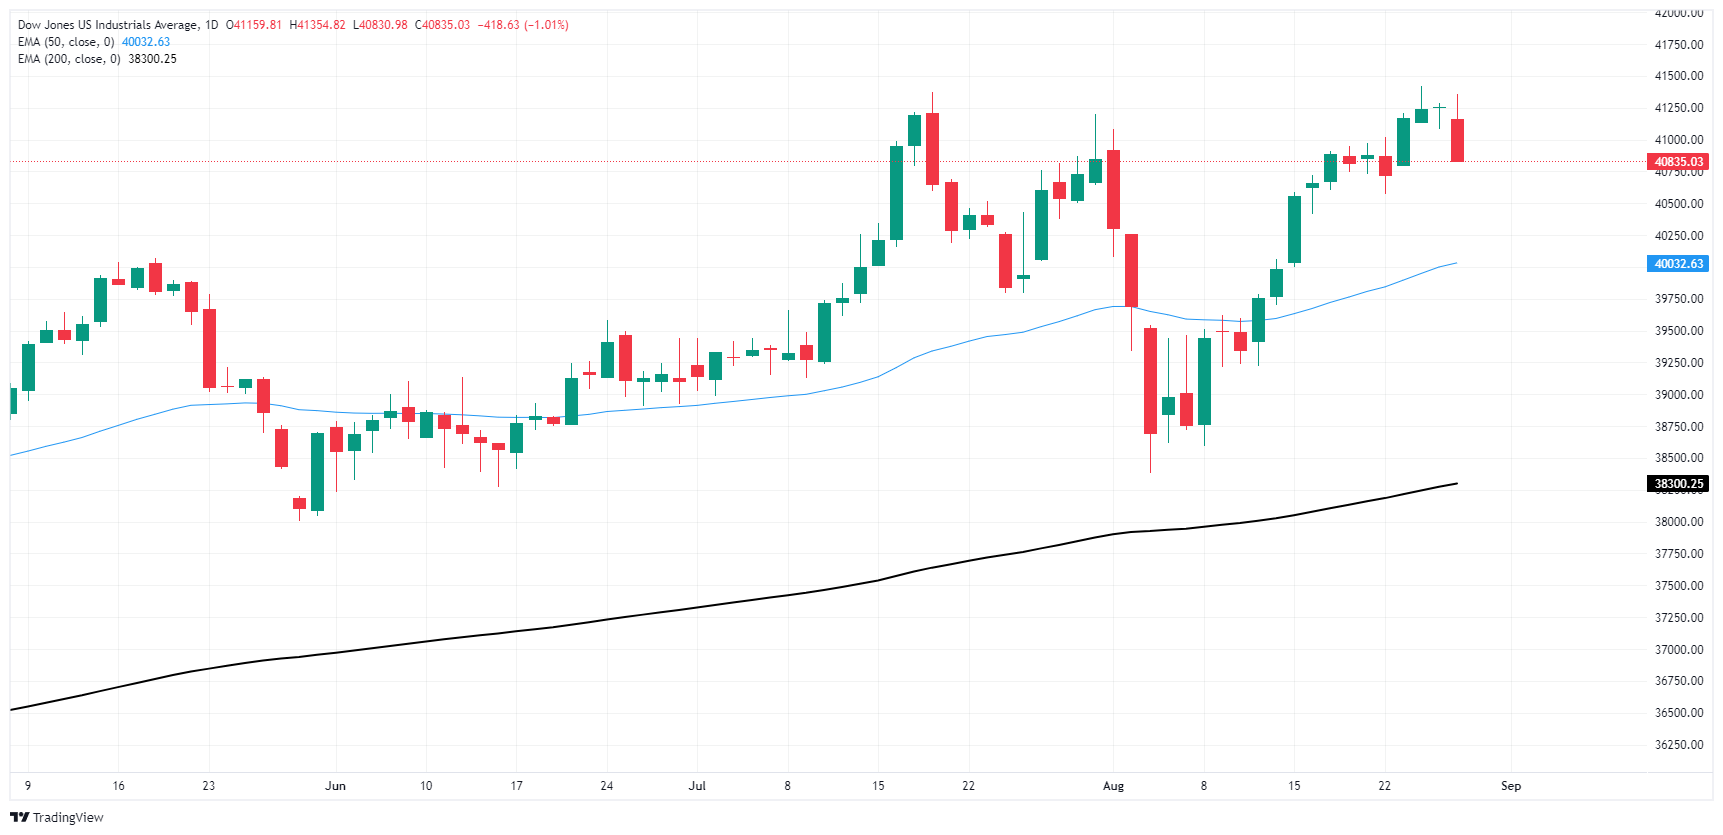
Dow Jones FAQs
The Dow Jones Industrial Average, one of the oldest stock market indices in the world, is compiled of the 30 most traded stocks in the US. The index is price-weighted rather than weighted by capitalization. It is calculated by summing the prices of the constituent stocks and dividing them by a factor, currently 0.152. The index was founded by Charles Dow, who also founded the Wall Street Journal. In later years it has been criticized for not being broadly representative enough because it only tracks 30 conglomerates, unlike broader indices such as the S&P 500.
Many different factors drive the Dow Jones Industrial Average (DJIA). The aggregate performance of the component companies revealed in quarterly company earnings reports is the main one. US and global macroeconomic data also contributes as it impacts on investor sentiment. The level of interest rates, set by the Federal Reserve (Fed), also influences the DJIA as it affects the cost of credit, on which many corporations are heavily reliant. Therefore, inflation can be a major driver as well as other metrics which impact the Fed decisions.
Dow Theory is a method for identifying the primary trend of the stock market developed by Charles Dow. A key step is to compare the direction of the Dow Jones Industrial Average (DJIA) and the Dow Jones Transportation Average (DJTA) and only follow trends where both are moving in the same direction. Volume is a confirmatory criteria. The theory uses elements of peak and trough analysis. Dow’s theory posits three trend phases: accumulation, when smart money starts buying or selling; public participation, when the wider public joins in; and distribution, when the smart money exits.
There are a number of ways to trade the DJIA. One is to use ETFs which allow investors to trade the DJIA as a single security, rather than having to buy shares in all 30 constituent companies. A leading example is the SPDR Dow Jones Industrial Average ETF (DIA). DJIA futures contracts enable traders to speculate on the future value of the index and Options provide the right, but not the obligation, to buy or sell the index at a predetermined price in the future. Mutual funds enable investors to buy a share of a diversified portfolio of DJIA stocks thus providing exposure to the overall index.
- Recovering US yields supported the USD on Wednesday.
- The August NFP release is the most important reading for the Fed's policy decision.
- Current market pricing still sees 100 bps of easing by year-end.
The US Dollar, measured by the US Dollar Index (DXY), recovered modestly on Wednesday, after closing lower on Tuesday. The 10-year US Treasury yield held slightly above 3.80%, supporting the Greenback.
With no high-tier economic data releases scheduled for Wednesday, the US Dollar might remain in a narrow range.
Daily digest market movers: DXY shrugs off weak sentiment data on the back of hawkish bets
- On a quiet Wednesday, US Treasury yields supported the US Dollar with the 10-year rate above 3.80%
- Market pricing still anticipates 100 bps of easing by year-end, and the odds of a 50 bps cut in September remain at 25-35%.
- Strong August Nonfarm Payrolls figures next week could result in a 25 bps cut, while a weak reading may trigger a 50 bps cut.
- The index might continue sideways trading in the next few sessions, while markets await labor market data — the policy driver at the moment, according to the Fed.
Technical analysis DXY: Bearish momentum eases, index finds support around 101.00
The DXY index is currently hovering around its support levels and near its December lows. Market participants are waiting for new catalysts, resulting in sideways movement in the index over the past few sessions.
The Relative Strength Index (RSI) has moved out of oversold territory, while the Moving Average Convergence Divergence (MACD) indicator’s red bars are signaling a decline in selling pressure. Support levels lie at 100.50, 100.30 and 100.00, while resistance levels are located at 101.00, 101.50 and 101.80.
US Dollar FAQs
The US Dollar (USD) is the official currency of the United States of America, and the ‘de facto’ currency of a significant number of other countries where it is found in circulation alongside local notes. It is the most heavily traded currency in the world, accounting for over 88% of all global foreign exchange turnover, or an average of $6.6 trillion in transactions per day, according to data from 2022. Following the second world war, the USD took over from the British Pound as the world’s reserve currency. For most of its history, the US Dollar was backed by Gold, until the Bretton Woods Agreement in 1971 when the Gold Standard went away.
The most important single factor impacting on the value of the US Dollar is monetary policy, which is shaped by the Federal Reserve (Fed). The Fed has two mandates: to achieve price stability (control inflation) and foster full employment. Its primary tool to achieve these two goals is by adjusting interest rates. When prices are rising too quickly and inflation is above the Fed’s 2% target, the Fed will raise rates, which helps the USD value. When inflation falls below 2% or the Unemployment Rate is too high, the Fed may lower interest rates, which weighs on the Greenback.
In extreme situations, the Federal Reserve can also print more Dollars and enact quantitative easing (QE). QE is the process by which the Fed substantially increases the flow of credit in a stuck financial system. It is a non-standard policy measure used when credit has dried up because banks will not lend to each other (out of the fear of counterparty default). It is a last resort when simply lowering interest rates is unlikely to achieve the necessary result. It was the Fed’s weapon of choice to combat the credit crunch that occurred during the Great Financial Crisis in 2008. It involves the Fed printing more Dollars and using them to buy US government bonds predominantly from financial institutions. QE usually leads to a weaker US Dollar.
Quantitative tightening (QT) is the reverse process whereby the Federal Reserve stops buying bonds from financial institutions and does not reinvest the principal from the bonds it holds maturing in new purchases. It is usually positive for the US Dollar.
The Greenback regained the smile on Wednesday and advanced to weekly tops vs. its main rivals as investors seek further clues regarding the potential Fed’s rate path ahead of key economic data releases.
Here is what you need to know on Thursday, August 29:
The US Dollar Index (DXY) regained the 101.00 barrier and above despite mixed US yields across the curve. Another estimate of US Q2 GDP Growth Rate is due on August 29, followed by usual weekly Initial Jobless Claims, Pending Home Sales, and the speech by the Fed’s Bostic.
EUR/USD came under marked downside pressure and disputed the 1.1100 region following the strong rebound in the US Dollar. On August 29, the preliminary Inflation Rate in Germany takes centre stage, ahead of EMU’s Consumer Confidence, Economic Sentiment, and Industrial Sentiment. In addition, the ECB’s Schnabel is due to speak.
GBP/USD receded from recent yearly peaks and broke below the 1.3200 support, challenging weekly lows. The annualized Car Production results are only expected on August 29.
USD/JPY tested waters above the 145.00 barrier in response to the strong bounce in the Greenback and mixed yields. The usual weekly Foreign Bond Investment figures are due on August 29.
AUD/USD could not extend its breakout of the 0.6800 hurdle, eventually succumbing to the Dollar’s uptick. The next data release on the Australian docket will be Housing Credit readings, as well as Retail Sales, both coming on August 30.
Demand concerns in China and the stronger Dollar offset supply worries and a mild bullish report from the EIA, all dragging WTI prices to weekly lows below the $74.00 mark per barrel.
Gold prices came under pressure and deflated to weekly lows in the sub-$2,500 region per ounce troy. Silver sold off and confronted the $29.00 mark per ounce, a region coincident with the interim 55-day and 100-day SMAs.
- Mexican Peso strengthens despite judiciary reform and AMLO's diplomatic "pause" with US and Canadian embassies.
- Focus on Banxico’s Q2 report and Fiscal Balance data this Friday amid a light economic calendar.
- USD/MXN spikes near 19.80 due to political worries despite a weakening US Dollar post-Powell dovish Jackson Hole remarks.
The Mexican Peso recovered some ground against the Greenback on Wednesday, yet it remains strongly influenced by political turmoil in Mexico linked to the judiciary reform and President Andres Manuel Lopez Obrador's decision to “pause” relations with the US and Canadian Embassies. At the time of writing, the USD/MXN trades at 19.64, falling some 0.44%.
Mexico’s economic docket remains absent, and traders are bracing for Bank of Mexico’s (Banxico) Q2 report ahead of Friday's reveal of July’s Fiscal Balance. In the meantime, Wall Street trades with losses as speculators await the release of Nvidia’s fiscal Q2 2025 earnings.
Political developments in Mexico weighed on the Peso after a commission of deputies approved the ruling on the judiciary reform. The reform is expected to be voted on once the new Mexican Congress takes office on September 1.
This and AMLO’s pausing relations with the embassies of Mexico’s largest trading partners triggered a rally in the USD/MXN, which rose over 1.70% and was a whisker of hitting 19.80, even though the US Dollar sustained losses against most G7 FX currencies after Federal Reserve (Fed) Chair Jerome Powell hinted that rate cuts are looming at his Jackson Hole speech.
Across the border, the US economic docket is absent. Yet traders are awaiting the release of the second estimate of Q2’s 2024 Gross Domestic Product (GDP) and Initial Jobless Claims data for the week ending August 24.
Later, Atlanta Fed President Raphael Bostic will cross the newswires at around 22:00 GMT.
Daily digest market movers: Mexican Peso shrugs off risk-off mood and rises
- Comments from US Ambassador Ken Salazar, expressed on August 22, were the reason behind AMLO’s decision. Salazar said that the judiciary reform threatens the rule of law and added that “the direct election of judges represents a major risk to the functioning of Mexico’s democracy. Any judicial reform must have safeguards that guarantee that the judiciary is strengthened and not subject to the corruption of politics.”
- Market sentiment remains mixed, yet it would greatly influence the USD/MXN’s direction, given the US Dollar’s safe-haven status.
- Traders will eye Fed speakers, the release of US Q2’s 2024 GDP, and the Fed’s preferred inflation gauge, the core Personal Consumption Expenditures Price Index (PCE).
- Data from the Chicago Board of Trade (CBOT) suggests the Fed will cut at least 100 basis points (bps), according to the fed funds rate futures contract for December 2024.
Technical outlook: Mexican Peso strengthens as USD/MXN falls below 19.60
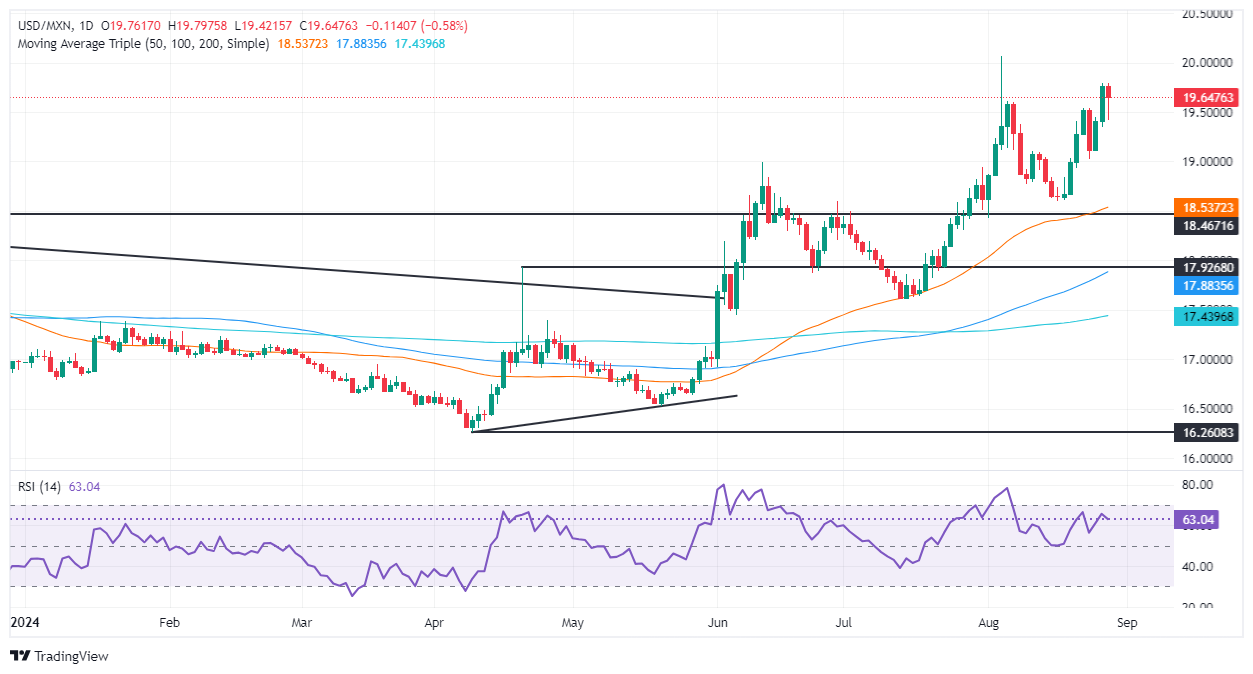
The USD/MXN daily chart hints that the uptrend remains intact despite the ongoing pullback. Momentum favors buyers as seen by the Relative Strength Index (RSI).
On further USD/MXN strength, the pair could challenge the current week-to-date (WTD) high of 19.79. A breach of the latter will expose 20.00, followed by the year-to-date (YTD) high at 20.22 and the psychological 20.50 supply area.
Conversely, if USD/MXN tumbles below 19.50, this could expose the 19.00 figure. Further losses lie beneath that level, opening the door to test the August 19 low of 18.59, followed by the 50-day Simple Moving Average (SMA) at 18.48.
Mexican Peso FAQs
The Mexican Peso (MXN) is the most traded currency among its Latin American peers. Its value is broadly determined by the performance of the Mexican economy, the country’s central bank’s policy, the amount of foreign investment in the country and even the levels of remittances sent by Mexicans who live abroad, particularly in the United States. Geopolitical trends can also move MXN: for example, the process of nearshoring – or the decision by some firms to relocate manufacturing capacity and supply chains closer to their home countries – is also seen as a catalyst for the Mexican currency as the country is considered a key manufacturing hub in the American continent. Another catalyst for MXN is Oil prices as Mexico is a key exporter of the commodity.
The main objective of Mexico’s central bank, also known as Banxico, is to maintain inflation at low and stable levels (at or close to its target of 3%, the midpoint in a tolerance band of between 2% and 4%). To this end, the bank sets an appropriate level of interest rates. When inflation is too high, Banxico will attempt to tame it by raising interest rates, making it more expensive for households and businesses to borrow money, thus cooling demand and the overall economy. Higher interest rates are generally positive for the Mexican Peso (MXN) as they lead to higher yields, making the country a more attractive place for investors. On the contrary, lower interest rates tend to weaken MXN.
Macroeconomic data releases are key to assess the state of the economy and can have an impact on the Mexican Peso (MXN) valuation. A strong Mexican economy, based on high economic growth, low unemployment and high confidence is good for MXN. Not only does it attract more foreign investment but it may encourage the Bank of Mexico (Banxico) to increase interest rates, particularly if this strength comes together with elevated inflation. However, if economic data is weak, MXN is likely to depreciate.
As an emerging-market currency, the Mexican Peso (MXN) tends to strive during risk-on periods, or when investors perceive that broader market risks are low and thus are eager to engage with investments that carry a higher risk. Conversely, MXN tends to weaken at times of market turbulence or economic uncertainty as investors tend to sell higher-risk assets and flee to the more-stable safe havens.
- EUR/GBP maintains its downtrend, falling near the 0.8400 mark and then recovering above.
- Indicators remain deep in negative area.
- Buyers must defend the 0.8400 range to avoid declines.
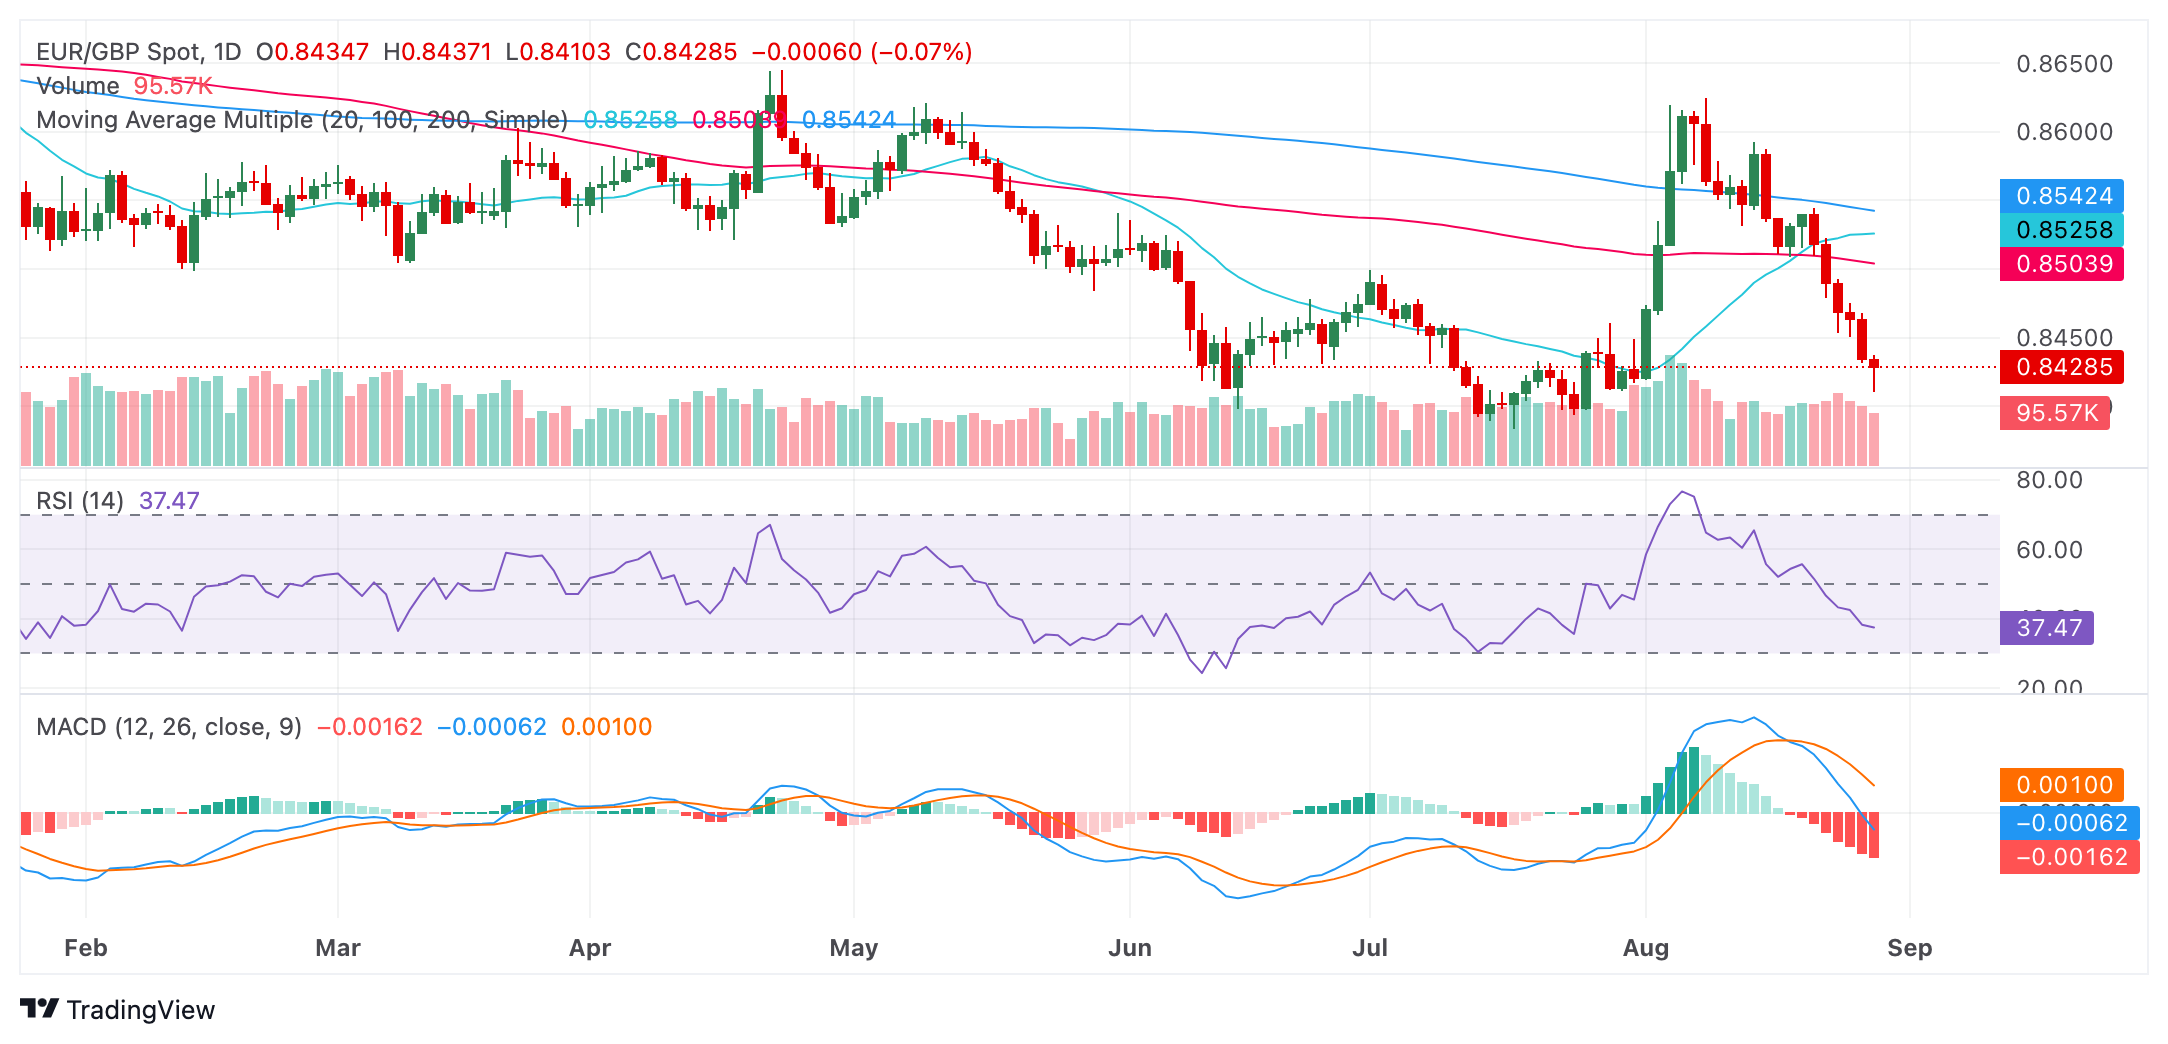
In Wednesday's session, the EUR/GBP pair extended its losses, down to 0.8425, reflecting a persistent bearish outlook by the sellers. The pair has been extending its losing streak to six consecutive sessions. The technical indicators continue to align with the bearish trend, but on the positive side, buyers stepped in to defend the 0.8400 area after falling to a low of 0.8410.
The Relative Strength Index (RSI) stands at 40 and the Moving Average Convergence Divergence (MACD) continues to print rising red bars, suggesting increasing bearish momentum This convergence of indicators points to a likely continuation of the downtrend.
After seven sessions of losses, the next sessions might see a rebound and sellers might eventually run out of steam. Regarding the overall outlook, it will depend on whether the pair holds the 0.8400 line or not.
EUR/GBP daily chart
- GBP/USD struggles to keep its uptrend above year-to-date (YTD) high of 1.3266.
- RSI shifting overbought opened the door for GBP/USD’s retracement.
- The uptrend will resume once the pair reclaims 1.3266.
- Downside risks emerge if GBP/USD tumbles below 1.3200.
The Pound Sterling retreats from the multi-year highs it reached on Tuesday and registers losses of over 0.40% against the Greenback as traders brace for the release of US inflation data on Friday. The GBP/USD enjoyed a ride and hit a two-year peak at 1.3266 following Fed Chair Jerome Powell’s speech, yet at the time of writing, the pair trades at 1.3220.
GBP/USD Price Forecast: Technical outlook
According to the GBP/USD daily chart, the uptrend will extend as long as the pair remains above the top trendline of an ascending channel that was broken on August 23. However, due to the 400-pip rally in August, the pair is set to consolidate as buying momentum begins to fade, as depicted by the Relative Strength Index (RSI).
The RSI turned overbought, meaning the pair could retreat before aiming for higher prices.
If GBP/USD clears the YTD high of 1.3266, that could pave the way for challenging the March 23, 2022 peak at 1.3298. Further gains are seen once that level is cleared, with the next key resistance being the 1.3400 figure before challenging the March 1, 2022, high at 1.3437.
Conversely, if GBP/USD tumbles below 1.3200, this could exacerbate a pullback toward the latest cycle high at 1.3044, hit on July 17. A breach of the latter will expose the 50-day moving average (DMA) at 1.2857.
GBP/USD Price Action – Daily Chart

British Pound PRICE Today
The table below shows the percentage change of British Pound (GBP) against listed major currencies today. British Pound was the strongest against the Euro.
| USD | EUR | GBP | JPY | CAD | AUD | NZD | CHF | |
|---|---|---|---|---|---|---|---|---|
| USD | 0.54% | 0.40% | 0.42% | 0.12% | 0.07% | -0.11% | 0.13% | |
| EUR | -0.54% | -0.13% | -0.13% | -0.41% | -0.45% | -0.37% | -0.41% | |
| GBP | -0.40% | 0.13% | 0.00% | -0.29% | -0.33% | -0.25% | -0.27% | |
| JPY | -0.42% | 0.13% | 0.00% | -0.27% | -0.34% | -0.27% | -0.28% | |
| CAD | -0.12% | 0.41% | 0.29% | 0.27% | -0.05% | 0.04% | 0.02% | |
| AUD | -0.07% | 0.45% | 0.33% | 0.34% | 0.05% | 0.08% | 0.06% | |
| NZD | 0.11% | 0.37% | 0.25% | 0.27% | -0.04% | -0.08% | -0.02% | |
| CHF | -0.13% | 0.41% | 0.27% | 0.28% | -0.02% | -0.06% | 0.02% |
The heat map shows percentage changes of major currencies against each other. The base currency is picked from the left column, while the quote currency is picked from the top row. For example, if you pick the British Pound from the left column and move along the horizontal line to the US Dollar, the percentage change displayed in the box will represent GBP (base)/USD (quote).
- USD/JPY rises to near 145.00 as the US Dollar recovers strongly.
- Upbeat US Consumer Confidence eases US hard landing fears.
- Investors await the Tokyo CPI and the US core PCE inflation for July.
The USD/JPY pair climbs to near 145.00 in Wednesday’s North American session. The asset strengthens as the US Dollar (USD) delivers a strong recovery move after posting a fresh annual low. The USD rebounds as upbeat United States (US) Consumer Confidence data for August diminished fears of a hard landing.
Market experts started anticipating a hard landing for the US economy after the US Nonfarm Payrolls (NFP) report for July showed a slowdown in labor demand and a significant increase in the Unemployment Rate. The hard landing is a scenario in which the economy enters a recession in an attempt to bring inflation down to the bank’s target.
US Conference Board showed on Tuesday that Consumer Confidence rose to 103.30 in August, beating expectations of 100.7. The sentiment indicator exhibits the confidence of individuals in the economic prospects.
Meanwhile, the market sentiment appears to be risk-off as investors turn cautious ahead of the US core Personal Consumption Expenditure price index (PCE) data for July, which will be published on Friday. The S&P 500 has posted nominal losses in the North American session. The US Dollar Index (DXY), which tracks the Greenback’s value against six major currencies, recovered strongly above 101.00 from a fresh annual low of 100.50.
The underlying inflation data is expected to influence market speculation for the Federal Reserve (Fed) interest rate cut path. Financial markets currently expect that the Fed will begin reducing interest rates from the September meeting. Traders remain split over the likely rate-cut size.
On the Japanese Yen (JPY) front, investors await the Tokyo Consumer Price Index (CPI) data for August, which will be published on Friday. The data is expected to show that Tokyo CPI excluding Fresh foods rose steadily by 2.2% in August. The inflation data will influence market speculation for the Bank of Japan's (BoJ) interest rate hike path.
Japanese Yen FAQs
The Japanese Yen (JPY) is one of the world’s most traded currencies. Its value is broadly determined by the performance of the Japanese economy, but more specifically by the Bank of Japan’s policy, the differential between Japanese and US bond yields, or risk sentiment among traders, among other factors.
One of the Bank of Japan’s mandates is currency control, so its moves are key for the Yen. The BoJ has directly intervened in currency markets sometimes, generally to lower the value of the Yen, although it refrains from doing it often due to political concerns of its main trading partners. The current BoJ ultra-loose monetary policy, based on massive stimulus to the economy, has caused the Yen to depreciate against its main currency peers. This process has exacerbated more recently due to an increasing policy divergence between the Bank of Japan and other main central banks, which have opted to increase interest rates sharply to fight decades-high levels of inflation.
The BoJ’s stance of sticking to ultra-loose monetary policy has led to a widening policy divergence with other central banks, particularly with the US Federal Reserve. This supports a widening of the differential between the 10-year US and Japanese bonds, which favors the US Dollar against the Japanese Yen.
The Japanese Yen is often seen as a safe-haven investment. This means that in times of market stress, investors are more likely to put their money in the Japanese currency due to its supposed reliability and stability. Turbulent times are likely to strengthen the Yen’s value against other currencies seen as more risky to invest in.
This time last year, the FX futures market was reducing EUR longs. More recently, EUR positioning is very small, Société Generale FX strategists note
Risk reversals to return towards flattish levels
“EUR/USD’s acceleration above 1.10 over the past couple of weeks has pushed up both realised and implied volatility.”
“As the FX skew usually predicts more volatility on the USD upside, the switch to positive of short-dated EUR/USD risk reversals is an inversion.”
“This move is consistent with the positive vol/spot correlation, but as the spot stabilises, we’d expect risk reversals to return towards flattish levels.”
- AUD/USD continues rising in line with the dominant uptrend.
- The RSI is showing bearish divergence with price, however, warning of a possible pull back.
AUD/USD extends its rally and makes higher highs as it continues the uptrend it began at the start of August.
The pair reached a new monthly high of 0.6813 on Wednesday. Although it has pulled back since, it remains in an established uptrend which, given “the trend is your friend” is expected to extend.
AUD/USD 4-hour Chart
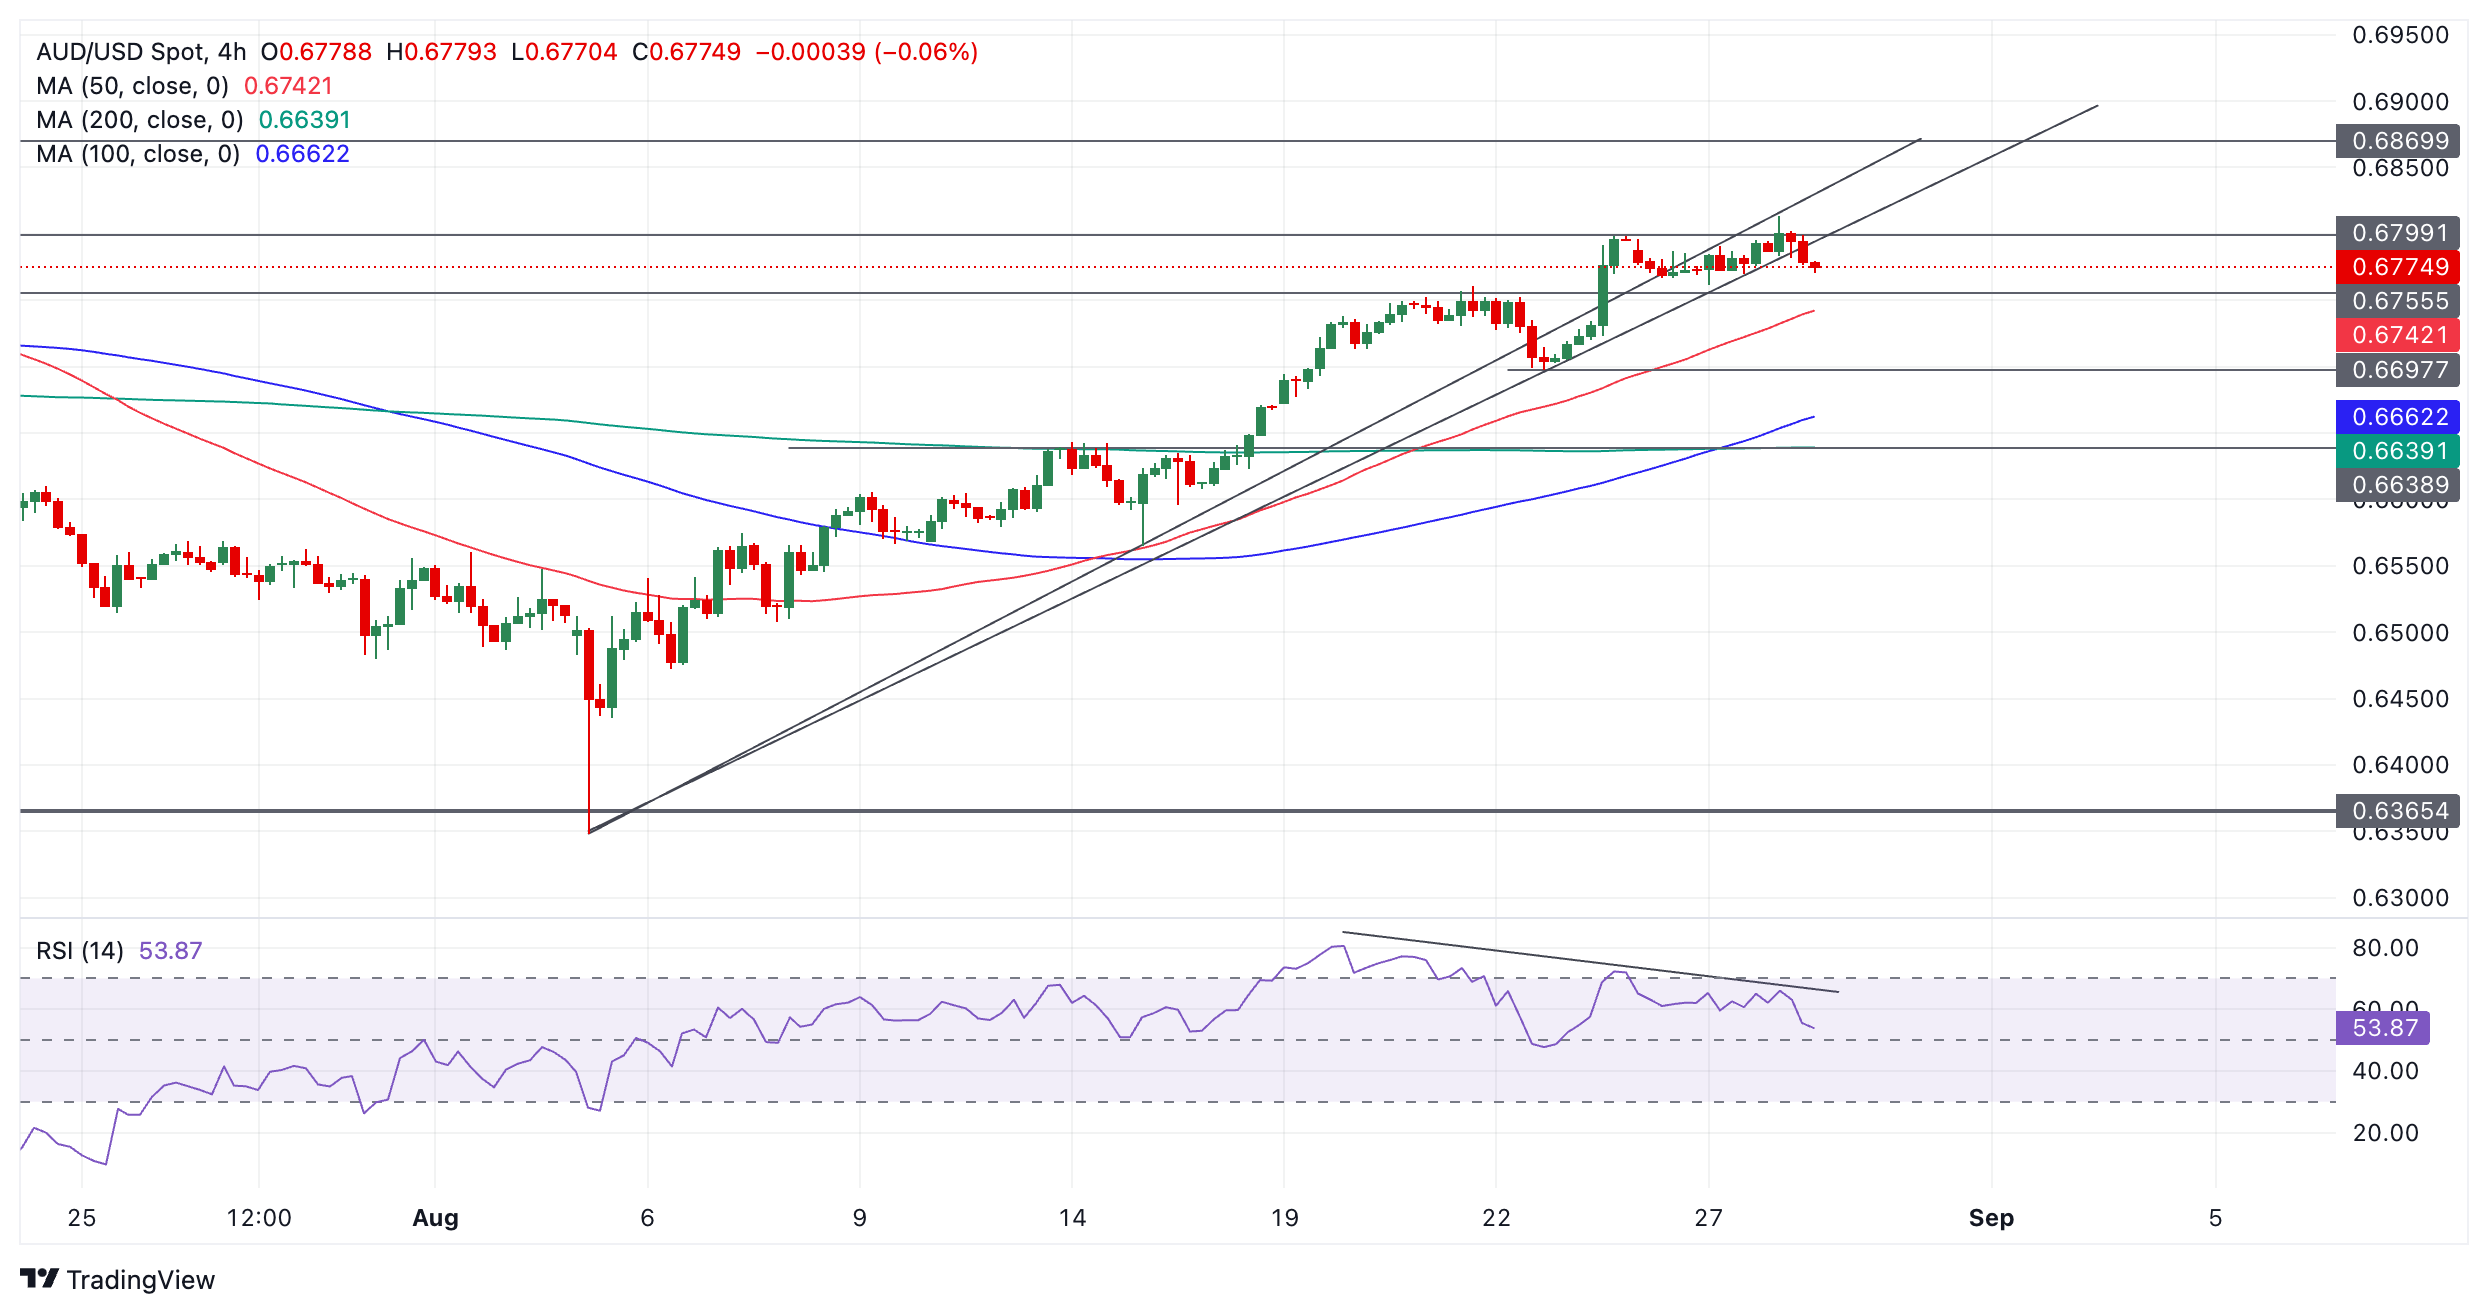
AUD/USD has broken above the key 0.6799 July 11 high, and now sets its sights on the next target at 0.6870, the December 2023 high. A break above 0.6813 would provide bullish confirmation.
The Relative Strength Index (RSI) momentum indicator is showing bearish divergence with price. The new monthly high price reached on Wednesday was not accompanied by a corresponding new high in the RSI, for example. This shows waning momentum which is a bearish sign and could infer a deeper correction is on the horizon.
The price levels at 0.6755 and 0.6639, however, would be expected to provide support to any pull backs and points of departure for fresh upswings as the dominant uptrend is likely to resume.
- NZD/USD declined to from 0.6250 after a strong recovery in the US Dollar.
- Annual US core PCE inflation is estimated to have accelerated to 2.7% in July.
- The RBNZ is expected to deliver more interest rate cuts this year.
The NZD/USD pair drops after facing selling pressure near 0.6250 in Wednesday’s North American session. The Kiwi asset falls as the US Dollar (USD) recovers strongly after posting a fresh annual low. The US Dollar Index (DXY), which tracks the Greenback’s value against six major currencies, extends its recovery above 101.00 from its year-to-date low (YTD) low of 100.50.
A decent recovery in the US Dollar appears to be bolstered by uncertainty among market participants as the United States (US) core Personal Consumption Expenditure inflation (PCE) for July comes under the spotlight. This has also weighed on risk-sensitive assets.
Investors await the US PCE inflation data to get fresh cues about the Federal Reserve (Fed) interest rate cut path. Currently, traders have fully priced in market expectations for the Fed to start reducing its key borrowing rates in September, while they are doubtful over whether the potential size of the rate cut would be 25 or 50 basis points (bps).
The data from the US PCE report is expected to show that annual core inflation rose at a faster pace of 2.7% from 2.6% in June, with monthly figures growing steadily by 0.2%.
Meanwhile, investors have underpinned the US Dollar against the New Zealand Dollar (NZD), but the Kiwi’s performance against other major peers has remained firm even though market participants expect that the Reserve Bank of New Zealand (RBNZ) will cut interest rates aggressively this year. The RBNZ unexpectedly pivoted to policy-normalization two weeks back.
New Zealand Dollar FAQs
The New Zealand Dollar (NZD), also known as the Kiwi, is a well-known traded currency among investors. Its value is broadly determined by the health of the New Zealand economy and the country’s central bank policy. Still, there are some unique particularities that also can make NZD move. The performance of the Chinese economy tends to move the Kiwi because China is New Zealand’s biggest trading partner. Bad news for the Chinese economy likely means less New Zealand exports to the country, hitting the economy and thus its currency. Another factor moving NZD is dairy prices as the dairy industry is New Zealand’s main export. High dairy prices boost export income, contributing positively to the economy and thus to the NZD.
The Reserve Bank of New Zealand (RBNZ) aims to achieve and maintain an inflation rate between 1% and 3% over the medium term, with a focus to keep it near the 2% mid-point. To this end, the bank sets an appropriate level of interest rates. When inflation is too high, the RBNZ will increase interest rates to cool the economy, but the move will also make bond yields higher, increasing investors’ appeal to invest in the country and thus boosting NZD. On the contrary, lower interest rates tend to weaken NZD. The so-called rate differential, or how rates in New Zealand are or are expected to be compared to the ones set by the US Federal Reserve, can also play a key role in moving the NZD/USD pair.
Macroeconomic data releases in New Zealand are key to assess the state of the economy and can impact the New Zealand Dollar’s (NZD) valuation. A strong economy, based on high economic growth, low unemployment and high confidence is good for NZD. High economic growth attracts foreign investment and may encourage the Reserve Bank of New Zealand to increase interest rates, if this economic strength comes together with elevated inflation. Conversely, if economic data is weak, NZD is likely to depreciate.
The New Zealand Dollar (NZD) tends to strengthen during risk-on periods, or when investors perceive that broader market risks are low and are optimistic about growth. This tends to lead to a more favorable outlook for commodities and so-called ‘commodity currencies’ such as the Kiwi. Conversely, NZD tends to weaken at times of market turbulence or economic uncertainty as investors tend to sell higher-risk assets and flee to the more-stable safe havens.
The main FX positioning story was the unwind of a massive carry trade and the associated yen shorts, Société Generale FX strategists note.
CAD short covering looks far from over
“As we suspected on 7 August, these shorts were almost cleaned out, while CFTC reports released since then show that yen positions have totally normalised. Now, the biggest FX position is in CAD, as a very significant short accumulated between March and July.”
“The reversal of this position started this month and has already pressured USD/CAD below 1.35 from 1.40. But given the size of the remaining short, the CAD short covering looks far from over.”
- WTI falls to the $74.00 level as lower demand from China, the world’s largest Oil consumer weighs.
- The weakness comes despite a Libyan political faction shutting down all the country’s Oil production.
- OPEC+ is expected to increase production which could bring down the equilibrium rate of WTI.
West Texas Intermediate (WTI), the US Crude Oil benchmark, is trading down by almost one and a half percent to just above $74.00 on Wednesday. WTI is falling as concerns about Chinese demand and risks of a broader economic slowdown offset supply losses from Libya and wider geopolitical risks from the region.
A slowdown in the Chinese economy, the largest importer of Crude Oil in the world, is reducing demand whilst structural changes and the replacement of gasoline-fueled cars with electric vehicles, as well as a general shift towards a greater reliance on green energy, is further taking its toll.
“The big surprise this year on the demand side has been the softness of Chinese demand growth. The slowdown in China demand, which is mostly structural, is an important factor in Oil markets over the next few years. Some of it is a macro story – GDP is rising at a slower pace – the other reasons are more Oil-specific and micro, and include fuel-switching to EVs and from Oil to LNG,” says Daan Struyven, Head of Research at Goldman Sachs.
WTI price declines on Wednesday despite the news from Libya that the Sarir Oil field has almost completely halted output, according to Reuters. The move was orchestrated by the Libyan National Army (LNA) who are protesting about the Libyan government’s sacking of the Governor of the Central Bank of Libya (CBL), Sadiq al-Kabir. The LNA controls the country's east and south where most of the oil fields lie. The LNA declared on Monday that all production and exports would be halted.
Speculation that OPEC+ will begin raising production in order to bring down the price of Oil so as it make it less profitable for competitors in the form of US shale producers, is further weighing on WTI.
“OPEC has been quite effective in balancing the market and keeping Oil prices in a range,” said Struyven, in an interview with Bloomberg News, however “this is set to change, if OPEC+ increases production.”
The result of such changes in OPEC+’s strategy will be that Oil prices could fall to a lower equilibrium rate where the new floor for prices becomes the equilibrium rate for shale producers. However, the decline is likely to be gradual given countervailing bullish factors, says the Goldman Sachs researcher.
US monetary policy could be a further factor for Oil price. If the US Federal Reserve (Fed) decides to go ahead with cutting interest rates in 20204-5, as now seems highly likely, WTI could gain a back wind because it would lower the opportunity cost of holding Oil vis-a-vis interest-paying assets.
The US Crude inventories declined last week, according to data from the American Petroleum Institute (API). Crude Oil stockpiles in the United States for the week ending August 23 fell by 3.4 million barrels. This compared to an increase in stockpiles of 0.347 million barrels in the previous week. The market consensus estimate had been for stocks to decline by 3.0 million barrels.
On Wednesday, the Energy Information Administration (EIA) will release its figures on US crude inventories. They are expected to show a similar fall, in line with the downtrend witnessed during the summer. Out of the last nine US inventory releases, eight showed declines. This reflects increased demand which is a supportive background factor for Oil.
A period of high deficits, slowing growth, sticky inflation, currency devaluation and an imminent cutting cycle has already attracted capital towards Gold's warm embrace, TDS Senior Commodity Strategist Daniel Ghali notes.
Visible short positions remain near decade-lows
“Macro fund positioning in Gold is at its highest levels since the depths of the pandemic. It is more statistically consistent with deep recession cuts than it is with normalization cuts, or alternatively may be bloated due to geopolitics, deficits, or any number of the bullish narratives touted above.”
“What is clear is that macro funds have scarcely held more Gold than they do today, with our estimates now at levels that marked local highs in 2019 and 2016. CTAs are also effectively 'max long'. Chinese ETF outflows have resumed. Shanghai trader positioning near record-highs already reflects Gold’s allure in the face of a weaker domestic currency, stock and property market.”
“Asia is on a buyer's strike in physical. Visible short positions remain near decade-lows. Narratives in Gold markets are unanimously bullish. We see significant risks to the near-term outlook tied to positioning, despite the strong fundamental backdrop.”
The Pound Sterling (GBP) has drifted lower in line with the broader trend in the USD so far today, Scotiabank's Chief FX Strategist Shaun Osborne notes.
GBP consolidates
“PM Starmer is in Germany to try and rebuild UK/EU ties—a potential GBP-positive. BoE MPC member Mann, who dissented in favour of a hold at the last MPC policy decision, speaks at 8.15ET. A generally firm run of UK data reports in the recent past will not have allayed her concerns about an ‘upward ratchet’ to wage trends.”
“GBP is consolidating but has put minor bull trend support at 1.3235 behind it on the session, suggesting that a little more drift may develop in the short run. A low close on the session could form a bearish “harami” candle. GBP support is 1.3180.”
The Euro (EUR) has lost 0.5% over the course of the session so far as EUR consolidation from earlier in the week develops into a little more softness, Scotiabank's Chief FX Strategist Shaun Osborne notes.
EUR slips despite some narrowing in short-term EZ/US spreads
“Absent any data or fundamental developments, short-term flows appear to be driving movement on the session. Note that EZ/US 2Y spreads have narrowed further today (-147bps, the narrowest since mid-2023) which suggests EUR losses may snap higher again after month -end flows run off.”
“EUR/USD drift has undercut short-term bull trend momentum and spot risks easing a bit more to test key short-term support at 1.1100/10. Price action suggests a minor peak may have been reached around 1.12 over the turn of the week. A push under 1.1100 may see losses extend to the mid-1.10s.”
Despite the desynchronisation of ECB and Riksbank rates decisions, EUR-SEK rates differentials poorly explain the path of the FX rate, Société Generale FX strategists note.
FX market is trading the krone as an equity proxy
“The short rates spread has been widening since April, but the pro-carry environment stimulated the correlation between EUR/SEK and risky assets, especially European equities.”
“This correlation has been somewhat unstable this summer, but the latest joint bounce of the SEK and Eurostoxx suggests that the FX market is again trading the krone as an equity proxy.”
The Canadian Dollar (CAD) has slipped a little so far today after grinding higher through 1.3450 yesterday, Scotiabank's Chief FX Strategist Shaun Osborne notes.
CAD edges off highs but holds in upper 1.34s
“CAD losses are limited in the grander scheme of things though and the solid gains in the CAD through August so far is surely putting the squeeze on the aggressive buildup of CAD short positioning that developed through the middle of the year—just as the CAD troughed.”
“Spot continues to trade a little below our estimated fair value equilibrium of 1.3521, which may constrain CAD short-covering gains somewhat. There are no Canadian data reports today. Q2 Current Account data is out tomorrow and June/Q2 GDP is updated on Friday. Steady spot gains on the session so far may develop a little more traction above 1.3470/75 resistance on the day to regain 1.35+.”
“But the USD rebound is still some way away from making any impression on the August downtrend (resistance sits at 1.3545/50). Support is 1.3440. The USD is looking oversold on the short-term chart but the strength of the downtrend in the USD sets the bar quite high for a reversal to develop at the moment.”
- The US Dollar trades flat ahead of a quiet US economic calendar.
- Markets seem to turn risk-off ahead of Nvidia earnings, benefiting the Dollar and weighing on Chinese tech stocks and cryptocurrencies.
- The US Dollar Index edges up slightly, trading just below 101.00 for a second day in a row.
The US Dollar (USD) trades mixed again on Wednesday, with markets getting a bit nervous ahead of Nvidia Corp. (NVDA) earnings to be released after the US closing bell. Seeing the recent slowdown in some economic numbers and with the boom around Artificial Intelligence (AI) having eased a touch, traders wonder if Nvidia can keep up its pace of growth and its streak of beating earnings. A miss on estimates could spark some sharper risk-off moves, a scenario that would put the US Dollar back in the graces of traders with safe-haven flows unfolding.
On the US economic calendar front, nearly no data points for markets to digest on Wednesday. This adds to more tension and expectations for the Nvidia earnings. Even Federal Reserve officials aren’t expected to make an early appearance, with only Federal Reserve Bank of Atlanta President Raphael Bostic set to speak at 22:00 GMT.
Daily digest market movers: Another off day
- At 11:00 GMT, the Mortgage Bankers Association has released its weekly Mortgage Applications Index, this time for the week ending August 23. The week before, the index posted a steep decline of 10.1% with the most recent number coming in at 0.5%.
- The US Treasury is auctioning a 5-year note around 17:00 GMT.
- Federal Reserve Bank of Atlanta President Raphael Bostic participates in a moderated conversation and Q&A about the US economic outlook at the Stanford Club of Georgia at 22:00 GMT.
- Equities in Asia got dragged lower due to Chinese tech stocks dipping ahead of Nvidia earnings later this Wednesday. Both European and US indices are rather flat.
- The CME Fedwatch Tool shows a 63.5% chance of a 25 basis points (bps) interest rate cut by the Fed in September against a 36.5% chance for a 50 bps cut. Another 25 bps cut (if September is a 25 bps cut) is expected in November by 42.5%, while there is a 45.4% chance that rates will be 75 bps (25 bps + 50 bps) below the current levels and a 12.1% probability of rates being 100 (25 bps + 75 bps) basis points lower.
- The US 10-year benchmark rate trades at 3.82%, quite stable for the second day in a row.
US Dollar Index Technical Analysis: Nvidia moving forex
The US Dollar Index (DXY) is seeing a very odd driver dictating direction. The assumption is very easy: should Nvidia earnings beat expectations again, a new wave of risk-on flows will likely push equities higher and the US Dollar lower. If earnings fall in line with expectations or below them, the US Dollar is expected to rally and risk-off flows would send equities south.
For a recovery, the DXY faces a long road ahead. First, 101.90 is the level to reclaim. A steep 2% uprising would be needed to get the index to 103.18 from the current 101.00. A very heavy resistance level near 104.00 not only holds a pivotal technical value, but it also bears the 200-day Simple Moving Average (SMA) as the second heavyweight to cap price action.
On the downside, 100.62 (the low from December 28) tries to hold support, although it looks rather feeble. Should it break, the low from July 14, 2023, at 99.58 will be the ultimate level to look out for. Once that level gives way, early levels from 2023 are coming in near 97.73.
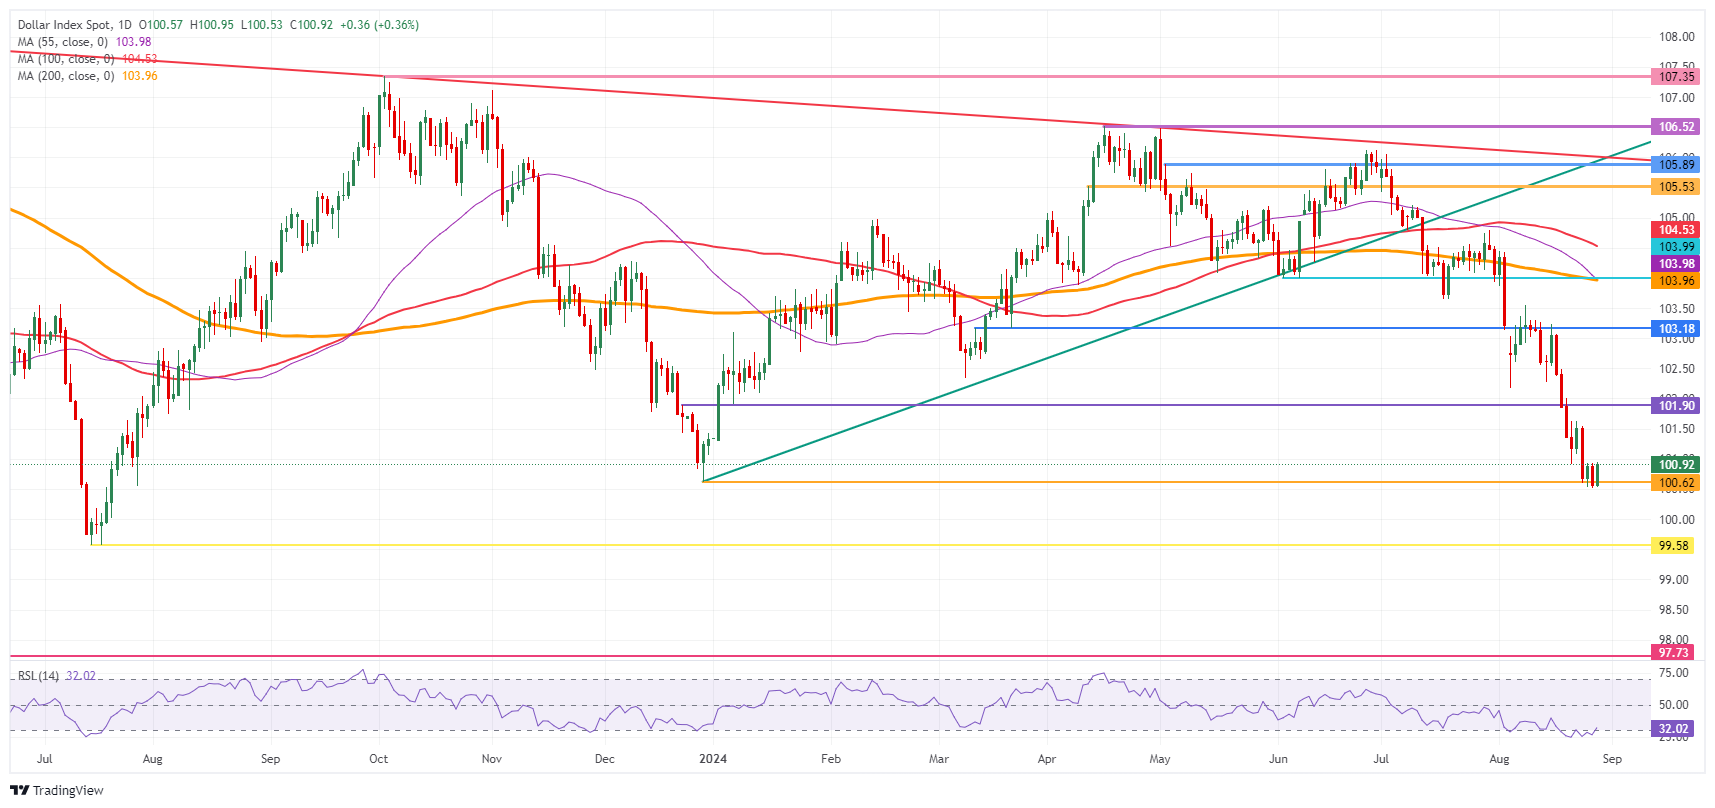
US Dollar Index: Daily Chart
US Dollar FAQs
The US Dollar (USD) is the official currency of the United States of America, and the ‘de facto’ currency of a significant number of other countries where it is found in circulation alongside local notes. It is the most heavily traded currency in the world, accounting for over 88% of all global foreign exchange turnover, or an average of $6.6 trillion in transactions per day, according to data from 2022. Following the second world war, the USD took over from the British Pound as the world’s reserve currency. For most of its history, the US Dollar was backed by Gold, until the Bretton Woods Agreement in 1971 when the Gold Standard went away.
The most important single factor impacting on the value of the US Dollar is monetary policy, which is shaped by the Federal Reserve (Fed). The Fed has two mandates: to achieve price stability (control inflation) and foster full employment. Its primary tool to achieve these two goals is by adjusting interest rates. When prices are rising too quickly and inflation is above the Fed’s 2% target, the Fed will raise rates, which helps the USD value. When inflation falls below 2% or the Unemployment Rate is too high, the Fed may lower interest rates, which weighs on the Greenback.
In extreme situations, the Federal Reserve can also print more Dollars and enact quantitative easing (QE). QE is the process by which the Fed substantially increases the flow of credit in a stuck financial system. It is a non-standard policy measure used when credit has dried up because banks will not lend to each other (out of the fear of counterparty default). It is a last resort when simply lowering interest rates is unlikely to achieve the necessary result. It was the Fed’s weapon of choice to combat the credit crunch that occurred during the Great Financial Crisis in 2008. It involves the Fed printing more Dollars and using them to buy US government bonds predominantly from financial institutions. QE usually leads to a weaker US Dollar.
Quantitative tightening (QT) is the reverse process whereby the Federal Reserve stops buying bonds from financial institutions and does not reinvest the principal from the bonds it holds maturing in new purchases. It is usually positive for the US Dollar.
- USD/CAD is undergoing a correction within an established downtrend.
- The RSI is oversold and if it exits the zone it could indicate a higher correction is likely unfolding.
USD/CAD is pulling back whilst unfolding a down leg within a long-term range bound market. Both the medium and short-term trends are bearish and given “the trend is your friend” the odds favor more downside.
The Relative Strength Index (RSI) momentum indicator is in the oversold zone, however, and the pair is pulling back. If the RSI exits oversold and re-enters the neutral territory (on a 4-hour closing basis) it would provide a buy signal and indicate an extended correction higher. Such a correction is likely to return to the trendline before rolling over.
USD/CAD 4-hour Chart
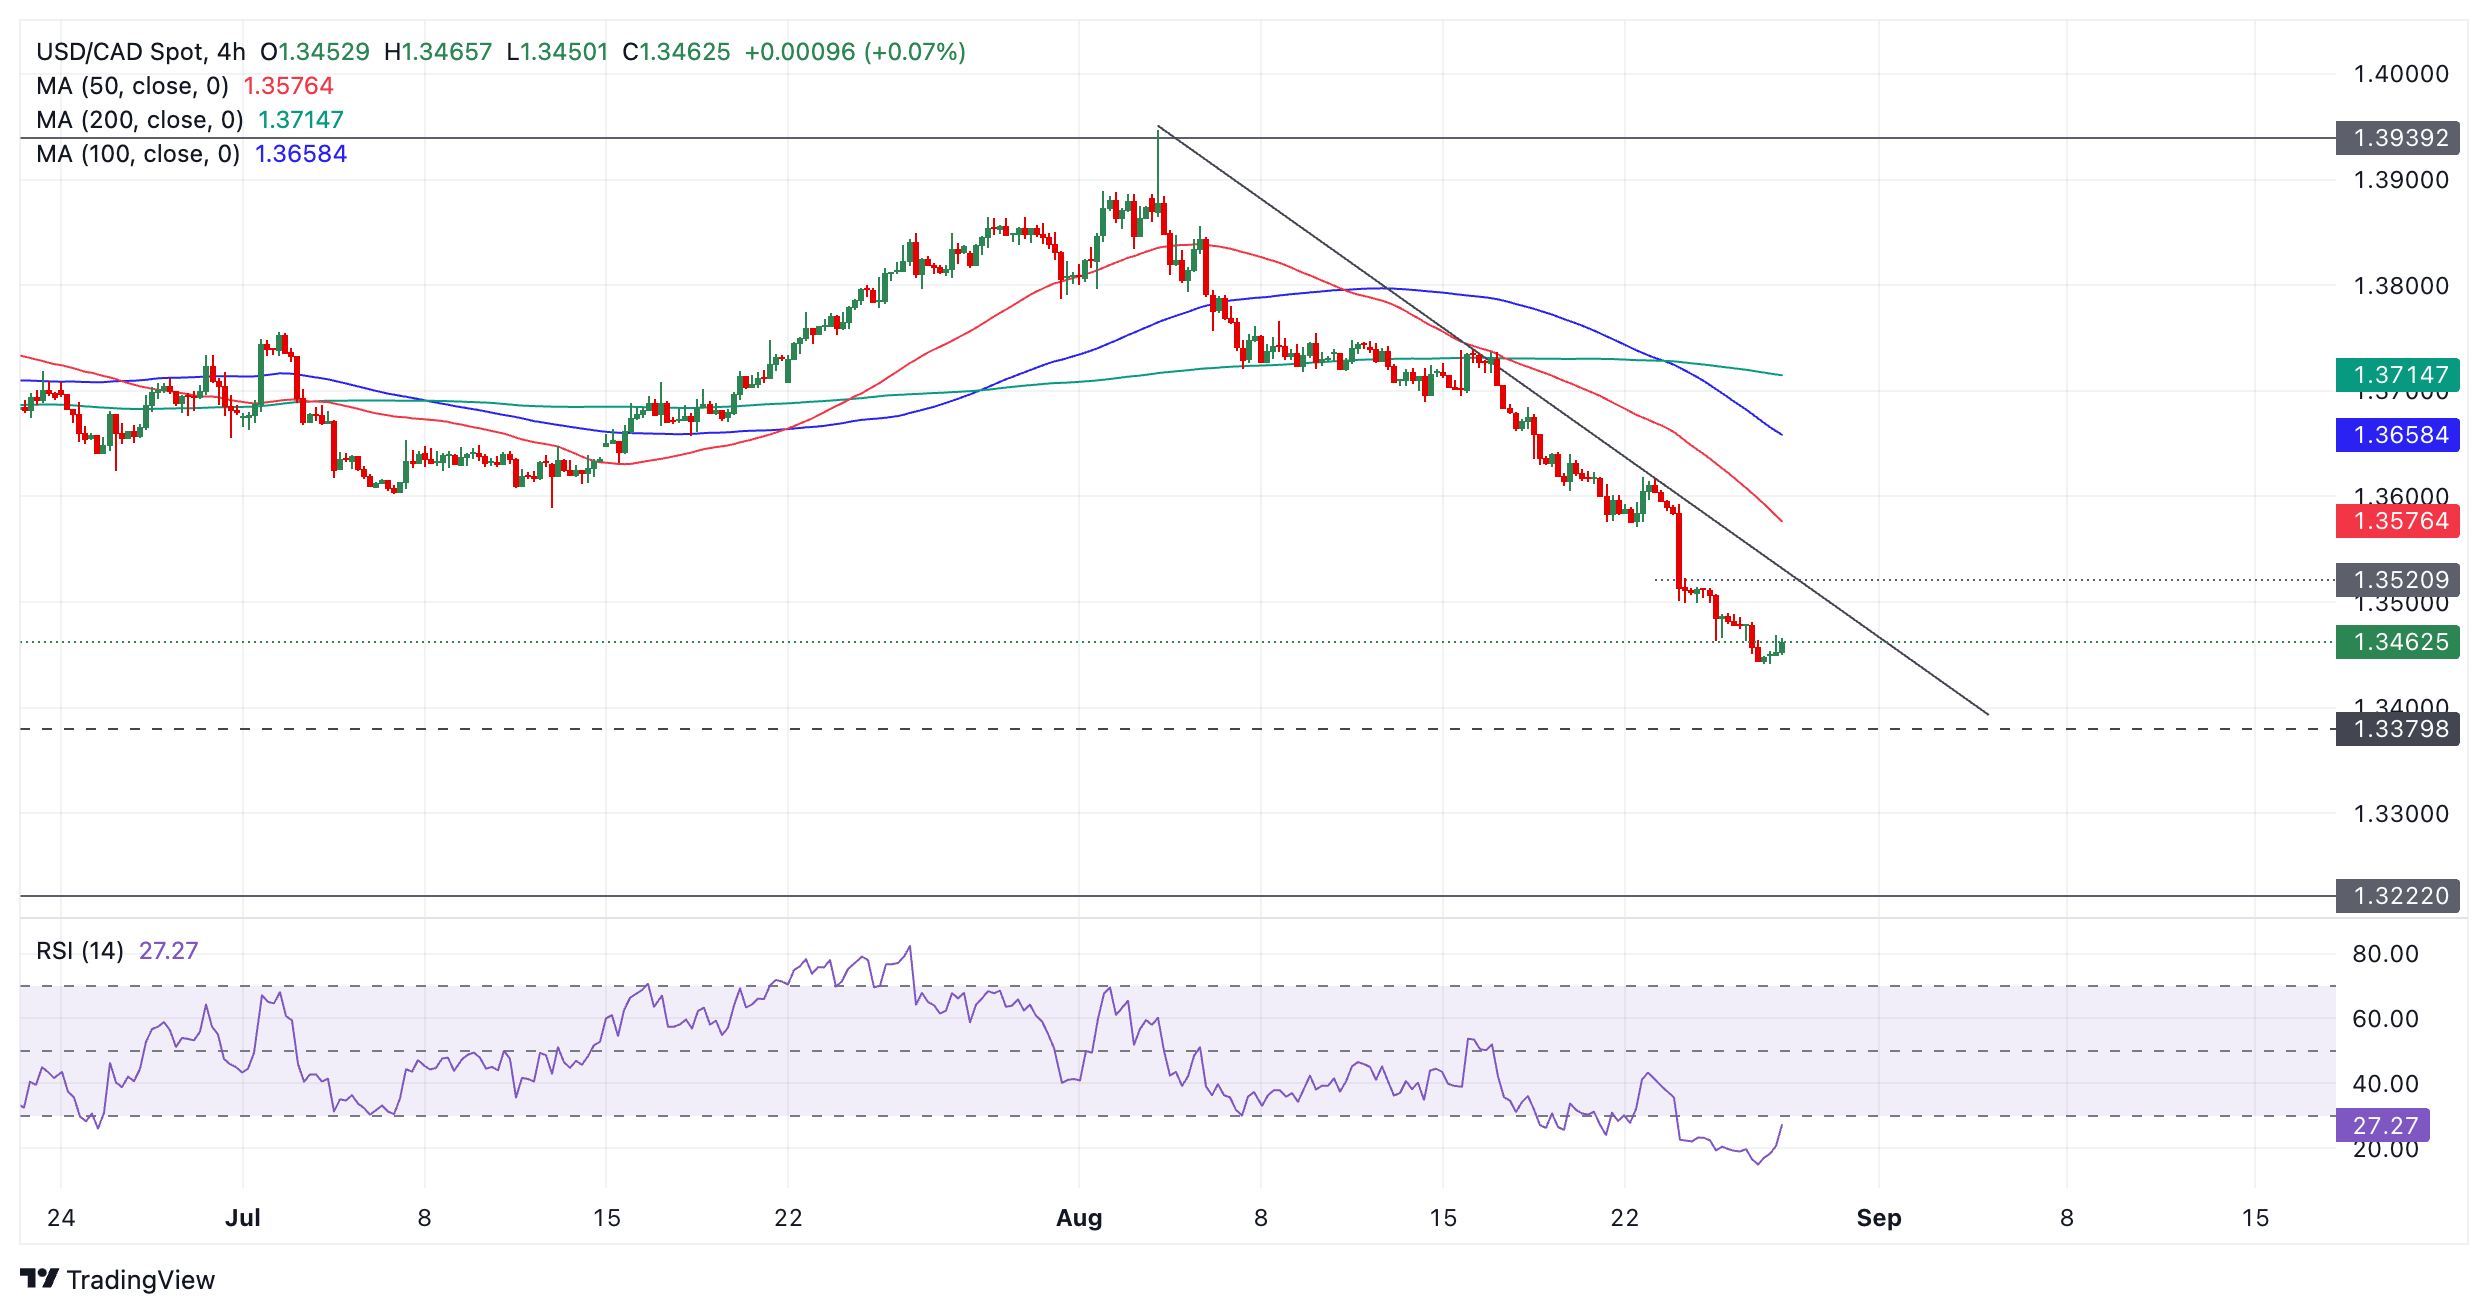
Once the pull back ends the downtrend is likely to take over again, pushing the pair lower. Added bearish confirmation would come from a break below 1.3441.
The next bearish target is situated at 1.3380 – the swing lows of October 2023 and January 2024. This is followed by the bottom of the range at 1.3222.
A close above 1.3520 and the trendline for the move down in August would bring into doubt the bearish bias and could indicate early signs of a reversal. However, a break above 1.3593 would give a surer sign of a reversal.
The Dollar Index (DXY) depreciated 0.3% to 100.55, its weakest level since July 2023, and then rebounded back, DBS Senior FX Strategist Philip Wee notes.
Fed is inclined for a 25-bps rate cut
“While the US Treasury 10Y yield was barely changed at 3.82%, the 2Y yield eased 3.7 bps to 3.90%. Both the S&P 500 and Nasdaq Composite Indices rose by 0.16% each. Fed officials are rallying around Fed Chair Jerome Powell’s call to lower interest rates in September. This Friday’s PCE deflator has become less relevant given the Fed’s priority to prevent further cooling of the US labor market.”
“Although the Conference Board’s Consumer Confidence Index increased to 103.3 in August from an upwardly revised 101.9 in July, consumers showed more concern about the labor market. For example, the proportion of respondents who felt that jobs were ‘plentiful’ fell to 32.8% from 33.4%, while the share of those who reckoned jobs were ‘hard to get’ increased slightly to 16.4% from 16.3%.”
“However, the expectations index signaled less concerns of a recession ahead by pushing above 80 to 82.5 in August from an upwardly revised July to 81.1. Overall, the consumer survey supported the Fed’s inclination for a 25-bps rate cut vs. the market’s bet for a larger 50 bps move.”
In the year to date, the Euro (EUR) is the second best performing G10 currency. This appears out of kilter with Germany’s struggling economy, which is in danger of falling back into technical recession in Q3, Rabobank’s Senior FX Strategist Jane Foley notes.
The value of EUR/USD continues its ascent
“Although some models suggest that at current levels, EUR is undervalued vs. the USD, the Eurozone’s real effective exchange rate is trading comfortably off its post pandemic low and around the middle of the range maintained since the single currency’s inception.”
This suggests that the value of the currency was no obstacle to the ECB cutting rates in June. Indeed, if the value of EUR/USD continues its ascent, given the backdrop of moderating inflationary pressure in the Eurozone, there may be more reason for the ECB to lower rates.
If a stronger EUR triggers expectations that the pace of ECB rate cuts could be hastened, this will have an automatic moderating impact on the value of EUR/USD. Consequently, we don’t see EUR/USD trading much higher than 1.12 in the coming months. We see scope for dips back to 1.10 if forthcoming key US economic data surprises on the upside.
NZD/USD appreciated most overnight by 0.8% to 0.6252, its highest closing level since January 2, DBS Senior FX Strategist Philip Wee notes.
NZD to extend rise above 0.62
“NZD/USD can return to the 0.6320 level at the end of 2023 to fully recover this year’s losses. Technically, NZD/USD has broken above this year’s primary psychological resistance level at 0.62.”
“Policy-wise, the focus shifted to the greenback’s weakness in anticipation of the Fed’s telegraphed rate cut at the September 18 meeting, following the Reserve Bank of New Zealand’s interest rate cut on August 14.”
“Position-wise, CFTC data reported that speculators have trimmed their net short positions after aggressively dumping their six-year high net long positions during the unwinding of JPY carry trades in the past two months.”
- Silver price declines from $30.00, weighed down by a mild recovery in the US Dollar.
- Traders divide over the potential Fed rate-cut size in September.
- Silver price finds cushion near key 50-period EMA on a four-hour timeframe.
Silver price (XAG/USD) falls sharply from the psychological resistance of $30.00 in Wednesday’s European session. The white metal tumbles as the US Dollar (USD) recovers some ground after declining to a fresh year-to-date (YTD) low. Historically, buying interest in the US Dollar bodes poorly for the Silver price, given that it makes the Silver price expensive for investors.
The US Dollar (DXY), which tracks the Greenback’s value against six major currencies, delivers a mild recovery move to near 100.85 from 100.50. 10-year US Treasury yields drop to near 3.82%.
A mild recovery in the US Dollar appears to be the outcome of uncertainty among market participants ahead of the United States (US) core Personal Consumption Expenditure inflation (PCE) data for July, which will be published on Friday. The near-term outlook of the US Dollar has remained vulnerable as the Federal Reserve (Fed) is widely anticipated to start reducing interest rates from the September meeting. While trades remain split over the likely rate cut size.
The core PCE price index data, a Federal Reserve’s (Fed) preferred inflation measure, is expected to influence market expectations for the potential size of interest rate cuts in September. Economists estimated that annual underlying inflation accelerated to 2.7% from 2.6% in July, with month-on-month price pressures growing steadily by 0.2%.
Silver technical analysis
Silver price trades in a Rising Channel chart pattern on a four-hour timeframe in which each pullback is considered as a buying opportunity by market participants. The 50-period Exponential Moving Average (EMA) near $29.40 continues to provide support to the Silver price bulls.
The 14-period Relative Strength Index (RSI) falls inside the 40.00-60.00 range, suggesting a consolidation ahead.
Silver four-hour chart
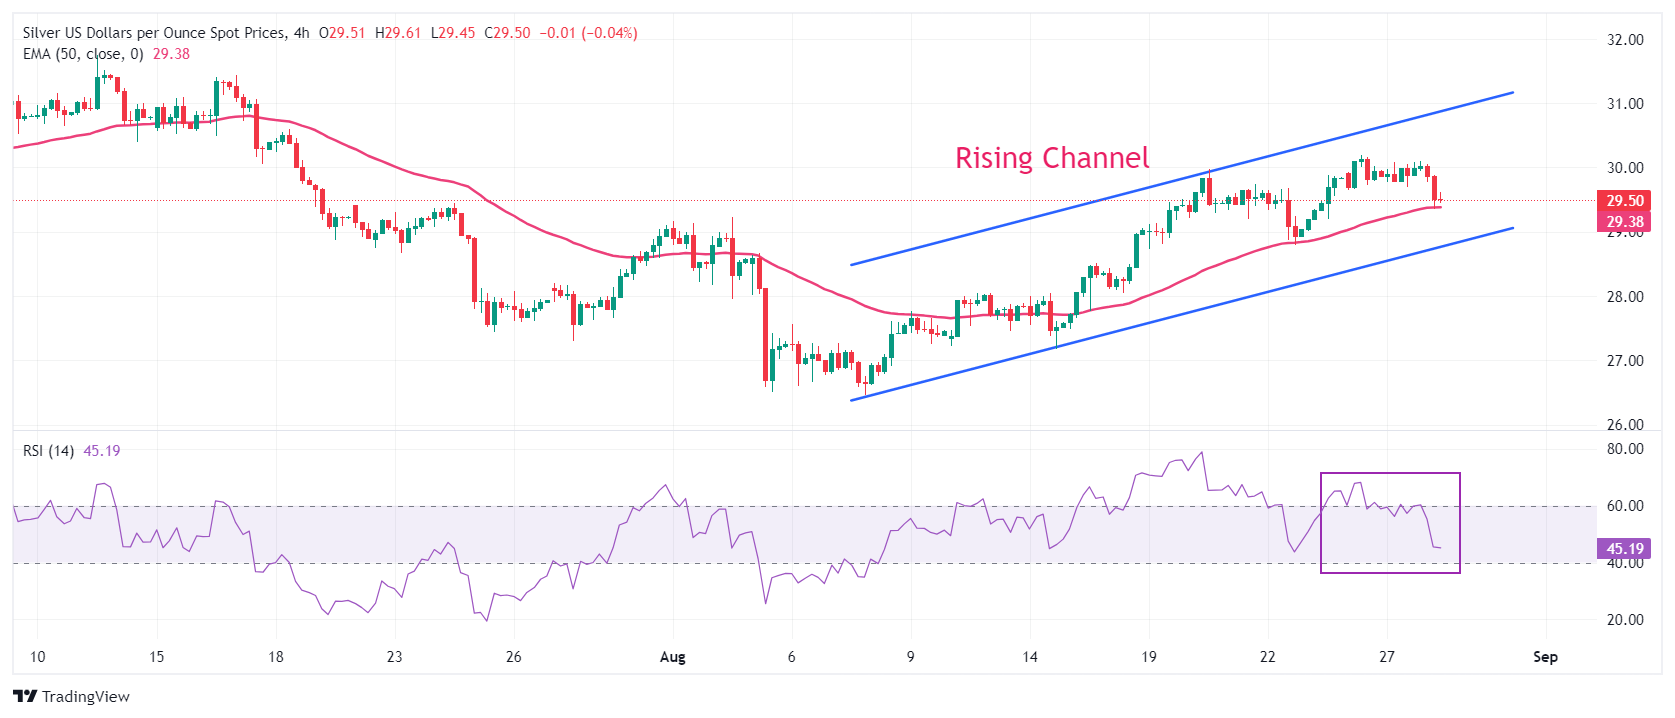
Silver FAQs
Silver is a precious metal highly traded among investors. It has been historically used as a store of value and a medium of exchange. Although less popular than Gold, traders may turn to Silver to diversify their investment portfolio, for its intrinsic value or as a potential hedge during high-inflation periods. Investors can buy physical Silver, in coins or in bars, or trade it through vehicles such as Exchange Traded Funds, which track its price on international markets.
Silver prices can move due to a wide range of factors. Geopolitical instability or fears of a deep recession can make Silver price escalate due to its safe-haven status, although to a lesser extent than Gold's. As a yieldless asset, Silver tends to rise with lower interest rates. Its moves also depend on how the US Dollar (USD) behaves as the asset is priced in dollars (XAG/USD). A strong Dollar tends to keep the price of Silver at bay, whereas a weaker Dollar is likely to propel prices up. Other factors such as investment demand, mining supply – Silver is much more abundant than Gold – and recycling rates can also affect prices.
Silver is widely used in industry, particularly in sectors such as electronics or solar energy, as it has one of the highest electric conductivity of all metals – more than Copper and Gold. A surge in demand can increase prices, while a decline tends to lower them. Dynamics in the US, Chinese and Indian economies can also contribute to price swings: for the US and particularly China, their big industrial sectors use Silver in various processes; in India, consumers’ demand for the precious metal for jewellery also plays a key role in setting prices.
Silver prices tend to follow Gold's moves. When Gold prices rise, Silver typically follows suit, as their status as safe-haven assets is similar. The Gold/Silver ratio, which shows the number of ounces of Silver needed to equal the value of one ounce of Gold, may help to determine the relative valuation between both metals. Some investors may consider a high ratio as an indicator that Silver is undervalued, or Gold is overvalued. On the contrary, a low ratio might suggest that Gold is undervalued relative to Silver.
The Peso closed at its lowest levels of the year against the dollar yesterday as investors continue to take a dim view of the ruling Morena’s party constitutional reforms, ING’s FX strategist Chris Turner notes.
The judicial reforms are currently in focus
“Very much in focus currently are the judicial reforms centered on judges – including Supreme Court judges – being elected by popular vote. Outgoing President AMLO says his reforms seek to reduce corruption in the judiciary. Many others say the reforms represent an alarming concentration of power.”
“Worrying for investors is that these judicial reforms passed the committee stage on Monday without being watered down at all. And we should expect more Peso volatility over coming weeks as the reforms are debated in Congress as the government seeks to secure a two-thirds majority in both the lower house and the Senate.
“And unlike in Brazil where the central bank could well be hiking rates on 18 September, the Peso looks unlikely to receive any support from the central bank. Here Banxico is trying to steer a clear course to lower rates. Let’s see whether Banxico’s inflation report released today adds weight to Banxico’s optimism on the path to lower core inflation – probably a Peso negative if it does.”
Turkish policymakers are waiting for some much-needed decline in inflation to back their claim that inflation is moderating through H2 2024. So far, however, only superficial improvement is observed. The month-on-month rate of CPI change even re-accelerated in July, and end-2024 inflation expectations deteriorated, Commerzbank’s FX Analyst Tatha Ghose notes.
Inflation expectations are elevated
“We have received further bad news in the form of elevated inflation expectations within consumer and business tendency surveys. The latest survey showed that the manufacturing sector’s 12-month forward inflation expectation stands at c.54% in August; the household sector’s 12-month forward inflation expectation stands at c.73%. These data portray inflation expectations to be stuck in a range incompatible with ‘winning the fight against inflation’.”
“All surveys are gradually easing compared with their 2022-23 peaks, but the absolute levels are very different. CBT’s survey of market participants has proved to be the most over-optimistic at all timeframes – it hardly went above 45% at its peak when actual CPI inflation was registering 70%. There is simply too much ‘mean reversion’ built into market forecasts, perhaps. Conversely, the household sector’s expectations seem stuck at a higher static range.”
“Whatever the explanation of such systematic errors may be, economic agents are still likely to behave in line with their own expectations – in this sense, the economic adjustment necessary to ‘anchor’ inflation expectations do not seem to have occurred at all. At a time when the lira is depreciating at a faster pace once again and speculation about policymakers’ fatigue is mounting, such data come as bad news indeed.”
- Natural Gas steadies above $2.13 and holds support
- Markets see Europe gearing up for the next heating season while New Zealand faces issues ahead.
- The US Dollar index sees mild inflow on the back of risk-off nervousness ahead of Nvidia.
Natural Gas is trading at $2.17 per MMBtu at the time of writing. Natural Gas prices (XNG/USD) remain in the clear range between $2.13 and $2.36 for most of August. Demand still looks bleak, with Europe and China having less demand for Liquified Natural Gas (LNG). Meanwhile, New Zealand is quickly lifting an LNG import ban and speeding up LNG projects to solve the current energy crisis.
Meanwhile, the US Dollar Index (DXY), which tracks the Greenback's value against six major currencies, is still trying to recover from one of its worst weeks in nearly a year last week. The US Dollar looks to have some support and even see some mild inflow again on the back of some nervousness ahead of Nvidia earnings later this Wednesday after the US closing bell. Any underperformance of the tech giant could spark a sell-off in equities and could see more US Dollar inflow.
Natural Gas is trading at $2.17 per MMBtu at the time of writing.
Natural Gas news and market movers: New Zealand’s energy issues
- Bloomberg reports that Norwegian gas exports to Europe are at a two-month low. The main reason for the drop in supply is seasonal maintenance in Norway.
- Reuters reports from Australia that Inpex has canceled at least four LNG shipments scheduled for next month from its Ichthys facility due to an ongoing outage.
- Reuters reports that New Zealand's government vowed to lift a six-year-old ban on the issue of oil and gas exploration permits and wants to fast-track an LNG import project. The country has been facing serious energy disruptions in recent months.
- Recent retaliations and now the introduction of a new ballistic missile for Ukraine could mean that Russian President Vladimir Putin could even consider completely cutting off Europe from its gas supply.
Natural Gas Technical Analysis: Not much moving the needle
Natural Gas prices have eased after a rather volatile summer. With a ceasefire deal on the table for the Gaza region and Israel, combined European gas storage levels above 90% and sluggish demand in China, not many catalysts exist for gas prices to substantially surge. It looks like Gas prices will be stuck in this sideways action for some time until a new catalyst comes in to shake things up.
Should more bullish headlines emerge and pull the Gas price higher, look ahead for moving averages as upside resistances. First, the 200-day Simple Moving Average (SMA) and the 55-day SMA near $2.30 and $2.36 would already be significant moves higher. Further up, the 100-day SMA at $2.41 could be tested.
On the downside, pressure is building on $2.13 to a breakdown again. In case that level snaps, $2.00 comes back into play for a test and possible dip below. Although still far away, a return of sub-$2.00 could mean a test at the low of August, with $1.93 in the cards.
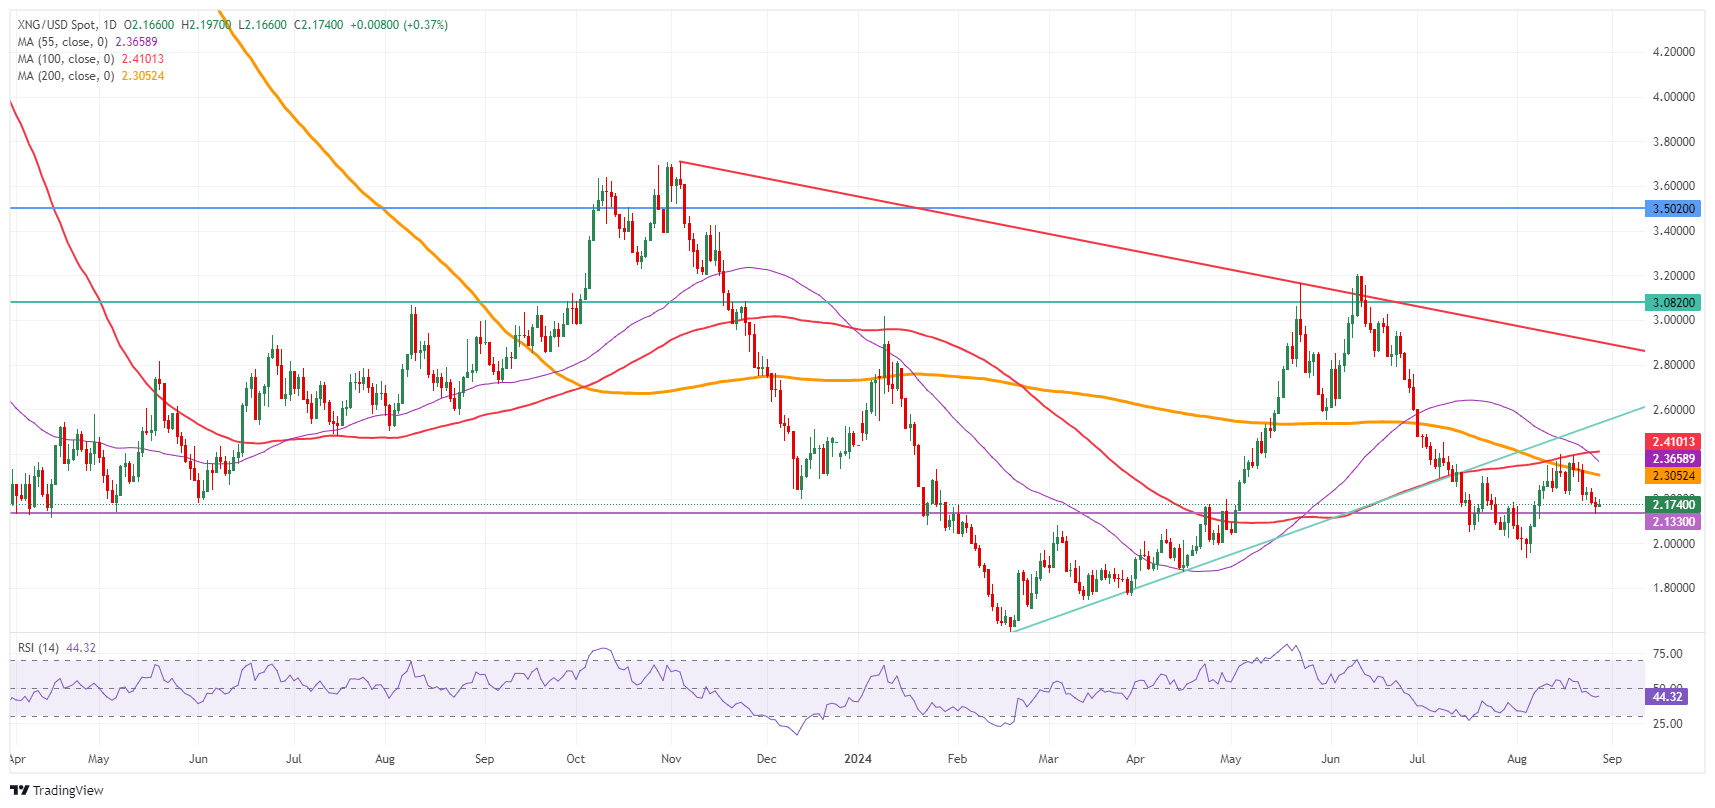
Natural Gas: Daily Chart
Natural Gas FAQs
Supply and demand dynamics are a key factor influencing Natural Gas prices, and are themselves influenced by global economic growth, industrial activity, population growth, production levels, and inventories. The weather impacts Natural Gas prices because more Gas is used during cold winters and hot summers for heating and cooling. Competition from other energy sources impacts prices as consumers may switch to cheaper sources. Geopolitical events are factors as exemplified by the war in Ukraine. Government policies relating to extraction, transportation, and environmental issues also impact prices.
The main economic release influencing Natural Gas prices is the weekly inventory bulletin from the Energy Information Administration (EIA), a US government agency that produces US gas market data. The EIA Gas bulletin usually comes out on Thursday at 14:30 GMT, a day after the EIA publishes its weekly Oil bulletin. Economic data from large consumers of Natural Gas can impact supply and demand, the largest of which include China, Germany and Japan. Natural Gas is primarily priced and traded in US Dollars, thus economic releases impacting the US Dollar are also factors.
The US Dollar is the world’s reserve currency and most commodities, including Natural Gas are priced and traded on international markets in US Dollars. As such, the value of the US Dollar is a factor in the price of Natural Gas, because if the Dollar strengthens it means less Dollars are required to buy the same volume of Gas (the price falls), and vice versa if USD strengthens.
For the second consecutive month, there is some tentatively encouraging news on inflation for the Reserve Bank of Australia. Monthly headline CPI eased from 3.8% to 3.5% year-on-year in July. That was above the 3.4% consensus, but the slowdown in the trimmed mean (i.e. core) from 4.1% to 3.8% made up for that, ING’s FX strategist Francesco Pesole notes.
AUD to test December-2023 highs at 0.6850
“The AUD followed Australian bond yields higher right after the release, but is now trading back below 0.680. There are reasons to be cautiously optimistic on Australian disinflation at this point, but we still see market pricing for one RBA cut in December as too dovish and think easing will only start in 1Q25. Remember that RBA rates are at 4.35%, which is still below the rates expected of the Fed and the RBNZ (both 4.50%) by year-end.”
“Some short-term USD rebound can put some pressure on AUD, but it seems too early to rule out that the 0.6850 December-2023 highs will be tested.”
The market has focused heavily on the US Dollar (USD) in the recent past. No wonder, as we assume that the Fed has a more responsive reaction function, which leads to increased uncertainty and thus increased, especially at the turning point in monetary policy. The Euro is likely to play second fiddle in the near future, although it is of course worth taking a look at the single currency, Commerzbank’s FX Analyst Antje Praefcke notes.
Euro is set to depreciate somewhat
“It is clear that the market also expects the Fed to be more responsive. The Fed is likely to cut by a total of 200 basis points by mid-2025, the ECB by ‘only’ 150 bp. In view of the fact that the Fed's inflation target is within reach and the US labor market is weakening, these expectations may seem justified. However, there are unlikely to be any major surprises on the Fed's interest rate expectations for the time being.”
“On the Euro side, the ECB's statements at the September meeting were less precise than Powell's recent comments. ECB President Lagarde emphasized in July that future decisions would be data dependent. However, the ECB saw its medium-term inflation outlook confirmed and Lagarde emphasized that wages are unlikely to rise as much next year as they did this year. In addition, some ECB representatives have become more dovish, making an interest rate hike the week after next appear highly likely.”
“It is quite possible that the expectations for the ECB will shift somewhat in the course of the publication of the Euro zone inflation data – especially if the data surprise to the downside – and the Euro will depreciate somewhat. The greater the fall in the inflation rate, the more certain the market can be that the interest rate cut in September will come as expected and that the ECB will continue its cutting cycle beyond that.”
Provided that 0.6215 is not breached, the New Zealand Dollar (NZD) could test 0.6265 before the advance might pause. In the longer terms, NZD is expected to continue to advance; it remains to be seen if the y-t-d high of 0.6320 is within reach, UOB Group FX strategists Quek Ser Leang and Lee Sue Ann note.
Bulls may try to test 0.6265
24-HOUR VIEW: “We expected NZD to trade in a range between 0.6180 and 0.6225 yesterday. Our expectation was incorrect. Instead of trading in a range, NZD rose, reaching a high of 0.6254. Despite the relatively sharp advance, upward momentum has not increased much. That said, provided that 0.6215 (minor support is at 0.6230) is not breached, NZD could test 0.6265 before the advance might pause.”
1-3 WEEKS VIEW: “Two days ago (26 Aug, spot at 0.6230), we highlighted that while we continue to expect NZD to advance, conditions are severely overbought, and it remains to be seen if the year-to-date high of 0.6320 is within reach. There is no change in our view. On the downside, should NZD break below 0.6180 (‘strong support’ level previously at 0.6140), it would indicate that NZD is not strengthening further.”
- The Mexican Peso is strengthening as risk appetite improves.
- Recent mixed US data is dispelling fears of a hard landing for the US economy.
- Political risk remains a negative background factor for the Peso.
The Mexican Peso (MXN) trades higher in its key pairs on Wednesday amid a cautiously optimistic market mood. European equities are trading modestly higher and the increasingly held view that the US Federal Reserve (Fed) will be able to lower interest rates in an orderly fashion – avoiding disruptions to the economy – is further buoying investor risk appetite.
Several lower tier US data releases have come out over recent days that have painted a mixed picture and helped allay concerns the economy is heading for a hard landing. These include higher-than-expected Consumer Confidence in August and a surge in US Durable Goods Orders in July released Monday, though labor-market pessimism lingers and the Richmond Fed Manufacturing Index sank below estimates.
Mexican Peso faces pressure from political factors
The Mexican Peso, meanwhile, has been pressured in recent sessions by a revival of the debate over reforms the new Morean-led government is planning for the Mexican judiciary. The proposed changes would make judges and magistrates elected by popular vote; critics say this will undermine justice, democracy and investor confidence in Mexico. ¡
Monday saw the new reforms voted through a committee for debate in the lower house in September when parliament opens, according to ABC News. Disagreement over the reforms has led to public demonstrations in Mexico City by members of the judiciary. The US ambassador to Mexico, Ken Salazar, said the “popular direct election of judges is a major risk to the functioning of Mexico's democracy.”
Salazar’s criticisms have led the Mexican government to “pause” diplomatic relations with both the US and Canada. If the stand-off escalates there is the potential for it to negatively impact free trade between the three countries with negative implications for the Mexican Peso. This would especially be the case should former-President Donald Trump win the presidential election.
The breakdown in diplomatic relations comes at a time where Mexico stands to potentially benefit from an escalating trade war between North America and China. News on Tuesday revealed, Canada has decided to increase tariffs on Chinese electric vehicle (EV) and steel imports, by 100% and 25%, respectively.
The decision could benefit Mexico, however, because of its existing role as an intermediary manufacturer of Chinese EVs. These, destined for North America, are not subject to punitive tariffs because of the free-trade agreement that exists between the US, Canada and Mexico, according to Bloomberg News.
At the time of writing, one US Dollar (USD) buys 19.64 Mexican Pesos, EUR/MXN trades at 21.89, and GBP/MXN at 26.00.
Technical Analysis: USD/MXN extends leg higher within rising channel
USD/MXN is moving up within a rising channel and the established uptrend favors longs over shorts.
The pair has broken above a key high that was capping upside at 19.52 (August 23 high), giving further impetus to the uptrend. A break above 19.80 would confirm more gains towards the upper channel line in the 20.60s.
USD/MXN 4-hour Chart
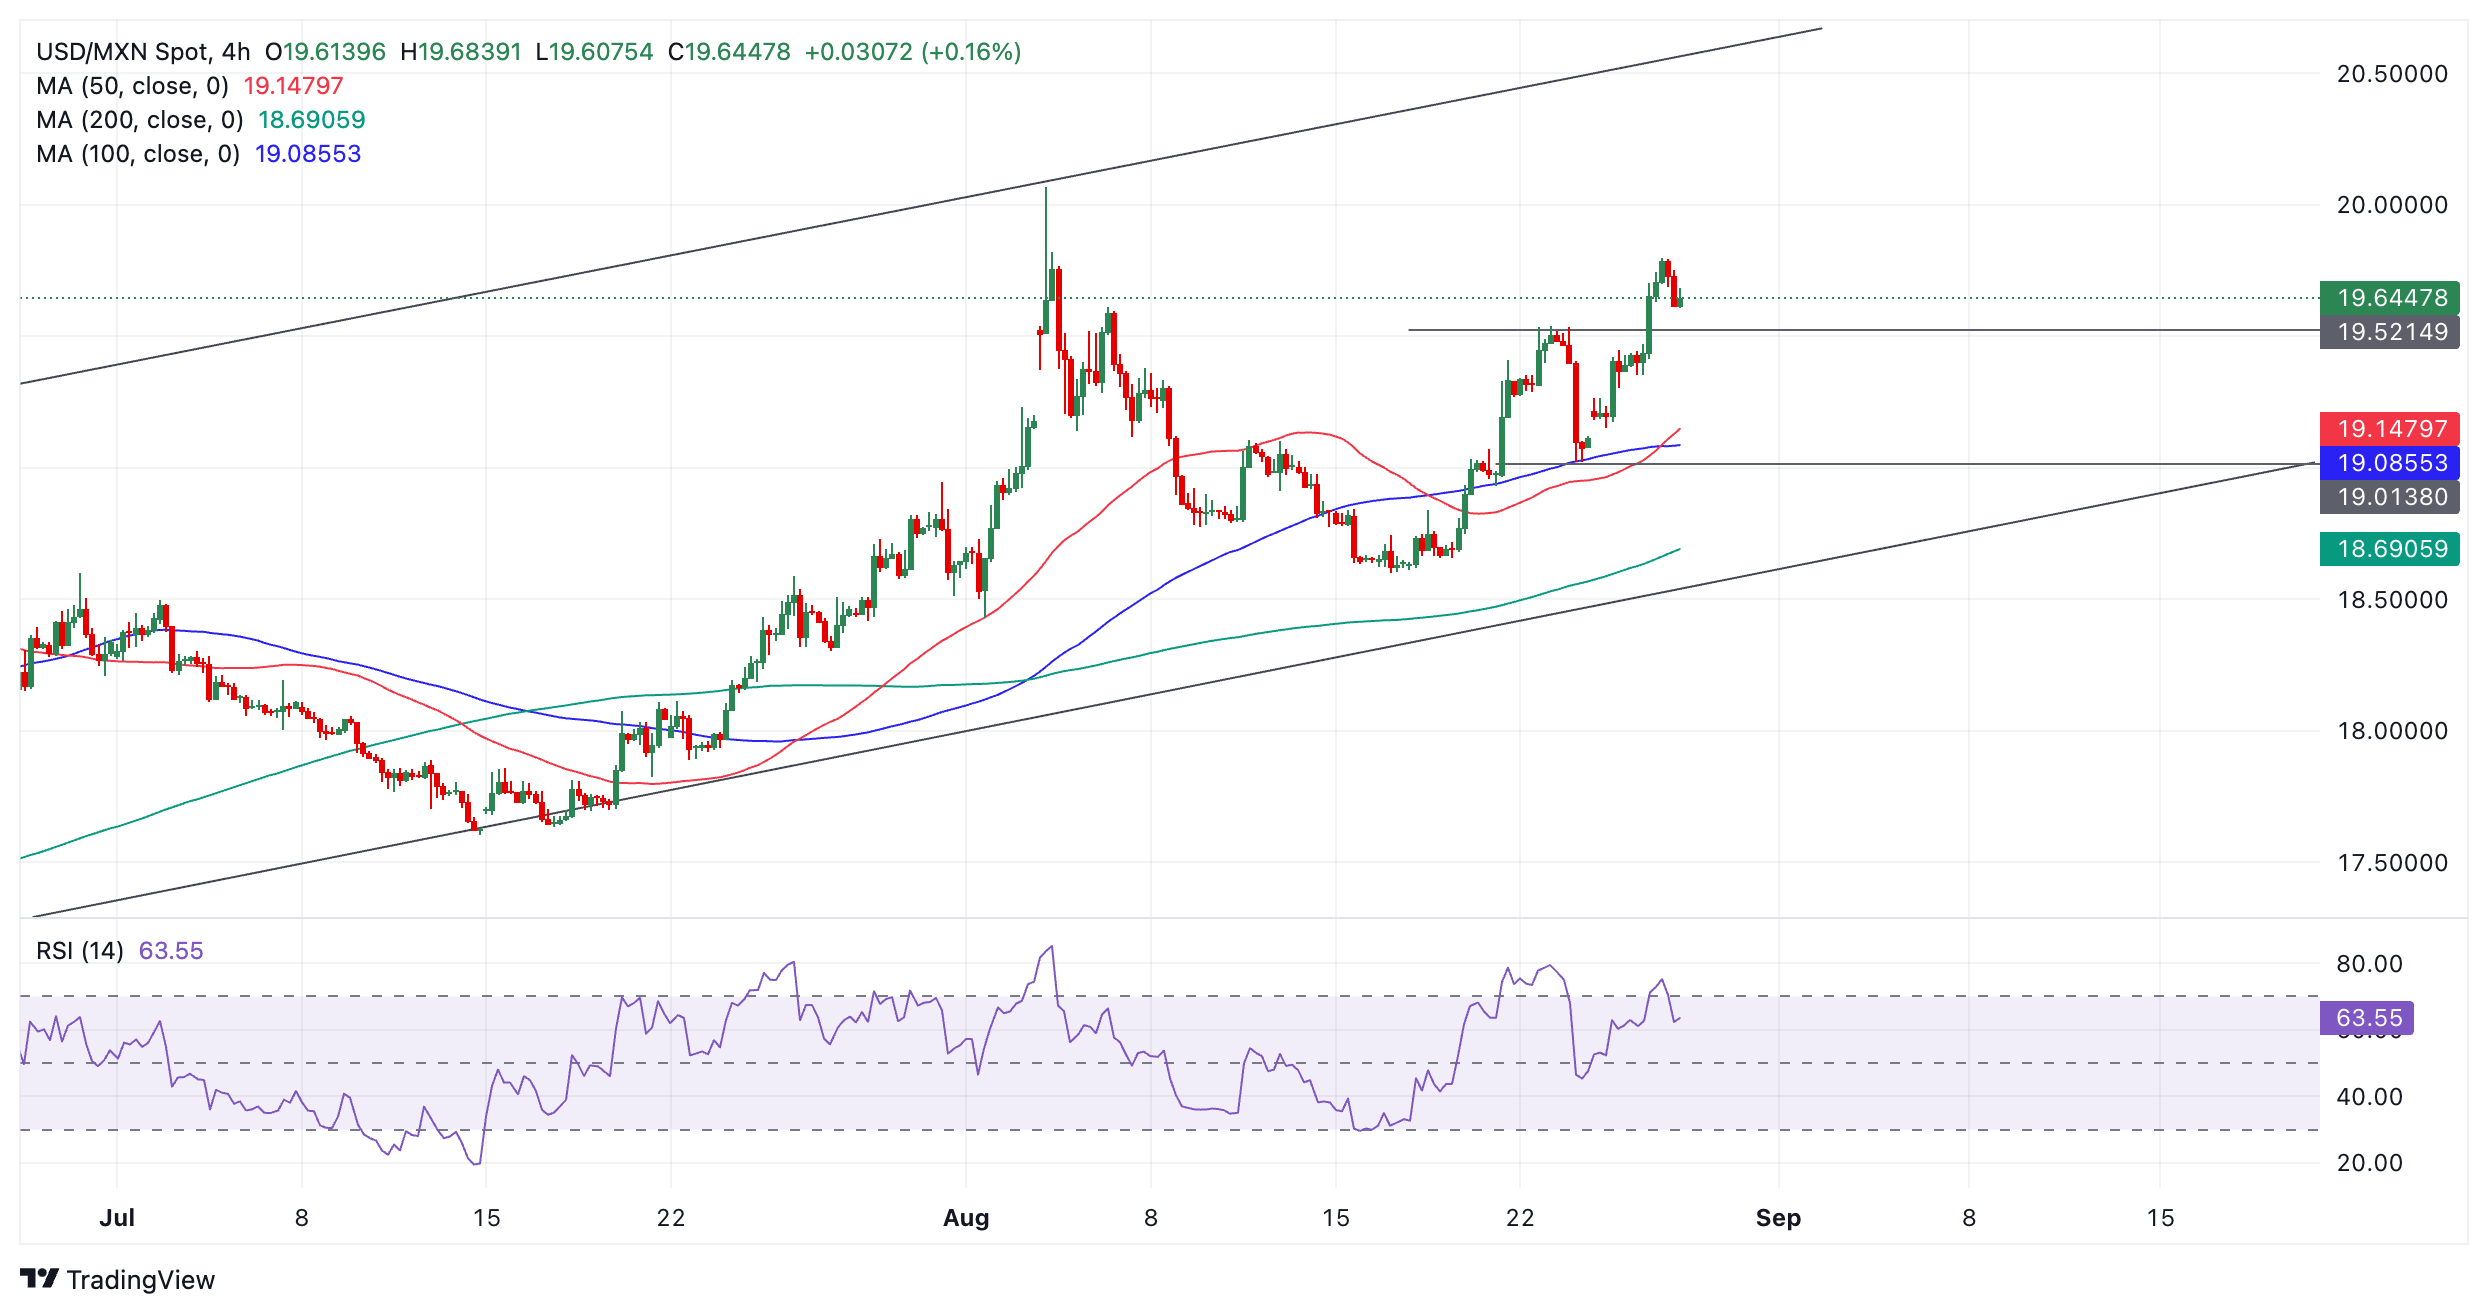
The Relative Strength Index (RSI) has just exited overbought and fallen back into neutral territory. This is a sell signal and indicates a pull back within the uptrend could be unfolding. Such a correction will probably find support at the 19.52 level (previous resistance turned support) and from there possibly resume its upside bias.
Mexican Peso FAQs
The Mexican Peso (MXN) is the most traded currency among its Latin American peers. Its value is broadly determined by the performance of the Mexican economy, the country’s central bank’s policy, the amount of foreign investment in the country and even the levels of remittances sent by Mexicans who live abroad, particularly in the United States. Geopolitical trends can also move MXN: for example, the process of nearshoring – or the decision by some firms to relocate manufacturing capacity and supply chains closer to their home countries – is also seen as a catalyst for the Mexican currency as the country is considered a key manufacturing hub in the American continent. Another catalyst for MXN is Oil prices as Mexico is a key exporter of the commodity.
The main objective of Mexico’s central bank, also known as Banxico, is to maintain inflation at low and stable levels (at or close to its target of 3%, the midpoint in a tolerance band of between 2% and 4%). To this end, the bank sets an appropriate level of interest rates. When inflation is too high, Banxico will attempt to tame it by raising interest rates, making it more expensive for households and businesses to borrow money, thus cooling demand and the overall economy. Higher interest rates are generally positive for the Mexican Peso (MXN) as they lead to higher yields, making the country a more attractive place for investors. On the contrary, lower interest rates tend to weaken MXN.
Macroeconomic data releases are key to assess the state of the economy and can have an impact on the Mexican Peso (MXN) valuation. A strong Mexican economy, based on high economic growth, low unemployment and high confidence is good for MXN. Not only does it attract more foreign investment but it may encourage the Bank of Mexico (Banxico) to increase interest rates, particularly if this strength comes together with elevated inflation. However, if economic data is weak, MXN is likely to depreciate.
As an emerging-market currency, the Mexican Peso (MXN) tends to strive during risk-on periods, or when investors perceive that broader market risks are low and thus are eager to engage with investments that carry a higher risk. Conversely, MXN tends to weaken at times of market turbulence or economic uncertainty as investors tend to sell higher-risk assets and flee to the more-stable safe havens.
- AUD/USD grips gains near 0.6800 as hotter-than-expected Aussie inflation keeps hopes of RBA leaving interest rates steady this year alive.
- Aussie monthly CPI rose by 3.5%, remained higher than estimates of 3.4% but decelerated from the prior release of 3.8%.
- Investors await the Aussie Retail Sales and US core PCE inflation data for July.
The AUD/USD pair holds onto gains near the round-level figure of 0.6800 in Wednesday’s European session. The Aussie asset posts a fresh seven-month high of 0.6813 after a hotter-than-expected Australian monthly Consumer Price Index (CPI) for July kept market speculation for the Reserve Bank of Australia (RBA) to leave its Official Cash Rate (OCR) steady at 4.35% for the entire year alive.
The inflation date came in the early Asian session on Wednesday and showed that monthly CPI decelerated to 3.5% from 3.8% in June but remained higher than expectations of 3.5%, which appeared insufficient to bring RBA rate cut expectations on the table.
This week, the Australian Dollar (AUD) is expected to show more action as Aussie monthly Retail Sales data for July is lined up for release on Friday. Economists estimate that Retail Sales, a key measure of consumer spending that prompts price pressures, to have grown at a slower pace of 0.3% from 0.5% in June.
Meanwhile, the US Dollar (USD) regains temporary ground after posting a fresh year-to-date (YTD) low. The US Dollar Index (DXY), which tracks the Greenback’s value against six major currencies, delivers a mild recovery from 100.50 to near 100.85.
Investors see the US Dollar’s recovery as a short-lived pullback, with evidence that its near-term outlook is uncertain. The Greenback has remained under pressure as the Federal Reserve (Fed) seems to be prepared to start reducing interest rates from the September meeting, with uncertainty over the likely size by which the central bank will cut its key borrowing rates.
For fresh cues on interest rate cut path, investors await the United States (US) core Personal Consumption Expenditure Inflation (PCE) data for July, which will be published on Friday. The PCE Price Index report is expected to show that the annual core inflation rose by 2.7%, faster than June’s reading of 2.6%, with monthly figures growing steadily by 0.2%.
Australian Dollar FAQs
One of the most significant factors for the Australian Dollar (AUD) is the level of interest rates set by the Reserve Bank of Australia (RBA). Because Australia is a resource-rich country another key driver is the price of its biggest export, Iron Ore. The health of the Chinese economy, its largest trading partner, is a factor, as well as inflation in Australia, its growth rate and Trade Balance. Market sentiment – whether investors are taking on more risky assets (risk-on) or seeking safe-havens (risk-off) – is also a factor, with risk-on positive for AUD.
The Reserve Bank of Australia (RBA) influences the Australian Dollar (AUD) by setting the level of interest rates that Australian banks can lend to each other. This influences the level of interest rates in the economy as a whole. The main goal of the RBA is to maintain a stable inflation rate of 2-3% by adjusting interest rates up or down. Relatively high interest rates compared to other major central banks support the AUD, and the opposite for relatively low. The RBA can also use quantitative easing and tightening to influence credit conditions, with the former AUD-negative and the latter AUD-positive.
China is Australia’s largest trading partner so the health of the Chinese economy is a major influence on the value of the Australian Dollar (AUD). When the Chinese economy is doing well it purchases more raw materials, goods and services from Australia, lifting demand for the AUD, and pushing up its value. The opposite is the case when the Chinese economy is not growing as fast as expected. Positive or negative surprises in Chinese growth data, therefore, often have a direct impact on the Australian Dollar and its pairs.
Iron Ore is Australia’s largest export, accounting for $118 billion a year according to data from 2021, with China as its primary destination. The price of Iron Ore, therefore, can be a driver of the Australian Dollar. Generally, if the price of Iron Ore rises, AUD also goes up, as aggregate demand for the currency increases. The opposite is the case if the price of Iron Ore falls. Higher Iron Ore prices also tend to result in a greater likelihood of a positive Trade Balance for Australia, which is also positive of the AUD.
The Trade Balance, which is the difference between what a country earns from its exports versus what it pays for its imports, is another factor that can influence the value of the Australian Dollar. If Australia produces highly sought after exports, then its currency will gain in value purely from the surplus demand created from foreign buyers seeking to purchase its exports versus what it spends to purchase imports. Therefore, a positive net Trade Balance strengthens the AUD, with the opposite effect if the Trade Balance is negative.
Scope for Australian Dollar (AUD) to edge higher, but any advance is likely limited to a test of 0.6815. In the longer run, outsized advance suggests further AUD strength; given the overbought conditions, it remains to be seen if 0.6870 is within reach, UOB Group FX strategists Quek Ser Leang and Lee Sue Ann note.
The 0.6870 resistance may be out of reach
24-HOUR VIEW: “AUD traded between 0.6762 and 0.6796 yesterday, higher than our expected sideways trading range of 0.6750/0.6790. The price action has resulted in a slight increase in upward momentum. Today, there is scope for AUD to edge higher, but any advance is likely limited to a test of 0.6815. The major resistance at 0.6870 is unlikely to come under threat. On the downside, a breach of 0.6760 (minor support is at 0.6775) would indicate that the current mild upward pressure has eased.”
1-3 WEEKS VIEW: “Our update from Monday (26 Aug, spot at 0.6790) is still valid. As indicated, while the outsized advance from last Friday suggests further AUD strength, given the overbought conditions, it remains to be seen if 0.6870 is within reach in the next 1 to 2 weeks. On the downside, if AUD breaks the ‘strong support’ at 0.6730 (level previously at 0.6710), it would suggest that it is not strengthening further.”
Silver prices (XAG/USD) fell on Wednesday, according to FXStreet data. Silver trades at $29.59 per troy ounce, down 1.29% from the $29.97 it cost on Tuesday.
Silver prices have increased by 24.34% since the beginning of the year.
| Unit measure | Silver Price Today in USD |
|---|---|
| Troy Ounce | 29.59 |
| 1 Gram | 0.95 |
The Gold/Silver ratio, which shows the number of ounces of Silver needed to equal the value of one ounce of Gold, stood at 84.83 on Wednesday, up from 84.23 on Tuesday.
Silver FAQs
Silver is a precious metal highly traded among investors. It has been historically used as a store of value and a medium of exchange. Although less popular than Gold, traders may turn to Silver to diversify their investment portfolio, for its intrinsic value or as a potential hedge during high-inflation periods. Investors can buy physical Silver, in coins or in bars, or trade it through vehicles such as Exchange Traded Funds, which track its price on international markets.
Silver prices can move due to a wide range of factors. Geopolitical instability or fears of a deep recession can make Silver price escalate due to its safe-haven status, although to a lesser extent than Gold's. As a yieldless asset, Silver tends to rise with lower interest rates. Its moves also depend on how the US Dollar (USD) behaves as the asset is priced in dollars (XAG/USD). A strong Dollar tends to keep the price of Silver at bay, whereas a weaker Dollar is likely to propel prices up. Other factors such as investment demand, mining supply – Silver is much more abundant than Gold – and recycling rates can also affect prices.
Silver is widely used in industry, particularly in sectors such as electronics or solar energy, as it has one of the highest electric conductivity of all metals – more than Copper and Gold. A surge in demand can increase prices, while a decline tends to lower them. Dynamics in the US, Chinese and Indian economies can also contribute to price swings: for the US and particularly China, their big industrial sectors use Silver in various processes; in India, consumers’ demand for the precious metal for jewellery also plays a key role in setting prices.
Silver prices tend to follow Gold's moves. When Gold prices rise, Silver typically follows suit, as their status as safe-haven assets is similar. The Gold/Silver ratio, which shows the number of ounces of Silver needed to equal the value of one ounce of Gold, may help to determine the relative valuation between both metals. Some investors may consider a high ratio as an indicator that Silver is undervalued, or Gold is overvalued. On the contrary, a low ratio might suggest that Gold is undervalued relative to Silver.
(An automation tool was used in creating this post.)
The EUR/USD drop this morning appears largely USD-driven, although admittedly the euro does look on less stable ground when considering the room for European Central Bank dovish repricing compared to the Fed’s, ING’s FX strategist Francesco Pesole notes.
A retest of the 1.110 support is possible
“The two-year OIS USD:EUR spread tightened again below 100bp after Powell’s speech (now at 96bp). That could argue for EUR/USD above 1.12 but the softer risk environment is favouring some profit-taking, and there may be some speculation that some rewidening in that rate differential is due.”
“Indeed, markets are pricing in one 50bp move by the Fed by year-end (100bp in total), but only 64bp by the ECB over the last three meetings of 2024. The investor community may not be consistently at ease with this decoupling of Fed-ECB rate expectations, and the risks are probably that some easing is priced back into the ECB curve to realign it with the Fed. Germany’s return to recession in the second quarter is a narrative that can contribute to that realignment.”
“EUR/USD may struggle to trade back closer to 1.120 in the next few days as the lack of key US data probably favours the dollar on the margin, and a retest of the 1.110 support is possible. But we don’t see the conditions for the recent EUR/USD rally to be substantially unwound. From tomorrow, eurozone CPI figures will start pouring in, which will be a key test for that ECB-Fed decoupling story.”
The Pound Sterling (GBP) could strengthen further, but it does not appear to possess enough momentum to reach the major resistance at 1.3320, UOB Group FX strategists Quek Ser Leang and note.
Bulls are set to breach 1.3320
24-HOUR VIEW: “We did not anticipate GBP to soar to a fresh 2-1/2 year high of 1.3269 yesterday (we were expecting range trading). The rapid buildup momentum suggests further GBP strength today. However, GBP does not appear to possess enough momentum to reach the major resistance at 1.3320 (there is another resistance at 1.3295). To keep the momentum going, GBP must not break below 1.3215 with minor support at 1.3235.”
1-3 WEEKS VIEW: “The level to monitor is 1.3320. After GBP soared last Friday, we indicated on Monday (26 Aug, spot at 1.3215) that ‘the sharp and rapid rise is coupled with strong momentum.’ We expected GBP to continue to rise and indicated that ‘the next level to monitor is 1.3320.’ There is no change in our view. Overall, only a breach of 1.3145 (‘strong support’ level previously at 1.3105) would mean that the GBP strength has run its course.”
- EUR/USD comes under pressure as the Euro weakens on firm ECB rate cuts prospects.
- The Eurozone’s weak economic outlook supports ECB rate cut bets for September.
- The US Dollar regains ground with US core PCE inflation data under the spotlight.
EUR/USD corrects to near 1.1150 in Wednesday’s European session. The major currency pair drops as the US Dollar (USD) regains ground after posting a fresh year-to-date (YTD) low this week. The US Dollar Index (DXY), which tracks the Greenback’s value against six major currencies, edges higher to near 100.80 from fresh lows of 100.50.
A mild recovery in the US Dollar appears to be a short-lived pullback move for now, which could be capitalized as a selling opportunity by market participants. The near-term outlook for the Greenback is vulnerable on sheer optimism that the Federal Reserve (Fed) will start reducing interest rates in September.
While Fed rate cuts in September have been fully priced in by traders, bets remain split over whether the central bank will cut interest rates gradually by 25 basis points (bps) or deliver a larger one of 50 bps. According to the CME FedWatch tool, 30-day Federal Funds Futures pricing data shows that the likelihood of a 50-bps interest rate reduction in September is 34.5%, while the rest favors a cut by 25 bps.
For fresh cues about the potential rate-cut size, investors await the United States (US) core Personal Consumption Expenditure Inflation (PCE) data for July, which will be published on Friday. The PCE Price Index report is expected to show that the annual core inflation rose by 2.7%, up from June’s reading of 2.6%, with monthly figures growing steadily by 0.2%. Signs of a further decline in the underlying inflation would prompt expectations for the Fed to adopt an aggressive policy-easing approach. On the contrary, sticky figures would dampen this jumbo rate-cut scenario.
Daily digest market movers: EUR/USD drops to near 1.1150 as Euro weakens
- EUR/USD slumps from fresh highs of 1.1200 as the Euro (EUR) weakens. The Euro underperforms its major peers as investors seem confident that the European Central Bank (ECB) will cut interest rates again in September.
- The ECB started reducing interest rates in June as policymakers appear confident that price pressures in the Eurozone will return to the bank’s target of 2% in 2025. However, it decided to leave its key borrowing rates unchanged in July as officials were worried that an aggressive policy easing process could revamp inflationary pressures again.
- With evidence from Eurozone flash HCOB PMI for August and Q2 Negotiated Wage Rates that the overall economic outlook is uncertain and wage pressures are easing, the ECB is widely anticipated to reduce interest rates by 25 bps in September. Traders also see the ECB cutting borrowing rates again somewhere in the last quarter of this year.
- For fresh cues on the interest rate cut path, investors await the flash Harmonized Index of Consumer Prices (HICP) data for August for Germany and the overall Eurozone, which will be published on Thursday and Friday, respectively. Economists expect that price pressures to have decelerated.
Technical Analysis: EUR/USD falls to near 1.1150
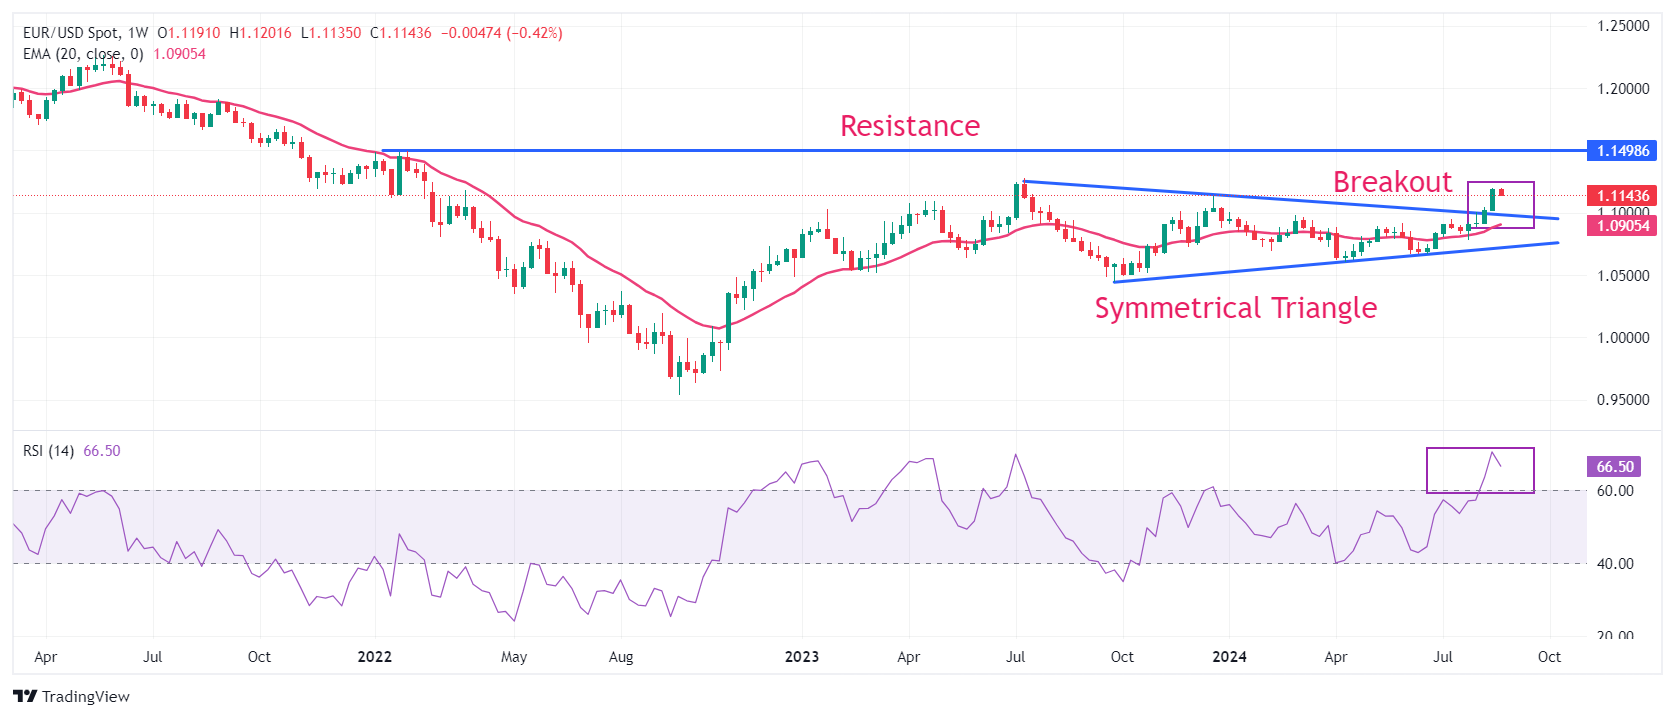
EUR/USD declines to near 1.1150 after posting a fresh swing high at 1.1200. The broader outlook of the major currency pair remains firm as it holds the breakout of the Symmetrical Triangle chart pattern formed on the weekly time frame. The upward-sloping 20-week Exponential Moving Average (EMA) near 1.0900 supports more upside ahead.
The 14-period Relative Strength Index (RSI) oscillates in the bullish range of 60.00-80.00, suggesting a strong upside momentum. On the upside, the July 2023 high at 1.1275 and the January 2022 high of 1.1500 will be the next stops for the Euro bulls. The downside is expected to remain cushioned near the psychological support of 1.1000.
Euro FAQs
The Euro is the currency for the 20 European Union countries that belong to the Eurozone. It is the second most heavily traded currency in the world behind the US Dollar. In 2022, it accounted for 31% of all foreign exchange transactions, with an average daily turnover of over $2.2 trillion a day. EUR/USD is the most heavily traded currency pair in the world, accounting for an estimated 30% off all transactions, followed by EUR/JPY (4%), EUR/GBP (3%) and EUR/AUD (2%).
The European Central Bank (ECB) in Frankfurt, Germany, is the reserve bank for the Eurozone. The ECB sets interest rates and manages monetary policy. The ECB’s primary mandate is to maintain price stability, which means either controlling inflation or stimulating growth. Its primary tool is the raising or lowering of interest rates. Relatively high interest rates – or the expectation of higher rates – will usually benefit the Euro and vice versa. The ECB Governing Council makes monetary policy decisions at meetings held eight times a year. Decisions are made by heads of the Eurozone national banks and six permanent members, including the President of the ECB, Christine Lagarde.
Eurozone inflation data, measured by the Harmonized Index of Consumer Prices (HICP), is an important econometric for the Euro. If inflation rises more than expected, especially if above the ECB’s 2% target, it obliges the ECB to raise interest rates to bring it back under control. Relatively high interest rates compared to its counterparts will usually benefit the Euro, as it makes the region more attractive as a place for global investors to park their money.
Data releases gauge the health of the economy and can impact on the Euro. Indicators such as GDP, Manufacturing and Services PMIs, employment, and consumer sentiment surveys can all influence the direction of the single currency. A strong economy is good for the Euro. Not only does it attract more foreign investment but it may encourage the ECB to put up interest rates, which will directly strengthen the Euro. Otherwise, if economic data is weak, the Euro is likely to fall. Economic data for the four largest economies in the euro area (Germany, France, Italy and Spain) are especially significant, as they account for 75% of the Eurozone’s economy.
Another significant data release for the Euro is the Trade Balance. This indicator measures the difference between what a country earns from its exports and what it spends on imports over a given period. If a country produces highly sought after exports then its currency will gain in value purely from the extra demand created from foreign buyers seeking to purchase these goods. Therefore, a positive net Trade Balance strengthens a currency and vice versa for a negative balance.
A round of risk aversion is hitting the FX market this morning as the Chinese earnings season has failed to offer any real support to Asian equities and the impact of Federal Reserve Chair Jay Powell’s speech on Friday wears off. The DXY dollar index has modestly rebounded since the start of the week, largely driven by the weaker EUR/USD, and one can probably argue another small leg higher in the greenback against pro-cyclical peers is warranted now, ING’s FX strategist Francesco Pesole notes.
DXY can break and find some support above 101.0
“After all, the OIS pricing for 100bp of easing by year-end means markets are positioned for a soft landing paired with no more inflation bumps. And while Powell’s explicit rate cut guidance has some significance, investors had fully priced in easing well before Jackson Hole and the negative USD reaction to the speech looked a bit overdone from the onset.”
“To be clear, we are not calling for a big dollar rally at this stage. Falling USD rates have made the greenback significantly cheaper to short and generalised dollar weakness is entirely consistent with Fed easing prospects being passed through to asset markets. However, the risks from a technical perspective and rate differentials are undoubtedly more balanced, and in the very near term slightly upside-tilted for the USD.”
“We discussed yesterday how another major USD leg lower may require markets to fully embrace the possibility of a US recession, so perhaps the lack of tier-one US data this week is good news for the dollar. The only event of the day is a speech by the Fed’s Raphael Bostic, who is generally considered hawkish-leaning and may not push the easing narrative much further. DXY can break and find some support above 101.0 in the next couple of days.”
Euro (EUR) could edge above 1.1200 but is unlikely to reach 1.1225. For the longer term, boost in momentum has increased the likelihood of EUR reaching 1.1275, UOB Group FX strategists Quek Ser Leang and note.
Bulls may test 1.1200 short term
24-HOUR VIEW: “Yesterday, we indicated that EUR ‘seems to have entered a consolidation phase and is likely to trade in a range of 1.1140/1.1190.’ Our view was not wrong, even though EUR traded in a narrower range of 1.1150/1.1190, closing on a firm note at 1.1184 (+0.21%). Upward momentum has increased, albeit not much. EUR could edge above 1.1200 today but the next resistance at 1.1225 is likely out of reach. On the downside, support levels are at 1.1165 and 1.1145.”
1-3 WEEKS VIEW: “After EUR soared last Friday, we indicated on Monday (26 Aug, spot at 1.1185) that ‘the boost in momentum has increased the likelihood of EUR reaching 1.1275.’ We will hold the same view provided that the ‘strong support’ at 1.1105 (no change in level) is not breached.”
- Gold is correcting back as the US Dollar recovers from year-to-date lows.
- Mixed US economic data is making the market cautious about whether the Fed will cut by 0.50% in September.
- The heavy long positioning in Gold is a further headwind for bulls trying to push the price higher.
Gold (XAU/USD) exchanges hands just above $2,500 on Wednesday after sliding lower due to a rebound in the US Dollar (USD). Given Gold is mainly priced in USD, any strength in the Greenback tends to weigh on its price. The US Dollar Index (DXY) is up over a third of a percent in the 100.90s on Wednesday, rebounding from the 100.51 year-to-date lows touched on the previous day.
US data was mixed on Tuesday, with the Conference Board’s gauge of Consumer Confidence in August rising to 103.3 and beating expectations of 100.7. The optimism coming from the US consumer provided further evidence against a hard-landing scenario for the US economy. Labor market indicators, however, “fell to their weakest levels so far in this cycle, which supported concerns about the recent slowdown in the labor market,” according to Jim Reid, a strategist at Deutsche Bank.
Gold pulls back as concerns over the US economy moderate
Gold is moving lower on Wednesday as data out over the last few days paints a mixed picture of the state of the US economy. The Richmond Fed Manufacturing Index came in at -19 in August from -17 previously, when an improvement to -14 had been forecast. US housing data was mixed, meanwhile, with house prices falling 0.1% MoM in June against expectations of a 0.2% rise, but the S&P/Case-Schiller House Price Index revealing a 6.5% rise year-over-year against the 6.0% estimated.
The data follows better-than-expected US Durable Goods Orders numbers on Monday, which showed a sharp 9.9% rise in July – the highest reading since May 2020, and helped reassure investors about the US economy.
Despite these releases, the market’s expectations for the trajectory of US interest rates appears little changed. The probability of the Fed making a mega 0.50% interest rate cut in September remains at mid-30%, according to the CME FedWatch Tool. This is around where it was after Federal Reserve (Fed) Chairman Jerome Powell made the clearest signal yet that cuts were in the pipeline at his speech in Jackson Hole. That said, 3-month US Treasury yields are rising on Wednesday whilst longer maturity bond yields are edging lower, which could suggest bond traders are not confident the Fed will go for a mega 0.50% cut. Such a move, if it were to transpire, would benefit Gold, which as a non-interest paying asset tends to see gains the more interest rates fall.
Traders now look to the Fed’s favored gauge of inflation, the Personal Consumption Expenditures (PCE) Price Index, out on Friday, for a clearer steer of where the Fed could be going on interest rates. Thursday’s second estimate of the US Gross Domestic Product (GDP) data for Q2 could impact expectations, whilst on Wednesday the slim docket provides only commentary from Atlanta Fed President Raphael Bostic. Nvidia (NVDA) earnings will be released after hours.
Extreme long positioning continues to be a problem for Gold bulls trying to hike up the price, according to Daniel Ghali, Senior Commodity Strategist at TD Securities.
“Our gauge of macro fund positioning in Gold is now at the highest levels recorded in the depths of the pandemic. This red flag marked the local highs set in Sep 2019, and previously in July 2016,” says Ghali.
“Downside risks are now more potent. The ship is crowded. In fact, it has scarcely been as crowded as it is today. Do you have a slot secured on the lifeboat?” adds the strategist.
Technical Analysis: Gold falls back after retesting the $2,530 highs
Gold (XAU/USD) is falling back down after retesting the $2,530 level. Overall, it remains inside a consolidation above its old range. Despite the recent pause, Gold remains in a short-term uptrend, which given “the trend is your friend” favors longs over shorts.
XAU/USD 4-hour Chart
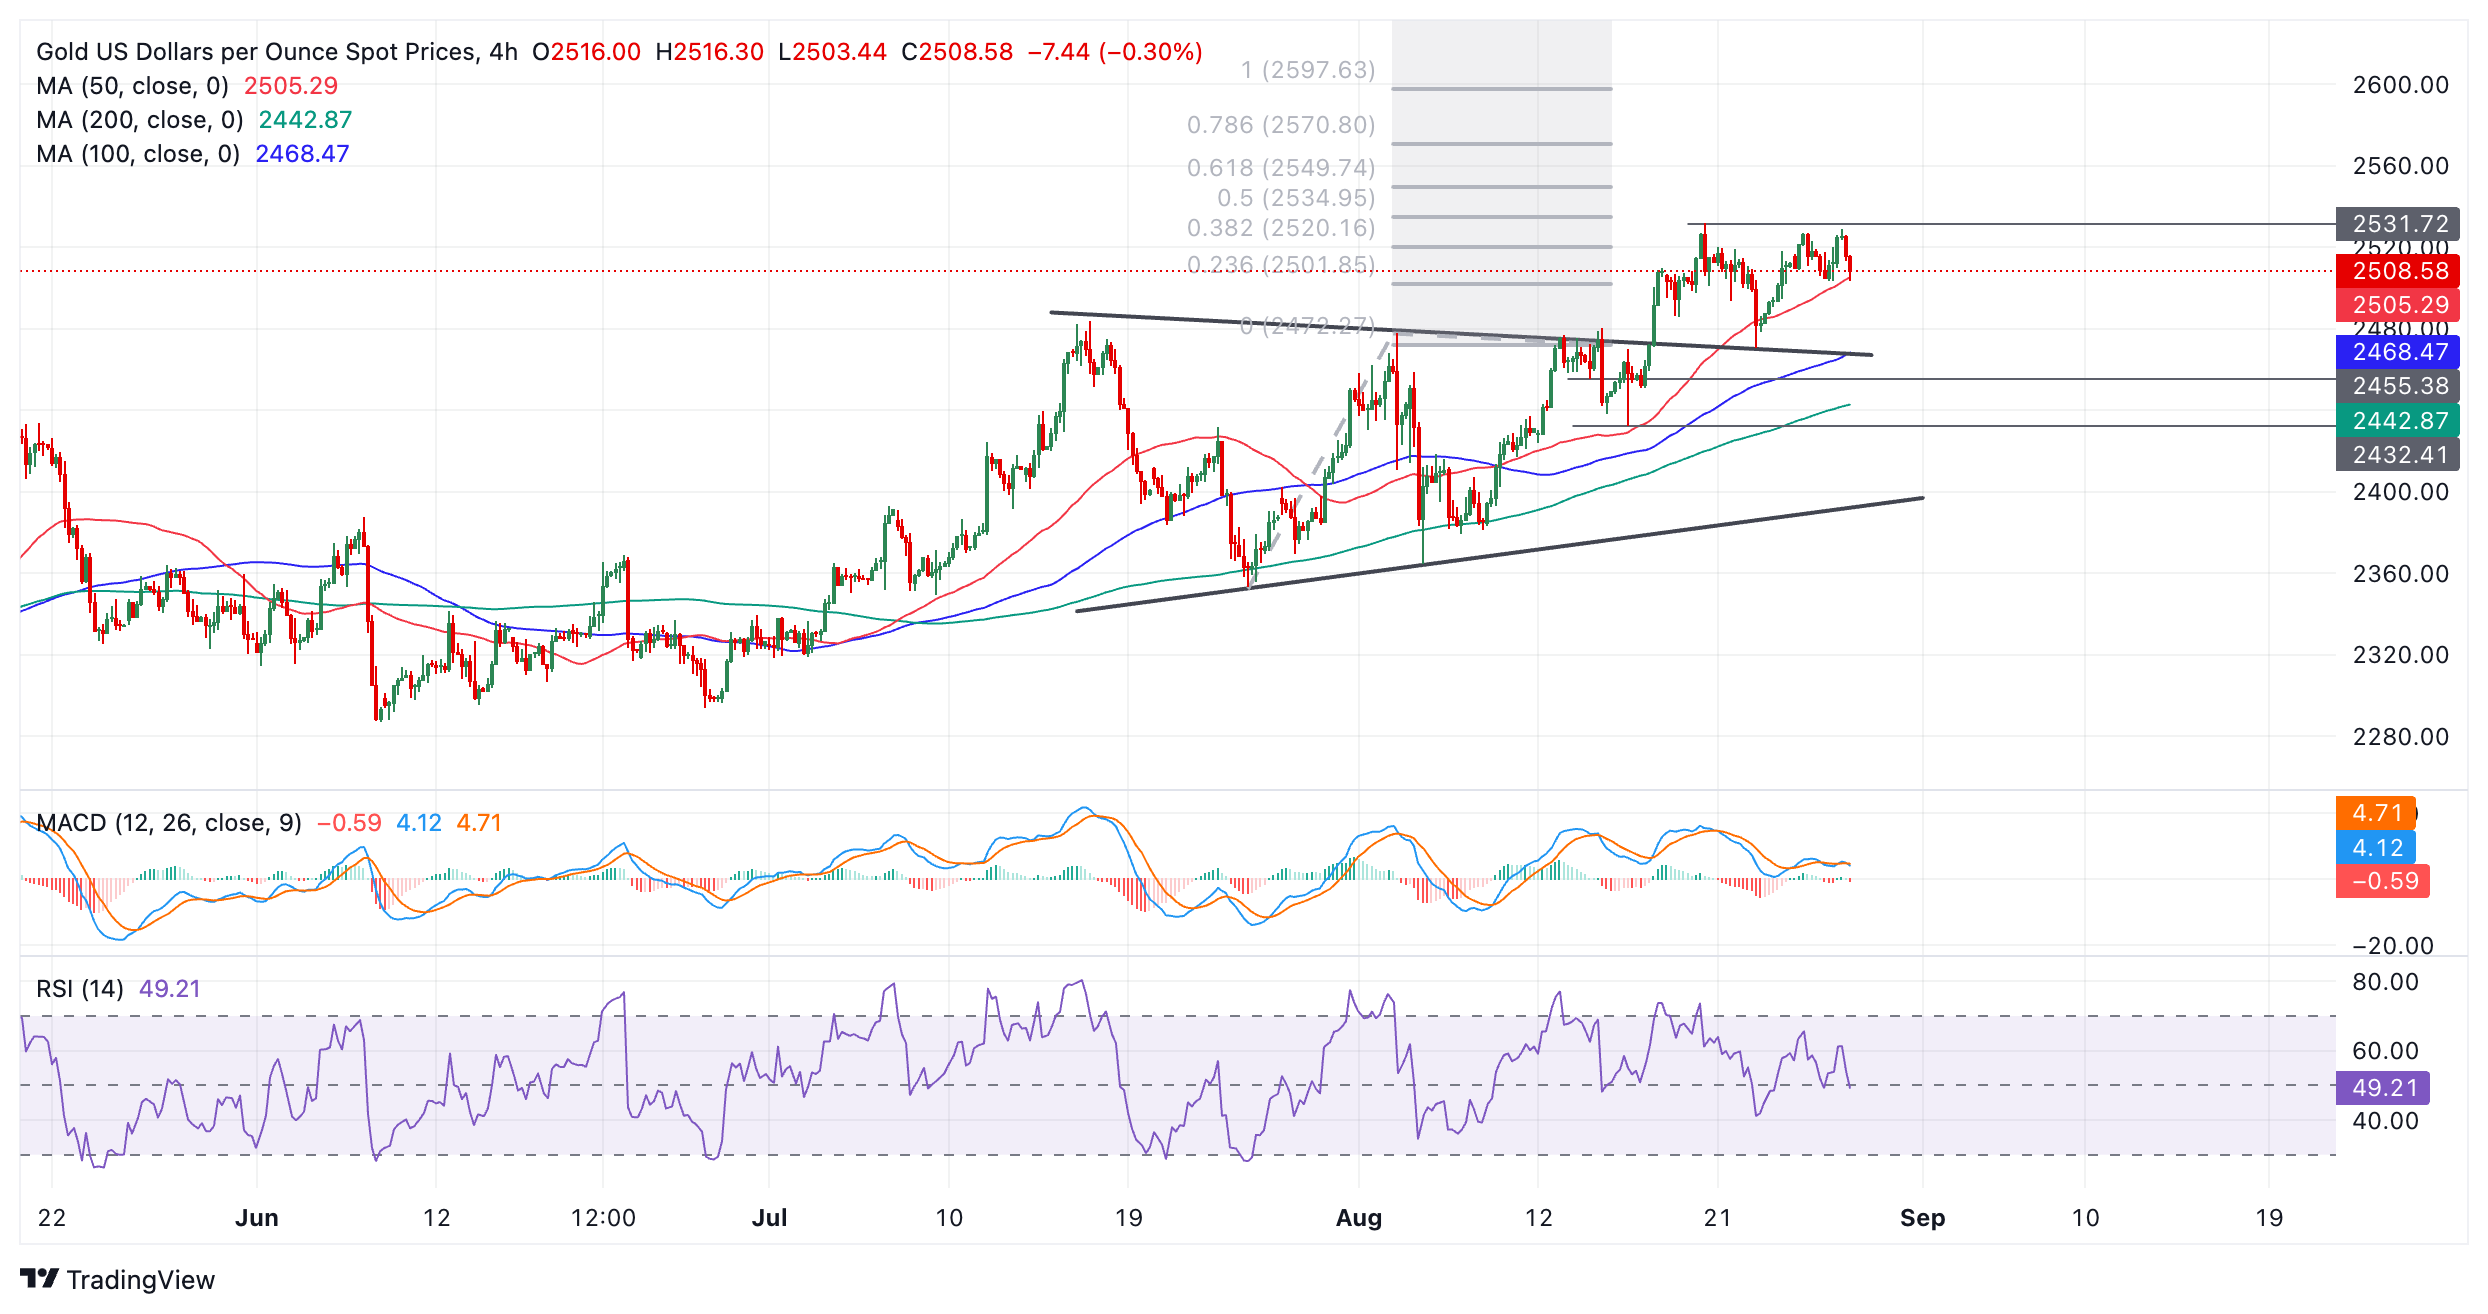
The breakout of the range (which resembles an incomplete triangle pattern), took place on August 14 and generated an upside target at roughly $2,550. This was calculated by taking the 0.618 Fibonacci ratio of the range’s height and extrapolating it higher. This target is the minimum expectation for a follow-through after a breakout based on principles of technical analysis.
A break above the $2,531 August 20 all-time high would provide confirmation of a continuation higher towards the $2,550 target.
Alternatively, a break back inside the range would negate the upside projected target. Such a move would be confirmed on a daily close below $2,470 (August 22 low). It would change the picture for Gold and bring the short-term uptrend into doubt.
Gold is in a broad uptrend on medium and long-term time frames, however, which further supports an overall bullish outlook for the precious metal.
Economic Indicator
Consumer Confidence
The Consumer Confidence index, released on a monthly basis by the Conference Board, is a survey gauging sentiment among consumers in the United States, reflecting prevailing business conditions and likely developments for the months ahead. The report details consumer attitudes, buying intentions, vacation plans and consumer expectations for inflation, labor market, stock prices and interest rates. The data shows a picture of whether or not consumers are willing to spend money, a key factor as consumer spending is a major driver of the US economy. Generally, a high reading is bullish for the US Dollar (USD), while a low reading is bearish. Note: Because of restrictions from the Conference Board, FXStreet Economic Calendar does not provide this indicator's figures.
Read more.Last release: Tue Aug 27, 2024 14:00
Frequency: Monthly
Actual: -
Consensus: -
Previous: -
Source: Conference Board
Here is what you need to know on Wednesday, August 28:
After edging lower and touching its weakest level in over a year near 100.50, the US Dollar (USD) Index stages a rebound toward 101.00 in the European session on Wednesday. The economic calendar will not feature any high-tier data releases midweek and investors will continue to pay close attention to comments from central bank officials and geopolitical headlines.
US Dollar PRICE This week
The table below shows the percentage change of US Dollar (USD) against listed major currencies this week. US Dollar was the strongest against the Euro.
| USD | EUR | GBP | JPY | CAD | AUD | NZD | CHF | |
|---|---|---|---|---|---|---|---|---|
| USD | 0.36% | -0.11% | 0.16% | -0.42% | 0.04% | -0.20% | -0.53% | |
| EUR | -0.36% | -0.53% | -0.19% | -0.77% | -0.41% | -0.55% | -0.87% | |
| GBP | 0.11% | 0.53% | 0.23% | -0.31% | 0.11% | -0.09% | -0.42% | |
| JPY | -0.16% | 0.19% | -0.23% | -0.57% | -0.04% | -0.14% | -0.61% | |
| CAD | 0.42% | 0.77% | 0.31% | 0.57% | 0.45% | 0.26% | -0.13% | |
| AUD | -0.04% | 0.41% | -0.11% | 0.04% | -0.45% | -0.14% | -0.50% | |
| NZD | 0.20% | 0.55% | 0.09% | 0.14% | -0.26% | 0.14% | -0.34% | |
| CHF | 0.53% | 0.87% | 0.42% | 0.61% | 0.13% | 0.50% | 0.34% |
The heat map shows percentage changes of major currencies against each other. The base currency is picked from the left column, while the quote currency is picked from the top row. For example, if you pick the US Dollar from the left column and move along the horizontal line to the Japanese Yen, the percentage change displayed in the box will represent USD (base)/JPY (quote).
The modest improvement seen in risk mood made it difficult for the USD to stay resilient against its major rivals on Tuesday. Early Wednesday, US stock index futures trade virtually unchanged on the day. Meanwhile, the 10-year US Treasury bond yield fluctuates in a narrow range slightly above 3.8%.
The data from Australia showed early Wednesday that the Consumer Price Index rose 3.5% on a yearly basis in July. This reading followed the 3.8% increase recorded in June and came in above the market expectation of 3.4%. After touching a fresh 2024-high above 0.6810 with the immediate reaction to inflation data, AUD/USD lost its traction and retreated below 0.6800.
Bank of Japan (BoJ) Deputy Governor Ryozo Himino said on Wednesday that the financial and capital markets remain unstable and the Japanese central bank needs to monitor these developments with utmost vigilance. These comments don't seem to be having a noticeable impact on USD/JPY's action. At the time of press, the pair was trading in positive territory near 144.50.
EUR/USD edged higher on Tuesday but lost its bullish momentum after coming in within a touching distance of 1.1200. Early Wednesday, the pair stays on the back foot and trades near 1.1150.
GBP/USD extended its rally and reached its highest level since March 2022 above 1.3260 on Tuesday. The pair seems to have gone into a consolidation phase on Wednesday and was last seen trading below 1.3240.
Gold registered modest gains for the second consecutive day on Tuesday. XAU/USD, however, lost its traction early Wednesday and retreated below $2,510.
Risk sentiment FAQs
In the world of financial jargon the two widely used terms “risk-on” and “risk off'' refer to the level of risk that investors are willing to stomach during the period referenced. In a “risk-on” market, investors are optimistic about the future and more willing to buy risky assets. In a “risk-off” market investors start to ‘play it safe’ because they are worried about the future, and therefore buy less risky assets that are more certain of bringing a return, even if it is relatively modest.
Typically, during periods of “risk-on”, stock markets will rise, most commodities – except Gold – will also gain in value, since they benefit from a positive growth outlook. The currencies of nations that are heavy commodity exporters strengthen because of increased demand, and Cryptocurrencies rise. In a “risk-off” market, Bonds go up – especially major government Bonds – Gold shines, and safe-haven currencies such as the Japanese Yen, Swiss Franc and US Dollar all benefit.
The Australian Dollar (AUD), the Canadian Dollar (CAD), the New Zealand Dollar (NZD) and minor FX like the Ruble (RUB) and the South African Rand (ZAR), all tend to rise in markets that are “risk-on”. This is because the economies of these currencies are heavily reliant on commodity exports for growth, and commodities tend to rise in price during risk-on periods. This is because investors foresee greater demand for raw materials in the future due to heightened economic activity.
The major currencies that tend to rise during periods of “risk-off” are the US Dollar (USD), the Japanese Yen (JPY) and the Swiss Franc (CHF). The US Dollar, because it is the world’s reserve currency, and because in times of crisis investors buy US government debt, which is seen as safe because the largest economy in the world is unlikely to default. The Yen, from increased demand for Japanese government bonds, because a high proportion are held by domestic investors who are unlikely to dump them – even in a crisis. The Swiss Franc, because strict Swiss banking laws offer investors enhanced capital protection.
- The Pound Sterling drops to near 1.3230 against the US Dollar as the latter gains temporary ground.
- Economists expect annual core PCE inflation to accelerate to 2.7%.
- For fresh cues on the BoE interest rate path, investors await Catherine Mann’s speech at 12:15 GMT.
The Pound Sterling (GBP) declines from a more-than-two-year high of 1.3266 against the US Dollar (USD) in Wednesday’s London session. The GBP/USD pair drops as the US Dollar recovers some ground, with investors focusing on the United States (US) core Personal Consumption Expenditure Price Index (PCE) data for July, to be published on Friday, as it could be the next big trigger for the pair.
The US Dollar Index (DXY), which tracks the Greenback’s value against six major currencies, discovers some buying interest as value-buying kicked in after posting a fresh year-to-date (YTD) low at 100.50.
Despite the recent recovery, the near-term outlook of the US Dollar is still downbeat as investors are certain about the Federal Reserve (Fed) reducing interest rates at its September meeting. Traders debate now over whether the Fed will deliver a sizeable interest rate cut or will stick to a small reduction in borrowing costs.
According to the CME FedWatch tool, 30-day Federal Funds Futures pricing data shows that the probability of a 50-basis points (bps) interest rate reduction in September is 34.5%, while the rest are favoring a cut by 25 bps.
As for core PCE inflation, economists expect that year-on-year the Fed’s preferred inflation gauge rose at a faster pace of 2.7% from 2.6% in June, with monthly figures growing steadily by 0.2%. Signs of inflation remaining persistent would dampen market speculation for a large rate cut by the Fed, while a further decline in price pressures will boost them.
Daily digest market movers: Pound Sterling to be guided by BoE Mann’s speech
- The Pound Sterling exhibits a mixed performance against its major peers in Wednesday’s European trading hours. The British currency is expected to trade broadly sideways as investors look for fresh cues about the Bank of England’s (BoE) interest rate path.
- The BoE cut interest rates by 25 basis points (bps) to 5% in August, ending its two-and-a-half year-long restrictive monetary policy stance, as officials gained confidence that price pressures will return to the bank’s target of 2% sustainably.
- Market participants expect that the BoE’s interest rate reduction path for the rest of this year will be slower than that of other central banks because the United Kingdom (UK) economy seems to be holding up well, according to the flash S&P Global/CIPS PMI for August and robust Q2 Gross Domestic Product (GDP) growth.
- For fresh guidance on interest rates, investors await BoE policymaker Catherine Mann’s speech, which is scheduled at 12:15 GMT. Mann was among those policymakers who voted for leaving interest rates steady at 5.25% in the monetary policy meeting on August 1. Investors would look for cues about how much the BoE will cut interest rates this year along with an outlook on service inflation and wage pressures.
- On the political front, United Kingdom (UK) Prime Minister Keir Starmer's commentary on the financial budget's outlook, which will be announced in October, has also improved the Pound Sterling’s appeal. Starmer said that the fiscal budget is expected to be tight, specifically that "the budget will be short-term pain for long-term gain," with the intention of increasing the tax burden on households, especially on individuals with higher incomes.
Technical Analysis: Pound Sterling holds key support of 1.3200
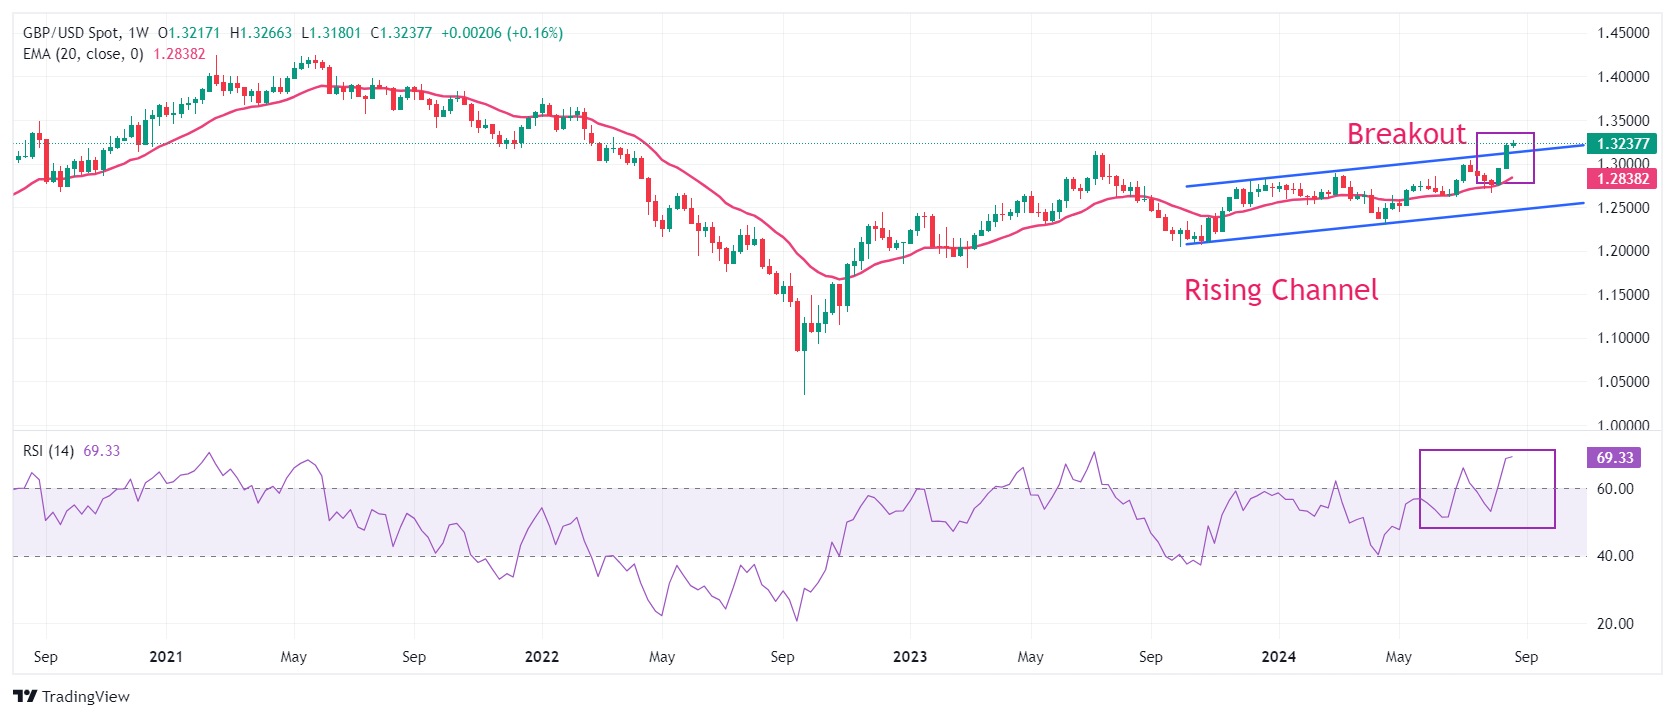
The Pound Sterling corrects mildly after posting a fresh two-and-a-half-year high of 1.3266 against the US Dollar. The near-term appeal of the GBP/USD pair remains firm as it holds the breakout of the Rising Channel chart formation on the weekly time frame. If bullish momentum resumes, the Cable is expected to extend its upside towards the February 4, 2022, high of 1.3640.
The upward-sloping 20-week Exponential Moving Average (EMA) near 1.3000 suggests a strong upside trend.
The 14-period Relative Strength Index (RSI) oscillates in the bullish range of 60.00-80.00, suggesting a strong upside momentum. Still, it has reached overbought levels at around 70.00, increasing the chances of a corrective pullback. On the downside, the psychological level of 1.3000 will be the crucial support for the Pound Sterling bulls.
Pound Sterling FAQs
The Pound Sterling (GBP) is the oldest currency in the world (886 AD) and the official currency of the United Kingdom. It is the fourth most traded unit for foreign exchange (FX) in the world, accounting for 12% of all transactions, averaging $630 billion a day, according to 2022 data. Its key trading pairs are GBP/USD, aka ‘Cable’, which accounts for 11% of FX, GBP/JPY, or the ‘Dragon’ as it is known by traders (3%), and EUR/GBP (2%). The Pound Sterling is issued by the Bank of England (BoE).
The single most important factor influencing the value of the Pound Sterling is monetary policy decided by the Bank of England. The BoE bases its decisions on whether it has achieved its primary goal of “price stability” – a steady inflation rate of around 2%. Its primary tool for achieving this is the adjustment of interest rates. When inflation is too high, the BoE will try to rein it in by raising interest rates, making it more expensive for people and businesses to access credit. This is generally positive for GBP, as higher interest rates make the UK a more attractive place for global investors to park their money. When inflation falls too low it is a sign economic growth is slowing. In this scenario, the BoE will consider lowering interest rates to cheapen credit so businesses will borrow more to invest in growth-generating projects.
Data releases gauge the health of the economy and can impact the value of the Pound Sterling. Indicators such as GDP, Manufacturing and Services PMIs, and employment can all influence the direction of the GBP. A strong economy is good for Sterling. Not only does it attract more foreign investment but it may encourage the BoE to put up interest rates, which will directly strengthen GBP. Otherwise, if economic data is weak, the Pound Sterling is likely to fall.
Another significant data release for the Pound Sterling is the Trade Balance. This indicator measures the difference between what a country earns from its exports and what it spends on imports over a given period. If a country produces highly sought-after exports, its currency will benefit purely from the extra demand created from foreign buyers seeking to purchase these goods. Therefore, a positive net Trade Balance strengthens a currency and vice versa for a negative balance.
FX option expiries for Aug 28 NY cut at 10:00 Eastern Time, via DTCC, can be found below.
EUR/USD: EUR amounts
- 1.1100 836m
- 1.1120 602m
- 1.1140 415m
- 1.1150 2.1b
- 1.1170 828m
- 1.1175 1b
- 1.1200 1.5b
GBP/USD: GBP amounts
- 1.3250 502m
USD/JPY: USD amounts
- 143.75 500m
- 145.25 1.6b
- 145.50 2.2b
USD/CHF: USD amounts
- 0.8555 500m
- 0.8600 1.1b
AUD/USD: AUD amounts
- 0.6775 609m
- 0.6800 1.2b
USD/CAD: USD amounts
- 1.3560 500m
EUR/GBP: EUR amounts
- 0.8530 915m
- USD/CAD holds positive ground around 1.3460 in Wednesday’s early European session.
- The risk aversion sentiment lifts the safe-haven currency like the US Dollar, but Fed rate cut bets might cap its upside.
- The BoC is anticipated to cut its interest rate next week as inflation eases.
The USD/CAD pair recovers some lost ground near 1.3460, snapping the three-day losing streak during the early European session on Wednesday. The uptick of the pair is bolstered by the modest recovery of the US Dollar (USD). Market players will take more cues from the Federal Reserve’s (Fed) Christopher Waller and Raphael Bostic speeches later on Wednesday.
The cautious mood ahead of the AI giant’s Nvidia earnings reports and Fedspeak might boost the safe-haven flows, benefiting the USD. However, the firmer expectation that the US Fed would lower its borrowing costs in September might cap the pair’s upside. The markets have fully priced in a 25 basis points (bps) rate cut in September, while the possibility of a deeper rate cut stands at 34.5%, according to the CME FedWatch Tool. Traders see 100 bps Fed easing this year.
San Francisco Fed President Mary Daly said on Monday that she believes it’s appropriate for the Fed to begin cutting interest rates. Her comments echoed remarks from Fed Chair Jerome Powell at the Jackson Hole symposium, who said that he has gained confidence that inflation is on course to the 2% target and “the time has come for policy to adjust.”
On the Loonie front, economists expect the Bank of Canada (BoC) to cut interest rates for a third consecutive meeting on the September 4 policy meeting, according to the median estimate in an August poll conducted by Bloomberg. This, in turn, might weigh on the Canadian Dollar (CAD) against the USD. Meanwhile, the lower crude oil prices contribute to the commodity-linked CAD’s downside, as Canada is the leading exporter of oil to the United States.
Canadian Dollar FAQs
The key factors driving the Canadian Dollar (CAD) are the level of interest rates set by the Bank of Canada (BoC), the price of Oil, Canada’s largest export, the health of its economy, inflation and the Trade Balance, which is the difference between the value of Canada’s exports versus its imports. Other factors include market sentiment – whether investors are taking on more risky assets (risk-on) or seeking safe-havens (risk-off) – with risk-on being CAD-positive. As its largest trading partner, the health of the US economy is also a key factor influencing the Canadian Dollar.
The Bank of Canada (BoC) has a significant influence on the Canadian Dollar by setting the level of interest rates that banks can lend to one another. This influences the level of interest rates for everyone. The main goal of the BoC is to maintain inflation at 1-3% by adjusting interest rates up or down. Relatively higher interest rates tend to be positive for the CAD. The Bank of Canada can also use quantitative easing and tightening to influence credit conditions, with the former CAD-negative and the latter CAD-positive.
The price of Oil is a key factor impacting the value of the Canadian Dollar. Petroleum is Canada’s biggest export, so Oil price tends to have an immediate impact on the CAD value. Generally, if Oil price rises CAD also goes up, as aggregate demand for the currency increases. The opposite is the case if the price of Oil falls. Higher Oil prices also tend to result in a greater likelihood of a positive Trade Balance, which is also supportive of the CAD.
While inflation had always traditionally been thought of as a negative factor for a currency since it lowers the value of money, the opposite has actually been the case in modern times with the relaxation of cross-border capital controls. Higher inflation tends to lead central banks to put up interest rates which attracts more capital inflows from global investors seeking a lucrative place to keep their money. This increases demand for the local currency, which in Canada’s case is the Canadian Dollar.
Macroeconomic data releases gauge the health of the economy and can have an impact on the Canadian Dollar. Indicators such as GDP, Manufacturing and Services PMIs, employment, and consumer sentiment surveys can all influence the direction of the CAD. A strong economy is good for the Canadian Dollar. Not only does it attract more foreign investment but it may encourage the Bank of Canada to put up interest rates, leading to a stronger currency. If economic data is weak, however, the CAD is likely to fall.
Bank of Japan (BoJ) Deputy Governor Ryozo Himno is back on the wires, via Reuters, noting that “our imminent task is to closely monitor financial market developments with high sense of urgency.”
Additional quotes
BoJ’s monetary policy has to take into account numerous factors.
Our task is to closely monitor market developments for the time being.
Not having in mind specific levels, range for neutral interest rates.
Financial conditions are accommodative right now.
Believe main scenario remains that the US economy will make soft landing.
Don’t have any specific timeframe in mind when asked how long BoJ would need to monitor market to judge it has stablised.
Will adjust degree of monetary easing if outlook of economy, prices is likely to be achieved.
Likelihood of economy, price outlook being achieved would be affected by various factors including market developments.
Market reaction
USD/JPY extends recovery gains, as Kimino’s comments hit the wires again, currently adding 0.35% on the day to trade near 144.50.
Bank of Japan FAQs
The Bank of Japan (BoJ) is the Japanese central bank, which sets monetary policy in the country. Its mandate is to issue banknotes and carry out currency and monetary control to ensure price stability, which means an inflation target of around 2%.
The Bank of Japan has embarked in an ultra-loose monetary policy since 2013 in order to stimulate the economy and fuel inflation amid a low-inflationary environment. The bank’s policy is based on Quantitative and Qualitative Easing (QQE), or printing notes to buy assets such as government or corporate bonds to provide liquidity. In 2016, the bank doubled down on its strategy and further loosened policy by first introducing negative interest rates and then directly controlling the yield of its 10-year government bonds.
The Bank’s massive stimulus has caused the Yen to depreciate against its main currency peers. This process has exacerbated more recently due to an increasing policy divergence between the Bank of Japan and other main central banks, which have opted to increase interest rates sharply to fight decades-high levels of inflation. The BoJ’s policy of holding down rates has led to a widening differential with other currencies, dragging down the value of the Yen.
A weaker Yen and the spike in global energy prices have led to an increase in Japanese inflation, which has exceeded the BoJ’s 2% target. With wage inflation becoming a cause of concern, the BoJ looks to move away from ultra loose policy, while trying to avoid slowing the activity too much.
- WTI price trades in negative territory in Wednesday’s early European session, down 0.35% on the day.
- Slower economic growth in the US and China could diminish demand for WTI.
- The potential shutdown of Libya's oil production and Middle East geopolitical tensions might cap the downside for crude oil prices.
West Texas Intermediate (WTI), the US crude oil benchmark, is trading around $75.10 on Wednesday. The WTI price edges lower as investors are concerned about slower economic growth in the United States and China.
Data released by the Conference Board on Wednesday revealed that the US Consumer Confidence Index improved to 103.3 in August from an upwardly revised 101.9 in July. Nonetheless, consumers are more worried about the labor market after the Unemployment Rate reached a nearly three-year high of 4.3% last month.
Furthermore, fears of the economic health and future oil demand in China weigh on the crude oil price, as China is the world’s largest importer of oil. Daan Struyven, head of oil research at Goldman, noted demand in China has softened as the country switches from gasoline-powered cars to electric vehicles.
The US crude inventories declined last week. According to the American Petroleum Institute (API), crude oil stockpiles in the United States for the week ending August 23 fell by 3.4 million barrels, compared to an increase of 0.347 million barrels in the previous week. The market consensus estimated that stocks would decline by 3.0 million barrels.
The downside for the WTI price might be limited amid the potential shutdown of Libya's oil production and geopolitical tensions in the Middle East. It's worth noting that Libya produces around 1.2 million barrels per day, with more than 1 million bpd exported to the global market. The developments surrounding Libya's output cuts have triggered further supply concerns and lifted the WTI price.
WTI Oil FAQs
WTI Oil is a type of Crude Oil sold on international markets. The WTI stands for West Texas Intermediate, one of three major types including Brent and Dubai Crude. WTI is also referred to as “light” and “sweet” because of its relatively low gravity and sulfur content respectively. It is considered a high quality Oil that is easily refined. It is sourced in the United States and distributed via the Cushing hub, which is considered “The Pipeline Crossroads of the World”. It is a benchmark for the Oil market and WTI price is frequently quoted in the media.
Like all assets, supply and demand are the key drivers of WTI Oil price. As such, global growth can be a driver of increased demand and vice versa for weak global growth. Political instability, wars, and sanctions can disrupt supply and impact prices. The decisions of OPEC, a group of major Oil-producing countries, is another key driver of price. The value of the US Dollar influences the price of WTI Crude Oil, since Oil is predominantly traded in US Dollars, thus a weaker US Dollar can make Oil more affordable and vice versa.
The weekly Oil inventory reports published by the American Petroleum Institute (API) and the Energy Information Agency (EIA) impact the price of WTI Oil. Changes in inventories reflect fluctuating supply and demand. If the data shows a drop in inventories it can indicate increased demand, pushing up Oil price. Higher inventories can reflect increased supply, pushing down prices. API’s report is published every Tuesday and EIA’s the day after. Their results are usually similar, falling within 1% of each other 75% of the time. The EIA data is considered more reliable, since it is a government agency.
OPEC (Organization of the Petroleum Exporting Countries) is a group of 13 Oil-producing nations who collectively decide production quotas for member countries at twice-yearly meetings. Their decisions often impact WTI Oil prices. When OPEC decides to lower quotas, it can tighten supply, pushing up Oil prices. When OPEC increases production, it has the opposite effect. OPEC+ refers to an expanded group that includes ten extra non-OPEC members, the most notable of which is Russia.
Gold prices fell in India on Wednesday, according to data compiled by FXStreet.
The price for Gold stood at 6,780.33 Indian Rupees (INR) per gram, down compared with the INR 6,813.77 it cost on Tuesday.
The price for Gold decreased to INR 79,084.80 per tola from INR 79,474.51 per tola a day earlier.
| Unit measure | Gold Price in INR |
|---|---|
| 1 Gram | 6,780.33 |
| 10 Grams | 67,803.61 |
| Tola | 79,084.80 |
| Troy Ounce | 210,886.20 |
FXStreet calculates Gold prices in India by adapting international prices (USD/INR) to the local currency and measurement units. Prices are updated daily based on the market rates taken at the time of publication. Prices are just for reference and local rates could diverge slightly.
Gold FAQs
Gold has played a key role in human’s history as it has been widely used as a store of value and medium of exchange. Currently, apart from its shine and usage for jewelry, the precious metal is widely seen as a safe-haven asset, meaning that it is considered a good investment during turbulent times. Gold is also widely seen as a hedge against inflation and against depreciating currencies as it doesn’t rely on any specific issuer or government.
Central banks are the biggest Gold holders. In their aim to support their currencies in turbulent times, central banks tend to diversify their reserves and buy Gold to improve the perceived strength of the economy and the currency. High Gold reserves can be a source of trust for a country’s solvency. Central banks added 1,136 tonnes of Gold worth around $70 billion to their reserves in 2022, according to data from the World Gold Council. This is the highest yearly purchase since records began. Central banks from emerging economies such as China, India and Turkey are quickly increasing their Gold reserves.
Gold has an inverse correlation with the US Dollar and US Treasuries, which are both major reserve and safe-haven assets. When the Dollar depreciates, Gold tends to rise, enabling investors and central banks to diversify their assets in turbulent times. Gold is also inversely correlated with risk assets. A rally in the stock market tends to weaken Gold price, while sell-offs in riskier markets tend to favor the precious metal.
The price can move due to a wide range of factors. Geopolitical instability or fears of a deep recession can quickly make Gold price escalate due to its safe-haven status. As a yield-less asset, Gold tends to rise with lower interest rates, while higher cost of money usually weighs down on the yellow metal. Still, most moves depend on how the US Dollar (USD) behaves as the asset is priced in dollars (XAU/USD). A strong Dollar tends to keep the price of Gold controlled, whereas a weaker Dollar is likely to push Gold prices up.
(An automation tool was used in creating this post.)
- AUD/USD renews seven-month highs above 0.6800 after Australian CPI cools less than expected.
- The US Dollar recovers as risk sentiment deteriorates ahead of Fedspeak and Nvidia earnings report.
- AUD/USD daily technical setup points to more gains in the offing in the near term.
AUD/USD is paring back gains to trade near 0.6800 in Asian trading on Wednesday, having reversed a spike to a new seven-month high of 0.6813.
AUD/USD cheers Australian CPI data
The Aussie pair caught a fresh bid wave and recaptured the 0.6800 barrier following the Australian monthly Consumer Price Index (CPI) data release.
The inflation data showed that consumer prices in Australia cooled at a slower pace than expected in July, reporting a 3.5% YoY growth when compared to a 3.4% increase estimated and June’s 3.8% acceleration.
Hot Australian inflation data re-kindled expectations of further interest-rate hikes from the Reserve Bank of Australia (RBA), fuelling a fresh leg up in the Aussie Dollar (AUD).
However, a risk-averse market environment limited the upside in the higher-yielding Aussie while lifting the haven demand for the US Dollar (USD).
Markets are anxious heading into the much-awaited US AI giant’s, Nvidia. Earning reports, leading to a decline in the global stocks. Traders also await a slew of speeches from the US Federal Reserve (Fed) official for fresh cues on the magnitude of the upcoming rate cut in September.
Looking ahead, the pair will remain at the mercy of the Fedspeak-driven USD price action and the broader market sentiment, gearing up for Thursday’s Australian Private Capex data for the second quarter.
Technically, AUD/USD remains poised for more upside, as the 14-day Relative Strength Index (RSI) points north above the 50 level while just beneath the overbought region, currently near 67. Further, a couple of bullish crossovers on the daily time frame also add credence to the constructive outlook for the Aussie.
AUD/USD: Daily chart
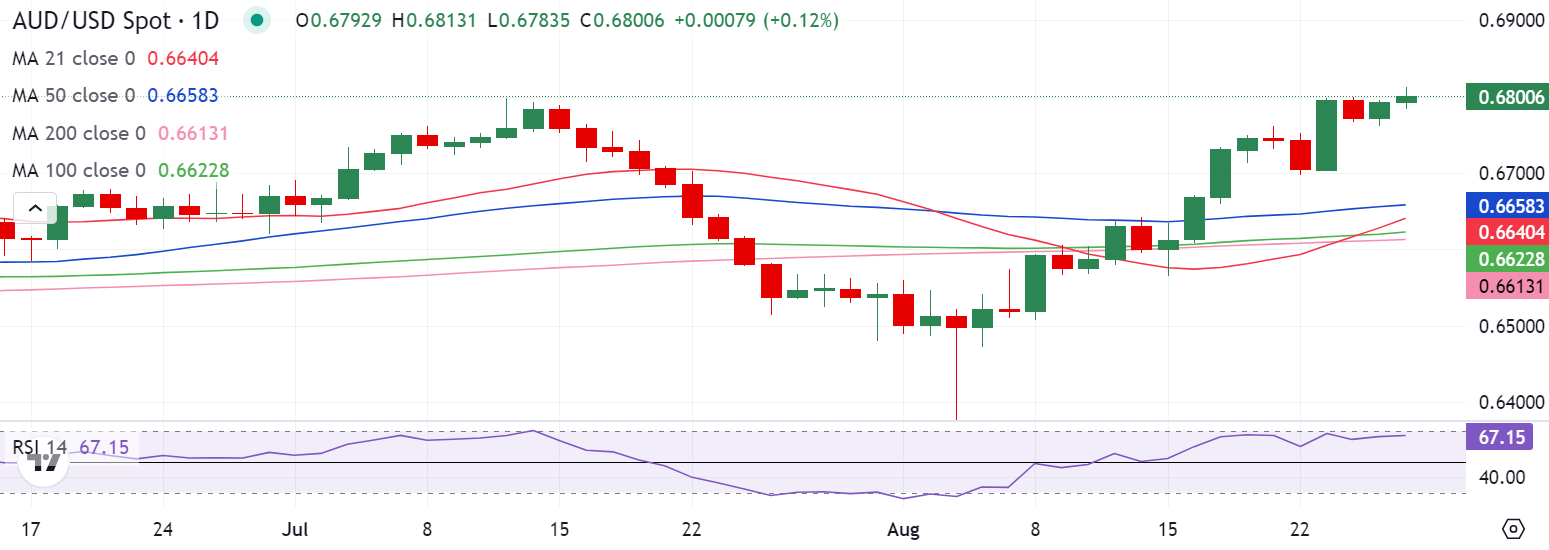
Australian Dollar FAQs
One of the most significant factors for the Australian Dollar (AUD) is the level of interest rates set by the Reserve Bank of Australia (RBA). Because Australia is a resource-rich country another key driver is the price of its biggest export, Iron Ore. The health of the Chinese economy, its largest trading partner, is a factor, as well as inflation in Australia, its growth rate and Trade Balance. Market sentiment – whether investors are taking on more risky assets (risk-on) or seeking safe-havens (risk-off) – is also a factor, with risk-on positive for AUD.
The Reserve Bank of Australia (RBA) influences the Australian Dollar (AUD) by setting the level of interest rates that Australian banks can lend to each other. This influences the level of interest rates in the economy as a whole. The main goal of the RBA is to maintain a stable inflation rate of 2-3% by adjusting interest rates up or down. Relatively high interest rates compared to other major central banks support the AUD, and the opposite for relatively low. The RBA can also use quantitative easing and tightening to influence credit conditions, with the former AUD-negative and the latter AUD-positive.
China is Australia’s largest trading partner so the health of the Chinese economy is a major influence on the value of the Australian Dollar (AUD). When the Chinese economy is doing well it purchases more raw materials, goods and services from Australia, lifting demand for the AUD, and pushing up its value. The opposite is the case when the Chinese economy is not growing as fast as expected. Positive or negative surprises in Chinese growth data, therefore, often have a direct impact on the Australian Dollar and its pairs.
Iron Ore is Australia’s largest export, accounting for $118 billion a year according to data from 2021, with China as its primary destination. The price of Iron Ore, therefore, can be a driver of the Australian Dollar. Generally, if the price of Iron Ore rises, AUD also goes up, as aggregate demand for the currency increases. The opposite is the case if the price of Iron Ore falls. Higher Iron Ore prices also tend to result in a greater likelihood of a positive Trade Balance for Australia, which is also positive of the AUD.
The Trade Balance, which is the difference between what a country earns from its exports versus what it pays for its imports, is another factor that can influence the value of the Australian Dollar. If Australia produces highly sought after exports, then its currency will gain in value purely from the surplus demand created from foreign buyers seeking to purchase its exports versus what it spends to purchase imports. Therefore, a positive net Trade Balance strengthens the AUD, with the opposite effect if the Trade Balance is negative.
- The Indian Rupee attracts some sellers in Wednesday’s early Asian session.
- The weakening in Asian peers and month-end USD demand weigh on the INR.
- Investors await the Fed's Waller and Bostic speeches on Wednesday for fresh impetus.
The Indian Rupee (INR) extends its losses on Wednesday, pressured by the weakness in Asian peers and US Dollar (USD) demand from importers. Nonetheless, positive domestic markets and Federal Reserve (Fed) Chair Jerome Powell's dovish comments at the Jackson Hole meeting last week might cushion the local currency’s downside.
Later on Wednesday, the Fed's Christopher Waller and Raphael Bostic are scheduled to speak. The advanced US Gross Domestic Product (GDP) Annualized for the second quarter (Q2) will be published on Thursday, which is projected to grow 2.8%. On Friday, the US Personal Consumption Expenditures (PCE) Price Index and Indian GDP Quarterly for the first quarter (Q1) of fiscal 2024-25 (FY25) will be in the spotlight.
Daily Digest Market Movers: Indian Rupee looks fragile despite dovish Fed
- The International Monetary Fund (IMF) projected that India’s real GDP growth will touch 7% in 2024 to remain the fastest-growing major economy in the world.
- According to a Reuters poll, India's economic growth in the April-June quarter was anticipated to expand at its slowest pace in a year owing to lower government spending.
- The Conference Board's US Consumer Confidence Index rose to 103.3 in August from an upwardly revised 101.9 in July, marking a six-month high.
- The US House Price Index dropped by 0.1% MoM in June, better than the estimation of a 0.2% increase, the Federal Housing Finance Agency showed onTuesday.
- Futures are currently pricing in a near 34.5% chance of a half-percentage point cut in interest rates, according to the CME FedWatch Tool.
Technical Analysis: USD/INR’s positive outlook remains in play
The Indian Rupee weakens on the day. Technically, the constructive picture of the pair remains intact as the price is above the key 100-day Exponential Moving Average (EMA) on the daily timeframe. The 14-day Relative Strength Index (RSI) remains above the midline near 58.00, suggesting that the support level is likely to hold rather than break.
The first upside barrier to watch for USD/INR is the support-turned-resistance level at the 84.00 psychological level. Any follow-through buying above this level could pave the way to the next hurdle near the record high of 84.24 en route to 84.50.
In the bearish event, the low of August 20 at 83.77 acts as an initial support level for the pair. Extended losses could expose the 100-day EMA at 83.60.
US Dollar price today
The table below shows the percentage change of US Dollar (USD) against listed major currencies today. US Dollar was the weakest against the Australian Dollar.
| USD | EUR | GBP | CAD | AUD | JPY | NZD | CHF | |
| USD | 0.08% | 0.07% | 0.01% | -0.15% | 0.32% | 0.03% | 0.18% | |
| EUR | -0.07% | -0.01% | -0.06% | -0.23% | 0.24% | -0.05% | 0.11% | |
| GBP | -0.08% | 0.00% | -0.07% | -0.23% | 0.25% | -0.04% | 0.11% | |
| CAD | -0.01% | 0.07% | 0.06% | -0.17% | 0.30% | 0.02% | 0.16% | |
| AUD | 0.15% | 0.23% | 0.23% | 0.16% | 0.45% | 0.20% | 0.32% | |
| JPY | -0.32% | -0.24% | -0.25% | -0.31% | -0.47% | -0.28% | -9915.37% | |
| NZD | -0.03% | 0.05% | 0.04% | -0.02% | -0.18% | 0.31% | 0.13% | |
| CHF | -0.19% | -0.11% | -0.10% | -0.16% | -0.33% | 0.10% | -0.15% |
The heat map shows percentage changes of major currencies against each other. The base currency is picked from the left column, while the quote currency is picked from the top row. For example, if you pick the Euro from the left column and move along the horizontal line to the Japanese Yen, the percentage change displayed in the box will represent EUR (base)/JPY (quote).
Indian Rupee FAQs
The Indian Rupee (INR) is one of the most sensitive currencies to external factors. The price of Crude Oil (the country is highly dependent on imported Oil), the value of the US Dollar – most trade is conducted in USD – and the level of foreign investment, are all influential. Direct intervention by the Reserve Bank of India (RBI) in FX markets to keep the exchange rate stable, as well as the level of interest rates set by the RBI, are further major influencing factors on the Rupee.
The Reserve Bank of India (RBI) actively intervenes in forex markets to maintain a stable exchange rate, to help facilitate trade. In addition, the RBI tries to maintain the inflation rate at its 4% target by adjusting interest rates. Higher interest rates usually strengthen the Rupee. This is due to the role of the ‘carry trade’ in which investors borrow in countries with lower interest rates so as to place their money in countries’ offering relatively higher interest rates and profit from the difference.
Macroeconomic factors that influence the value of the Rupee include inflation, interest rates, the economic growth rate (GDP), the balance of trade, and inflows from foreign investment. A higher growth rate can lead to more overseas investment, pushing up demand for the Rupee. A less negative balance of trade will eventually lead to a stronger Rupee. Higher interest rates, especially real rates (interest rates less inflation) are also positive for the Rupee. A risk-on environment can lead to greater inflows of Foreign Direct and Indirect Investment (FDI and FII), which also benefit the Rupee.
Higher inflation, particularly, if it is comparatively higher than India’s peers, is generally negative for the currency as it reflects devaluation through oversupply. Inflation also increases the cost of exports, leading to more Rupees being sold to purchase foreign imports, which is Rupee-negative. At the same time, higher inflation usually leads to the Reserve Bank of India (RBI) raising interest rates and this can be positive for the Rupee, due to increased demand from international investors. The opposite effect is true of lower inflation.
| Raw materials | Closed | Change, % |
|---|---|---|
| Silver | 29.966 | 0.22 |
| Gold | 252.417 | 0.26 |
| Palladium | 969.67 | 0.5 |
Commenting on the July inflation data, Australia Treasurer Jim Chalmers said on Wednesday that consumer prices rising at their slowest pace in four months was a promising result.
He, however, added that “we’re not complacent because we know that people are still under pressure.”
Market reaction
At the time of writing, AUD/USD is flirting with 0.6800, adding 0.13% on the day.
Australian Dollar FAQs
One of the most significant factors for the Australian Dollar (AUD) is the level of interest rates set by the Reserve Bank of Australia (RBA). Because Australia is a resource-rich country another key driver is the price of its biggest export, Iron Ore. The health of the Chinese economy, its largest trading partner, is a factor, as well as inflation in Australia, its growth rate and Trade Balance. Market sentiment – whether investors are taking on more risky assets (risk-on) or seeking safe-havens (risk-off) – is also a factor, with risk-on positive for AUD.
The Reserve Bank of Australia (RBA) influences the Australian Dollar (AUD) by setting the level of interest rates that Australian banks can lend to each other. This influences the level of interest rates in the economy as a whole. The main goal of the RBA is to maintain a stable inflation rate of 2-3% by adjusting interest rates up or down. Relatively high interest rates compared to other major central banks support the AUD, and the opposite for relatively low. The RBA can also use quantitative easing and tightening to influence credit conditions, with the former AUD-negative and the latter AUD-positive.
China is Australia’s largest trading partner so the health of the Chinese economy is a major influence on the value of the Australian Dollar (AUD). When the Chinese economy is doing well it purchases more raw materials, goods and services from Australia, lifting demand for the AUD, and pushing up its value. The opposite is the case when the Chinese economy is not growing as fast as expected. Positive or negative surprises in Chinese growth data, therefore, often have a direct impact on the Australian Dollar and its pairs.
Iron Ore is Australia’s largest export, accounting for $118 billion a year according to data from 2021, with China as its primary destination. The price of Iron Ore, therefore, can be a driver of the Australian Dollar. Generally, if the price of Iron Ore rises, AUD also goes up, as aggregate demand for the currency increases. The opposite is the case if the price of Iron Ore falls. Higher Iron Ore prices also tend to result in a greater likelihood of a positive Trade Balance for Australia, which is also positive of the AUD.
The Trade Balance, which is the difference between what a country earns from its exports versus what it pays for its imports, is another factor that can influence the value of the Australian Dollar. If Australia produces highly sought after exports, then its currency will gain in value purely from the surplus demand created from foreign buyers seeking to purchase its exports versus what it spends to purchase imports. Therefore, a positive net Trade Balance strengthens the AUD, with the opposite effect if the Trade Balance is negative.
The Bank of Japan (BoJ) Deputy Governor Ryozo Himino said on Wednesday that the financial and capital markets remain unstable and the Japanese central bank needs to monitor these developments with utmost vigilance.
Key quotes
The financial and capital markets remain unstable.
The BoJ needs to monitor these developments with utmost vigilance.
BoJ also intends to carefully examine the impact these market.
Developments at home and abroad have on the outlet for economic activity and prices, the risks surrounding the outlook, and the degree of confidence in the outlook.
BoJ will adjust the degree of monetary accommodation if it has growing confidence that its outlook for economic activity and prices will be realized.
Will conduct monetary policy as appropriate to achieve the 2% inflation target in sustainable and stable manner while closely communicating with market participants and other stakeholders.
Needs to closely monitor developments in recent market volatilities including weaker stocks and stronger Yen.
BoJ should continue its efforts to refine its approaches to estimate the neutral rate for Japan, and use the results as a useful point of reference.
But BoJ has no other choice but to chart a way forward examining how the economy and prices respond as it conducts monetary policy.
Estimation of the neutral interest rate would not automatically show the right policy path for Japan, at least at the moment.
Our baseline scenario for fiscal year 2025, 2026 envisions a reasonably balanced state where the inflation rate is consistent with the price stability target, and the economic growth is slightly above cruising speed.
The Yen recent appreciation may alleviate the import cost hike and profit squeeze many small and medium-size firms currently face.
But stronger Yen may lower the yen denominated profits of export industries and Japanese multinationals.
Market reaction
At the time of writing, the USD/JPY pair is trading 0.13% higher on the day to trade at 144.15.
Japanese Yen FAQs
The Japanese Yen (JPY) is one of the world’s most traded currencies. Its value is broadly determined by the performance of the Japanese economy, but more specifically by the Bank of Japan’s policy, the differential between Japanese and US bond yields, or risk sentiment among traders, among other factors.
One of the Bank of Japan’s mandates is currency control, so its moves are key for the Yen. The BoJ has directly intervened in currency markets sometimes, generally to lower the value of the Yen, although it refrains from doing it often due to political concerns of its main trading partners. The current BoJ ultra-loose monetary policy, based on massive stimulus to the economy, has caused the Yen to depreciate against its main currency peers. This process has exacerbated more recently due to an increasing policy divergence between the Bank of Japan and other main central banks, which have opted to increase interest rates sharply to fight decades-high levels of inflation.
The BoJ’s stance of sticking to ultra-loose monetary policy has led to a widening policy divergence with other central banks, particularly with the US Federal Reserve. This supports a widening of the differential between the 10-year US and Japanese bonds, which favors the US Dollar against the Japanese Yen.
The Japanese Yen is often seen as a safe-haven investment. This means that in times of market stress, investors are more likely to put their money in the Japanese currency due to its supposed reliability and stability. Turbulent times are likely to strengthen the Yen’s value against other currencies seen as more risky to invest in.
The People’s Bank of China (PBOC) set the USD/CNY central rate for the trading session ahead on Wednesday at 7.1216, as against the previous day's fix of 7.1249 and 7.1210 Reuters estimates.
Australia’s monthly Consumer Price Index (CPI) jumped by 3.5% in the year to July, compared to a 3.8% increase seen in June, according to the data published by the Australian Bureau of Statistics (ABS) on Wednesday.
The market forecast was for 3.4% growth in the reported period.
Market reaction to the Australia’s monthly CPI inflation
At the time of writing, the AUD/USD pair is trading 0.10% lower on the day to trade at 0.6785.
Australian Dollar price today
The table below shows the percentage change of Australian Dollar (AUD) against listed major currencies today. Australian Dollar was the weakest against the New Zealand Dollar.
| USD | EUR | GBP | CAD | AUD | JPY | NZD | CHF | |
| USD | 0.01% | 0.01% | 0.00% | 0.03% | 0.15% | -0.04% | 0.06% | |
| EUR | -0.01% | 0.00% | -0.01% | 0.01% | 0.17% | -0.06% | 0.06% | |
| GBP | -0.02% | -0.01% | -0.03% | 0.01% | 0.15% | -0.06% | 0.05% | |
| CAD | 0.01% | 0.01% | 0.01% | 0.03% | 0.16% | -0.05% | 0.06% | |
| AUD | -0.01% | -0.01% | -0.01% | -0.03% | 0.14% | -0.07% | 0.04% | |
| JPY | -0.16% | -0.16% | -0.17% | -0.17% | -0.14% | -0.21% | -9912.05% | |
| NZD | 0.04% | 0.06% | 0.05% | 0.04% | 0.07% | 0.23% | 0.11% | |
| CHF | -0.07% | -0.06% | -0.06% | -0.06% | -0.04% | 0.10% | -0.11% |
The heat map shows percentage changes of major currencies against each other. The base currency is picked from the left column, while the quote currency is picked from the top row. For example, if you pick the Euro from the left column and move along the horizontal line to the Japanese Yen, the percentage change displayed in the box will represent EUR (base)/JPY (quote).
- The Japanese Yen depreciates despite a hawkish sentiment surrounding the BoJ’s policy outlook.
- The JPY’s downside could be restrained as traders expect the BoJ to increase interest rates further.
- The US Dollar received downward pressure as US Fed Chair Powell signaled a rate cut soon.
The Japanese Yen (JPY) fell slightly against the US Dollar (USD) on Wednesday. However, conflicting policy outlooks from the Bank of Japan (BoJ) and the Federal Reserve (Fed) are exerting downward pressure on the USD/JPY pair. BoJ Governor Kazuo Ueda indicated in Parliament on Friday that the central bank might consider further interest rate hikes if its economic forecasts prove accurate.
The downside for the JPY may be limited by the hawkish sentiment surrounding the Bank of Japan (BoJ). Meanwhile, Fed Chair Jerome Powell remarked at the Jackson Hole Symposium that "the time has come for policy to adjust." However, Powell did not specify the timing or magnitude of potential rate cuts.
Additionally, San Francisco Federal Reserve President Mary Daly mentioned in a Bloomberg TV interview on Monday that "the time is upon us" to begin reducing interest rates, likely starting with a quarter-percentage point cut.
According to the CME FedWatch Tool, markets are fully anticipating at least a 25 basis point (bps) rate cut by the Federal Reserve at its September meeting.
Daily Digest Market Movers: Japanese Yen depreciates despite a hawkish BoJ
- Japan’s Finance Minister Shunichi Suzuki stated on Tuesday that foreign exchange rates are influenced by a variety of factors, including monetary policies, interest rate differentials, geopolitical risks, and market sentiment. Suzuki added that it is difficult to predict how these factors will impact FX rates.
- US Durable Goods Orders surged by 9.9% month-over-month in July, rebounding from a 6.9% decline in June. This increase significantly outpaced the expected 4.0% rise, marking the largest gain since May 2020.
- Bloomberg reported on Friday that Philadelphia Fed President Patrick Harker emphasized the need for the US central bank to lower interest rates gradually. Meanwhile, Reuters reported that Chicago Fed President Austan Goolsbee noted that monetary policy is currently at its most restrictive, with the Fed now focusing on achieving its employment mandate.
- Bank of Japan (BoJ) Governor Kazuo Ueda addressed the Japanese parliament on Friday, stating that he is “not considering selling long-term Japanese government bonds (JGBs) as a tool for adjusting interest rates.” He noted that any reduction in JGB purchases would only account for about 7-8% of the balance sheet, which is a relatively small decrease. Ueda added that if the economy aligns with their projections, there could be a phase where they might adjust interest rates slightly further.
- Japan’s National Consumer Price Index increased by 2.8% year-on-year in July, maintaining this rate for the third consecutive month and remaining at its highest level since February. Additionally, the National CPI excluding Fresh Food rose by 2.7%, the highest reading since February, aligning with expectations.
- The US Composite PMI edged down to 54.1 in August, a four-month low, from 54.3 in July, but remained above market expectations of 53.5. This indicates continued expansion in US business activity, marking 19 consecutive months of growth.
- FOMC Minutes for July’s policy meeting indicated that most Fed officials agreed last month that they would likely cut their benchmark interest rate at the upcoming meeting in September as long as inflation continued to cool.
Technical Analysis: USD/JPY remains above 144.00
USD/JPY trades around 144.20 on Wednesday. Analysis of the daily chart shows that the pair is testing the downtrend line, suggesting a weakening bearish bias. However, the 14-day Relative Strength Index (RSI) remains slightly above 30, suggesting a confirmation of a bearish trend.
On the downside, if the USD/JPY pair stays below the downtrend line, it could hover around the seven-month low of 141.69, recorded on August 5. A break below this level might push the pair toward the throwback support at 140.25.
In terms of resistance, the USD/JPY pair may challenge the immediate barrier at the nine-day Exponential Moving Average (EMA) around the 145.23 level. A breakthrough above this level could pave the way for the pair to explore the area near the throwback-turned-resistance at 154.50.
USD/JPY: Daily Chart
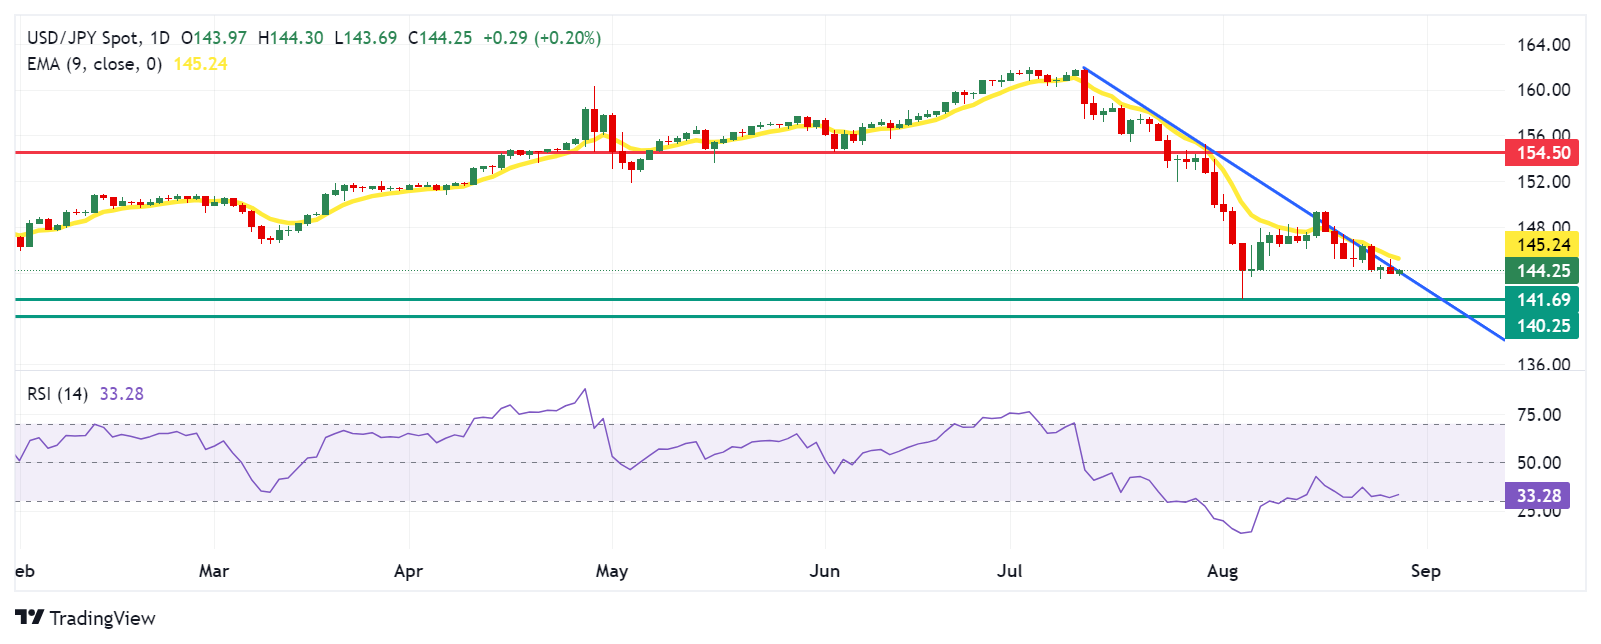
Japanese Yen PRICE Today
The table below shows the percentage change of Japanese Yen (JPY) against listed major currencies today. Japanese Yen was the weakest against the US Dollar.
| USD | EUR | GBP | JPY | CAD | AUD | NZD | CHF | |
|---|---|---|---|---|---|---|---|---|
| USD | 0.09% | 0.06% | 0.19% | 0.05% | 0.13% | -0.15% | 0.09% | |
| EUR | -0.09% | -0.02% | 0.11% | -0.04% | 0.05% | 0.04% | 0.00% | |
| GBP | -0.06% | 0.02% | 0.11% | -0.02% | 0.07% | 0.06% | 0.03% | |
| JPY | -0.19% | -0.11% | -0.11% | -0.10% | -0.05% | -0.09% | -0.09% | |
| CAD | -0.05% | 0.04% | 0.02% | 0.10% | 0.09% | 0.08% | 0.05% | |
| AUD | -0.13% | -0.05% | -0.07% | 0.05% | -0.09% | -0.01% | -0.04% | |
| NZD | 0.15% | -0.04% | -0.06% | 0.09% | -0.08% | 0.00% | -0.03% | |
| CHF | -0.09% | -0.00% | -0.03% | 0.09% | -0.05% | 0.04% | 0.03% |
The heat map shows percentage changes of major currencies against each other. The base currency is picked from the left column, while the quote currency is picked from the top row. For example, if you pick the Japanese Yen from the left column and move along the horizontal line to the US Dollar, the percentage change displayed in the box will represent JPY (base)/USD (quote).
Japanese Yen FAQs
The Japanese Yen (JPY) is one of the world’s most traded currencies. Its value is broadly determined by the performance of the Japanese economy, but more specifically by the Bank of Japan’s policy, the differential between Japanese and US bond yields, or risk sentiment among traders, among other factors.
One of the Bank of Japan’s mandates is currency control, so its moves are key for the Yen. The BoJ has directly intervened in currency markets sometimes, generally to lower the value of the Yen, although it refrains from doing it often due to political concerns of its main trading partners. The current BoJ ultra-loose monetary policy, based on massive stimulus to the economy, has caused the Yen to depreciate against its main currency peers. This process has exacerbated more recently due to an increasing policy divergence between the Bank of Japan and other main central banks, which have opted to increase interest rates sharply to fight decades-high levels of inflation.
The BoJ’s stance of sticking to ultra-loose monetary policy has led to a widening policy divergence with other central banks, particularly with the US Federal Reserve. This supports a widening of the differential between the 10-year US and Japanese bonds, which favors the US Dollar against the Japanese Yen.
The Japanese Yen is often seen as a safe-haven investment. This means that in times of market stress, investors are more likely to put their money in the Japanese currency due to its supposed reliability and stability. Turbulent times are likely to strengthen the Yen’s value against other currencies seen as more risky to invest in.
- Gold price extends its rally in Wednesday’s early Asian session.
- The deteriorating situation in the Middle East and the Fed’s dovish stance underpin the Gold price.
- Traders await the speeches from the Fed’s Waller and Bostic on Wednesday.
The Gold price (XAU/USD) gains traction above $2,500 per troy ounce on Wednesday, bolstered by the escalating geopolitical tensions in the Middle East. Additionally, US Federal Reserve (Fed) Chair Jerome Powell's speech at the Jackson Hole symposium last week, signalling “time has come” to begin lowering interest rates, supports the precious metal as it reduces the opportunity cost of holding non-interest-paying assets.
Investors will take more cues from the Fed's Christopher Waller and Raphael Bostic speeches on Wednesday for some hints about the US interest rate path. The attention will shift to the preliminary US Gross Domestic Product (GDP) Annualized for the second quarter (Q2) and Personal Consumption Expenditures (PCE) - Price Index data, which will be published on Thursday and Friday, respectively. The better-than-estimated outcomes could lift the US Dollar (USD) and cap the upside for the USD-denominated Gold price.
Daily Digest Market Movers: Gold price remains strong near the record-high
- Thousands of troops from special units mobilized for a large-scale operation in the northern West Bank, which is anticipated to take several weeks. The report said the army has conducted the largest military operation in the West Bank since 2002, and the operation will continue for several days.
- “The prospect of falling interest rates is also attracting investors. According to Bloomberg, Gold ETF holdings rose by 15 tonnes last week to the highest level in six months. Speculative interest is particularly strong. The net long position of speculative investors rose to around 193,000 contracts in the week to August 20th, at the same time as Gold hit an all-time high, its highest level in almost four and a half years,” noted Commerzbank’s commodity strategist Carsten Fritsch.
- The Conference Board's US Consumer Confidence Index improved to a six-month high, rising to 103.3 in August from an upwardly revised 101.9 in July.
- The US Housing Price Index declined by 0.1% MoM in June, below the market consensus of a 0.2% increase, the Federal Housing Federal Agency showed Tuesday.
- According to the CME FedWatch Tool, the rate futures markets have fully priced in a 25 basis points (bps) rate cut in September, while the possibility of a deeper rate cut stands at 34.5%. Traders see 100 bps Fed easing this year.
Technical Analysis: Gold price keeps the bullish vibe in the longer term
The Gold price edges higher on the day. The precious metal remains capped under a five-month-old ascending channel upper boundary and the record high. A broader positive outlook of yellow metal remains unchanged as it holds above the key 100-day Exponential Moving Average (EMA) on the daily chart. The upward momentum is supported by the 14-day Relative Strength Index (RSI), which stands above the midline near 64.70, affirming continued bullish pressure in the near term.
The key resistance level for XAU/USD emerges at $2,530, representing the confluence of the all-time high and the upper boundary of the trend channel. A bullish breakout above this level could make a play for the $2,600 psychological barrier.
On the downside, the initial support level is seen at the $2,500 round figure. A breach of the mentioned level could lead to further losses near $2,470, the low of August 22. The next contention level to watch is $2,432, the low of August 15.
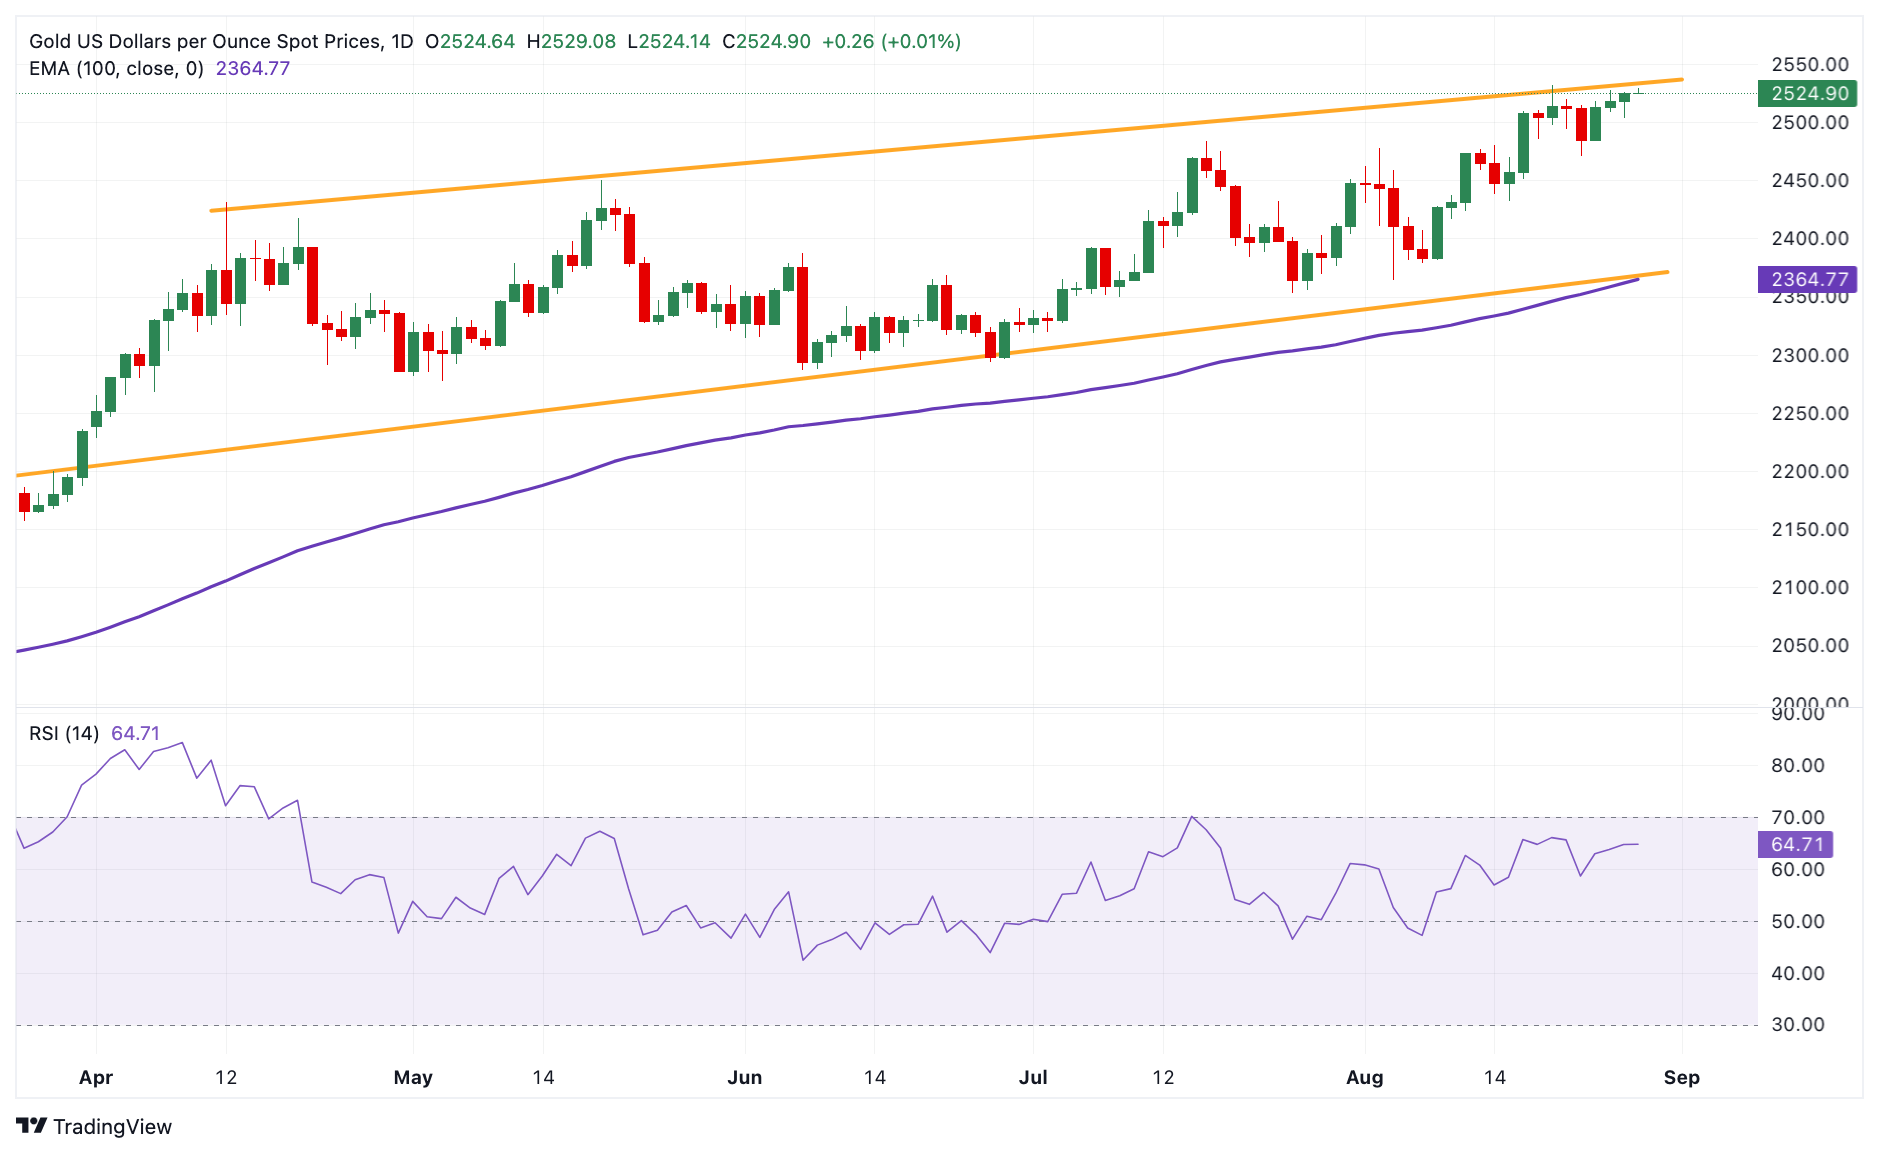
Gold FAQs
Gold has played a key role in human’s history as it has been widely used as a store of value and medium of exchange. Currently, apart from its shine and usage for jewelry, the precious metal is widely seen as a safe-haven asset, meaning that it is considered a good investment during turbulent times. Gold is also widely seen as a hedge against inflation and against depreciating currencies as it doesn’t rely on any specific issuer or government.
Central banks are the biggest Gold holders. In their aim to support their currencies in turbulent times, central banks tend to diversify their reserves and buy Gold to improve the perceived strength of the economy and the currency. High Gold reserves can be a source of trust for a country’s solvency. Central banks added 1,136 tonnes of Gold worth around $70 billion to their reserves in 2022, according to data from the World Gold Council. This is the highest yearly purchase since records began. Central banks from emerging economies such as China, India and Turkey are quickly increasing their Gold reserves.
Gold has an inverse correlation with the US Dollar and US Treasuries, which are both major reserve and safe-haven assets. When the Dollar depreciates, Gold tends to rise, enabling investors and central banks to diversify their assets in turbulent times. Gold is also inversely correlated with risk assets. A rally in the stock market tends to weaken Gold price, while sell-offs in riskier markets tend to favor the precious metal.
The price can move due to a wide range of factors. Geopolitical instability or fears of a deep recession can quickly make Gold price escalate due to its safe-haven status. As a yield-less asset, Gold tends to rise with lower interest rates, while higher cost of money usually weighs down on the yellow metal. Still, most moves depend on how the US Dollar (USD) behaves as the asset is priced in dollars (XAU/USD). A strong Dollar tends to keep the price of Gold controlled, whereas a weaker Dollar is likely to push Gold prices up.
| Index | Change, points | Closed | Change, % |
|---|---|---|---|
| NIKKEI 225 | 178.4 | 38288.62 | 0.47 |
| Hang Seng | 75.94 | 17874.67 | 0.43 |
| KOSPI | -8.76 | 2689.25 | -0.32 |
| ASX 200 | -13.3 | 8071.2 | -0.16 |
| DAX | 64.79 | 18681.81 | 0.35 |
| CAC 40 | -24.59 | 7565.78 | -0.32 |
| Dow Jones | 9.98 | 41250.5 | 0.02 |
| S&P 500 | 8.96 | 5625.8 | 0.16 |
| NASDAQ Composite | 29.05 | 17754.82 | 0.16 |
| Pare | Closed | Change, % |
|---|---|---|
| AUDUSD | 0.67921 | 0.33 |
| EURJPY | 160.952 | -0.19 |
| EURUSD | 1.1183 | 0.18 |
| GBPJPY | 190.835 | 0.16 |
| GBPUSD | 1.32586 | 0.53 |
| NZDUSD | 0.62504 | 0.74 |
| USDCAD | 1.34415 | -0.3 |
| USDCHF | 0.84154 | -0.65 |
| USDJPY | 143.934 | -0.36 |


© 2000-2026. Bản quyền Teletrade.
Trang web này được quản lý bởi Teletrade D.J. LLC 2351 LLC 2022 (Euro House, Richmond Hill Road, Kingstown, VC0100, St. Vincent and the Grenadines).
Thông tin trên trang web không phải là cơ sở để đưa ra quyết định đầu tư và chỉ được cung cấp cho mục đích làm quen.
Giao dịch trên thị trường tài chính (đặc biệt là giao dịch sử dụng các công cụ biên) mở ra những cơ hội lớn và tạo điều kiện cho các nhà đầu tư sẵn sàng mạo hiểm để thu lợi nhuận, tuy nhiên nó mang trong mình nguy cơ rủi ro khá cao. Chính vì vậy trước khi tiến hành giao dịch cần phải xem xét mọi mặt vấn đề chấp nhận tiến hành giao dịch cụ thể xét theo quan điểm của nguồn lực tài chính sẵn có và mức độ am hiểu thị trường tài chính.
Sử dụng thông tin: sử dụng toàn bộ hay riêng biệt các dữ liệu trên trang web của công ty TeleTrade như một nguồn cung cấp thông tin nhất định. Việc sử dụng tư liệu từ trang web cần kèm theo liên kết đến trang teletrade.vn. Việc tự động thu thập số liệu cũng như thông tin từ trang web TeleTrade đều không được phép.
Xin vui lòng liên hệ với pr@teletrade.global nếu có câu hỏi.
ngân hàng