- Phân tích
- Tin tức và các công cụ
- Tin tức thị trường
Tin tức thì trường
- AUD/USD edges lower to near 0.6790 in Wednesday’s early Asian session.
- Escalating geopolitical tensions might weigh on the pair, while the Fed rate cut bets might cap its downside.
- Investors will monitor the Australian monthly CPI report, which is due on Wednesday.
The AUD/USD pair trades with mild losses around 0.6790 on Wednesday during the early Asian session. The risk-off mood amid escalating geopolitical tensions in the Middle East weighs on riskier assets like the Australian Dollar (AUD). Investors will take more cues from the Australian monthly Consumer Price Index (CPI) on Wednesday for fresh impetus.
The rising Middle East geopolitical risks might boost the safe-haven flows, benefiting the Greenback for the time being. Thousands of troops from special units mobilized for a large-scale operation in the northern West Bank, which is anticipated to take several weeks, per the local news agency Aljazeera.
However, the US Federal Reserve's (Fed) rate cut expectations are likely to cap the upside of the US Dollar (USD) and provide some support to AUD/USD. The US Fed is anticipated to cut rates in September, with a quarter-point move expected after Fed Chair Jerome Powell said on Friday that it was time to cut rates.
Consumer confidence in the United States continued to improve in August, with the Conference Board's (CB) Consumer Confidence Index climbing to 103.3 in August from 101.9 (revised from 100.3) in July. Nonetheless, this data provides little to no impact on the US D’s valuation.
On the Aussie front, the monthly Australian CPI inflation is estimated to ease to 3.4% YoY in July from 3.8% in June. The softer-than-expected outcome could trigger market speculation that the Reserve Bank of Australia (RBA) will lower interest rates this year.
Australian Dollar FAQs
One of the most significant factors for the Australian Dollar (AUD) is the level of interest rates set by the Reserve Bank of Australia (RBA). Because Australia is a resource-rich country another key driver is the price of its biggest export, Iron Ore. The health of the Chinese economy, its largest trading partner, is a factor, as well as inflation in Australia, its growth rate and Trade Balance. Market sentiment – whether investors are taking on more risky assets (risk-on) or seeking safe-havens (risk-off) – is also a factor, with risk-on positive for AUD.
The Reserve Bank of Australia (RBA) influences the Australian Dollar (AUD) by setting the level of interest rates that Australian banks can lend to each other. This influences the level of interest rates in the economy as a whole. The main goal of the RBA is to maintain a stable inflation rate of 2-3% by adjusting interest rates up or down. Relatively high interest rates compared to other major central banks support the AUD, and the opposite for relatively low. The RBA can also use quantitative easing and tightening to influence credit conditions, with the former AUD-negative and the latter AUD-positive.
China is Australia’s largest trading partner so the health of the Chinese economy is a major influence on the value of the Australian Dollar (AUD). When the Chinese economy is doing well it purchases more raw materials, goods and services from Australia, lifting demand for the AUD, and pushing up its value. The opposite is the case when the Chinese economy is not growing as fast as expected. Positive or negative surprises in Chinese growth data, therefore, often have a direct impact on the Australian Dollar and its pairs.
Iron Ore is Australia’s largest export, accounting for $118 billion a year according to data from 2021, with China as its primary destination. The price of Iron Ore, therefore, can be a driver of the Australian Dollar. Generally, if the price of Iron Ore rises, AUD also goes up, as aggregate demand for the currency increases. The opposite is the case if the price of Iron Ore falls. Higher Iron Ore prices also tend to result in a greater likelihood of a positive Trade Balance for Australia, which is also positive of the AUD.
The Trade Balance, which is the difference between what a country earns from its exports versus what it pays for its imports, is another factor that can influence the value of the Australian Dollar. If Australia produces highly sought after exports, then its currency will gain in value purely from the surplus demand created from foreign buyers seeking to purchase its exports versus what it spends to purchase imports. Therefore, a positive net Trade Balance strengthens the AUD, with the opposite effect if the Trade Balance is negative.
Thousands of troops from special units mobilized for a large-scale operation in the northern West Bank, which is anticipated to take several weeks. The report said the army has conducted the largest military operation in the West Bank since 2002 and the operation will continue for several days.
The United Nations (UN) stated last Wednesday that Israeli air strikes in the West Bank had killed 128 Palestinians, including 26 children, since October 7, per the BBC.
The West Bank has seen a surge in violence since the start of the war in Gaza, triggered by Hamas's deadly attack on southern Israel in October.
Market reaction
At the time of writing, the gold price (XAU/USD) is trading 0.05% higher on the day to trade at $2,525.15.
Risk sentiment FAQs
In the world of financial jargon the two widely used terms “risk-on” and “risk off'' refer to the level of risk that investors are willing to stomach during the period referenced. In a “risk-on” market, investors are optimistic about the future and more willing to buy risky assets. In a “risk-off” market investors start to ‘play it safe’ because they are worried about the future, and therefore buy less risky assets that are more certain of bringing a return, even if it is relatively modest.
Typically, during periods of “risk-on”, stock markets will rise, most commodities – except Gold – will also gain in value, since they benefit from a positive growth outlook. The currencies of nations that are heavy commodity exporters strengthen because of increased demand, and Cryptocurrencies rise. In a “risk-off” market, Bonds go up – especially major government Bonds – Gold shines, and safe-haven currencies such as the Japanese Yen, Swiss Franc and US Dollar all benefit.
The Australian Dollar (AUD), the Canadian Dollar (CAD), the New Zealand Dollar (NZD) and minor FX like the Ruble (RUB) and the South African Rand (ZAR), all tend to rise in markets that are “risk-on”. This is because the economies of these currencies are heavily reliant on commodity exports for growth, and commodities tend to rise in price during risk-on periods. This is because investors foresee greater demand for raw materials in the future due to heightened economic activity.
The major currencies that tend to rise during periods of “risk-off” are the US Dollar (USD), the Japanese Yen (JPY) and the Swiss Franc (CHF). The US Dollar, because it is the world’s reserve currency, and because in times of crisis investors buy US government debt, which is seen as safe because the largest economy in the world is unlikely to default. The Yen, from increased demand for Japanese government bonds, because a high proportion are held by domestic investors who are unlikely to dump them – even in a crisis. The Swiss Franc, because strict Swiss banking laws offer investors enhanced capital protection.
- NZD/USD extends its rally around 0.6250 in Wednesday’s early Asian session.
- The firmer bets of Fed rate cuts continue to undermine the US dollar ahead of the key US data.
- RBNZ is open to faster rate cuts, which might drag the Kiwi lower against the USD.
The NZD/USD pair trades on a weaker note near 0.6245 after retracing from eight-month highs during the early Asian session on Wednesday. However, the downside of the pair is likely to be limited due to the weaker US Dollar (USD) after the Federal Reserve (Fed) signalled the upcoming rate cut this year. Fed’s Christopher Waller and Raphael Bostic are scheduled to speak later on Wednesday.
The prospect of upcoming US interest rate cuts might continue to exert some selling pressure on the Greenback. The rate futures markets have priced in nearly 34.5% odds that the Fed will cut rates by 50 basis points (bps) in September, with 100 bps Fed easing expected this year.
Data released by the Conference Board on Tuesday revealed that the US Consumer Confidence Index rose to 103.3 in August from an upwardly revised 101.9 in July. This figure improved to a six-month high amid optimism over the economic outlook. However, concerns about the labor market remain after the Unemployment Rate jumped to near a three-year high of 4.3% last month.
Investors are looking forward to fresh drivers from the US economic data this week. The preliminary estimate for the US Gross Domestic Product (GDP) for the second quarter (Q2) and the Personal Consumption Expenditures (PCE) Price Index, the Fed's preferred inflation gauge, will be published on Thursday and Friday, respectively.
After a surprise interest rate cut by the Reserve Bank of New Zealand (RBNZ) in its August meeting, there is speculation among monetary policy committee members to accelerate future cuts if economic data suggests increasing downside risks to activity and inflation. Traders expect the New Zealand central bank to cut rates by 25 bps in October and November. This, in turn, might weigh on the New Zealand Dollar (NZD) and cap the upside for the pair.
New Zealand Dollar FAQs
The New Zealand Dollar (NZD), also known as the Kiwi, is a well-known traded currency among investors. Its value is broadly determined by the health of the New Zealand economy and the country’s central bank policy. Still, there are some unique particularities that also can make NZD move. The performance of the Chinese economy tends to move the Kiwi because China is New Zealand’s biggest trading partner. Bad news for the Chinese economy likely means less New Zealand exports to the country, hitting the economy and thus its currency. Another factor moving NZD is dairy prices as the dairy industry is New Zealand’s main export. High dairy prices boost export income, contributing positively to the economy and thus to the NZD.
The Reserve Bank of New Zealand (RBNZ) aims to achieve and maintain an inflation rate between 1% and 3% over the medium term, with a focus to keep it near the 2% mid-point. To this end, the bank sets an appropriate level of interest rates. When inflation is too high, the RBNZ will increase interest rates to cool the economy, but the move will also make bond yields higher, increasing investors’ appeal to invest in the country and thus boosting NZD. On the contrary, lower interest rates tend to weaken NZD. The so-called rate differential, or how rates in New Zealand are or are expected to be compared to the ones set by the US Federal Reserve, can also play a key role in moving the NZD/USD pair.
Macroeconomic data releases in New Zealand are key to assess the state of the economy and can impact the New Zealand Dollar’s (NZD) valuation. A strong economy, based on high economic growth, low unemployment and high confidence is good for NZD. High economic growth attracts foreign investment and may encourage the Reserve Bank of New Zealand to increase interest rates, if this economic strength comes together with elevated inflation. Conversely, if economic data is weak, NZD is likely to depreciate.
The New Zealand Dollar (NZD) tends to strengthen during risk-on periods, or when investors perceive that broader market risks are low and are optimistic about growth. This tends to lead to a more favorable outlook for commodities and so-called ‘commodity currencies’ such as the Kiwi. Conversely, NZD tends to weaken at times of market turbulence or economic uncertainty as investors tend to sell higher-risk assets and flee to the more-stable safe havens.
- EUR/USD rose on Tuesday, but bulls remain unable to pierce 1.1200.
- Wednesday’s market session promises little momentum with a thin calendar.
- EU and US inflation data looms large on Friday, but little meaningful until then.
EUR/USD drifted into the high side on Tuesday, bolstered by a continued broad-market easing in Greenback bidding pressure. Fiber ticked back into the high end after the trading week kicked off with a slight pare back in recent gains, but a fresh round of risk-on market sentiment sent bids back into recent highs. Still, the pair remains trapped below the 1.1200 handle as Euro bulls struggle to confidently force Fiber higher.
Fed Chair Jerome Powell all but confirmed that the central bank will pivot into a rate-cutting cycle on September 18 during an appearance at the Jackson Hole Economic Symposium last Friday, sending market appetite into the ceiling once again.
Coming up on Wednesday: Markets set for a quiet day
Little of note is populating the economic calendar on the Euro side, and Wednesday is shaping up to be a quiet session on both sides of the Atlantic. Fedspeak traders will have an eye out for a speech from Fed Board of Governors member Christopher Waller early in the US market session, while central bank watchers will be on the lookout for any headlines from the EU’s Eurogroup meeting slated for the European market session.
What happened on Tuesday
Mixed prints in US housing price data from June gave investors little to go on. The Federal Housing Finance Agency’s MoM Housing Price Index contracted -0.1% compared to May’s print of 0.0%. Markets expected a print of 0.2%. The S&P/Case-Shiller Home Price Indices, meanwhile, rose 6.5% YoY, less than the previous period’s revised 6.9%, but still more than the expected 6.0%.
Coming up: EU, US inflation data drops
Pan-EU Harmonized Index of Consumer Prices inflation numbers for August are due early Friday, and price growth across the Euro area are expected to tick down to 2.8% YoY compared to the previous 2.9% as inflationary pressures continue to ease, though not nearly as fast as policymakers at the European Central Bank (ECB) would like.
US Q2 Gross Domestic Product (GDP) figures are slated to print on Thursday, and are expected to hold steady at 2.8% on an annualized basis. However, the key data print this week will be Friday’s US Personal Consumption Expenditure (PCE) Price Index inflation reading for July, which is expected to tick higher YoY to 2.7% from 2.6% and hold flat at 0.2% MoM. Market participants absolutely giddy over hopes for rate cuts will be looking for inflation data to come in below expectations, while an above-forecast print could send fresh jitters through investor risk appetite.
Forex Today: Lack of enthusiasm points to some consolidation
EUR/USD price forecast
EUR/USD is on pace for its best single-month performance since November of 2022, up over 3.1% just in the month of August. Despite this week’s early technical exhaustion pullback, Fiber has gained ground for four consecutive trading weeks, and is bidding well above the 200-day Exponential Moving Average (EMA) at 1.0832.
Despite a healthy bid deep into bull country, Fiber is running a deep exposure to a bearish pullback, and a lack of topside momentum could see price action tumble all the way back to the 50-day EMA at 1.0925.
EUR/USD daily chart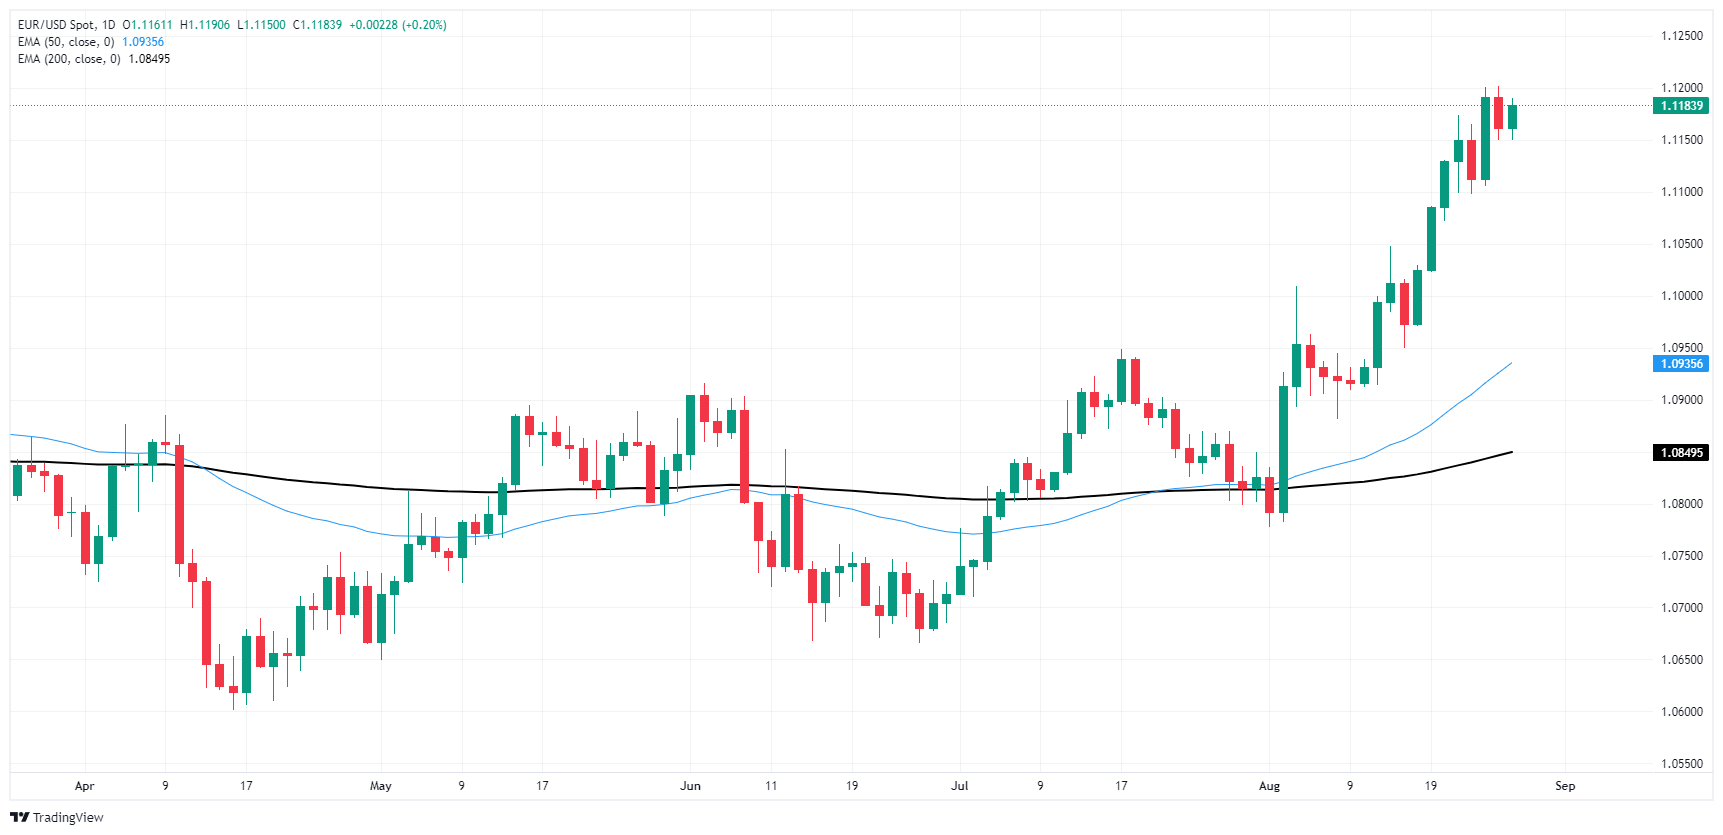
Euro FAQs
The Euro is the currency for the 20 European Union countries that belong to the Eurozone. It is the second most heavily traded currency in the world behind the US Dollar. In 2022, it accounted for 31% of all foreign exchange transactions, with an average daily turnover of over $2.2 trillion a day. EUR/USD is the most heavily traded currency pair in the world, accounting for an estimated 30% off all transactions, followed by EUR/JPY (4%), EUR/GBP (3%) and EUR/AUD (2%).
The European Central Bank (ECB) in Frankfurt, Germany, is the reserve bank for the Eurozone. The ECB sets interest rates and manages monetary policy. The ECB’s primary mandate is to maintain price stability, which means either controlling inflation or stimulating growth. Its primary tool is the raising or lowering of interest rates. Relatively high interest rates – or the expectation of higher rates – will usually benefit the Euro and vice versa. The ECB Governing Council makes monetary policy decisions at meetings held eight times a year. Decisions are made by heads of the Eurozone national banks and six permanent members, including the President of the ECB, Christine Lagarde.
Eurozone inflation data, measured by the Harmonized Index of Consumer Prices (HICP), is an important econometric for the Euro. If inflation rises more than expected, especially if above the ECB’s 2% target, it obliges the ECB to raise interest rates to bring it back under control. Relatively high interest rates compared to its counterparts will usually benefit the Euro, as it makes the region more attractive as a place for global investors to park their money.
Data releases gauge the health of the economy and can impact on the Euro. Indicators such as GDP, Manufacturing and Services PMIs, employment, and consumer sentiment surveys can all influence the direction of the single currency. A strong economy is good for the Euro. Not only does it attract more foreign investment but it may encourage the ECB to put up interest rates, which will directly strengthen the Euro. Otherwise, if economic data is weak, the Euro is likely to fall. Economic data for the four largest economies in the euro area (Germany, France, Italy and Spain) are especially significant, as they account for 75% of the Eurozone’s economy.
Another significant data release for the Euro is the Trade Balance. This indicator measures the difference between what a country earns from its exports and what it spends on imports over a given period. If a country produces highly sought after exports then its currency will gain in value purely from the extra demand created from foreign buyers seeking to purchase these goods. Therefore, a positive net Trade Balance strengthens a currency and vice versa for a negative balance.
- GBP/USD lurched into a fresh 29-month peak as the US Dollar recedes.
- Markets continue to tilt into a risk-on stance as Fed rate cut hopes continue.
- UK economic data releases remain thin this week, US PCE inflation looms on Friday.
GBP/USD tested into a fresh multi-year high on Tuesday, easing into a 29-month peak of 1.3266 as the Pound Sterling continues to catch a ride on a broad-market Greenback sell wave. Investors have piled into hopes for a September rate cut from the Federal Reserve (Fed), and US Personal Consumption Expenditure Price Index (PCE) inflation figures not due until Friday leave markets with little meaningful data to chew on until then.
Fed Chair Jerome Powell all but confirmed that the central bank will pivot into a rate-cutting cycle on September 18 during an appearance at the Jackson Hole Economic Symposium last Friday, sending market appetite into the ceiling ocne again..
Coming up on Wednesday: consolidation session on the cards
Little of note is populating the economic calendar on the UK side, and Wednesday is shaping up to be a quiet session on both sides of the Atlantic. Fedspeak traders will have an eye out for a speech from Fed Board of Governors member Christopher Waller early in the US market session, while central bank watchers will be looking out for a speech from Bank of England (BoE) policymaker Catherine Mann, due after London markets close.
What happened on Tuesday
Mixed prints in US housing price data from June gave investors little to go on. The Federal Housing Finance Agency’s MoM Housing Price Index contracted -0.1% compared to May’s print of 0.0%. Markets expected a print of 0.2%. The S&P/Case-Shiller Home Price Indices, meanwhile, rose 6.5% YoY, less than the previous period’s revised 6.9%, but still more than the expected 6.0%.
Coming up: US GDP, PCE inflation data prints
US Q2 Gross Domestic Product (GDP) figures are slated to print on Thursday, and are expected to hold steady at 2.8% on an annualized basis. However, the key data print this week will be Friday’s US Personal Consumption Expenditure (PCE) Price Index inflation reading for July, which is expected to tick higher YoY to 2.7% from 2.6% and hold flat at 0.2% MoM. Market participants absolutely giddy over hopes for rate cuts will be looking for inflation data to come in below expectations, while an above-forecast print could send fresh jitters through investor risk appetite.
Forex Today: Lack of enthusiasm points to some consolidation
GBP/USD price forecast
Cable’s early-week pullback is already over, with bids tipping once again into a fresh 29-month high. GBP/USD is now on pace to resume a near-term bullish trend that has dragged the pair up 4.75% bottom-to-top from early August’s swing low into 1.2665.
GBP/USD has closed in the green for all but two of the last 14 consecutive trading days, and technical barriers on the high side have drawn thin. Bidders should be cautious of an overbought snap back into the low side, but with price action trading well north of the 50-day Exponential Moving Average (EMA) at 1.2876, it would take a significant drop in value before signs of a bearish trend change even begin to form on the charts.
GBP/USD daily chart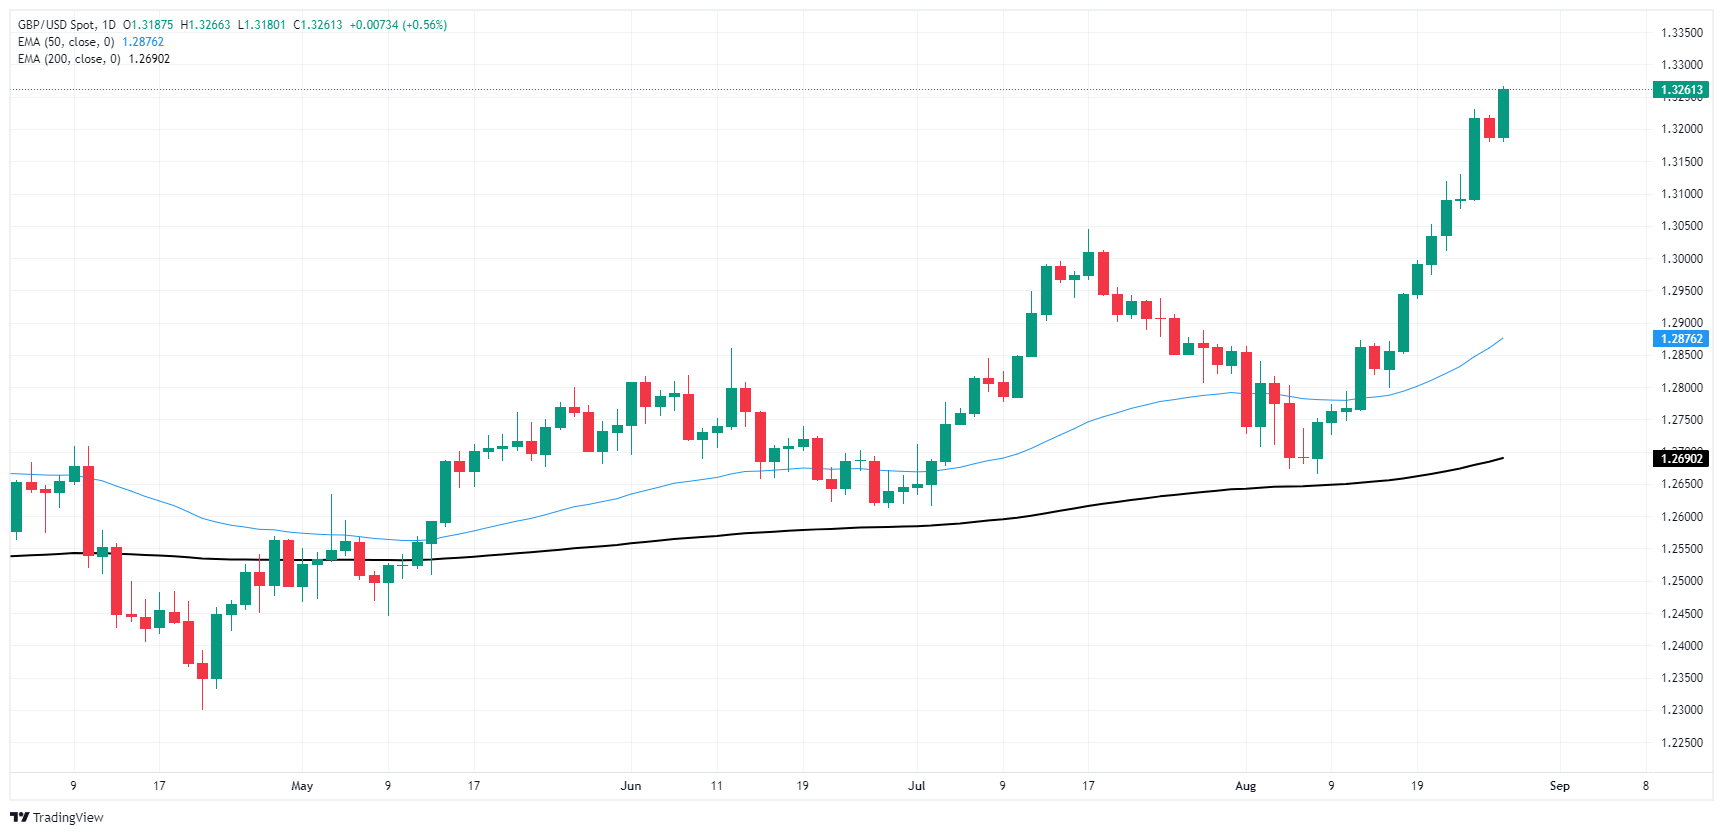
Pound Sterling FAQs
The Pound Sterling (GBP) is the oldest currency in the world (886 AD) and the official currency of the United Kingdom. It is the fourth most traded unit for foreign exchange (FX) in the world, accounting for 12% of all transactions, averaging $630 billion a day, according to 2022 data. Its key trading pairs are GBP/USD, aka ‘Cable’, which accounts for 11% of FX, GBP/JPY, or the ‘Dragon’ as it is known by traders (3%), and EUR/GBP (2%). The Pound Sterling is issued by the Bank of England (BoE).
The single most important factor influencing the value of the Pound Sterling is monetary policy decided by the Bank of England. The BoE bases its decisions on whether it has achieved its primary goal of “price stability” – a steady inflation rate of around 2%. Its primary tool for achieving this is the adjustment of interest rates. When inflation is too high, the BoE will try to rein it in by raising interest rates, making it more expensive for people and businesses to access credit. This is generally positive for GBP, as higher interest rates make the UK a more attractive place for global investors to park their money. When inflation falls too low it is a sign economic growth is slowing. In this scenario, the BoE will consider lowering interest rates to cheapen credit so businesses will borrow more to invest in growth-generating projects.
Data releases gauge the health of the economy and can impact the value of the Pound Sterling. Indicators such as GDP, Manufacturing and Services PMIs, and employment can all influence the direction of the GBP. A strong economy is good for Sterling. Not only does it attract more foreign investment but it may encourage the BoE to put up interest rates, which will directly strengthen GBP. Otherwise, if economic data is weak, the Pound Sterling is likely to fall.
Another significant data release for the Pound Sterling is the Trade Balance. This indicator measures the difference between what a country earns from its exports and what it spends on imports over a given period. If a country produces highly sought-after exports, its currency will benefit purely from the extra demand created from foreign buyers seeking to purchase these goods. Therefore, a positive net Trade Balance strengthens a currency and vice versa for a negative balance.
- Silver holds above 50 and 100-DMAs, showing buyer strength, but momentum is diminishing.
- For uptrend continuation, a break above the August 26 peak of $30.18 is needed, aiming for $30.50 and July 17 high of $31.42.
- If gains below $30.00 aren't sustained, expect a pullback to supports at $29.22-$29.13 and key $29.00 level.
Silver's price consolidated for the second straight day, within the $29.70-$30.10 area on Tuesday, yet printed gains of 0.24%. At the time of writing, XAG/USD trades at $29.96.
XAG/USD Price Forecast: Technical outlook
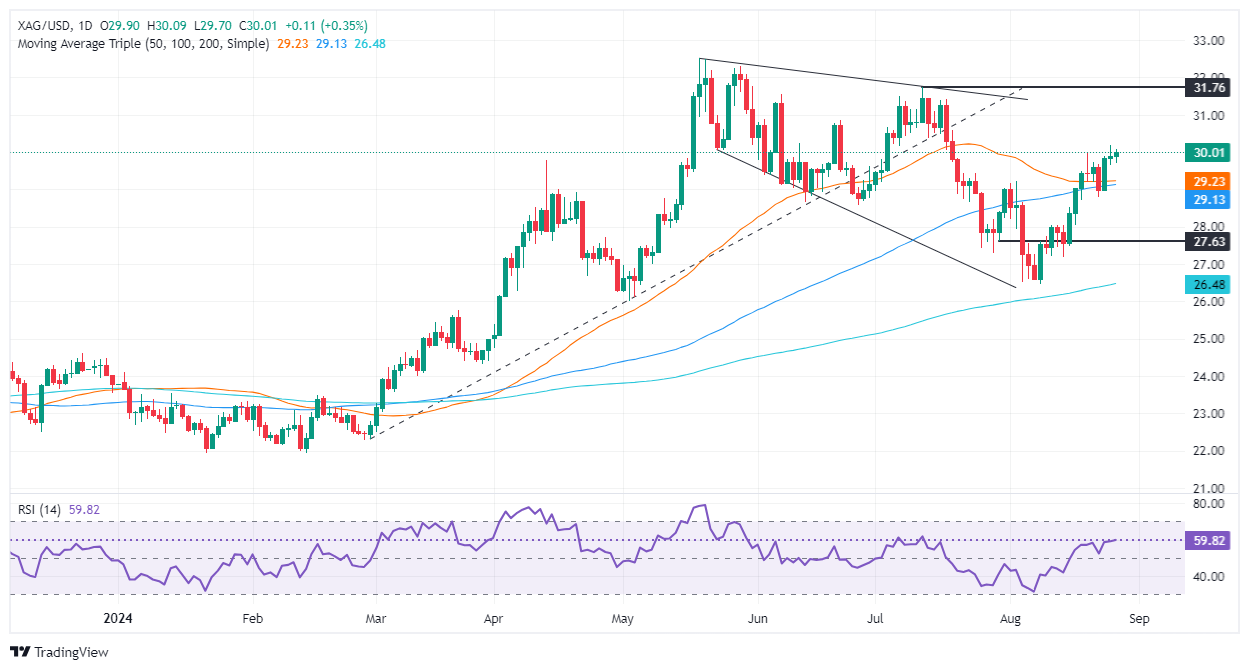
The XAG/USD trades above the confluence of the 50- and 100-day moving averages (DMAs), an indication of buyer strength. Still, Silver’s uptrend seems stretched, with bills failing to achieve a daily close above $30.00.
Momentum supports buyers yet shows that they’re losing steam, as the Relative Strength Index (RSI) shows.
Silver’s uptrend will continue once buyers reclaim the August 26 peak at $30.18. Once surpassed, the next resistance would be the $30.50 figure, followed by the July 17 swing high at $31.42.
Conversely, if XAG/USD sellers keep prices below $30.00, this will expose the confluence of the 50 and 100-DMAs at around $29.22-$29.13, ahead of the $29.00 figure.
XAG/USD Price Action – Daily Chart
Silver FAQs
Silver is a precious metal highly traded among investors. It has been historically used as a store of value and a medium of exchange. Although less popular than Gold, traders may turn to Silver to diversify their investment portfolio, for its intrinsic value or as a potential hedge during high-inflation periods. Investors can buy physical Silver, in coins or in bars, or trade it through vehicles such as Exchange Traded Funds, which track its price on international markets.
Silver prices can move due to a wide range of factors. Geopolitical instability or fears of a deep recession can make Silver price escalate due to its safe-haven status, although to a lesser extent than Gold's. As a yieldless asset, Silver tends to rise with lower interest rates. Its moves also depend on how the US Dollar (USD) behaves as the asset is priced in dollars (XAG/USD). A strong Dollar tends to keep the price of Silver at bay, whereas a weaker Dollar is likely to propel prices up. Other factors such as investment demand, mining supply – Silver is much more abundant than Gold – and recycling rates can also affect prices.
Silver is widely used in industry, particularly in sectors such as electronics or solar energy, as it has one of the highest electric conductivity of all metals – more than Copper and Gold. A surge in demand can increase prices, while a decline tends to lower them. Dynamics in the US, Chinese and Indian economies can also contribute to price swings: for the US and particularly China, their big industrial sectors use Silver in various processes; in India, consumers’ demand for the precious metal for jewellery also plays a key role in setting prices.
Silver prices tend to follow Gold's moves. When Gold prices rise, Silver typically follows suit, as their status as safe-haven assets is similar. The Gold/Silver ratio, which shows the number of ounces of Silver needed to equal the value of one ounce of Gold, may help to determine the relative valuation between both metals. Some investors may consider a high ratio as an indicator that Silver is undervalued, or Gold is overvalued. On the contrary, a low ratio might suggest that Gold is undervalued relative to Silver.
- USD/JPY retreats from 145.00, pressured by falling US Treasury yields and a weakening Dollar.
- Bearish trend outlook; momentum favors sellers with RSI staying negative.
- Key supports: August 26 low at 143.44, then 143.00, 142.00, and August 5 low at 141.69.
- Upside: Break above 144.00 targets resistance at 146.42 (Tenkan-Sen) and potentially 147.00.
The USD/JPY retreats from around the 145.00 area and tumbles under the 144.00 figure as US Treasury bond yields edge lower. The Greenback extends its losses, as seen by the US Dollar Index (DXY), which tracks a basket of six currencies against the buck. It dropped 0.31% to 100.54. At the time of writing, the major trades at 143.94, down by 0.40%.
USD/JPY Price Forecast: Technical outlook
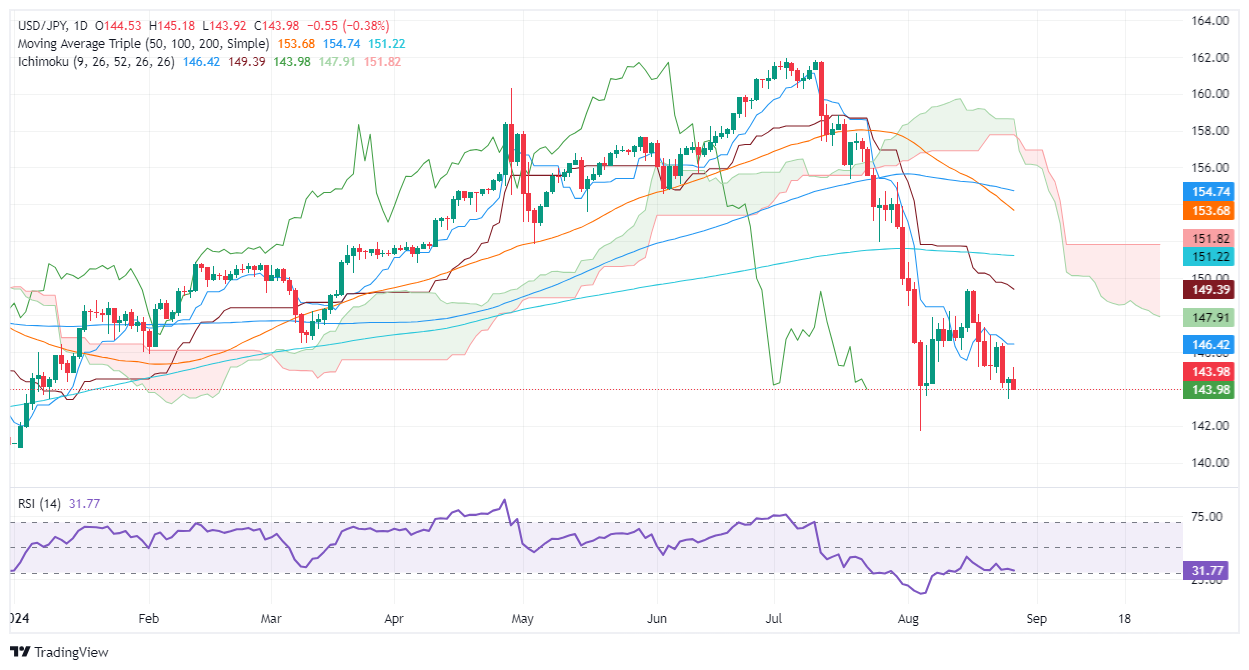
The USD/JPY continues to trade “relatively sideways,” with sellers stepping in ahead of Friday's release of crucial US inflation data. Nevertheless, from a technical point of view, the pair will re-test August’s 5 daily low of 141.69 if traders clear some hurdles on the way south.
As of writing, momentum favors sellers, as portrayed by the Relative Strength Index (RSI), which remains bearish. With this said, USD/JPY's first support level would be the August 26 swing low of 143.44. Once surpassed, the next stop would be the psychological 143.00 figure, followed by the 142.00 figure, before challenging the August, as mentioned above, 5-cycle low.
Conversely, if USD/JPY clears the 144.00 figure, the pair could aim upward and challenge higher prices. The next resistance would be the Tenkan-Sen at 146.42, followed by the 147.00 mark.
USD/JPY Price Action – Daily Chart
Japanese Yen FAQs
The Japanese Yen (JPY) is one of the world’s most traded currencies. Its value is broadly determined by the performance of the Japanese economy, but more specifically by the Bank of Japan’s policy, the differential between Japanese and US bond yields, or risk sentiment among traders, among other factors.
One of the Bank of Japan’s mandates is currency control, so its moves are key for the Yen. The BoJ has directly intervened in currency markets sometimes, generally to lower the value of the Yen, although it refrains from doing it often due to political concerns of its main trading partners. The current BoJ ultra-loose monetary policy, based on massive stimulus to the economy, has caused the Yen to depreciate against its main currency peers. This process has exacerbated more recently due to an increasing policy divergence between the Bank of Japan and other main central banks, which have opted to increase interest rates sharply to fight decades-high levels of inflation.
The BoJ’s stance of sticking to ultra-loose monetary policy has led to a widening policy divergence with other central banks, particularly with the US Federal Reserve. This supports a widening of the differential between the 10-year US and Japanese bonds, which favors the US Dollar against the Japanese Yen.
The Japanese Yen is often seen as a safe-haven investment. This means that in times of market stress, investors are more likely to put their money in the Japanese currency due to its supposed reliability and stability. Turbulent times are likely to strengthen the Yen’s value against other currencies seen as more risky to invest in.
- Gold rises in risk-on setting, shrugging off robust US data as the US Dollar hits a 12-month low.
- Powell’s dovish remarks keep US Treasury yields stable, pressuring the US Dollar and boosting Gold.
- Focus shifts to upcoming core PCE and job data, crucial for Fed decisions; rate cut prospects bolster Gold.
Gold prices advanced firmly during the North American session on Tuesday amid a risk-on environment and steady US Treasury yields. Investors ignored better-than-expected economic data from the United States (US), failing to underpin the already battered Greenback. The XAU/USD trades at $2,524 and gains over 0.20%.
The financial markets' narrative has remained unchanged since Federal Reserve (Fed) Chair Jerome Powell announced last Friday that the time for lowering interest rates has come. This sent US Treasury bond yields tumbling and the US Dollar to a new 12-month low, levels last seen in July 2023, according to the US Dollar Index (DXY).
The DXY sits at 100.55 and slumps 0.31%, while the US 10-year benchmark note yields 3.829%, virtually unchanged.
American Consumers turned slightly optimistic in August, according to a poll by the US Conference Board (CB). However, traders remain laser-focused on Friday’s release of the core Personal Consumption Expenditures Price Index (PCE), the Fed’s preferred gauge for inflation, along with jobs market data with the Initial Jobless Claims report announced on August 29.
This could be a prelude to the upcoming Nonfarm Payrolls report due to the Fed’s pivot toward worrying about the labor market. The jobs market remains healthy if the number of Americans filing for unemployment claims is lower than estimates. Otherwise, the US Dollar could weaken further, creating a tailwind for Gold prices.
The December 2024 Chicago Board of Trade (CBOT) fed funds future rates contract hints that investors are eyeing 100 basis points of Fed easing this year, up from Monday’s 97. This implies that traders estimate a 50 bps interest rate cut at September’s meeting, though odds for lowering rates of that size lie at 34.5%, according to the CME FedWatch Tool.
Bullion prices received a lifeline from rising tensions in the Middle East. The Israel-Hezbollah conflict escalated over the weekend, and fears that the conflict could broaden would be positive for the golden metal.
Daily digest market movers: Gold price climbs, ignoring Consumer Confidence data
- If US economic data continues to be weak, the Gold price uptrend is likely to persist, fueling speculation about a larger rate cut by the Fed.
- US Conference Board revealed that Consumer Confidence for August came at 103.3, up from July’s upwardly revised 101.9 and exceeded estimates of 100.7.
- Gross Domestic Product (GDP) figures for Q2 in the second estimate are expected to improve from 1.4% to 2.8%.
- On Friday, the Fed’s favorite inflation gauge, the core Personal Consumption Expenditures (PCE) Price Index, will be revealed. It is expected to rise from 2.6% to 2.7% YoY.
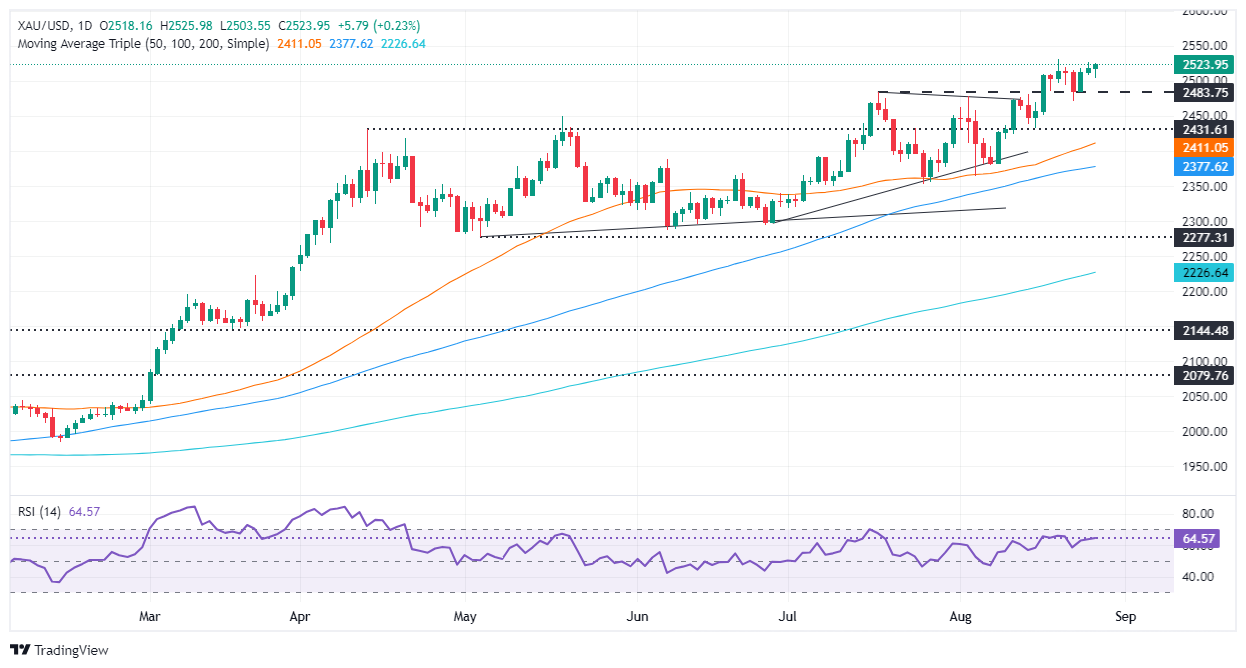
Technical outlook: Gold’s uptrend is intact as buyers eye $2,550
Gold price’s upward bias remains, though price action during the last couple of days shows that traders are reluctant to position themselves ahead of the PCE data release.
From a momentum standpoint, the Relative Strength Index (RSI) is failing to crack its last peak, contrarily to XAU/USD price action, meaning that a negative divergence could be looming.
If XAU/USD slides below the current week’s low of $2,503 and $2,500, this would pave the way for a deeper pullback. The following support would be the July 17 high at $2,483, followed by the $2,450 psychological mark. Further downside is seen at the 50-day Simple Moving Average (SMA) at $2,410, ahead of $2,400.
On the flip side, if bullion prices clear the all-time high (ATH) of $2,531, this could sponsor a leg-up to $2,550 before challenging $2,600.
Gold FAQs
Gold has played a key role in human’s history as it has been widely used as a store of value and medium of exchange. Currently, apart from its shine and usage for jewelry, the precious metal is widely seen as a safe-haven asset, meaning that it is considered a good investment during turbulent times. Gold is also widely seen as a hedge against inflation and against depreciating currencies as it doesn’t rely on any specific issuer or government.
Central banks are the biggest Gold holders. In their aim to support their currencies in turbulent times, central banks tend to diversify their reserves and buy Gold to improve the perceived strength of the economy and the currency. High Gold reserves can be a source of trust for a country’s solvency. Central banks added 1,136 tonnes of Gold worth around $70 billion to their reserves in 2022, according to data from the World Gold Council. This is the highest yearly purchase since records began. Central banks from emerging economies such as China, India and Turkey are quickly increasing their Gold reserves.
Gold has an inverse correlation with the US Dollar and US Treasuries, which are both major reserve and safe-haven assets. When the Dollar depreciates, Gold tends to rise, enabling investors and central banks to diversify their assets in turbulent times. Gold is also inversely correlated with risk assets. A rally in the stock market tends to weaken Gold price, while sell-offs in riskier markets tend to favor the precious metal.
The price can move due to a wide range of factors. Geopolitical instability or fears of a deep recession can quickly make Gold price escalate due to its safe-haven status. As a yield-less asset, Gold tends to rise with lower interest rates, while higher cost of money usually weighs down on the yellow metal. Still, most moves depend on how the US Dollar (USD) behaves as the asset is priced in dollars (XAU/USD). A strong Dollar tends to keep the price of Gold controlled, whereas a weaker Dollar is likely to push Gold prices up.
- The Canadian Dollar eased back on Tuesday, but the US Dollar fell faster.
- Canada remains data-light until Friday’s GDP print.
- Markets are hunkering down until Friday’s US PCE inflation figures.
The Canadian Dollar (CAD) traded with a broadly softer tone on Tuesday, easing back against the majority of its major currency peers, but still found room to move higher against the US Dollar (USD). The Greenback floundered across the board heading into the midweek, dipping into the red and helping to send USD/CAD into a third straight down day.
Canada remains mostly absent from the economic calendar this week until Friday’s Gross Domestic Product (GDP) update for the second quarter. Annualized Q2 GDP is expected to tick down to 1.6% from 1.7%, but markets are likely to be focused entirely on US Personal Consumption Expenditure - Price Index (PCE), which are due to print in the same release window.
Daily digest market movers
- Markets continue to sell the Greenback into the ground as rate cut expectations hold on the high side.
- CAD continues to struggle to find its own momentum and remains at the mercy of broader market flows.
- The Federal Reserve (Fed) pivoting into a dovish stance remains the talk of the town.
- According to the CME’s FedWatch Tool, rate markets are pricing into over 35% odds of a 50 bps rate trim on September 18, with the remainder expecting a quarter-point cut.
- Rate traders expect a total of 100 bps in cuts by the year’s end.
Canadian Dollar price forecast
Despite the Canadian Dollar’s (CAD) unconfident tone on Tuesday, a broadly weakening US Dollar has sent USD/CAD price action into the gutter, extending a decline below 1.3500 and testing six-month lows near 1.3450. The pair has traded into the red for all but four of the last 17 consecutive trading days, tumbling 3.5% peak-to-trough from early August’s peak bids just shy of 1.3950.
A one-sided bearish plunge in USD/CAD chart action has let bids slump directly through the 200-day Exponential Moving Average (EMA) at 1.3628. Sidelined bulls are running out of room to find a foothold before momentum breaks through the low end of early 2024’s congestion zone between 1.3600 and 1.3400.
USD/CAD daily chart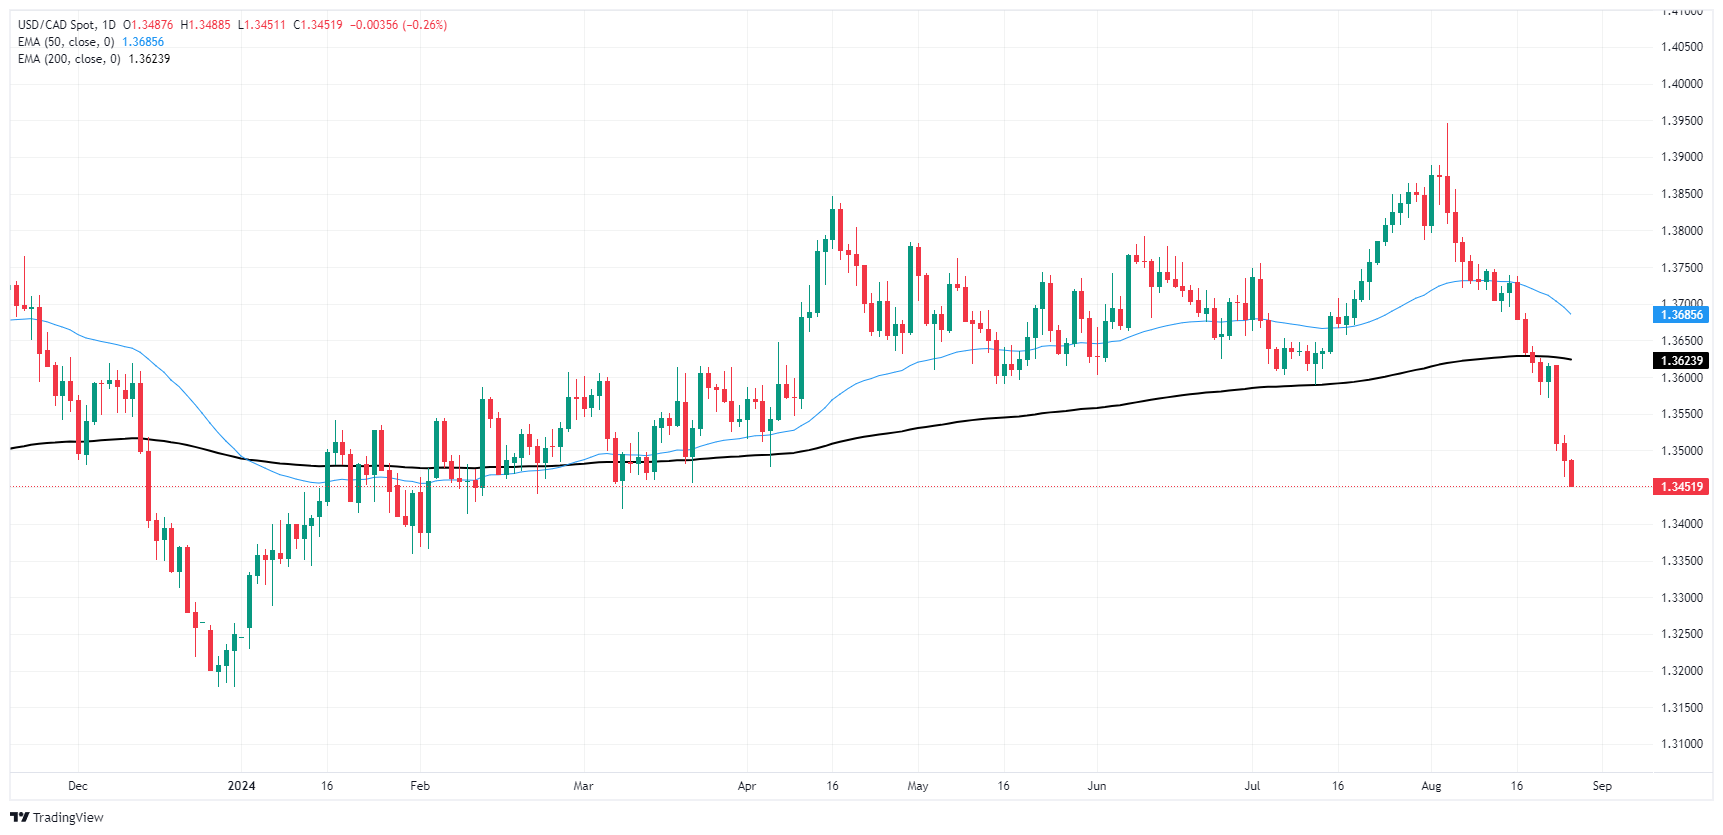
Canadian Dollar FAQs
The key factors driving the Canadian Dollar (CAD) are the level of interest rates set by the Bank of Canada (BoC), the price of Oil, Canada’s largest export, the health of its economy, inflation and the Trade Balance, which is the difference between the value of Canada’s exports versus its imports. Other factors include market sentiment – whether investors are taking on more risky assets (risk-on) or seeking safe-havens (risk-off) – with risk-on being CAD-positive. As its largest trading partner, the health of the US economy is also a key factor influencing the Canadian Dollar.
The Bank of Canada (BoC) has a significant influence on the Canadian Dollar by setting the level of interest rates that banks can lend to one another. This influences the level of interest rates for everyone. The main goal of the BoC is to maintain inflation at 1-3% by adjusting interest rates up or down. Relatively higher interest rates tend to be positive for the CAD. The Bank of Canada can also use quantitative easing and tightening to influence credit conditions, with the former CAD-negative and the latter CAD-positive.
The price of Oil is a key factor impacting the value of the Canadian Dollar. Petroleum is Canada’s biggest export, so Oil price tends to have an immediate impact on the CAD value. Generally, if Oil price rises CAD also goes up, as aggregate demand for the currency increases. The opposite is the case if the price of Oil falls. Higher Oil prices also tend to result in a greater likelihood of a positive Trade Balance, which is also supportive of the CAD.
While inflation had always traditionally been thought of as a negative factor for a currency since it lowers the value of money, the opposite has actually been the case in modern times with the relaxation of cross-border capital controls. Higher inflation tends to lead central banks to put up interest rates which attracts more capital inflows from global investors seeking a lucrative place to keep their money. This increases demand for the local currency, which in Canada’s case is the Canadian Dollar.
Macroeconomic data releases gauge the health of the economy and can have an impact on the Canadian Dollar. Indicators such as GDP, Manufacturing and Services PMIs, employment, and consumer sentiment surveys can all influence the direction of the CAD. A strong economy is good for the Canadian Dollar. Not only does it attract more foreign investment but it may encourage the Bank of Canada to put up interest rates, leading to a stronger currency. If economic data is weak, however, the CAD is likely to fall.
- The Dow Jones index softened on Tuesday after reaching fresh record highs this week.
- Mixed housing figures gave markets little to chew on as traders await rate cuts.
- US PCE print due at the end of the week marks a critical read on inflation.
The Dow Jones Industrial Average (DJIA) was softer on Tuesday, testing the lower side of the day’s opening bids after clipping into a fresh record high at the outset of the trading week. Market action on the Dow Jones has pulled into the midrange with market bets of a Federal Reserve (Fed) rate cut in September fully priced in. The long wait to the next Fed rate call will be filled with grappling over whether it will be 25 bps or 50.
Fed Chair Jerome Powell all but confirmed that the central bank will pivot into a rate-cutting cycle on September 18 during an appearance at the Jackson Hole Economic Symposium last Friday, sending market appetite into the ceiling and pinning equities into a fresh bullish bid.
Mixed prints in US housing price data from June gave investors little to go on. The Federal Housing Finance Agency’s MoM Housing Price Index contracted -0.1% compared to May’s print of 0.0%. Markets expected a print of 0.2%. The S&P/Case-Shiller Home Price Indices, meanwhile, rose 6.5% YoY, less than the previous period’s revised 6.9%, but still more than the expected 6.0%.
US Q2 Gross Domestic Product (GDP) figures are slated to print on Thursday, and are expected to hold steady at 2.8% on an annualized basis. However, the key data print this week will be Friday’s US Personal Consumption Expenditure (PCE) Price Index inflation reading for July, which is expected to tick higher YoY to 2.7% from 2.6% and hold flat at 0.2% MoM. Market participants absolutely giddy over hopes for rate cuts will be looking for inflation data to come in below expectations, while an above-forecast print could send fresh jitters through investor risk appetite.
Dow Jones news
Despite an overall softer tone on Tuesday, the Dow Jones is roughly on-balance heading into the midweek. Half of the DJIA board is in the green, with the other half easing back slightly. Nike (NKE) rose 1.1% to $85.20 per share, while Amazon (AMZN) backslid 1.08% to $173.61 per share.
Dow Jones price forecast
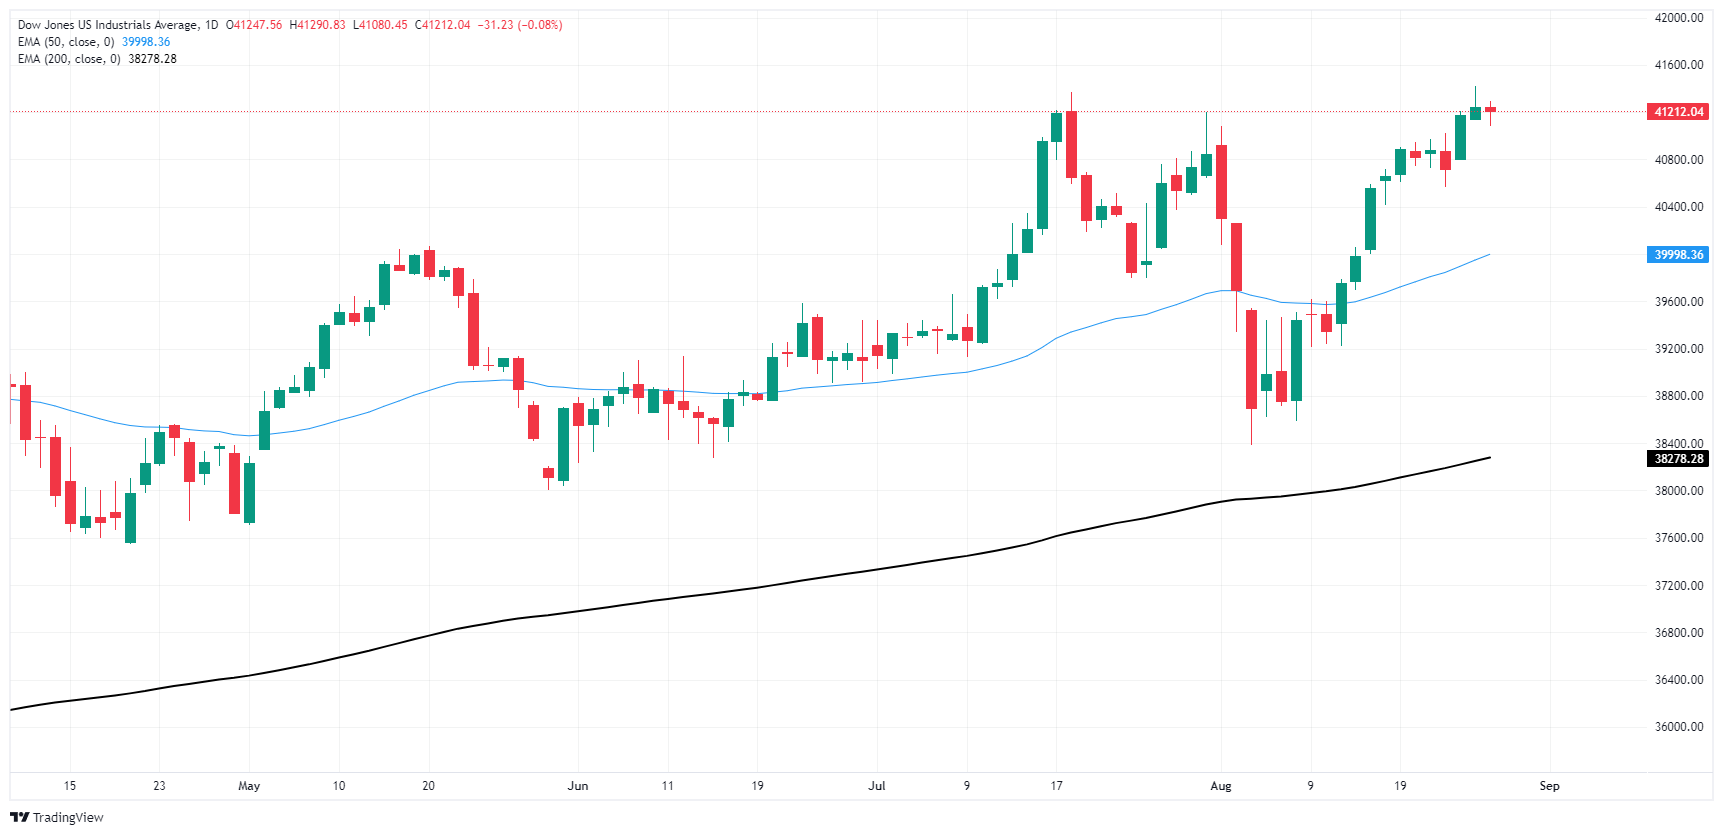
The Dow Jones is trading flat on Tuesday, with some early exploration into the downside. The major equity index tested lower, but still remains well-bid above 41,000.00 and is sticking close to record highs set this week at 41,419.65.
The next immediate roadblock for bidders hopeful to re-establish bullish momentum will be a firm break of the 41,500.00 round number barrier. Despite a potential slowdown forming on the daily candlesticks, short sellers will have their work cut out for them trying to drag price action down to the nearest meaningful technical barrier at the 50-day Exponential Moving Average (EMA) rising into the 40,000.00 major handle.
Dow Jones daily chart
Dow Jones FAQs
The Dow Jones Industrial Average, one of the oldest stock market indices in the world, is compiled of the 30 most traded stocks in the US. The index is price-weighted rather than weighted by capitalization. It is calculated by summing the prices of the constituent stocks and dividing them by a factor, currently 0.152. The index was founded by Charles Dow, who also founded the Wall Street Journal. In later years it has been criticized for not being broadly representative enough because it only tracks 30 conglomerates, unlike broader indices such as the S&P 500.
Many different factors drive the Dow Jones Industrial Average (DJIA). The aggregate performance of the component companies revealed in quarterly company earnings reports is the main one. US and global macroeconomic data also contributes as it impacts on investor sentiment. The level of interest rates, set by the Federal Reserve (Fed), also influences the DJIA as it affects the cost of credit, on which many corporations are heavily reliant. Therefore, inflation can be a major driver as well as other metrics which impact the Fed decisions.
Dow Theory is a method for identifying the primary trend of the stock market developed by Charles Dow. A key step is to compare the direction of the Dow Jones Industrial Average (DJIA) and the Dow Jones Transportation Average (DJTA) and only follow trends where both are moving in the same direction. Volume is a confirmatory criteria. The theory uses elements of peak and trough analysis. Dow’s theory posits three trend phases: accumulation, when smart money starts buying or selling; public participation, when the wider public joins in; and distribution, when the smart money exits.
There are a number of ways to trade the DJIA. One is to use ETFs which allow investors to trade the DJIA as a single security, rather than having to buy shares in all 30 constituent companies. A leading example is the SPDR Dow Jones Industrial Average ETF (DIA). DJIA futures contracts enable traders to speculate on the future value of the index and Options provide the right, but not the obligation, to buy or sell the index at a predetermined price in the future. Mutual funds enable investors to buy a share of a diversified portfolio of DJIA stocks thus providing exposure to the overall index.
- Mexican Peso plunges as fears of judicial reforms by Congress spark foreign investor sell-off.
- Political tension escalates after President Lopez Obrador halts ties with US Embassy over reform critiques.
- Trade data overlooked; smaller-than-expected trade deficit eclipsed by political focus.
The Mexican Peso tumbled sharply, sparked by foreign investors' fears that the upcoming Mexican Congress could approve the judiciary reform. Nevertheless, a commission of deputies approved the ruling on the reform, which is expected to be voted on once the new Congress takes office on September 1. This sparked fears among investors, which ditched the Mexican Peso as the USD/MXN trades at 19.64, posting gains of over 1.20%.
Mexico’s economic docket revealed that the Balance of Trade printed a deficit of $-0.072 billion, less than the $-1.35 billion expected by most analysts. However, analysts ignored this, remaining eyed on Mexico’s political developments.
The USD/MXN rose sharply after newswires revealed that Mexico’s President Andres Manuel Lopez Obrador said there is a “pause” in their relationship with the US Embassy after the Ambassador commented on proposed judicial reform.
On August 22, US Ambassador Ken Salazar said, “Based on my lifelong experience supporting the rule of law, I believe that the direct election of judges represents a major risk to the functioning of Mexico’s democracy. Any judicial reform must have safeguards that guarantee that the judiciary is strengthened and not subject to the corruption of politics.”
The Canadian Ambassador to Mexico, Graeme C. Clark, echoed some of his comments during the Mexico-Canada business forum. Clark commented that the reform has raised doubts about the stability of the legal framework in Mexico, which is essential to maintaining the confidence of foreign investors.
Across the border, the US economic docket featured the Conference Board (CB) Consumer Confidence for August, which was expected to deteriorate from 101.9 in July to 100.7, according to analysts. Nevertheless, consumers grew more optimistic about the US economy, with the index rising to 103.3.
This boosted the Greenback against most emerging market FX currencies, even though Federal Reserve (Fed) Chair Jerome Powell gave the green light last week to begin reducing interest rates. This hurt the Greenback’s prospects against most G7 FX currencies, but the US Dollar continues gathering steam over the Mexican Peso.
Daily digest market movers: Mexican Peso depreciates also on geopolitical risks
- Another driver that pressures the Peso was the escalation of the Israel-Hezbollah conflict in the Middle East.
- Traders will eye Fed speakers, the release of US Q2’s 2024 GDP, and the Fed’s preferred inflation gauge, the Core Personal Consumption Expenditures Price Index (PCE).
- Data from the Chicago Board of Trade (CBOT) suggests the Fed will cut at least 100 basis points (bps), according to the fed funds rate futures contract for December 2024.
Technical outlook: Mexican Peso weakens as USD/MXN hits 19.70
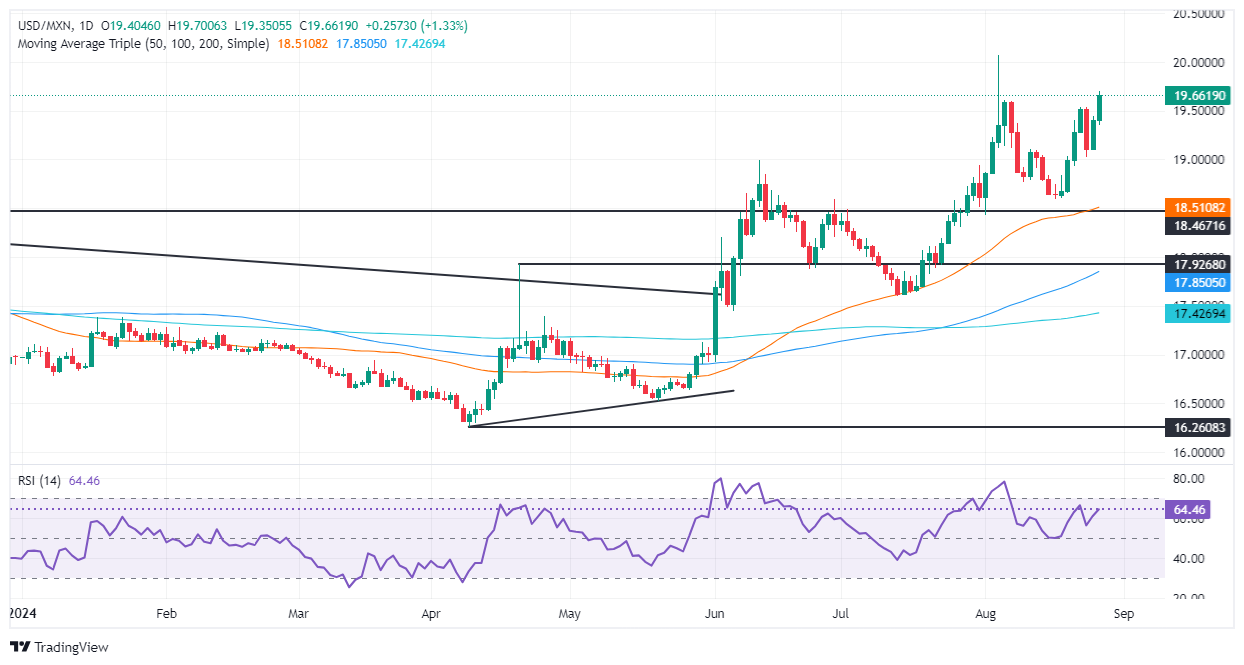
The USD/MXN uptrend remains in place, with buyers gaining momentum as the exotic pair reached a two-week peak of 19.70, a level last hit on August 5. The Relative Strength Index (RSI) hints that bulls are in charge, which means the pair could aim higher.
If USD/MXN clears 19.70, the next resistance would be the 20.00 figure, followed by the current year-to-date (YTD) high at 20.22. Once cleared, further gains are seen, with the 20.50 supply area up next.
Conversely, if USD/MXN tumbles below 19.50, this could expose the 19.00 figure. A breach of the latter and further losses are expected, with the following support being the August 19 low of 18.59, followed by the 50-day Simple Moving Average (SMA) at 18.48.
Mexican Peso FAQs
The Mexican Peso (MXN) is the most traded currency among its Latin American peers. Its value is broadly determined by the performance of the Mexican economy, the country’s central bank’s policy, the amount of foreign investment in the country and even the levels of remittances sent by Mexicans who live abroad, particularly in the United States. Geopolitical trends can also move MXN: for example, the process of nearshoring – or the decision by some firms to relocate manufacturing capacity and supply chains closer to their home countries – is also seen as a catalyst for the Mexican currency as the country is considered a key manufacturing hub in the American continent. Another catalyst for MXN is Oil prices as Mexico is a key exporter of the commodity.
The main objective of Mexico’s central bank, also known as Banxico, is to maintain inflation at low and stable levels (at or close to its target of 3%, the midpoint in a tolerance band of between 2% and 4%). To this end, the bank sets an appropriate level of interest rates. When inflation is too high, Banxico will attempt to tame it by raising interest rates, making it more expensive for households and businesses to borrow money, thus cooling demand and the overall economy. Higher interest rates are generally positive for the Mexican Peso (MXN) as they lead to higher yields, making the country a more attractive place for investors. On the contrary, lower interest rates tend to weaken MXN.
Macroeconomic data releases are key to assess the state of the economy and can have an impact on the Mexican Peso (MXN) valuation. A strong Mexican economy, based on high economic growth, low unemployment and high confidence is good for MXN. Not only does it attract more foreign investment but it may encourage the Bank of Mexico (Banxico) to increase interest rates, particularly if this strength comes together with elevated inflation. However, if economic data is weak, MXN is likely to depreciate.
As an emerging-market currency, the Mexican Peso (MXN) tends to strive during risk-on periods, or when investors perceive that broader market risks are low and thus are eager to engage with investments that carry a higher risk. Conversely, MXN tends to weaken at times of market turbulence or economic uncertainty as investors tend to sell higher-risk assets and flee to the more-stable safe havens.
There was no joy for the Greenback on Tuesday, as sellers regained control amidst a generalized absence of fervour among market participants prior to the release of key US data later in the week. The British pound outperformed its peers of the risk-linked galaxy on the back of a persistently restrictive stance from the BoE.
Here is what you need to know on Wednesday, August 28:
The US Dollar Index (DXY) rapidly left behind Monday’s advance and refocused on the downside, where recent YTD lows sit. The MBA’s weekly Mortgage Applications results are due on August 28, seconded by the EIA’s report on US crude oil inventories and the speech by FOMC’s Waller.
EUR/USD regained upside traction and partially faded the negative start to the week. On August 28, the ECB will publish its M3 Money Supply figures along with Loans to Companies and Loans to Households data.
GBP/USD rose to more than two-year highs near 1.3250, backed by expectations that the BoE would not reduce rates as much as markets anticipated this year. There will be no data releases across the Channel on August 28.
USD/JPY maintained the downtrend well in place and challenged once again the key support at 144.00. The final Coincident Index and Leading Economic Index will come on August 28.
AUD/USD maintained its business in the area of recent peaks, although a test or surpass of the 0.6800 barrier remained elusive. The RBA’s Monthly CPI Indicator is due on August 28.
WTI retreated sharply and left behind three consecutive days of gains on the back of renewed demand concerns and some profit-taking in light of the recent pronounced rebound.
Prices of Gold alternated gains with losses above the $2,500 region per ounce troy amidst investors’ prudence prior to the US PCE release. Silver prices rose slightly and remained near the $30.00 mark per ounce.
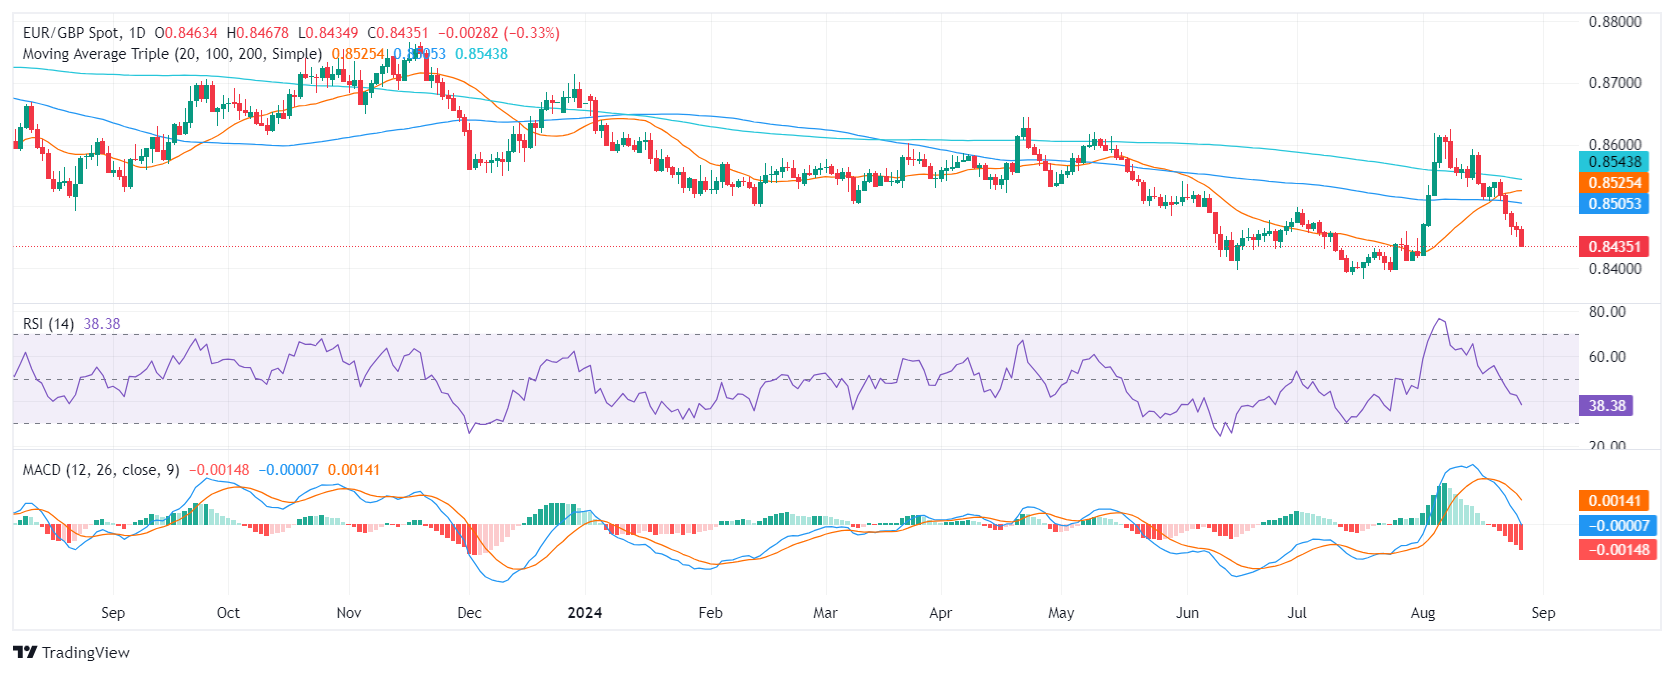
- EUR/GBP maintains its downtrend, targetting support at 0.8450.
- RSI and MACD indicators suggest increasing bearish momentum.
- Buyers must defend the 0.8400-0.8450 range to avoid declined.
In Tuesday's session, the EUR/GBP pair extended its losses,0.30% down to 0.8440, reflecting a dominant outlook by the sellers. The pair has been extending its losing streak to six consecutive sessions. The technical indicators continue to align with the bearish trend, hinting at further declines below 0.8450.
The Relative Strength Index (RSI), an indicator that gauges market momentum has retreated to 40, indicating a waning buying pressure. The Moving Average Convergence Divergence (MACD), displays rising red bars, signaling an increase in bearish momentum. This convergence of indicators points to a likely continuation of the downtrend.
With indicators marching towards oversold conditions, the pair might see a slight upward correction, but the outlook has turned bearish at least for the short term. For the next sessions, the movements will be determined by whether the cross sustains the 0.8400-0.8450 area.
EUR/GBP Daily chart
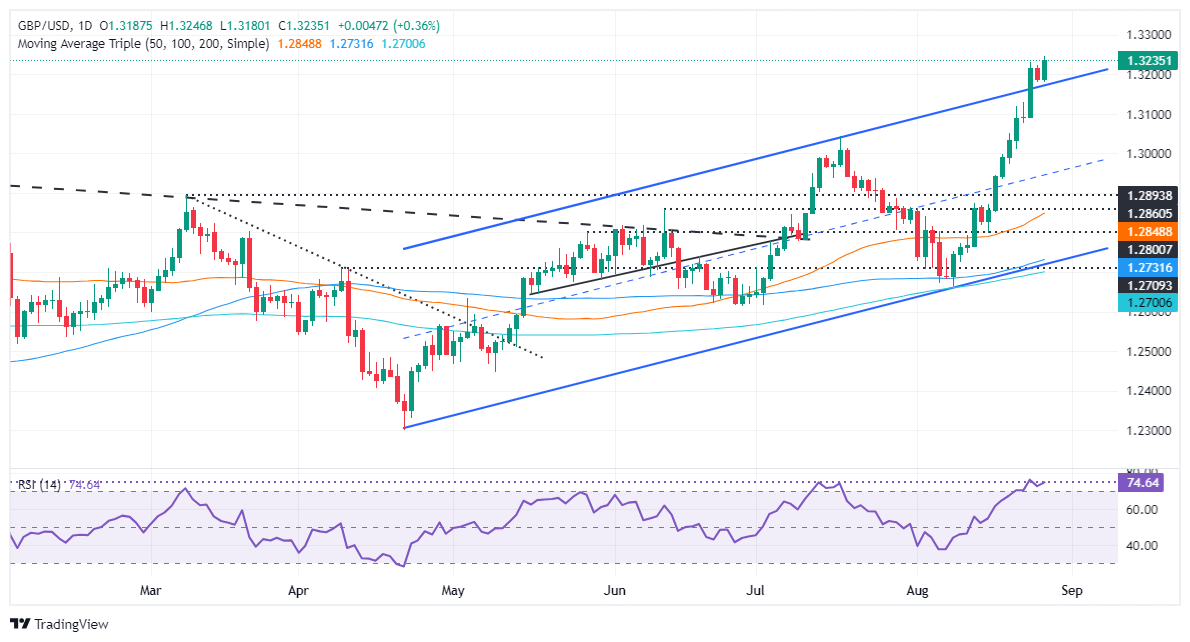
- GBP/USD uptrend remains intact as long as it stays above 1.3043.
- If buyers reclaim 1.3298, that will expose March 2022 peak at 1.3437.
- A dip below 1.3200 will expose further support levels, like August 22, 1.3130 and the 1.3100 figure.
The Pound Sterling extended its gains and refreshed multi-year highs at around 1.3246 on Tuesday as the Greenback failed to recover following a surprisingly dovish tilt by Fed Chair Jerome Powell at his Jackson Hole speech. Investors increased their bets that the US central bank will lower rates at the September meeting, a tailwind for the GBP/USD. The pair exchanged hands at 1.3239 and is up by 0.40%.
GBP/USD Price Forecast: Technical outlook
The uptrend in the GBP/USD continues even though the Relative Strength Index (RSI) is overbought, which could cap the pair’s advance higher. Nevertheless, reclaiming the top trendline of an ascending channel could put into play the test of the March 22, 2022, peak at 1.3298 before challenging higher prices.
In that outcome, the GBP/USD's next resistance would be 1.3300. Once surpassed, the March 1, 2022, daily high would emerge at 1.3437.
Conversely, a dip below 1.3200 can send the GBP/USD towards the August 22 high at 1.3130 ahead of 1.3100. On further weakness, the next support would be the July 17 peak turned support at 1.3044.
GBP/USD Price Action – Daily Chart
British Pound PRICE Today
The table below shows the percentage change of British Pound (GBP) against listed major currencies today. British Pound was the strongest against the US Dollar.
| USD | EUR | GBP | JPY | CAD | AUD | NZD | CHF | |
|---|---|---|---|---|---|---|---|---|
| USD | -0.08% | -0.38% | -0.17% | -0.27% | -0.18% | -0.50% | -0.47% | |
| EUR | 0.08% | -0.30% | -0.10% | -0.20% | -0.09% | -0.45% | -0.40% | |
| GBP | 0.38% | 0.30% | 0.21% | 0.12% | 0.21% | -0.13% | -0.09% | |
| JPY | 0.17% | 0.10% | -0.21% | -0.08% | 0.00% | -0.34% | -0.30% | |
| CAD | 0.27% | 0.20% | -0.12% | 0.08% | 0.09% | -0.25% | -0.20% | |
| AUD | 0.18% | 0.09% | -0.21% | -0.01% | -0.09% | -0.35% | -0.30% | |
| NZD | 0.50% | 0.45% | 0.13% | 0.34% | 0.25% | 0.35% | 0.03% | |
| CHF | 0.47% | 0.40% | 0.09% | 0.30% | 0.20% | 0.30% | -0.03% |
The heat map shows percentage changes of major currencies against each other. The base currency is picked from the left column, while the quote currency is picked from the top row. For example, if you pick the British Pound from the left column and move along the horizontal line to the US Dollar, the percentage change displayed in the box will represent GBP (base)/USD (quote).
The Pound Sterling pushed higher to near 1.3250 in overnight trade before easing back, Scotiabank’s Chief FX Strategist Shaun Osborne notes
Cable is at risk of testing trend support 1.3200/05
“UK Gilts are underperforming moderately, giving the pound some modest yield support but the steady ramp up in Cable from the start of Asian trade suggests a buy program was behind the gains rather than anything fundamental. The BRC’s Shop Price Index fell in Y/Y terms (-0.3%) for the first time in close to three years, suggesting easing inflationary UK pressures.”
“GBP’s bull trend remains resilient after overnight gains extended to the mid-1.32s. The drift off the high is starting to look a minor negative for the pound, however, and suggests Cable is at risk of slipping back a little more intraday now to test trend support 1.3200/05. Support below here sits at 1.3125.
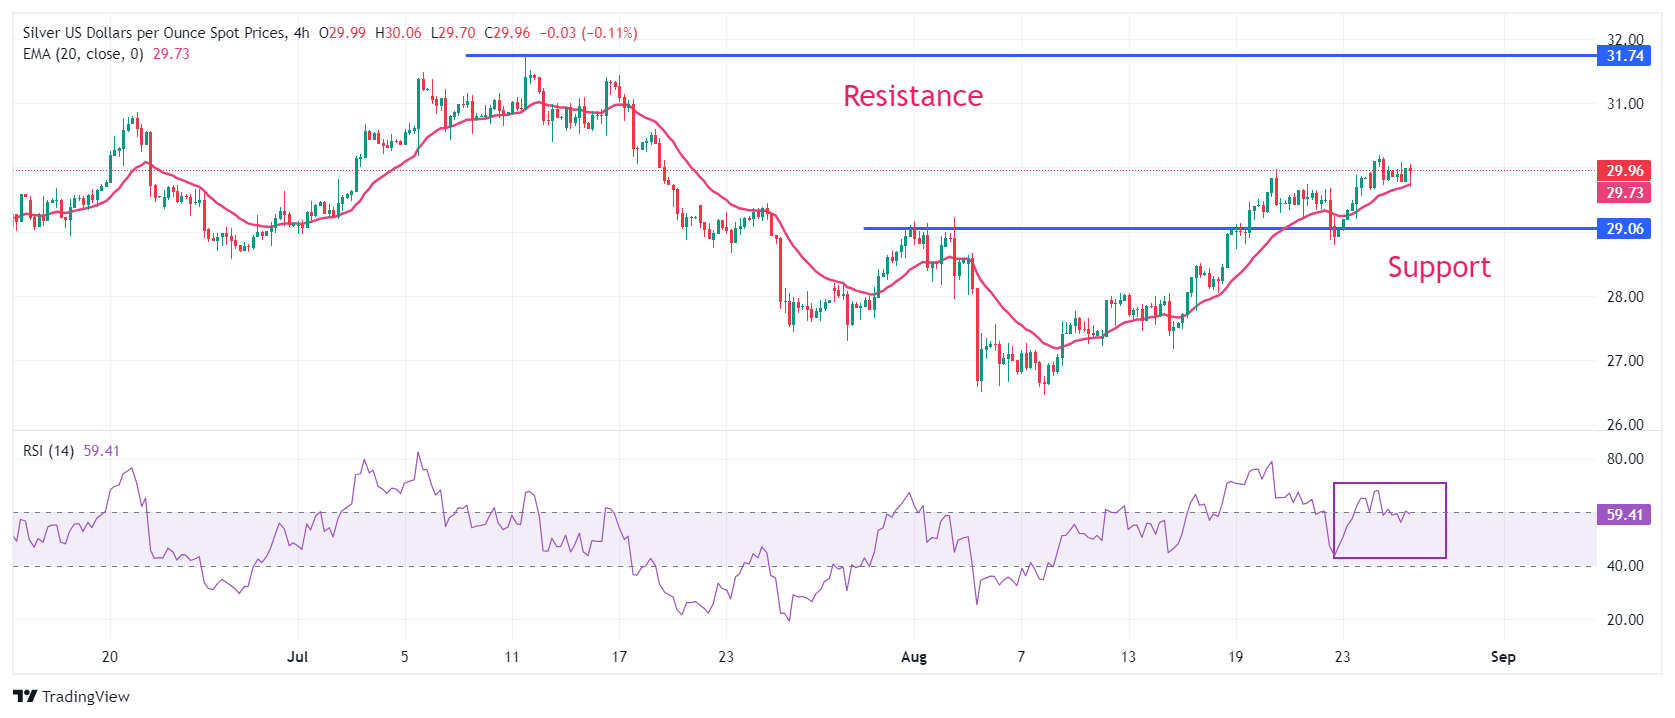
- Silver price faces pressures in extending its upside above $30.00 as US bond yields surge.
- The Fed seems prepared to cut interest rates in September.
- Investors keenly await the US core PCE inflation data for July.
Silver price (XAG/USD) struggles to extend its upside above the psychological resistance of $30.00 in Tuesday’s New York session. The near-term outlook of the white metal remains upbeat as the Federal Reserve (Fed) is widely anticipated to start reducing interest rates from the September meeting. While investors seek clarity over the likely size by which the Fed will cut its key borrowing rates.
According to the CME FedWatch tool, 30-day Federal Funds Futures pricing data shows that the probability of a 50-basis points (bps) interest rate reduction in September is 28.5%, while rest are favoring a cut by 25 bps.
Meanwhile, San Francisco Fed Bank President Mary Daly supported a quarter-to-a-percentage interest rate cut in September in her interview with Bloomberg on Monday. However, she kept doors open for a bigger one if the labor market deteriorates.
Firm optimism for Fed interest rate cuts in September continues to weigh on the US Dollar and bond yields. The US Dollar Index (DXY), which tracks the Greenback’s value against six major currencies, sees more downside below the year-to-date (YTD) low of 100.53. 10-year US Treasury yields jump to near 3.86% amid caution ahead of the United States (US) core Personal Consumption Expenditure Price Index (PCE) data for July, which will be published on Friday.
Generally, higher yields on interest-bearing assets bode poorly for non-yielding assets, such as Silver, given that they reduce the opportunity cost of holding an investment in them.
Silver technical analysis
Silver price bounced back strongly after discovering firm buying interest near the August 1 high of $29.16 in a four-hour timeframe. The white metal is expected to extend its upside towards July 11 high of $31.75. Upward-sloping 20-day Exponential Moving Average (EMA) near $29.70 warrants more upside.
The 14-period Relative Strength Index (RSI) oscillates in the bullish range of 60.00-80.00, indicating a strong upside momentum.
Silver four-hour chart
Silver FAQs
Silver is a precious metal highly traded among investors. It has been historically used as a store of value and a medium of exchange. Although less popular than Gold, traders may turn to Silver to diversify their investment portfolio, for its intrinsic value or as a potential hedge during high-inflation periods. Investors can buy physical Silver, in coins or in bars, or trade it through vehicles such as Exchange Traded Funds, which track its price on international markets.
Silver prices can move due to a wide range of factors. Geopolitical instability or fears of a deep recession can make Silver price escalate due to its safe-haven status, although to a lesser extent than Gold's. As a yieldless asset, Silver tends to rise with lower interest rates. Its moves also depend on how the US Dollar (USD) behaves as the asset is priced in dollars (XAG/USD). A strong Dollar tends to keep the price of Silver at bay, whereas a weaker Dollar is likely to propel prices up. Other factors such as investment demand, mining supply – Silver is much more abundant than Gold – and recycling rates can also affect prices.
Silver is widely used in industry, particularly in sectors such as electronics or solar energy, as it has one of the highest electric conductivity of all metals – more than Copper and Gold. A surge in demand can increase prices, while a decline tends to lower them. Dynamics in the US, Chinese and Indian economies can also contribute to price swings: for the US and particularly China, their big industrial sectors use Silver in various processes; in India, consumers’ demand for the precious metal for jewellery also plays a key role in setting prices.
Silver prices tend to follow Gold's moves. When Gold prices rise, Silver typically follows suit, as their status as safe-haven assets is similar. The Gold/Silver ratio, which shows the number of ounces of Silver needed to equal the value of one ounce of Gold, may help to determine the relative valuation between both metals. Some investors may consider a high ratio as an indicator that Silver is undervalued, or Gold is overvalued. On the contrary, a low ratio might suggest that Gold is undervalued relative to Silver.
The Aluminium price recorded the strongest increase among the LME metals last week, rising by 7.5% compared to the previous week. It was not only the hope of rapid interest rate cuts in the US that provided a boost, Commerzbank’s commodity analyst Barbara Lambrecht notes.
Aluminium prices are falling slightly again today
“There were also concerns on the supply side after the futures price for alumina, the intermediate product between bauxite and refined Aluminium, rose significantly on the Shanghai Future Exchange due to a sharp decline in inventories registered on the SHFE. At the end of last year and then again in May, a sharp rise in the price of alumina had already driven Aluminium prices up sharply. However, prices on the alumina market quickly fell again at the time, and the LME price also fell as a result. In fact, alumina prices have already fallen again somewhat this time too.”
“Even though we generally consider Aluminium to be well supported, as capacities at the main supplier China are only being expanded slightly and at the same time the medium-term demand prospects are positive because the metal is in demand during the transformation process, we believe that prices have risen a little too quickly in recent days and that the upside potential has now been exhausted in the short term. After trading on the LME was closed yesterday, Aluminium prices are falling slightly again today.”
- CB Consumer Confidence edged higher to 103.3 in August.
- US Dollar Index stays in daily range below 101.00.
Consumer sentiment in the US continued to improve in August, with The Conference Board's (CB) Consumer Confidence Index rising to 103.3 from 101.9 (revised from 100.3) in July.
The Present Situation Index rose to 134.4 from 133.1 in the same period, while the Expectations Index edged higher to 82.5 from 81.1.
Assessing the survey's findings, "consumers continued to express mixed feelings in August," noted Dana M. Peterson, Chief Economist at The Conference Board. "Compared to July, they were more positive about business conditions, both current and future, but also more concerned about the labor market."
Market reaction
This data doesn't seem to be having a significant impact on the US Dollar's valuation. At the time of press, the US Dollar Index was down 0.1% on the day at 100.75.
The Fed is in all likelihood going to cut rates in the next few weeks and everyone knows it, TDS Senior Commodity Strategist Daniel Ghali notes. This scenario is favoring Gold, but chances of a correction are increasing day by day, he says.
Downside risks for Gold are more potent
“Our gauge of macro fund positioning in Gold is now at the highest levels recorded in the depths of the pandemic. This red flag marked the local highs set in Sep 2019, and previously in Jul 2016. Symmetrically, extreme short positioning from this cohort marked the lows in 2018 and 2022.”
“This time around, CTAs are also max long and Shanghai traders' net length has also inched towards record highs. Algos are also vulnerable in silver, with most scenarios for prices pointing to selling activity on the horizon, barring a break north of $31.5/oz.”
“This set-up is the antithesis to the early-year dichotomy in positioning that helped to propel Gold on its trajectory towards current all-time highs. Downside risks are now more potent. The ship is crowded. In fact, it has scarcely been as crowded as it is today. Do you have a slot secured on the lifeboat?”
- EUR/GBP extends its losing spree as the ECB seems prepared to cut interest rates again in September.
- The BoE is expected to follow a gradual interest rate cut approach.
- Investors await the flash Eurozone HICP data for August.
The EUR/GBP pair extends its losing spree for the fifth trading session on Tuesday. The cross weakens as the Pound Sterling (GBP) strengthens on expectations that the process of policy-easing by the Bank of England (BoE) in the remaining year would be slower than other central bankers from its major peers.
BoE Governor Andrew Bailey said the central bank would "be careful not to cut interest rates too quickly or by too much" in his speech at the Jackson Hole (JH) Symposium on Friday.
The BoE announced its first-ever interest rate cut on August 1, ending its two-and-a-half year-long restrictive monetary policy stance, as officials gained confidence that price pressures will return to the bank’s target of 2% sustainably.
Currently, financial markets expect that the BoE will deliver one more interest rate cut this year. The reasoning behind a shallow BoE policy-easing cycle is the improving United Kingdom’s (UK) economic outlook.
The economic outlook of the UK economy improved after flash S&P Global/CIPS PMI showed that activities in the manufacturing and the service sector rose at a faster-than-expected pace in August.
On the Eurozone front, the Euro (EUR) underperforms as investors seem confident that the European Central Bank (ECB) will cut interest rates again in the September meeting. Easing price pressures in the shared currency region and uncertain economic outlook have prompted ECB rate cut expectations.
For fresh interest rate cues, investors await the Eurozone flash Harmonized Index of Consumer Prices (HICP) data for August, which will be published on Friday.
Economic Indicator
Core Harmonized Index of Consumer Prices (YoY)
The Core Harmonized Index of Consumer Prices (HICP) measures changes in the prices of a representative basket of goods and services in the European Monetary Union. The HICP, – released by Eurostat on a monthly basis, is harmonized because the same methodology is used across all member states and their contribution is weighted. The YoY reading compares prices in the reference month to a year earlier. Core HICP excludes volatile components like food, energy, alcohol, and tobacco. The Core HICP is a key indicator to measure inflation and changes in purchasing trends. Generally, a high reading is seen as bullish for the Euro (EUR), while a low reading is seen as bearish.
Read more.Next release: Fri Aug 30, 2024 09:00 (Prel)
Frequency: Monthly
Consensus: 2.8%
Previous: 2.9%
Source: Eurostat
EUR/USD is steady as markets consolidate recent gains, Scotiabank’s Chief FX Strategist Shaun Osborne notes.
EUR consolidates in upper 1.11s
“Final Q2 German GDP data was unchanged from the preliminary report (-0.1% Q/Q) as weak consumption and investment exert a drag on growth. The ECB’s Knot and Nagel speak today.”
“Minor EUR drift from the 1.12 peak may be no more than a pause (potential bull flag) in the EUR’s still strong uptrend. RSI oscillators are signaling that the EUR is somewhat overbought but the strength of the trend higher in spot in the past four weeks or so confers a good deal of protection against counter trend corrections for now.”
“Minor support is 1.1150. Stronger support intraday sits at 1.1105/10.”
In a political dispute with the government in the west, the government in the east of the country has imposed an oil production and export freeze, Commerzbank’s commodity strategist Barbara Lambrecht notes.
The risk of a long-term shortfall is reduced
“Most of the country's oil production facilities and export terminals, which recently produced around 1.1 million barrels per day and primarily supplies the European market, are located in the east. A smaller oil field with a daily production of 70,000 barrels has already been shut down, according to informed sources.”
“The fact that the market has so far only reacted with limited alarm to the order is probably due to the fact that Libyan production has often been subject to strong short-term fluctuations due to the country's political instability. However, the country is strongly dependent on income from oil sales, which reduces the risk of a long-term shortfall.”
- The US Dollar Index has touched down on a key support level at the 100 mark.
- This has historically provided a springboard for a recovery, however, it is too early to say whether history will repeat itself.
The US Dollar Index (DXY) is in a medium and long-term sideways trend within a multi-year range. Since late July it has been steadily unfolding a down leg within that range from the ceiling at around 105, to the range floor at the 100 level.
100 is important. Apart from being a key psychological level, 100 is also a major historical support level which has provided a safety net to falling prices on three prior occasions since 2023 (circled below). The question is, will 100 come to the rescue again on this occasion?
US Dollar Index Daily Chart
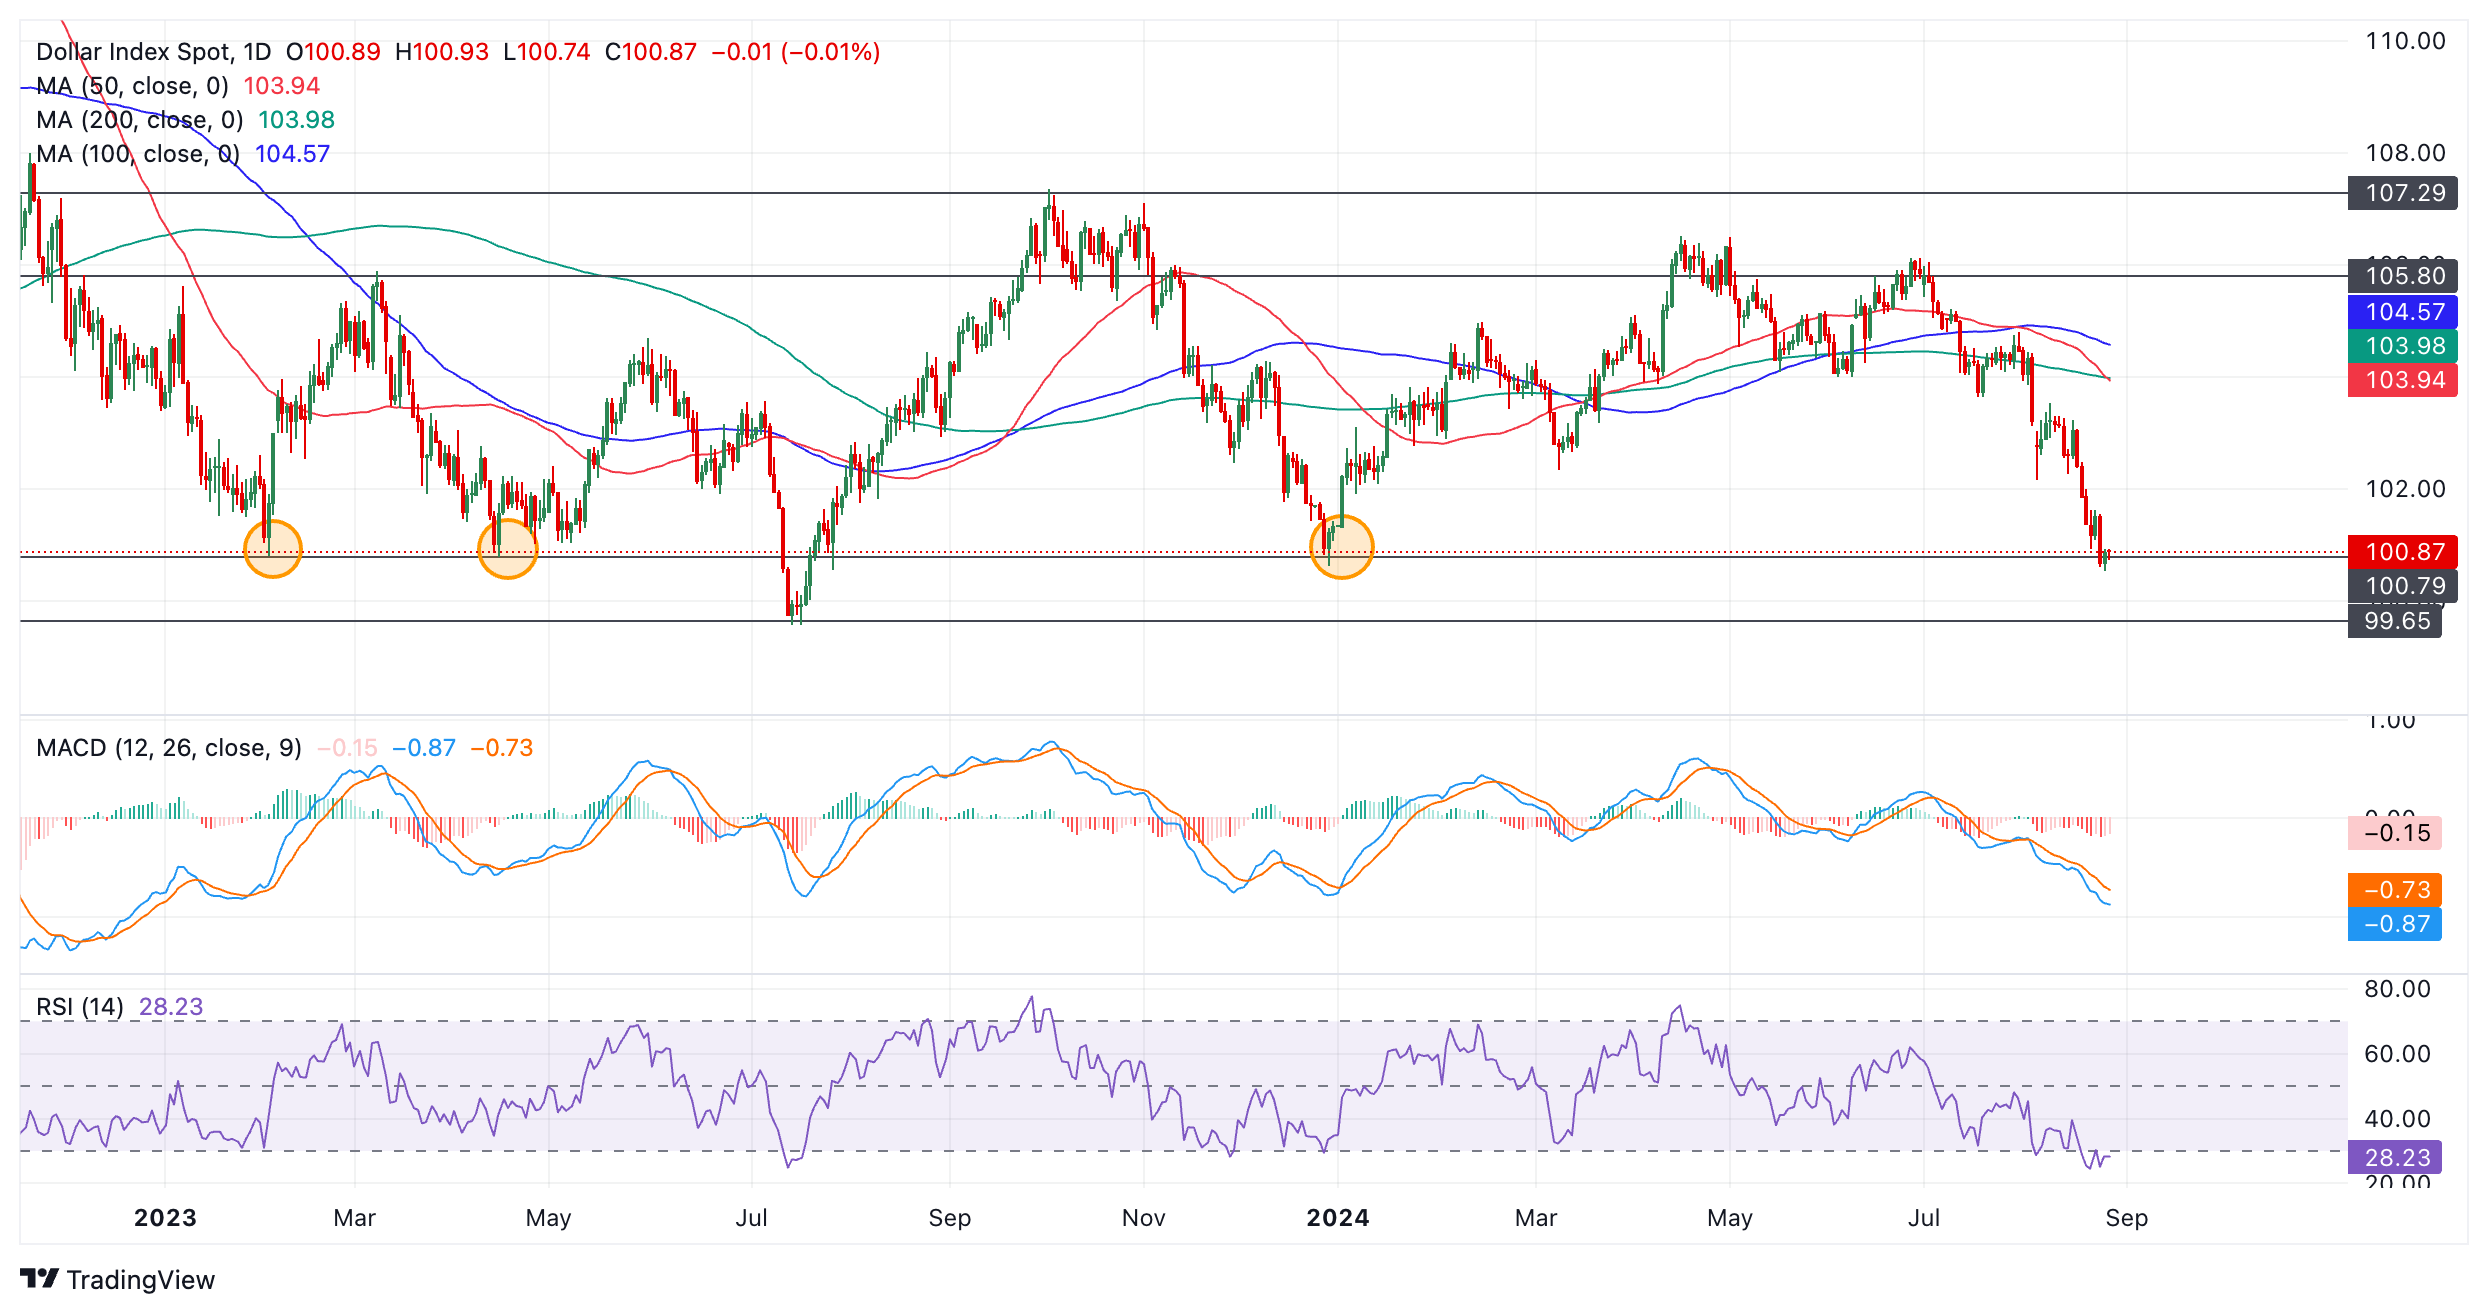
Price action is still bearish and there are no strong bullish reversal patterns forming – neither of the shape or the candlestick variety. This suggests a risk of more downside. A continuation south would probably see DXY reach the next support level at the 99.57, the July 2023 low. This is the lowest floor of the range – a decisive break below there would be a very bearish sign.
The Relative Strength Index (RSI) momentum indicator is oversold on both the daily chart and weekly chart (not shown). This suggests prices are overextended to the downside and there is a greater risk of a pull back occurring.
However, RSI has not yet exited the oversold zone, a necessary prerequisite for a buy signal. As things stand, the fact the RSI is oversold is merely a warning for bears not to add to their short positions, it would have to fully rise out of oversold to provide a reversal signal.
The Moving Average Convergence Divergence (MACD) momentum oscillator has not crossed above its red signal line yet either. This too would be required to provide a buy signal.
To conclude, there is a risk that although the US Dollar Index has reached a historic low it could simply continue falling unless price action forms a reversal pattern or momentum indicators provide firm buy signals.
Oil prices rose by more than 2% on Friday, significantly limiting the previous weekly losses, Commerzbank’s commodity strategist Carsten Fritsch notes.
OPEC+ production increase from October still on the table
“The rally was linked to comments from Fed Chairman Jerome Powell, who opened the door to interest rate cuts by the Fed from September in his speech at Jackson Hole. This boosted sentiment in the financial markets, which also impacted the oil market. Oil prices rose at the start of the new trading week as Israel and the Hezbollah militia exchanged fire over the weekend. This increases the risk that the conflict could escalate and affect oil supplies.”
“However, the situation seems to have calmed down, which is why gains were initially limited. This only changed with the news that there is a risk of production losses in Libya. Brent then climbed back above the $80 per barrel mark. An escalation in the Middle East is also possible at any time. Iran, for example, has reiterated its intention to retaliate against Israel.”
“On the other hand, demand concerns have not suddenly disappeared and a possible increase in OPEC+ production from October is still on the table. As a result, further upside potential for oil prices is likely to be limited.”
- NZD/USD is repeatedly pushing up against the ceiling of a range it began in the spring.
- A break above the August 20 high would form a higher high and confirm a breakout from the range.
- Such a move would be expected to lead to substantial upside follow-through.
NZD/USD continues knocking on the ceiling of the sideways range it established since the springtime. A break above the August 20 high would probably confirm an upside breakout with substantial gains expected thereafter.
NZD/USD Daily Chart
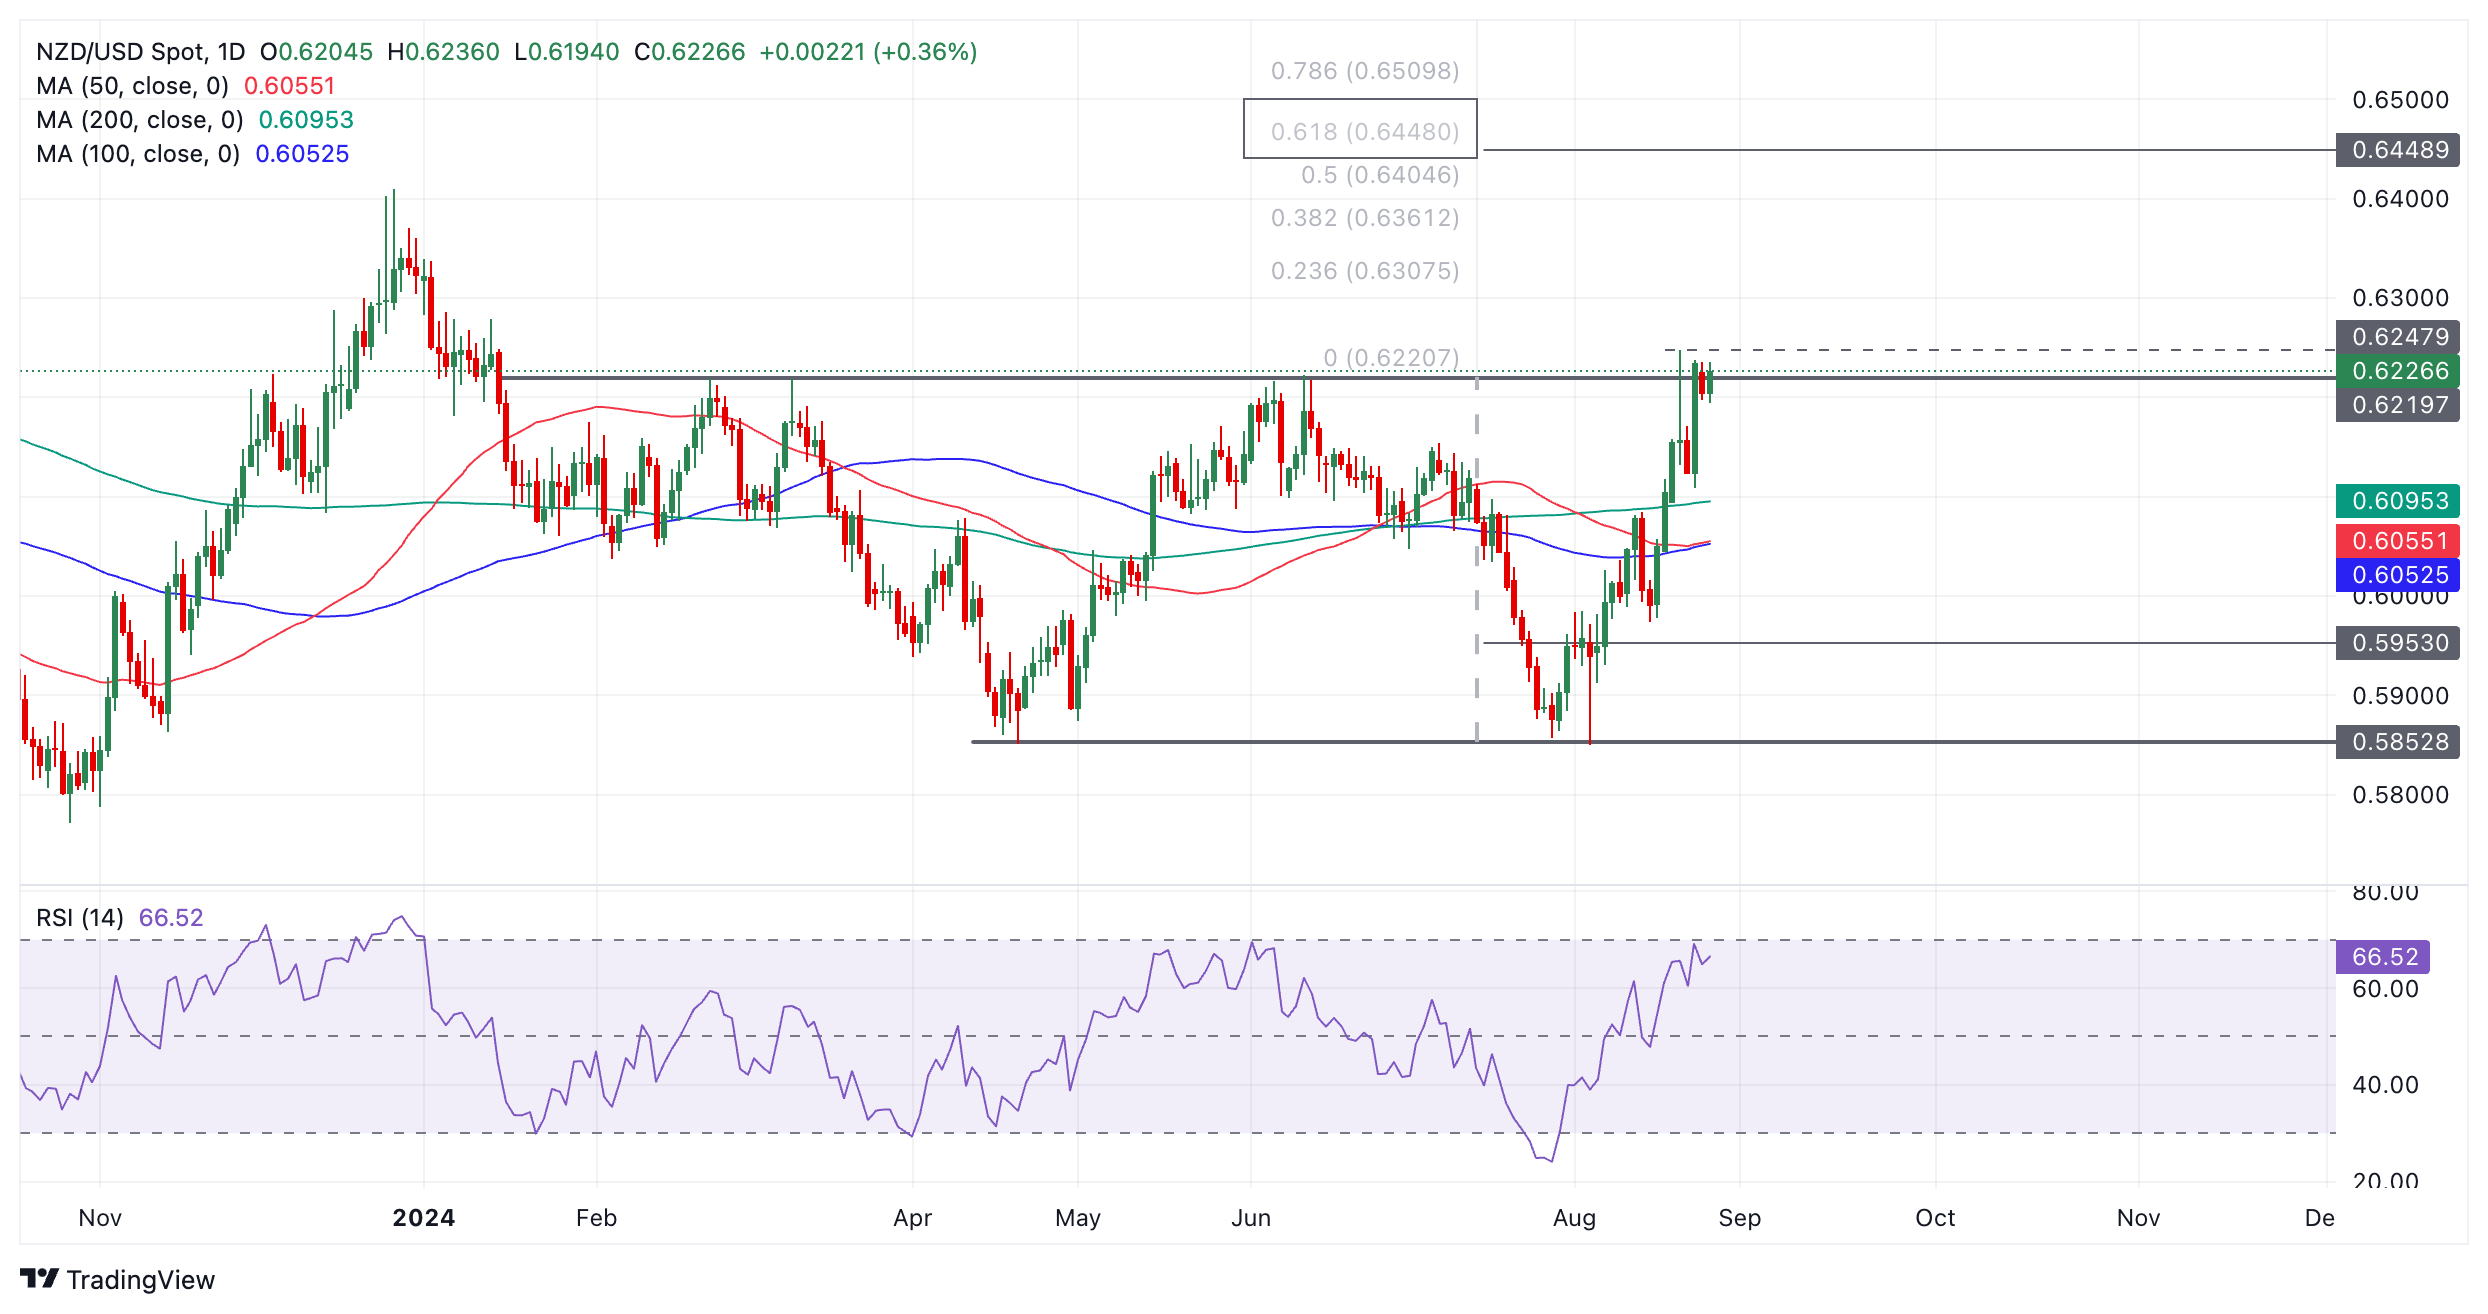
The pair temporarily breached the ceiling of its range on August 20 when it rose up to a high of 0.6248 before rapidly falling back down and forming a bearish Gravestone Doji candlestick in the process. This was followed by a red down candle which would have been expected to indicate further near-term weakness, however, the pair fell on a few points down to the 0.6109 August 22 swing low.
NZD/USD has since recovered and continues testing the range ceiling.
A break above the 0.6248 August 20 highs would signal a decisive breakout from the confines of the range. Such a move would then activate an upside target, calculated by taking the 0.618 ratio of the height of the range and extrapolating it higher. This would give an upside target of 0.6448 (bold rectangle). Another, more conservative target lies at 0.6409 (December 2023 high).
Such a move would probably also change the short-term trend from sideways to bullish.
A break below the 0.6109 swing low (August 23 low), however, would reconfirm the sideways trend as intact. This would probably then see the pair move back down towards the range floor at around 0.5850.
- USD/CHF is in a short-term downtrend which is falling towards a key low.
- The pair is oversold according to the RSI and at risk of a pull back.
USD/CHF trades lower in line with the dominant short-term downtrend after the pair established a sequence of descending peaks and troughs since the August 15 high.
Given “the trend is your friend” the downtrend should continue, with the next key target lying at 0.8433, the key August 5 low.
USD/CHF 4-hour Chart
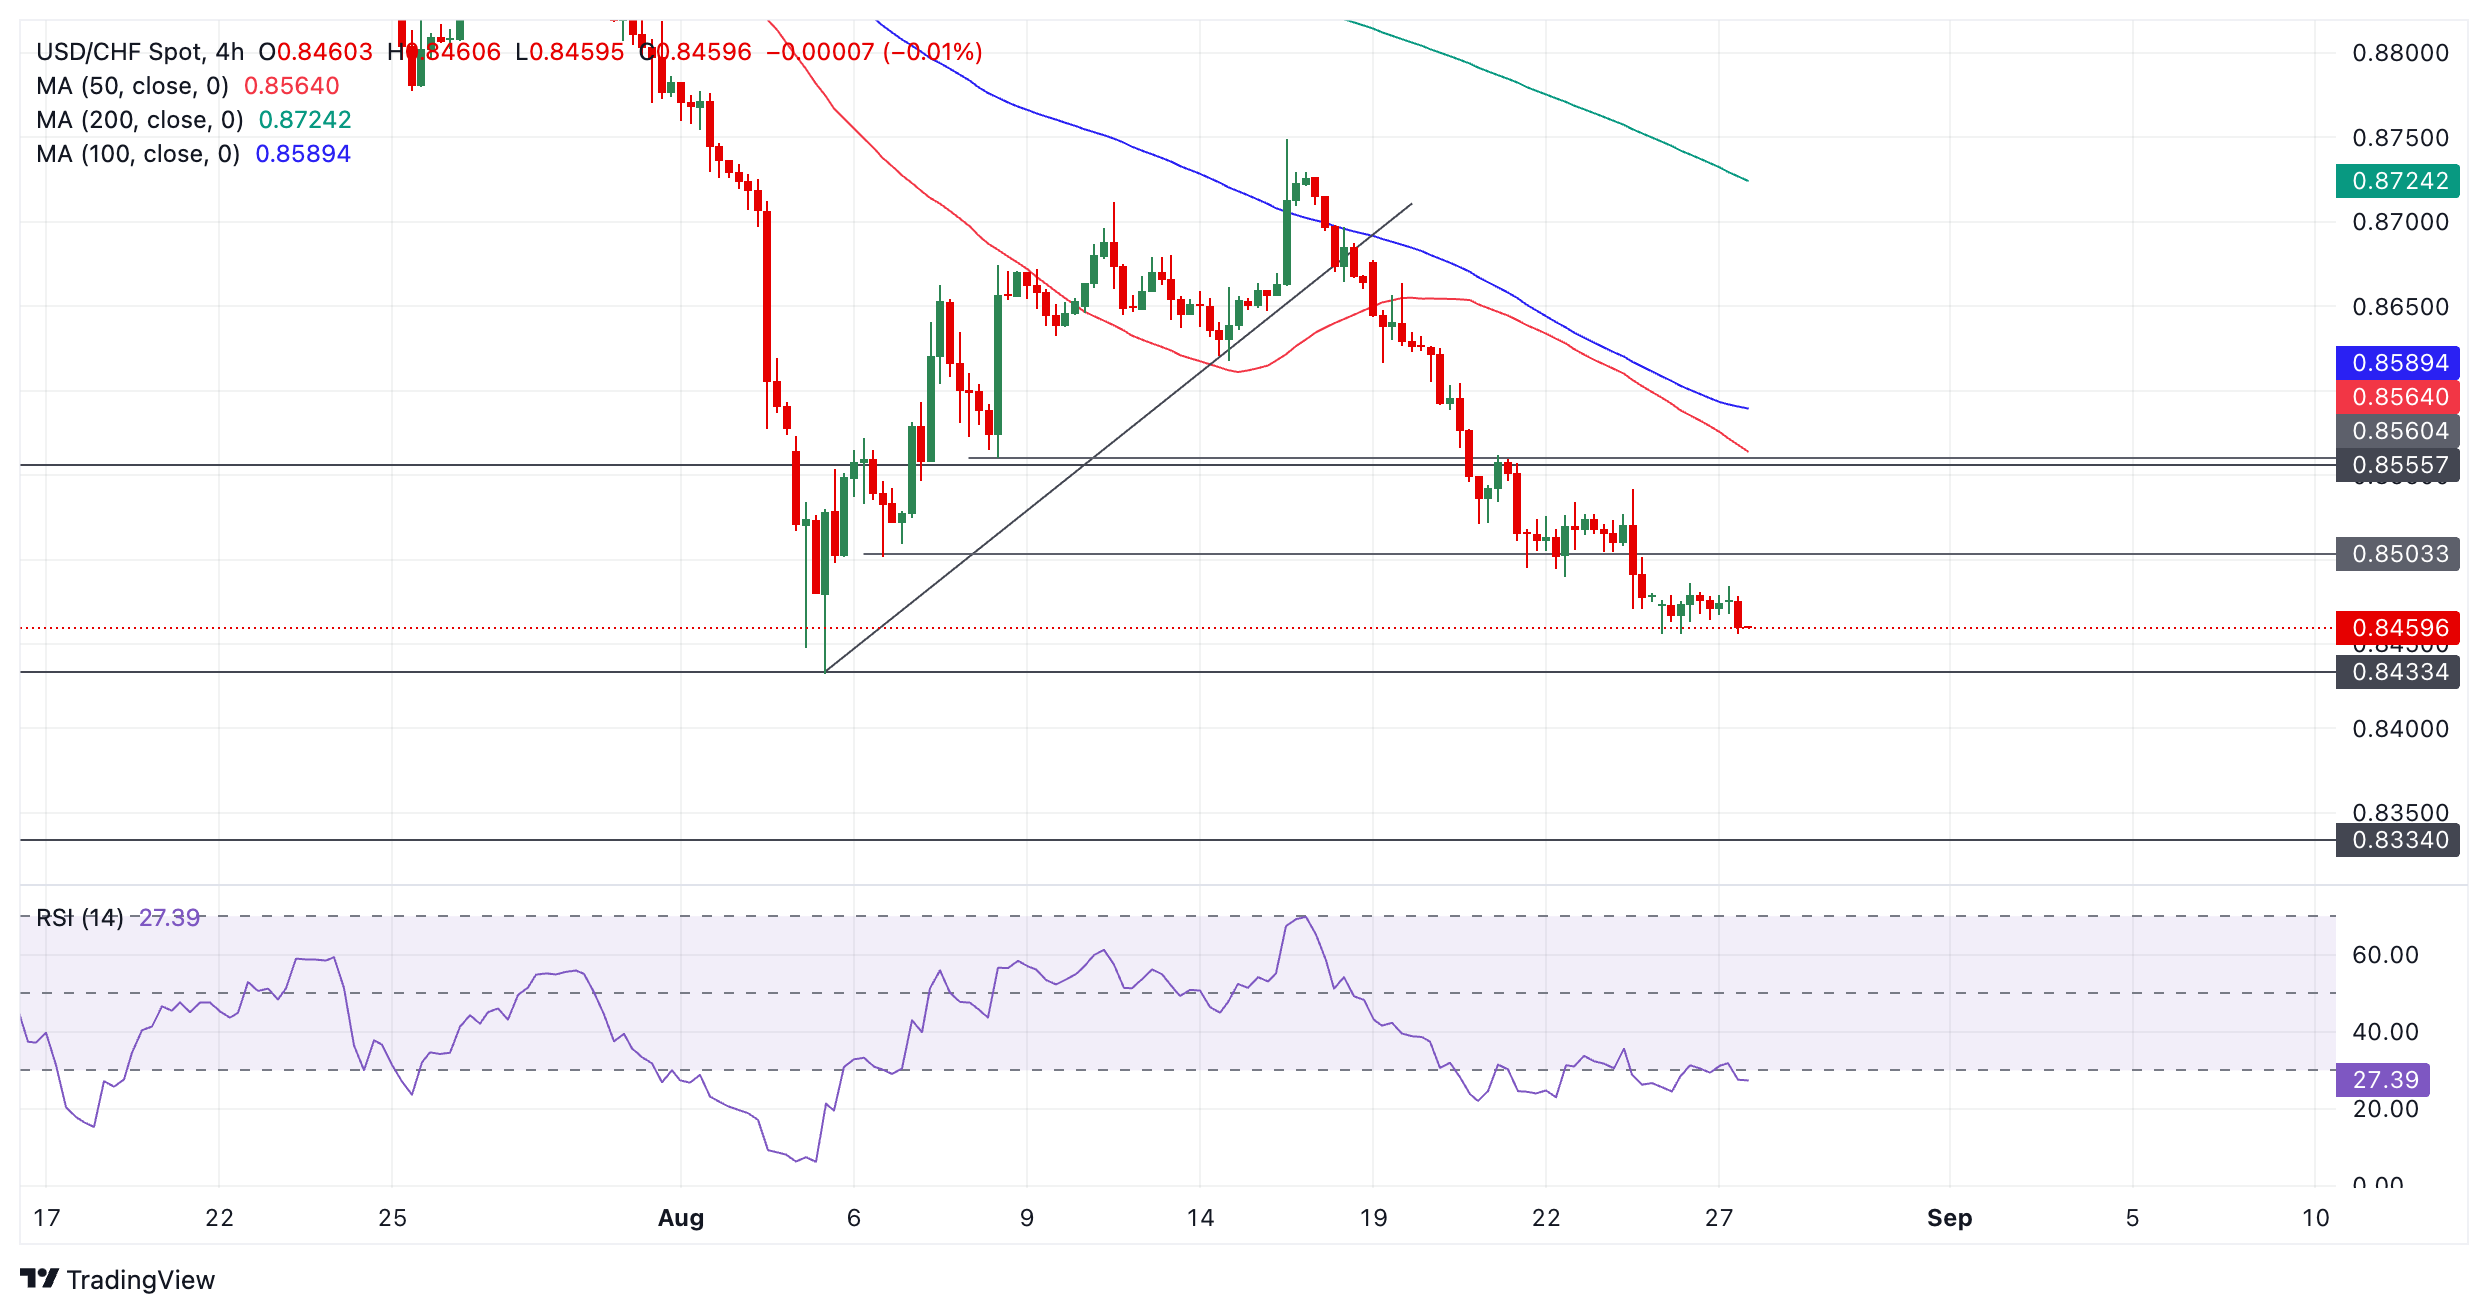
The Relative Strength Index (RSI) momentum indicator is in the oversold zone indicating a risk of a pull back. A buy signal for counter trend reactions is given when the RSI exits oversold and closes back inside neutral territory (above 30).
A decisive break below the August 5 lows would see the downtrend extend even lower, towards the next target at 0.8334.
A decisive break would be one accompanied by a long red candlestick that broke well below the low and closed near its low or three red candles in a row that broke below the level.
The Canadian Dollar (CAD) is little changed on the session, leaving spot pressed back up against yesterday’s intraday low around 1.3468, Scotiabank’s Chief FX Strategist Shaun Osborne notes
CAD holds gains in upper 1.34s
“While factors continue to shift favourably for the CAD in broad terms, spot is trading further below our fair value estimate (1.3529) today. General USD weakness accounts for some of the discrepancy but position adjustment (CAD short covering) is also a likely driver of the CAD’s buoyancy at the moment.”
“Friday’s CFTC data reflected only a mild reduction in the recent build-up of (hefty) CAD shorting activity in the week through last Tuesday. Spot retains a weak technical undertone.
“Steady losses over the past four weeks have pushed the USD back to 1.3475 retracement support (61.8% of the 2024 move up) and trend strength oscillators are aligned bearishly across the intraday, daily and weekly studies. This tilts risks towards more USD weakness and suggests limited scope for USD rebounds. Oscillators are warning that an oversold condition in the USD is developing, however.”
Following Fed Chairman Powell's speech on Friday, Gold once again rose above the $2,500 per troy ounce mark. Supported by the deteriorating situation in the Middle East over the weekend, the price on Monday was close to the all-time high set last week. At the Jackson Hole symposium, Powell had said that it was time to adjust policy, Commerzbank’s commodity strategist Carsten Fritsch notes.
Gold has no significant upside potential
“The timing and pace of rate cuts would depend on incoming data. As a result, the USD depreciated and bond yields fell, both of which were positive for Gold. Expectations for rate cuts have also risen slightly. Currently, Fed fund futures are pricing in a rate cut of around 35 basis points in September and rate cuts of just over 100 basis points at the remaining three meetings through the end of the year.”
“The prospect of falling interest rates is also attracting investors. According to Bloomberg, Gold ETF holdings rose by 15 tonnes last week to the highest level in six months. Speculative interest is particularly strong. The net long position of speculative investors rose to around 193,000 contracts in the week to August 20th, at the same time as Gold hit an all-time high, its highest level in almost four and a half years.”
“Much of the positive news for Gold may therefore already have been priced in. We feel vindicated in our view that Gold has no significant upside potential for the time being. We see more room for the three other precious metals that have not caught up with Gold in recent weeks.”
Rally in Australian Dollar (AUD) over the last few weeks came on the back of hawkish RBA remarks, broadly softer USD, riskon sentiment and higher iron ore prices, OCBC FX strategists Frances Cheung and Christopher Wong note.
Corrective pullback is not ruled out for now
“But the rise has met resistance at near 0.68 (the high for the year). Pair failing to break above it for the second time forms an interim double-top. Last seen at 0.6780. Bullish momentum on daily chart intact but RSI eased from near overbought conditions. Corrective pullback is not ruled out for now.”
“Geopolitical risks may undermine sentiments Support seen at 0.6730 (23.6% fibo), 0.6640/50 levels (38.2% fibo retracement of 2023 low to 2024 high, 50 DMA). Resistance at 0.6799 (double top). Break-out should see AUD bulls regain momentum to test 0.6870 levels.”
- USD/CAD is declining within a large range.
- The Loonie will probably fall to the range lows or an interim target.
- The RSI is oversold indicating a risk of a reaction, although no signal has been given yet.
USD/CAD is currently declining within a long-term range which has a ceiling in the 1.39s and a floor in the 1.31-1.32s.
The pair is unfolding a down leg within this range as the US Dollar (USD) weakens. Both the medium and short-term trends are now bearish, which given “the trend is your friend” favors short positions over longs.
USD/CAD Daily Chart
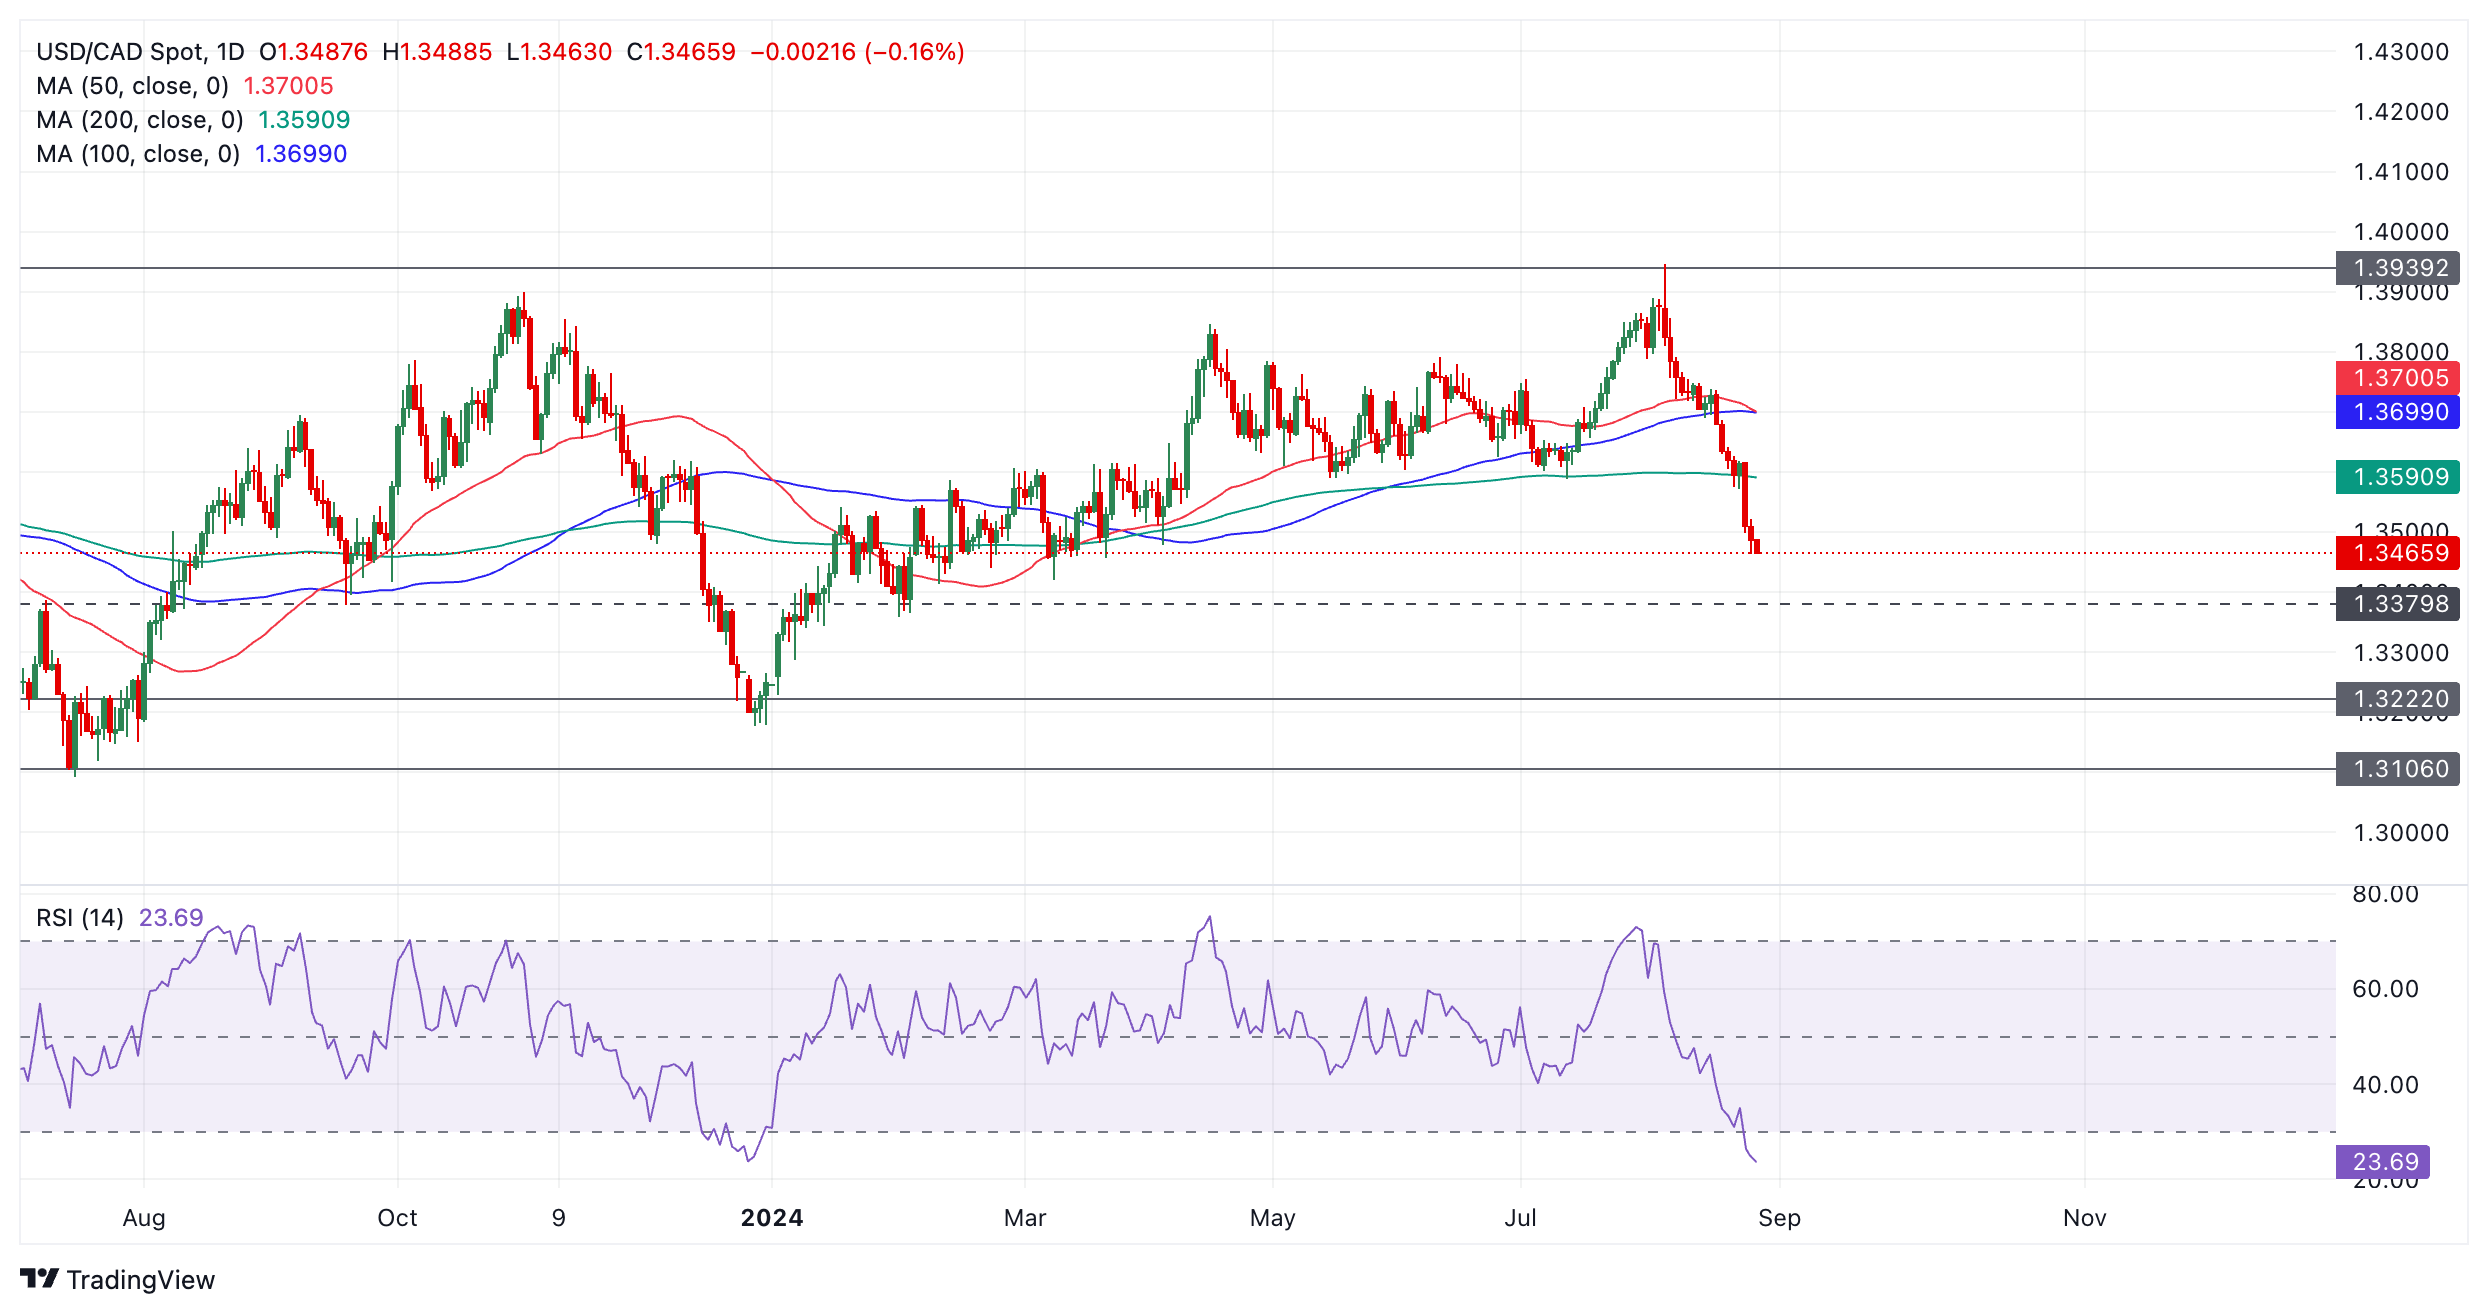
The pair is likely to continue falling in line with the trend, with an eventual target, most probably, at the range floor, starting at 1.3220.
An interim target is also situated at 1.3380 composed of swing lows in October 2023 and January 2024.
The Relative Strength Index (RSI) momentum indicator is in the oversold region indicating a risk of a pull back. However, a buy signal is not said to be given until RSI exits oversold and re-enters the neutral territory (on a closing basis) – which has not yet happened.
Given the oversold state of the RSI, however, traders are advised not to add to their existing short positions. Nor should they close them either, since RSI can remain oversold for a long time during downtrends whilst price continues making lower lows.
There is no sign from price that it is about to pull back as the chart keeps printing one red bar after another.
- The US Dollar trades mixed against its most major peers on Tuesday.
- Markets are going back into risk-on, picking up the drive from past Friday, as tensions in the Middle East ease somewhat.
- The US Dollar Index trades sideways, just below 101.00.
The US Dollar (USD) trades mixed on Tuesday’s European session, halting the mild recovery seen on Monday, with only one pattern on the quote board to retain. The US Dollar is up against most major Asian currencies such as the Japanese Yen (JPY) and the Korean Won (KRW). The risk-on mood seems to have returned to markets – with equities in the green across Asia, Europe, and US futures – as safe-haven flows retreat amid easing hostilities in the Middle East.
On the US economic calendar front, the Housing Price Index for June will be the main event to look at. the second element will be the Consumer Confidence Index for August. After the stellar Durable Goods Orders numbers from Monday, the Consumer Confidence Index should also head higher.
Daily digest market movers: Look out for pivotal data
- The US session kicks off with the Redbook Index for the week ending August 23, to be published at 12:55 GMT. The previous reading was at 4.9%.
- The Housing Price Index will be released at 13:00 GMT. The previous number showed prices remained unchanged, and a slight 0.2% uptick is expected for June.
- At 14:00 GMT, the Consumer Confidence Index for August will be released. the previous number was at 100.3, and economists forecast it to increase slightly to 100.9.
- Also at 14:00 GMT, the Richmond Fed Manufacturing Index for August will be released. An uptick is expected, from -17 to -14.
- Equities in Asia and Europe are overall up on the quote board. US futures are taking over the positive tone and are up by less than 0.5%.
- The CME Fedwatch Tool shows a 71.5% chance of a 25 basis points (bps) interest rate cut by the Fed in September against a 28.5% chance for a 50 bps cut. Another 25 bps cut (if September is a 25 bps cut) is expected in November by 50.2%, while there is a 41.3% chance that rates will be 75 bps (25 bps + 50 bps) below the current levels and a 8.5% probability of rates being 100 (25 bps + 75 bps) basis points lower.
- The US 10-year benchmark rate trades at 3.82%, a fresh weekly high.
US Dollar Index Technical Analysis: If the recovery already stalls now
The US Dollar Index (DXY) saw a substantial move lower last week, snapping several important support levels, as markets are pricing in aggressive Fed rate cuts by November. The recovery from Monday was already a good start, seeing that markets might have exaggerated their assumption on how big and how many cuts the Fed will actually perform. However, the DXY has not been able to recover that much, which means incoming data will become pivotal. Any strong data might trigger a tipping point that could fuel a rally in the DXY if markets start to price out cuts.
For a recovery, the DXY faces a long road ahead. First, 101.90 is the level to reclaim. A steep 2% uprising would be needed to get the index to 103.18 from the current 101.00. A very heavy resistance level near 104.00 not only holds a pivotal technical value, but it also bears the 200-day Simple Moving Average (SMA) as the second heavyweight to cap price action.
On the downside, 100.62 (the low from December 28) tries to hold support, although it looks rather feeble. Should it break, the low from July 14, 2023, at 99.58 will be the ultimate level to look out for. Once that level gives way, early levels from 2023 are coming in near 97.73.

US Dollar Index: Daily Chart
US Dollar FAQs
The US Dollar (USD) is the official currency of the United States of America, and the ‘de facto’ currency of a significant number of other countries where it is found in circulation alongside local notes. It is the most heavily traded currency in the world, accounting for over 88% of all global foreign exchange turnover, or an average of $6.6 trillion in transactions per day, according to data from 2022. Following the second world war, the USD took over from the British Pound as the world’s reserve currency. For most of its history, the US Dollar was backed by Gold, until the Bretton Woods Agreement in 1971 when the Gold Standard went away.
The most important single factor impacting on the value of the US Dollar is monetary policy, which is shaped by the Federal Reserve (Fed). The Fed has two mandates: to achieve price stability (control inflation) and foster full employment. Its primary tool to achieve these two goals is by adjusting interest rates. When prices are rising too quickly and inflation is above the Fed’s 2% target, the Fed will raise rates, which helps the USD value. When inflation falls below 2% or the Unemployment Rate is too high, the Fed may lower interest rates, which weighs on the Greenback.
In extreme situations, the Federal Reserve can also print more Dollars and enact quantitative easing (QE). QE is the process by which the Fed substantially increases the flow of credit in a stuck financial system. It is a non-standard policy measure used when credit has dried up because banks will not lend to each other (out of the fear of counterparty default). It is a last resort when simply lowering interest rates is unlikely to achieve the necessary result. It was the Fed’s weapon of choice to combat the credit crunch that occurred during the Great Financial Crisis in 2008. It involves the Fed printing more Dollars and using them to buy US government bonds predominantly from financial institutions. QE usually leads to a weaker US Dollar.
Quantitative tightening (QT) is the reverse process whereby the Federal Reserve stops buying bonds from financial institutions and does not reinvest the principal from the bonds it holds maturing in new purchases. It is usually positive for the US Dollar.
Euro’s (EUR) recent run higher towards 1.12 may have run its course for now and technically, there are signs to suggest that a pullback may be on the cards, OCBC FX strategists Frances Cheung and Christopher Wong note.
RSI shows signs of turning lower
“The move higher in recent weeks can largely be attributed to the EUR playing catch up to gains seen in other FX amid a softer USD environment while EU-UST yield differentials narrowed further (-153bps vs. - 200bps in Apr). The solid current account data for the eurozone – was also one catalyst - monthly current account surplus for Jun at EUR51bn was the highest on record. The last all-time high was back in Jan 2015 when it was about EUR42.75bn surplus.”
“Moreover, ECB officials have not been outright dovish in the last few weeks. Recall last Fri, Holzmann said a Sep cut is not a foregone conclusion while Chief Economist Lane said that a return to 2% inflation target is not secure yet. And markets were probably getting excited to price in new-found dovishness in Fed, and the USD. Finally, on growth, Euro-area PMIs have yet to show much improvement. Manufacturing PMIs in Euro-area, Germany slumped further into contractionary territory while consumer confidence lags.”
“We cannot rule out markets re-focusing back to short EUR as Jackson Hole comes to pass. Pair was last at 1.1166 levels. Daily momentum is bullish while RSI shows signs of turning lower from near overbought conditions. Elsewhere price action resembled a rising wedge pattern, typically associated with a bearish reversal in the near term. Support at 1.1090, 1.10, 1.0930 (61.8% fibo retracement of 2024 high to low). Resistance at 1.12 (recent high) and 1.1280 (2023 high).”
The US Dollar (USD) is likely to trade sideways between 7.1150 and 7.1350. In the longer run, downward momentum has increased sharply, suggesting there is potential for USD to decline to 7.0636, UOB Group FX strategists Quek Ser Leang and Lee Sue Ann note.
Potential to decline towards 7.0636
24-HOUR VIEW: “Yesterday, we held the view that USD ‘could drop further to 7.0900 before stabilisation can be expected.’ However, USD fell less than expected, rebounding from 7.1069 to 7.1251. USD closed at 7.1239 (+0.11%). Downward pressure appears to have faded. Today, USD is likely to trade sideways, probably between 7.1150 and 7.1350.”
1-3 WEEKS VIEW: “After USD fell last Friday, we indicated yesterday (26 Aug, spot at 7.1100) that downward momentum has increased sharply, suggesting there is potential for USD to decline to the July’s low of 7.0636. While USD did not make further headway on the downside, we continue to hold the same view for now. Only a breach of 7.1460 (no change in ‘strong resistance level from yesterday) would mean that USD is not declining further.”
- USD/JPY falls below 145.00 as the US Dollar remains on the backfoot.
- Traders remain divided over the likely size of the Fed’s September interest rate cuts.
- Investors doubt how much inflation in Japan will pick up this year.
The USD/JPY pair falls to near 144.70 in Tuesday’s European session. The asset drops as the US Dollar (USD) remains on the backfoot as market participants appear to be certain that the Federal Reserve (Fed) will start reducing interest rates from the September meeting. The US Dollar Index (DXY), which tracks the Greenback’s value against six major currencies, exhibits a subdued performance below 101.00.
Investors’ risk-appetite has diminished as tensions between Iran and Israel in the Middle East have escalated. S&P 500 futures surrender gains posted in Asian trading hours. While the broader market sentiment remains cheerful amid confidence that the Fed will pivot to policy-normalization in September.
Though the Fed seems certain to cut interest rates in September, traders remain split over the likely size of rate cuts, given that United States (US) recession fears have eased significantly. The CME FedWatch tool shows that the likelihood of a 50-basis point (bps) interest rate reduction is 28.5%.
For fresh interest rate guidance, investors await the US core Personal Consumption Expenditure Price Index (PCE) data for July, which will be published on Friday. The annual core PCE is estimated to have grown at a higher pace of 2.7% from 2.6% in June, with monthly figures growing steadily by 0.2%. Signs of price pressures remaining persistent would weigh on expectations of bigger interest rate cuts.
Meanwhile, the Japanese Yen (JPY) outweighs the US Dollar on the latter’s weakness but is underperforming against its other peers. Easing signs of price pressures in Japan remaining sticky have raised doubts over the scope of Bank of Japan’s policy tightening. Japan’s Corporate Service Price Index, a key measure of producer inflation, came in lower at 2.8% in July than estimates of 2.9% and June’s reading of 3%. However, BoJ Governor Kazuo Ueda said last week that there is a need to raise interest rates further.
Japanese Yen FAQs
The Japanese Yen (JPY) is one of the world’s most traded currencies. Its value is broadly determined by the performance of the Japanese economy, but more specifically by the Bank of Japan’s policy, the differential between Japanese and US bond yields, or risk sentiment among traders, among other factors.
One of the Bank of Japan’s mandates is currency control, so its moves are key for the Yen. The BoJ has directly intervened in currency markets sometimes, generally to lower the value of the Yen, although it refrains from doing it often due to political concerns of its main trading partners. The current BoJ ultra-loose monetary policy, based on massive stimulus to the economy, has caused the Yen to depreciate against its main currency peers. This process has exacerbated more recently due to an increasing policy divergence between the Bank of Japan and other main central banks, which have opted to increase interest rates sharply to fight decades-high levels of inflation.
The BoJ’s stance of sticking to ultra-loose monetary policy has led to a widening policy divergence with other central banks, particularly with the US Federal Reserve. This supports a widening of the differential between the 10-year US and Japanese bonds, which favors the US Dollar against the Japanese Yen.
The Japanese Yen is often seen as a safe-haven investment. This means that in times of market stress, investors are more likely to put their money in the Japanese currency due to its supposed reliability and stability. Turbulent times are likely to strengthen the Yen’s value against other currencies seen as more risky to invest in.
The US Dollar (USD) sell-off shows signs of stabilising as Jackson hole excitement comes to pass, OCBC FX strategists Frances Cheung and Christopher Wong note.
Clean break of 100.60 puts 99.60 in focus
“This week, 2Q GDP (Thu) and core PCE (Fri) will be the highlight. Firmer print may potentially slow USD’s bearish momentum, but another underwhelming print should re-expose USD to further downside. That said, month-end flows, geopolitical risks may potentially distort price action.”
“DXY was last at 100.87. Bearish momentum on daily chart intact while RSI is near oversold conditions. Not ruling out the risk of short squeeze but bias to fade rallies. Death cross observed as 50DMA cuts 200DMA to the downside. Support here at 100.60 levels. Clean break puts 99.60 in focus.”
“Resistance at 101, 101.50 and 102.20 (23.6% fibo retracement of 2023 high to 2024 low).”
- Oil undergoes some light profit-taking after rallying above $77.00 on Monday.
- Analysts are issuing concerns about supply after the sudden disruption of Libyan barrels in the markets.
- The US Dollar Index trades back below 101.00 as its recovery eases already.
Oil traders appear to be taking profits on Tuesday after prices have been undergoing a very steep three-day surge which retraced ahead of a pivotal technical area near $77.60. Markets are digesting the sudden disruption in Libyan Oil production in a political local spat between the Benghazi government and the officially-recognised government seating in Tripoli over who should become the next Chairman at the central bank. Analysts said that Libya's supply outage could not easily be replaced as it concerns Light Sweet Crude, which is very high in demand because it can more easily be fractionated into gasoline or kerosene.
The US Dollar Index (DXY) is meanwhile undergoing some profit-taking as well after its recovery only lasted one day. Markets are still going all in on substantial interest-rate cuts from the US Federal Reserve (Fed). In this scenario, the biggest risk is that strong incoming US data might ease or even scrub future rate cuts in case the US economy overheats again.
At the time of writing, Crude Oil (WTI) trades at $76.48 and Brent Crude at $79.21.
Oil news and market movers: Libya’s outage means issues for refiners
- Marketwire reports that several analysts are seeing severe issues with the sudden shutdown of Libyan Oil fields as they produce Light Sweet Crude, which is in high demand on the markets.
- Recent Chinese data reveals that Chinese Crude refiners are struggling with far less demand as sales of Electric Vehicles (EVs) are booming in China. The sector is already on the back foot due to a slowdown in demand from the manufacturing and construction sectors, a Bloomberg report showed this Tuesday.
- Goldman Sachs joins Morgan Stanley and cuts its Brent forecast to $77.00 per barrel by 2025 as OPEC is probably heading to reverse its voluntary supply cuts.
- The American Petroleum Institute will release at 20:30 GMT its weekly crude Oil stock numbers for the week ending August 23. Analysts expect a drawdown of 3 million barrels.
Oil Technical Analysis: Technical issues ahead
Oil has sprinted higher to a technical junction residing near $77.60. From that level on, towards $79.00 almost four different resistances will limit Oil prices. The trifecta of Simple Moving Averages (SMA) and the descending trendline should do the trick in keeping price action muted at current levels. With the downward revisions from Goldman Sachs and Morgan Stanley, this could be the end of the line for Crude’s recent rally.
On the upside, the double level at $77.65 aligns with both a descending trendline and the 200-day Simple Moving Average (SMA). In case bulls are able to break above it, the 100-day SMA at $78.45 could trigger a rejection.
On the downside, the low from August 5 at $71.17 emerges as the first support. Under $70.00, the $68.00 big figure is the first level to watch followed by $67.11, which is the lowest point from the triple bottom seen back in June 2023.
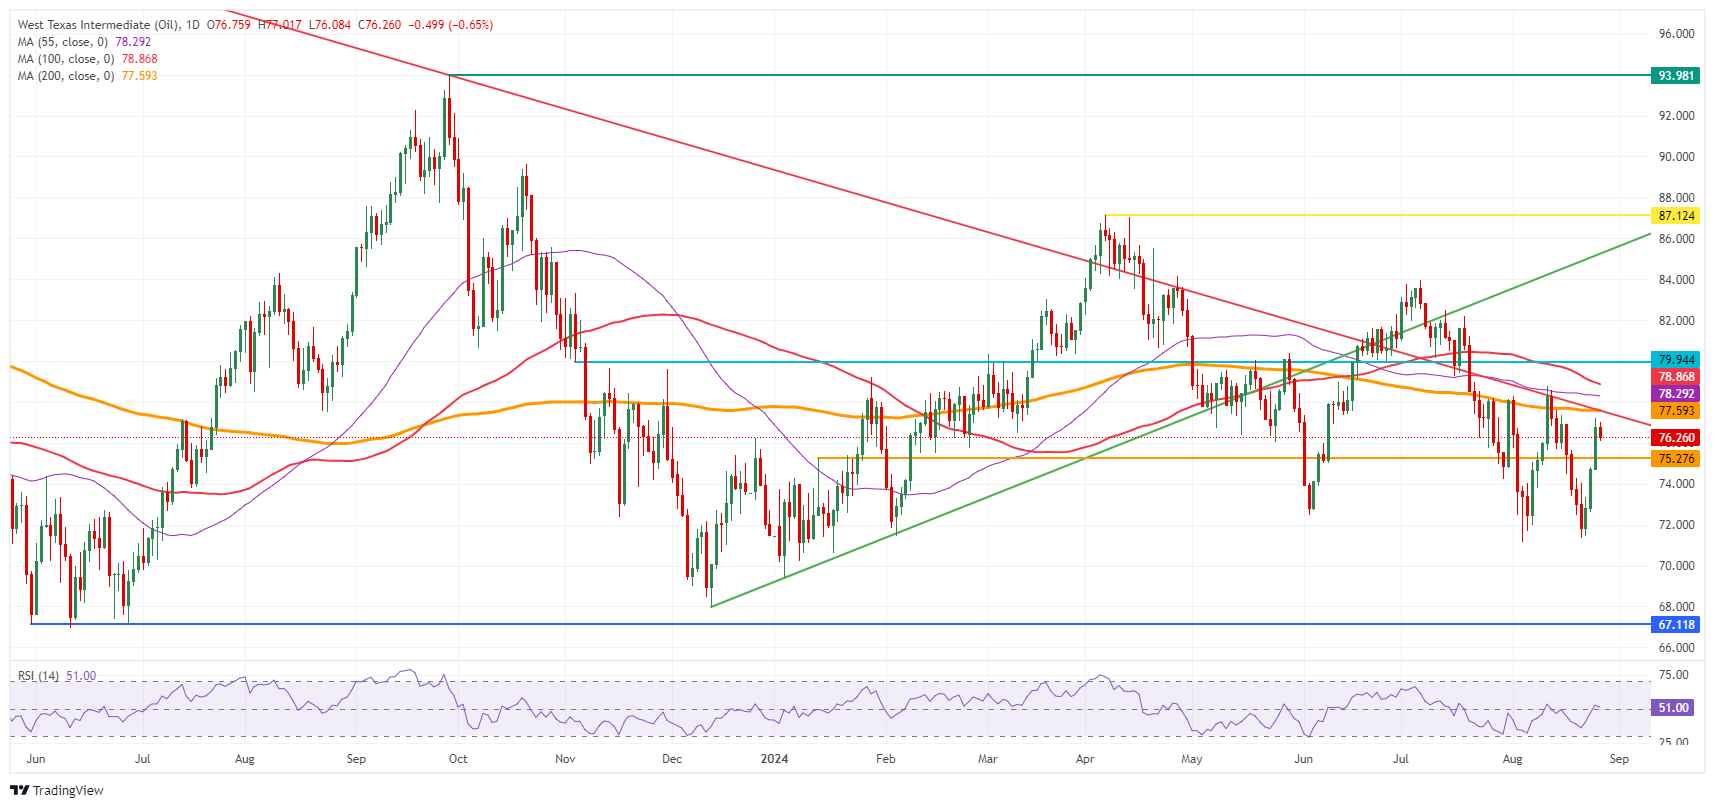
US WTI Crude Oil: Daily Chart
Brent Crude Oil FAQs
Brent Crude Oil is a type of Crude Oil found in the North Sea that is used as a benchmark for international Oil prices. It is considered ‘light’ and ‘sweet’ because of its high gravity and low sulfur content, making it easier to refine into gasoline and other high-value products. Brent Crude Oil serves as a reference price for approximately two-thirds of the world's internationally traded Oil supplies. Its popularity rests on its availability and stability: the North Sea region has well-established infrastructure for Oil production and transportation, ensuring a reliable and consistent supply.
Like all assets supply and demand are the key drivers of Brent Crude Oil price. As such, global growth can be a driver of increased demand and vice versa for weak global growth. Political instability, wars, and sanctions can disrupt supply and impact prices. The decisions of OPEC, a group of major Oil-producing countries, is another key driver of price. The value of the US Dollar influences the price of Brent Crude Oil, since Oil is predominantly traded in US Dollars, thus a weaker US Dollar can make Oil more affordable and vice versa.
The weekly Oil inventory reports published by the American Petroleum Institute (API) and the Energy Information Agency (EIA) impact the price of Brent Crude Oil. Changes in inventories reflect fluctuating supply and demand. If the data shows a drop in inventories it can indicate increased demand, pushing up Oil price. Higher inventories can reflect increased supply, pushing down prices. API’s report is published every Tuesday and EIA’s the day after. Their results are usually similar, falling within 1% of each other 75% of the time. The EIA data is considered more reliable, since it is a government agency.
OPEC (Organization of the Petroleum Exporting Countries) is a group of 13 Oil producing nations who collectively decide production quotas for member countries at twice-yearly meetings. Their decisions often impact Brent Crude Oil prices. When OPEC decides to lower quotas, it can tighten supply, pushing up Oil prices. When OPEC increases production, it has the opposite effect. OPEC+ refers to an expanded group that includes ten extra non-OPEC members, the most notable of which is Russia.
The US Dollar (USD) is likely to range trade, probably between 143.90 and 145.10. In the longer term, USD remains under pressure, and increase in momentum has increased the chance of it reaching 141.66, UOB Group FX strategists Quek Ser Leang and Lee Sue Ann note.
Rangebound between 143.90 and 145.10
24-HOUR VIEW: “We expected USD to ‘decline further, potentially reaching 142.80.’ We highlighted that ‘to keep the momentum going, USD must remain below 145.00.’ Our expectations did not turn out, as USD rebounded from 143.43 to 144.65, closing modestly higher at 144.52 (+0.10%). Slowing downward momentum, combined with oversold conditions, suggests USD is likely to range trade today, probably between 143.90 and 145.10.”
1-3 WEEKS VIEW: “We highlighted yesterday (26 Aug, spot at 143.85) that USD ‘remains under pressure.’ We also highlighted that the increase in momentum from last Friday ‘has increased the chance of it reaching 141.66, the low registered early this month.’ While we continue to hold the same view, oversold short-term conditions could lead to a couple of days of range trading first. Overall, only a breach of 146.50 (no change in ‘strong resistance’ level) would mean that the current downward pressure has eased.”
US Dollar (USD) net long positions have decreased. Euro (EUR) net long positions have surged, driven by a decrease in short positions. Pound Sterling (GBP) net long positions have jumped higher again after the recent shake out, and Japanese Yen (JPY) net long positions have increased, Rabobank’s FX strategists Jane Foley and Molly Schwartz note.
FX Market Positioning as at August 20
“USD net long positions have decreased, driven by an increase in short positions. Better US economic data have provided reassurance that the market was priced for too much easing from the Fed during its mini panic earlier this month. That said, Powell struck a slightly more dovish tone than expected at the Jackson Hole event, driving USD lower on Friday. EUR net long positions have surged, driven by a decrease in short positions. Eurozone July CPI inflation registered in line with expectations at 0.0% m/m and 2.6% y/y. We have seen a consistent appreciation of EUR against USD, with EUR/USD up from an August low of 1.0778 to 1.1189 at the time of writing.”
“GBP net long positions have jumped higher again after the recent shake out. GBP is the best performing G10 currency against USD. At the time of writing, the market is pricing in a 26.7% likelihood of a 25bp cut at the BoE’s September meeting. JPY net long positions have increased, driven by an increase in long positions. JPY net short positions are at their lowest level since March 2021. This continues the improving trend that has been in place since early July. The Bank of Japan released its decision to raise the target rate 15bp to 0.25% on July 31. Since then, Japanese economic data have mostly improved, and JPY long positions are at their highest level since 2016.”
The New Zealand Dollar (NZD) is likely to trade in a range between 0.6180 and 0.6225. In the longer run, NZD is expected to continue to advance; it remains to be seen if the y-t-d high of 0.6320 is within reach, UOB Group FX strategists Quek Ser Leang and Lee Sue Ann note.
Rangebound between 0.6180 and 0.6225
24-HOUR VIEW: “Yesterday, we indicated that “further NZD strength is not ruled out, but severely overbought conditions suggest any advance is likely limited to a test of 0.6260.” However, instead of strengthening further, NZD traded in a range between 0.6198 and 0.6233. Further range trading seems likely today, probably between 0.6180 and 0.6225.”
1-3 WEEKS VIEW: “Not much has changed since our update from yesterday (26 Aug, spot at 0.6230). As highlighted, while we continue to expect NZD to advance, conditions are severely overbought, and it remains to be seen if the year-to-date high of 0.6320 is within reach. Should NZD break below 0.6140 (no change in ‘strong support’ level), it would indicate that NZD is not strengthening further.”
- AUD/USD struggles to extend its upside above 0.6800 as investors have sidelined ahead of Aussie inflation for July.
- The appeal of risky assets remains firm amid optimism over Fed interest rate cuts in September.
- The next move in the US Dollar will be guided by the US core PCE inflation for July.
The AUD/USD pair turns sideways after a juggernaut rally to a fresh six-week high near 0.6800 in Tuesday’s European session. The rally in the Aussie asset appears to have stalled as investors shift focus to the Australian monthly Consumer Price Index (CPI) data for July, which will be published on Wednesday.
Annually, the inflation data is estimated to have decelerated to 3.4% from the prior release of 3.8%. An expected decline in price pressures would market speculation that the Reserve Bank of Australia (RBA) is unlikely to cut interest rates this year.
Meanwhile, upbeat market sentiment continues to cushion the downside in the Australian Dollar (AUD). The market mood seems favorable for risky assets, given that the Federal Reserve (Fed) is widely anticipated to start reducing interest rates from the September meeting. S&P 500 futures have posted decent gains in European trading hours. The US Dollar Index (DXY), which tracks the Greenback's value against six major currencies, struggles to gain ground after posting a fresh year-to-date low of 100.53.
Although Fed September interest rate cuts appear certain, traders remain split over the potential rate-cut size. According to the CME FedWatch tool, 30-day Federal Funds Futures pricing data shows that the probability of a 50-basis points (bps) interest rate reduction in September is 28.5%, while the rest points to a 25-bps rate cut.
For fresh cues about the likely size, investors await the United States (US) core Personal Consumption Expenditure Price Index (PCE) data for July, which will be published on Friday. The annual core PCE is estimated to have accelerated to 2.7% from the prior release of 2.6%, with monthly figures growing steadily by 0.2%.
Australian Dollar FAQs
One of the most significant factors for the Australian Dollar (AUD) is the level of interest rates set by the Reserve Bank of Australia (RBA). Because Australia is a resource-rich country another key driver is the price of its biggest export, Iron Ore. The health of the Chinese economy, its largest trading partner, is a factor, as well as inflation in Australia, its growth rate and Trade Balance. Market sentiment – whether investors are taking on more risky assets (risk-on) or seeking safe-havens (risk-off) – is also a factor, with risk-on positive for AUD.
The Reserve Bank of Australia (RBA) influences the Australian Dollar (AUD) by setting the level of interest rates that Australian banks can lend to each other. This influences the level of interest rates in the economy as a whole. The main goal of the RBA is to maintain a stable inflation rate of 2-3% by adjusting interest rates up or down. Relatively high interest rates compared to other major central banks support the AUD, and the opposite for relatively low. The RBA can also use quantitative easing and tightening to influence credit conditions, with the former AUD-negative and the latter AUD-positive.
China is Australia’s largest trading partner so the health of the Chinese economy is a major influence on the value of the Australian Dollar (AUD). When the Chinese economy is doing well it purchases more raw materials, goods and services from Australia, lifting demand for the AUD, and pushing up its value. The opposite is the case when the Chinese economy is not growing as fast as expected. Positive or negative surprises in Chinese growth data, therefore, often have a direct impact on the Australian Dollar and its pairs.
Iron Ore is Australia’s largest export, accounting for $118 billion a year according to data from 2021, with China as its primary destination. The price of Iron Ore, therefore, can be a driver of the Australian Dollar. Generally, if the price of Iron Ore rises, AUD also goes up, as aggregate demand for the currency increases. The opposite is the case if the price of Iron Ore falls. Higher Iron Ore prices also tend to result in a greater likelihood of a positive Trade Balance for Australia, which is also positive of the AUD.
The Trade Balance, which is the difference between what a country earns from its exports versus what it pays for its imports, is another factor that can influence the value of the Australian Dollar. If Australia produces highly sought after exports, then its currency will gain in value purely from the surplus demand created from foreign buyers seeking to purchase its exports versus what it spends to purchase imports. Therefore, a positive net Trade Balance strengthens the AUD, with the opposite effect if the Trade Balance is negative.
The Australian Dollar (AUD) is likely to trade in a sideways range of 0.6750/0.6790. In mid-term, outsized advance suggests further AUD strength; given the overbought conditions, it remains to be seen if 0.6870 is within reach, UOB Group FX strategists Quek Ser Leang and Lee Sue Ann note.
A move towards 0.6870 is possible mid-term
24-HOUR VIEW: “After AUD surged last Friday, we indicated yesterday that “conditions are severely overbought, but there appears to be enough momentum to break clearly above 0.6800.” Our view did not materialise, as AUD traded in a sideways range of 0.6768/0.6798, closing at 0.6772 (- 0.38%). Momentum indicators are turning neutral, and further sideways trading seems likely. Expected range for today: 0.6750/0.6790.”
1-3 WEEKS VIEW: “We continue to hold the same view as yesterday (26 Aug, spot at 0.6790). As indicated, while the outsized advance from last Friday suggests further AUD strength, given the overbought conditions, it remains to be seen if 0.6870 is within reach in the next 1 to 2 weeks. On the downside, if AUD breaks the ‘strong support’ at 0.6710 (no change in level), it would suggest that it is not strengthening further.”
UK money markets have yet to fully react to Bank of England Governor Andrew Bailey's speech last Friday, ING’s FX strategist Chris Turner notes.
Bailey remains concerned over the ‘intrinsic’ inflation
“Unlike Powell, Governor Bailey remained concerned over the ‘intrinsic’ inflation in the economy and also felt that the economic costs of tighter policy could be less than what they were in the past. His comments stand to keep a wedge between US and UK rates, where money markets continue to price a shallower and slower easing cycle for the BoE.”
“GBP/USD could see some consolidation in a 1.31-1.32 range before moving higher still. EUR/GBP could make a run towards its recent 0.8400 lows. And it looks like we'll have to revise our medium-term sterling profile higher.
As widely expected, the PBoC left the medium-term lending facility (MLF) rate for August unchanged at 2.3%, after cutting it by 20bp in July. The PBoC also withdrew a net CNY101 billion from the banking system through the facility. Part of the reason for the withdrawal is that the demand for MLF loans by banks is subdued. This is because the MLF rate is more expensive than the average funding cost of around 2% for interbank lending currently, Commerzbank’s FX strategists note.
Canada imposes tariffs on China
“The MLF rate announcement was originally scheduled for 15 August but the PBoC delayed the announcement to yesterday, which was five business days after the release date of loan prime rates (LPRs) on 20 August. We will see whether the PBoC will delay the MLF rate announcement again in September, or if it will move the date to around 25th of each month permanently, as the central bank downplays the role of the MLF rate.”
“Canada announced that it will impose new tariffs of 100% on electric vehicles and 25% on steel and aluminium imported from China. The new tariff rates matched the ones imposed by the US in May this year, and way above the European Union's (EU) tariffs on Chinese EVs which ranged from 9% to 36.3%. Canada also launched a 30-day consultation on other sectors including batteries, semiconductors, solar products, and critical minerals.”
“In FX, USD/CNY rose just 10 pips at above 7.12 and the offshore USD/CNH gained 70 pips, also at above 7.12.”
The majority of analysts expect Hungary’s National Bank (MNB) to leave its base rate unchanged at 6.75% at today’s meeting. A minority expect another 25bp rate cut. Most observers predict that the central bank will cut rates by another cumulative 25-50bp before the easing cycle is truly paused; FRA’s price in c.30bp lower rates in 3-6 months’ time, which basically represents some split of views between the 25bp and 50bp options, Commerzbank’s FX strategist Tatha Ghose notes.
MNB is not set to add any pressure on the exchange rate
“Regardless, observers do not anticipate the next rate cut right away. This makes sense based on the CB’s July MPC minutes (a pause was already considered then). Since then, Hungary’s inflation data have not been impressive – core HICP dynamics have remained the most elevated among eastern European countries.”
“But at the same time, Q2 GDP was a disappointment; and conditions have got more dovish in the more developed countries, globally (the Fed view has been totally altered). It may therefore make sense to implement any remaining rate cuts upfront and then, end the easing cycle once and for all.”
“These conflicting considerations make today’s outcome a close but interesting call. On balance, we lean towards no change. This is because EUR/HUF has returned to near 395.0 from being nearer 392.0 a few sessions ago, and we do not reckon that MNB will fancy adding any pressure on the exchange rate.”
- Silver is correcting within its August uptrend.
- If the precious metal breaks above the August high of $30.19 it will probably extend the rally.
Silver (XAG/USD) has pulled back after running up to new highs for the month of August at $30.19.
The precious metal is in a short-term uptrend, however, and given “the trend is your friend” it is expected to resume – going higher once the pull back ends.
Silver 4-hour Chart
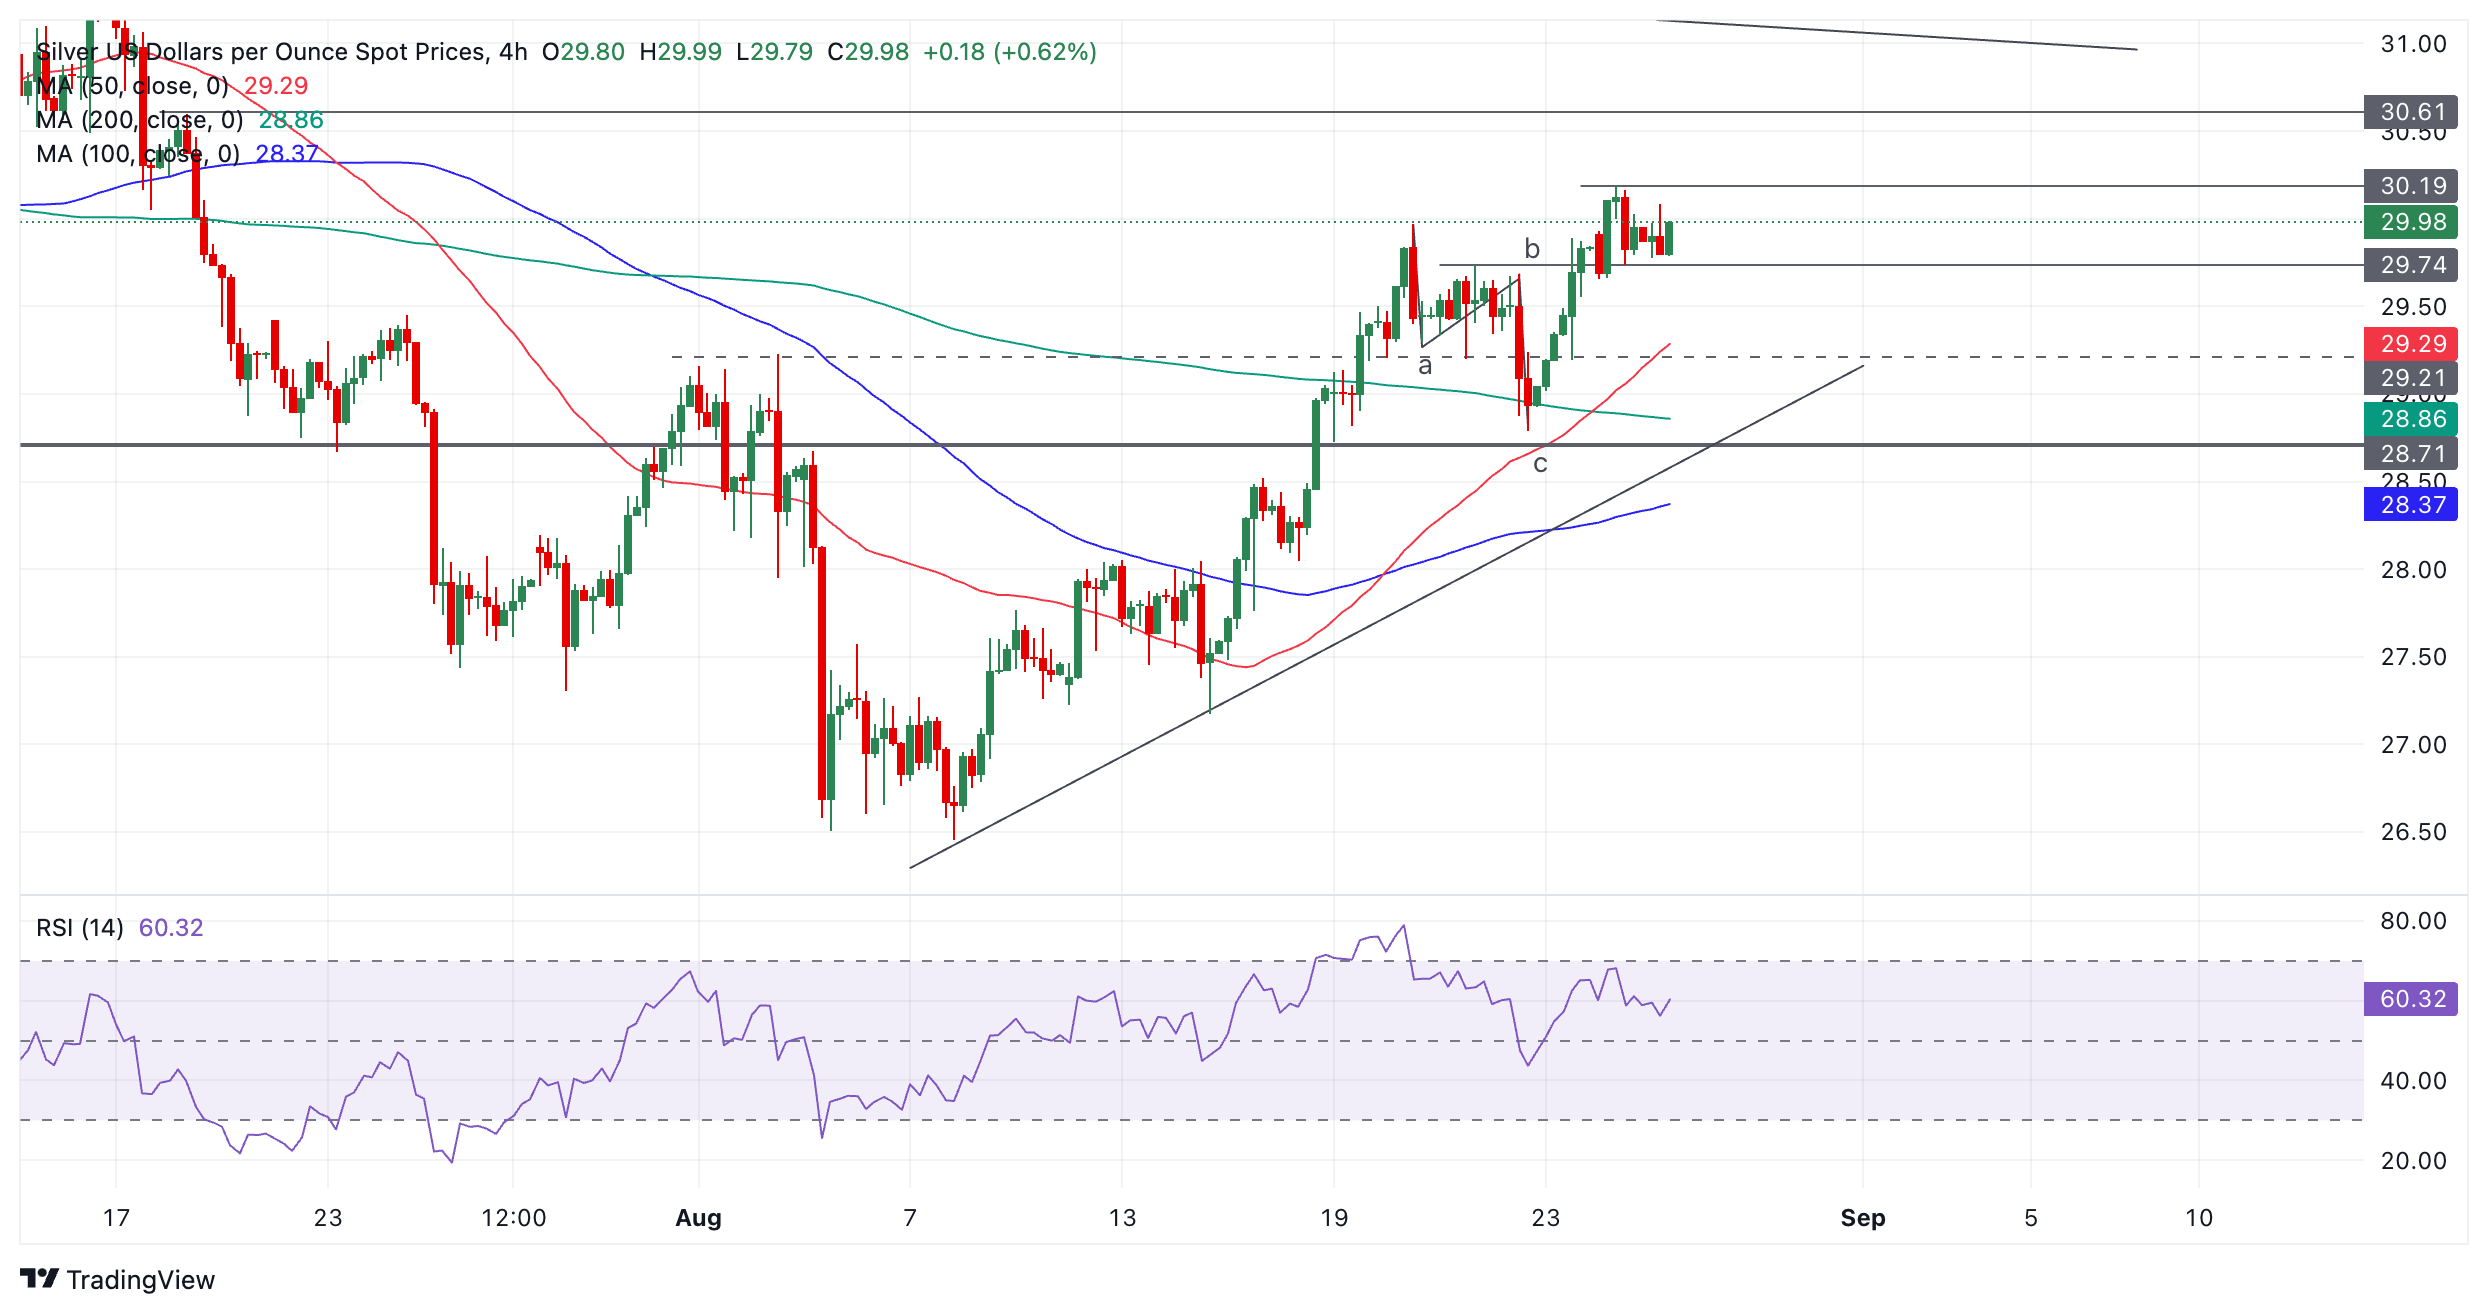
A break above the August high at $30.19 would help confirm more upside, with the next target coming into view at $30.61 the July 18 swing high. The fact the pull back is shallow increases the chances it will peter out and more upside will materialize.
A break below support at $29.23 (August 2 high), however, would be a bearish event and indicate a possible reversal of the short-term uptrend.
The trend on the medium and longer-term charts is unclear – possibly sideways – indicating little directional bias from higher time frames.
Silver prices (XAG/USD) rose on Tuesday, according to FXStreet data. Silver trades at $29.95 per troy ounce, up 0.15% from the $29.90 it cost on Monday.
Silver prices have increased by 25.85% since the beginning of the year.
| Unit measure | Silver Price Today in USD |
|---|---|
| Troy Ounce | 29.95 |
| 1 Gram | 0.96 |
The Gold/Silver ratio, which shows the number of ounces of Silver needed to equal the value of one ounce of Gold, stood at 83.85 on Tuesday, down from 84.21 on Monday.
Silver FAQs
Silver is a precious metal highly traded among investors. It has been historically used as a store of value and a medium of exchange. Although less popular than Gold, traders may turn to Silver to diversify their investment portfolio, for its intrinsic value or as a potential hedge during high-inflation periods. Investors can buy physical Silver, in coins or in bars, or trade it through vehicles such as Exchange Traded Funds, which track its price on international markets.
Silver prices can move due to a wide range of factors. Geopolitical instability or fears of a deep recession can make Silver price escalate due to its safe-haven status, although to a lesser extent than Gold's. As a yieldless asset, Silver tends to rise with lower interest rates. Its moves also depend on how the US Dollar (USD) behaves as the asset is priced in dollars (XAG/USD). A strong Dollar tends to keep the price of Silver at bay, whereas a weaker Dollar is likely to propel prices up. Other factors such as investment demand, mining supply – Silver is much more abundant than Gold – and recycling rates can also affect prices.
Silver is widely used in industry, particularly in sectors such as electronics or solar energy, as it has one of the highest electric conductivity of all metals – more than Copper and Gold. A surge in demand can increase prices, while a decline tends to lower them. Dynamics in the US, Chinese and Indian economies can also contribute to price swings: for the US and particularly China, their big industrial sectors use Silver in various processes; in India, consumers’ demand for the precious metal for jewellery also plays a key role in setting prices.
Silver prices tend to follow Gold's moves. When Gold prices rise, Silver typically follows suit, as their status as safe-haven assets is similar. The Gold/Silver ratio, which shows the number of ounces of Silver needed to equal the value of one ounce of Gold, may help to determine the relative valuation between both metals. Some investors may consider a high ratio as an indicator that Silver is undervalued, or Gold is overvalued. On the contrary, a low ratio might suggest that Gold is undervalued relative to Silver.
(An automation tool was used in creating this post.)
- The Mexican Peso trades mixed with multiple influences impacting its valuation.
- The political risk from planned changes to the constitution that critics say will compromise the independence of the judiciary weighs.
- News of Canadian tariffs on Chinese EVs and Mexican monetary policy support MXN.
The Mexican Peso (MXN) trades mixed on Tuesday during the European session after weakening over one percent in its most-traded pairs on the previous day.
The Peso is probably gaining mild support after an interview with the Bank of Mexico (Banxico) Deputy Governor Galia Borja, in which she said interest rates might remain higher for longer. The expectation that rates might remain elevated is positive for the Peso as it is likely to increase foreign capital inflows.
The Mexican Peso may also be gaining relief from the news of Canada’s decision to increase tariffs on Chinese electric vehicle (EV) and steel imports, by 100% and 25%, respectively. This may benefit Mexico in a roundabout way because of its existing role as an intermediary manufacturer of Chinese EVs destined for the North American market and the free-trade agreement it has with Canada, according to Bloomberg News.
At the time of writing, one US Dollar (USD) buys 19.35 Mexican Pesos, EUR/MXN trades at 21.62, and GBP/MXN at 25.60.
Mexican Peso impacted by political risk
The Peso’s weakness on Monday was partly due to investors' concerns over the Mexican government’s planned changes to the Mexican constitution, in particular in the way the judiciary is appointed. The newly approved Morena-ruled government wants to make judges elected rather than appointed. Critics say the changes will compromise the independence of the judiciary, undermining justice and democracy.
In an interview with El Economista on Monday, Banxico Deputy Governor Galia Borja said that, despite the bank making cuts in March and August, this does not imply the abandonment of restrictive policy. The “cuts in March and August do not mean that we are going to the neutral or accommodative territory. That will take some time. So, from now on, there will still be another period in which the restrictive monetary stance will continue,” said Borja.
Cooler-than-expected Mexican inflation data for August, weaker retail sales in July and carry trade flows out of the Mexican Peso might have been other background factors weighing on the currency at the start of the week.
Technical Analysis: USD/MXN trades within a rising channel
USD/MXN is consolidating in a broad uptrend within a rising channel. The established uptrend overall favors longs over shorts.
More recently, the pair has been oscillating within a mini-range between 19.52 and 19.01. It may well fall temporarily to close the gap that opened on August 26 between 19.11 and 19.15. However, the general direction of the trend is up and suggests an eventual ascent towards the channel highs at roughly 20.50.
USD/MXN 4-hour Chart
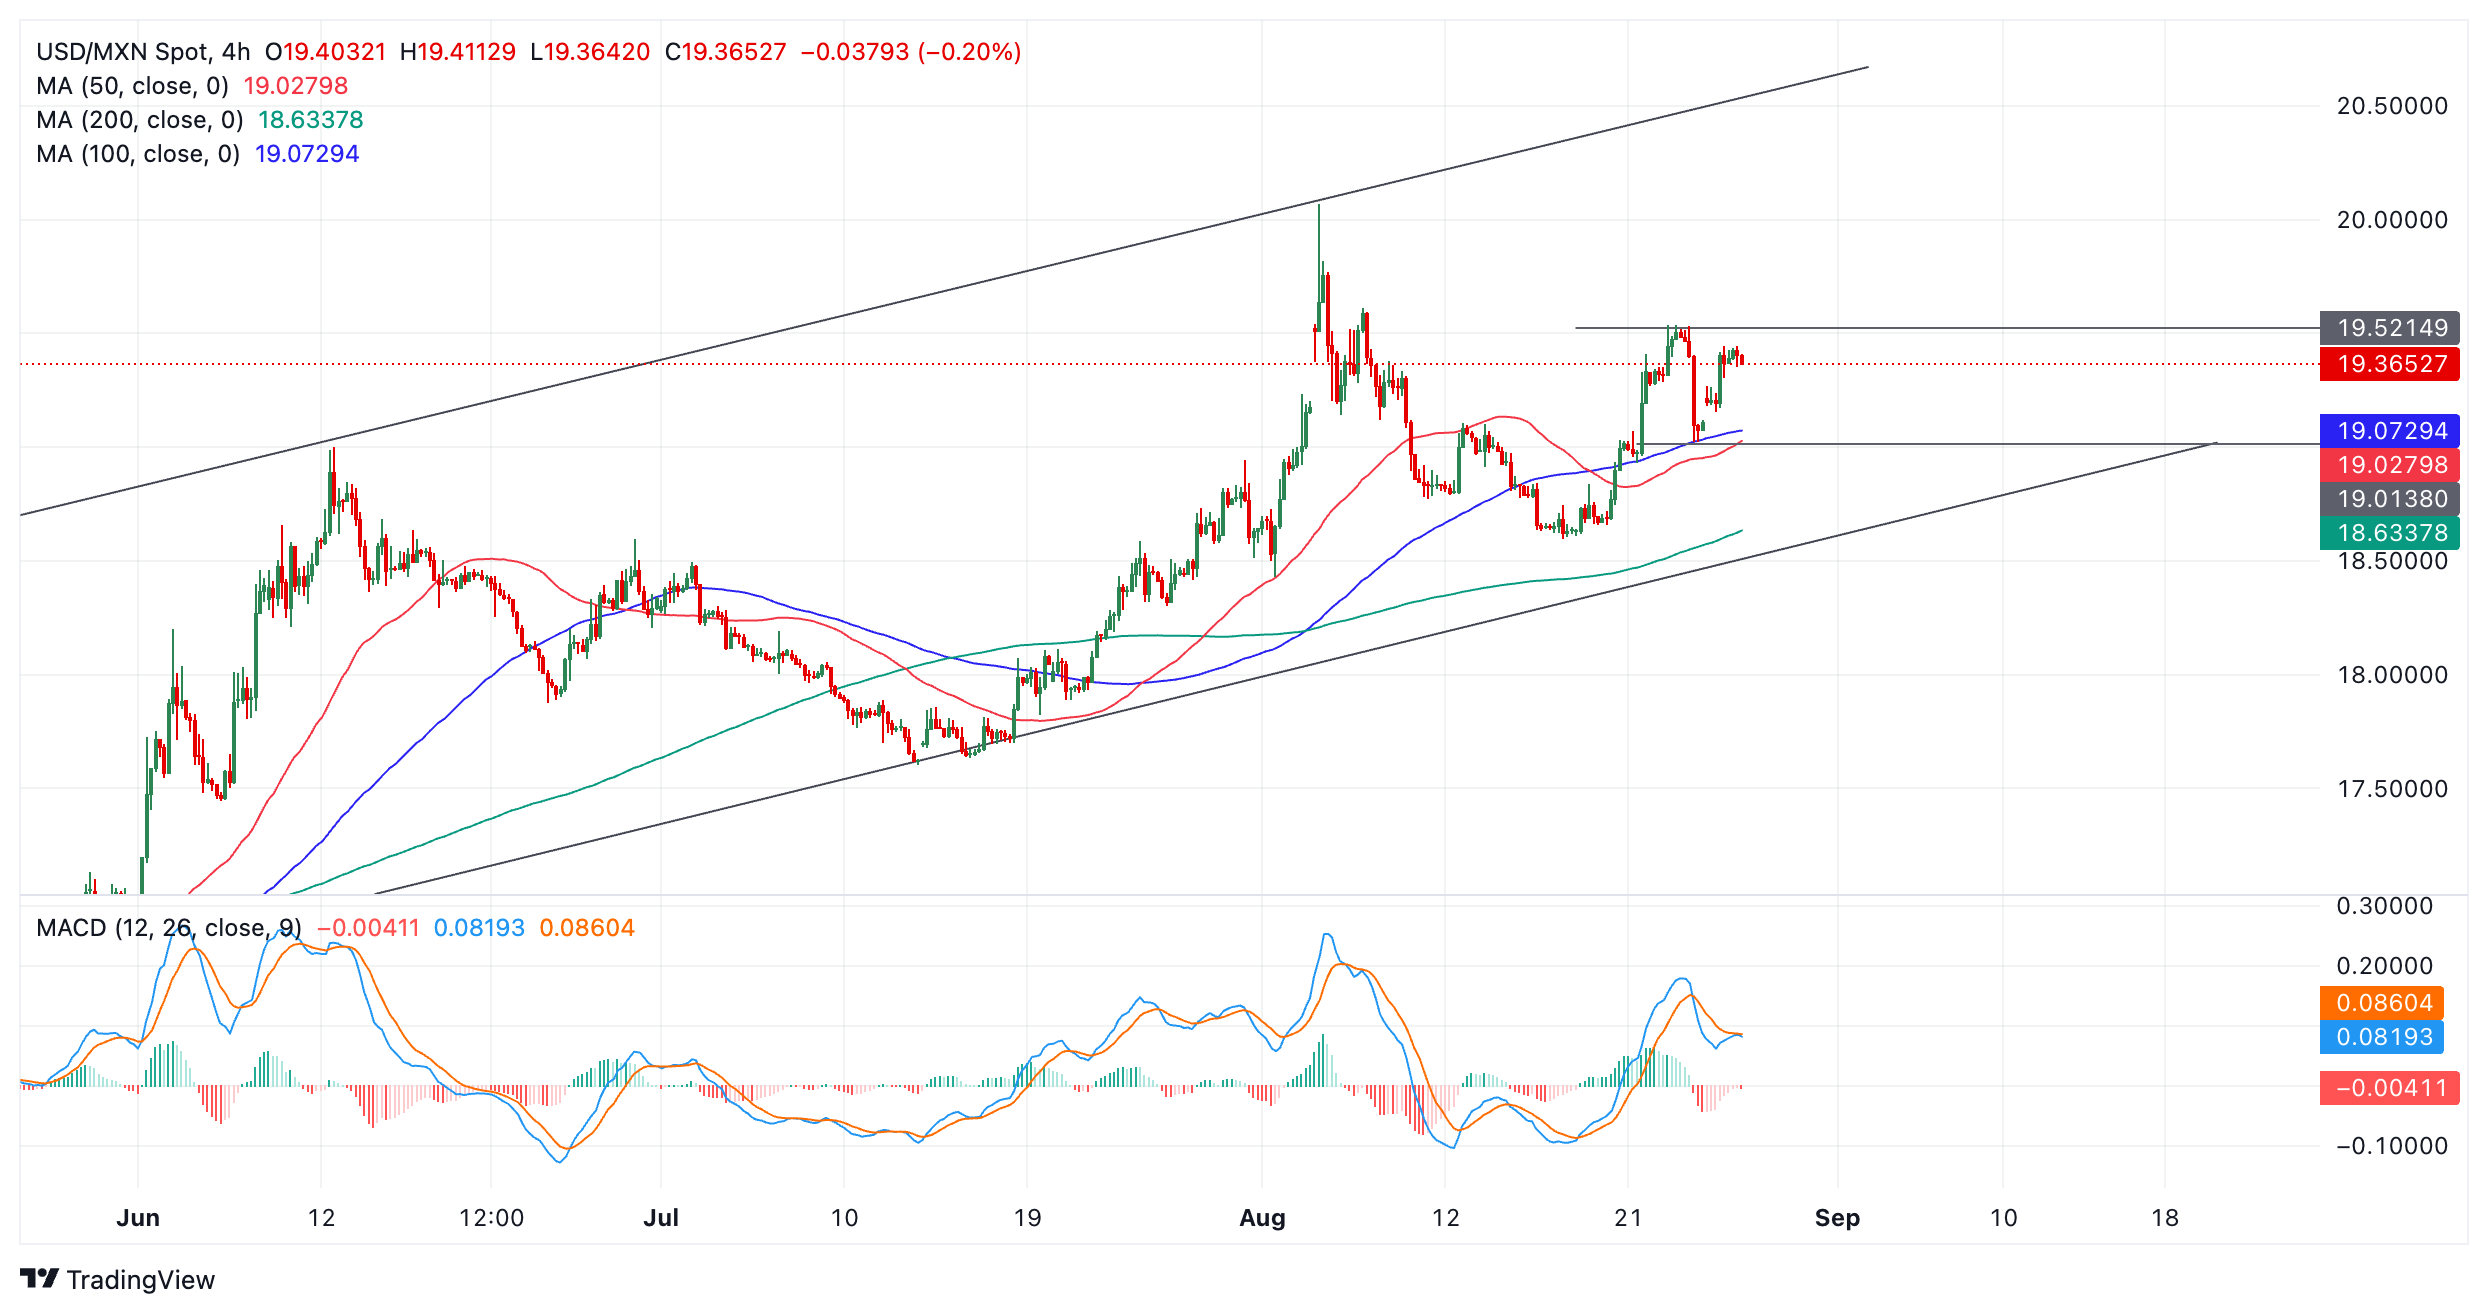
A break above the 19.53 swing high would provide additional confirmation of the continuation of the up leg towards the channel highs.
Banxico FAQs
The Bank of Mexico, also known as Banxico, is the country’s central bank. Its mission is to preserve the value of Mexico’s currency, the Mexican Peso (MXN), and to set the monetary policy. To this end, its main objective is to maintain low and stable inflation within target levels – at or close to its target of 3%, the midpoint in a tolerance band of between 2% and 4%.
The main tool of the Banxico to guide monetary policy is by setting interest rates. When inflation is above target, the bank will attempt to tame it by raising rates, making it more expensive for households and businesses to borrow money and thus cooling the economy. Higher interest rates are generally positive for the Mexican Peso (MXN) as they lead to higher yields, making the country a more attractive place for investors. On the contrary, lower interest rates tend to weaken MXN. The rate differential with the USD, or how the Banxico is expected to set interest rates compared with the US Federal Reserve (Fed), is a key factor.
Banxico meets eight times a year, and its monetary policy is greatly influenced by decisions of the US Federal Reserve (Fed). Therefore, the central bank’s decision-making committee usually gathers a week after the Fed. In doing so, Banxico reacts and sometimes anticipates monetary policy measures set by the Federal Reserve. For example, after the Covid-19 pandemic, before the Fed raised rates, Banxico did it first in an attempt to diminish the chances of a substantial depreciation of the Mexican Peso (MXN) and to prevent capital outflows that could destabilize the country.
ING’s experts have been quite bullish on EUR/USD this month. But the question is whether the move close to 1.12 marks the end of the rally or whether there is more to come, ING’s FX strategist Chris Turner notes.
EUR to trade in a range until the next US data release
“Technically, we think EUR/USD does resemble a coiled spring and that a move above 1.12 could trigger some strong follow-through buying as the speculative community sniffs out a new trend. Yet it is not clear from where that catalyst for a break-out will come this week. From the eurozone side, the main candidate could potentially be Friday's release of the flash CPI data for August.”
“Any upside surprise here could rein in the market's pricing of two-and-a-half ECB rate cuts by year-end, narrow EUR:USD two-year swap differentials still further and support EUR/USD. On the subject of ECB rate cuts, let's see what the two hawks, Klaas Knot and Joachim Nagel, have to say when they speak today.”
“Elsewhere, the run-up in oil prices on the back of increased Middle East tension and Libyan supply challenges will not be helping EUR/USD. And after a strong rally since early August, it looks like EUR/USD could be due some consolidation. We would favour a 1.1100-1.1200 trading range for now – waiting for some US activity data to disappoint.”
Speaking on the economic outlook at the Rose Garden at Downing Street on Tuesday, Prime Minister Keir Starmer warned that "things will get worse before they get better".
Additional quotes
The budget coming in October will be painful.
Those with the broadest shoulders should pay the heaviest burden.
I will have to make big asks of the public, to accept short term pain for long term good.
We have inherited not just an economic black hole but a societal black hole and that is why we have to take action and do things differently. Part of that is being honest with people about the choices we face and how tough this will be.
Market reaction
GBP/USD holds a part of the intraday gains near 1.3235 following these comments, adding 0.34% so far.
There was little movement in the currency markets yesterday. It almost seemed as if the markets were still recovering from the weekend and the Fed symposium in Jackson Hole. After losing value against all of the G10 currencies on Friday, the US Dollar (USD) was able to recover somewhat against most of the currencies yesterday, although the news was very thin on the ground, at least for currencies markets. The President of the San Francisco Fed, Mary Daly, did not say anything new yesterday when she reiterated that the time for rate cuts has come and that of course it is not yet known what the path of rate cuts will be, Commerzbank’s FX strategist Volkmar Baur notes.
Fed has everything it needs for September
"I think Jerome Powell surprised the markets with his dovish comments on Friday, even though on Friday morning I still thought this to be unlikely. We had not heard such a clear statement that the first move would come in September. And while that may not have changed the path that the market was already pricing in, it did reduce the risk around that assumption. The key point is that the risk was only been taken off one side. Only the residual risk that rates would remain unchanged in September was reduced. That is why the market was pricing in a higher probability of a 50-basis point move in September on Friday night. And that was the dovish surprise."
"I find the discussion about data dependency versus forward guidance interesting. Of course, the central bank will emphasize that it has not yet made a decision and wrap that in the word ‘data dependent.’ However, there is only one more jobs report before the September meeting. And as we know, this time series is very volatile, and there are first revisions, second revisions and further ones after that. So the Fed would be well-advised not to rely too heavily on this one last employment report, even if it surprises a bit one way or the other. Of course, the central bank is dependent on the data. But 95 percent of what it needs to know for its September meeting should already be available. And maybe it would be good to emphasize that sometimes."
- EUR/USD steadies below 1.1200 with investors focusing on the inflation data from both the Eurozone and the US.
- The ECB is expected to deliver two more interest rate cuts by year-end.
- Fed’s Mary Daly vows for a 25-basis-points interest-rate reduction in September.
EUR/USD trades in a tight range below the immediate resistance of 1.1200 in Tuesday’s European session. The major currency pair consolidates as investors look for fresh cues about how much the European Central Bank (ECB) and the US Federal Reserve (Fed) will cut interest rates this year.
Market participants currently see an ECB September interest rate cut as certain. The central bank is also expected to cut its key borrowing rates again somewhere during the last quarter of this year. This growing speculation of two additional interest rate cuts responds to easing price pressures in the Eurozone and the uncertainty over its economic outlook.
For the latest update on the current status of Eurozone inflation, investors await the flash Harmonized Index of Consumer Prices (HICP) data for August, which will be published on Friday. On year, the headline and core HICP – which excludes volatile components like food, energy, alcohol, and tobacco – are estimated to have slowed to 2.2% and 2.8%, respectively. The scenario of soft inflationary pressures could weigh on the Euro as it would strengthen market speculation for further rate cuts. On the contrary, surprisingly hot inflation figures would weaken them, providing support to the Euro.
Daily digest market movers: EUR/USD trades sideways while US Dollar struggles for firm footing
- EUR/USD consolidates slightly below 1.1200 as the US Dollar (USD) struggles to gain ground after posting a fresh year-to-date low. The US Dollar Index (DXY), which tracks the Greenback’s value against six major currencies, hovers below 101.00. The Greenback is expected to remain sideways as investors focus on the United States (US) core Personal Consumption Expenditure Price Index (PCE) data for July, which will be published on Friday.
- The Federal Reserve’s (Fed) preferred inflation measure could provide cues about the likely pace at which the central bank will cut interest rates in September. The annual core PCE is estimated to have accelerated to 2.7% from the prior release of 2.6%, with monthly figures seen growing steadily by 0.2%.
- According to the CME FedWatch tool, 30-day Federal Funds Futures pricing data shows that the probability of a 50-basis points (bps) interest rate reduction in September is 28.5%, while the rest points to a 25-bps rate cut, indicating that the Fed return to policy-normalization is certain.
- Meanwhile, most Fed officials also see rate cuts in September as appropriate, given that the central bank is now more worried about emerging risks to the job market. San Francisco Fed Bank President Mary Daly said that "the time is upon us" to cut interest rates, in an interview with Bloomberg on Monday. When asked about the likely size of interest rate cuts, Daily said that she expects a 25-bps interest rate reduction is most likely, however, she left doors open for a 50-bps rate cut if the labor market deteriorates.
Technical Analysis: EUR/USD hovers below 1.1200
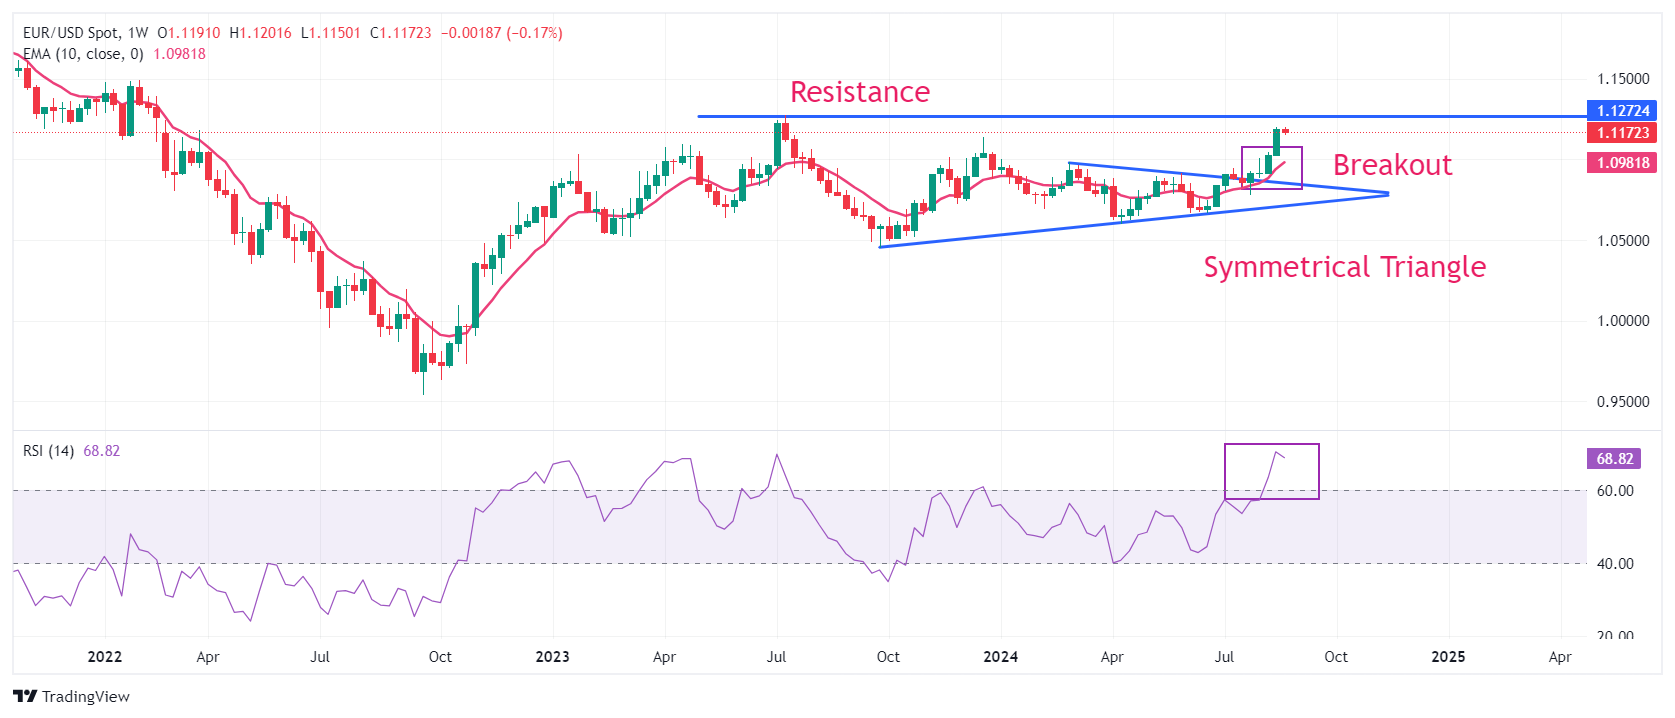
EUR/USD turns sideways after posting a fresh swing high at 1.1200. The major currency pair strengthened after a breakout of the Symmetrical Triangle chart pattern on the weekly time frame. The upward-sloping 10-week Exponential Moving Average (EMA) near 1.0940 supports more upside ahead.
The 14-period Relative Strength Index (RSI) oscillates in the bullish range of 60.00-80.00, suggesting a strong upside momentum. Still, it has reached overbought levels at around 70.00, increasing the chances of a corrective pullback. On the upside, the July 2023 high at 1.1275 will be the next stop for the Euro bulls.
Euro FAQs
The Euro is the currency for the 20 European Union countries that belong to the Eurozone. It is the second most heavily traded currency in the world behind the US Dollar. In 2022, it accounted for 31% of all foreign exchange transactions, with an average daily turnover of over $2.2 trillion a day. EUR/USD is the most heavily traded currency pair in the world, accounting for an estimated 30% off all transactions, followed by EUR/JPY (4%), EUR/GBP (3%) and EUR/AUD (2%).
The European Central Bank (ECB) in Frankfurt, Germany, is the reserve bank for the Eurozone. The ECB sets interest rates and manages monetary policy. The ECB’s primary mandate is to maintain price stability, which means either controlling inflation or stimulating growth. Its primary tool is the raising or lowering of interest rates. Relatively high interest rates – or the expectation of higher rates – will usually benefit the Euro and vice versa. The ECB Governing Council makes monetary policy decisions at meetings held eight times a year. Decisions are made by heads of the Eurozone national banks and six permanent members, including the President of the ECB, Christine Lagarde.
Eurozone inflation data, measured by the Harmonized Index of Consumer Prices (HICP), is an important econometric for the Euro. If inflation rises more than expected, especially if above the ECB’s 2% target, it obliges the ECB to raise interest rates to bring it back under control. Relatively high interest rates compared to its counterparts will usually benefit the Euro, as it makes the region more attractive as a place for global investors to park their money.
Data releases gauge the health of the economy and can impact on the Euro. Indicators such as GDP, Manufacturing and Services PMIs, employment, and consumer sentiment surveys can all influence the direction of the single currency. A strong economy is good for the Euro. Not only does it attract more foreign investment but it may encourage the ECB to put up interest rates, which will directly strengthen the Euro. Otherwise, if economic data is weak, the Euro is likely to fall. Economic data for the four largest economies in the euro area (Germany, France, Italy and Spain) are especially significant, as they account for 75% of the Eurozone’s economy.
Another significant data release for the Euro is the Trade Balance. This indicator measures the difference between what a country earns from its exports and what it spends on imports over a given period. If a country produces highly sought after exports then its currency will gain in value purely from the extra demand created from foreign buyers seeking to purchase these goods. Therefore, a positive net Trade Balance strengthens a currency and vice versa for a negative balance.
Sharp and rapid rise is coupled with strong momentum; Pound Sterling (GBP) is expected to continue to rise, UOB Group FX strategists Quek Ser Leang and Lee Sue Ann note.
A breach of 1.3105 to stop GBP march upwards
24-HOUR VIEW: “We highlighted yesterday that ‘as long as 1.3160 is not breached, there is room for GBP to test 1.3250, after which the advance may pause.’ While GBP did not breach 1.3160, it did not test 1.3250 either, trading in a range of 1.3181/1.3222. The strong advance from late last week is likely taking a pause. Today, we expect GBP to trade in a range, probably between 1.3160 and 1.3220.”
1-3 WEEKS VIEW: “The level to monitor is 1.3320. GBP soared last Friday. Yesterday (Monday), we indicated that ‘the sharp and rapid rise is coupled with strong momentum.’ And GBP ‘is expected to continue to rise.’ We also indicated that ‘the next level to monitor is 1.3320.’ There is no change in our view. Overall, only a breach of 1.3105 (no change in ‘strong support’ level from yesterday) would mean that the GBP strength has run its course.”
FX option expiries for Aug 27 NY cut at 10:00 Eastern Time, via DTCC, can be found below.
EUR/USD: EUR amounts
- 1.1050 1.2b
- 1.1070 500m
- 1.1100 2b
- 1.1150 1.6b
- 1.1170 618m
GBP/USD: GBP amounts
- 1.3100 577m
- 1.3115 200m
USD/JPY: USD amounts
- 143.25 390m
- 144.30 550m
- 144.90 788m
- 145.20 428m
USD/CHF: USD amounts
- 0.8460 500m
AUD/USD: AUD amounts
- 0.6600 3.9b
- 0.6700 296m
- 0.6800 444m
- 0.6840 500m
USD/CAD: USD amounts
- 1.3485 467m
- 1.3545 830m
- 1.3600 370m
NZD/USD: NZD amounts
- 0.6000 1.7b
- 0.6020 694m
EUR/GBP: EUR amounts
- 0.8450 1b
- 0.8475 2.7b
- 0.8525 407m
- AUD/JPY gains ground due to a hawkish mood surrounding the RBA’s policy trajectory.
- RBA’s Bullock expressed that the Australian central bank will not hesitate to raise rates again.
- The downside of the Japanese Yen would be limited as traders expect the BoJ to adopt a hawkish stance.
AUD/JPY edges higher to near 98.40 during the European hours on Tuesday, following hawkish sentiment surrounding the Reserve Bank of Australia’s (RBA) policy outlook. The RBA Governor Michele Bullock expressed that the Australian central bank will not hesitate to raise rates again to combat inflation if needed.
The recent RBA Minutes suggested that the board members had considered a rate hike earlier this month before ultimately deciding that maintaining current rates would better balance the risks. Additionally, RBA members agreed that a rate cut is unlikely soon. Traders await a Monthly Consumer Price Index on Wednesday that could influence the RBA policy outlook.
However, the upside of the AUD/JPY cross could be restrained due to the hawkish mood surrounding the Bank of Japan (BoJ). Additionally, the contrasting statements from the BoJ and the Federal Reserve (Fed) regarding their policy outlooks are contributing support for the Japanese Yen. BoJ Governor Kazuo Ueda stated in Parliament on Friday that the central bank could raise interest rates further if its economic projections are accurate.
BoJ Governor Ueda also addressed the Japanese parliament, stating that he is “not considering selling long-term Japanese government bonds (JGBs) as a tool for adjusting interest rates.” Ueda noted that any reduction in JGB purchases would only account for about 7-8% of the balance sheet, which is a relatively small decrease. He added that if the economy aligns with their projections, there could be a phase where they might adjust interest rates slightly further.
Japan’s Finance Minister Shunichi Suzuki noted on Tuesday that foreign exchange rates are shaped by a range of factors, including monetary policies, interest rate differentials, geopolitical risks, and market sentiment. He emphasized that predicting the impact of these factors on FX rates is challenging.
Interest rates FAQs
Interest rates are charged by financial institutions on loans to borrowers and are paid as interest to savers and depositors. They are influenced by base lending rates, which are set by central banks in response to changes in the economy. Central banks normally have a mandate to ensure price stability, which in most cases means targeting a core inflation rate of around 2%. If inflation falls below target the central bank may cut base lending rates, with a view to stimulating lending and boosting the economy. If inflation rises substantially above 2% it normally results in the central bank raising base lending rates in an attempt to lower inflation.
Higher interest rates generally help strengthen a country’s currency as they make it a more attractive place for global investors to park their money.
Higher interest rates overall weigh on the price of Gold because they increase the opportunity cost of holding Gold instead of investing in an interest-bearing asset or placing cash in the bank. If interest rates are high that usually pushes up the price of the US Dollar (USD), and since Gold is priced in Dollars, this has the effect of lowering the price of Gold.
The Fed funds rate is the overnight rate at which US banks lend to each other. It is the oft-quoted headline rate set by the Federal Reserve at its FOMC meetings. It is set as a range, for example 4.75%-5.00%, though the upper limit (in that case 5.00%) is the quoted figure. Market expectations for future Fed funds rate are tracked by the CME FedWatch tool, which shapes how many financial markets behave in anticipation of future Federal Reserve monetary policy decisions.
Fed Chair Jerome Powell used his speech at the Jackson Hole symposium to pre-announce the start of the Fed's easing cycle in September. Short-dated US rates fell about 15bp into Monday's session and the DXY dollar index sold off around 1%. In effect, Powell declared the inflation battle won, with the attention now turning squarely to the US labour market. The latter featured heavily in Powell's speech, ING’s FX strategist Chris Turner notes.
A US soft landing is priced
“Notably, US one-month OIS rates price two years forward remain at their lows at 3.00%. This pricing looks consistent with a soft landing and assumes some orderly – perhaps 25bp per meeting – Fed rate cuts through to autumn 2025. Arguably near 100, the DXY prices that scenario in and for DXY to break convincingly under 100, fears of a US recession will have to build. And in the middle of all this, we have US elections in early November.”
“Therefore, much lower USD levels from here require much weaker US activity data, where focus will be given to the August jobs report on 6 September. This week sees some second-tier US activity data in the form of consumer confidence (Tuesday and Friday), plus the weekly initial claims data (Thursday) and personal income and spending data (Friday). Given Powell's speech on Friday, the release of the core PCE deflator probably takes on a less pivotal role now.”
“We note the USD is at some significant medium-term support levels. We do not think it needs to rally much from here, but equally, the catalyst for a major downside break-out may not be present this week. DXY looks set to consolidate in a 100.50-101.90 range for now.”
Boost in momentum has increased the likelihood of Euro (EUR) reaching 1.1275, UOB Group FX strategists Quek Ser Leang and Lee Sue Ann note.
EUR is set to target 1.1275
24-HOUR VIEW: “We expected EUR to ‘strengthen further towards 1.1225’ yesterday. We indicated that ‘support levels are at 1.1165 and 1.1145.’ Our expectation did not turn out, as EUR traded between 1.1150 and 1.1201, closing at 1.1161 (-0.26%). EUR seems to have entered a consolidation phase and is likely to trade in a range of 1.1140/1.1190 today.”
1-3 WEEKS VIEW: “After EUR soared last Friday, we indicated yesterday (26 Aug, spot at 1.1185) that ‘the boost in momentum has increased the likelihood of EUR reaching 1.1275.’ We continue to hold the same view even though overbought short-term conditions could lead to a couple of days of consolidation first. Overall, we will continue to hold a positive EUR view provided that the ‘strong support’ level at 1.1105 (no change in level) is not breached.”
- Gold edges lower as a result of easing hostilities in the Middle East and better-than-expected US economic data.
- US Durable Goods Orders smashed estimates on Monday, dispelling some of the pessimism around the US economy.
- Despite risk of a correction from overweight long positions, TD Securities expects Gold to reach a long-term target of $2,700.
Gold (XAU/USD) trades marginally lower in the $2,510s on Tuesday as tensions in the Middle East dissipate, reducing haven demand for the yellow metal. This comes after Israel and Hezbollah’s tit-for-tat missile exchange fails to escalate, though ongoing threats from Iran hover.
Gold may also be edging lower after the release of better-than-expected US Durable Goods Orders data on Monday. The 9.9% rise recorded in July was the highest reading since May 2020 and helped dispel some of the pessimism surrounding the US economy. This, in turn, probably acted as an antidote to expectations the Federal Reserve (Fed) will need to cut interest rates aggressively to avoid a hard landing.
A more gradual programme of cuts would limit the upside for Gold, which is a non-interest paying asset that tends to be viewed more attractively the lower rates are.
The probability of the Fed making a mega 0.50% interest rate cut in September rather than the standard 0.25% reduction has eased back down below 30%. It had risen up to around 35% after Federal Reserve (Fed) Chairman Jerome Powell made the clearest signal yet that cuts were in pipeline at his speech in Jackson Hole on Friday.
Gold slips on reduced haven demand, strong US data
Gold edges lower on Tuesday as safety demand eases. US Air Force General C.Q. Brown, chairman of the Joint Chiefs of Staff, said early Tuesday that fears of a near-term broader Middle East conflict between Israel and Lebanon’s Hezbollah have eased following a lack of escalation. Nonetheless, the US top General warned that “Iran still poses a significant danger as it weighs a strike on Israel,” according to Reuters.
The US Dollar Index (DXY), which measures the strength of the Dollar against a trade-weighted basket, is off its lows, recovering marginally to 100.88 on Tuesday. Gold is negatively correlated to the US Dollar (USD) as it is priced in USD.
Gold to rally in medium-term but risk of correction looms – TD Securities
Gold is likely to go higher but is also at risk of a sharp pullback due to extreme long positioning, according to Bart Melek, Head of Commodity Strategy at TD Securities.
“More upside is in the cards in coming months, but fund heavy long positioning represents a short-term correction risk,” says the strategist.
Given the Fed’s new focus is on its other mandate to provide “full employment”, there is a risk that strong employment figures could trigger an unwinding of these longs and a correction.
“A stronger-than-expected Payrolls print or any other event, which reduces the expectations of rate cuts, could trigger these players to take profits, causing a significant correction,” adds Malek.
TD Securities’ long-term upside target for Gold is $2,700, with the potential for major central bank players such as the People’s Bank of China (PBoC) providing the demand to push the precious metal up to those highs.
One possibility might be that the PBoC (and other major investors) who stopped accumulating Gold back in May – presumably because it was hoping prices would come back down to more favorable levels – may decide not to wait any longer due to fear of missing out, and start buying at current levels again, adds Malek.
Technical Analysis: Gold consolidates above top of former range
Gold (XAU/USD) continues trading above support from the top of its old range. Despite trading sideways recently, the pair remains in a short-term uptrend and given “the trend is your friend” this continues to favor longs over shorts.
XAU/USD 4-hour Chart
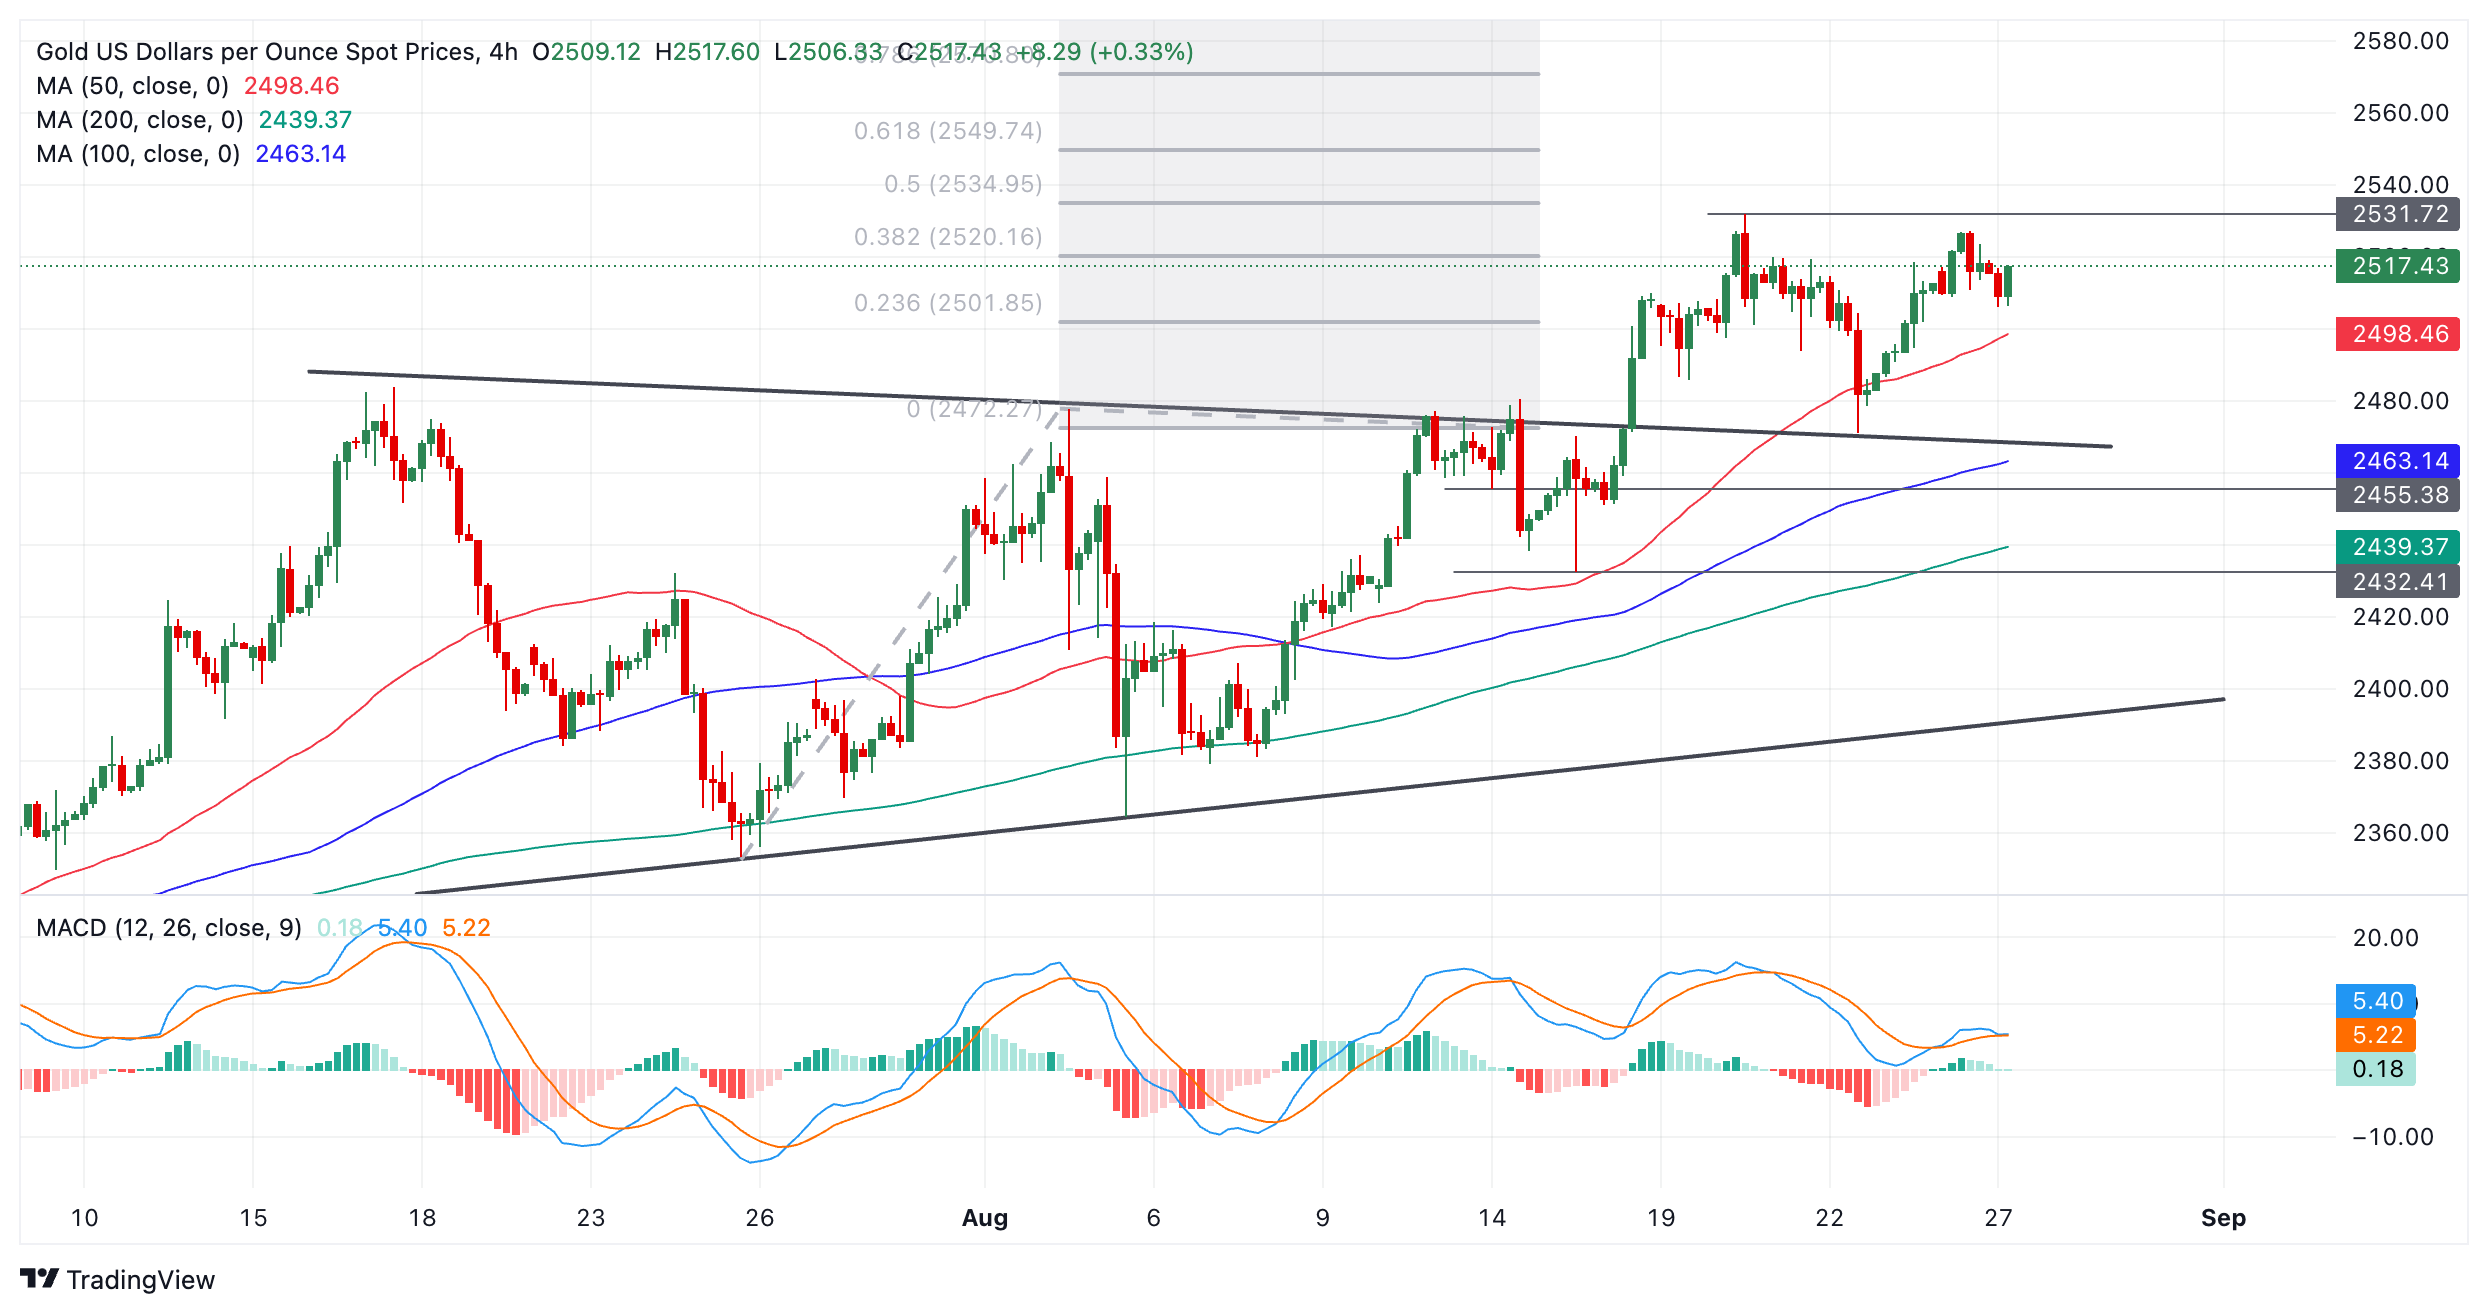
The breakout of the range, which looks like an incomplete triangle pattern, on August 14 generated an upside target at roughly $2,550. This was calculated by taking the 0.618 Fibonacci ratio of the range’s height and extrapolating it higher. This target is the minimum expectation for a follow-through after a breakout based on principles of technical analysis.
A break above the $2,531 all-time high from August 20 would provide added confirmation of a continuation higher towards the $2,550 target.
Alternatively, a break back inside the range would negate the upside projected target. Such a move would be confirmed on a close below $2,470 (August 22 low). It would change the picture for Gold and bring the short-term uptrend into doubt.
Gold is in a broad uptrend on medium and long-term time frames, however, which further supports an overall bullish outlook for the precious metal.
Economic Indicator
Durable Goods Orders
The Durable Goods Orders, released by the US Census Bureau, measures the cost of orders received by manufacturers for durable goods, which means goods planned to last for three years or more, such as motor vehicles and appliances. As those durable products often involve large investments they are sensitive to the US economic situation. The final figure shows the state of US production activity. Generally speaking, a high reading is bullish for the USD.
Read more.Last release: Mon Aug 26, 2024 12:30
Frequency: Monthly
Actual: 9.9%
Consensus: 4%
Previous: -6.6%
Source: US Census Bureau
Here is what you need to know on Tuesday, August 27:
Major currency pairs continue to trade in relatively tight ranges early Tuesday after closing the first day of the week little changed. The US economic calendar will feature Housing Price Index data for June, the Conference Board's Consumer Confidence Index and the Richmond Fed Manufacturing Index for August. Later in the American session, the US Treasury will hold a 2-year note auction.
US Dollar PRICE Last 7 days
The table below shows the percentage change of US Dollar (USD) against listed major currencies last 7 days. US Dollar was the weakest against the New Zealand Dollar.
| USD | EUR | GBP | JPY | CAD | AUD | NZD | CHF | |
|---|---|---|---|---|---|---|---|---|
| USD | -0.71% | -1.59% | -1.10% | -1.16% | -0.62% | -1.93% | -1.74% | |
| EUR | 0.71% | -0.88% | -0.39% | -0.44% | 0.11% | -0.92% | -1.04% | |
| GBP | 1.59% | 0.88% | 0.48% | 0.45% | 1.01% | -0.05% | -0.17% | |
| JPY | 1.10% | 0.39% | -0.48% | -0.05% | 0.49% | -0.55% | -0.67% | |
| CAD | 1.16% | 0.44% | -0.45% | 0.05% | 0.54% | -0.48% | -0.62% | |
| AUD | 0.62% | -0.11% | -1.01% | -0.49% | -0.54% | -1.02% | -1.18% | |
| NZD | 1.93% | 0.92% | 0.05% | 0.55% | 0.48% | 1.02% | -0.14% | |
| CHF | 1.74% | 1.04% | 0.17% | 0.67% | 0.62% | 1.18% | 0.14% |
The heat map shows percentage changes of major currencies against each other. The base currency is picked from the left column, while the quote currency is picked from the top row. For example, if you pick the US Dollar from the left column and move along the horizontal line to the Japanese Yen, the percentage change displayed in the box will represent USD (base)/JPY (quote).
The upbeat Durable Goods Orders data for July and the mixed action seen in Wall Street's main indexes helped the US Dollar (USD) stay resilient against its rivals on Monday. Following the previous week's sharp decline, the USD Index closed in positive territory on Monday and was last seen moving sideways slightly below 101.00. Meanwhile, US stock index futures trade flat on the day in the European morning. Reuters reported earlier in the day that US Air Force General C.Q. Brown, chairman of the Joint Chiefs of Staff, said that fears of a near-term broader Middle East conflict have ebbed after Israel and Lebanon’s Hezbollah exchanged fire without further escalation.
The data from Germany showed that the GfK Consumer Confidence Index declined to -22 for September from -18.6. This reading came in worse than the market expectation of -17.5. In the meantime, Germany's Destatis confirmed that the Gross Domestic Product (GDP) contracted 0.1% on a quarterly basis in the second quarter. EUR/USD holds steady above 1.1150 after closing marginally lower on Monday.
GBP/USD edged lower on Monday but managed to stabilize at around 1.3200 early Tuesday.
Japan’s Finance Minister Shunichi Suzuki said on Tuesday that FX rates are determined by various factors, not just monetary policies and interest rate differentials but also by geopolitical risks, market sentiment and others. After closing marginally higher on Monday, USD/JPY trades in a narrow band near 145.00 in the early European session.
Gold failed to preserve its bullish momentum after rising toward $2,530 early Monday and closed the day with small gains. Gold stays on the back foot on Tuesday and retreats toward $2,500.
Risk sentiment FAQs
In the world of financial jargon the two widely used terms “risk-on” and “risk off'' refer to the level of risk that investors are willing to stomach during the period referenced. In a “risk-on” market, investors are optimistic about the future and more willing to buy risky assets. In a “risk-off” market investors start to ‘play it safe’ because they are worried about the future, and therefore buy less risky assets that are more certain of bringing a return, even if it is relatively modest.
Typically, during periods of “risk-on”, stock markets will rise, most commodities – except Gold – will also gain in value, since they benefit from a positive growth outlook. The currencies of nations that are heavy commodity exporters strengthen because of increased demand, and Cryptocurrencies rise. In a “risk-off” market, Bonds go up – especially major government Bonds – Gold shines, and safe-haven currencies such as the Japanese Yen, Swiss Franc and US Dollar all benefit.
The Australian Dollar (AUD), the Canadian Dollar (CAD), the New Zealand Dollar (NZD) and minor FX like the Ruble (RUB) and the South African Rand (ZAR), all tend to rise in markets that are “risk-on”. This is because the economies of these currencies are heavily reliant on commodity exports for growth, and commodities tend to rise in price during risk-on periods. This is because investors foresee greater demand for raw materials in the future due to heightened economic activity.
The major currencies that tend to rise during periods of “risk-off” are the US Dollar (USD), the Japanese Yen (JPY) and the Swiss Franc (CHF). The US Dollar, because it is the world’s reserve currency, and because in times of crisis investors buy US government debt, which is seen as safe because the largest economy in the world is unlikely to default. The Yen, from increased demand for Japanese government bonds, because a high proportion are held by domestic investors who are unlikely to dump them – even in a crisis. The Swiss Franc, because strict Swiss banking laws offer investors enhanced capital protection.
- The Pound Sterling trades sideways around 1.3200 against the US Dollar, with investors focusing on the US core PCE inflation data for July.
- Fed’s Mary Daly kept doors open for an aggressive policy easing if the US labor market deteriorates.
- British shop price inflation slowed sharply in August.
The Pound Sterling (GBP) clings to gains near the round-level figure of 1.3200 against the US Dollar (USD) in Tuesday’s London session. The GBP/USD pair is sort of taking a breather after last week’s sharp increase, with investors looking for fresh cues about the likely size of the Federal Reserve (Fed) interest rate cut in September.
According to the CME FedWatch tool, 30-day Federal Funds Futures pricing data shows that the probability of a 50-basis-points (bps) interest-rate reduction in September is 28.5%, while the rest favors a smaller cut of 25 bps. The tool unambiguously shows that the Fed’s return to policy normalization is fully priced in by traders, a move that has kept the US Dollar on the back foot for more than a week.
The US Dollar Index (DXY), which tracks the Greenback’s value against six major currencies, exhibits a subdued performance below the immediate resistance of 101.00.
On Monday, San Francisco Fed Bank President Mary Daly emphasized the need to cut interest rates in September. Daly supported a 25 bps interest rate cut but also left doors open for a bigger one if the labor market deteriorates, she said in an interview on Bloomberg.
The confidence of investors that the Fed will begin reducing interest rates from September rose after Fed Chair Jerome Powell said that the time has come for policy to adjust in his speech at the Jackson Hole (JH) Symposium on Friday. Jerome Powell also showed concerns over easing labor market conditions and vowed to support it.
This week, investors will keenly focus on the United States (US) core Personal Consumption Expenditure Price Index (PCE) data for July, which will be published on Friday. Annual core PCE is estimated to have accelerated to 2.7% from the prior release of 2.6%, with monthly figures seen growing steadily by 0.2%. Before that, the US economic calendar will offer on Tuesday the release of the S&P/Case-Shiller Home Price Indices for June and The Conference Board’s gauge of Consumer Confidence for August.
Daily digest market movers: Pound Sterling outperforms major peers
- The Pound Sterling exhibits strength against its major peers, except Asia-Pacific currencies, on Tuesday. The British currency capitalizes on upbeat market sentiment and an improving economic outlook in the United Kingdom (UK). Economic prospects improved after the flash S&P Global/CIPS PMI showed that activity in both the manufacturing and the service sectors rose at a faster-than-expected pace in August.
- Declining bets favoring another interest-rate cut by the Bank of England (BoE) in September have also improved the Pound Sterling’s appeal. The possibility of this scenario is low as BoE officials expect inflation to rise again even as price pressures in the pipeline seem to be abating.
- British shop prices declined in August for the first time since October 2021, data from the British Retail Consortium (BRC) reported on Tuesday shows. Prices of non-food goods dropped by 1.5% due to slower summer clothes sales, the biggest fall in three years. Food prices rose at a slower pace of 2.0%, the smallest rise since November 2021, down from 2.3% in July.
- A slowdown in the shop price inflation is unlikely to increase expectations of BoE interest rate cuts in September as officials are still concerned about sticky price pressures in the service sector due to wage pressures. However, it could boost speculation for another rate cut before the year ends.
Technical Analysis: Pound Sterling consolidates near 1.3200
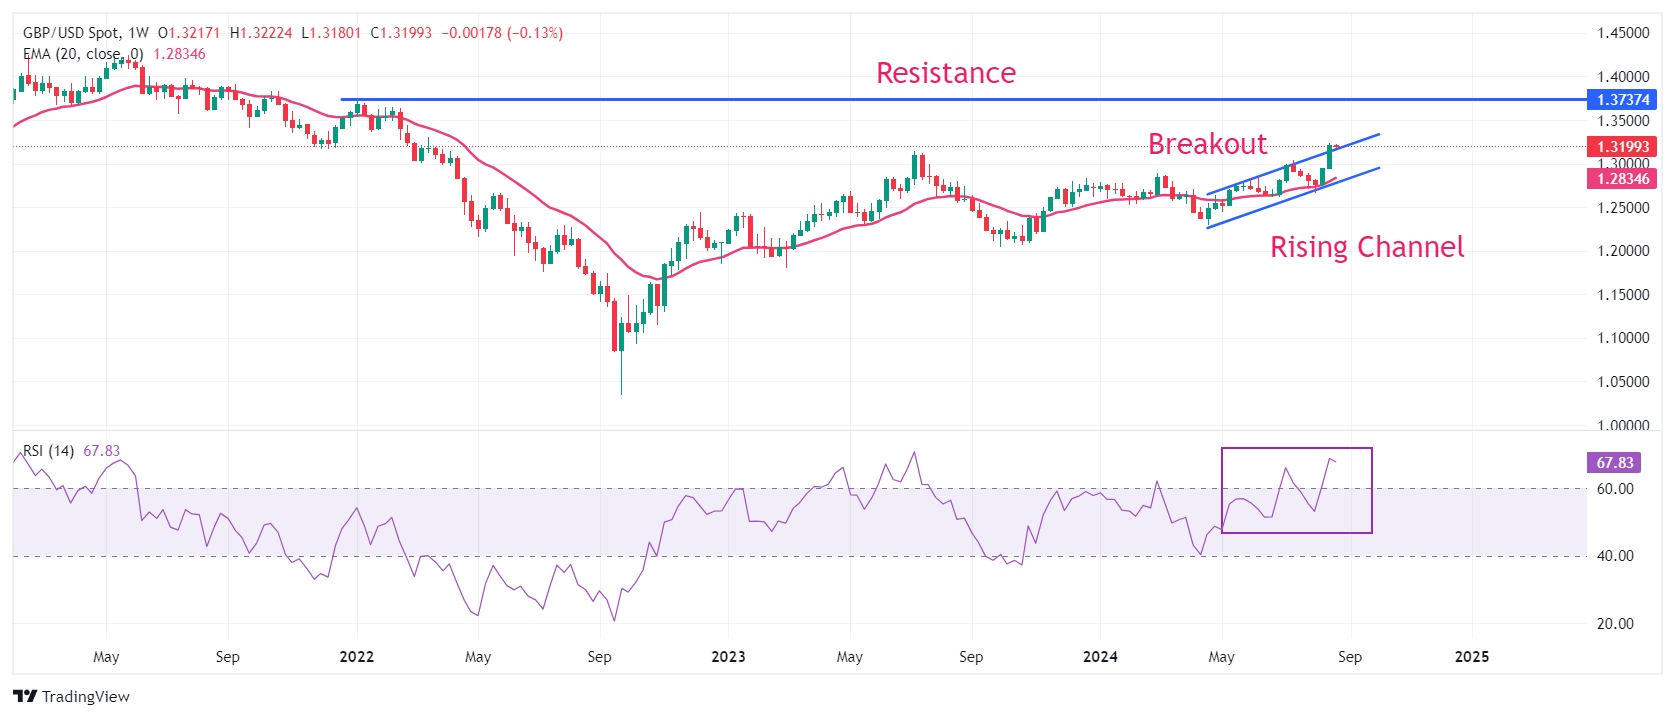
The Pound Sterling turns sideways after posting a fresh two-an-a-half-year high of 1.3200 against the US Dollar. The GBP/USD pair strengthened after delivering a breakout of the Rising Channel chart formation on the weekly time frame. If bullish momentum resumes, the Cable is expected to extend its upside towards the February 4, 2022, high of 1.3640.
The upward-sloping 20-week Exponential Moving Average (EMA) near 1.2766 suggests a strong upside trend.
The 14-period Relative Strength Index (RSI) oscillates in the bullish range of 60.00-80.00, suggesting a strong upside momentum. Still, it has reached overbought levels at around 70.00, increasing the chances of a corrective pullback. On the downside, the psychological level of 1.3000 will be the crucial support for the Pound Sterling bulls.
Pound Sterling FAQs
The Pound Sterling (GBP) is the oldest currency in the world (886 AD) and the official currency of the United Kingdom. It is the fourth most traded unit for foreign exchange (FX) in the world, accounting for 12% of all transactions, averaging $630 billion a day, according to 2022 data. Its key trading pairs are GBP/USD, aka ‘Cable’, which accounts for 11% of FX, GBP/JPY, or the ‘Dragon’ as it is known by traders (3%), and EUR/GBP (2%). The Pound Sterling is issued by the Bank of England (BoE).
The single most important factor influencing the value of the Pound Sterling is monetary policy decided by the Bank of England. The BoE bases its decisions on whether it has achieved its primary goal of “price stability” – a steady inflation rate of around 2%. Its primary tool for achieving this is the adjustment of interest rates. When inflation is too high, the BoE will try to rein it in by raising interest rates, making it more expensive for people and businesses to access credit. This is generally positive for GBP, as higher interest rates make the UK a more attractive place for global investors to park their money. When inflation falls too low it is a sign economic growth is slowing. In this scenario, the BoE will consider lowering interest rates to cheapen credit so businesses will borrow more to invest in growth-generating projects.
Data releases gauge the health of the economy and can impact the value of the Pound Sterling. Indicators such as GDP, Manufacturing and Services PMIs, and employment can all influence the direction of the GBP. A strong economy is good for Sterling. Not only does it attract more foreign investment but it may encourage the BoE to put up interest rates, which will directly strengthen GBP. Otherwise, if economic data is weak, the Pound Sterling is likely to fall.
Another significant data release for the Pound Sterling is the Trade Balance. This indicator measures the difference between what a country earns from its exports and what it spends on imports over a given period. If a country produces highly sought-after exports, its currency will benefit purely from the extra demand created from foreign buyers seeking to purchase these goods. Therefore, a positive net Trade Balance strengthens a currency and vice versa for a negative balance.
- NZD/USD could test the seven-month high of 0.6247 due to the bullish bias that prevails.
- The nine-day EMA is positioned above the 50-day EMA, signaling short-term upward momentum to prevail.
- If the 14-day RSI surpasses the 70 level, it could signal that the pair is overbought and a potential short-term correction.
NZD/USD recovers recent losses from the previous session, trading around 0.6220 during Tuesday’s European hours. On the daily chart, the pair is moving higher within the upper boundary of an ascending channel, supporting a bullish outlook.
The 14-day Relative Strength Index (RSI) is currently just below the 70 level, confirming the bullish sentiment. However, if the RSI moves higher, it could signal that the currency pair is becoming overbought, suggesting a potential short-term correction.
Additionally, the nine-day Exponential Moving Average (EMA) is positioned above the 50-day EMA, signaling that the NZD/USD pair is experiencing short-term upward momentum and is likely to continue rising.
On the upside, the NZD/USD pair may encounter immediate resistance around the upper boundary of the ascending channel at 0.6230, followed by the seven-month high of 0.6247, recorded on August 21.
In terms of support, the nine-day EMA at 0.6149 serves as the immediate support level. A break below this could weaken the bullish bias, potentially leading the pair to test the lower boundary of the ascending channel at 0.6070, followed by the 50-day EMA at 0.6064.
If the pair breaches the latter, a bearish sentiment may emerge, putting pressure on the NZD/USD to move toward the "throwback support" region around the 0.5850 level.
NZD/USD: Daily Chart
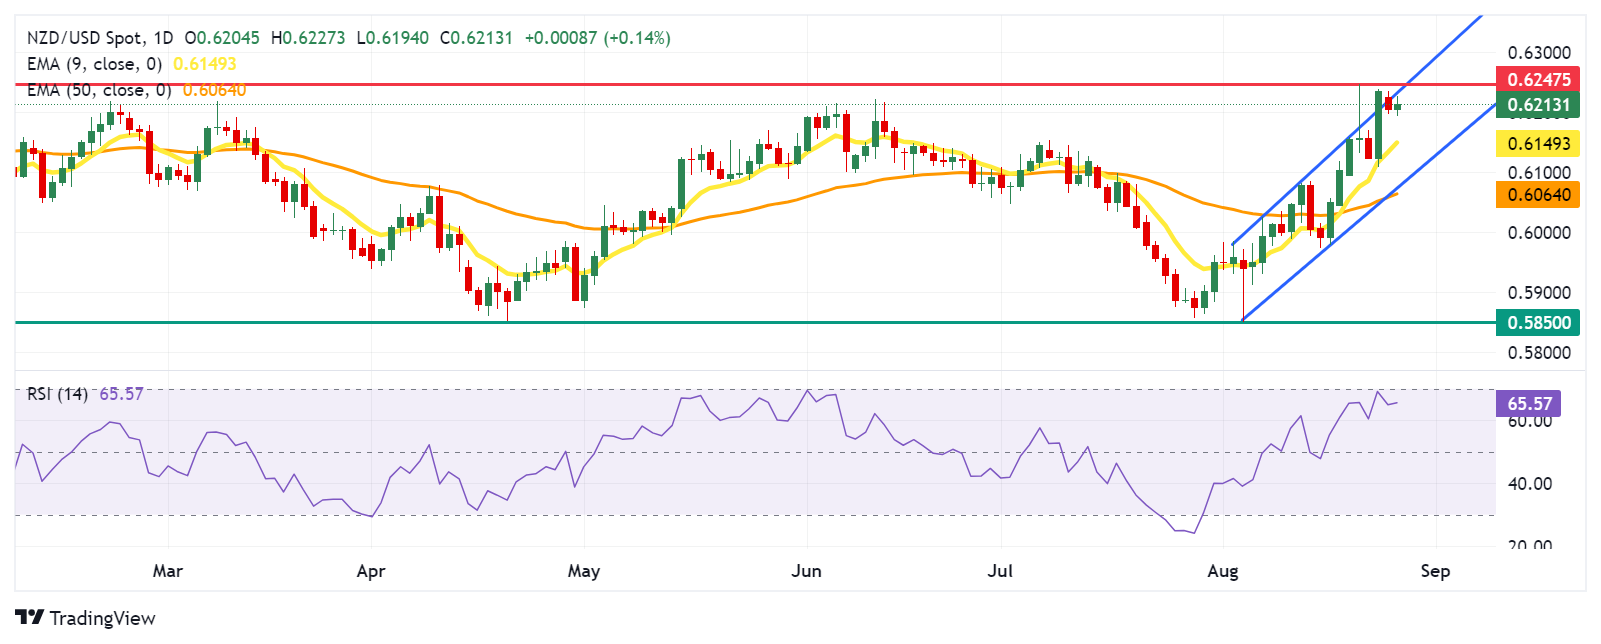
New Zealand Dollar PRICE Today
The table below shows the percentage change of New Zealand Dollar (NZD) against listed major currencies today. New Zealand Dollar was the strongest against the Japanese Yen.
| USD | EUR | GBP | JPY | CAD | AUD | NZD | CHF | |
|---|---|---|---|---|---|---|---|---|
| USD | -0.04% | -0.12% | 0.38% | -0.06% | -0.05% | -0.16% | 0.10% | |
| EUR | 0.04% | -0.07% | 0.42% | -0.03% | -0.00% | -0.14% | 0.14% | |
| GBP | 0.12% | 0.07% | 0.48% | 0.06% | 0.06% | -0.04% | 0.21% | |
| JPY | -0.38% | -0.42% | -0.48% | -0.44% | -0.43% | -0.55% | -0.29% | |
| CAD | 0.06% | 0.03% | -0.06% | 0.44% | 0.02% | -0.11% | 0.17% | |
| AUD | 0.05% | 0.00% | -0.06% | 0.43% | -0.02% | -0.13% | 0.16% | |
| NZD | 0.16% | 0.14% | 0.04% | 0.55% | 0.11% | 0.13% | 0.26% | |
| CHF | -0.10% | -0.14% | -0.21% | 0.29% | -0.17% | -0.16% | -0.26% |
The heat map shows percentage changes of major currencies against each other. The base currency is picked from the left column, while the quote currency is picked from the top row. For example, if you pick the New Zealand Dollar from the left column and move along the horizontal line to the US Dollar, the percentage change displayed in the box will represent NZD (base)/USD (quote).
- EUR/GBP trades in negative territory for the fifth consecutive day around 0.8460 in Tuesday’s early European session.
- The German economy contracted 0.1% QoQ in Q2, compared to the previous reading of -0.1%, in line with estimation.
- BoE’s Bailey said he was “cautiously optimistic” about inflation, but it’s too early to declare victory on inflation.
The EUR/GBP cross extends its downside near 0.8460 during the early European trading hours on Tuesday. The Euro weakens as the sluggish growth outlook in the Eurozone has triggered bets on more rate cuts from the European Central Bank (ECB) in September. The attention will shift to the first reading of German and Eurozone inflation data for August, which are due later this week.
Data released by the Federal Statistics Office of Germany showed on Tuesday that the German Gross Domestic Product (GDP) for the second quarter (Q2) was in line with expectations. The economy contracted 0.1% QoQ in Q2, compared to the previous reading of -0.1%. On an annual basis, the GDP remained unchanged compared to the same quarter in 2023. The Euro remains under selling pressure in an immediate reaction to the German GDP report.
ECB Governing Council member Olli Rehn noted last week that the slowdown in inflation and weakness in the Eurozone economy supported the case for lowering borrowing costs next month. Traders expect the ECB to cut its benchmark interest rates by 25 basis points (bps) in the September meeting, which might continue to weigh on the shared currency in the near term.
The Bank of England (BoE) Governor Andrew Bailey said on Friday that he was “cautiously optimistic” about inflation, but it was premature to declare victory on inflation. The expectation that the UK central bank’s policy-easing cycle will be slower than that of other major central banks provides some support to the Pound Sterling (GBP) and acts as a headwind for EUR/GBP.
GDP FAQs
A country’s Gross Domestic Product (GDP) measures the rate of growth of its economy over a given period of time, usually a quarter. The most reliable figures are those that compare GDP to the previous quarter e.g Q2 of 2023 vs Q1 of 2023, or to the same period in the previous year, e.g Q2 of 2023 vs Q2 of 2022. Annualized quarterly GDP figures extrapolate the growth rate of the quarter as if it were constant for the rest of the year. These can be misleading, however, if temporary shocks impact growth in one quarter but are unlikely to last all year – such as happened in the first quarter of 2020 at the outbreak of the covid pandemic, when growth plummeted.
A higher GDP result is generally positive for a nation’s currency as it reflects a growing economy, which is more likely to produce goods and services that can be exported, as well as attracting higher foreign investment. By the same token, when GDP falls it is usually negative for the currency. When an economy grows people tend to spend more, which leads to inflation. The country’s central bank then has to put up interest rates to combat the inflation with the side effect of attracting more capital inflows from global investors, thus helping the local currency appreciate.
When an economy grows and GDP is rising, people tend to spend more which leads to inflation. The country’s central bank then has to put up interest rates to combat the inflation. Higher interest rates are negative for Gold because they increase the opportunity-cost of holding Gold versus placing the money in a cash deposit account. Therefore, a higher GDP growth rate is usually a bearish factor for Gold price.
- USD/CAD extends its losing streak due to higher Oil prices amid rising geopolitical tensions.
- WTI price gains ground due to rising fears of a broader Middle-East conflict and the potential shutdown of Libyan Oil fields.
- The US Dollar lost ground due to rising odds of a Fed rate cut in September.
USD/CAD loses ground for the third consecutive session, trading around 1.3480 during the early European hours on Tuesday. This downside of the USD/CAD pair could be attributed to the improving commodity-linked Canadian Dollar (CAD) amid rising crude Oil prices.
Crude Oil prices have surged due to concerns over potential supply disruptions, driven by fears of an escalating conflict in the Middle East and the possible shutdown of Libyan oil fields. In parallel, Hamas has rejected Israel's new conditions in ongoing ceasefire negotiations in Egypt, insisting that Israel comply with the terms set forth by US President Joe Biden and the UN Security Council.
However, US Air Force General C.Q. Brown, chairman of the Joint Chiefs of Staff, told Reuters early Tuesday that concerns about an imminent broader conflict in the region have diminished. An exchange of fire between Israel and Lebanon's Hezbollah did not escalate further.
Oil prices gained support from increasing expectations of US interest rate cuts, which could stimulate fuel demand. Lower borrowing costs are likely to boost economic activity in the United States, the world's largest Oil-consuming country.
The US Federal Reserve (Fed) Chairman Jerome Powell stated at the Jackson Hole Symposium on Friday, "The time has come for policy to adjust." However, Powell did not specify when rate cuts would begin or their potential size. According to the CME FedWatch Tool, markets are fully anticipating at least a 25 basis point (bps) rate cut by the Federal Reserve at its September meeting.
Canadian Dollar FAQs
The key factors driving the Canadian Dollar (CAD) are the level of interest rates set by the Bank of Canada (BoC), the price of Oil, Canada’s largest export, the health of its economy, inflation and the Trade Balance, which is the difference between the value of Canada’s exports versus its imports. Other factors include market sentiment – whether investors are taking on more risky assets (risk-on) or seeking safe-havens (risk-off) – with risk-on being CAD-positive. As its largest trading partner, the health of the US economy is also a key factor influencing the Canadian Dollar.
The Bank of Canada (BoC) has a significant influence on the Canadian Dollar by setting the level of interest rates that banks can lend to one another. This influences the level of interest rates for everyone. The main goal of the BoC is to maintain inflation at 1-3% by adjusting interest rates up or down. Relatively higher interest rates tend to be positive for the CAD. The Bank of Canada can also use quantitative easing and tightening to influence credit conditions, with the former CAD-negative and the latter CAD-positive.
The price of Oil is a key factor impacting the value of the Canadian Dollar. Petroleum is Canada’s biggest export, so Oil price tends to have an immediate impact on the CAD value. Generally, if Oil price rises CAD also goes up, as aggregate demand for the currency increases. The opposite is the case if the price of Oil falls. Higher Oil prices also tend to result in a greater likelihood of a positive Trade Balance, which is also supportive of the CAD.
While inflation had always traditionally been thought of as a negative factor for a currency since it lowers the value of money, the opposite has actually been the case in modern times with the relaxation of cross-border capital controls. Higher inflation tends to lead central banks to put up interest rates which attracts more capital inflows from global investors seeking a lucrative place to keep their money. This increases demand for the local currency, which in Canada’s case is the Canadian Dollar.
Macroeconomic data releases gauge the health of the economy and can have an impact on the Canadian Dollar. Indicators such as GDP, Manufacturing and Services PMIs, employment, and consumer sentiment surveys can all influence the direction of the CAD. A strong economy is good for the Canadian Dollar. Not only does it attract more foreign investment but it may encourage the Bank of Canada to put up interest rates, leading to a stronger currency. If economic data is weak, however, the CAD is likely to fall.
Gold prices fell in Pakistan on Tuesday, according to data compiled by FXStreet.
The price for Gold stood at 22,514.53 Pakistani Rupees (PKR) per gram, down compared with the PKR 22,558.78 it cost on Monday.
The price for Gold decreased to PKR 262,609.20 per tola from PKR 263,121.20 per tola a day earlier.
| Unit measure | Gold Price in PKR |
|---|---|
| 1 Gram | 22,514.53 |
| 10 Grams | 225,144.40 |
| Tola | 262,609.20 |
| Troy Ounce | 700,272.20 |
FXStreet calculates Gold prices in Pakistan by adapting international prices (USD/PKR) to the local currency and measurement units. Prices are updated daily based on the market rates taken at the time of publication. Prices are just for reference and local rates could diverge slightly.
Gold FAQs
Gold has played a key role in human’s history as it has been widely used as a store of value and medium of exchange. Currently, apart from its shine and usage for jewelry, the precious metal is widely seen as a safe-haven asset, meaning that it is considered a good investment during turbulent times. Gold is also widely seen as a hedge against inflation and against depreciating currencies as it doesn’t rely on any specific issuer or government.
Central banks are the biggest Gold holders. In their aim to support their currencies in turbulent times, central banks tend to diversify their reserves and buy Gold to improve the perceived strength of the economy and the currency. High Gold reserves can be a source of trust for a country’s solvency. Central banks added 1,136 tonnes of Gold worth around $70 billion to their reserves in 2022, according to data from the World Gold Council. This is the highest yearly purchase since records began. Central banks from emerging economies such as China, India and Turkey are quickly increasing their Gold reserves.
Gold has an inverse correlation with the US Dollar and US Treasuries, which are both major reserve and safe-haven assets. When the Dollar depreciates, Gold tends to rise, enabling investors and central banks to diversify their assets in turbulent times. Gold is also inversely correlated with risk assets. A rally in the stock market tends to weaken Gold price, while sell-offs in riskier markets tend to favor the precious metal.
The price can move due to a wide range of factors. Geopolitical instability or fears of a deep recession can quickly make Gold price escalate due to its safe-haven status. As a yield-less asset, Gold tends to rise with lower interest rates, while higher cost of money usually weighs down on the yellow metal. Still, most moves depend on how the US Dollar (USD) behaves as the asset is priced in dollars (XAU/USD). A strong Dollar tends to keep the price of Gold controlled, whereas a weaker Dollar is likely to push Gold prices up.
(An automation tool was used in creating this post.)
- EUR/JPY gains ground around 161.60 in Tuesday’s early European session, up 0.20% on the day.
- Investors will focus on the German Q2 GDP report, which is due on Tuesday.
- Hawkish signals from the BoJ are largely ignored as traders await fresh catalysts.
The EUR/JPY cross trades on a stronger note near 161.60 during the early European session on Tuesday. The uncertainty about the future rate path in Japan weighs on the Japanese Yen (JPY) and creates a tailwind for EUR/JPY.
The hawkish comments from the Bank of Japan’s (BoJ) Governor Kazuo Ueda fail to boost the JPY as traders await clearer guidance on the future rate path. Japan’s Tokyo Consumer Price Index (CPI) on Friday will be in the spotlight. BoJ’s Ueda said last week that the Japanese central bank could raise interest rates further if its economic projections are accurate.
Market players will also keep an eye on the geopolitical tensions in the Middle East. Any signs of escalation could boost safe-haven flows and lift the JPY. Hamas rejects fresh Israeli conditions in ceasefire talks in Egypt and insists that Israel be bound by the terms of a proposal laid out by US President Joe Biden and the UN Security Council, per local news agency Aljazeera.
The European Central Bank’s (ECB) chief economist Philip Lane said there had been “good progress” so far in taming price pressures in the Eurozone. However, the goal of getting inflation back to 2% is “not yet secure,” and the interest rates will need to stay restrictive for the time being. Investors will take more cues from the German Gross Domestic Product (GDP) for the second quarter, which is due on Tuesday.
Later this week, the Eurozone inflation data will be closely watched. Markets expect the ECB to cut interest rates twice this year, with the next move set for September. The ECB rate cut expectation might weigh on the Euro (EUR) against the JPY in the near term.
Japanese Yen FAQs
The Japanese Yen (JPY) is one of the world’s most traded currencies. Its value is broadly determined by the performance of the Japanese economy, but more specifically by the Bank of Japan’s policy, the differential between Japanese and US bond yields, or risk sentiment among traders, among other factors.
One of the Bank of Japan’s mandates is currency control, so its moves are key for the Yen. The BoJ has directly intervened in currency markets sometimes, generally to lower the value of the Yen, although it refrains from doing it often due to political concerns of its main trading partners. The current BoJ ultra-loose monetary policy, based on massive stimulus to the economy, has caused the Yen to depreciate against its main currency peers. This process has exacerbated more recently due to an increasing policy divergence between the Bank of Japan and other main central banks, which have opted to increase interest rates sharply to fight decades-high levels of inflation.
The BoJ’s stance of sticking to ultra-loose monetary policy has led to a widening policy divergence with other central banks, particularly with the US Federal Reserve. This supports a widening of the differential between the 10-year US and Japanese bonds, which favors the US Dollar against the Japanese Yen.
The Japanese Yen is often seen as a safe-haven investment. This means that in times of market stress, investors are more likely to put their money in the Japanese currency due to its supposed reliability and stability. Turbulent times are likely to strengthen the Yen’s value against other currencies seen as more risky to invest in.
- USD/CHF loses ground due to dovish sentiment surrounding the Fed.
- Safe-haven flows, driven by rising tensions in the Middle East, are supporting the Swiss Franc.
- Swiss Non-Farm Payrolls rose by 1.3% YoY, reaching a record 5.499 million in the second quarter.
USD/CHF extends its losing streak for the third successive day, trading around 0.8470 during the Asian hours on Tuesday. The USD/CHF pair may decline further due to safe-haven flows toward the Swiss Franc (CHF). The risk aversion sentiment prevails due to rising geopolitical tensions in the Middle East.
Hamas has rejected new conditions proposed by Israel in ceasefire negotiations in Egypt, insisting that Israel adhere to the terms outlined by US President Joe Biden and the UN Security Council. However, US Air Force General C.Q. Brown, chairman of the Joint Chiefs of Staff, told Reuters early Tuesday that concerns about an imminent broader conflict in the region have diminished. An exchange of fire between Israel and Lebanon's Hezbollah did not escalate further.
The US Federal Reserve (Fed) Chairman Jerome Powell stated at the Jackson Hole Symposium on Friday, "The time has come for policy to adjust." However, Powell did not specify when rate cuts would begin or their potential size. According to the CME FedWatch Tool, markets are fully anticipating at least a 25 basis point (bps) rate cut by the Federal Reserve at its September meeting.
In the second quarter, Switzerland's Non-Farm Payrolls increased by 1.3% year-on-year, reaching a record 5.499 million, following a 1.8% rise in the previous quarter. Employment in the industrial sector rose by 0.7% to 1.134 million, with growth across all sectors. Meanwhile, employment in the services sector grew by 1.4% to 4.365 million.
The expansion of the labor market is less likely to influence market speculation regarding further interest rate cuts by the Swiss National Bank (SNB) in September. Furthermore, traders are expected to focus on the Swiss ZEW Survey – Expectations for August, scheduled for release on Wednesday.
Swiss Franc FAQs
The Swiss Franc (CHF) is Switzerland’s official currency. It is among the top ten most traded currencies globally, reaching volumes that well exceed the size of the Swiss economy. Its value is determined by the broad market sentiment, the country’s economic health or action taken by the Swiss National Bank (SNB), among other factors. Between 2011 and 2015, the Swiss Franc was pegged to the Euro (EUR). The peg was abruptly removed, resulting in a more than 20% increase in the Franc’s value, causing a turmoil in markets. Even though the peg isn’t in force anymore, CHF fortunes tend to be highly correlated with the Euro ones due to the high dependency of the Swiss economy on the neighboring Eurozone.
The Swiss Franc (CHF) is considered a safe-haven asset, or a currency that investors tend to buy in times of market stress. This is due to the perceived status of Switzerland in the world: a stable economy, a strong export sector, big central bank reserves or a longstanding political stance towards neutrality in global conflicts make the country’s currency a good choice for investors fleeing from risks. Turbulent times are likely to strengthen CHF value against other currencies that are seen as more risky to invest in.
The Swiss National Bank (SNB) meets four times a year – once every quarter, less than other major central banks – to decide on monetary policy. The bank aims for an annual inflation rate of less than 2%. When inflation is above target or forecasted to be above target in the foreseeable future, the bank will attempt to tame price growth by raising its policy rate. Higher interest rates are generally positive for the Swiss Franc (CHF) as they lead to higher yields, making the country a more attractive place for investors. On the contrary, lower interest rates tend to weaken CHF.
Macroeconomic data releases in Switzerland are key to assessing the state of the economy and can impact the Swiss Franc’s (CHF) valuation. The Swiss economy is broadly stable, but any sudden change in economic growth, inflation, current account or the central bank’s currency reserves have the potential to trigger moves in CHF. Generally, high economic growth, low unemployment and high confidence are good for CHF. Conversely, if economic data points to weakening momentum, CHF is likely to depreciate.
As a small and open economy, Switzerland is heavily dependent on the health of the neighboring Eurozone economies. The broader European Union is Switzerland’s main economic partner and a key political ally, so macroeconomic and monetary policy stability in the Eurozone is essential for Switzerland and, thus, for the Swiss Franc (CHF). With such dependency, some models suggest that the correlation between the fortunes of the Euro (EUR) and the CHF is more than 90%, or close to perfect.
Gold prices fell in India on Tuesday, according to data compiled by FXStreet.
The price for Gold stood at 6,766.61 Indian Rupees (INR) per gram, down compared with the INR 6,795.38 it cost on Monday.
The price for Gold decreased to INR 78,923.83 per tola from INR 79,259.98 per tola a day earlier.
| Unit measure | Gold Price in INR |
|---|---|
| 1 Gram | 6,766.61 |
| 10 Grams | 67,665.60 |
| Tola | 78,923.83 |
| Troy Ounce | 210,465.40 |
FXStreet calculates Gold prices in India by adapting international prices (USD/INR) to the local currency and measurement units. Prices are updated daily based on the market rates taken at the time of publication. Prices are just for reference and local rates could diverge slightly.
Gold FAQs
Gold has played a key role in human’s history as it has been widely used as a store of value and medium of exchange. Currently, apart from its shine and usage for jewelry, the precious metal is widely seen as a safe-haven asset, meaning that it is considered a good investment during turbulent times. Gold is also widely seen as a hedge against inflation and against depreciating currencies as it doesn’t rely on any specific issuer or government.
Central banks are the biggest Gold holders. In their aim to support their currencies in turbulent times, central banks tend to diversify their reserves and buy Gold to improve the perceived strength of the economy and the currency. High Gold reserves can be a source of trust for a country’s solvency. Central banks added 1,136 tonnes of Gold worth around $70 billion to their reserves in 2022, according to data from the World Gold Council. This is the highest yearly purchase since records began. Central banks from emerging economies such as China, India and Turkey are quickly increasing their Gold reserves.
Gold has an inverse correlation with the US Dollar and US Treasuries, which are both major reserve and safe-haven assets. When the Dollar depreciates, Gold tends to rise, enabling investors and central banks to diversify their assets in turbulent times. Gold is also inversely correlated with risk assets. A rally in the stock market tends to weaken Gold price, while sell-offs in riskier markets tend to favor the precious metal.
The price can move due to a wide range of factors. Geopolitical instability or fears of a deep recession can quickly make Gold price escalate due to its safe-haven status. As a yield-less asset, Gold tends to rise with lower interest rates, while higher cost of money usually weighs down on the yellow metal. Still, most moves depend on how the US Dollar (USD) behaves as the asset is priced in dollars (XAU/USD). A strong Dollar tends to keep the price of Gold controlled, whereas a weaker Dollar is likely to push Gold prices up.
(An automation tool was used in creating this post.)
- EUR/USD gains ground due to improved market sentiment amid easing geopolitical tensions.
- US Air Force General told that concerns about an imminent broader conflict in the Middle East have diminished.
- Traders await the German GfK Consumer Confidence Survey and Gross Domestic Product data, which are scheduled for release on Tuesday.
EUR/USD recovers its recent losses from the previous session, trading around 1.1170 during the Asian hours on Tuesday. The market optimism prevails after concluding a three-day trip to the Middle East, US Air Force General C.Q. Brown, chairman of the Joint Chiefs of Staff, told Reuters early Tuesday that concerns about an imminent broader conflict in the region have diminished.
An exchange of fire between Israel and Lebanon's Hezbollah did not escalate further. However, Hamas has rejected new conditions proposed by Israel in ceasefire negotiations in Egypt, insisting that Israel adhere to the terms outlined by US President Joe Biden and the UN Security Council.
On the Fedspeak front, San Francisco Federal Reserve President Mary Daly stated on Monday in an interview with Bloomberg TV that "the time is upon us" to begin cutting interest rates, likely starting with a quarter-percentage point reduction. Daly suggested that if inflation continues to slow gradually and the labor market maintains a "steady, sustainable" pace of job growth, it would be reasonable to "adjust policy at the regular, normal cadence."
On the EUR front, traders assess the extent to which consolidated expectations of incoming rate cuts by the Federal Reserve will impact European Central Bank (ECB) borrowing costs. Additionally, GfK Consumer Confidence Survey and Gross Domestic Product (GDP) data will be eyed later in the day.
ECB Governing Council member Olli Rehn stated last week that the slowdown in inflation, coupled with weakness in the Eurozone economy, bolsters the case for lowering borrowing costs next month, according to Bloomberg. The subdued growth outlook in Europe, particularly in manufacturing, reinforces the argument for a rate cut in September.
Euro PRICE Today
The table below shows the percentage change of Euro (EUR) against listed major currencies today. Euro was the strongest against the Japanese Yen.
| USD | EUR | GBP | JPY | CAD | AUD | NZD | CHF | |
|---|---|---|---|---|---|---|---|---|
| USD | -0.07% | -0.04% | 0.12% | -0.04% | -0.18% | -0.22% | -0.04% | |
| EUR | 0.07% | 0.03% | 0.19% | 0.02% | -0.12% | -0.17% | 0.04% | |
| GBP | 0.04% | -0.03% | 0.17% | 0.01% | -0.14% | -0.17% | 0.01% | |
| JPY | -0.12% | -0.19% | -0.17% | -0.16% | -0.30% | -0.35% | -0.15% | |
| CAD | 0.04% | -0.02% | -0.01% | 0.16% | -0.14% | -0.19% | 0.01% | |
| AUD | 0.18% | 0.12% | 0.14% | 0.30% | 0.14% | -0.06% | 0.16% | |
| NZD | 0.22% | 0.17% | 0.17% | 0.35% | 0.19% | 0.06% | 0.19% | |
| CHF | 0.04% | -0.04% | -0.01% | 0.15% | -0.01% | -0.16% | -0.19% |
The heat map shows percentage changes of major currencies against each other. The base currency is picked from the left column, while the quote currency is picked from the top row. For example, if you pick the Euro from the left column and move along the horizontal line to the US Dollar, the percentage change displayed in the box will represent EUR (base)/USD (quote).
Euro FAQs
The Euro is the currency for the 20 European Union countries that belong to the Eurozone. It is the second most heavily traded currency in the world behind the US Dollar. In 2022, it accounted for 31% of all foreign exchange transactions, with an average daily turnover of over $2.2 trillion a day. EUR/USD is the most heavily traded currency pair in the world, accounting for an estimated 30% off all transactions, followed by EUR/JPY (4%), EUR/GBP (3%) and EUR/AUD (2%).
The European Central Bank (ECB) in Frankfurt, Germany, is the reserve bank for the Eurozone. The ECB sets interest rates and manages monetary policy. The ECB’s primary mandate is to maintain price stability, which means either controlling inflation or stimulating growth. Its primary tool is the raising or lowering of interest rates. Relatively high interest rates – or the expectation of higher rates – will usually benefit the Euro and vice versa. The ECB Governing Council makes monetary policy decisions at meetings held eight times a year. Decisions are made by heads of the Eurozone national banks and six permanent members, including the President of the ECB, Christine Lagarde.
Eurozone inflation data, measured by the Harmonized Index of Consumer Prices (HICP), is an important econometric for the Euro. If inflation rises more than expected, especially if above the ECB’s 2% target, it obliges the ECB to raise interest rates to bring it back under control. Relatively high interest rates compared to its counterparts will usually benefit the Euro, as it makes the region more attractive as a place for global investors to park their money.
Data releases gauge the health of the economy and can impact on the Euro. Indicators such as GDP, Manufacturing and Services PMIs, employment, and consumer sentiment surveys can all influence the direction of the single currency. A strong economy is good for the Euro. Not only does it attract more foreign investment but it may encourage the ECB to put up interest rates, which will directly strengthen the Euro. Otherwise, if economic data is weak, the Euro is likely to fall. Economic data for the four largest economies in the euro area (Germany, France, Italy and Spain) are especially significant, as they account for 75% of the Eurozone’s economy.
Another significant data release for the Euro is the Trade Balance. This indicator measures the difference between what a country earns from its exports and what it spends on imports over a given period. If a country produces highly sought after exports then its currency will gain in value purely from the extra demand created from foreign buyers seeking to purchase these goods. Therefore, a positive net Trade Balance strengthens a currency and vice versa for a negative balance.
- GBP/USD inches higher due to improved market optimism amid easing Middle-East tensions.
- San Francisco Fed President Daly supported the idea of starting to cut interest rates, with a reduction of 25 basis points.
- UK PM Starmer may emphasize that "change won't happen overnight," but he is committed to tackling bigger issues.
GBP/USD inches higher following the easing of the concerns about an imminent broader conflict in the Middle East have diminished following an exchange of fire between Israel and Lebanon's Hezbollah that did not escalate further. US Air Force General C.Q. Brown, chairman of the Joint Chiefs of Staff, told Reuters early Tuesday after concluding a three-day trip to the region. The risk-sensitive GBP/USD pair trades around 1.3190 during Tuesday’s Asian hours.
The US Federal Reserve (Fed) Chairman Jerome Powell stated at the Jackson Hole Symposium on Friday, "The time has come for policy to adjust." However, Powell did not specify when rate cuts would begin or their potential size. According to the CME FedWatch Tool, markets are fully anticipating at least a 25 basis point (bps) rate cut by the Federal Reserve at its September meeting.
Additionally, San Francisco Federal Reserve President Mary Daly stated on Monday in an interview with Bloomberg TV that "the time is upon us" to begin cutting interest rates, likely starting with a quarter-percentage point reduction. Daly suggested that if inflation continues to slow gradually and the labor market maintains a "steady, sustainable" pace of job growth, it would be reasonable to "adjust policy at the regular, normal cadence."
In the United Kingdom (UK), the BRC Shop Price Index fell by 0.3% year-on-year in August compared with the previous increase of 0.2% in July. British shop prices fell in annual terms this month for the first time since October 2021, pushed down by summer sales of clothes and household goods.
UK Prime Minister Keir Starmer stated last week that addressing Britain's numerous challenges will take time, warning that "things will get worse before they get better" in a speech he described as an opportunity to be candid with the public. As Britain's parliament returns to work after the summer break on Tuesday, Starmer may emphasize that "change won't happen overnight," but his government is committed to tackling a wide range of issues, from overcrowded prisons to long waiting lists for health services.
British Pound PRICE Today
The table below shows the percentage change of British Pound (GBP) against listed major currencies today. British Pound was the strongest against the Japanese Yen.
| USD | EUR | GBP | JPY | CAD | AUD | NZD | CHF | |
|---|---|---|---|---|---|---|---|---|
| USD | -0.05% | -0.02% | 0.25% | -0.05% | -0.17% | -0.16% | 0.02% | |
| EUR | 0.05% | 0.04% | 0.31% | -0.01% | -0.11% | -0.13% | 0.08% | |
| GBP | 0.02% | -0.04% | 0.29% | -0.02% | -0.15% | -0.15% | 0.04% | |
| JPY | -0.25% | -0.31% | -0.29% | -0.30% | -0.42% | -0.43% | -0.23% | |
| CAD | 0.05% | 0.01% | 0.02% | 0.30% | -0.12% | -0.12% | 0.09% | |
| AUD | 0.17% | 0.11% | 0.15% | 0.42% | 0.12% | -0.02% | 0.20% | |
| NZD | 0.16% | 0.13% | 0.15% | 0.43% | 0.12% | 0.02% | 0.19% | |
| CHF | -0.02% | -0.08% | -0.04% | 0.23% | -0.09% | -0.20% | -0.19% |
The heat map shows percentage changes of major currencies against each other. The base currency is picked from the left column, while the quote currency is picked from the top row. For example, if you pick the British Pound from the left column and move along the horizontal line to the US Dollar, the percentage change displayed in the box will represent GBP (base)/USD (quote).
- NZD/USD holds positive ground around 0.6210 in Tuesday’s Asian session.
- The rising expectation of a Fed rate cut weighs on USD and supports NZD/USD.
- Geopolitical tension in the Middle East might boost safe-haven flows and help limit the USD’s losses.
The NZD/USD pair edges higher to near 0.6210 during the Asian trading hours on Tuesday. The Federal Reserve’s (Fed) dovish stance and firmer US rate cut expectation continue to undermine the US Dollar (USD) broadly. Traders will closely monitor the key US data, including advanced Gross Domestic Product (GDP) Annualized for the second quarter (Q2) and Personal Consumption Expenditures (PCE) Price Index data, which are due later this week.
San Francisco Fed President Mary Daly said on Monday that she believes it’s appropriate for the Fed to begin cutting interest rates. Her dovish remarks echoed comments from Fed Chair Jerome Powell at the Jackson Hole symposium on Friday. Powell has already concluded that the Fed has brought down inflation while preserving labor market strength. Financial markets have fully priced in a 25 basis points (bps) rate cut, while the chance of a deeper rate cut stands at 30%, down from 36.5 % last Friday, according to the CME FedWatch Tool.
On the Kiwi front, the Reserve Bank of New Zealand (RBNZ) has begun its easing cycle, lowering its Official Cash Rate (OCR) to 5.25% in August. Traders expect the New Zealand central bank to cut additional interest rates by 25 basis points (bps) in October and November. This, in turn, might drag the New Zealand Dollar (NZD) lower against the Greenback.
Additionally, the ongoing geopolitical risks in the Middle East could boost the safe-haven flows, benefiting the USD. US Air Force General C.Q. Brown, chairman of the Joint Chiefs of Staff, said early Tuesday that fears of a near-term broader Middle East war have ebbed after Israel and Lebanon’s Hezbollah exchanged fire without further escalation. Nonetheless, the US top general warned that “Iran still poses a significant danger as it weighs a strike on Israel,” per Reuters.
New Zealand Dollar FAQs
The New Zealand Dollar (NZD), also known as the Kiwi, is a well-known traded currency among investors. Its value is broadly determined by the health of the New Zealand economy and the country’s central bank policy. Still, there are some unique particularities that also can make NZD move. The performance of the Chinese economy tends to move the Kiwi because China is New Zealand’s biggest trading partner. Bad news for the Chinese economy likely means less New Zealand exports to the country, hitting the economy and thus its currency. Another factor moving NZD is dairy prices as the dairy industry is New Zealand’s main export. High dairy prices boost export income, contributing positively to the economy and thus to the NZD.
The Reserve Bank of New Zealand (RBNZ) aims to achieve and maintain an inflation rate between 1% and 3% over the medium term, with a focus to keep it near the 2% mid-point. To this end, the bank sets an appropriate level of interest rates. When inflation is too high, the RBNZ will increase interest rates to cool the economy, but the move will also make bond yields higher, increasing investors’ appeal to invest in the country and thus boosting NZD. On the contrary, lower interest rates tend to weaken NZD. The so-called rate differential, or how rates in New Zealand are or are expected to be compared to the ones set by the US Federal Reserve, can also play a key role in moving the NZD/USD pair.
Macroeconomic data releases in New Zealand are key to assess the state of the economy and can impact the New Zealand Dollar’s (NZD) valuation. A strong economy, based on high economic growth, low unemployment and high confidence is good for NZD. High economic growth attracts foreign investment and may encourage the Reserve Bank of New Zealand to increase interest rates, if this economic strength comes together with elevated inflation. Conversely, if economic data is weak, NZD is likely to depreciate.
The New Zealand Dollar (NZD) tends to strengthen during risk-on periods, or when investors perceive that broader market risks are low and are optimistic about growth. This tends to lead to a more favorable outlook for commodities and so-called ‘commodity currencies’ such as the Kiwi. Conversely, NZD tends to weaken at times of market turbulence or economic uncertainty as investors tend to sell higher-risk assets and flee to the more-stable safe havens.
- The Japanese Yen declines despite a hawkish mood surrounding the BoJ’s policy outlook.
- The downside of the JPY could be limited as traders expect the BoJ to increase interest rates further.
- US Fed Chair Powell signaled a rate cut soon, which puts downward pressure on the US Dollar.
The Japanese Yen (JPY) continues to lose ground against the US Dollar (USD) for the second consecutive day on Tuesday. However, the downside of the JPY could be restrained due to the hawkish mood surrounding the Bank of Japan (BoJ).
Additionally, the contrasting statements from the BoJ and the Federal Reserve (Fed) regarding their policy outlooks are putting downward pressure on the USD/JPY pair. BoJ Governor Kazuo Ueda stated in Parliament on Friday that the central bank could raise interest rates further if its economic projections are accurate.
Meanwhile, Fed Chair Jerome Powell stated at the Jackson Hole Symposium, "The time has come for policy to adjust." However, Powell did not specify when rate cuts would begin or their potential size. Additionally, San Francisco Federal Reserve President Mary Daly stated on Monday in an interview with Bloomberg TV that "the time is upon us" to begin cutting interest rates, likely starting with a quarter-percentage point reduction.
Daily Digest Market Movers: Japanese Yen edges lower despite a hawkish BoJ
- According to the CME FedWatch Tool, markets are fully anticipating at least a 25 basis point (bps) rate cut by the Federal Reserve at its September meeting.
- Japan’s Finance Minister Shunichi Suzuki stated on Tuesday that foreign exchange rates are influenced by a variety of factors, including monetary policies, interest rate differentials, geopolitical risks, and market sentiment. Suzuki added that it is difficult to predict how these factors will impact FX rates.
- US Durable Goods Orders surged by 9.9% month-over-month in July, rebounding from a 6.9% decline in June. This increase significantly outpaced the expected 4.0% rise, marking the largest gain since May 2020.
- Bloomberg reported on Friday that Philadelphia Fed President Patrick Harker emphasized the need for the US central bank to lower interest rates gradually. Meanwhile, Reuters reported that Chicago Fed President Austan Goolsbee noted that monetary policy is currently at its most restrictive, with the Fed now focusing on achieving its employment mandate.
- Bank of Japan (BoJ) Governor Kazuo Ueda addressed the Japanese parliament on Friday, stating that he is “not considering selling long-term Japanese government bonds (JGBs) as a tool for adjusting interest rates.” He noted that any reduction in JGB purchases would only account for about 7-8% of the balance sheet, which is a relatively small decrease. Ueda added that if the economy aligns with their projections, there could be a phase where they might adjust interest rates slightly further.
- Japan’s National Consumer Price Index increased by 2.8% year-on-year in July, maintaining this rate for the third consecutive month and remaining at its highest level since February. Additionally, the National CPI excluding Fresh Food rose by 2.7%, the highest reading since February, aligning with expectations.
- The US Composite PMI edged down to 54.1 in August, a four-month low, from 54.3 in July, but remained above market expectations of 53.5. This indicates continued expansion in US business activity, marking 19 consecutive months of growth.
- FOMC Minutes for July’s policy meeting indicated that most Fed officials agreed last month that they would likely cut their benchmark interest rate at the upcoming meeting in September as long as inflation continued to cool.
Technical Analysis: USD/JPY tests a psychological level at 145.00
USD/JPY trades around 144.90 on Tuesday. Analysis of the daily chart shows that the pair is testing the downtrend line, suggesting a weakening bearish bias. However, the 14-day Relative Strength Index (RSI) remains slightly above 30, suggesting a confirmation of a bearish trend.
On the downside, if the USD/JPY pair stays below the downtrend line, it could hover around the seven-month low of 141.69, recorded on August 5. A break below this level might push the pair toward the throwback support at 140.25.
In terms of resistance, the USD/JPY pair may challenge the immediate barrier at the nine-day Exponential Moving Average (EMA) around the 145.67 level. A breakthrough above this level could pave the way for the pair to explore the area near the throwback-turned-resistance at 154.50.
USD/JPY: Daily Chart
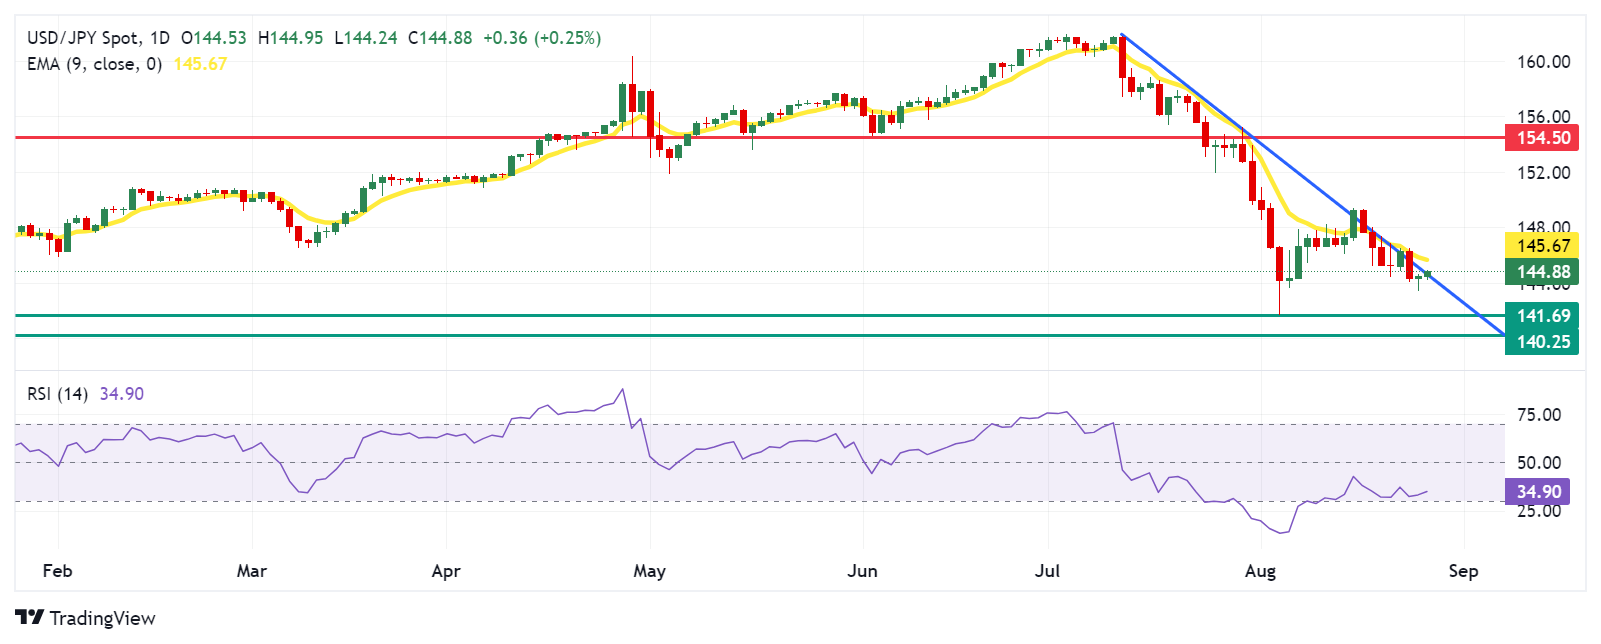
Japanese Yen PRICE Today
The table below shows the percentage change of Japanese Yen (JPY) against listed major currencies today. Japanese Yen was the weakest against the New Zealand Dollar.
| USD | EUR | GBP | JPY | CAD | AUD | NZD | CHF | |
|---|---|---|---|---|---|---|---|---|
| USD | -0.07% | -0.02% | 0.20% | -0.05% | -0.11% | -0.12% | -0.00% | |
| EUR | 0.07% | 0.05% | 0.26% | 0.00% | -0.03% | -0.07% | 0.07% | |
| GBP | 0.02% | -0.05% | 0.23% | -0.02% | -0.08% | -0.10% | 0.02% | |
| JPY | -0.20% | -0.26% | -0.23% | -0.25% | -0.31% | -0.34% | -0.21% | |
| CAD | 0.05% | -0.01% | 0.02% | 0.25% | -0.06% | -0.08% | 0.06% | |
| AUD | 0.11% | 0.03% | 0.08% | 0.31% | 0.06% | -0.04% | 0.11% | |
| NZD | 0.12% | 0.07% | 0.10% | 0.34% | 0.08% | 0.04% | 0.12% | |
| CHF | 0.00% | -0.07% | -0.02% | 0.21% | -0.06% | -0.11% | -0.12% |
The heat map shows percentage changes of major currencies against each other. The base currency is picked from the left column, while the quote currency is picked from the top row. For example, if you pick the Japanese Yen from the left column and move along the horizontal line to the US Dollar, the percentage change displayed in the box will represent JPY (base)/USD (quote).
Japanese Yen FAQs
The Japanese Yen (JPY) is one of the world’s most traded currencies. Its value is broadly determined by the performance of the Japanese economy, but more specifically by the Bank of Japan’s policy, the differential between Japanese and US bond yields, or risk sentiment among traders, among other factors.
One of the Bank of Japan’s mandates is currency control, so its moves are key for the Yen. The BoJ has directly intervened in currency markets sometimes, generally to lower the value of the Yen, although it refrains from doing it often due to political concerns of its main trading partners. The current BoJ ultra-loose monetary policy, based on massive stimulus to the economy, has caused the Yen to depreciate against its main currency peers. This process has exacerbated more recently due to an increasing policy divergence between the Bank of Japan and other main central banks, which have opted to increase interest rates sharply to fight decades-high levels of inflation.
The BoJ’s stance of sticking to ultra-loose monetary policy has led to a widening policy divergence with other central banks, particularly with the US Federal Reserve. This supports a widening of the differential between the 10-year US and Japanese bonds, which favors the US Dollar against the Japanese Yen.
The Japanese Yen is often seen as a safe-haven investment. This means that in times of market stress, investors are more likely to put their money in the Japanese currency due to its supposed reliability and stability. Turbulent times are likely to strengthen the Yen’s value against other currencies seen as more risky to invest in.
- The Indian Rupee weakens in Tuesday’s early Asian session.
- Month-end USD demand and higher crude oil prices weigh on the INR.
- Traders await the US August CB’s Consumer Confidence ahead of the key events later this week.
The Indian Rupee (INR) trades on a weaker note on Tuesday. The US Dollar (USD) demand from local banks and corporates during the month-end, and a surge in crude oil prices are likely to cap the local currency’s gains. On the other hand, the upside of the pair might be limited due to the dovish remarks from US Federal Reserve (Fed) Chair Jerome Powell at the Jackson Hole Symposium, which have triggered the possibility of a deeper rate cut in the September meeting.
Investors will keep an eye on the US Conference Board’s Consumer Confidence for August on Tuesday. The advanced US Gross Domestic Product (GDP) Annualized for the second quarter (Q2) and Personal Consumption Expenditures (PCE) Price Index data will be closely watched this week. On the Indian docket, the GDP Quarterly for Q1 will be published on Friday.
Daily Digest Market Movers: Indian Rupee remains vulnerable amid global factors and challenges
- “We expect the rupee to trade with a slight positive bias on risk in global risk sentiments amid dovish Fed speak and rising expectations of a rate cut by the Fed in September. However, geopolitical tensions in the Middle East and rising crude oil prices may cap the sharp upside,” said Anuj Choudhary, Research Analyst at Sharekhan by BNP Paribas.
- India's economic growth likely expanded at its slowest pace in a year in the April-June quarter due to lower government spending, according to a Reuters poll.
- San Francisco Fed President Mary Daly said on Monday that "the time is upon us" to cut interest rates, likely starting with a quarter-percentage point reduction in borrowing costs, per Reuters.
- Richmond Fed President Thomas Barkin stated on Monday that he will take a 'test and learn' approach to rate cuts.
- The US Durable Goods Orders increased $26.1 billion, or 9.9%, to $289.6 billion in July, from a -6.9% contraction in June. This figure was above the market consensus of a 4% increase and marked the most significant gain since May 2020.
- Futures are currently pricing in a near 40% odds of a half-percentage point cut in interest rates.
Technical Analysis: USD/INR remains bullish in the longer term
The Indian Rupee trades softer on the day. The USD/INR pair maintains a positive outlook above the key 100-day Exponential Moving Average (EMA) on the daily chart. However, the price has crossed below the three-month-old uptrend line, while the 14-day Relative Strength Index (RSI) hovers around the midline, suggesting further consolidation cannot be ruled out.
The support-turned-resistance level at the 84.00 psychological mark acts as an immediate upside barrier for USD/INR. Further north, the next target emerges at the record high of 84.24 en route to 84.50.
On the downside, the initial support level is located at 83.77, the low of August 20. A break below the mentioned level will see a drop to the 100-day EMA at 83.57.
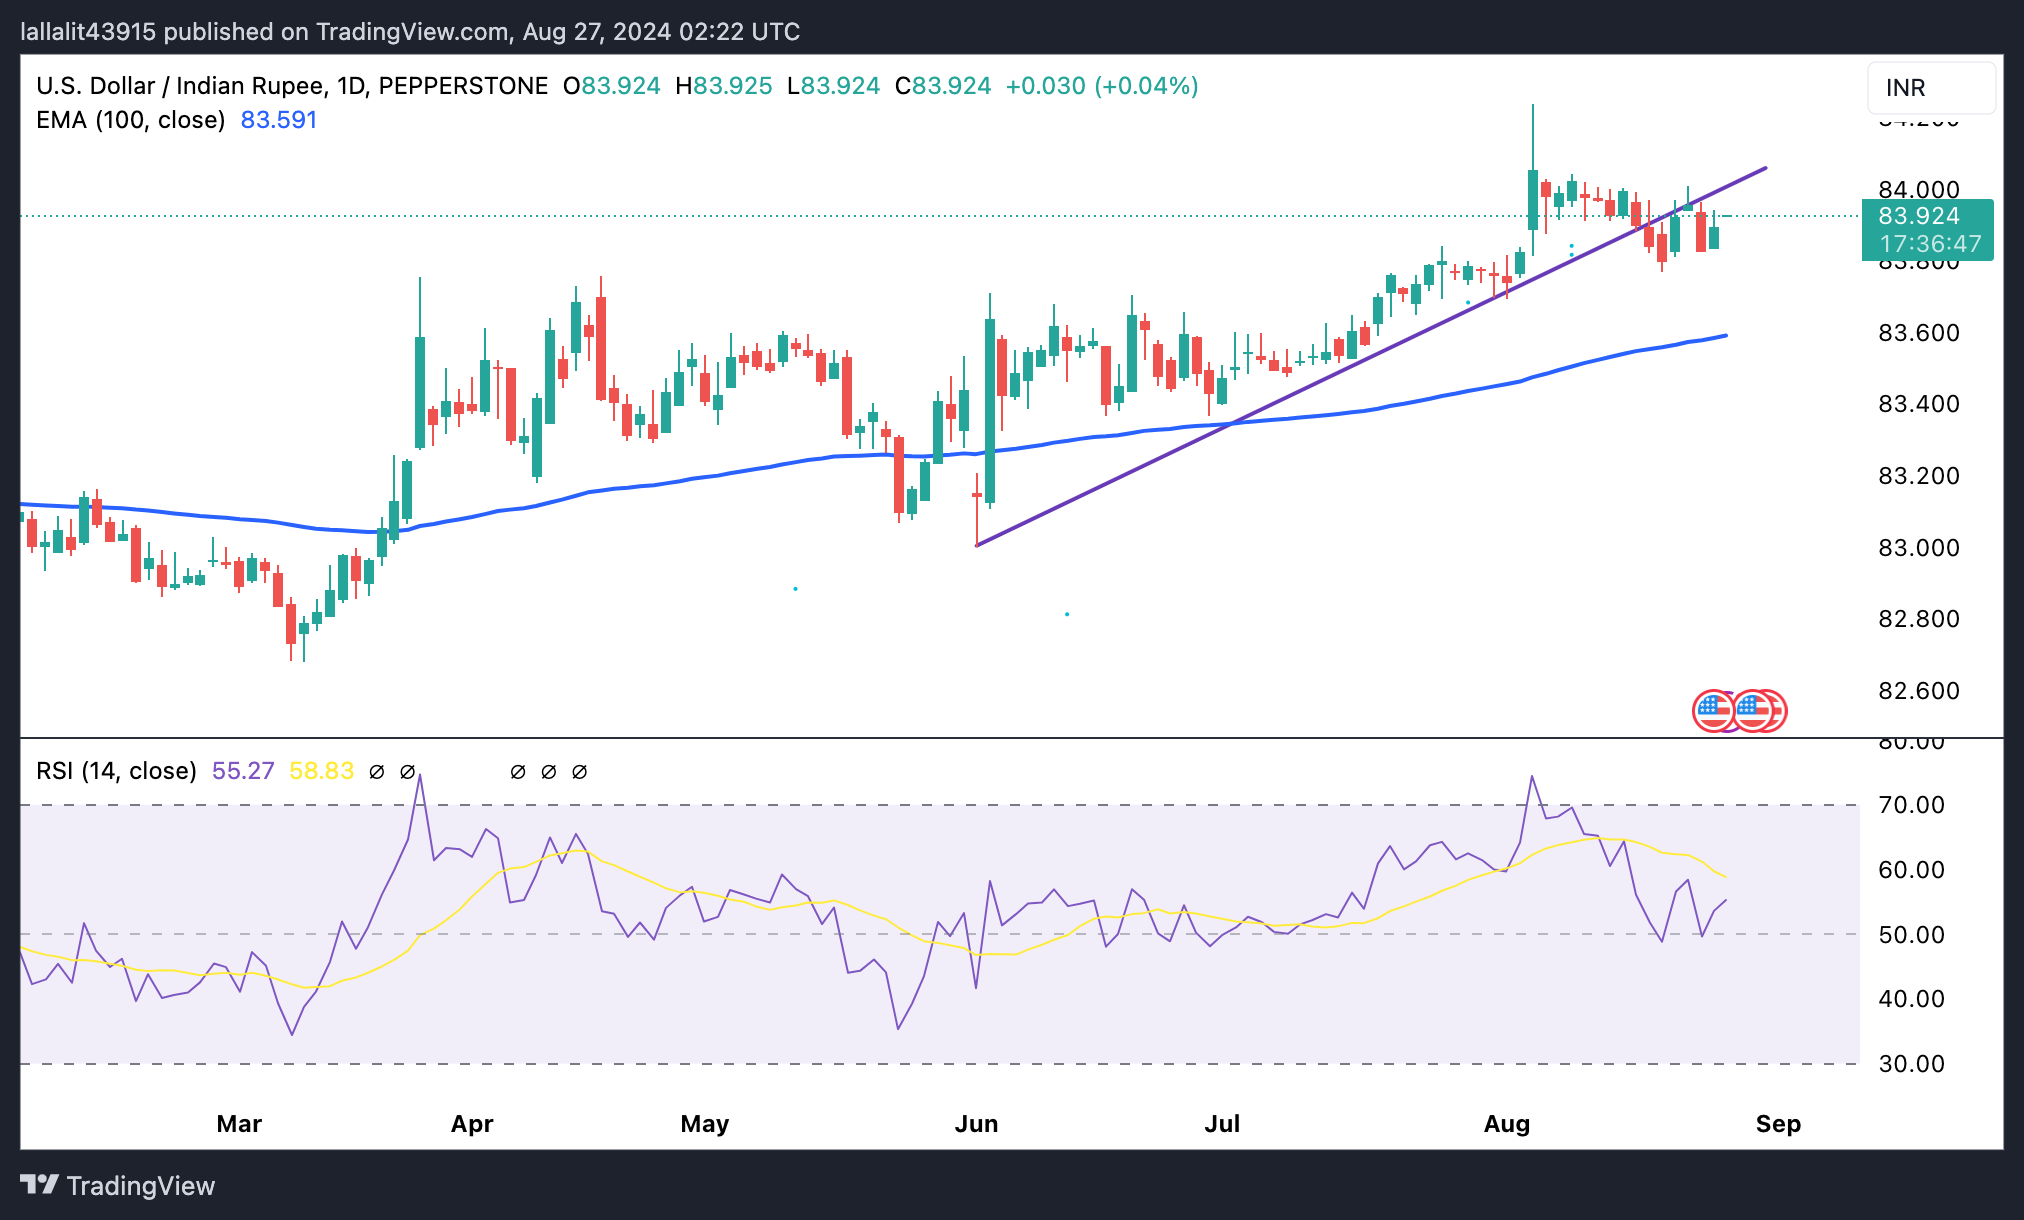
US Dollar price today
The table below shows the percentage change of US Dollar (USD) against listed major currencies today. US Dollar was the weakest against the New Zealand Dollar.
| USD | EUR | GBP | CAD | AUD | JPY | NZD | CHF | |
| USD | -0.01% | 0.03% | 0.00% | -0.03% | 0.28% | -0.06% | 0.03% | |
| EUR | 0.01% | 0.04% | 0.00% | -0.03% | 0.30% | -0.04% | 0.04% | |
| GBP | -0.03% | -0.04% | -0.03% | -0.06% | 0.26% | -0.09% | 0.00% | |
| CAD | -0.01% | -0.02% | 0.03% | -0.05% | 0.28% | -0.07% | 0.02% | |
| AUD | 0.06% | 0.02% | 0.07% | 0.03% | 0.32% | -0.02% | 0.07% | |
| JPY | -0.28% | -0.28% | -0.25% | -0.29% | -0.30% | -0.34% | -9925.70% | |
| NZD | 0.06% | 0.06% | 0.08% | 0.05% | 0.04% | 0.34% | 0.08% | |
| CHF | -0.03% | -0.04% | 0.00% | -0.03% | -0.07% | 0.29% | -0.08% |
The heat map shows percentage changes of major currencies against each other. The base currency is picked from the left column, while the quote currency is picked from the top row. For example, if you pick the Euro from the left column and move along the horizontal line to the Japanese Yen, the percentage change displayed in the box will represent EUR (base)/JPY (quote).
Indian Rupee FAQs
The Indian Rupee (INR) is one of the most sensitive currencies to external factors. The price of Crude Oil (the country is highly dependent on imported Oil), the value of the US Dollar – most trade is conducted in USD – and the level of foreign investment, are all influential. Direct intervention by the Reserve Bank of India (RBI) in FX markets to keep the exchange rate stable, as well as the level of interest rates set by the RBI, are further major influencing factors on the Rupee.
The Reserve Bank of India (RBI) actively intervenes in forex markets to maintain a stable exchange rate, to help facilitate trade. In addition, the RBI tries to maintain the inflation rate at its 4% target by adjusting interest rates. Higher interest rates usually strengthen the Rupee. This is due to the role of the ‘carry trade’ in which investors borrow in countries with lower interest rates so as to place their money in countries’ offering relatively higher interest rates and profit from the difference.
Macroeconomic factors that influence the value of the Rupee include inflation, interest rates, the economic growth rate (GDP), the balance of trade, and inflows from foreign investment. A higher growth rate can lead to more overseas investment, pushing up demand for the Rupee. A less negative balance of trade will eventually lead to a stronger Rupee. Higher interest rates, especially real rates (interest rates less inflation) are also positive for the Rupee. A risk-on environment can lead to greater inflows of Foreign Direct and Indirect Investment (FDI and FII), which also benefit the Rupee.
Higher inflation, particularly, if it is comparatively higher than India’s peers, is generally negative for the currency as it reflects devaluation through oversupply. Inflation also increases the cost of exports, leading to more Rupees being sold to purchase foreign imports, which is Rupee-negative. At the same time, higher inflation usually leads to the Reserve Bank of India (RBI) raising interest rates and this can be positive for the Rupee, due to increased demand from international investors. The opposite effect is true of lower inflation.
| Raw materials | Closed | Change, % |
|---|---|---|
| Silver | 29.908 | 0.11 |
| Gold | 251.811 | 0.24 |
| Palladium | 959.05 | -0 |
- Silver price consolidates around a psychological level of $30.00 with a positive bias.
- Rising Middle-East tensions may provide support for the safe-haven Silver.
- The non-yielding grey metal receives support from rising expectations of a Fed rate cut in September.
Silver price (XAG/USD) hovers around $29.90 per troy ounce during the Asian session on Monday. The market sentiment is in favor of safe-haven assets following the rising geopolitical tensions in the Middle East.
Hamas has rejected new conditions proposed by Israel in ceasefire negotiations in Egypt, insisting that Israel adhere to the terms outlined by US President Joe Biden and the UN Security Council, according to reports from Al Jazeera.
After concluding a three-day trip to the Middle East, US Air Force General C.Q. Brown, chairman of the Joint Chiefs of Staff, told Reuters early Tuesday that concerns about an imminent broader conflict in the region have diminished following an exchange of fire between Israel and Lebanon's Hezbollah that did not escalate further.
Read more: Top US General Brown: Risk of broader war ‘somewhat’ abated after Israel-Hezbollah clash
The non-yielding assets like Silver gains ground amid rising odds of a rate cut by the US Federal Reserve (Fed) in September. Fed Chairman Jerome Powell stated at the Jackson Hole Symposium on Friday, "The time has come for policy to adjust." However, Powell did not specify when rate cuts would begin or their potential size.
Additionally, San Francisco Federal Reserve President Mary Daly stated on Monday in an interview with Bloomberg TV that "the time is upon us" to begin cutting interest rates, likely starting with a quarter-percentage point reduction.
Silver FAQs
Silver is a precious metal highly traded among investors. It has been historically used as a store of value and a medium of exchange. Although less popular than Gold, traders may turn to Silver to diversify their investment portfolio, for its intrinsic value or as a potential hedge during high-inflation periods. Investors can buy physical Silver, in coins or in bars, or trade it through vehicles such as Exchange Traded Funds, which track its price on international markets.
Silver prices can move due to a wide range of factors. Geopolitical instability or fears of a deep recession can make Silver price escalate due to its safe-haven status, although to a lesser extent than Gold's. As a yieldless asset, Silver tends to rise with lower interest rates. Its moves also depend on how the US Dollar (USD) behaves as the asset is priced in dollars (XAG/USD). A strong Dollar tends to keep the price of Silver at bay, whereas a weaker Dollar is likely to propel prices up. Other factors such as investment demand, mining supply – Silver is much more abundant than Gold – and recycling rates can also affect prices.
Silver is widely used in industry, particularly in sectors such as electronics or solar energy, as it has one of the highest electric conductivity of all metals – more than Copper and Gold. A surge in demand can increase prices, while a decline tends to lower them. Dynamics in the US, Chinese and Indian economies can also contribute to price swings: for the US and particularly China, their big industrial sectors use Silver in various processes; in India, consumers’ demand for the precious metal for jewellery also plays a key role in setting prices.
Silver prices tend to follow Gold's moves. When Gold prices rise, Silver typically follows suit, as their status as safe-haven assets is similar. The Gold/Silver ratio, which shows the number of ounces of Silver needed to equal the value of one ounce of Gold, may help to determine the relative valuation between both metals. Some investors may consider a high ratio as an indicator that Silver is undervalued, or Gold is overvalued. On the contrary, a low ratio might suggest that Gold is undervalued relative to Silver.
Japan’s Finance Minister Shunichi Suzuki said on Tuesday that “FX rates are determined by various factors, not just monetary policies and interest rate differentials but also by geopolitical risks, market sentiment and others..”
Further comments
Hard to tell how those factors would impact FX rates.
Will monitor how changes in US monetary policies would affect through various channels.
Market reaction
USD/JPY stays bid below 145.00 following these comments, adding 0.15% on the day.
Speaking to Reuters after concluding a three-day trip to the Middle East, US Air Force General C.Q. Brown, chairman of the Joint Chiefs of Staff, said early Tuesday that fears of a near-term broader Middle East conflict have ebbed after Israel and Lebanon’s Hezbollah exchanged fire without further escalation.
However, the US top General warned that “Iran still poses a significant danger as it weighs a strike on Israel.”
Additional quotes
“You had two things you knew were going to happen. One’s already happened. Now it depends on how the second is going to play out.”
“How Iran responds will dictate how Israel responds, which will dictate whether there is going to be a broader conflict or not.”
“Hezbollah’s strike was just one of two major threatened attacks against Israel that emerged in recent weeks.”
“Iran is also threatening an attack over the killing of a Hamas leader in Tehran last month.”
- The Australian Dollar holds ground as the RBA is highly expected to adopt a hawkish stance regarding its policy outlook.
- The Aussie Dollar may advance further as RBA minutes indicated that a rate cut is unlikely soon.
- The US Dollar received downward pressure as the Fed Chair Powell signaled a rate cut soon.
The Australian Dollar (AUD) moves sideways against the US Dollar (USD) on Tuesday, holding a position just below the seven-month high of 0.6798 recorded on Monday. However, the downside of the AUD/USD pair would be limited as traders expect different policy outlooks between the two central banks.
The recent Reserve Bank of Australia (RBA) Minutes showed that the board members agreed that a rate cut is unlikely soon. Additionally, RBA Governor Michele Bullock expressed that the Australian central bank will not hesitate to raise rates again to combat inflation if needed.
The US Federal Reserve (Fed) Chairman Jerome Powell stated at the Jackson Hole Symposium on Friday, "The time has come for policy to adjust." However, Powell did not specify when rate cuts would begin or their potential size.
According to the CME FedWatch Tool, markets are fully anticipating at least a 25 basis point (bps) rate cut by the Federal Reserve at its September meeting.
Daily Digest Market Movers: Australian Dollar holds ground amid a hawkish RBA
- San Francisco Federal Reserve President Mary Daly stated on Monday in an interview with Bloomberg TV that "the time is upon us" to begin cutting interest rates, likely starting with a quarter-percentage point reduction. Daly suggested that if inflation continues to slow gradually and the labor market maintains a "steady, sustainable" pace of job growth, it would be reasonable to "adjust policy at the regular, normal cadence."
- US Durable Goods Orders surged by 9.9% month-over-month in July, rebounding from a 6.9% decline in June. This increase significantly outpaced the expected 4.0% rise, marking the largest gain since May 2020.
- Bloomberg reported on Friday that Philadelphia Fed President Patrick Harker emphasized the need for the US central bank to lower interest rates gradually. Meanwhile, Reuters reported that Chicago Fed President Austan Goolsbee noted that monetary policy is currently at its most restrictive, with the Fed now focusing on achieving its employment mandate.
- The US Composite PMI dipped slightly to 54.1 in August, a four-month low, down from 54.3 in July, yet remained above market expectations of 53.5. This suggests that US business activity continues to expand, marking 19 straight months of growth.
- Australia's Judo Bank Composite Purchasing Managers Index (PMI) rose to 51.4 in August, up from 49.9 in July. This increase marks the fastest expansion in three months, driven by a stronger performance in the services sector, despite a more pronounced contraction in manufacturing production.
- FOMC Minutes for July’s policy meeting indicated that most Fed officials agreed last month that they would likely cut their benchmark interest rate at the upcoming meeting in September as long as inflation continued to cool.
- On Tuesday, the RBA Minutes suggested that the board members had considered a rate hike earlier this month before ultimately deciding that maintaining current rates would better balance the risks. Additionally, RBA members agreed that a rate cut is unlikely soon.
Technical Analysis: Australian Dollar remains below 0.6800
The Australian Dollar trades around 0.6770 on Friday. Daily chart analysis shows the AUD/USD pair has breached below the ascending channel, suggesting a weakening of a bullish bias. However, the 14-day Relative Strength Index (RSI) remains below the 70 mark, supporting the ongoing bullish trend.
In terms of resistance, the AUD/USD pair tests the immediate barrier at the seven-month high of 0.6798 level, followed by the lower boundary of the ascending channel at 0.6800 level. A break above this level could lead the pair to explore the region around the upper boundary of the ascending channel at the 0.6940 level.
On the downside, the AUD/USD pair may find support around the nine-day Exponential Moving Average (EMA) at the 0.6726 level. A break below the nine-day EMA could weaken the bullish bias and put downward pressure on the pair to navigate the region around the throwback level at 0.6575, followed by another throwback level at 0.6470.
AUD/USD: Daily Chart
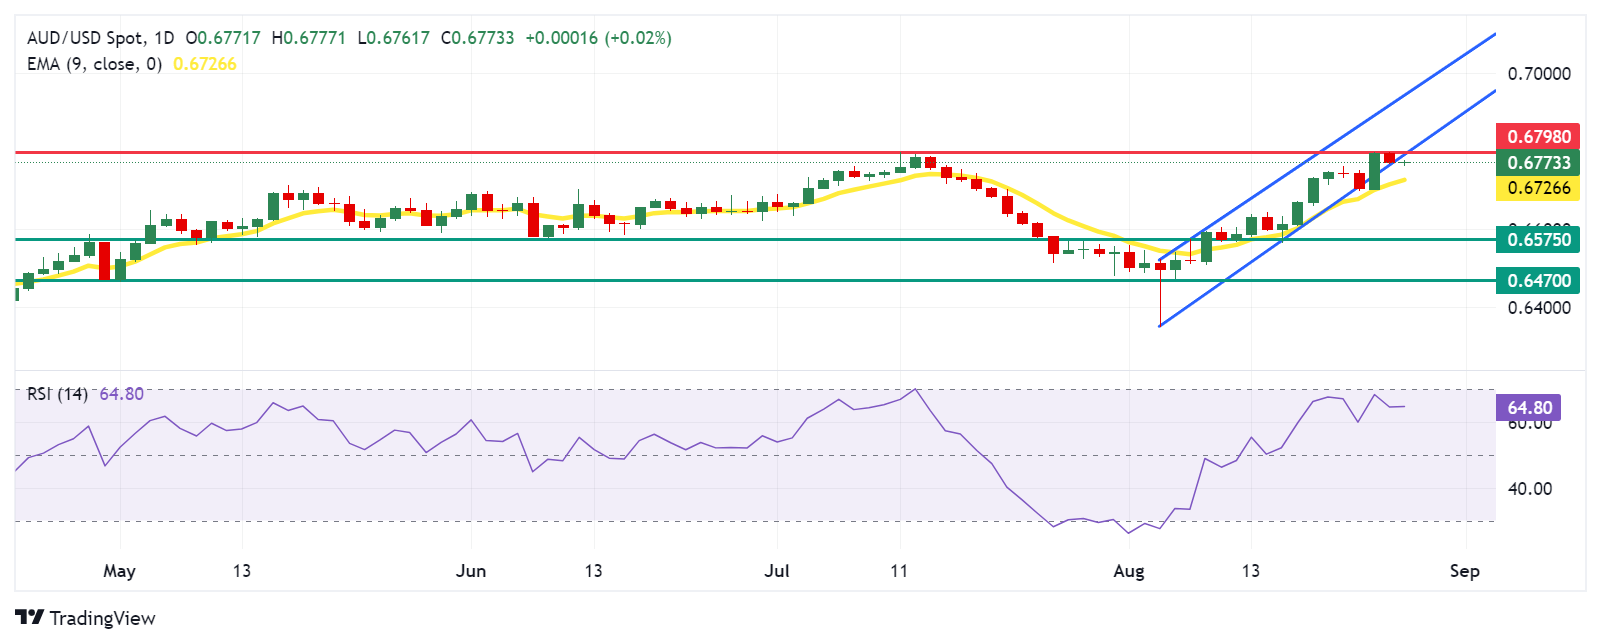
Australian Dollar PRICE Today
The table below shows the percentage change of Australian Dollar (AUD) against listed major currencies today. Australian Dollar was the weakest against the Euro.
| USD | EUR | GBP | JPY | CAD | AUD | NZD | CHF | |
|---|---|---|---|---|---|---|---|---|
| USD | -0.05% | -0.00% | 0.13% | -0.02% | -0.02% | 0.02% | -0.02% | |
| EUR | 0.05% | 0.05% | 0.19% | 0.01% | 0.04% | 0.03% | 0.04% | |
| GBP | 0.00% | -0.05% | 0.15% | -0.01% | -0.01% | 0.00% | -0.01% | |
| JPY | -0.13% | -0.19% | -0.15% | -0.15% | -0.15% | -0.14% | -0.15% | |
| CAD | 0.02% | -0.01% | 0.01% | 0.15% | 0.00% | 0.02% | 0.02% | |
| AUD | 0.02% | -0.04% | 0.01% | 0.15% | -0.01% | 0.00% | 0.00% | |
| NZD | -0.02% | -0.03% | -0.01% | 0.14% | -0.02% | -0.00% | -0.02% | |
| CHF | 0.02% | -0.04% | 0.00% | 0.15% | -0.02% | -0.01% | 0.02% |
The heat map shows percentage changes of major currencies against each other. The base currency is picked from the left column, while the quote currency is picked from the top row. For example, if you pick the Australian Dollar from the left column and move along the horizontal line to the US Dollar, the percentage change displayed in the box will represent AUD (base)/USD (quote).
Australian Dollar FAQs
One of the most significant factors for the Australian Dollar (AUD) is the level of interest rates set by the Reserve Bank of Australia (RBA). Because Australia is a resource-rich country another key driver is the price of its biggest export, Iron Ore. The health of the Chinese economy, its largest trading partner, is a factor, as well as inflation in Australia, its growth rate and Trade Balance. Market sentiment – whether investors are taking on more risky assets (risk-on) or seeking safe-havens (risk-off) – is also a factor, with risk-on positive for AUD.
The Reserve Bank of Australia (RBA) influences the Australian Dollar (AUD) by setting the level of interest rates that Australian banks can lend to each other. This influences the level of interest rates in the economy as a whole. The main goal of the RBA is to maintain a stable inflation rate of 2-3% by adjusting interest rates up or down. Relatively high interest rates compared to other major central banks support the AUD, and the opposite for relatively low. The RBA can also use quantitative easing and tightening to influence credit conditions, with the former AUD-negative and the latter AUD-positive.
China is Australia’s largest trading partner so the health of the Chinese economy is a major influence on the value of the Australian Dollar (AUD). When the Chinese economy is doing well it purchases more raw materials, goods and services from Australia, lifting demand for the AUD, and pushing up its value. The opposite is the case when the Chinese economy is not growing as fast as expected. Positive or negative surprises in Chinese growth data, therefore, often have a direct impact on the Australian Dollar and its pairs.
Iron Ore is Australia’s largest export, accounting for $118 billion a year according to data from 2021, with China as its primary destination. The price of Iron Ore, therefore, can be a driver of the Australian Dollar. Generally, if the price of Iron Ore rises, AUD also goes up, as aggregate demand for the currency increases. The opposite is the case if the price of Iron Ore falls. Higher Iron Ore prices also tend to result in a greater likelihood of a positive Trade Balance for Australia, which is also positive of the AUD.
The Trade Balance, which is the difference between what a country earns from its exports versus what it pays for its imports, is another factor that can influence the value of the Australian Dollar. If Australia produces highly sought after exports, then its currency will gain in value purely from the surplus demand created from foreign buyers seeking to purchase its exports versus what it spends to purchase imports. Therefore, a positive net Trade Balance strengthens the AUD, with the opposite effect if the Trade Balance is negative.
The People’s Bank of China (PBOC) set the USD/CNY central rate for the trading session ahead on Tuesday at 7.1139, as against the previous day's fix of 7.1139 and 7.1245 Reuters estimates.
- Gold price attracts some sellers in Tuesday’s early Asian session.
- Rising bets of a US rate cut this year and escalating geopolitical conflicts might cap the Gold’s downside.
- Investors will watch the US CB’s Consumer Confidence and Housing Price Index data, which are due on Tuesday.
The Gold price (XAU/USD) trades in negative territory amid the modest recovery of the US Dollar (USD) on Tuesday. Nonetheless, the signal from US Federal Reserve (Fed) Chair Jerome Powell at Jackson Hole to start cutting interest rates is likely to support the precious metal. Lower interest rates are generally positive for gold as they reduce the opportunity cost of holding non-interest-paying assets. Furthermore, the rising geopolitical tensions in the Middle East might further boost Gold, a traditional safe-haven asset.
The People's Bank of China (PBOC) halted gold purchases in July, marking the third straight month it did not acquire for reserves. Traders will watch the August data for fresh impetus. The concerns about the sluggish economy and the demand for precious metals in China could drag the price of gold down as China is the largest producer and consumer of gold worldwide.
The US Conference Board’s Consumer Confidence for August and Housing Price Index for June are due on Tuesday. Later this week, the preliminary US Gross Domestic Product (GDP) Annualized for the second quarter and Personal Consumption Expenditures (PCE) - Price Index data will be in the spotlight.
Daily Digest Market Movers: Gold price loses traction, potential downside seems limited
- Hamas rejects fresh Israeli conditions in ceasefire talks in Egypt and insists that Israel be bound by the terms of a proposal laid out by US President Joe Biden and the UN Security Council, per local news agency Aljazeera.
- Federal Reserve (Fed) Bank of San Francisco President Mary Daly said that it’s appropriate for the Fed to begin cutting interest rates, adding that she doesn’t want to keep making policy tighter as inflation comes down.
- Richmond Fed President Thomas Barkin noted that he will take a 'test and learn' approach to rate cuts.
- Fed Chair Powell said on Friday at the Kansas City Fed's annual economic symposium in Jackson Hole, "The time has come for policy to adjust.” Powell further stated that he was confident inflation was on its way towards the Fed’s 2% target.
- The US Durable Goods Orders jumped to 9.9% MoM in July from a -6.9% contraction in June, stronger than the 4% increase expected. This figure registered the most significant gain since May 2020.
- According to the CME FedWatch Tool, the markets have fully priced in a 25 basis points (bps) rate cut, while the possibility of a deeper rate cut stands at 30%, down from 36.5% last Friday.
Technical Analysis: Gold price’s broader bullish picture remains intact
Gold price edges lower on the day. The yellow metal remains capped under a five-month-old ascending channel upper boundary. Nonetheless, a broader bullish outlook prevails as the precious metal is well-supported above the key 100-day Exponential Moving Average (EMA) on the daily chart. The 14-day Relative Strength Index (RSI) holds above the midline near 92.95, indicating sustained strength.
If Gold busts through the resistance areas and sustainably sees bullish candlesticks above the $2,530-$2,540 zone, the record high and the upper boundary of the trend channel, XAU/USD could make a play for the $2,600 psychological barrier.
On the other hand, any follow-through selling below the low of August 22 at $2,470 could draw in more technical sellers and take the Gold down to the next support zone at $2,432, the low of August 15. The key contention level to watch is the $2,360-$2,370 zone, the lower limit of the trend channel and the 100-day EMA.
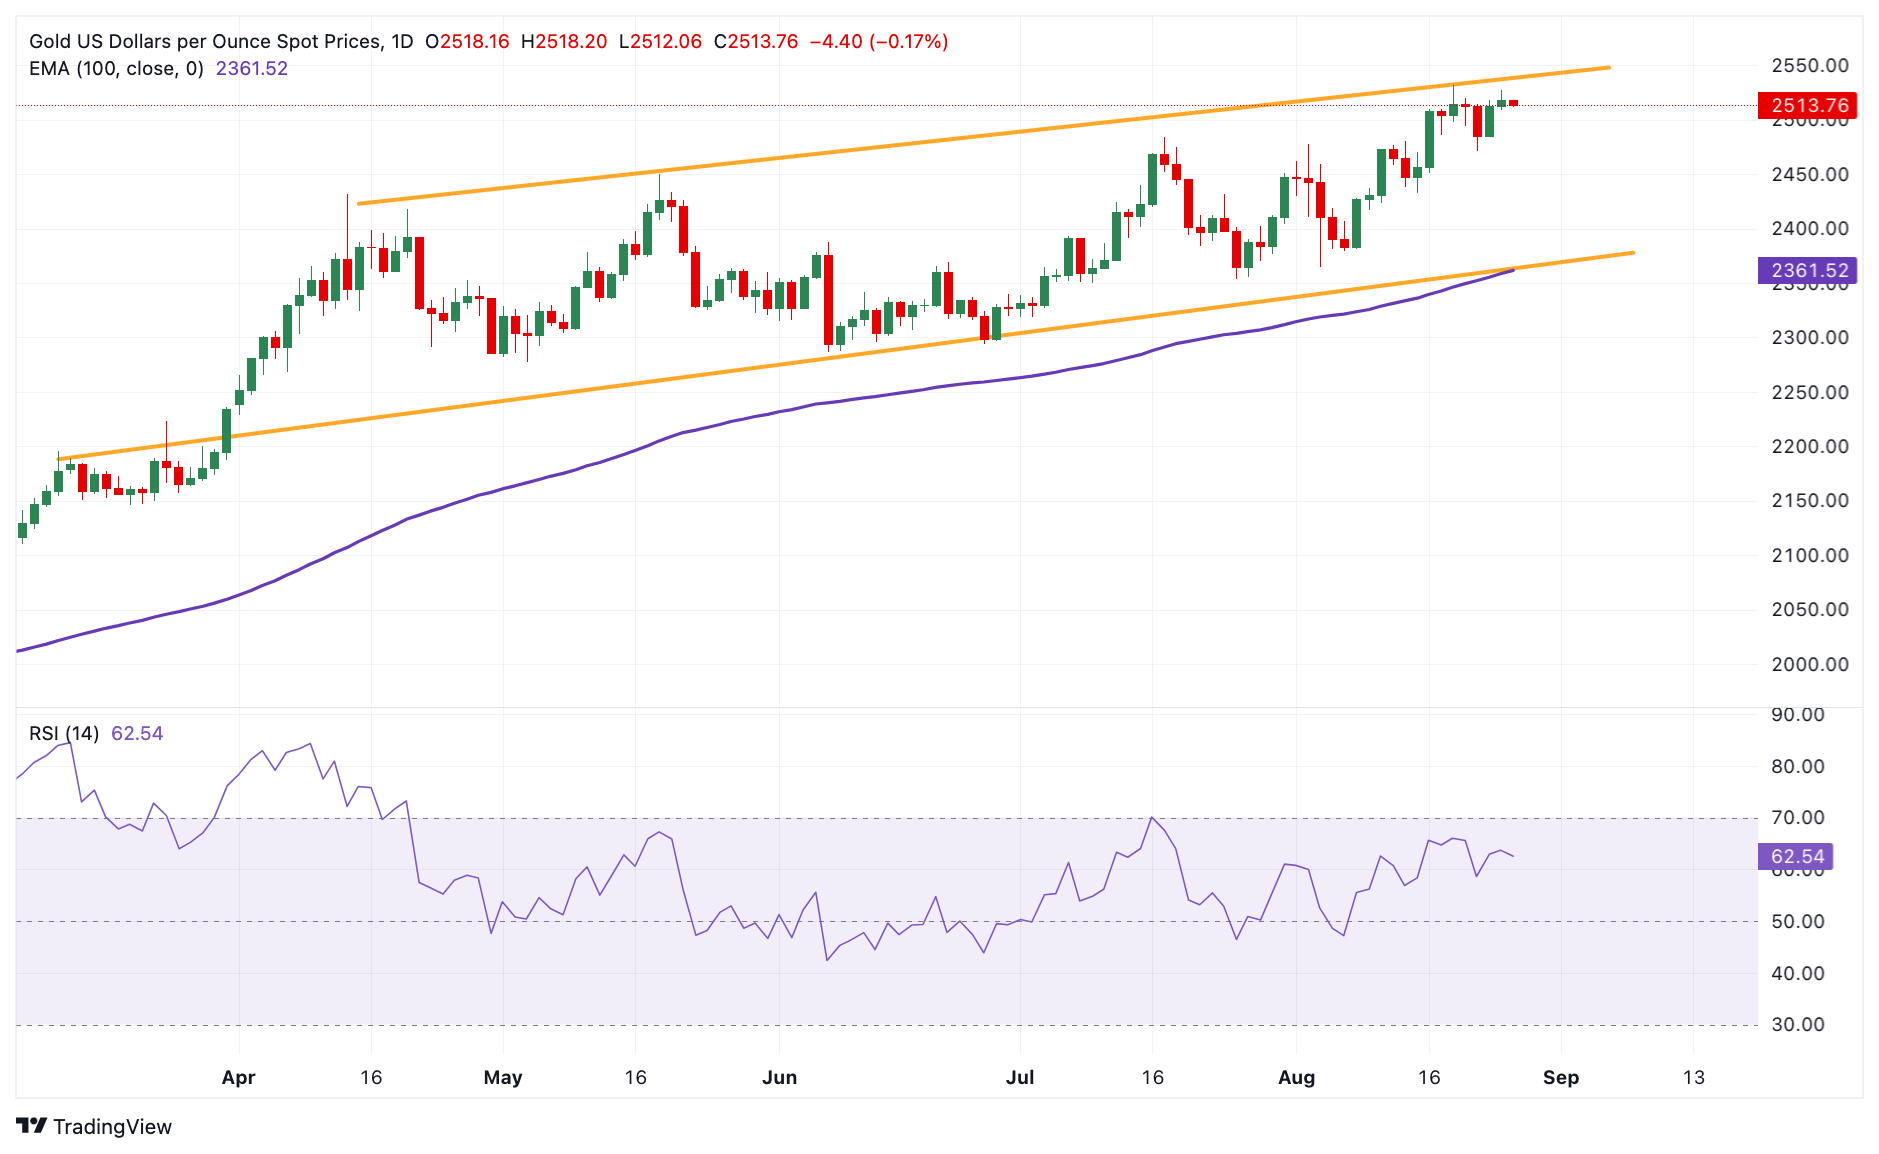
US Dollar price this week
The table below shows the percentage change of US Dollar (USD) against listed major currencies this week. US Dollar was the weakest against the Canadian Dollar.
| USD | EUR | GBP | CAD | AUD | JPY | NZD | CHF | |
| USD | 0.19% | 0.15% | -0.22% | 0.21% | 0.17% | 0.24% | -0.10% | |
| EUR | -0.20% | -0.05% | -0.42% | 0.01% | -0.02% | 0.05% | -0.29% | |
| GBP | -0.15% | 0.03% | -0.37% | 0.05% | 0.02% | 0.11% | -0.25% | |
| CAD | 0.22% | 0.41% | 0.38% | 0.42% | 0.43% | 0.47% | 0.12% | |
| AUD | -0.19% | 0.00% | -0.05% | -0.43% | -0.02% | 0.05% | -0.28% | |
| JPY | -0.18% | 0.02% | -0.04% | -0.43% | 0.00% | 0.02% | -9927.67% | |
| NZD | -0.24% | -0.07% | -0.09% | -0.47% | -0.04% | -0.07% | -0.35% | |
| CHF | 0.08% | 0.29% | 0.25% | -0.12% | 0.31% | 0.28% | 0.35% |
The heat map shows percentage changes of major currencies against each other. The base currency is picked from the left column, while the quote currency is picked from the top row. For example, if you pick the Euro from the left column and move along the horizontal line to the Japanese Yen, the percentage change displayed in the box will represent EUR (base)/JPY (quote).
Gold FAQs
Gold has played a key role in human’s history as it has been widely used as a store of value and medium of exchange. Currently, apart from its shine and usage for jewelry, the precious metal is widely seen as a safe-haven asset, meaning that it is considered a good investment during turbulent times. Gold is also widely seen as a hedge against inflation and against depreciating currencies as it doesn’t rely on any specific issuer or government.
Central banks are the biggest Gold holders. In their aim to support their currencies in turbulent times, central banks tend to diversify their reserves and buy Gold to improve the perceived strength of the economy and the currency. High Gold reserves can be a source of trust for a country’s solvency. Central banks added 1,136 tonnes of Gold worth around $70 billion to their reserves in 2022, according to data from the World Gold Council. This is the highest yearly purchase since records began. Central banks from emerging economies such as China, India and Turkey are quickly increasing their Gold reserves.
Gold has an inverse correlation with the US Dollar and US Treasuries, which are both major reserve and safe-haven assets. When the Dollar depreciates, Gold tends to rise, enabling investors and central banks to diversify their assets in turbulent times. Gold is also inversely correlated with risk assets. A rally in the stock market tends to weaken Gold price, while sell-offs in riskier markets tend to favor the precious metal.
The price can move due to a wide range of factors. Geopolitical instability or fears of a deep recession can quickly make Gold price escalate due to its safe-haven status. As a yield-less asset, Gold tends to rise with lower interest rates, while higher cost of money usually weighs down on the yellow metal. Still, most moves depend on how the US Dollar (USD) behaves as the asset is priced in dollars (XAU/USD). A strong Dollar tends to keep the price of Gold controlled, whereas a weaker Dollar is likely to push Gold prices up.
| Index | Change, points | Closed | Change, % |
|---|---|---|---|
| NIKKEI 225 | -254.05 | 38110.22 | -0.66 |
| Hang Seng | 186.63 | 17798.73 | 1.06 |
| KOSPI | -3.68 | 2698.01 | -0.14 |
| ASX 200 | 60.6 | 8084.5 | 0.76 |
| DAX | -16.08 | 18617.02 | -0.09 |
| CAC 40 | 13.33 | 7590.37 | 0.18 |
| Dow Jones | 65.44 | 41240.52 | 0.16 |
| S&P 500 | -17.77 | 5616.84 | -0.32 |
| NASDAQ Composite | -152.02 | 17725.77 | -0.85 |
| Pare | Closed | Change, % |
|---|---|---|
| AUDUSD | 0.67704 | -0.35 |
| EURJPY | 161.279 | 0 |
| EURUSD | 1.11603 | -0.26 |
| GBPJPY | 190.555 | 0.1 |
| GBPUSD | 1.31857 | -0.19 |
| NZDUSD | 0.62036 | -0.41 |
| USDCAD | 1.34841 | -0.18 |
| USDCHF | 0.84715 | -0.03 |
| USDJPY | 144.526 | 0.28 |


© 2000-2026. Bản quyền Teletrade.
Trang web này được quản lý bởi Teletrade D.J. LLC 2351 LLC 2022 (Euro House, Richmond Hill Road, Kingstown, VC0100, St. Vincent and the Grenadines).
Thông tin trên trang web không phải là cơ sở để đưa ra quyết định đầu tư và chỉ được cung cấp cho mục đích làm quen.
Giao dịch trên thị trường tài chính (đặc biệt là giao dịch sử dụng các công cụ biên) mở ra những cơ hội lớn và tạo điều kiện cho các nhà đầu tư sẵn sàng mạo hiểm để thu lợi nhuận, tuy nhiên nó mang trong mình nguy cơ rủi ro khá cao. Chính vì vậy trước khi tiến hành giao dịch cần phải xem xét mọi mặt vấn đề chấp nhận tiến hành giao dịch cụ thể xét theo quan điểm của nguồn lực tài chính sẵn có và mức độ am hiểu thị trường tài chính.
Sử dụng thông tin: sử dụng toàn bộ hay riêng biệt các dữ liệu trên trang web của công ty TeleTrade như một nguồn cung cấp thông tin nhất định. Việc sử dụng tư liệu từ trang web cần kèm theo liên kết đến trang teletrade.vn. Việc tự động thu thập số liệu cũng như thông tin từ trang web TeleTrade đều không được phép.
Xin vui lòng liên hệ với pr@teletrade.global nếu có câu hỏi.
ngân hàng