- Phân tích
- Tin tức và các công cụ
- Tin tức thị trường
Tin tức thì trường
- GBP/USD trades with mild positive bias near 1.2770 in Tuesday’s early Asian session.
- Traders lower their bets on interest rate cuts by the Fed amid strong US data and the Fed’s hawkish comments.
- The BoE might stay on hold on the rate, boosting the GBP.
The GBP/USD pair consolidates its upside around 1.2770 after reaching two-month highs during the early Asian session on Tuesday. The USD Index (DXY) remains under some selling pressure at around 104.60, which provides some support to the major pair. Traders await the US Conference Board’s Consumer Confidence, FHFA’s House Price Index, along with the Fed’s Neel Kashkari, Mary Daly, and Lisa Cook speeches later on Tuesday.
The markets lower their bets on interest rate cuts by the US Federal Reserve (Fed) and see a 49% chance of rate cuts in September, down from 63% recorded a week ago, according to the CME FedWatch tool. The US key data this week might offer some hints about the economic outlook and inflation trajectory. The first reading of US GDP economic growth in the first quarter will be due on Thursday ahead of the US Core Personal Consumption Expenditures Price Index (Core CPE), the Fed’s preferred inflation gauge. The hotter-than-expected US inflation data might lift the Greenback and weigh on the GBP/USD in the near term.
On the other hand, the Pound Sterling (GBP) gains momentum as traders anticipate that the Bank of England (BoE) will maintain its borrowing costs for longer to cool inflation. Citigroup strategist Jamie Searle said that the UK election in July will “further reduce the chance of a near-term BOE cut, adding that it lowers the risk of a later election interfering with the BOE cycle and focusing only on data-dependency.
- EUR/USD found little gains against the weaker Greenback.
- European economic data thin this week, US PCE inflation key print.
- US GDP, Fedspeak to feature prominently this week.
EUR/USD found little momentum on Monday, cycling near 1.0860 after US markets were dark for the holiday long weekend. Tuesday will kick off the Fiber’s trading week in earnest after German sentiment surveys hobbled the Euro (EUR) on Monday.
Talking points from central planners on both sides of the Atlantic are spread throughout this week. The European Central Bank (ECB) is all but guaranteed to cut interest rates in June, while cut-hungry traders continue to search for signs of a rate trim from the Federal Reserve (Fed). According to the CME’s FedWatch Tool, markets are pricing in nearly-even odds of a quarter-point rate cut from the Fed in September, down significantly from over 70% a week ago.
German Consumer Price Index (CPI) inflation figures are slated for Wednesday, and markets are expecting Germany’s economy to grow by only 0.2% MoM in May compared to the previous 0.5%.
The US will dominate the latter half of the economic calendar this week, with US Gross Domestic Product (GDP) due on Thursday, and Personal Consumption Expenditure (PCE) Price Index inflation figures slated for Friday. US Q1 GDP is expected to ease to 1.4% versus 1.6%, and investors are hoping that PCE Price Index inflation will hold steady at 0.3% MoM in April.
German Retail Sales and pan-European Harmonized Index of Consumer Prices (HICP) are both due on Friday. German Retail Sales last grow 0.3% YoY in April, while Core European HICP inflation is expected to hold steady at 2.7% YoY in May.
EUR/USD technical outlook
EUR/USD has recovered from a near-term decline into the 1.0800 region, but topside momentum remains thin and the pair is grappling with a pileup of technical resistance below the 1.0900 handle.
Despite recent losses, EUR/USD remains on the high side of the 200-day Exponential Moving Average (EMA) at 1.0790. However the pair still remains down from 2024’s opening bids near 1.1036.
EUR/USD hourly chart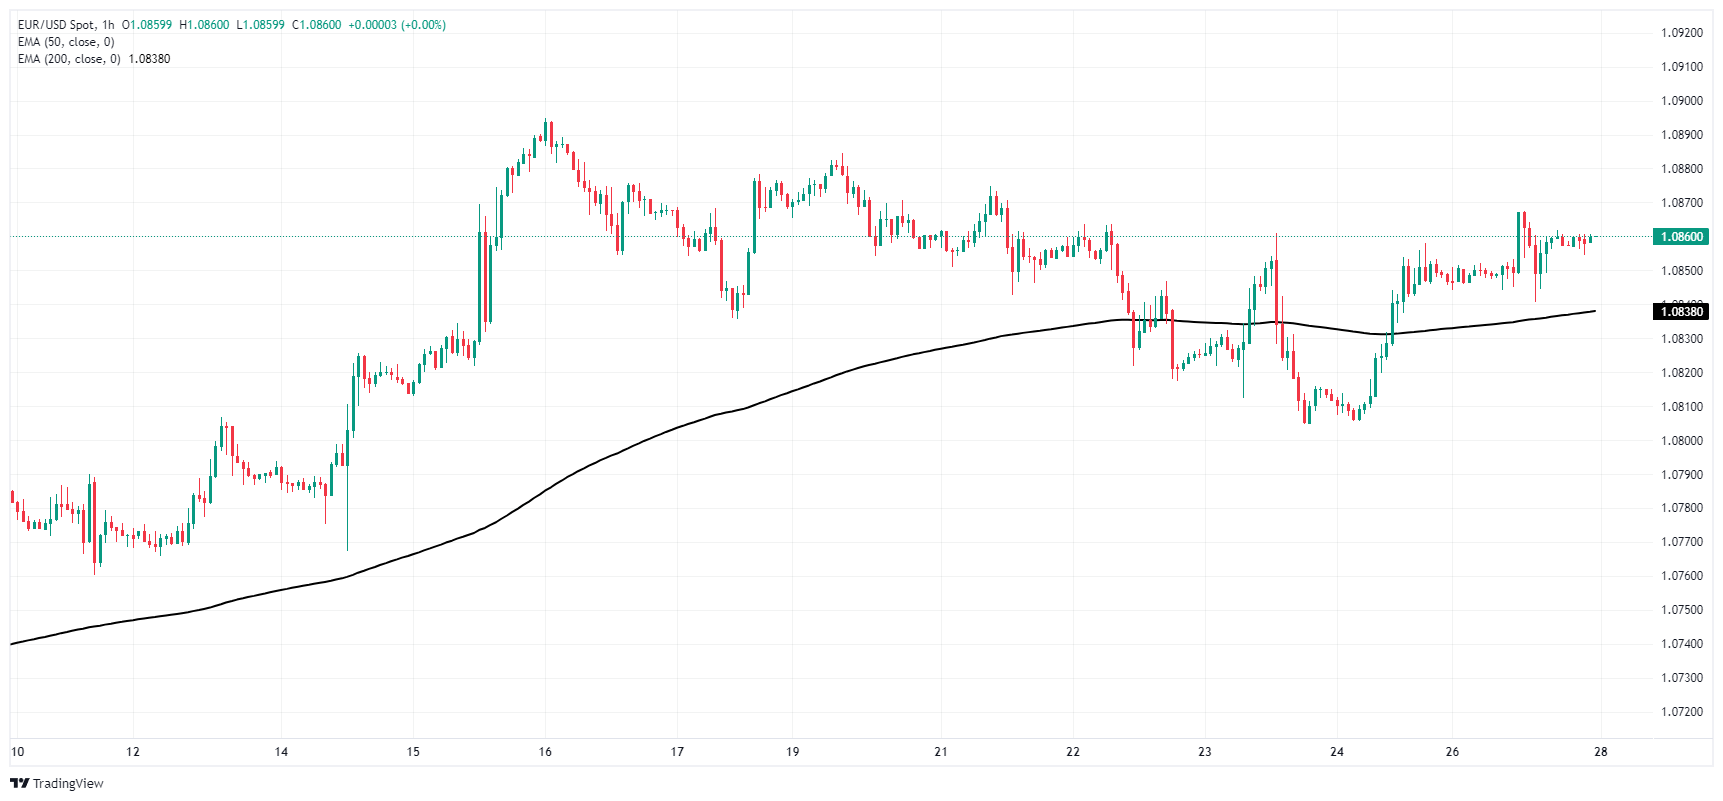
EUR/USD daily chart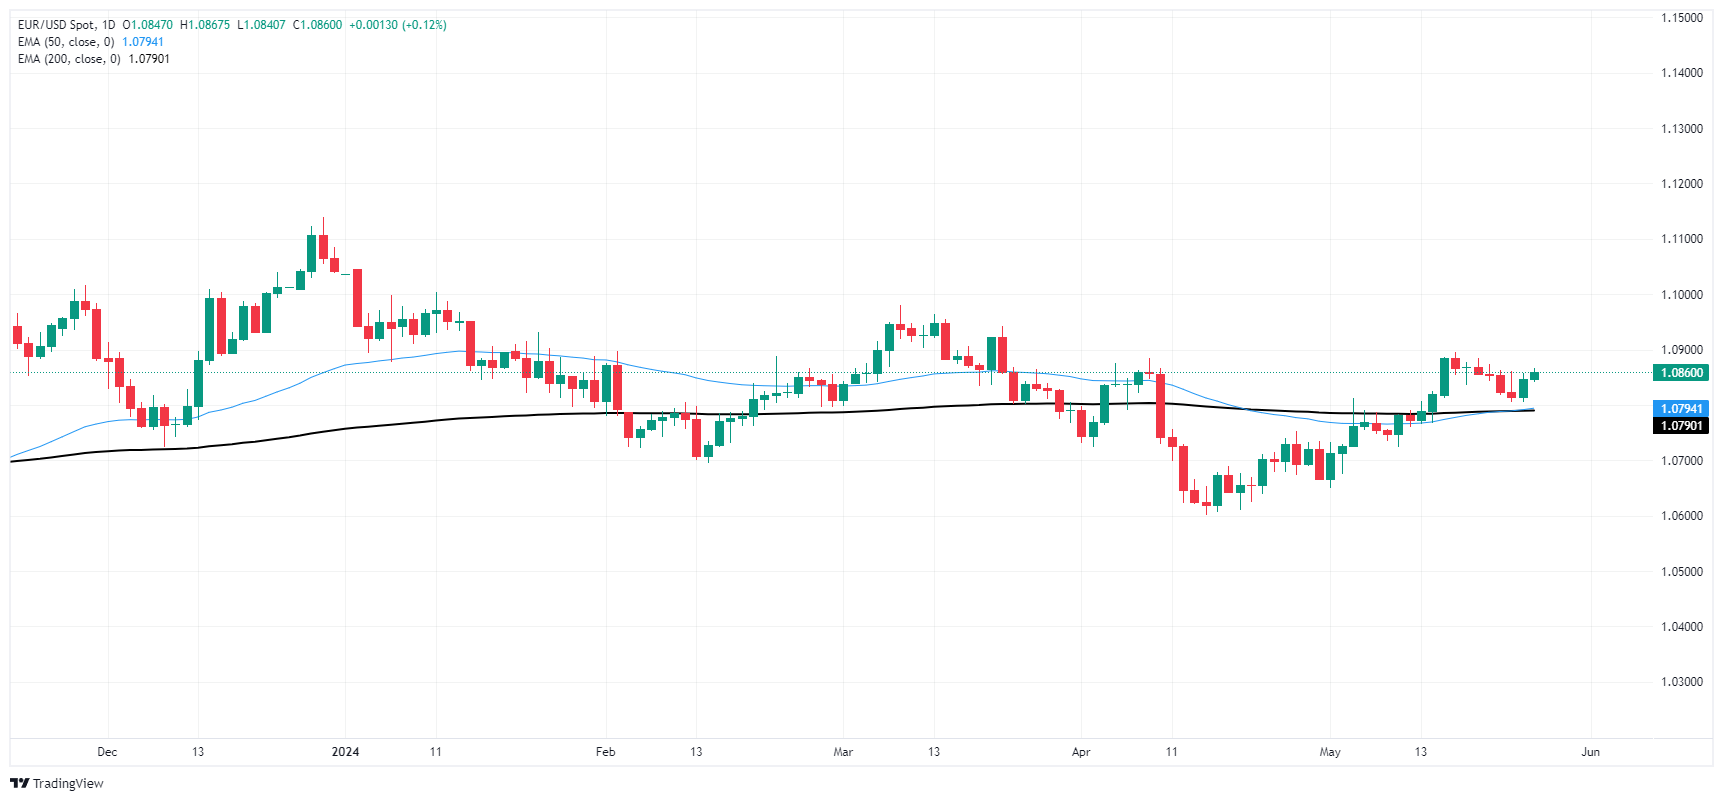
- Silver rallies over 4%, trading at $31.42 after rebounding from a low of $30.25 in thin liquidity.
- Technicals indicate strong upward bias, with bullish RSI not yet overbought.
- Key resistance levels: Psychological $32.00 figure, YTD high at $32.51, and $33.00 mark.
- Key support levels: $31.00 figure, $30.50 psychological level, and May 23 low of $30.07.
Silver prices rallied sharply on Monday, posting gains of more than 4%. At the time of writing, they were at $31.42. The grey metal bounced off daily lows of $30.25, capitalizing on thin liquidity conditions as Wall Street remained closed in observance of Memorial Day.
XAG/USD Price Analysis: Technical outlook
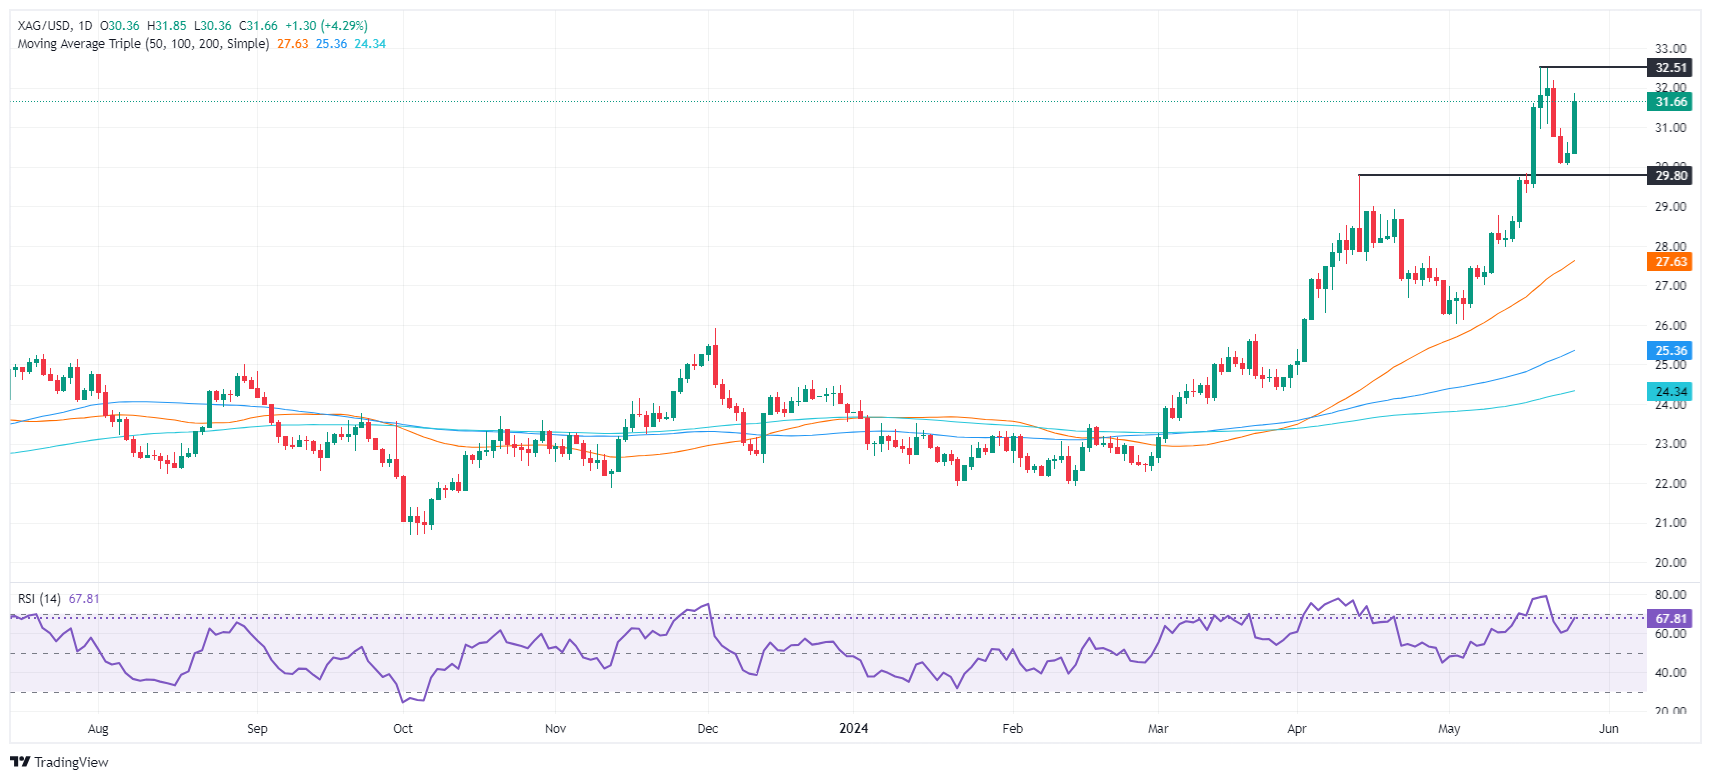
The daily chart suggests that Silver is upward-biased, yet it remains shy of testing the year-to-date (YTD) high of 32.51. Momentum supports buyers, as the Relative Strength Index (RSI) remains bullish though short of turning overbought.
With that said, the XAG/USD first resistance would be the psychological $32.00 figure. Once cleared, overhead resistance lies with the YTD high, followed by the $33.00 mark.
Conversely, the XAG/USD first support would be the $31.00 figure. Further losses lie below that demand area, like the $30.50 psychological level, followed by the May 23 low of $30.07.
XAG/USD Price Action – Daily Chart
- NZD/USD buyers advanced and pushed the pair to levels last seen in March at around 0.6148.
- May’s ANZ business survey will be Tuesday’s highlight on the NZ side.
- Across the Pacific, markets await GDP, PCE, and Fed Beige book to gather additional data on the US economic health.
The NZD/USD pair traded higher on Monday while US traders remained on the sidelines, resting on Memorial Day.
In the US scope, the Federal Reserve's (Fed) upcoming Beige Book Report could set the tone for the NZD/USD pair on Wednesday. In addition, the core Personal Consumption Expenditure (PCE) reading for April, will be highly looked upon on Friday and is expected to remain steady at 2.8% YoY. The Q1 Gross Domestic Product (GDP) revision will be released on Thursday which might also shake markets.
In addition, Fed speakers, who are scheduled throughout the week, may bring nuanced insight into the current Federal stance ahead of the media blackout period. Current market odds indicate around 50% odds of a cut in September and an 80% chance of a November rate cut. Those odds remain low for June and July
As for New Zealand, investors are banking on the May ANZ business survey due this Tuesday to shed light on areas of concern like domestic inflation and business activity.
NZD/USD technical analysis
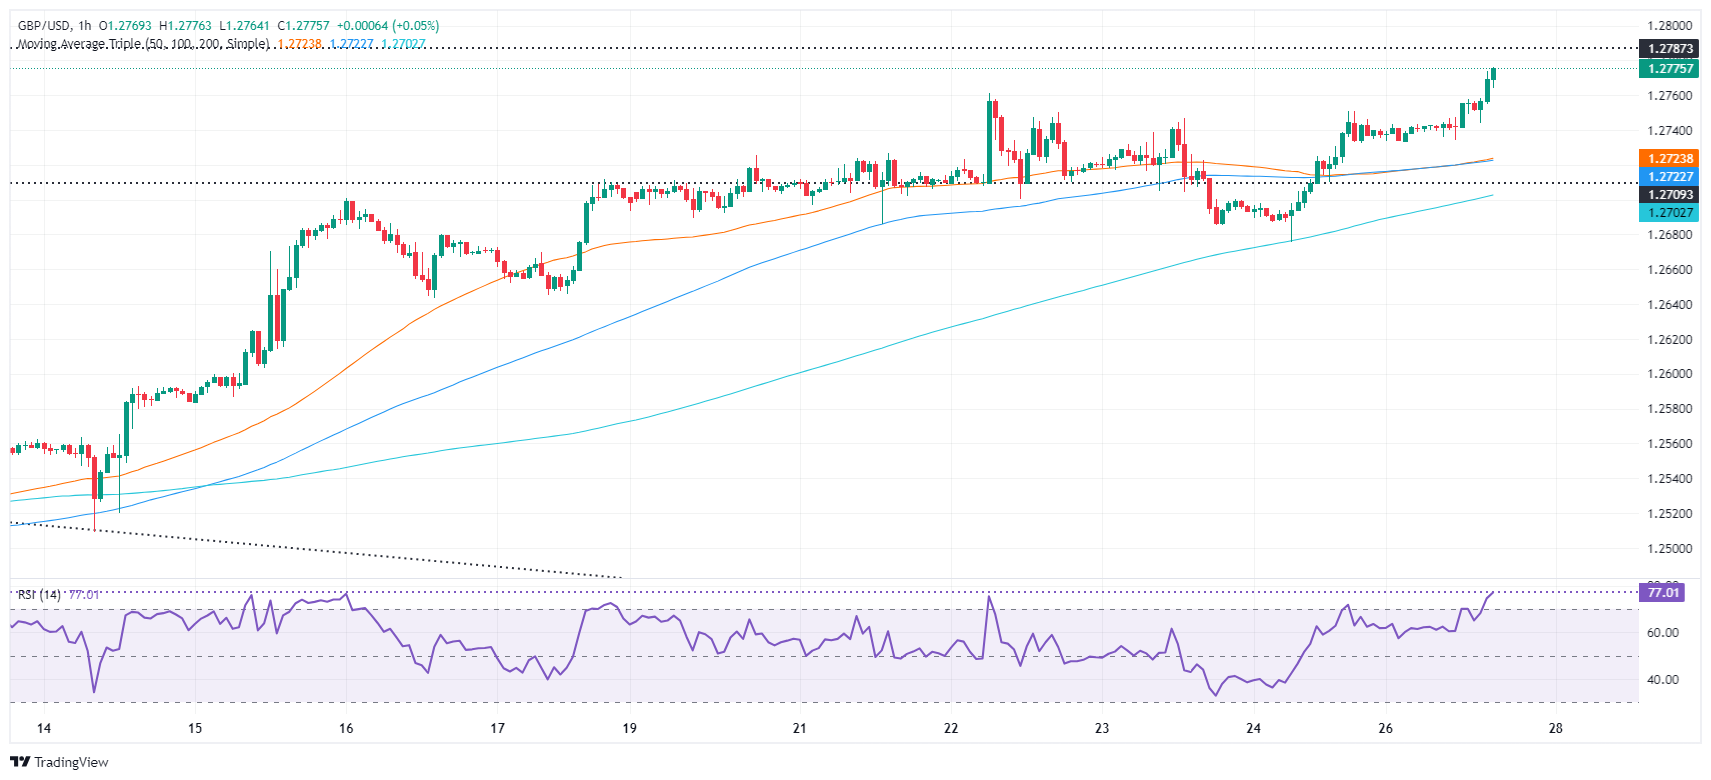
In the daily analysis, the Relative Strength Index (RSI) shows a positive trend with the recent RSI readings hovering around the 60 to 70 territory, indicating substantial buying pressure. The slope has risen compared to previous sessions, suggesting an increase in bullish momentum. This positive tendency in the RSI coincides with rising green bars on the Moving Average Convergence Divergence (MACD), which points to a continued upward trend.
NZD/USD daily chart
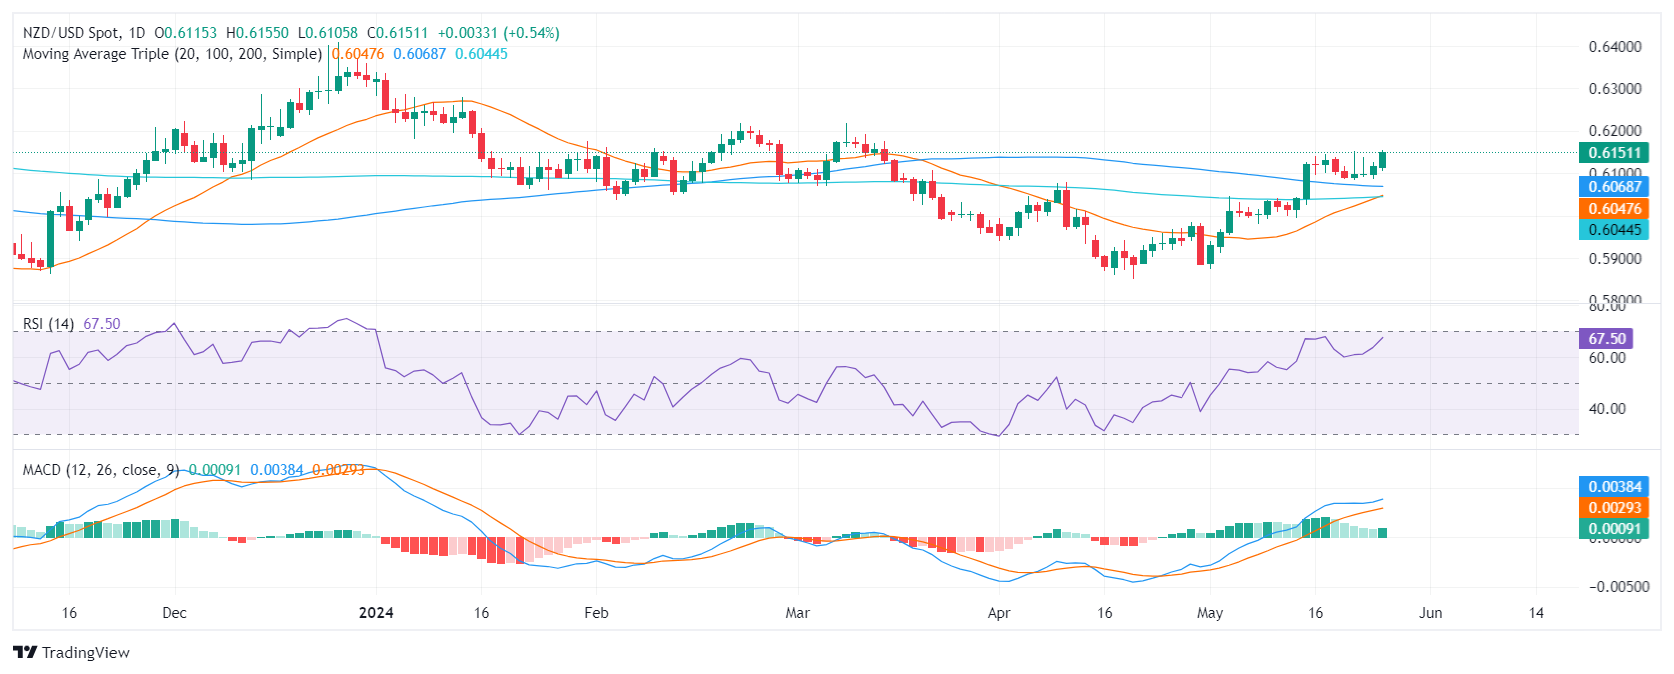
In addition, the NZD/USD pair is in a strong upward trend, trading above its 20, 100, and 200-day Simple Moving Averages (SMAs). This suggests that buyers flipped the tables and secured a bullish outlook for the long and short term.
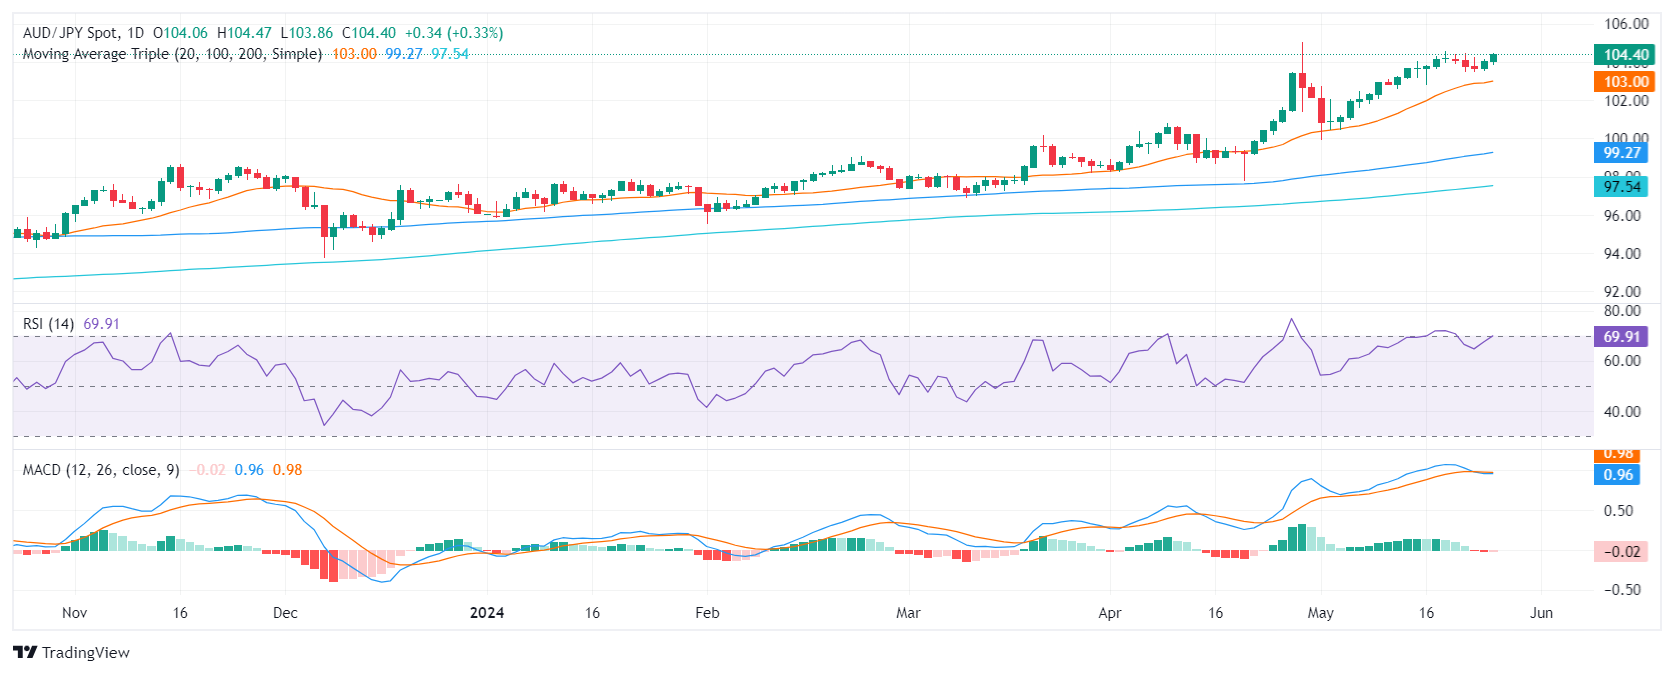
- Daily chart indicators depict a steady buying traction with RSI deep in positive area , but nearing overbought conditions.
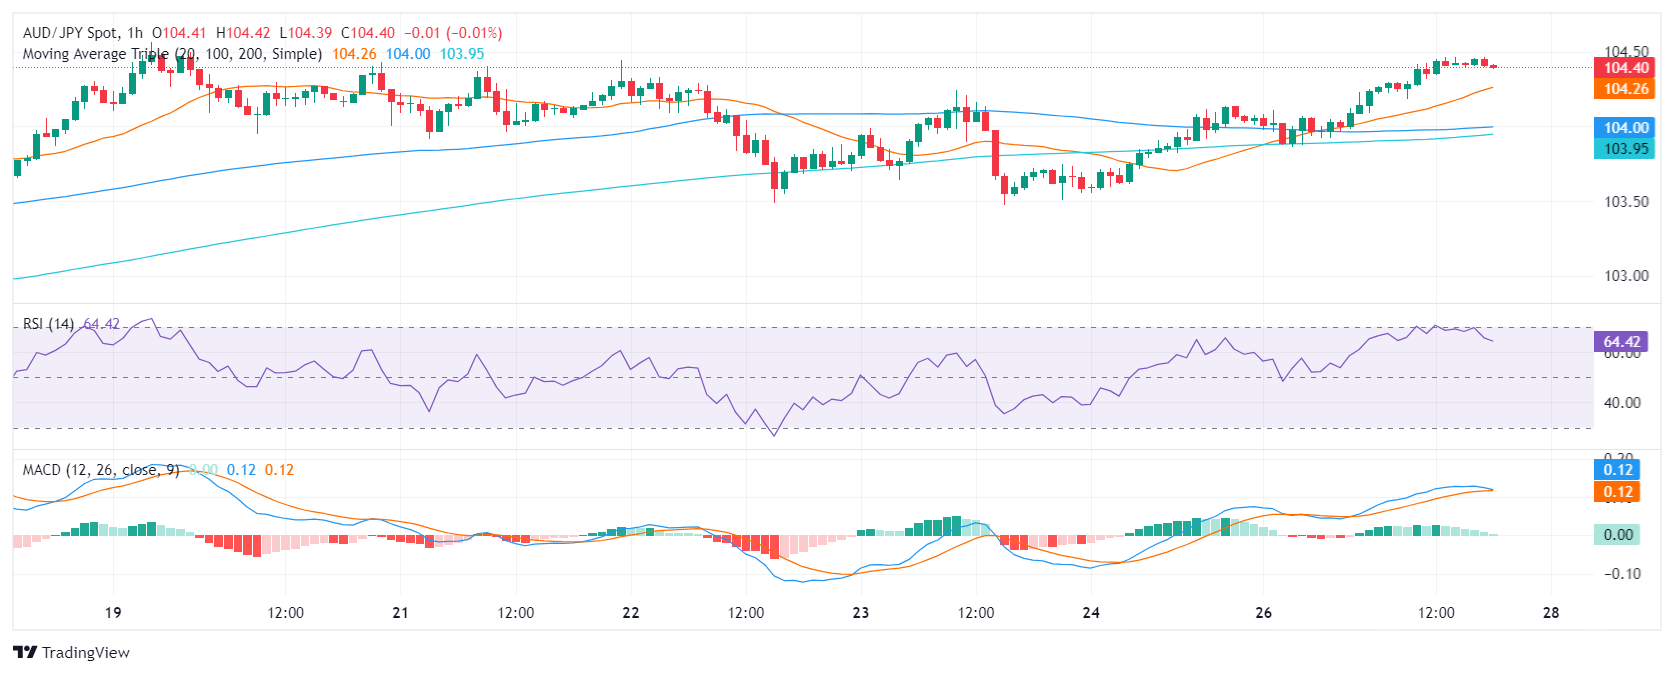
- On the hourly chart indicators are beginning to flatten, which suggests the cross may face some losses ahead of the Asian session.
- Given the heightened momentum, the stage could be set for a shift in market dominance, suggesting a potential correction on the horizon.
In Monday's session, the AUD/JPY pair managed to acquire supplementary momentum and saw some gains. Despite the strength of the buying momentum, the market may be heading for a correction since the Relative Strength Index (RSI) and Moving Average Convergence Divergence (MACD) hint at overbought levels. Ahead of the Asian session, with the pair nearing cyclical peaks, an incoming pullback for the cross may be on the horizon.
Examining the daily chart, the RSI is near the overbought territory. A gradual decrease from overbought conditions is evident while maintaining a positive trend, indicating buyers' dominance but hinting at a potential flattening. In line with that, the MACD shows a negative momentum as red bars are seen.
AUD/JPY daily chart
The hourly RSI values reveal a similar positive trend, with values hovering around the 60 mark but pointing downwards. This is backed by the MACD which prints decreasing green bars.
AUD/JPY hourly chart
In the broader context, the AUD/JPY is trading above all three key Simple Moving Average (SMA) benchmarks of 20, 100, and 200 days and this alignment suggests a strong bullish outlook for the pair. However, as the pair remains near cycle highs and due to the cross momentum becoming overextended, a correction could be imminent.
- AUD/USD pushes for a second day of recovery after near-term rebound.
- Australian Retail Sales on the offer early Tuesday.
- US long weekend holiday leaves Monday volumes thin.
AUD/USD found some room on the high side on Monday after US markets dark for the Memorial Day holiday left the Greenback on the low side, propping up the Aussie and extending Friday’s recovery into a second day. AUD traders will be looking ahead to Tuesday’s Australian Retail Sales in April, while US Personal Consumption Expenditure (PCE) inflation data looms ahead later in the week.
Australian MoM Retail Sales in April are expected to recover to 0.2% after the previous month’s 0.4% decline. Looking further ahead to Wednesday, Australian Monthly Consumer Price Index (CPI) inflation in April is expected to grow at 3.4% YoY compared to the previous month’s annualized 3.5%.
Talking points from Federal Reserve (Fed) officials are expected to resume dominating headlines this week after US markets return to action after a long weekend holiday. A slew of Fed policymakers are expected to make appearances throughout the week.
Friday will cap off the economic calendar with a fresh print of US PCE Price Index inflation. Investors hope Core PCE Price Index inflation in April will hold steady at 0.3%. If the number comes out higher, inflation remains a key problem for the US and could shatter risk appetite, while a lower-than-expected print will send investor sentiment soaring.
AUD/USD technical outlook
Despite getting knocked back below 0.6700 last week, the Aussie remains on the high side of the 200-day Exponential Moving Average (EMA) at 0.6575. The pair has been holding on the bullish side since recovering from a swing low into 0.6360 in April, but still remains down from 2024’s opening bids above 0.6800.
AUD/USD hourly chart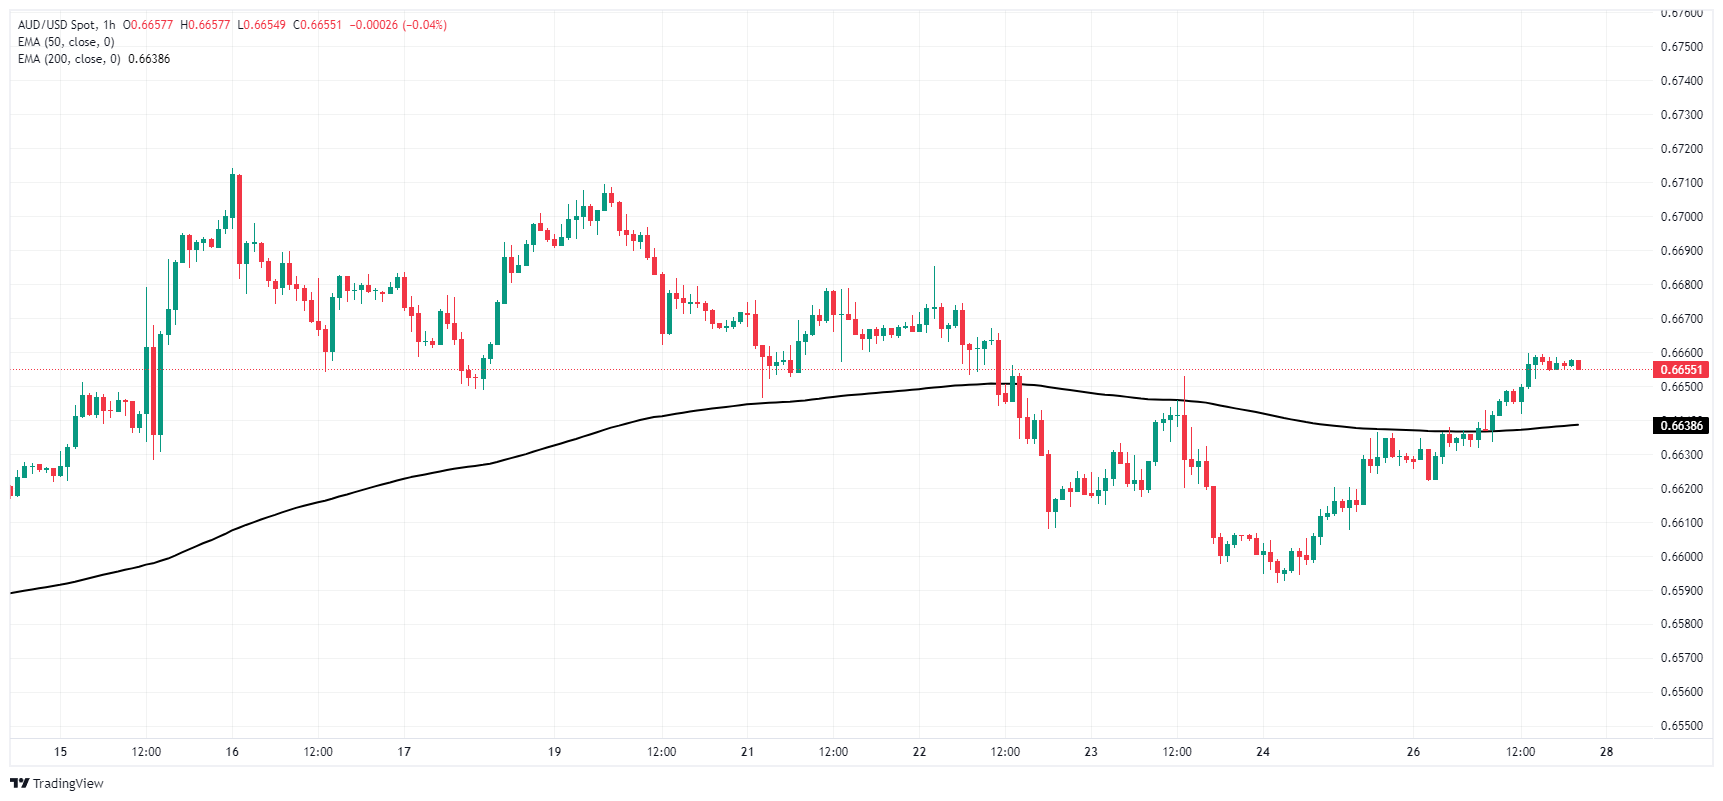
AUD/USD daily chart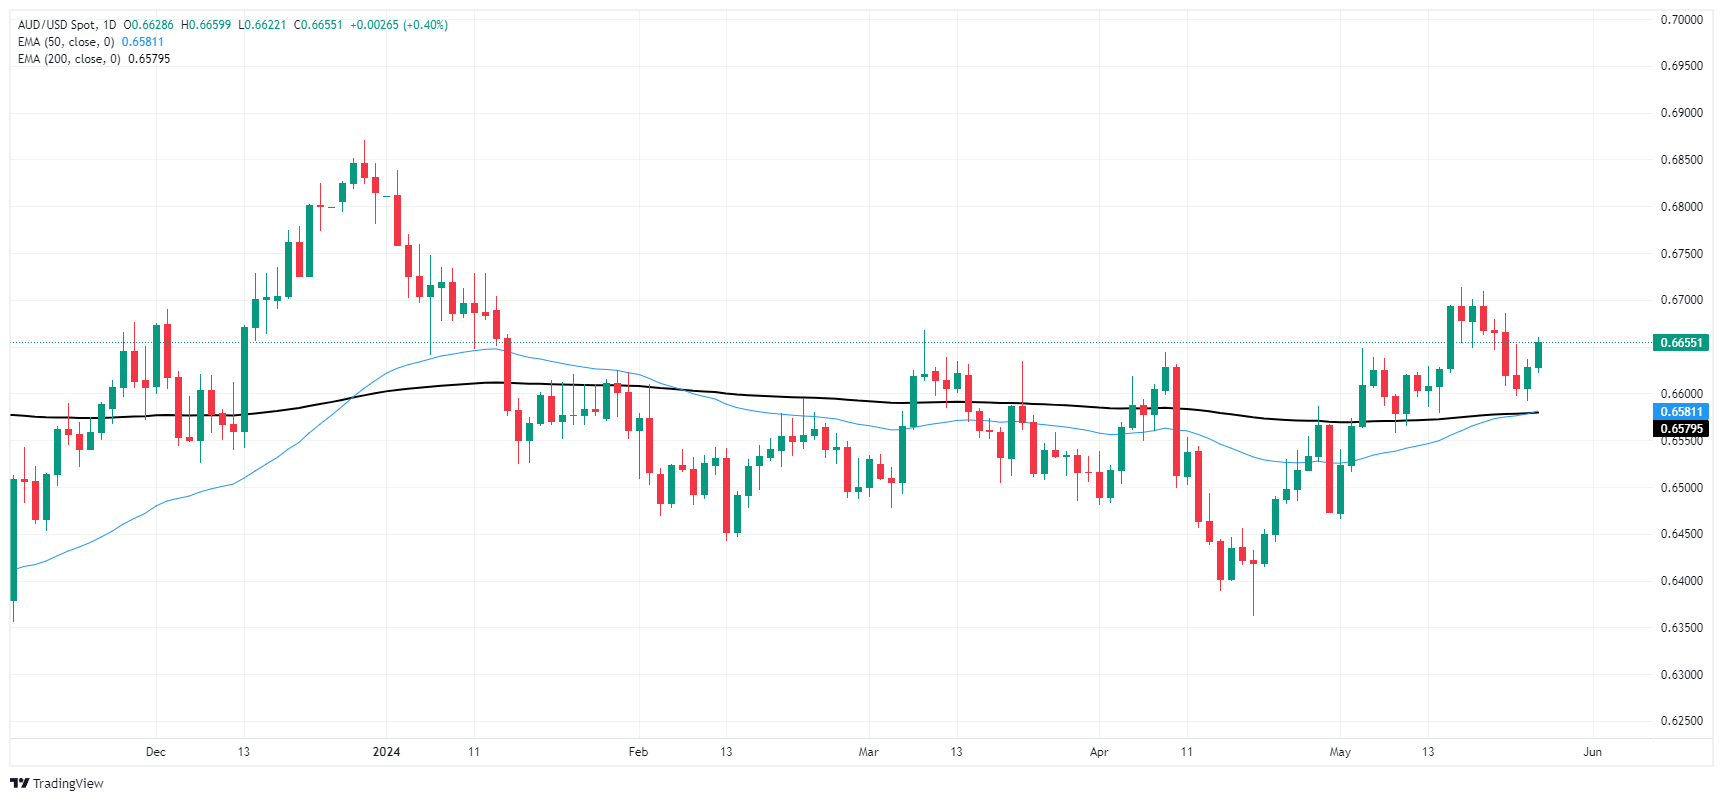
- WTI climbed further on Monday as US inflation data looms.
- OPEC+ is broadly expected to maintain voluntary production cuts.
- Rate cut expectations remain key to barrel prices.
West Texas Intermediate (WTI) US Crude Oil continued to gain on Monday, climbing above $78.50 per barrel. Crude Oil is climbing with US markets dark for the Memorial Day holiday, and risk appetite is leaning into the high side as investors look for signs of Federal Reserve (Fed) rate cuts to help bolster Crude Oil.
US Personal Consumption Expenditure (PCE) inflation numbers will be updated later this week, providing a key reading for investors hoping for a rate trim from the Fed. Markets expect Friday’s US PCE Price Index to hold at 2.8% YoY in April.
The Organization of the Petroleum Exporting Countries (OPEC) and its extended membership network, OPEC+, are broadly expected to maintain voluntary production caps that were initially adopted in 2023 to prop up global Crude Oil prices. With US production continuing to ramp up and outpace demand, OPEC+ is likely to keep production limits in place to try and sop up excess production. OPEC+’s meeting is slated for June 2.
Barrel traders will also be keeping an eye out for US week-on-week barrel inventory counts from both the American Petroleum Institute (API) and the Energy Information Administration (EIA), due respectively on Wednesday and Thursday this week. Last week’s US Crude Oil supply tracking saw yet another unexpected buildup of US barrel counts. Market forecasts are doubling down on expecting a decline, with EIA weekly barrel counts forecast to decline by two million barrels on Thursday.
WTI technical outlook
US Crude Oil rebounded on Monday, extending a near-term rebound from the $76.00 handle, however, bullish momentum faces immediate technical resistance at the $80.00 price level. A recovery in WTI sends prices back into recent congestion on the lower bound of the 200-day Exponential Moving Average (EMA) at $79.16.
WTI hourly chart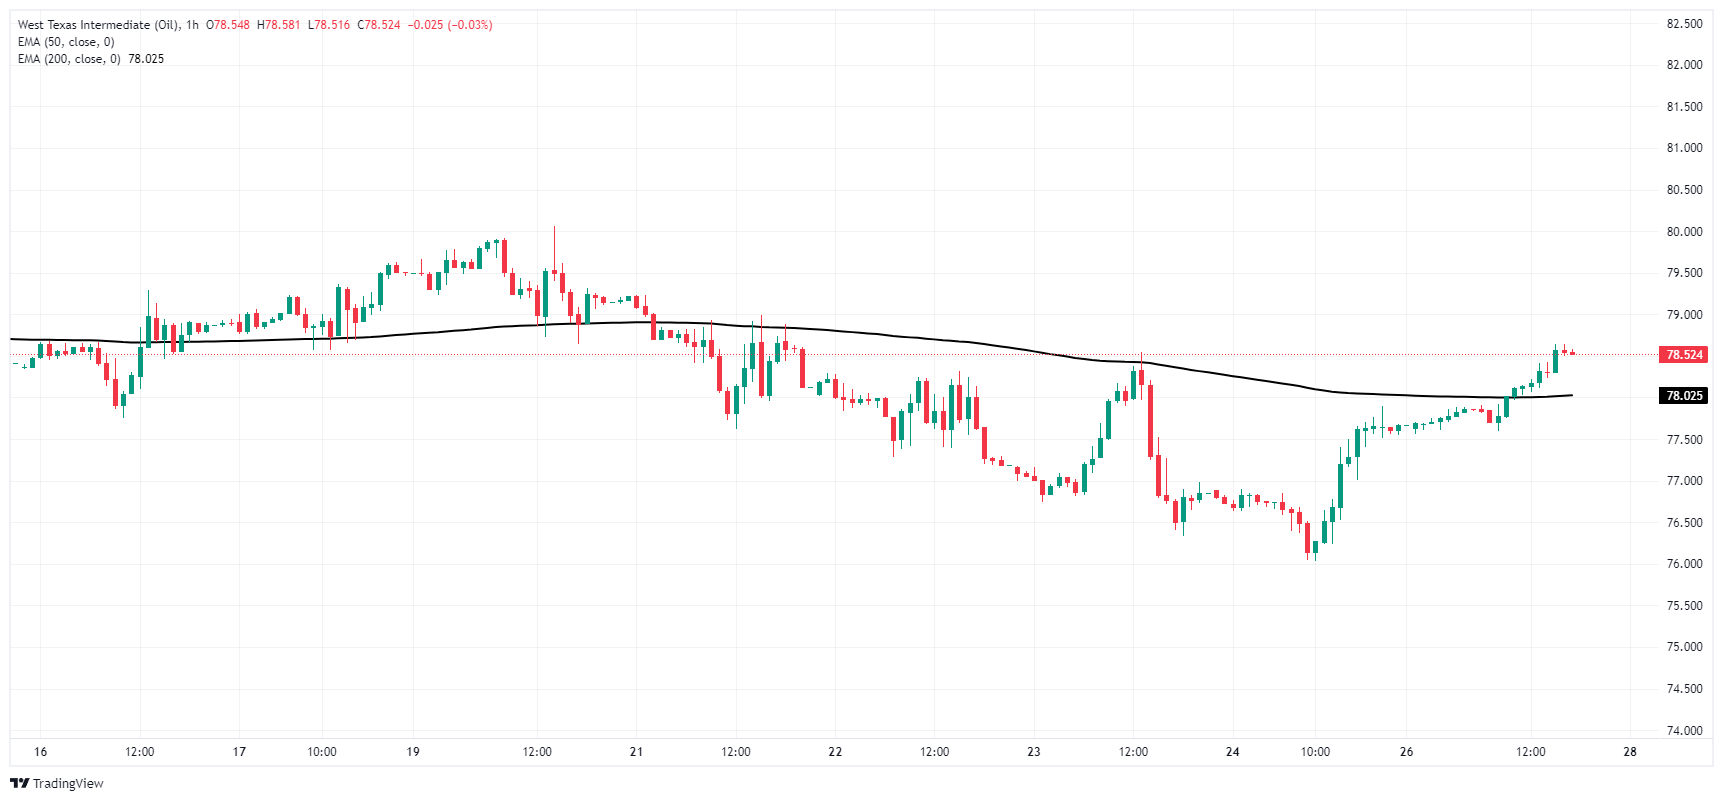
WTI daily chart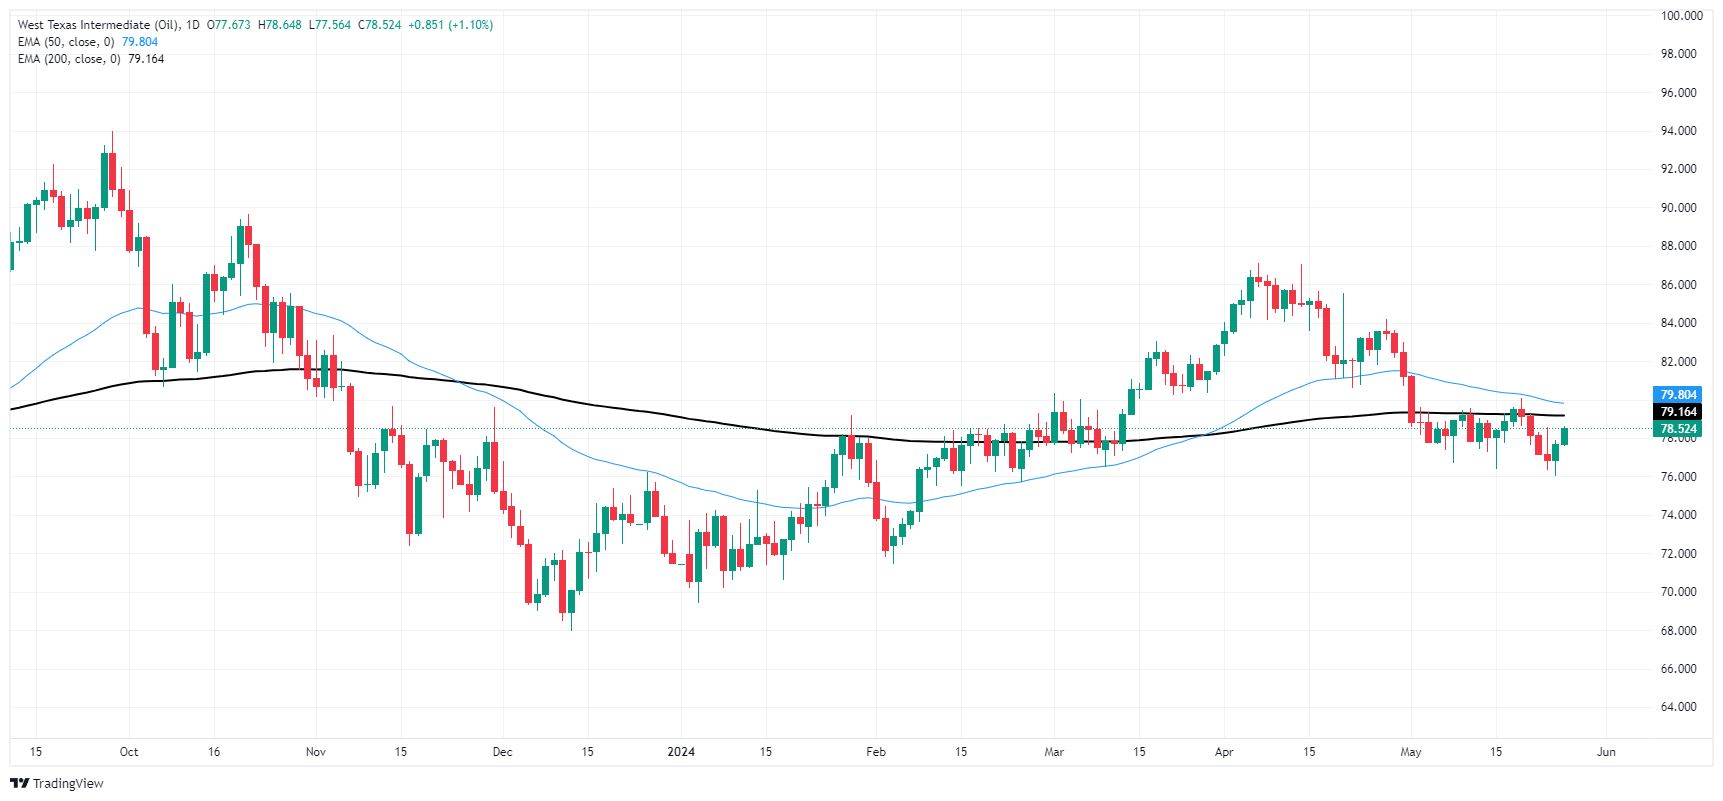
- USD/JPY down slightly by 0.08% at 156.87, amid low-volume trading due to US Memorial Day.
- Technicals show an upward trend, with prices above the Ichimoku Cloud, Tenkan-Sen, and Kijun-Sen.
- Resistance at 157.00, followed by April 26 high of 158.44 and YTD high of 160.32.
- Support levels include Tenkan-Sen at 156.05, Senkou Span A at 155.72, Kijun-Sen at 155.39, and 50-DMA at 154.08.
The USD/JPY trade subdued amid low-volume trading on Monday. courtesy of the observance of Memorial Day, as Wall Street remained closed. The major trades at 156.87, registering modest losses of 0.08%.
USD/JPY Price Analysis: Technical outlook
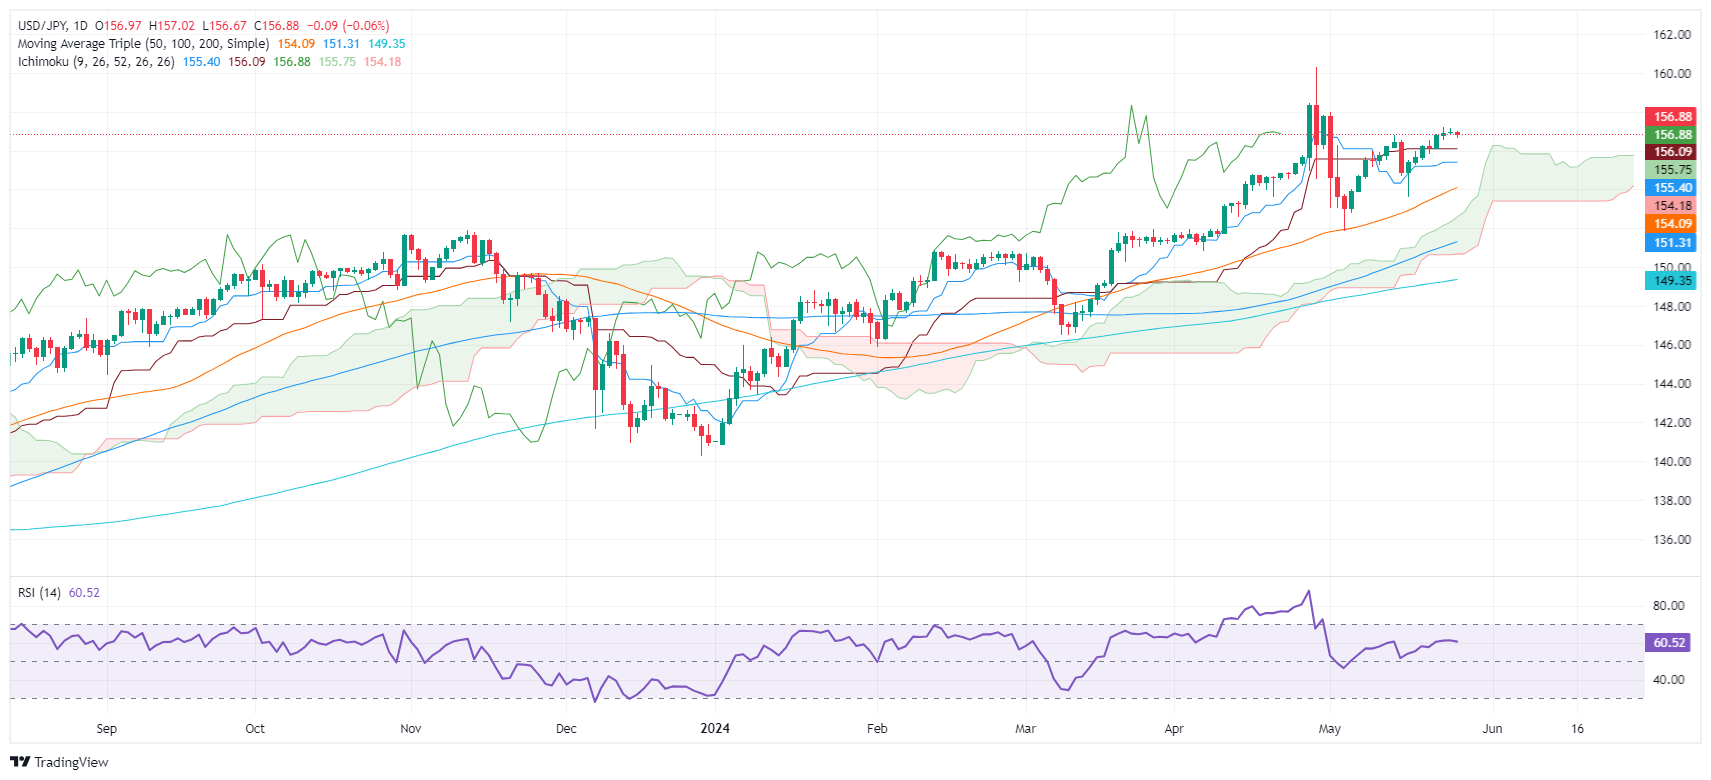
From a technical perspective, the USD/JPY is upward biased, as evidenced by successive series of higher highs and lows and price action standing above the Ichimoku Cloud (Kumo). Additionally, the spot price is also above the Tenkan and Kijun-Sen, a further indication of bulls’ strength. Yet intervention threats by Japanese authorities kept buyers at bay instead of committing to open fresh long positions.
However, if USD/JPY clears the 157.00 figure, further gains lie overhead. The next resistance would be the April 26 high at 158.44, followed by the year-to-date (YTD) high at 160.32.
Conversely, if it stumbles below the confluence of the Tenkan-Sen at 156.05, that will sponsor a leg down. Next key support levels emerge at the Senkou Span A at 155.72, followed by the Kijun-Sen at 155.39, ahead of the 50-day moving average (DMA) at 154.08.
USD/JPY Price Action – Daily Chart
- AUD/NZD dips mildly to 1.0821 during Monday's session.
- Markets are eyeing Australia's April CPI and Retail Sales updates this week.
- Investors will eye New Zealand's May ANZ business survey, which is expected to reveal a slowdown in activity.
The AUD/NZD is presently trading with mild fluctuations, expecting key figures from Australia and New Zealand along the week.
On the Australian side, the focus is primarily on the April Consumer Price Index (CPI) and Retail sales data. The CPI is projected to register a slight decrease, dropping to 3.4% YoY while Retail Sales are expected to recover somewhat. The outcome of the data might shape the expectations of the Reserve Bank of Australia (RBA) which has lately advocated for a cautious stance.
On the other hand, the attention in New Zealand is directed towards the ANZ business survey data for May on Tuesday. The outcome might also shape the bets on the next Reserve Bank of New Zealand (RBNZ)'s monetary policy decisions. While the bank suggested a potential rate hike, market prediction indicates an opposing view, leaning towards a first rate cut in November.
AUD/NZD technical analysis
In the daily chart, the Relative Strength Index (RSI) sits within negative territory. Despite an uptick in the latest reading to 30, the pair remains pressured, as the positive momentum observed earlier in the week has considerably waned. The negative trend, as suggested by the RSI, is further confirmed by the rising red bars of the Moving Average Convergence Divergence (MACD) histogram, affirming the downside momentum.
AUD/NZD daily chart
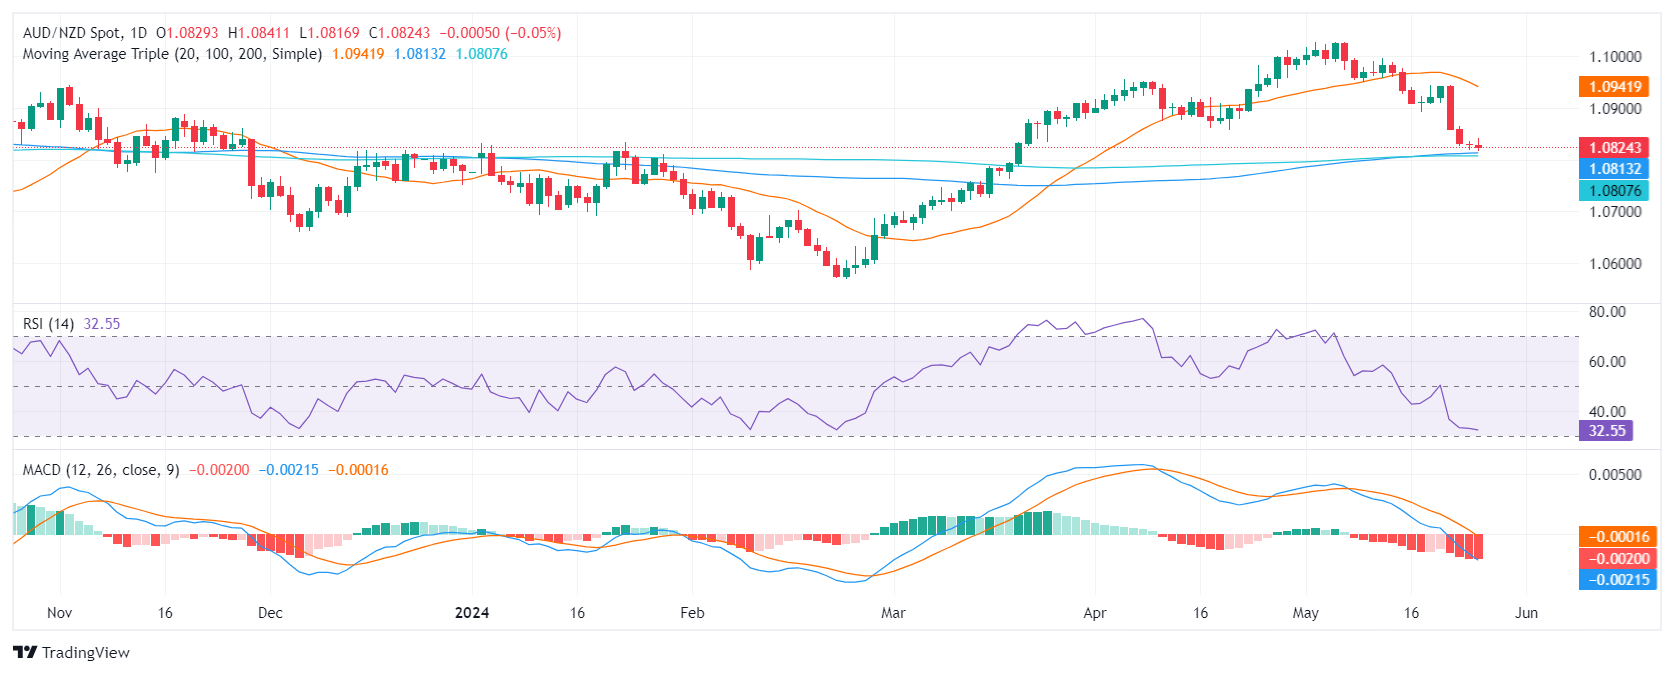
On a positive note, the pair currently trades above its 100 and 200-day Simple Moving Averages (SMA), indicating potential medium-to-long-term upward momentum. However, the AUD/NZD's positioning below the 20-day SMA highlights the near-term volatility anticipated.
- Gold price rises close to 1% after bouncing off two-week low of $2,325.
- Strong US economic data dampens hopes for Fed easing, pressured Gold prices last week.
- Fed officials indicate longer timeline to achieve 2% inflation target, impacting Gold's appeal.
- Upcoming US PCE Price Index anticipated to report a core increase of 2.8% YoY and headline growth of 0.3% MoM.
Gold price is up on Monday amid thin trading due to holidays across both sides of the Atlantic, particularly the UK and the US. The yellow metal bounced off two-week lows of $2,325, as US Treasury yields finished the last week down, while the Greenback weakened across the board.
The XAU/USD trades at $2,354 on Monday, gaining close to 1% at the time of writing. Solid economic data from the United States (US) hurts market participants' hopes that the Federal Reserve (Fed) will ease monetary policy this year. Consequently, this undermined the non-yielding metal, which tumbled by more than 3% last week.
Fedspeak weighed on Gold prices as officials acknowledged it would take longer than previously thought to curb stickier inflation to the Fed’s 2% core inflation goal. Although the golden metal is considered a hedge against inflation, higher US Treasury yields sponsored the last leg down of XAU/USD.
UBS analysts chimed in, “We expect gold prices to stay volatile and price setbacks to be shallow, targeting Gold prices to test new record highs later this year.”
A scarce macroeconomic calendar during the week is expected to reveal April’s Personal Consumption Expenditures (PCE) Price Index, the Fed’s favorite inflation gauge. Estimates suggest the core reading will print at 2.8% YoY, while headline PCE is foreseen edging higher to 0.3% MoM.
Daily digest market movers: Gold price rises amid weak US Dollar
- Gold prices are boosted by the decline in US Treasury yields and a softer US Dollar.
- US 10-year Treasury note is yielding 4.461% and loses one-and-a-half basis points, undermining the Greenback. The US Dollar Index (DXY), which tracks the buck’s performance against a basket of peers, trades at 104.58, down 0.15%.
- US economy continues to fare well, as evidenced by last week's S&P Global PMIs, which highlighted increased business activity. However, investor uncertainty about the economic outlook persists due to a worse-than-expected US Durable Goods Orders report released on Friday.
- FOMC Minutes showed that Fed officials remained uncertain about the degree of policy restrictiveness. They added that “it would take longer than previously anticipated to gain greater confidence in inflation moving sustainably to 2%.”
- BBH analysts commented that since the latest Beige Book released on April 17, the US inflation has remained sticky despite some signs of softening in the labor market. They added, “We expect a balanced tone in this report that will allow the Fed to take a wait and see approach with regards to easing.”
- Fed funds rate futures estimate just 25 basis points of interest rate cuts in 2024, according to data provided by the Chicago Board of Trade (CBOT).
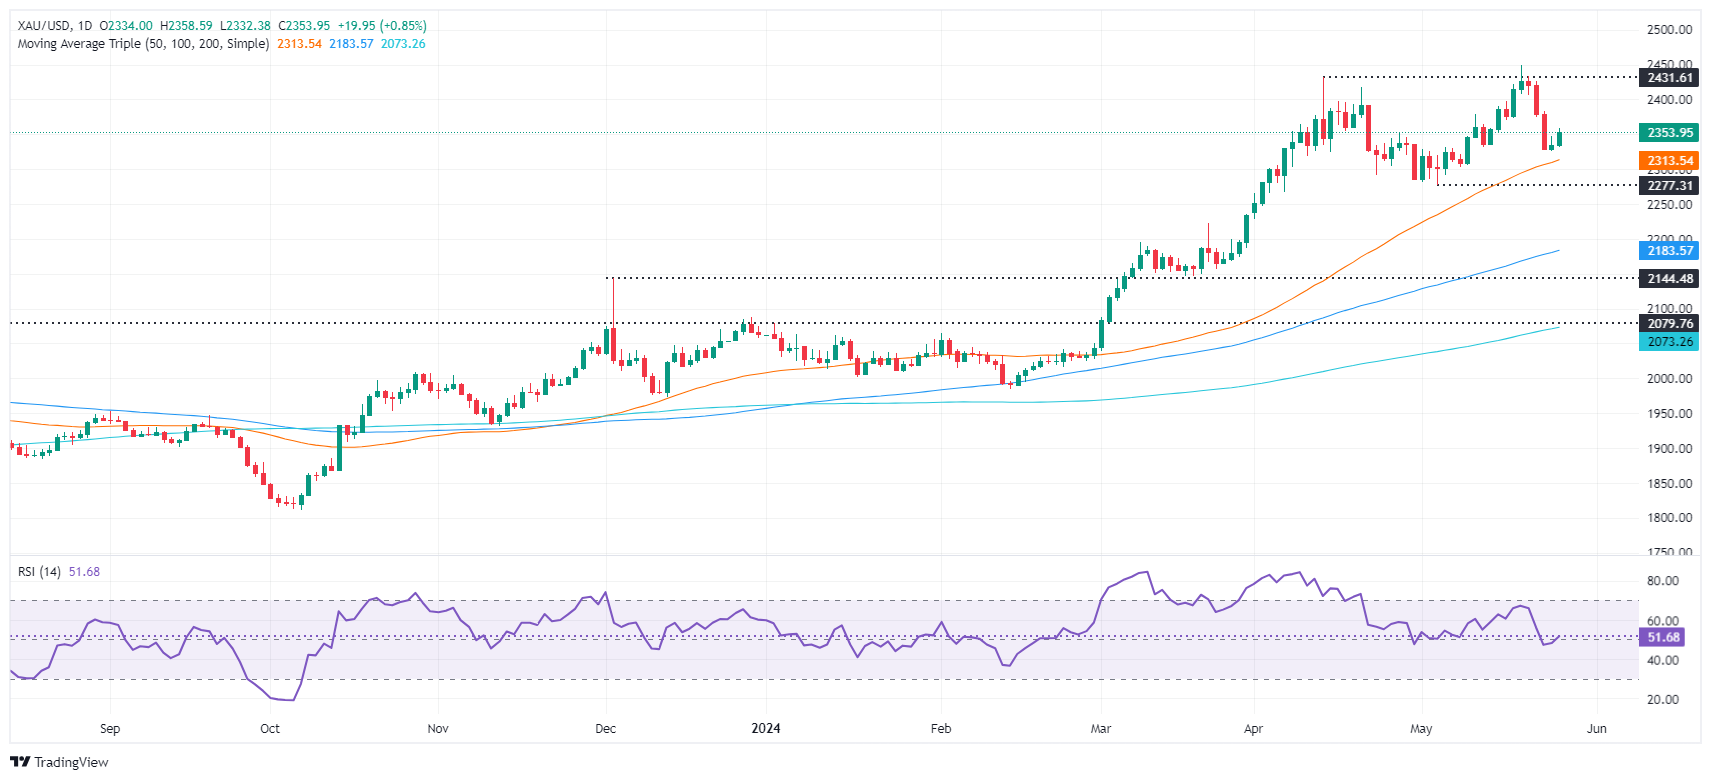
Technical analysis: Gold price clings to gains above $2,330
Gold price uptrend remains intact despite retreating below the $2,400 figure. Buyers are gathering traction as depicted in the Relative Strength Index (RSI) indicator, which has turned bullish, hinting that higher prices lie ahead.
If XAU/USD clears $2,350, that would expose the $2,400 mark. Further gains lie overhead as buyers target the year-to-date high of $2,450, followed by the $2,500 mark.
On the other hand, if bears keep the XAU/USD price below $2,350, they need to push prices below the May 8 low of $2,303. Once surpassed, the May 3 cycle low of $2,277 would follow.
Gold FAQs
Gold has played a key role in human’s history as it has been widely used as a store of value and medium of exchange. Currently, apart from its shine and usage for jewelry, the precious metal is widely seen as a safe-haven asset, meaning that it is considered a good investment during turbulent times. Gold is also widely seen as a hedge against inflation and against depreciating currencies as it doesn’t rely on any specific issuer or government.
Central banks are the biggest Gold holders. In their aim to support their currencies in turbulent times, central banks tend to diversify their reserves and buy Gold to improve the perceived strength of the economy and the currency. High Gold reserves can be a source of trust for a country’s solvency. Central banks added 1,136 tonnes of Gold worth around $70 billion to their reserves in 2022, according to data from the World Gold Council. This is the highest yearly purchase since records began. Central banks from emerging economies such as China, India and Turkey are quickly increasing their Gold reserves.
Gold has an inverse correlation with the US Dollar and US Treasuries, which are both major reserve and safe-haven assets. When the Dollar depreciates, Gold tends to rise, enabling investors and central banks to diversify their assets in turbulent times. Gold is also inversely correlated with risk assets. A rally in the stock market tends to weaken Gold price, while sell-offs in riskier markets tend to favor the precious metal.
The price can move due to a wide range of factors. Geopolitical instability or fears of a deep recession can quickly make Gold price escalate due to its safe-haven status. As a yield-less asset, Gold tends to rise with lower interest rates, while higher cost of money usually weighs down on the yellow metal. Still, most moves depend on how the US Dollar (USD) behaves as the asset is priced in dollars (XAU/USD). A strong Dollar tends to keep the price of Gold controlled, whereas a weaker Dollar is likely to push Gold prices up.
The Greenback came under extra selling pressure against the backdrop of marginal volatility in response to the US and UK holidays. Markets are expected to enter some consolidative phase ahead of the release of US PCE and EMU CPI, both due on Friday.
Here is what you need to know on Tuesday, May 28:
The USD Index (DXY) added to Friday’s pullback and revisited the 104.60-104.50 band on Monday. On May 28, the Conference Board’s Consumer Confidence takes centre stage, seconded by the FHFA’s House Price Index. In addition, Fed’s Mester, Kashkari and Cook are due to speak.
Further gains lifted EUR/USD to four-day highs around 1.0870 amidst a renewed selling bias in the US Dollar. Wholesale Prices in Germany are due on May 28 along with the ECB’s Schnabel speech.
GBP/USD accelerated its gains beyond the 1.2700 barrier and hit a new two-month tops following the weaker Greenback. The CBI Distributive Trades are expected on May 28.
Price action around USD/JPY remained flat near the 157.00 hurdle following a solid performance of JGB 10-year yields. There are no scheduled releases in “The Land of the Rising Sun” on May 28.
A solid session saw AUD/USD advance to three-day highs near 0.6660 amidst the softer Dollar and an improved tone in the commodity complex. Flash Retail Sales are next on tap in Oz on May 28.
Prices of WTI rose for the second session in a row, managing to reclaim the area above the $78.00 mark per barrel in response to the selling pressure hurting the greenback.
Gold prices edged higher and surpassed the $2,350 mark per troy ounce, adding to Friday’s small uptick. Silver followed suit and rose markedly more than 4% to surpass the $31.00 mark per ounce.
- The daily RSI and MACD remain in positive territory but suggest that consolidation may be incoming..
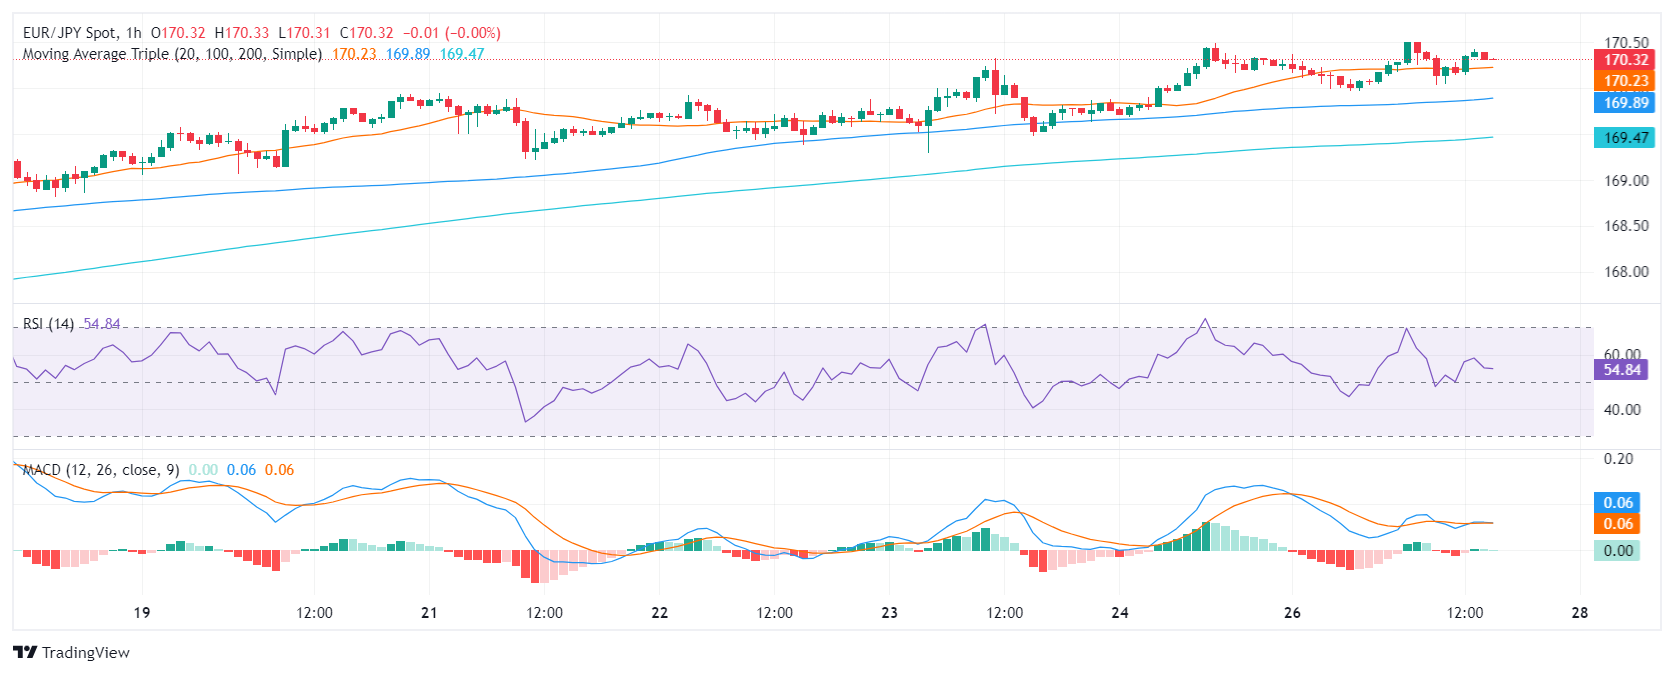
- The same indicators on the hourly chart hint also signal a possible consolidation phase subsequent to recent gains.
- The EUR/JPY's position above primary SMAs maintains long-term bullish sentiment.
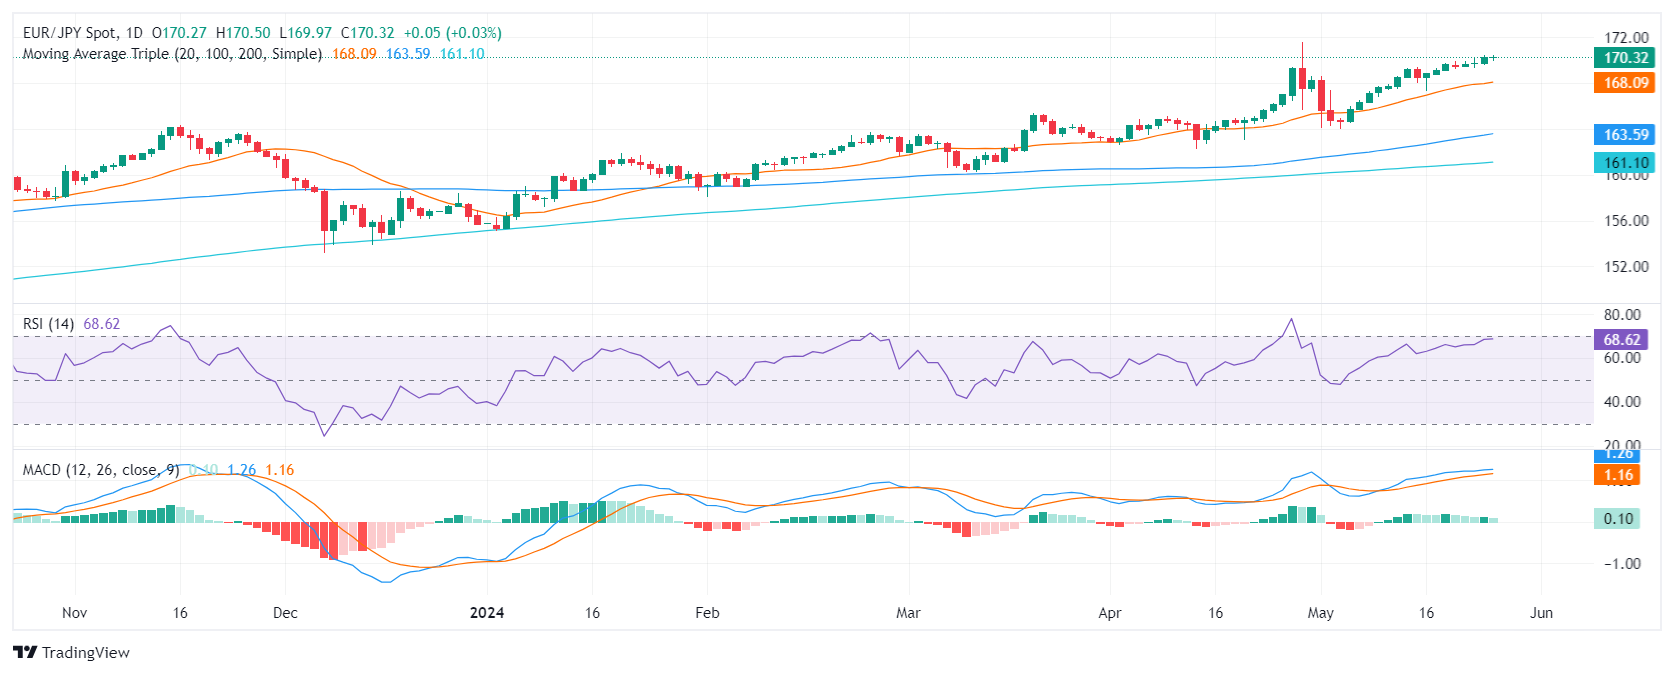
In Monday's session, the EUR/JPY pair is trading mildly higher, showing continued dominance by the bulls. However, caution must be exercised due to signs of overbought conditions, which tend to be followed by downward movements
In the daily analysis, the Relative Strength Index (RSI) for the EUR/JPY pair has been observing a steady positive trend. It points out that buyers hold a strong position with the latest reading nearing overbought territory. Concurrently, the Moving Average Convergence Divergence (MACD) histogram fortifies this stance, demonstrating flat green bars symbolizing a steady but flattening positive momentum.
EUR/JPY daily chart
Transitioning to the hourly chart, the RSI has dipped from high-positive towards a negative slope, with the latest reading at 54, distancing itself from an earlier overbought condition. The MACD histogram also hints at a pace alteration, continuing to print flat green bars, implying a downturn in buying pressure.
EUR/JPY hourly chart
The EUR/JPY robust performance is highlighted by its position above the key Simple Moving Average (SMA) benchmarks at 20,100, and 200 days. However, a technical correction may be incoming but any movements which keep the pair above these levels could be considered as mere consolidation.
- GBP/JPY rose back above 200.00 as Yen weakness remains.
- BoJ statements bought little reprieve from broad-market Yen selling.
- Japanese Tokyo CPI inflation due later this week.
GBP/JPY rose again on Monday, climbing back above the key 200.00 handle as broad-market Yen selling continues to batter the JPY. Bank of Japan (BoJ) policymakers, including BoJ Governor Kazuo Ueda and BoJ Deputy Governor Shinichi Uchida, found very little traction in markets, and a reprieve in Yen short pressure was brief in early Monday trading.
The UK economic calendar is quiet this week, with strictly low-tier figures on the offering. Yen traders will pivot in the late-week to focus on Japanese Tokyo Consumer Price Index (CPI) inflation figures. YoY headline Tokyo CPI inflation last printed at 1.8% in April, with Core Tokyo CPI inflation coming in at 1.6%. Median market forecasts currently expect May’s Core Tokyo CPI inflation to bounce to 1.9%. Tokyo CPI inflation will print early Friday.
GBP/JPY technical outlook
The Guppy continues to march up the charts and the pair is threatening to break into fresh multi-decade highs above 200.60, a level reached in late April. The pair fell to a near-term low below 192.00 after a set of suspected “Yenterventions”, but broad-market Yen weakness continues unabated. GBP/JPY has gained ground in all but three of the last 15 consecutive trading days.
GBP/JPY hourly chart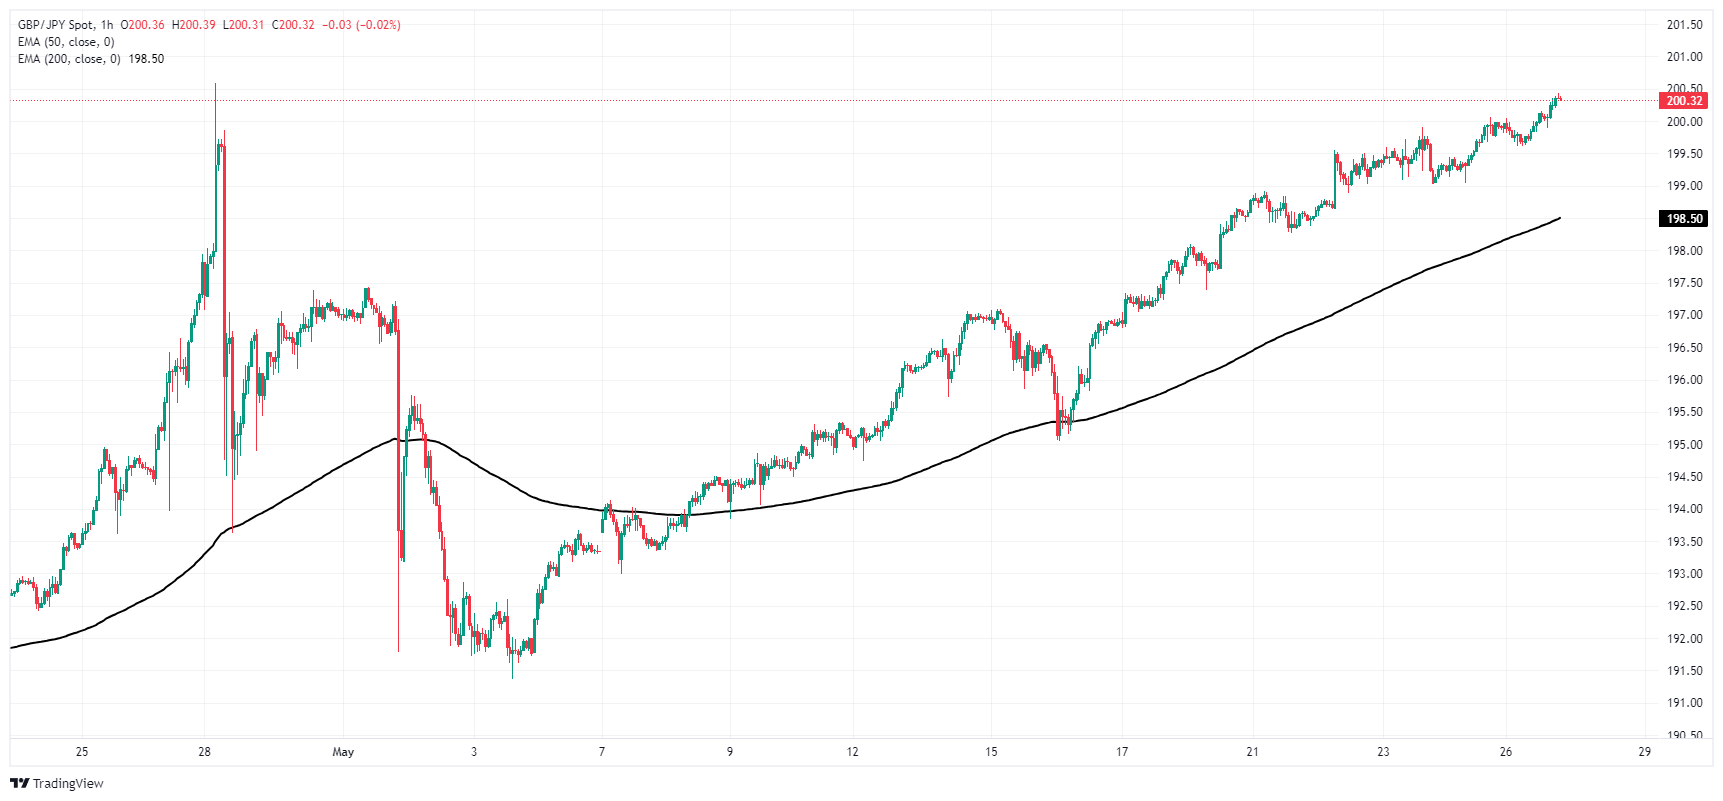
GBP/JPY daily chart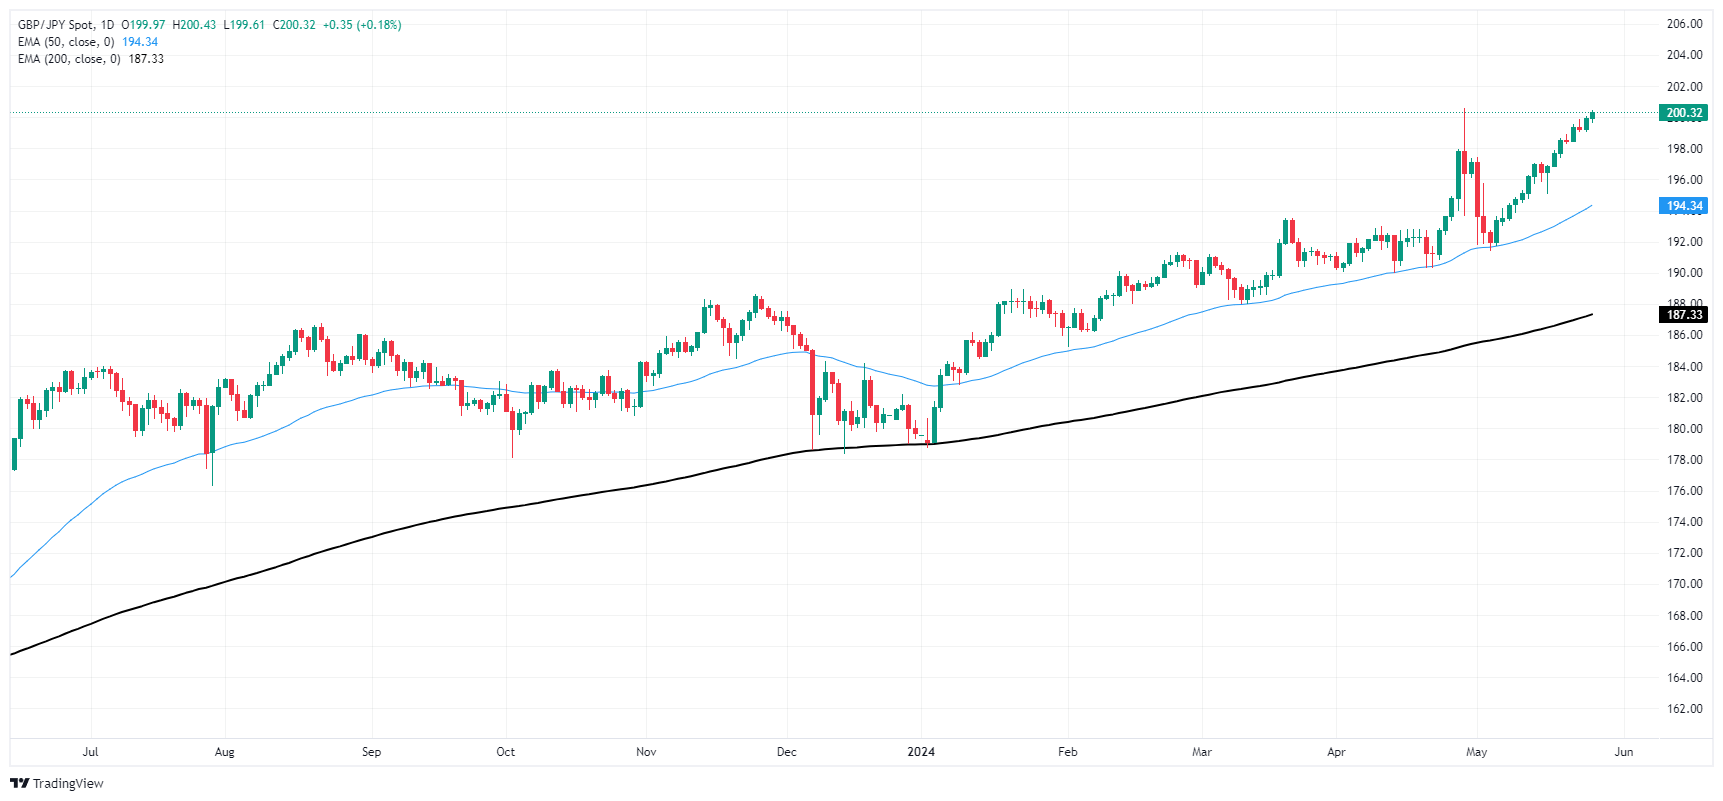
- Mexican Peso recovers ground against the US Dollar, trading at 16.64, down 0.09%.
- Mexican economic data reveals an April trade deficit and a Q1 2024 Current Account deficit totaling $-12,582 million.
- Traders await US core PCE Price Index, softer results may increase prospects for 2024 rate cuts.
The Mexican Peso recovered ground against the US Dollar on Monday amid thin volume conditions as Wall Street remained closed in observance of Memorial Day. A scarce Mexican economic docket during the week leaves traders awaiting the release of the core Personal Consumption Expenditures Price Index (PCE) on Friday, the Federal Reserve’s preferred inflation gauge. If it comes in softer than expected, it would increase hopes for a rate cut in 2024.
The USD/MXN trades at 16.64, down 0.09%. The market sentiment in Europe is positive, yet volume conditions remain tight as American traders take the day off. Last week, Mexico’s National Statistics Agency revealed a trade deficit in April after registering a surplus of $2.098 billion in March.
Meanwhile, the Bank of Mexico (Banxico) registered a Current Account deficit of $-12,582 million in Q1 2024, down from the surplus of $11,817 million achieved in the previous reading.
Across the border, the US economy continues to fare well following the release of last week's S&P Global PMIs highlighting its strength as business activity picked up. Yet a worse-than-expected US Durable Goods Orders report on Friday kept investors uncertain about the economic outlook.
Daily digest market movers: Mexican Peso capitalizes on US Dollar weakness despite turning uncertain
- Last week’s data showed that Mexico’s economic outlook is turning uncertain as the Mid-month headline inflation for May rose as underlying prices dipped.
- Alongside that, Mexico’s economic slowdown, as shown by the last Gross Domestic Product (GDP) report and a widening trade deficit, could exert pressure on Mexican Peso.
- May’s Citibanamex poll showed that most economists estimate Banxico will cut rates on June 27 from 11% to 10.75%. The median expects headline inflation at 4.21% and core at 4.07% in 2024.
- In the week ahead, the US economic docket will feature further Fedspeak, housing data, the Conference Board (CB) Consumer Confidence, economic growth data, and the release of core PCE.
- Despite that, fed funds rate futures estimated just 25 basis points of easing toward the end of the year after S&P Global revealed that US business activity is gathering steam.
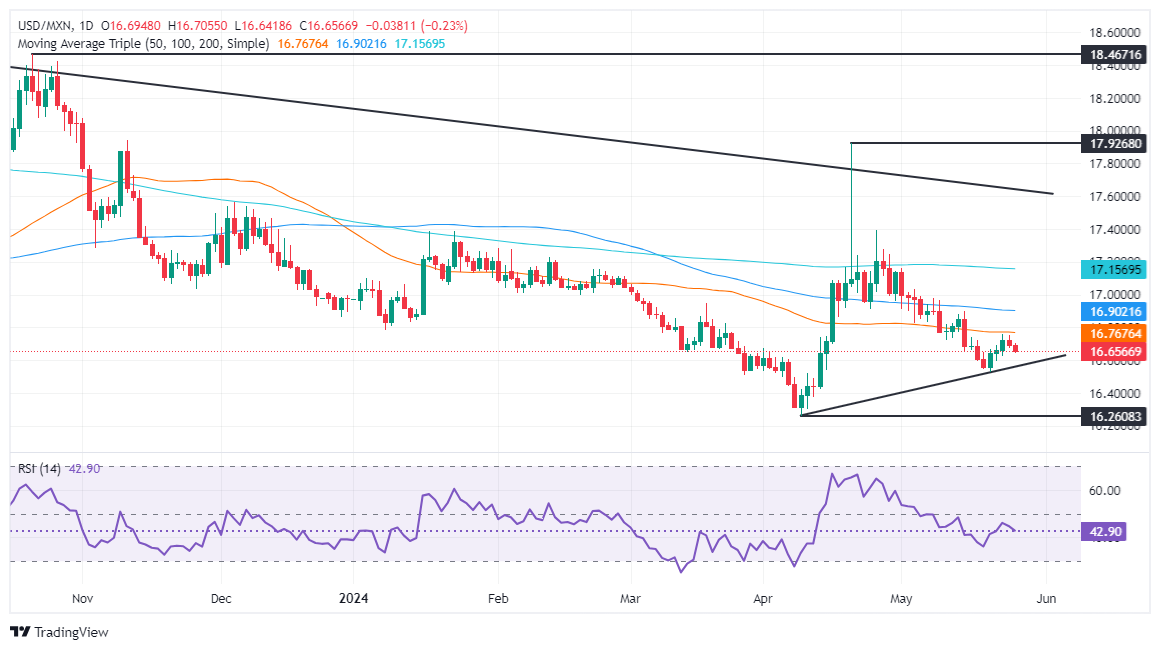
Technical analysis: Mexican Peso trims losses as USD/MXN tumbles below 16.70
The USD/MXN downtrend extended after buyers failed to overcome the 100-day SMA at 16.76 with the pair subsequently dropping below the psychological 16.70 mark. Momentum favors sellers as the Relative Strength Index (RSI) points downward into bearish territory.
Given the current seller strength, the path of least resistance is downward. The pair's next support is at 16.62, the 2023 low, followed by the May 21 cycle low at 16.52 and the year-to-date low of 16.25.
On the flip side, if buyers reclaim 16.70, they will need to surpass the 100-day SMA at 16.76 to extend gains. In that scenario, key resistance levels include the 50-day SMA at 16.89, the psychological figure of 17.00, and the 200-day SMA at 17.14.
Mexican Peso FAQs
The Mexican Peso (MXN) is the most traded currency among its Latin American peers. Its value is broadly determined by the performance of the Mexican economy, the country’s central bank’s policy, the amount of foreign investment in the country and even the levels of remittances sent by Mexicans who live abroad, particularly in the United States. Geopolitical trends can also move MXN: for example, the process of nearshoring – or the decision by some firms to relocate manufacturing capacity and supply chains closer to their home countries – is also seen as a catalyst for the Mexican currency as the country is considered a key manufacturing hub in the American continent. Another catalyst for MXN is Oil prices as Mexico is a key exporter of the commodity.
The main objective of Mexico’s central bank, also known as Banxico, is to maintain inflation at low and stable levels (at or close to its target of 3%, the midpoint in a tolerance band of between 2% and 4%). To this end, the bank sets an appropriate level of interest rates. When inflation is too high, Banxico will attempt to tame it by raising interest rates, making it more expensive for households and businesses to borrow money, thus cooling demand and the overall economy. Higher interest rates are generally positive for the Mexican Peso (MXN) as they lead to higher yields, making the country a more attractive place for investors. On the contrary, lower interest rates tend to weaken MXN.
Macroeconomic data releases are key to assess the state of the economy and can have an impact on the Mexican Peso (MXN) valuation. A strong Mexican economy, based on high economic growth, low unemployment and high confidence is good for MXN. Not only does it attract more foreign investment but it may encourage the Bank of Mexico (Banxico) to increase interest rates, particularly if this strength comes together with elevated inflation. However, if economic data is weak, MXN is likely to depreciate.
As an emerging-market currency, the Mexican Peso (MXN) tends to strive during risk-on periods, or when investors perceive that broader market risks are low and thus are eager to engage with investments that carry a higher risk. Conversely, MXN tends to weaken at times of market turbulence or economic uncertainty as investors tend to sell higher-risk assets and flee to the more-stable safe havens.
- Canadian Dollar climbs over Greenback but gives mixed Monday performance.
- Canada brings little of note to the economic calendar until Friday’s GDP release.
- Memorial Day holiday keeps US markets dark, leaves market volumes thin.
The Canadian Dollar (CAD) is mixed on Monday, climbing against the US Dollar (USD) thanks to a quiet US market session. US markets are dark for the Memorial Day holiday, leaving CAD traders to twist in the breeze and await meaningful data prints.
Canada has little of note on the economic calendar early this week, and the release schedule is littered with low-impact figures until Thursday’s Canadian Current Account for the first quarter, which is expected to decline to -5.88 billion versus the previous -1.62 billion. Friday brings a fresh print of Canadian Gross Domestic Product (GDP), which is forecast to ease to a flat 0.0% MoM compared to the previous 0.2%. However, Friday’s Canadian GDP is likely to be overshadowed by key US inflation figures being released at the same time.
Daily digest market movers: Quiet Monday markets give Canadian Dollar a leg up on Greenback weakness
- Canadian Dollar is gaining ground on Monday, due more to fresh weakness in safe haven currencies than any particular CAD-based bidding power.
- According to a StatCan flash estimate, wholesale trade in Canada likely rose 2.8% MoM in April, a welcome sign for investors fearing a potential recession in the Canadian economy.
- Canadian Industrial Product Prices, due to be released on Tuesday, are expected to slow to 0.6% MoM growth from the previous 0.8%.
- Canadian Raw Material Price Index is also expected to recede to 3.2% MoM growth from the previous 4.7%.
- Tuesday will kick off the American trading week with appearances from several key Federal Reserve policymakers as Fedspeak remains a key driver of market flows.
Canadian Dollar PRICE Today
The table below shows the percentage change of Canadian Dollar (CAD) against listed major currencies today. Canadian Dollar was the strongest against the US Dollar.
| USD | EUR | GBP | JPY | CAD | AUD | NZD | CHF | |
|---|---|---|---|---|---|---|---|---|
| USD | -0.12% | -0.25% | -0.06% | -0.25% | -0.40% | -0.54% | -0.11% | |
| EUR | 0.12% | -0.16% | 0.09% | -0.14% | -0.34% | -0.52% | 0.05% | |
| GBP | 0.25% | 0.16% | 0.18% | -0.01% | -0.18% | -0.27% | 0.17% | |
| JPY | 0.06% | -0.09% | -0.18% | -0.22% | -0.35% | -0.40% | -0.07% | |
| CAD | 0.25% | 0.14% | 0.00% | 0.22% | -0.17% | -0.29% | 0.09% | |
| AUD | 0.40% | 0.34% | 0.18% | 0.35% | 0.17% | -0.10% | 0.35% | |
| NZD | 0.54% | 0.52% | 0.27% | 0.40% | 0.29% | 0.10% | 0.43% | |
| CHF | 0.11% | -0.05% | -0.17% | 0.07% | -0.09% | -0.35% | -0.43% |
The heat map shows percentage changes of major currencies against each other. The base currency is picked from the left column, while the quote currency is picked from the top row. For example, if you pick the Canadian Dollar from the left column and move along the horizontal line to the US Dollar, the percentage change displayed in the box will represent CAD (base)/USD (quote).
Technical analysis: Canadian Dollar steps over softening Greenback
The Canadian Dollar (CAD) is broadly mixed on Monday, gaining around a quarter of a percent against the US Dollar and the Japanese Yen (JPY). However, the CAD is falling back against the Antipodeans, shedding a quarter of a percent against both the Australian Dollar (AUD) and the New Zealand Dollar (NZD).
USD/CAD fell back into familiar congestion on Monday, extending a decline from last week’s late peak near 1.3740. The pair is set to run aground of technical support near the 1.3600 handle, with a long-term floor priced in at the 200-day Exponential Moving Average near 1.3553.
USD/CAD hourly chart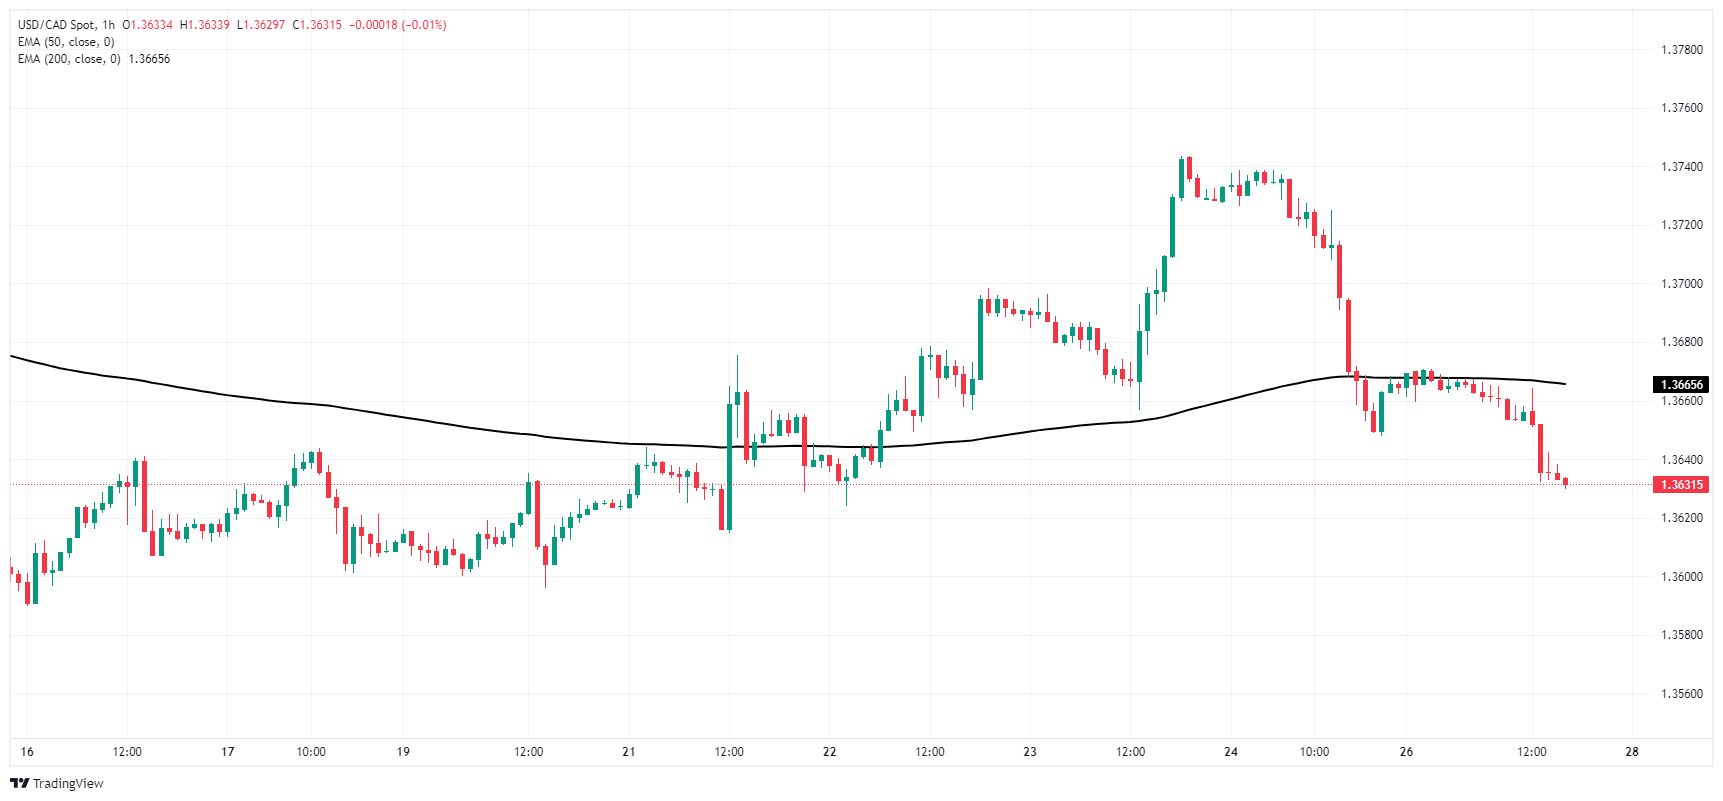
USD/CAD daily chart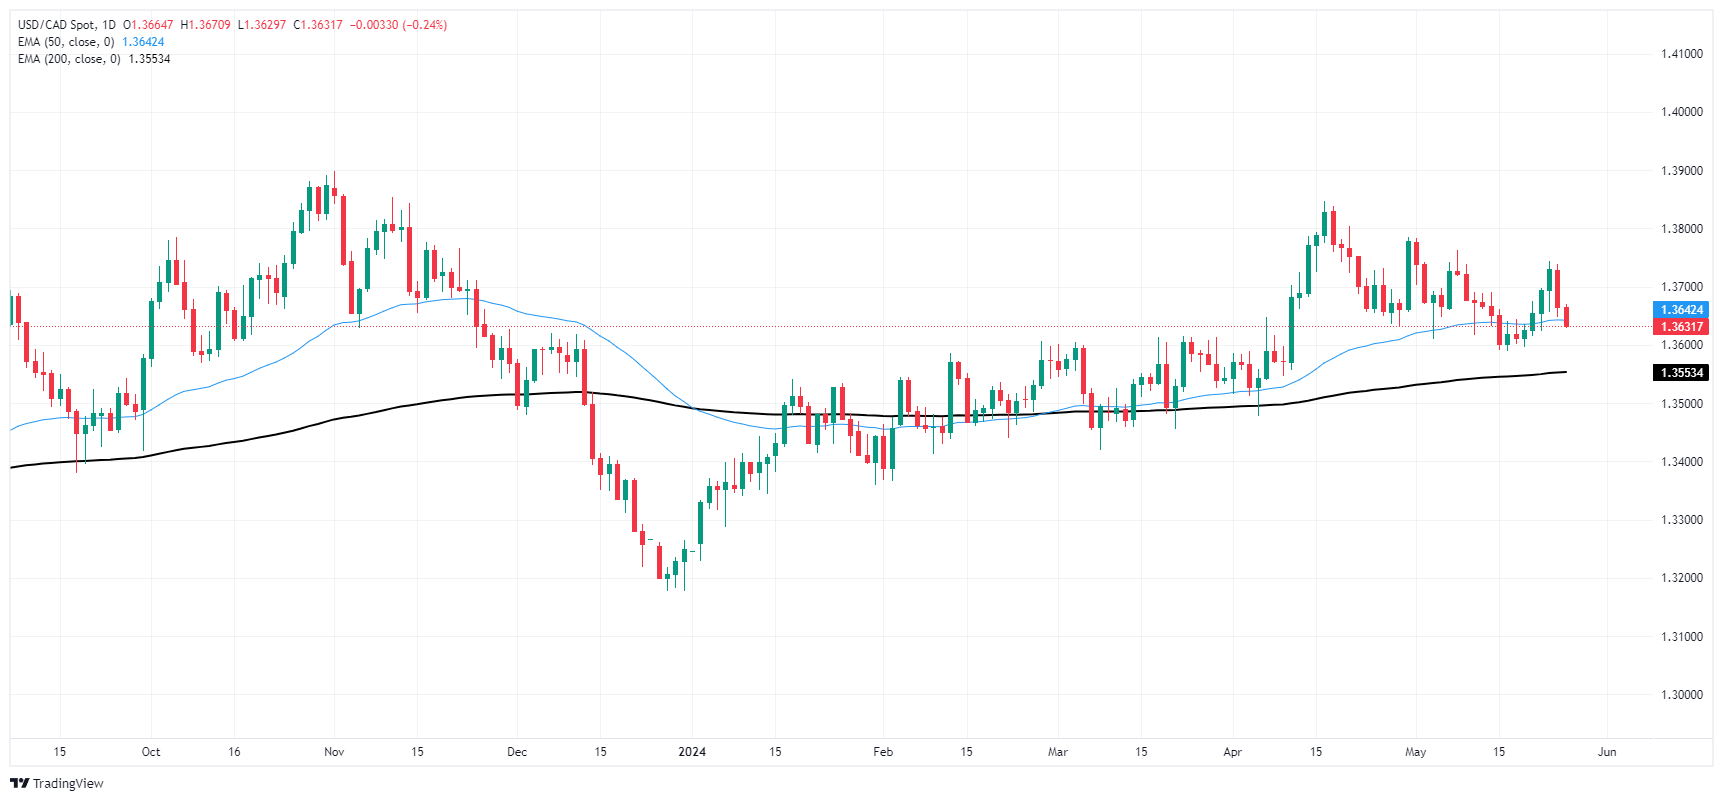
Canadian Dollar FAQs
The key factors driving the Canadian Dollar (CAD) are the level of interest rates set by the Bank of Canada (BoC), the price of Oil, Canada’s largest export, the health of its economy, inflation and the Trade Balance, which is the difference between the value of Canada’s exports versus its imports. Other factors include market sentiment – whether investors are taking on more risky assets (risk-on) or seeking safe-havens (risk-off) – with risk-on being CAD-positive. As its largest trading partner, the health of the US economy is also a key factor influencing the Canadian Dollar.
The Bank of Canada (BoC) has a significant influence on the Canadian Dollar by setting the level of interest rates that banks can lend to one another. This influences the level of interest rates for everyone. The main goal of the BoC is to maintain inflation at 1-3% by adjusting interest rates up or down. Relatively higher interest rates tend to be positive for the CAD. The Bank of Canada can also use quantitative easing and tightening to influence credit conditions, with the former CAD-negative and the latter CAD-positive.
The price of Oil is a key factor impacting the value of the Canadian Dollar. Petroleum is Canada’s biggest export, so Oil price tends to have an immediate impact on the CAD value. Generally, if Oil price rises CAD also goes up, as aggregate demand for the currency increases. The opposite is the case if the price of Oil falls. Higher Oil prices also tend to result in a greater likelihood of a positive Trade Balance, which is also supportive of the CAD.
While inflation had always traditionally been thought of as a negative factor for a currency since it lowers the value of money, the opposite has actually been the case in modern times with the relaxation of cross-border capital controls. Higher inflation tends to lead central banks to put up interest rates which attracts more capital inflows from global investors seeking a lucrative place to keep their money. This increases demand for the local currency, which in Canada’s case is the Canadian Dollar.
Macroeconomic data releases gauge the health of the economy and can have an impact on the Canadian Dollar. Indicators such as GDP, Manufacturing and Services PMIs, employment, and consumer sentiment surveys can all influence the direction of the CAD. A strong economy is good for the Canadian Dollar. Not only does it attract more foreign investment but it may encourage the Bank of Canada to put up interest rates, leading to a stronger currency. If economic data is weak, however, the CAD is likely to fall.
- Data on US income, spending, consumer confidence, and Q1 GDP will shape the index’s trajectory this week.
- Fed's Beige Book report on Wednesday is anticipated to suggest a balanced economic backdrop.
- Investors anticipate less than 80% odds of November rate cut and 50% chance of cut in September.
The US Dollar Index (DXY) is seeing some losses on Monday as US markets remain closed for the Memorial Day break. Market participants anticipate Thursday's Gross Domestic Product (GDP) and Personal Consumption Expenditures (PCE) data in hope of additional insights into the Federal Reserve's (Fed) stance and the economy's health. The Beige Book report on Wednesday will also be eagerly anticipated.
The US economy, backed by robust data, allows the Fed to maintain its hawkish stance, which cushions the US Dollar. Despite some signs of labor market softening and dampened consumer spending, inflation remains high, which justifies Fed officials’ continued talk of patience.
Daily digest market movers: DXY is mildly down ahead of key data this week, eyes on Fed officials
- Officials from the Fed, including Mester, Bowman, Kashkari, Cook and Daly, are expected to continue advocating for a cautious approach in their scheduled speeches throughout the week. Markets continue to adjust their expectations, odds of September cut stand around 50%.
- April’s Personal Consumption Expenditure (PCE) report is expected on Friday. Projections remain at 2.7% YoY for headline inflation, 2.8% for core.
- Q1 GDP is expected to be revised to 1.3% on Thursday.
- Outcome of high-tier data will continue modeling expectations on easing cycle, dictating pace of USD.
DXY technical analysis: Greenback witnesses selling pressure, while bulls struggle
The daily chart indicators display escalating bearish momentum in the DXY. The Relative Strength Index (RSI) is on a negative slope and remains in negative territory, suggesting that selling pressure prevails. This is further confirmed by the flat red bars of the Moving Average Convergence Divergence (MACD) indicator.
In regard to Simple Moving Averages (SMAs), the DXY is operating beneath the 20-day SMA, indicating bears’ short-term efficiency. Despite this, DXY remains above the 100 and 200-day SMAs, suggesting bulls have relative strength over a more extended timeline.
US Dollar FAQs
The US Dollar (USD) is the official currency of the United States of America, and the ‘de facto’ currency of a significant number of other countries where it is found in circulation alongside local notes. It is the most heavily traded currency in the world, accounting for over 88% of all global foreign exchange turnover, or an average of $6.6 trillion in transactions per day, according to data from 2022. Following the second world war, the USD took over from the British Pound as the world’s reserve currency. For most of its history, the US Dollar was backed by Gold, until the Bretton Woods Agreement in 1971 when the Gold Standard went away.
The most important single factor impacting on the value of the US Dollar is monetary policy, which is shaped by the Federal Reserve (Fed). The Fed has two mandates: to achieve price stability (control inflation) and foster full employment. Its primary tool to achieve these two goals is by adjusting interest rates. When prices are rising too quickly and inflation is above the Fed’s 2% target, the Fed will raise rates, which helps the USD value. When inflation falls below 2% or the Unemployment Rate is too high, the Fed may lower interest rates, which weighs on the Greenback.
In extreme situations, the Federal Reserve can also print more Dollars and enact quantitative easing (QE). QE is the process by which the Fed substantially increases the flow of credit in a stuck financial system. It is a non-standard policy measure used when credit has dried up because banks will not lend to each other (out of the fear of counterparty default). It is a last resort when simply lowering interest rates is unlikely to achieve the necessary result. It was the Fed’s weapon of choice to combat the credit crunch that occurred during the Great Financial Crisis in 2008. It involves the Fed printing more Dollars and using them to buy US government bonds predominantly from financial institutions. QE usually leads to a weaker US Dollar.
Quantitative tightening (QT) is the reverse process whereby the Federal Reserve stops buying bonds from financial institutions and does not reinvest the principal from the bonds it holds maturing in new purchases. It is usually positive for the US Dollar.
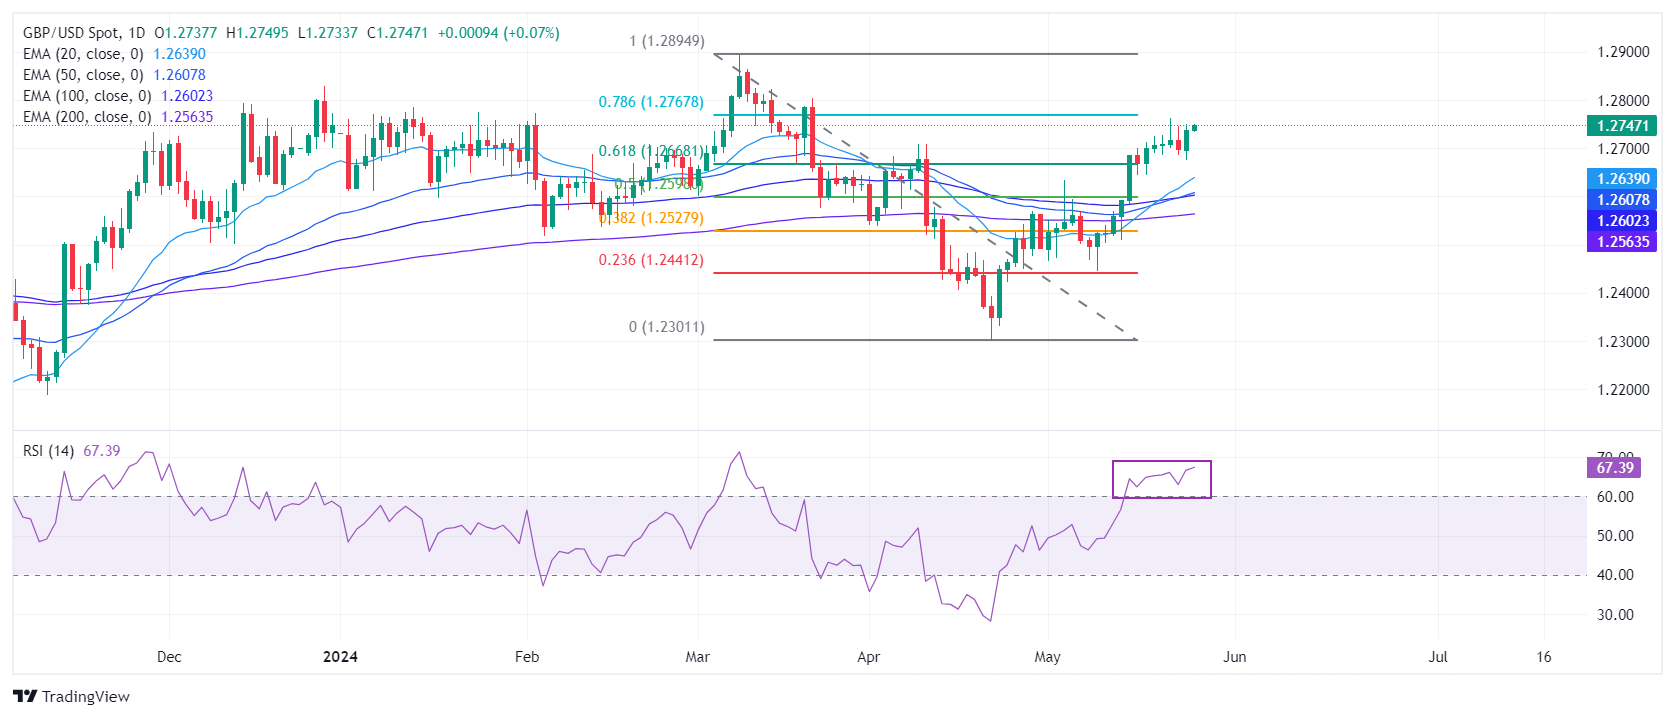
- GBP/USD registers solid gains on Monday on thin volume.
- From a daily chart perspective, the major could challenge the YTD high and 1.2900.
- Short-term, as RSI is overbought, look for a pullback to 1.2750 and 1.2700.
The Pound Sterling climbed 0.30% against the Greenback on Monday amid thin liquidity conditions in observance of UK and US holidays. At the time of writing, the GBP/USD trades at 1.2772 after hitting a daily low of 1.2728.
GBP/USD Price Analysis: Technical outlook
The GBP/USD daily chart depicts the pair as upward biased, aimed to challenge the March 21 cycle high at 1.2803. If cleared on further strength, up next lies the year-to-date (YTD) high at 1.2894. Failure to do it, and sellers could keep the pair within the 1.2700 – 1.2800 range ahead of the release of the US Core Personal Consumer Expenditures Price Index (PCE) on Friday.
Shor-term, the GBP/USD has broken the latest cycle peak at 1.2761, exposing the resistance levels. Despite that, caution is warranted as momentum suggests that buying pressure could be fading as the Relative Strength Index (RSI) shifted overbought. In that event, sellers could step in once the RSI pierces below 70.
If the GBP/USD retreats below 1.2750, the next stop would be the current day’s low of 1.2728. Once cleared, the next stop would be the 1.2700 mark.
GBP/USD Price Action – Hourly Chart
British Pound PRICE Today
The table below shows the percentage change of British Pound (GBP) against listed major currencies today. British Pound was the strongest against the US Dollar.
| USD | EUR | GBP | JPY | CAD | AUD | NZD | CHF | |
|---|---|---|---|---|---|---|---|---|
| USD | -0.09% | -0.30% | -0.13% | -0.24% | -0.44% | -0.56% | -0.07% | |
| EUR | 0.09% | -0.23% | -0.02% | -0.15% | -0.41% | -0.56% | 0.05% | |
| GBP | 0.30% | 0.23% | 0.16% | 0.05% | -0.17% | -0.27% | 0.25% | |
| JPY | 0.13% | 0.02% | -0.16% | -0.16% | -0.34% | -0.37% | 0.02% | |
| CAD | 0.24% | 0.15% | -0.05% | 0.16% | -0.22% | -0.32% | 0.11% | |
| AUD | 0.44% | 0.41% | 0.17% | 0.34% | 0.22% | -0.07% | 0.42% | |
| NZD | 0.56% | 0.56% | 0.27% | 0.37% | 0.32% | 0.07% | 0.48% | |
| CHF | 0.07% | -0.05% | -0.25% | -0.02% | -0.11% | -0.42% | -0.48% |
The heat map shows percentage changes of major currencies against each other. The base currency is picked from the left column, while the quote currency is picked from the top row. For example, if you pick the British Pound from the left column and move along the horizontal line to the US Dollar, the percentage change displayed in the box will represent GBP (base)/USD (quote).
- WTI jumps to $78.50 with a focus on global inflation data.
- The Fed is expected to announce rate cuts in the last quarter of this year.
- Investors will focus on the OPEC+ meeting to know about any change in the oil supply policy.
West Texas Intermediate (WTI), futures on NYMEX, rises further to $78.50 in Monday’s New York session. The Oil price rises even though investors expect that the Federal Reserve (Fed) will consider reducing interest rates from the current levels in the last quarter of this year.
Market speculation for Fed rate cuts has shifted to the last quarter from the September meeting as policymakers want the continuation of current policy framework for a longer period until they get evidence that inflation will sustainably return to the desired rate of 2%. Fed officials emphasize keeping the policy framework restrictive despite the slowdown in price pressures in April suggested by the Consumer Price Index (CPI) report of the same month.
Historically, easing Fed rate-cut prospects is an unfavorable situation for the Oil price as higher interest rates reduced flow of liquidity into the economy, which weakens the OIL demand outlook.
This week, investors will focus on the United States core Personal Consumption Expenditure price index (PCE) data for April and the Eurozone preliminary inflation data for May, which will influence speculation for rate cuts by the Fed and the European Central Bank (ECB), respectively, which will be published on Friday.
The ECB is expected to begin cutting key borrowing rates in June, while investors doubt whether policymakers will follow the dovish decision in the July meeting, too.
On the supply front, investors will focus on the OPEC+ meeting that is scheduled for June 2. Investors will focus on whether oil-rich nations will change the current output cut of 2.2 million barrels for data.
- AUD/USD moves higher to 0.6650 ahead of crucial Australian economic data.
- Investors expect that the Fed will consider rate cuts in the last quarter of this year.
- Fed policymakers emphasize the need to maintain interest rates at restrictive levels.
The AUD/USD pair climbs to 0.6650 in Monday’s New York session. The Aussie asset rises as the US Dollar remains under pressure even though investors expect that the Federal Reserve (Fed) will not cut interest rates before the fourth quarter of this year.
The market sentiment is slightly cautious due to thin trading volume as United States markets are closed on account of Memorial Day. The US Dollar Index (DXY), which tracks the Greenback’s value against six major currencies, is slightly down near 104.65.
Market speculation for the Fed reducing interest rates from the September meeting has come downs slightly below 50% from 62% a week ago, as per the CME FedWatch tool. The sharp decline in Fed rate-cut prospects is the outcome of policymakers’ hawkish interest-rate guidance and strengthening US economic outlook.
Fed officials have been underscoring the need to maintain the current interest rate framework for a longer period as they believe that the one-time decline in price pressures reported by April’s Consumer Price Index (CPI) report is insufficient to gain confidence that progress in the disinflation process has resumed after stalling in the January-March period.
Meanwhile, the Australian Dollar exhibits strength ahead of the release of the monthly Retail Sales and annual Consumer Price Index (CPI) data for April, which will be published on Tuesday and Wednesday.
The Retail Sales are estimated to have grown by 0.2% after contracting 0.4% in March. In the same period, the inflation data is expected to have softened to 3.4% from 3.5%.
European Central Bank (ECB) Chief Economist Phillip Lane said on Monday that keeping rates overly restrictive for too long could push inflation below target over the medium term, per Reuters. "This would require corrective action that could even require having to descend to below-neutral," Lane added.
Key takeaways
"The breadth of the domestic inflation dynamic is narrowing."
"The bulk of the tightening impact on inflation is comparatively backloaded, with substantial pass-through still expected to transpire in the period ahead."
"The ECB wage tracker is signalling that overall wage pressures have moderated since 2023."
"It is straightforward that the calibration of the appropriate degree of restrictiveness should adjust for the impact of lower expected inflation."
"Even if inflation does not smoothly decline during the rest of 2024, further disinflation can be expected in the course of 2025."
"Easing the stance too quickly would not be consistent with inflation sustainably returning to target if inflation turns out to be more persistent than anticipated."
Market reaction
These remarks failed to trigger a noticeable market reaction. At the time of press, EUR/USD was virtually unchanged on the day at 1.0848.
- The US Dollar index (DXY) closed below the key 105.00 level last week, extending the downside on Monday.
- US markets are closed due to the Memorial Day holiday on Monday.
- The US Dollar could ease further after an important daily and weekly close on the charts.
The US Dollar (USD) trades a little softer against most major peers on Monday as there is not much to report for the Greenback, with US markets closed for the Memorial Day holidays. However, on the other side of the Atlantic Ocean, a change in stance on the European Central Bank (ECB) is starting to form.
There is a very quiet economic data calendar on Monday. Most of this week will be rather quiet, with only some soft data and US Federal Reserve (Fed) speeches ahead towards Thursday. Then, the second estimate for the Q1 US Gross Domestic Product (GDP) on Thursday and April’s US Personal Consumption Expenditures (PCE) numbers on Friday could hit markets and leave more clues on the disinflationary pathway in the US and what the Fed might do next.
Daily digest market movers: Some small headlines
- Traders are still looking into more details on a headline from Friday where President Vladimir Putin said to be willing to have a ceasefire and start up peace talks if current frontlines can be adhered to as new official borders.
- ECB Chief Economist Philip Lane said that an interest rate cut in June looks a given, though it might take longer for the next cut. This completely goes against the three-cut expectations from the markets, with several ECB policymakers recently saying that a June rate cut might be a ‘one and done’ for 2024.
- There is risk-on sentiment across the board, with China and Europe markets comfortably in the green.
- The CME Fedwatch Tool is pricing 99.1% for no change in the policy rate for June. September futures are seeing more action, where it is a neck-and-neck race with 50.2% chances for keeping rates unchanged against 44.9% chances for a 25 basic points (bps) rate cut and 4.5% chances for even 50 bps rate cut. A marginal 0.5% price in an interest rate hike.
- The benchmark 10-year US Treasury Note trades around 4.46% and is not moving on Monday with the US bank holiday.
US Dollar Index Technical Analysis: Technical ugly picture
The US Dollar Index (DXY) faces a bit of a horror story on the technical front after its weekly close on Friday. First of all, on the weekly chart, the DXY closed below the 100-week Simple Moving Average (SMA), which is a severe bearish signal and could point to a further downturn. A similar picture is seen on the daily chart, where the DXY was unable to stay afloat above the 55-day SMA at 104.86 and gave up its gains for the week above 105.00.
On the upside, the DXY index needs to reclaim those levels it lost last week: the 55-day Simple Moving Average (SMA) at 104.86 and the 105.00 big round level. Further up, the following levels to consider are 105.12 and 105.52.
On the downside, the 200-day SMA at 104.40 and the 100-day SMA around 104.30 are the last line of defence. Once that level snaps, an air pocket is placed between 104.30 and 103.00. Should the US Dollar decline persist, the low of March at 102.35 and the low from December at 100.62 are levels to consider.
US Dollar FAQs
The US Dollar (USD) is the official currency of the United States of America, and the ‘de facto’ currency of a significant number of other countries where it is found in circulation alongside local notes. It is the most heavily traded currency in the world, accounting for over 88% of all global foreign exchange turnover, or an average of $6.6 trillion in transactions per day, according to data from 2022. Following the second world war, the USD took over from the British Pound as the world’s reserve currency. For most of its history, the US Dollar was backed by Gold, until the Bretton Woods Agreement in 1971 when the Gold Standard went away.
The most important single factor impacting on the value of the US Dollar is monetary policy, which is shaped by the Federal Reserve (Fed). The Fed has two mandates: to achieve price stability (control inflation) and foster full employment. Its primary tool to achieve these two goals is by adjusting interest rates. When prices are rising too quickly and inflation is above the Fed’s 2% target, the Fed will raise rates, which helps the USD value. When inflation falls below 2% or the Unemployment Rate is too high, the Fed may lower interest rates, which weighs on the Greenback.
In extreme situations, the Federal Reserve can also print more Dollars and enact quantitative easing (QE). QE is the process by which the Fed substantially increases the flow of credit in a stuck financial system. It is a non-standard policy measure used when credit has dried up because banks will not lend to each other (out of the fear of counterparty default). It is a last resort when simply lowering interest rates is unlikely to achieve the necessary result. It was the Fed’s weapon of choice to combat the credit crunch that occurred during the Great Financial Crisis in 2008. It involves the Fed printing more Dollars and using them to buy US government bonds predominantly from financial institutions. QE usually leads to a weaker US Dollar.
Quantitative tightening (QT) is the reverse process whereby the Federal Reserve stops buying bonds from financial institutions and does not reinvest the principal from the bonds it holds maturing in new purchases. It is usually positive for the US Dollar.
- Gold is pulling back after last week’s steep sell-off.
- Traders are keen to wait for US inflation data later this week to reassess fundamentals.
- Gold is probably forming a consolidation or continuation pattern within a downtrend that is likely to go lower.
Gold (XAU/USD) is trading in the $2,340s, making a modest pullback from oversold levels on Monday. Markets are quiet ahead of potentially market-moving US inflation data later in the week. Public holidays in the UK and the US further reduce volumes.
Gold pulls back after steep sell-off
Gold price dropped from a peak of $2,450 to a low of $2,325 last week, on the back of changing expectations for the future path of US interest rates.
Better-than-expected US economic data last week led to a revision of market expectations for when the US Federal Reserve (Fed) is foreseen lowering interest rates. Whilst last week interest-rate future’s markets gave a probability of 65% that the Fed will lower its fed funds rate by 0.25% at its September meeting, today they are only giving it odds of 49%, according to the CME Fedwatch tool.
The maintenance of interest rates at high levels is negative for non-yielding Gold because it increases the opportunity cost of holding the precious metal.
Technical Analysis: Gold consolidates in new downtrend
Gold price is consolidating after a steep decline. Last week’s sell-off took it below a major trendline and has ushered in a new more bearish technical environment.
Gold is probably in a short-term downtrend now, favoring short positions over longs.
XAU/USD 4-hour Chart
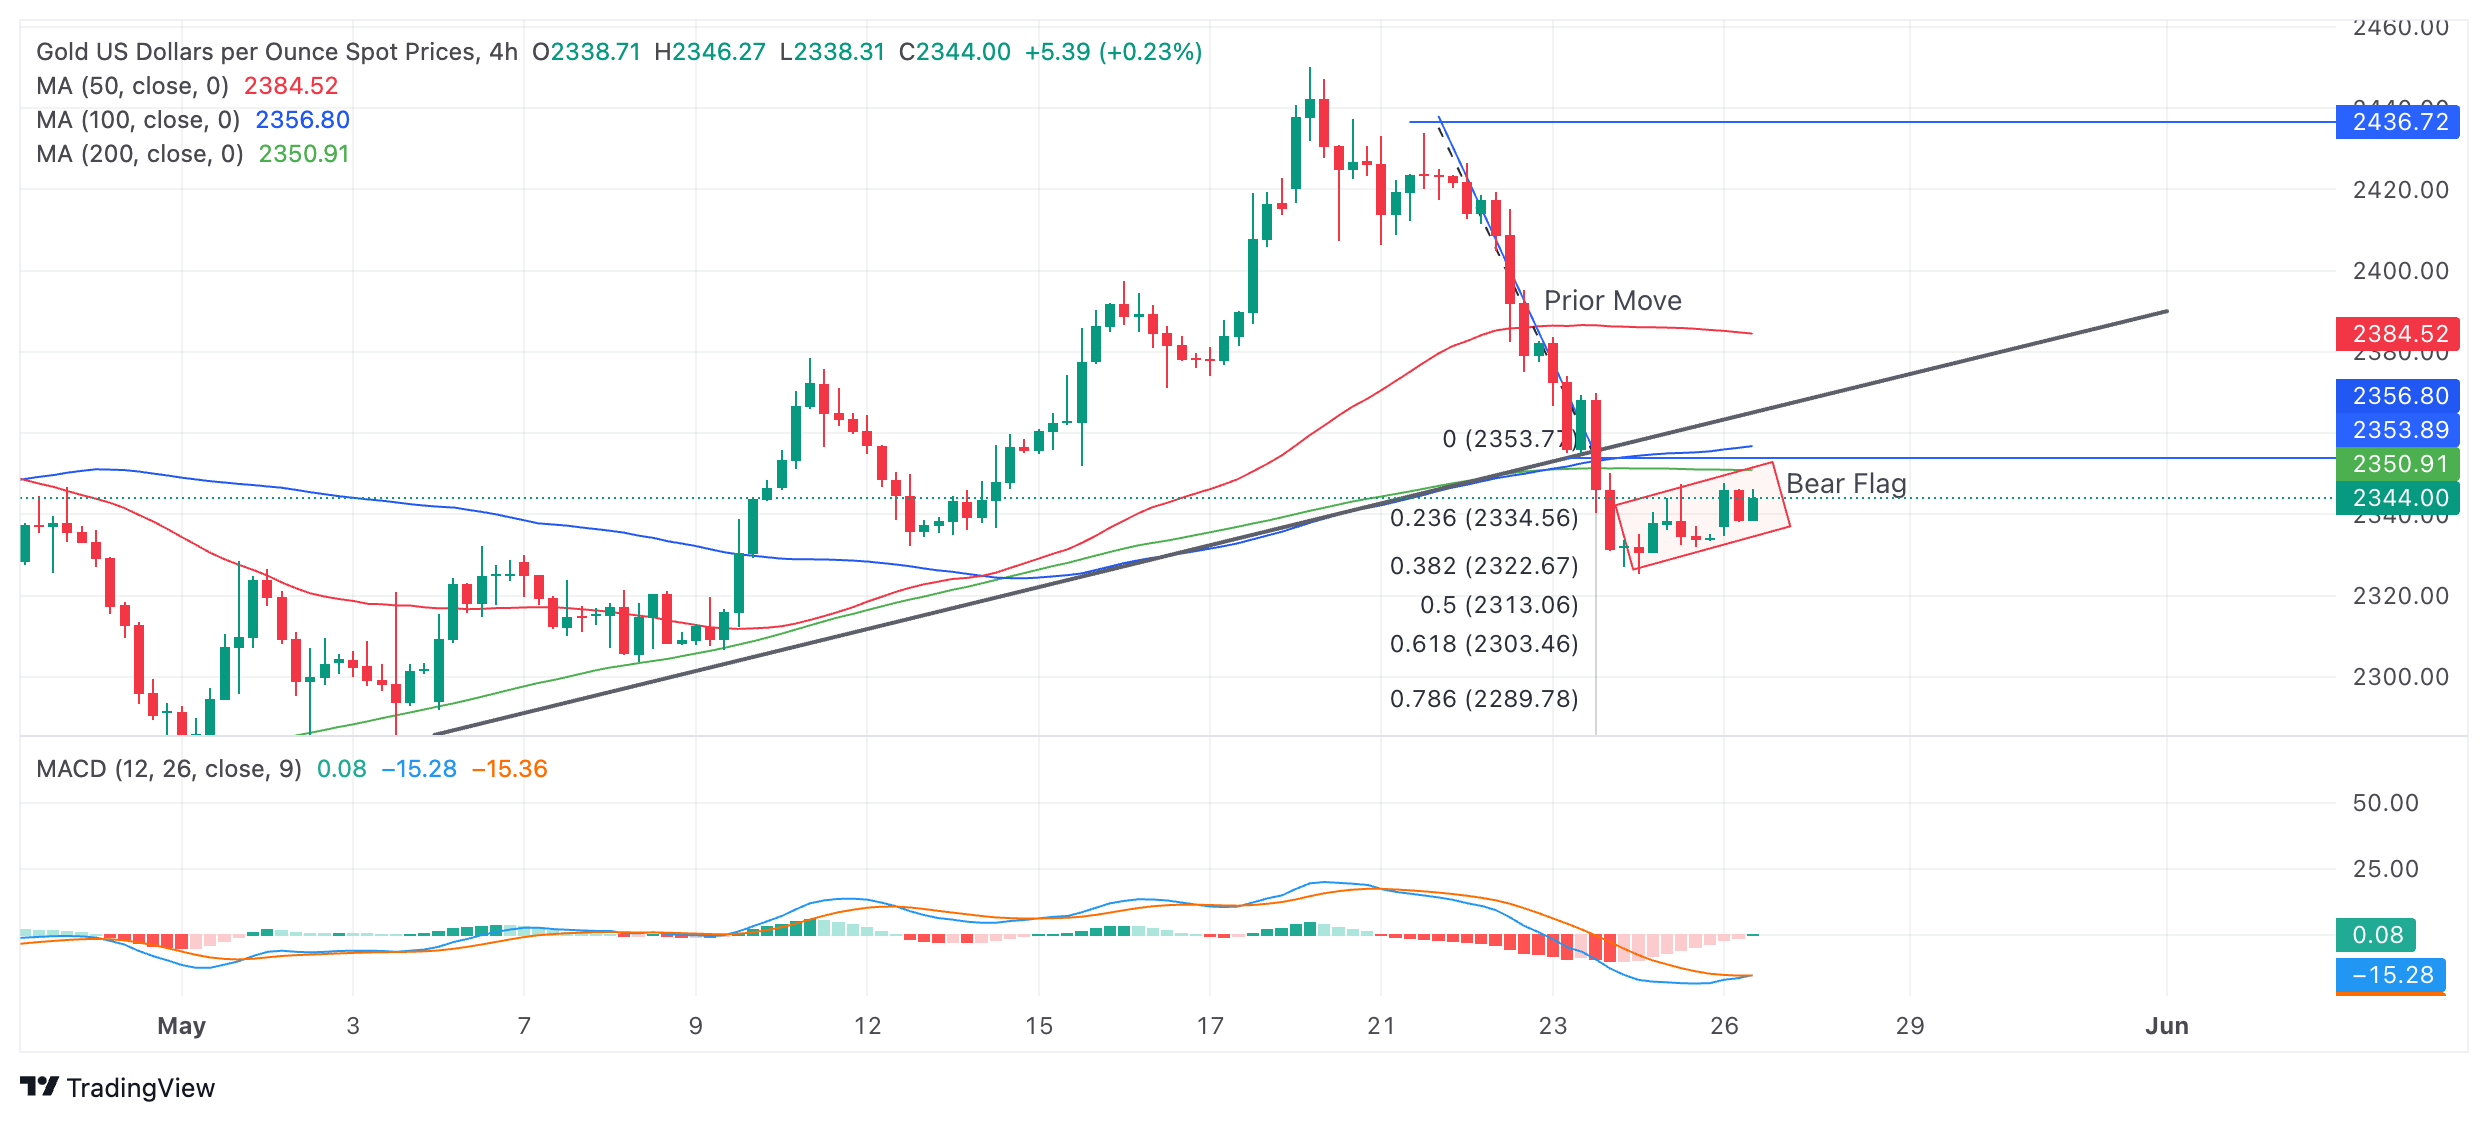
The precious metal is seen pulling back (red rectangle) on the 4-hour chart used to assess the short-term trend. The pullback is relatively shallow, however, and looks vulnerable to break down. The pullback might even be an evolving Bear Flag continuation price pattern. If so, it would suggest substantial downside – to at least $2,300 – in the event of a break below the $3,325 May 24 lows.
Last week’s decisive break of the major trendline indicates a likely follow-through lower. The conservative target for the follow-through is $2,303 (the Fibonacci 0.618 extrapolation of the down move prior to the break – from $2,435 to $2,355).
A more bearish move could see Gold fall all the way down to $2,272 (the 100% extrapolation of the move prior to the break). The latter level is also the support from the May 3 lower high. A break below the $2,325 lows would provide confirmation of more downside to these targets.
The Moving Average Convergence Divergence (MACD) indicator is attempting to cross above its signal line. If it is successful, it will give a buy signal and perhaps indicate the possibility the pullback is developing into a stronger upside correction
The precious metal’s medium and long-term trends are still bullish, further suggesting the risk of a recovery remains high, yet price action is not supporting a resumption hypothesis.
A decisive break back above the trendline at $2,360 would, however, provide evidence of a recovery and reversal of the short-term downtrend.
A decisive break would be one accompanied by a long green bullish candle or three green candles in a row.
Gold FAQs
Gold has played a key role in human’s history as it has been widely used as a store of value and medium of exchange. Currently, apart from its shine and usage for jewelry, the precious metal is widely seen as a safe-haven asset, meaning that it is considered a good investment during turbulent times. Gold is also widely seen as a hedge against inflation and against depreciating currencies as it doesn’t rely on any specific issuer or government.
Central banks are the biggest Gold holders. In their aim to support their currencies in turbulent times, central banks tend to diversify their reserves and buy Gold to improve the perceived strength of the economy and the currency. High Gold reserves can be a source of trust for a country’s solvency. Central banks added 1,136 tonnes of Gold worth around $70 billion to their reserves in 2022, according to data from the World Gold Council. This is the highest yearly purchase since records began. Central banks from emerging economies such as China, India and Turkey are quickly increasing their Gold reserves.
Gold has an inverse correlation with the US Dollar and US Treasuries, which are both major reserve and safe-haven assets. When the Dollar depreciates, Gold tends to rise, enabling investors and central banks to diversify their assets in turbulent times. Gold is also inversely correlated with risk assets. A rally in the stock market tends to weaken Gold price, while sell-offs in riskier markets tend to favor the precious metal.
The price can move due to a wide range of factors. Geopolitical instability or fears of a deep recession can quickly make Gold price escalate due to its safe-haven status. As a yield-less asset, Gold tends to rise with lower interest rates, while higher cost of money usually weighs down on the yellow metal. Still, most moves depend on how the US Dollar (USD) behaves as the asset is priced in dollars (XAU/USD). A strong Dollar tends to keep the price of Gold controlled, whereas a weaker Dollar is likely to push Gold prices up.
- USD/CAD juggles near Friday’s low around 1.3650 as trading volume is low due to holiday in US markets.
- Traders pare bets supporting Fed rate cuts in September.
- The BoC is widely anticipated to start reducing interest rates from June.
The USD/CAD pair trades in a narrow range near Friday’s low around 1.3650 in Monday’s European session. The Loonie asset is on the backfoot as the US Dollar faces selling pressure in a thin trading volume session as the United States (US) markets are closed on account of Memorial Day.
The US Dollar could bounce back as investors worry that the Federal Reserve (Fed) will not return to policy normalization before the last quarter of this year. The CME FedWatch tool shows that probability for interest rates remaining steady at their current levels after the September meeting has increased to 51% from 38% recorded last week.
Also, Fed policymakers continue to maintain a hawkish guidance on interest rates as they believe that one-time decline in the inflation data as recorded for April is insufficient to get confidence that the progress in the disinflation process has resumed.
Meanwhile, the Canadian Dollar could come under pressure as investors expect that the Bank of Canada (BoC) will start reducing interest rates from the June meeting. Canada’s weak Retail Sales and consistently declining price pressures have prompted expectations for BoC rate-cuts in June.
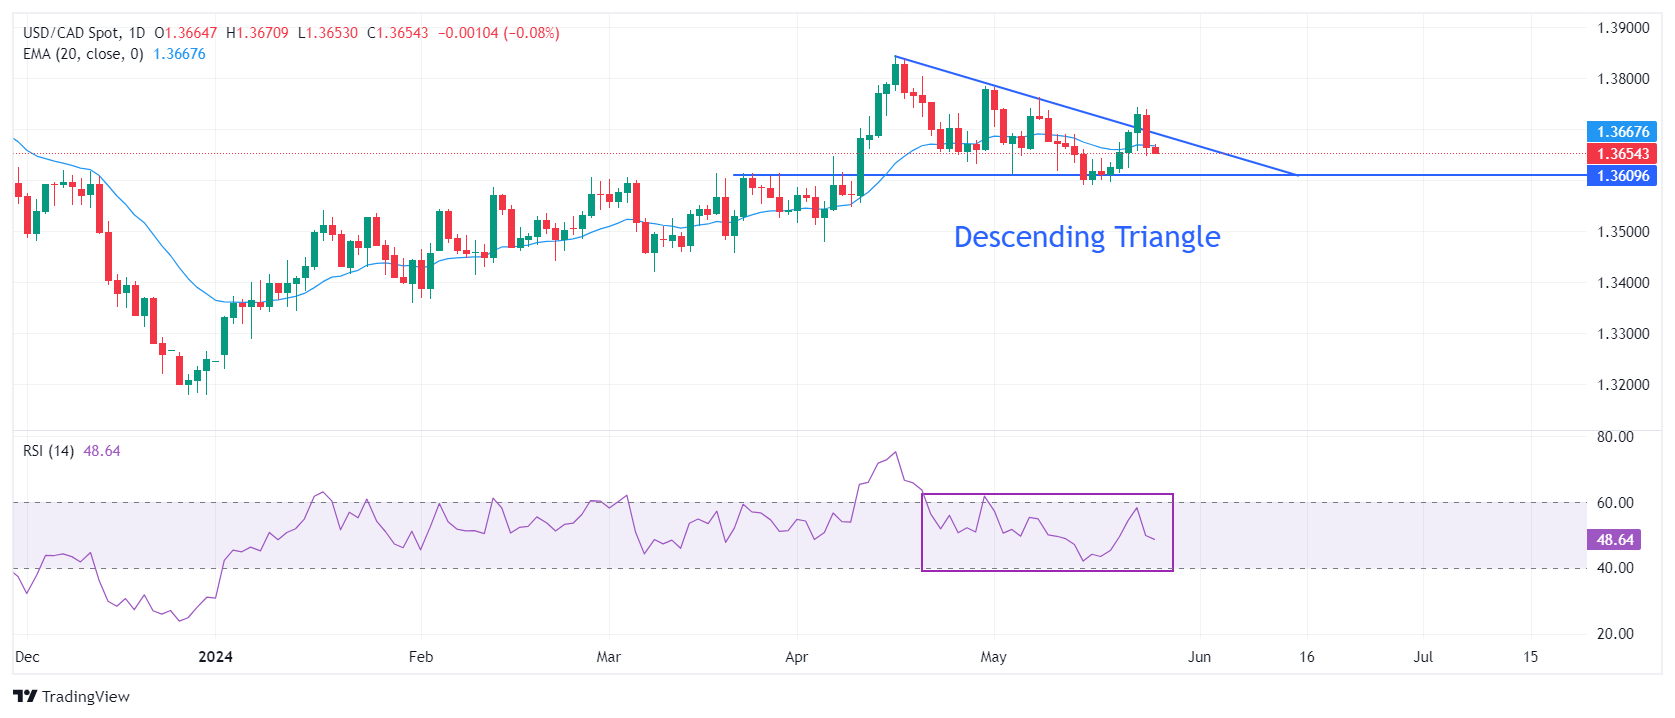
USD/CAD trades in a Descending Triangle chart formation on a daily timeframe, which exhibits a sharp volatility contraction. The downward-sloping border of the above-mentioned chart pattern is plotted from April 16 high at 1.3846 while the horizontal support is marked from March 25 high near 1.3570.
The Loonie asset remains sticky to the 20-day Exponential Moving Average (EMA) near 1.3670, suggesting a sideways trend.
The 14-period Relative Strength Index (RSI) oscillates in the 40.00-60.00 range, indicating indecisiveness among market participants.
Fresh buying opportunity would emerge if the asset breaks above April 30 high at 1.3785. This would drive the asset towards April 17 high at 1.3838, followed by the round-level resistance of 1.3900.
In an alternate scenario, a breakdown below May 3 low around 1.3600 will expose the asset to the April 9 low around 1.3547 and the psychological support of 1.3500.
USD/CAD daily chart
- Natural Gas prices have declined over 5% from last week’s peak at $3.16 as traders book profits.
- EU court ruling on Gazprom payments might see disrupted Gas flows in Austria.
- The US Dollar Index trades flat after a volatile week.
Natural Gas price (XNG/USD) holds its ground on Monday after reaching a six-month high of $3.16 on Thursday and immediately facing profit taking. The last squeeze came on the back of a Bloomberg article reporting that Austria warned that the remaining Gas flows out of Russia might get disrupted after a court ruling said that European companies no longer need to make payments to Gazprom on deliveries. Traders were pushing up Gas prices ahead of any disruption risk, but now profit-taking is underway and Gas prices are looking for support levels.
The US Dollar Index (DXY), which tracks the Greenback’s value against six major currencies, roughly trades flat after a volatile ride last week. A mixture of geopolitical events with mixed data has pushed the DXY back below 105.00. US markets are closed on Monday due to a bank holiday, and later this week the revised US Gross Domestic Product estimates on Thursday and the US Personal Consumption Expenditure (PCE) Price Index figures on Friday will be the main events.
Natural Gas is trading at $2.78 per MMBtu at the time of writing.
Natural Gas news and market movers: EU refueling disruptions
- Supply concerns linger in the EU after Austria’s OMV AG warned of possible disruptions in Gas flows out of Russia.
- Meanwhile, Bloomberg reported that Italian Gas storages are filled up to 73%, well above its average of 59% for this time of year.
- Brunei LNG is facing a substantial outage and ships awaiting in the harbor. Since May 20, no LNG has left the port.
Natural Gas Technical Analysis: profit taking towards support
Natural Gas is facing pressure after its steep rally last week, which was built up on geopolitical drivers together with rumors on supply disruptions towards Europe. With that last one out of the way, more downside in Gas prices could be at hand, with a bigger part of the recent rally unwinding. Add the peace talk willingness from Russia ahead of the peace talks in mid-June with China, Ukraine and the US around the table, and more easing in Gas prices might take place in the coming weeks.
The $3.00 marker as a big figure was easily broken on Wednesday. The pivotal level near $3.07 (high of March 6, 2023) remains key as prices failed to post a daily close above it. Further up, the fresh year-to-date high at $3.16 is the level to beat.
On the downside, the 200-day Simple Moving Average (SMA) is acting as first support near $2.53. Should that support area fail to hold, then the pivotal level near $2.14 should do the trick ahead of $2.11, where both the 55-day and 100-day SMA are trading.
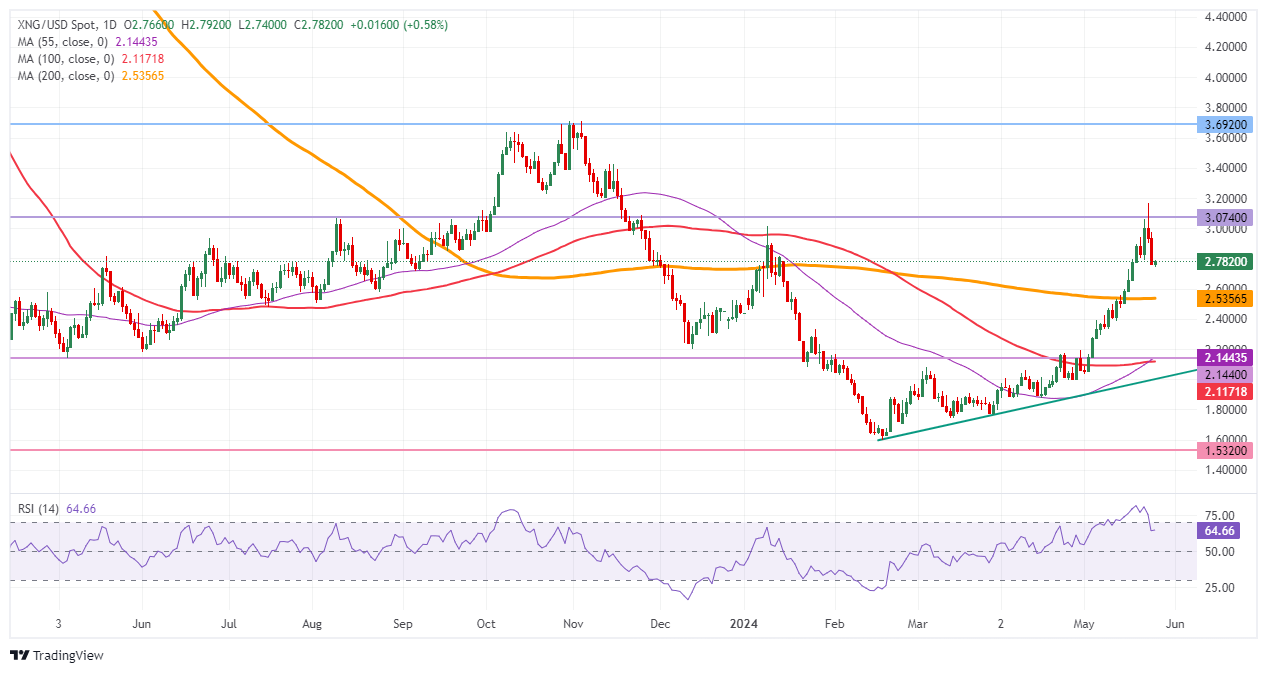
Natural Gas: Daily Chart
Natural Gas FAQs
Supply and demand dynamics are a key factor influencing Natural Gas prices, and are themselves influenced by global economic growth, industrial activity, population growth, production levels, and inventories. The weather impacts Natural Gas prices because more Gas is used during cold winters and hot summers for heating and cooling. Competition from other energy sources impacts prices as consumers may switch to cheaper sources. Geopolitical events are factors as exemplified by the war in Ukraine. Government policies relating to extraction, transportation, and environmental issues also impact prices.
The main economic release influencing Natural Gas prices is the weekly inventory bulletin from the Energy Information Administration (EIA), a US government agency that produces US gas market data. The EIA Gas bulletin usually comes out on Thursday at 14:30 GMT, a day after the EIA publishes its weekly Oil bulletin. Economic data from large consumers of Natural Gas can impact supply and demand, the largest of which include China, Germany and Japan. Natural Gas is primarily priced and traded in US Dollars, thus economic releases impacting the US Dollar are also factors.
The US Dollar is the world’s reserve currency and most commodities, including Natural Gas are priced and traded on international markets in US Dollars. As such, the value of the US Dollar is a factor in the price of Natural Gas, because if the Dollar strengthens it means less Dollars are required to buy the same volume of Gas (the price falls), and vice versa if USD strengthens.
- EUR/JPY holds strength above 170.00 as investors doubt subsequent rate cuts by the ECB.
- ECB policymakers remain comfortable with rate-cut expectations for June.
- Investors doubt that the BoJ will tighten policy further in the near term.
The EUR/JPY pair holds the psychological figure of 170.00 in Monday’s European session. The cross remains firm as investors worry about how the European Central Bank (ECB) will approach rate cuts beyond the June meeting.
The ECB is widely anticipated to start reducing interest rates from the June meeting. ECB policymakers are comfortable with market speculation for a rate cut in June despite a higher Q1 Negotiated Wage Rate. The wage growth data rose to 4.69% from the prior reading of 4.45%. However, ECB board member and Bundesbank President Joachim Nagel downplayed the effect of higher wage growth, stating that it is a lagging indicator and the long-term trend is expected to remain soft.
Therefore, investors have shifted their focus to the July meeting, where they expect that policymakers will observe the outcome of the rate-cut move on the economy and will follow suit based on the incoming data. ECB policymakers denied committing to any subsequent rate-cut moves.
In Friday’s European session, ECB Governing Council member Isabel Schnabel said that the adaptation of aggressive rate-cut cycle by the central bank could have significant consequences. She agreed that there is a noticeable decline in price pressures but some elements such as domestic and service inflation are still persistent.
On the Tokyo front, the Japanese Yen remains downbeat as investors doubt that the Bank of Japan (BoJ) have more room for further policy tightening. Last week, Japan’s National Consumer Price Index (CPI) report showed that inflation declined for the second straight month. Though price pressures remain above the 2% target, it is still insufficient for policymakers to raise interest rates again.
Meanwhile, the release of the Japan’s latest economic assessment report of May by the Cabinet Office shows that the government maintained status quo on economic prospects for straight third month.
- The Pound Sterling moves higher as the US Dollar drops even though Fed rate-cut bets ease.
- Improved US economic outlook has weighed on Fed rate-cut prospects for September.
- UK Retail Sales and preliminary PMI weaken due to BoE’s restrictive interest rate policy.
The Pound Sterling (GBP) rises to near 1.2750 against the US Dollar (USD) in Monday’s London trading session. The GBP/USD pair remains firm as bets supporting the Bank of England (BoE) reducing interest rates from the June meeting have diminished due to a slower-than-expected decline in the United Kingdom’s (UK) consumer inflation for April.
Economists forecasted that the UK headline inflation would fall to 2.1% year-over-year in April but slowed to 2.3% from the previous reading of 3.2%. Also, a nominal decline in the UK service inflation deepens fears of inflation remaining persistent for a longer period. The UK service inflation slowed slightly to 5.9% from the prior reading of 6.0%. UK’s sticky service inflation has remained a major barrier to price pressures returning to the objective rate of 2%.
However, other economic indicators, such as Retail Sales and the preliminary Purchasing Managers’ Index (PMI) report for May, suggest that the UK economy struggles to absorb the consequences of higher BoE interest rates. Retail Sales declined significantly as rainfall reduced consumer footfall at retail stores. May’s S&P Global/CIPS Composite PMI was dragged down due to a sharp decline in demand in the service sector.
Daily digest market movers: Pound Sterling exhibits strength against the US Dollar
- The Pound Sterling remains firm against the US Dollar in a thin-volume trading session due to holidays in the United Kingdom (UK) and the United States (US) markets on account of the Spring Bank Holiday and Memorial Day, respectively. Though trading activity is expected to remain quiet, any surprise move due to the occurrence of a global event could spur a sharp directional move as fewer market participants would struggle to absorb unexpected orders.
- The near-term outlook of the GBP/USD pair remains firm as the US Dollar is under pressure despite traders paring bets supporting interest rate cuts by the Federal Reserve (Fed) from their current levels in the September meeting. The CME FedWatch tool shows that the probability for rate cuts in September has reduced to 49% from 63% recorded a week ago, suggesting that investors’ confidence in Fed rate cuts has been pushed to the November meeting.
- Market speculation about the Fed lowering interest rates from September has eased as policymakers have been maintaining hawkish guidance on interest rates and an improvement in the US economic outlook. Fed officials want to see inflation declining for months to be sure that it will return to the desired rate of 2%. Officials are less convinced that the slowdown in inflation in April will last long.
- Given the strength of the US labor market, Fed officials believe that they can maintain the current interest rate framework for a longer period. Meanwhile, the surprisingly upbeat preliminary US PMI report for May has also exhibited a firm picture of economic prospects.
- This week, market speculation for Fed rate cuts will be significantly influenced by the core Personal Consumption Expenditure price index (PCE) data for April, which will be published on Friday. A slowdown in April’s Consumer Price Index (CPI) after a hot first quarter suggests that core PCE inflation figures could also remain soft from prior readings.
Technical Analysis: Pound Sterling seems well-established above 61.8% Fibo retracement
Pound Sterling trades close to Friday’s high around 1.2750. The GBP/USD pair is likely to extend upside above the weekly high near 1.2760 as the outlook is bullish. The appeal for the Cable remains high as it has established a firm footing above the 61.8% Fibonacci retracement (plotted from the March 8 high of 1.2900 to the April 22 low at 1.2300) at 1.2667.
The Cable is expected to remain in the bullish trajectory as all short-to-long-term Exponential Moving Averages (EMAs) are sloping higher, suggesting a strong uptrend.
The 14-period Relative Strength Index (RSI) has shifted into the bullish range of 60.00-80.00, suggesting that the momentum has leaned toward the upside.
Pound Sterling FAQs
The Pound Sterling (GBP) is the oldest currency in the world (886 AD) and the official currency of the United Kingdom. It is the fourth most traded unit for foreign exchange (FX) in the world, accounting for 12% of all transactions, averaging $630 billion a day, according to 2022 data. Its key trading pairs are GBP/USD, aka ‘Cable’, which accounts for 11% of FX, GBP/JPY, or the ‘Dragon’ as it is known by traders (3%), and EUR/GBP (2%). The Pound Sterling is issued by the Bank of England (BoE).
The single most important factor influencing the value of the Pound Sterling is monetary policy decided by the Bank of England. The BoE bases its decisions on whether it has achieved its primary goal of “price stability” – a steady inflation rate of around 2%. Its primary tool for achieving this is the adjustment of interest rates. When inflation is too high, the BoE will try to rein it in by raising interest rates, making it more expensive for people and businesses to access credit. This is generally positive for GBP, as higher interest rates make the UK a more attractive place for global investors to park their money. When inflation falls too low it is a sign economic growth is slowing. In this scenario, the BoE will consider lowering interest rates to cheapen credit so businesses will borrow more to invest in growth-generating projects.
Data releases gauge the health of the economy and can impact the value of the Pound Sterling. Indicators such as GDP, Manufacturing and Services PMIs, and employment can all influence the direction of the GBP. A strong economy is good for Sterling. Not only does it attract more foreign investment but it may encourage the BoE to put up interest rates, which will directly strengthen GBP. Otherwise, if economic data is weak, the Pound Sterling is likely to fall.
Another significant data release for the Pound Sterling is the Trade Balance. This indicator measures the difference between what a country earns from its exports and what it spends on imports over a given period. If a country produces highly sought-after exports, its currency will benefit purely from the extra demand created from foreign buyers seeking to purchase these goods. Therefore, a positive net Trade Balance strengthens a currency and vice versa for a negative balance.
Silver prices (XAG/USD) rose on Monday, according to FXStreet data. Silver trades at $30.81 per troy ounce, up 1.50% from the $30.36 it cost on Friday.
Silver prices have increased by 20.97% since the beginning of the year.
| Unit measure | Today Price |
|---|---|
| Silver price per troy ounce | $30.81 |
| Silver price per gram | $0.99 |
The Gold/Silver ratio, which shows the number of troy ounces of Silver needed to equal the value of one troy ounce of Gold, stood at 76.10 on Monday, down from 76.89 on Friday.
Investors might use this ratio to determine the relative valuation of Gold and Silver. Some may consider a high ratio as an indicator that Silver is undervalued – or Gold is overvalued – and might buy Silver or sell Gold accordingly. Conversely, a low ratio might suggest that Gold is undervalued relative to Silver.
(An automation tool was used in creating this post.)
Silver FAQs
Silver is a precious metal highly traded among investors. It has been historically used as a store of value and a medium of exchange. Although less popular than Gold, traders may turn to Silver to diversify their investment portfolio, for its intrinsic value or as a potential hedge during high-inflation periods. Investors can buy physical Silver, in coins or in bars, or trade it through vehicles such as Exchange Traded Funds, which track its price on international markets.
Silver prices can move due to a wide range of factors. Geopolitical instability or fears of a deep recession can make Silver price escalate due to its safe-haven status, although to a lesser extent than Gold's. As a yieldless asset, Silver tends to rise with lower interest rates. Its moves also depend on how the US Dollar (USD) behaves as the asset is priced in dollars (XAG/USD). A strong Dollar tends to keep the price of Silver at bay, whereas a weaker Dollar is likely to propel prices up. Other factors such as investment demand, mining supply – Silver is much more abundant than Gold – and recycling rates can also affect prices.
Silver is widely used in industry, particularly in sectors such as electronics or solar energy, as it has one of the highest electric conductivity of all metals – more than Copper and Gold. A surge in demand can increase prices, while a decline tends to lower them. Dynamics in the US, Chinese and Indian economies can also contribute to price swings: for the US and particularly China, their big industrial sectors use Silver in various processes; in India, consumers’ demand for the precious metal for jewellery also plays a key role in setting prices.
Silver prices tend to follow Gold's moves. When Gold prices rise, Silver typically follows suit, as their status as safe-haven assets is similar. The Gold/Silver ratio, which shows the number of ounces of Silver needed to equal the value of one ounce of Gold, may help to determine the relative valuation between both metals. Some investors may consider a high ratio as an indicator that Silver is undervalued, or Gold is overvalued. On the contrary, a low ratio might suggest that Gold is undervalued relative to Silver.
The Japanese Cabinet Office said in its report on Monday, the government kept its view on the economy unchanged for the third straight month in May.
Key takeaways
The Japanese economy is recovering at a moderate pace, although it recently appears to be pausing.
Industrial production shows movements of picking up recently, although manufacturing activities declined due to the effects of the suspension of production and shipment by some automotive manufacturers.
There were signs of a pick-up in factory output, upgrading its assessment of this metric for the first time since May last year.
The change in the assessment on industrial output may suggest that these temporary headwinds to factory activity likely have eased.
Market reaction
Despite the upbeat report, the Japanese Yen loses its recovery momentum against the US Dollar. At the time of writing, the USD/JPY pair is trading around 156.90, down 0.05% on the day.
Japanese Yen PRICE Today
The table below shows the percentage change of Japanese Yen (JPY) against listed major currencies today. Japanese Yen was the weakest against the New Zealand Dollar.
| USD | EUR | GBP | JPY | CAD | AUD | NZD | CHF | |
|---|---|---|---|---|---|---|---|---|
| USD | -0.07% | -0.08% | -0.06% | -0.07% | -0.23% | -0.37% | -0.02% | |
| EUR | 0.07% | -0.04% | 0.03% | 0.00% | -0.24% | -0.40% | 0.11% | |
| GBP | 0.08% | 0.04% | 0.00% | 0.02% | -0.18% | -0.29% | 0.09% | |
| JPY | 0.06% | -0.03% | 0.00% | -0.04% | -0.19% | -0.23% | 0.01% | |
| CAD | 0.07% | -0.00% | -0.02% | 0.04% | -0.19% | -0.30% | -0.02% | |
| AUD | 0.23% | 0.24% | 0.18% | 0.19% | 0.19% | -0.08% | 0.26% | |
| NZD | 0.37% | 0.40% | 0.29% | 0.23% | 0.30% | 0.08% | 0.33% | |
| CHF | 0.02% | -0.11% | -0.09% | -0.01% | 0.02% | -0.26% | -0.33% |
The heat map shows percentage changes of major currencies against each other. The base currency is picked from the left column, while the quote currency is picked from the top row. For example, if you pick the Japanese Yen from the left column and move along the horizontal line to the US Dollar, the percentage change displayed in the box will represent JPY (base)/USD (quote).
- The Mexican Peso rises in its key pairs as investor risk appetite improves.
- China, Japan and South Korea reopen free-trade talks, tech stocks rally.
- Speculation of Banxico cutting interest rates in June is high, according to a leading poll.
The Mexican Peso (MXN) is rising in its key pairs due to strong investor risk appetite on Monday, which favors the Mexican Peso and commodity-linked currencies.
During the Asian session, stocks rose, with the Shanghai Composite clocking up gains of 1.14%; the Nikkei rising 0.61%, and Australia’s ASX200 up 0.83%. Optimism from the restarting of free-trade negotiations between China, Japan and South Korea – after they stalled in 2019 – and advances in technology stocks, were seen as factors supporting sentiment.
USD/MXN is exchanging hands at 16.68 at the time of writing, EUR/MXN is trading at 18.09 and GBP/MXN at 21.25.
Mexican Peso rises despite Citibanamex survey
The Mexican Peso recovers despite high expectations Banxico will lower interest rates this summer. A poll of economists held by Mexico’s second-largest bank, Citibanamex, showed that the majority of respondents estimated the Bank of Mexico (Banxico) will cut interest rates from 11.00% to 10.75% at its June 27 meeting. Lower interest rates are negative for a currency since they attract less foreign capital inflows.
The survey followed Banxico’s unanimous decision to keep interest rates unchanged at its May meeting.
Banxico’s May meeting Minutes showed policymakers championing a broad range of views, making it difficult to determine the future trajectory of Banxico’s policy rate. Stubborn services-sector inflation, however, appears to be a key factor holding Banxico back from planning further cuts.
The US Federal Reserve (Fed) is expected to further delay its first interest-rate cut after strong US economic data. The preliminary Purchasing Manager Index (PMI) data for May roundly beat expectations – especially in the services sector, which is also inflationary in the US. The odds of the Fed cutting in September are now at 49.4%, according to the CME FedWatch tool, which bases its calculations on interest-rate futures.
In Europe, meanwhile, European Central Bank (ECB) officials have all but committed to a June interest-rate cut although most policymakers appear to favor a data-dependent approach after that.
In the UK, the latest inflation data showed inflation cooling to 2.3%. However, this was not as low as expected. UK Retail Sales and data for April was weak although Consumer Confidence improved. Speculation remains high that the Bank of England (BoE) will cut interest rates in June as inflation declines closer to the BoE’s 2.0% target.
Technical Analysis: USD/MXN pulls back after tracking higher
USD/MXN – or the number of Pesos that can be bought with one US Dollar – has weakened a little since peaking on May 23, and has broken below the grey trendline of the recovery from the May 21 low. This has weakened the outlook somewhat, however, the new short-term uptrend remains intact and still favors longs over shorts.
USD/MXN 4-hour Chart
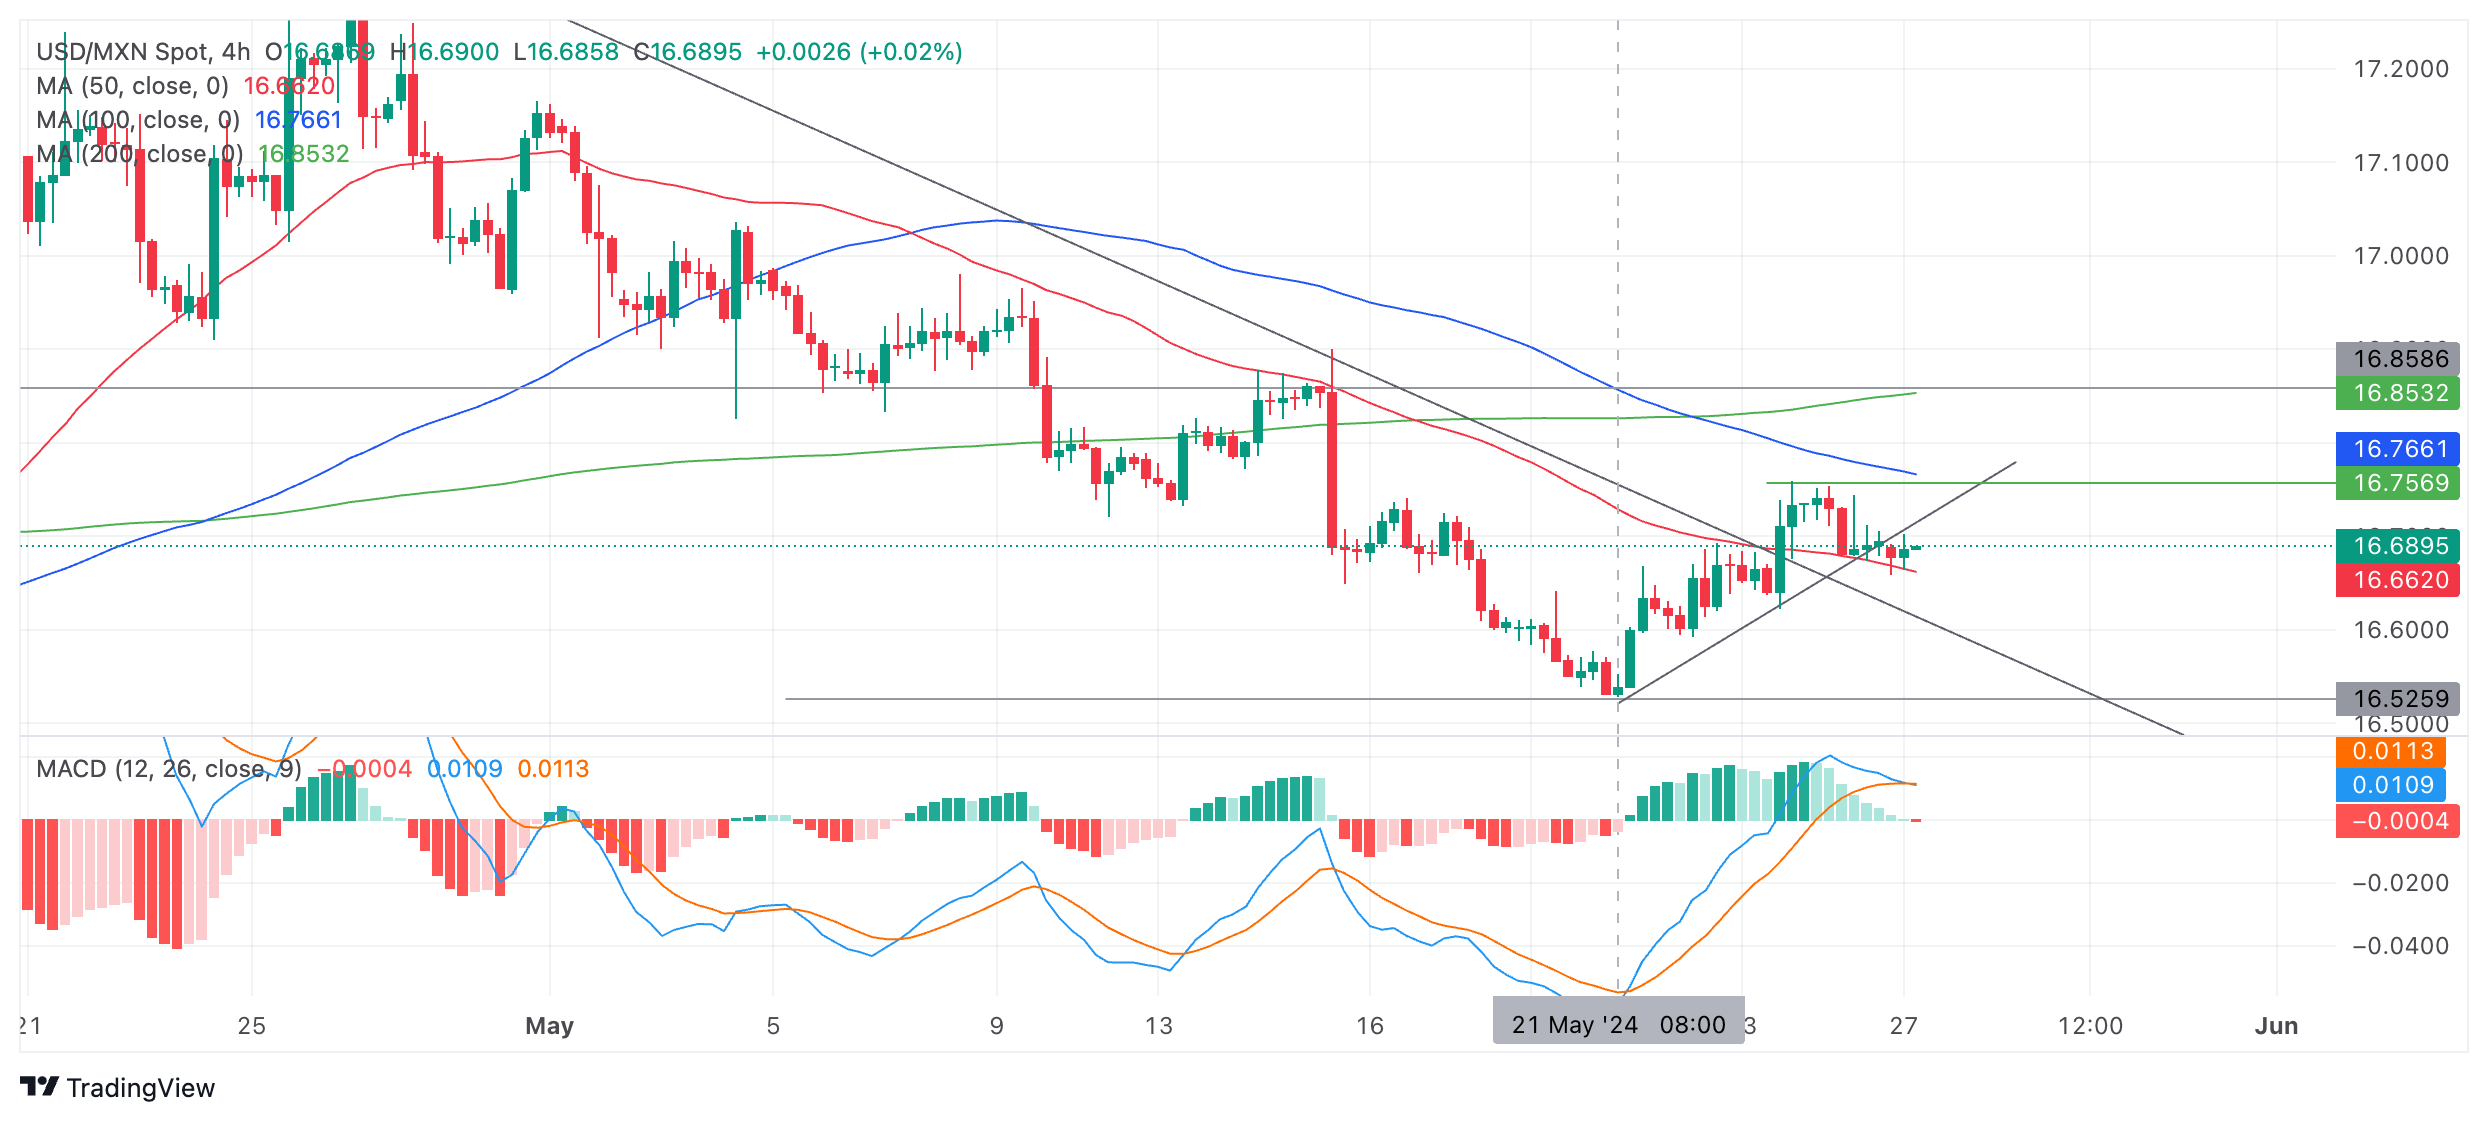
A break above the 16.76 (May 23 high) would probably confirm a continuation of the young uptrend to a possible target at the previous range lows around 16.85.
The Moving Average Convergence Divergence (MACD) indicator has crossed below its signal line, giving a sell signal and possibly indicating further weakness. A break below the swing low at 16.62 could indicate further weakness to the low of May 21 at 16.52.
Given the medium and long-term trends are bearish there also remains a risk of the pair continuing lower due to longer-term currents.
Banxico FAQs
The Bank of Mexico, also known as Banxico, is the country’s central bank. Its mission is to preserve the value of Mexico’s currency, the Mexican Peso (MXN), and to set the monetary policy. To this end, its main objective is to maintain low and stable inflation within target levels – at or close to its target of 3%, the midpoint in a tolerance band of between 2% and 4%.
The main tool of the Banxico to guide monetary policy is by setting interest rates. When inflation is above target, the bank will attempt to tame it by raising rates, making it more expensive for households and businesses to borrow money and thus cooling the economy. Higher interest rates are generally positive for the Mexican Peso (MXN) as they lead to higher yields, making the country a more attractive place for investors. On the contrary, lower interest rates tend to weaken MXN. The rate differential with the USD, or how the Banxico is expected to set interest rates compared with the US Federal Reserve (Fed), is a key factor.
Banxico meets eight times a year, and its monetary policy is greatly influenced by decisions of the US Federal Reserve (Fed). Therefore, the central bank’s decision-making committee usually gathers a week after the Fed. In doing so, Banxico reacts and sometimes anticipates monetary policy measures set by the Federal Reserve. For example, after the Covid-19 pandemic, before the Fed raised rates, Banxico did it first in an attempt to diminish the chances of a substantial depreciation of the Mexican Peso (MXN) and to prevent capital outflows that could destabilize the country.
- Silver price advances due to escalated geopolitical tensions in the Middle East.
- Israeli strikes in Rafah on Sunday killed at least 35 people, intensifying pressure surrounding the conflict in Gaza.
- The subdued US Dollar reinforces the strength of the grey metal.
Silver price rises to $30.80 per troy ounce during the European session on Monday. Safe-haven commodities like Silver have gained ground due to escalated geopolitical tensions in the Middle East. According to CNN, Israeli strikes killed at least 35 people in Rafah on Sunday, increasing pressure over the war in Gaza.
Officials stated that ceasefire and hostage talks will continue next week. However, the negotiations between Israel and Hamas have stalled, with both parties unable to reach an agreement due to differences in key conditions.
The surge in the price of grey metal is also attributed to the subdued US Dollar (USD) after the emergence of the positive market sentiment after the softer University of Michigan's 5-year Consumer Inflation Expectations for May was released on Friday.
The UoM's 5-year Consumer Inflation Expectations for May on Friday. It eased slightly to 3.0%, below the forecasted 3.1%. Despite the upward revision of the Consumer Sentiment Index to 69.1 from a preliminary reading of 67.4, it still marked the lowest level in six months. These figures likely contributed to strengthening investors’ sentiment regarding potential rate cuts by the Federal Reserve.
However, recent hawkish remarks by Fed officials suggest that the central bank will maintain higher interest rates for a longer period. Fed Vice Chair Michael Barr emphasized the need for more time to evaluate the effectiveness of restrictive policies, while Atlanta Fed President Raphael Bostic reiterated his estimate for only one rate cut this year. High interest rates dampen the appeal of non-yielding assets like Silver.
- EUR/USD trades sideways around 1.0850 on a thinly traded day.
- The Euro strengthens as investors remain uncertain over ECB reducing rates in July too.
- Investors expect that the Fed will start lowering borrowing rates in the last quarter of this year.
EUR/USD is stuck in a tight range around 1.0850 in Monday’s European session, in a calm start to the week ahead of the release of inflation data on both sides of the Atlantic on Friday. The major currency pair exhibits strength as European Central Bank (ECB) policymakers avoid to commit about extending the rate-cut cycle beyond the June meeting.
ECB policymakers do not want to promise more rate cuts as they seem to be concerned that aggressive policy easing could revamp price pressures again.
In this context, traders have dialled back expectations of three rate cuts this year and are seeing only two due to recent economic indicators signalling persisting price pressures, such as the Negotiated Wage Rates for the first quarter and the preliminary HCOB Composite Purchasing Managers Index (PMI) data for May.
Higher wage growth deepens households’ pockets, which leads to a significant rise in consumer spending that fuels inflationary pressures. However, ECB board member and Bundesbank President Joachim Nagel downplayed the effect of higher wage growth, stating that it is a lagging indicator and the long-term trend is expected to remain soft.
On the economic front, German IFO data on Business Climate, Current Assessment and Expectations for May has been released. The overall data missed estimates, however, the Euro remains unchanged.
German IFO Business Climate Index dipped slightly to 89.3 from 89.4 in April. Investors forecasted a sharp rise to 90.3.
The Current Economic Assessment Index declined to 88.3 from 88.9 in April, missing the consensus of 89.9.
The IFO Expectations Index, which indicates firms’ projections for the next six months at 90.4, fell short of the market consensus of 90.5 but remains higher than the former reading of 89.7.
Daily digest market movers: EUR/USD remains sideways as US markets close
- EUR/USD trades in a tight range around 1.0850 as trading volume remains thin on account of a holiday in United States markets due to Memorial Day. This week, volatility is expected to be high as the Eurostat is set to release the preliminary inflation data for May and the United States Bureau of Economic Analysis (BEA) will report the core Personal Consumption Expenditure Price Index (PCE) data for April. Both reports will be published on Friday.
- Investors will keenly focus on the Eurozone inflation data as ECB policymakers are widely expected to announce a rate cut in their monetary policy meeting in June, barring any surprise. ECB officials remain comfortable with market speculation for a return to policy normalization in June, but many are reluctant to commit to any subsequent move and want to remain data-dependent.
- The expectations for the Eurozone preliminary inflation report suggest that the annual core reading – which strips off volatile items like food, energy, tobacco and alcohol – will remain steady at 2.7%. The headline figure is estimated to have accelerated to 2.5% from 2.4% in April. The inflation data isn’t likely to significantly impact the rate-cut decision for June.
- Meanwhile, the US Dollar steadies in the early European session after a steep sell-off on Friday. The US Dollar Index (DXY) fell to 104.65 despite investors losing confidence in the Federal Reserve (Fed) beginning to lower interest rates in the September meeting.
- The CME FedWatch tool shows that traders see a little over 50% chance that the central bank will keep interest rates unchanged in September, up from 38% last week. The odds leaning towards keeping rates on hold have been driven by a surprisingly strong preliminary US PMI report for May.
- This week, the core PCE inflation data will influence market speculation for Fed rate cuts in September. The Consumer Price Index (CPI) data for April, which was published earlier this month, showed price pressures cooled after a hot first quarter. This deceleration suggests that the core PCE, the Fed’s preferred inflation measure, will also have softened from its prior reading of 2.7% on a year-on-year basis.
Technical Analysis: EUR/USD holds the triangle breakout
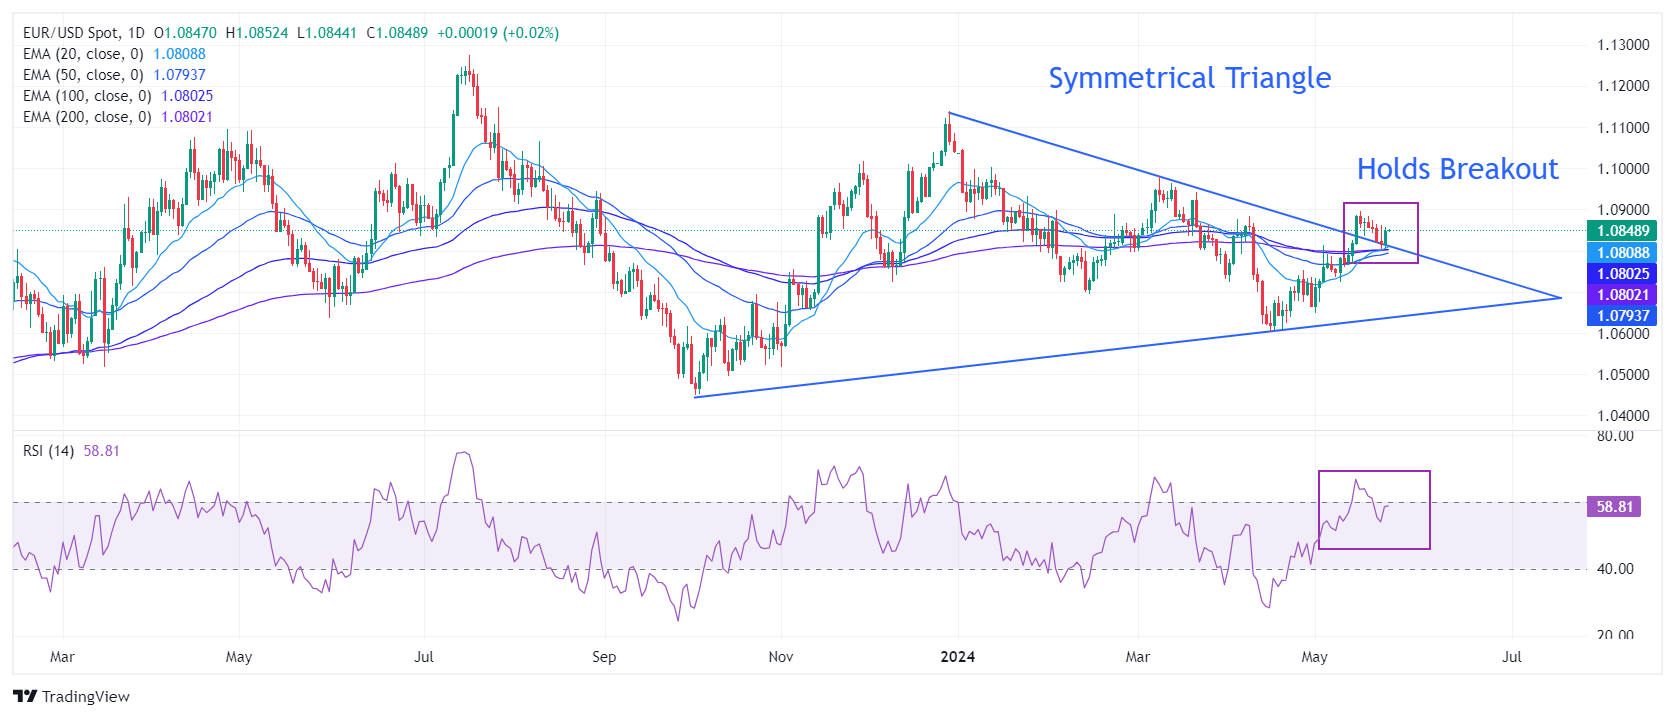
EUR/USD consolidates around 1.0850 ahead of crucial inflation data for both the Eurozone and the US. The major currency pair indicates broader strength as it strongly holds the breakout from the Symmetrical Triangle chart pattern formed on a daily time frame.
The near-term outlook of the shared currency pair remains firm as it is trading above all short-to-long-term Exponential Moving Averages (EMAs).
The 14-period Relative Strength Index (RSI) has fallen into the 40.00-60.00 range, suggesting that the upside momentum has faded for now.
In case of further upside, the major currency pair is expected to recapture a two-month high at around 1.0900. A decisive break above this level would drive the asset towards the March 21 high at around 1.0950 and the psychological resistance of 1.1000. However, a downside move below the 200-day EMA at 1.0800 could push the pair further down.
Euro FAQs
The Euro is the currency for the 20 European Union countries that belong to the Eurozone. It is the second most heavily traded currency in the world behind the US Dollar. In 2022, it accounted for 31% of all foreign exchange transactions, with an average daily turnover of over $2.2 trillion a day. EUR/USD is the most heavily traded currency pair in the world, accounting for an estimated 30% off all transactions, followed by EUR/JPY (4%), EUR/GBP (3%) and EUR/AUD (2%).
The European Central Bank (ECB) in Frankfurt, Germany, is the reserve bank for the Eurozone. The ECB sets interest rates and manages monetary policy. The ECB’s primary mandate is to maintain price stability, which means either controlling inflation or stimulating growth. Its primary tool is the raising or lowering of interest rates. Relatively high interest rates – or the expectation of higher rates – will usually benefit the Euro and vice versa. The ECB Governing Council makes monetary policy decisions at meetings held eight times a year. Decisions are made by heads of the Eurozone national banks and six permanent members, including the President of the ECB, Christine Lagarde.
Eurozone inflation data, measured by the Harmonized Index of Consumer Prices (HICP), is an important econometric for the Euro. If inflation rises more than expected, especially if above the ECB’s 2% target, it obliges the ECB to raise interest rates to bring it back under control. Relatively high interest rates compared to its counterparts will usually benefit the Euro, as it makes the region more attractive as a place for global investors to park their money.
Data releases gauge the health of the economy and can impact on the Euro. Indicators such as GDP, Manufacturing and Services PMIs, employment, and consumer sentiment surveys can all influence the direction of the single currency. A strong economy is good for the Euro. Not only does it attract more foreign investment but it may encourage the ECB to put up interest rates, which will directly strengthen the Euro. Otherwise, if economic data is weak, the Euro is likely to fall. Economic data for the four largest economies in the euro area (Germany, France, Italy and Spain) are especially significant, as they account for 75% of the Eurozone’s economy.
Another significant data release for the Euro is the Trade Balance. This indicator measures the difference between what a country earns from its exports and what it spends on imports over a given period. If a country produces highly sought after exports then its currency will gain in value purely from the extra demand created from foreign buyers seeking to purchase these goods. Therefore, a positive net Trade Balance strengthens a currency and vice versa for a negative balance.
- EUR/GBP experienced challenges as ECB officials suggested an interest rate cut in June.
- ECB Chief Economist Phillip Lane said that “there is enough in what we see to start interest rate cuts.”
- The Pound Sterling may struggle as moderated UK's annual inflation has tempered expectations of BoE’s rate cut in June.
EUR/GBP trades around 0.8510 during the early European hours on Monday, struggling due to dovish comments from European Central Bank (ECB) Chief Economist Philip Lane. In an interview with the Financial Times, Lane stated, “There is enough in what we see to start interest rate cuts. He thinks that they have been successful in getting inflation down in a timely manner and can move down somewhat within the zone of restrictiveness.
Additionally, ECB policymaker Piero Cipollone mentioned on Sunday that the time is right for an interest rate cut in June, as recent data has been favorable. Meanwhile, ECB President Christine Lagarde expressed confidence that Eurozone inflation is under control, indicating that an interest rate cut is likely next month.
On the data front, Germany's IFO Business Climate survey, which measures current conditions and business expectations, posted a reading of 89.3 for May. This falls short of the expected 90.3 and the previous 89.4.
In the United Kingdom (UK), the market is closed due to the Spring Bank Holiday on Monday. The Pound Sterling (GBP) received support as the traders digested lower-than-anticipated Retail Sales data released on Friday.
April saw a notable 2.3% decline in the monthly volume of sales of goods by retailers in the UK, far worse than the expected 0.4% downturn. On an annual basis, sales dipped by 2.7%, compared to the expected 0.2% decrease. Meanwhile, GfK Consumer Confidence softened to a reading of -17 in May, slightly better than the anticipated -18 reading and the previous -19.
However, the UK's annual inflation rate has moderated, edging closer to the Bank of England's (BoE) target of 2%. This moderation has tempered expectations of a rate cut in June among investors, which could put pressure on the Pound Sterling (GBP) and limit the downside of the EUR/GBP cross.
- German IFO Business Climate Index misses estimates with 89.3 in May.
- IFO Current Economic Assessment Index declines to 88.3 in the reported month.
The headline German IFO Business Climate Index arrived at 89.3 in May, a tad lower than the April figure of 89.4. The market expectation was 90.3.
Meanwhile, the Current Economic Assessment Index dipped from 88.9 in April to 88.3 in the same period, missing estimates of 89.9.
The IFO Expectations Index – indicating firms’ projections for the next six months, rose to 90.4 in May vs. 89.7 in April but fell short of the market consensus of 90.5.
Market reaction to the German IFO Survey
EUR/USD fails to react to the downbeat German IFO survey. At the time of writing, the pair is trading almost unchanged at 1.0845 amid holiday-thinned light trading.
About German IFO
The headline IFO business climate index was rebased and recalibrated in May after the IFO Research Institute changed the series from the base year of 2000 to the base year of 2005 as of May 2011 and then changed series to include services as of May 2018. The survey now includes 9,000 monthly survey responses from firms in the manufacturing, service sector, trade and construction.
Gold prices rose in India on Monday, according to data from India's Multi Commodity Exchange (MCX).
Gold price stood at 71,922 Indian Rupees (INR) per 10 grams, up INR 254 compared with the INR 71,668 it cost on Friday.
As for futures contracts, Gold prices increased to INR 71,596 per 10 gms from INR 71,256 per 10 gms.
Prices for Silver futures contracts increased to INR 91,927 per kg from INR 90,548 per kg.
| Major Indian city | Gold Price |
|---|---|
| Ahmedabad | 74,435 |
| Mumbai | 74,170 |
| New Delhi | 74,190 |
| Chennai | 74,430 |
| Kolkata | 74,365 |
Global Market Movers: Comex Gold price attracts some buyers amid the geopolitical risks
- The Ministry of Health in Gaza said that at least 35 Palestinians were killed and dozens more were injured as a result of Israeli air attacks on a camp in Rafah for displaced people on Sunday, per CNN.
- Gold price has increased by over 16% year-to-date, hitting a record high of over $2,400 per ounce in May, according to World Gold Council data.
- The US Durable Goods Orders rose by 0.7% MoM in April from the downward revision of 0.8% in March, better than the expectation of -0.8%.
- The University of Michigan Consumer Sentiment Index came in at 69.1 in May from 67.4 in April, above the market consensus of 67.5. Inflation expectations for one year rose slightly to 3.3% from 3.2%, while five-year inflation expectations eased to 3% from 3.1%.
- UBS analysts recently raised their gold price forecast to $2,600 for the end of 2024. Citi analysts predicted gold would hit $3,000 per ounce in the next six to 18 months.
- Gold imports to India, the world's second-largest gold consumer, might fall nearly a fifth this year as high prices encourage retail customers to exchange old jewellery for new items, per Reuters.
(An automation tool was used in creating this post.)
Gold FAQs
Gold has played a key role in human’s history as it has been widely used as a store of value and medium of exchange. Currently, apart from its shine and usage for jewelry, the precious metal is widely seen as a safe-haven asset, meaning that it is considered a good investment during turbulent times. Gold is also widely seen as a hedge against inflation and against depreciating currencies as it doesn’t rely on any specific issuer or government.
Central banks are the biggest Gold holders. In their aim to support their currencies in turbulent times, central banks tend to diversify their reserves and buy Gold to improve the perceived strength of the economy and the currency. High Gold reserves can be a source of trust for a country’s solvency. Central banks added 1,136 tonnes of Gold worth around $70 billion to their reserves in 2022, according to data from the World Gold Council. This is the highest yearly purchase since records began. Central banks from emerging economies such as China, India and Turkey are quickly increasing their Gold reserves.
Gold has an inverse correlation with the US Dollar and US Treasuries, which are both major reserve and safe-haven assets. When the Dollar depreciates, Gold tends to rise, enabling investors and central banks to diversify their assets in turbulent times. Gold is also inversely correlated with risk assets. A rally in the stock market tends to weaken Gold price, while sell-offs in riskier markets tend to favor the precious metal.
The price can move due to a wide range of factors. Geopolitical instability or fears of a deep recession can quickly make Gold price escalate due to its safe-haven status. As a yield-less asset, Gold tends to rise with lower interest rates, while higher cost of money usually weighs down on the yellow metal. Still, most moves depend on how the US Dollar (USD) behaves as the asset is priced in dollars (XAU/USD). A strong Dollar tends to keep the price of Gold controlled, whereas a weaker Dollar is likely to push Gold prices up.
European Central Bank (ECB) policymaker Olli Rehn spoke about the timings of the central bank’s interest rate cut on Monday.
Key quotes
Inflation is converging to our 2% target in a sustained way, and the time is thus ripe in June to ease the monetary policy stance and start cutting rates.
This obviously assumes that the disinflationary trend will continue and there will be no further setbacks in the geopolitical situation and energy prices.
Market reaction
The above comments fail to move the needle around the EUR/USD pair, as it gyrates around 1.0850, at the time of writing.
Euro PRICE Today
The table below shows the percentage change of Euro (EUR) against listed major currencies today. Euro was the strongest against the Swiss Franc.
| USD | EUR | GBP | JPY | CAD | AUD | NZD | CHF | |
|---|---|---|---|---|---|---|---|---|
| USD | -0.02% | -0.03% | -0.06% | -0.03% | -0.15% | -0.26% | 0.05% | |
| EUR | 0.02% | -0.04% | 0.00% | -0.01% | -0.19% | -0.34% | 0.10% | |
| GBP | 0.03% | 0.04% | -0.02% | -0.00% | -0.14% | -0.23% | 0.10% | |
| JPY | 0.06% | 0.00% | 0.02% | -0.01% | -0.10% | -0.13% | 0.07% | |
| CAD | 0.03% | 0.01% | 0.00% | 0.01% | -0.13% | -0.23% | 0.02% | |
| AUD | 0.15% | 0.19% | 0.14% | 0.10% | 0.13% | -0.07% | 0.22% | |
| NZD | 0.26% | 0.34% | 0.23% | 0.13% | 0.23% | 0.07% | 0.30% | |
| CHF | -0.05% | -0.10% | -0.10% | -0.07% | -0.02% | -0.22% | -0.30% |
The heat map shows percentage changes of major currencies against each other. The base currency is picked from the left column, while the quote currency is picked from the top row. For example, if you pick the Euro from the left column and move along the horizontal line to the US Dollar, the percentage change displayed in the box will represent EUR (base)/USD (quote).
Here is what you need to know on Monday, May 27:
The action in financial markets turns subdued at the beginning of the week. The European economic docket will feature IFO sentiment data from Germany and the US markets will remain closed in observance of the Memorial Day holiday. Later in the week, comments from central bank officials, inflation data from Germany, the Euro area and the US will be watched closely by market participants.
The US Dollar (USD) Index snapped a four-day winning streak and closed in negative territory on Friday but managed to register modest gains for the week. The USD Index fluctuates in a narrow channel below 105.00 in the European morning on Monday. Supported by the upbeat data releases from the US, the benchmark 10-year yield rose over 1% in the previous week.
US Dollar PRICE Last 7 days
The table below shows the percentage change of US Dollar (USD) against listed major currencies last 7 days. US Dollar was the strongest against the Japanese Yen.
| USD | EUR | GBP | JPY | CAD | AUD | NZD | CHF | |
|---|---|---|---|---|---|---|---|---|
| USD | 0.18% | -0.32% | 0.83% | 0.33% | 0.79% | 0.01% | 0.64% | |
| EUR | -0.18% | -0.53% | 0.72% | 0.16% | 0.65% | -0.16% | 0.47% | |
| GBP | 0.32% | 0.53% | 1.10% | 0.68% | 1.17% | 0.36% | 0.99% | |
| JPY | -0.83% | -0.72% | -1.10% | -0.51% | -0.03% | -0.79% | -0.18% | |
| CAD | -0.33% | -0.16% | -0.68% | 0.51% | 0.42% | -0.32% | 0.31% | |
| AUD | -0.79% | -0.65% | -1.17% | 0.03% | -0.42% | -0.81% | -0.19% | |
| NZD | -0.01% | 0.16% | -0.36% | 0.79% | 0.32% | 0.81% | 0.62% | |
| CHF | -0.64% | -0.47% | -0.99% | 0.18% | -0.31% | 0.19% | -0.62% |
The heat map shows percentage changes of major currencies against each other. The base currency is picked from the left column, while the quote currency is picked from the top row. For example, if you pick the US Dollar from the left column and move along the horizontal line to the Japanese Yen, the percentage change displayed in the box will represent USD (base)/JPY (quote).
USD/JPY edged higher ahead of the weekend and reached its strongest level since early May above 157.00 on Friday. The pair struggles to gather bullish momentum and trades slightly below 157.00 early Monday. Bank of Japan (BoJ) Governor Kazuo Ueda said on Monday that they have made progress in moving away from zero and lifting inflation expectations but added that they now must re-anchor them at the 2% target. Additionally, BoJ Director-General Of the Monetary Affairs Department Kazuhiro Masaki said that the changes in wages in real terms will move to positive territory on a year-on-year basis, adding that they need to keep an eye on energy prices and forex moves.
Japanese Yen stays calm amid softer US Dollar, thin trading.
Despite the broad-based USD strength last week, GBP/USD managed to register marginal gains for the week, supported by the stronger-than-forecast Consumer Price Index (CPI) data from the UK. The pair stays in a consolidation phase and trades at around 1.2750 in the European morning. UK markets will remain closed in observance of Spring Bank Holiday.
EUR/USD gained traction on Friday and erased a large portion of its weekly losses. The pair stays relatively quiet and moves up and down in a narrow band at around 1.0850.
Gold suffered heavy losses last week and dropped to its weakest level in two weeks below $2,330 on Friday. XAU/USD edges slightly higher and holds at around $2,340 to start the new week.
Gold price edges higher, Israel strikes Rafah and boosts safe-haven flows.
Inflation FAQs
Inflation measures the rise in the price of a representative basket of goods and services. Headline inflation is usually expressed as a percentage change on a month-on-month (MoM) and year-on-year (YoY) basis. Core inflation excludes more volatile elements such as food and fuel which can fluctuate because of geopolitical and seasonal factors. Core inflation is the figure economists focus on and is the level targeted by central banks, which are mandated to keep inflation at a manageable level, usually around 2%.
The Consumer Price Index (CPI) measures the change in prices of a basket of goods and services over a period of time. It is usually expressed as a percentage change on a month-on-month (MoM) and year-on-year (YoY) basis. Core CPI is the figure targeted by central banks as it excludes volatile food and fuel inputs. When Core CPI rises above 2% it usually results in higher interest rates and vice versa when it falls below 2%. Since higher interest rates are positive for a currency, higher inflation usually results in a stronger currency. The opposite is true when inflation falls.
Although it may seem counter-intuitive, high inflation in a country pushes up the value of its currency and vice versa for lower inflation. This is because the central bank will normally raise interest rates to combat the higher inflation, which attract more global capital inflows from investors looking for a lucrative place to park their money.
Formerly, Gold was the asset investors turned to in times of high inflation because it preserved its value, and whilst investors will often still buy Gold for its safe-haven properties in times of extreme market turmoil, this is not the case most of the time. This is because when inflation is high, central banks will put up interest rates to combat it. Higher interest rates are negative for Gold because they increase the opportunity-cost of holding Gold vis-a-vis an interest-bearing asset or placing the money in a cash deposit account. On the flipside, lower inflation tends to be positive for Gold as it brings interest rates down, making the bright metal a more viable investment alternative.
- USD/CHF gains ground around 0.9150 on Monday.
- The hawkish signals from Fed officials and stronger US economic data support the USD.
- The Middle East geopolitical tensions might boost the Swiss Franc and cap the pair’s upside.
The USD/CHF pair trades stronger near 0.9150 during the early European trading hours on Monday. The expectation that the US Federal Reserve (Fed) will start cutting interest rates from the September meeting provides some support to the US Dollar (USD) and lifts the pair. Investors await the Swiss National Bank’s (SNB) Chairman Thomas Jordan's speech on Tuesday for fresh impetus ahead of Switzerland’s Gross Domestic Product (GDP) for Q1.
The hawkish signals from Fed policymakers continue to underpin the Greenback. The US Fed officials emphasized that they would keep borrowing costs higher for longer than expected following a series of disappointing inflation data when inflation remained well above the Fed’s 2% target.
Furthermore, the stronger US economic data on Friday has prompted speculation of a delay in the easing cycle this year. The financial markets have priced in a 53% chance of a Fed rate cut in September, down from the 64% recorded a week ago, according to the CME FedWatch tool. The US Durable Goods Orders came in better than expected, the US Census Bureau reported on Friday. The figure rose by 0.7% MoM in April following a downwardly revised 0.8% advance in March, above the market consensus of -0.8%. Meanwhile, the University of Michigan Consumer Sentiment Index eased to 69.1 in May from 67.4 in April, but was stronger than the estimated 67.5.
On the Swiss front, CNN reported early Monday that at least 35 Palestinians were killed and dozens more were injured as a result of Israeli air attacks on a camp in Rafah for displaced people on Sunday, the Ministry of Health in Gaza said. Market participants will monitor the developments surrounding geopolitical risks in the Middle East. Any signs of rising tension might boost the safe-haven flows, benefiting the Swiss Franc (CHF) and creating a headwind for USD/CHF.
Bank of Japan’s (BoJ) Director-General Of the Monetary Affairs Department Kazuhiro Masaki said on Monday that the “changes in wages in real terms will move to positive territory on a year-on-year basis.”
He said that there is a “need to keep an eye on energy prices and forex moves.”
Market reaction
USD/JPY is keeping its range play intact near 156.80, down 0.12% on the day.
FX option expiries for May 27 NY cut at 10:00 Eastern Time, via DTCC, can be found below
- EUR/USD: EUR amounts
- 1.0740 615m
- GBP/USD: GBP amounts
- 1.2540 903m
- USD/JPY: USD amounts
- 157.00 1.5b
- USD/CHF: USD amounts
- 0.9100 800m
- AUD/USD: AUD amounts
- 0.6530 449m
- 0.6600 864m
- USD/CAD: USD amounts
- 1.3670 1.3b
- 1.3710 564m
- NZD/USD remains stronger amid a softer US Dollar on Monday.
- The US Dollar lost ground after the 10-year US Treasury yield depreciated on Friday.
- The New Zealand Dollar received support as RBNZ raised the forecast for peak rates and postponed the timing of a rate cut.
NZD/USD continues its winning streak for the fourth successive day, trading around 0.6130 during the Asian hours on Monday. The depreciation in the US Dollar (USD) is underpinning the NZD/USD pair, which could be attributed to the improved risk appetite after the softer University of Michigan's 5-year Consumer Inflation Expectations for May was released on Friday.
The UoM's 5-year Consumer Inflation Expectations for May on Friday. It eased slightly to 3.0%, below the forecasted 3.1%. Despite the upward revision of the Consumer Sentiment Index to 69.1 from a preliminary reading of 67.4, it still marked the lowest level in six months. These figures likely contributed to strengthening investors’ sentiment regarding potential rate cuts by the Federal Reserve.
The US Dollar Index (DXY), which measures the value of the US Dollar (USD) against the six other major currencies, trades near 104.70 by the press time. On Friday, the Greenback lost ground due to the lower 10-year US Treasury yield, which stood at 4.46%.
Across the pond, the New Zealand Dollar (Kiwi) remains supported by the hawkish stance of the Reserve Bank of New Zealand (RBNZ). The central bank has raised its forecast for a peak in interest rates and delayed the timing for any rate cut. The RBNZ kept its cash rate at a 15-year high of 5.5%, indicating that restrictive policy needs to be maintained longer to ensure inflation returns to the 1-3% target range.
In an interview with Bloomberg last week, RBNZ Governor Adrian Orr downplayed the likelihood of another interest rate hike, suggesting that the central bank would only tighten policy further if necessary to manage inflation expectations. Additionally, RBNZ Deputy Governor Christian Hawkesby emphasized that "cutting interest rates is not part of the near-term discussion."
- USD/CAD finds interim support near 1.3650 on firm speculation that the BoC will announce a rate cut on June 5.
- The US Dollar is expected to recover as expectations for the Fed pivoting to rate cuts in September have come down significantly.
- Trading volume is expected to remain light in Monday’s session on account of the holiday in US markets.
The USD/CAD pair trades in a tight range slightly above the crucial support of 1.3650 in Monday’s Asian session. The Loonie asset struggles for a direction as the US Dollar steadies due to holiday mood in the United States economy on account of Memorial Day.
The Loonie asset witnessed an intense sell-off on Friday due to the weak US Dollar. The US Dollar Index (DXY), which tracks the Greenback's value against six major currencies, fell sharply to 104.70, even though investors expect that the Federal Reserve (Fed) will keep interest rates steady in the range of 5.25%-5.50% in the September meeting, too.
As per the CME FedWatch tool, traders see a little over 50% chance of a steady interest rate decision. The probability of interest rates remaining unchanged has increased from 38%, recorded last week. The odds of a stable monetary policy have increased after the release of the surprisingly strong preliminary US Purchasing Managers Index (PMI) report for May.
Meanwhile, the outlook of the Canadian Dollar is also vulnerable as weak domestic spending has increased the likelihood of a rate-cut move by the Bank of Canada (BoC) in its upcoming monetary policy on June 5,
Statistics Canada showed on Friday that monthly Retail Sales for March were down by 0.2%. The pace at which Retail Sales contracted was sharper than a decline of 0.1% recorded for the February month. This was the straight third month of contraction, exhibiting that households are struggling to bear the consequences of higher interest rates by the BoC. Weak households’ spending and consistently easing price pressures underscore the need for the BoC to return to policy normalization.
- GBP/USD extends gains due to risk-on sentiment after UoM's 5-year Consumer Inflation Expectations.
- CME FedWatch Tool suggests the likelihood of the Fed’s rate cut in September has decreased to 44.9% from 49.0% a week earlier.
- UK's softer inflation has tempered expectations of BoE’s rate cut in June.
GBP/USD advances for the second successive session, trading around 1.2740, near two-month highs, during the Asian hours on Monday. The appreciation in the GBP/USD could be attributed to the risk-on sentiment, despite diminishing expectations for Federal Reserve interest rate cuts. It is worth noting that the UK market will be closed due to the Spring Bank Holiday and the US market will be closed due to the Memorial Day bank holiday on Monday.
The University of Michigan's 5-year Consumer Inflation Expectations for May on Friday. It eased slightly to 3.0%, below the forecasted 3.1%. Despite the upward revision of the Consumer Sentiment Index to 69.1 from a preliminary reading of 67.4, it still marked the lowest level in six months. These figures likely contributed to strengthening investors’ sentiment regarding potential rate cuts by the Federal Reserve. This has weakened the Greenback and underpinned the GBP/USD pair.
According to the CME FedWatch Tool, the probability of the Federal Reserve implementing a 25 basis-point rate cut in September has decreased to 44.9% from 49.0% a week earlier.
In the United Kingdom (UK), traders have digested lower-than-anticipated Retail Sales data released on Friday. April saw a notable 2.3% decline in the monthly volume of sales of goods by retailers, far worse than the expected 0.4% downturn. On an annual basis, sales dipped by 2.7%, compared to the expected 0.2% decrease. Meanwhile, GfK Consumer Confidence softened to a reading of -17 in May, slightly better than the anticipated -18 reading and the previous -19.
Furthermore, the UK's annual inflation rate has moderated, edging closer to the Bank of England's (BoE) target of 2%. This moderation has tempered expectations of a rate cut in June among investors, potentially bolstering support for the Pound Sterling (GBP).
In an interview with the Financial Times on Monday, European Central Bank (ECB) Chief Economist Phillip Lane said that “there is enough in what we see to start interest rate cuts.”
Additional quotes
I think we have been successful in getting inflation down in a timely manner.
But policy needs to remain in restrictive territory.
Things will be bumpy and things will be gradual.
But within the zone of restrictiveness we can move down somewhat.
If inflation visibly approaches the target next year, then we can make sure rates come down further.
Market reaction
EUR/USD is unmoved on the dovish comments. trading flat at around 1.0850, as of writing.
ECB FAQs
The European Central Bank (ECB) in Frankfurt, Germany, is the reserve bank for the Eurozone. The ECB sets interest rates and manages monetary policy for the region. The ECB primary mandate is to maintain price stability, which means keeping inflation at around 2%. Its primary tool for achieving this is by raising or lowering interest rates. Relatively high interest rates will usually result in a stronger Euro and vice versa. The ECB Governing Council makes monetary policy decisions at meetings held eight times a year. Decisions are made by heads of the Eurozone national banks and six permanent members, including the President of the ECB, Christine Lagarde.
In extreme situations, the European Central Bank can enact a policy tool called Quantitative Easing. QE is the process by which the ECB prints Euros and uses them to buy assets – usually government or corporate bonds – from banks and other financial institutions. QE usually results in a weaker Euro. QE is a last resort when simply lowering interest rates is unlikely to achieve the objective of price stability. The ECB used it during the Great Financial Crisis in 2009-11, in 2015 when inflation remained stubbornly low, as well as during the covid pandemic.
Quantitative tightening (QT) is the reverse of QE. It is undertaken after QE when an economic recovery is underway and inflation starts rising. Whilst in QE the European Central Bank (ECB) purchases government and corporate bonds from financial institutions to provide them with liquidity, in QT the ECB stops buying more bonds, and stops reinvesting the principal maturing on the bonds it already holds. It is usually positive (or bullish) for the Euro.
- Indian Rupee weakens on Monday despite the weaker USD.
- Strong inflows into Indian equities might support the INR in near term; geopolitical risks might cap the local currency’s upside.
- US Q1 GDP, US April PCE and Indian Q4 GDP growth numbers will be closely watched this week.
Indian Rupee (INR) trims gains on Monday despite the softer US Dollar (USD). The INR closed at a two-month high of 83.10 on Friday, marking its biggest weekly gain in over five months, bolstered by strong inflows into Indian equities. The continuing USD inflows into domestic equities could lift the INR in the near term. However, the rise of crude oil prices and safe-haven flows amid the rising geopolitical tensions in the Middle East might boost the Greenback and create a tailwind for USD/INR.
Investors will closely watch the first reading of US Gross Domestic Product (GDP) for the first quarter (Q1) of 2024 on Thursday and the final reading of the Personal Consumption Expenditures Price Index (PCE) for April on Friday. On the Indian docket, the GDP growth number for the fourth quarter of 2023 will be released on Friday. If the Indian economy shows a weaker-than-expected growth, this could weigh on the INR and cap the downside for the pair.
Daily Digest Market Movers: Indian Rupee edges lower amid the cautious mood
- The Indian Rupee strengthened by the most in five months, as India's benchmark equity indices, BSE Sensex and Nifty 50, touched record highs on Friday.
- After witnessing impressive growth rates of more than 8% for three consecutive quarters, India’s economic growth is estimated to moderate to a four-quarter low of 6.7% in the fourth quarter of 2023.
- At least 35 people have been killed after an Israeli airstrike in the southern Gaza city of Rafah hit tents housing displaced people, the Ministry of Health in Gaza said on Sunday, hours after Hamas launched a barrage of rockets at Tel Aviv for the first time in months, per the Guardian.
- The US Durable Goods Orders climbed by 0.7% MoM in April following a downwardly revised 0.8% advance in March. Economists had expected the figure to decrease by 0.8%.
- The University of Michigan Consumer Sentiment Index fell to 69.1 in May from 67.4 in April. Meanwhile, inflation expectations for one year rose slightly to 3.3% from 3.2%, while five-year inflation expectations dropped to 3% from 3.1%.
- Financial markets see the probability of unchanged rates rising to 46% from 35% a week earlier, according to CME's FedWatch tool.
Technical analysis: USD/INR resumes a bearish stance on the daily chart
The Indian Rupee weakens on the day. The USD/INR pair confirms a breakout of the neckline of the Head and Shoulders pattern that formed since March 21. The pair resumes a bearish outlook as the price is below the key 100-day Exponential Moving Average (EMA) on the daily chart. Additionally, the 14-day Relative Strength Index (RSI) stands in bearish territory near 34.65, supporting the sellers for the time being.
The support-turned-resistance level and the 100-day EMA at 83.20 will be a potential resistance level for USD/INR. Any follow-through buying above this level will pave the way to a high of May 13 at 83.54, followed by a high of April 17 at 83.72, and finally the 84.00 round level.
On the other hand, a breach of the 83.00 psychological support will expose a low of January 15 at 82.78. Further south, the next contention level is seen near a low of March 11 at 82.65.
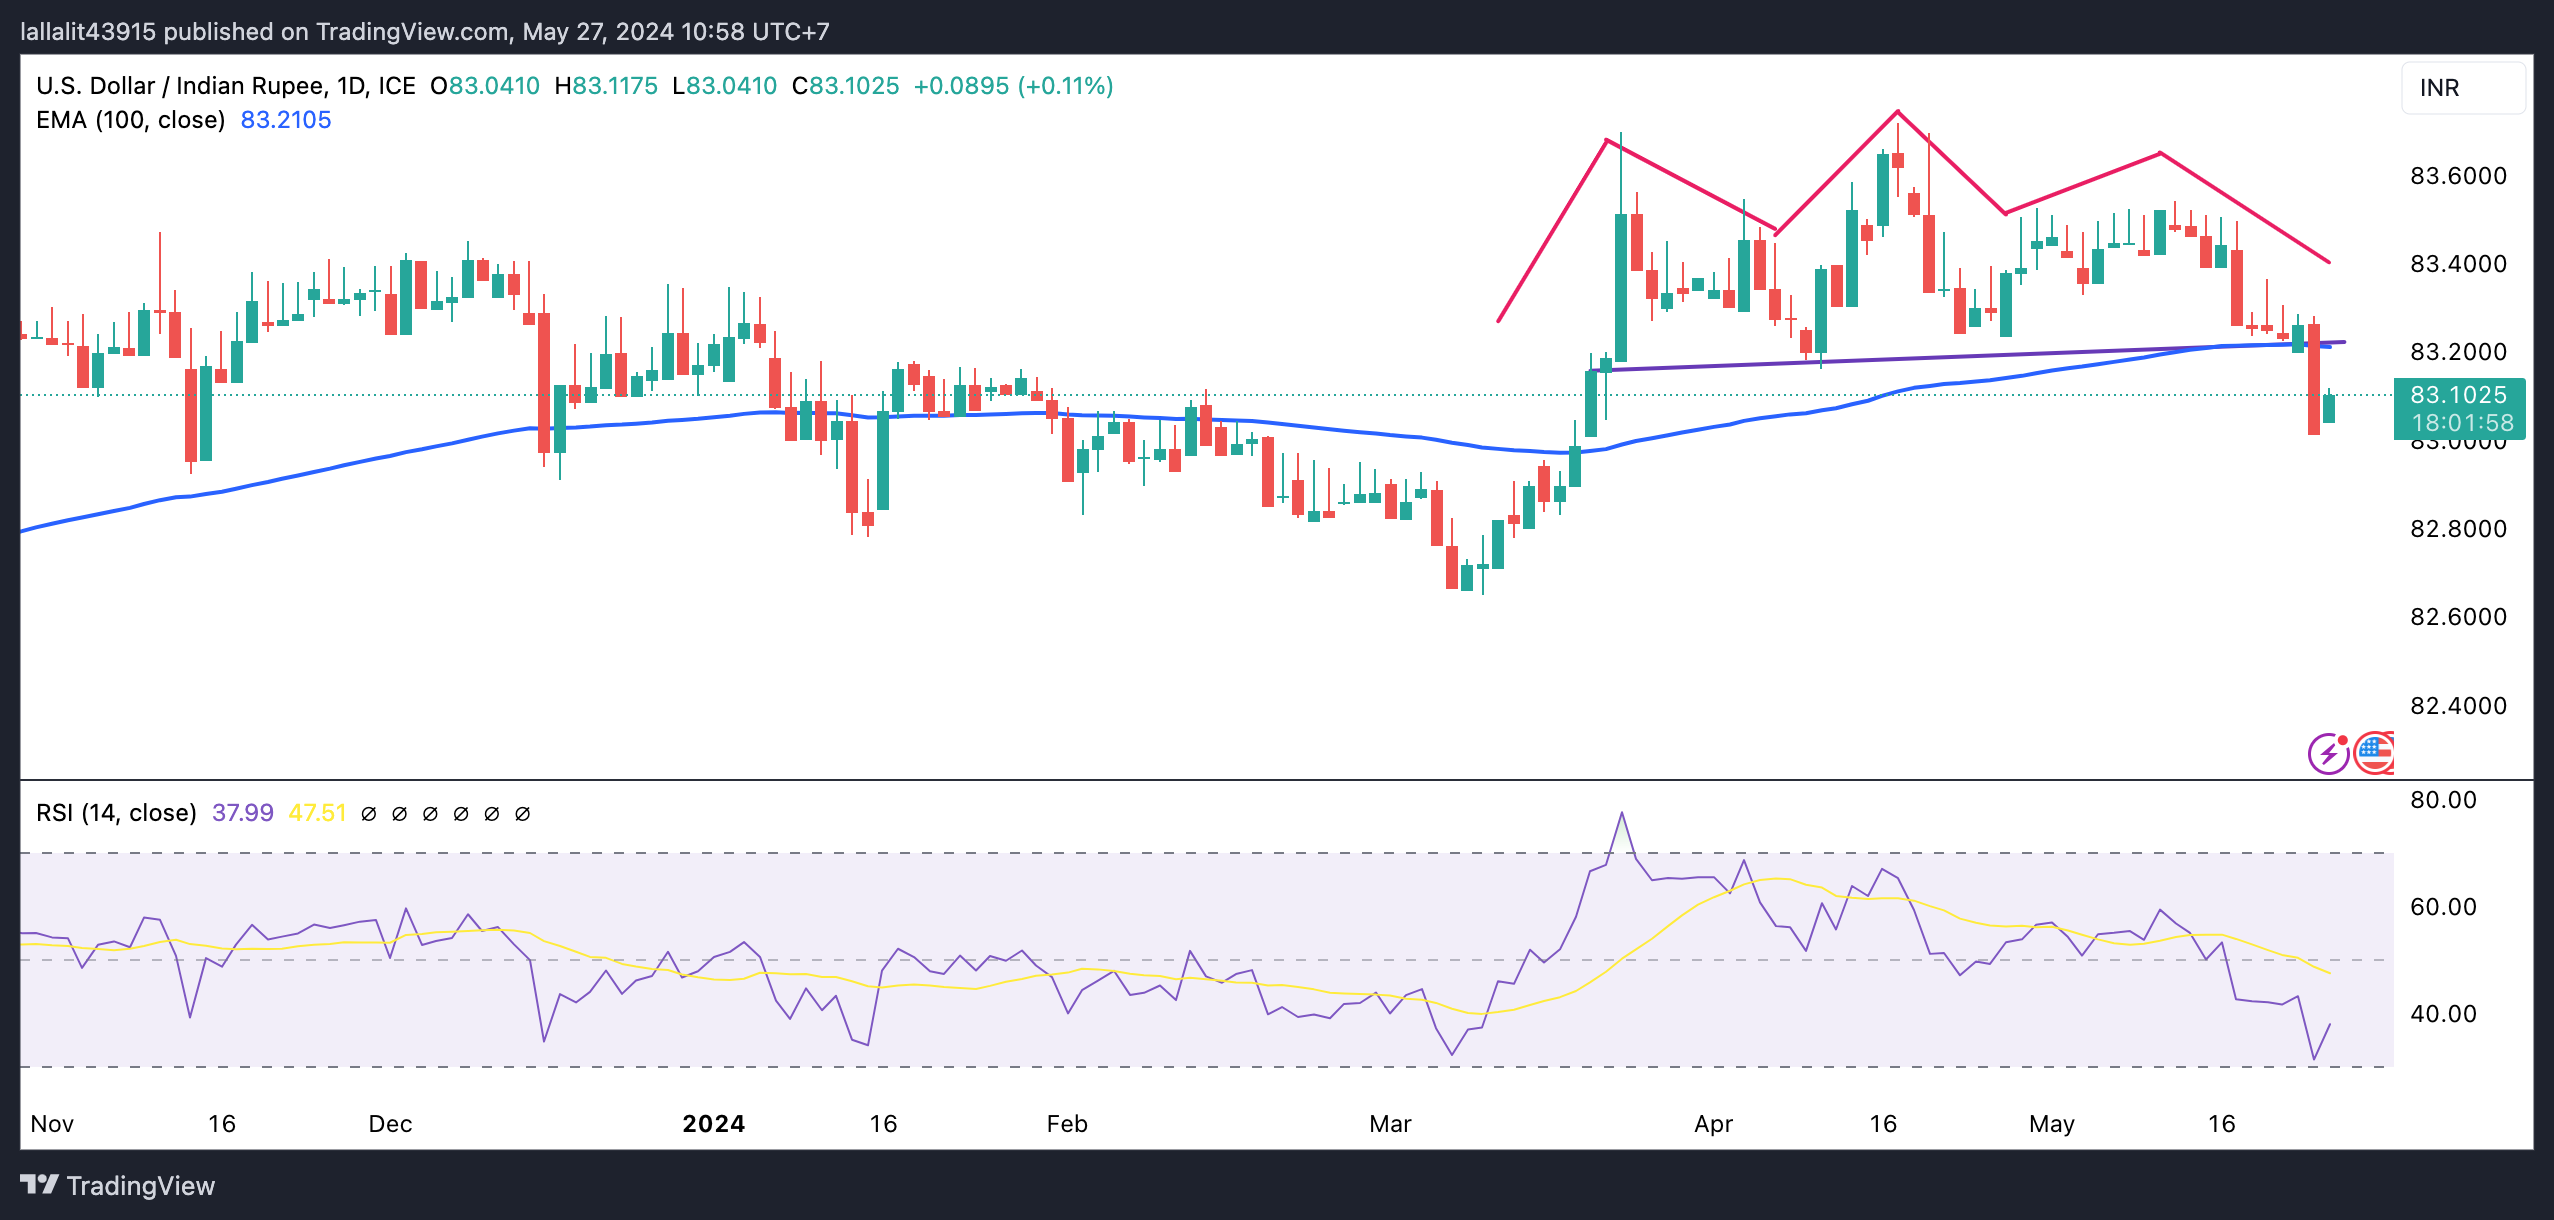
US Dollar price today
The table below shows the percentage change of US Dollar (USD) against listed major currencies today. US Dollar was the strongest against the Euro.
| USD | EUR | GBP | CAD | AUD | JPY | NZD | CHF | |
| USD | -0.01% | -0.04% | -0.01% | -0.15% | -0.10% | -0.12% | -0.03% | |
| EUR | 0.01% | -0.02% | -0.01% | -0.14% | -0.09% | -0.12% | 0.02% | |
| GBP | 0.05% | 0.05% | 0.03% | -0.12% | -0.06% | -0.08% | 0.02% | |
| CAD | 0.02% | 0.01% | -0.03% | -0.14% | -0.08% | -0.11% | -0.02% | |
| AUD | 0.15% | 0.14% | 0.11% | 0.14% | 0.05% | 0.02% | 0.13% | |
| JPY | 0.10% | 0.09% | 0.06% | 0.07% | -0.07% | -0.05% | 0.07% | |
| NZD | 0.13% | 0.12% | 0.10% | 0.10% | -0.02% | 0.03% | 0.10% | |
| CHF | -0.01% | -0.02% | -0.02% | 0.00% | -0.13% | -0.11% | -0.11% |
The heat map shows percentage changes of major currencies against each other. The base currency is picked from the left column, while the quote currency is picked from the top row. For example, if you pick the Euro from the left column and move along the horizontal line to the Japanese Yen, the percentage change displayed in the box will represent EUR (base)/JPY (quote).
Indian Rupee FAQs
The Indian Rupee (INR) is one of the most sensitive currencies to external factors. The price of Crude Oil (the country is highly dependent on imported Oil), the value of the US Dollar – most trade is conducted in USD – and the level of foreign investment, are all influential. Direct intervention by the Reserve Bank of India (RBI) in FX markets to keep the exchange rate stable, as well as the level of interest rates set by the RBI, are further major influencing factors on the Rupee.
The Reserve Bank of India (RBI) actively intervenes in forex markets to maintain a stable exchange rate, to help facilitate trade. In addition, the RBI tries to maintain the inflation rate at its 4% target by adjusting interest rates. Higher interest rates usually strengthen the Rupee. This is due to the role of the ‘carry trade’ in which investors borrow in countries with lower interest rates so as to place their money in countries’ offering relatively higher interest rates and profit from the difference.
Macroeconomic factors that influence the value of the Rupee include inflation, interest rates, the economic growth rate (GDP), the balance of trade, and inflows from foreign investment. A higher growth rate can lead to more overseas investment, pushing up demand for the Rupee. A less negative balance of trade will eventually lead to a stronger Rupee. Higher interest rates, especially real rates (interest rates less inflation) are also positive for the Rupee. A risk-on environment can lead to greater inflows of Foreign Direct and Indirect Investment (FDI and FII), which also benefit the Rupee.
Higher inflation, particularly, if it is comparatively higher than India’s peers, is generally negative for the currency as it reflects devaluation through oversupply. Inflation also increases the cost of exports, leading to more Rupees being sold to purchase foreign imports, which is Rupee-negative. At the same time, higher inflation usually leads to the Reserve Bank of India (RBI) raising interest rates and this can be positive for the Rupee, due to increased demand from international investors. The opposite effect is true of lower inflation.
- The Japanese Yen gained ground amid improved risk appetite on Monday.
- BoJ Governor Kazuo Ueda said there is a need to re-anchor inflation expectations at the 2% target.
- The US Dollar lost ground due to the lower 10-year US Treasury yield after softer UoM 5-year Inflation Expectation.
The Japanese Yen (JPY) halted its three-day losing streak, possibly influenced by comments from Bank of Japan (BoJ) Governor Kazuo Ueda on Monday. Ueda remarked that progress has been made in moving away from zero and raising inflation expectations, but there is a need to re-anchor them, this time at the 2% target. He also said that the BoJ will proceed cautiously, aligning with other central banks that have inflation-targeting frameworks.
Japan's annual inflation rate remained above the Bank of Japan’s 2% target. This sustained inflationary trend exerts pressure on the central bank to contemplate policy tightening. The BoJ has underscored the importance of a virtuous cycle characterized by sustained and stable attainment of its 2% price target, coupled with robust wage growth, as essential for policy normalization.
The US Dollar Index (DXY), which measures the value of the US Dollar (USD) against the six other major currencies, trades near 104.70 by the press time. On Friday, the Greenback lost ground due to the lower 10-year US Treasury yield, which stood at 4.46%. This could be attributed to the improved risk sentiment after the softer University of Michigan's 5-year Consumer Inflation Expectations for May on Friday.
Daily Digest Market Movers: Japanese Yen advances after remarks from BoJ officials
- BoJ Deputy Governor Shinichi Uchida stated on Monday that they have reverted to a conventional monetary policy framework, with the objective of achieving a 2% price stability target through adjustments of the short-term policy rate. Uchida also said that they have successfully navigated past the zero-lower bound.
- UoM 5-year Consumer Inflation Expectations eased slightly to 3.0%, falling below the forecasted 3.1%. Despite the upward revision of the Consumer Sentiment Index to 69.1 from a preliminary reading of 67.4, it still indicated the lowest level in six months. These figures likely bolstered investors’ sentiment regarding potential rate cuts by the Federal Reserve.
- According to the CME FedWatch Tool, the probability of the Federal Reserve implementing a 25 basis-point rate cut in September has decreased to 44.9% from 49.0% a week earlier.
- On Friday, the US Census Bureau released Durable Goods Orders, indicating a strong rebound in April with a 0.7% MoM increase, contrasting the forecasted 0.8% decline. However, March’s figure was revised downward to 0.8% from the initial estimate of 2.6%.
- Japan’s National Consumer Price Index (CPI) dropped to 2.5% YoY in April from 2.7% in the previous month, marking the second consecutive month of moderation but still staying above the Bank of Japan’s (BoJ) 2% target. This sustained inflation keeps pressure on the central bank to consider further policy tightening.
- Japan’s 10-year government bond yield surpassed 1% last week for the first time since May 2013, fueled by traders' increasing bets that the Bank of Japan would tighten policy further in 2024.
Technical Analysis: USD/JPY drops toward 156.50
The USD/JPY pair trades close to 156.70 on Monday. A potential bearish reversal is indicated by the emerging rising wedge pattern on the daily chart, as the pair nears the wedge's apex. However, the 14-day Relative Strength Index (RSI) maintains a slightly bullish bias, staying above 50. A drop below this threshold would suggest a shift in momentum.
The USD/JPY pair might retest the upper boundary of the rising wedge around 157.30. Should it exceed this level, the pair could aim for 160.32, marking its highest point in more than thirty years.
In terms of support, the nine-day Exponential Moving Average (EMA) at 156.40 stands as immediate support, followed by the lower edge of the rising wedge and the psychological level of 156.00. If breached, these levels could exert downward pressure on the USD/JPY pair, potentially guiding it toward the throwback support at 151.86.
USD/JPY: Daily Chart
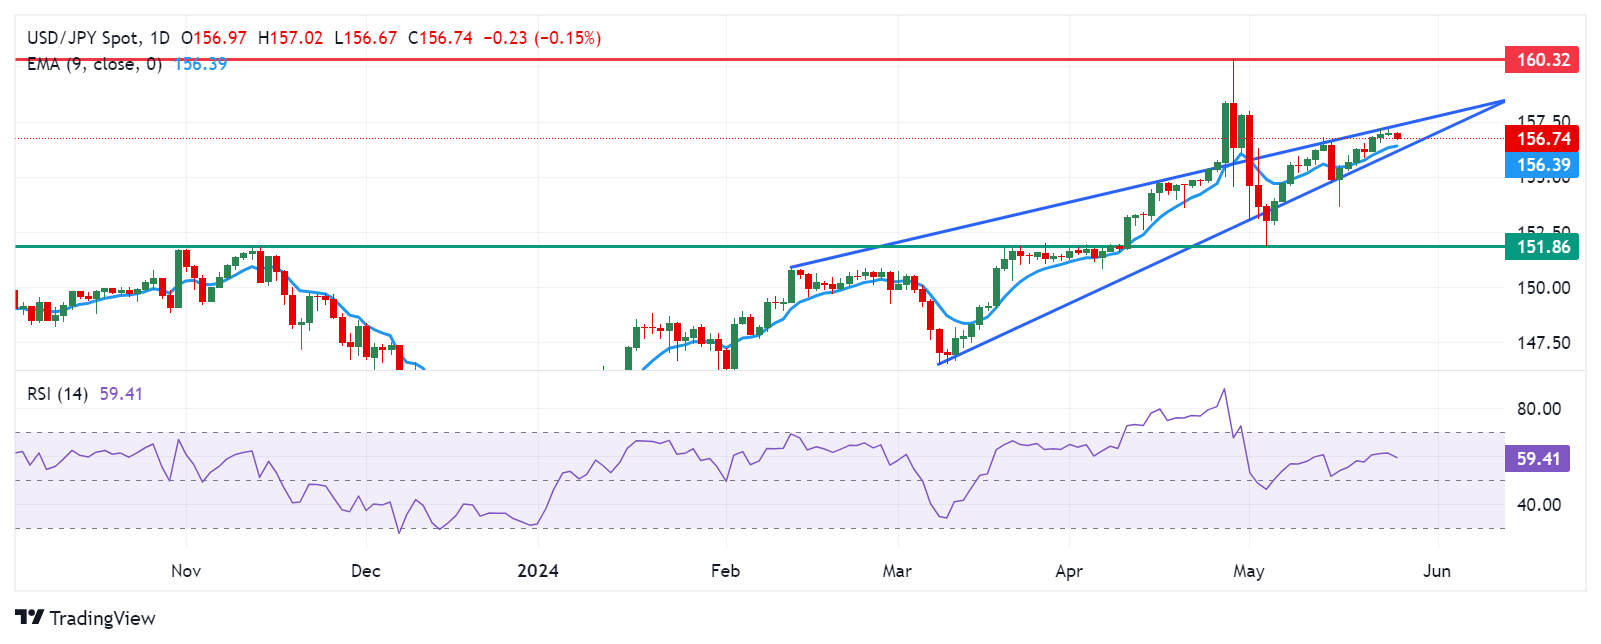
Japanese Yen price today
The table below shows the percentage change of the Japanese Yen (JPY) against listed major currencies today. Japanese Yen was the strongest against the US Dollar.
| USD | EUR | GBP | CAD | AUD | JPY | NZD | CHF | |
| USD | -0.02% | -0.03% | -0.01% | -0.12% | -0.09% | -0.10% | -0.01% | |
| EUR | 0.02% | -0.02% | -0.01% | -0.12% | -0.07% | -0.09% | 0.00% | |
| GBP | 0.03% | 0.02% | 0.01% | -0.10% | -0.06% | -0.07% | 0.02% | |
| CAD | 0.02% | -0.02% | -0.01% | -0.11% | -0.07% | -0.08% | -0.01% | |
| AUD | 0.13% | 0.12% | 0.10% | 0.12% | 0.05% | 0.03% | 0.12% | |
| JPY | 0.09% | 0.05% | 0.06% | 0.06% | -0.06% | -0.02% | 0.06% | |
| NZD | 0.10% | 0.09% | 0.07% | 0.09% | -0.03% | 0.02% | 0.08% | |
| CHF | 0.02% | 0.00% | -0.02% | -0.01% | -0.12% | -0.07% | -0.09% |
The heat map shows percentage changes of major currencies against each other. The base currency is picked from the left column, while the quote currency is picked from the top row. For example, if you pick the Euro from the left column and move along the horizontal line to the Japanese Yen, the percentage change displayed in the box will represent EUR (base)/JPY (quote).
Japanese Yen FAQs
The Japanese Yen (JPY) is one of the world’s most traded currencies. Its value is broadly determined by the performance of the Japanese economy, but more specifically by the Bank of Japan’s policy, the differential between Japanese and US bond yields, or risk sentiment among traders, among other factors.
One of the Bank of Japan’s mandates is currency control, so its moves are key for the Yen. The BoJ has directly intervened in currency markets sometimes, generally to lower the value of the Yen, although it refrains from doing it often due to political concerns of its main trading partners. The current BoJ ultra-loose monetary policy, based on massive stimulus to the economy, has caused the Yen to depreciate against its main currency peers. This process has exacerbated more recently due to an increasing policy divergence between the Bank of Japan and other main central banks, which have opted to increase interest rates sharply to fight decades-high levels of inflation.
The BoJ’s stance of sticking to ultra-loose monetary policy has led to a widening policy divergence with other central banks, particularly with the US Federal Reserve. This supports a widening of the differential between the 10-year US and Japanese bonds, which favors the US Dollar against the Japanese Yen.
The Japanese Yen is often seen as a safe-haven investment. This means that in times of market stress, investors are more likely to put their money in the Japanese currency due to its supposed reliability and stability. Turbulent times are likely to strengthen the Yen’s value against other currencies seen as more risky to invest in.
| Raw materials | Closed | Change, % |
|---|---|---|
| Silver | 30.343 | 0.77 |
| Gold | 2333.82 | 0.19 |
| Palladium | 965.46 | -0.59 |
- The Australian Dollar gained ground due to risk-on after softer UoM 5-year Inflation Expectation on Friday.
- Australian equities rose above 7,770, following gains on Wall Street from Friday.
- The US Dollar weakened after the UoM 5-year Consumer Inflation Expectations (May) eased to 3.0% compared to the estimated 3.1%.
The Australian Dollar (AUD) extends its gains against the US Dollar (USD) for the second consecutive session on Monday as overall market risk appetite improved, despite diminishing expectations for Federal Reserve interest rate cuts. Meanwhile, investors eagerly anticipate the Monthly Australian Consumer Price Index report on Wednesday, seeking insights into the trajectory of domestic monetary policy.
The Australian Dollar may gain ground as the latest Reserve Bank of Australia (RBA) meeting minutes suggested that the board found it difficult to predict future changes in the cash rate, acknowledging that recent data increases the likelihood of inflation persisting above the 2-3% target for a prolonged duration.
The US Dollar (USD) weakened following the release of the University of Michigan's 5-year Consumer Inflation Expectations for May on Friday. It eased slightly to 3.0%, below the forecasted 3.1%. Despite the upward revision of the Consumer Sentiment Index to 69.1 from a preliminary reading of 67.4, it still marked the lowest level in six months. These figures likely contributed to strengthening investors’ sentiment regarding potential rate cuts by the Federal Reserve.
According to the CME FedWatch Tool, the probability of the Federal Reserve implementing a 25 basis-point rate cut in September has decreased to 44.9% from 49.0% a week earlier. It is worth noting that the US market will be closed due to the Memorial Day bank holiday on Monday.
Daily Digest Market Movers: Australian Dollar advances due to improved risk sentiment
- The ASX 200 Index rose above 7,770 on Monday, with nearly all sectors recovering losses from the previous week. Australian shares also followed gains on Wall Street from Friday amid improved risk appetite.
- The US Census Bureau released Durable Goods Orders on Friday, showing a solid recovery in April with a 0.7% month-over-month increase, compared to the forecasted 0.8% decline. However, March’s figure was revised down to 0.8% from the initial estimate of 2.6%.
- On Thursday, Australian Consumer Inflation Expectation of future inflation over the next 12 months fell to 4.1% in May from 4.6% in April, marking the lowest level since October 2021.
- The S&P Global US Composite PMI surged to 54.4 in May, marking the highest level since April 2022. The Service PMI rose to 54.8, indicating the biggest output growth in a year, while the Manufacturing PMI increased to 50.9.
- Reuters cited Chinese state media reports on Thursday, which indicated that China has deployed numerous fighter jets and conducted simulated strikes in the Taiwan Strait and around groups of Taiwan-controlled islands. Any geopolitical tension in the region may impact the Australian market as China and Australia are both close trade partners.
Technical Analysis: Australian Dollar tests nine-day EMA, followed by the key level of 0.6650
The Australian Dollar trades around 0.6630 on Monday. The 14-day Relative Strength Index (RSI) is positioned slightly above the 50 level, showing a bullish bias. Analysis of the daily chart shows that the AUD/USD pair is testing the lower boundary of a rising wedge. A return into the wedge would suggest the strengthening of the bullish bias.
The nine-day Exponential Moving Average (EMA) at 0.6634 and the lower boundary of the rising wedge serve as immediate resistance. A breakthrough above this level could lead the AUD/USD pair to test the four-month high of 0.6714, followed by the upper limit of the ascending triangle around 0.6730.
On the downside, the psychological level of 0.6600 could act as the key support, followed by the major level of 0.6550. A further decline may exert downward pressure on the AUD/USD pair, potentially driving it toward the throwback support region at 0.6470.
AUD/USD: Daily Chart
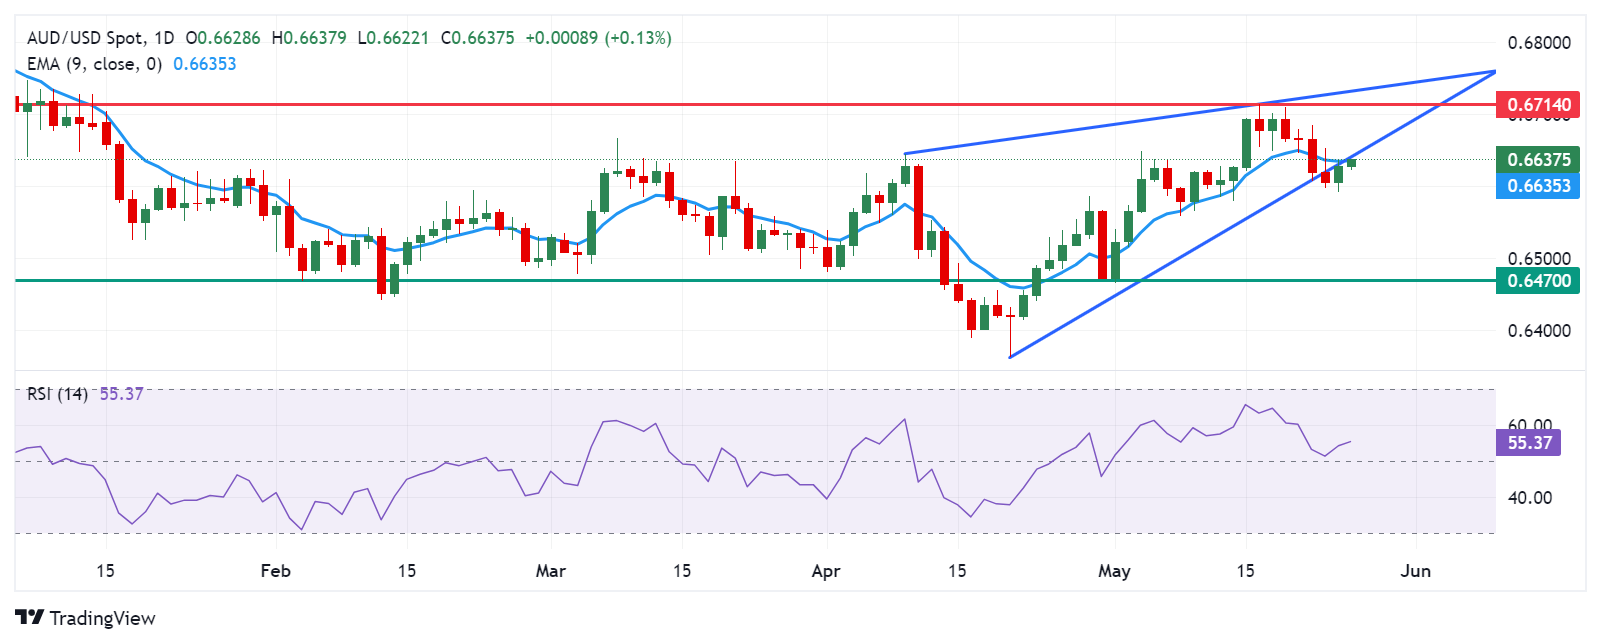
Australian Dollar price today
The table below shows the percentage change of the Australian Dollar (AUD) against listed major currencies today. The Australian Dollar was the strongest against the US Dollar.
| USD | EUR | GBP | CAD | AUD | JPY | NZD | CHF | |
| USD | -0.05% | -0.05% | -0.02% | -0.15% | -0.07% | -0.09% | 0.00% | |
| EUR | 0.03% | -0.02% | 0.01% | -0.13% | -0.04% | -0.06% | 0.03% | |
| GBP | 0.06% | 0.02% | 0.03% | -0.11% | -0.02% | -0.04% | 0.05% | |
| CAD | 0.03% | -0.02% | -0.03% | -0.13% | -0.04% | -0.09% | 0.01% | |
| AUD | 0.17% | 0.13% | 0.11% | 0.13% | 0.09% | 0.07% | 0.15% | |
| JPY | 0.07% | 0.02% | 0.02% | 0.03% | -0.12% | -0.01% | 0.06% | |
| NZD | 0.09% | 0.04% | 0.04% | 0.07% | -0.06% | 0.03% | 0.08% | |
| CHF | 0.00% | -0.04% | -0.04% | -0.02% | -0.15% | -0.06% | -0.09% |
The heat map shows percentage changes of major currencies against each other. The base currency is picked from the left column, while the quote currency is picked from the top row. For example, if you pick the Euro from the left column and move along the horizontal line to the Japanese Yen, the percentage change displayed in the box will represent EUR (base)/JPY (quote).
Australian Dollar FAQs
One of the most significant factors for the Australian Dollar (AUD) is the level of interest rates set by the Reserve Bank of Australia (RBA). Because Australia is a resource-rich country another key driver is the price of its biggest export, Iron Ore. The health of the Chinese economy, its largest trading partner, is a factor, as well as inflation in Australia, its growth rate, and Trade Balance. Market sentiment – whether investors are taking on more risky assets (risk-on) or seeking safe havens (risk-off) – is also a factor, with risk-on positive for AUD.
The Reserve Bank of Australia (RBA) influences the Australian Dollar (AUD) by setting the level of interest rates that Australian banks can lend to each other. This influences the level of interest rates in the economy as a whole. The main goal of the RBA is to maintain a stable inflation rate of 2-3% by adjusting interest rates up or down. Relatively high interest rates compared to other major central banks support the AUD, and the opposite for relatively low. The RBA can also use quantitative easing and tightening to influence credit conditions, with the former AUD-negative and the latter AUD-positive.
China is Australia’s largest trading partner so the health of the Chinese economy is a major influence on the value of the Australian Dollar (AUD). When the Chinese economy is doing well it purchases more raw materials, goods and services from Australia, lifting demand for the AUD, and pushing up its value. The opposite is the case when the Chinese economy is not growing as fast as expected. Positive or negative surprises in Chinese growth data, therefore, often have a direct impact on the Australian Dollar and its pairs.
Iron Ore is Australia’s largest export, accounting for $118 billion a year according to data from 2021, with China as its primary destination. The price of Iron Ore, therefore, can be a driver of the Australian Dollar. Generally, if the price of Iron Ore rises, AUD also goes up, as aggregate demand for the currency increases. The opposite is the case if the price of Iron Ore falls. Higher Iron Ore prices also tend to result in a greater likelihood of a positive Trade Balance for Australia, which is also positive of the AUD.
The Trade Balance, which is the difference between what a country earns from its exports versus what it pays for its imports, is another factor that can influence the value of the Australian Dollar. If Australia produces highly sought after exports, then its currency will gain in value purely from the surplus demand created from foreign buyers seeking to purchase its exports versus what it spends to purchase imports. Therefore, a positive net Trade Balance strengthens the AUD, with the opposite effect if the Trade Balance is negative.
Bank of Japan (BoJ) Deputy Governor Shinichi Uchida said on Monday that “we have overcome the zero lower bound.”
Additional quotes
We still have a big challenge to anchor the inflation expectations to 2%, the end of our battle is in sight.
This time is different.
We have overcome the zero lower bound.
We returned to a conventional monetary policy framework, aiming at a 2% price stabilitytarget through adjustments of the short-term policy rate, which means we have overcome thezero lower bound.
Labor market conditions have changed structurally and irreversibly.
Not so clear if Japan has overcome deflationary norm.
The main driving force for these developments and long-waited structural changes is labor shortages.
Higher menu costs, together with mild inflation, have slowed the pace of price adjustment.
And for us, the central bank, this requires more effort to get out of this situation.
Market reaction
At the time of writing, USD/JPY is losing 0.15% on the day to trade at 156.75.
- Gold price gains ground in Monday’s Asian session.
- The uptick in yellow metal is supported by the weaker USD and rising Middle East geopolitical risks.
- The speeches from the Fed's Bowman, Mester and Kashkari on Tuesday will be closely watched.
Gold price (XAU/USD) gathers strength on Monday. The softer US Dollar (USD) and the renewed escalating geopolitical tensions in the Middle East provide some support to the yellow metal. In the longer term, the precious metal might be bolstered by the growing central banks' demand for gold. Nonetheless, the lower bets on the Federal Reserve (Fed) rate cut this year and the hawkish stance from Fed officials might exert some selling pressure on XAU/USD as it makes gold less attractive as a store of value when interest rates rise.
On Monday, the US banks will be closed due to the Memorial Day bank holiday. Gold traders will take more cues from the Fed’s speech on Tuesday, including Michelle Bowman, Loretta Mester and Neel Kashkari. The first reading of US Gross Domestic Product (GDP) for the first quarter on Thursday will be in the spotlight, which is estimated to expand 1.5% in Q1. The stronger-than-expected data might boost the Greenback and weigh on USD-denominated gold.
Daily digest market movers: Gold price attracts some buyers amid the geopolitical risks
- The Ministry of Health in Gaza said that at least 35 Palestinians were killed and dozens more were injured as a result of Israeli air attacks on a camp in Rafah for displaced people on Sunday, per CNN.
- Gold price has increased by over 16% year-to-date, hitting a record high of over $2,400 per ounce in May, according to World Gold Council data.
- The US Durable Goods Orders rose by 0.7% MoM in April from the downward revision of 0.8% in March, better than the expectation of -0.8%.
- The University of Michigan Consumer Sentiment Index came in at 69.1 in May from 67.4 in April, above the market consensus of 67.5. Inflation expectations for one year rose slightly to 3.3% from 3.2%, while five-year inflation expectations eased to 3% from 3.1%.
- UBS analysts recently raised their gold price forecast to $2,600 for the end of 2024. Citi analysts predicted gold would hit $3,000 per ounce in the next six to 18 months.
- Gold imports to India, the world's second-largest gold consumer, might fall nearly a fifth this year as high prices encourage retail customers to exchange old jewellery for new items, per Reuters.
Technical analysis: Gold price keeps the bullish vibe unchanged on the daily timeframe
The gold price edges higher on the day. The constructive stance of the precious metal remains unchanged as it holds above the key 100-day Exponential Moving Average (EMA) on the daily chart. However, the 14-day Relative Strength Index (RSI) stands in a bearish zone around 48.5, indicating that consolidation or further downside in gold prices cannot be ruled out.
The first upside barrier for yellow metal will emerge near the upper boundary of the Bollinger Band at $2,428. Extended gains will see a rally to the all-time high of $2,450 and the $2,500 psychological mark.
On the downside, the $2,300 round level acts as an initial support level for the precious metal. A break below this level will see a drop to the lower limit of the Bollinger Band at $2,267. The next potential contention level is seen at the 100-day EMA of $2,220.
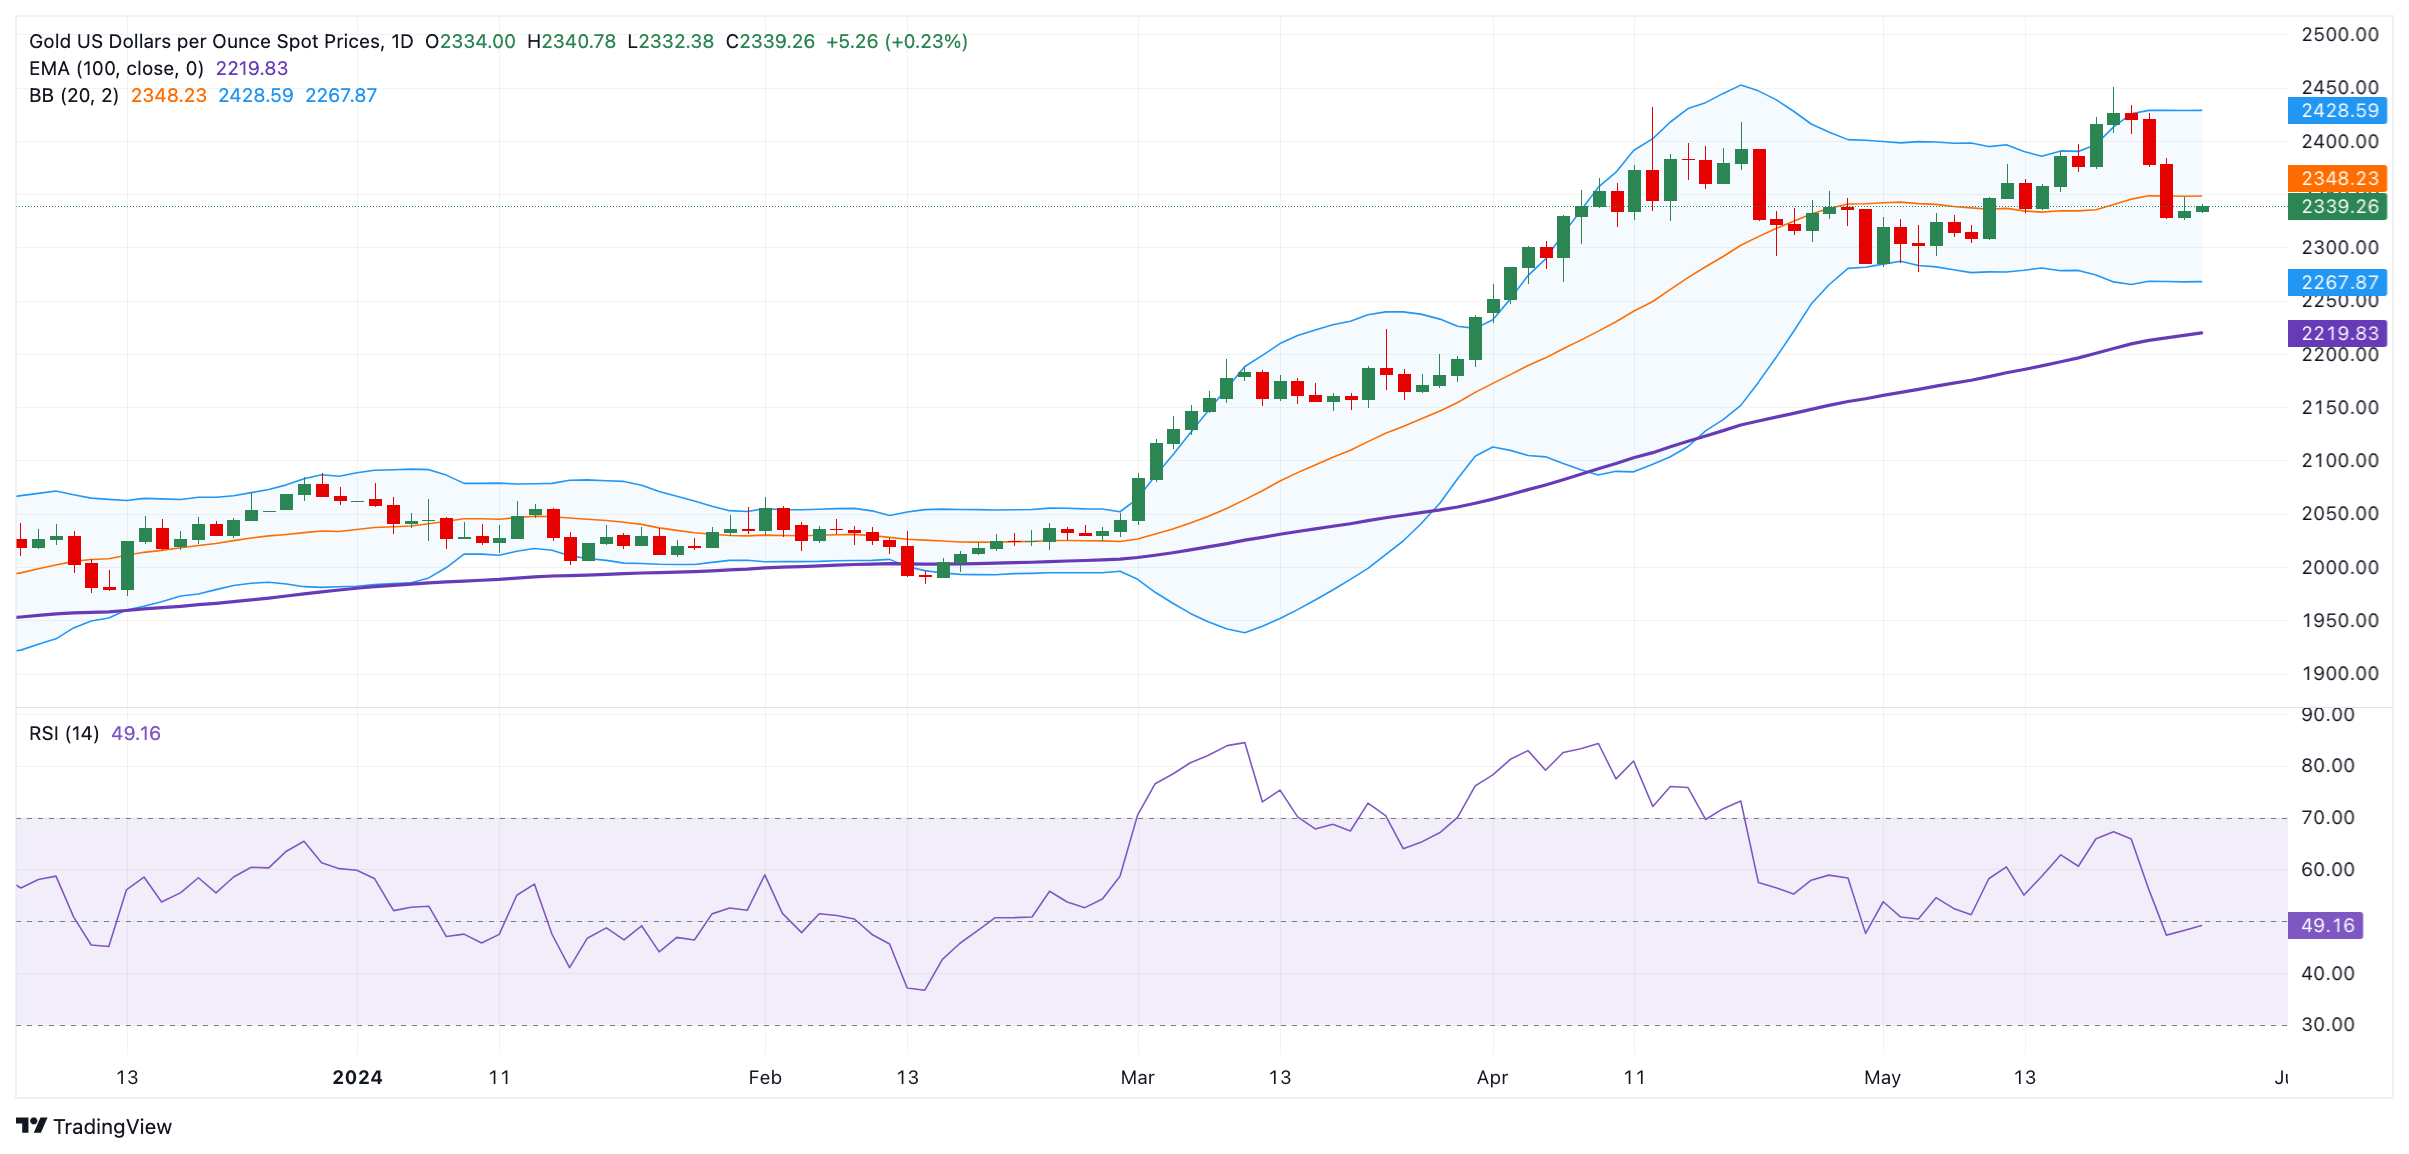
US Dollar price today
The table below shows the percentage change of US Dollar (USD) against listed major currencies today. US Dollar was the strongest against the Swiss Franc.
| USD | EUR | GBP | CAD | AUD | JPY | NZD | CHF | |
| USD | -0.03% | -0.05% | -0.02% | -0.14% | -0.08% | -0.10% | 0.00% | |
| EUR | 0.03% | -0.02% | 0.00% | -0.11% | -0.04% | -0.07% | 0.03% | |
| GBP | 0.05% | 0.01% | 0.02% | -0.09% | -0.03% | -0.05% | 0.04% | |
| CAD | 0.03% | 0.00% | -0.02% | -0.12% | -0.04% | -0.07% | 0.01% | |
| AUD | 0.16% | 0.14% | 0.12% | 0.14% | 0.09% | 0.04% | 0.16% | |
| JPY | 0.08% | 0.04% | 0.04% | 0.03% | -0.08% | -0.02% | 0.06% | |
| NZD | 0.10% | 0.06% | 0.04% | 0.07% | -0.07% | 0.03% | 0.09% | |
| CHF | 0.00% | -0.03% | -0.04% | -0.02% | -0.14% | -0.07% | -0.10% |
The heat map shows percentage changes of major currencies against each other. The base currency is picked from the left column, while the quote currency is picked from the top row. For example, if you pick the Euro from the left column and move along the horizontal line to the Japanese Yen, the percentage change displayed in the box will represent EUR (base)/JPY (quote).
Gold FAQs
Gold has played a key role in human’s history as it has been widely used as a store of value and medium of exchange. Currently, apart from its shine and usage for jewelry, the precious metal is widely seen as a safe-haven asset, meaning that it is considered a good investment during turbulent times. Gold is also widely seen as a hedge against inflation and against depreciating currencies as it doesn’t rely on any specific issuer or government.
Central banks are the biggest Gold holders. In their aim to support their currencies in turbulent times, central banks tend to diversify their reserves and buy Gold to improve the perceived strength of the economy and the currency. High Gold reserves can be a source of trust for a country’s solvency. Central banks added 1,136 tonnes of Gold worth around $70 billion to their reserves in 2022, according to data from the World Gold Council. This is the highest yearly purchase since records began. Central banks from emerging economies such as China, India and Turkey are quickly increasing their Gold reserves.
Gold has an inverse correlation with the US Dollar and US Treasuries, which are both major reserve and safe-haven assets. When the Dollar depreciates, Gold tends to rise, enabling investors and central banks to diversify their assets in turbulent times. Gold is also inversely correlated with risk assets. A rally in the stock market tends to weaken Gold price, while sell-offs in riskier markets tend to favor the precious metal.
The price can move due to a wide range of factors. Geopolitical instability or fears of a deep recession can quickly make Gold price escalate due to its safe-haven status. As a yield-less asset, Gold tends to rise with lower interest rates, while higher cost of money usually weighs down on the yellow metal. Still, most moves depend on how the US Dollar (USD) behaves as the asset is priced in dollars (XAU/USD). A strong Dollar tends to keep the price of Gold controlled, whereas a weaker Dollar is likely to push Gold prices up.
The People’s Bank of China (PBoC) set the USD/CNY central rate for the trading session ahead on Friday at 7.1091, as against the previous day's fix of 7.1102 and 7.2367 Reuters estimates.
- WTI Oil price attempts to extend its gains due to a recovery in overall market risk sentiment.
- University of Michigan's 5-year Consumer Inflation Expectations for May eased slightly, bolstering expectations regarding the Fed’s rate cuts.
- Iran will increase its Oil output from 3.6 million to 4 million barrels per day.
West Texas Intermediate (WTI) crude Oil price inches higher due to a recovery in overall market risk appetite, likely driven by investors' anticipation of a rate cut from the Federal Reserve (Fed) in September. WTI price trades around $77.70 per barrel during the Asian session on Monday.
On Friday, the University of Michigan's 5-year Consumer Inflation Expectations for May eased slightly to 3.0%, down from the forecasted 3.1%. This decline in inflation expectations is bolstering investor sentiment regarding potential rate cuts by the Fed.
However, Fed officials tempered expectations for rate cuts last week, issuing cautionary statements that the central bank still requires more evidence that inflation will eventually decline to its target of 2% annual price growth. Prolonged elevated interest rates are negatively impacting the US economic outlook and reducing Oil demand.
Reuters reported on Sunday, citing Iran’s Tasnim news agency, that an economic council led by Iran's interim president Mohammad Mokhber has approved a plan to increase the country's Oil output from 3.6 million barrels per day (bpd) to 4 million bpd.
Additionally, Saudi Arabia is preparing for a multi-billion-dollar share sale in energy giant Aramco, aiming to raise around $10 billion as early as June. This would be one of the region's largest stock deals, with shares listed in Riyadh in a fully marketed offering rather than an accelerated sale over a few days.
The Ministry of Health in Gaza said that at least 35 Palestinians were killed and dozens more were injured as a result of Israeli air attacks on a camp in Rafah for displaced people on Sunday, per CNN.
Ceasefire and hostage talks will continue next week, officials said. The talks between Israel and Hamas have stalled, with both parties failing to reach an agreement over differences on key conditions.
Market reaction
At the time of writing, gold price (XAU/USD) is trading 0.10% higher on the day to trade at $2,336.10
Risk sentiment FAQs
In the world of financial jargon the two widely used terms “risk-on” and “risk off'' refer to the level of risk that investors are willing to stomach during the period referenced. In a “risk-on” market, investors are optimistic about the future and more willing to buy risky assets. In a “risk-off” market investors start to ‘play it safe’ because they are worried about the future, and therefore buy less risky assets that are more certain of bringing a return, even if it is relatively modest.
Typically, during periods of “risk-on”, stock markets will rise, most commodities – except Gold – will also gain in value, since they benefit from a positive growth outlook. The currencies of nations that are heavy commodity exporters strengthen because of increased demand, and Cryptocurrencies rise. In a “risk-off” market, Bonds go up – especially major government Bonds – Gold shines, and safe-haven currencies such as the Japanese Yen, Swiss Franc and US Dollar all benefit.
The Australian Dollar (AUD), the Canadian Dollar (CAD), the New Zealand Dollar (NZD) and minor FX like the Ruble (RUB) and the South African Rand (ZAR), all tend to rise in markets that are “risk-on”. This is because the economies of these currencies are heavily reliant on commodity exports for growth, and commodities tend to rise in price during risk-on periods. This is because investors foresee greater demand for raw materials in the future due to heightened economic activity.
The major currencies that tend to rise during periods of “risk-off” are the US Dollar (USD), the Japanese Yen (JPY) and the Swiss Franc (CHF). The US Dollar, because it is the world’s reserve currency, and because in times of crisis investors buy US government debt, which is seen as safe because the largest economy in the world is unlikely to default. The Yen, from increased demand for Japanese government bonds, because a high proportion are held by domestic investors who are unlikely to dump them – even in a crisis. The Swiss Franc, because strict Swiss banking laws offer investors enhanced capital protection.
| Index | Change, points | Closed | Change, % |
|---|---|---|---|
| NIKKEI 225 | -457.11 | 38646.11 | -1.17 |
| Hang Seng | -259.77 | 18608.94 | -1.38 |
| KOSPI | -34.21 | 2687.6 | -1.26 |
| ASX 200 | -84.2 | 7727.6 | -1.08 |
| DAX | 2.05 | 18693.37 | 0.01 |
| CAC 40 | -7.36 | 8094.97 | -0.09 |
| Dow Jones | 4.33 | 39069.59 | 0.01 |
| S&P 500 | 36.88 | 5304.72 | 0.7 |
| NASDAQ Composite | 184.76 | 16920.79 | 1.1 |
Bank of Japan (BoJ) Governor Kazuo Ueda said on Monday that some challenges are uniquely difficult for the Bank and BoJ will proceed cautiously as do other central banks with inflation-targeting frameworks.
Key quotes
We have made progress in moving away from zero and lifting inflation expectations, but we must now re-anchor them, this time at the 2% target.
BoJ will proceed cautiously, as do other central banks with inflation-targeting frameworks.
While many of the challenges we face are similar to those encountered by our counterparts, some are uniquely difficult for us.
The absence of significant interest rate movements poses a considerable obstacle in assessing the economy's response to changes in interest rates.
Market reaction
At the time of writing, USD/JPY is trading 0.09% lower on the day to trade at 156.82.
Japanese Yen FAQs
The Japanese Yen (JPY) is one of the world’s most traded currencies. Its value is broadly determined by the performance of the Japanese economy, but more specifically by the Bank of Japan’s policy, the differential between Japanese and US bond yields, or risk sentiment among traders, among other factors.
One of the Bank of Japan’s mandates is currency control, so its moves are key for the Yen. The BoJ has directly intervened in currency markets sometimes, generally to lower the value of the Yen, although it refrains from doing it often due to political concerns of its main trading partners. The current BoJ ultra-loose monetary policy, based on massive stimulus to the economy, has caused the Yen to depreciate against its main currency peers. This process has exacerbated more recently due to an increasing policy divergence between the Bank of Japan and other main central banks, which have opted to increase interest rates sharply to fight decades-high levels of inflation.
The BoJ’s stance of sticking to ultra-loose monetary policy has led to a widening policy divergence with other central banks, particularly with the US Federal Reserve. This supports a widening of the differential between the 10-year US and Japanese bonds, which favors the US Dollar against the Japanese Yen.
The Japanese Yen is often seen as a safe-haven investment. This means that in times of market stress, investors are more likely to put their money in the Japanese currency due to its supposed reliability and stability. Turbulent times are likely to strengthen the Yen’s value against other currencies seen as more risky to invest in.
| Pare | Closed | Change, % |
|---|---|---|
| AUDUSD | 0.66278 | 0.34 |
| EURJPY | 170.244 | 0.31 |
| EURUSD | 1.08461 | 0.3 |
| GBPJPY | 199.875 | 0.31 |
| GBPUSD | 1.27357 | 0.31 |
| NZDUSD | 0.6121 | 0.34 |
| USDCAD | 1.36661 | -0.48 |
| USDCHF | 0.91472 | 0.05 |
| USDJPY | 156.966 | 0 |
- EUR/USD trades with mild gains near 1.0850 in Monday’s early Asian session.
- The stronger US data and the Fed’s hawkish stance might lift the USD and cap the pair’s upside.
- ECB’s Cipollone said the time is right for June rate cuts as the recent data moved in the right direction.
The EUR/USD pair trades in positive territory for the second consecutive day around 1.0850 in Monday’s early Asian session. The stronger-than-expected preliminary Eurozone Purchasing Managers Index (PMI) for May provides some support to the Euro (EUR). However, the chance that the European Central Bank (ECB) will cut interest rates in the upcoming months might cap the upside of the major pair.
The stronger US economic data and the hawkish comments from US Federal Reserve (Fed) officials might trigger speculation of a delay in the easing cycle this year. Investors have priced in 53% odds of a Fed rate cut in September, down from 64% recorded a week ago, according to the CME FedWatch tool. Investors await the preliminary US Gross Domestic Product (GDP) Annualized for the first quarter (Q1), which is due on Thursday. The GDP number is estimated to grow by 1.5% in Q1 from 1.6% prior. The stronger reading is likely to lift the Greenback in the near term.
On Friday, US Durable Goods Orders increased by 0.7% MoM in April from the downward revised 0.8% in March, stronger than -0.8% expected. Meanwhile, the University of Michigan Consumer Sentiment Index improved to 69.1 in May from 67.4 in April, better than the estimated 67.5. The UoM five-year inflation expectations eased to 3% from 3.1%.
The ECB policymaker Piero Cipollone said on Sunday that the time is right for an interest rate cut in June as the recent data moved in the right direction. Meanwhile, ECB President Christine Lagarde said that she is "really confident" that Eurozone inflation was under control and an interest-rate cut is probable next month. A lowering of borrowing costs by the ECB in June has been widely expected, and this might weigh on the EUR against its rivals.


© 2000-2026. Bản quyền Teletrade.
Trang web này được quản lý bởi Teletrade D.J. LLC 2351 LLC 2022 (Euro House, Richmond Hill Road, Kingstown, VC0100, St. Vincent and the Grenadines).
Thông tin trên trang web không phải là cơ sở để đưa ra quyết định đầu tư và chỉ được cung cấp cho mục đích làm quen.
Giao dịch trên thị trường tài chính (đặc biệt là giao dịch sử dụng các công cụ biên) mở ra những cơ hội lớn và tạo điều kiện cho các nhà đầu tư sẵn sàng mạo hiểm để thu lợi nhuận, tuy nhiên nó mang trong mình nguy cơ rủi ro khá cao. Chính vì vậy trước khi tiến hành giao dịch cần phải xem xét mọi mặt vấn đề chấp nhận tiến hành giao dịch cụ thể xét theo quan điểm của nguồn lực tài chính sẵn có và mức độ am hiểu thị trường tài chính.
Sử dụng thông tin: sử dụng toàn bộ hay riêng biệt các dữ liệu trên trang web của công ty TeleTrade như một nguồn cung cấp thông tin nhất định. Việc sử dụng tư liệu từ trang web cần kèm theo liên kết đến trang teletrade.vn. Việc tự động thu thập số liệu cũng như thông tin từ trang web TeleTrade đều không được phép.
Xin vui lòng liên hệ với pr@teletrade.global nếu có câu hỏi.
ngân hàng