- Phân tích
- Tin tức và các công cụ
- Tin tức thị trường
Tin tức thì trường
- EUR/USD churns near 1.0720 as market flows buckle down for the wait to key data.
- Wednesday has a limited data docket on the offer.
- Investors look ahead to Friday’s packed data docket.
EUR/USD traded within familiar levels on Wednesday, keeping the Fiber trapped in near-term consolidation just north of 1.0700 as Euro traders hunker down for the wait to meaningful data releases. Momentum is set to remain thin as markets await fresh data to drive market flows beginning on Thursday.
Forex Today: The FX universe remains in waiting mode
Wednesday’s economic calendar is notably thin, though traders will note that the latest German GfK Consumer Confidence Survey for July is expected to improve slightly from the previous print of -20.9 to -18.9. European Central Bank (ECB) Chief Economist Philip Lane is also expected to deliver some talking points during the European market session. Still, the ECB Executive Board member is not expected to rock the boat or otherwise deviate from recent talking points shared by other ECB board members.
The US will also release the latest Bank Stress Test results, but performance is not expected to wildly deviate from previous runs through the Federal Reserve’s stress test of the US banking system. The current “severely adverse” stress test asks banks to examine the soundness of their balance sheets under a hypothetical scenario where the US Unemployment Rate reaches 10% within a two-year period, alongside an increase in market volatility, a 36% decline in housing prices, and a 40% drop in commercial real estate values.
Thursday will kick off the week’s data releases in earnest, with final pan-EU Consumer Confidence figures for June as well as a revision print for Q1’s US Gross Domestic Product (GDP) print which is expected to hold steady at 1.3% QoQ.
Friday will blow the doors off the week’s otherwise sedate economic release schedule with German Retail Sales figures for May and the latest print of US Personal Consumption Expenditure Price Index (PCE) inflation, also for the monthly period of May. One of the Federal Reserve's (Fed) preferred inflation metrics, investors will be closely monitoring a continued decrease in crucial US inflation figures to ensure the Fed stays on track to implement an initial rate cut when the Federal Open Market Committee (FOMC) convenes on September 18.
EUR/USD technical outlook
EUR/USD continues to get squeezed into near-term consolidation as the 200-hour Exponential Moving Average (EMA) weighs on intraday price action from 1.071, but a demand zone below 1.0680 is proving technical support and keeping bids bolstered.
Daily candlesticks are mired in technical congestion, but the Fiber remains poised for an extended slide as high and lows continue to chalk in lower peaks and valleys. The pair is drifting on the south side of the 200-day EMA at 1.0798, and failure to spark a firm bullish push back into the high end of recent lower highs could see the Fiber contesting the last major swing low into the 1.0600 handle.
EUR/USD hourly chart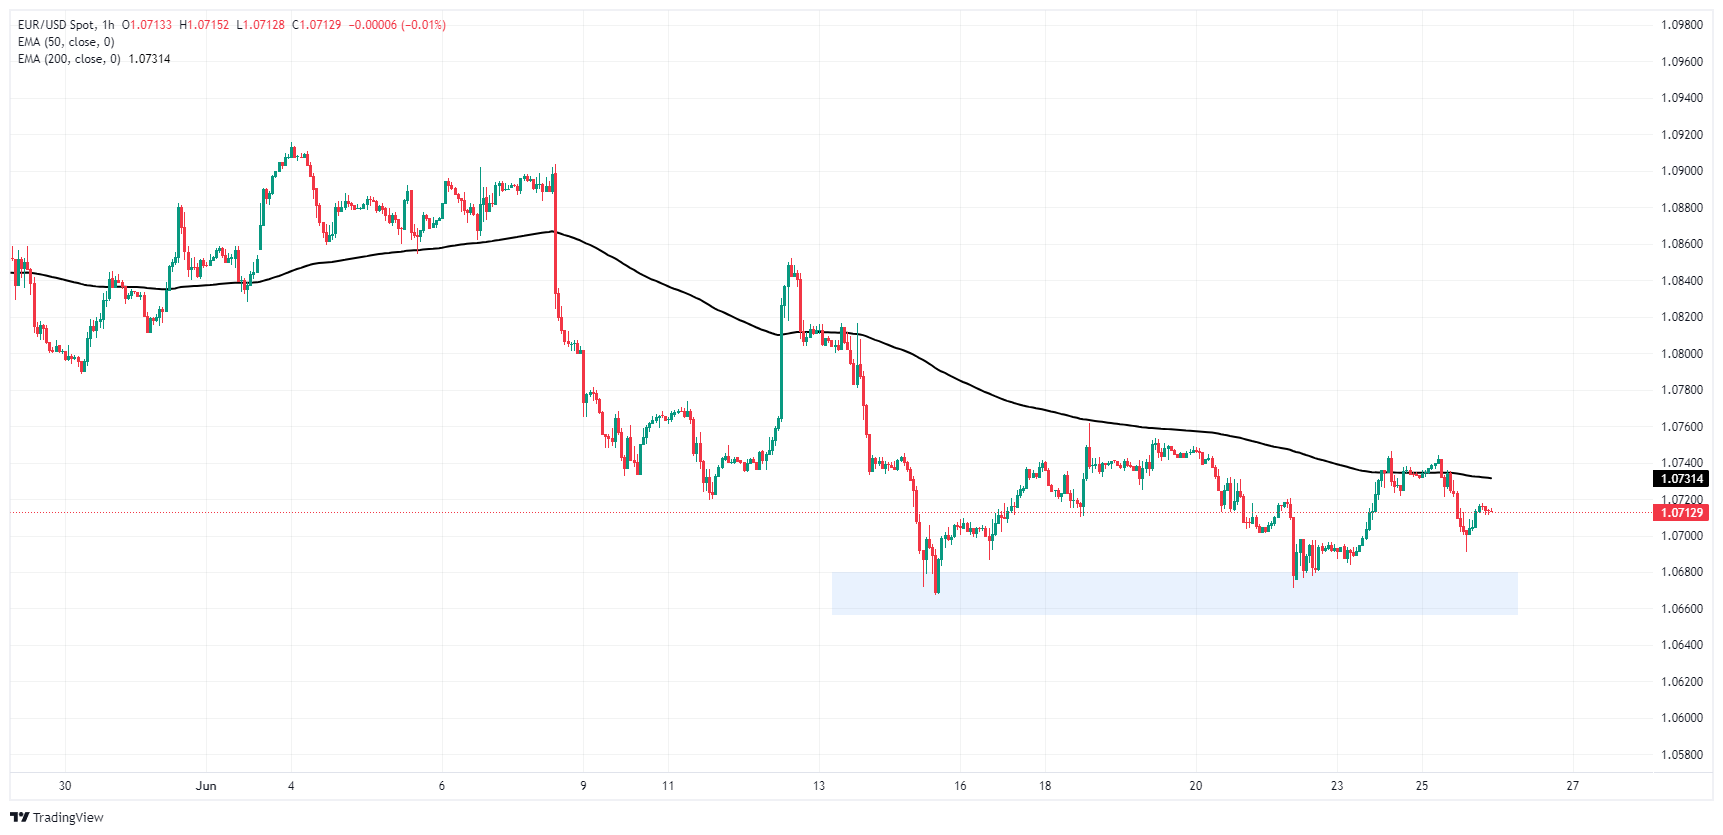
EUR/USD daily chart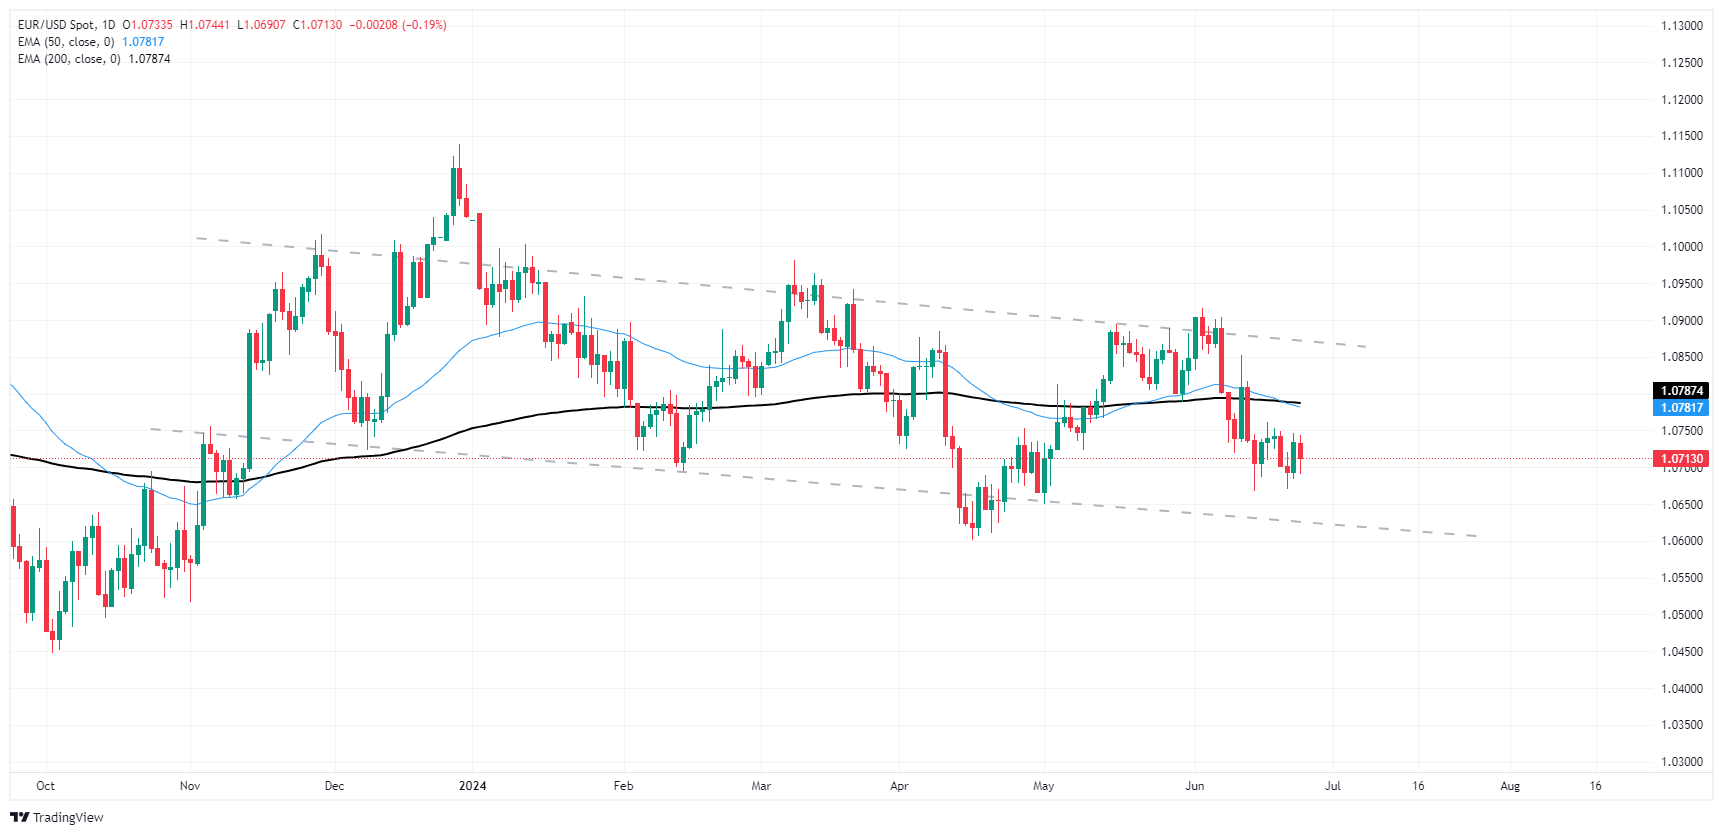
Euro FAQs
The Euro is the currency for the 20 European Union countries that belong to the Eurozone. It is the second most heavily traded currency in the world behind the US Dollar. In 2022, it accounted for 31% of all foreign exchange transactions, with an average daily turnover of over $2.2 trillion a day. EUR/USD is the most heavily traded currency pair in the world, accounting for an estimated 30% off all transactions, followed by EUR/JPY (4%), EUR/GBP (3%) and EUR/AUD (2%).
The European Central Bank (ECB) in Frankfurt, Germany, is the reserve bank for the Eurozone. The ECB sets interest rates and manages monetary policy. The ECB’s primary mandate is to maintain price stability, which means either controlling inflation or stimulating growth. Its primary tool is the raising or lowering of interest rates. Relatively high interest rates – or the expectation of higher rates – will usually benefit the Euro and vice versa. The ECB Governing Council makes monetary policy decisions at meetings held eight times a year. Decisions are made by heads of the Eurozone national banks and six permanent members, including the President of the ECB, Christine Lagarde.
Eurozone inflation data, measured by the Harmonized Index of Consumer Prices (HICP), is an important econometric for the Euro. If inflation rises more than expected, especially if above the ECB’s 2% target, it obliges the ECB to raise interest rates to bring it back under control. Relatively high interest rates compared to its counterparts will usually benefit the Euro, as it makes the region more attractive as a place for global investors to park their money.
Data releases gauge the health of the economy and can impact on the Euro. Indicators such as GDP, Manufacturing and Services PMIs, employment, and consumer sentiment surveys can all influence the direction of the single currency. A strong economy is good for the Euro. Not only does it attract more foreign investment but it may encourage the ECB to put up interest rates, which will directly strengthen the Euro. Otherwise, if economic data is weak, the Euro is likely to fall. Economic data for the four largest economies in the euro area (Germany, France, Italy and Spain) are especially significant, as they account for 75% of the Eurozone’s economy.
Another significant data release for the Euro is the Trade Balance. This indicator measures the difference between what a country earns from its exports and what it spends on imports over a given period. If a country produces highly sought after exports then its currency will gain in value purely from the extra demand created from foreign buyers seeking to purchase these goods. Therefore, a positive net Trade Balance strengthens a currency and vice versa for a negative balance.
- GBP/USD traded in a circle on Wednesday, testing 1.2700.
- Key figures for both the US and UK due later in the week.
- GDP updates due on both sides of the Atlantic, US PCE inflation slated for Friday.
GBP/USD treaded water on Tuesday as investors mostly stood pat with a lack of meaningful data to drive market bets in either direction. The pair drifted in a slow circle near the 1.2700 handle, with a data-light Wednesday on the offer for the mid-week market session.
Forex Today: The FX universe remains in waiting mode
Data was notably thin on the Tuesday market session with the UK absent from the data docket and US data strictly mid-tier. The Richmond Fed’s Manufacturing Index declined sharply to -10 in June, down sharply from the previous print of 0 and entirely missing the forecast increase to 2. The CB Consumer Confidence survey index also eased back, but not as much as expected as the sentiment indicator ticked down to 100.4 from the previous 102.0 but stopping just short of the forecast 100.0.
The week’s noteworthy data releases will kick off on Thursday with the Bank of England’s )BoE) latest Financial Stability Report, followed by US Durable Goods Orders and US Gross Domestic Product (GDP) revisions for the first quarter.
Friday will round out an otherwise low-impact trading week with the UK’s own GDP quarterly revisions, followed by the latest print of the US’ Personal Consumption Expenditure Price Index (PCE) inflation. As one of the Federal Reserve’s (Fed) favored inflation metrics, investors will be looking for a continued cooling in critical US inflation figures to keep the Fed on pace to deliver a first rate cut when the Federal Open Market Committee (FOMC) meets on September 18.
GBP/USD technical outlook
GBP/USD continues to tilt towards the low side as near-term price action gets hung up on the 200-hour Exponential Moving Average (EMA) near 1.2693. The 1.2700 handle is proving too tough of a barrier for bulls to crack on intraday charts, and a continued softening of upside momentum could drag the pair into fresh July lows below 1.2630.
Daily candlesticks remain mired in technical congestion at the 50-day EMA near 1.2673, and the Cable continues to trade on the low side of a supply zone priced in above 1.2800.
GBP/USD hourly chart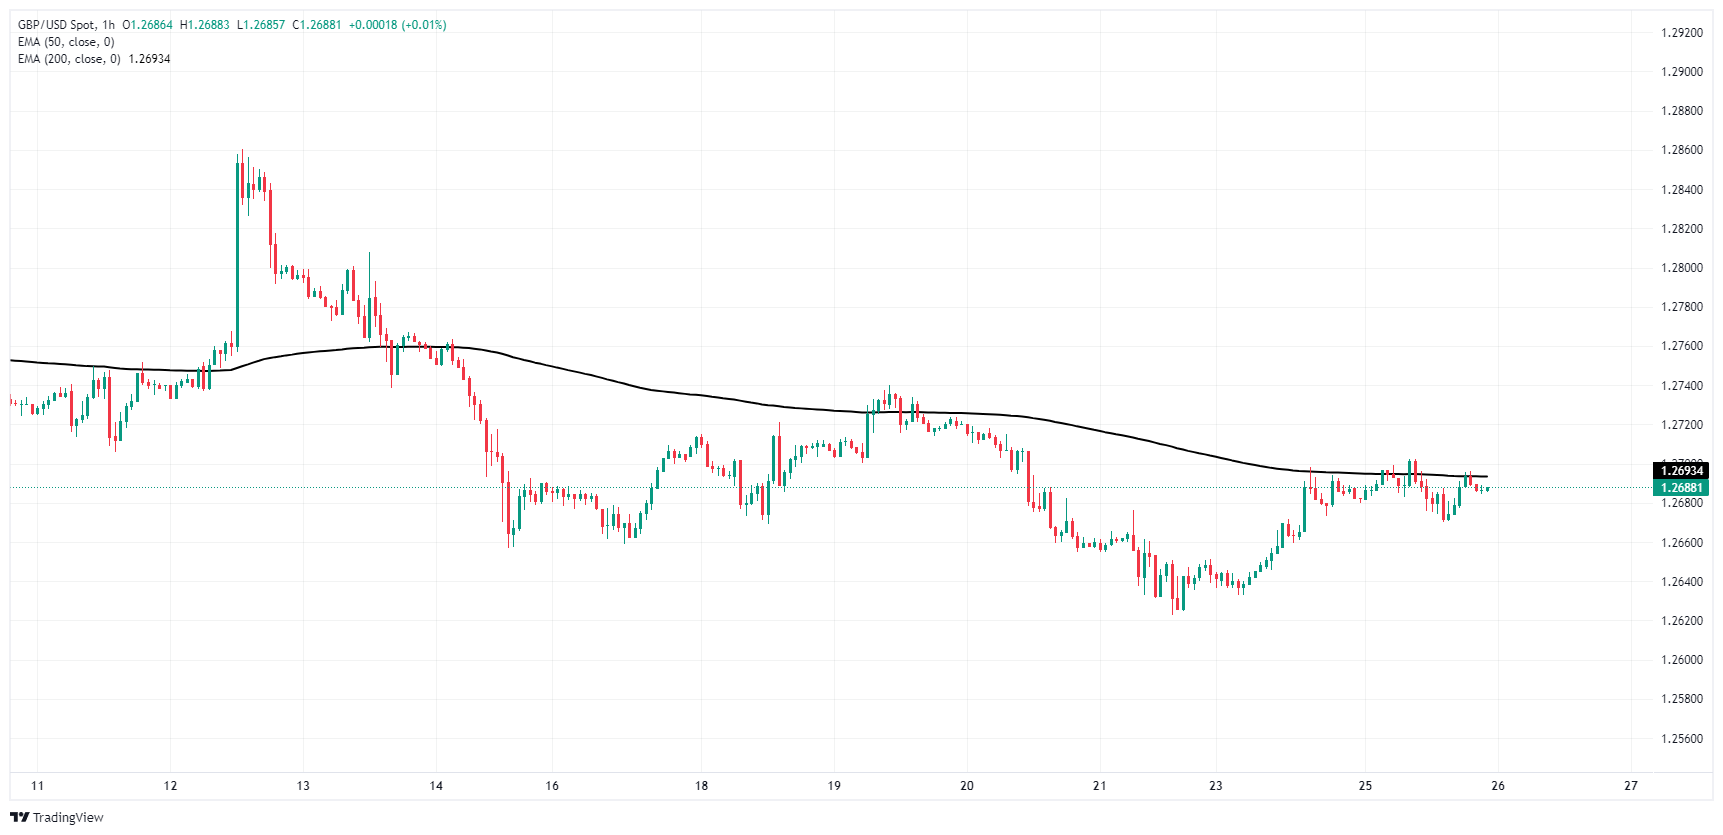
GBP/USD daily chart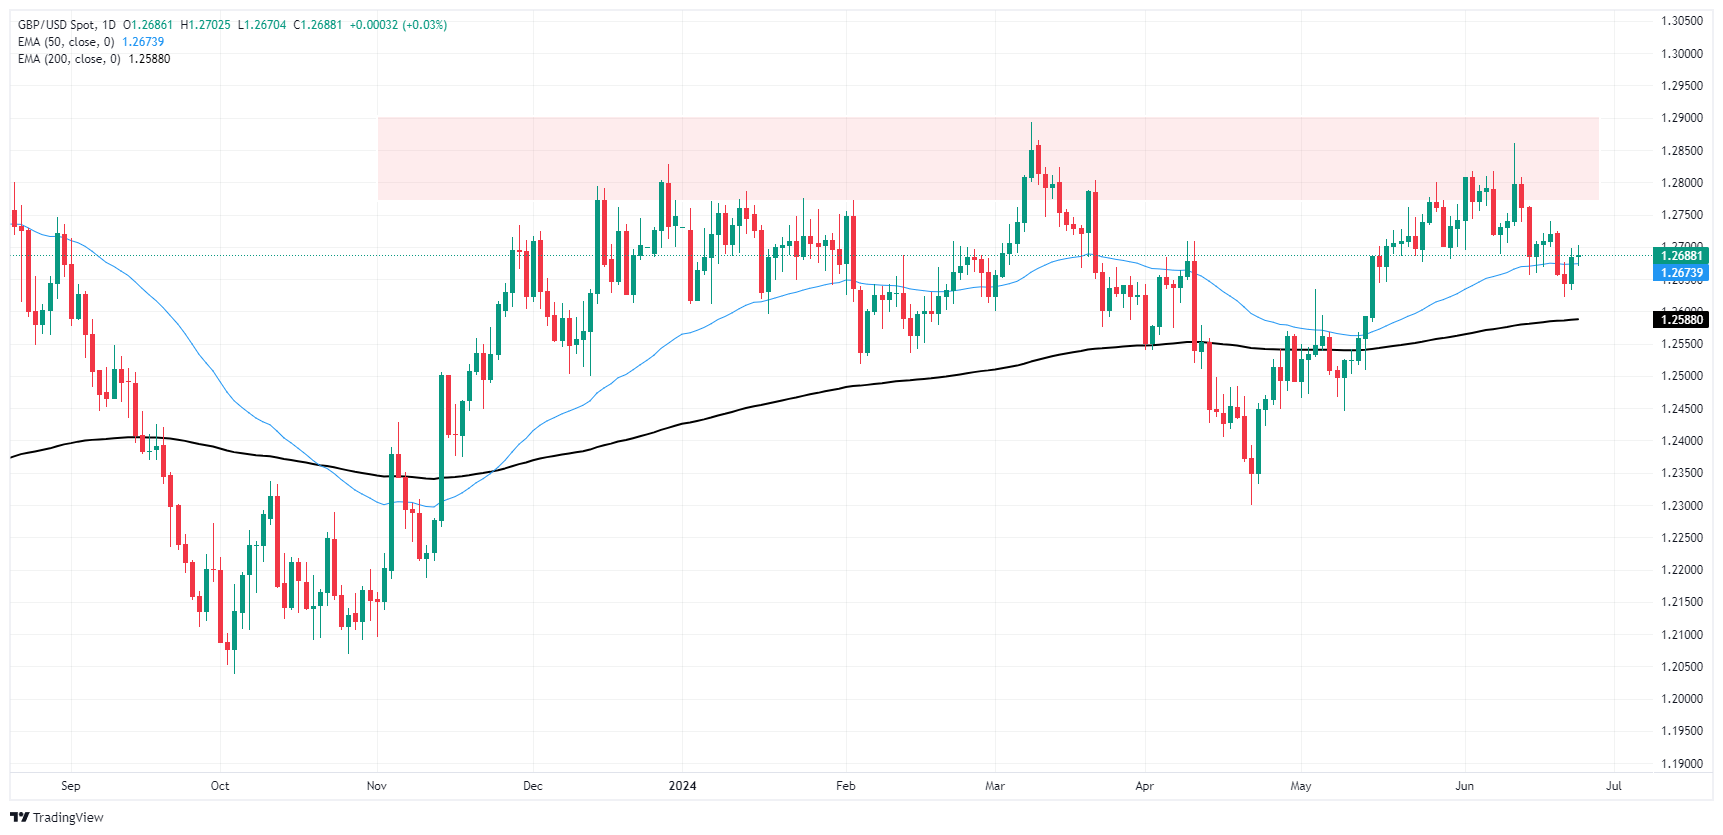
Pound Sterling FAQs
The Pound Sterling (GBP) is the oldest currency in the world (886 AD) and the official currency of the United Kingdom. It is the fourth most traded unit for foreign exchange (FX) in the world, accounting for 12% of all transactions, averaging $630 billion a day, according to 2022 data. Its key trading pairs are GBP/USD, aka ‘Cable’, which accounts for 11% of FX, GBP/JPY, or the ‘Dragon’ as it is known by traders (3%), and EUR/GBP (2%). The Pound Sterling is issued by the Bank of England (BoE).
The single most important factor influencing the value of the Pound Sterling is monetary policy decided by the Bank of England. The BoE bases its decisions on whether it has achieved its primary goal of “price stability” – a steady inflation rate of around 2%. Its primary tool for achieving this is the adjustment of interest rates. When inflation is too high, the BoE will try to rein it in by raising interest rates, making it more expensive for people and businesses to access credit. This is generally positive for GBP, as higher interest rates make the UK a more attractive place for global investors to park their money. When inflation falls too low it is a sign economic growth is slowing. In this scenario, the BoE will consider lowering interest rates to cheapen credit so businesses will borrow more to invest in growth-generating projects.
Data releases gauge the health of the economy and can impact the value of the Pound Sterling. Indicators such as GDP, Manufacturing and Services PMIs, and employment can all influence the direction of the GBP. A strong economy is good for Sterling. Not only does it attract more foreign investment but it may encourage the BoE to put up interest rates, which will directly strengthen GBP. Otherwise, if economic data is weak, the Pound Sterling is likely to fall.
Another significant data release for the Pound Sterling is the Trade Balance. This indicator measures the difference between what a country earns from its exports and what it spends on imports over a given period. If a country produces highly sought-after exports, its currency will benefit purely from the extra demand created from foreign buyers seeking to purchase these goods. Therefore, a positive net Trade Balance strengthens a currency and vice versa for a negative balance.
- WTI falls back once more from $81.50 as near-term chart churn continues.
- API weekly Crude Oil counts reported another unexpected increase in reserves.
- Middle East tensions keep Crude Oil risk bid elevated, but weakness persists.
West Texas Intermediate (WTI) US Crude Oil eased back on Tuesday, slipping over a dollar per barrel from $81.50 to test below $80.50 as bullish Crude Oil sentiment continues to sour with hopes for a summertime drawdown dwindling and a surprise buildup in US Crude Oil stocks hampering upside potential in energy markets.
The American Petroleum Institute (API) reported a week-on-week buildup of Weekly Crude Oil Stocks for the week ended June 21, chalking in a 900K barrel buildup compared to the expected drawdown of 3 million barrels, adding to the previous week’s buildup of 2.263 million barrels. US Gasoline inventories also rose, climbing 3.843 million barrels as domestic demand struggles to sop up output from refined producers.
Broad-market hopes for a firm drag on Crude Oil stocks are dwindling as inventory counts climb. Barrel traders, who have been propping up Crude Oil prices on fears of the Israel-Palestinian Hamas conflict might spill over into neighboring countries, have yet to see any actual disruptions in Crude Oil production.
Adding onto this, the Organization of the Petroleum Exporting Countries (OPEC) and its extended network of non-member ally states, OPEC+, are set to begin phasing out voluntary production cuts meant to bolster global Crude Oil prices. OPEC+’s gradual phasing out of production caps could see an additional 2.2 million bpd pour into global Crude Oil supplies as OPEC+ member states grow weary of propping up global energy prices at the expense of their government budgets, which rely on Crude Oil sales to balance the books.
Economic Indicator
API Weekly Crude Oil Stock
API’s Weekly Statistical Bulletin (WSB) has reported total U.S. and regional data relating to refinery operations and the production of the four major petroleum products: motor gasoline, kerosene jet fuel, distillate (by sulfur content), and residual fuel oil. These products represent more than 85% of total petroleum industry.
Read more.Last release: Tue Jun 25, 2024 20:45
Frequency: Weekly
Actual: 0.9M
Consensus: -3M
Previous: 2.264M
Source: American Petroleum Institute
WTI technical outlook
Near-term price action has halted a bullish advance, keeping WTI US Crude Oil prices pinned on the low side of a supply zone above $81.50. Intraday bidding is easing back to the 200-hour Exponential Moving Average (EMA) at the $80.00 handle, and an extended backslide could see barrel bids tumble further into mid-June’s consolidation range below $78.50.
Daily candlesticks have largely churned in place since finishing a 12.65% bottom-to-top rally sparked after early June’s swing low to $72.45, but a lack of bullish momentum beyond the 200-day EMA at $78.90 leaves price action poised for a bearish turnaround.
WTI hourly chart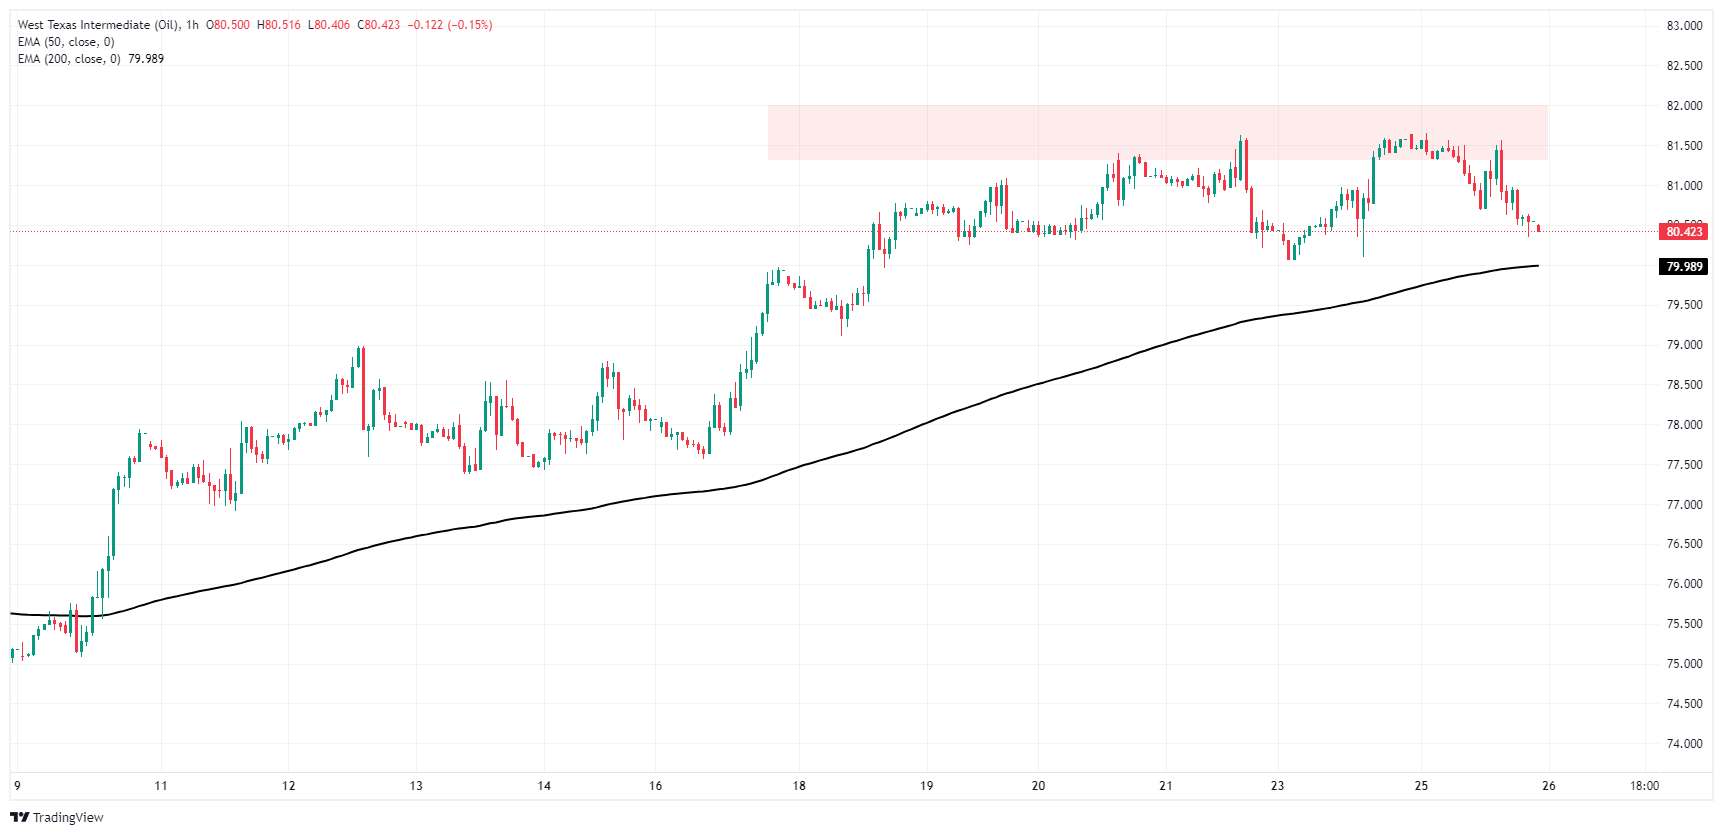
WTI daily chart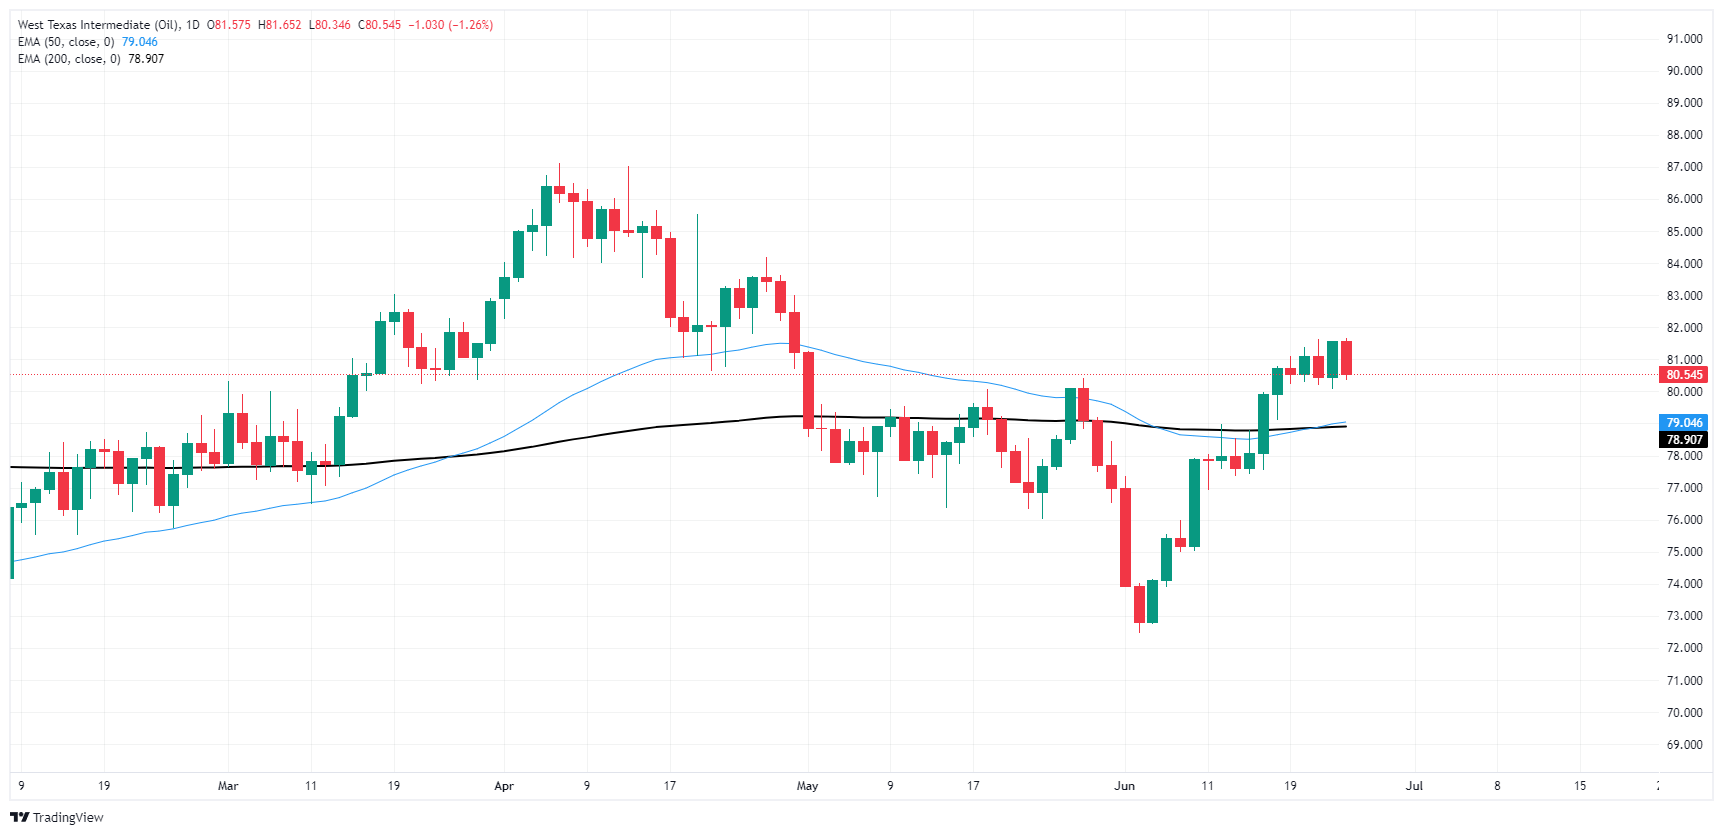
WTI Oil FAQs
WTI Oil is a type of Crude Oil sold on international markets. The WTI stands for West Texas Intermediate, one of three major types including Brent and Dubai Crude. WTI is also referred to as “light” and “sweet” because of its relatively low gravity and sulfur content respectively. It is considered a high quality Oil that is easily refined. It is sourced in the United States and distributed via the Cushing hub, which is considered “The Pipeline Crossroads of the World”. It is a benchmark for the Oil market and WTI price is frequently quoted in the media.
Like all assets, supply and demand are the key drivers of WTI Oil price. As such, global growth can be a driver of increased demand and vice versa for weak global growth. Political instability, wars, and sanctions can disrupt supply and impact prices. The decisions of OPEC, a group of major Oil-producing countries, is another key driver of price. The value of the US Dollar influences the price of WTI Crude Oil, since Oil is predominantly traded in US Dollars, thus a weaker US Dollar can make Oil more affordable and vice versa.
The weekly Oil inventory reports published by the American Petroleum Institute (API) and the Energy Information Agency (EIA) impact the price of WTI Oil. Changes in inventories reflect fluctuating supply and demand. If the data shows a drop in inventories it can indicate increased demand, pushing up Oil price. Higher inventories can reflect increased supply, pushing down prices. API’s report is published every Tuesday and EIA’s the day after. Their results are usually similar, falling within 1% of each other 75% of the time. The EIA data is considered more reliable, since it is a government agency.
OPEC (Organization of the Petroleum Exporting Countries) is a group of 13 Oil-producing nations who collectively decide production quotas for member countries at twice-yearly meetings. Their decisions often impact WTI Oil prices. When OPEC decides to lower quotas, it can tighten supply, pushing up Oil prices. When OPEC increases production, it has the opposite effect. OPEC+ refers to an expanded group that includes ten extra non-OPEC members, the most notable of which is Russia.
- NZD/JPY remains stable at 97.60, as the pair starts consolidating.
- The 20-day SMA at 96.30 offers considerable support against a potential correction.
- Despite the consolidation phase, the bullish outlook persists, eyeing the next key resistance at 98.00.
On Tuesday, the NZD/JPY cross appeared to have entered a consolidation phase, retaining its footing at the fresh high of 97.80. Flaunting its resilience, the pair maintained its strong support at the 20-day Simple Moving Average (SMA) of 96.30, while hovering at high levels not witnessed since July 2007. The bullish outlook remains undisputed, despite the necessity for a healthy correction to address the overbought conditions.
The daily Relative Strength Index (RSI) currently stands at 66, a decline from Monday's 68, hinting at an impending downtrend. However, it remains within a positive territory devoid of extreme conditions. Meanwhile, the Moving Average Convergence Divergence (MACD) prints flat red bars which implies diminishing buying pressure as a shift towards a potential consolidation or correction phase.
NZD/JPY daily chart
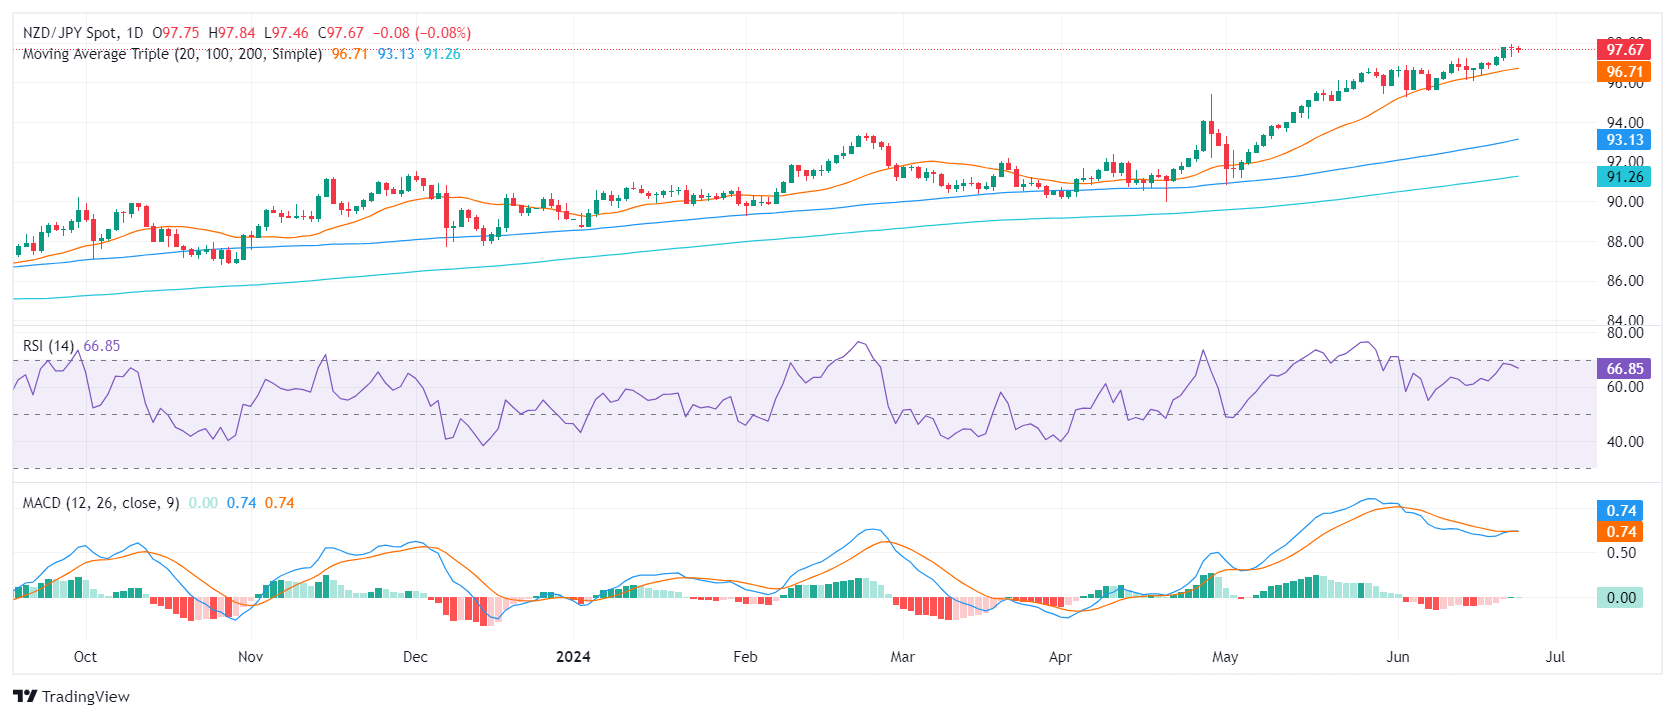
The steady grip of bulls above the 20-day SMA illustrates their strength, coupled with the technical indicators nearing overbought status, this further cements the positive technical outlook of the Kiwi against the Yen. However, overbought conditions necessitate a healthy correction or consolidation to ensure sustained upward momentum.
As investors anticipate subsequent trading sessions, the focus is on the immediate support at 97.00 and the resistance target at 98.00. A sustained break above the consolidation range could validate further upside while slipping below the 20-day SMA could indicate a deeper correction.
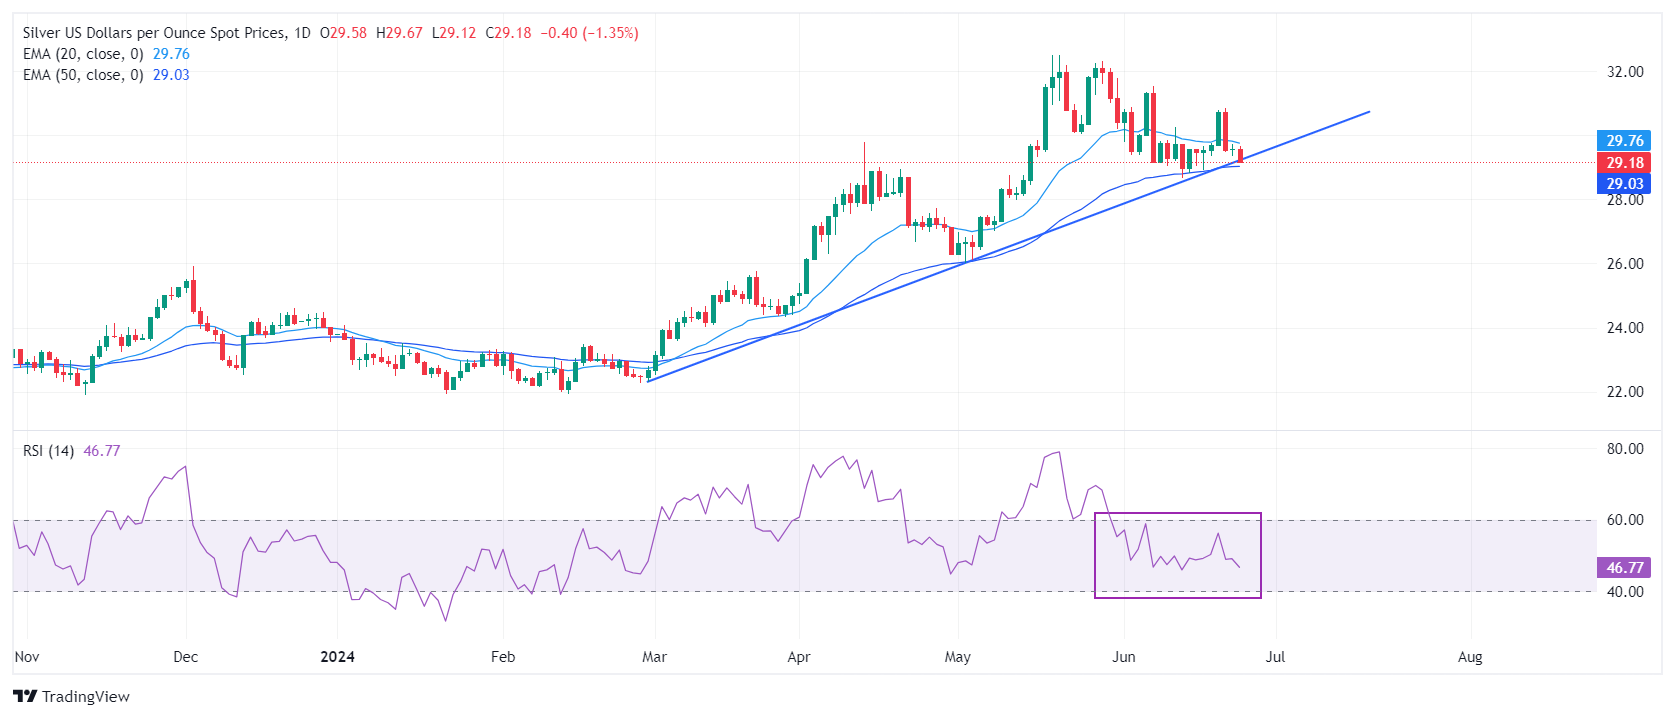
- Silver drops to $28.90, under 50-day MA, after Fed's Bowman's hawkish remarks.
- Bearish pattern evident, with RSI suggesting further downside.
- Support levels: $28.74 (May 18 high), $28.28 (June 10 high), $28.00, $26.82 (100-DMA).
- Resistance points: $29.16 (50-DMA), $31.54 (June 7 high), $32.00, $32.51 (YTD high).
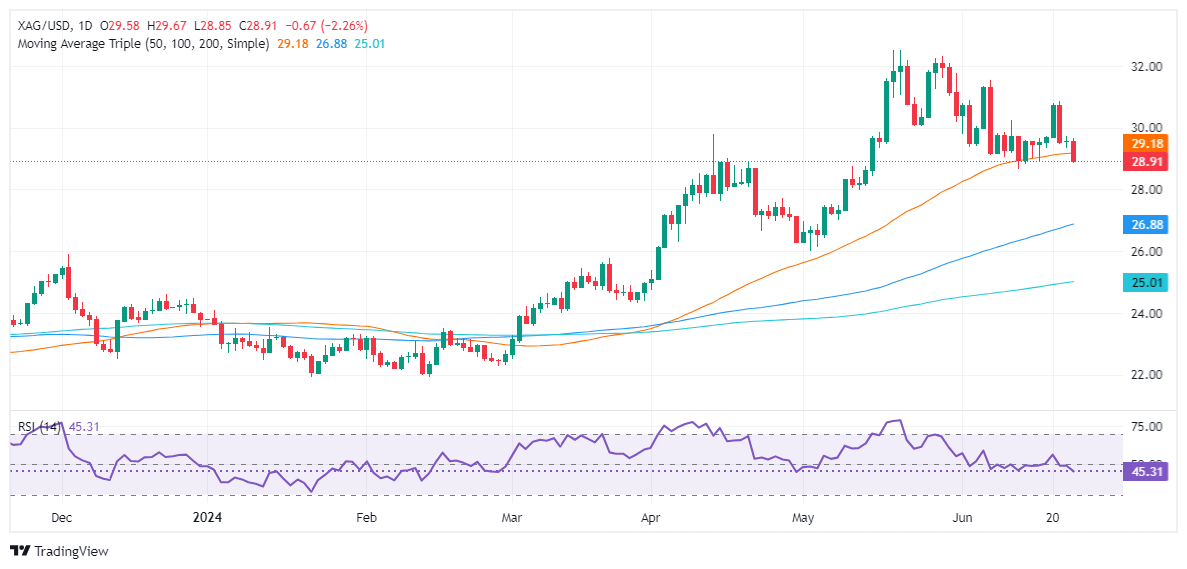
Silver price collapsed on Tuesday amid a strong US Dollar, sponsored by hawkish comments by Fed Governor Michelle Bowman. Although US Treasury yields were unchanged, the Greenback registered moderate gains, which weighed on the grey metal. The XAG/USD trades at $28.90, below its 50-day moving average (DMA) for the first time since March 1.
XAG/USD Price Analysis: Technical outlook
The grey metal formed a ‘bearish engulfing’ chart pattern last week, which opened the door for further downside. Momentum favors sellers, as shown by the Relative Strength Index (RSI), which stands bearish. This suggests that Silver could extend its losses.
Hence, the XAG/USD's first support would be the May 18, 2021, high turned support at $28.74, ahead of challenging June 10, 2021, high at $28.28. Key support levels lie underneath, like the $28.00 figure, followed by the 100-DMA at $26.82.
Conversely, if XAG/USD resumes its uptrend, the next resistance level would be the 50-day moving average (DMA) at $29.16. Once surpassed, the next stop is the June 7 high of $31.54. Clearing this level would target $32.00 before challenging the year-to-date (YTD) high of $32.51.
XAG/USD Price Action – Daily Chart
- NZD/USD moved sideways with mild losses while pair remains under the 20-day SMA.
- The Kiwi's outlook continues to skew bearish in the short term while the 100 and 200-day SMAs converge at 0.6070 potentially brightening the broader picture.
- Despite the bearish sentiment, a break above 0.6150, the position of the 20-day SMA, would change direction.
On Tuesday, the NZD/USD continues to trade sideways with minor losses. Sellers have consolidated their stance and taken the pair under the 20-day Simple Moving Average (SMA). Despite this, the convergence of the 100 and 200-day SMAs at 0.6070 could paint a more optimistic picture if they complete a bullish crossover.
The Relative Strength Index (RSI) on the daily chart fell to 49, suggesting more bearishness. Still, despite the downward shift, the RSI remains near the neutral zone. The Moving Average Convergence Divergence (MACD) remains flat with red bars, showcasing a seller's market.
NZD/USD daily chart
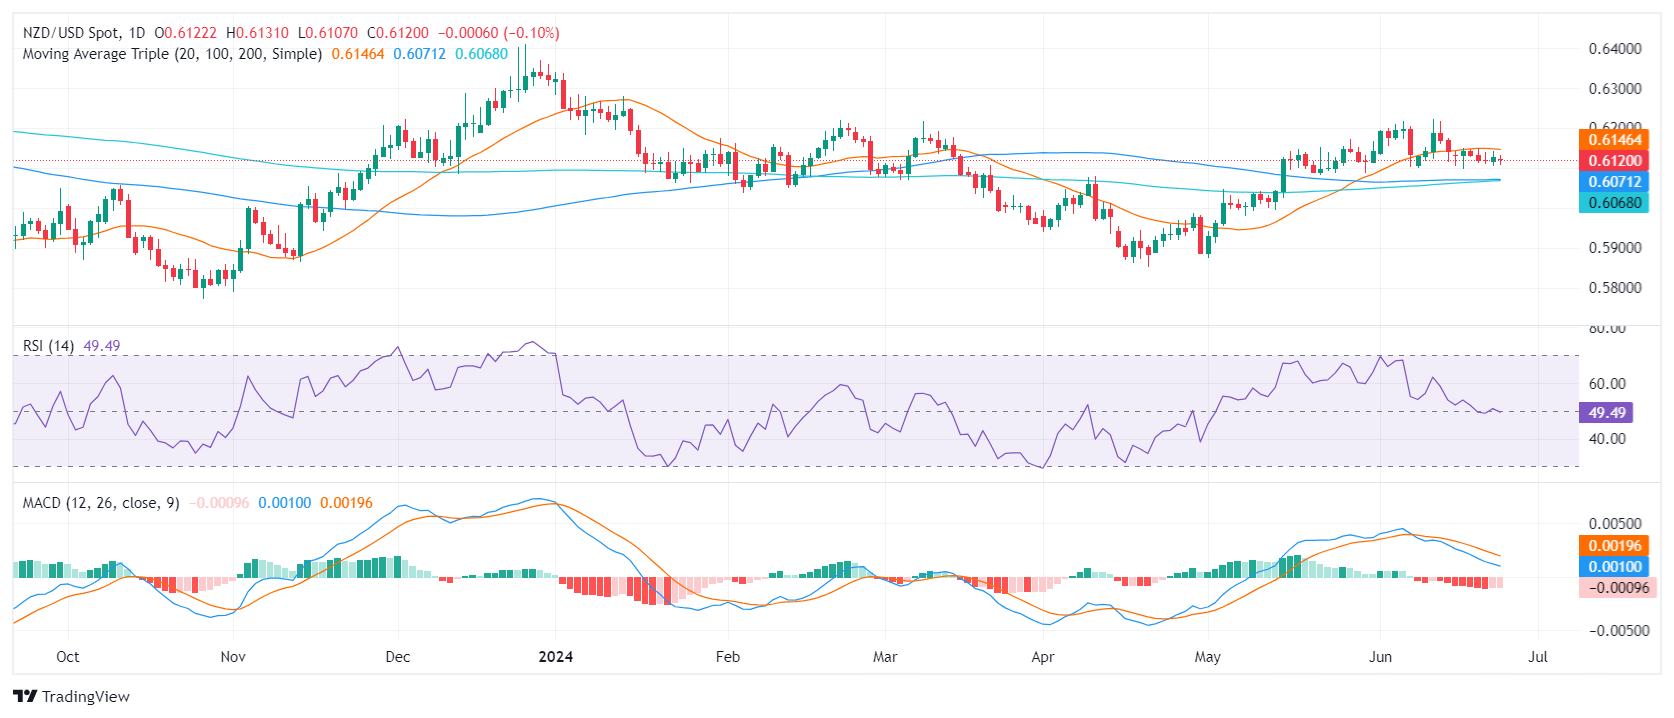
The NZD/USD finds immediate support near the 0.6100 level. Beneath that, additional support is available at the converging 100 and 200-day SMAs at 0.6070. If the pair continues its descent, these levels could provide a robust defense. A failure to hold these SMAs could signal a deepening of the sell-off scenario.
Conversely, resistance remains at the 20-day SMA at 0.6150, with additional resistance points at 0.6170 and 0.6200. A decisive breakout above these levels might indicate an end to the current bearish market sentiment and a shift in favor of the bulls.
- GBP/JPY chalks in a fresh multi-year high of 202.73 on Tuesday.
- Guppy on pace for a sixth straight month of gains.
- FX markets continue to sell off the Yen broadly.
GBP/JPY continues its march higher as the Japanese Yen slumps across the board. Buried beneath irreversible market flows, the Bank of Japan (BoJ) remains stubbornly planted in a hyper-easy monetary policy stance. Attempts to verbally talk the Yen back up, up to and including veiled threats of direct market intervention, have done little to stem the tide of short pressure built up in JPY markets.
A quiet early—to mid-week economic calendar leaves the Guppy churning on thin market flows. The back half of the trading week promises a more impactful schedule, with Japanese inflation and UK Gross Domestic Product (GDP) figures on the agenda.
Japanese Large Retail Sales will kick off the Guppy’s late-week release schedule early Thursday. Japanese Retail Trade is expected to print a slight decline to 2.0% from 2.4% for the year ended in May. The Bank of England’s (BoE) latest Financial Stability Report will also be released on Thursday.
Friday will round out the week with Japan’s latest Tokyo Consumer Price Index (CPI) inflation, followed by the UK’s first-quarter GDP revision which is expected to hold steady at 0.6%.
GBP/JPY technical outlook
The Guppy ticked into a fresh 16-year high on Tuesday, clipping 202.73. The pair is on pace to close flat or higher for the seventh consecutive trading day, and GBP/JPY has risen over 6% from mid-May.
GBP/JPY has traded well north of the 200-day Exponential Moving Average (EMA) at 198.86, rising nearly 13.5% bottom-to-top in 2024. The Guppy has closed flat or in the green for all but six of the last 25 consecutive trading weeks, and markets will be on the lookout for any signs of structural intervention from the BoJ as GBP/JPY continues the march to 204.00.
GBP/JPY daily chart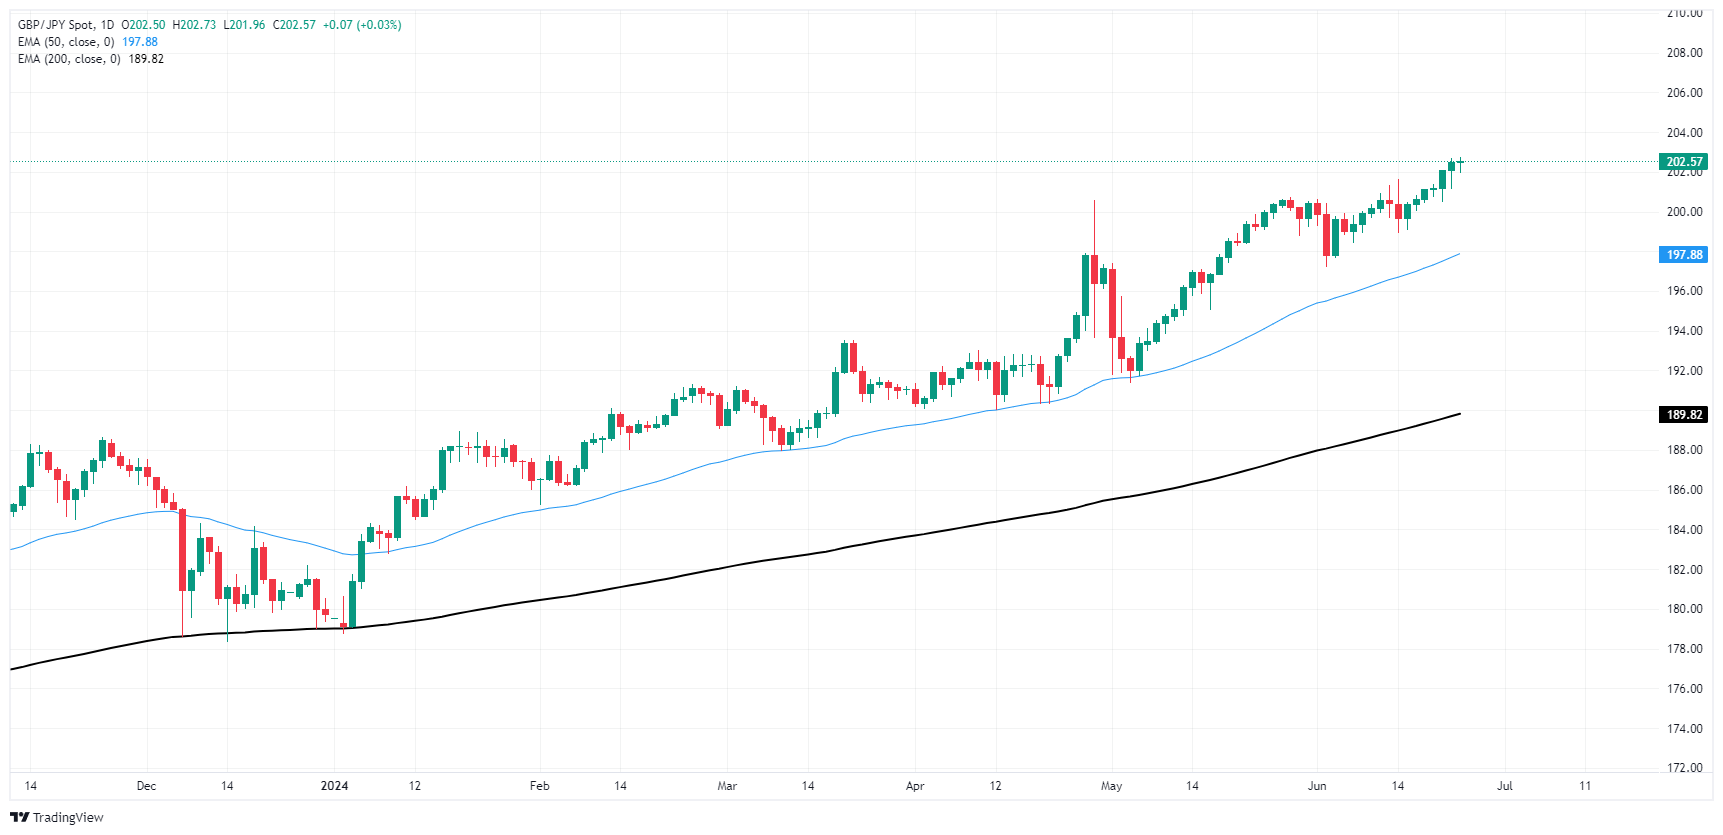
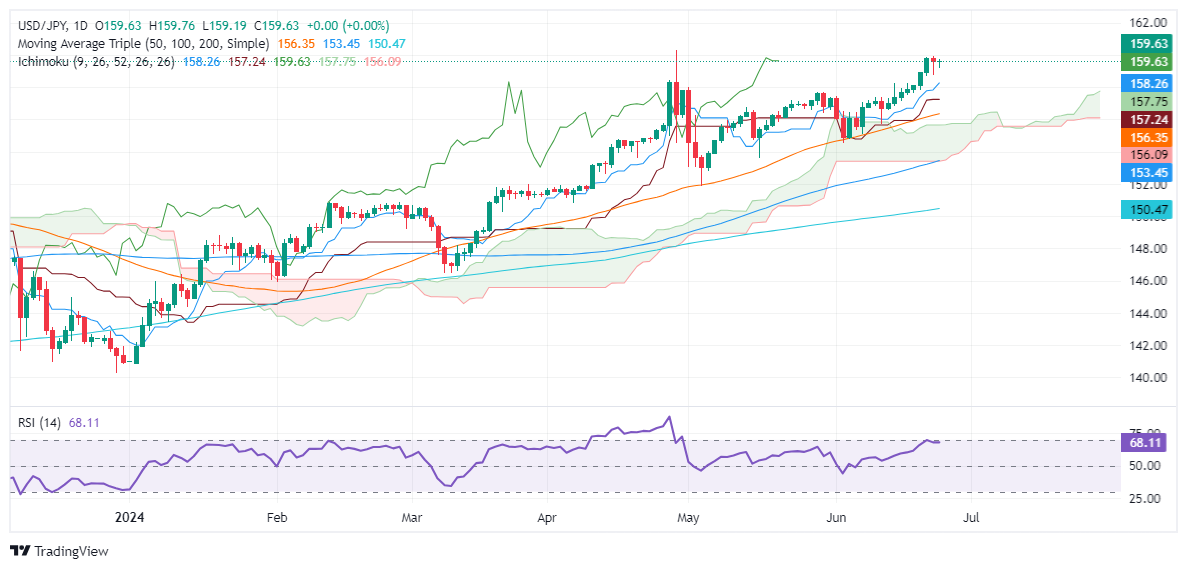
- USD/JPY remains flat as US Treasury yields tumble.
- Technical outlook shows upward bias with bullish RSI, but risks persist due to potential Japanese intervention.
- Key resistance levels: psychological 160.00 mark, YTD high at 160.32, further gains at 160.50 and 161.00.
- Key support levels: day's low at 158.75, Tenkan-Sen at 157.82, Senkou Span A at 157.53, and Kijun-Sen at 157.24.
The USD/JPY is flat late in the North American session as US Treasury yields fell. Intervention threats by Japanese authorities refrained traders from pushing the exchange rate above 160.00. At the time of writing, the pair trades at 159.62, unchanged.
USD/JPY Price Analysis: Technical outlook
The USD/JPY is upward biased after climbing above the 159.00 figure, spurring fears that Japanese authorities or the Bank of Japan (BoJ) might intervene in the FX markets.
Momentum favors buyers, with the Relative Strength Index (RSI) remaining bullish, but downward risks persist. If USD/JPY clears the psychological 160.00 mark, the next resistance level would be the year-to-date (YTD) high of 160.32. Further gains are anticipated above 160.50 and at 161.00.
Conversely, if USD/JPY drops below the day's low of 158.75, it could pave the way for testing key support levels. The next support would be the Tenkan-Sen at 157.82, followed by the Senkou Span A at 157.53, and then the Kijun-Sen at 157.24.
USD/JPY Price Action – Daily Chart
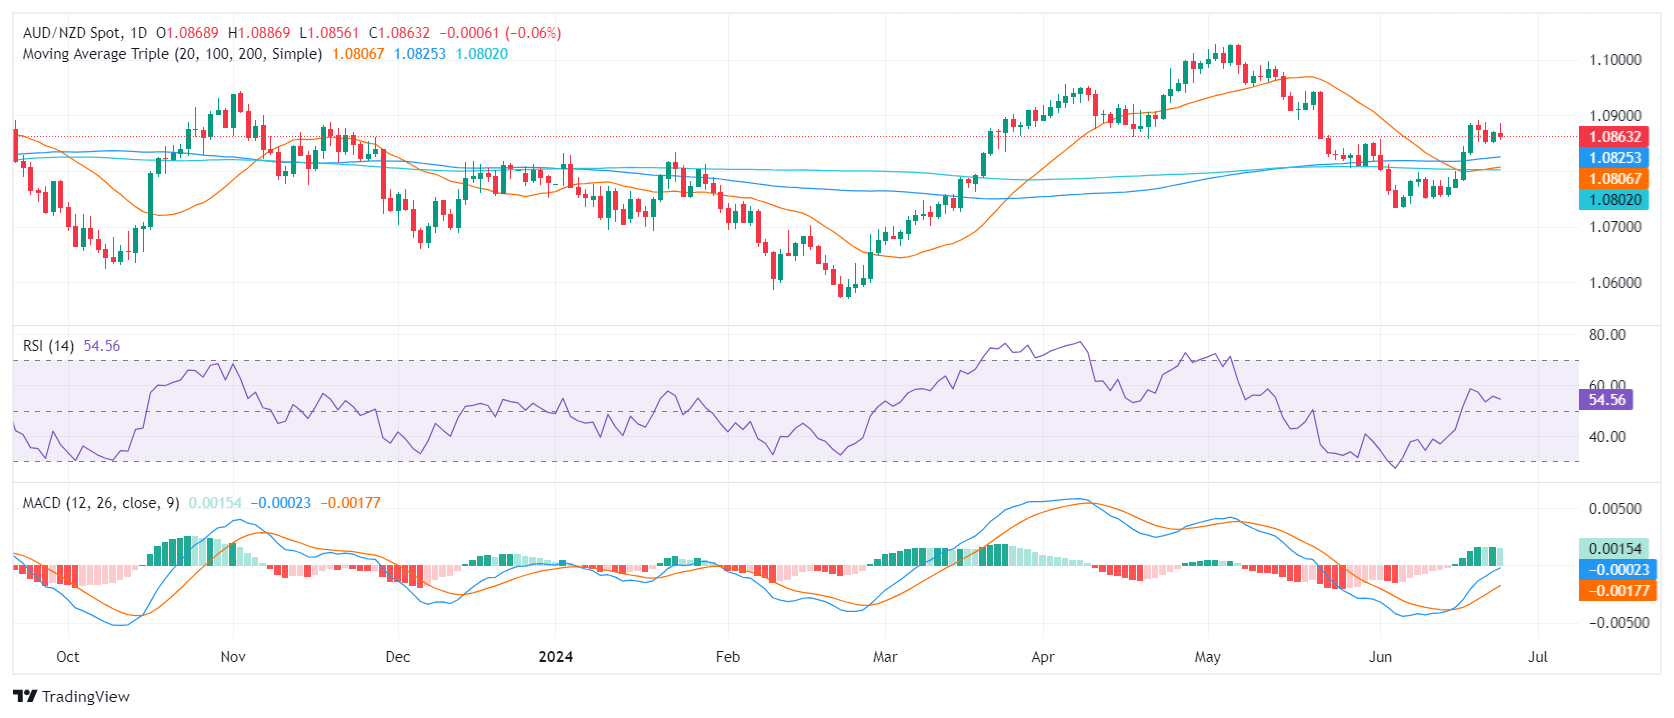
- Sellers take control of AUD/NZD, pushing the pair to 1.0860 and clearing the recent gains.
- New Zealand is set to release June ANZ consumer and business surveys on Wednesday, with keen attention from the market.
- CPI data from Australia due this Wednesday, continues to reveal Australia's direction.
The AUD/NZD sellers stepped in on Tuesday, wiping all the daily gains and pushing the cross to 1.0860. The Reserve Bank of Australia (RBA) and the Reserve Bank of New Zealand (RBNZ) moves are keenly awaited by investors, who await guidance.
In New Zealand, eyes are on the June ANZ consumer and business surveys to be released this Wednesday. The RBNZ plans its first rate cut for Q3 2025, which contradicts the market's expectations of a cut in November but incoming data will dictate the pace of the bets. In case New Zealand’s economy sees more signs of weakness the bank might consider sooner cuts.
In Australia, the Westpac Consumer Confidence data drew attention with a 1.7% rise to 83.6 in June from 82.2 in May- marking the first increase since February. The key data for the week would, however, come through with the release of the May Consumer Price Index (CPI) on Wednesday.
The swaps market now sees less than 25% odds of a rate cut by December 2024, which intensifies to around 65% in February 2025. Despite the headline expectation to climb by two ticks to a five-month peak at 3.8% year on year, the RBA remains patient, expecting a considerable period before inflation sustainably sits within the 2-3% target range. The outcome of inflation figures might see significant volatility in the Aussie’s price dynamics.
AUD/NZD technical analysis
In the near term, the technical outlook for AUD/NZD appears positive, despite indicators flattening and hinting at a potential consolidation of the recent 0.80% gains achieved last week. This is supported by the cross maintaining its position above the 20, 100, and 200-day Simple Moving Averages (SMAs). Furthermore, the 20-day SMA completed a bullish crossover with the 100-day SMA which reinforces the positive outlook.
AUD/NZD daily chart
- Gold falls 0.59%, pressured by a recovering US Dollar and rising Treasury yields.
- Golden metal was pressured by Fed Governor Michelle Bowman's hawkish remarks.
- Fed’s Lisa Cook is neutral, forecasting a sharp inflation decline next year.
- US Conference Board indicates declining consumer optimism, with diminished expectations for future income and business conditions.
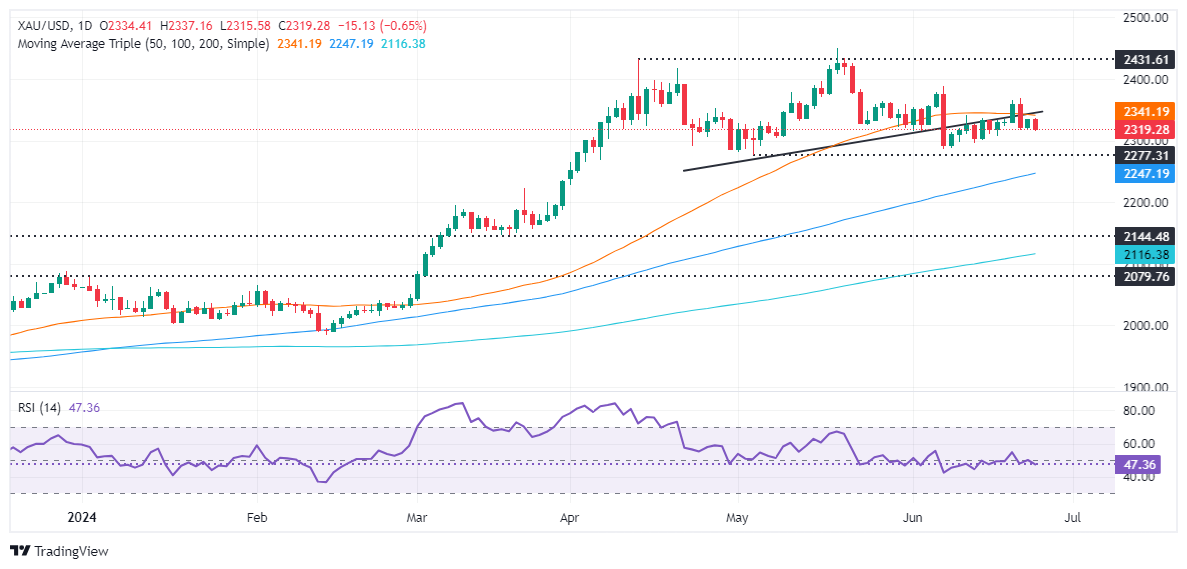
Gold price tumbled after reaching a weekly high of $2,334 and fell as the Greenback staged a recovery underpinned by a minimal rise in US Treasury bond yields, spurred by Federal Reserve (Fed) Governor Michelle Bowman's hawkish comments. The XAU/USD trades at $2,319, down 0.59%.
Bowman emphasized that monetary policy should remain steady for “some time” and would probably be enough to bring inflation down. She disregarded rate cuts this year and stated she’s willing to raise rates “should progress on inflation stall or even reverse.”
Recently, her colleague Lisa Cook adopted a more neutral stance, saying that inflation was most likely to fall “sharply” next year, adding that it would be necessary to ease policy to keep the Fed’s dual mandate more balanced.
Regarding economic data, the US Conference Board revealed that consumers are becoming less optimistic. According to the survey, consumers' views of the current situation improved; nevertheless, “their expectations for both future income and business conditions weakened, weighing down the overall Expectations Index.”
In the meantime, traders are awaiting the release of the Fed’s preferred gauge for inflation, the Personal Consumption Expenditures (PCE) Price Index. If the data edges below the previous reading and estimates, it will reignite rate cut hopes for the year ahead.
Daily digest market movers: Gold price extends its losses on strong US Dollar
- US Dollar Index (DXY), which tracks the value of American currency against a basket of six other currencies, gained 0.13% to 105.61. In the meantime, US 10-year Treasury note yield shifted flat at 4.242%.
- On Monday, San Francisco Fed President Mary Daly leaned dovish as she said, “At this point, inflation is not the only risk we face,” she expressed worries about the labor market.
- Conference Board (CB) revealed that Consumer Confidence in June was 100.4, exceeding expectations, but missed May’s 101.3 rise.
- Headline PCE is expected to drop from 2.7% to 2.6% in yearly readings. Core is foreseen dipping from 2.8% to 2.6%.
- According to the CME FedWatch Tool, odds for a 25-basis-point Fed rate cut are at 59.5%, down from 61.1% last Monday.
- The December 2024 fed funds rate futures contract implies the Fed will ease policy by just 36 basis points (bps) toward the end of the year.
Technical analysis: Gold price retreats after testing Head-and-Shoulders neckline near $2,330
Gold price remains downwardly biased after forming a ‘bearish-engulfing’ chart pattern on Friday. This further validates the Head-and-Shoulders chart pattern, meaning that further downside is expected for the non-yielding metal.
The XAU/USD next support would be $2,300. Once cleared, XAU/USD would fall to $2,277, the May 3 low, followed by the March 21 high of $2,222. Further losses lie underneath, with sellers eyeing the Head-and-Shoulders chart pattern objective from $2,170 to $2,160.
Conversely, if Gold reclaims $2,350, that will expose additional key resistance levels like the June 7 cycle high of $2,387, ahead of challenging the $2,400 figure.
Gold FAQs
Gold has played a key role in human’s history as it has been widely used as a store of value and medium of exchange. Currently, apart from its shine and usage for jewelry, the precious metal is widely seen as a safe-haven asset, meaning that it is considered a good investment during turbulent times. Gold is also widely seen as a hedge against inflation and against depreciating currencies as it doesn’t rely on any specific issuer or government.
Central banks are the biggest Gold holders. In their aim to support their currencies in turbulent times, central banks tend to diversify their reserves and buy Gold to improve the perceived strength of the economy and the currency. High Gold reserves can be a source of trust for a country’s solvency. Central banks added 1,136 tonnes of Gold worth around $70 billion to their reserves in 2022, according to data from the World Gold Council. This is the highest yearly purchase since records began. Central banks from emerging economies such as China, India and Turkey are quickly increasing their Gold reserves.
Gold has an inverse correlation with the US Dollar and US Treasuries, which are both major reserve and safe-haven assets. When the Dollar depreciates, Gold tends to rise, enabling investors and central banks to diversify their assets in turbulent times. Gold is also inversely correlated with risk assets. A rally in the stock market tends to weaken Gold price, while sell-offs in riskier markets tend to favor the precious metal.
The price can move due to a wide range of factors. Geopolitical instability or fears of a deep recession can quickly make Gold price escalate due to its safe-haven status. As a yield-less asset, Gold tends to rise with lower interest rates, while higher cost of money usually weighs down on the yellow metal. Still, most moves depend on how the US Dollar (USD) behaves as the asset is priced in dollars (XAU/USD). A strong Dollar tends to keep the price of Gold controlled, whereas a weaker Dollar is likely to push Gold prices up.
- Australian Dollar’s downside is supported by hawkish RBA outlook.
- Markets now hint at rate cuts not before February 2025.
- Upcoming May CPI figures will be pivotal for markets to anticipate next RBA moves.
Tuesday's session observed a decline in the Australian Dollar (AUD) as it slipped down to the 0.6650 mark against the US Dollar, edging close to the 20-day Simple Moving Average (SMA) at 0.6640. The upcoming Australian inflation data remains in the spotlight, expected to shape future RBA moves. Low-tier data reported during the Asian sessions didn't significantly affect the Aussie's standing.
In Australia, despite signs of an ailing economy, the persistently high inflation acts as a roadblock to the Reserve Bank of Australia's (RBA) possible rate cuts, potentially limiting the downside pressure on the Aussie.
Daily digest market movers: Aussie sees red ahead of CPI figures
- In June, the Westpac Melbourne Institute Consumer Confidence index in Australia saw an increase of 1.7%, reaching 83.6 compared to 82.2 in May and marked the first rise since February.
- Despite this uptick, consumer sentiment remains significantly pessimistic, with the index still far below the neutral level of 100.
- Markets are poised for Wednesday's release of the May Consumer Price Index (CPI) data, anticipating potential changes to guide the RBA's forthcoming decisions.
- Swaps market has reset its odds to less than a 25% chance of a rate cut by December 2024, rising to around 65% probability by February 2025, indicating the RBA's steadfast approach to tackling inflation.
- Last week, Governor Bullock introduced a new stance, affirming the RBA "will do what is necessary" to bring inflation back to target. Consequently, with the RBA ruling out rate cuts, the downside on the Aussie is set to remain constrained.
Technical analysis: AUD/USD faces pullback, buyers aim to guard 20-day SMA
From a technical standpoint, adjustments in the indicators are noted. The Relative Strength Index (RSI) continues to stay above 50 but indicates a downtrend.
Similarly, the Moving Average Convergence Divergence (MACD) persists in the negative sphere with a sequence of red bars. Upcoming sessions are contingent on the buyers upholding the AUD/USD above the 20-day Simple Moving Average (SMA), a line of defense with the potential to set a promising momentum for the pair's future outlook.
Australian Dollar FAQs
One of the most significant factors for the Australian Dollar (AUD) is the level of interest rates set by the Reserve Bank of Australia (RBA). Because Australia is a resource-rich country another key driver is the price of its biggest export, Iron Ore. The health of the Chinese economy, its largest trading partner, is a factor, as well as inflation in Australia, its growth rate and Trade Balance. Market sentiment – whether investors are taking on more risky assets (risk-on) or seeking safe-havens (risk-off) – is also a factor, with risk-on positive for AUD.
The Reserve Bank of Australia (RBA) influences the Australian Dollar (AUD) by setting the level of interest rates that Australian banks can lend to each other. This influences the level of interest rates in the economy as a whole. The main goal of the RBA is to maintain a stable inflation rate of 2-3% by adjusting interest rates up or down. Relatively high interest rates compared to other major central banks support the AUD, and the opposite for relatively low. The RBA can also use quantitative easing and tightening to influence credit conditions, with the former AUD-negative and the latter AUD-positive.
China is Australia’s largest trading partner so the health of the Chinese economy is a major influence on the value of the Australian Dollar (AUD). When the Chinese economy is doing well it purchases more raw materials, goods and services from Australia, lifting demand for the AUD, and pushing up its value. The opposite is the case when the Chinese economy is not growing as fast as expected. Positive or negative surprises in Chinese growth data, therefore, often have a direct impact on the Australian Dollar and its pairs.
Iron Ore is Australia’s largest export, accounting for $118 billion a year according to data from 2021, with China as its primary destination. The price of Iron Ore, therefore, can be a driver of the Australian Dollar. Generally, if the price of Iron Ore rises, AUD also goes up, as aggregate demand for the currency increases. The opposite is the case if the price of Iron Ore falls. Higher Iron Ore prices also tend to result in a greater likelihood of a positive Trade Balance for Australia, which is also positive of the AUD.
The Trade Balance, which is the difference between what a country earns from its exports versus what it pays for its imports, is another factor that can influence the value of the Australian Dollar. If Australia produces highly sought after exports, then its currency will gain in value purely from the surplus demand created from foreign buyers seeking to purchase its exports versus what it spends to purchase imports. Therefore, a positive net Trade Balance strengthens the AUD, with the opposite effect if the Trade Balance is negative.
- Dow Jones backslides as other indexes gain ground.
- DJIA gets dragged down by steep declines in large caps.
- US data softened slightly on Tuesday, but not enough to appease rate cut hopes.
The Dow Jones Industrial Average (DJIA) shed weight on Tuesday, declining around 300 points as heavy-hitters like Home Depot Inc. (HD) and Walmart Inc. (WMT) dragged the large-industry index into the red. US equities are gaining ground in a lop-sided index performance, with losses concentrated in key securities on the Dow Jones.
The CB Consumer Confidence survey index declined to 100.4 in June, down from the previous print of 102.0 but falling just short of the expected decline to 100.0. The Richmond Fed’s Manufacturing Index dropped sharply to -10.0 in June, far below the forecast increase to 2.0 from the previous 0.0.
Financial markets broadly hopeful for softly-weakening economic figures from the US will be pivoting to watch for US Durable Goods, Gross Domestic Product (GDP), and Personal Consumption Expenditure Price Index (PCE) inflation figures all slated for release in the back half of the trading week beginning on Thursday. Tuesday’s mid-tier releases weren’t enough to spark firm market flows in either direction.
According to the CME’s FedWatch Tool, rate markets continue to price in around 66% odds of at least a quarter-point rate cut from the Federal Reserve (Fed) in September. Rate-cut-hungry investors are running out of room to hope that a downturn in US economic figures will spark an early rate cut from the Federal Open Market Committee (FOMC), while a too-sharp drop in US economic activity could spark a broad risk-off flight into safe havens like the US Dollar. On the other hand, a resurgence in US economic activity would likewise spoil investor sentiment, as rate cut hopes hinge on a slow trudge into a soft-landing recession within the US’ domestic economy.
Dow Jones news
The Dow Jones is getting dragged lower by downside in key securities on Tuesday. The DJIA is broadly in the red for the day, with only a third of the index’s securities in the green, but steep losses are concentrated in key stocks. Home Depot Inc. (HD) tumbled around 4% to $337.70 per share, followed by Walmart Inc. (WMT) which shed 2.78% and fell below $67.00 per share. Boeing Co. (BA) and Nike Inc. (NKE) were close behind, backsliding around 2.33% apiece to $53.35 and $95.11 per share, respectively.
Tuesday gainers remain notably thin, with Amazon.com Inc. (AMZN) and Apple Inc. (AAPL) climbing a little over 1% each. Amazon gained ground to $187.64 per share while Apple crossed above $210.00 per share after Monday’s decline below $208.00.
Dow Jones technical outlook
The Dow Jones is on pace to close firmly lower on Tuesday in the index’s worst single-day performance since late May as the index slumps three-quarters of one percent on the day. An intraday recovery is seeing limited effect, but is dragging Tuesday’s bids back up from the day’s bottom at 38,982.37.
Daily candlesticks continue to grind out chart paper just north of the 50-day Exponential Moving Average (EMA) at 38,864.49, with long-term technical support from the 200-day EMA at 37,455.71. Despite holding in bull country, the Dow Jones has struggled to make firm gains after a -5.15% backslide from all-time highs above 40,000.00 reached in mid-May.
Dow Jones five-minute chart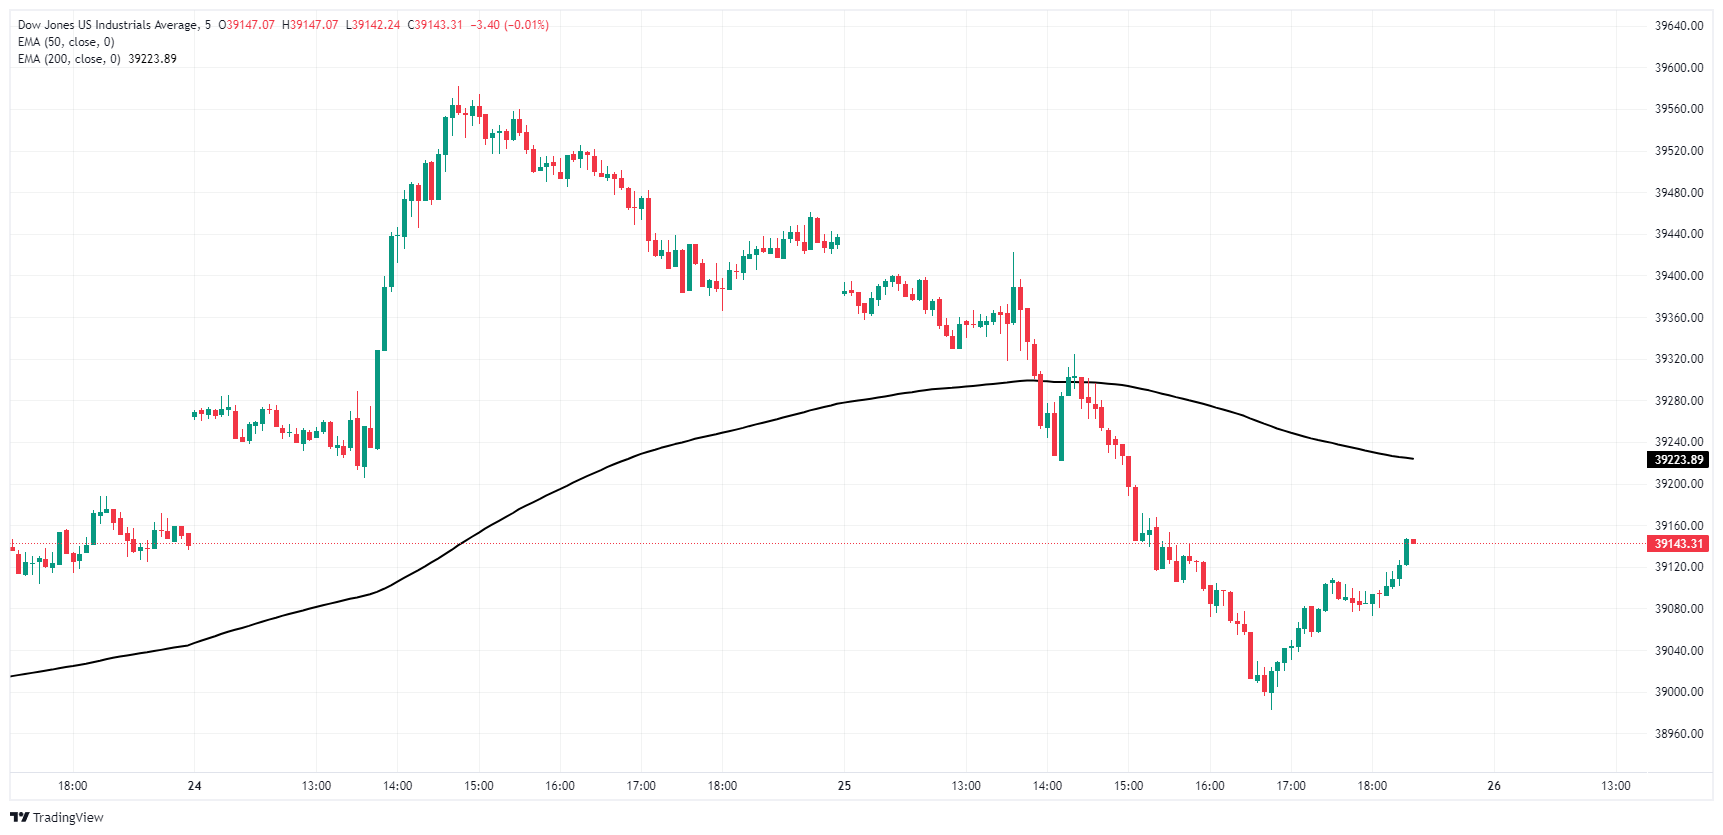
Dow Jones daily chart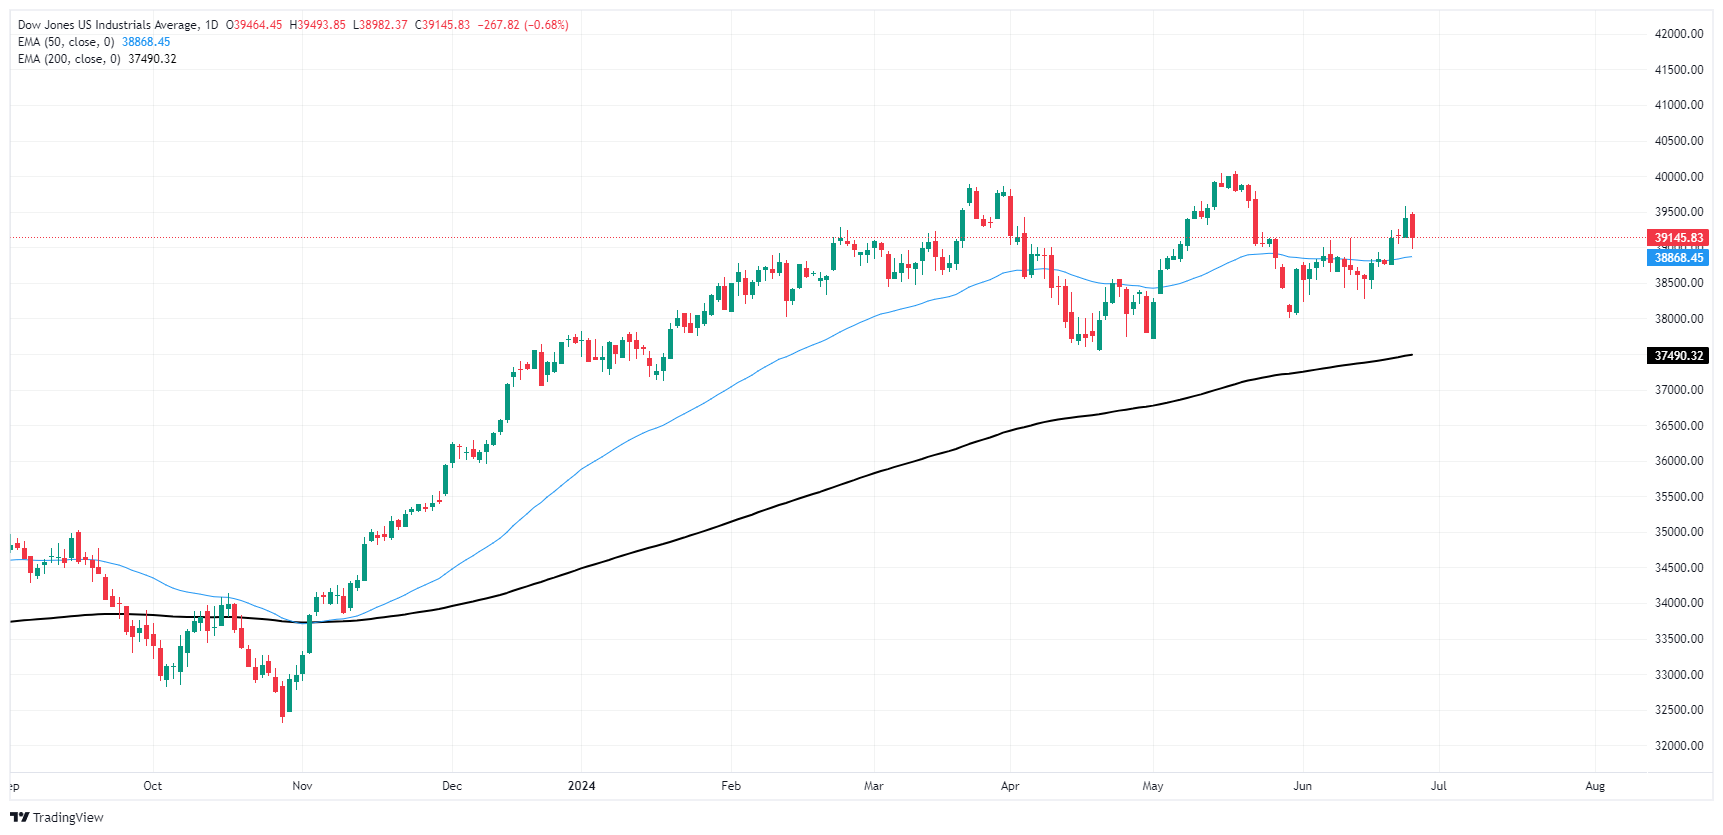
Economic Indicator
Durable Goods Orders
The Durable Goods Orders, released by the US Census Bureau, measures the cost of orders received by manufacturers for durable goods, which means goods planned to last for three years or more, such as motor vehicles and appliances. As those durable products often involve large investments they are sensitive to the US economic situation. The final figure shows the state of US production activity. Generally speaking, a high reading is bullish for the USD.
Read more.Next release: Thu Jun 27, 2024 12:30
Frequency: Monthly
Consensus: 0%
Previous: 0.7%
Source: US Census Bureau
The US Dollar recouped part of the ground lost following Monday’s negative session along with a decent bounce in US yields, while expectations for a Fed rate cut in September and December remained in place among investors.
Here is what you need to know on Wednesday, June 26:
The USD Index (DXY) left behind Monday’s pullback and rose to the 105.80 region, accompanied by a humble rebound in US yields, while disappointing Consumer Confidence readings propped up rate-cut bets. On June 26, MBA will report on the usual weekly Mortgage Applications ahead of New Home Sales.
EUR/USD resumed its downward impulse and revisited the sub-1.0700 region against the backdrop of a decent move higher in the Greenback. Germany’s Consumer Confidence gauged by GfK will be unveiled on June 26 along with a speech by the ECB’s P. Lane.
GBP/USD alternated gains with losses after an unsuccessful attempt to surpass the 1.2700 barrier. The CBI Distributive Trades are only due on June 26 across the Channel.
USD/JPY traded just below the 160.00 level amidst persistent concerns surrounding the likelihood of FX intervention. The Japanese docket will be empty on June 26.
AUD/USD set aside Monday’s bull run and revisited the 0.6630–0.6640 band amidst the US Dollar’s gains. In Oz, Westpac’s Leading Index is due on June 26, prior to the RBA’s Monthly CPI Indicator and the speech by the RBA’s L. Kent.
WTI prices corrected slightly lower after hitting new monthly highs just below the $82.00 mark per barrel ahead of key US inventories data.
The stronger Dollar and higher US yields played against the continuation of Monday’s advance in Gold prices, which hovered around the $2,320 zone. Silver added to the ongoing weakness and dropped to multi-day lows, breaking below the key $29.00 mark per ounce.
- Canadian Dollar whipsaws against Greenback on CPI Tuesday.
- Canada reported an upswing in CPI inflation in May.
- Additional focus to fall on July inflation print in the runup to BoC July rate call.
The Canadian Dollar climbed on Tuesday after Canadian Consumer Price Index (CPI) inflation ticked higher in May. Despite the upswing in CPI growth, the CAD whipsawed against the US Dollar during the American market session, setting a fresh 14-day high before settling back to flat on Tuesday.
Canada also printed an upward surge in the Bank of Canada’s (BoC) CPI Core reading in May. With CPI inflation snapping higher following the BoC’s recent rate cut, renewed focus will be put on June’s upcoming CPI print ahead of the Canadian central bank’s rate call slated for July 24.
Daily digest market movers: Canadian CPI upswing sends CAD higher
- Canadian CPI inflation rose to 2.9% YoY in May, erasing the forecasted downtick to 2.6% from the previous 2.7%.
- MoM CPI climbed to 0.6% in May, coming in well above the forecast 0.3% and accelerating from the previous 0.5%.
- BoC’s own CPI Core also rose to 0.6% MoM versus the forecast hold at 0.2%.
- A snap rise in Canadian inflation follows a recent quarter-point cut from the BoC, which could spark concerns that the Canadian central bank started cutting too early.
- US CB Consumer Confidence survey eased to 100.4 from 102.0, a slightly better print than the expected 100.0.
Canadian Dollar PRICE Today
The table below shows the percentage change of Canadian Dollar (CAD) against listed major currencies today. Canadian Dollar was the strongest against the Euro.
| USD | EUR | GBP | JPY | CAD | AUD | NZD | CHF | |
|---|---|---|---|---|---|---|---|---|
| USD | 0.27% | 0.06% | 0.08% | 0.06% | 0.28% | 0.20% | 0.21% | |
| EUR | -0.27% | -0.22% | -0.21% | -0.22% | 0.00% | -0.04% | -0.05% | |
| GBP | -0.06% | 0.22% | 0.00% | 0.00% | 0.23% | 0.19% | 0.16% | |
| JPY | -0.08% | 0.21% | 0.00% | -0.02% | 0.22% | 0.15% | 0.15% | |
| CAD | -0.06% | 0.22% | -0.01% | 0.02% | 0.21% | 0.18% | 0.16% | |
| AUD | -0.28% | 0.00% | -0.23% | -0.22% | -0.21% | -0.04% | -0.05% | |
| NZD | -0.20% | 0.04% | -0.19% | -0.15% | -0.18% | 0.04% | -0.02% | |
| CHF | -0.21% | 0.05% | -0.16% | -0.15% | -0.16% | 0.05% | 0.02% |
The heat map shows percentage changes of major currencies against each other. The base currency is picked from the left column, while the quote currency is picked from the top row. For example, if you pick the Canadian Dollar from the left column and move along the horizontal line to the US Dollar, the percentage change displayed in the box will represent CAD (base)/USD (quote).
Technical analysis: Canadian Dollar gains some ground amid churn, but gains remain tepid
The Canadian Dollar (CAD) briefly rose to a fresh two-week high against the US Dollar on Tuesday before falling back within the day’s opening range. The CAD also eked out gains against the Euro and the Australian Dollar, climbing around one-fifth of one percent against each.
USD/CAD tumbled to a new 14-day low of 1.3624 before snapping back to Tuesday’s opening bids near 1.3660. The pair is caught in near-term chart churn as bidders struggle to break through intraday technical resistance at 1.3680.
Despite grinding out a -1.2% decline top-to-bottom from early June’s peak at 1.3791, the CAD looks set to run out of gas against the US Dollar with USD/CAD finding a price floor near 1.3650. Daily candles continue to tread water in a consolidation pattern north of the 200-day Exponential Moving Average (EMA) at 1.3582.
USD/CAD hourly chart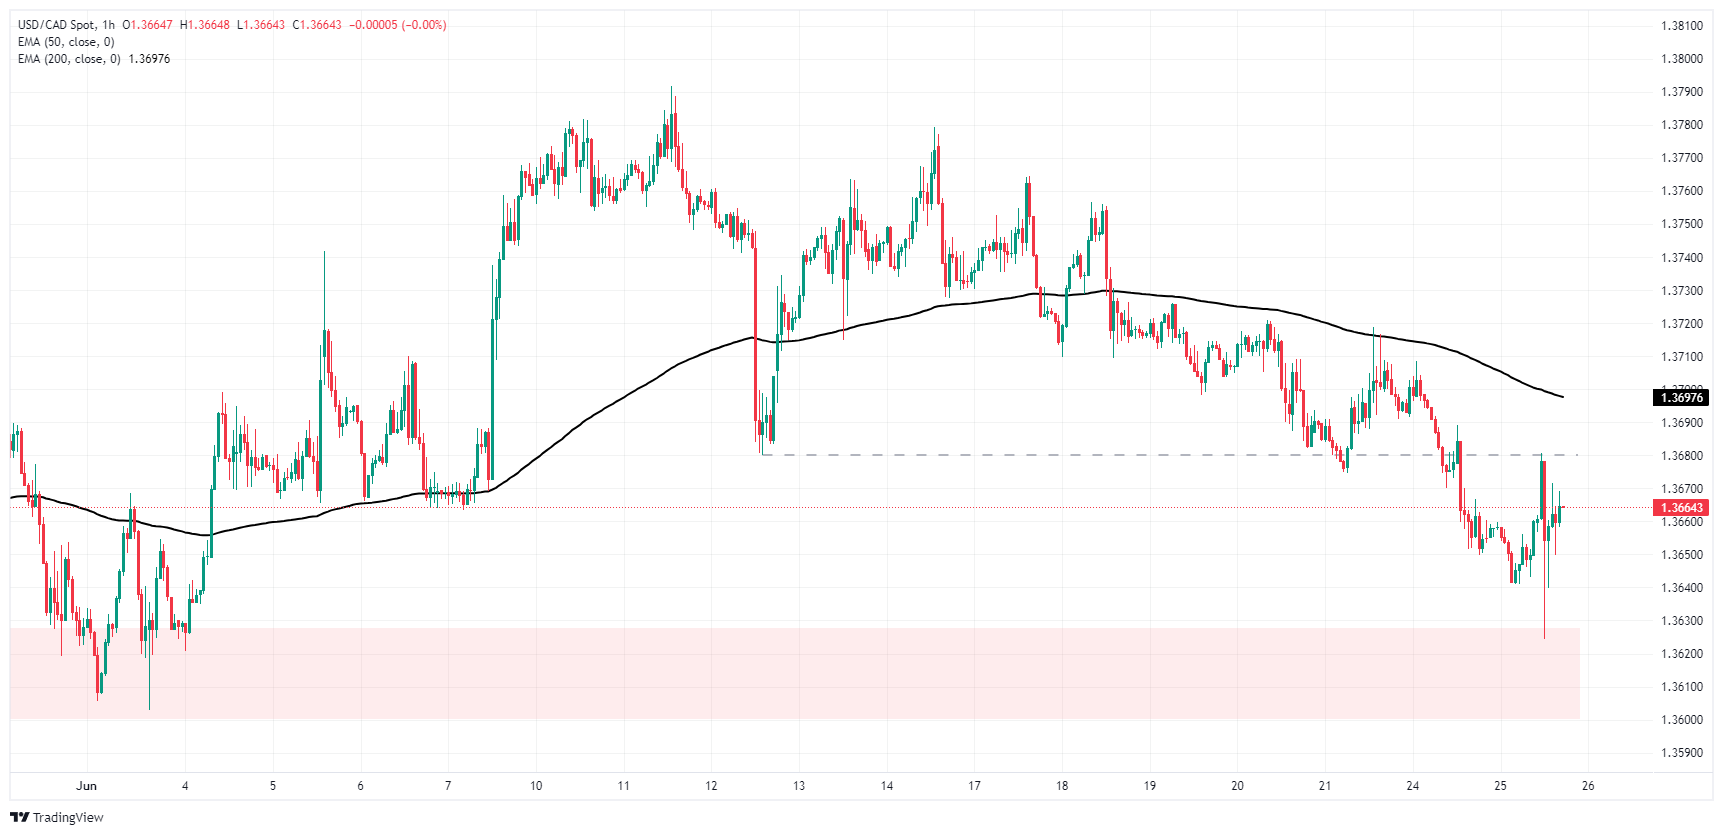
USD/CAD daily chart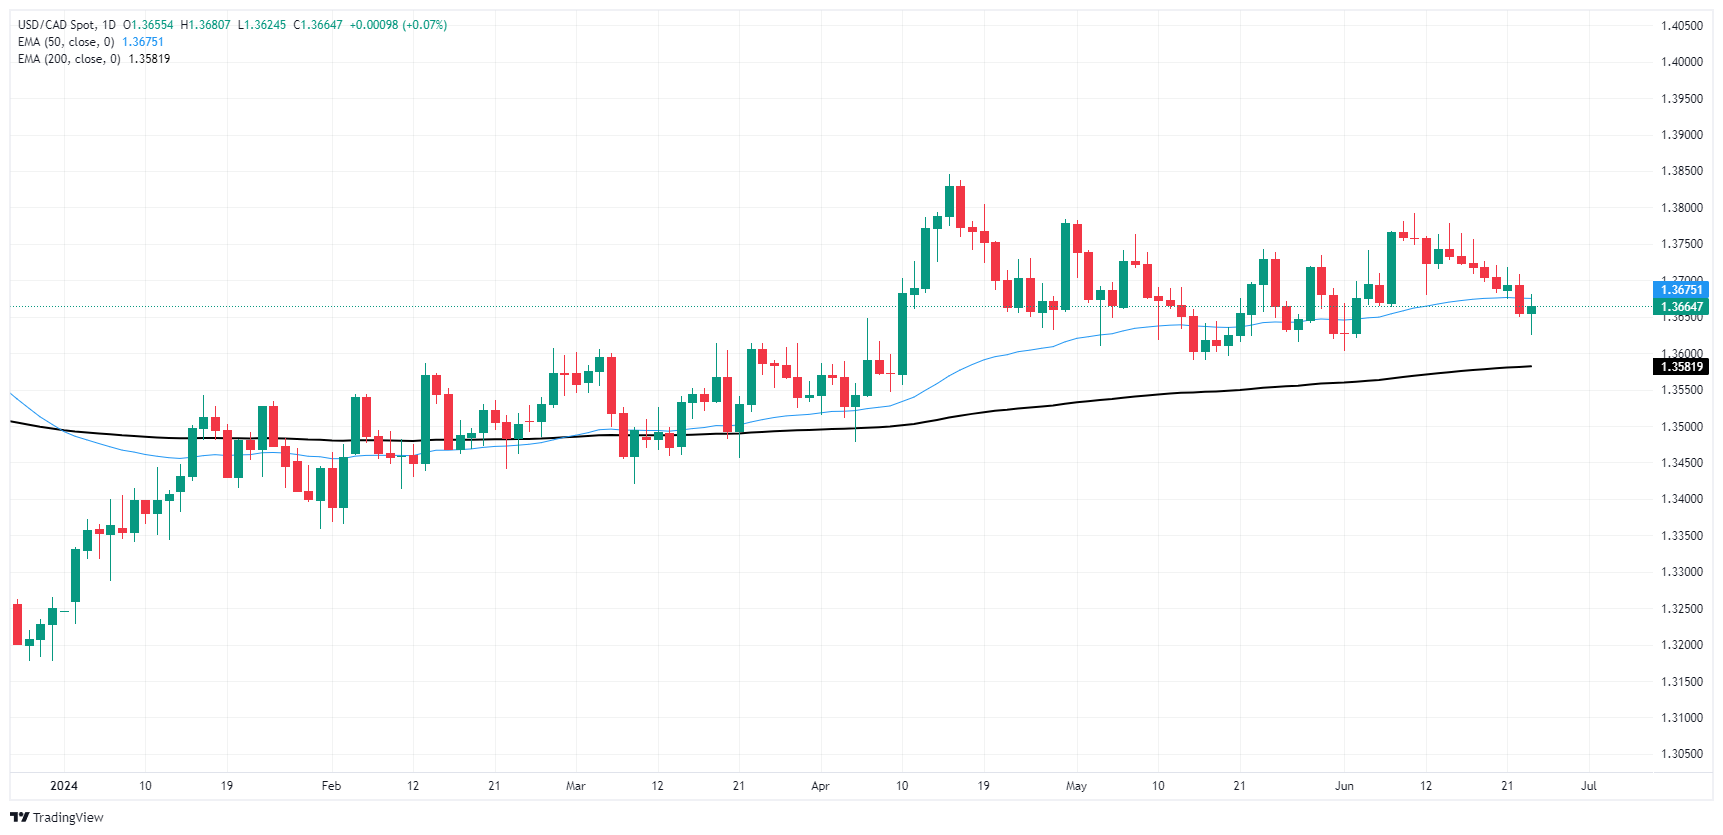
Canadian Dollar FAQs
The key factors driving the Canadian Dollar (CAD) are the level of interest rates set by the Bank of Canada (BoC), the price of Oil, Canada’s largest export, the health of its economy, inflation and the Trade Balance, which is the difference between the value of Canada’s exports versus its imports. Other factors include market sentiment – whether investors are taking on more risky assets (risk-on) or seeking safe-havens (risk-off) – with risk-on being CAD-positive. As its largest trading partner, the health of the US economy is also a key factor influencing the Canadian Dollar.
The Bank of Canada (BoC) has a significant influence on the Canadian Dollar by setting the level of interest rates that banks can lend to one another. This influences the level of interest rates for everyone. The main goal of the BoC is to maintain inflation at 1-3% by adjusting interest rates up or down. Relatively higher interest rates tend to be positive for the CAD. The Bank of Canada can also use quantitative easing and tightening to influence credit conditions, with the former CAD-negative and the latter CAD-positive.
The price of Oil is a key factor impacting the value of the Canadian Dollar. Petroleum is Canada’s biggest export, so Oil price tends to have an immediate impact on the CAD value. Generally, if Oil price rises CAD also goes up, as aggregate demand for the currency increases. The opposite is the case if the price of Oil falls. Higher Oil prices also tend to result in a greater likelihood of a positive Trade Balance, which is also supportive of the CAD.
While inflation had always traditionally been thought of as a negative factor for a currency since it lowers the value of money, the opposite has actually been the case in modern times with the relaxation of cross-border capital controls. Higher inflation tends to lead central banks to put up interest rates which attracts more capital inflows from global investors seeking a lucrative place to keep their money. This increases demand for the local currency, which in Canada’s case is the Canadian Dollar.
Macroeconomic data releases gauge the health of the economy and can have an impact on the Canadian Dollar. Indicators such as GDP, Manufacturing and Services PMIs, employment, and consumer sentiment surveys can all influence the direction of the CAD. A strong economy is good for the Canadian Dollar. Not only does it attract more foreign investment but it may encourage the Bank of Canada to put up interest rates, leading to a stronger currency. If economic data is weak, however, the CAD is likely to fall.
- Mexican Peso depreciates sharply with USD/MXN trading back above 18.00, gaining over 1%.
- Fed Governor Michelle Bowman’s comments on holding policy rates steady and willingness to raise rates pressure the Peso.
- Upcoming Banxico monetary policy decision on Thursday, with most economists expecting rates to remain unchanged at 11.00%.
The Mexican Peso depreciated sharply against the US dollar as Federal Reserve (Fed) Governor Michelle Bowman was hawkish compared to San Francisco Fed President Mary Daly, who was concerned about the labor market, stressing that the dual mandate risks are balanced. Nevertheless, the USD/MXN trades at 18.15, gaining more than 1%.
The Peso was stressed after Bowman emphasized that the policy rate would be held steady “for some time,” adding that there has been “modest further progress on US inflation” and that she’s willing to raise rates if inflation stalls.
San Francisco Fed President Mary Daly stressed that the Fed must "exhibit care" as it aims to finish the job of bringing down inflation, adding that it “is not the only risk we face.”
Mexico’s economic docket featured June’s mid-month inflation data on Monday, ahead of the Bank of Mexico (Banxico) monetary policy decision on Thursday. The Citibanamex survey showed that most economists expect rates to be unchanged at 11.00%, yet they expect the central bank to cut rates until August.
Daily digest market movers: Mexican Peso tumbles despite high inflation warranting Banxico’s rate holding
- Mexico’s June mid-month consumer prices rose above estimates, which would likely deter Banxico from easing policy, on June 27.
- Headline inflation jumped from 4.70% expected to 4.78% YoY, though core prices edged lower from 4.31% to 4.17% YoY.
- Citibanamex survey showed economists priced out fewer rate cuts by the central bank, estimating rates will be lowered to 10.25% in 2024, up from 10.00%. Regarding the USD/MXN, the consensus estimates the exchange rate will end the year at 18.70, up from 18.00 in the previous report.
- Regarding economic growth, the consensus revised the Gross Domestic Product (GDP) for 2024 downward from 2.2% to 2.1% YoY.
- Last week’s Banxico’s verbal intervention underpinned the Mexican Peso as the USD/MXN hit an 11-day low. However, the Fed's hawkish comments weighed on the emerging market currency.
- CME FedWatch Tool shows odds for a 25-basis-point Fed rate cut at 59.5%, down from 61.1% last Monday.
Technical analysis: Mexican Peso falls as USD/MXN rallies back above 18.00
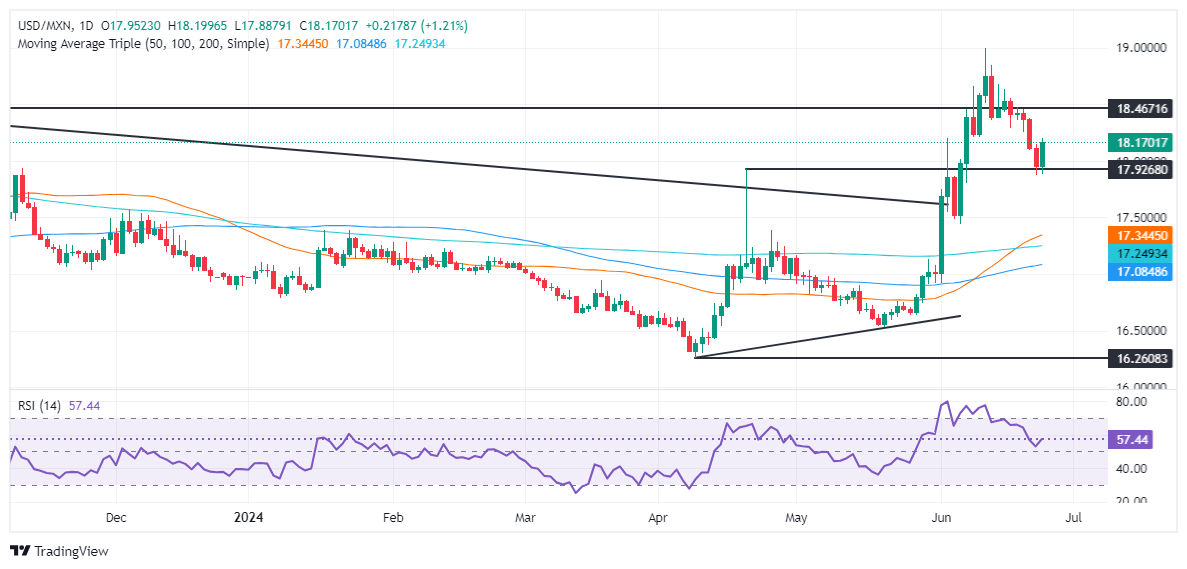
The USD/MXN uptrend remains intact after yesterday’s pullback beneath 17.90, which sounded the alarms that sellers were back in control. Nevertheless, momentum is still in favor of buyers, who had moved in, reclaimed 18.00, and targeted the year-to-date (YTD) high.
If USD/MXN clears 18.50, the next resistance would be the YTD high of 18.99. A breach of the latter will expose the March 20, 2023, high of 19.23, followed by an uptick to 19.50.
On the flip side, if USD/MXN tumbles below 18.00, the next key support level would be the 50-day Simple Moving Average (SMA) at 17.37 before testing the 200-day SMA at 17.23. Once those two levels are cleared, the next stop would be the 100-day SMA at 17.06.
Mexican Peso FAQs
The Mexican Peso (MXN) is the most traded currency among its Latin American peers. Its value is broadly determined by the performance of the Mexican economy, the country’s central bank’s policy, the amount of foreign investment in the country and even the levels of remittances sent by Mexicans who live abroad, particularly in the United States. Geopolitical trends can also move MXN: for example, the process of nearshoring – or the decision by some firms to relocate manufacturing capacity and supply chains closer to their home countries – is also seen as a catalyst for the Mexican currency as the country is considered a key manufacturing hub in the American continent. Another catalyst for MXN is Oil prices as Mexico is a key exporter of the commodity.
The main objective of Mexico’s central bank, also known as Banxico, is to maintain inflation at low and stable levels (at or close to its target of 3%, the midpoint in a tolerance band of between 2% and 4%). To this end, the bank sets an appropriate level of interest rates. When inflation is too high, Banxico will attempt to tame it by raising interest rates, making it more expensive for households and businesses to borrow money, thus cooling demand and the overall economy. Higher interest rates are generally positive for the Mexican Peso (MXN) as they lead to higher yields, making the country a more attractive place for investors. On the contrary, lower interest rates tend to weaken MXN.
Macroeconomic data releases are key to assess the state of the economy and can have an impact on the Mexican Peso (MXN) valuation. A strong Mexican economy, based on high economic growth, low unemployment and high confidence is good for MXN. Not only does it attract more foreign investment but it may encourage the Bank of Mexico (Banxico) to increase interest rates, particularly if this strength comes together with elevated inflation. However, if economic data is weak, MXN is likely to depreciate.
As an emerging-market currency, the Mexican Peso (MXN) tends to strive during risk-on periods, or when investors perceive that broader market risks are low and thus are eager to engage with investments that carry a higher risk. Conversely, MXN tends to weaken at times of market turbulence or economic uncertainty as investors tend to sell higher-risk assets and flee to the more-stable safe havens.
Federal Reserve (Fed) Lisa Cook noted that she expects the Fed's progress on inflation to continue despite a bumpy start to the year. Fed Governor Cook was addressing the Economic Club of New York on Tuesday.
Key highlights
At some point it will be appropriate to cut rates.
Current policy is well positioned to respond to economic outlook.
A rise in inflation expectations would imply keeping monetary policy restrictive for longer.
I am very attentive to inflation expectations.
The timing of any policy adjustment will depend on economic data and its implications for outlook and the balance of risks.
Monetary policy is restrictive.
Inflation has slowed, and the labor market tightness has eased.
I am fully committed to 2% inflation target.
Policy would also need to respond to sharper-than-expected weakening of economy and the job market.
The job market is tight but not overheated.
The risks to achieving inflation and employment goals have moved toward better balance.
I see 12-month inflation moving sideways for the rest of this year, and slowing more sharply next year.
I expect 3 and 6 month inflation rates to move lower on a bumpy path.
Progress on inflation has slowed, but I expect the disinflation trend to continue.
I lean toward optimism on innovation, productivity, allowing faster pace of non-inflationary growth.
Rising credit card and auto loan delinquencies are not yet concerning, but need watching.
I expect economic growth to remain near the rate of potential growth, somewhat above 2%.
Monthly job gains needed to keep the unemployment rate steady likely have doubled to nearly 200,000.
The financial system is not currently positioned to unusually amplify any future shock.
- US Dollar opens Tuesday with robust rebound.
- Fed officials maintain a cautious approach given mixed economic indicators.
- May’s PCE is the week’s highlight on Friday.
On Tuesday, the US Dollar, as portrayed by the Dollar Index (DXY), rose to 105.70 after opening the week on a soft note. A recovery in US yields appeared to overlook a slight dip in Consumer Sentiment data reported during the session.
From an economic perspective in the US, the picture continues to be mixed. A few signals of disinflation are noticeable, while most Federal Reserve (Fed) officials maintain a cautious approach.
Daily digest market movers: DXY shrugs off weak sentiment data on the back of hawkish bets
- On Tuesday, investors' attention was drawn by the Conference Board's Consumer Confidence Index. The figure slightly slipped to 100.4 from a revised 101.3 in May, indicating a somewhat tepid pace of consumer spending activity.
- Moving to Thursday, the Gross Domestic Product (GDP) revisions for the year are expected to remain at 1.3%.
- Friday will be a significant event as the May Personal Consumption Expenditures (PCE), a gauge of inflation favored by the Fed, is scheduled to be released.
- Both headline and core PCE are projected to ease to 2.6% YoY, down from 2.7% and 2.8%, respectively, in April.
- Expectations are high for a potential Fed rate cut in November, with a 70% probability of a cut happening as early as September.
- PCE data will play a crucial role in influencing market predictions.
Daily digest market movers: DXY shrugs off weak sentiment data on the back of hawkish bets
The technical outlook continues on a positive note, with indicators comfortably in the green. The Relative Strength Index (RSI) remains above 50 and trends upwards, while the Moving Average Convergence Divergence (MACD) is building green bars, suggesting a building of strength among bulls.
In addition, the DXY Index sustains its position above the 20, 100 and 200-day Simple Moving Averages (SMAs), which confirms an overall positive outlook.
Fed FAQs
Monetary policy in the US is shaped by the Federal Reserve (Fed). The Fed has two mandates: to achieve price stability and foster full employment. Its primary tool to achieve these goals is by adjusting interest rates. When prices are rising too quickly and inflation is above the Fed’s 2% target, it raises interest rates, increasing borrowing costs throughout the economy. This results in a stronger US Dollar (USD) as it makes the US a more attractive place for international investors to park their money. When inflation falls below 2% or the Unemployment Rate is too high, the Fed may lower interest rates to encourage borrowing, which weighs on the Greenback.
The Federal Reserve (Fed) holds eight policy meetings a year, where the Federal Open Market Committee (FOMC) assesses economic conditions and makes monetary policy decisions. The FOMC is attended by twelve Fed officials – the seven members of the Board of Governors, the president of the Federal Reserve Bank of New York, and four of the remaining eleven regional Reserve Bank presidents, who serve one-year terms on a rotating basis.
In extreme situations, the Federal Reserve may resort to a policy named Quantitative Easing (QE). QE is the process by which the Fed substantially increases the flow of credit in a stuck financial system. It is a non-standard policy measure used during crises or when inflation is extremely low. It was the Fed’s weapon of choice during the Great Financial Crisis in 2008. It involves the Fed printing more Dollars and using them to buy high grade bonds from financial institutions. QE usually weakens the US Dollar.
Quantitative tightening (QT) is the reverse process of QE, whereby the Federal Reserve stops buying bonds from financial institutions and does not reinvest the principal from the bonds it holds maturing, to purchase new bonds. It is usually positive for the value of the US Dollar.
- GBP/USD is steady as worse-than-expected US Consumer Confidence report, weighs on US Dollar.
- Technical outlook shows a 'bullish piercing' pattern, but momentum favors sellers, with RSI standing bearish.
- Key support levels will be 100-DMA and the May 3 high at 1.2640/34, with further losses eyed beneath the psychological level of 1.2600.
- Key resistance levels are 1.2700 and previous support trendline turned resistance at 1.2730/40.
The Pound Sterling stayed firm against the Greenback on Tuesday, even though the latter remained positive, and a worse-than-expected Consumer Confidence report capped the US Dollar advance. Therefore, the GBP/USD trades at 1.2678, virtually unchanged.
GBP/USD Price Analysis: Technical outlook
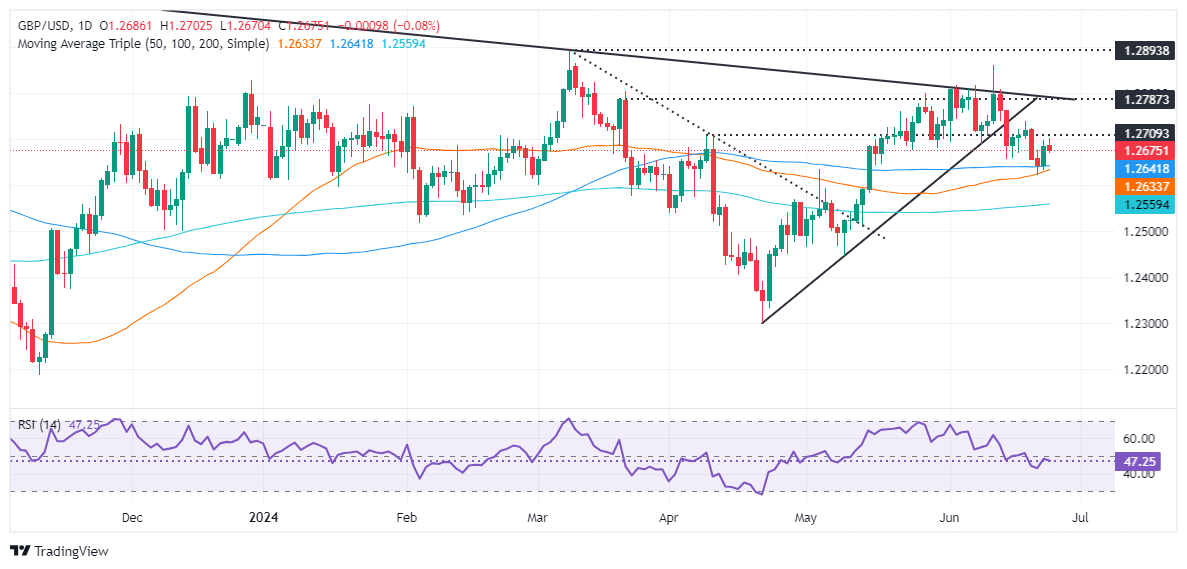
The pair formed a ‘bullish piercing’ pattern, hinting that traders could challenge the next resistance seen at 1.2700, yet buyers remain reluctant to lift the GBP/USD towards that level.
Momentum still favors sellers, as depicted by the Relative Strength Index (RSI), which remains bearish and aims lower. That said, the GBP/USD path of least resistance is downwards.
The first support will be the confluence of the 100-day moving average (DMA) and the May 3 high-turned support at around 1.2640/34, closely followed by the 50-DMA at 1.2632. Once that area is surpassed, the psychological 1.2600 mark would be up next, ahead of the 200-DMA at 1.2555.
For a bullish continuation, traders must claim 1.2700 and clear a previous support trendline turned resistance at around 1.2730/40.
GBP/USD Price Action – Daily Chart
The US Dollar (USD) has weakened modestly the previous day although remains close to recent highs with the dollar index once again attempting to break above the 106.00-level on a sustainable basis, Senior Currency Analyst at MUFG Lee Hardman notes.
Yen to breach a year to date high at 160.17
“The modest softening of the US Dollar the previous day pushed USD/JPY to an intra-day low of 159.19.”
“Monday comments from Japan’s top currency official Kanda and Finance Minister Suzuki have also helped to temporarily dampen upward momentum for USD/JPY as it moves back to within touching distance of the year to date high (29th April, 160.17).”
“The step up in verbal intervention was evident again overnight in comments from the Japanese government’s top spokesperson Hayashi who in a regular press conference reiterated that Japan is closely watching the foreign exchange market and will respond appropriately to excessive moves.”
Analysts at Societe Generale expect profits – the glue that holds the S&P 500 Index together – to reach new highs in 2H24.
S&P500 is at a critical juncture
“After a +15% rally in the index year to date, we expect the S&P 500 to stay in buy-the-dip mode, with the next upleg coming closer to a Fed rate-cutting cycle, which we see starting in early 2025e. Our S&P 500 target level is unchanged at 5,500 for year-end 2024.”
“The outperformance of mega caps vs the average S&P 500 stock is now at a critical juncture. Narrow breadth typically occurs in a bear market or when a few concentrated stocks have the potential to take us into a ‘bubble’ – neither of which is our base case. We see cyclical opportunities outside Tech too.”
“The AI ‘boom’ becomes a TMT-like bubble, driving the S&P 500 to 6,666 or 24.7x $270 (the March 2000 peak valuation x our 2025 S&P 500 EPS estimate). Oil prices head towards $60bbl on the back of significant OPEC spare capacity. These two provide some upside risks.”
We revised our USD profile higher in early Q2, underscoring a shift in our signals and framework towards inflation, TDS FX strategists note.
US Dollar to remain bullish across the board
"Inflation trading strategies remain some of the best performers across FX, highlighting the importance of inflation divergence. Inflation factors have outperformed growth factors, suggesting that ROW/US growth convergence isn't enough to weaken the USD."
"Instead, we think everything needs to go just right in the months ahead, with any surprises likely to benefit the USD. Risk and equity trading baskets have also performed well for most of this year but again those are two themes that work for the USD."
"From here, we expect a 2.5% jump in the BDXY, taking it to 1300 by yearend. That takes EUR/USD towards 1.02, USD/CAD above 1.40 and USD/CNY to 7.40."
- US CB Consumer Confidence Index edged lower in June, the Present Situation Index improved.
- The US Dollar Index stays in positive territory above 105.50.
Consumer sentiment in the US weakened slightly in June, with the Conference Board's Consumer Confidence Index declining to 100.4 from 101.3 (revised from 102.00) in May. The Present Situation Index improved to 141.5 from 140.8 in the same period, while the Expectations Index fell to 73.0 from 74.9.
Commenting on the survey's findings, "confidence pulled back in June but remained within the same narrow range that’s held throughout the past two years, as strength in current labor market views continued to outweigh concerns about the future," said Dana M. Peterson, Chief Economist at The Conference Board. "However, if material weaknesses in the labor market appear, Confidence could weaken as the year progresses."
Market reaction
The US Dollar Index edged higher with the immediate reaction and was last seen gaining 0.25% on the day at 105.74.
The Euro (EUR) rebounded amid broad USD pullback, Rates Strategist Frances Cheung and FX Strategist Christopher Wong from OCBC note.
EUR/USD to remain rangebound ahead of elections
“The main focus is on French elections in the short term. Depending on the skew of the results, knee-jerk impact on EUR can vary but is likely to be skewed to the downside, unless outcome surprises with Macron’s Ensemble coalition winning a larger share.”
“Pair was last at 1.0706 levels. Bearish momentum on daily chart shows signs of fading while RSI rose slightly. Some risks to the upside but 2-way trades still likely ahead of French election risks.”
“Support at 1.0660/70 levels (recent low) before 1.06 levels. Resistance at 1.0770 (50 DMA), 1.0810 (38.2% fibo retracement of 2024 high to low, 100 DMA).”
- AUD/USD is trading in the middle of a multi-week range.
- It is in a sideways short-term trend that is tipped to extend.
- More recently it has contracted further, forming a “mini-range” within a range.
AUD/USD continues trading up and down within a range on the 4-hour price chart. Since June 19 the waves of buying and selling have narrowed even further, forming a sort of temporary “mini-range” within a range.
AUD/USD 4-hour Chart
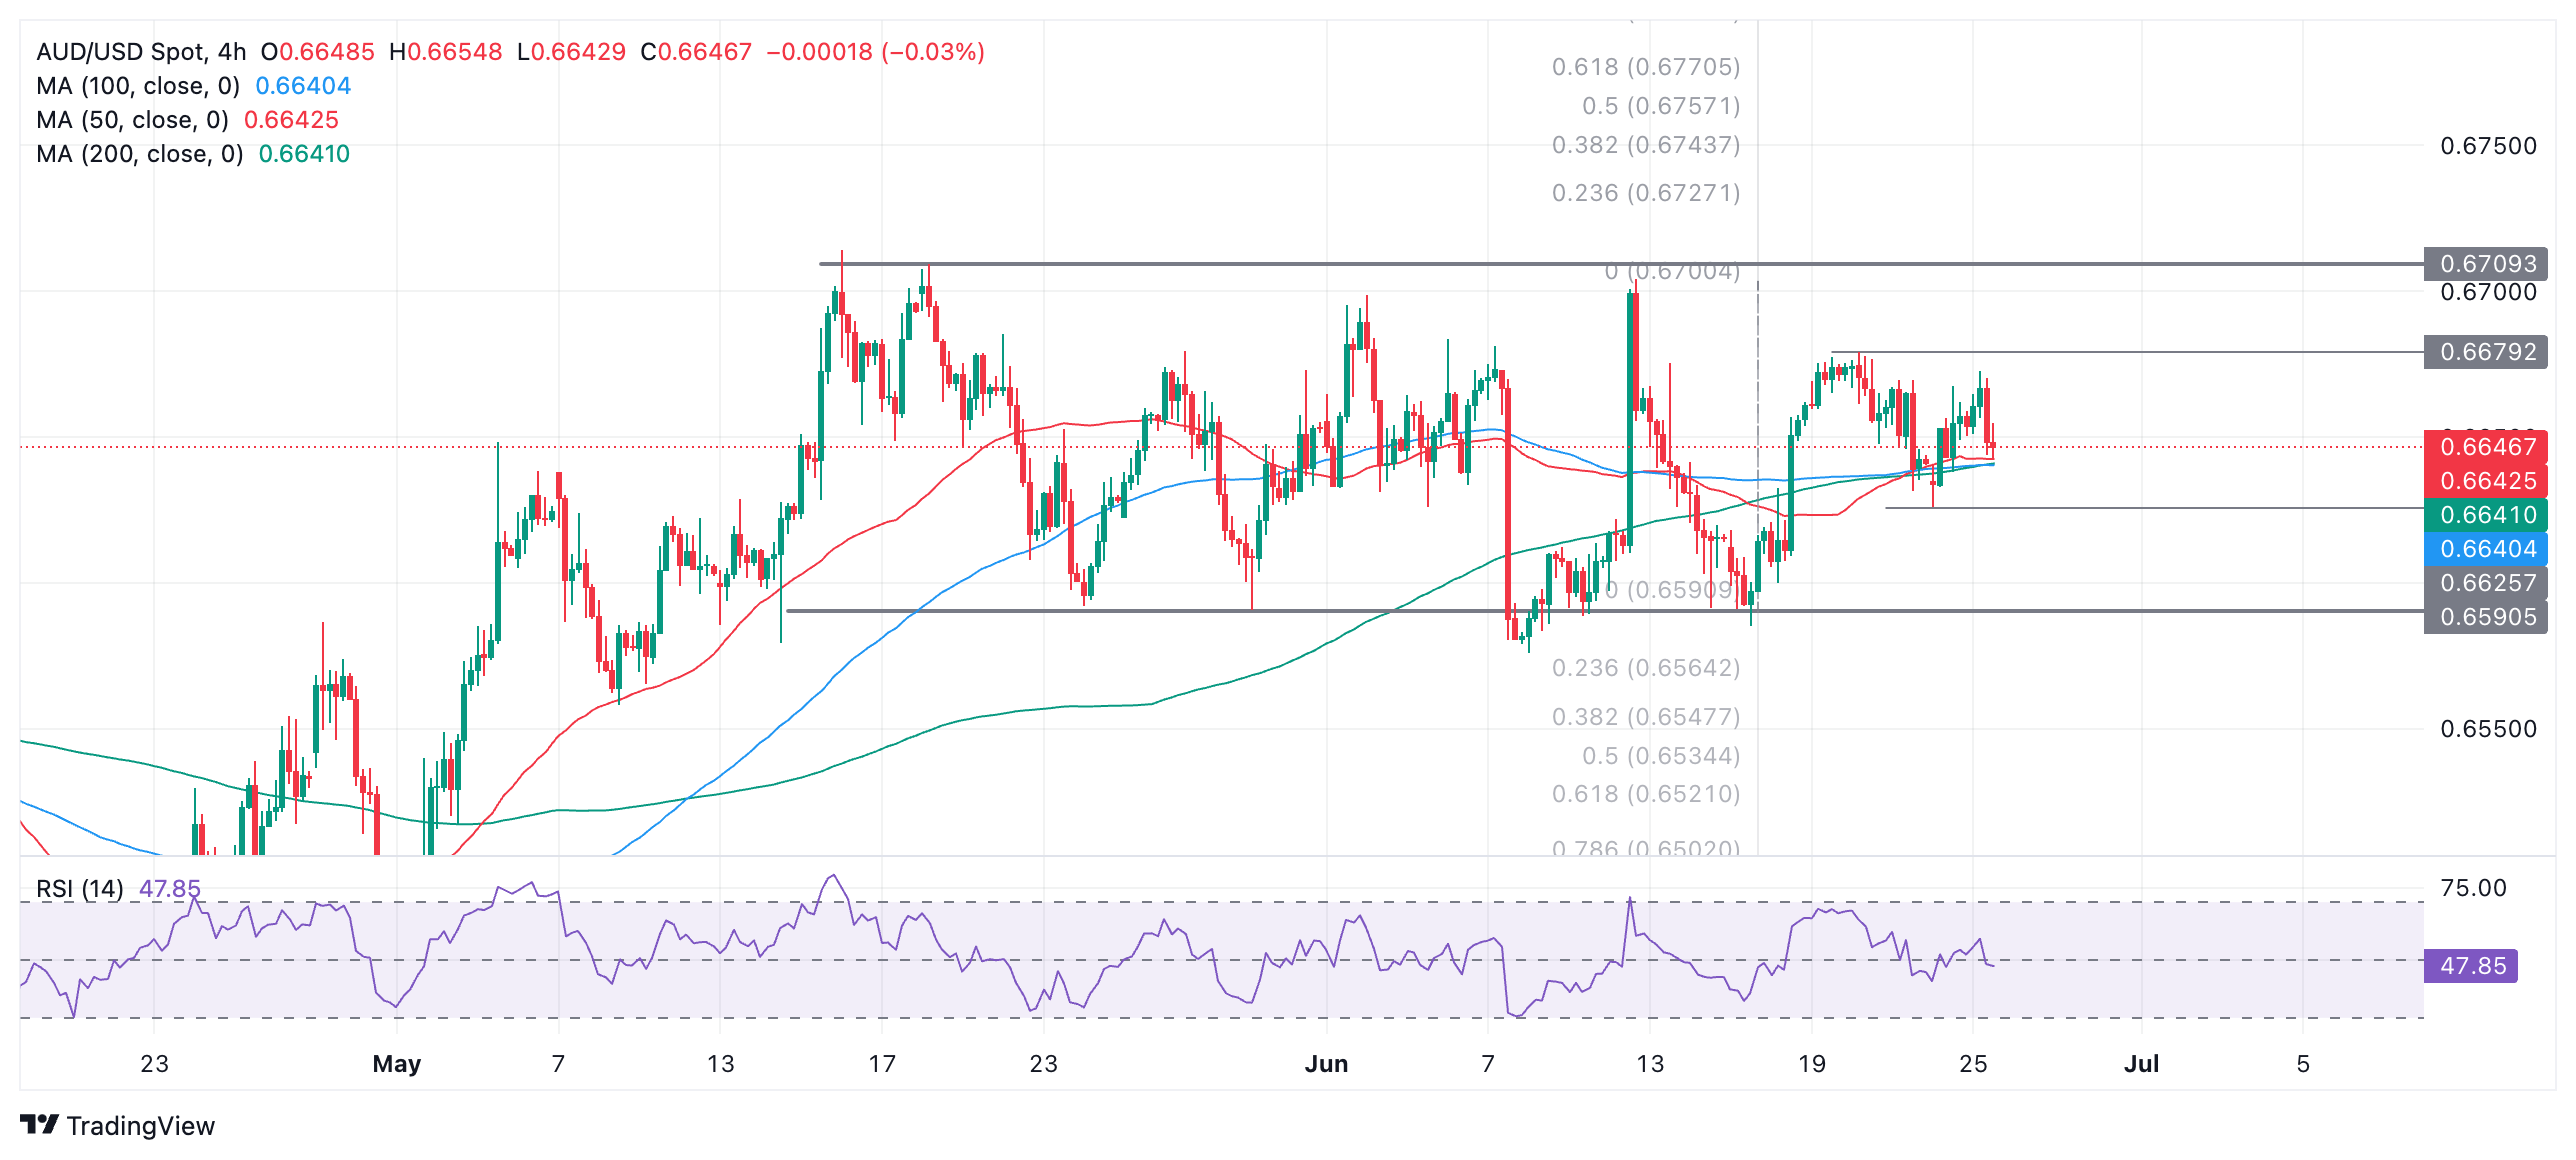
AUD/USD could move either higher or lower within the range – at the moment it is difficult to tell which way next. A break above the mini-range high at 0.6679 would probably indicate a continuation up to the range ceiling at 0.6709. Likewise a break below the mini-range low at 0.6625 would probably lead to a move down to the range floor at 0.6590.
The short-term trend is sideways and as long as price remains within the bounds of the range it will likely keep ping-ponging up and down, extending the trend – “the trend is your friend”.
It would require a decisive breakout of the range to signal a change to a more directional mode. An upside break is marginally more likely to happen because the trend prior to the formation of the range was bullish. The breakout move is likely to be volatile given the range highs and lows have been touched multiple times.
A decisive break above the ceiling of the range would see a follow-through to a conservative target at 0.6770; a decisive break below the range floor would indicate a follow-through to an initial target at 0.6521.
A decisive break would be one in which a longer-than-average candle broke out of the range and closed near its high or low, or three successive candles of the same color broke cleanly through the range top or bottom.
The targets are generated using the technical-analysis method of extrapolating the height of the range by a Fibonacci 0.618 ratio higher (in the case of an upside break) or lower (in the case of a downside break). A more generous target would come from extrapolating the full height of the range.
- Silver price slides below $29.40 as the US Dollar bounces back.
- Fed Bowman sees interest rates remaining at their current levels this year.
- Investors await the US core PCE inflation for fresh guidance.
Silver price (XAG/USD) slumps below lower end of Monday’s trading range near $29.40 in Tuesday’s New York session. The white metal faces selling pressure as the US Dollar (USD) has bounced back strongly after correcting on Monday. The US Dollar Index (DXY), which tracks the Greenback’s value against six major currencies, rebounds from 105.40.
The US Dollar recovers as investors become doubtful over the Federal Reserve’s (Fed) interest rate outlook. Currently, financial markets expect that the Fed will start reducing interest rates from the September meeting and subsequent rate cuts will be announced in the November or December meeting.
However, Fed policymakers argue in favor of maintaining interest rates at their current levels until they see inflation declining for months. In Tuesday’s New York session, Fed Governor Michelle Bowman said in an interview that she doesn't see any rate cut this year. Bowman added that rate cuts at this point are inappropriate, and the option of more rate hikes remains on the table if progress in the disinflation process appears to stall or reverse in the future.
Going forward, investors will focus on the United States (US) core Personal Consumption Expenditure Price Index (PCE) for May, which will be published on Friday. The core PCE price index data is the Fed’s preferred inflation measure, and it will provide fresh cues on when and how much the central bank will reduce interest rates this year.
Silver technical analysis
Silver price declines to near upward-sloping trendline plotted from February 29 low at $22.30 plotted on a daily timeframe. The asset corrects to near 50-day Exponential Moving Average (EMA) around $29.00. Sideways 20- and 50-day Exponential Moving Averages (EMAs) indicate a consolidation ahead.
The 14-day Relative Strength Index (RSI) oscillates in the 40.00-60.00 range, suggesting indecisiveness among investors.
Silver daily chart
The US Dollar (USD) slipped overnight on somewhat less hawkish Federal Reserve (Fed) rhetoric, Rates Strategist Frances Cheung and FX Strategist Christopher Wong from OCBC note.
USD waits for PCE for direction
“Mary Daly warned that US labour market is near a point, where further slowing in job vacancy could mean higher unemployment. Goolsbee said that it may be appropriate to start thinking about whether policy is putting too much pressure on the economy.”
“This week, the focus is on PCE core (Fri). Softer core CPI, PPI readings in May is building expectations for core PCE to print softer. A weaker than expected print should raise hopes for Fed rate cut. This should also tamper USD gains, but hotter print may continue to fuel USD momentum.”
“The Dollar Index (DXY) was last at 105.31. Mild bullish momentum on daily chart intact but RSI fell. Some pullback not ruled out. Support at 105.20 (50 DMA), 104.80/90 (61.8% fibo retracement of Oct high to 2024 low, 21 DMA) and 104 (50% fibo). Resistance at 105.75 (76.4% fibo).”
- EUR/CAD is completing a Symmetrical Triangle pattern on the weekly chart.
- A breakout is expected – probably quite soon – leading to a volatile directional move higher or lower.
- Given the move prior to the pattern in 2022-23 was bullish, the odds marginally favor a breakout and continuation higher.
EUR/CAD is completing a Symmetrical Triangle pattern on the weekly price chart, which indicates the pair is poised to break out and move in a volatile directional fashion.
EUR/CAD Weekly Chart
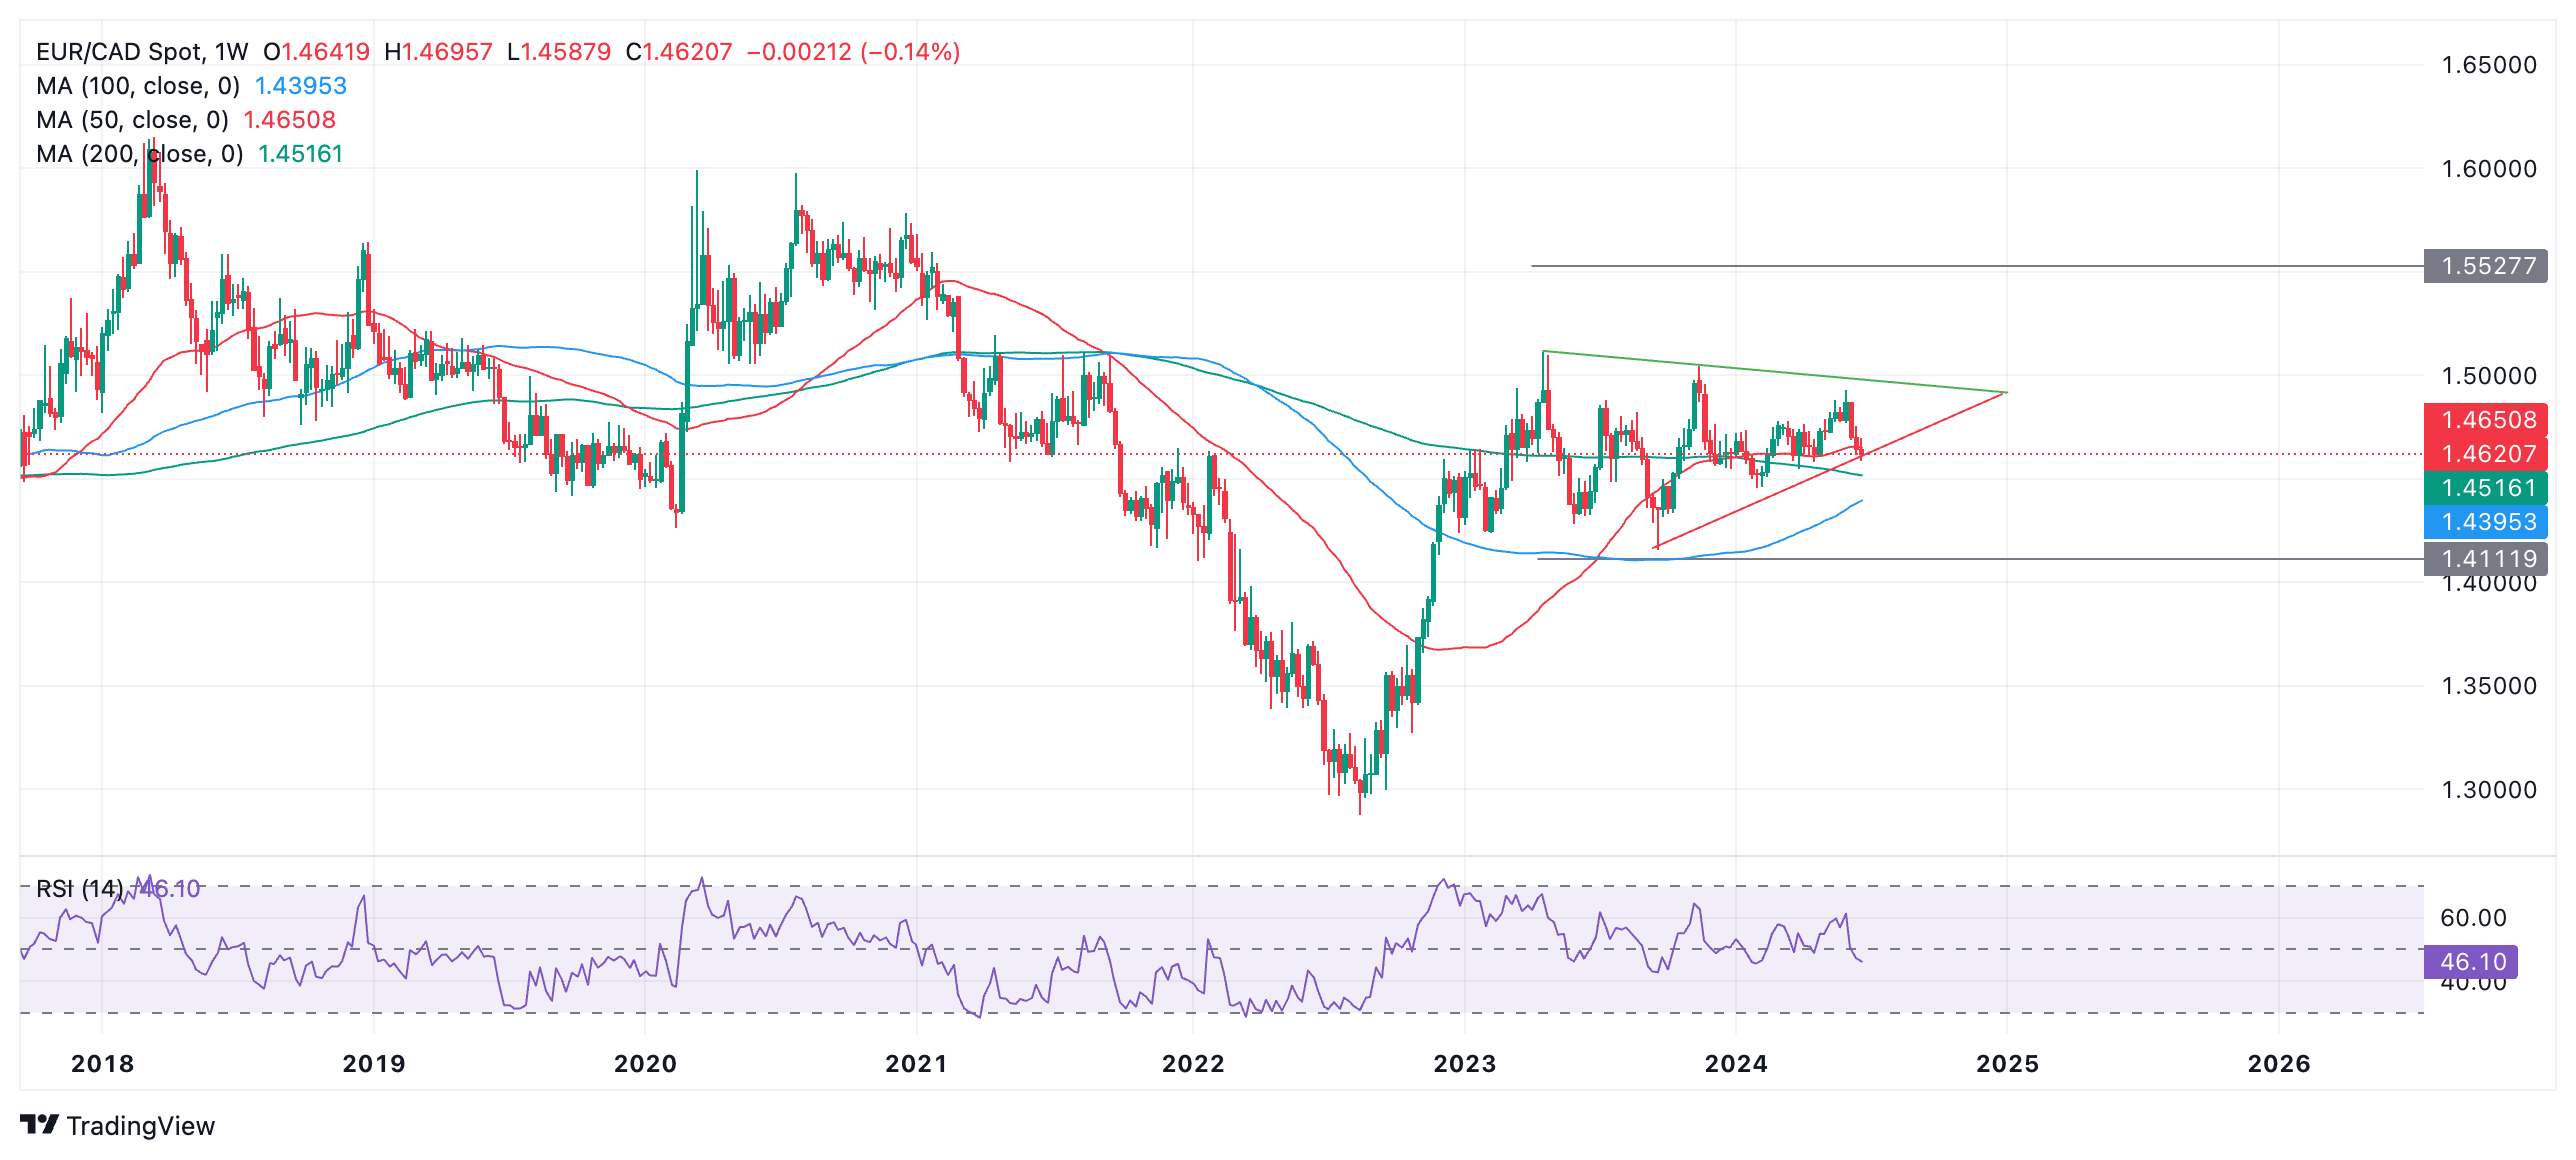
The bigger picture for EUR/CAD is that the pair bottomed out in 2022 and recovered. From the start of 2023 the pair started consolidating and began forming a Symmetrical Triangle pattern.
The Symmetrical Triangle (ST) pattern has formed roughly five internal waves which is the minimum for reaching completion. It is possible that it has finished, therefore, and could break out quite soon.
A breakout higher is marginally more likely than a breakout lower because the move prior to the formation of the ST was bullish. It could also be argued that the pair began a long-term uptrend prior to the formation of the ST.
A decisive break above the upper (green) boundary line would be indicative of an upside breakout. This would be expected to reach a target at roughly 1.5528, the 0.618 Fibonacci of the height of the ST at its widest point extrapolated higher from the breakout point.
Likewise, the same goes for a decisive break lower, only with a target at roughly 1.4112.
A decisive break higher would be defined as a breakout that was accompanied by a long, green, weekly candle that closes near its high, or three candles in a row that break higher. In the case of a breakout lower the same would apply only with a red candle instead.
Oil markets are now succumbing to a reversal of systematic flows, TD Securities analysts suggest.
Upside for Oil prices is likely capped
“With Commodity Trading Advisor (CTA) buying running its course, the market failed to maintain the required upside momentum and in turn has started liquidating their length. CTAs are now targeting a reduction of some 12% and 8% of the historical max position in WTI and Brent crude respectively.”
“We are not anticipating another rout in prices as supply risks are back in focus with tensions building in the Middle East between Israel and Lebanon, while further ship attacks in the Red Sea reignite concerns.”
“A renewed increase in our energy supply risk indicator can support price action in the near term. Yet, we still argue the upside is likely capped by increasing global supply and potential OPEC+ increases, which puts 2025 balances in question.”
Downside momentum has proven resilient in industrial metals, despite lingering hopes of new Chinese stimulus as our gauge of commodity demand continues to weaken amid a precarious global macro landscape, TDS commodity strategists note.
Copper is flat, other metals to slide lower
“Top Shanghai Futures Exchange (SHFE) traders have liquidated their Copper length and are now holding a fairly flat position, highlighting those on the ground in the Middle Kingdom may not be buying into the stimulus talk just yet.”
“Elsewhere, AUM for base metal specific ETFs have also notably declined, while money manager positioning is also coming off the euphoric highs for the red metal, and there could still be additional downside in the near-term as bloated positions continue to unwind.”
“For now, Commodity Trading Advisors (CTA) positions remain safe with a large margin of safety before the next selling trigger at $9,104/t. Elsewhere, Aluminum prices are in the crosshairs with CTA selling triggers sitting at the $2,400/t level, while Zinc and Lead could also be at risk of selling.”
- USD/CAD falls sharply as the Canadian Dollar appreciates after the stubbornly higher Canadian inflation report for May.
- The hotter-than-expected US inflation report has trimmed expectations for the BoC’s subsequent rate cuts.
- Fed Bowman sees interest rates remaining at their current levels for the entire year.
The USD/CAD pair witnesses a sharp sell-off in Tuesday’s New York session. The Loonie asset comes under pressure as the May Consumer Price Index (CPI) report from Statistics Canada showed that price pressure surprisingly rose higher than April’s reading. This has dented expectations of subsequent rate cuts by the Bank of Canada (BoC). The BoC commenced its policy-easing campaign at its policy meeting in early June.
The CPI report showed that annual headline inflation unexpectedly grew by 2.9%. Investors expected price pressures to have declined to 2.6% from the prior release of 2.7%. On month, headline CPI grew strongly by 0.6% than the former release of 0.5%. The BoC core CPI, which excludes eight volatile items, grew at a faster pace of 0.6% than expectations and the prior reading of 0.2% on month-on-month. Annually, the underlying inflation data accelerated to 1.8% from 1.6% in April.
Meanwhile, the US Dollar Index (DXY) bounces back after correcting to near 105.40. The USD Index rebounded after Federal Reserve (Fed) Governor Michelle Bowman delivered hawkish guidance on interest rates. Fed Bowman said we are not at a point where rate cuts become appropriate. Bowman pushed back expectations of rate cuts to 2025 and warned of more hikes if disinflation appears to stall or reverse.
This week, the major trigger for the US Dollar will be the United States (US) core Personal Consumption Expenditure price index (PCE) for May, which will be published on Friday. The core PCE price index data is the Fed’s preferred inflation measure, which will provide fresh cues on when and how much the central bank will reduce interest rates this year.
- EUR/GBP loses ground on the risks to the EU of a far-right victory in Sunday’s French elections.
- Weak German IFO data further weighs whilst the Pound gains some support from firm Retail Sales data.
- Pound Sterling manages to exorcize some of the dovishness from the BoE’s June meeting.
EUR/GBP is trading lower in the 0.8440s on Tuesday as the Euro (EUR) loses ground due to rising political risk premia amid concerns about the outcome of the French-election, whilst the Pound Sterling (GBP) finds support after recent UK Retail Sales data beat forecasts, easing expectations that the Bank of England (BoE) go ahead with interest-rate cuts in August, as is widely expected.
EUR/GBP falls as French Election threatens European project
The Euro is depreciating ahead of the French elections on Sunday June 30 when the French will vote in their next parliament. At the moment the far-right National Rally (RN) is in front with 34% of the vote and is projected to win 260 seats in the National Assembly, just short of the 289 needed for a clear majority to rule, according to Politico.
If National Rally wins the election it will be a massive setback for the European Union (EU), shake the foundations of the world order, and drive a wedge into the western alliance at the heart of NATO.
“An RN government would therefore be a dagger to the belly of Western as well as European unity. It would threaten Russian infiltration of the French — and therefore Western — intelligence services,” says John Lichfield, a contributor to Politico.
That said, at the moment the RN does not look like it will quite get a clear majority, resulting in what Lichfield calls an “utterly blocked parliament.”
Underpar German data further weighs
As far as macroeconomic data is concerned, the headline German IFO Business Climate Index which fell to 88.6 in June from 89.3 in May, coming in below the market expectation of 89.7. The Current Assessment Index, meanwhile, remained unchanged at 88.3, while the Expectations Index dropped to 89.0 from 90.4. This weaker German data puts more pressure on the Euro, further dragging the EUR/GBP cross lower.
Traders will be watching preliminary inflation data for June in several major European economies, including France, Spain, and Italy, published on Friday, for hints of the trajectory for interest rates in Europe. ¡
At its meeting in June, the European Central Bank (ECB) cut its key policy interest rate by 0.25% to 4.25%, however, further rate cuts are in the balance. Lower inflation would increase expectations of the ECB following up with further cuts and weigh on the Euro. Lower interest rates are negative for a currency because they attract less foreign capital inflows.
Pound exorcizes some of BoE-meeting’s dovishness
The Pound Sterling, meanwhile, finds some support going into the new week after UK Retail Sales data out on Friday beat expectations and reduced bets the BoE will cut interest rates at its meeting in August.
Retail Sales in the UK soared 2.9% month-over-month in May, recovering from an upwardly revised 1.8% decline in April and much higher than forecasts of a 1.5% gain. It was the largest increase in four months, with sales at non-food stores rising 3.5%, the most since April 2021, according to Trading Economics.
The data popped some of the optimism that had expanded following the BoE’s June policy meeting. Although the BoE’s board of governors voted to keep its key policy interest rate unchanged at 5.25%, there were hints in the accompanying statement that the decision was “finely balanced” and might have swung either way. Markets took this as a sign that the BoE was closer to pressing the trigger on cutting interest rates than previously thought.
The meeting also followed the release of the latest Consumer Price Index (CPI) data for the UK, which showed headline inflation cooling to only 2.0% in May, from 2.3% in April and the lowest since July 2021. Although core inflation remained stubbornly elevated at 3.5%, the fall in the headline rate brought it into line with the Bank of England’s target, indicating inflation might be near a level where the BoE would see fit to reduce interest rates.
The rise in US government deficits has kept Treasury supply fears front and center for investors. While Treasury is likely to keep auction sizes steady until mid-2025, higher deficits and the sharp rise in rates continue to raise the question of who will buy Treasuries in the coming years, TD Securities strategists note.
Treasuries are getting more expensive for investors
“Demand from mutual funds and ETFs, leveraged investors, pension funds, and money market funds has been strong thus far. However, levered investors face increased costs and pension fund buying may be starting to slow. Banks, state and local accounts have also purchased a large number of Treasuries in recent years.”
“Demand from foreign investors remains highly uncertain. Japanese investors have only been modest buyers of Treasuries this year due to high FX hedging costs and China has shed Treasuries on net in 2024. However, foreign investors ex-Japan and China have remained buyers.”
“Supply is likely to remain a headwind for Treasuries even as already elevated yields aid demand. Despite the move lower in rates in the past several weeks, we continue to favor buying dips in both real and nominal rates. We also remain positioned for 5s30s steepeners and 30y swap spread tighteners.”
It seems that Federal Reserve (Fed) officials are getting a bit nervous, BBH analysts note.
Inflation is not the only risk for the Fed
“Goolsbee said ‘If we get more months like what we have just seen in the last month on inflation, coupled with slowing conditions in some of the other parts of the real economy, then you would have to start questioning, should we remain as restrictive as we’ve been?’”
“Elsewhere, Daly said ‘The bumpiness of inflation data so far this year has not inspired confidence. Recent readings are more encouraging, but it is hard to know if we are truly on track to sustainable price stability."
“However, ‘So far, the labor market has adjusted slowly, and the unemployment rate has only edged up. Future labor market slowing could translate into higher unemployment, as firms need to adjust not just vacancies but actual jobs. It seems, inflation is not the only risk we face.’”
- The US Dollar trades slightly lower against major peers at the start of the European session.
- Two Fed speakers are scheduled on Tuesday.
- The US Dollar index trades near the weekly low, though still well above 105.00.
The US Dollar (USD) trades slightly lower against major pairs during the Tuesday European session despite the risk-off mood, with Nvidia becoming the biggest worry for markets after being the golden boy for many weeks in a row. Meanwhile, in Europe, headaches emerge as well ahead of the French snap election’s first round on Sunday.
On the economic front, Tuesday’s calendar includes some housing numbers, the Chicago Fed National Activity Index, the Richmond Fed Manufacturing Index, and the US Conference Board Consumer Confidence as main elements. Additionally, two US Federal Reserve (Fed) members will take the stage and might comment on the current monetary policy stance. One element to highlight as well on the agenda is the first presidential debate on Thursday between current US President Joe Biden and former US President Donald Trump.
Daily digest market movers: US equities on the front foot
- At 12:30 GMT, the Chicago Fed National Activity Index for May will be released. The previous number was at -0.23, with no forecast available.
- At 13:00 GMT, the Housing Price Index for April will be released. An uptick of 0.3% is expected after rising by 0.1% in March.
- The Conference Board Consumer Confidence and the Richmond Fed Manufacturing Index for June will both be released at 14:00 GMT. Consumer Confidence is expected to ease to 100.00 after reaching 102.00 in May. The Richmond Manufacturing Index is expected to rise to 2 in June after the previous reading of 0.
- Two US Federal Reserve officials will make their way to the stage:
- At 11:00 GMT, Federal Reserve Governor Michelle Bowman delivered a speech about the US monetary policy and bank capital reform at the Policy Exchange UK event in London, United Kingdom. She remained very hawkish by saying hikes are still on the table if needed, and there are still too many risks for upside surprises in inflation.
- At 16:00 GMT, Federal Reserve Governor Lisa Cook delivers a speech about the US economic outlook in a luncheon at the Economic Club of New York.
- To round up the day, at 18:10 GMT, Bowman delivers pre-recorded opening remarks at the Midwest Cyber Workshop hosted by the Federal Reserve Bank of St. Louis, Chicago, and Kansas City.
- European equities are diving lower, with the major German Dax sinking over 1%. US futures are flat and do not follow the negative sentiment.
- The CME Fedwatch Tool is backing a rate cut in September, with odds now standing at 61.1% for a 25 basis point cut. A rate pause stands at a 32.3% chance, while a 50-basis-point rate cut has a slim 6.6% possibility.
- The US 10-year benchmark rate trades at 4.24%, rather steady since the end of last week. The spread between the French and German 10-years benchmark has fallen from 0.79% to 0.74% and is easing a touch, though still the highest level in over six years.
US Dollar Index Technical Analysis: Risk-off helping to push back
The US Dollar Index (DXY) is trading float on Tuesday, with some risk-off out of Europe supporting the Greenback. Expect not to see any big waves ahead of the US Opening Bell as markets are starting to struggle with how to price the possible outcome from the French snap elections on Sunday. Traders will also be looking for NVidia to see how it behaves and if it can end its recent correction.
On the upside, the first level to watch is 105.88, which triggered a rejection at the start of May and on Friday last week. Further up, the biggest challenge remains at 106.52, the year-to-date high from April 16. A rally to 107.20, a level not seen since 2023, would need to be driven by a surprise uptick in the US inflation or a sudden hawkish shift from the Fed.
On the downside, 105.52 is the first support ahead of a trifecta of Simple Moving Averages (SMA). First is the 55-day SMA at 105.23, safeguarding the 105.00 round figure. A touch lower, near 104.66 and 104.48, both the 100-day and the 200-day SMA form a double layer of protection to support any declines. Should this area be broken, look for 104.00 to salvage the situation.
US Dollar FAQs
The US Dollar (USD) is the official currency of the United States of America, and the ‘de facto’ currency of a significant number of other countries where it is found in circulation alongside local notes. It is the most heavily traded currency in the world, accounting for over 88% of all global foreign exchange turnover, or an average of $6.6 trillion in transactions per day, according to data from 2022. Following the second world war, the USD took over from the British Pound as the world’s reserve currency. For most of its history, the US Dollar was backed by Gold, until the Bretton Woods Agreement in 1971 when the Gold Standard went away.
The most important single factor impacting on the value of the US Dollar is monetary policy, which is shaped by the Federal Reserve (Fed). The Fed has two mandates: to achieve price stability (control inflation) and foster full employment. Its primary tool to achieve these two goals is by adjusting interest rates. When prices are rising too quickly and inflation is above the Fed’s 2% target, the Fed will raise rates, which helps the USD value. When inflation falls below 2% or the Unemployment Rate is too high, the Fed may lower interest rates, which weighs on the Greenback.
In extreme situations, the Federal Reserve can also print more Dollars and enact quantitative easing (QE). QE is the process by which the Fed substantially increases the flow of credit in a stuck financial system. It is a non-standard policy measure used when credit has dried up because banks will not lend to each other (out of the fear of counterparty default). It is a last resort when simply lowering interest rates is unlikely to achieve the necessary result. It was the Fed’s weapon of choice to combat the credit crunch that occurred during the Great Financial Crisis in 2008. It involves the Fed printing more Dollars and using them to buy US government bonds predominantly from financial institutions. QE usually leads to a weaker US Dollar.
Quantitative tightening (QT) is the reverse process whereby the Federal Reserve stops buying bonds from financial institutions and does not reinvest the principal from the bonds it holds maturing in new purchases. It is usually positive for the US Dollar.
If USD/JPY does break through 160 in the coming days the USD/CNH pair may come along, Chief FX Strategist at Societe Generale Kit Juckes argues.
The US/Japanese rate gap is too big
“USD/CNH and USD/JPY move in tandem. The Japanese Yen (JPY) moves more, and the Chinese Yuan (CNH) moves are more controlled, but they seldom move in opposite directions. This reflects economic similarities as much as geographical proximity and it is changing the way the FX market works.”
“At the moment, the Bank of Japan (BoJ) and the Ministry of Finance (MOF) are trying to talk the Yen around, and the chances of both rate hikes and bond sales have increased, but with the US/Japanese rate gap so big, does anything the BoJ does matter yet?”
“If USD/JPY does break through 160 in the coming days, preventing further Yuan weakness would be very difficult indeed.”
Federal Reserve Governor Michelle Bowman said on Tuesday that they are not yet at the point where it is appropriate to cut interest rates, per Reuters.
Key takeaways
"Should data show inflation moving sustainably to 2%, it will eventually become appropriate to gradually lower policy rate.",
"Baseline outlook continues to be inflation will return to 2% with policy rate held steady for some time."
"Willing to raise the target rate at a future meeting if inflation progress stalls or reverses."
"Will remain cautious in approach to future changes in policy stance."
"Other central banks may ease monetary policy sooner or more quickly than the Fed."
"Only modest further progress on US inflation seen this year."
"Expecting US inflation to remain elevated for some time, still see a number of upside inflation risks."
"US labor market remains tight, despite some further rebalancing."
Market reaction
The US Dollar Index edged higher in reaction to these comments and was last seen rising 0.1% on the day at 105.58.
The Canadian dollar (CAD) has been trading stronger since the last Bank of Canada (BoC) rate cut, but the CPI data coming Tuesday may give it a turn, ING’s FX Strategist Francesco Pesole notes.
Canada’s CPI data comes forth
“Canada publishes CPI data for May on Tuesday, and we expect another inflation slowdown in line with consensus expectations. Headline CPI is seen decelerating from 2.7% to 2.6% year-on-year and the core inflation metrics may also keep inching lower.”
“This is the second big piece of Canadian data since the Bank of Canada (BoC) cut rates on 5 June. Earlier this month, jobs data showed a slowdown in hiring in May, with unemployment ticking higher and full-time employment dropping.”
“The Canadian dollar (CAD) has been trading gradually stronger since the June cut, largely on the back of generally supportive sentiment, higher oil prices and distance from the EU political turmoil. Still, as we expect three more rate cuts by the BoC this year, we continue to expect the Loonie to be a laggard in the pro-cyclical space this summer.”
Looking at forward curves, it is remarkable that UK interest rates remain priced so close to the US, ING’s FX strategists Chris Turner notes.
UK rates to be priced lower starting in August
“UK interest rates remain priced so close to the US. Both price around 45bp of rate cuts this year and both have a terminal rate for forthcoming easing cycles around the 3.30/3.40% area. Our conviction views this summer is that UK rates will be repriced lower starting with a rate cut in August. And this should lead to a lower Pound Sterling (GBP).”
“We will not hear anything more from the Bank of England (BoE) until after the 4 July general election now. But thereafter, we would be looking for the more dovish members of the seven who voted for unchanged rates last week to make their voices heard.”
“Uncertain developments in the eurozone suggest EUR/GBP may struggle to break back above 0.8490 in the short term. But a cross rate like GBP/NOK could come lower over the next month if both US rates come lower and the BoE doves emerge in July.”
- The Mexican Peso rallies after the release of inflation data ahead of the Banxico meeting.
- The Banxico is likely to keep interest rates unchanged at 11%, supporting the MXN.
- The short-term trend has reversed for USD/MXN and is probably bearish now, though RSI is oversold.
The Mexican Peso (MXN) comes off its highs on Tuesday, as traders take profit after a concerted period of strengthening, which has seen it reverse almost half of the post-election slide in its most traded pairs.
At the time of writing, one US Dollar (USD) buys 17.98 Mexican Pesos, EUR/MXN is trading at 19.29 and GBP/MXN at 22.83.
Mexican Peso rallies as inflation remains elevated
The Mexican Peso pulls back from overbought highs on Tuesday as traders book profits from their long positions following last week’s strong rebound.
Mexican headline inflation data on Monday came out higher-than-expected, aligning with the Bank of Mexico’s (Banxico) pledge to keep interest rates high in order to combat high inflation.
Mexico’s June mid-month Consumer Price Index (CPI) rose by 0.21% MoM, beating estimates of 0.13% and the previous month’s negative reading. On a year-over-year basis prices rose by 4.78%, unchanged from the previous reading and higher than the 4.70% estimate.
It was a different story for core prices, however, which rose by a below-estimated 0.17% MoM when analysts had expected a 0.18% increase. Although it was higher than the previous month’s 0.15%. Annual core prices rose 4.17%, which was below the consensus estimate of 4.31% and the previous month’s 4.19%.
The Peso spiked higher against the US Dollar (USD) after the release of the CPI data. The reading added to previous stronger-than-expected Retail Sales and Private Spending data, reflecting relatively resilient Mexican consumer spending despite high borrowing costs.
June’s CPI data continue to show both core and headline inflation running above Banxico's 2%-4% target and indicates the bank will probably keep interest rates at their current 11.00% at their June policy meeting on Thursday.
"Banco de Mexico meets Thursday and is expected to keep rates steady at 11.0%,” says Dr. Win Thin, Global Head of Markets Strategy at Brown Brothers Harriman (BBH) in a note on Tuesday. “At the last meeting on May 9, the bank kept rates steady after starting the easing cycle at the March 21 meeting with a 25 bp cut. Recent weakness in MXN is an upside risk to inflation and will keep the bank cautious. The swaps curve has adjusted higher since the May meeting and is pricing in only 75 bp of easing over the next 12 months vs. 125 bp at the start of May,” adds Thin.
The MXN’s post-election slide, which saw it lose over 11% in its main pairs, is likely to bring imported inflation by making imported goods more expensive, according to economists at Standard Chartered. This, in turn, will prevent the Banxico from pressing the trigger on rate cuts, supporting the Peso in the process.
“We now expect Banco de México (Banxico) to stay on hold instead of cutting by 25bps at its 27 June meeting, amid sharp currency depreciation driven by elevated political noise and fiscal uncertainty,” says the bank.
Mexican Peso fights back
Last week the Mexican Peso fought back, recovering over 5.0%, almost half of its decline after the June 2 elections. The recovery took on added momentum on Thursday June 20, after Claudia Sheinbaum’s announcement of top cabinet pics.
The market seemed to look favorably on her choice of Economy Minister in Marcelo Luis Ebrard Casaubón, the former head of Foreign Affairs under President Andres Manuel López Obrador (AMLO).
Further, the Mexican Peso remains supported by the relatively high interest rates in Mexico (11.00%) which make it one of the most attractive currencies to buy in the carry trade, according to Christian Lawrence, Senior Strategist at Rabobank.
The “carry trade” is a type of investment in which investors borrow in a currency with low interest rates, like the Japanese Yen (JPY), and buy a currency with a high interest rate like the Mexican Peso. Their profit is the difference between the interest repayments on the low-interest loan and the profit from the interest on the investment (minus currency risk).
“The main driver of MXN outperformance has been its position as the world’s most attractive carry currency and that remains true and will remain true in the coming months,” Lawrence told FXStreet.
This also makes it expensive for most traders to hold short positions in the Mexican Peso for long periods of time, explains Lawrence, reducing the chances of a long-term bearish trend evolving.
Technical Analysis: USD/MXN short-term trend reverses, RSI oversold
USD/MXN briefly slides below the 18.00 mark before becoming oversold and rebounding.
The short-term trend has now probably reversed and is going down. Given “the trend is your friend”, more weakness is expected as it extends lower.
USD/MXN 4-Hour Chart
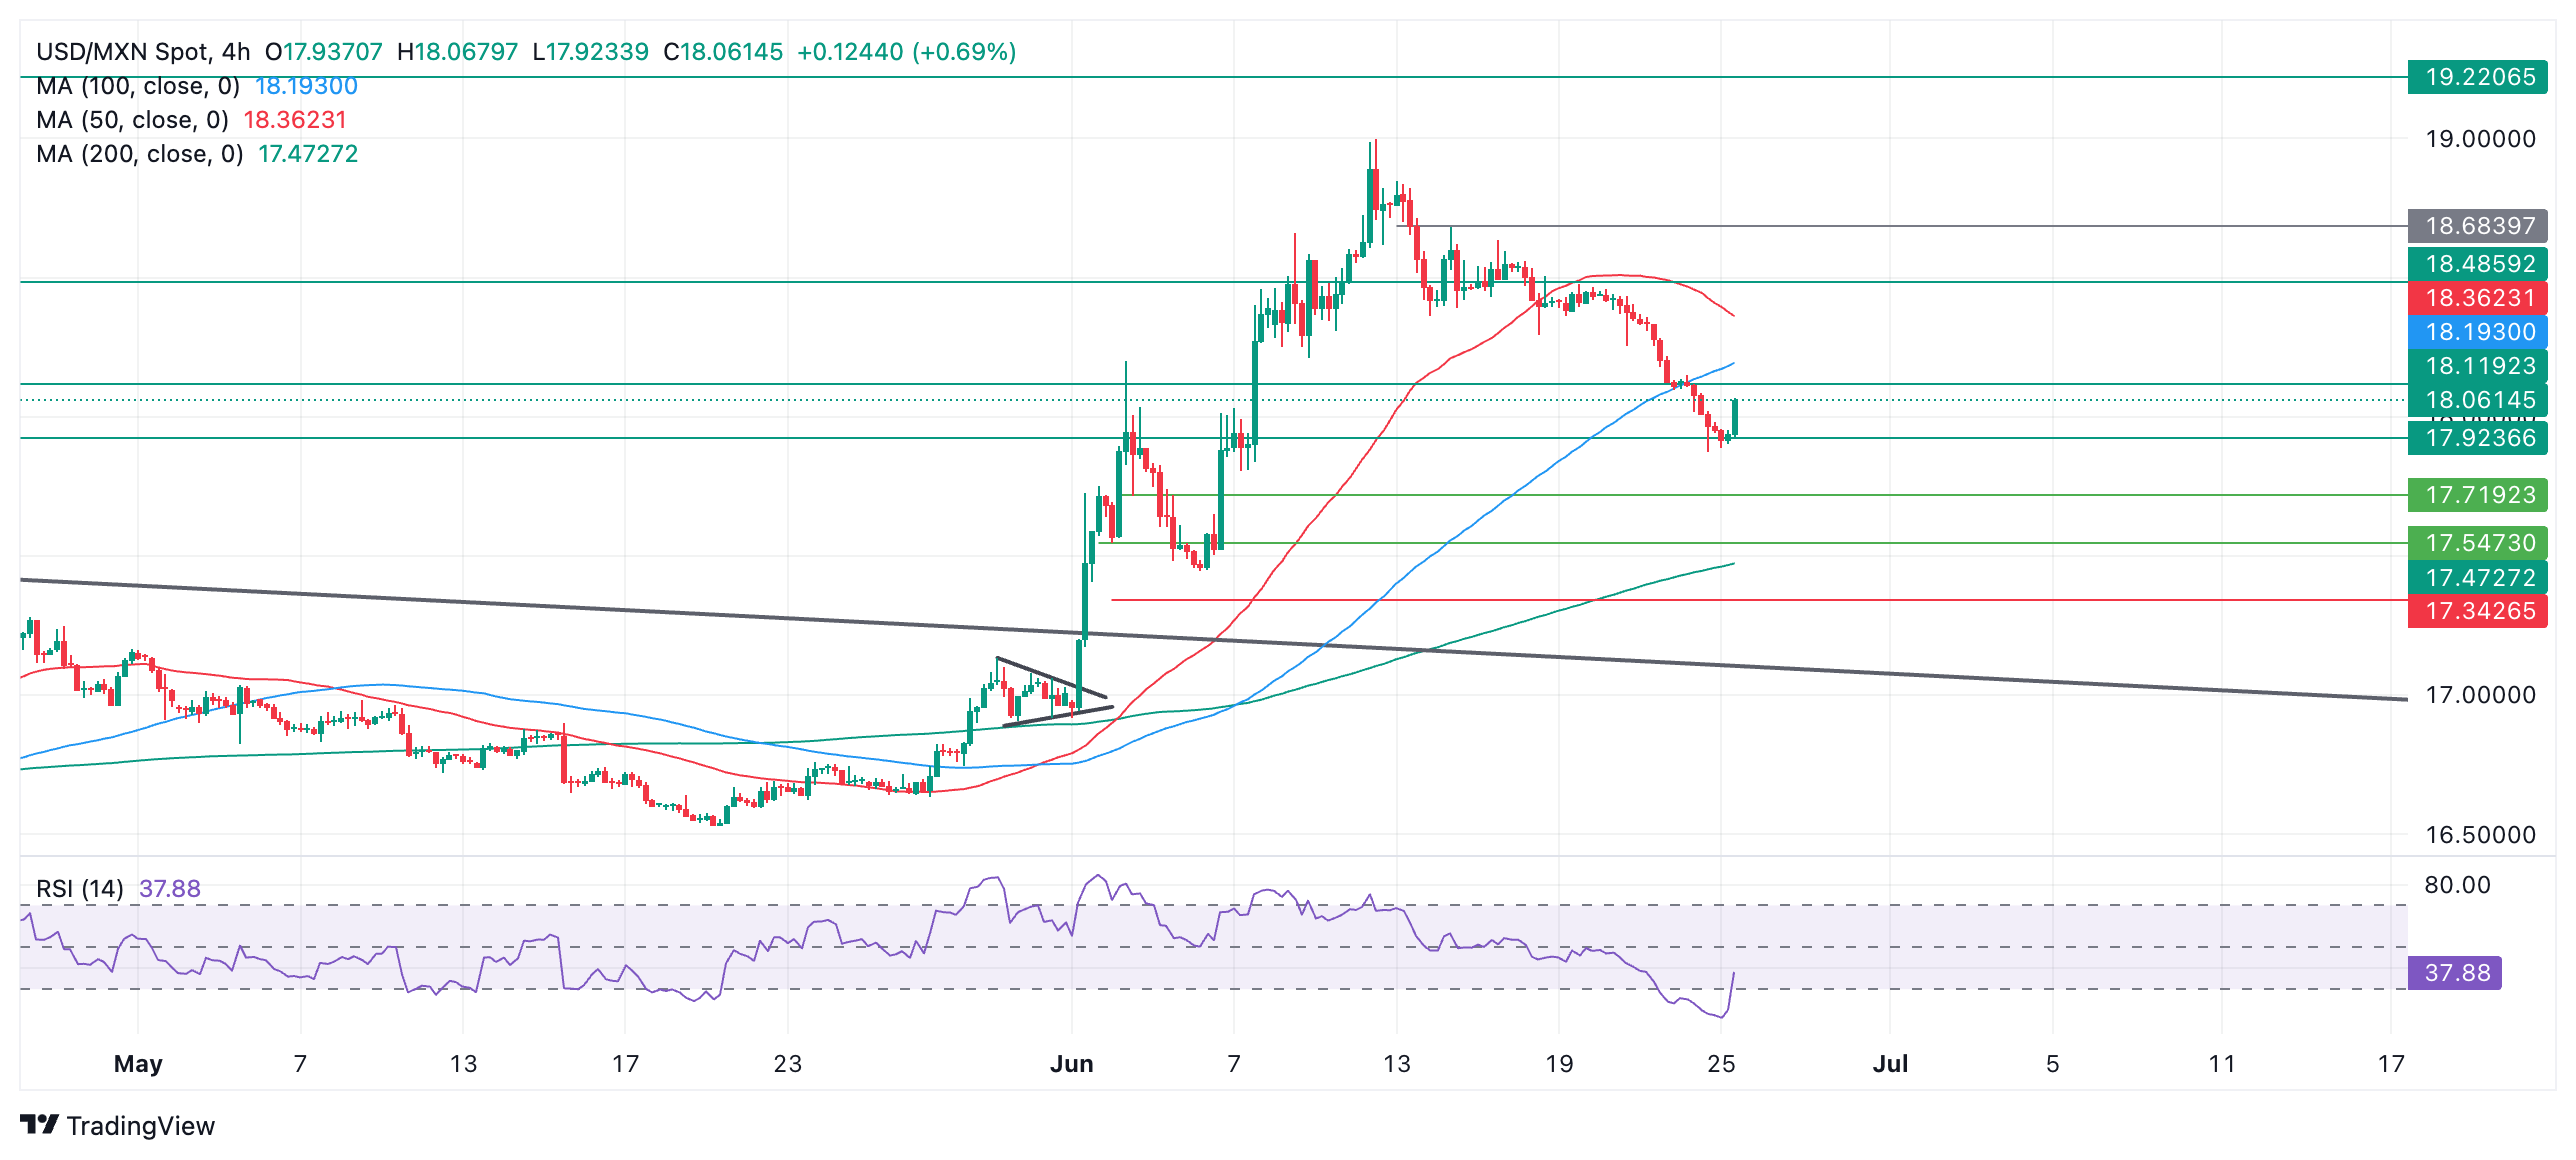
A break below 17.87 (June 24 low) would probably result in a continuation of the short-term downtrend to a target at 17.71 (a low made in the 4-hour chart on June 4), followed by 17.54 if stronger, the June 4 swing low.
The Relative Strength Index (RSI) is oversold but attempting to rise back out of the zone. If it is successful, as it is increasingly likely, it will signal a pullback higher. The 100-period Simple Moving Average in the 4-hour chart at 18.19 offers a possible peak level for the correction before it rolls over and resumes going south.
The direction of the long and intermediate-term trends remains in doubt.
Mexican Peso FAQs
The Mexican Peso (MXN) is the most traded currency among its Latin American peers. Its value is broadly determined by the performance of the Mexican economy, the country’s central bank’s policy, the amount of foreign investment in the country and even the levels of remittances sent by Mexicans who live abroad, particularly in the United States. Geopolitical trends can also move MXN: for example, the process of nearshoring – or the decision by some firms to relocate manufacturing capacity and supply chains closer to their home countries – is also seen as a catalyst for the Mexican currency as the country is considered a key manufacturing hub in the American continent. Another catalyst for MXN is Oil prices as Mexico is a key exporter of the commodity.
The main objective of Mexico’s central bank, also known as Banxico, is to maintain inflation at low and stable levels (at or close to its target of 3%, the midpoint in a tolerance band of between 2% and 4%). To this end, the bank sets an appropriate level of interest rates. When inflation is too high, Banxico will attempt to tame it by raising interest rates, making it more expensive for households and businesses to borrow money, thus cooling demand and the overall economy. Higher interest rates are generally positive for the Mexican Peso (MXN) as they lead to higher yields, making the country a more attractive place for investors. On the contrary, lower interest rates tend to weaken MXN.
Macroeconomic data releases are key to assess the state of the economy and can have an impact on the Mexican Peso (MXN) valuation. A strong Mexican economy, based on high economic growth, low unemployment and high confidence is good for MXN. Not only does it attract more foreign investment but it may encourage the Bank of Mexico (Banxico) to increase interest rates, particularly if this strength comes together with elevated inflation. However, if economic data is weak, MXN is likely to depreciate.
As an emerging-market currency, the Mexican Peso (MXN) tends to strive during risk-on periods, or when investors perceive that broader market risks are low and thus are eager to engage with investments that carry a higher risk. Conversely, MXN tends to weaken at times of market turbulence or economic uncertainty as investors tend to sell higher-risk assets and flee to the more-stable safe havens.
- Oil prices edge down slightly on Tuesday after Monday’s rally.
- Traders see pressure building with Pemex limiting refining activities again and geopolitical tensions spiraling.
- The US Dollar Index trades above 105.00, with European equities triggering a risk-off market mood.
Oil prices ease a touch on Tuesday but remain close to a six-week high after their firm uptick on Monday. Prices moved higher driven by increasing geopolitical tensions from Russia to Yemen, while supply issues in the US are also mounting. With parts of Texas reopening again after a tropical depression hit the Oil-producing region, one of the biggest refiners in the US, Pemex, said it is limiting its volumes again. Back in April, the firm faced a fire that damaged the installations, and now another plant has been forced to limit production due to a breach of air quality in the region.
Meanwhile, the US Dollar Index (DXY), which tracks the performance of the US Dollar against six major currencies, is on the front foot after a sluggish start on Monday. The Greenback benefits from a risk-off market mood on Tuesday, with Nvidia in the US and Airbus in Europe facing substantial losses, dragging major indices down.
At the time of writing, Crude Oil (WTI) trades at $81.32 and Brent Crude at $85.05.
Oil news and market movers: Pemex in the balance
- Pemex, one of the biggest refiners in the US, has cut its production in two separate plants, Bloomberg reports:
- One refinery still sees production hiccups due to a fire back in April.
- A second refinery was forced to reduce its productivity due to air quality limitations .
- Indian state-owned refiners are in talks with Russia for Ural Oil deliveries at a discounted price of around $3 to $5 below current benchmark prices after Reliance Industries Ltd. struck a deal earlier with Moscow, according to Reuters.
- The American Petroleum Institute (API) will release its weekly figures on Tuesday at 20:30 GMT. The agency reported a drawdown of 2.265 million barrels last week.
Oil Technical Analysis: Supply to get tighter
Oil prices are set to head higher before starting to ease once OPEC+ opens up the Oil tap again in full. The uptick will especially be felt in the US, where demand is expected to pick up as during summer a lot of citizens will be flying or driving for the holidays. Meanwhile, the hurricane season has started earlier than usual with already the first tropical depression having had impact on the Texas region.
On the upside, the red descending trend line near $81.00 has been broken and now needs to prove its resilience as support with both a daily and weekly close above it, not allowing any more false breaks. More room to move higher towards $87.12, the year-to-date high (April 5). Previously, a relatively small pivotal level would act as resistance near $84.00.
On the downside, the big belt of Simple Moving Averages (SMA) should work now as support and no longer allow to see moves below it. That means the 55-day SMA at $79.63, the 100-day SMA at $79.64, and the 200-day SMA at $78.90 should avoid any dips below $79.00. Should those levels not hold, another drop back to $75 could occur.
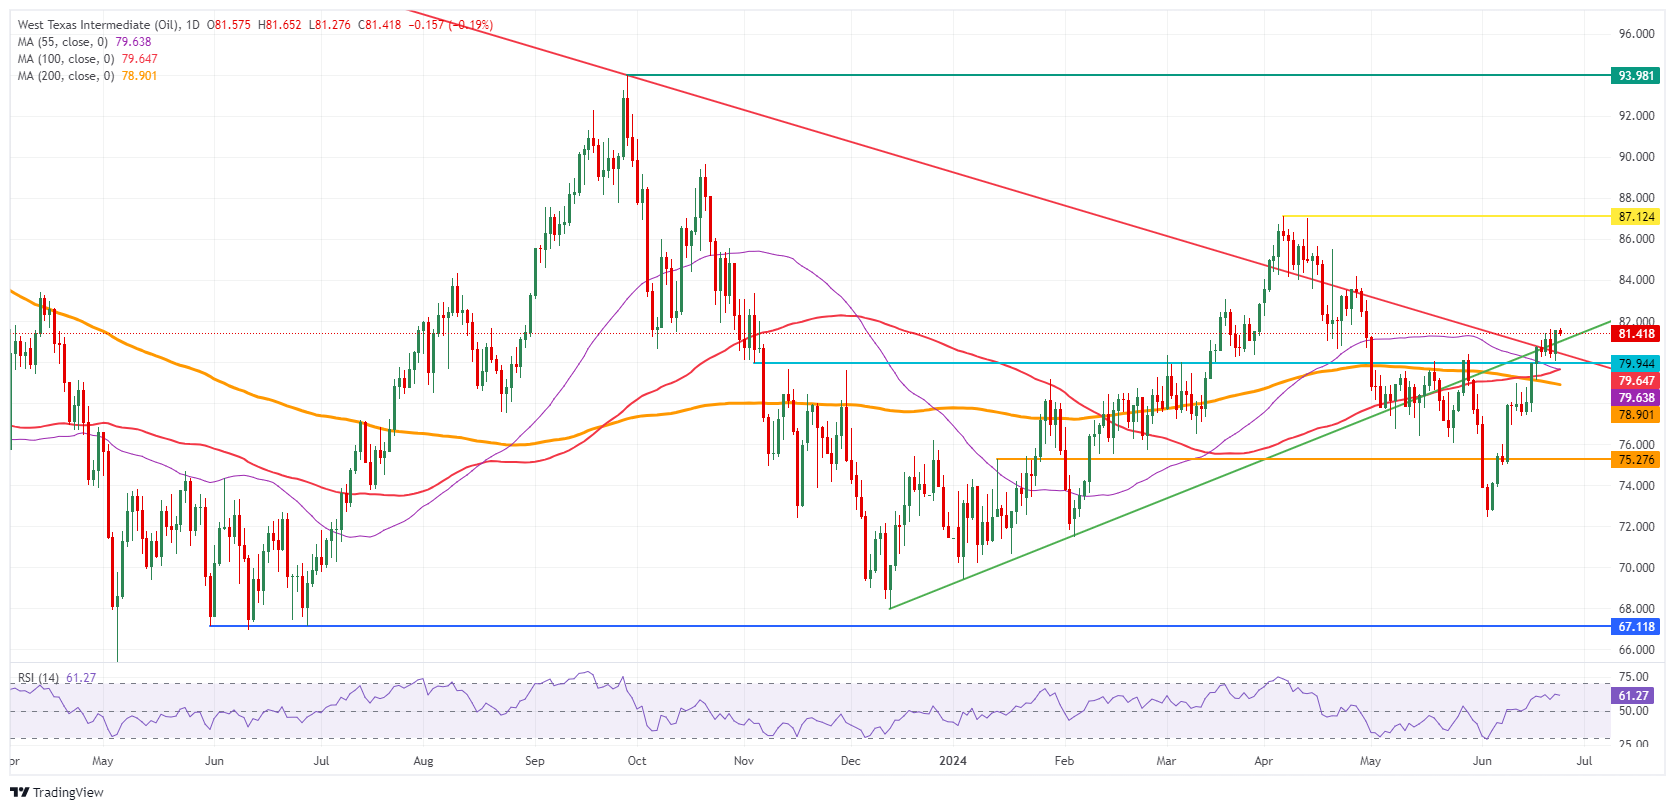
US WTI Crude Oil: Daily Chart
WTI Oil FAQs
WTI Oil is a type of Crude Oil sold on international markets. The WTI stands for West Texas Intermediate, one of three major types including Brent and Dubai Crude. WTI is also referred to as “light” and “sweet” because of its relatively low gravity and sulfur content respectively. It is considered a high quality Oil that is easily refined. It is sourced in the United States and distributed via the Cushing hub, which is considered “The Pipeline Crossroads of the World”. It is a benchmark for the Oil market and WTI price is frequently quoted in the media.
Like all assets, supply and demand are the key drivers of WTI Oil price. As such, global growth can be a driver of increased demand and vice versa for weak global growth. Political instability, wars, and sanctions can disrupt supply and impact prices. The decisions of OPEC, a group of major Oil-producing countries, is another key driver of price. The value of the US Dollar influences the price of WTI Crude Oil, since Oil is predominantly traded in US Dollars, thus a weaker US Dollar can make Oil more affordable and vice versa.
The weekly Oil inventory reports published by the American Petroleum Institute (API) and the Energy Information Agency (EIA) impact the price of WTI Oil. Changes in inventories reflect fluctuating supply and demand. If the data shows a drop in inventories it can indicate increased demand, pushing up Oil price. Higher inventories can reflect increased supply, pushing down prices. API’s report is published every Tuesday and EIA’s the day after. Their results are usually similar, falling within 1% of each other 75% of the time. The EIA data is considered more reliable, since it is a government agency.
OPEC (Organization of the Petroleum Exporting Countries) is a group of 13 Oil-producing nations who collectively decide production quotas for member countries at twice-yearly meetings. Their decisions often impact WTI Oil prices. When OPEC decides to lower quotas, it can tighten supply, pushing up Oil prices. When OPEC increases production, it has the opposite effect. OPEC+ refers to an expanded group that includes ten extra non-OPEC members, the most notable of which is Russia.
French/German yield spreads have narrowed a little and the Euro (EUR) has edged up after representatives of France's National Rally (RN) party have said the party will respect the nation's budget rules, Global Head of Markets at ING Chris Turner notes.
EUR/USD needs force to break above 1.0760
“Our eurozone macro team sees continued stress here and we would therefore warn against chasing EUR/USD back to and over 1.08, since there are still many possibly bearish chapters to play out here. One of those could be the Leftist Alliance doing a little better than expected in Sunday's elections. And while bond investors will welcome soothing words from the RN about France's budget trajectory, our team suspects it is too early for the party to be making significant concessions to its manifesto.”
“We therefore expect that the euro will struggle to sustain a rally over the coming weeks and that key euro cross rates, such as EUR/AUD and EUR/NOK, will come lower. These moves should accelerate should US inflation indeed come in on the low side. EUR/USD may therefore struggle to break to the topside of its 1.0660-1.0760 range.”
The US Dollar (USD) continues to lack a significant trend and remains to the topside of a two-month trading range. US interest rate volatility remains subdued and that means interest has resumed in the yen-funded carry trade, Chris Turner, Global Head of Markets at ING, notes.
US presidential debate and core PCE to drive USD moves
“The dollar remains sidelined ahead of two key event risks later this week. Thursday night sees the first presidential debate between President Biden and Donald Trump on CNN. It may be too early to expect this, but we will want to see whether the dollar responds to who 'wins' the debate.”
“But the bigger market mover this week will be Friday's core PCE inflation read. Should it meet expectations of a 0.1% month-on-month reading, we suspect the short-end of the US curve can come lower and take the dollar with it. However, most of any dollar downside will be felt against the likes of the Australian dollar and the Norwegian krone.”
“The US data calendar is quiet today apart from what is expected to be a modest dip in US June consumer confidence. DXY to trade well within a 105.00 to 106.00 range.”
- USD/JPY faces pressure in an attempt to recapture 160.00 as fears of Japan’s intervention deepen.
- The BoJ looks to raise interest rates further as weak Yen continues to boost inflationary pressures.
- The US Dollar will be guided by the US core PCE inflation data for May.
The USD/JPY pair exhibits a subdued performance slightly below the psychological resistance of 160.00 in Tuesday’s European session. The rally in the asset appears to have stalled as investors expect a stealth intervention by Japan’s authority against excessive FX moves to limit the downside in the Japanese Yen.
Fears of Japan’s intervention in the FX domain intensified after country’s main currency diplomat Masato Kanda said on Monday that the government would intervene around the clock if necessary.
Also, expectations for the Bank of Japan (BoJ) to tighten policy further have improved as weak Yen is resulting in higher inflation by making exports competitive in global markets and increasing import costs. The BoJ minutes for the latest meeting showed that one member advocated for an increase "without too much delay" to help bring inflation back down, Reuters reported.
Meanwhile, the US Dollar (USD) struggles to gain ground as investors expect that the Federal Reserve (Fed) will deliver two rate cuts this year and will choose the September meeting to begin the policy-normalization process. This week, the major trigger for the US Dollar will be the United States (US) core Personal Consumption Expenditure price index (PCE) for May, which will be published on Friday.
USD/JPY hovers near the horizontal resistance of the Ascending Triangle chart formation on a daily timeframe, which is plotted from April 29 high of 160.32. The upward-sloping border of the above-mentioned chart pattern is placed from March 11 low near 146.50.
Advancing 20- and 50-day Exponential Moving Averages (EMAs) near 157.70 and 156.10, respectively, indicate that the overall trend is bullish.
The 14-day Relative Strength Index (RSI) oscillates inside the 60.00-80.00 range, suggesting that momentum is already in favor of bulls.
More upside would appear if the asset breaks above multi-year high of 160.00. Breach of the latter will expose the pair in unchartered territory towards 162.00
On the flip side, a breakdown below May 16 low at 153.60 will expose the asst towards May 3 low at 151.86, followed by the psychological support of 150.00.
USD/JPY daily chart
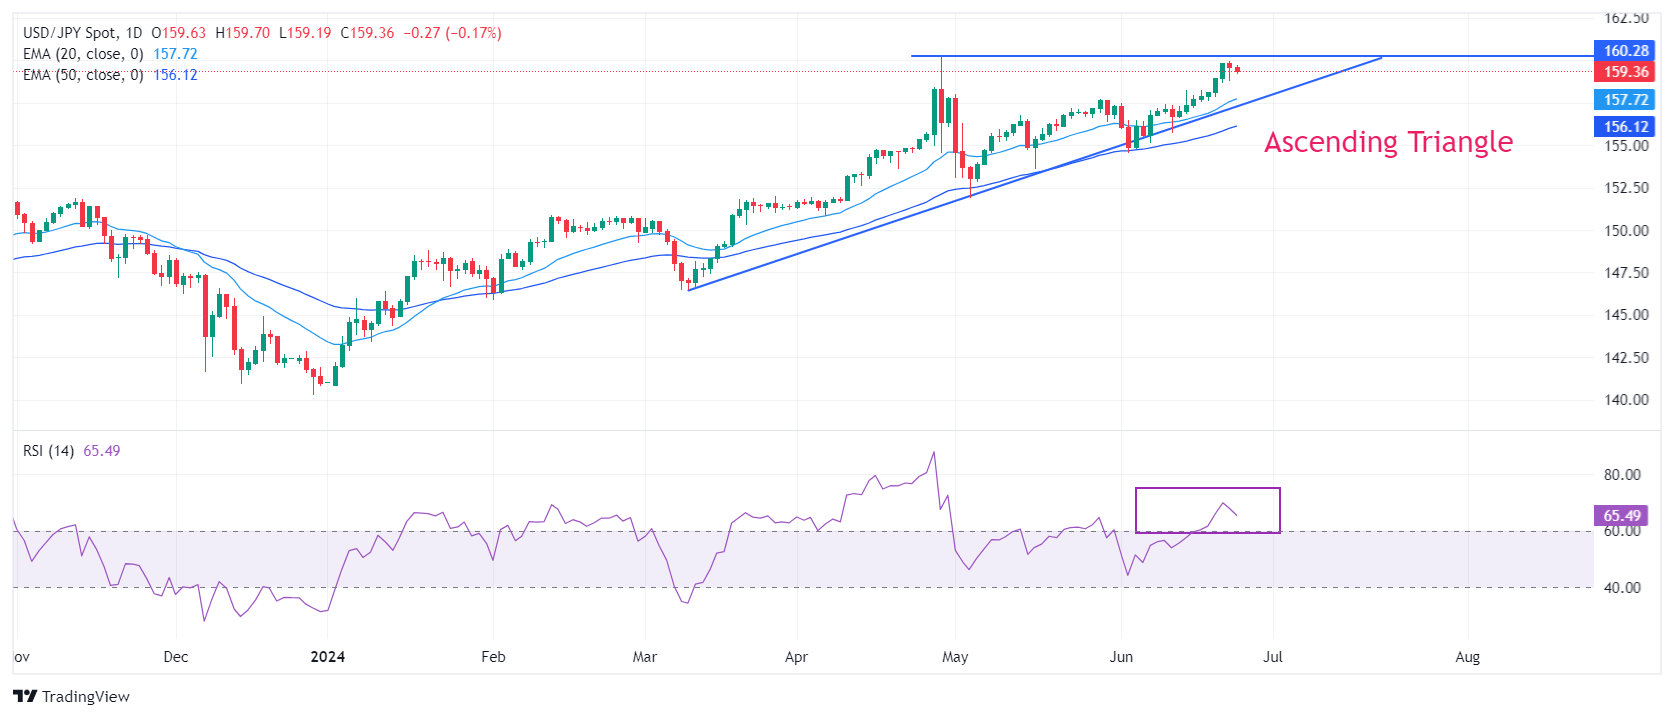
The US Dollar (USD) is likely to trade in a sideways range of 7.2750/7.2910. Resistance levels to watch are 7.3000 and 7.3100, UOB Group analysts note.
Resistance lies at 7.3000 and 7.3100
24-HOUR VIEW: “We indicated yesterday that USD ‘could continue to trade sideways, likely in a range of 7.2850/7.2950.’ USD then traded in a wider range than expected (7.2771/7.2937), closing slightly lower by 0.12% at 7.2830. The price movements still appear to be part of a sideways trading phase. That said, the slightly softened underlying tone suggests USD is likely to trade in a lower range of 7.2750/7.2910.”
1-3 WEEKS VIEW: “We have expected USD to strengthen since early last week. In our latest update from last Friday (21 Jun, spot at 7.2920), we indicated that ‘further USD strength is likely, and the resistance levels to watch are 7.3000 and 7.3100.’ Yesterday, USD eked out a fresh high of 7.2937 before pulling back. There has been a slight slowdown in momentum, but only a breach of 7.2700 (no change in ‘strong support’ level) would mean that USD is not strengthening further.”
The US Dollar (USD) is likely to trade sideways between 159.35 and 159.95. It could break above 160.00 but note that there is another resistance level at 160.25, UOB Group FX strategists suggest.
USD/JPY has a chance to break above 160.00
24-HOUR VIEW: “Yesterday, we held the view that ‘as long as USD remains above 159.30, it could rise above 160.00, potentially reaching 160.25.’ The subsequent price action did not evolve as we expected. USD dropped sharply, but briefly to 159.31 before recovering to close at 159.59 (-0.13%). The price action is likely part of a sideways trading phase. Today, we expect USD to trade between 159.35 and 159.95.”
1-3 WEEKS VIEW: “We continue to hold the same view as yesterday (24 Jun, spot at 159.85). As highlighted, USD could break above 160.00, but note that there is another resistance level at 160.25. On the downside, should USD break below 158.80 (no change in ‘strong support’ level), it would indicate that the USD strength from early last week has eased.”
- The Pound Sterling performs stronger against the US Dollar as markets widely expect the Fed to deliver two interest-rate cuts this year.
- Investors expect that the BoE will start reducing key rates in August.
- Investors will focus on the US core PCE inflation data for May this week.
The Pound Sterling (GBP) performs relatively stronger against most currencies, except for the Japanese Yen (JPY) and the Australian Dollar (AUD) in Tuesday’s London session. The British currency remains upbeat amid uncertainty about when the Bank of England (BoE) will start cutting interest rates.
Market expectations indicate that the BoE will announce a cut in interest rates in August, the first one since the Covid-19 pandemic hit. Speculation for BoE rate cuts in August has strengthened as policymakers signaled in the latest policy meeting that they are closer to starting to roll back their restrictive interest rate stance.
BoE Governor Andrew Bailey said in the monetary policy statement that the decision to keep interest rates unchanged at 5.25% in the last meeting was “finely balanced”. Seven officials voted to keep key rates steady while policymakers Swati Dhingra and Deputy Governor Dave Ramsden voted for a rate cut.
The BoE said the return of the annual headline inflation to the bank’s target of 2% is welcome news. However, it is still not enough for rate cuts. BoE policymakers remain worried about stubborn wage inflation, which is posing upside risks to price pressures in the service sector.
Daily digest market movers: Pound Sterling holds gains
- The Pound Sterling moves higher against the US Dollar (USD) to around the round-level resistance of 1.2700. The GBP/USD pair holds recovery from a five-week low of 1.2620 as the US Dollar (USD) has corrected due to firm speculation that the Federal Reserve (Fed) will start cutting interest rates from the September meeting. The US Dollar Index (DXY), which tracks the Greenback’s value against six major currencies, drops to 105.40 from a seven-week high of 105.90.
- According to the CME FedWatch tool, 30-day Federal Funds Futures pricing data indicates that there will be two rate cuts and the central bank will lower borrowing rates subsequently in the November or December meeting.
- Contrary to market expectations, Fed officials expect only one rate-cut this year as they say they want to see inflation declining for months before pivoting to policy normalization. In an interview with CNBC on Monday, Chicago Fed Bank President Austan Goolsbee said that he is “very optimistic” about a further improvement in the inflation data, which will open room for potential rate cuts.
- On the economic data front, investors will focus on the core US core Personal Consumption Expenditure price index (PCE) for May, which will be published on Friday. The core PCE price index data is the Fed’s preferred inflation measure, and it is expected to provide fresh cues on when the central bank will start reducing interest rates this year. Soft figures would boost expectations of the Fed to begin easing borrowing rates from September, while hot numbers will likely delay any rate cuts towards the end of the year.
Pound Sterling Price Today:
British Pound PRICE Today
The table below shows the percentage change of British Pound (GBP) against listed major currencies today. British Pound was the strongest against the Swiss Franc.
| USD | EUR | GBP | JPY | CAD | AUD | NZD | CHF | |
|---|---|---|---|---|---|---|---|---|
| USD | 0.03% | -0.07% | -0.10% | -0.00% | -0.03% | -0.02% | 0.06% | |
| EUR | -0.03% | -0.11% | -0.14% | -0.04% | -0.07% | -0.01% | 0.01% | |
| GBP | 0.07% | 0.11% | -0.04% | 0.08% | 0.06% | 0.10% | 0.14% | |
| JPY | 0.10% | 0.14% | 0.04% | 0.09% | 0.08% | 0.11% | 0.16% | |
| CAD | 0.00% | 0.04% | -0.08% | -0.09% | -0.04% | 0.02% | 0.07% | |
| AUD | 0.03% | 0.07% | -0.06% | -0.08% | 0.04% | 0.05% | 0.10% | |
| NZD | 0.02% | 0.01% | -0.10% | -0.11% | -0.02% | -0.05% | 0.05% | |
| CHF | -0.06% | -0.01% | -0.14% | -0.16% | -0.07% | -0.10% | -0.05% |
The heat map shows percentage changes of major currencies against each other. The base currency is picked from the left column, while the quote currency is picked from the top row. For example, if you pick the British Pound from the left column and move along the horizontal line to the US Dollar, the percentage change displayed in the box will represent GBP (base)/USD (quote).
Technical Analysis: Pound Sterling clings to recovery near 1.2700
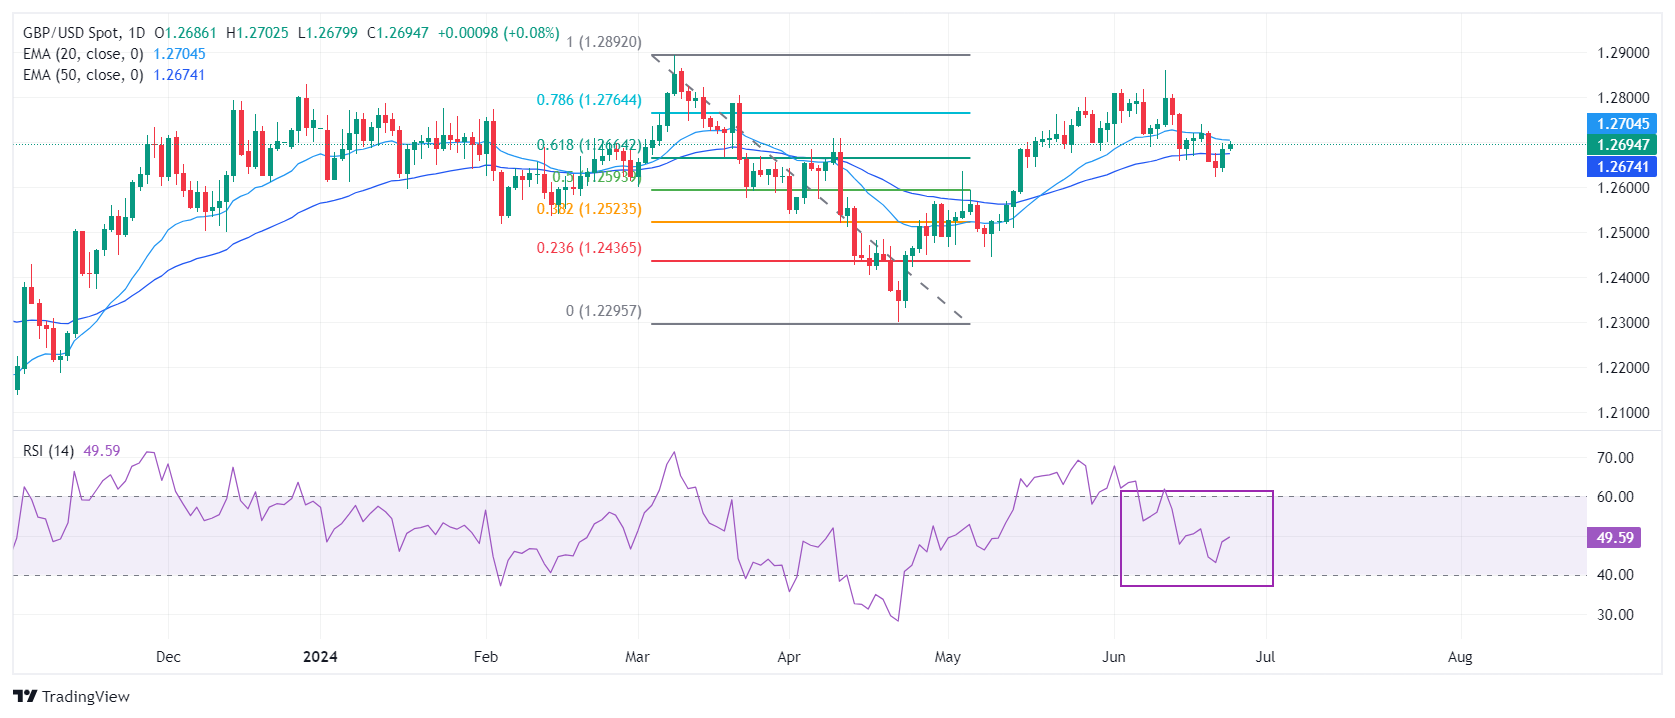
The Pound Sterling advances to around 1.2700 against the US Dollar after recovering from the crucial support of 1.2620. The GBP/USD pair gathers strength to sustain above the 20-day and 50-day Exponential Moving Averages (EMAs), which trade around 1.2700 and 1.2670, respectively.
The Cable also trades above the 61.8% Fibonacci retracement support at 1.2667, plotted from the March 8 high of 1.2900 to the April 22 low at 1.2300.
The 14-day Relative Strength Index (RSI) oscillates inside the 40.00-60.00 range, indicating a consolidation trend ahead.
Pound Sterling FAQs
The Pound Sterling (GBP) is the oldest currency in the world (886 AD) and the official currency of the United Kingdom. It is the fourth most traded unit for foreign exchange (FX) in the world, accounting for 12% of all transactions, averaging $630 billion a day, according to 2022 data. Its key trading pairs are GBP/USD, aka ‘Cable’, which accounts for 11% of FX, GBP/JPY, or the ‘Dragon’ as it is known by traders (3%), and EUR/GBP (2%). The Pound Sterling is issued by the Bank of England (BoE).
The single most important factor influencing the value of the Pound Sterling is monetary policy decided by the Bank of England. The BoE bases its decisions on whether it has achieved its primary goal of “price stability” – a steady inflation rate of around 2%. Its primary tool for achieving this is the adjustment of interest rates. When inflation is too high, the BoE will try to rein it in by raising interest rates, making it more expensive for people and businesses to access credit. This is generally positive for GBP, as higher interest rates make the UK a more attractive place for global investors to park their money. When inflation falls too low it is a sign economic growth is slowing. In this scenario, the BoE will consider lowering interest rates to cheapen credit so businesses will borrow more to invest in growth-generating projects.
Data releases gauge the health of the economy and can impact the value of the Pound Sterling. Indicators such as GDP, Manufacturing and Services PMIs, and employment can all influence the direction of the GBP. A strong economy is good for Sterling. Not only does it attract more foreign investment but it may encourage the BoE to put up interest rates, which will directly strengthen GBP. Otherwise, if economic data is weak, the Pound Sterling is likely to fall.
Another significant data release for the Pound Sterling is the Trade Balance. This indicator measures the difference between what a country earns from its exports and what it spends on imports over a given period. If a country produces highly sought-after exports, its currency will benefit purely from the extra demand created from foreign buyers seeking to purchase these goods. Therefore, a positive net Trade Balance strengthens a currency and vice versa for a negative balance.
Silver prices (XAG/USD) rose on Tuesday, according to FXStreet data. Silver trades at $29.60 per troy ounce, down 0.01% from the $29.58 it cost on Monday.
Silver prices have increased by 24.38% since the beginning of the year.
| Unit measure | Silver Price Today in USD |
|---|---|
| Troy Ounce | 29.60 |
| 1 Gram | 0.95 |
The Gold/Silver ratio, which shows the number of ounces of Silver needed to equal the value of one ounce of Gold, stood at 78.74 on Tuesday, down from 78.92 on Monday.
Silver FAQs
Silver is a precious metal highly traded among investors. It has been historically used as a store of value and a medium of exchange. Although less popular than Gold, traders may turn to Silver to diversify their investment portfolio, for its intrinsic value or as a potential hedge during high-inflation periods. Investors can buy physical Silver, in coins or in bars, or trade it through vehicles such as Exchange Traded Funds, which track its price on international markets.
Silver prices can move due to a wide range of factors. Geopolitical instability or fears of a deep recession can make Silver price escalate due to its safe-haven status, although to a lesser extent than Gold's. As a yieldless asset, Silver tends to rise with lower interest rates. Its moves also depend on how the US Dollar (USD) behaves as the asset is priced in dollars (XAG/USD). A strong Dollar tends to keep the price of Silver at bay, whereas a weaker Dollar is likely to propel prices up. Other factors such as investment demand, mining supply – Silver is much more abundant than Gold – and recycling rates can also affect prices.
Silver is widely used in industry, particularly in sectors such as electronics or solar energy, as it has one of the highest electric conductivity of all metals – more than Copper and Gold. A surge in demand can increase prices, while a decline tends to lower them. Dynamics in the US, Chinese and Indian economies can also contribute to price swings: for the US and particularly China, their big industrial sectors use Silver in various processes; in India, consumers’ demand for the precious metal for jewellery also plays a key role in setting prices.
Silver prices tend to follow Gold's moves. When Gold prices rise, Silver typically follows suit, as their status as safe-haven assets is similar. The Gold/Silver ratio, which shows the number of ounces of Silver needed to equal the value of one ounce of Gold, may help to determine the relative valuation between both metals. Some investors may consider a high ratio as an indicator that Silver is undervalued, or Gold is overvalued. On the contrary, a low ratio might suggest that Gold is undervalued relative to Silver.
(An automation tool was used in creating this post.)
The New Zealand Dollar (NZD) is likely to trade in a sideways range of 0.6100/0.6140 or drift lower towards 0.6085, UOB Group analysts note.
NZD to drift lower towards 0.6085
24-HOUR VIEW: “We highlighted yesterday that NZD ‘is expected to drift lower.’ We added, ‘0.6085 is likely out of reach.’ Our view did not materialise as NZD traded in a range of 0.6105/0.6140, closing largely unchanged at 0.6124 (+0.08%). There has been no increase in either downward or upward momentum. In other words, NZD is likely to trade sideways today, probably between 0.6100 and 0.6140.”
1-3 WEEKS VIEW: “Our most recent narrative was from last Tuesday (18 Jun, spot at 0.6130), wherein ‘as long as NZD remains below 0.6180, it could drift lower towards the support at 0.6085.’ While we continue to expect NZD to drift lower towards 0.6085, the ‘strong resistance’ level has moved lower to 0.6160 from 0.6180.”
Following a meeting with his South Korean counterpart Choi Sang-mok on Tuesday, Japanese Finance Minister Shunichi Suzuki said that they “will continue to take appropriate steps to respond to the declining value of the currency.”
Additional comments
Japan, South Korea share serious concerns on respective currency depreciation.
Will closely monitor currency movements.
Market reaction
The Japanese Yen is holding the recovery gains following these intervention warnings, with USD/JPY losing 0.08% on the day to trade at around 159.45, as of writing.
Japanese Yen FAQs
The Japanese Yen (JPY) is one of the world’s most traded currencies. Its value is broadly determined by the performance of the Japanese economy, but more specifically by the Bank of Japan’s policy, the differential between Japanese and US bond yields, or risk sentiment among traders, among other factors.
One of the Bank of Japan’s mandates is currency control, so its moves are key for the Yen. The BoJ has directly intervened in currency markets sometimes, generally to lower the value of the Yen, although it refrains from doing it often due to political concerns of its main trading partners. The current BoJ ultra-loose monetary policy, based on massive stimulus to the economy, has caused the Yen to depreciate against its main currency peers. This process has exacerbated more recently due to an increasing policy divergence between the Bank of Japan and other main central banks, which have opted to increase interest rates sharply to fight decades-high levels of inflation.
The BoJ’s stance of sticking to ultra-loose monetary policy has led to a widening policy divergence with other central banks, particularly with the US Federal Reserve. This supports a widening of the differential between the 10-year US and Japanese bonds, which favors the US Dollar against the Japanese Yen.
The Japanese Yen is often seen as a safe-haven investment. This means that in times of market stress, investors are more likely to put their money in the Japanese currency due to its supposed reliability and stability. Turbulent times are likely to strengthen the Yen’s value against other currencies seen as more risky to invest in.
- Gold trades firmly in its range as traders await more news and data before taking positions.
- The Fed’s preferred gauge of inflation is out on Friday and could move the Gold price.
- XAU/USD’s break above key resistance fails to follow through, throwing the technical picture into confusion.
Gold (XAU/USD) trades in familiar territory in the $2,320s on Tuesday, amid a subdued market mood after a mixed session for Asian stocks and investor loss of appetite for tech stocks on Monday.
Gold yo-yos as investors await fresh cues
Gold trades about a third of a percent lower on Tuesday, still stuck in a range, amid a cautious market mood as investors await fresh macroeconomic and political news.
Of key interest will be the US Personal Consumption Expenditures (PCE) Price Index for May out on Friday, the Federal Reserve’s (Fed) preferred inflation gauge.
Speeches from Fed members' Lisa Cook and Michelle Bowman on Tuesday could provide further clues on the trajectory of interest rates in the US, a key driver of Gold since it dictates the opportunity cost of holding the non-coupon bearing asset.
On Monday, San Francisco Fed President Mary Daly said she does not believe the Fed should cut rates before it is confident that inflation is headed towards 2%. At the same time Daly cautioned about not focusing on inflation to the detriment of the labor market. If unemployment continued to rise the Fed could cut rates to support demand and the labor market, according to Reuters.
The market-based probabilities of an interest-rate cut at (or before) the Fed’s September meeting remain relatively elevated at 67% compared to circa 50% last week, according to the CME FedWatch tool, which calculates chances using Fed Funds Futures prices. Such a cut would be a bullish event for Gold.
Geopolitical tensions swirl
Geopolitical factors are a key driver of Gold due to its safe-haven qualities. Upcoming elections in France and the United Kingdom could throw curve balls into the geopolitical arena as polls show a material risk of a lurch to the far right in France. In the UK, Labor looks likely to romp home on July 4 but the right-wing Reform Party continues to gather support at the expense of the Conservatives amidst fresh allegations of sleaze.
Geopolitical tensions remain elevated in the Middle East after a US-backed proposal to end the eight-month war in Gaza ran aground on Tuesday. Israeli Prime Minister Benjamin Netanyahu only agreed to a “partial ceasefire”, according to Aljazeera news.
In addition, fears of an “all-out” war with Lebanon remain alive after the Israeli government told residents of northern Israel, evacuated because of the escalating conflict with Hezbollah, not to return to their homes until the end of August, according to Israeli media.
Russia has said the US is responsible for a strike that killed at least four people including children, and injured 151 others on a crowded beach in Crimea. Russia’s foreign ministry warned retaliation would “definitely follow”. The ATACMS missiles that caused the damage were US-made but the US denied responsibility, saying it “regretted any loss of civilian life” but that Ukraine made its own “targeting decisions”, according to Aljazeera.
Technical Analysis: Gold upside break reverses
Although Gold decisively broke above a key resistance level at the 50-day Simple Moving Average (SMA) and a trendline connecting the May 7 and June 20 highs, it failed to follow through. The precious metal only managed to rally up to a peak at $2,369 on June 21 before rolling over suddenly and plummeting. It has now fallen back below the trendline it originally breached.
The break technically invalidated the bearish Head-and-Shoulders (H&S) pattern that had been forming on the daily chart. However, given bulls could not sustain the upside, it has left the outlook confused. The H&S remains invalid according to technical guidelines, but there is also a possibility that a more complex topping pattern could be forming that might nevertheless prove bearish. In other words, a complex or multi-shouldered bearish H&S might still be forming.
XAU/USD Daily Chart
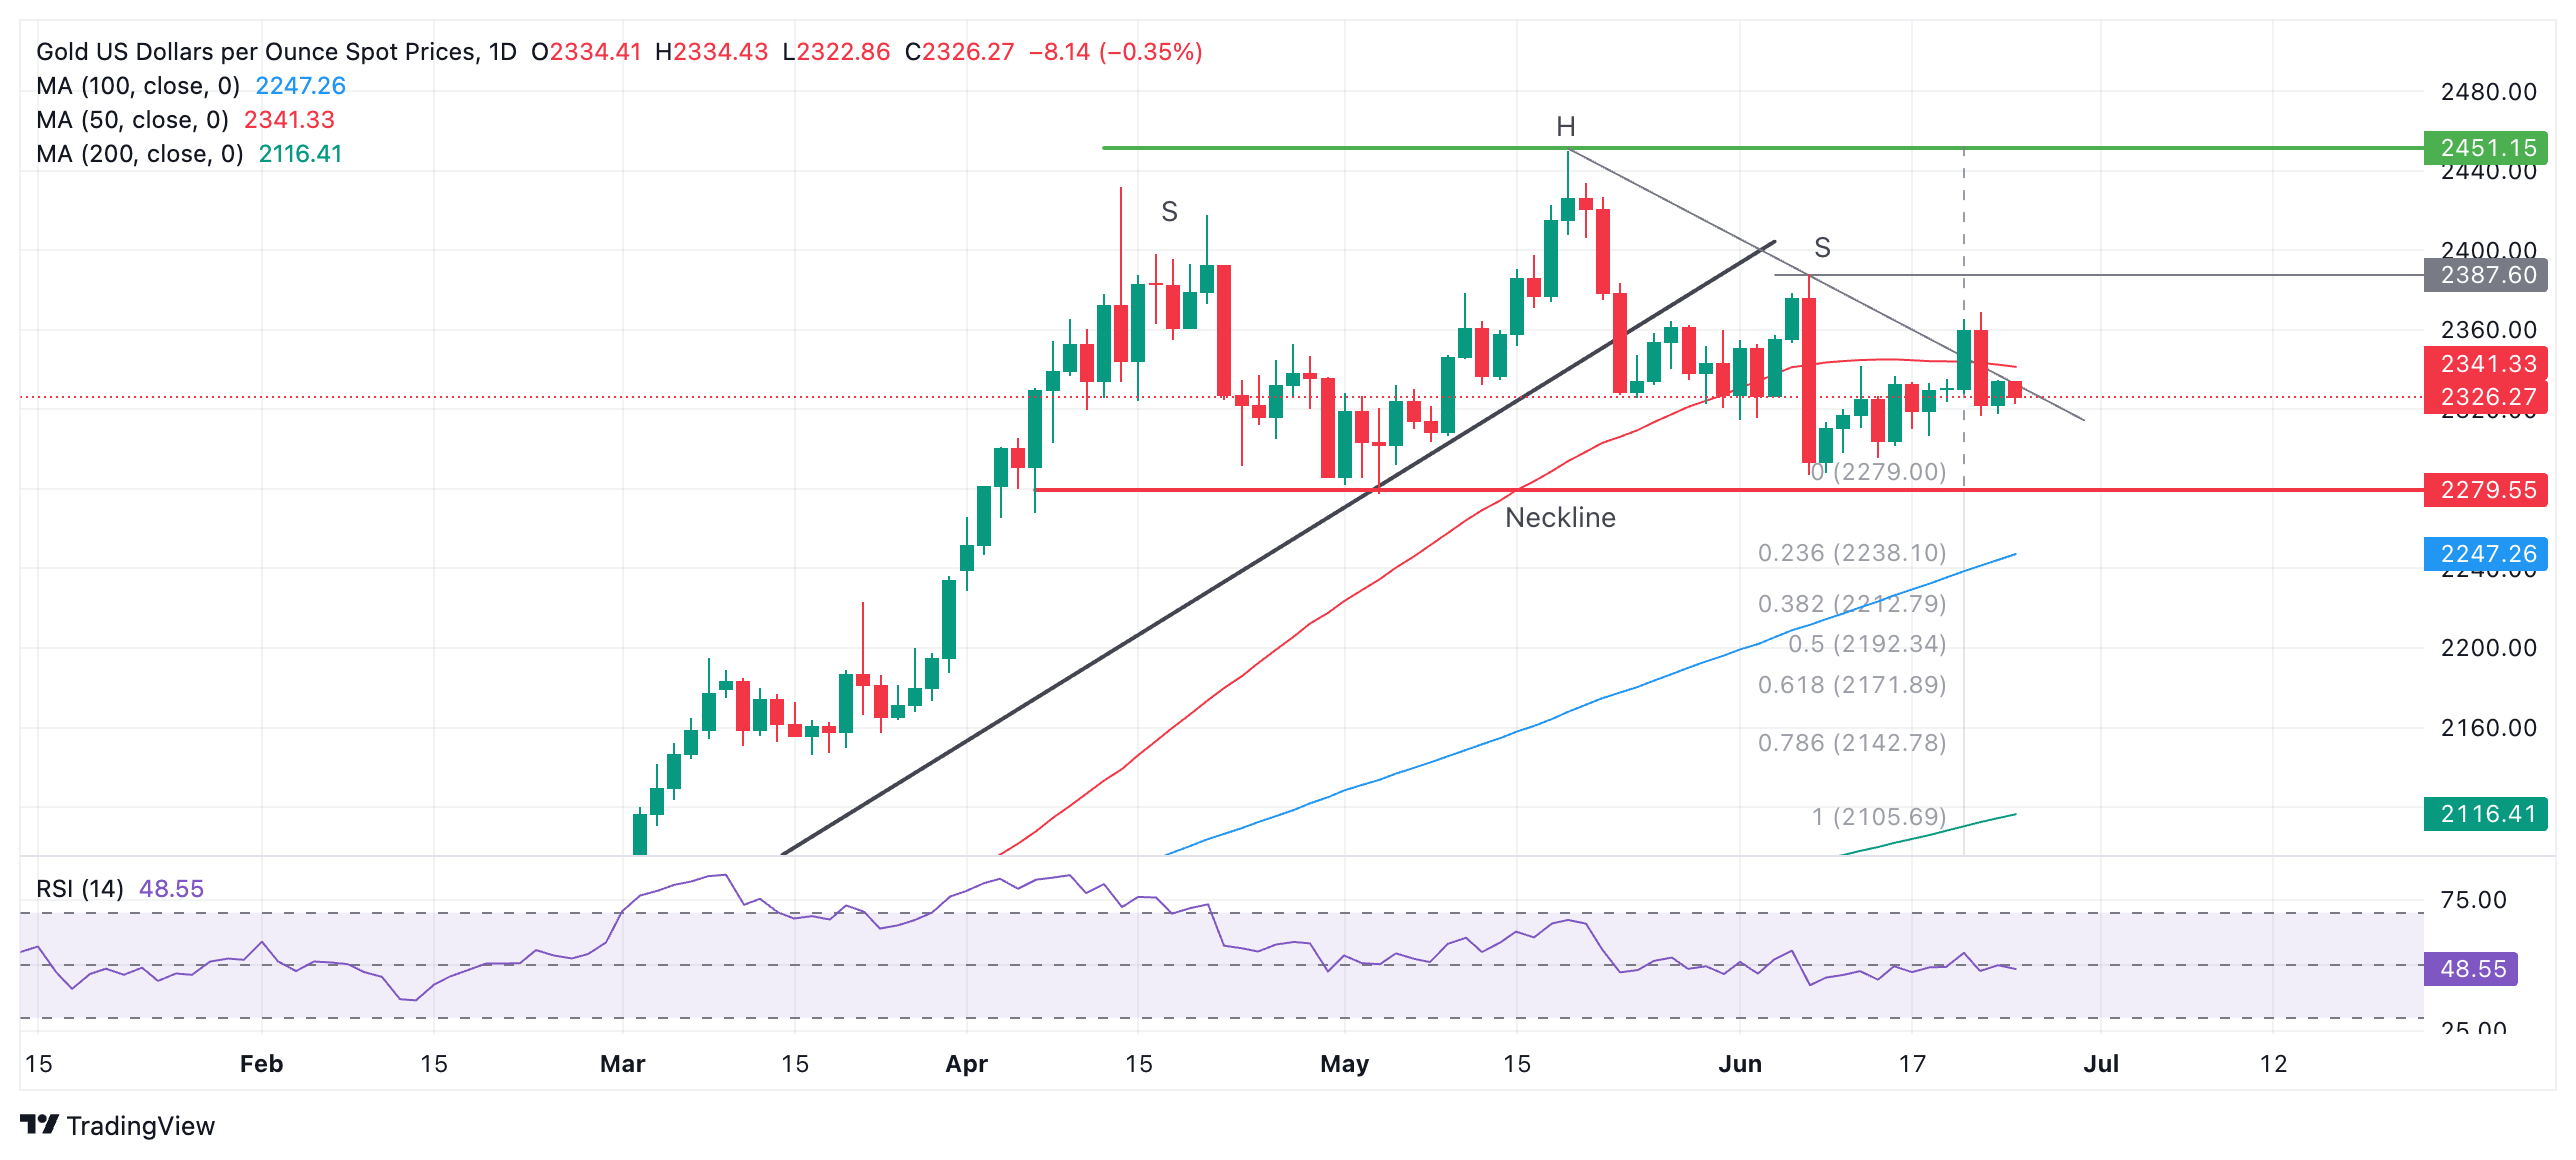
If so, then a break below the pattern’s neckline at $2,279 would provide confirmation of a reversal lower, with a conservative target at $2,171, and a second target at $2,105.
At the same time, it is also still possible Gold could find its feet and continue higher. Gold’s original break above the trendline and the 50-day SMA was supposed to reach an initial, conservative target in the mid $2,380s (June 7 high), and it is still possible it could reach that target despite the fallback.
However, it would require a break above $2,350 to confirm a run up to the June 7 high. A further break above that might indicate a continuation up to the May – and all-time – high at $2,450.
A break above that would confirm a resumption of the broader uptrend.
There is a risk the trend may also now be sideways in both the short and medium term. In the longer term, Gold remains in an uptrend.
Gold FAQs
Gold has played a key role in human’s history as it has been widely used as a store of value and medium of exchange. Currently, apart from its shine and usage for jewelry, the precious metal is widely seen as a safe-haven asset, meaning that it is considered a good investment during turbulent times. Gold is also widely seen as a hedge against inflation and against depreciating currencies as it doesn’t rely on any specific issuer or government.
Central banks are the biggest Gold holders. In their aim to support their currencies in turbulent times, central banks tend to diversify their reserves and buy Gold to improve the perceived strength of the economy and the currency. High Gold reserves can be a source of trust for a country’s solvency. Central banks added 1,136 tonnes of Gold worth around $70 billion to their reserves in 2022, according to data from the World Gold Council. This is the highest yearly purchase since records began. Central banks from emerging economies such as China, India and Turkey are quickly increasing their Gold reserves.
Gold has an inverse correlation with the US Dollar and US Treasuries, which are both major reserve and safe-haven assets. When the Dollar depreciates, Gold tends to rise, enabling investors and central banks to diversify their assets in turbulent times. Gold is also inversely correlated with risk assets. A rally in the stock market tends to weaken Gold price, while sell-offs in riskier markets tend to favor the precious metal.
The price can move due to a wide range of factors. Geopolitical instability or fears of a deep recession can quickly make Gold price escalate due to its safe-haven status. As a yield-less asset, Gold tends to rise with lower interest rates, while higher cost of money usually weighs down on the yellow metal. Still, most moves depend on how the US Dollar (USD) behaves as the asset is priced in dollars (XAU/USD). A strong Dollar tends to keep the price of Gold controlled, whereas a weaker Dollar is likely to push Gold prices up.
- USD/CAD extends its losing streak ahead of Canada’s inflation data release on Tuesday.
- Lower WTI price may limit the upside of the commodity-linked Canadian Dollar.
- Fed’s Austan Goolsbee said that the Fed might need to consider the impact of restrictive policy on the US economy.
USD/CAD continues its losing streak that began on June 14, trading around 1.3650 during the European session on Tuesday. Statistics Canada is set to release the top-tier Consumer Price Index (CPI) data for May later in the North American session.
Also read: Canada CPI Preview: Inflation expected to continue easing in May
The downward correction in the crude Oil prices put pressure on the commodity-linked Canadian Dollar (CAD) as Canada is the largest crude Oil exporter to the United States (US). West Texas Intermediate (WTI), the US crude Oil benchmark, trades around $81.40, at the time of writing. However, Crude prices may limit its downside on the hope for a strong summer driving demand and Oil supply concerns amid the ongoing geopolitical tensions in the Middle East.
The US Dollar (USD) received downward pressure from dovish comments from Chicago Fed President Austan Goolsbee, which in turn undermines the USD/CAD pair. On Monday, Goolsbee said in a chat show on CNBC’s Squawk Box that the Federal Reserve might need to consider whether the restrictive policy is putting too much pressure on the economy.
US Dollar Index (DXY), which measures the value of the US Dollar against six other major currencies, remains softer ahead of the revised US Gross Domestic Product (GDP) for the first quarter (Q1) is set to be released on Thursday, followed by the Personal Consumption Expenditure (PCE) Price Index on Friday.
The Australian Dollar (AUD) is likely to consolidate between 0.6635 and 0.6675 for the time being, analysts at UOB Group note.
AUD/USD is rangebound for the time being
24-HOUR VIEW: “We noted yesterday that “downward momentum has increased slightly, and AUD is likely to drift lower.’ However, we were of the view that “any decline is unlikely to reach 0.6600.’ Our view was incorrect, as after dipping to a low of 0.6627, AUD rose to a high of 0.6668. The recovery did not result in any clear increase of momentum. Instead of continuing to recover, AUD is more likely to consolidate between 0.6635 and 0.6675.”
1-3 WEEKS VIEW: “Our update from yesterday (24 Jun, spot at 0.6640) is still valid. As indicated, the current price action is likely part of a range-trading phase. For the time being, AUD is likely to trade between 0.6600 and 0.6685.”
Instead of rising further, the Pund Sterling (GBP) is more likely to trade in a range between 1.2650 and 1.2705. Slowdown in momentum suggests a slim chance of GBP weakening to 1.2600, UOB Group strategists note.
GBP is likely to trade between 1.2650 and 1.2705
24-HOUR VIEW: “Yesterday, we were of the view that GBP ‘could dip towards 1.2600 before the risk of a rebound increases.’ However, after dipping to a low of 1.2633, GBP rebounded strongly, reaching a high of 1.2698. The robust rebound appears to be overextended, and instead of rising further, GBP is more likely to trade in a range today, probably between 1.2650 and 1.2705.”
1-3 WEEKS VIEW: “We highlighted yesterday (24 Jun, spot at 1.2640) that GBP ‘is likely to continue to weaken to 1.2600.’ We also highlighted that ‘only a breach of 1.2705 would mean that the weakness in GBP has stabilised.’ GBP subsequently rebounded strongly, reaching a high of 1.2698. While our ‘strong resistance’ level at 1.2705 has not been breached yet, the slowdown in momentum suggests a slim chance of GBP weakening to 1.2600. Looking ahead, if 1.2705 is breached, it would indicate that the weakness in GBP from early last week (see annotations in the chart below) has stabilised and GBP could trade in a range.”
Room for the Euro (EUR) to rise to 1.0760 before levelling off is likely. EUR has likely entered a consolidation phase; for the time being, it is likely to trade between 1.0670 and 1.0800, UOB Group analysts write.
Euro to trade within the 1.0670-1.0800 range
24-HOUR VIEW: “We did not anticipate the strong rebound that sent EUR to a high of 1.0746; we were expecting range-trading. While the rapid advance is approaching overbought levels, there is room for EUR to rise to 1.0760 before levelling off is likely. The major resistance at 1.0800 is not expected to come under threat. On the downside, support levels are at 1.0715 and 1.0695.”
1-3 WEEKS VIEW: “We have held the view that EUR could retest the 1.0665 since early last week (as annotated in the chart below). After EUR fell to 1.0668 last Friday, we indicated yesterday (24 Jun, spot at 1.0695) that ‘while the bias for EUR remains on the downside, it must break clearly below 1.0665 before further decline can be expected.’ We also indicated that ‘a breach of 1.0740 would mean that the downward bias has faded.’ EUR then rebounded and broke above 1.0740 (high of 1.0746). The price action suggests that EUR has likely entered a consolidation phase. For the time being, it is likely to trade between 1.0670 and 1.0800.”
- NZD/USD stays calm as traders adopt caution ahead of key inflation data from both nations.
- The Kiwi Dollar may appreciate as close trade partner China expressed confidence in achieving its annual growth target of 5%.
- CME FedWatch Tool suggests 67.7% odds of a Fed rate cut in September, rising from 61.5% a week earlier.
NZD/USD hovers around 0.6120 during the European session on Tuesday. The pair barely moves due to the investors’ caution ahead of ANZ – Roy Morgan Consumer Confidence for June due and US Gross Domestic Product (GDP) for the first quarter (Q1) are set to be released on Thursday. The US Personal Consumption Expenditure (PCE) Price Index will be eyed on Friday.
The Reserve Bank of New Zealand (RBNZ) forecasted during its last policy meeting in May that the central bank wouldn’t start cutting its Official Cash Rate from 5.5% until the third quarter of next year as inflation remains elevated.
According to Bloomberg, China Premier Li Qiang expressed confidence that China is capable of achieving its full-year growth target of around 5%. Qiang warned that decoupling and protectionism would only increase economic operational costs globally. Any change in the Chinese economy could impact the Kiwi market, as China and New Zealand are close trade partners.
The US Dollar received downward pressure from dovish comments from Chicago Fed President Goolsbee. On Monday, Goolsbee said in a chat show on CNBC’s Squawk Box that the Federal Reserve might need to consider whether the restrictive policy is putting too much pressure on the economy.
According to the CME FedWatch Tool, investors are pricing in 67.7% odds of a Fed rate cut in September, compared to 61.5% a week earlier.
- The Canadian Consumer Price Index is set to rise 2.6% YoY in May after April’s 2.7% increase.
- Canada’s CPI inflation data will likely impact the timing of the next Bank of Canada interest rate cut.
- Statistics Canada will publish the CPI inflation data at 12:30 GMT on Tuesday.
Statistics Canada is set to release the top-tier Consumer Price Index (CPI) data for May on Tuesday at 12:30 GMT.
The timing of the Bank of Canada’s (BoC) next interest rate cut will depend on the CPI inflation data, significantly impacting the market’s pricing and the value of the Canadian Dollar.
What to expect from Canada’s inflation rate?
The Canadian CPI is expected to rise at an annual rate of 2.6% in May, a tad slower than a 2.7% increase in April. On a monthly basis, the CPI inflation is seen easing to 0.3% in the same period after April’s 0.5% growth. The core CPI showed no growth over the month in April.
Alongside the CPI data release, the Bank of Canada will publish its closely watched core Consumer Price Index data, which excludes volatile items such as food and energy prices. In May, the annual BoC core CPI inflation is seen steady at 1.6%, while the monthly BoC core CPI is set to rise by 0.2%.
Canada’s inflation is likely to stay below 3.0% for the fifth month in a row, although closing in on the central bank's 2.0% target.
Previewing the Canadian inflation report, analysts at TD Securities (TDS) noted: “We look for headline CPI to rise by 0.3% in May on another large increase for shelter as inflation edges lower to 2.6% YoY.”
“Core inflation measures should hold stable at 2.9%/2.6% for CPI-trim/median, translating to a modest acceleration on a 3M (SAAR) basis, but we do not expect the BoC will be overly concerned by this and see a high bar for this print to derail a July cut,” the TDS analysts said.
Markets are widely pricing in another BoC rate cut at the July 24 policy meeting. However, one additional inflation report is due before the next policy announcement.
TDS Director of Economics, James Orlando, said that “it would probably take a bad reading, either this month or next, to stop the Bank of Canada from cutting."
The central bank's Summary of Deliberations revealed last week that Governor Tiff Macklem and his colleagues thought about waiting until July to lower interest rates but ultimately decided to cut earlier at the June 5 meeting.
Following the policy announcement, Macklem said that “if inflation continues to ease, and our confidence that inflation is headed sustainably to the 2.0% target continues to increase, it is reasonable to expect further cuts to our policy interest rate.”
The BoC joined Sweden's Riksbank and the Swiss National Bank (SNB) in reducing rates, followed by the European Central Bank (ECB), making Canada the first nation amongst the G7 countries to adopt the dovish policy pivot. The central bank lowered key policy rate to 4.75% from 5.0% in June, the first cut in four years.
How could the Canada CPI data affect USD/CAD?
The Canadian Dollar (CAD) has paused its recovery from two-month lows of 1.3792 against the US Dollar (USD) in the lead-up to Tuesday’s CPI showdown. Strong S&P Global preliminary PMI data for June from the United States and risk-aversion continue to underpin the US Dollar at the start of the new week, lending support to the USD/CAD pair.
The Canadian Dollar could regain its recovery momentum if the headline and core CPI figures surprise to the upside and squash expectations of back-to-back interest-rate cuts by the BoC. In such a case, USD/CAD could resume its corrective downside toward the 1.3600 level. Conversely, soft CPI data could boost the BoC’s confidence that inflation is sustainably reaching toward its target, reverberating the market expectations for another rate cut next month. In this scenario, USD/CAD could stage a rebound toward 1.3800, as renewed dovish bets could weigh heavily on the CAD.
Dhwani Mehta, FXStreet’s Senior Analyst, offers key technical levels for trading USD/CAD on Canada’s inflation report: “USD/CAD battles the key confluence zone near 1.3690, where horizontal 21-day Simple Moving Average (SMA) and the 50-day SMA coincide. The 14-day Relative Strength Index (RSI) sits just beneath the 50 level, reflecting buyers’ caution.”
“Acceptance above the 21-day SMA and 50-day SMA confluence at 1.3690 could drive USD/CAD back toward the previous week’s high of 1.3765. Further up, the 1.3800 round level will be on buyers’ radars, close to two-month highs of 1.3792. On the downside, a daily closing below the static support near 1.3665 will reopen the door for a test of the 100-day SMA at 1.3619. The next relevant cushion is seen at the 200-day SMA at 1.3586,” Dhwani adds.
Economic Indicator
Consumer Price Index (YoY)
The Consumer Price Index (CPI), released by Statistics Canada on a monthly basis, represents changes in prices for Canadian consumers by comparing the cost of a fixed basket of goods and services. The YoY reading compares prices in the reference month to the same month a year earlier. Generally, a high reading is seen as bullish for the Canadian Dollar (CAD), while a low reading is seen as bearish.
Read more.Next release: Tue Jun 25, 2024 12:30
Frequency: Monthly
Consensus: 2.6%
Previous: 2.7%
Source: Statistics Canada
Inflation FAQs
Inflation measures the rise in the price of a representative basket of goods and services. Headline inflation is usually expressed as a percentage change on a month-on-month (MoM) and year-on-year (YoY) basis. Core inflation excludes more volatile elements such as food and fuel which can fluctuate because of geopolitical and seasonal factors. Core inflation is the figure economists focus on and is the level targeted by central banks, which are mandated to keep inflation at a manageable level, usually around 2%.
The Consumer Price Index (CPI) measures the change in prices of a basket of goods and services over a period of time. It is usually expressed as a percentage change on a month-on-month (MoM) and year-on-year (YoY) basis. Core CPI is the figure targeted by central banks as it excludes volatile food and fuel inputs. When Core CPI rises above 2% it usually results in higher interest rates and vice versa when it falls below 2%. Since higher interest rates are positive for a currency, higher inflation usually results in a stronger currency. The opposite is true when inflation falls.
Although it may seem counter-intuitive, high inflation in a country pushes up the value of its currency and vice versa for lower inflation. This is because the central bank will normally raise interest rates to combat the higher inflation, which attract more global capital inflows from investors looking for a lucrative place to park their money.
Formerly, Gold was the asset investors turned to in times of high inflation because it preserved its value, and whilst investors will often still buy Gold for its safe-haven properties in times of extreme market turmoil, this is not the case most of the time. This is because when inflation is high, central banks will put up interest rates to combat it. Higher interest rates are negative for Gold because they increase the opportunity-cost of holding Gold vis-a-vis an interest-bearing asset or placing the money in a cash deposit account. On the flipside, lower inflation tends to be positive for Gold as it brings interest rates down, making the bright metal a more viable investment alternative.
- EUR/USD rises to 1.0740 even though Germany’s outlook appears to be dull.
- The ECB could deliver subsequent rate cuts to uplift poor demand prospects.
- The US Dollar will dance to the tunes of the US core PCE inflation data for May.
EUR/USD extends its recovery to 1.0740 in Tuesday’s European session. The major currency pair raises as growing optimism for the Federal Reserve (Fed) to reduce interest rates twice this year has increased investors’ risk appetite.
The US Dollar Index (DXY), which tracks the Greenback’s value against six major currencies, has dropped to 105.40 as demand for safe-haven assets has eased. The DXY Index corrects even though the preliminary United States (US) S&P Global Purchasing Managers Index (PMI) unexpectedly beats the consensus and its prior numbers in June.
This week, investors will focus on the US core Personal Consumption Expenditure price index (PCE) for May, which will be published on Friday. The core PCE price index data is the Fed’s preferred inflation measure, and it will provide fresh cues on when and how much the central bank will reduce interest rates this year.
Daily digest market movers: EUR/USD gains despite Eurozone’s election uncertainty
- EUR/USD rises further to 1.0740 as the market sentiment is favorable for risk-perceived assets. However, the outlook for the Euro is uncertain as economic prospects of Eurozone’s largest economy appear to be deteriorating. German IFO Institute data, which exhibits market sentiment over the economy’s current position and forward outlook, indicated a gloomy picture.
- IFO Business Climate, an early indicator of current conditions and business expectations in Germany, surprisingly declined to 88.6 in June. Investors forecasted a rise to 89.7 from May’s reading of 89.3. In the same period, the Expectations index unexpectedly dropped to 89.0 from the estimates of 91.0 and the former release of 90.3 (downwardly revised from 90.4). On the data release, IFO President Clemens Fuest said, "The German economy is having difficulty overcoming stagnation."
- Last week, the preliminary HCOB PMI data for June also pointed to slowing economic activities due to a sharper decline in new orders from domestic as well as global markets. The Manufacturing PMI contracted at a faster pace and declined to a six-month low of 45.6 from the prior reading of 47.3. The Services PMI continues to expand but at the slowest pace in three months.
- The dismal economic outlook for the Eurozone economy points to subsequent rate cuts from the European Central Bank (ECB). The ECB began unwinding its restrictive interest rate framework in its policy meeting in early June. However, officials have been refraining from committing to any specific rate-cut path as they remain concerned over upside risks to wage inflation, which could boost price pressures.
- Meanwhile, political uncertainty is deepening as France heads toward the first round of snap legislative elections, scheduled for June 30. French President Emmanuel Macron called for a snap election after his party suffered defeat in preliminary results in European parliamentary elections held on June 9 from Marine Le Pen’s far-right National Rally (RN).
Technical Analysis: EUR/USD trades below 50-day EMA
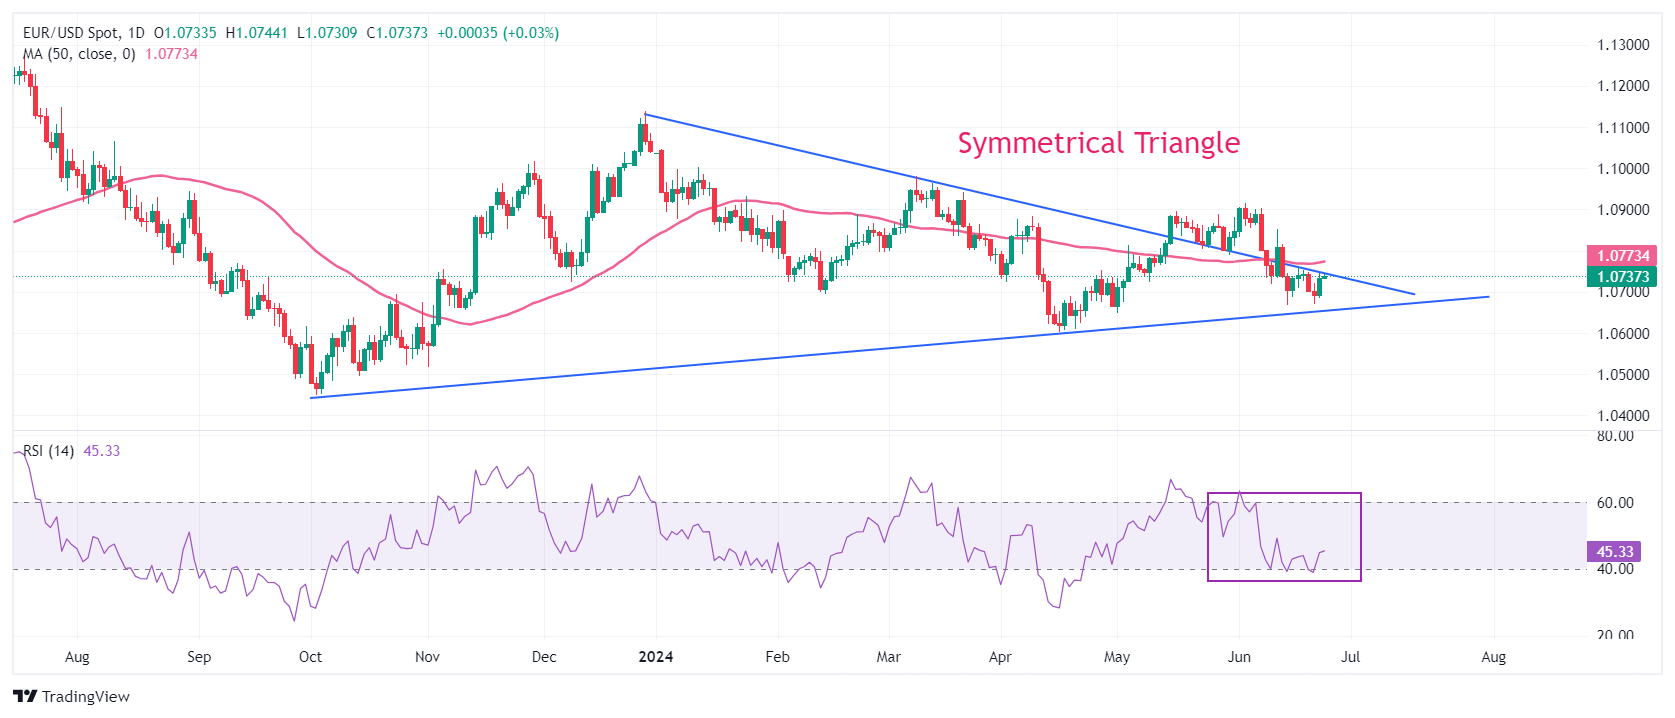
EUR/USD trades close to Monday’s high around 1.0740. The major currency pair continues to face selling pressure near the downward-sloping border of the Symmetrical Triangle near 1.0750, which is plotted from 28 December 2023 high around 1.1140. The pair trades below the 50-day Exponential Moving Average (EMA), which indicates that the short-term outlook is bearish.
The 14-day Relative Strength Index (RSI) hovers near 40.00. A bearish momentum would trigger if the oscillator slips below this level.
Euro FAQs
The Euro is the currency for the 20 European Union countries that belong to the Eurozone. It is the second most heavily traded currency in the world behind the US Dollar. In 2022, it accounted for 31% of all foreign exchange transactions, with an average daily turnover of over $2.2 trillion a day. EUR/USD is the most heavily traded currency pair in the world, accounting for an estimated 30% off all transactions, followed by EUR/JPY (4%), EUR/GBP (3%) and EUR/AUD (2%).
The European Central Bank (ECB) in Frankfurt, Germany, is the reserve bank for the Eurozone. The ECB sets interest rates and manages monetary policy. The ECB’s primary mandate is to maintain price stability, which means either controlling inflation or stimulating growth. Its primary tool is the raising or lowering of interest rates. Relatively high interest rates – or the expectation of higher rates – will usually benefit the Euro and vice versa. The ECB Governing Council makes monetary policy decisions at meetings held eight times a year. Decisions are made by heads of the Eurozone national banks and six permanent members, including the President of the ECB, Christine Lagarde.
Eurozone inflation data, measured by the Harmonized Index of Consumer Prices (HICP), is an important econometric for the Euro. If inflation rises more than expected, especially if above the ECB’s 2% target, it obliges the ECB to raise interest rates to bring it back under control. Relatively high interest rates compared to its counterparts will usually benefit the Euro, as it makes the region more attractive as a place for global investors to park their money.
Data releases gauge the health of the economy and can impact on the Euro. Indicators such as GDP, Manufacturing and Services PMIs, employment, and consumer sentiment surveys can all influence the direction of the single currency. A strong economy is good for the Euro. Not only does it attract more foreign investment but it may encourage the ECB to put up interest rates, which will directly strengthen the Euro. Otherwise, if economic data is weak, the Euro is likely to fall. Economic data for the four largest economies in the euro area (Germany, France, Italy and Spain) are especially significant, as they account for 75% of the Eurozone’s economy.
Another significant data release for the Euro is the Trade Balance. This indicator measures the difference between what a country earns from its exports and what it spends on imports over a given period. If a country produces highly sought after exports then its currency will gain in value purely from the extra demand created from foreign buyers seeking to purchase these goods. Therefore, a positive net Trade Balance strengthens a currency and vice versa for a negative balance.
- Silver price may find support around the 50-day EMA at $29.01 level.
- Analysis of the daily chart suggests a bearish bias as the Silver price consolidates within the descending channel pattern.
- The upper boundary of the descending channel at $30.50 could act as a key resistance.
Silver price inches lower to near $29.60 per troy ounce during the early European session on Tuesday. Analysis of the daily chart indicates a bearish bias as the XAG/USD pair consolidates within the descending channel pattern. Additionally, the 14-day Relative Strength Index (RSI) is positioned below the 50 level, suggesting a confirmation of a downward trend.
The momentum indicator Moving Average Convergence Divergence (MACD) suggests a bearish bias for Silver. This configuration indicates that the overall trend might still be positive as the MACD line is above the centreline. However, the momentum is weakening as the MACD line is below the signal line. If the MACD line crosses below the centerline, it would further confirm a strengthening downward trend.
On the downside, the Silver price may find immediate support around the 50-day Exponential Moving Average (EMA) at $29.01 level. A break below this level could put pressure on the grey metal to navigate the region around the psychological level of $28.00, followed by the lower threshold of the descending channel around the level of $27.76.
In terms of resistance, the Silver price may find the immediate barrier at the significant level of $30.00, followed by the upper boundary of the descending channel at $30.50. A breakthrough above the latter could lead the XAG/USD pair to test the four-week high of $31.55.
XAG/USD: Daily Chart
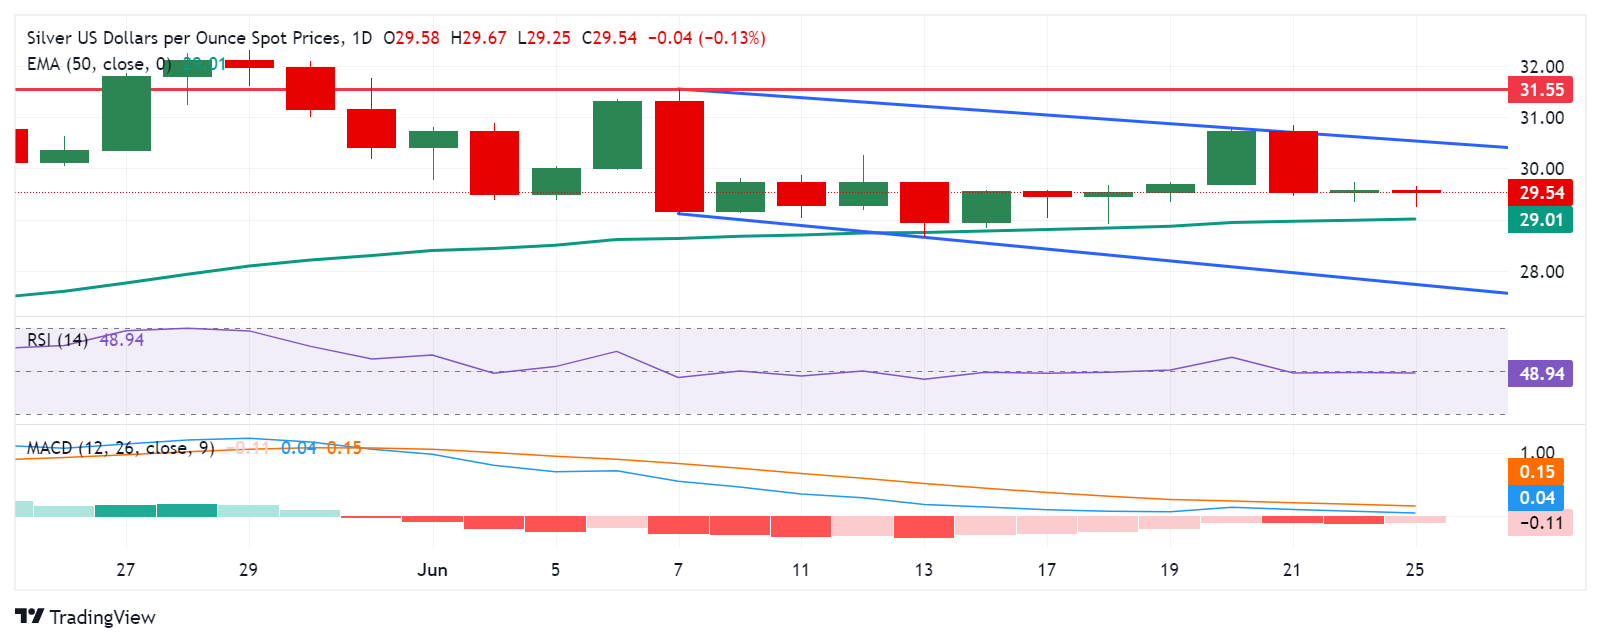
Here is what you need to know on Tuesday, June 25:
Following a bearish start to the week, the US Dollar (USD) holds its ground early Tuesday as investors await housing, regional manufacturing and consumer confidence data. In the early American session, May Consumer Price Index (CPI) data from Canada will also be watched closely by market participants.
The positive shift seen in risk mood made it difficult for the USD to find demand in the first half of the day on Monday. The mixed action in Wall Street, however, helped the currency limit its losses later in the day. Nevertheless, the USD Index lost more than 0.3% on a daily basis, while the Dow Jones Industrial Average gained 0.67% and the Nasdaq Composite fell 1.3%. Early Tuesday, the USD Index stays in a consolidation phase slightly below 105.50 and US stock index futures trade marginally higher on the day.
US Dollar PRICE This week
The table below shows the percentage change of US Dollar (USD) against listed major currencies this week. US Dollar was the weakest against the Australian Dollar.
| USD | EUR | GBP | JPY | CAD | AUD | NZD | CHF | |
|---|---|---|---|---|---|---|---|---|
| USD | -0.37% | -0.35% | -0.18% | -0.29% | -0.45% | -0.17% | -0.15% | |
| EUR | 0.37% | 0.03% | 0.24% | 0.12% | -0.05% | 0.24% | 0.31% | |
| GBP | 0.35% | -0.03% | 0.14% | 0.08% | -0.09% | 0.21% | 0.27% | |
| JPY | 0.18% | -0.24% | -0.14% | -0.10% | -0.22% | 0.06% | 0.06% | |
| CAD | 0.29% | -0.12% | -0.08% | 0.10% | -0.14% | 0.12% | 0.19% | |
| AUD | 0.45% | 0.05% | 0.09% | 0.22% | 0.14% | 0.30% | 0.36% | |
| NZD | 0.17% | -0.24% | -0.21% | -0.06% | -0.12% | -0.30% | 0.06% | |
| CHF | 0.15% | -0.31% | -0.27% | -0.06% | -0.19% | -0.36% | -0.06% |
The heat map shows percentage changes of major currencies against each other. The base currency is picked from the left column, while the quote currency is picked from the top row. For example, if you pick the US Dollar from the left column and move along the horizontal line to the Japanese Yen, the percentage change displayed in the box will represent USD (base)/JPY (quote).
The data from Australia showed in the early Asian session that the Westpac Consumer Confidence improved to 1.7% in June from -0.3% in May. In the meantime, China’s Premier Li Qiang noted that they are confident and capable of achieving the full-year growth target of around 5% this year. After closing in positive territory on Monday, AUD/USD continues to edge higher and was last seen trading at around 0.6670.
Annual inflation in Canada, as measured by the change in the CPI, is forecast to edge lower to 2.6% in May from 2.7% in April. USD/CAD closed in the red on Monday and continued to stretch lower early Tuesday. The pair was last seen trading at its weakest level in three weeks near 1.3650.
USD/JPY corrected lower after coming within a touching distance of 160.00 on Monday as investors refrained from betting on further Japanese Yen weakness on growing speculation about an intervention. Japan Chief Cabinet Secretary Yoshimasa Hayashi repeated that excessive foreign exchange (FX) volatility is undesirable, adding that they will closely monitor the FX moves and will take necessary steps if needed. Early Tuesday, USD/JPY trades in the red below 159.50.
EUR/USD took advantage of the USD weakness on Monday and recovered toward 1.0750. The pair stays relatively quiet and fluctuates in a tight channel below this level in the European morning on Tuesday.
GBP/USD gained traction and advanced to 1.2700 on Monday. Early Tuesday, the pair stays in a consolidation phase near 1.2690.
Gold registered small gains on Monday as the benchmark 10-year US Treasury bond yield retreated below 4.25%. XAU/USD struggles to build on recent recovery and trades in a narrow band below $2,330 to begin the European session on Tuesday.
Inflation FAQs
Inflation measures the rise in the price of a representative basket of goods and services. Headline inflation is usually expressed as a percentage change on a month-on-month (MoM) and year-on-year (YoY) basis. Core inflation excludes more volatile elements such as food and fuel which can fluctuate because of geopolitical and seasonal factors. Core inflation is the figure economists focus on and is the level targeted by central banks, which are mandated to keep inflation at a manageable level, usually around 2%.
The Consumer Price Index (CPI) measures the change in prices of a basket of goods and services over a period of time. It is usually expressed as a percentage change on a month-on-month (MoM) and year-on-year (YoY) basis. Core CPI is the figure targeted by central banks as it excludes volatile food and fuel inputs. When Core CPI rises above 2% it usually results in higher interest rates and vice versa when it falls below 2%. Since higher interest rates are positive for a currency, higher inflation usually results in a stronger currency. The opposite is true when inflation falls.
Although it may seem counter-intuitive, high inflation in a country pushes up the value of its currency and vice versa for lower inflation. This is because the central bank will normally raise interest rates to combat the higher inflation, which attract more global capital inflows from investors looking for a lucrative place to park their money.
Formerly, Gold was the asset investors turned to in times of high inflation because it preserved its value, and whilst investors will often still buy Gold for its safe-haven properties in times of extreme market turmoil, this is not the case most of the time. This is because when inflation is high, central banks will put up interest rates to combat it. Higher interest rates are negative for Gold because they increase the opportunity-cost of holding Gold vis-a-vis an interest-bearing asset or placing the money in a cash deposit account. On the flipside, lower inflation tends to be positive for Gold as it brings interest rates down, making the bright metal a more viable investment alternative.
- USD/CHF trades on a weaker note near 0.8925 in Tuesday’s early Asian session.
- Fed policymakers retain a cautious approach to rate cuts, emphasizing that their decisions would be data-dependent.
- The Swiss Franc is supported by the escalating geopolitical tensions in the Middle East and Ukraine.
The USD/CHF pair weakens around 0.8925 on Tuesday during the early Asian trading hours. The downtick of the pair is backed by a weaker US Dollar (USD) broadly. Investors will keep an eye on the Swiss SNB Quarterly Bulletin for the second quarter (Q2) on Wednesday. On the US docket, the final reading of the US Gross Domestic Product (GDP) for Q1 on Thursday, and the May Personal Consumption Expenditure (PCE) Price Index for May on Friday will be the highlights this week.
The US Federal Reserve (Fed) policymakers retain a cautious approach to rate reduction, emphasizing that their decisions would be data-dependent. On Monday, San Francisco Fed President Mary Daly said that the Fed must continue its efforts to restore price stability without a painful disruption to the economy. Daly noted that although the central bank still has "more work to do" to temper inflation, it is not the only risk they face.
According to the CME FedWatch Tool, traders are now pricing in a nearly 66% chance of the Fed rate cut in September, up from 59.5% at the end of last week. The speeches from the Fed’s Lisa Cook and Michelle Bowman later on Tuesday might offer some hints about the interest rate trajectory this year. The hawkish comments from the Fed policymakers could lift the Greenback and cap the downside for USD/CHF.
On the other hand, the ongoing geopolitical tensions in the Middle East and Ukraine might boost the safe-haven flows, which benefit the Swiss Franc (CHF). Israeli Prime Minister Benjamin Netanyahu stated that the most intense phase of the attack against Hamas in Gaza is close to ending while stressing the broader war against Hamas wages on, according to CNN. Additionally, Russia has condemned the US for a "barbaric" strike in Crimea, which used US-provided missiles, killing at least four people, including children, and injuring 151 others.
Gold prices fell in India on Tuesday, according to data compiled by FXStreet.
The price for Gold stood at 6,236.12 Indian Rupees (INR) per gram, down compared with the INR 6,264.13 it cost on Monday.
The price for Gold decreased to INR 72,736.83 per tola from INR 73,063.59 per tola a day earlier.
| Unit measure | Gold Price in INR |
|---|---|
| 1 Gram | 6,236.12 |
| 10 Grams | 62,362.23 |
| Tola | 72,736.83 |
| Troy Ounce | 193,965.00 |
FXStreet calculates Gold prices in India by adapting international prices (USD/INR) to the local currency and measurement units. Prices are updated daily based on the market rates taken at the time of publication. Prices are just for reference and local rates could diverge slightly.
Gold FAQs
Gold has played a key role in human’s history as it has been widely used as a store of value and medium of exchange. Currently, apart from its shine and usage for jewelry, the precious metal is widely seen as a safe-haven asset, meaning that it is considered a good investment during turbulent times. Gold is also widely seen as a hedge against inflation and against depreciating currencies as it doesn’t rely on any specific issuer or government.
Central banks are the biggest Gold holders. In their aim to support their currencies in turbulent times, central banks tend to diversify their reserves and buy Gold to improve the perceived strength of the economy and the currency. High Gold reserves can be a source of trust for a country’s solvency. Central banks added 1,136 tonnes of Gold worth around $70 billion to their reserves in 2022, according to data from the World Gold Council. This is the highest yearly purchase since records began. Central banks from emerging economies such as China, India and Turkey are quickly increasing their Gold reserves.
Gold has an inverse correlation with the US Dollar and US Treasuries, which are both major reserve and safe-haven assets. When the Dollar depreciates, Gold tends to rise, enabling investors and central banks to diversify their assets in turbulent times. Gold is also inversely correlated with risk assets. A rally in the stock market tends to weaken Gold price, while sell-offs in riskier markets tend to favor the precious metal.
The price can move due to a wide range of factors. Geopolitical instability or fears of a deep recession can quickly make Gold price escalate due to its safe-haven status. As a yield-less asset, Gold tends to rise with lower interest rates, while higher cost of money usually weighs down on the yellow metal. Still, most moves depend on how the US Dollar (USD) behaves as the asset is priced in dollars (XAU/USD). A strong Dollar tends to keep the price of Gold controlled, whereas a weaker Dollar is likely to push Gold prices up.
(An automation tool was used in creating this post.)
FX option expiries for June 25 NY cut at 10:00 Eastern Time, via DTCC, can be found below
- EUR/USD: EUR amounts
- 1.0625 600m
- 1.0650 720m
- 1.0700 1.7b
- 1.0800 485m
- 1.0860 1b
- USD/JPY: USD amounts
- 160.00 1.7b
- AUD/USD: AUD amounts
- 0.6675 434m
- GBP/USD extends gains to test 14-day EMA at 1.2704 level.
- A broadening bottom pattern on a daily chart suggests a potential correction before moving lower.
- The lower boundary of the broadening bottom pattern around the level of 1.2640 could act as a key support.
GBP/USD extends gains for the second successive session, trading around 1.2700 during Asian hours on Tuesday. Analysis of the daily chart shows a broadening bottom pattern in price action, representing increasing volatility. This chart pattern suggests a potential correction before moving lower.
The 14-day Relative Strength Index (RSI) is positioned below the 50 level, indicating a bearish bias. Furthermore, the Moving Average Convergence Divergence (MACD) momentum indicator also suggests a downward trend, as the MACD line is above the centerline but diverges below the signal line. Breaking below the centerline may strengthen the downward trend.
To the downside, the GBP/USD pair may find key support at the bottom wedge of the broadening bottom pattern around the level of 1.2640. A break below this level could exert pressure on the pair to navigate the vicinity of the throwback support at 1.2450.
In terms of resistance, the immediate barrier appears at the 14-day Exponential Moving Average (EMA) at the 1.2704 level. A breakthrough above this level could propel the GBP/USD pair toward testing the top wedge of the broadening bottom pattern around 1.2900.
GBP/USD: Daily Chart
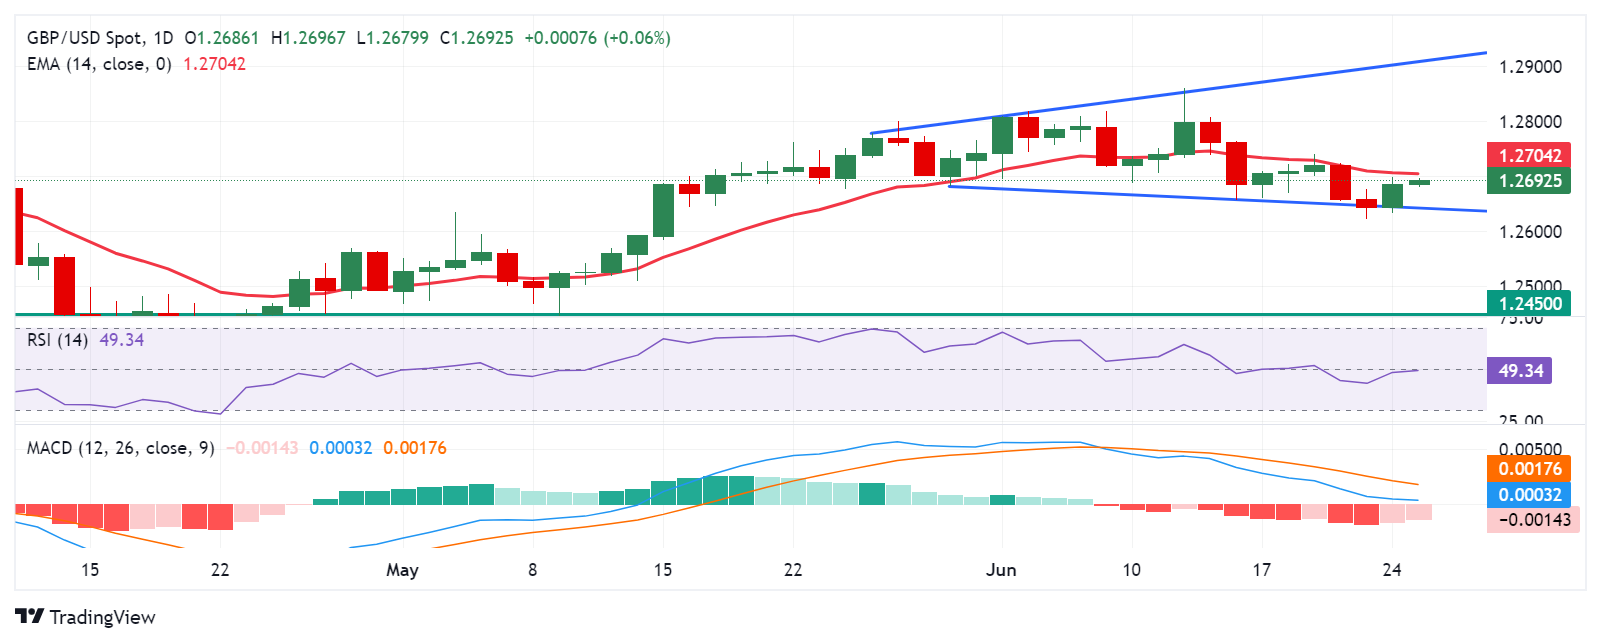
- The Indian Rupee drifts higher on the weaker US dollar on Tuesday.
- India’s inflows might lift the INR, while the weakness in major Asian peers, higher oil prices might cap the upside.
- Traders await US Chicago Fed National Activity Index, Consumer Confidence and the speech from Fed’s Cook and Bowman on Tuesday.
The Indian Rupee (INR) gains traction on Tuesday, supported by the softer US Dollar (USD) across the board. The significant inflows related to the inclusion of Indian bonds in the JPMorgan emerging market debt index could support the INR. However, the upside of the Indian Rupee might be limited by a decline in major Asian currencies like the Chinese Yuan and the Japanese Yen. Additionally, the rise in crude oil prices amid the hope for strong summer driving demand could weigh on the INR as India is the world’s third-largest oil consumer after the United States (US) and China.
The US Chicago Fed National Activity Index for May and Consumer Confidence will be released on Tuesday. Also, the Fed’s Lisa Cook and Michelle Bowman are set to speak. Investors will shift their attention to the key US economic data later this week. The final reading of US Gross Domestic Product (GDP) for the first quarter (Q1) is due on Thursday, and the Personal Consumption Expenditure (PCE) Price Index for May will be published on Friday.
Daily Digest Market Movers: Indian Rupee remains strong, supported by optimistic economic outlook
- The S&P Global Ratings retained its growth forecast for India at 6.8% for FY25, citing high interest rates and government spending boosting demand in the non-agricultural sectors.
- India is expected to become a $4 trillion economy in 2025, surpassing Japan by early next fiscal year to become the world's fourth largest economy, according to Indian Economic Advisory Council to the Prime Minister (EAC-PM) member Sanjeev Sanyal.
- San Francisco Fed President Mary Daly said that the Fed must continue the work of fully restoring price stability without a painful disruption to the economy. Daly added that while the central bank still has "more work to do" on bringing inflation down, inflation is not the only risk they face.
- The final reading of the US headline and Core Personal Consumption Expenditures (PCE) Price Index is estimated to show a rise of 2.6% on a yearly basis in May.
- The financial markets have priced in a 66% probability of a Fed rate cut in September, increasing from 59.5% at the end of last week, according to the CME FedWatch Tool.
Technical analysis: USD/INR might see further consolidation in the near term
The Indian Rupee trades firmly on Tuesday. The USD/INR pair maintains the constructive picture on the daily chart beyond the key 100-day Exponential Moving Average (EMA). However, the 14-day Relative Strength Index (RSI) hovers around the 50-midline, indicating that further consolidation in the near term looks favorable.
A move to the all-time high of 83.75 would increase the possibility of an upleg to the 84.00 psychological level. Further gains to 84.50 are also on the table if USD/INR gains bullish momentum beyond the mentioned level.
On the downside, extended losses may extend its downswing to the potential support level at the 83.30-83.35 region, representing the confluence of the resistance-turned-support level and the 100-day EMA. Further south, the next downside barrier is located at the 83.00 round figure.
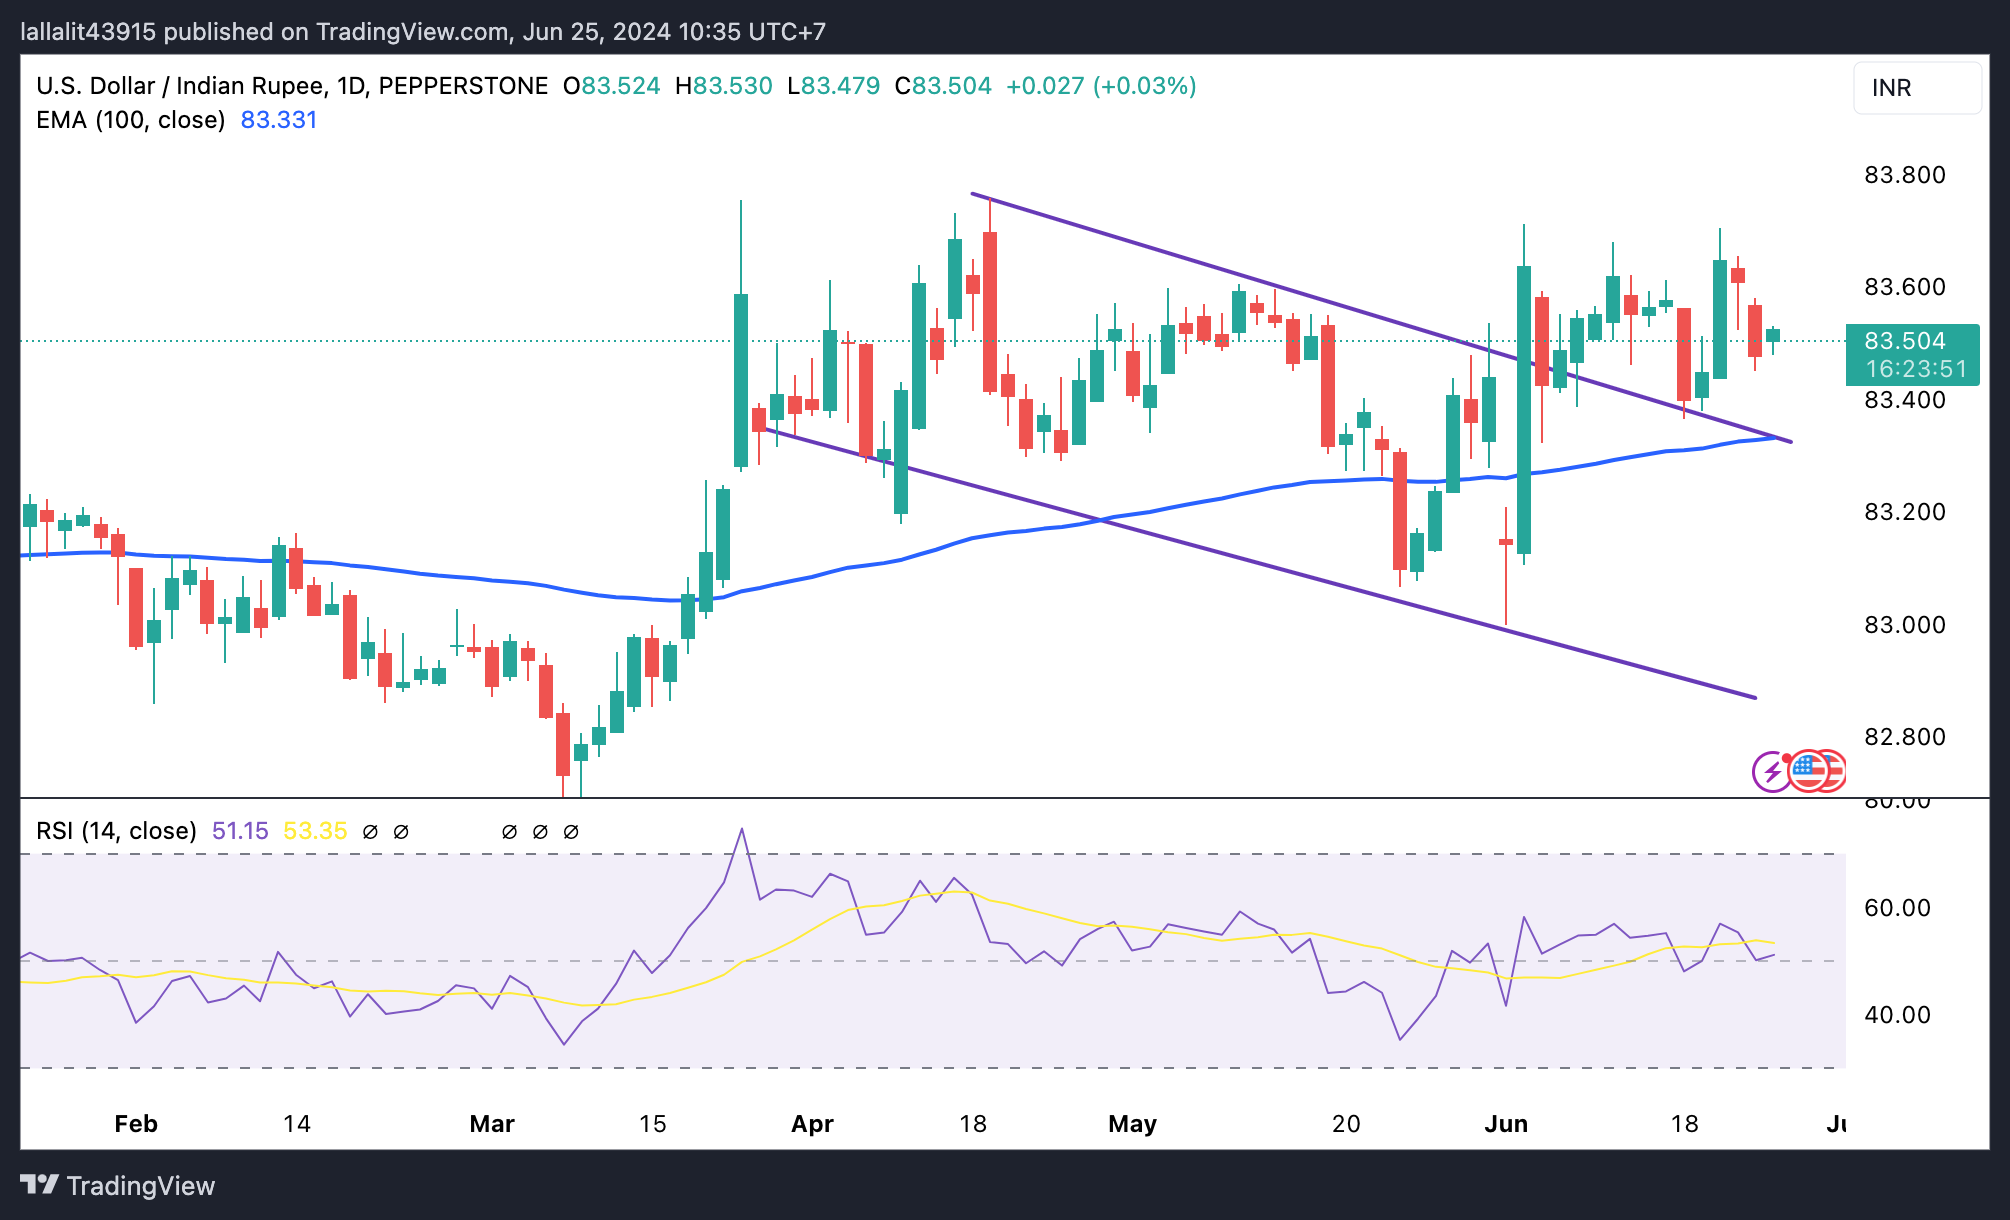
US Dollar price today
The table below shows the percentage change of US Dollar (USD) against listed major currencies today. US Dollar was the weakest against the Swiss Franc.
| USD | EUR | GBP | CAD | AUD | JPY | NZD | CHF | |
| USD | -0.05% | -0.10% | -0.12% | -0.09% | -0.12% | -0.04% | -0.16% | |
| EUR | 0.05% | -0.08% | -0.06% | -0.03% | -0.06% | 0.01% | -0.09% | |
| GBP | 0.11% | 0.06% | -0.01% | 0.02% | 0.00% | 0.07% | -0.03% | |
| CAD | 0.12% | 0.07% | 0.01% | 0.03% | 0.00% | 0.08% | -0.04% | |
| AUD | 0.09% | 0.03% | -0.02% | -0.04% | -0.02% | 0.04% | -0.07% | |
| JPY | 0.13% | 0.08% | 0.02% | 0.00% | -0.02% | 0.06% | -0.02% | |
| NZD | 0.07% | 0.01% | -0.04% | -0.08% | -0.02% | -0.04% | -0.09% | |
| CHF | 0.15% | 0.09% | 0.03% | 0.01% | 0.04% | 0.04% | 0.09% |
The heat map shows percentage changes of major currencies against each other. The base currency is picked from the left column, while the quote currency is picked from the top row. For example, if you pick the Euro from the left column and move along the horizontal line to the Japanese Yen, the percentage change displayed in the box will represent EUR (base)/JPY (quote).
Indian Rupee FAQs
The Indian Rupee (INR) is one of the most sensitive currencies to external factors. The price of Crude Oil (the country is highly dependent on imported Oil), the value of the US Dollar – most trade is conducted in USD – and the level of foreign investment, are all influential. Direct intervention by the Reserve Bank of India (RBI) in FX markets to keep the exchange rate stable, as well as the level of interest rates set by the RBI, are further major influencing factors on the Rupee.
The Reserve Bank of India (RBI) actively intervenes in forex markets to maintain a stable exchange rate, to help facilitate trade. In addition, the RBI tries to maintain the inflation rate at its 4% target by adjusting interest rates. Higher interest rates usually strengthen the Rupee. This is due to the role of the ‘carry trade’ in which investors borrow in countries with lower interest rates so as to place their money in countries’ offering relatively higher interest rates and profit from the difference.
Macroeconomic factors that influence the value of the Rupee include inflation, interest rates, the economic growth rate (GDP), the balance of trade, and inflows from foreign investment. A higher growth rate can lead to more overseas investment, pushing up demand for the Rupee. A less negative balance of trade will eventually lead to a stronger Rupee. Higher interest rates, especially real rates (interest rates less inflation) are also positive for the Rupee. A risk-on environment can lead to greater inflows of Foreign Direct and Indirect Investment (FDI and FII), which also benefit the Rupee.
Higher inflation, particularly, if it is comparatively higher than India’s peers, is generally negative for the currency as it reflects devaluation through oversupply. Inflation also increases the cost of exports, leading to more Rupees being sold to purchase foreign imports, which is Rupee-negative. At the same time, higher inflation usually leads to the Reserve Bank of India (RBI) raising interest rates and this can be positive for the Rupee, due to increased demand from international investors. The opposite effect is true of lower inflation.
- The Japanese Yen extended gains as Japan's Yoshimasa Hayashi stated that authorities would respond appropriately to excessive currency volatility.
- The JPY appreciated as Japanese authorities spent billions of dollars on a Yen-buying intervention.
- CME FedWatch Tool indicates 67.7% odds of a Fed rate cut in September, compared with 61.5% a week earlier.
The Japanese Yen (JPY) extends its gains for the second consecutive session on Tuesday. The USD/JPY pair remains within touching distance of the 160.00 level that recently pushed Japanese authorities to spend billions of dollars in Yen-buying intervention, per Reuters.
Japan’s Corporate Service Price Index (YoY) rose 2.5% in May, slowing from a 2.7% increase in April. Investors now look ahead to more domestic economic reports this week including Retail Sales, Unemployment data for May and Tokyo’s inflation figures for June.
On the USD front, the revised US Gross Domestic Product (GDP) for the first quarter (Q1) is set to be released on Thursday, followed by the Personal Consumption Expenditure (PCE) Price Index on Friday.
Daily Digest Market Movers: Japanese Yen extends gains due to intervention threat
- According to the CME FedWatch Tool, investors are pricing in 67.7% odds of a Fed rate cut in September, compared to 61.5% a week earlier.
- According to a Reuters report, Japanese Chief Cabinet Secretary Yoshimasa Hayashi stated on Tuesday that authorities would respond appropriately to excessive currency volatility. This fresh warning comes as the Japanese Yen has approached the key 160 per US Dollar level.
- As long as the USD/JPY pair remains above 159.30, it could rise above 160.00, potentially reaching another resistance level at 160.25, UOB Group analysts note.
- Japan's top currency diplomat, Masato Kanda, stated on Monday that he would take appropriate measures if there were excessive movements in the foreign exchange market. Kanda cautioned against the negative economic effects of such movements and emphasized his readiness to intervene around the clock if necessary, per Reuters.
- On Monday, minutes of the Bank of Japan's last meeting showed that Japanese policymakers discussed a near-term interest rate hike. According to a Reuters report, one member advocated for an increase "without too much delay" to help bring inflation back down.
- Strong US business activity data from Friday dampened expectations for Federal Reserve (Fed) interest rate cuts. US Composite PMI for June surpassed expectations, rising to 54.6 from May’s reading of 54.5. This figure marked the highest level since April 2022. The Manufacturing PMI increased to a reading of 51.7 from a 51.3 figure, exceeding the forecast of 51.0. Similarly, the Services PMI rose to 55.1 from 54.8 in May, beating the consensus estimate of 53.7.
- Reuters reported that Bank of Japan Deputy Governor Shinichi Uchida stated on Friday that the central bank would "adjust the degree of monetary support" if the economy and prices align with its forecasts. This signals the bank's readiness to raise interest rates further.
- Japan reaffirmed its commitment on Friday to achieve a primary budget surplus by the next fiscal year. This decision reflects concerns that exiting the ultra-low interest rate environment could increase the government's debt burden, according to Reuters.
Technical Analysis: USD/JPY holds a position around the 159.50 level
USD/JPY trades around 159.30 on Tuesday. Analyzing the daily chart shows a bullish bias, with the pair hovering near the upper boundary of an ascending channel pattern. The 14-day Relative Strength Index (RSI) is positioned above the 50 level, indicating upward momentum.
Surpassing the upper threshold of the ascending channel pattern around 159.90 will reinforce the bullish sentiment, potentially driving the USD/JPY pair toward 160.32, the highest level since April and a major resistance point.
On the downside, immediate support appears at the nine-day Exponential Moving Average (EMA) at 158.60. A breach below this level could intensify downward pressure on the USD/JPY pair, potentially driving it toward the lower boundary of the ascending channel around 155.60. A break below this level could push the pair to test the throwback support around 152.80.
USD/JPY: Daily Chart
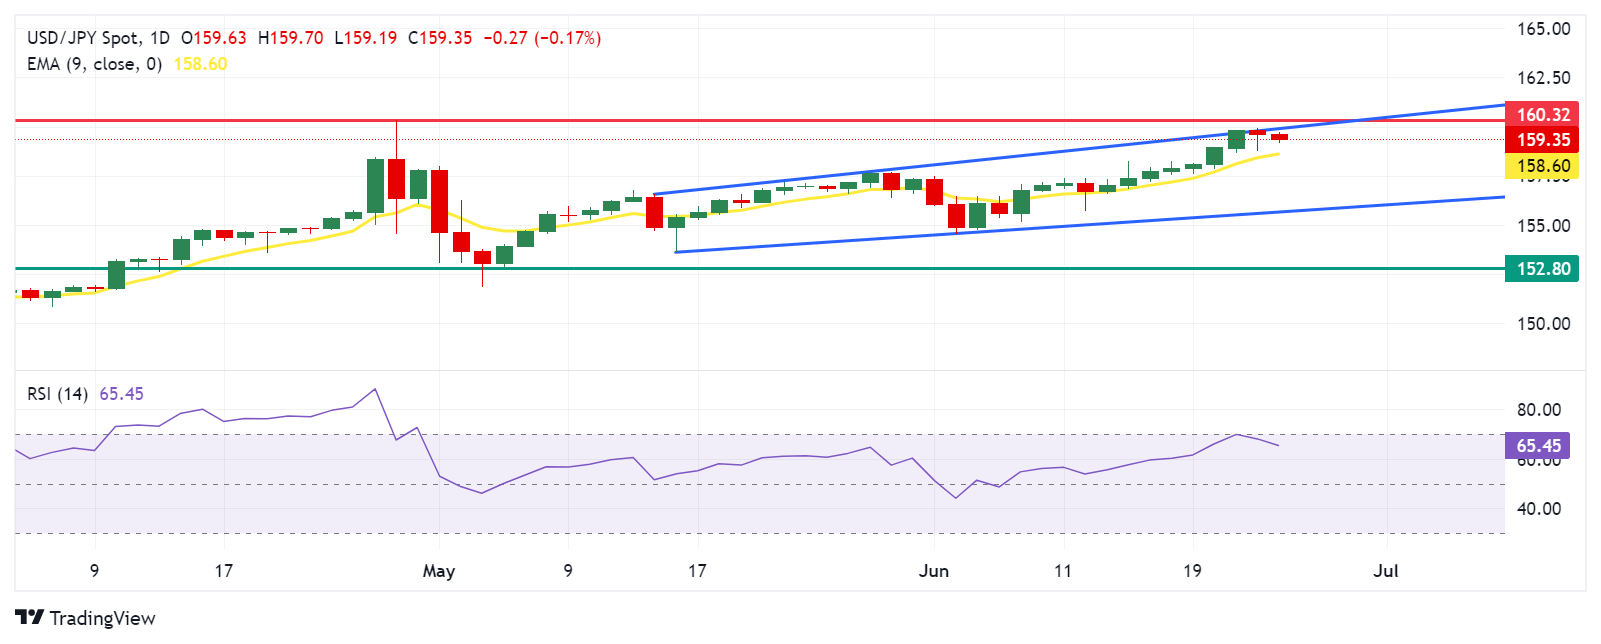
Japanese Yen price today
The table below shows the percentage change of the Japanese Yen (JPY) against listed major currencies today. Japanese Yen was the strongest against the US Dollar.
| USD | EUR | GBP | CAD | AUD | JPY | NZD | CHF | |
| USD | -0.03% | -0.09% | -0.09% | -0.07% | -0.16% | -0.01% | -0.15% | |
| EUR | 0.03% | -0.07% | -0.06% | -0.02% | -0.11% | 0.01% | -0.10% | |
| GBP | 0.09% | 0.05% | -0.01% | 0.03% | -0.06% | 0.07% | -0.05% | |
| CAD | 0.09% | 0.06% | 0.01% | 0.05% | -0.06% | 0.07% | -0.04% | |
| AUD | 0.07% | 0.03% | -0.03% | -0.03% | -0.09% | 0.04% | -0.06% | |
| JPY | 0.17% | 0.14% | 0.08% | 0.07% | 0.08% | 0.15% | 0.02% | |
| NZD | 0.03% | -0.01% | -0.06% | -0.07% | -0.04% | -0.12% | -0.12% | |
| CHF | 0.15% | 0.11% | 0.06% | 0.05% | 0.08% | 0.00% | 0.13% |
The heat map shows percentage changes of major currencies against each other. The base currency is picked from the left column, while the quote currency is picked from the top row. For example, if you pick the Euro from the left column and move along the horizontal line to the Japanese Yen, the percentage change displayed in the box will represent EUR (base)/JPY (quote).
Japanese Yen FAQs
The Japanese Yen (JPY) is one of the world’s most traded currencies. Its value is broadly determined by the performance of the Japanese economy, but more specifically by the Bank of Japan’s policy, the differential between Japanese and US bond yields, or risk sentiment among traders, among other factors.
One of the Bank of Japan’s mandates is currency control, so its moves are key for the Yen. The BoJ has directly intervened in currency markets sometimes, generally to lower the value of the Yen, although it refrains from doing it often due to political concerns of its main trading partners. The current BoJ ultra-loose monetary policy, based on massive stimulus to the economy, has caused the Yen to depreciate against its main currency peers. This process has exacerbated more recently due to an increasing policy divergence between the Bank of Japan and other main central banks, which have opted to increase interest rates sharply to fight decades-high levels of inflation.
The BoJ’s stance of sticking to ultra-loose monetary policy has led to a widening policy divergence with other central banks, particularly with the US Federal Reserve. This supports a widening of the differential between the 10-year US and Japanese bonds, which favors the US Dollar against the Japanese Yen.
The Japanese Yen is often seen as a safe-haven investment. This means that in times of market stress, investors are more likely to put their money in the Japanese currency due to its supposed reliability and stability. Turbulent times are likely to strengthen the Yen’s value against other currencies seen as more risky to invest in.
China’s Premier Li Qiang expressed his take on the economy in his speech on Tuesday.
Key quotes
We are confident and capable to achieve the full year growth target of around 5%.
Electric vehicles, lithium batteries produced by Chinese companies have not only met domestic demand but enriched global supply.
We should build a more fair non-discriminatory business environment for tech innovation.
We should face up to the difficulty of global economic growth.
Weak global economic growth momentum hit by COVID, high inflation, increasing debt.
Decoupling and protectionism will only raise economic operation costs for the world.
We should seize the new opportunities of the tech revolution and industrial transformation.
Shaking off the difficulty of growth needs new sources of growth drivers.
The fast rise of emerging industries in China follows the trend of global tech revolution, green development.
Chinese products first satisfy domestic demand, ease global inflation pressure, and help deal with global climate change.
- Gold price edges lower in Tuesday’s Asian session.
- The stronger US economic data and the Fed's hawkish stance continue to underpin the yellow metal.
- Investors will focus on the speech from Fed’s Cook and Bowman on Tuesday.
Gold price (XAU/USD) trades in negative territory on Tuesday despite the weaker Greenback. The stronger-than-expected US Purchasing Managers Index (PMI) released last week triggered Federal Reserve (Fed) officials to push out the timing of the first interest rate cut this year, which continues to cap the gold’s upside. However, the safe-haven flows on the back of geopolitical tensions in the Middle East and Ukraine might boost the yellow metal in the near term.
Investors will take more cues from the Fed members' speeches on Tuesday, with Lisa Cook, Michelle Bowman scheduled to speak. The crucial US economic data to be closely watched this week will be the final reading of the US Gross Domestic Product (GDP) for the first quarter (Q1) on Thursday and the Personal Consumption Expenditure (PCE) Price Index for May, which is due on Friday. Any evidence of a trend of easing inflation could prompt the expectation of Fed rate cuts later in 2024. This, in turn, might drag the Greenback lower and create a tailwind for USD-denominated Gold.
Daily Digest Market Movers: Gold price remains sensitive to Fed rate-cut path
- San Francisco Federal Reserve Bank President Mary Daly said on Monday that she does not believe the Fed should cut rates before the central bank is confident that inflation is headed towards 2%. Daly added that the labour market, albeit strong, might face rising unemployment if inflation remains persistent.
- The final reading of the US headline and Core Personal Consumption Expenditures (PCE) Price Index is expected to show an increase of 2.6% YoY in May.
- Traders are now pricing in a 66% odds of a Fed rate cut in September, up from 59.5% at the end of last week, according to the CME FedWatch Tool.
- Israeli Prime Minister Benjamin Netanyahu stated that the most intense phase of the assault against Hamas in Gaza is close to ending while stressing the broader war against Hamas wages on, per CNN.
- Russia has condemned the US for a "barbaric" strike in Crimea, which used US-provided missiles, killing at least four people, including children, and injuring 151 others. On Monday, Russia's Foreign Ministry summoned US Ambassador Lynne Tracy and accused the US of launching a "proxy war," warning that retaliation would "definitely follow,” per local news agency Aljazeera.
Technical Analysis: Gold price could face downward pressure in the shorter term
The gold price trades on a softer note on the day. The precious metal has formed a descending trend channel since May 10 on the daily timeframe. The yellow metal keeps the bullish vibe above the key 100-day Exponential Moving Average (EMA). Nonetheless, further consolidation cannot be ruled out as the 14-day Relative Strength Index (RSI) hovers around the 50-midline, indicating a neutral level between bullish and bearish positions.
The upper boundary of the descending trend channel at $2,350 will be the first stop for XAU/USD. A break above this level will pave the way to $2,387, a high of June 7. Further north, the next hurdle is seen at the all-time high of $2,450.
On the other hand, a low of June 21 at $2,316 acts as an initial support level for the yellow metal. Any follow-through selling will see a drop to $2,285, a low of June 7. The key contention level to watch is the $2,255-$2,260 zone, portraying the 100-day EMA and the lower limit of the descending trend channel.
Gold FAQs
Gold has played a key role in human’s history as it has been widely used as a store of value and medium of exchange. Currently, apart from its shine and usage for jewelry, the precious metal is widely seen as a safe-haven asset, meaning that it is considered a good investment during turbulent times. Gold is also widely seen as a hedge against inflation and against depreciating currencies as it doesn’t rely on any specific issuer or government.
Central banks are the biggest Gold holders. In their aim to support their currencies in turbulent times, central banks tend to diversify their reserves and buy Gold to improve the perceived strength of the economy and the currency. High Gold reserves can be a source of trust for a country’s solvency. Central banks added 1,136 tonnes of Gold worth around $70 billion to their reserves in 2022, according to data from the World Gold Council. This is the highest yearly purchase since records began. Central banks from emerging economies such as China, India and Turkey are quickly increasing their Gold reserves.
Gold has an inverse correlation with the US Dollar and US Treasuries, which are both major reserve and safe-haven assets. When the Dollar depreciates, Gold tends to rise, enabling investors and central banks to diversify their assets in turbulent times. Gold is also inversely correlated with risk assets. A rally in the stock market tends to weaken Gold price, while sell-offs in riskier markets tend to favor the precious metal.
The price can move due to a wide range of factors. Geopolitical instability or fears of a deep recession can quickly make Gold price escalate due to its safe-haven status. As a yield-less asset, Gold tends to rise with lower interest rates, while higher cost of money usually weighs down on the yellow metal. Still, most moves depend on how the US Dollar (USD) behaves as the asset is priced in dollars (XAU/USD). A strong Dollar tends to keep the price of Gold controlled, whereas a weaker Dollar is likely to push Gold prices up.
| Raw materials | Closed | Change, % |
|---|---|---|
| Silver | 29.56 | 0.14 |
| Gold | 233.36 | 0.54 |
| Palladium | 973.35 | 3.72 |
Japan Chief Cabinet Secretary Yoshimasa Hayashi said on Monday that excessive foreign exchange (FX) volatility is undesirable, adding that he will closely monitor the FX moves and will take necessary steps if needed.
Key quotes
Won't comment on Forex levels.
Important for currencies to move in a stable manner, reflecting fundamentals.
Excessive FX volatility is undesirable.
Closely watching FX moves, will respond appropriately to excessive volatility.
Market reaction
At the time of writing, USD/JPY was trading at 159.44, losing 0.12% on the day.
Japanese Yen FAQs
The Japanese Yen (JPY) is one of the world’s most traded currencies. Its value is broadly determined by the performance of the Japanese economy, but more specifically by the Bank of Japan’s policy, the differential between Japanese and US bond yields, or risk sentiment among traders, among other factors.
One of the Bank of Japan’s mandates is currency control, so its moves are key for the Yen. The BoJ has directly intervened in currency markets sometimes, generally to lower the value of the Yen, although it refrains from doing it often due to political concerns of its main trading partners. The current BoJ ultra-loose monetary policy, based on massive stimulus to the economy, has caused the Yen to depreciate against its main currency peers. This process has exacerbated more recently due to an increasing policy divergence between the Bank of Japan and other main central banks, which have opted to increase interest rates sharply to fight decades-high levels of inflation.
The BoJ’s stance of sticking to ultra-loose monetary policy has led to a widening policy divergence with other central banks, particularly with the US Federal Reserve. This supports a widening of the differential between the 10-year US and Japanese bonds, which favors the US Dollar against the Japanese Yen.
The Japanese Yen is often seen as a safe-haven investment. This means that in times of market stress, investors are more likely to put their money in the Japanese currency due to its supposed reliability and stability. Turbulent times are likely to strengthen the Yen’s value against other currencies seen as more risky to invest in.
- The Australian Dollar inches lower possibly due to investors' caution as looming inflation data.
- Australia's Westpac Consumer Confidence rose by 1.7% MoM in June, marking the highest level since February.
- The US Dollar may limit its downside strong US business activity data dampened expectations for Fed rate cuts.
The Australian Dollar (AUD) inches lower on Tuesday despite an improvement in Australia's Westpac Consumer Confidence Index, released on Tuesday. This decline could be attributed to the investors' caution ahead of this week's Australian inflation data. However, the AUD/USD pair may limit its downside due to the hawkish stance of the Reserve Bank of Australia (RBA).
The RBA Governor Michele Bullock said during her latest press conference that the Board discussed potential rate hikes, dismissing considerations of rate cuts in the near term, as per ABC News. Markets have significantly reduced their expectations for a RBA’s rate cut this year, with an easing not anticipated until April next year.
The US Dollar trades on a softer note ahead of key US economic data due later this week. The revised US Gross Domestic Product (GDP) for the first quarter (Q1) is set to be released on Thursday, followed by the Personal Consumption Expenditure (PCE) Price Index on Friday.
Daily Digest Market Movers: Australian Dollar edges lower due to risk aversion
- Australia's Westpac Consumer Confidence rose by 1.7% month-over-month in June, rebounding from a 0.3% decline the previous month. This marks the first increase in four months and the highest level since February.
- According to the CME FedWatch Tool, investors are pricing in nearly 67.7% odds of a Fed rate cut in September, compared to 61.5% a week earlier.
- On Tuesday, the People's Bank of China injected 300 billion Yuan via seven-day reverse repos, maintaining the reverse repo rate at 1.8%. Any change in the Chinese economy could impact the Australian market, as China and Australia are close trade partners.
- On Friday, the US Composite PMI for June surpassed expectations, rising to 54.6 from May’s reading of 54.5. This figure marked the highest level since April 2022. The Manufacturing PMI increased to a reading of 51.7 from a 51.3 figure, exceeding the forecast of 51.0. Similarly, the Services PMI rose to 55.1 from 54.8 in May, beating the consensus estimate of 53.7.
- As per a Reuters report, Fed Reserve Bank of Minneapolis President Neel Kashkari noted on Thursday that it will probably take a year or two to get inflation back to 2%.
Technical Analysis: Australian Dollar hovers around 0.6650
The Australian Dollar trades around 0.6650 on Tuesday. Analysis of the daily chart shows a neutral bias for the AUD/USD pair as it consolidates within a rectangle formation. The 14-day Relative Strength Index (RSI) is positioned slightly above the 50 level, indicating a potential bullish bias.
The AUD/USD pair may find support around the 50-day Exponential Moving Average (EMA) at 0.6615, with additional support near 0.6585, marking the lower boundary of the rectangle formation.
On the upside, the AUD/USD pair may encounter resistance near the upper boundary of the rectangle formation around 0.6695, aligned with the psychological level of 0.6700. Beyond that, potential resistance levels include the high of 0.6714 observed since January.
AUD/USD: Daily Chart
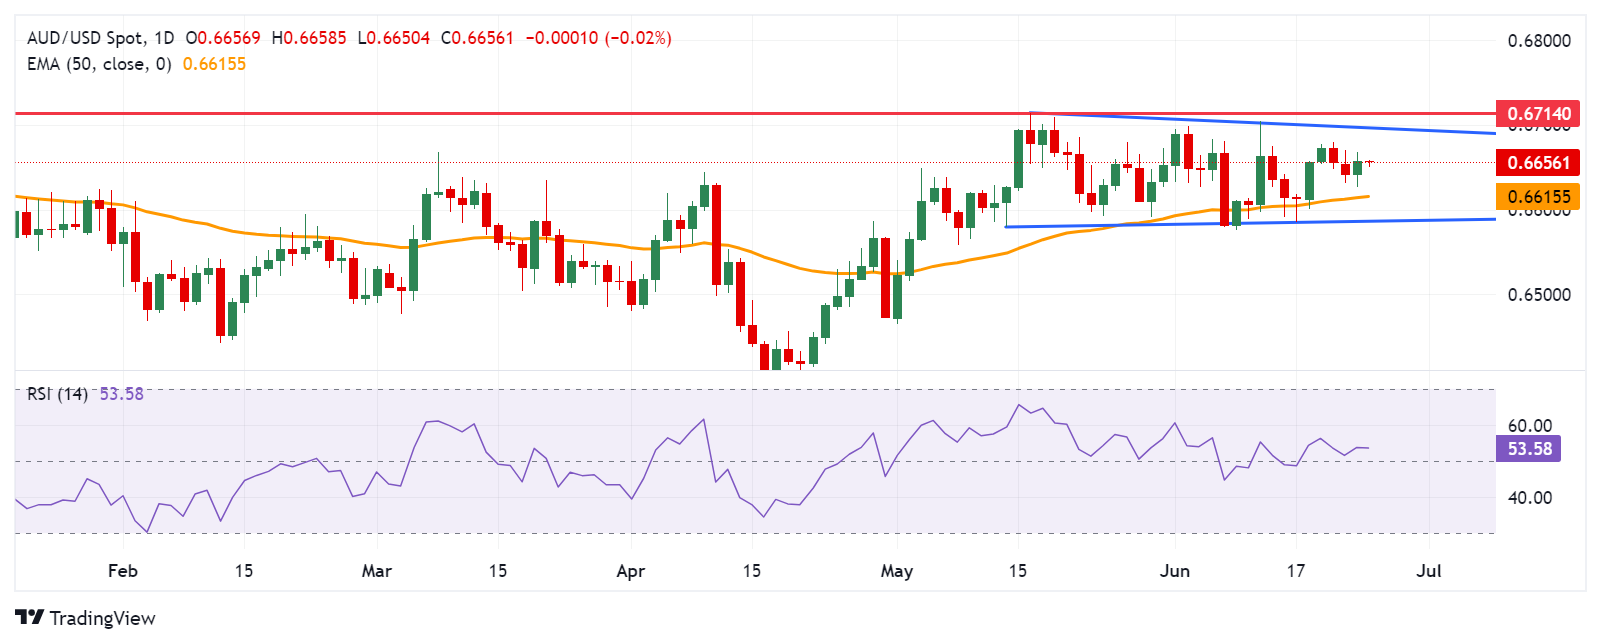
Australian Dollar price today
The table below shows the percentage change of the Australian Dollar (AUD) against listed major currencies today. The Australian Dollar was the weakest against the Japanese Yen.
| USD | EUR | GBP | CAD | AUD | JPY | NZD | CHF | |
| USD | -0.02% | -0.03% | -0.03% | -0.03% | -0.14% | -0.05% | -0.09% | |
| EUR | 0.02% | -0.03% | -0.01% | -0.01% | -0.10% | -0.03% | -0.07% | |
| GBP | 0.03% | 0.01% | 0.00% | 0.00% | -0.09% | -0.02% | -0.05% | |
| CAD | 0.03% | 0.01% | 0.00% | 0.00% | -0.09% | -0.02% | -0.06% | |
| AUD | 0.03% | 0.00% | -0.01% | -0.01% | -0.10% | -0.03% | -0.05% | |
| JPY | 0.14% | 0.12% | 0.11% | 0.11% | 0.07% | 0.07% | 0.05% | |
| NZD | 0.04% | 0.03% | 0.02% | 0.02% | 0.02% | -0.07% | -0.04% | |
| CHF | 0.08% | 0.06% | 0.05% | 0.05% | 0.05% | -0.04% | 0.03% |
The heat map shows percentage changes of major currencies against each other. The base currency is picked from the left column, while the quote currency is picked from the top row. For example, if you pick the Euro from the left column and move along the horizontal line to the Japanese Yen, the percentage change displayed in the box will represent EUR (base)/JPY (quote).
Australian Dollar FAQs
One of the most significant factors for the Australian Dollar (AUD) is the level of interest rates set by the Reserve Bank of Australia (RBA). Because Australia is a resource-rich country another key driver is the price of its biggest export, Iron Ore. The health of the Chinese economy, its largest trading partner, is a factor, as well as inflation in Australia, its growth rate, and Trade Balance. Market sentiment – whether investors are taking on more risky assets (risk-on) or seeking safe havens (risk-off) – is also a factor, with risk-on positive for AUD.
The Reserve Bank of Australia (RBA) influences the Australian Dollar (AUD) by setting the level of interest rates that Australian banks can lend to each other. This influences the level of interest rates in the economy as a whole. The main goal of the RBA is to maintain a stable inflation rate of 2-3% by adjusting interest rates up or down. Relatively high interest rates compared to other major central banks support the AUD, and the opposite for relatively low. The RBA can also use quantitative easing and tightening to influence credit conditions, with the former AUD-negative and the latter AUD-positive.
China is Australia’s largest trading partner so the health of the Chinese economy is a major influence on the value of the Australian Dollar (AUD). When the Chinese economy is doing well it purchases more raw materials, goods and services from Australia, lifting demand for the AUD, and pushing up its value. The opposite is the case when the Chinese economy is not growing as fast as expected. Positive or negative surprises in Chinese growth data, therefore, often have a direct impact on the Australian Dollar and its pairs.
Iron Ore is Australia’s largest export, accounting for $118 billion a year according to data from 2021, with China as its primary destination. The price of Iron Ore, therefore, can be a driver of the Australian Dollar. Generally, if the price of Iron Ore rises, AUD also goes up, as aggregate demand for the currency increases. The opposite is the case if the price of Iron Ore falls. Higher Iron Ore prices also tend to result in a greater likelihood of a positive Trade Balance for Australia, which is also positive of the AUD.
The Trade Balance, which is the difference between what a country earns from its exports versus what it pays for its imports, is another factor that can influence the value of the Australian Dollar. If Australia produces highly sought after exports, then its currency will gain in value purely from the surplus demand created from foreign buyers seeking to purchase its exports versus what it spends to purchase imports. Therefore, a positive net Trade Balance strengthens the AUD, with the opposite effect if the Trade Balance is negative.
The People’s Bank of China (PBoC) set the USD/CNY central rate for the trading session ahead on Tuesday at 7.1225, as against the previous day's fix of 7.1201 and 7.2587 Reuters estimates.
- WTI hovers around $82.00 amid the softer US dollar on Tuesday.
- The renewed hopes of a summertime upswing in fuel demand and geopolitical risks support the WTI price.
- The expectation that the Fed will delay the rate-cutting cycle might drag the black gold lower.
West Texas Intermediate (WTI), the US crude oil benchmark, is trading around $82.00 on Tuesday. The rise of the WTI price is bolstered by the hope for a strong summer driving demand and oil supply concerns amid the ongoing geopolitical tensions in the Middle East.
Summer demand is likely to drive the WTI price higher. JPMorgan reported that global oil demand has increased by 1.4 million bpd this month, supported by robust summer travel across Europe and Asia.
Geopolitical risks in the Middle East and Ukraine could endanger crude flows from the region, which also underpin the WTI price. TD Securities’s senior commodity strategist, Ryan McKay, said that supply risks are now back in focus as tensions are building on the Israel-Lebanon border. Israeli Prime Minister Benjamin Netanyahu stated that the most intense phase of the assault against Hamas in Gaza is close to ending while stressing the broader war against Hamas wages on, per CNN. Meanwhile, Ukraine President Volodymyr Zelenskyy stated Monday that Kyiv attacked around 30 Russian oil refineries, terminals, and bases, but did not provide a time range for the strikes.
On the other hand, the stronger US Dollar (USD) and the hawkish stance of Federal Reserve (Fed) officials might weigh on the black gold. San Francisco Federal Reserve Bank President Mary Daly said on Monday that she does not believe the Fed should cut rates before policymakers are confident that inflation is headed towards 2%. Higher interest rates generally weigh on WTI prices as it increases the cost of borrowing, which can dampen economic activity and oil demand.
| Index | Change, points | Closed | Change, % |
|---|---|---|---|
| NIKKEI 225 | 208.18 | 38804.65 | 0.54 |
| Hang Seng | -0.81 | 18027.71 | -0 |
| KOSPI | -19.53 | 2764.73 | -0.7 |
| ASX 200 | -62.3 | 7733.7 | -0.8 |
| DAX | 162.06 | 18325.58 | 0.89 |
| CAC 40 | 78.32 | 7706.89 | 1.03 |
| Dow Jones | 260.88 | 39411.21 | 0.67 |
| S&P 500 | -16.75 | 5447.87 | -0.31 |
| NASDAQ Composite | -192.54 | 17496.82 | -1.09 |
| Pare | Closed | Change, % |
|---|---|---|
| AUDUSD | 0.6656 | 0.22 |
| EURJPY | 171.291 | 0.32 |
| EURUSD | 1.07329 | 0.37 |
| GBPJPY | 202.465 | 0.29 |
| GBPUSD | 1.26861 | 0.34 |
| NZDUSD | 0.61242 | 0.13 |
| USDCAD | 1.36574 | -0.25 |
| USDCHF | 0.89264 | -0.13 |
| USDJPY | 159.598 | -0.05 |


© 2000-2024. Bản quyền Teletrade.
Trang web này được quản lý bởi Teletrade D.J. LLC 2351 LLC 2022 (Euro House, Richmond Hill Road, Kingstown, VC0100, St. Vincent and the Grenadines).
Thông tin trên trang web không phải là cơ sở để đưa ra quyết định đầu tư và chỉ được cung cấp cho mục đích làm quen.
Giao dịch trên thị trường tài chính (đặc biệt là giao dịch sử dụng các công cụ biên) mở ra những cơ hội lớn và tạo điều kiện cho các nhà đầu tư sẵn sàng mạo hiểm để thu lợi nhuận, tuy nhiên nó mang trong mình nguy cơ rủi ro khá cao. Chính vì vậy trước khi tiến hành giao dịch cần phải xem xét mọi mặt vấn đề chấp nhận tiến hành giao dịch cụ thể xét theo quan điểm của nguồn lực tài chính sẵn có và mức độ am hiểu thị trường tài chính.
Sử dụng thông tin: sử dụng toàn bộ hay riêng biệt các dữ liệu trên trang web của công ty TeleTrade như một nguồn cung cấp thông tin nhất định. Việc sử dụng tư liệu từ trang web cần kèm theo liên kết đến trang teletrade.vn. Việc tự động thu thập số liệu cũng như thông tin từ trang web TeleTrade đều không được phép.
Xin vui lòng liên hệ với pr@teletrade.global nếu có câu hỏi.
ngân hàng