- Phân tích
- Tin tức và các công cụ
- Tin tức thị trường
Tin tức thì trường
| Time | Country | Event | Period | Previous value | Forecast |
|---|---|---|---|---|---|
| 00:00 (GMT) | United Kingdom | MPC Member Andy Haldane Speaks | |||
| 00:30 (GMT) | Australia | Private Sector Credit, m/m | January | 0.3% | |
| 00:30 (GMT) | Australia | Private Sector Credit, y/y | January | 1.8% | |
| 05:00 (GMT) | Japan | Construction Orders, y/y | January | -1.3% | |
| 05:00 (GMT) | Japan | Housing Starts, y/y | January | -9% | |
| 07:00 (GMT) | United Kingdom | Nationwide house price index, y/y | February | 6.4% | |
| 07:00 (GMT) | United Kingdom | Nationwide house price index | February | -0.3% | |
| 07:45 (GMT) | France | CPI, m/m | February | ||
| 07:45 (GMT) | France | CPI, y/y | February | ||
| 07:45 (GMT) | France | Consumer spending | January | 23% | |
| 07:45 (GMT) | France | GDP, q/q | Quarter IV | 18.7% | -1.3% |
| 08:00 (GMT) | Switzerland | KOF Leading Indicator | February | 96.5 | |
| 08:00 (GMT) | Switzerland | Gross Domestic Product (YoY) | Quarter IV | -1.6% | |
| 08:00 (GMT) | Switzerland | Gross Domestic Product (QoQ) | Quarter IV | 7.2% | |
| 12:30 (GMT) | United Kingdom | MPC Member Ramsden Speaks | |||
| 13:30 (GMT) | U.S. | Goods Trade Balance, $ bln. | January | -82.47 | |
| 13:30 (GMT) | U.S. | Personal spending | January | -0.2% | 0.5% |
| 13:30 (GMT) | U.S. | Personal Income, m/m | January | 0.6% | 8% |
| 13:30 (GMT) | U.S. | PCE price index ex food, energy, Y/Y | January | 1.5% | |
| 13:30 (GMT) | U.S. | PCE price index ex food, energy, m/m | January | 0.3% | |
| 14:45 (GMT) | U.S. | Chicago Purchasing Managers' Index | February | 63.8 | |
| 15:00 (GMT) | U.S. | Reuters/Michigan Consumer Sentiment Index | February | 79 | 76.2 |
| 18:00 (GMT) | U.S. | Baker Hughes Oil Rig Count | February |
- Welcomes any rise in inflation expectations after years in which the pace was too weak
- H1 growth to be a "little bit weaker" than we projected
- ECB has maintained favorable financing conditions
The National Association
of Realtors (NAR) announced on Thursday its seasonally adjusted pending home
sales index (PHSI) fell 2.8 percent m-o-m to 122.8 in January 2021, after a
revised 0.5 percent m-o-m advance in December 2020 (originally a 0.3 percent
m-o-m decrease).
Economists had
expected pending home sales to be flat m-o-m in January.
On y-o-y basis,
the index rose 13.0 percent, following a revised 20.8 percent jump in December
(originally a 21.4 percent m-o-m climb).
According to
the report, three of all four regional indices recorded month-over-month decreases
in January, but all four regions rose from one year ago, including two regions reaching
double-digit gains. The Northeast PHSI plunged 7.4 percent m-o-m to 101.6 in
January, but posted a 9.6 percent rise from a year ago. The index in the West fell
7.8 percent m-o-m in January, to 104.6, up 11.5 percent from a year prior. The PHSI
for the Midwest dropped 0.9 percent m-o-m to 113.2 last month, up 8.6 percent
from January 2020. Meanwhile, pending home sales in the South edged up 0.1
percent m-o-m to an index of 151.3 in January, up 17.1 percent from January
2020.
"Pending
home sales fell in January because there are simply not enough homes to match
the demand on the market," noted Lawrence Yun, NAR's chief economist.
"That said, there has been an increase in permits and requests to build
new homes."
- Monetary policy is set to remain highly accommodative for some time
- Fed is positioned to patient as it follows outlook for the virus and the economy
- It is too early to discuss pulling back on accommodation given elevated unemployment, below-target inflation, and uncertainties surrounding the outlook
- Recent rise in long-term rates does not warrant a monetary policy response
- Much of the increase in yields reflects growing optimism in strength of the recovery
- Additional monetary stimulus could exacerbate the unevenness that has been the defining characteristic of the pandemic downturn
- Unemployment rate of 6.3% likely underestimates slack in labor market
- The stage is set for strong recovery once widespread vaccination is achieved
The U.S.
Commerce Department reported on Thursday that the durable goods orders climbed
3.4 percent m-o-m in January 2021, following a revised 1.2 percent m-o-m gain
in December 2020 (originally a 0.2 percent m-o-m advance). This represented the
biggest monthly increase in durable goods orders since July 2020.
Economists had
forecast a 1.1 percent m-o-m jump.
According to
the report, a 7.8 percent m-o-m surge in orders for transportation equipment was
the major contributor to the January rise. Meanwhile, orders for durable goods
excluding transportation increased 1.4 percent m-o-m in January, following a
revised 1.7 percent m-o-m advance in December (originally a 0.7 percent m-o-m
gain), also exceeding economists’ forecast of 0.7 percent m-o-m rise.
Elsewhere, orders
for non-defense capital goods excluding aircraft, a closely watched proxy for
business spending plans, increased 0.5 percent m-o-m in January after a revised
1.5 percent jump m-o-m in December (originally a 0.7 percent m-o-m gain).
Economists had called for a 0.7 percent m-o-m advance in core capital goods
orders in January.
Shipments of
these core capital goods rose 2.1 percent m-o-m in January after a revised 1.0
percent m-o-m jump in the prior month (originally a 0.7 percent m-o-m advance).
U.S. stock-index futures fell on Thursday, as the heavily-weighted technology stocks remained under pressure amid growing U.S. Treasury yields, while a raft of better-than-expected U.S. economic data helped build confidence in the country's economic recovery.
Global Stocks:
Index/commodity | Last | Today's Change, points | Today's Change, % |
Nikkei | 30,168.27 | +496.57 | +1.67% |
Hang Seng | 30,074.17 | +355.93 | +1.20% |
Shanghai | 3,585.05 | +20.97 | +0.59% |
S&P/ASX | 6,834.00 | +56.20 | +0.83% |
FTSE | 6,686.46 | +27.49 | +0.41% |
CAC | 5,805.90 | +7.92 | +0.14% |
DAX | 13,974.43 | -1.57 | -0.01% |
Crude oil | $63.21 | -0.02% | |
Gold | $1,780.60 | -0.96% |
- Recovery in U.S. is in a "rough patch" now but outlook for jobs is not totally gloomy
- A lot of strength households currently feel in their finances depends on outcome of fiscal discussions
(company / ticker / price / change ($/%) / volume)
3M Co | MMM | 177.36 | -0.27(-0.15%) | 1236 |
ALCOA INC. | AA | 27.64 | 0.44(1.62%) | 52363 |
ALTRIA GROUP INC. | MO | 45.06 | 0.06(0.13%) | 13061 |
Amazon.com Inc., NASDAQ | AMZN | 3,147.00 | -12.53(-0.40%) | 30829 |
American Express Co | AXP | 140.59 | 0.70(0.50%) | 4182 |
AMERICAN INTERNATIONAL GROUP | AIG | 45.86 | 0.43(0.95%) | 3570 |
Apple Inc. | AAPL | 124.76 | -0.59(-0.47%) | 1235433 |
AT&T Inc | T | 29.2 | -0.18(-0.61%) | 302393 |
Boeing Co | BA | 228.66 | -0.68(-0.30%) | 206566 |
Caterpillar Inc | CAT | 222.39 | -0.08(-0.04%) | 3545 |
Chevron Corp | CVX | 104.4 | 1.09(1.06%) | 43523 |
Cisco Systems Inc | CSCO | 45.6 | -0.14(-0.31%) | 17469 |
Citigroup Inc., NYSE | C | 69.64 | 1.04(1.52%) | 189446 |
E. I. du Pont de Nemours and Co | DD | 72.08 | 0.40(0.56%) | 94223 |
Exxon Mobil Corp | XOM | 57.21 | 0.51(0.90%) | 262305 |
Facebook, Inc. | FB | 262.6 | -1.71(-0.65%) | 96134 |
FedEx Corporation, NYSE | FDX | 259.12 | -0.94(-0.36%) | 1197 |
Ford Motor Co. | F | 12.25 | -0.02(-0.16%) | 1706331 |
Freeport-McMoRan Copper & Gold Inc., NYSE | FCX | 38.26 | 0.37(0.98%) | 111763 |
General Electric Co | GE | 13.13 | 0.01(0.08%) | 520511 |
General Motors Company, NYSE | GM | 52.8 | -0.10(-0.19%) | 135588 |
Goldman Sachs | GS | 333.81 | 3.17(0.96%) | 12164 |
Google Inc. | GOOG | 2,080.00 | -15.17(-0.72%) | 5292 |
Home Depot Inc | HD | 261 | 1.03(0.40%) | 17321 |
Intel Corp | INTC | 62.77 | -0.42(-0.66%) | 112898 |
International Business Machines Co... | IBM | 122.84 | -0.37(-0.30%) | 6657 |
International Paper Company | IP | 51 | 0.20(0.39%) | 703 |
Johnson & Johnson | JNJ | 164.36 | 1.77(1.09%) | 71335 |
JPMorgan Chase and Co | JPM | 155.33 | 2.07(1.35%) | 50177 |
McDonald's Corp | MCD | 214.6 | 1.33(0.62%) | 16049 |
Merck & Co Inc | MRK | 74.85 | 0.28(0.38%) | 27646 |
Microsoft Corp | MSFT | 233.14 | -1.41(-0.60%) | 220552 |
Nike | NKE | 136.91 | 1.26(0.93%) | 19982 |
Pfizer Inc | PFE | 33.82 | 0.07(0.21%) | 184665 |
Procter & Gamble Co | PG | 127.75 | 0.09(0.07%) | 3964 |
Starbucks Corporation, NASDAQ | SBUX | 104.1 | -0.28(-0.27%) | 31912 |
Tesla Motors, Inc., NASDAQ | TSLA | 724.11 | -17.91(-2.41%) | 712893 |
The Coca-Cola Co | KO | 50.66 | -0.05(-0.10%) | 28710 |
Twitter, Inc., NYSE | TWTR | 71.81 | -0.11(-0.15%) | 51238 |
UnitedHealth Group Inc | UNH | 330.2 | -2.01(-0.61%) | 2642 |
Verizon Communications Inc | VZ | 56.69 | -0.43(-0.75%) | 178827 |
Visa | V | 217.83 | -1.60(-0.73%) | 19650 |
Wal-Mart Stores Inc | WMT | 133.33 | 0.12(0.09%) | 44658 |
Walt Disney Co | DIS | 197.98 | 0.47(0.24%) | 31098 |
Yandex N.V., NASDAQ | YNDX | 66.61 | -0.36(-0.54%) | 2160 |
AT&T (T) downgraded to Perform from Outperform at Oppenheimer
Verizon (VZ) downgraded to Perform from Outperform at Oppenheimer
NIKE (NKE) upgraded to Buy from Hold at HSBC Securities; target raised to $158
A report from
the Commerce Department showed on Thursday that the U.S. economy expanded slightly
more than initially estimated in the fourth quarter of 2020, reflecting the upward
revisions to residential fixed investment, private inventory investment, and
state and local government spending, which were partly offset by a downward
revision to personal consumption expenditures (PCE).
According to
the second estimate, the U.S. gross domestic product (GDP) grew at a 4.1
percent annual rate in the fourth quarter, slightly faster than a 4.0 percent advance
reported in the advance estimate.
Economists had
expected the decline rate to be revised to 4.2 percent, following the third
quarter's surge of 33.4 percent.
The increase in
real GDP in the fourth quarter reflected gains in exports, nonresidential fixed
investment, PCE, residential fixed investment, and private inventory investment
that were partly offset by declines in state and local government spending and
federal government spending. Meanwhile, imports, which are a subtraction in the
calculation of GDP, rose.
The data from
the Labor Department revealed on Thursday the number of applications for
unemployment fell more than forecast last week, but remained elevated, as the
U.S. labor market struggles to recover from its biggest shock in history,
caused by the COVID-19 pandemic.
According to
the report, the initial claims for unemployment benefits decreased by 111,000
to 730,000 for the week ended February 20. This was the lowest reading since
the week ended November 29. Still, claims remained well above the pre-pandemic
levels.
Economists had
expected 838,000 new claims last week.
Claims for the
prior week were revised downwardly to 841,000 from the initial estimate of 861,000.
Meanwhile, the
four-week moving average of jobless claims declined to 807,750 from a downwardly
revised 828,250 in the previous week.
Continuing
claims dropped to 4,419,000 from an upwardly revised 4,520,000 in the previous
week.
FXStreet reports that the Credit Suisse analyst team notes that the S&P 500 Index is recovering strongly and above 3934 it is expected to see a resumption of the core uptrend back to 3950/51, then 3975 and eventually 4070/75.
“We remain of the view that recent weakness was a temporary and corrective pause only prior to the core uptrend resuming. Above 3930/34 remains needed to add weight to our view to further reinforce the likelihood the core uptrend has indeed resumed for strength back to the 3950/51 highs.
“Above 3950 in due course should see a move to trend resistance at 3974/75 next, then the 4000 psychological barrier, also the top of the daily Bollinger Band.”
“Support moves to 3908 initially, then 3896, with 3860 now ideally holding further weakness.”
FXStreet reports that Lee Sue Ann, Economist at UOB Group, evaluates the latest figures from inflation and the labour market in the UK.
“The UK’s unemployment rate rose to 5.1% in the three months to December, from 5.0% in November. Employment fell by 114,000, compared with expectations for a 30,000 decline. However, average weekly earnings rose sharply to 4.7% y/y in the three months to December, from 3.7% in the three months to November.”
“Meanwhile, UK inflation rose a touch faster than expected in January. CPI accelerated to 0.7% y/y in January, from 0.6% y/y in December. The reading was above consensus of 0.6% y/y… This likely temporary period of above target inflation over the summer is unlikely to prompt a hawkish turn by the Bank of England (BOE), which will be focused on the weakness in the labour market.”
“With the COVID-19 pandemic still taking its toll on busineses and households, and the oulook highly uncertain, the BOE will be cognizant of the risks and hence, likely to maintain a very accomodative monetary policy stance until the recovery is on a firmer footing. At this juncture, we are not ruling out an acceleration in the pace of bond purchases, or changes to the Term Funding Scheme. As for negative interest rates, we are not expecting any further cuts for now, though policymakers will be careful not to shut the door to this option.”
Value and international stocks to be the main beneficiaries of the cyclical recovery - JP Morgan
FXStreet reports that Meera Pandit, Global Market Strategist at JP Morgan, notes that comparing the recoveries of the global financial crisis (GFC) and the pandemic recession is like comparing the tortoise and the hare: the aftermath of the former was slow and steady, while the latter should experience a burst of speed ahead. The difference in the potential strength and speed of the recovery can be attributed to three factors.
“The financial crisis was a demand-driven recession, in which housing and financial market excesses led the economy to overheat and collapse, destroying demand, and therefore growth and employment, in the years that followed. The COVID-19 recession shocked a healthy economy in which demand was still strong, but supply was then reduced. Once that supply returns (activity normalizes in a post-vaccine world), pent-up demand can be realized.”
“Policy support has been swifter and much greater. Credit was tight after the GFC, while lending and access to credit have remained robust throughout the pandemic. Also, this round of quantitative easing (QE4) is now nearly larger than QE1-QE3 combined. Meanwhile, the federal government is set to pass packages for a total price tag of $5.2 trillion and 25% of 2020 nominal GDP, this dwarfs the $831 billion American Recovery and Reinvestment Act of 2009, which was just 5.8% of 2009 nominal GDP.”
“Massive policy support propelled one of the fastest market recoveries on record. S&P 500 valuations have soared to 22.0x currently, compared to 12.9x in the corresponding post-GFC period. Although the improving backdrop should support markets in the months ahead, high valuations may constrain long-term returns. Investors should seek attractive relative valuations and beneficiaries of the cyclical recovery, like in value stocks and international equities.”
EUR/GBP: Support at 0.8520 to hold for a consolidation phase - Credit Suisse
FXStreet reports that EUR/GBP momentum is slowing ahead of a cluster of Fibonacci supports at 0.8543/20, including the 38.2% retracement of the entire 2015/2020 bull trend and economists at Credit Suisse look for this to hold for now.
“With momentum now slowing we continue to look for the 38.2% retracement of the entire 2015/2020 bull trend at 0.8520 to hold at first for a consolidation/recovery phase.”
“Big picture, we look for a break in due course which should then see a move to the ‘measured objective’ from the large ‘head & shoulders’ top at 0.8430, and now we think an eventual test of the key 0.8281/39 lows of 2019 and 2020.”
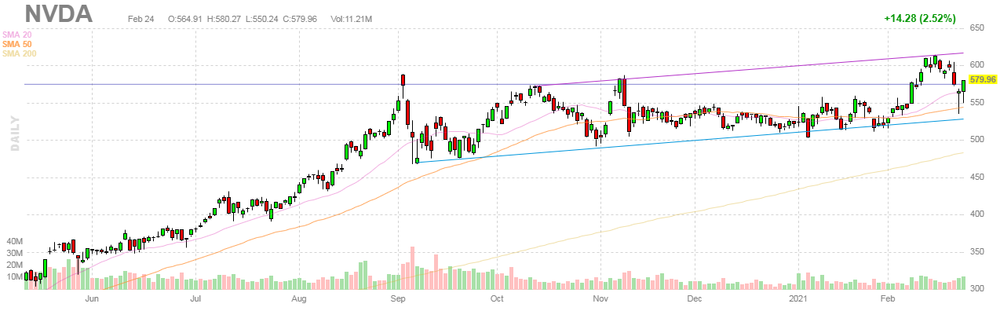
NVIDIA Corp. (NVDA) reported Q4 FY 2020 earnings of $3.10 per share (versus $1.89 per share in Q4 FY 2019), solidly beating analysts’ consensus estimate of $1.98 per share.
The company’s quarterly revenues amounted to $5.003 bln (+61.1% y/y), beating analysts’ consensus estimate of $4.819 bln.
The company also issued upside guidance for Q1 FY 2021, projecting Q1 revenues of $5.194-5.406 bln versus analysts’ consensus estimate of $4.53 bln.
NVDA fell to $565.82(-2.44%) in pre-market trading.
Commodity-related currencies to continue outperforming - MUFG
FXStreet reports that renewed U.S. dollar weakness has been mainly evident against the commodity-related G10 currencies of the New Zealand dollar (+3.0%) and Australian dollar (+2.6%). The oil-related currencies of the Canadian dollar (+1.4%) and Norwegian krone (+1.1%) have also outperformed. Commodity currencies are set to continue strengthening in the opinion of economists at MUFG Bank.
“The commodity-related currencies continue to benefit from building confidence in the outlook for the economic recovery. It has been notable that global activity data has continued to surprise to the upside at the start of this year in spite of the COVID-related restrictions that have been in place over the winter. It suggests that global economies have been adapting better than expected which is helping to dampen downside risks to growth.”
“The outlook for a stronger global recovery has been supported by further positive vaccine news. The US FDA reported yesterday that Jonson & Johnson’s vaccine was effective at preventing severe COVID-19 symptoms in the US, Brazil and South Africa. It provides reassurance that current vaccines will continue to help reduce the risk of severe disease even from COVID-19 mutations which will help to ease pressure on health systems and ultimately encourage the re-opening of the global economy.”
“The improving global growth outlook continues to be supported by loose monetary and fiscal policies. The main message from major central bank officials this week is that loose monetary policy is set to remain accommodative for the foreseeable future even as growth is expected to strengthen.”
“For now, we continue to see the current trading environment as remaining supportive for commodity-related currency strength.”
- ECB is closely monitoring the evolution of long-term nominal bond yields
- Two key yield curves in Eurozone are overnight index swap (OIS) curve and GDP-weighted sovereign bond yield curve
- Our monetary policy measures can contribute to preserving OIS yield curve and gdp-weighted sovereign yield curve at favourable levels
Bloomberg reports that according to Deutsche Bank AG strategists, U.S. stimulus checks could unleash a $170 billion wave of fresh retail inflows to the stock market.
A survey of retail investors showed respondents planned to put 37% of their stimulus cash directly into equities, a team including Parag Thatte wrote in a note. With potentially $465 billion of direct stimulus being planned, that adds up to $170 billion, they said.
“Retail sentiment remains positive across the board, regardless of age, income or when the investor began trading. Retail investors say they expect to maintain or add to their stock holdings even as the economy re-opens.” the strategists wrote.
According to Deutsche, new investors are younger and more aggressive, and much more likely to trade options frequently compared with more experienced traders. When faced with a hypothetical modest selloff, a majority of respondents said they would increase their investments, the note said -- though on net they’d pull out money if the selloff surpassed 10%.
FXStreet reports that analysts at Credit Suisse discuss EUR/JPY prospects.
“EUR/JPY has surged higher again for a move with ease above the ‘measured base objective’ and 61.8% retracement of the 2018/2020 bear trend at 128.67/70, leaving the market on course for its “measured triangle objective” at 130.13/16.”
“Although a fresh pause should be allowed at 130.13/16, we see no reason not to look for this to be cleared also to open the door to a move to 131.26 next and then 132.55 – the 78.6% retracement of the entire 2018/2020 bear trend. With the key September 2018 high not far above at 133.13, we would then look for a more important cap here and consolidation.”
According to the report from European Commission, In February 2021, the Economic Sentiment Indicator (ESI) picked up in both the EU (+1.9 points to 93.1) and the euro area (+1.9 points to 93.4) compared to January. The Employment Expectations Indicator (EEI) also increased (+1.7 points to 91.9 in the EU and +1.8 points to 90.9 in the euro area).
In the EU, the ESI’s increase in February was driven by improving confidence in industry, services and among consumers, while confidence declined slightly in retail trade and remained broadly unchanged in construction.
Amongst the largest EU economies, the ESI rose markedly in Poland (+4.7), Italy (+4.4), Germany (+3.0) and, to a lesser extent, in France (+0.9). By contrast, sentiment worsened strongly in Spain (-3.2) and, more mildly so, in the Netherlands (-1.3).
According to the report from European Central Bank, the annual growth rate of the broad monetary aggregate M3 stood at 12.5% in January 2021, after 12.4% in December 2020, averaging 12.0% in the three months up to January. The components of M3 showed the following developments. The annual growth rate of the narrower aggregate M1, which comprises currency in circulation and overnight deposits, increased to 16.4% in January from 15.6% in December. The annual growth rate of short-term deposits other than overnight deposits (M2-M1) decreased to 1.1% in January from 1.7% in December. The annual growth rate of marketable instruments (M3-M2) decreased to 18.2% in January from 25.0% in December.
Annual growth rate of adjusted loans to households stood at 3.0% in January, compared with 3.1% in December
Annual growth rate of adjusted loans to non-financial corporations stood at 7.0% in January, compared with 7.1% in December
Reuters reports that Barclays raised its 2021 oil price forecast, citing weaker than expected supply response from U.S. producers to higher prices and normalizing inventories after last week’s cold storm in Texas.
The bank increased its 2021 Brent crude oil price outlook by $7 to $62 per barrel and WTI crude price estimate by $6 to $58 a barrel.
“Colder-than-normal weather, especially in the southern states, has accelerated the normalization in inventories by disrupting output more than demand,” the British bank said.
U.S. energy firms last week cut the number of oil rigs operating for the first time since November as a freeze hit most of Texas.
The bank said the lacklustre supply response by U.S. oil producers to rising prices indicated that much stronger prices are required for incremental supplies.
The bank expects the Organization of the Petroleum Exporting Countries and allies, a group known as OPEC+, to increase aggregate supply by 1.5 million bpd over the second quarter and Saudi Arabia to reverse the unilateral cut in April. The group is scheduled to meet on March 4.
FXStreet reports that economists at Westpac discuss AUD/USD prospects.
“A$ TWI is printing three-year highs, but the Reserve Bank of Australia (RBA) can’t start to talk about excessive appreciation with base metal and energy prices surging. On Tuesday, the RBA Board should stress the long road to a labour market tight enough to drive wages growth to 3.5%+, consistent with inflation returning to the 2.5% target.”
“The RBA is unlikely to provide encouragement to those pondering tightening ahead of the guidance provided last month. Still, positioning for a global rebound should keep AUD/USD well supported on dips, with scope for 0.8050+ multi-day.”
CNBC reports that an analyst told that Mario Draghi’s new government could be good for financials and consumer recovery plays, as investors turn more bullish on Italian stocks.
“Accomplishing structural reform will be difficult. But after a long period of Italian underperformance, expectations are low. So any signs that Draghi may succeed in achieving growth-boosting structural reforms could lead to an upward rerating of Italian assets,” analysts at investment research firm Gavekal Research said.
The FTSE MIB, Italy’s main stock market index, has risen about 7% from a low on Jan. 29 on the back of Draghi’s appointment. But experts believe there is further room to grow.
Strategists at UniCredit last week forecast that large and mid-cap segments of the Italian market could have “an absolute performance potential of about 10% from current level” in 2021.
Mislav Matejka, head of global and European equity strategy at JPMorgan, said that Draghi’s policies are “bullish for the Italian equity market, through tighter peripheral spreads, greater policy credibility and the bottoming out in activity momentum, helped by the strong fiscal support.”
“At sector level, this is especially positive for Financials, as well as for consumer recovery plays,” Matejka said.
Financials are the biggest sector among Italian large and mid-cap firms and consumer discretionary stocks make up the third-largest sector.
| Time | Country | Event | Period | Previous value | Forecast | Actual |
|---|---|---|---|---|---|---|
| 00:30 | Australia | Private Capital Expenditure | Quarter IV | -3% | 0% | 3% |
| 05:00 | Japan | Leading Economic Index | December | 96.1 | 94.9 | 95.3 |
| 05:00 | Japan | Coincident Index | December | 89.0 | 87.8 | 88.3 |
| 07:00 | Germany | Gfk Consumer Confidence Survey | March | -15.5 | -14.3 | -12.9 |
| 07:45 | France | Consumer confidence | February | 92 | 92 | 91 |
During today's Asian trading, the US dollar fell against most major currencies. At the same time, the dollar rose against the yen. Experts note that the "dovish" statements of the Fed Chairman Jerome Powell and the growing expectations of large-scale budget spending in the country contribute to an increase in demand for riskier assets.
Speaking before the House Financial Services Committee on Wednesday, Powell said that the focus remains on the recovery of the economy affected by the COVID-19 coronavirus pandemic, and that it is too early to worry about an increase in the budget deficit or rising government bond yields.
On Thursday, traders expect the publication of revised data on US GDP in the fourth quarter of 2020.
Meanwhile, the pound in February may show the highest growth since July on the back of a jump in British government bond yields, caused by improved economic forecasts and the rapid pace of vaccination in the country. Since the beginning of this month, the pound has gained more than 3% against the dollar and the euro. Since the end of last year, the pound has risen by more than 4% against the euro. Meanwhile, the yield on ten-year UK government bonds in February increased by more than 0.4 p. p. The sale of government securities was the highest since 2016.
The ICE Dollar index, which shows the value of the US dollar against six major world currencies, fell by 0.15%
According to the report from Insee, in February 2021, households’ confidence in the economic situation has been almost stable. At 91, the synthetic index has lost one point and remains below its long-term average (100).
In February, the share of households considering it is a suitable time to make major purchases has been stable. The corresponding balance remains below its long-term average.
The households’ opinion balance related to their past financial situation has increased slightly. It has gained one point and remains above its long-term average.
The households’ opinion balance related to their future financial situation has been stable, below its long-term average.
In February, households’ opinion balance related to their future saving capacity has gained three points. Households’ opinion balance related to their current saving capacity has been stable. Both balances are at their highest level ever.
Households' fears about unemployment trend have increased again in February. The corresponding balance has gained three points and approaches its June 2009 historical level.
In February, households considering that prices will be on the rise during the next twelve months have been a bit less numerous than in January: the corresponding balance has lost one point but remains above its long-term average.
In contrast, the share of households considering that prices were on the rise during the past twelve months has increased slightly. The corresponding balance has gained one point staying well below its long-term average.
EUR/USD
Resistance levels (open interest**, contracts)
$1.2264 (3822)
$1.2226 (3090)
$1.2197 (2556)
Price at time of writing this review: $1.2170
Support levels (open interest**, contracts):
$1.2139 (108)
$1.2127 (387)
$1.2106 (1829)
Comments:
- Overall open interest on the CALL options and PUT options with the expiration date March, 5 is 97785 contracts (according to data from February, 24) with the maximum number of contracts with strike price $1,1200 (6887);
GBP/USD
Resistance levels (open interest**, contracts)
$1.4281 (2478)
$1.4245 (740)
$1.4214 (317)
Price at time of writing this review: $1.4133
Support levels (open interest**, contracts):
$1.4035 (182)
$1.3969 (173)
$1.3885 (117)
Comments:
- Overall open interest on the CALL options with the expiration date March, 5 is 15159 contracts, with the maximum number of contracts with strike price $1,4250 (2478);
- Overall open interest on the PUT options with the expiration date March, 5 is 16172 contracts, with the maximum number of contracts with strike price $1,3100 (1225);
- The ratio of PUT/CALL was 1.07 versus 1.10 from the previous trading day according to data from February, 24
* - The Chicago Mercantile Exchange bulletin (CME) is used for the calculation.
** - Open interest takes into account the total number of option contracts that are open at the moment.
FXStreet reports that analysts at Westpac discuss EUR/USD prospects.
“European Council’s intention is to reinforce solidarity but it may also highlight failings in covid vaccination rollout as well as difficulties in vaccine production and delivery. It may also raise issues around the financial response to the pandemic given that the much-vaunted Recovery Fund is still to be disbursed.”
“Stuttering vaccine and fund roll-outs have weighed on regional sentiment especially as the path for unwinding lockdown restrictions is being delayed.”
“EUR/USD is likely to remain contained within an effective 1.20-1.23 range.”
According to the report from GfK, in the wake of the collapse caused by the lockdown at the beginning of the year, February has seen consumer sentiment start to recover. Both economic and income expectations have increased, along with propensity to buy. As a result, GfK is forecasting a decrease of 12.9 points in consumer sentiment for March 2021, up 2.6 points from February this year (revised from -15.5 points). The index was expected to be -14.3.
In addition to increasing income expectations and propensity to buy, the boost in consumer sentiment in Germany was also prompted by a decline in propensity to save.
"Consumers are recovering to some extent from the shock they suffered after the tough lockdown in mid-December. The recent dip in infection rates and the launch of the vaccination program are fueling hopes of a speedy easing of measures," says Rolf Bürkl, consumer expert at GfK.
Both economic and income expectations have more than compensated for the previous month's losses. After plummeting by up to 37 points at the beginning of the year, propensity to buy has recovered around one-fifth of its losses from last month, with an increase of 7.4 points. The indicator currently stands at 7.4 points – over 46 points lower than the same time last year.
| Raw materials | Closed | Change, % |
|---|---|---|
| Brent | 67 | 3.62 |
| Silver | 27.963 | 1.12 |
| Gold | 1805.066 | -0.07 |
| Palladium | 2431.31 | 3.69 |
| Time | Country | Event | Period | Previous value | Forecast |
|---|---|---|---|---|---|
| 00:30 (GMT) | Australia | Private Capital Expenditure | Quarter IV | -3% | |
| 05:00 (GMT) | Japan | Leading Economic Index | December | 96.1 | 94.9 |
| 05:00 (GMT) | Japan | Coincident Index | December | 89.0 | 87.8 |
| 07:00 (GMT) | Germany | Gfk Consumer Confidence Survey | March | -15.6 | |
| 07:45 (GMT) | France | Consumer confidence | February | 92 | |
| 09:00 (GMT) | Eurozone | Private Loans, Y/Y | January | 3.1% | |
| 09:00 (GMT) | Eurozone | M3 money supply, adjusted y/y | January | 12.3% | |
| 10:00 (GMT) | Eurozone | Consumer Confidence | February | -15.5 | |
| 10:00 (GMT) | Eurozone | Industrial confidence | February | -5.9 | |
| 10:00 (GMT) | Eurozone | Economic sentiment index | February | 91.5 | |
| 13:30 (GMT) | U.S. | Continuing Jobless Claims | February | ||
| 13:30 (GMT) | U.S. | FOMC Member Bostic Speaks | |||
| 13:30 (GMT) | U.S. | Durable goods orders ex defense | January | 0.5% | |
| 13:30 (GMT) | U.S. | Durable Goods Orders ex Transportation | January | 0.7% | 0.7% |
| 13:30 (GMT) | U.S. | Durable Goods Orders | January | 0.2% | 1.4% |
| 13:30 (GMT) | U.S. | Initial Jobless Claims | February | ||
| 13:30 (GMT) | U.S. | GDP, q/q | Quarter IV | 33.4% | 4.3% |
| 15:00 (GMT) | U.S. | Pending Home Sales (MoM) | January | -0.3% | |
| 17:00 (GMT) | U.S. | FOMC Member Bostic Speaks | |||
| 20:00 (GMT) | U.S. | FOMC Member Williams Speaks | |||
| 21:45 (GMT) | New Zealand | Trade Balance, mln | January | 17 | |
| 23:30 (GMT) | Japan | Tokyo CPI ex Fresh Food, y/y | February | -0.9% | |
| 23:30 (GMT) | Japan | Tokyo Consumer Price Index, y/y | February | -0.5% | |
| 23:50 (GMT) | Japan | Retail sales, y/y | January | -0.3% | |
| 23:50 (GMT) | Japan | Industrial Production (YoY) | January | -2.6% | |
| 23:50 (GMT) | Japan | Industrial Production (MoM) | January | -1% |
| Pare | Closed | Change, % |
|---|---|---|
| AUDUSD | 0.79688 | 0.75 |
| EURJPY | 128.796 | 0.78 |
| EURUSD | 1.2169 | 0.21 |
| GBPJPY | 149.641 | 0.83 |
| GBPUSD | 1.41389 | 0.26 |
| NZDUSD | 0.7444 | 1.55 |
| USDCAD | 1.25119 | -0.57 |
| USDCHF | 0.9064 | 0.47 |
| USDJPY | 105.831 | 0.58 |


© 2000-2026. Bản quyền Teletrade.
Trang web này được quản lý bởi Teletrade D.J. LLC 2351 LLC 2022 (Euro House, Richmond Hill Road, Kingstown, VC0100, St. Vincent and the Grenadines).
Thông tin trên trang web không phải là cơ sở để đưa ra quyết định đầu tư và chỉ được cung cấp cho mục đích làm quen.
Giao dịch trên thị trường tài chính (đặc biệt là giao dịch sử dụng các công cụ biên) mở ra những cơ hội lớn và tạo điều kiện cho các nhà đầu tư sẵn sàng mạo hiểm để thu lợi nhuận, tuy nhiên nó mang trong mình nguy cơ rủi ro khá cao. Chính vì vậy trước khi tiến hành giao dịch cần phải xem xét mọi mặt vấn đề chấp nhận tiến hành giao dịch cụ thể xét theo quan điểm của nguồn lực tài chính sẵn có và mức độ am hiểu thị trường tài chính.
Sử dụng thông tin: sử dụng toàn bộ hay riêng biệt các dữ liệu trên trang web của công ty TeleTrade như một nguồn cung cấp thông tin nhất định. Việc sử dụng tư liệu từ trang web cần kèm theo liên kết đến trang teletrade.vn. Việc tự động thu thập số liệu cũng như thông tin từ trang web TeleTrade đều không được phép.
Xin vui lòng liên hệ với pr@teletrade.global nếu có câu hỏi.
ngân hàng