LƯU Ý: Tài liệu trong nguồn cấp dữ liệu tin tức và phân tích được cập nhật tự động, tải lại trang có thể làm chậm quá trình xuất hiện tài liệu mới. Để nhận được tài liệu nhanh chóng, chúng tôi khuyên bạn nên luôn mở nguồn cấp tin tức.
Sort by topic
tất cả tin tức
Sắp xếp theo cặp tiền tệ
24.02.2025
23:50
Japan Corporate Service Price Index (YoY) increased to 3.1% in January from previous 2.9%
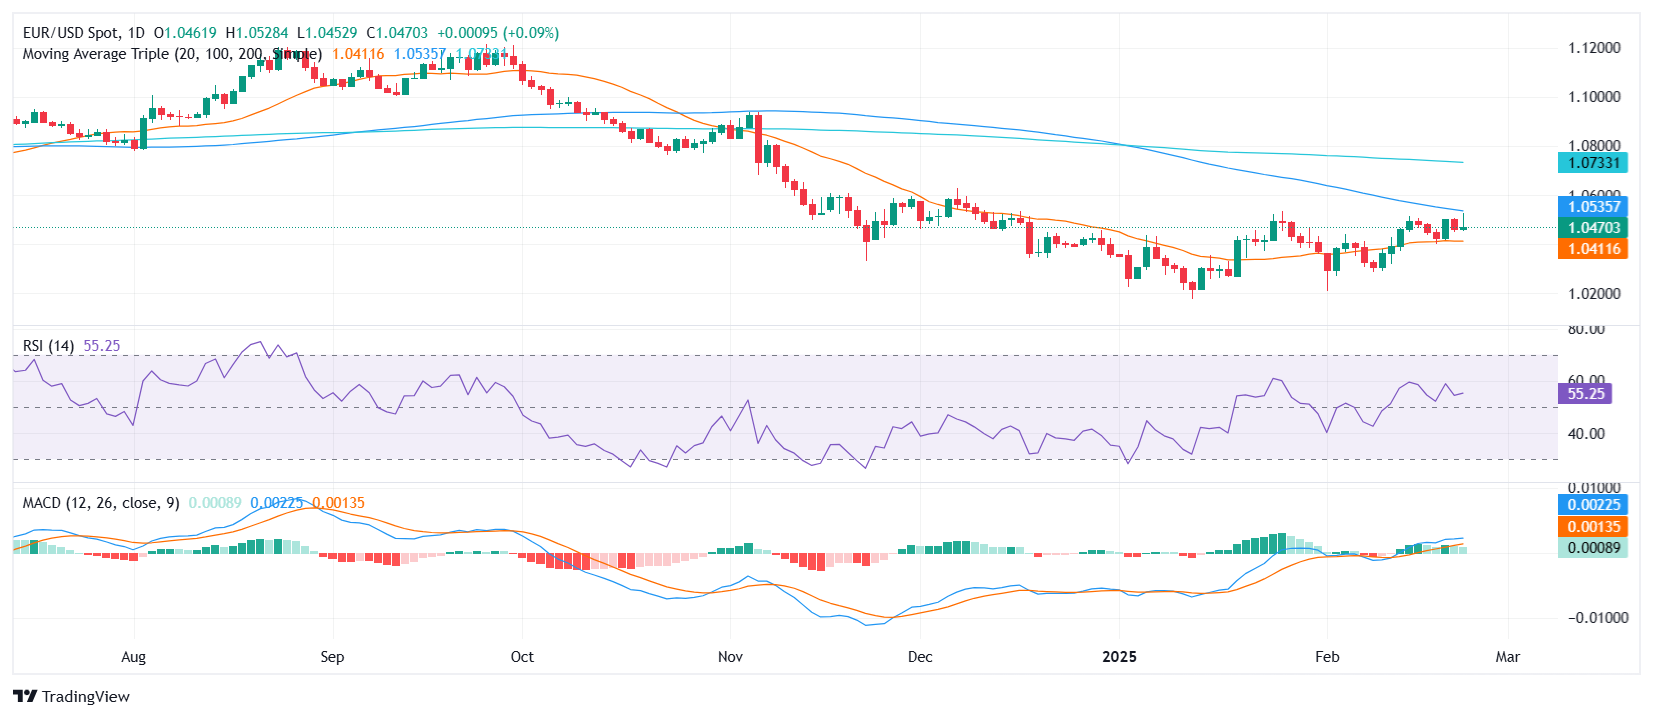
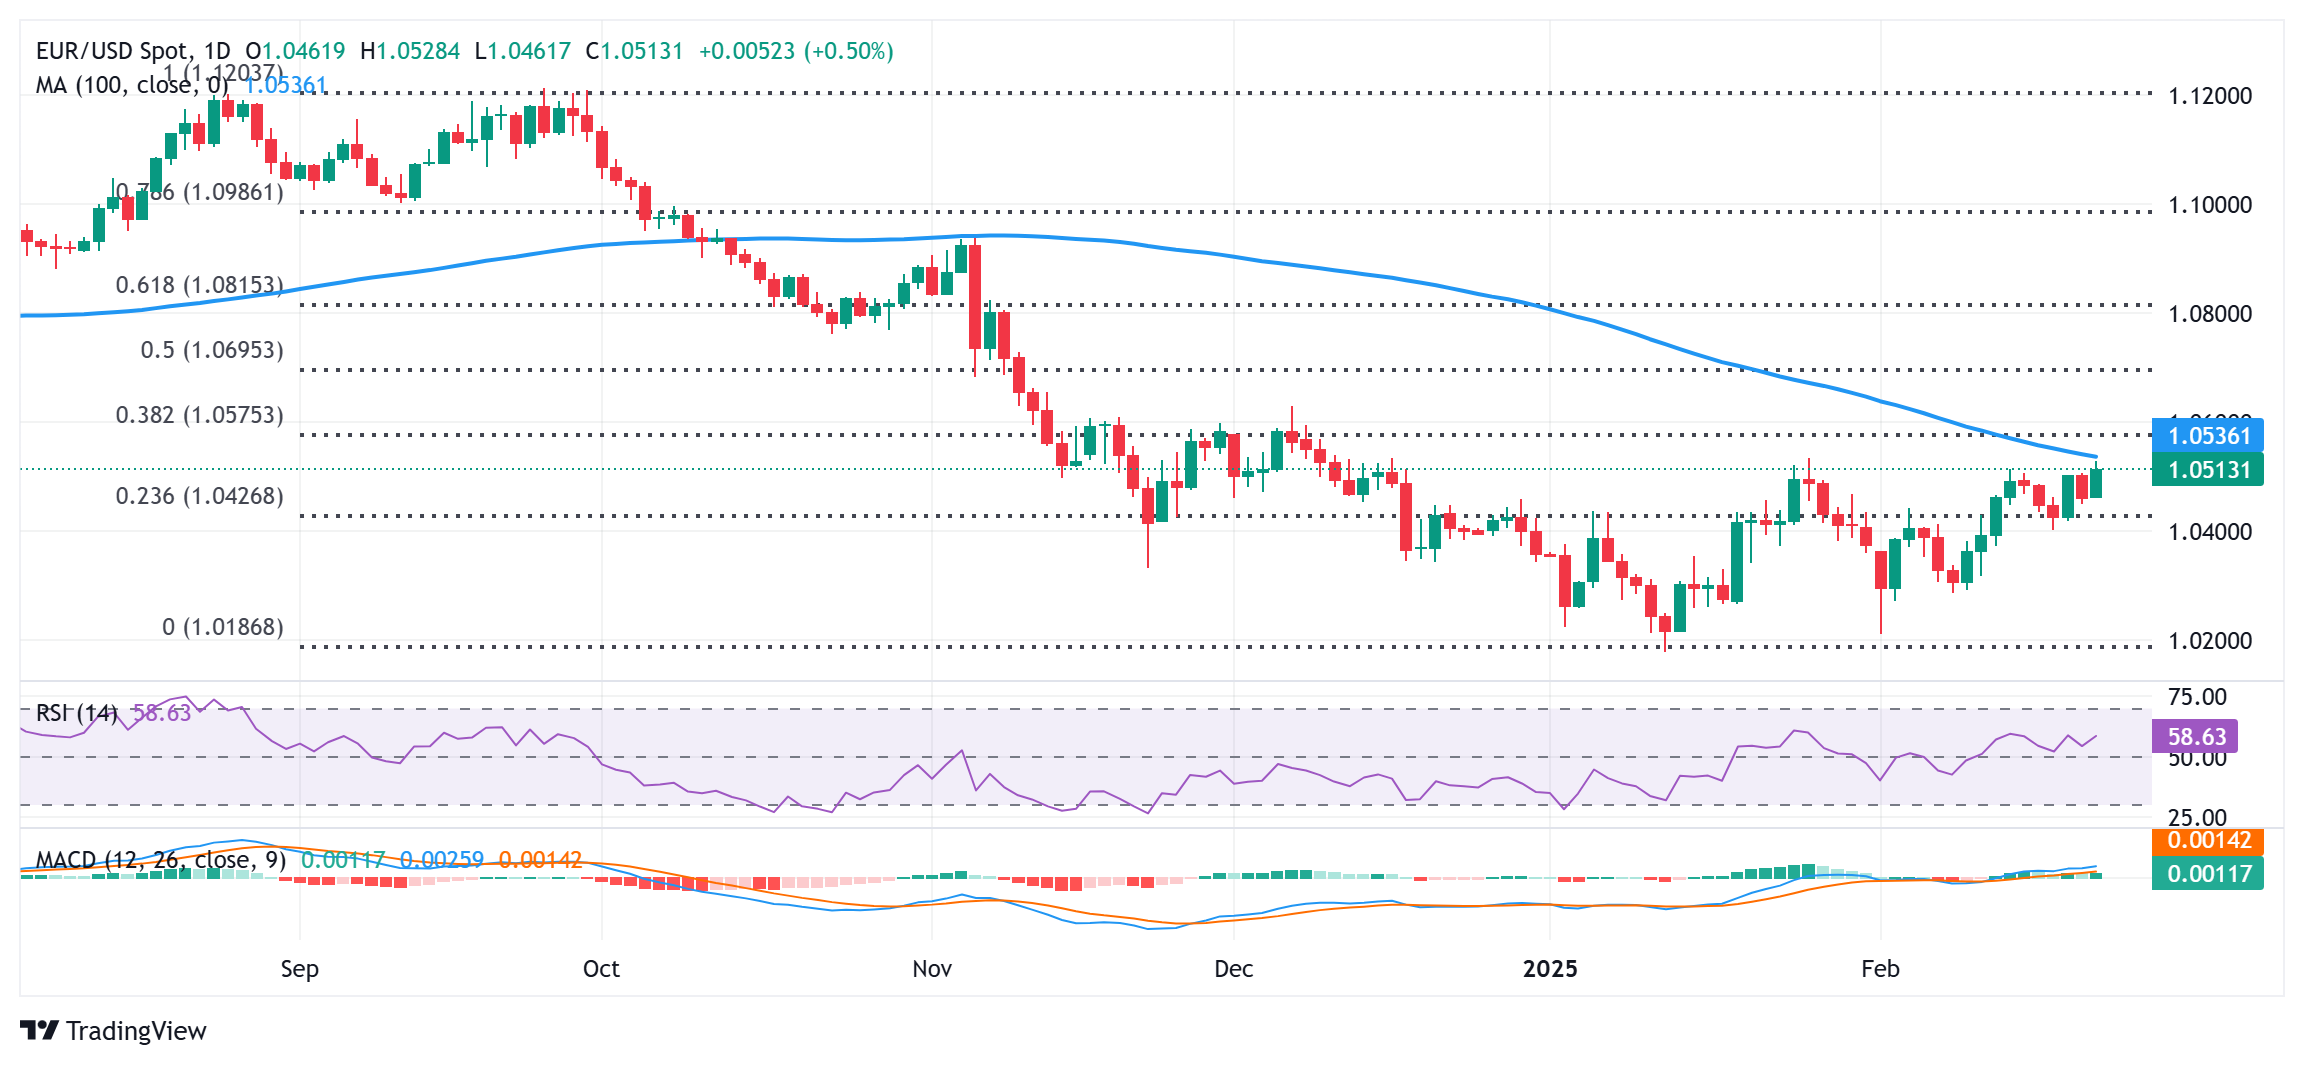
EUR/USD remains hunkered below 1.0500 as bulls run out of steam.
European data is limited for most of the week, with Fed speakers set to dominate.
German and US inflation figures will close out the week.
EUR/USD cycled familiar territory on Monday, testing the 1.0500 handle but failing to make any meaningful headway as Fiber continues to churn near the top end of recent consolidation.
Last week's rise in US inflation figures triggered a new wave of risk aversion among investors. Their attention is now squarely on the upcoming US Personal Consumption Expenditure (PCE) inflation data expected later this week. Traders are hoping that the early-year increase in headline inflation in the US will diminish swiftly and not lead to another prolonged struggle over “transitory” inflation that runs too hot for the Federal Reserve (Fed) to implement rate cuts. Market participants eager for a quicker pace of Fed rate cuts in 2025 are already feeling the pressure as US President Donald Trump attempts to ignite a global trade war. Additionally, another surge in inflation may extinguish any remaining hopes for rate reductions. On Monday, President Trump reiterated threats of high tariffs on Canada and Mexico, cautioning that tariffs are still expected to take effect “next month,” following his recent concession on tariff pressures and granting delays to nearly every country he has targeted with import taxes on his own citizens.
German Consumer Price Index (CPI) inflation is also due on Friday, as well as German Retail Sales activity figures. As a bellwether for pan-EU data, Germany’s data prints on Friday will likely draw some Fiber traders’ eyes, but the key market-moving print will still be US PCE inflation.
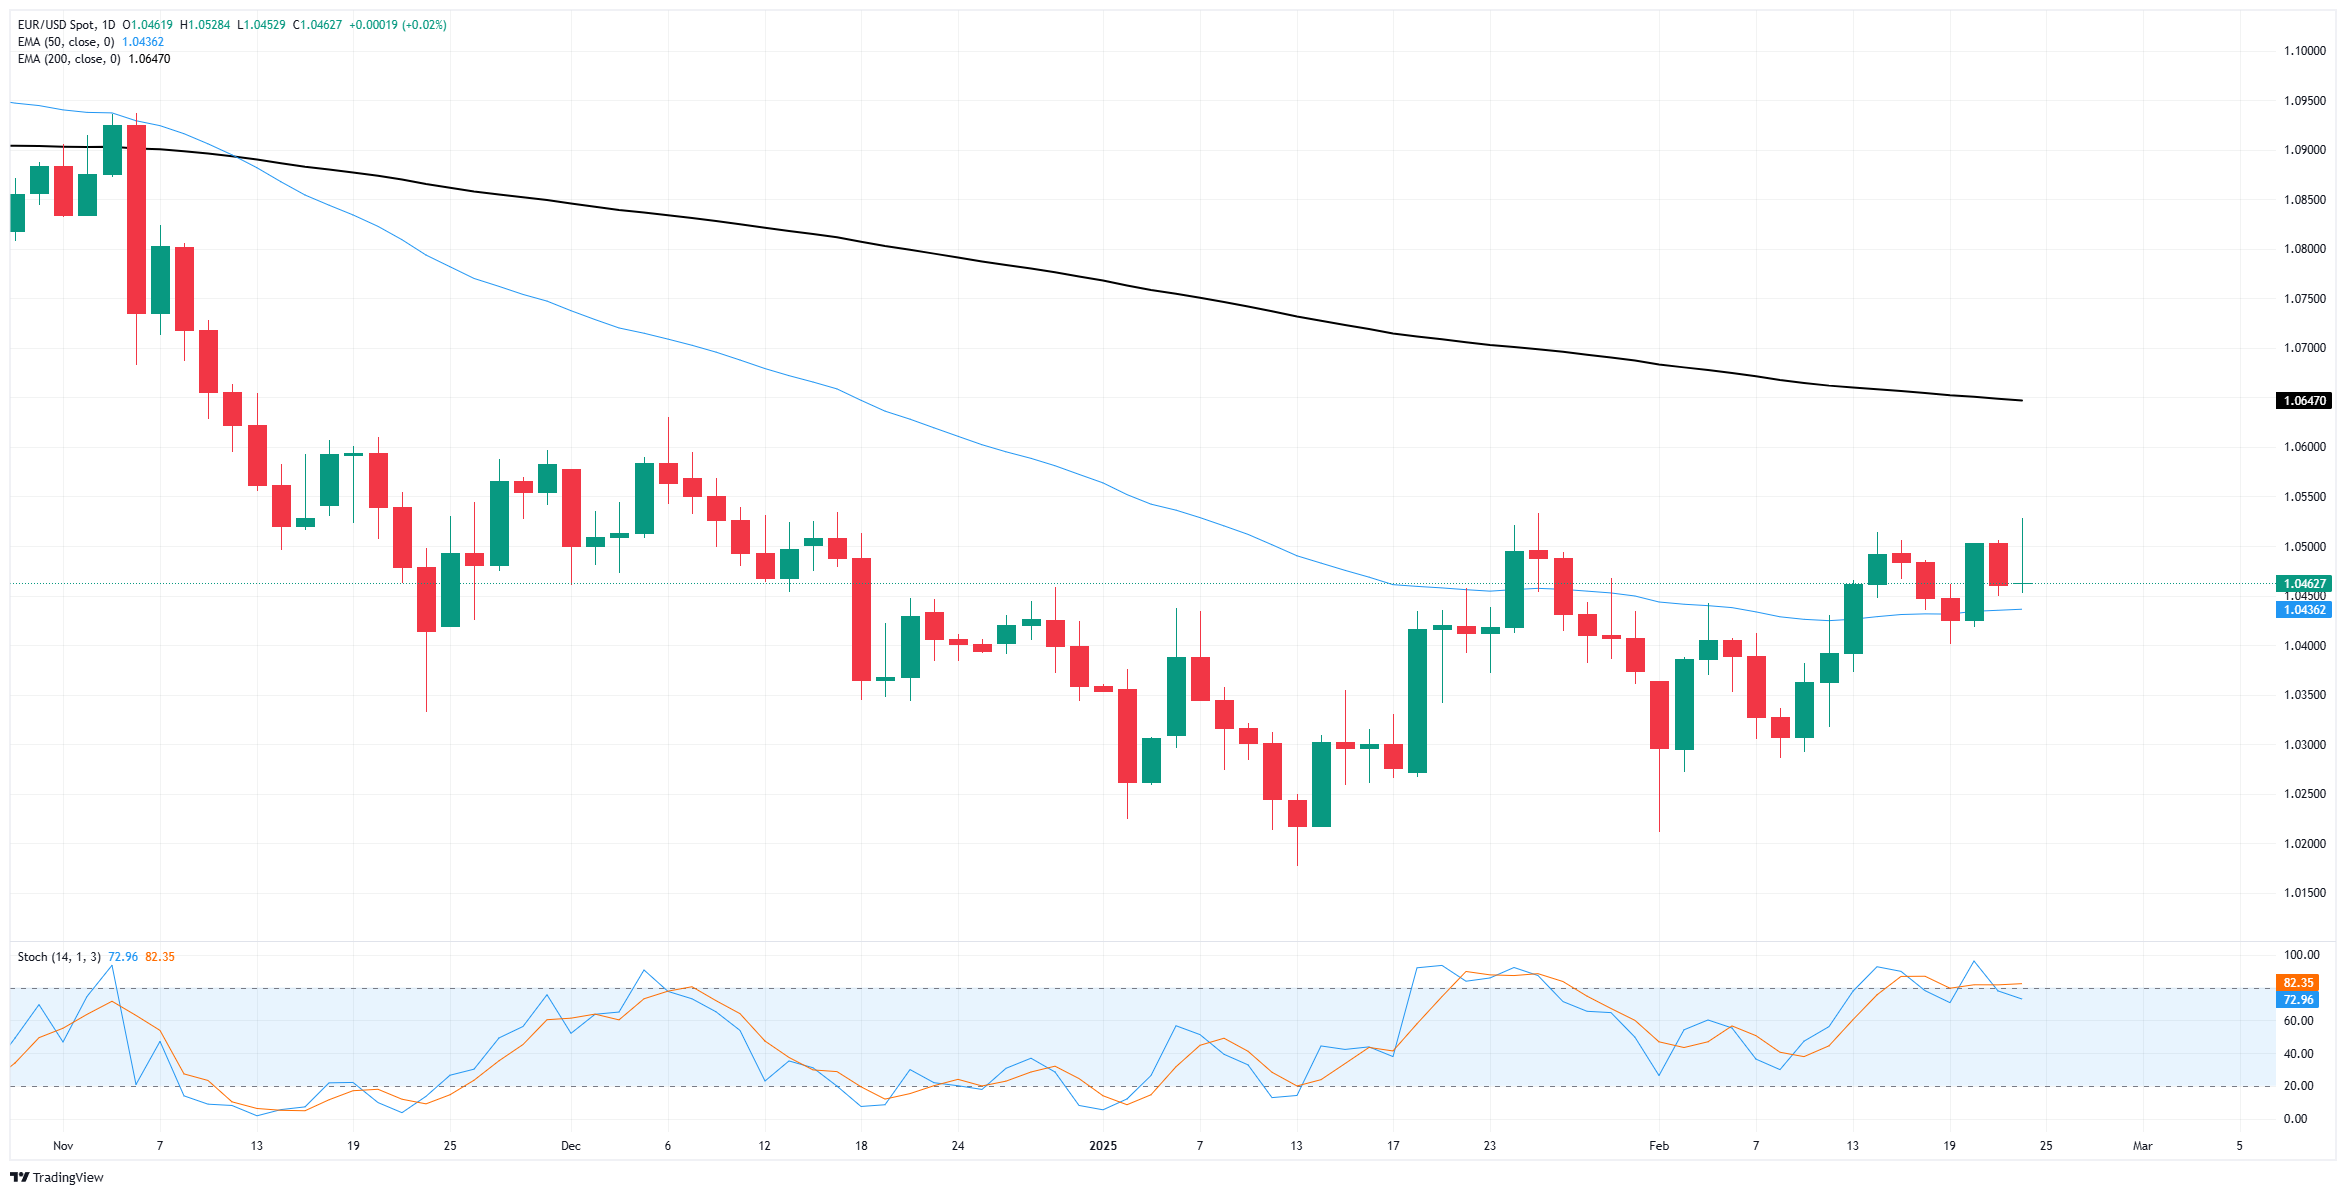
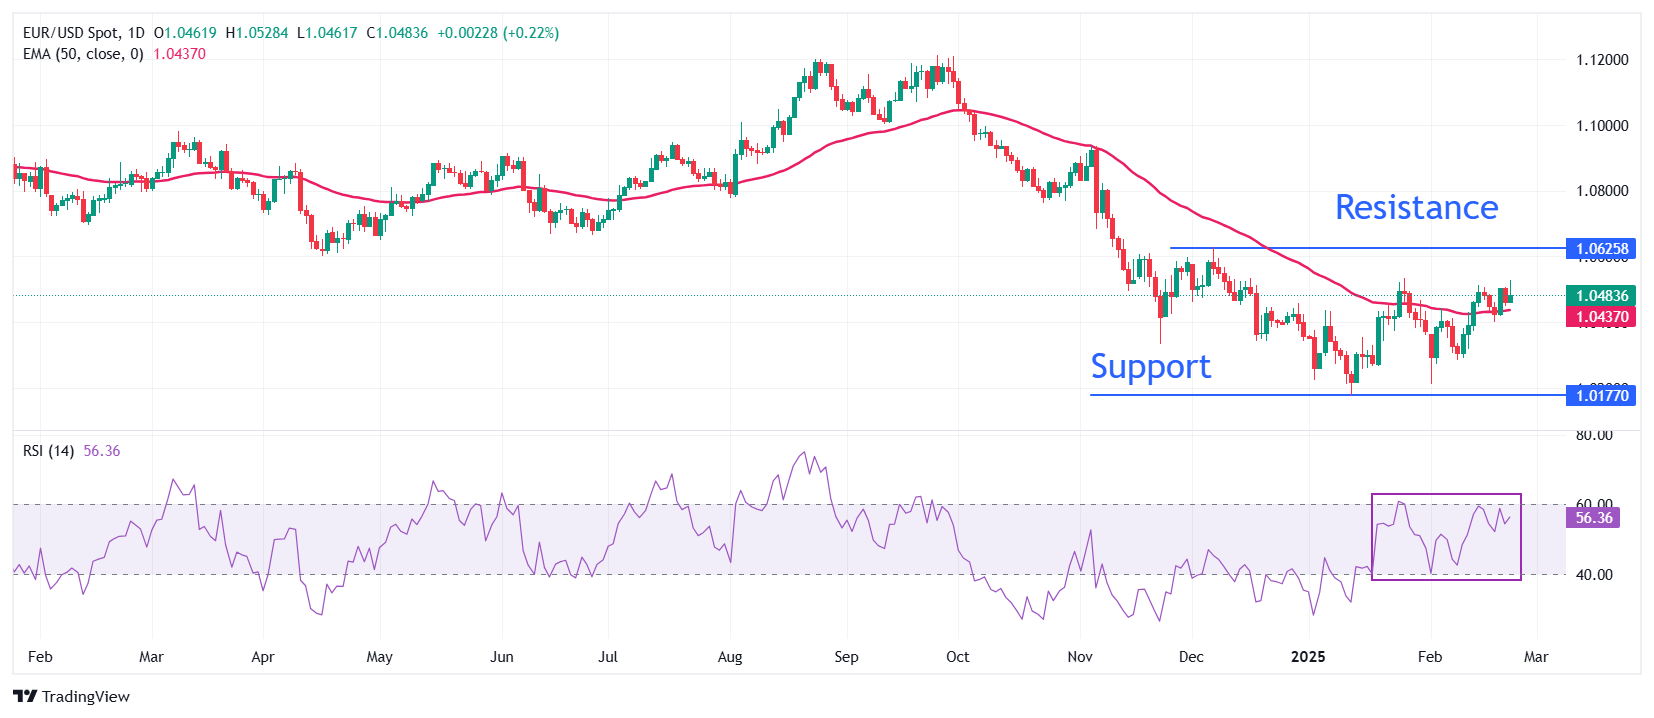
EUR/USD price forecast
EUR/USD continues to churn near the 50-day Exponential Moving Average (EMA) near 1.0435, with price action hobbled just south of 1.0500. Daily candles continue to close inside of a near-term rough wedge, albeit with some uninspired tests in either direction.
The pair’s last major swing low dipped below 1.0200 in mid-January, but bullish momentum remains limited with the pair still trading well below the 200-day EMA at 1.0650.
EUR/USD daily chart
Euro FAQs
The Euro is the currency for the 19 European Union countries that belong to the Eurozone. It is the second most heavily traded currency in the world behind the US Dollar. In 2022, it accounted for 31% of all foreign exchange transactions, with an average daily turnover of over $2.2 trillion a day. EUR/USD is the most heavily traded currency pair in the world, accounting for an estimated 30% off all transactions, followed by EUR/JPY (4%), EUR/GBP (3%) and EUR/AUD (2%).
The European Central Bank (ECB) in Frankfurt, Germany, is the reserve bank for the Eurozone. The ECB sets interest rates and manages monetary policy. The ECB’s primary mandate is to maintain price stability, which means either controlling inflation or stimulating growth. Its primary tool is the raising or lowering of interest rates. Relatively high interest rates – or the expectation of higher rates – will usually benefit the Euro and vice versa. The ECB Governing Council makes monetary policy decisions at meetings held eight times a year. Decisions are made by heads of the Eurozone national banks and six permanent members, including the President of the ECB, Christine Lagarde.
Eurozone inflation data, measured by the Harmonized Index of Consumer Prices (HICP), is an important econometric for the Euro. If inflation rises more than expected, especially if above the ECB’s 2% target, it obliges the ECB to raise interest rates to bring it back under control. Relatively high interest rates compared to its counterparts will usually benefit the Euro, as it makes the region more attractive as a place for global investors to park their money.
Data releases gauge the health of the economy and can impact on the Euro. Indicators such as GDP, Manufacturing and Services PMIs, employment, and consumer sentiment surveys can all influence the direction of the single currency. A strong economy is good for the Euro. Not only does it attract more foreign investment but it may encourage the ECB to put up interest rates, which will directly strengthen the Euro. Otherwise, if economic data is weak, the Euro is likely to fall. Economic data for the four largest economies in the euro area (Germany, France, Italy and Spain) are especially significant, as they account for 75% of the Eurozone’s economy.
Another significant data release for the Euro is the Trade Balance. This indicator measures the difference between what a country earns from its exports and what it spends on imports over a given period. If a country produces highly sought after exports then its currency will gain in value purely from the extra demand created from foreign buyers seeking to purchase these goods. Therefore, a positive net Trade Balance strengthens a currency and vice versa for a negative balance.
US President Donald Trump said Monday that sweeping US tariffs on imports from Canada and Mexico “will go forward” when a month-long delay on their implementation expires next week.
“The tariffs are going forward on time, on schedule,” Trump said Monday from the White House during a joint press conference with French President Emmanuel Macron.
Market reaction
At the time of writing, the USD/CAD is trading 0.01% lower on the day to trade at 1.4270.
Tariffs FAQs
Tariffs are customs duties levied on certain merchandise imports or a category of products. Tariffs are designed to help local producers and manufacturers be more competitive in the market by providing a price advantage over similar goods that can be imported. Tariffs are widely used as tools of protectionism, along with trade barriers and import quotas.
Although tariffs and taxes both generate government revenue to fund public goods and services, they have several distinctions. Tariffs are prepaid at the port of entry, while taxes are paid at the time of purchase. Taxes are imposed on individual taxpayers and businesses, while tariffs are paid by importers.
There are two schools of thought among economists regarding the usage of tariffs. While some argue that tariffs are necessary to protect domestic industries and address trade imbalances, others see them as a harmful tool that could potentially drive prices higher over the long term and lead to a damaging trade war by encouraging tit-for-tat tariffs.
During the run-up to the presidential election in November 2024, Donald Trump made it clear that he intends to use tariffs to support the US economy and American producers. In 2024, Mexico, China and Canada accounted for 42% of total US imports. In this period, Mexico stood out as the top exporter with $466.6 billion, according to the US Census Bureau. Hence, Trump wants to focus on these three nations when imposing tariffs. He also plans to use the revenue generated through tariffs to lower personal income taxes.
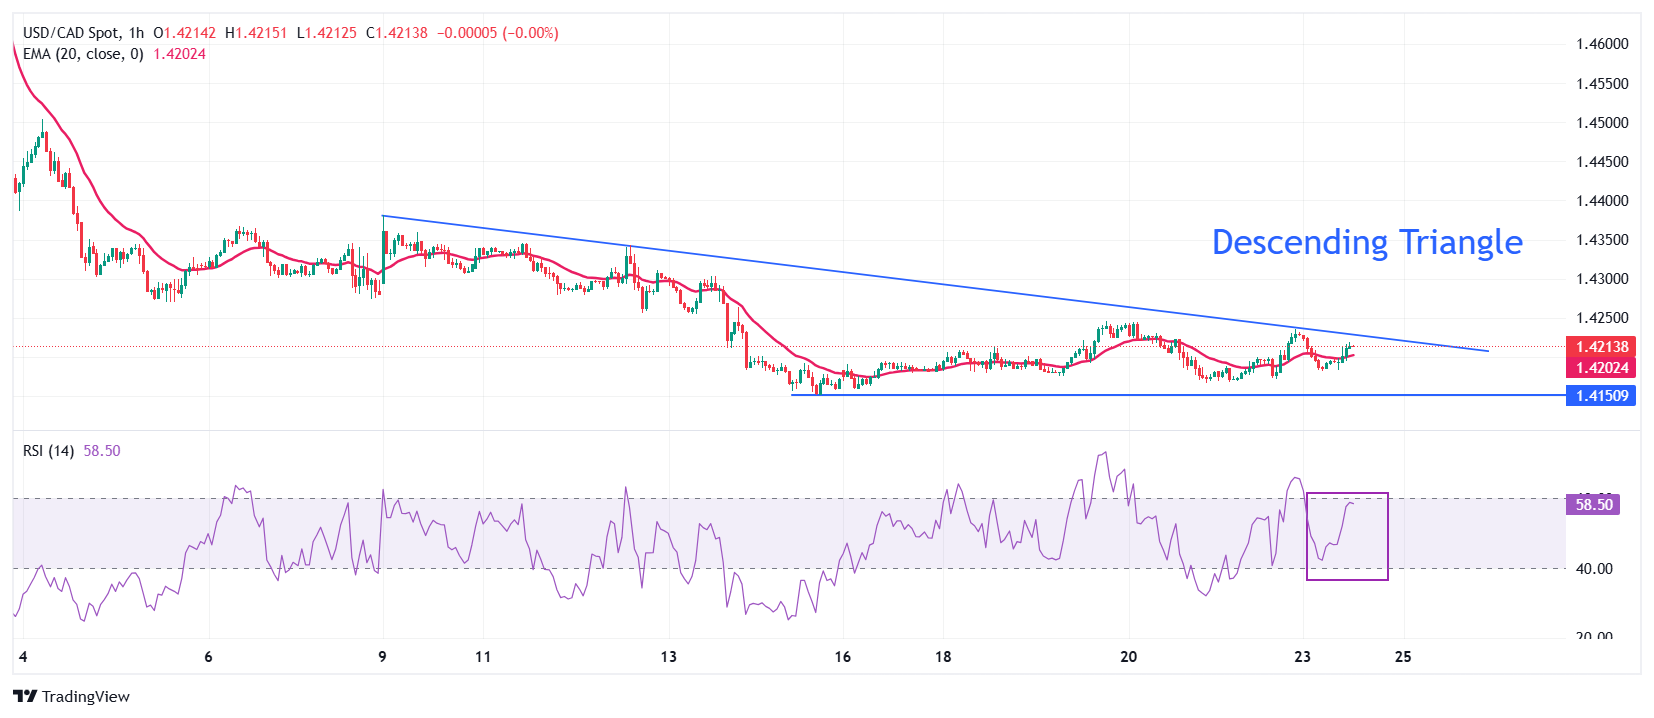
USD/CAD gains ground to around 1.4260 in Monday’s late American session.
The downbeat US PMI weighs on the US Dollar, but escalating trade tension might cap its downside.
Trump said tariffs on Canada and Mexico ‘will go forward’.
The USD/CAD pair trades with mild gains near 1.4265 during the late American session on Monday. The Consumer Confidence gauged by the Conference Board will take center stage on Tuesday. Also, the Federal Reserve (Fed) Michael Barr, Thomas Barkin and Lorie Logan are set to speak on the same day.
US President Donald Trump said late Monday that sweeping US tariffs on imports from Canada and Mexico “will go forward” when a month-long delay on their implementation expires next week. Trump claimed that the US has “been taken advantage of” by foreign nations and reiterated his plan to impose so-called reciprocal tariffs. His policy pronouncements could weigh on riskier assets like the CAD and create a tailwind for USD/CAD.
The disappointing US economic data, including S&P Global Purchasing Managers' Index (PMI) released last week, kept the prospect of interest rate cuts by the Fed intact this year, even though the US central bank will remain on hold for the next several months. This, in turn, could weigh on the Greenback.
Investors will take more cues from Friday's US Personal Consumption Expenditures (PCE) report. At least speeches from at least nine Fed officials this week will be in the spotlight. The hawkish comment from policymakers could lift the USD against the Canadian Dollar (CAD) in the near term.
Canadian Dollar FAQs
The key factors driving the Canadian Dollar (CAD) are the level of interest rates set by the Bank of Canada (BoC), the price of Oil, Canada’s largest export, the health of its economy, inflation and the Trade Balance, which is the difference between the value of Canada’s exports versus its imports. Other factors include market sentiment – whether investors are taking on more risky assets (risk-on) or seeking safe-havens (risk-off) – with risk-on being CAD-positive. As its largest trading partner, the health of the US economy is also a key factor influencing the Canadian Dollar.
The Bank of Canada (BoC) has a significant influence on the Canadian Dollar by setting the level of interest rates that banks can lend to one another. This influences the level of interest rates for everyone. The main goal of the BoC is to maintain inflation at 1-3% by adjusting interest rates up or down. Relatively higher interest rates tend to be positive for the CAD. The Bank of Canada can also use quantitative easing and tightening to influence credit conditions, with the former CAD-negative and the latter CAD-positive.
The price of Oil is a key factor impacting the value of the Canadian Dollar. Petroleum is Canada’s biggest export, so Oil price tends to have an immediate impact on the CAD value. Generally, if Oil price rises CAD also goes up, as aggregate demand for the currency increases. The opposite is the case if the price of Oil falls. Higher Oil prices also tend to result in a greater likelihood of a positive Trade Balance, which is also supportive of the CAD.
While inflation had always traditionally been thought of as a negative factor for a currency since it lowers the value of money, the opposite has actually been the case in modern times with the relaxation of cross-border capital controls. Higher inflation tends to lead central banks to put up interest rates which attracts more capital inflows from global investors seeking a lucrative place to keep their money. This increases demand for the local currency, which in Canada’s case is the Canadian Dollar.
Macroeconomic data releases gauge the health of the economy and can have an impact on the Canadian Dollar. Indicators such as GDP, Manufacturing and Services PMIs, employment, and consumer sentiment surveys can all influence the direction of the CAD. A strong economy is good for the Canadian Dollar. Not only does it attract more foreign investment but it may encourage the Bank of Canada to put up interest rates, leading to a stronger currency. If economic data is weak, however, the CAD is likely to fall.
GBP/USD rose early on Monday, but failed to capture 1.2700 and fell back.
A raft of speeches are due from both BoE and Fed speakers this week.
Key US growth and inflation figures are due this week as inflation fears return.
GBP/USD churned on Monday, jumping to a fresh 10-week high before slumping back to the day’s opening bids near 1.2630. Cable failed to recapture the 1.270 handle, and price action has fallen back beneath the 200-day Exponential Moving Average (EMA) near 1.2660.
A resurgence in US inflation figures late last week kicked off a fresh round of risk aversion. Investors will be focused squarely on upcoming US Personal Consumption Expenditure (PCE) inflation data due later this week. Traders hope that an early-year uptick in headline inflation data from the US will recede quickly and not solidify into another drawn-out battle with “transitory” inflation that runs too hot for the Federal Reserve (Fed) to deliver rate cuts.
Market participants hoping for an upswing in the pace of Fed rate cuts in 2025 have already been pushed to the ropes as US President Donald Trump tries to spark a global trade war, and a new surge in inflation will be the final nail in the coffin for rate cut hopes. President Trump reiterated his own threats of high tariffs on Canada and Mexico on Monday, warning that tariffs are still due to be enacted “next month” after caving on his own tariff pressures in recent weeks and granting a delay to nearly every country he’s taunted with import taxes on his own citizens.
Not to be left in the dust, the Bank of England (BoE) has its own policymakers slated to make regular appearances this week, though their impact on global markets is likely to remain muted. The BoE has, thus far, largely matched market expectations on the rate cut front. The BoE’s Huw Pill makes an appearance on Tuesday, followed by Swati Dinghra on Wednesday and Dave Ramsden on Friday.
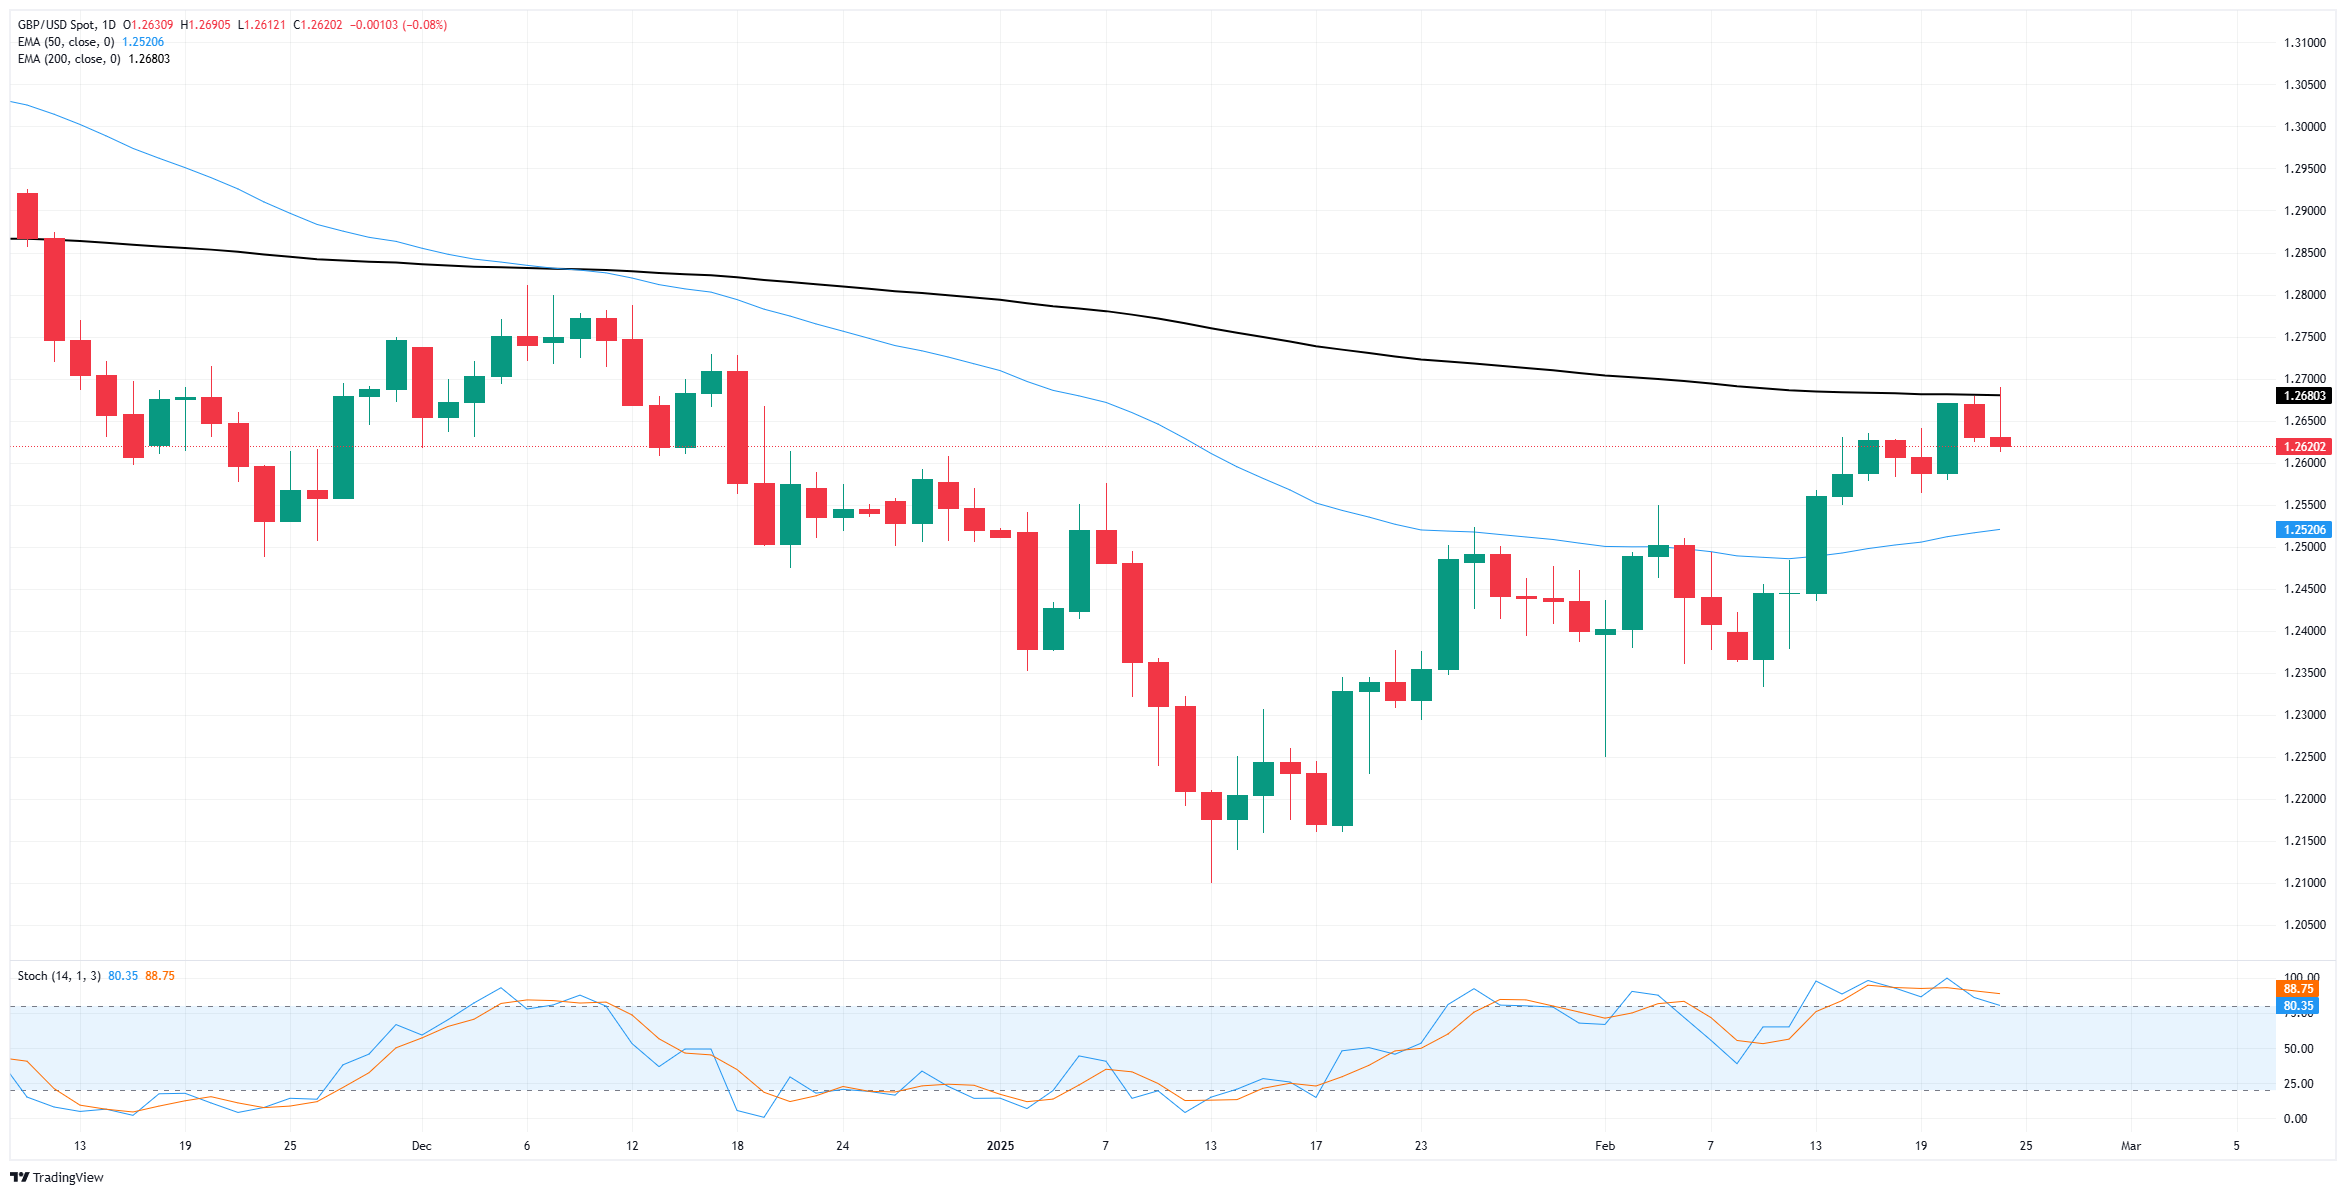
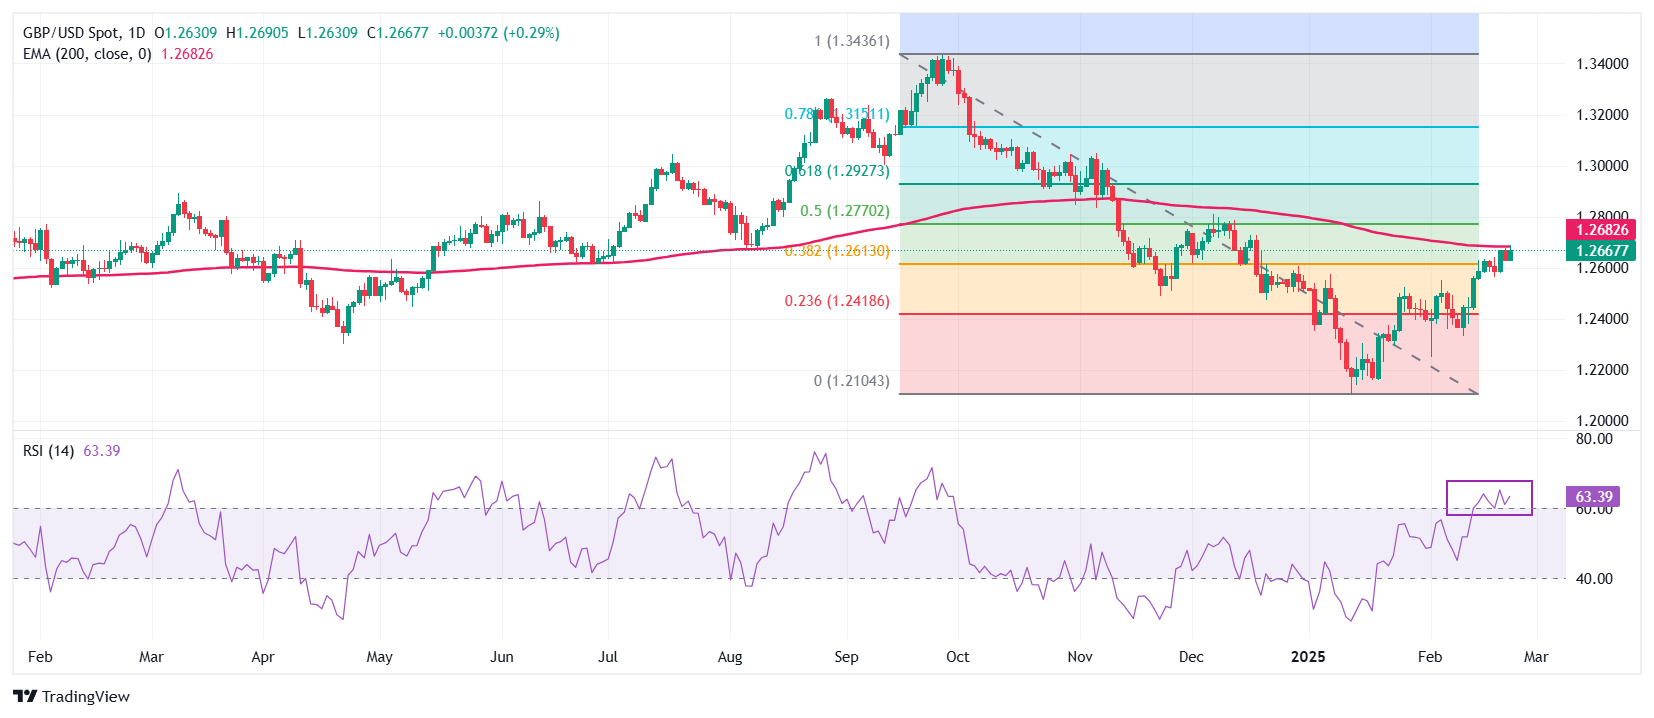
GBP/USD price forecast
With price action backing into the 200-day EMA at 1.2660, middling performance poses a significant risk to any technical trend. GBP/USD has risen around 4.4% from its last major swing low to 1.2100 in mid-January, but bidding appears to have run out of gas.
The next immediate barrier to a fresh leg down will be the 50-day EMA at 1.2520, but bidders will no doubt be waiting in the wings to kick off a new push into the high side from the 1.2500 handle.
GBP/USD daily chart
Pound Sterling FAQs
The Pound Sterling (GBP) is the oldest currency in the world (886 AD) and the official currency of the United Kingdom. It is the fourth most traded unit for foreign exchange (FX) in the world, accounting for 12% of all transactions, averaging $630 billion a day, according to 2022 data. Its key trading pairs are GBP/USD, also known as ‘Cable’, which accounts for 11% of FX, GBP/JPY, or the ‘Dragon’ as it is known by traders (3%), and EUR/GBP (2%). The Pound Sterling is issued by the Bank of England (BoE).
The single most important factor influencing the value of the Pound Sterling is monetary policy decided by the Bank of England. The BoE bases its decisions on whether it has achieved its primary goal of “price stability” – a steady inflation rate of around 2%. Its primary tool for achieving this is the adjustment of interest rates. When inflation is too high, the BoE will try to rein it in by raising interest rates, making it more expensive for people and businesses to access credit. This is generally positive for GBP, as higher interest rates make the UK a more attractive place for global investors to park their money. When inflation falls too low it is a sign economic growth is slowing. In this scenario, the BoE will consider lowering interest rates to cheapen credit so businesses will borrow more to invest in growth-generating projects.
Data releases gauge the health of the economy and can impact the value of the Pound Sterling. Indicators such as GDP, Manufacturing and Services PMIs, and employment can all influence the direction of the GBP. A strong economy is good for Sterling. Not only does it attract more foreign investment but it may encourage the BoE to put up interest rates, which will directly strengthen GBP. Otherwise, if economic data is weak, the Pound Sterling is likely to fall.
Another significant data release for the Pound Sterling is the Trade Balance. This indicator measures the difference between what a country earns from its exports and what it spends on imports over a given period. If a country produces highly sought-after exports, its currency will benefit purely from the extra demand created from foreign buyers seeking to purchase these goods. Therefore, a positive net Trade Balance strengthens a currency and vice versa for a negative balance.
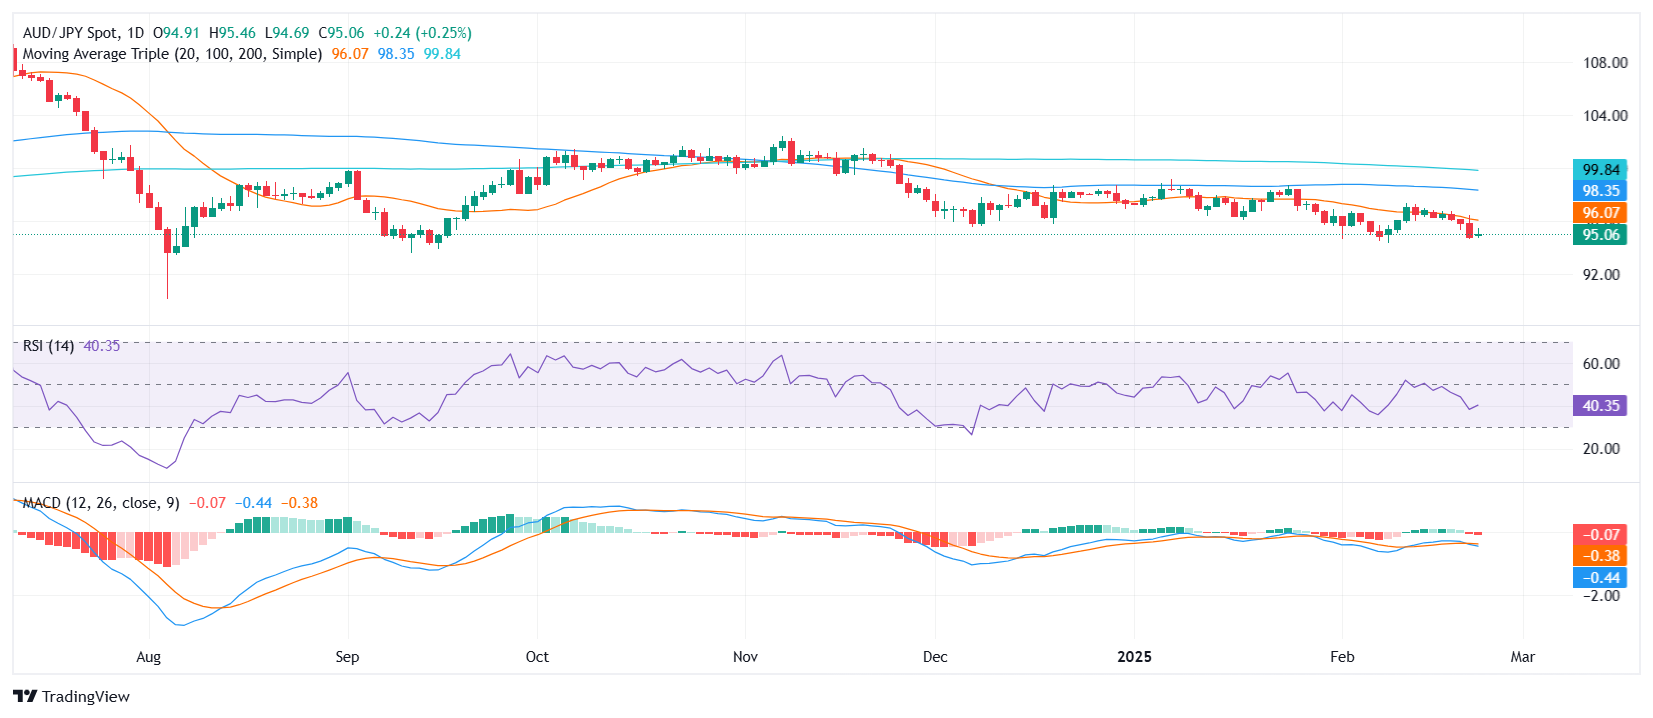
AUD/JPY posts a modest recovery after last week’s sharp losses.
RSI remains stuck in negative territory, signaling limited bullish momentum.
The trading below the 20-day SMA confirms a bearish dominance.
The AUD/JPY cross saw a mild recovery at the start of the week, managing to halt last Friday’s steep losses. Despite this small bounce, the pair remains well below its 20-day Simple Moving Average (SMA), keeping the broader outlook tilted toward the downside. This slight uptick seems more like a technical pause rather than the start of a meaningful reversal.
Technical indicators reflect a cautious market tone. The Relative Strength Index (RSI) hovers in negative territory, indicating that sellers still hold the upper hand despite the recent stabilization. Meanwhile, the Moving Average Convergence Divergence (MACD) histogram continues to display flat red bars, highlighting a lack of clear momentum for a sustained bullish push.
For now, the outlook remains bearish unless the cross manages to break decisively back above the 20-day SMA. If sellers regain control, the pair could revisit recent lows near the 94.50 zone. On the other hand, a rebound above key resistance around 96.00 could signal a shift in sentiment. Until then, the bearish bias appears firmly in place, with buyers struggling to establish traction.
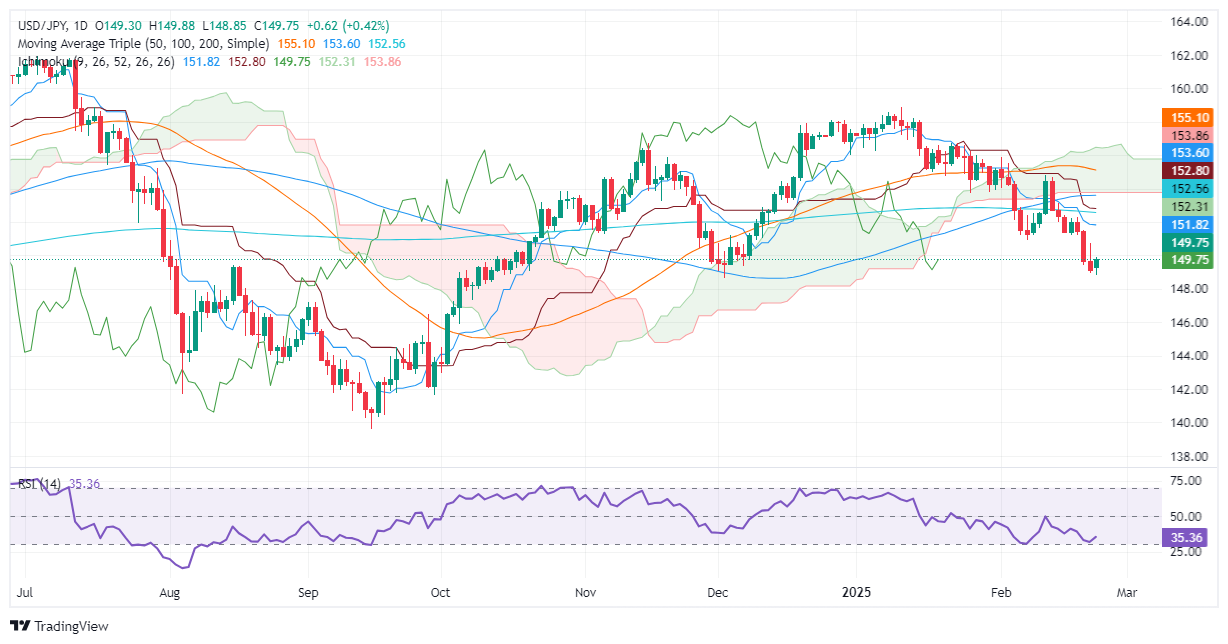
USD/JPY bounces off 148.85, approaching resistance at 150.73.
Bullish harami pattern signals potential upside if momentum holds.
Key resistance at 151.82 and 152.31; downside risk below 148.64.
The USD/JPY rebounds off yearly lows of 148.85 and climbs past the 149.50 mark late during the North American session on Monday, despite overall US Dollar weakness across the board. At the time of writing, the pair trades at 149.72, up 0.30%.
USD/JPY Price Forecast: Technical outlook
The daily chart depicts the pair as downward biased, with the USD/JPY exchange rate below the 200-day Simple Moving Average (SMA) of 152.57 and beneath the Ichimoku Cloud (Kumo).
Short-term, the USD/JPY could aim upward as it is forming the ‘bullish harami’ candle chart pattern. If it clears the February 21 peak of 150.73, the next resistance would be the Tenkan-sen at 151.82, followed by the Senkou Span A at 152.31. A breach of the latter will expose the 200-day SMA.
On the other hand, if USD/JPY surpassed the December 3 swing low of 148.64, the next support would be the September 27 swing high turned support at 146.49.
USD/JPY Price Chart – Daily
Japanese Yen PRICE Today
The table below shows the percentage change of Japanese Yen (JPY) against listed major currencies today. Japanese Yen was the strongest against the Swiss Franc.
USD
EUR
GBP
JPY
CAD
AUD
NZD
CHF
USD
-0.01%
-0.01%
0.03%
-0.01%
-0.03%
0.00%
0.02%
EUR
0.00%
-0.01%
0.05%
-0.01%
-0.02%
0.00%
0.03%
GBP
0.01%
0.01%
0.04%
0.02%
-0.01%
0.02%
0.04%
JPY
-0.03%
-0.05%
-0.04%
-0.03%
-0.04%
-0.01%
0.00%
CAD
0.00%
0.00%
-0.02%
0.03%
-0.01%
0.02%
0.03%
AUD
0.03%
0.02%
0.00%
0.04%
0.00%
0.03%
0.05%
NZD
-0.00%
-0.01%
-0.02%
0.01%
-0.02%
-0.03%
0.02%
CHF
-0.02%
-0.03%
-0.04%
-0.00%
-0.03%
-0.05%
-0.02%
The heat map shows percentage changes of major currencies against each other. The base currency is picked from the left column, while the quote currency is picked from the top row. For example, if you pick the Japanese Yen from the left column and move along the horizontal line to the US Dollar, the percentage change displayed in the box will represent JPY (base)/USD (quote).
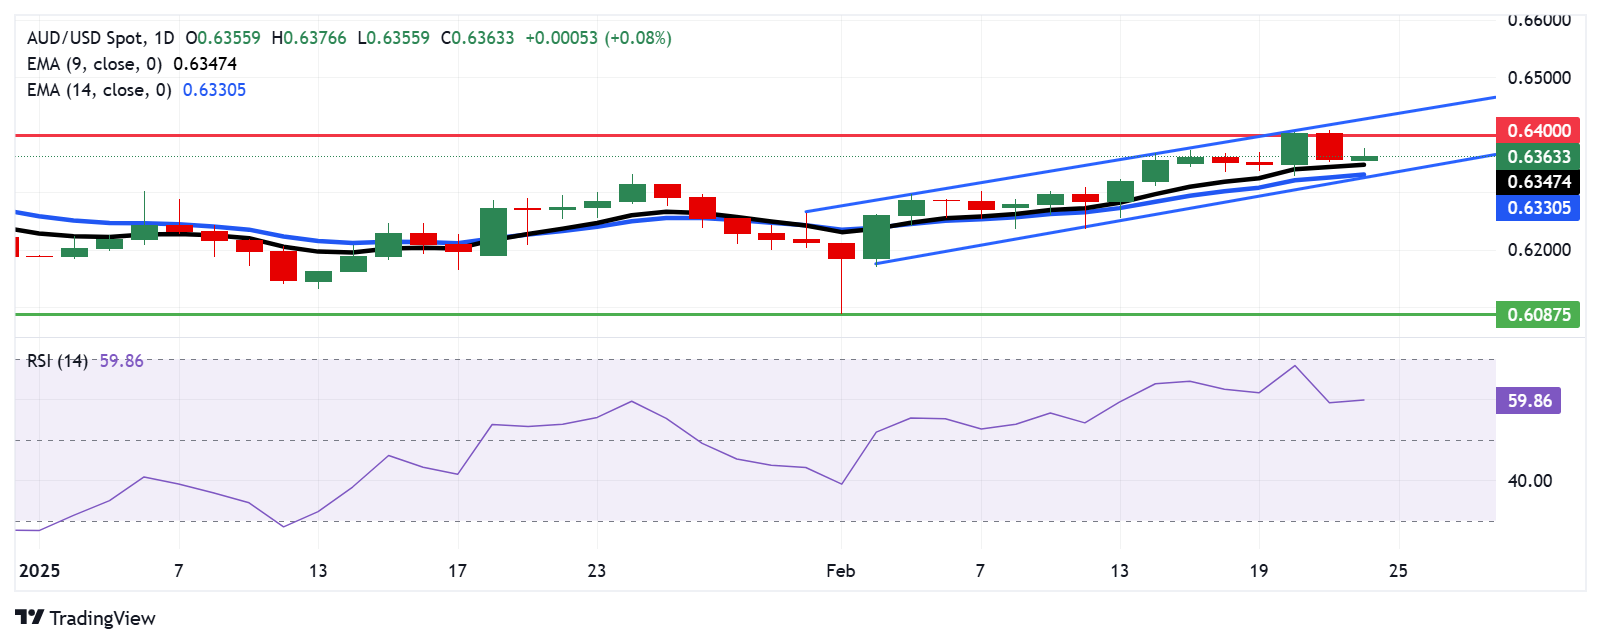
Aussie recovers from Friday’s strong decline as US Dollar slips.
Trump’s next tariff moves keep the global trade outlook on edge.
RBA’s cautious stance on further easing resonates with markets.
Investors watch upcoming Australian inflation data for policy cues.
AUD/USD managed to regain some upside traction and reverse Friday’s strong decline, revisiting the vicinity of the 0.6400 mark but then buyers quickly rejected it. During the American session, United States (US) President Donald Trump confirmed tariffs against Mexico and Canada’s goods but didn’t offer further details on its policy plans on China.
Daily digest market movers: Aussie eyes RBA CPI outlook as trade tensions linger
US President Donald Trump indicated possible 25% tariffs on cars, pharmaceuticals, semiconductors, and lumber, potentially starting in the coming weeks, which could reignite global trade worries.
The Australian Dollar (AUD) trades in a cautious stance as market participants anticipate monthly Consumer Price Index (CPI) data for January, projected to accelerate by 2.6% from December’s 2.5%.
Last week, the Reserve Bank of Australia (RBA) trimmed its Official Cash Rate (OCR) for the first time since November 2020 but reiterated that its fight against inflation is not complete, offering cautious guidance on further easing.
In a quieter start to the trading week, the US Dollar (USD) alternated between minor gains and losses.
AUD/USD technical outlook: Momentum stalls at 100-day SMA as indicators show signs of fatigue
The AUD/USD pair mildly rose to a higher zone on Monday, but it encountered robust resistance at the 100-day Simple Moving Average, leading to a partial retracement. The Relative Strength Index (RSI) sits in the upper positive territory yet is declining, suggesting that the bulls might be losing momentum. Meanwhile, the Moving Average Convergence Divergence (MACD) histogram prints flat green bars, reinforcing the idea of a waning uptrend.
While the pair remains above its 20-day Simple Moving Average, any move failing to maintain traction above the 100-day SMA does not necessarily indicate a structural shift. The pair could either slip lower or oscillate between the referenced resistance and the 20-day SMA, depending on fresh data and evolving trade narratives.
Australian Dollar FAQs
One of the most significant factors for the Australian Dollar (AUD) is the level of interest rates set by the Reserve Bank of Australia (RBA). Because Australia is a resource-rich country another key driver is the price of its biggest export, Iron Ore. The health of the Chinese economy, its largest trading partner, is a factor, as well as inflation in Australia, its growth rate and Trade Balance. Market sentiment – whether investors are taking on more risky assets (risk-on) or seeking safe-havens (risk-off) – is also a factor, with risk-on positive for AUD.
The Reserve Bank of Australia (RBA) influences the Australian Dollar (AUD) by setting the level of interest rates that Australian banks can lend to each other. This influences the level of interest rates in the economy as a whole. The main goal of the RBA is to maintain a stable inflation rate of 2-3% by adjusting interest rates up or down. Relatively high interest rates compared to other major central banks support the AUD, and the opposite for relatively low. The RBA can also use quantitative easing and tightening to influence credit conditions, with the former AUD-negative and the latter AUD-positive.
China is Australia’s largest trading partner so the health of the Chinese economy is a major influence on the value of the Australian Dollar (AUD). When the Chinese economy is doing well it purchases more raw materials, goods and services from Australia, lifting demand for the AUD, and pushing up its value. The opposite is the case when the Chinese economy is not growing as fast as expected. Positive or negative surprises in Chinese growth data, therefore, often have a direct impact on the Australian Dollar and its pairs.
Iron Ore is Australia’s largest export, accounting for $118 billion a year according to data from 2021, with China as its primary destination. The price of Iron Ore, therefore, can be a driver of the Australian Dollar. Generally, if the price of Iron Ore rises, AUD also goes up, as aggregate demand for the currency increases. The opposite is the case if the price of Iron Ore falls. Higher Iron Ore prices also tend to result in a greater likelihood of a positive Trade Balance for Australia, which is also positive of the AUD.
The Trade Balance, which is the difference between what a country earns from its exports versus what it pays for its imports, is another factor that can influence the value of the Australian Dollar. If Australia produces highly sought after exports, then its currency will gain in value purely from the surplus demand created from foreign buyers seeking to purchase its exports versus what it spends to purchase imports. Therefore, a positive net Trade Balance strengthens the AUD, with the opposite effect if the Trade Balance is negative.
Gold-backed ETFs see biggest net inflows since 2022, supporting prices.
Traders eye US economic data, including Core PCE inflation gauge this week.
Signs of buyer exhaustion emerge as Gold hovers near all-time highs.
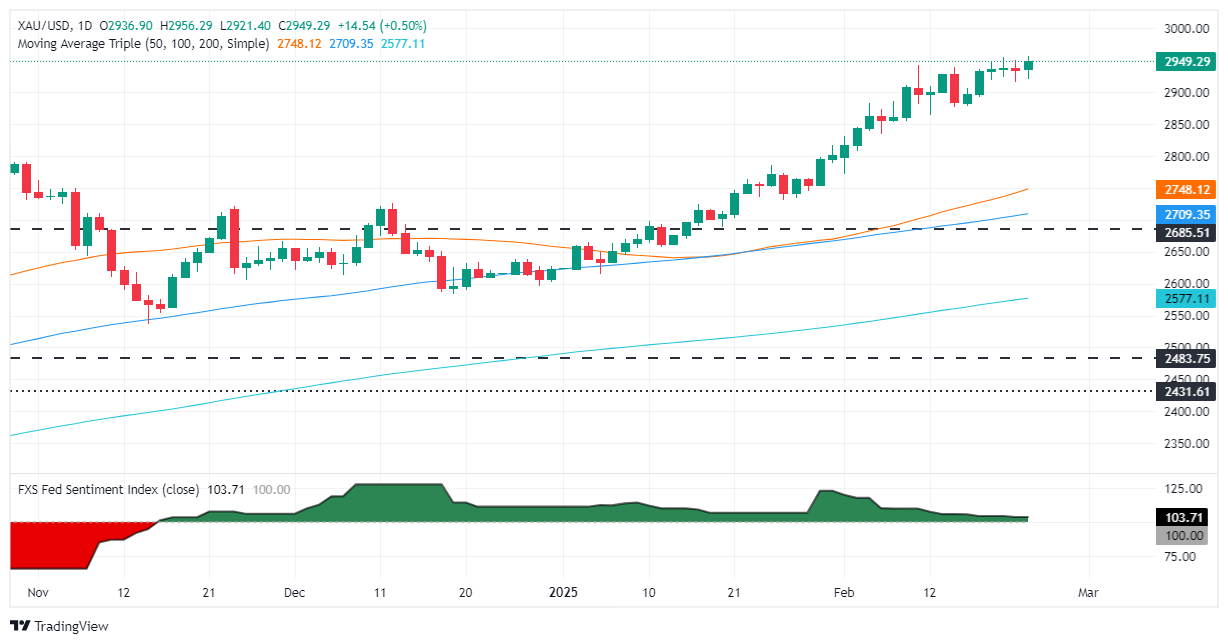
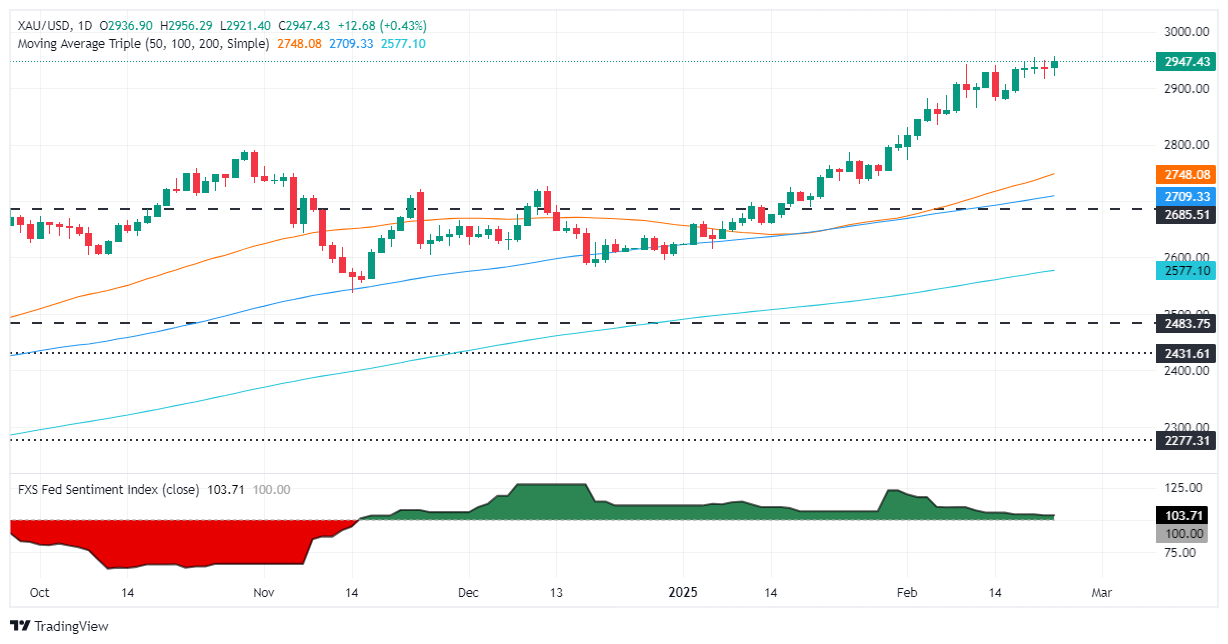
Gold prices surged during the North American session after hitting a record high of $2,956 as the Greenback weakened and US Treasury bond yields fell. At the time of writing, XAU/USD trades at $2,949, up 0.49%.
Uncertainty keeps Bullion prices underpinned as investors consider trade policies US President Donald Trump proposed. Geopolitics continued to be in the second stage as the Ukraine-Russia conflict seems closer to being resolved, while increasing tensions in the Middle East fueled demand for Gold.
Gold prices have risen for the past eight weeks, spurred by the most significant net inflows into Gold-backed ETFs since 2022, revealed Bloomberg.
Even though XAU/USD could be poised to remain near all-time highs, it seems that buyers have lost a step as price action shows signs of exhaustion.
This week, the US economic docket will feature Federal Reserve (Fed) speakers, the Conference Board Consumer Confidence, housing data, Durable Goods Orders, the second reading of Q4 GDP, and the release of the Fed’s preferred inflation gauge—the Core Personal Consumption Expenditures (PCE) Price Index.
Daily digest market movers: Gold price capitalizes on US yields drop
The US 10-year Treasury note yield has tumbled one basis point to 4.443%, a tailwind for the precious metal. US real yields, as measured by the yield in the US 10-year Treasury Inflation-Protected Securities (TIPS), stay firm near 2.017%.
The Conference Board Consumer Confidence is expected to drop from 104.1 to 103 in February.
US business activity data in the United States (US) revealed last Friday was mixed with the S&P Global Manufacturing PMI expanding while the Services PMI shrank. Also, inflation expectations rose, and consumer sentiment deteriorated, revealed the University of Michigan (UoM).
The Fed’s Meeting Minutes from Wednesday revealed that Trump’s trade and immigration policies fueled concerns over rising prices.
The World Gold Council revealed that central bank purchases rose more than 54% YoY to 333 tonnes following Trump’s victory.
Last week, Goldman Sachs upwardly revised Gold price projections to $3,100 by the end of 2025.
Money market fed funds futures are pricing in 50 basis points of easing by the Fed in 2025.
XAU/USD technical outlook: Gold price hovers near all-time high
Gold price is tilted to the upside, though buyers seem to be losing some steam. Despite hitting an all-time high, XAU/USD paired some of those gains and retreated below $2,950 amid bulls’ lack of strength to drive the yellow metal to $3,000. In addition, the Relative Strength Index (RSI) is overbought. Once the RSI resumes its downward path toward neutrality, the precious metal will be under selling pressure.
In that outcome, Gold’s first support would be the $2,900 mark, followed by the February 14 swing low of $2,877, followed by the February 12 daily low of $2,864.
Gold FAQs
Gold has played a key role in human’s history as it has been widely used as a store of value and medium of exchange. Currently, apart from its shine and usage for jewelry, the precious metal is widely seen as a safe-haven asset, meaning that it is considered a good investment during turbulent times. Gold is also widely seen as a hedge against inflation and against depreciating currencies as it doesn’t rely on any specific issuer or government.
Central banks are the biggest Gold holders. In their aim to support their currencies in turbulent times, central banks tend to diversify their reserves and buy Gold to improve the perceived strength of the economy and the currency. High Gold reserves can be a source of trust for a country’s solvency. Central banks added 1,136 tonnes of Gold worth around $70 billion to their reserves in 2022, according to data from the World Gold Council. This is the highest yearly purchase since records began. Central banks from emerging economies such as China, India and Turkey are quickly increasing their Gold reserves.
Gold has an inverse correlation with the US Dollar and US Treasuries, which are both major reserve and safe-haven assets. When the Dollar depreciates, Gold tends to rise, enabling investors and central banks to diversify their assets in turbulent times. Gold is also inversely correlated with risk assets. A rally in the stock market tends to weaken Gold price, while sell-offs in riskier markets tend to favor the precious metal.
The price can move due to a wide range of factors. Geopolitical instability or fears of a deep recession can quickly make Gold price escalate due to its safe-haven status. As a yield-less asset, Gold tends to rise with lower interest rates, while higher cost of money usually weighs down on the yellow metal. Still, most moves depend on how the US Dollar (USD) behaves as the asset is priced in dollars (XAU/USD). A strong Dollar tends to keep the price of Gold controlled, whereas a weaker Dollar is likely to push Gold prices up.
The US Dollar kicked off the new trading week slightly on the defensive, managing to rebound from fresh multi-week lows amid tariff concerns, lower yields, and renewed jitters on the health of the US economy.
Here is what you need to know on Tuesday, February 25:
The US Dollar Index (DXY) dropped to new two-month lows, trading at shouting distance from the key support at the 106.00 mark. The Consumer Confidence gauged by the Conference Bord will take centre stage seconded by the FHFA’s House Price Index, The Richmond Fed Manufacturing Index, and the API’s weekly report on US crude oil inventories. In addition, the Fed’s Logan, Barr and Barkin are due to speak.
EUR/USD briefly surpassed the 1.0500 barrier on fresh optimism following the results of the German election on Sunday. The final Q4 GDP Growth Rate in Germany will be at the centre of the debate, along with the ECB’s Negotiated Wage Growth and the speech by the ECB’s Nagel.
GBP/USD resumed its uptrend on Monday, rising to new highs in levels closer to the 1.2700 hurdle. The CBI Distributive Trades will be the only data release across the Channel, seconded by the speech by the BoE’s Pill.
After three daily pullbacks in a row, USD/JPY finally regained the smile and charted decent gains to the proximity of the key 150.00 barrier. Next on tap on the Japanese calendar will be the final prints of the December Coincident Index and Leading Economic Index.
AUD/USD treaded water around 0.6350 following an unsuccessful attempt to hit the 0.6400 level earlier in the day. The RBA’s Jones will speak on Tuesday, while the RBA’s Monthly CPI Indicator, and Construction Done figures, are expected on February 26.
Once again, supply concerns lent some much-needed oxygen to crude oil prices, prompting the barrel of American WTI to clock acceptable gains above the $70.00 mark.
Prices of Gold advanced to a record high closer to $2,960 per ounce troy on the back of intense uncertainty surrounding US tariffs. Silver prices added to Friday’s pullback, reaching multi-day lows near the £2.00 mark per ounce.
The US Dollar Index recovers earlier losses, stabilizing around 106.50.
Euro pares gains after CDU leads German elections, easing political uncertainty.
Markets focus on upcoming US GDP and PCE data later this week.
US President Donald Trump set to deliver a speech amid growing trade tensions.
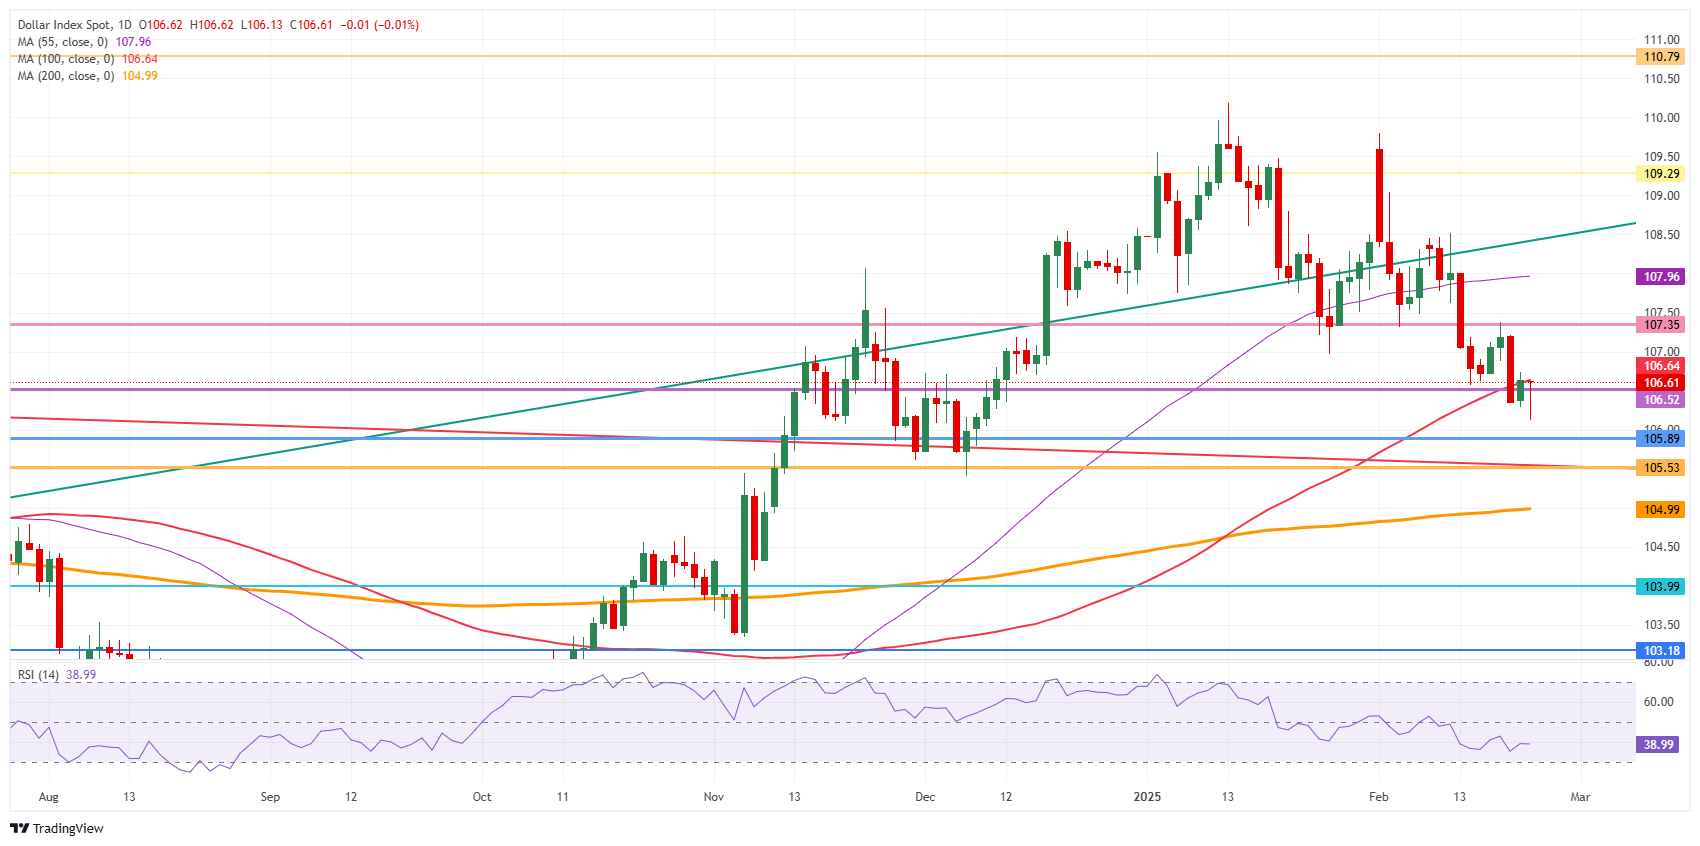
The US Dollar Index (DXY), which measures the US Dollar’s (USD) performance against a basket of six major currencies, recovers on Monday after an initial downturn, stabilizing around 106.50. Early losses triggered by upbeat German election results faded as the Christian Democratic Union (CDU) secured a leading position, calming market fears.
Daily digest market movers: US Dollar steadies amid geopolitical and economic developments
US Dollar Index recovers from Asian losses as German election results ease political concerns.
Christian Democratic Union (CDU) leads the German elections, dampening Euro rally amid reduced political uncertainty.
Investors await key US data releases, including Q4 2024 Gross Domestic Product (GDP) on Thursday.
January Personal Consumption Expenditures (PCE) data set for release on Friday, potentially influencing the inflation outlook.
Chicago Fed National Activity Index for January due later on Monday, offering insight into economic activity trends.
US President Donald Trump is expected to speak later today, potentially addressing trade policy and tariffs.
Tariffs set to take effect over the weekend could weigh on global trade sentiment.
Personal income and spending data are expected alongside PCE figures for January.
Q4 GDP figures are anticipated to confirm steady economic growth, supporting a positive outlook for 2025.
The US Dollar Index is attempting to stabilize around 106.50, with efforts to reclaim the 100-day Simple Moving Average (SMA) at 106.60 underway. Despite a mild rebound, technical indicators remain weak. The Relative Strength Index (RSI) and the Moving Average Convergence Divergence (MACD) suggest a continued bearish sentiment, though some recovery signs are emerging. Resistance lies at 107.00, while support remains firm around 106.00. A break above the 106.60 mark would signal a potential shift in momentum, but the bullish push remains fragile for now.
US Dollar FAQs
The US Dollar (USD) is the official currency of the United States of America, and the ‘de facto’ currency of a significant number of other countries where it is found in circulation alongside local notes. It is the most heavily traded currency in the world, accounting for over 88% of all global foreign exchange turnover, or an average of $6.6 trillion in transactions per day, according to data from 2022. Following the second world war, the USD took over from the British Pound as the world’s reserve currency. For most of its history, the US Dollar was backed by Gold, until the Bretton Woods Agreement in 1971 when the Gold Standard went away.
The most important single factor impacting on the value of the US Dollar is monetary policy, which is shaped by the Federal Reserve (Fed). The Fed has two mandates: to achieve price stability (control inflation) and foster full employment. Its primary tool to achieve these two goals is by adjusting interest rates. When prices are rising too quickly and inflation is above the Fed’s 2% target, the Fed will raise rates, which helps the USD value. When inflation falls below 2% or the Unemployment Rate is too high, the Fed may lower interest rates, which weighs on the Greenback.
In extreme situations, the Federal Reserve can also print more Dollars and enact quantitative easing (QE). QE is the process by which the Fed substantially increases the flow of credit in a stuck financial system. It is a non-standard policy measure used when credit has dried up because banks will not lend to each other (out of the fear of counterparty default). It is a last resort when simply lowering interest rates is unlikely to achieve the necessary result. It was the Fed’s weapon of choice to combat the credit crunch that occurred during the Great Financial Crisis in 2008. It involves the Fed printing more Dollars and using them to buy US government bonds predominantly from financial institutions. QE usually leads to a weaker US Dollar.
Quantitative tightening (QT) is the reverse process whereby the Federal Reserve stops buying bonds from financial institutions and does not reinvest the principal from the bonds it holds maturing in new purchases. It is usually positive for the US Dollar.
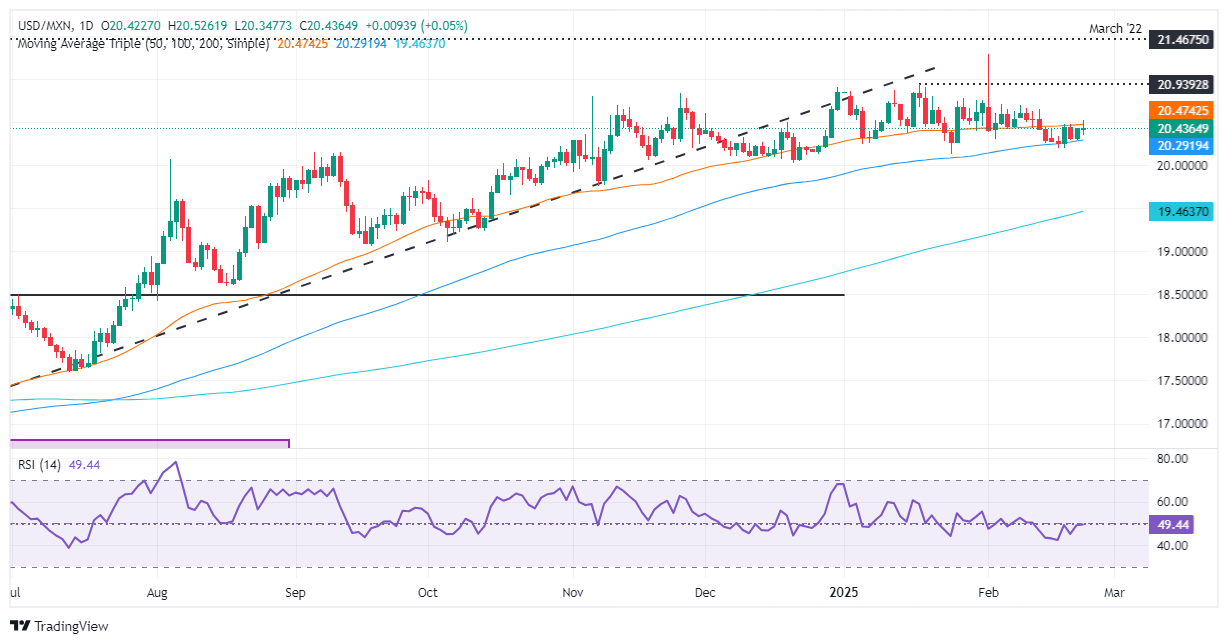
Mexican Peso slips as monetary policy divergence with Fed fuels further upside.
USD/MXN climbs 0.14% to 20.43 as Banxico signals additional 50-bps rate cuts.
Mexico’s Q4 GDP contracts by 0.6%, raising recession concerns.
Traders eye Mexico’s Current Account, Balance of Trade, and jobs data this week.
The Mexican Peso (MXN) slipped against the US Dollar (US) for the second consecutive day after inflation data for the first half of February rose as expected, yet justified Banco de Mexico's (Banxico) latest 50 basis points (bps) rate cut. At the time of writing, USD/MXN trades at 20.43, up 0.14%.
Mexico’s inflation report revealed that Banxico could continue to recalibrate monetary policy. According to February’s 6 meeting minutes, Banxico is expected to continue reducing rates at a 50-bps size.
Last week’s Gross Domestic Product (GDP) figures confirmed that Mexico’s economy is closing to a technical recession. GDP shrank by -0.6% QoQ in the fourth quarter of 2024, down from a 1.1% expansion and matching estimates of a Reuters poll. This and monetary policy divergence, with Banxico lowering rates and the Federal Reserve (Fed) keeping them unchanged, suggests further upside in the USD/MXN pair.
Ahead this week, Mexico’s economic docket will feature the Current Account, Balance of trade, and jobs data.
Daily digest market movers: Mexican Peso depreciates as inflation data justifies Banxico’s dovish tilt
Mid-month headline inflation in February rose by 0.15% as expected. On annual terms, it jumped 3.74%, as expected by most economists.
Core inflation for the same period expanded by 0.27% MoM, slightly above estimates of 0.24%. Yearly, underlying prices increased by 3.63%, up from 3.61%.
Last week, US President Donald Trump reiterated tariffs of 25% on cars, effective on April 2.
The swaps markets hint that the Federal Reserve might cut rates 25 basis points twice in 2025 via data from the Chicago Board of Trade (CBOT). Traders had priced in 51 bps of easing.
Trade disputes between the US and Mexico remain front and center. Although the countries found common ground previously, USD/MXN traders should know that there is a 30-day pause and that tensions could arise toward the end of February.
USD/MXN technical outlook: Mexican Peso drops as USD/MXN challenges 50-day SMA
The trend remains tilted to the upside, with the USD/MXN pair testing the 50-day Simple Moving Average (SMA) at 20.44 at the time of writing. Momentum, as depicted by the Relative Strength Index (RSI), suggests that buyers are gathering steam. Therefore, if USD/MXN climbs past 20.50, the exotic pair would be poised to challenge the January 17 20.93 high, followed by 21.00 and the year-to-date (YTD) high of 21.28.
Conversely, if sellers outweigh buyers, USD/MXN could test the 100-day SMA at 20.24. On further weakness, the pair might surpass that dynamic support and head towards the 20.00 figure.
Mexican Peso FAQs
The Mexican Peso (MXN) is the most traded currency among its Latin American peers. Its value is broadly determined by the performance of the Mexican economy, the country’s central bank’s policy, the amount of foreign investment in the country and even the levels of remittances sent by Mexicans who live abroad, particularly in the United States. Geopolitical trends can also move MXN: for example, the process of nearshoring – or the decision by some firms to relocate manufacturing capacity and supply chains closer to their home countries – is also seen as a catalyst for the Mexican currency as the country is considered a key manufacturing hub in the American continent. Another catalyst for MXN is Oil prices as Mexico is a key exporter of the commodity.
The main objective of Mexico’s central bank, also known as Banxico, is to maintain inflation at low and stable levels (at or close to its target of 3%, the midpoint in a tolerance band of between 2% and 4%). To this end, the bank sets an appropriate level of interest rates. When inflation is too high, Banxico will attempt to tame it by raising interest rates, making it more expensive for households and businesses to borrow money, thus cooling demand and the overall economy. Higher interest rates are generally positive for the Mexican Peso (MXN) as they lead to higher yields, making the country a more attractive place for investors. On the contrary, lower interest rates tend to weaken MXN.
Macroeconomic data releases are key to assess the state of the economy and can have an impact on the Mexican Peso (MXN) valuation. A strong Mexican economy, based on high economic growth, low unemployment and high confidence is good for MXN. Not only does it attract more foreign investment but it may encourage the Bank of Mexico (Banxico) to increase interest rates, particularly if this strength comes together with elevated inflation. However, if economic data is weak, MXN is likely to depreciate.
As an emerging-market currency, the Mexican Peso (MXN) tends to strive during risk-on periods, or when investors perceive that broader market risks are low and thus are eager to engage with investments that carry a higher risk. Conversely, MXN tends to weaken at times of market turbulence or economic uncertainty as investors tend to sell higher-risk assets and flee to the more-stable safe havens.
US President Donald Trump hit newswires on Monday, passing along comments on the ongoing Ukraine-Russia peacemaking situation. With Russia over a thousand days into its three-day military operation that was meant to sweep the Ukrainian country back under Russian control, the US President, who has pursued an alliance with Russia's Vladimir Putin for years, is looking to isolate Ukraine from NATO and get Ukraine to sign a deal worth half of a trillion dollars.
This follows accusations from President Trump that Ukrainian President Volodymyr Zelenskyy is ultimately responsible for causing Russia to invade Ukraine in the first place and also failing to stop the war after it started.
Key highlights
Trump does not see problem with sending European troops as peacemakers in Ukraine.
Will meet with Zelenskyy, could come "this week or next" to sign "minerals deal".
Will meet with Russia's Putin "at some point".
NATO is a good thing if done properly.
Trump priases Italy's Meloni's leadership, says Italy is very important.
Trying to work on economic development with Russia.
Trump claims he could end the war in Ukraine within weeks.
May 9 may be "a lttle soon" for a visit to Moscow.
Trump willing to go to Moscow at appropriate time.
Trump claims Putin will accept European peacekeepers, "we'll see" when asked if Ukraine should give up territory.
18:05
United States 2-Year Note Auction: 4.169% vs previous 4.211%
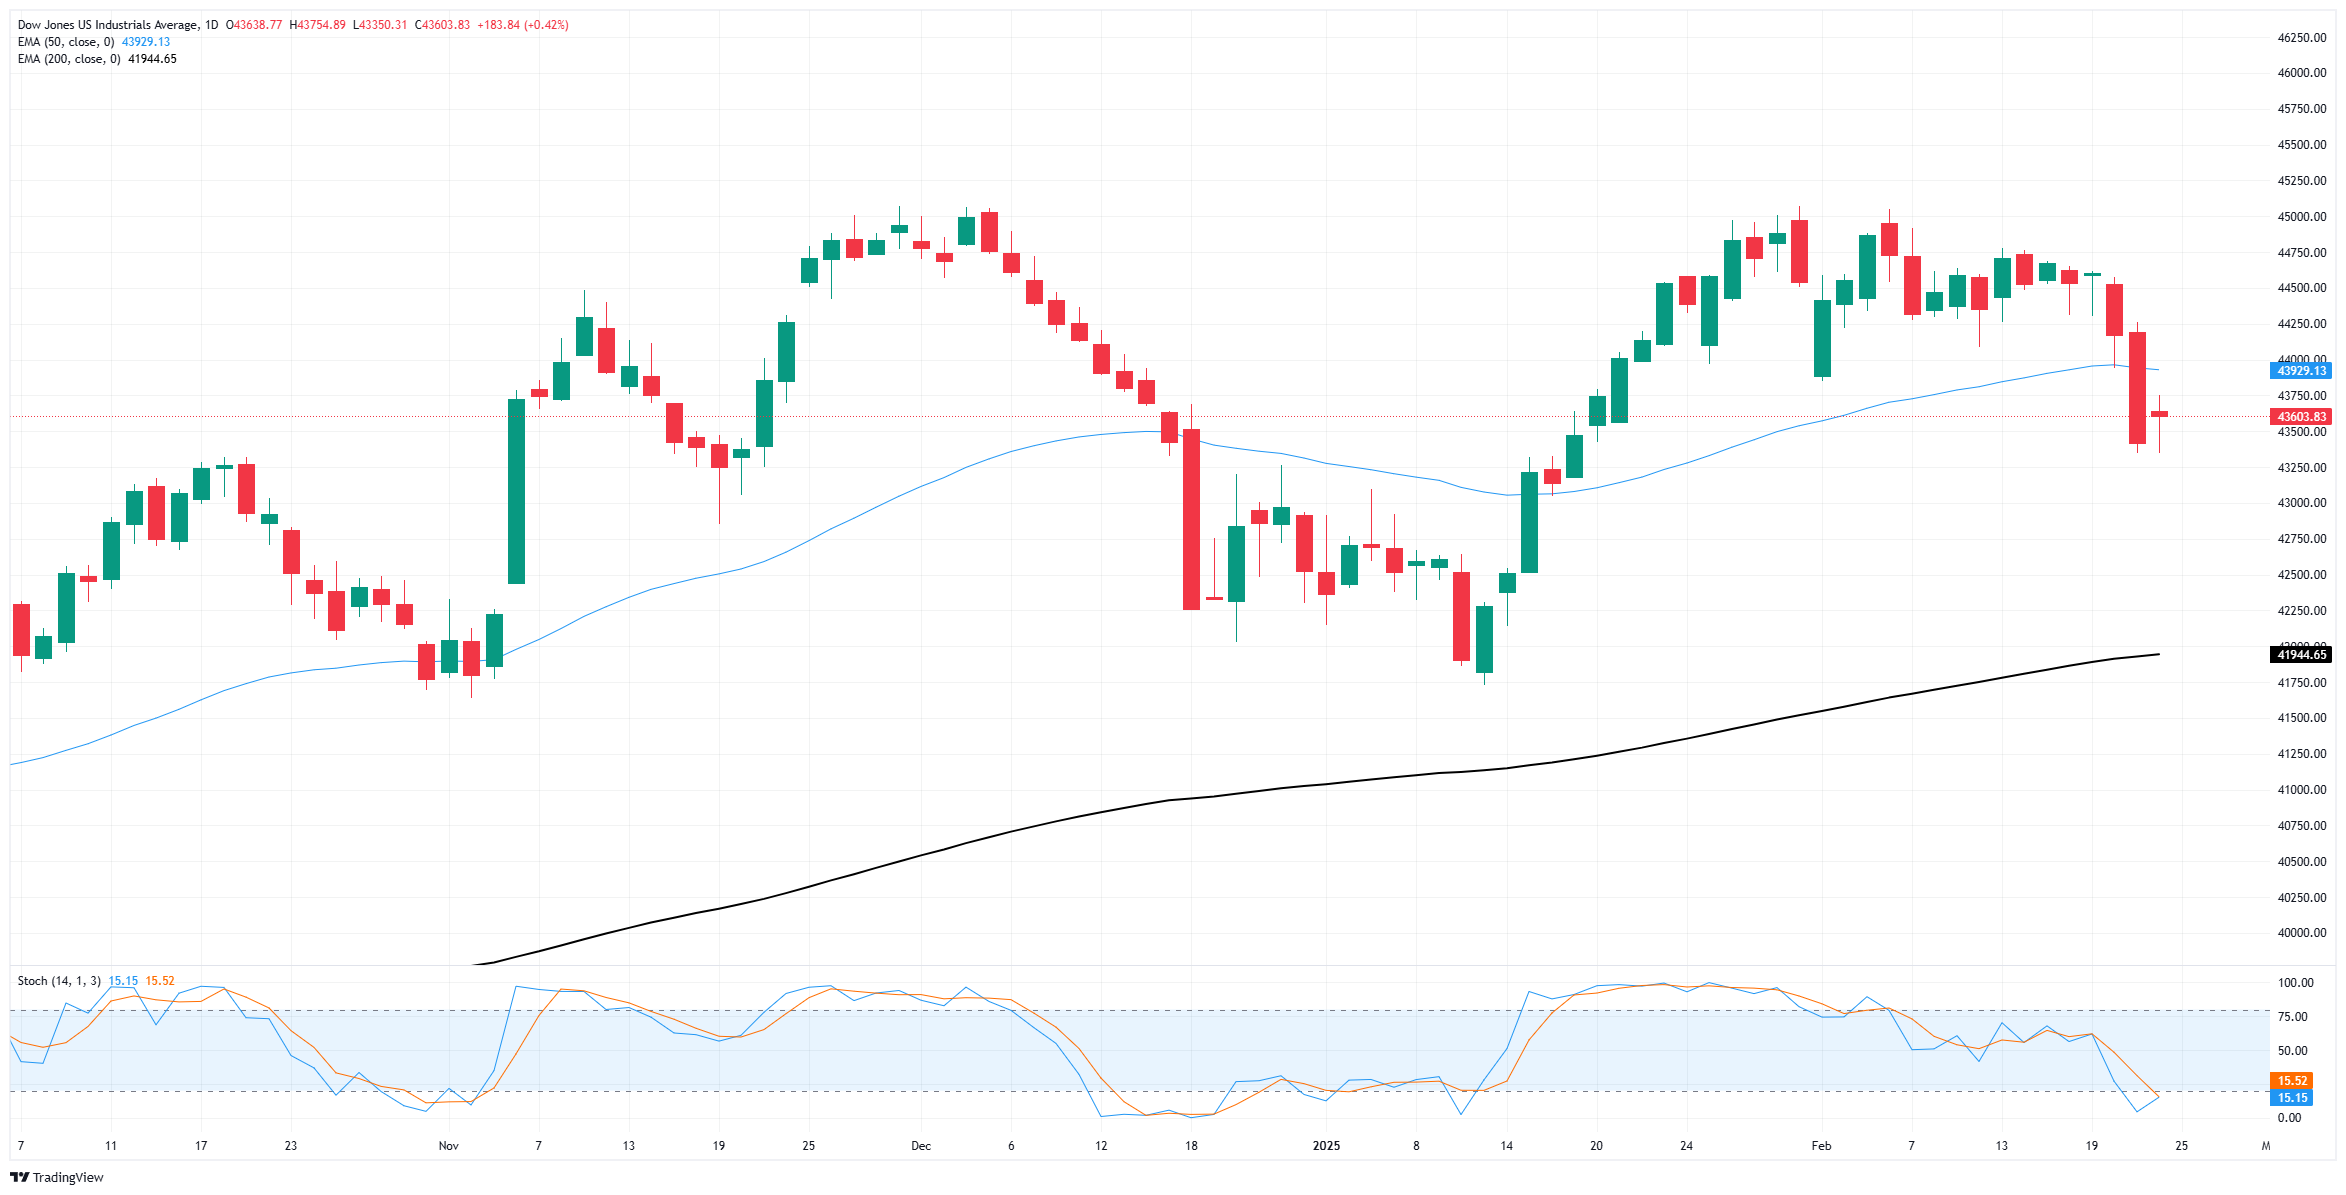
The Dow Jones shifted higher on Monday, trimming recent losses.
Equities recovery remains limited as tech stocks trade blows.
US inflation data due later this week looms large on the horizon.
The Dow Jones Industrial Average (DJIA) recovered some ground on Monday, climbing some 300 points and change at its peak in an effort to claw back some of last week’s losses sparked by an unexpected downturn in consumer confidence figures. Markets are kicking off the new trading week with a bullish tilt, but gains remain limited as tensions hold on the high end and investors remain overall uneasy on multiple fronts.
Consumer sentiment figures from February raised some alarms last week, and now investors will be pivoting to key earnings figures this week from consumer building suppliers Home Depot (HD) and Lowe’s (LOW) to help gauge consumers' spending health. US Personal Consumption Expenditure (PCE) inflation figures due later this week will draw plenty of investor focus as traders hope for signs that January’s uptick in Consumer Price Index (CPI) and Producer Price Index (PPI) inflation, which both came in higher than expected, was just a flash in the pan and not a sign of a new resurgence of inflation pressures.
Dow Jones news
Despite some mixed investor sentiment, most of the Dow Jones is holding on the high side, with over two-thirds of the index’s listed securities gaining ground on Monday. Microsoft (MSFT) is down a full percentage point, falling to $404 per share as the company cuts its spending plans on data centers, reigniting even more fears that the AI trade may be coming to an end.
Dow Jones price forecast
The Dow Jones may be recovering from last week’s last-minute bearish plunge, but the major equity index is still mired in bear country. Price action is stuck on the low side of the 50-day Exponential Moving Average (EMA) near 43,930, and bidders are struggling to develop meaningful legs from their new swing low point.
The Dow Jones shed around 2.75% in a two-day losing streak that took bids from 44,575 to 43,345, but further downside losses are looking unlikely as markets claw back from four-week lows. Price action remains well-supported above the long-term 200-day EMA approaching 42,000.
Dow Jones daily chart
Dow Jones FAQs
The Dow Jones Industrial Average, one of the oldest stock market indices in the world, is compiled of the 30 most traded stocks in the US. The index is price-weighted rather than weighted by capitalization. It is calculated by summing the prices of the constituent stocks and dividing them by a factor, currently 0.152. The index was founded by Charles Dow, who also founded the Wall Street Journal. In later years it has been criticized for not being broadly representative enough because it only tracks 30 conglomerates, unlike broader indices such as the S&P 500.
Many different factors drive the Dow Jones Industrial Average (DJIA). The aggregate performance of the component companies revealed in quarterly company earnings reports is the main one. US and global macroeconomic data also contributes as it impacts on investor sentiment. The level of interest rates, set by the Federal Reserve (Fed), also influences the DJIA as it affects the cost of credit, on which many corporations are heavily reliant. Therefore, inflation can be a major driver as well as other metrics which impact the Fed decisions.
Dow Theory is a method for identifying the primary trend of the stock market developed by Charles Dow. A key step is to compare the direction of the Dow Jones Industrial Average (DJIA) and the Dow Jones Transportation Average (DJTA) and only follow trends where both are moving in the same direction. Volume is a confirmatory criteria. The theory uses elements of peak and trough analysis. Dow’s theory posits three trend phases: accumulation, when smart money starts buying or selling; public participation, when the wider public joins in; and distribution, when the smart money exits.
There are a number of ways to trade the DJIA. One is to use ETFs which allow investors to trade the DJIA as a single security, rather than having to buy shares in all 30 constituent companies. A leading example is the SPDR Dow Jones Industrial Average ETF (DIA). DJIA futures contracts enable traders to speculate on the future value of the index and Options provide the right, but not the obligation, to buy or sell the index at a predetermined price in the future. Mutual funds enable investors to buy a share of a diversified portfolio of DJIA stocks thus providing exposure to the overall index.
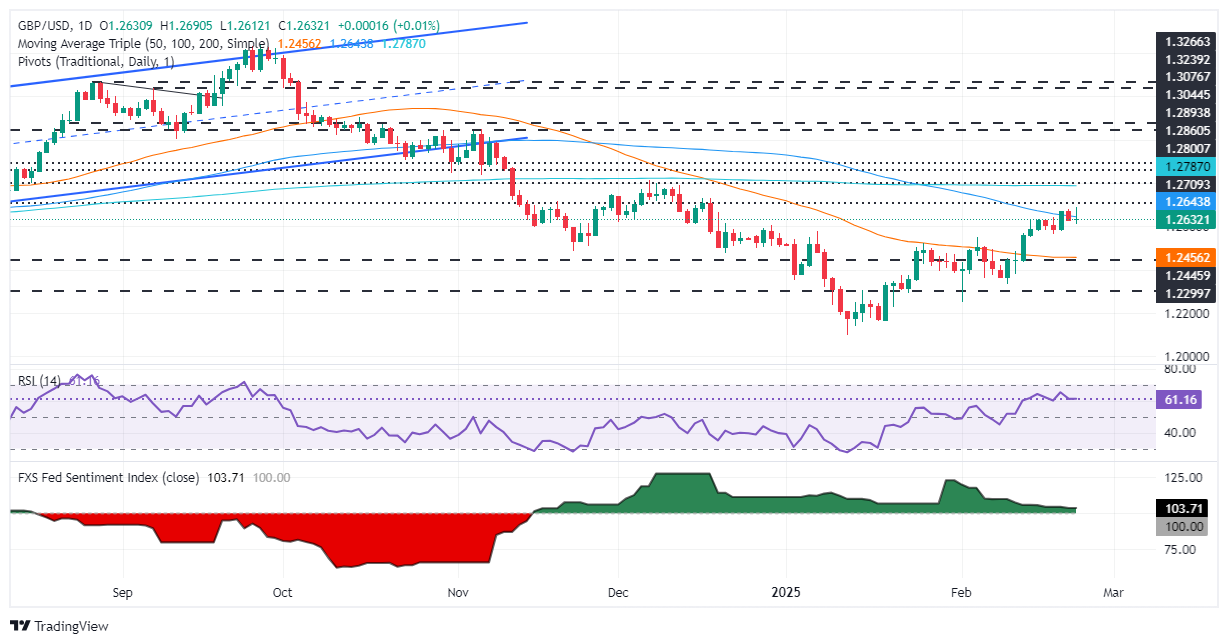
GBP/USD touched 1.2690 as UK inflation data boosted rate-cut uncertainty.
Market wary of potential spending cuts from UK Chancellor Rachel Reeves.
US data weakens as Dallas Fed Manufacturing Index plunges into contraction.
The Pound Sterling remains firm against the Greenback during the North American session on Monday yet retraced earlier gains after hitting a 9-week high of 1.2690 amid some US dollar weakness. GBP/USD trades at 1.2632 almost flat.
Sterling steadies near 1.2653 as traders eye UK Spring Budget risks
The market mood remains uneasy as traders digest the news that companies are reducing expenses. This is an indication of cautiousness as US President Donald Trump continues to use trade policies to negotiate favorable deals for the US.
Inflation data in the United Kingdom sponsored Cable’s last leg-up. Nevertheless, the release of the Spring budget could weaken the Pound, as Chancellor Rachel Reeves would need to scale back spending if she didn’t want to raise taxes. In that outcome, the Bank of England (BoE) could continue to ease policy as the disinflation process evolves.
Money markets traders expect the BoE will lower rates by 54 basis points in 2025, though they expect gradual adjustments as inflation remains sticky.
In the US, the Dallas Fed Manufacturing Index plunged 22 points to -8.3 in February from a 14.1 three-year high expansion hit a month ago.
On Tuesday, the UK economic docket will feature CBI Distributive Trades and a speech of the BoE Chief Economist Huw Pill. Across the Atlantic, traders are eyeing the Conference Board (CB) Consumer Confidence for February, expected to deteriorate from 104.1 to 103, and speeches from Fed Governor Michael Barr and Richmond Fed Thomas Barkin.
GBP/USD Price Analysis: Technical outlook
The GBP/USD is neutral to upward biased but failed to crack the 100-day Simple Moving Average (SMA) at 1.2653, which opened the door for a pullback. Hence, the GBP/USD key support would be 1.2600, followed by the February 19 swing low of 1.2563. On the other hand, if the pair reclaims the 100-day SMA, buyers could challenge 1.2700 and the 200-day SMA at 1.2787.
British Pound PRICE Today
The table below shows the percentage change of British Pound (GBP) against listed major currencies today. British Pound was the strongest against the Japanese Yen.
USD
EUR
GBP
JPY
CAD
AUD
NZD
CHF
USD
-0.07%
0.01%
0.16%
0.00%
-0.01%
-0.05%
-0.09%
EUR
0.07%
-0.00%
0.08%
-0.11%
0.04%
-0.17%
-0.19%
GBP
-0.01%
0.00%
0.13%
-0.11%
0.05%
-0.16%
-0.19%
JPY
-0.16%
-0.08%
-0.13%
-0.17%
-0.10%
-0.14%
-0.18%
CAD
-0.00%
0.11%
0.11%
0.17%
-0.06%
-0.05%
-0.08%
AUD
0.00%
-0.04%
-0.05%
0.10%
0.06%
-0.21%
-0.24%
NZD
0.05%
0.17%
0.16%
0.14%
0.05%
0.21%
-0.03%
CHF
0.09%
0.19%
0.19%
0.18%
0.08%
0.24%
0.03%
The heat map shows percentage changes of major currencies against each other. The base currency is picked from the left column, while the quote currency is picked from the top row. For example, if you pick the British Pound from the left column and move along the horizontal line to the US Dollar, the percentage change displayed in the box will represent GBP (base)/USD (quote).
EUR/USD posts mild gains but faces rejection near the 100-day SMA.
RSI remains in positive territory but shows signs of fading bullish momentum.
The EUR/USD pair started the week on a cautiously positive note, climbing toward recent highs before encountering strong resistance near the 100-day Simple Moving Average (SMA). After briefly reaching the 1.0530 area, the pair lost momentum and pulled back toward the 1.0470 zone. This retreat suggests that bullish efforts are beginning to stall, with sellers gradually regaining control.
Technical signals highlight this shift in sentiment. The Relative Strength Index (RSI) remains in positive territory but is flattening, indicating that bullish momentum may be running out of steam. The Moving Average Convergence Divergence (MACD) histogram shows flat green bars, reinforcing the notion of weakening upward pressure. Without a decisive break above the 100-day SMA, bulls could struggle to maintain control.
In the short term, the key focus will be on whether the pair can defend support around the 1.0450 zone. A break below this level could invite further losses, pushing the pair toward the 20-day SMA. On the upside, a clear breach of the 100-day SMA would be required to revive bullish momentum and open the door for a sustained recovery. For now, the technical indicators suggest that time may be running out for the bulls to regain traction.
Gold climbs as Trump’s trade policies fuel investor uncertainty.
US 10-year Treasury yield dips slightly, providing a tailwind for bullion.
Overbought conditions suggest bulls may face exhaustion near record levels.
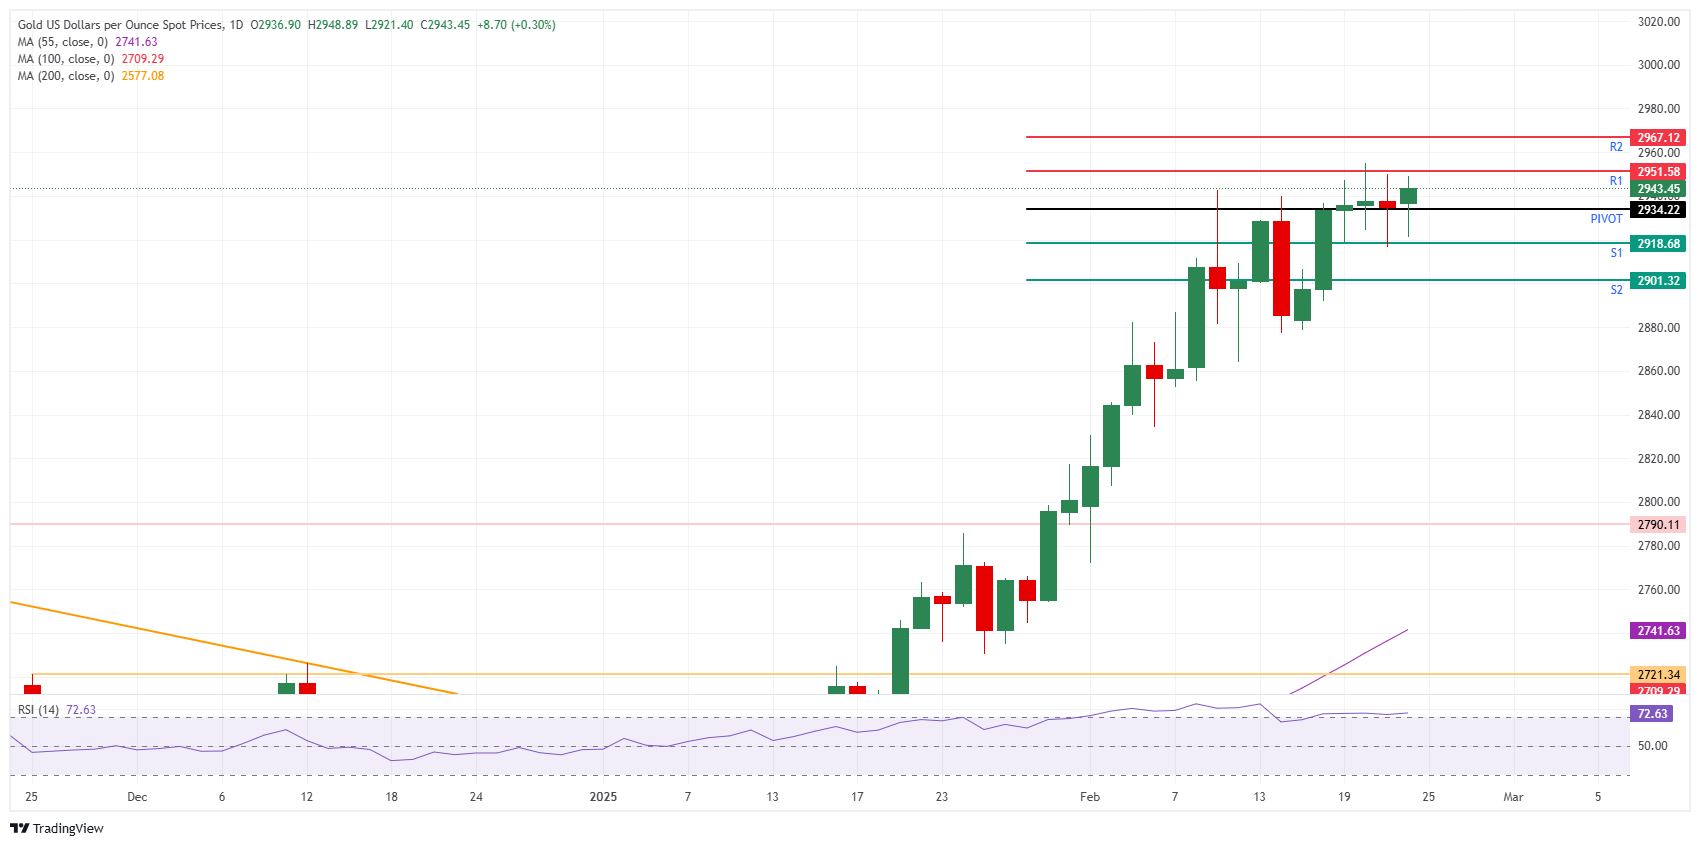
Gold's price rose to a new record high of $2,956 in early trading on Monday during the North American session as the Greenback stayed firm and US yields remained virtually unchanged.
XAU/USD extends rally despite firm US Dollar and stable yields
Uncertainty keeps bullion prices underpinned as investors consider trade policies proposed by US President Donald Trump. It is the last week of February, and we should see tensions rising within the US, Canada, and Mexico after Trump delayed tariffs. Countries agreed to cooperate with the US in stopping fentanyl traffic and illegal immigration.
The US 10-year Treasury note yield has tumbled one basis point to 4.443%, a tailwind for the precious metal. US Real yields, as measured by the yield in the US 10-year Treasury Inflation-Protected Securities (TIPS), stay firm near 2.017%.
Last Friday, business activity data in the United States (US) was mixed, with the S&P Global Manufacturing PMI expanding while the Services PMI shrank. Also, inflation expectations rose, and consumer sentiment deteriorated, revealed the University of Michigan (UoM)
Given the backdrop, XAU/USD is set to extend its gains, even though bulls seem exhausted, as depicted by oscillators that are overbought.
XAU/USD Price Forecast: Technical outlook
Gold’s uptrend remains intact, but buyers would likely push prices steadily without aggressive movements. The Relative Strength Index (RSI) is overbought, which could cap XAU/USD’s advance and pave the way for a retracement.
However, if XAU/USD climbs past the all-time high of $2,956, the next resistance would be $3,000. On the other hand, if bullion prices fall below the February 21 low of $2,916, XAU/USD could challenge $2,900 in the near term.
Gold FAQs
Gold has played a key role in human’s history as it has been widely used as a store of value and medium of exchange. Currently, apart from its shine and usage for jewelry, the precious metal is widely seen as a safe-haven asset, meaning that it is considered a good investment during turbulent times. Gold is also widely seen as a hedge against inflation and against depreciating currencies as it doesn’t rely on any specific issuer or government.
Central banks are the biggest Gold holders. In their aim to support their currencies in turbulent times, central banks tend to diversify their reserves and buy Gold to improve the perceived strength of the economy and the currency. High Gold reserves can be a source of trust for a country’s solvency. Central banks added 1,136 tonnes of Gold worth around $70 billion to their reserves in 2022, according to data from the World Gold Council. This is the highest yearly purchase since records began. Central banks from emerging economies such as China, India and Turkey are quickly increasing their Gold reserves.
Gold has an inverse correlation with the US Dollar and US Treasuries, which are both major reserve and safe-haven assets. When the Dollar depreciates, Gold tends to rise, enabling investors and central banks to diversify their assets in turbulent times. Gold is also inversely correlated with risk assets. A rally in the stock market tends to weaken Gold price, while sell-offs in riskier markets tend to favor the precious metal.
The price can move due to a wide range of factors. Geopolitical instability or fears of a deep recession can quickly make Gold price escalate due to its safe-haven status. As a yield-less asset, Gold tends to rise with lower interest rates, while higher cost of money usually weighs down on the yellow metal. Still, most moves depend on how the US Dollar (USD) behaves as the asset is priced in dollars (XAU/USD). A strong Dollar tends to keep the price of Gold controlled, whereas a weaker Dollar is likely to push Gold prices up.
USD/JPY jumps to near 149.80 as the Japanese Yen weakens on a slight correction in 10-year JGBs.
The BoJ is expected to raise interest rates further this year.
The US Dollar bounces back as investors digest weak US PMI data.
The USD/JPY pair advances to near 149.80 in North American trading hours on Monday. The asset gains as the Japanese Yen (JPY) weakens across the board amid a slight correction in 10-year Japan bond yields.
Japanese Yen PRICE Today
The table below shows the percentage change of Japanese Yen (JPY) against listed major currencies today. Japanese Yen was the strongest against the Swiss Franc.
USD
EUR
GBP
JPY
CAD
AUD
NZD
CHF
USD
-0.09%
-0.11%
0.34%
-0.05%
-0.22%
-0.15%
0.10%
EUR
0.09%
-0.11%
0.28%
-0.15%
-0.14%
-0.24%
0.02%
GBP
0.11%
0.11%
0.44%
-0.04%
-0.04%
-0.14%
0.12%
JPY
-0.34%
-0.28%
-0.44%
-0.39%
-0.48%
-0.41%
-0.15%
CAD
0.05%
0.15%
0.04%
0.39%
-0.23%
-0.10%
0.17%
AUD
0.22%
0.14%
0.04%
0.48%
0.23%
-0.10%
0.16%
NZD
0.15%
0.24%
0.14%
0.41%
0.10%
0.10%
0.26%
CHF
-0.10%
-0.02%
-0.12%
0.15%
-0.17%
-0.16%
-0.26%
The heat map shows percentage changes of major currencies against each other. The base currency is picked from the left column, while the quote currency is picked from the top row. For example, if you pick the Japanese Yen from the left column and move along the horizontal line to the US Dollar, the percentage change displayed in the box will represent JPY (base)/USD (quote).
Investors rushed to buy Japanese bonds after Bank of Japan (BoJ) Governor Kazuo Ueda said on Friday that the central bank could ramp up the government bond-purchasing program if long-term interest rates rise sharply. 10-year JGBs decline to near 1.41% from 1.45%, the highest level seen in almost 15 years.
Meanwhile, firm expectations that the BoJ will raise interest rates again this year would keep the Japanese Yen on the front foot. Hotter-than-expected Japan’s National Consumer Price Index (CPI) data for January also added to expectations that the BoJ will tighten its monetary policy further.
On the US Dollar (USD) front, a strong recovery has been seen after sliding to its lowest in almost 12 weeks. The US Dollar Index (DXY) rebounded to near 106.60 as investors digest weak United States (US) flash S&P Global Purchasing Managers’ Index (PMI) data for February, released on Friday. The Composite PMI fell to 50.4 from 52.7 in January as activities in the services sector declined unexpectedly for the first time after expanding for straight 25 months.
Weak US private business activity data has resulted in a decent increase in Federal Reserve (Fed) dovish bets. The likelihood for the Fed to cut interest rates in the June meeting has increased to 58% from almost 50% a week ago, according to the CME FedWatch tool.
Japanese Yen FAQs
The Japanese Yen (JPY) is one of the world’s most traded currencies. Its value is broadly determined by the performance of the Japanese economy, but more specifically by the Bank of Japan’s policy, the differential between Japanese and US bond yields, or risk sentiment among traders, among other factors.
One of the Bank of Japan’s mandates is currency control, so its moves are key for the Yen. The BoJ has directly intervened in currency markets sometimes, generally to lower the value of the Yen, although it refrains from doing it often due to political concerns of its main trading partners. The BoJ ultra-loose monetary policy between 2013 and 2024 caused the Yen to depreciate against its main currency peers due to an increasing policy divergence between the Bank of Japan and other main central banks. More recently, the gradually unwinding of this ultra-loose policy has given some support to the Yen.
Over the last decade, the BoJ’s stance of sticking to ultra-loose monetary policy has led to a widening policy divergence with other central banks, particularly with the US Federal Reserve. This supported a widening of the differential between the 10-year US and Japanese bonds, which favored the US Dollar against the Japanese Yen. The BoJ decision in 2024 to gradually abandon the ultra-loose policy, coupled with interest-rate cuts in other major central banks, is narrowing this differential.
The Japanese Yen is often seen as a safe-haven investment. This means that in times of market stress, investors are more likely to put their money in the Japanese currency due to its supposed reliability and stability. Turbulent times are likely to strengthen the Yen’s value against other currencies seen as more risky to invest in.
13:30
United States Chicago Fed National Activity Index fell from previous 0.15 to -0.03 in January
The US Dollar is red across the board against most major currencies on Monday.
The far-right AfD party cannot book enough seats to claim the lead in Germany.
The US Dollar Index (DXY) recovers initial losses and looks ready to shoot higher.
The US Dollar Index (DXY), which tracks the performance of the US Dollar (USD) against six major currencies, recovers the nearly 0.50% loss it incurred in the opening hours in the Asian markets and trades flat near 106.60 at the time of writing on Monday. The initial move down in the US Dollar came in due to euphoria for the Euro (EUR) after the first German election results showed a firm lead for the Christian Democratic Union of Germany (CDU), which will take the lead in forming a coalition. As the dust settles, this means that fundamentally, no big changes will take place in Germany regarding leadership and political agenda, which triggers the Euro to pare back gains and the DXY to turn flat to positive.
The US economic calendar starts off the week slowly, with all eyes on the US Gross Domestic Product (GDP) release for the fourth quarter of 2024 on Thursday and Personal Consumption Expenditures (PCE) for January on Friday. However, the Chicago Fed National Activity Index for January is due this Monday. Later in the day, United States (US) President Donald Trump is also due to deliver a speech.
Daily digest market movers: That was quick
Halfway through the European trading session, the Euro (EUR) has given up nearly all its gains against the US Dollar (USD) as traders are not impressed with the possible lack of major reforms or changes in the German political landscape for the new government formation.
At 13:30 GMT, the Chicago Fed National Activity Index for January is due. No forecast is available, with the previous reading at 0.15.
The US Treasury will auction a 3-month, 6-month Bills, and a 2-year Note auction this Monday.
US President Donald Trump is set to hold a press conference with President of France Macron near 19:00 GMT.
Equities are breathing a sigh of relief after the German election outcome, though the German Dax is starting to fade its intraday gains halfway through the European trading session.
The CME FedWatch tool shows a 41.2% chance that interest rates will remain unchanged at current levels in June against a bigger 46.2% for a 25 basis points (bps) rate cut.
The US 10-year yield trades around 4.43%, down over 3% from last week’s high at 4.574%.
US Dollar Index Technical Analysis: False note
The US Dollar Index (DXY) portrays a textbook element here, with the German election outcome as a catalyst. During the Asian session, a sigh of relief and support for the Euro was outpacing the Greenback in the idea that a crisis was averted with the Far-Right not having enough seats to secure the lead in Germany. However, now that the dust settles, markets start to realise that the current coalition probability is dull and the same politics markets saw in the past few decades is due, which is seen as not enough to trigger substantial additional upside in Euro.
On the upside, the 100-day Simple Moving Average (SMA) could limit bulls buying the Greenback near 106.61. From there, the next leg could go up to 107.35, a pivotal support from December 2024 and January 2025. In case US President Trump has some surprise comments on Monday, even 107.96 (55-day SMA) could be tested.
On the downside, the 106.52 (April 16, 2024, high) level has seen a false break for now. However, that does mean quite a few stops might have been triggered in the markets, with a few bulls having been washed out of their long US Dollar positions. Another leg lower might be needed to entice those Dollar bulls to reenter at lower levels, near 105.89 or even 105.33.
US Dollar Index: Daily Chart
US Dollar FAQs
The US Dollar (USD) is the official currency of the United States of America, and the ‘de facto’ currency of a significant number of other countries where it is found in circulation alongside local notes. It is the most heavily traded currency in the world, accounting for over 88% of all global foreign exchange turnover, or an average of $6.6 trillion in transactions per day, according to data from 2022. Following the second world war, the USD took over from the British Pound as the world’s reserve currency. For most of its history, the US Dollar was backed by Gold, until the Bretton Woods Agreement in 1971 when the Gold Standard went away.
The most important single factor impacting on the value of the US Dollar is monetary policy, which is shaped by the Federal Reserve (Fed). The Fed has two mandates: to achieve price stability (control inflation) and foster full employment. Its primary tool to achieve these two goals is by adjusting interest rates. When prices are rising too quickly and inflation is above the Fed’s 2% target, the Fed will raise rates, which helps the USD value. When inflation falls below 2% or the Unemployment Rate is too high, the Fed may lower interest rates, which weighs on the Greenback.
In extreme situations, the Federal Reserve can also print more Dollars and enact quantitative easing (QE). QE is the process by which the Fed substantially increases the flow of credit in a stuck financial system. It is a non-standard policy measure used when credit has dried up because banks will not lend to each other (out of the fear of counterparty default). It is a last resort when simply lowering interest rates is unlikely to achieve the necessary result. It was the Fed’s weapon of choice to combat the credit crunch that occurred during the Great Financial Crisis in 2008. It involves the Fed printing more Dollars and using them to buy US government bonds predominantly from financial institutions. QE usually leads to a weaker US Dollar.
Quantitative tightening (QT) is the reverse process whereby the Federal Reserve stops buying bonds from financial institutions and does not reinvest the principal from the bonds it holds maturing in new purchases. It is usually positive for the US Dollar.
AUD/USD retreats from 0.6400 as the US Dollar recovers its intraday losses.
Investors digest weak preliminary US S&P Global PMI data for February.
Going forward, Australian monthly CPI data for January will influence RBA’s policy outlook.
The AUD/USD pair pares gains after rising to near 0.6400 in late European trading hours on Monday. The Aussie pair falls back as the US Dollar (USD) bounces back strongly, with investors shrugging off the impact of weak United States (US) flash S&P Global Purchasing Managers’ Index (PMI) data for February, which was released on Friday.
The US Dollar Index (DXY), which tracks the Greenback’s value against six major currencies, recovers its entire intraday losses and returns above 106.50.
The PMI report showed that the overall business activity continued to expand, however, the pace of expansion slowed significantly, with the Services PMI declining for the first time in 25 months. The Services PMI, which gauges activities in the services sector, contracts to 49.7 from 52.9 in January. On the contrary, the Manufacturing PMI rose at a faster-than-expected pace to 51.6.
Meanwhile, investors seek more developments on US President Donald Trump’s tariff agenda to get cues about the likely global economic outlook. Last week, Trump announced that he is planning to impose 25% tariffs on cars, pharmaceuticals, semiconductors, and lumber and forest products over the next month or sooner. Such a scenario would lead to a global trade war, which would increase demand for safe-haven assets.
In the Asia-Pacific region, the Australian Dollar (AUD) trades cautiously as investors await the monthly Consumer Price Index (CPI) data for January, which will be released on Wednesday. The monthly CPI is estimated to have accelerated to 2.6% from 2.5% in December. The inflation data will influence market speculation for the Reserve Bank of Australia's (RBA) monetary policy outlook.
Last week, the RBA reduced its Official Cash Rate (OCR) for the first time since November 2020 but said that the battle against inflation is not over yet and guided a cautious stance on further monetary policy easing.
Australian Dollar FAQs
One of the most significant factors for the Australian Dollar (AUD) is the level of interest rates set by the Reserve Bank of Australia (RBA). Because Australia is a resource-rich country another key driver is the price of its biggest export, Iron Ore. The health of the Chinese economy, its largest trading partner, is a factor, as well as inflation in Australia, its growth rate and Trade Balance. Market sentiment – whether investors are taking on more risky assets (risk-on) or seeking safe-havens (risk-off) – is also a factor, with risk-on positive for AUD.
The Reserve Bank of Australia (RBA) influences the Australian Dollar (AUD) by setting the level of interest rates that Australian banks can lend to each other. This influences the level of interest rates in the economy as a whole. The main goal of the RBA is to maintain a stable inflation rate of 2-3% by adjusting interest rates up or down. Relatively high interest rates compared to other major central banks support the AUD, and the opposite for relatively low. The RBA can also use quantitative easing and tightening to influence credit conditions, with the former AUD-negative and the latter AUD-positive.
China is Australia’s largest trading partner so the health of the Chinese economy is a major influence on the value of the Australian Dollar (AUD). When the Chinese economy is doing well it purchases more raw materials, goods and services from Australia, lifting demand for the AUD, and pushing up its value. The opposite is the case when the Chinese economy is not growing as fast as expected. Positive or negative surprises in Chinese growth data, therefore, often have a direct impact on the Australian Dollar and its pairs.
Iron Ore is Australia’s largest export, accounting for $118 billion a year according to data from 2021, with China as its primary destination. The price of Iron Ore, therefore, can be a driver of the Australian Dollar. Generally, if the price of Iron Ore rises, AUD also goes up, as aggregate demand for the currency increases. The opposite is the case if the price of Iron Ore falls. Higher Iron Ore prices also tend to result in a greater likelihood of a positive Trade Balance for Australia, which is also positive of the AUD.
The Trade Balance, which is the difference between what a country earns from its exports versus what it pays for its imports, is another factor that can influence the value of the Australian Dollar. If Australia produces highly sought after exports, then its currency will gain in value purely from the surplus demand created from foreign buyers seeking to purchase its exports versus what it spends to purchase imports. Therefore, a positive net Trade Balance strengthens the AUD, with the opposite effect if the Trade Balance is negative.
BoC Governor Macklem said Friday the economy was on a 'better footing' on the back of a pickup in consumer demand but noted again that the consequences of a trade war with the US would be 'severe' and the threat of tariffs was already doing economic harm, Scotiabank's Chief FX Strategist Shaun Osborne notes.
BoC to adjust the policy depending on developments
"He said a trade war would cut domestic output by nearly 3% over two years and lower the growth flight path for the Canadian economy by 2.5% in the long run. Macklem said the situation was 'fluid', however, and policymakers would make the best decision possible at the March 12th rate policy meeting. In other words, the Bank has a pretty open mind about the direction of policy and will adjust, or not, depending on developments.
"The CAD lost some ground on the crosses last week, especially against the JPY. CAD/JPY eased under 105 to trade to its lowest since last September. The cross broke below major trend support and may have further to run as markets mull BoC/BoJ policy divergence and tariff risks. Cross flows may add to broader CAD headwinds."
USD-bearish technical signals noted recently ('engulfing' patterns on the daily and weekly charts and a key reversal week on the 'regular' charts) remain the salient features of USD/CAD’s technical picture, Scotiabank's Chief FX Strategist Shaun Osborne notes.
A lot of residual bull momentum behind the USD
"But there is still a lot of residual bull momentum behind the USD and that may curb the CAD’s ability to recover. Those reversal patterns should mean, however, that the top of the USD is in for this move up—from a technical point of view—at 1.4795. My confidence in this respect is suitably measured, however."
"Technical resistance sits at 1.4250/60, the January range lows, and 1.4465/00. Support remains 1.4095/00 (38.2% Fibonacci retracement of the USD October/January rise) and 1.40."
The German federal election result yielded the expected shift to the right—a win for the conservative CDU/CSU and gains for the far-right AfD, Scotiabank's Chief FX Strategist Shaun Osborne notes.
EUR firms modestly, falls back on election
"The CDU did not win a majority, however, and will need to forge a coalition—most likely with the out-going Social-Democrats and rely on support from other, smaller parties – to govern."
"Coalition talks may take some weeks, however. EURUSD rallied to retest the low 1.05 area but resistance around 1.0530 capped gains again, keeping the near-term outlook for spot more or less flat."
The US Dollar (USD) is little changed in quiet trade. Overnight price action saw the Euro (EUR) advance in response to the anticipated win for the center-right in Germany’s federal election but the result was largely as expected, Scotiabank's Chief FX Strategist Shaun Osborne notes.
USD steady in quiet trade
"The JPY retains a firm tone, pushing the USD below the 150 line, while the GBP remains relatively firm in the low 1.26s. US equity futures are trading in the green, reversing Friday’s hefty losses, but US markets have underperformed in recent weeks as investors await clarity in US tariff policy, allowing foreign markets—especially European—to forge ahead which may undermine demand for the USD to some extent."
"It’s a relatively quiet start to the week in terms of data reports and most attention will likely fall on Friday’s Personal Income and Spending plus the associated PCE deflator for January. The core PCE is expected to rise 0.3% in the month and 2.6% in the year, down slightly from December’s 2.8%."
"Slow progress on restoring price stability will underscore the Fed’s 'on hold' messaging. Better than expected data won’t change that outlook much. Higher than expected core PCE data might prompt markets to think a bit harder about how long the Fed pause will last, however."
12:00
Mexico 1st half-month Inflation down to 0.15% in February from previous 0.2%
12:00
Mexico 1st half-month Core Inflation: 0.27% (February) vs previous 0.28%
US Dollar (USD) is expected to trade in a sideways range between 7.2350 and 7.2650 vs Chinese Yuan (CNH). In the longer run, to continue to decline, USD must break and remain below 7.2300, UOB Group’s FX analysts Quek Ser Leang and Peter Chia note.
USD must break and remain below 7.2300 to continue to decline
24-HOUR VIEW: "After USD dropped sharply last Thursday, we indicated on Friday that 'the steep selloff seems excessive, and USD is unlikely to decline much further.' We expected USD to 'trade between 7.2300 and 7.2580.' USD subsequently traded sideways between 7.2339 and 7.2596, closing higher by 0.25% at 7.2540. Further sideways trading seems likely, probably between 7.2350 and 7.2650."
1-3 WEEKS VIEW: "We have expected USD to decline since early last week. After USD fell and almost reach our technical target of 7.2300 last Thursday (low has been 7.2314), we highlighted on Friday that 'while we continue to expect USD to decline, it must break and remain below 7.2300 before further weakness is likely.' There is no change in our view. On the upside, a breach of 7.2800 (no change in ‘strong resistance’ level from last Friday) would indicate that USD is not ready to break below 7.2300."
EUR/GBP continues to hover around the 0.8300 mark with an empty domestic macro calendar for the week ahead, Danske Bank's FX analyst Jens Nærvig Pedersen reports.
UK economy remains stalled
"The UK preliminary PMIs for February came in to the weak side with composite at 50.5 (cons: 50.6, prior: 50.6), services at 51.1 (cons: 50.8, prior: 50.8) and manufacturing at 46.4 (cons: 48.5, prior: 48.3). On employment, January showed the sharpest decline in private sector wage growth since 2020 due to weak demand and rising payrolls costs."
"Price pressures remain elevated due to high wage growth and the impending increase in employers' national insurance contribution (NIC). Following a stagnation in the second half of 2024, the UK economy remains stalled according to the PMI release."
"While a rise in the minimum wage in April will be a supportive combined with easier monetary policy, the rise in employers' NIC remains a risk for the labour market and by extension, growth. This week, keep an eye out for a number of BoE speakers out on the wire."
Room for US Dollar (USD) to retest the 148.90 level vs Japanese Yen (JPY) before stabilisation is likely; significant support at 148.63 is unlikely to come into view. In the longer run, USD is likely to decline further; the significant support at 148.63 may not come into view so soon, UOB Group’s FX analysts Quek Ser Leang and Peter Chia note.
USD is likely to decline further
24-HOUR VIEW: "Following the steep drop in USD last Thursday, we indicated on Friday that 'the outsized decline appears to be overdone, and USD is unlikely to decline much further.' We expected USD to 'trade in a 149.20/150.55 range.' We did not anticipate the volatile price action as USD rose to 150.73 and then plummeted to a low of 148.90 before recovering to close lower by 0.23% at 149.29. While the decline still appears to be overdone, there is room for USD to retest the 148.90 before stabilisation is likely. The significant support level at 148.63 is unlikely to come into view. Resistance is at 149.75, followed by 150.10."
1-3 WEEKS VIEW: "Last Friday (21 Feb, spot at 149.60), we indicated that 'while USD is likely to decline further, short-term conditions are deeply oversold, and the significant support at 148.63 may not come into view so soon.' While USD subsequently plummeted to a low of 148.90, short-term conditions remain deeply oversold, and we continue to hold the same view. On the upside, should USD break above 151.05 (‘strong resistance’ level was at 151.80 last Friday), it would suggest that the weakness in USD from early last week has stabilised."
Gold price pops near 0.50% in the early European session on Monday.
Although the Far-Right AfD has gained 20% of votes, the CDU has booked a comfortable lead.
US Dollar Index drops, opening room for Gold to tick higher.
Gold’s price (XAU/USD) edges higher and trades near $2,945 at the time of writing on Monday due to a weaker US Dollar (USD) as a reaction to the recent German federal election outcome. Although the far-right party Alternative for Germany (AfD) has gained 20% of votes, the Christian Democratic Union of Germany (CDU) is comfortable in the lead with 208 seats against AfD’s 152. The Euro (EUR) jumped higher on the outcome, resulting in a weaker US Dollar, which coincided with XAU/USD higher.
Meanwhile, traders will watch the US Gross Domestic Product (GBP) release for the fourth quarter of 2024 later this week. Given the recent slowdown in US activity and economic data (for example, the softer Services Purchase Managers Index (PMI) reading on Friday), another drop in US yields could be triggered, with markets anticipating the Federal Reserve lowering its monetary policy rate to boost the economy and demand.
Daily digest market movers: On the table
Canada’s Equinox Gold Corporation sought to acquire Calibre Mining in a deal that would value the combined companies at $5.4 billion. This is the latest example of dealmaking as miners capitalize on record gold prices, Bloomberg reports.
The US dollar weakened after several reports and economic data points last week revealed that US business activity slowed and consumer confidence waned, with expectations for inflation surging and markets pricing in more rate cuts by the Federal Reserve this year, Bloomberg reports.
Conservative CDU leader Friedrich Merz emerged as the winner in Sunday’s German federal election. However, the results gave his Christian Democrat-led bloc just one clear path to power, facing intense pressure to quickly form a government. While the far-right AfD doubled support to become the second-strongest party with 20.8% of the votes, it fell short of a blocking minority on its own, the Financial Times reports.
Technical Analysis: Back up again
Traders must be getting headaches from these constant whipsaw moves. With more and more banks calling for the $3,000 mark, the risk is building that the Gold price might not actually reach it. A similar story was seen in the Euro against the US Dollar (EUR/USD), where at one point this year all banks called for parity, though the pair never got there and instead moved higher.
For this Monday, the all-time high at $2,955 remains the main level to watch. On the way up, the daily R1 resistance at $2,951 precedes. Further up, meaning that there will be a new all-time high, the R2 resistance stands at $2,967.
On the downside, support levels are plentiful, with the daily Pivot Point at $2,934. Further down, the S1 support comes in at $2,918, which roughly coincides with Friday’s low. In case that level does not hold, the $2,900 big figure comes into play with the S2 support at $2,901.
XAU/USD: Daily Chart
Gold FAQs
Gold has played a key role in human’s history as it has been widely used as a store of value and medium of exchange. Currently, apart from its shine and usage for jewelry, the precious metal is widely seen as a safe-haven asset, meaning that it is considered a good investment during turbulent times. Gold is also widely seen as a hedge against inflation and against depreciating currencies as it doesn’t rely on any specific issuer or government.
Central banks are the biggest Gold holders. In their aim to support their currencies in turbulent times, central banks tend to diversify their reserves and buy Gold to improve the perceived strength of the economy and the currency. High Gold reserves can be a source of trust for a country’s solvency. Central banks added 1,136 tonnes of Gold worth around $70 billion to their reserves in 2022, according to data from the World Gold Council. This is the highest yearly purchase since records began. Central banks from emerging economies such as China, India and Turkey are quickly increasing their Gold reserves.
Gold has an inverse correlation with the US Dollar and US Treasuries, which are both major reserve and safe-haven assets. When the Dollar depreciates, Gold tends to rise, enabling investors and central banks to diversify their assets in turbulent times. Gold is also inversely correlated with risk assets. A rally in the stock market tends to weaken Gold price, while sell-offs in riskier markets tend to favor the precious metal.
The price can move due to a wide range of factors. Geopolitical instability or fears of a deep recession can quickly make Gold price escalate due to its safe-haven status. As a yield-less asset, Gold tends to rise with lower interest rates, while higher cost of money usually weighs down on the yellow metal. Still, most moves depend on how the US Dollar (USD) behaves as the asset is priced in dollars (XAU/USD). A strong Dollar tends to keep the price of Gold controlled, whereas a weaker Dollar is likely to push Gold prices up.
USD/CAD bounces back after a strong recovery in the US Dollar.
Investors shrug off weak US flash S&P Global PMI data for February.
Investors turn cautious about the Canadian Dollar (CAD) outlook as President Trump reviews 25% tariffs on Canada.
The USD/CAD pair rebounds to near 1.4220 in European trading hours on Monday after sliding to near 1.4180 earlier in the day. The Loonie pair recovers as the US Dollar (USD) recovers almost its entire losses, with the US Dollar Index (DXY) bounces back to near 106.60.
The USD Index gains as investors digest weak United States (US) flash S&P Global Services PMI data for February, which showed that activities in the services sector surprisingly contracted for the first time in 25 months.
Meanwhile, fears of 25% tariffs on Canada by US President Donald Trump looms large. President Trump postponed his plans of imposing 25% tariffs on Canada and Mexico by one month on February 4 after both nations agreed to cooperate for criminal enforcement at borders.
On the monetary policy front, Bank of Canada (BoC) Governor Tiff Macklem warned in a speech in Ontario on Friday that the economic impact would be severe if Trump slaps tariffs on all imports from Canada.
USD/CAD trades in a Descending Triangle chart pattern formed on an hourly timeframe. The downward-sloping border of the above-mentioned chart pattern is plotted from the February 9 high of 1.4380 and the flat border is placed from the February 14 low of 1.4151.
The 20-period Exponential Moving Average (EMA) overlaps the Loonie price, suggesting a sideways trend.
The 14-period Relative Strength Index (RSI) trades inside the 40.00-60.00 range, which indicates indecisiveness among investors.
The pair has remained in a downtrend since the first trading day of February and could see more downside if it breaks below the February 14 low of 1.4151 and moves towards the December 9 low of 1.4094, followed by the December 6 low of 1.4020.
On the contrary, an upside move above the February 19 high of 1.4246 will open the door toward the round-level resistance of 1.4300 and the February 9 high of 1.4380.
USD/CAD hourly chart
Canadian Dollar FAQs
The key factors driving the Canadian Dollar (CAD) are the level of interest rates set by the Bank of Canada (BoC), the price of Oil, Canada’s largest export, the health of its economy, inflation and the Trade Balance, which is the difference between the value of Canada’s exports versus its imports. Other factors include market sentiment – whether investors are taking on more risky assets (risk-on) or seeking safe-havens (risk-off) – with risk-on being CAD-positive. As its largest trading partner, the health of the US economy is also a key factor influencing the Canadian Dollar.
The Bank of Canada (BoC) has a significant influence on the Canadian Dollar by setting the level of interest rates that banks can lend to one another. This influences the level of interest rates for everyone. The main goal of the BoC is to maintain inflation at 1-3% by adjusting interest rates up or down. Relatively higher interest rates tend to be positive for the CAD. The Bank of Canada can also use quantitative easing and tightening to influence credit conditions, with the former CAD-negative and the latter CAD-positive.
The price of Oil is a key factor impacting the value of the Canadian Dollar. Petroleum is Canada’s biggest export, so Oil price tends to have an immediate impact on the CAD value. Generally, if Oil price rises CAD also goes up, as aggregate demand for the currency increases. The opposite is the case if the price of Oil falls. Higher Oil prices also tend to result in a greater likelihood of a positive Trade Balance, which is also supportive of the CAD.
While inflation had always traditionally been thought of as a negative factor for a currency since it lowers the value of money, the opposite has actually been the case in modern times with the relaxation of cross-border capital controls. Higher inflation tends to lead central banks to put up interest rates which attracts more capital inflows from global investors seeking a lucrative place to keep their money. This increases demand for the local currency, which in Canada’s case is the Canadian Dollar.
Macroeconomic data releases gauge the health of the economy and can have an impact on the Canadian Dollar. Indicators such as GDP, Manufacturing and Services PMIs, employment, and consumer sentiment surveys can all influence the direction of the CAD. A strong economy is good for the Canadian Dollar. Not only does it attract more foreign investment but it may encourage the Bank of Canada to put up interest rates, leading to a stronger currency. If economic data is weak, however, the CAD is likely to fall.
NZD/USD edge up a little before paring back gains, BBH's FX analysts report.
RBNZ to make the pace of easing more gradual
"New Zealand Q4 retail sales data was stronger than anticipated. The total volume of retail sales increased 0.9% q/q (consensus: 0.5%) vs. 0% in Q3 (revised up from -0.1%), with growth across most industries."
"The data supports the RBNZ’s guidance for a more gradual pace of easing. The RBNZ has penciled-in another 75bps of easing over the next 12 months that would see the policy rate bottom at 3.00%. This seems about right."
The UK published on Friday data showing a net public sector surplus of £15.4bn in January, which fell short of the £20bn estimated by the Office for Budget Responsibility in October alongside the Budget, ING’s FX analysts Francesco Pesole notes.
GBP to return below 1.25 in GBP/USD in March
"That further raises the probability that Chancellor Rachel Reeves will need to scale back spending if she wants to avoid hiking taxes in her Spring Statement on 26 March. Remember that the fiscal headroom originally expected last autumn has been eroded by the rise in gilt yields."
"We think sterling is going to suffer from the March Budget event, also as the Bank of England could see lower spending as a reason to unlock more cuts in line with the recent dovish shift in the MPC. While sterling is not as directly exposed to US tariffs as the euro, we expect the impact of upcoming broad-based US protectionist measures to weigh on all European currencies vis-à-vis the dollar. We expect a return below 1.25 in GBP/USD in March."
"This week, the UK data calendar is empty, so all the domestic focus will be on BoE speakers. We’ll hear from two doves today – Swati Dhingra and Dave Ramsden. Tomorrow, we'll hear from Chief Economist Huw Pill."
New Zealand Dollar (NZD) is likely to trade sideways between 0.5735 and 0.5770. In the longer run, boost in momentum suggests the major resistance at 0.5790 is back in sight, UOB Group’s FX analysts Quek Ser Leang and Peter Chia note.
Major resistance at 0.5790 is back in sight
24-HOUR VIEW: "Last Thursday, NZD surged by 1.02% (0.5763). On Friday, we pointed out that 'the sharp and swift rise appears overdone, and while there is scope for NZD to rise further, it is unlikely to reach 0.5790.' NZD subsequently rose to 0.5772 and then eased off. The current price action is likely part of a sideways trading phase, probably between 0.5735 and 0.5770."
1-3 WEEKS VIEW: "Our update from last Friday (21 Feb, spot at 0.5760) remains valid. As indicated, 'the boost in upward momentum suggests the major resistance level is back in sight.' Overall, only a breach of 0.5715 (no change in ‘strong support’ level) would mean that the advance from the middle of the month has ended."
A slew of soft data and renewed expectations that US President Donald Trump's tariffs will only be a short-lived transactional measure hurt the dollar last week. The direction of US protectionism will be the main driver beyond the short term, and we should see the discussion on Mexico and Canada tariffs return to centre stage as the deadline for the delayed tariffs is a week away. Canada is already disproportionately affected by US metals tariffs, and our working assumption is that Trump won't go ahead with 25% tariffs on his neighbours. However, a series of hawkish comments from Trump followed by a last-minute deal would be a familiar script, ING’s FX analysts Francesco Pesole notes.
Upside risks to DXY beyond very short-term swings
"The dollar has become more sensitive to US data (also non tier-one), and there are a few market moving releases in this week’s calendar. Today, the Chicago and Dallas Fed indices should be overlooked, but tomorrow’s Conference Board consumer sentiment indicator is key. We have seen indications – from both data and corporate earnings guidance – that the consumption story has deteriorated at the start of 2025."
"We doubt we’ll see one-way-traffic on the dollar this week. Markets are keen to close dollar longs on the back of softening US data, and a residual negative correction is still owed by the dollar should Russia and Ukraine agree on a peace deal. Yesterday, Ukrainian President Volodymyr Zelensky offered to step down in exchange for peace and NATO membership. At the same time, the looming Canada and Mexico tariff deadline and a 0.3% MoM core PCE can support the greenback."
"There are many irons in the fire, and markets don’t have the privilege of looking much beyond daily developments. We have a flat bias for the dollar today as the rebounding momentum from Friday has been tampered by a market-friendly German election result. We continue to see upside risks to DXY beyond very short-term swings."
The Oil price aims for a firm footing above $70.00 after a significant fall on Friday.
Russia-Ukraine peace would increase the flow of global oil supply, which would weaken its price.
The OPEC is planning to postpone its planned monthly supply increase.
West Texas Intermediate (WTI), futures on NYMEX, bounces to near $70.44 in Monday’s European session after posting an over seven-week low around $70.00 on Friday. The outlook of the Oil price remains uncertain as investors seek more development in Russia-Unites States (US) talks for ending the war in Ukraine, which entered its fourth year on Monday.
Last week, the US agreed to hold more talks with Russia after having long discussions on a truce with Ukraine in Riyadh, without having Ukraine and the European Union (EU) on the table. The US government also said that President Donald Trump is expected to meet Russian leader Vladimir Putin by this month. Over that Ukrainian leader Volodymyr Zelenskiy clarified that any agreement without their consent won’t be acceptable.
Meanwhile, President Trump has accused the Ukrainian leader of starting the war. On that, Zelenskyy has said that he is willing to step down if Ukraine gets NATO membership.
More positive developments in Russia-US peace talks would be an unfavorable scenario for the Oil price. Europe and the US are expected to revoke their sanctions on Russia if it calls of war in Ukraine. Such a scenario would lead to an increase in the seaborne oil flows.
Meanwhile, investors will also focus on OPEC’s decision about whether it will increase its monthly supply, which are expected in April. Last week, Bloomberg reported that the OPEC is planning to delay its planned monthly supply increase.
Brent Crude Oil FAQs
Brent Crude Oil is a type of Crude Oil found in the North Sea that is used as a benchmark for international Oil prices. It is considered ‘light’ and ‘sweet’ because of its high gravity and low sulfur content, making it easier to refine into gasoline and other high-value products. Brent Crude Oil serves as a reference price for approximately two-thirds of the world's internationally traded Oil supplies. Its popularity rests on its availability and stability: the North Sea region has well-established infrastructure for Oil production and transportation, ensuring a reliable and consistent supply.
Like all assets supply and demand are the key drivers of Brent Crude Oil price. As such, global growth can be a driver of increased demand and vice versa for weak global growth. Political instability, wars, and sanctions can disrupt supply and impact prices. The decisions of OPEC, a group of major Oil-producing countries, is another key driver of price. The value of the US Dollar influences the price of Brent Crude Oil, since Oil is predominantly traded in US Dollars, thus a weaker US Dollar can make Oil more affordable and vice versa.
The weekly Oil inventory reports published by the American Petroleum Institute (API) and the Energy Information Agency (EIA) impact the price of Brent Crude Oil. Changes in inventories reflect fluctuating supply and demand. If the data shows a drop in inventories it can indicate increased demand, pushing up Oil price. Higher inventories can reflect increased supply, pushing down prices. API’s report is published every Tuesday and EIA’s the day after. Their results are usually similar, falling within 1% of each other 75% of the time. The EIA data is considered more reliable, since it is a government agency.
OPEC (Organization of the Petroleum Exporting Countries) is a group of 12 Oil producing nations who collectively decide production quotas for member countries at twice-yearly meetings. Their decisions often impact Brent Crude Oil prices. When OPEC decides to lower quotas, it can tighten supply, pushing up Oil prices. When OPEC increases production, it has the opposite effect. OPEC+ refers to an expanded group that includes ten extra non-OPEC members, the most notable of which is Russia.
Australian Dollar (AUD) is expected to trade in 0.6355/0.6400 range. In the longer run, AUD could advance further, potentially reaching 0.6455, UOB Group’s FX analysts Quek Ser Leang and Peter Chia note.
AUD can advance further, potentially reaching 0.6455
24-HOUR VIEW: "When AUD was at 0.6400 last Friday, we indicated that 'there is room for AUD to advance to 0.6425 before levelling off'. We also indicated that 'the major resistance at 0.6455 is likely out of reach for now.' AUD rose less than expected, pulling back after reaching 0.6409. The pullback appears corrective, and AUD is unlikely to weaken much further. Today, we expect AUD to trade in a 0.6355/0.6400 range."
1-3 WEEKS VIEW: "We have held a positive AUD view since early this month. Tracking the advance, we highlighted last Friday (21 Feb, spot at 0.6400) that AUD 'could advance further, potentially reaching 0.6455.' While upward momentum has eased somewhat with the pullback to 0.6352, only a breach of 0.6345 would suggest that AUD is not ready to advance to 0.6455."
London cocoa came under additional pressure on Friday, with the front-month contract falling more than 7.6% to settle at a little over GBP7,300/t, ING’s commodity analysts Warren Patterson and Ewa Manthey notes.
Prices remain historically high
"This is the lowest level since November. However, prices remain historically high, raising concerns over demand destruction. Given the tightness in the cocoa market, demand destruction may help return some balance to the market. Prices are likely to continue trading in a volatile manner."
"Weekly positioning data from the CFTC show money managers trimmed their net short position in wheat by 21,232 lots to 61,577 lots as of 18 February. The move was mostly driven by short covering, with gross shorts decreasing by 26,733 lots to 132,334 lots. As for corn, managed money net longs rose by 21,144 lots to 353,533 lots over the last reporting week."
EUR/USD briefly challenged lows of January but has quickly rebounded after forming an important low near 1.0140, Societe Generale's FX analysts report.
Above 1.0630, EUR can continue moving upwards
"It has gradually established itself above 50-DMA denoting regain of upward momentum. The pair is now probing the upper limit of a multi-month base. The MA at 1.0400/1.0385 is near term support. Defence of this can lead to persistence in bounce towards projections of 1.0580 and December high of 1.0630. Overcoming this hurdle could result in a larger up move."
EUR/USD surrenders most of its initial gains as the US Dollar bounces back.
Market participants worry that potential German coalition government formation will unlikely uplift the economy.
Weak US private business activity data weighed on the US Dollar.
EUR/USD gives up most of its intraday gains after revisiting the one-month high near 1.0530 in Monday’s European session. The major currency pair surrenders significant gains as the Euro (EUR) weakens in the aftermath of the German federal election, with the absence of a clear majority by a single party that would hinder growth in the already fractured economy.
Christian Democratic Union of Germany (CDU) leader Friedrich Merz is set to become the German Chancellor after getting majority votes but is expected to face a slew of difficulties, including complicated negotiations to form a coalition government. The most likely scenario seems to be a coalition between the CDU and the Social Democratic Party of Germany (SPD).
Analysts at ING expect the next German government is unlikely to deliver much more for the economy than a “short-lived positive impact from some tax cuts, small reforms, and a bit more investment.”
The broader outlook for the Euro remains weak as European Central Bank (ECB) officials continue to support a consistent policy easing cycle. On Saturday, ECB policymaker and Governor of the Bank of France François Villeroy de Galhau said in an interview with Alternatives Economiques that the central bank could cut its deposit rate down to 2% by this summer. His comments came a day after the release of the Eurozone flash HCOB Purchasing Managers Index (PMI) data for February on Friday.
The preliminary PMI report showed on Friday that the Eurozone Composite PMI remained unchanged at 50.2, slower than estimates of 50.5. Additionally, overall business activity in France contracted at a faster-than-expected pace.
On the economic front on Monday, German IFO data for February has majorly come in weaker than expected. The IFO Business Climate, which measures current conditions and business expectations, came in at 85.2, as in January, lower than estimates of 85.8. On the contrary, IFO Expectations - which gauges current conditions and business expectations for the next six months - improved to 85.4 from estimates of 85.2 and the former reading of 84.3.
Daily digest market movers: EUR/USD retreats as US Dollar recovers strongly
The downside move in the EUR/USD pair is also driven by a strong US Dollar (USD) recovery, with investors looking beyond the weak United States (US) flash S&P Global PMI data for February.
The US Dollar Index (DXY), which tracks the Greenback’s value against six major currencies, rebounds to near 106.40 after posting a fresh 11-week low around 106.10 earlier in the day.
The US S&P Global PMI report showed on Friday that overall private business activity rose at a slower pace. The Composite PMI, which gauges activities in both manufacturing and the services sector, fell to 50.4. This is the lowest reading since September 2023.
A notable decline in the services sector activities led to a significant slowdown in the comprehensive business activity data. The Services PMI surprisingly declined to 49.7 from 52.9 in January due to political uncertainty, notably in relation to federal spending cuts and potential policy impacts on economic growth and inflation outlooks, according to the PMI report. Contrary to a decline in activities in the services sector, the Manufacturing PMI expanded at a faster-than-expected pace to 51.6.
Weak US PMI data has led to a decent increase in Federal Reserve (Fed) dovish bets. The likelihood that the Fed will cut interest rates in the June meeting has increased to 63.5% from almost 50% recorded a week ago.
Meanwhile, fears of global slowdown due to US President Donald Trump’s tariff agenda have supported the US Dollar. Trump has threatened to introduce reciprocal tariffs and levies on lumber and forest products, semiconductors, pharmaceuticals, and automobiles.
Technical Analysis: EUR/USD falls back from 1.0530
EUR/USD retreats from an intraday high of 1.0530 to near 1.0480 in European trading hours on Monday. The 50-day Exponential Moving Average (EMA) continues to offer support to the major currency pair at around 1.0437.
The 14-day Relative Strength Index (RSI) wobbles around 60.00. A bullish momentum would activate if the RSI (14) sustains above that level.
Looking down, the February 10 low of 1.0285 will act as the major support zone for the pair. Conversely, the December 6 high of 1.0630 will be the key barrier for the Euro bulls.
Euro FAQs
The Euro is the currency for the 19 European Union countries that belong to the Eurozone. It is the second most heavily traded currency in the world behind the US Dollar. In 2022, it accounted for 31% of all foreign exchange transactions, with an average daily turnover of over $2.2 trillion a day. EUR/USD is the most heavily traded currency pair in the world, accounting for an estimated 30% off all transactions, followed by EUR/JPY (4%), EUR/GBP (3%) and EUR/AUD (2%).
The European Central Bank (ECB) in Frankfurt, Germany, is the reserve bank for the Eurozone. The ECB sets interest rates and manages monetary policy. The ECB’s primary mandate is to maintain price stability, which means either controlling inflation or stimulating growth. Its primary tool is the raising or lowering of interest rates. Relatively high interest rates – or the expectation of higher rates – will usually benefit the Euro and vice versa. The ECB Governing Council makes monetary policy decisions at meetings held eight times a year. Decisions are made by heads of the Eurozone national banks and six permanent members, including the President of the ECB, Christine Lagarde.
Eurozone inflation data, measured by the Harmonized Index of Consumer Prices (HICP), is an important econometric for the Euro. If inflation rises more than expected, especially if above the ECB’s 2% target, it obliges the ECB to raise interest rates to bring it back under control. Relatively high interest rates compared to its counterparts will usually benefit the Euro, as it makes the region more attractive as a place for global investors to park their money.
Data releases gauge the health of the economy and can impact on the Euro. Indicators such as GDP, Manufacturing and Services PMIs, employment, and consumer sentiment surveys can all influence the direction of the single currency. A strong economy is good for the Euro. Not only does it attract more foreign investment but it may encourage the ECB to put up interest rates, which will directly strengthen the Euro. Otherwise, if economic data is weak, the Euro is likely to fall. Economic data for the four largest economies in the euro area (Germany, France, Italy and Spain) are especially significant, as they account for 75% of the Eurozone’s economy.
Another significant data release for the Euro is the Trade Balance. This indicator measures the difference between what a country earns from its exports and what it spends on imports over a given period. If a country produces highly sought after exports then its currency will gain in value purely from the extra demand created from foreign buyers seeking to purchase these goods. Therefore, a positive net Trade Balance strengthens a currency and vice versa for a negative balance.
10:00
Eurozone Core Harmonized Index of Consumer Prices (MoM) rose from previous -1% to -0.9% in January
10:00
Eurozone Harmonized Index of Consumer Prices (MoM) meets expectations (-0.3%) in January
10:00
Eurozone Harmonized Index of Consumer Prices (YoY) meets forecasts (2.5%) in January
10:00
Eurozone Core Harmonized Index of Consumer Prices (YoY) meets forecasts (2.7%) in January
Pound Sterling (GBP) is likely to trade in a range between 1.2625 and 1.2680. In the longer run, boost in momentum indicates further GBP strength to 1.2730, UOB Group’s FX analysts Quek Ser Leang and Peter Chia note.
Boost in momentum indicates further GBP strength
24-HOUR VIEW: "Last Thursday, GBP soared and rose to a high of 1.2671. On Friday, we indicated that 'although the rapid rise is deeply overbought, the current impulsive momentum could continue to push GBP higher.' Our expectation did not materialise as GBP eased off to close at 1.2636 (-0.25%). We view the current price movements as part of a range trading phase, probably between 1.2625 and 1.2680."
1-3 WEEKS VIEW: "We continue to hold the same view as last Friday (21 Feb, spot at 1.2670). As highlighted, following the sharp rise last Thursday, 'the boost in momentum indicates further GBP strength to 1.2730.' On the downside, a breach of 1.2580 (no change in ‘strong support’ level from last Friday) would mean that the GBP strength from the middle of the month (as annotated in the chart below) has ended."
Oil prices sold off heavily on Friday, with ICE Brent settling 2.68% lower on the day and WTI briefly trading below US$70/bbl this morning for the first time this year, ING’s commodity analysts Warren Patterson and Ewa Manthey notes.
President Trump is calling on OPEC+ to increase supply
"Recent weakness in prices comes amid intensifying noise about where OPEC+ will take supply levels. The group is currently cutting supply by 2.2m b/d. It’s scheduled to bring this supply back onto the market gradually from April. However, there are suggestions that OPEC+ is considering a delay."
"Any delay would lead to a change in the oil balance, leaving the market relatively tighter than we expected. Any delay would also likely not go down well with President Trump, who’s calling on OPEC+ to increase supply."
"The latest positioning data suggests market sentiment turning negative, with speculators cutting positions in ICE Brent by 23,931 lots. This left them with a net long of 265,223 lots as of last Tuesday. Driving the move is a combination of longs being liquidating and fresh shorts entering the market. Trade and tariff concerns, along with a push for a peace deal between Russia and Ukraine, will weigh somewhat on the market."
The German election results were broadly in line with opinion polls. The CDU/CSU is the leading party with 29%, followed by the far-right AfD at 21% and the SPD at 16%. While the CDU/CSU fared slightly worse than expected and the AfD’s growing popularity was confirmed by the vote, incoming chancellor Friedrich Merz will benefit from two parties (the left-wing populist BSW and centre-right FDP) falling short of the 5% threshold to enter the parliament, meaning a CDU/CSU-SPD coalition would have a parliamentary majority, ING’s FX analysts Francesco Pesole notes.
EUR to return below 1.04 over the next four weeks
"The euro has reacted positively to the result as the rise of the AfD was largely in line with expectations and a two-party government is deemed more stable given the unsuccessful three-party experience of the outgoing government."
"The period of coalition talks starts now and we could see some residual euro sensitivity to the topic, especially for everything concerning the debt rule. That said, we see a high chance German politics will move back to being a small secondary factor for FX and EUR/USD will be driven primarily by US tariffs and US-Russia-Ukraine peace talks."
"We remain reluctant to chase EUR/USD beyond 1.050 as a general rule, given the looming risk of US tariffs on the EU and the European Central Bank's resolutely dovish stance. Ultimately, we expect to see a return below 1.04 over the next four weeks."
Silver prices (XAG/USD) broadly unchanged on Monday, according to FXStreet data. Silver trades at $32.57 per troy ounce, broadly unchanged 0.09% from the $32.54 it cost on Friday.
Silver prices have increased by 12.73% since the beginning of the year.
Unit measure
Silver Price Today in USD
Troy Ounce
32.57
1 Gram
1.05
The Gold/Silver ratio, which shows the number of ounces of Silver needed to equal the value of one ounce of Gold, stood at 90.45 on Monday, up from 90.19 on Friday.
Silver FAQs
Silver is a precious metal highly traded among investors. It has been historically used as a store of value and a medium of exchange. Although less popular than Gold, traders may turn to Silver to diversify their investment portfolio, for its intrinsic value or as a potential hedge during high-inflation periods. Investors can buy physical Silver, in coins or in bars, or trade it through vehicles such as Exchange Traded Funds, which track its price on international markets.
Silver prices can move due to a wide range of factors. Geopolitical instability or fears of a deep recession can make Silver price escalate due to its safe-haven status, although to a lesser extent than Gold's. As a yieldless asset, Silver tends to rise with lower interest rates. Its moves also depend on how the US Dollar (USD) behaves as the asset is priced in dollars (XAG/USD). A strong Dollar tends to keep the price of Silver at bay, whereas a weaker Dollar is likely to propel prices up. Other factors such as investment demand, mining supply – Silver is much more abundant than Gold – and recycling rates can also affect prices.
Silver is widely used in industry, particularly in sectors such as electronics or solar energy, as it has one of the highest electric conductivity of all metals – more than Copper and Gold. A surge in demand can increase prices, while a decline tends to lower them. Dynamics in the US, Chinese and Indian economies can also contribute to price swings: for the US and particularly China, their big industrial sectors use Silver in various processes; in India, consumers’ demand for the precious metal for jewellery also plays a key role in setting prices.
Silver prices tend to follow Gold's moves. When Gold prices rise, Silver typically follows suit, as their status as safe-haven assets is similar. The Gold/Silver ratio, which shows the number of ounces of Silver needed to equal the value of one ounce of Gold, may help to determine the relative valuation between both metals. Some investors may consider a high ratio as an indicator that Silver is undervalued, or Gold is overvalued. On the contrary, a low ratio might suggest that Gold is undervalued relative to Silver.
(An automation tool was used in creating this post.)
Euro (EUR) is expected to trade in a 1.0450/1.0505 range vs the US Dollar (USD). In the longer run, rejuvenated upward momentum suggests EUR could continue to advance; the levels to monitor are 1.0530 and 1.0560, UOB Group’s FX analysts Quek Ser Leang and Peter Chia note.
Levels to monitor are 1.0530 and 1.0560
24-HOUR VIEW: "After EUR soared last Thursday, we indicated on Friday, when EUR was at 1.0500, that 'while deeply overbought, the impulsive advance has room to extend to 1.0530.' We added, 'given the overbought conditions, a clear break above this level appears unlikely.' EUR rose less than expected to 1.0505 and then dropped from the high. The current price movements are likely part of a range trading phase. Expected range for today: 1.0450/1.0505."
1-3 WEEKS VIEW: "Last Friday (21 Feb, spot at 1.0500), we highlighted that 'the rejuvenated upward momentum suggests EUR could continue to advance.' We pointed out, 'there are a pair of major resistance levels at 1.0530 and 1.0560.' While we did not expect the sharp pullback, only a breach of 1.0425 (no change in ‘strong support’ level) will invalidate our view."
NZD/USD could target the two-month high at 0.5794.
The 14-day RSI stays above the 50 level, reinforcing the bullish sentiment.
The nine-day EMA at 0.5721 level appears as the immediate support.
The NZD/USD pair maintains its gains around 0.5750 during European trading hours on Monday. Technical analysis of the daily chart suggests a bullish market outlook, as the pair continues to trade within an ascending channel pattern.
The 14-day Relative Strength Index (RSI) remains above the 50 level, strengthening the bullish outlook. Moreover, the NZD/USD pair stays positioned above the nine- and 14-day Exponential Moving Averages (EMAs), indicating robust short-term momentum.
On the upside, the NZD/USD pair could target the two-month high at 0.5794, reached on January 24, followed by the upper boundary of the ascending channel at the 0.5810 level. A break above this critical resistance zone could reinforce the bullish bias and lead the pair to approach the three-month high at 0.5922, last seen on December 3.
The NZD/USD pair could find immediate support at the nine-day EMA at 0.5721, followed by a 14-day EMA at 0.5707 level. Further support region appears at the ascending channel’s lower boundary at 0.5700 level.
A break below the channel would weaken the bullish bias and put downward pressure on the NZD/USD pair to navigate the region around 0.5516, its lowest point since October 2022, recorded on February 3.
NZD/USD: Daily Chart
New Zealand Dollar PRICE Today
The table below shows the percentage change of New Zealand Dollar (NZD) against listed major currencies today. New Zealand Dollar was the strongest against the Japanese Yen.
USD
EUR
GBP
JPY
CAD
AUD
NZD
CHF
USD
-0.17%
-0.16%
0.19%
-0.15%
-0.22%
-0.16%
-0.03%
EUR
0.17%
-0.08%
0.17%
-0.17%
-0.07%
-0.18%
-0.04%
GBP
0.16%
0.08%
0.32%
-0.09%
0.01%
-0.10%
0.05%
JPY
-0.19%
-0.17%
-0.32%
-0.34%
-0.33%
-0.28%
-0.13%
CAD
0.15%
0.17%
0.09%
0.34%
-0.12%
-0.01%
0.14%
AUD
0.22%
0.07%
-0.01%
0.33%
0.12%
-0.11%
0.04%
NZD
0.16%
0.18%
0.10%
0.28%
0.01%
0.11%
0.15%
CHF
0.03%
0.04%
-0.05%
0.13%
-0.14%
-0.04%
-0.15%
The heat map shows percentage changes of major currencies against each other. The base currency is picked from the left column, while the quote currency is picked from the top row. For example, if you pick the New Zealand Dollar from the left column and move along the horizontal line to the US Dollar, the percentage change displayed in the box will represent NZD (base)/USD (quote).
German IFO Business Climate Index misses estimates with 85.2 in February.
The IFO Current Economic Assessment Index fell to 85 in the reported month.
The headline German IFO Business Climate Index ticked a tad higher to 85.2 in February from 85.1 in January. The data came in below the market expectations of 85.8.
Meanwhile, the Current Economic Assessment Index dropped to 85 in the same period from 86.1 in January, missing the expected 86.5 reading.
The IFO Expectations Index, which indicates firms’ projections for the next six months, rose to 85.4 in February vs. 84.2 in January and 85.2 forecast.
Market reaction to the German IFO Survey
EUR/USD defend mild gains near 1.0480 following the mixed German IFO survey. When writing, the pair is trading 0.23% higher on the day.
09:01
Germany IFO – Current Assessment below forecasts (86.5) in February: Actual (85)
09:01
Germany IFO – Expectations above expectations (85.2) in February: Actual (85.4)
09:00
Germany IFO – Business Climate below forecasts (85.8) in February: Actual (85.2)
Silver price holds firm as the US Dollar weakens following disappointing US economic data.
President Trump signed a memorandum restricting Chinese investments in strategic US sectors.
Russian and US delegations are set to meet this week to discuss improving bilateral relations.
Silver price (XAG/USD) edges higher after registering gains in the previous session, trading around $32.60 during the European hours on Monday. The dollar-denominated Silver attracts buyers as the US Dollar (USD) weakens following the downbeat US economic data including Jobless Claims and S&P Global Purchasing Managers' Index (PMI) released last week.
The US Composite PMI fell to 50.4 in February, down from 52.7 in the previous month. In contrast, the Manufacturing PMI rose to 51.6 in February from 51.2 in January, surpassing the forecast of 51.5. Meanwhile, the Services PMI declined to 49.7 in February from 52.9 in January, falling short of the expected 53.0. US Initial Jobless Claims for the week ending February 14 rose to 219,000, exceeding the expected 215,000.
The safe-haven Silver receives support from ongoing trade and geopolitical uncertainties. Last week, US President Donald Trump threatened to impose tariffs on key sectors, including cars, semiconductors, pharmaceuticals, and lumber, keeping markets on edge. Trump also signed a memorandum on Friday instructing the Committee on Foreign Investment in the United States (US) to limit Chinese investments in strategic sectors.
Meanwhile, traders remain focused on developments related to the ongoing conflict between Russia and Ukraine, which enters its fourth year on Monday. European Union leaders are expected to convene for an extraordinary summit on March 6 to discuss additional support for Ukraine and European security assurances. This follows US President Donald Trump’s initiative to engage Russia in talks aimed at ending the war, though notably without the involvement of Ukraine or the European Union. Additionally, a senior Russian diplomat indicated that Russian and US teams plan to meet this week to explore ways to improve bilateral relations.
In Germany, preliminary results confirm the win for the Christian Democratic Union (CDU) and its ally, the Christian Social Union (CSU), led by chancellor candidate Friedrich Merz. Market attention now shifts to the coalition-building process, with stable leadership seen as crucial for advancing key fiscal reforms.
Silver FAQs
Silver is a precious metal highly traded among investors. It has been historically used as a store of value and a medium of exchange. Although less popular than Gold, traders may turn to Silver to diversify their investment portfolio, for its intrinsic value or as a potential hedge during high-inflation periods. Investors can buy physical Silver, in coins or in bars, or trade it through vehicles such as Exchange Traded Funds, which track its price on international markets.
Silver prices can move due to a wide range of factors. Geopolitical instability or fears of a deep recession can make Silver price escalate due to its safe-haven status, although to a lesser extent than Gold's. As a yieldless asset, Silver tends to rise with lower interest rates. Its moves also depend on how the US Dollar (USD) behaves as the asset is priced in dollars (XAG/USD). A strong Dollar tends to keep the price of Silver at bay, whereas a weaker Dollar is likely to propel prices up. Other factors such as investment demand, mining supply – Silver is much more abundant than Gold – and recycling rates can also affect prices.
Silver is widely used in industry, particularly in sectors such as electronics or solar energy, as it has one of the highest electric conductivity of all metals – more than Copper and Gold. A surge in demand can increase prices, while a decline tends to lower them. Dynamics in the US, Chinese and Indian economies can also contribute to price swings: for the US and particularly China, their big industrial sectors use Silver in various processes; in India, consumers’ demand for the precious metal for jewellery also plays a key role in setting prices.
Silver prices tend to follow Gold's moves. When Gold prices rise, Silver typically follows suit, as their status as safe-haven assets is similar. The Gold/Silver ratio, which shows the number of ounces of Silver needed to equal the value of one ounce of Gold, may help to determine the relative valuation between both metals. Some investors may consider a high ratio as an indicator that Silver is undervalued, or Gold is overvalued. On the contrary, a low ratio might suggest that Gold is undervalued relative to Silver.
The Pound Sterling jumps to near 1.2700 against a weakened US Dollar after a sharp slowdown in US services sector data for February.
Traders expect the BoE to cut interest rates two times more this year.
This week, investors will focus on the US Durable Goods and PCE inflation data for January.
The Pound Sterling (GBP) gains sharply to near the key resistance of 1.2700 against the US Dollar (USD) in European trading hours on Monday. The GBP/USD pair trades firmly as the US Dollar underperforms its peers, except the Japanese Yen (JPY), due to weak Unites States (US) services sector activity data, which increased bets for an interest rate cut by the Federal Reserve (Fed) in June. The US Dollar Index (DXY), which tracks the Greenback’s value against six major currencies, declines to near 106.10, the lowest level in almost 12 weeks.
On Friday, the US preliminary S&P Global Purchasing Managers Index (PMI) report showed a significant slowdown in business activity in February. The Composite PMI rose at a slower pace to 50.4 from 52.7 in January as activities in the services sector declined unexpectedly. The Services PMI contracted to 49.7 from 52.9, falling below the 50 threshold for the first time in 25 months. Economists expected the service sector activity to have expanded at a slightly faster pace to 53.0.
Service providers commonly linked the downturn in activity and worsening new orders growth to political uncertainty, notably in relation to federal spending cuts and potential policy impacts on economic growth and inflation outlooks, according to the S&P Global PMI report.
According to the CME FedWatch tool, the probability of the Fed’s interest rates remaining unchanged at the current range of 4.25%- 4.50% is 41.1%, down from nearly 50% before the PMI release.
On the contrary, the Manufacturing PMI expanded faster than expected to 51.6 in February from estimates of 51.5 and the former reading of 51.2.
The business activity data indicates the positive impact of US President Donald Trump’s tariff agenda on the country’s manufacturing sector. Trump had already mentioned in his comments that tariffs on imports would boost production activities locally, fulfilling his agenda of making “America great again”.
This week, investors will focus on the US Durable Goods Orders and the Personal Consumption Expenditures Price Index (PCE) data for January, which will be released on Thursday and Friday, respectively.
Daily digest market movers: Pound Sterling gains as BoE seems to follow slower monetary easing cycle
The Pound Sterling outperforms its major peers at the start of the week as investors expect the Bank of England (BoE) to follow a moderate policy-easing cycle this year. Upbeat United Kingdom (UK) Retail Sales, hotter-than-expected Consumer Price Index (CPI) data for January, and strong wage growth momentum in three months ending December have forced traders to pare BoE dovish bets.
Traders expect the BoE to cut interest rates two more times this year, according to money market expectations. The BoE also reduced its key borrowing rates by 25 basis points (bps) to 4.5% in the policy meeting earlier this month.
Contrary to market expectations, analysts at TD Securities expect the BoE to cut interest rates four times more this year amid uncertainty over potential tariffs from a second Trump presidency. However, the agency has revised its forecast for the next interest rate cut to May from March due to recent stronger-than-expected UK economic data.
Going forward, speeches from BoE policymakers will influence the British currency. Clare Lombardelli, Swati Dhingra, and Deputy Governor Dave Ramsden are set to speak on Monday, and they could provide fresh cues about the monetary policy outlook.
On the economic data front, flash S&P Global/CIPS PMI data for February has come in line with estimates. The Composite PMI expanded at a slower pace to 50.5 from 50.6 in January. Activities in the manufacturing and services sectors contracted and expanded, respectively, at a surprisingly faster pace.
Technical Analysis: Pound Sterling rises to near 200-day EMA
The Pound Sterling gathers strength to extend its upside to near the 200-day Exponential Moving Average (EMA), which stands around 1.2680, against the US Dollar in Monday’s European session. The GBP/USD pair strengthened after breaking above the 38.2% Fibonacci retracement from the end-September high to the mid-January low downtrend around 1.2620.
The 14-day Relative Strength Index (RSI) holds above 60.00. The bullish momentum would strengthen if the RSI (14) sustains above that level.
Looking down, the February 11 low of 1.2333 will act as a key support zone for the pair. On the upside, the 50% and 61.8% Fibonacci retracement at 1.2770 and 1.2927, respectively, will act as key resistance zones.
Pound Sterling FAQs
The Pound Sterling (GBP) is the oldest currency in the world (886 AD) and the official currency of the United Kingdom. It is the fourth most traded unit for foreign exchange (FX) in the world, accounting for 12% of all transactions, averaging $630 billion a day, according to 2022 data. Its key trading pairs are GBP/USD, also known as ‘Cable’, which accounts for 11% of FX, GBP/JPY, or the ‘Dragon’ as it is known by traders (3%), and EUR/GBP (2%). The Pound Sterling is issued by the Bank of England (BoE).
The single most important factor influencing the value of the Pound Sterling is monetary policy decided by the Bank of England. The BoE bases its decisions on whether it has achieved its primary goal of “price stability” – a steady inflation rate of around 2%. Its primary tool for achieving this is the adjustment of interest rates. When inflation is too high, the BoE will try to rein it in by raising interest rates, making it more expensive for people and businesses to access credit. This is generally positive for GBP, as higher interest rates make the UK a more attractive place for global investors to park their money. When inflation falls too low it is a sign economic growth is slowing. In this scenario, the BoE will consider lowering interest rates to cheapen credit so businesses will borrow more to invest in growth-generating projects.
Data releases gauge the health of the economy and can impact the value of the Pound Sterling. Indicators such as GDP, Manufacturing and Services PMIs, and employment can all influence the direction of the GBP. A strong economy is good for Sterling. Not only does it attract more foreign investment but it may encourage the BoE to put up interest rates, which will directly strengthen GBP. Otherwise, if economic data is weak, the Pound Sterling is likely to fall.
Another significant data release for the Pound Sterling is the Trade Balance. This indicator measures the difference between what a country earns from its exports and what it spends on imports over a given period. If a country produces highly sought-after exports, its currency will benefit purely from the extra demand created from foreign buyers seeking to purchase these goods. Therefore, a positive net Trade Balance strengthens a currency and vice versa for a negative balance.
08:05
Austria HICP (MoM) in line with expectations (0.9%) in January
08:05
Austria HICP (YoY) below forecasts (3.5%) in January: Actual (3.4%)
EUR/GBP climbs as market sentiment improves after Germany’s conservative election victory.
Investors focus on the coalition-building process, with strong leadership viewed as essential for driving key fiscal reforms in Germany.
The Pound Sterling may find support as expectations for a Bank of England rate cut in March ease.
EUR/GBP gains as the Euro finds support following Germany’s conservative victory in the election, aligning with expectations. Preliminary results confirm the win for the Christian Democratic Union (CDU) and its ally, the Christian Social Union (CSU), led by chancellor candidate Friedrich Merz. The currency cross trades around 0.8300 during the early European hours on Monday.
Market attention now shifts to the coalition-building process, with stable leadership seen as crucial for advancing key fiscal reforms. This political outcome comes amid Germany’s economic stagnation, the ongoing conflict in Ukraine, and rising tariff threats from US President Donald Trump. A proposed reform of Germany’s debt brake, which has long hindered investment, is expected to further strengthen the Euro.
Meanwhile, European Central Bank (ECB) policymaker Pierre Wunsch told the Financial Times that while he isn’t advocating for an April pause, rate cuts shouldn’t happen automatically without proper consideration. ECB’s Francois Villeroy de Galhau also suggested the ECB could lower its deposit rate to 2% by summer, according to Reuters.
However, EUR/GBP’s upside may be limited as the Pound Sterling (GBP) draws support from strong UK Retail Sales data for January, reducing expectations of a Bank of England (BoE) rate cut in March. These expectations were already challenged by hotter-than-expected January inflation and robust Average Earnings data through December.
However, the British Pound could face challenges as the Bank of England (BoE) Governor Andrew Bailey remains concerned over economic prospects this year. Earlier this week, Bailey warned that the economic growth is expected to remain sluggish.
Interest rates FAQs
Interest rates are charged by financial institutions on loans to borrowers and are paid as interest to savers and depositors. They are influenced by base lending rates, which are set by central banks in response to changes in the economy. Central banks normally have a mandate to ensure price stability, which in most cases means targeting a core inflation rate of around 2%. If inflation falls below target the central bank may cut base lending rates, with a view to stimulating lending and boosting the economy. If inflation rises substantially above 2% it normally results in the central bank raising base lending rates in an attempt to lower inflation.
Higher interest rates generally help strengthen a country’s currency as they make it a more attractive place for global investors to park their money.
Higher interest rates overall weigh on the price of Gold because they increase the opportunity cost of holding Gold instead of investing in an interest-bearing asset or placing cash in the bank. If interest rates are high that usually pushes up the price of the US Dollar (USD), and since Gold is priced in Dollars, this has the effect of lowering the price of Gold.
The Fed funds rate is the overnight rate at which US banks lend to each other. It is the oft-quoted headline rate set by the Federal Reserve at its FOMC meetings. It is set as a range, for example 4.75%-5.00%, though the upper limit (in that case 5.00%) is the quoted figure. Market expectations for future Fed funds rate are tracked by the CME FedWatch tool, which shapes how many financial markets behave in anticipation of future Federal Reserve monetary policy decisions.
West Texas Intermediate (WTI) Oil price advances on Monday, according to FXStreet data. WTI trades at $70.30 per barrel, up from Friday’s close at $70.18. Brent Oil Exchange Rate (Brent crude) is also up, advancing from the $73.87 price posted on Friday, and trading at $74.06.
WTI Oil FAQs
WTI Oil is a type of Crude Oil sold on international markets. The WTI stands for West Texas Intermediate, one of three major types including Brent and Dubai Crude. WTI is also referred to as “light” and “sweet” because of its relatively low gravity and sulfur content respectively. It is considered a high quality Oil that is easily refined. It is sourced in the United States and distributed via the Cushing hub, which is considered “The Pipeline Crossroads of the World”. It is a benchmark for the Oil market and WTI price is frequently quoted in the media.
Like all assets, supply and demand are the key drivers of WTI Oil price. As such, global growth can be a driver of increased demand and vice versa for weak global growth. Political instability, wars, and sanctions can disrupt supply and impact prices. The decisions of OPEC, a group of major Oil-producing countries, is another key driver of price. The value of the US Dollar influences the price of WTI Crude Oil, since Oil is predominantly traded in US Dollars, thus a weaker US Dollar can make Oil more affordable and vice versa.
The weekly Oil inventory reports published by the American Petroleum Institute (API) and the Energy Information Agency (EIA) impact the price of WTI Oil. Changes in inventories reflect fluctuating supply and demand. If the data shows a drop in inventories it can indicate increased demand, pushing up Oil price. Higher inventories can reflect increased supply, pushing down prices. API’s report is published every Tuesday and EIA’s the day after. Their results are usually similar, falling within 1% of each other 75% of the time. The EIA data is considered more reliable, since it is a government agency.
OPEC (Organization of the Petroleum Exporting Countries) is a group of 12 Oil-producing nations who collectively decide production quotas for member countries at twice-yearly meetings. Their decisions often impact WTI Oil prices. When OPEC decides to lower quotas, it can tighten supply, pushing up Oil prices. When OPEC increases production, it has the opposite effect. OPEC+ refers to an expanded group that includes ten extra non-OPEC members, the most notable of which is Russia.
(An automation tool was used in creating this post.)
07:30
Switzerland Employment Level (QoQ) increased to 5.534M in 4Q from previous 5.528M
Here is what you need to know on Monday, February 24:
The Euro (EUR) gathers strength against its rivals to begin the week as investors assess the results of the German election. Later in the session, IFO sentiment data from Germany will be featured in the European docket and Eurostat will publish revisions to the January inflation data. In the second half of the day, the Federal Reserve Bank of Chicago will release National Activity Index data for January.
Euro PRICE Today
The table below shows the percentage change of Euro (EUR) against listed major currencies today. Euro was the strongest against the Japanese Yen.
USD
EUR
GBP
JPY
CAD
AUD
NZD
CHF
USD
-0.44%
-0.23%
0.19%
-0.25%
-0.32%
-0.27%
-0.11%
EUR
0.44%
0.12%
0.46%
0.00%
0.11%
-0.02%
0.15%
GBP
0.23%
-0.12%
0.40%
-0.11%
-0.01%
-0.13%
0.02%
JPY
-0.19%
-0.46%
-0.40%
-0.44%
-0.42%
-0.38%
-0.22%
CAD
0.25%
-0.00%
0.11%
0.44%
-0.12%
-0.02%
0.14%
AUD
0.32%
-0.11%
0.00%
0.42%
0.12%
-0.13%
0.04%
NZD
0.27%
0.02%
0.13%
0.38%
0.02%
0.13%
0.16%
CHF
0.11%
-0.15%
-0.02%
0.22%
-0.14%
-0.04%
-0.16%
The heat map shows percentage changes of major currencies against each other. The base currency is picked from the left column, while the quote currency is picked from the top row. For example, if you pick the Euro from the left column and move along the horizontal line to the US Dollar, the percentage change displayed in the box will represent EUR (base)/USD (quote).
The CDU/CSU, led by Friedrich Merz, won the German election by securing about 28.6% of total votes. The far-right AfD came second with 20.8% and Olaf Scholz's SPD dropped to third with 16.4%. Following these results, a two-party coalition between CDU/CSU and SPD seem to be the mostly likely scenario. With the outcome largely falling in line with the polls, the Euro started the new week on a bullish note. At the time of press, EUR/USD was up 0.5% on the day above 1.0500. Reflecting the broad-based EUR strength, EUR/GBP trades in positive territory slightly above 0.8300 and EUR/JPY gains more than 0.5% near 157.00.
Following Friday's recovery attempt, the US Dollar (USD) Index stays on the back foot and trades at its lowest level since early December below 106.50. US President Donald Trump will participate in a G7 leaders call on Monday and he will be holding a press conference with President Emmanuel Macron later in the day.
Gold struggles to find direction early Monday and extends its sideways grind above $2,930 for the fourth consecutive trading day.
GBP/USD benefits from the selling pressure surrounding the USD and trades above 1.2650 in the European morning on Monday.
After losing nearly 2% in the previous week, USD/JPY holds its ground to begin the new week and trades marginally higher on the day at around 149.50.
During the Asian trading hours, the data from New Zealand showed that Retail Sales rose by 0.9% on a quarterly basis in the fourth quarter. This reading came in better than the market expectation for an increase of 0.6%. NZD/USD gained traction on the upbeat data and was last seen gaining nearly 0.3% at 0.5760.
German economy FAQs
The German economy has a significant impact on the Euro due to its status as the largest economy within the Eurozone. Germany's economic performance, its GDP, employment, and inflation, can greatly influence the overall stability and confidence in the Euro. As Germany's economy strengthens, it can bolster the Euro's value, while the opposite is true if it weakens. Overall, the German economy plays a crucial role in shaping the Euro's strength and perception in global markets.
Germany is the largest economy in the Eurozone and therefore an influential actor in the region. During the Eurozone sovereign debt crisis in 2009-12, Germany was pivotal in setting up various stability funds to bail out debtor countries. It took a leadership role in the implementation of the 'Fiscal Compact' following the crisis – a set of more stringent rules to manage member states’ finances and punish ‘debt sinners’. Germany spearheaded a culture of ‘Financial Stability’ and the German economic model has been widely used as a blueprint for economic growth by fellow Eurozone members.
Bunds are bonds issued by the German government. Like all bonds they pay holders a regular interest payment, or coupon, followed by the full value of the loan, or principal, at maturity. Because Germany has the largest economy in the Eurozone, Bunds are used as a benchmark for other European government bonds. Long-term Bunds are viewed as a solid, risk-free investment as they are backed by the full faith and credit of the German nation. For this reason they are treated as a safe-haven by investors – gaining in value in times of crisis, whilst falling during periods of prosperity.
German Bund Yields measure the annual return an investor can expect from holding German government bonds, or Bunds. Like other bonds, Bunds pay holders interest at regular intervals, called the ‘coupon’, followed by the full value of the bond at maturity. Whilst the coupon is fixed, the Yield varies as it takes into account changes in the bond's price, and it is therefore considered a more accurate reflection of return. A decline in the bund's price raises the coupon as a percentage of the loan, resulting in a higher Yield and vice versa for a rise. This explains why Bund Yields move inversely to prices.
The Bundesbank is the central bank of Germany. It plays a key role in implementing monetary policy within Germany, and central banks in the region more broadly. Its goal is price stability, or keeping inflation low and predictable. It is responsible for ensuring the smooth operation of payment systems in Germany and participates in the oversight of financial institutions. The Bundesbank has a reputation for being conservative, prioritizing the fight against inflation over economic growth. It has been influential in the setup and policy of the European Central Bank (ECB).
NZD/USD drifts higher to near 0.5760 in Monday’s early European session, up 0.31% on the day.
China’s plan to revitalize the agriculture sector and boost consumption lifts the China-proxy Kiwi.
The downbeat US PMI data undermine the US Dollar and create a tailwind for the pair.
The NZD/USD pair gains momentum to around 0.5760 during the early European session on Monday. The New Zealand Dollar (NZD) attracts some buyers after the Chinese government announced its annual policy statement for 2025 on Sunday. Later on Monday, the Chicago Fed National Activity Index for January will be released.
China will deepen rural reforms to revitalize the agriculture sector and strengthen food security in the face of US tariffs, an economic slowdown, and climate change, according to the State Council’s annual rural policy blueprint. Additionally, Premier Li Qiang said last week that China will direct more efforts to boosting consumption and lifting people's livelihoods. The positive development surrounding China’s stimulus plans supports the China-proxy Kiwi as China is a major trading partner to New Zealand.
The disappointing US economic data, including the S&P Global Purchasing Managers' Index (PMI) released last week, weighs on the Greenback and acts as a tailwind for NZD/USD. The US Composite PMI fell to 50.4 in February from 52.7 in the previous month.
Meanwhile, the Manufacturing PMI rose to 51.6 versus 51.2 prior, surpassing the forecast of 51.5. The Services PMI dropped to 49.7 in February, compared to 52.9 in January, below the market consensus of 53.0. The reports kept the prospect of interest rate cuts by the Federal Reserve (Fed) intact this year, even though the Fed will remain on hold for the next several months.
(This story was corrected on February 24 at 07:22 to say that China’s plan to revitalize consumption lifts the Kiwi, not the Aussie.)
New Zealand Dollar FAQs
The New Zealand Dollar (NZD), also known as the Kiwi, is a well-known traded currency among investors. Its value is broadly determined by the health of the New Zealand economy and the country’s central bank policy. Still, there are some unique particularities that also can make NZD move. The performance of the Chinese economy tends to move the Kiwi because China is New Zealand’s biggest trading partner. Bad news for the Chinese economy likely means less New Zealand exports to the country, hitting the economy and thus its currency. Another factor moving NZD is dairy prices as the dairy industry is New Zealand’s main export. High dairy prices boost export income, contributing positively to the economy and thus to the NZD.
The Reserve Bank of New Zealand (RBNZ) aims to achieve and maintain an inflation rate between 1% and 3% over the medium term, with a focus to keep it near the 2% mid-point. To this end, the bank sets an appropriate level of interest rates. When inflation is too high, the RBNZ will increase interest rates to cool the economy, but the move will also make bond yields higher, increasing investors’ appeal to invest in the country and thus boosting NZD. On the contrary, lower interest rates tend to weaken NZD. The so-called rate differential, or how rates in New Zealand are or are expected to be compared to the ones set by the US Federal Reserve, can also play a key role in moving the NZD/USD pair.
Macroeconomic data releases in New Zealand are key to assess the state of the economy and can impact the New Zealand Dollar’s (NZD) valuation. A strong economy, based on high economic growth, low unemployment and high confidence is good for NZD. High economic growth attracts foreign investment and may encourage the Reserve Bank of New Zealand to increase interest rates, if this economic strength comes together with elevated inflation. Conversely, if economic data is weak, NZD is likely to depreciate.
The New Zealand Dollar (NZD) tends to strengthen during risk-on periods, or when investors perceive that broader market risks are low and are optimistic about growth. This tends to lead to a more favorable outlook for commodities and so-called ‘commodity currencies’ such as the Kiwi. Conversely, NZD tends to weaken at times of market turbulence or economic uncertainty as investors tend to sell higher-risk assets and flee to the more-stable safe havens.
USD attracts fresh supply on Monday and drops to over a two-month low during the Asian session.
Concerns about US consumer health and growth outlook continue to weigh heavily on Greenback.
Hawkish Fed expectations warrant caution for the USD bears ahead of the US PCE data on Friday.
The US Dollar Index (DXY), which tracks the Greenback against a basket of currencies, kicks off the new week on a downbeat note and drops to its lowest level since December 10 during the Asian session. The index is currently placed around the 106.25 area, with bears looking to build on weakness below the 100-day Simple Moving Average (SMA).
Against the backdrop of the disappointing release of US Retail Sales figures, a disappointing sales forecast from Walmart raised doubts about US consumer health. Adding to this, data released on Friday fueled worries about the US growth outlook amid concerns that US President Donald Trump's policy moves would further undermine consumer spending. This turns out to be a key factor weighing on the buck.
The S&P Global's flash US Composite PMI dropped to 50.4 in February, from 52.7 in January, pointing to a weaker expansion in overall business activity across the private sector. Separately, the University of Michigan reported that its US Consumer Sentiment Index declined more than expected, to a 15-month low level of 64.7 in February. Meanwhile, households saw inflation over the next year surging to 4.3%.
Moreover, Federal Reserve (Fed) officials remain wary of future interest rate cuts amid sticky inflation and the uncertainty over US President Donald Trump's protectionist policies. This might hold back the USD bears from placing fresh bearish bets and positioning for further losses. Investors might also opt to move to the sidelines ahead of the release of the US Personal Consumption Expenditure (PCE) Price Index on Friday.
US Dollar PRICE Today
The table below shows the percentage change of US Dollar (USD) against listed major currencies today. US Dollar was the strongest against the Japanese Yen.
USD
EUR
GBP
JPY
CAD
AUD
NZD
CHF
USD
-0.54%
-0.36%
0.15%
-0.23%
-0.36%
-0.31%
-0.22%
EUR
0.54%
0.09%
0.50%
0.12%
0.16%
0.05%
0.14%
GBP
0.36%
-0.09%
0.49%
0.03%
0.07%
-0.04%
0.05%
JPY
-0.15%
-0.50%
-0.49%
-0.37%
-0.42%
-0.36%
-0.27%
CAD
0.23%
-0.12%
-0.03%
0.37%
-0.19%
-0.08%
0.02%
AUD
0.36%
-0.16%
-0.07%
0.42%
0.19%
-0.12%
-0.02%
NZD
0.31%
-0.05%
0.04%
0.36%
0.08%
0.12%
0.10%
CHF
0.22%
-0.14%
-0.05%
0.27%
-0.02%
0.02%
-0.10%
The heat map shows percentage changes of major currencies against each other. The base currency is picked from the left column, while the quote currency is picked from the top row. For example, if you pick the US Dollar from the left column and move along the horizontal line to the Japanese Yen, the percentage change displayed in the box will represent USD (base)/JPY (quote).
USD/CHF may depreciate toward the psychological level of 0.8900.
The bearish bias is bolstered as the 14-day RSI remains below the 50 level.
The pair could find the primary resistance at nine-day EMA at 0.9009.
The USD/CHF pair extends its losses for the third successive session, trading around 0.8960 during the Asian hours on Monday. The daily chart analysis points to an ongoing bearish bias, with the pair trading below the nine- and 14-day Exponential Moving Averages (EMAs).
Additionally, the 14-day Relative Strength Index (RSI) remains below the 50 level, reinforcing the bearish trend. Further depreciation would indicate an oversold situation and an upward correction in the near term.
The USD/CHF pair could find its initial support at the psychological level of 0.8900. A break below this level would open the doors for the pair to navigate the region around the two-month low at 0.8736 level, which was recorded on December 6.
On the upside, the USD/CHF pair could find the primary resistance at the nine-day EMA at 0.9009, followed by the 14-day EMA at 0.9026 level. A break above these levels would improve the short-term price momentum and support the pair to explore the nine-month high at 0.9201 level, which was approached on January 13.
USD/CHF: Daily Chart
Swiss Franc PRICE Today
The table below shows the percentage change of Swiss Franc (CHF) against listed major currencies today. Swiss Franc was the weakest against the Euro.
USD
EUR
GBP
JPY
CAD
AUD
NZD
CHF
USD
-0.53%
-0.35%
0.13%
-0.23%
-0.36%
-0.30%
-0.22%
EUR
0.53%
0.09%
0.50%
0.11%
0.15%
0.02%
0.13%
GBP
0.35%
-0.09%
0.49%
0.03%
0.07%
-0.05%
0.05%
JPY
-0.13%
-0.50%
-0.49%
-0.37%
-0.42%
-0.36%
-0.27%
CAD
0.23%
-0.11%
-0.03%
0.37%
-0.19%
-0.07%
0.02%
AUD
0.36%
-0.15%
-0.07%
0.42%
0.19%
-0.11%
-0.02%
NZD
0.30%
-0.02%
0.05%
0.36%
0.07%
0.11%
0.10%
CHF
0.22%
-0.13%
-0.05%
0.27%
-0.02%
0.02%
-0.10%
The heat map shows percentage changes of major currencies against each other. The base currency is picked from the left column, while the quote currency is picked from the top row. For example, if you pick the Swiss Franc from the left column and move along the horizontal line to the US Dollar, the percentage change displayed in the box will represent CHF (base)/USD (quote).
EUR/JPY climbs to around 157.10 in Monday’s early European session, adding 0.71% on the day.
The conservatives won the German election, supporting the Euro.
Rising BoJ rate hike bets might help limit the JPY’s losses.
The EUR/JPY cross rebounds to near 157.10, snapping the three-day losing streak during the early European session on Monday. The Euro (EUR) gathers strength as Germany's conservatives won its election as expected. Traders brace for further results from the German election for fresh impetus.
Preliminary results showed the conservative Christian Democratic Union (CDU), led by chancellor candidate Friedrich Merz, and its allied Christian Social Union (CSU) won the election. The far-right Alternative for Germany (AfD) party came second, scoring between 19 and 20% of the vote, according to exit polls. The attention now is how soon the conservative Christian Democrats could form a coalition government to offer much-needed reform to a struggling economy.
On the other hand, data released last week showed that Japan's core inflation touched a 19-month high in January, supporting the case of the Bank of Japan (BoJ) rate hike. BoJ Governor Kazuo Ueda said the BOJ could raise its short-term policy rate further "if the inflation outlook continues to improve," adding that underlying inflation was still below its 2% target. The rising speculation that the Japanese central bank might continue raising interest rates might lift the Japanese Yen (JPY) and create a headwind for EUR/JPY.
Japanese Yen FAQs
The Japanese Yen (JPY) is one of the world’s most traded currencies. Its value is broadly determined by the performance of the Japanese economy, but more specifically by the Bank of Japan’s policy, the differential between Japanese and US bond yields, or risk sentiment among traders, among other factors.
One of the Bank of Japan’s mandates is currency control, so its moves are key for the Yen. The BoJ has directly intervened in currency markets sometimes, generally to lower the value of the Yen, although it refrains from doing it often due to political concerns of its main trading partners. The BoJ ultra-loose monetary policy between 2013 and 2024 caused the Yen to depreciate against its main currency peers due to an increasing policy divergence between the Bank of Japan and other main central banks. More recently, the gradually unwinding of this ultra-loose policy has given some support to the Yen.
Over the last decade, the BoJ’s stance of sticking to ultra-loose monetary policy has led to a widening policy divergence with other central banks, particularly with the US Federal Reserve. This supported a widening of the differential between the 10-year US and Japanese bonds, which favored the US Dollar against the Japanese Yen. The BoJ decision in 2024 to gradually abandon the ultra-loose policy, coupled with interest-rate cuts in other major central banks, is narrowing this differential.
The Japanese Yen is often seen as a safe-haven investment. This means that in times of market stress, investors are more likely to put their money in the Japanese currency due to its supposed reliability and stability. Turbulent times are likely to strengthen the Yen’s value against other currencies seen as more risky to invest in.
European Central Bank (ECB) policymaker Pierre Wunsch told the Financial Times (FT), “I’m not pleading for a pause in April. But we must not "sleepwalk" to cutting rates to 2% without thinking about it.”
Additional quotes
If the data justify a rate cut, we will cut.
If it doesn't, then we might have to pause.
I think the risks on the downside and upside for inflation are relatively limited.
Inflation in Europe might be the boring part of this year; and it's not going to be a boring year.
ECB is tasked with fine-tuning policy around a soft landing now.
Market reaction
EUR/USD was last seen trading at 1.0513, up 0.53% on the day, courtesy of the German Conservatives election win.
05:00
Singapore Consumer Price Index (YoY) registered at 1.2, below expectations (2.2) in January
EUR/USD attracts fresh buyers and climbs to a nearly one-month high amid a bearish USD.
The technical setup favors bullish traders and supports prospects for further appreciation.
It will be prudent to wait for a break above the 100-day SMA before placing fresh bullish bets.
The EUR/USD pair regains positive traction at the start of a new week and hits a near one-month top, around the 1.0525-1.0530 area during the Asian session amid renewed US Dollar (USD) selling bias. Spot prices, however, remain below the 100-day Simple Moving Average (SMA) as traders await the release of the final Eurozone CPI print before placing fresh bets.
Given that oscillators on the daily chart have just started gaining positive traction, a sustained break through the said barrier, currently pegged near the 1.0535-1.0540 region, will be seen as a fresh trigger for bulls. The subsequent move up could lift the EUR/USD pair to the 38.2% Fibonacci retracement level of the September-January downfall, around the 1.0600 neighborhood en route to the December swing high, around the 1.0620 area.
Some follow-through should pave the way for additional gains toward reclaiming the 1.0700 mark, which coincides with the 50% retracement level. The momentum could extend further to the 1.0750-1.0755 hurdle before the EUR/USD pair aims to surpass the 1.0800 round figure and test the 61.8% Fibo. level, around the 1.0815 region.
On the flip side, weakness back below the 1.0500 psychological mark might continue to attract dip-buyers near the 1.0465-1.0460 area. This should help limit the downside for the EUR/USD pair near the 1.0420-1.0415 region, or the 23.6% Fibo. level. That said, some follow-through selling, leading to a subsequent break below the 1.0400 round figure, could drag spot prices to the 1.0340 intermediate support en route to the 1.0300 mark.
A convincing break below the latter would shift the near-term bias in favor of bearish traders and make the EUR/USD pair vulnerable to accelerate the fall towards the 1.0265-1.0260 region. Spot prices could eventually weaken below the 1.0200 mark and test the 1.0180-1.0175 area, or the lowest level since November 2022 touched last month.
Economic Indicator
Core Harmonized Index of Consumer Prices (YoY)
The Core Harmonized Index of Consumer Prices (HICP) measures changes in the prices of a representative basket of goods and services in the European Monetary Union. The HICP, – released by Eurostat on a monthly basis, is harmonized because the same methodology is used across all member states and their contribution is weighted. The YoY reading compares prices in the reference month to a year earlier. Core HICP excludes volatile components like food, energy, alcohol, and tobacco. The Core HICP is a key indicator to measure inflation and changes in purchasing trends. Generally, a high reading is seen as bullish for the Euro (EUR), while a low reading is seen as bearish.
Silver price gains ground to near $32.70 in Monday’s Asian session, up 0.45% on the day.
The positive view of Silver prevails above the key 100-day EMA with the bullish RSI indicator.
The first upside barrier is seen at the $33.35-$33.40 region; the initial support level is located at $31.52.
Silver price (XAG/USD) drifts higher to around $32.70 during the Asian trading hours on Monday. The weakening of the US Dollar (USD) provides some support to the USD-denominated commodity price. Furthermore, the uncertainty and concerns over US President Donald Trump's tariff plans might boost the safe-have flows, which contribute to Silver’s upside.
According to the daily chart, the bullish outlook of the white metal remains in place, with the price holding above the key 100-day Exponential Moving Average (EMA). The upward momentum is reinforced by the 14-day Relative Strength Index (RSI), which stands above the midline near 64.40, suggesting the path of least resistance is to the upside.
The upper boundary of the Bollinger Band and the high of February 14 of $33.35-$33.40 act as an upside barrier for Silver price. Sustained trading above this level could expose $34.55, the high of October 29, 2024. Any follow-through buying above the mentioned level could see a rally to $34.87, the high of October 22, 2024.
On the flip side, the initial support level for XAG/USD emerges at $31.52, the low of February 12. Extended losses could see a drop to $30.90, the 100-day EMA. The next contention level is seen at $30.70, the lower limit of the Bollinger Band.
Silver price (XAG/USD) daily chart
Silver FAQs
Silver is a precious metal highly traded among investors. It has been historically used as a store of value and a medium of exchange. Although less popular than Gold, traders may turn to Silver to diversify their investment portfolio, for its intrinsic value or as a potential hedge during high-inflation periods. Investors can buy physical Silver, in coins or in bars, or trade it through vehicles such as Exchange Traded Funds, which track its price on international markets.
Silver prices can move due to a wide range of factors. Geopolitical instability or fears of a deep recession can make Silver price escalate due to its safe-haven status, although to a lesser extent than Gold's. As a yieldless asset, Silver tends to rise with lower interest rates. Its moves also depend on how the US Dollar (USD) behaves as the asset is priced in dollars (XAG/USD). A strong Dollar tends to keep the price of Silver at bay, whereas a weaker Dollar is likely to propel prices up. Other factors such as investment demand, mining supply – Silver is much more abundant than Gold – and recycling rates can also affect prices.
Silver is widely used in industry, particularly in sectors such as electronics or solar energy, as it has one of the highest electric conductivity of all metals – more than Copper and Gold. A surge in demand can increase prices, while a decline tends to lower them. Dynamics in the US, Chinese and Indian economies can also contribute to price swings: for the US and particularly China, their big industrial sectors use Silver in various processes; in India, consumers’ demand for the precious metal for jewellery also plays a key role in setting prices.
Silver prices tend to follow Gold's moves. When Gold prices rise, Silver typically follows suit, as their status as safe-haven assets is similar. The Gold/Silver ratio, which shows the number of ounces of Silver needed to equal the value of one ounce of Gold, may help to determine the relative valuation between both metals. Some investors may consider a high ratio as an indicator that Silver is undervalued, or Gold is overvalued. On the contrary, a low ratio might suggest that Gold is undervalued relative to Silver.
Gold prices rose in India on Monday, according to data compiled by FXStreet.
The price for Gold stood at 8,197.41 Indian Rupees (INR) per gram, up compared with the INR 8,175.44 it cost on Friday.
The price for Gold increased to INR 95,609.34 per tola from INR 95,350.84 per tola on friday.
Unit measure
Gold Price in INR
1 Gram
8,197.41
10 Grams
81,970.98
Tola
95,609.34
Troy Ounce
254,976.20
FXStreet calculates Gold prices in India by adapting international prices (USD/INR) to the local currency and measurement units. Prices are updated daily based on the market rates taken at the time of publication. Prices are just for reference and local rates could diverge slightly.
Gold has played a key role in human’s history as it has been widely used as a store of value and medium of exchange. Currently, apart from its shine and usage for jewelry, the precious metal is widely seen as a safe-haven asset, meaning that it is considered a good investment during turbulent times. Gold is also widely seen as a hedge against inflation and against depreciating currencies as it doesn’t rely on any specific issuer or government.
Central banks are the biggest Gold holders. In their aim to support their currencies in turbulent times, central banks tend to diversify their reserves and buy Gold to improve the perceived strength of the economy and the currency. High Gold reserves can be a source of trust for a country’s solvency. Central banks added 1,136 tonnes of Gold worth around $70 billion to their reserves in 2022, according to data from the World Gold Council. This is the highest yearly purchase since records began. Central banks from emerging economies such as China, India and Turkey are quickly increasing their Gold reserves.
Gold has an inverse correlation with the US Dollar and US Treasuries, which are both major reserve and safe-haven assets. When the Dollar depreciates, Gold tends to rise, enabling investors and central banks to diversify their assets in turbulent times. Gold is also inversely correlated with risk assets. A rally in the stock market tends to weaken Gold price, while sell-offs in riskier markets tend to favor the precious metal.
The price can move due to a wide range of factors. Geopolitical instability or fears of a deep recession can quickly make Gold price escalate due to its safe-haven status. As a yield-less asset, Gold tends to rise with lower interest rates, while higher cost of money usually weighs down on the yellow metal. Still, most moves depend on how the US Dollar (USD) behaves as the asset is priced in dollars (XAU/USD). A strong Dollar tends to keep the price of Gold controlled, whereas a weaker Dollar is likely to push Gold prices up.
(An automation tool was used in creating this post.)
USD/CAD loses ground as the downbeat economic data reinforce the expectations of the Fed rate cuts.
The commodity-linked CAD could face challenges amid weaker crude Oil prices.
WTI price faces challenges due to expectations of resumed exports from Kurdistan’s oilfields.
USD/CAD offers its recent gains registered in the previous session, trading around 1.4190 during the Asian hours on Monday. The downside of the pair is attributed to the weaker US Dollar (USD) following the downbeat US economic data including Jobless Claims and the S&P Global Purchasing Managers' Index (PMI) released last week.
The downbeat economic data have reinforced the expectations of the Federal Reserve’s (Fed) rate cuts. The US Dollar Index (DXY), which measures the USD against six major currencies, depreciates to near 106.00 with 2- and 10-year yields on US Treasury bonds standing at 4.19% and 4.43%, respectively, at the time of writing.
In Canada, mixed economic data has created uncertainty around the Bank of Canada’s (BoC) policy outlook. An advance estimate from Statistics Canada indicates that Retail Sales fell by 0.4% in January 2025, marking the first decline in seven months. This suggests a slowdown in consumer spending following December’s strong surge, sparking concerns about economic momentum.
Meanwhile, inflationary pressures remain elevated, with rising industrial producer prices and an increase in the Raw Materials Price Index month-over-month. This underscores the BoC’s challenge of balancing economic growth and price stability, while also dampening expectations for further policy easing.
However, the commodity-linked Canadian Dollar (CAD) could face challenges amid weaker West Texas Intermediate (WTI) Oil price. Given that Canada is the largest Oil exporter to the United States (US). Crude Oil prices faced downward pressure amid expectations of resumed exports from Kurdistan’s Oilfields.
On Sunday, Reuters reported that an Iraqi Oil ministry official confirmed Iraq’s plan to export 185,000 barrels per day (bpd) from Kurdistan’s Oilfields via the Iraq-Turkey pipeline. The ministry stated that all necessary procedures had been completed to facilitate the resumption of exports through the pipeline.
Canadian Dollar FAQs
The key factors driving the Canadian Dollar (CAD) are the level of interest rates set by the Bank of Canada (BoC), the price of Oil, Canada’s largest export, the health of its economy, inflation and the Trade Balance, which is the difference between the value of Canada’s exports versus its imports. Other factors include market sentiment – whether investors are taking on more risky assets (risk-on) or seeking safe-havens (risk-off) – with risk-on being CAD-positive. As its largest trading partner, the health of the US economy is also a key factor influencing the Canadian Dollar.
The Bank of Canada (BoC) has a significant influence on the Canadian Dollar by setting the level of interest rates that banks can lend to one another. This influences the level of interest rates for everyone. The main goal of the BoC is to maintain inflation at 1-3% by adjusting interest rates up or down. Relatively higher interest rates tend to be positive for the CAD. The Bank of Canada can also use quantitative easing and tightening to influence credit conditions, with the former CAD-negative and the latter CAD-positive.
The price of Oil is a key factor impacting the value of the Canadian Dollar. Petroleum is Canada’s biggest export, so Oil price tends to have an immediate impact on the CAD value. Generally, if Oil price rises CAD also goes up, as aggregate demand for the currency increases. The opposite is the case if the price of Oil falls. Higher Oil prices also tend to result in a greater likelihood of a positive Trade Balance, which is also supportive of the CAD.
While inflation had always traditionally been thought of as a negative factor for a currency since it lowers the value of money, the opposite has actually been the case in modern times with the relaxation of cross-border capital controls. Higher inflation tends to lead central banks to put up interest rates which attracts more capital inflows from global investors seeking a lucrative place to keep their money. This increases demand for the local currency, which in Canada’s case is the Canadian Dollar.
Macroeconomic data releases gauge the health of the economy and can have an impact on the Canadian Dollar. Indicators such as GDP, Manufacturing and Services PMIs, employment, and consumer sentiment surveys can all influence the direction of the CAD. A strong economy is good for the Canadian Dollar. Not only does it attract more foreign investment but it may encourage the Bank of Canada to put up interest rates, leading to a stronger currency. If economic data is weak, however, the CAD is likely to fall.
Gold price continues to attract safe-haven flows amid worries about Trump’s tariff plans.
The emergence of fresh USD selling and inflation concerns also support the XAU/USD pair.
Hawkish Fed expectations might cap any further gains for the non-yielding yellow metal.
Gold price (XAU/USD) attracts some dip-buying during the Asian session on Monday, though it remains confined in a familiar range near the all-time peak touched last week. The uncertainty surrounding US President Donald Trump's trade tariffs and their impact on the global economy, along with the broader risk-averse theme, continues to act as a tailwind for the safe-haven bullion. Apart from this, geopolitical tensions and the underlying bearish sentiment surrounding the US Dollar (USD) turn out to be other factors that underpin the commodity.
That said, expectations that the Federal Reserve (Fed) will keep interest rates higher for longer amid still-sticky inflation cap the upside for the non-yielding Gold price. Hence, the market focus will remain glued to the release of the US Personal Consumption Expenditures (PCE) Price Index – the Fed's preferred inflation measure – on Friday. The crucial data would be looked upon for more cues about the Fed's rate-cut path, which, in turn, will drive the USD demand and help in determining the next leg of a directional move for the precious metal.
Gold price remains well supported by global trade war fears
Concerns about the potential economic fallout from US President Donald Trump's tariff plans assisted the safe-haven Gold price in registering gains for the eighth straight week and hit a fresh record high last week.
Trump imposed a 25% tariff on steel and aluminum, and an additional 10% tariff on Chinese imports since taking office, and said last week that he would announce fresh tariffs over the next month or sooner.
Data released on Friday fueled worries about the US growth outlook and dragged the US Dollar to its lowest level since December 10, which turns out to be another factor underpinning demand for the commodity.
The flash S&P Global US Composite PMI dropped to 50.4 in February, from 52.7 in January, pointing to a weaker expansion in overall business activity across the private sector amid worries about Trump's tariff plans.
Separately, the University of Michigan reported that its US Consumer Sentiment Index dropped more than expected, to a 15-month low level of 64.7 in February compared to the previous month's final reading of 71.7.
Moreover, households saw inflation surging to 4.3% - the highest since November 2023 - over the next year, which turns out to be another factor that benefits the precious metal's status as a hedge against rising prices.
Stronger US consumer inflation figures, along with hawkish FOMC minutes, suggest that the Federal Reserve will keep rates steady for an extended period and act as a headwind for the non-yielding yellow metal.
The release of the US Personal Consumption Expenditures (PCE) Price Index on Friday will play a key role in influencing market expectations about the Fed's rate outlook and provide a fresh impetus to the XAU/USD.
This week's US economic docket also features the release of Prelim US Q4 GDP print and Durable Goods Orders on Thursday, which, along with speeches by influential FOMC members, will drive the USD demand.
Gold price overbought daily RSI warrants some caution for bulls
From a technical perspective, the daily Relative Strength Index (RSI) holds above the 70 mark and points to slightly overbought conditions. This might hold back traders from placing fresh bullish bets around the Gold price, which supports prospects for an extension of the range-bound price action. That said, some follow-through buying beyond the $2,950-2,955 area, or the all-time peak, would be seen as a fresh trigger for bulls and assist the XAU/USD to build on its recent well-established uptrend witnessed over the past two months or so.
Meanwhile, any corrective pullback might continue to attract some dip-buyers around the $2,920-2,915 region, or the lower end of a multi-day-old trading range. This is followed by the $2,900 mark and support near the $2,880 region, which if broken decisively could drag the Gold price to the $2,860-2,855 area en route to the $2,834 zone and eventually to the $2,800 mark.
Gold FAQs
Gold has played a key role in human’s history as it has been widely used as a store of value and medium of exchange. Currently, apart from its shine and usage for jewelry, the precious metal is widely seen as a safe-haven asset, meaning that it is considered a good investment during turbulent times. Gold is also widely seen as a hedge against inflation and against depreciating currencies as it doesn’t rely on any specific issuer or government.
Central banks are the biggest Gold holders. In their aim to support their currencies in turbulent times, central banks tend to diversify their reserves and buy Gold to improve the perceived strength of the economy and the currency. High Gold reserves can be a source of trust for a country’s solvency. Central banks added 1,136 tonnes of Gold worth around $70 billion to their reserves in 2022, according to data from the World Gold Council. This is the highest yearly purchase since records began. Central banks from emerging economies such as China, India and Turkey are quickly increasing their Gold reserves.
Gold has an inverse correlation with the US Dollar and US Treasuries, which are both major reserve and safe-haven assets. When the Dollar depreciates, Gold tends to rise, enabling investors and central banks to diversify their assets in turbulent times. Gold is also inversely correlated with risk assets. A rally in the stock market tends to weaken Gold price, while sell-offs in riskier markets tend to favor the precious metal.
The price can move due to a wide range of factors. Geopolitical instability or fears of a deep recession can quickly make Gold price escalate due to its safe-haven status. As a yield-less asset, Gold tends to rise with lower interest rates, while higher cost of money usually weighs down on the yellow metal. Still, most moves depend on how the US Dollar (USD) behaves as the asset is priced in dollars (XAU/USD). A strong Dollar tends to keep the price of Gold controlled, whereas a weaker Dollar is likely to push Gold prices up.
WTI price may decline due to expectations of resumed exports from Kurdistan’s oilfields.
Iraq’s Oil Ministry confirmed plans to export 185,000 barrels per day from Kurdistan’s oilfields through the Iraq-Turkey pipeline.
Russian and US teams are set to meet this week to discuss ways to strengthen bilateral relations.
West Texas Intermediate (WTI) Oil price edges higher to around $70.30 per barrel during Asian trading hours on Monday. However, crude Oil prices faced downward pressure amid expectations of resumed exports from Kurdistan’s Oilfields.
On Sunday, Reuters reported that an Iraqi Oil ministry official confirmed Iraq’s plan to export 185,000 barrels per day (bpd) from Kurdistan’s Oilfields via the Iraq-Turkey pipeline. The ministry stated that all necessary procedures had been completed to facilitate the resumption of exports through the pipeline.
Meanwhile, traders remain focused on developments related to the ongoing conflict between Russia and Ukraine, which enters its fourth year on Monday. European Union leaders are expected to convene for an extraordinary summit on March 6 to discuss additional support for Ukraine and European security assurances.
Additionally, a senior Russian diplomat indicated that Russian and US teams plan to meet this week to explore ways to improve bilateral relations. This follows US President Donald Trump’s initiative to engage Russia in talks aimed at ending the war, though notably without the involvement of Ukraine or the European Union.
Investors are also closely watching potential developments on US trade policy. Further tariff-related announcements from President Trump could heighten global trade tensions, exerting additional downward pressure on crude Oil prices. On Friday, Trump signed a memorandum directing the Committee on Foreign Investment in the United States (CFIUS) to restrict Chinese investments in strategic sectors.
Finally, market participants will be paying close attention to the release of the Personal Consumption Expenditures (PCE) index on Friday — the Federal Reserve’s (Fed) preferred measure of inflation — which could provide further insights into the central bank’s future interest rate policy.
WTI Oil FAQs
WTI Oil is a type of Crude Oil sold on international markets. The WTI stands for West Texas Intermediate, one of three major types including Brent and Dubai Crude. WTI is also referred to as “light” and “sweet” because of its relatively low gravity and sulfur content respectively. It is considered a high quality Oil that is easily refined. It is sourced in the United States and distributed via the Cushing hub, which is considered “The Pipeline Crossroads of the World”. It is a benchmark for the Oil market and WTI price is frequently quoted in the media.
Like all assets, supply and demand are the key drivers of WTI Oil price. As such, global growth can be a driver of increased demand and vice versa for weak global growth. Political instability, wars, and sanctions can disrupt supply and impact prices. The decisions of OPEC, a group of major Oil-producing countries, is another key driver of price. The value of the US Dollar influences the price of WTI Crude Oil, since Oil is predominantly traded in US Dollars, thus a weaker US Dollar can make Oil more affordable and vice versa.
The weekly Oil inventory reports published by the American Petroleum Institute (API) and the Energy Information Agency (EIA) impact the price of WTI Oil. Changes in inventories reflect fluctuating supply and demand. If the data shows a drop in inventories it can indicate increased demand, pushing up Oil price. Higher inventories can reflect increased supply, pushing down prices. API’s report is published every Tuesday and EIA’s the day after. Their results are usually similar, falling within 1% of each other 75% of the time. The EIA data is considered more reliable, since it is a government agency.
OPEC (Organization of the Petroleum Exporting Countries) is a group of 12 Oil-producing nations who collectively decide production quotas for member countries at twice-yearly meetings. Their decisions often impact WTI Oil prices. When OPEC decides to lower quotas, it can tighten supply, pushing up Oil prices. When OPEC increases production, it has the opposite effect. OPEC+ refers to an expanded group that includes ten extra non-OPEC members, the most notable of which is Russia.
The Japanese Yen climbs to an over two-month top against USD amid BoJ rate hike bets.
Retreating JGB yields cap the JPY and assists USD/JPY to bounce off sub-149.00 levels.
The emergence of fresh USD selling should keep a lid on a further recovery for the pair.
The Japanese Yen (JPY) builds on last week's strong gains against its American counterpart and drags the USD/JPY pair below the 149.00 mark, or the lowest level since early December during the Asian session on Monday. Japan's strong Consumer Price Index (CPI) released on Friday comes on top of the upbeat Q4 Gross Domestic Product (GDP) growth report last week. This, along with expectations that sustained wage gains would spur consumer spending, suggests that the Bank of Japan (BoJ) might hike interest rates more aggressively than initially thought and continue to underpin the JPY.
Apart from this, the emergence of fresh US Dollar (USD) selling benefits the JPY and contributes to the USD/JPY pair's slide for the fourth straight day – marking the seventh day of a negative move in the previous eight. Meanwhile, BoJ Governor Kazuo Ueda showed readiness to ramp up government bond buying if long-term interest rates rise sharply. This, in turn, leads to a further pullback in the Japanese government bond (JGB) yields, from a multi-year peak touched last week, which prompts some intraday JPY selling and assists the currency pair in rebounding over 50 pips from the daily low.
Japanese Yen bulls retain control amid hawkish BoJ expectations
Data released on Friday showed that Japan's core inflation touched a 19-month high in January and reinforced expectations that the Bank of Japan will keep raising interest rates.
BoJ Governor Kazuo Ueda warned on Friday that the central bank could increase bond buying if abnormal market moves trigger a sharp rise in the government bond yields.
The yield on the benchmark Japanese government bond (JGB) retreats further from its highest level since November 2009 set last week and caps gains for the Japanese Yen.
A disappointing sales forecast from Walmart raised doubts about US consumer health and drags the US Dollar to over a two-month low during the Asian session on Monday.
The flash S&P Global US Composite PMI dropped to 50.4 in February, from 52.7 in January, pointing to a weaker expansion in overall business activity across the private sector.
Separately, the University of Michigan reported that its US Consumer Sentiment Index dropped more than expected, from 71.7 previous to 64.7 in February, or a 15-month low.
Moreover, households saw inflation over the next year surging to 4.3% — the highest since November 2023 — and running at 3.5% — the highest since 1995 – over the next five years.
Federal Reserve officials remain wary of future interest rate cuts amid sticky inflation and the uncertainty over US President Donald Trump's tariff plans and protectionist policies.
USD/JPY seems vulnerable while below 151.00-150.90 support breakpoint
From a technical perspective, any subsequent move up is likely to confront stiff resistance near the 150.00 psychological mark. Some follow-through buying could lift the USD/JPY pair to last Friday's swing high, around the 150.70-150.75 region, en route to the 150.90-151.00 horizontal support breakpoint. The latter should act as a key pivotal point, which if cleared decisively might trigger a short-covering rally and lift spot prices beyond the 151.40 intermediate hurdle, towards the 152.00 mark. The momentum, however, runs the risk of fizzling out rather quickly near the 152.65 area, representing the very important 200-day Simple Moving Average (SMA).
On the flip side, the 149.00 mark, followed by the Asian session low around the 148.85 region, now seems to act as an immediate hurdle ahead of the 148.65 area, or the December 2024 trough. Failure to defend the said support levels would make the USD/JPY pair vulnerable to accelerate the fall further toward the 148.00 round figure. The downward trajectory could extend further towards the next relevant support near the 147.45 region before spot prices eventually drop to the 147.00 mark.
Japanese Yen FAQs
The Japanese Yen (JPY) is one of the world’s most traded currencies. Its value is broadly determined by the performance of the Japanese economy, but more specifically by the Bank of Japan’s policy, the differential between Japanese and US bond yields, or risk sentiment among traders, among other factors.
One of the Bank of Japan’s mandates is currency control, so its moves are key for the Yen. The BoJ has directly intervened in currency markets sometimes, generally to lower the value of the Yen, although it refrains from doing it often due to political concerns of its main trading partners. The BoJ ultra-loose monetary policy between 2013 and 2024 caused the Yen to depreciate against its main currency peers due to an increasing policy divergence between the Bank of Japan and other main central banks. More recently, the gradually unwinding of this ultra-loose policy has given some support to the Yen.
Over the last decade, the BoJ’s stance of sticking to ultra-loose monetary policy has led to a widening policy divergence with other central banks, particularly with the US Federal Reserve. This supported a widening of the differential between the 10-year US and Japanese bonds, which favored the US Dollar against the Japanese Yen. The BoJ decision in 2024 to gradually abandon the ultra-loose policy, coupled with interest-rate cuts in other major central banks, is narrowing this differential.
The Japanese Yen is often seen as a safe-haven investment. This means that in times of market stress, investors are more likely to put their money in the Japanese currency due to its supposed reliability and stability. Turbulent times are likely to strengthen the Yen’s value against other currencies seen as more risky to invest in.
The Indian Rupee trades flat in Monday’s Asian session.
Persistent selling of domestic stocks from overseas could weigh on the INR.
Traders brace for the Chicago Fed National Activity Index for January, which is due later on Monday.
The Indian Rupee (INR) flat lines on Monday. The concern over Foreign Portfolio Investment (FPI) outflows, with foreign investors offloading over $11 billion in Indian stocks this year might weigh on the local currency.
Nonetheless, continued softness in the US Dollar (USD) might help offset these outflows, lifting the INR. Additionally, the likely intervention by the Reserve Bank of India (RBI) could prevent the Indian Rupee from significantly depreciating. Lower crude oil prices might support the INR as India is the world's third-largest oil consumer.
Later on Monday, the Chicago Fed National Activity Index for January will be released. The attention will shift to the preliminary reading of US Gross Domestic Product (GDP) for the fourth quarter (Q4), which will be published on Thursday.
Indian Rupee steadies amid foreign fund outflows
The HSBC India Manufacturing Purchasing Managers Index (PMI) eased to 57.1 in February from 57.5 in January. The Indian Services PMI rose to 61.1 in February versus 56.5 prior.
The Composite PMI improved to 60.6 in February from 57.7 in January.
“Rapid restocking around the world continues to lift new export orders. A healthy acceleration in orders and output is keeping firms optimistic about the future. Input prices eased while output prices rose at a faster pace, leading to improved margins, especially for goods producers,” said Pranjul Bhandari, Chief India Economist at HSBC.
The US S&P Global Composite PMI declined to 50.4 in February versus 52.7 prior.
The US S&P Global Manufacturing PMI climbed from 51.2 in January to 51.6 in February, beating the estimation of 51.5. The Services PMI dropped from 52.9 in January to 49.7 in February, weaker than the 53.0 expected.
The University of Michigan Consumer Sentiment Index fell to 64.7 in February, compared to the previous reading and the expectation of 67.8.
USD/INR maintains its constructive bias despite consolidation in the near term
The Indian Rupee trades on a flat note on the day. The USD/INR pair maintains a positive view as the price holds above the key 100-day Exponential Moving Average (EMA) on the daily chart. However, the 14-day Relative Strength Index (RSI) hovers around the midline near 50.0, suggesting that further consolidation or downside cannot be ruled out.
The first upside barrier for USD/INR is located at the 87.00 psychological level. Extended gains above the mentioned level could pave the way to an all-time high near 88.00, en route to 88.50.
On the other hand, a decisive break below the low of February 12 at 86.35 could see a drop to 86.14, the low of January 27. The additional downside target to watch is 85.65, the low of January 7.
Indian Rupee FAQs
The Indian Rupee (INR) is one of the most sensitive currencies to external factors. The price of Crude Oil (the country is highly dependent on imported Oil), the value of the US Dollar – most trade is conducted in USD – and the level of foreign investment, are all influential. Direct intervention by the Reserve Bank of India (RBI) in FX markets to keep the exchange rate stable, as well as the level of interest rates set by the RBI, are further major influencing factors on the Rupee.
The Reserve Bank of India (RBI) actively intervenes in forex markets to maintain a stable exchange rate, to help facilitate trade. In addition, the RBI tries to maintain the inflation rate at its 4% target by adjusting interest rates. Higher interest rates usually strengthen the Rupee. This is due to the role of the ‘carry trade’ in which investors borrow in countries with lower interest rates so as to place their money in countries’ offering relatively higher interest rates and profit from the difference.
Macroeconomic factors that influence the value of the Rupee include inflation, interest rates, the economic growth rate (GDP), the balance of trade, and inflows from foreign investment. A higher growth rate can lead to more overseas investment, pushing up demand for the Rupee. A less negative balance of trade will eventually lead to a stronger Rupee. Higher interest rates, especially real rates (interest rates less inflation) are also positive for the Rupee. A risk-on environment can lead to greater inflows of Foreign Direct and Indirect Investment (FDI and FII), which also benefit the Rupee.
Higher inflation, particularly, if it is comparatively higher than India’s peers, is generally negative for the currency as it reflects devaluation through oversupply. Inflation also increases the cost of exports, leading to more Rupees being sold to purchase foreign imports, which is Rupee-negative. At the same time, higher inflation usually leads to the Reserve Bank of India (RBI) raising interest rates and this can be positive for the Rupee, due to increased demand from international investors. The opposite effect is true of lower inflation.
NZD/USD strengthens as Retail Sales rose 0.9% QoQ in Q4 2024, marking the strongest growth in three years.
China’s annual policy statement highlights plans to advance rural reforms and drive comprehensive rural revitalization.
The US Dollar weakens amid disappointing US economic data released last week.
NZD/USD recovers recent losses registered in the previous session, trading around 0.5750 during the Asian hours on Monday. The New Zealand Dollar (NZD) strengthened following the release of domestic Retail Sales data, which rose 0.9% quarter-on-quarter in the fourth quarter of 2024 — the strongest increase in three years — after a revised flat reading in the previous period and surpassing forecasts of 0.6%.
The Chinese government released its annual policy statement for 2025 on Sunday. The statement outlines plans to advance rural reforms and promote comprehensive rural revitalization. Growing optimism around China’s stimulus measures could further boost the NZD and the NZD/USD pair, given China’s importance as a major trading partner for New Zealand.
However, the upside of the NZD/USD pair could be restrained as US President Donald Trump signed a memorandum on Friday instructing the Committee on Foreign Investment in the United States (US) to limit Chinese investments in strategic sectors. Reuters cited a White House official saying that the national security memorandum seeks to encourage foreign investment while safeguarding US national security interests from potential threats posed by foreign adversaries like China.
The US Dollar Index (DXY), which measures the USD against six major currencies, depreciates below 106.50 at the time of writing. The DXY faced challenges following the downbeat S&P Global Purchasing Managers' Index (PMI) released last week.
The US Composite PMI fell to 50.4 in February, down from 52.7 in the previous month. In contrast, the Manufacturing PMI rose to 51.6 in February from 51.2 in January, surpassing the forecast of 51.5. Meanwhile, the Services PMI declined to 49.7 in February from 52.9 in January, falling short of the expected 53.0.
Economic Indicator
Retail Sales (QoQ)
The Retail Sales data, released by Statistics New Zealand on a quarterly basis, measures the volume of sales of goods by retailers in New Zealand. Changes in Retail Sales are widely followed as an indicator of consumer spending. Percent changes reflect the rate of changes in such sales, with the QoQ reading comparing sales volumes in the reference quarter with the previous quarter. Generally, a high reading is seen as bullish for the New Zealand Dollar (NZD), while a low reading is seen as bearish.
The quarterly release of Retail Sales by the Statistics New Zealand directly reflects on the country’s consumer spending. Stronger sales could drive inflation higher, leading the Reserve Bank of New Zealand (RBNZ) to hike interest rates so as to maintain its inflation-containment mandate. Thus, the indicator impacts the New Zealand dollar significantly. A better-than-expected print tends to be NZD bullish. The data is published about a month and a half after the quarter ends.
The Australian Dollar advanced as the Chinese government announced its annual policy statement for 2025 on Sunday.
The AUD received support from President Trump’s announcement of potential progress in trade negotiations with China.
The US Dollar struggles following the downbeat US economic data released last week.
The Australian Dollar (AUD) retraces its recent losses from the previous session on Monday following the Chinese government’s release of its annual policy statement for 2025 on Sunday. The statement details strategies to advance rural reforms and promote comprehensive rural revitalization. Optimism around China’s stimulus plans could strengthen the AUD, given China’s role as a key trading partner for Australia.
The AUD/USD pair also gained ground as US President Donald Trump announced potential progress in trade negotiations with China, easing market concerns over tariffs. Investors will closely monitor Trump's further tariff headlines.
The Reserve Bank of Australia (RBA) lowered its Official Cash Rate (OCR) by 25 basis points to 4.10% last week—the first rate cut in four years. Reserve Bank of Australia (RBA) Governor Michele Bullock acknowledged the impact of high interest rates but cautioned that it was too soon to declare victory over inflation. She also emphasized the labor market's strength and clarified that future rate cuts are not guaranteed, despite market expectations.
Australian Dollar strengthens as the US Dollar falters amid disappointing economic data
The US Dollar Index (DXY), which measures the USD against six major currencies, depreciates below 106.50 at the time of writing. The DXY faced challenges following the downbeat US economic data including Jobless Claims S&P Global Purchasing Managers' Index (PMI) released last week.
US Composite PMI declined to 50.4 in February versus 52.7 prior. Meanwhile, the Manufacturing PMI climbed from 51.2 in February to 51.6 in January, beating the estimation of 51.5. Finally, the Services PMI dropped from 52.9 in January to 49.7 in February, weaker than the 53.0 expected.
US Initial Jobless Claims for the week ending February 14 rose to 219,000, exceeding the expected 215,000. Meanwhile, Continuing Jobless Claims increased to 1.869 million, slightly below the forecast of 1.87 million.
Federal Reserve Board Governor Adriana Kugler stated on Thursday that US inflation still has "some way to go" before reaching the central bank's 2% target, noting that the path remains uncertain, according to Reuters.
St. Louis Fed President Alberto Musalem cautioned about potential stagflation risks and rising inflation expectations. Meanwhile, Atlanta Fed President Raphael Bostic kept the possibility of two rate cuts this year open, contingent on economic developments.
President Trump indicated that a new trade deal with China is possible and expects Chinese President Xi Jinping to visit. He also mentioned discussions with China regarding TikTok and noted that his administration is considering a 25% tariff on lumber and forest products.
The latest Federal Open Market Committee (FOMC) Meeting Minutes reaffirmed the decision to keep interest rates unchanged in January. Policymakers emphasized the need for more time to assess economic activity, labor market trends, and inflation before considering any rate adjustments. The committee also agreed that clear signs of declining inflation are necessary before implementing rate cuts.
President Trump has confirmed that a 25% tariff on pharmaceutical and semiconductor imports will take effect in April. Additionally, he reaffirmed that auto tariffs will remain at 25%, further escalating global trade tensions.
Australia’s Judo Bank Manufacturing PMI rose to 50.6 in February, up from 50.2 in January. The Services PMI improved to 51.4 from 51.2, while the Composite PMI edged up to 51.2 from 51.1.
The Australian Bureau of Statistics (ABS) reported on Thursday that Australia’s seasonally adjusted Unemployment Rate rose to 4.1% in January from 4.0% in December, aligning with market expectations. Additionally, Employment Change came in at 44K for January, down from a revised 60K in December (previously 56.3K), but still exceeding the consensus forecast of 20K.
Reserve Bank of Australia (RBA) Deputy Governor Andrew Hauser stated while speaking to Bloomberg News last week that the central bank’s policy “is still restrictive.” Hauser noted that the latest jobs data showed little cause for concern.
Australian Dollar could test 0.6350 support near nine-day EMA
AUD/USD trades near 0.6370 on Monday, moving within an ascending channel that reflects bullish market sentiment. The 14-day Relative Strength Index (RSI) stays above 50, supporting the positive outlook.
On the upside, the AUD/USD pair could challenge the key psychological resistance at 0.6400, with the next hurdle at the ascending channel’s upper boundary around 0.6430.
The AUD/USD pair could find immediate support at the nine-day Exponential Moving Average (EMA) of 0.6347, followed by the 14-day EMA at 0.6330. A stronger support zone aligns with the channel’s lower boundary near 0.6320.
AUD/USD: Daily Chart
Australian Dollar PRICE Today
The table below shows the percentage change of Australian Dollar (AUD) against listed major currencies today. Australian Dollar was the strongest against the US Dollar.
USD
EUR
GBP
JPY
CAD
AUD
NZD
CHF
USD
-0.42%
-0.28%
-0.07%
-0.14%
-0.13%
-0.07%
-0.15%
EUR
0.42%
0.06%
0.17%
0.10%
0.29%
0.17%
0.10%
GBP
0.28%
-0.06%
0.17%
0.04%
0.23%
0.12%
0.04%
JPY
0.07%
-0.17%
-0.17%
-0.06%
0.04%
0.10%
0.02%
CAD
0.14%
-0.10%
-0.04%
0.06%
-0.04%
0.08%
0.00%
AUD
0.13%
-0.29%
-0.23%
-0.04%
0.04%
-0.11%
-0.18%
NZD
0.07%
-0.17%
-0.12%
-0.10%
-0.08%
0.11%
-0.07%
CHF
0.15%
-0.10%
-0.04%
-0.02%
-0.00%
0.18%
0.07%
The heat map shows percentage changes of major currencies against each other. The base currency is picked from the left column, while the quote currency is picked from the top row. For example, if you pick the Australian Dollar from the left column and move along the horizontal line to the US Dollar, the percentage change displayed in the box will represent AUD (base)/USD (quote).
Australian Dollar FAQs
One of the most significant factors for the Australian Dollar (AUD) is the level of interest rates set by the Reserve Bank of Australia (RBA). Because Australia is a resource-rich country another key driver is the price of its biggest export, Iron Ore. The health of the Chinese economy, its largest trading partner, is a factor, as well as inflation in Australia, its growth rate and Trade Balance. Market sentiment – whether investors are taking on more risky assets (risk-on) or seeking safe-havens (risk-off) – is also a factor, with risk-on positive for AUD.
The Reserve Bank of Australia (RBA) influences the Australian Dollar (AUD) by setting the level of interest rates that Australian banks can lend to each other. This influences the level of interest rates in the economy as a whole. The main goal of the RBA is to maintain a stable inflation rate of 2-3% by adjusting interest rates up or down. Relatively high interest rates compared to other major central banks support the AUD, and the opposite for relatively low. The RBA can also use quantitative easing and tightening to influence credit conditions, with the former AUD-negative and the latter AUD-positive.
China is Australia’s largest trading partner so the health of the Chinese economy is a major influence on the value of the Australian Dollar (AUD). When the Chinese economy is doing well it purchases more raw materials, goods and services from Australia, lifting demand for the AUD, and pushing up its value. The opposite is the case when the Chinese economy is not growing as fast as expected. Positive or negative surprises in Chinese growth data, therefore, often have a direct impact on the Australian Dollar and its pairs.
Iron Ore is Australia’s largest export, accounting for $118 billion a year according to data from 2021, with China as its primary destination. The price of Iron Ore, therefore, can be a driver of the Australian Dollar. Generally, if the price of Iron Ore rises, AUD also goes up, as aggregate demand for the currency increases. The opposite is the case if the price of Iron Ore falls. Higher Iron Ore prices also tend to result in a greater likelihood of a positive Trade Balance for Australia, which is also positive of the AUD.
The Trade Balance, which is the difference between what a country earns from its exports versus what it pays for its imports, is another factor that can influence the value of the Australian Dollar. If Australia produces highly sought after exports, then its currency will gain in value purely from the surplus demand created from foreign buyers seeking to purchase its exports versus what it spends to purchase imports. Therefore, a positive net Trade Balance strengthens the AUD, with the opposite effect if the Trade Balance is negative.
Gold price loses momentum to around $2,925 in Monday’s early Asian session, losing 0.38% on the day.
Investors take profits from Gold after reaching the previous session's record high.
Fears of a global trade war sparked by Trump might keep demand for the safe-haven elevated.
Gold price (XAU/USD) drifts lower to near $2,925 during the Asian trading hours on Monday. The precious metal eases from a record high on profit-taking. However, the uncertainty and concerns over US President Donald Trump's tariff plans might cap the downside for Gold price.
The yellow metal faces some selling pressure after retreating from an all-time high of $2,954 last week. "It's just a classical movement of new all-time highs and profit-taking... (but) the fundamentals for gold remain solid," said Alex Ebkarian, chief operating officer at Allegiance Gold.
The uncertainties surrounding global economic growth and political instability have underscored investor appetite for bullion. Last week, Trump said that he will announce new tariffs within the next month, adding lumber and forest products to previously announced plans to impose duties on imported cars, semiconductors and pharmaceuticals.
“Ongoing trade tensions continue to stoke inflation and growth concerns, and therefore safe-haven interest in gold,” said Peter Grant, vice president and senior metals strategist at Zaner Metals.
On the other hand, Minutes of the Federal Reserve’s (Fed) January meeting released last week showed that Trump’s initial policy proposals had stoked concerns over rising inflation, reinforcing the Fed’s stance to hold off on further rate cuts. This, in turn, could lift the Greenback and weigh on the USD-denominated commodity price in the near term.
Gold FAQs
Gold has played a key role in human’s history as it has been widely used as a store of value and medium of exchange. Currently, apart from its shine and usage for jewelry, the precious metal is widely seen as a safe-haven asset, meaning that it is considered a good investment during turbulent times. Gold is also widely seen as a hedge against inflation and against depreciating currencies as it doesn’t rely on any specific issuer or government.
Central banks are the biggest Gold holders. In their aim to support their currencies in turbulent times, central banks tend to diversify their reserves and buy Gold to improve the perceived strength of the economy and the currency. High Gold reserves can be a source of trust for a country’s solvency. Central banks added 1,136 tonnes of Gold worth around $70 billion to their reserves in 2022, according to data from the World Gold Council. This is the highest yearly purchase since records began. Central banks from emerging economies such as China, India and Turkey are quickly increasing their Gold reserves.
Gold has an inverse correlation with the US Dollar and US Treasuries, which are both major reserve and safe-haven assets. When the Dollar depreciates, Gold tends to rise, enabling investors and central banks to diversify their assets in turbulent times. Gold is also inversely correlated with risk assets. A rally in the stock market tends to weaken Gold price, while sell-offs in riskier markets tend to favor the precious metal.
The price can move due to a wide range of factors. Geopolitical instability or fears of a deep recession can quickly make Gold price escalate due to its safe-haven status. As a yield-less asset, Gold tends to rise with lower interest rates, while higher cost of money usually weighs down on the yellow metal. Still, most moves depend on how the US Dollar (USD) behaves as the asset is priced in dollars (XAU/USD). A strong Dollar tends to keep the price of Gold controlled, whereas a weaker Dollar is likely to push Gold prices up.
On Monday, the People’s Bank of China (PBOC) set the USD/CNY central rate for the trading session ahead at 7.1717 as compared to Friday's fix of 7.1696 and 7.2498 Reuters estimates.
PBOC FAQs
The primary monetary policy objectives of the People's Bank of China (PBoC) are to safeguard price stability, including exchange rate stability, and promote economic growth. China’s central bank also aims to implement financial reforms, such as opening and developing the financial market.
The PBoC is owned by the state of the People's Republic of China (PRC), so it is not considered an autonomous institution. The Chinese Communist Party (CCP) Committee Secretary, nominated by the Chairman of the State Council, has a key influence on the PBoC’s management and direction, not the governor. However, Mr. Pan Gongsheng currently holds both of these posts.
Unlike the Western economies, the PBoC uses a broader set of monetary policy instruments to achieve its objectives. The primary tools include a seven-day Reverse Repo Rate (RRR), Medium-term Lending Facility (MLF), foreign exchange interventions and Reserve Requirement Ratio (RRR). However, The Loan Prime Rate (LPR) is China’s benchmark interest rate. Changes to the LPR directly influence the rates that need to be paid in the market for loans and mortgages and the interest paid on savings. By changing the LPR, China’s central bank can also influence the exchange rates of the Chinese Renminbi.
Yes, China has 19 private banks – a small fraction of the financial system. The largest private banks are digital lenders WeBank and MYbank, which are backed by tech giants Tencent and Ant Group, per The Straits Times. In 2014, China allowed domestic lenders fully capitalized by private funds to operate in the state-dominated financial sector.
GBP/USD regains positive traction on Monday amid the emergence of fresh USD selling.
The USD drops to over a two-month trough amid concerns over US consumer health.
The GBP bulls shrug off the BoJ’s gloomy outlook and remain at the mercy of the USD.
The GBP/USD pair kicks off the new week on a positive note and climbs above mid-1.2600s during the Asian session, closer to over a two-month top touched on Friday. Spot prices now look to build on the momentum beyond the 100-day Simple Moving Average (SMA) amid a weaker sentiment surrounding the US Dollar (USD).
In fact, the USD Index (DXY), which tracks the Greenback against a basket of currencies, drops to its lowest level since December 10 amid doubts about US consumer health, fueled by a disappointing sales forecast from Walmart. Moreover, worries over the impact of US President Donald Trump's tariffs on price growth and consumer spending, along with a pickup in US stock futures, turn out to be key factors undermining the safe-haven buck.
The British Pound (GBP), on the other hand, continues to draw support from Friday's upbeat UK Retail Sales, which climbed 1.7% MoM in January compared to the previous month's upwardly revised print of -0.6%. Adding to this, the UK Services PMI unexpectedly rose to 51.1 in February from 50.9 in the previous month. This, to a larger extent, overshadowed a fall in the UK Manufacturing PMI to a 14-month low level of 46.4 in February.
The GBP/USD pair, meanwhile, seems rather unaffected by the Bank of England's (BoE) gloomy outlook and remains at the mercy of the USD price dynamics. In the absence of any relevant market-moving economic releases, the fundamental backdrop suggests that the path of least resistance for spot prices remains to the upside. This, in turn, supports prospects for an extension of the recent well-established uptrend witnessed over the past month or so.
Pound Sterling FAQs
The Pound Sterling (GBP) is the oldest currency in the world (886 AD) and the official currency of the United Kingdom. It is the fourth most traded unit for foreign exchange (FX) in the world, accounting for 12% of all transactions, averaging $630 billion a day, according to 2022 data. Its key trading pairs are GBP/USD, also known as ‘Cable’, which accounts for 11% of FX, GBP/JPY, or the ‘Dragon’ as it is known by traders (3%), and EUR/GBP (2%). The Pound Sterling is issued by the Bank of England (BoE).
The single most important factor influencing the value of the Pound Sterling is monetary policy decided by the Bank of England. The BoE bases its decisions on whether it has achieved its primary goal of “price stability” – a steady inflation rate of around 2%. Its primary tool for achieving this is the adjustment of interest rates. When inflation is too high, the BoE will try to rein it in by raising interest rates, making it more expensive for people and businesses to access credit. This is generally positive for GBP, as higher interest rates make the UK a more attractive place for global investors to park their money. When inflation falls too low it is a sign economic growth is slowing. In this scenario, the BoE will consider lowering interest rates to cheapen credit so businesses will borrow more to invest in growth-generating projects.
Data releases gauge the health of the economy and can impact the value of the Pound Sterling. Indicators such as GDP, Manufacturing and Services PMIs, and employment can all influence the direction of the GBP. A strong economy is good for Sterling. Not only does it attract more foreign investment but it may encourage the BoE to put up interest rates, which will directly strengthen GBP. Otherwise, if economic data is weak, the Pound Sterling is likely to fall.
Another significant data release for the Pound Sterling is the Trade Balance. This indicator measures the difference between what a country earns from its exports and what it spends on imports over a given period. If a country produces highly sought-after exports, its currency will benefit purely from the extra demand created from foreign buyers seeking to purchase these goods. Therefore, a positive net Trade Balance strengthens a currency and vice versa for a negative balance.
China unveiled the State Council’s annual rural policy blueprint for 2025, known as the “No.1 document” on Sunday, outlining the priorities for further deepening rural reforms and taking solid steps in advancing all-around rural revitalization, per CNBC.
The document highlights further boosting the supply of key agricultural products to safeguard grain security and developing new quality productive forces in agriculture, among other tasks.
Market reaction
At the time of writing, AUD/USD is trading 0.18% higher on the day at 0.6370.
Australian Dollar FAQs
One of the most significant factors for the Australian Dollar (AUD) is the level of interest rates set by the Reserve Bank of Australia (RBA). Because Australia is a resource-rich country another key driver is the price of its biggest export, Iron Ore. The health of the Chinese economy, its largest trading partner, is a factor, as well as inflation in Australia, its growth rate and Trade Balance. Market sentiment – whether investors are taking on more risky assets (risk-on) or seeking safe-havens (risk-off) – is also a factor, with risk-on positive for AUD.
The Reserve Bank of Australia (RBA) influences the Australian Dollar (AUD) by setting the level of interest rates that Australian banks can lend to each other. This influences the level of interest rates in the economy as a whole. The main goal of the RBA is to maintain a stable inflation rate of 2-3% by adjusting interest rates up or down. Relatively high interest rates compared to other major central banks support the AUD, and the opposite for relatively low. The RBA can also use quantitative easing and tightening to influence credit conditions, with the former AUD-negative and the latter AUD-positive.
China is Australia’s largest trading partner so the health of the Chinese economy is a major influence on the value of the Australian Dollar (AUD). When the Chinese economy is doing well it purchases more raw materials, goods and services from Australia, lifting demand for the AUD, and pushing up its value. The opposite is the case when the Chinese economy is not growing as fast as expected. Positive or negative surprises in Chinese growth data, therefore, often have a direct impact on the Australian Dollar and its pairs.
Iron Ore is Australia’s largest export, accounting for $118 billion a year according to data from 2021, with China as its primary destination. The price of Iron Ore, therefore, can be a driver of the Australian Dollar. Generally, if the price of Iron Ore rises, AUD also goes up, as aggregate demand for the currency increases. The opposite is the case if the price of Iron Ore falls. Higher Iron Ore prices also tend to result in a greater likelihood of a positive Trade Balance for Australia, which is also positive of the AUD.
The Trade Balance, which is the difference between what a country earns from its exports versus what it pays for its imports, is another factor that can influence the value of the Australian Dollar. If Australia produces highly sought after exports, then its currency will gain in value purely from the surplus demand created from foreign buyers seeking to purchase its exports versus what it spends to purchase imports. Therefore, a positive net Trade Balance strengthens the AUD, with the opposite effect if the Trade Balance is negative.
AUD/USD drifts higher to near 0.6370 in Monday’s early Asian session, adding 0.25% on the day.
China vowed to adopt more targeted measures to stimulate consumer spending, supporting the Aussie.
Renewed trade tensions could boost the US dollar and cap the upside for the pair.
The AUD/USD pair edges higher to near 0.6370 during the early Asian session on Monday. The Australian Dollar (AUD) attracts some buyers as the Chinese government announced rural revitalisation plans in its annual policy blueprint.
According to the State Council’s annual rural policy blueprint, China will intensify rural reforms to revitalize the agriculture sector and strengthen food security in the face of US tariffs, an economic slowdown, and climate change. Additionally, Premier Li Qiang said on Thursday that China will direct more efforts to boosting consumption and lifting people's livelihoods. Any positive development surrounding China’s stimulus plans could lift the China-proxy Australian Dollar as China is a major trading partner to Australia.
The downbeat US economic data drags the Greenback lower and creates a tailwind for AUD/USD. Data released by S&P Global on Friday showed that the Composite PMI declined to 50.4 in February versus 52.7 prior. Meanwhile, the Manufacturing PMI climbed from 51.2 in February to 51.6 in January, beating the estimation of 51.5. Finally, the Services PMI dropped from 52.9 in January to 49.7 in February, weaker than the 53.0 expected.
Investors will keep an eye on inflation data this week and closely monitor the tariff headlines from US President Donald Trump. Any signs of uncertainty and escalating trade tensions could boost the US Dollar (USD), a safe-haven currency.
Australian Dollar FAQs
One of the most significant factors for the Australian Dollar (AUD) is the level of interest rates set by the Reserve Bank of Australia (RBA). Because Australia is a resource-rich country another key driver is the price of its biggest export, Iron Ore. The health of the Chinese economy, its largest trading partner, is a factor, as well as inflation in Australia, its growth rate and Trade Balance. Market sentiment – whether investors are taking on more risky assets (risk-on) or seeking safe-havens (risk-off) – is also a factor, with risk-on positive for AUD.
The Reserve Bank of Australia (RBA) influences the Australian Dollar (AUD) by setting the level of interest rates that Australian banks can lend to each other. This influences the level of interest rates in the economy as a whole. The main goal of the RBA is to maintain a stable inflation rate of 2-3% by adjusting interest rates up or down. Relatively high interest rates compared to other major central banks support the AUD, and the opposite for relatively low. The RBA can also use quantitative easing and tightening to influence credit conditions, with the former AUD-negative and the latter AUD-positive.
China is Australia’s largest trading partner so the health of the Chinese economy is a major influence on the value of the Australian Dollar (AUD). When the Chinese economy is doing well it purchases more raw materials, goods and services from Australia, lifting demand for the AUD, and pushing up its value. The opposite is the case when the Chinese economy is not growing as fast as expected. Positive or negative surprises in Chinese growth data, therefore, often have a direct impact on the Australian Dollar and its pairs.
Iron Ore is Australia’s largest export, accounting for $118 billion a year according to data from 2021, with China as its primary destination. The price of Iron Ore, therefore, can be a driver of the Australian Dollar. Generally, if the price of Iron Ore rises, AUD also goes up, as aggregate demand for the currency increases. The opposite is the case if the price of Iron Ore falls. Higher Iron Ore prices also tend to result in a greater likelihood of a positive Trade Balance for Australia, which is also positive of the AUD.
The Trade Balance, which is the difference between what a country earns from its exports versus what it pays for its imports, is another factor that can influence the value of the Australian Dollar. If Australia produces highly sought after exports, then its currency will gain in value purely from the surplus demand created from foreign buyers seeking to purchase its exports versus what it spends to purchase imports. Therefore, a positive net Trade Balance strengthens the AUD, with the opposite effect if the Trade Balance is negative.
Giao dịch trên thị trường tài chính (đặc biệt là giao dịch sử dụng các công cụ biên) mở ra những cơ hội lớn và tạo điều kiện cho các nhà đầu tư sẵn sàng mạo hiểm để thu lợi nhuận, tuy nhiên nó mang trong mình nguy cơ rủi ro khá cao. Chính vì vậy trước khi tiến hành giao dịch cần phải xem xét mọi mặt vấn đề chấp nhận tiến hành giao dịch cụ thể xét theo quan điểm của nguồn lực tài chính sẵn có và mức độ am hiểu thị trường tài chính.
Sử dụng thông tin: sử dụng toàn bộ hay riêng biệt các dữ liệu trên trang web của công ty TeleTrade như một nguồn cung cấp thông tin nhất định. Việc sử dụng tư liệu từ trang web cần kèm theo liên kết đến trang teletrade.vn. Việc tự động thu thập số liệu cũng như thông tin từ trang web TeleTrade đều không được phép.
Nhấn nút "Đăng ký" để nhận thông báo về chương trình khuyến mãi và Bonus
Cảm ơn bạn đã ghé thăm teletrade.org!
Thông tin trên trang web này có thể không tuân thủ luật pháp của quốc gia nơi bạn sống.
Vẫn xem thông tin.
Tôi xác nhận rằng các tài liệu trên trang web này không dành cho cư dân EU và tôi có thể không có quyền đăng ký tài khoản bên teletrade.org, nhưng tôi vẫn muốn tiếp tục.