LƯU Ý: Tài liệu trong nguồn cấp dữ liệu tin tức và phân tích được cập nhật tự động, tải lại trang có thể làm chậm quá trình xuất hiện tài liệu mới. Để nhận được tài liệu nhanh chóng, chúng tôi khuyên bạn nên luôn mở nguồn cấp tin tức.
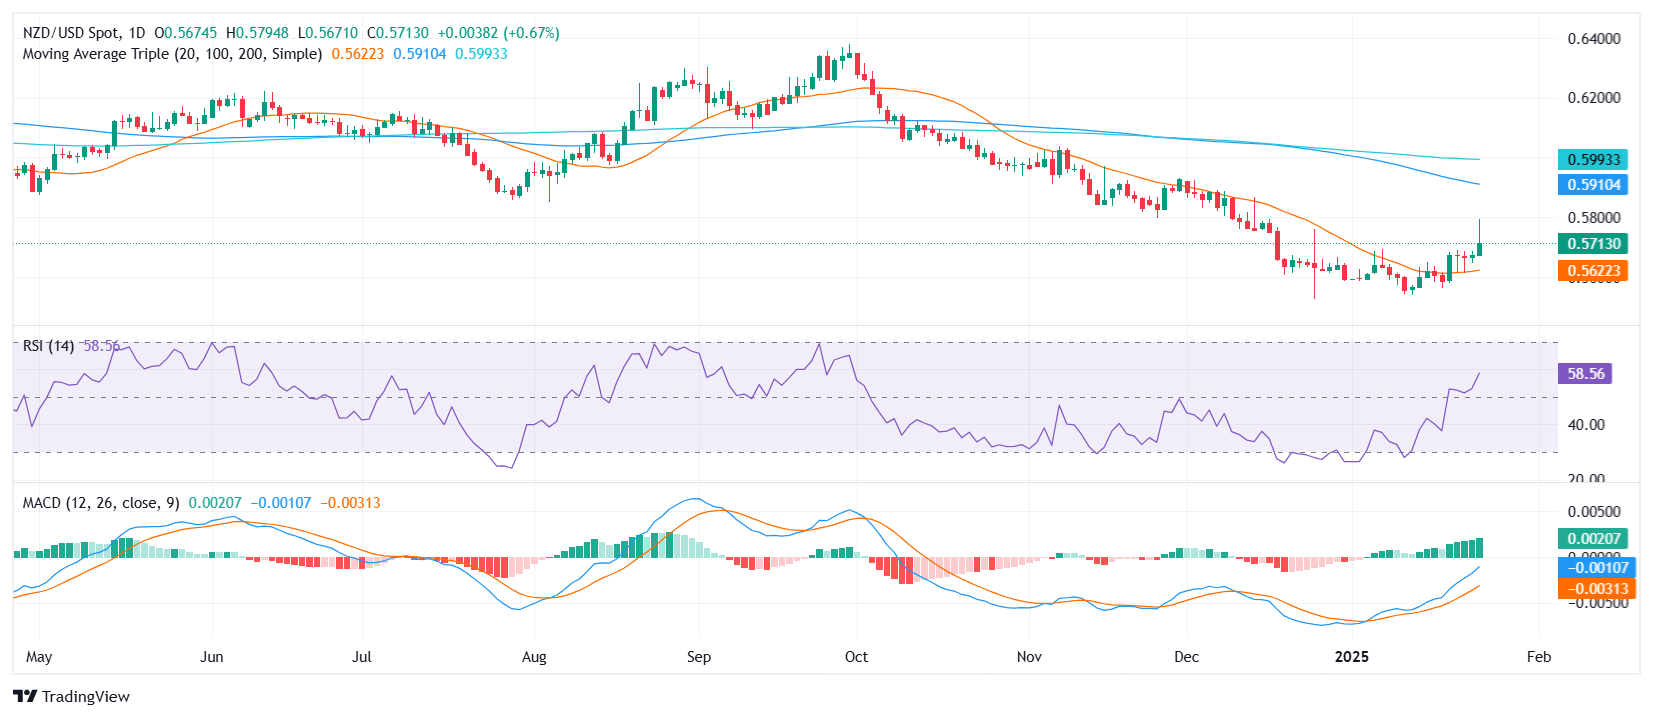
NZD/USD advances on Friday, holding above the key 0.5700 level.
The pair maintains its uptrend, supported by bullish technical indicators.
Focus remains on whether momentum can push the pair toward the next resistance level at 0.5750.
The NZD/USD pair continued its upward trajectory on Friday, rising by 0.44% to settle at 0.5705 and mantains its footing above its 20-day Simple Moving Average (SMA). This marks a steady continuation of the bullish momentum observed since mid-January, which was initiated by a breakout above the 0.5600 level. While minor pullbacks earlier in the week reflected potential profit-taking, the pair has maintained its position above 0.5700, signaling strong buying interest. On the negative side, the pair failed to sustain its intraday push near 0.5800.
Technical indicators align with the pair’s positive outlook. The Relative Strength Index (RSI) has climbed sharply to 63, firmly in positive territory, suggesting healthy upward momentum and room for further gains. Meanwhile, the Moving Average Convergence Divergence (MACD) histogram shows flat green bars, indicating sustained buying pressure despite a temporary pause in acceleration.
Immediate resistance is now seen at 0.5750, a level that could act as a gateway for the pair to aim higher. On the downside, support is found at 0.5670, followed by a more robust floor around 0.5640. As long as the pair stays above these support levels, the bullish trajectory remains intact, with potential for further appreciation in the near term.
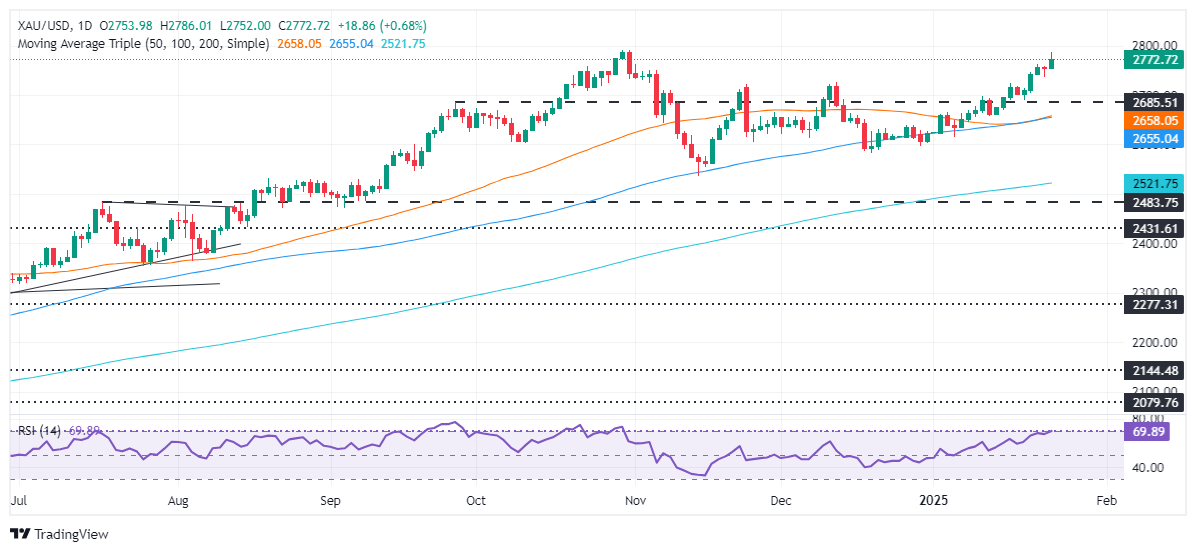
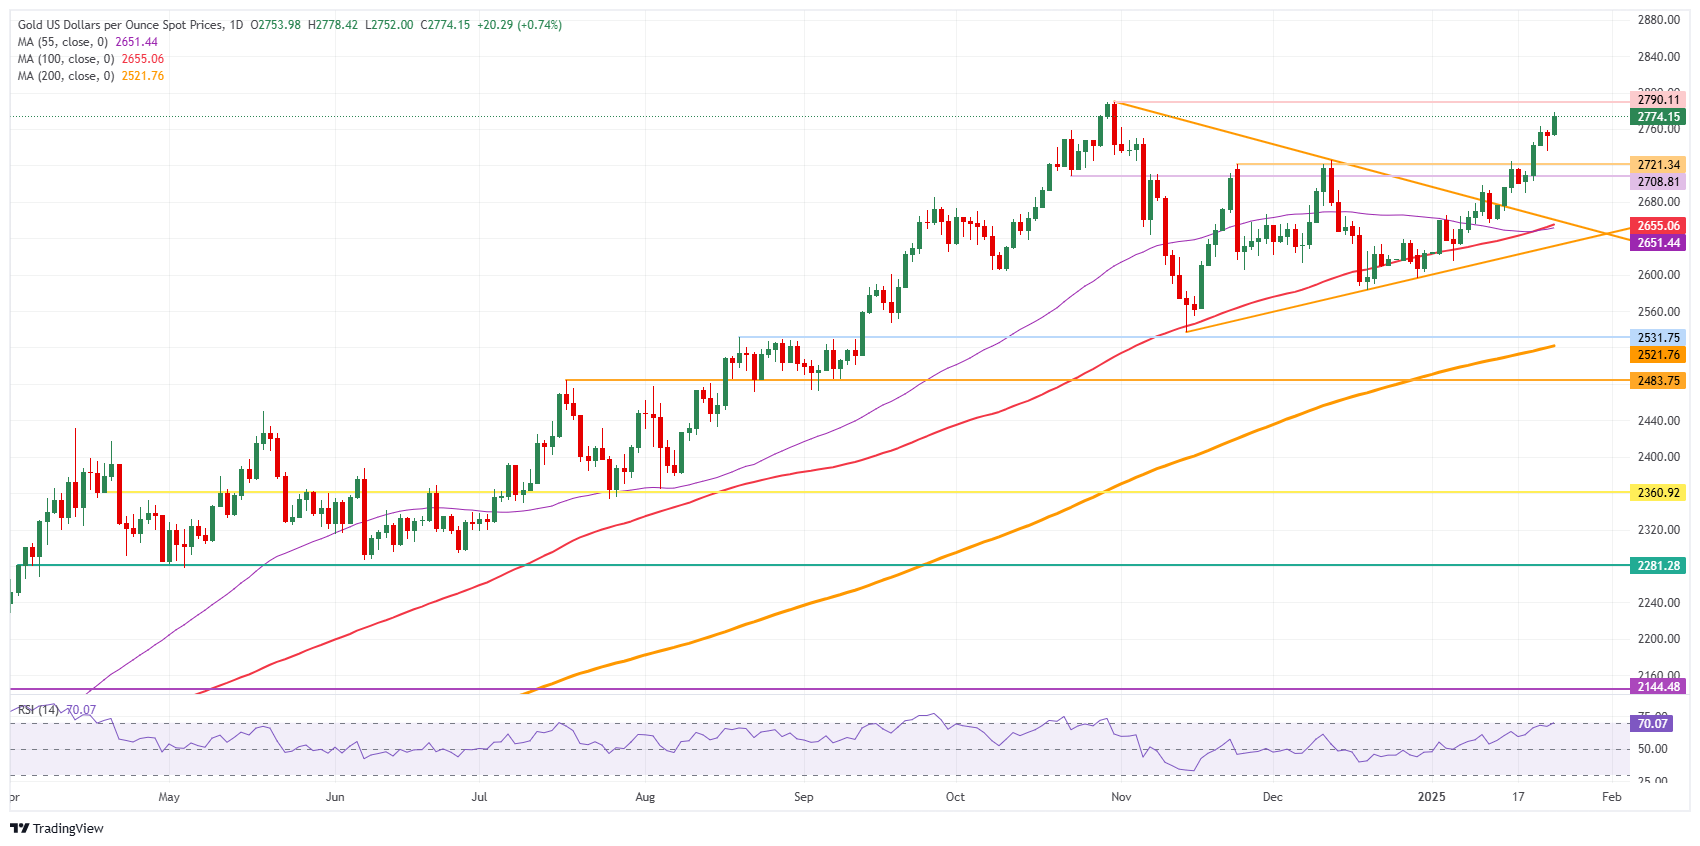
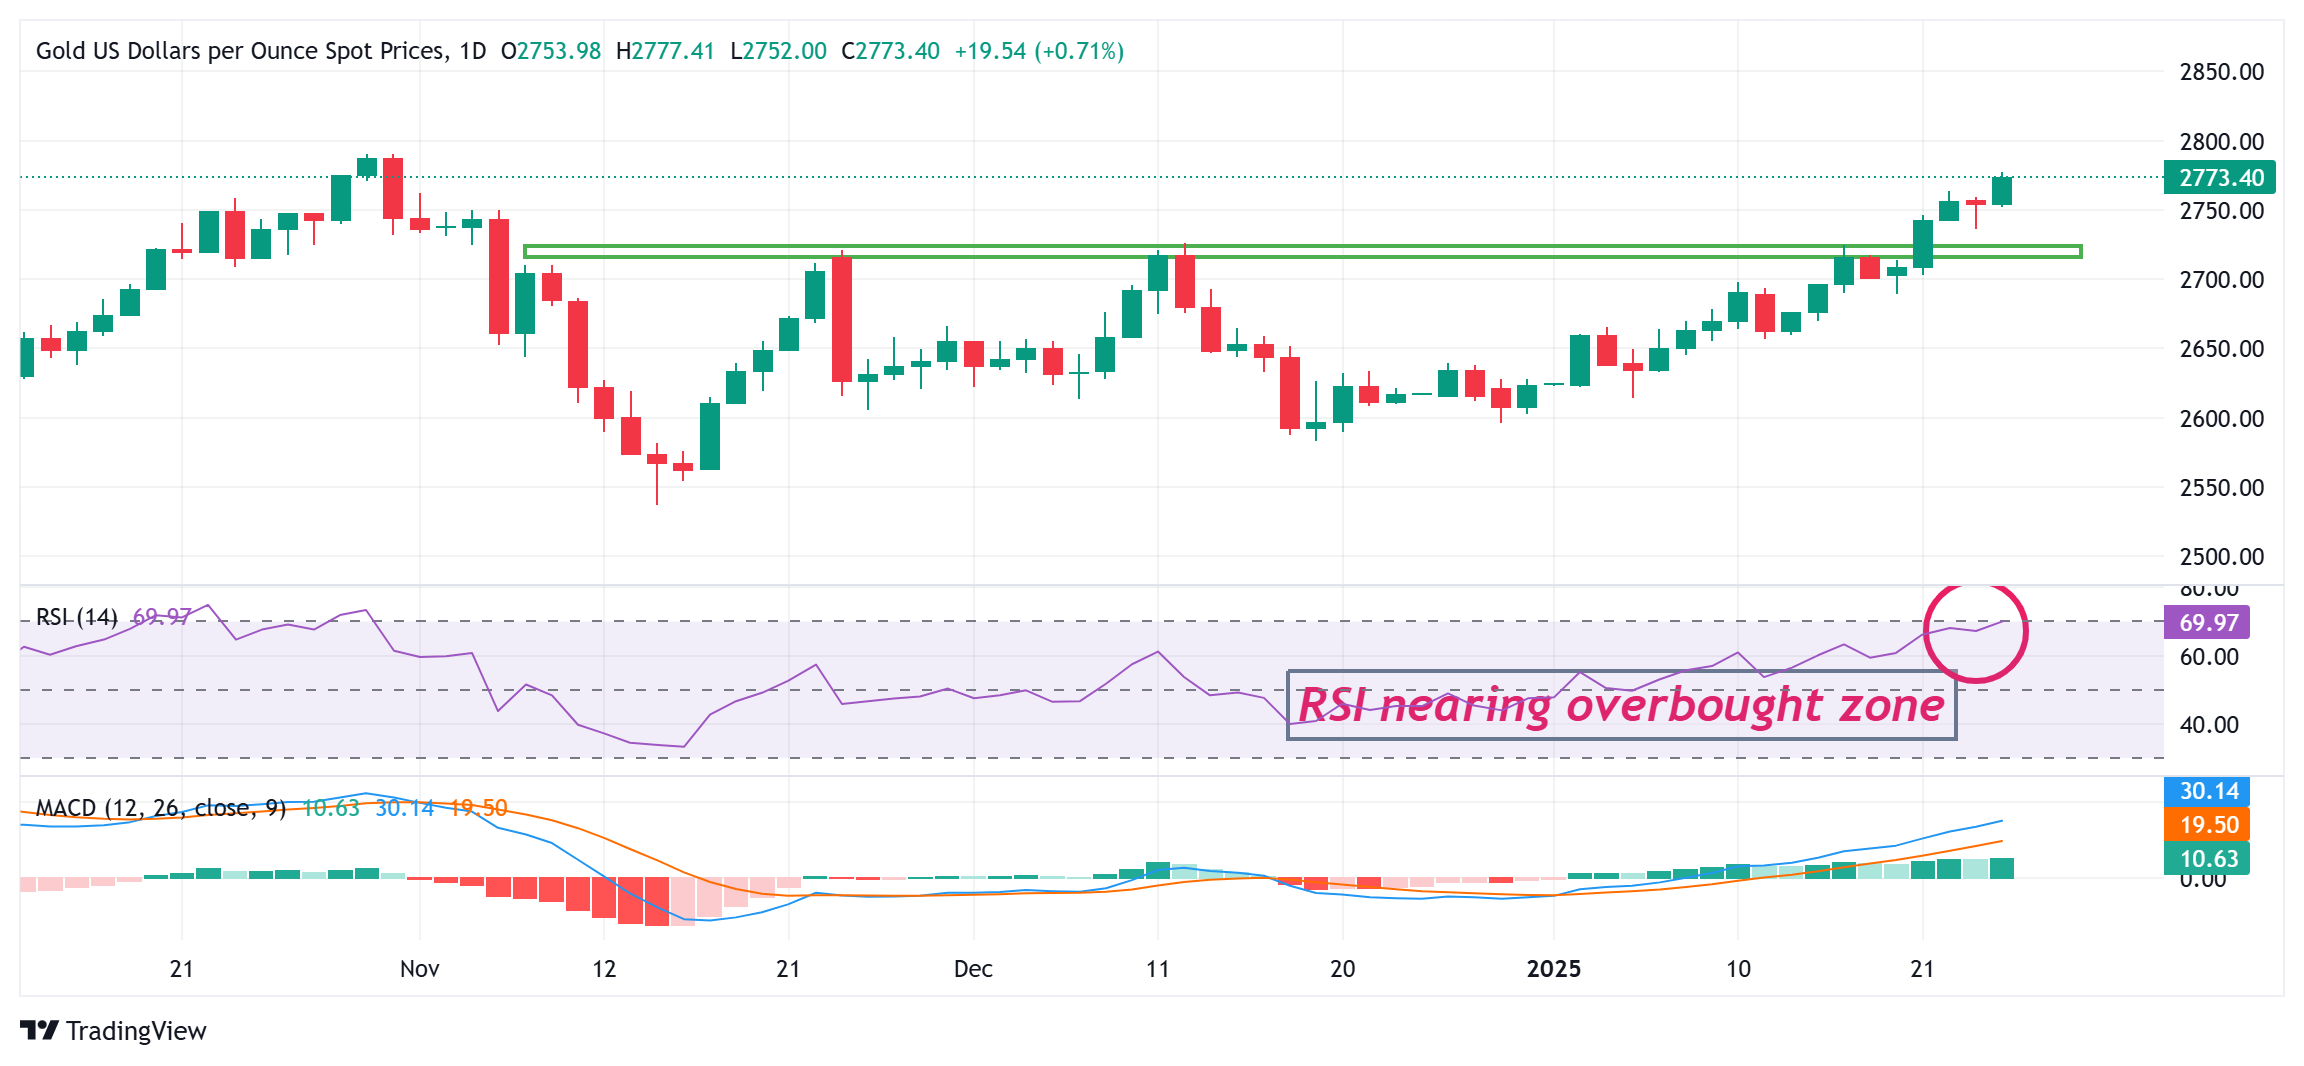
Gold nears all-time high, rises amid volatile US policy statements.
Trump's WEF comments soften on Chinese tariffs and advocate lower rates, affecting the dollar.
The US Dollar Index drops 0.62% to 107.44, weakening the Greenback and enhancing gold's hedge appeal.
Gold price extended its weekly gains, poised to challenge the all-time high of $2,790 rather sooner than later. Comments by United States (US) President Donald Trump could be the catalyst that pushes the yellow metal higher, though he surprised traders as he might refrain from imposing duties on Chinese products. The XAU/USD trades at $2,772, up 0.60%.
The market mood shifted slightly negatively even though Trump has eased the trade policy rhetoric against allies and adversaries. US economic data on Friday hinted that manufacturing activity improved in December, according to S&P Global, while Consumer Sentiment deteriorated, reported the University of Michigan (UoM) final survey for January.
However, Trump’s harsh rhetoric is not limited to the trade deficit. At the World Economic Forum (WEF) he added that he would demand lower interest rates.
After his remarks, the Greenback tumbled and remains on the defensive, as seen by the US Dollar Index (DXY), which tracks the American currency's value against a basket of six currencies. It edges down 0.62% to 107.44.
The buck is set to end the week with losses of 1.77% in the first week of US President Donald Trump in office.
Next week, the US economic docket will feature the release of Durable Goods Orders, the Federal Reserve’s (Fed) interest rate decision, Gross Domestic Product (GDP) figures and the Fed’s preferred inflation gauge, the Core Personal Consumption Expenditures (PCE) Price Index.
Daily digest market movers: Gold price climbs above $2,770 on solid US data
Gold price rose ignoring the advance of real yields. Measured by the 10-year Treasury Inflation-Protected Securities (TIPS), yield sits at 2.23%, up by one and a half basis points (bps).
The US 10-year Treasury bond yield slides two bps during the day at 4.625%.
US S&P Global Manufacturing PMI for December improved from 49.4 to 50.1, above estimates of 49.6. Meanwhile, the Services PMI dipped from 56.8 to 52.8, missing forecasts of 56.5
The University of Michigan Consumer Sentiment Final forJanuary expanded by 71.1, below estimates of 73.2 and the preliminary reading of 74.0.
Existing Home Sales in December rose by 2.2% MoM, from 4.15 million to 4.24 million.
Market participants are pricing in near-even odds that the Fed will cut rates twice by the end of 2025 with the first reduction occurring in June.
XAU/USD technical outlook: Gold surges above $2,770 as bulls target ATH
Gold price rally is set to extend but traders must clear the record high of $2,790. Despite this, the formation of a bullish candle with a small upper shadow indicates traders are not accepting higher prices. This is further confirmed by the Relative Strength Index (RSI), which has turned overbought.
XAU/USD must surpass the all-time high (ATH) at $2,790 for a bullish continuation. Once cleared, the next resistance would be $2,800, followed by key psychological levels exposed at $2,850 and $2,900.
Conversely, if bears drag Bullion prices below the $2,750 figure, the 50 and 100-day Simple Moving Averages (SMAs) emerge as support levels, each at $2,656 and $2,653. If surpassed, up next lies the 200-day SMA at $2,520.
Gold FAQs
Gold has played a key role in human’s history as it has been widely used as a store of value and medium of exchange. Currently, apart from its shine and usage for jewelry, the precious metal is widely seen as a safe-haven asset, meaning that it is considered a good investment during turbulent times. Gold is also widely seen as a hedge against inflation and against depreciating currencies as it doesn’t rely on any specific issuer or government.
Central banks are the biggest Gold holders. In their aim to support their currencies in turbulent times, central banks tend to diversify their reserves and buy Gold to improve the perceived strength of the economy and the currency. High Gold reserves can be a source of trust for a country’s solvency. Central banks added 1,136 tonnes of Gold worth around $70 billion to their reserves in 2022, according to data from the World Gold Council. This is the highest yearly purchase since records began. Central banks from emerging economies such as China, India and Turkey are quickly increasing their Gold reserves.
Gold has an inverse correlation with the US Dollar and US Treasuries, which are both major reserve and safe-haven assets. When the Dollar depreciates, Gold tends to rise, enabling investors and central banks to diversify their assets in turbulent times. Gold is also inversely correlated with risk assets. A rally in the stock market tends to weaken Gold price, while sell-offs in riskier markets tend to favor the precious metal.
The price can move due to a wide range of factors. Geopolitical instability or fears of a deep recession can quickly make Gold price escalate due to its safe-haven status. As a yield-less asset, Gold tends to rise with lower interest rates, while higher cost of money usually weighs down on the yellow metal. Still, most moves depend on how the US Dollar (USD) behaves as the asset is priced in dollars (XAU/USD). A strong Dollar tends to keep the price of Gold controlled, whereas a weaker Dollar is likely to push Gold prices up.
20:32
Eurozone CFTC EUR NC Net Positions: €-62.5K vs previous €-60.4K
Pair jumps 0.42% to 0.6315 on Friday, buoyed by broad risk appetite.
Trump expresses willingness to avoid tariffs on China, offers trade deal hints.
Fed rate cut bets and upbeat sentiment pressure the US Dollar.
Traders assess the latest US PMI data amid a potential shift in risk dynamics.
AUD/USD attracted buyers on Friday after President Trump suggested a trade agreement with China remains within reach, reinforcing a risk-on mood. The pair advances to 0.6315, heading for its first weekly gain in three weeks. Meanwhile, renewed speculation regarding additional Federal Reserve (Fed) rate cuts in 2025 continues to undermine the US Dollar, providing an added lift to the Aussie.
Daily digest market movers: Aussie continues its recovery as USD remains soft
The Greenback falls to a one-month trough as markets price in the prospect of further Fed easing by year-end. In addition, President Trump’s statements about immediate interest rate cuts contribute to the latest downside in the USD.
The Reserve Bank of Australia’s (RBA) possible rate cut in February and subdued economic growth might limit the Aussie’s upside.
On the US front, the S&P Global Composite PMI decelerates to 52.4 from 55.4, with Manufacturing climbing to 50.1 and Services dipping to 52.8. Analysts note rising optimism in the manufacturing sector, expecting supportive policies under the Trump administration.
The US President signals reluctance to levy tariffs on China, citing that a trade pact could be finalized. He also reiterates grievances about trade deficits with various nations, including Canada, while calling on OPEC to lower crude oil prices.
AUD/USD technical outlook: Short-term signals turn more upbeat, hinting at potential breakout
The AUD/USD has advanced to 0.6315 on Friday, extending its recent winning streak and edging closer to 0.6330. In the short term, technicals lean constructive: the Moving Average Convergence Divergence (MACD) histogram prints rising green bars, suggesting a budding shift toward bullish momentum. The Relative Strength Index (RSI) stands at 58 and is rising sharply, indicating robust upside pressure.
This combination implies the pair may be on the verge of a more meaningful rebound. A decisive break above 0.6330 would confirm a broader turnaround.
Australian Dollar FAQs
One of the most significant factors for the Australian Dollar (AUD) is the level of interest rates set by the Reserve Bank of Australia (RBA). Because Australia is a resource-rich country another key driver is the price of its biggest export, Iron Ore. The health of the Chinese economy, its largest trading partner, is a factor, as well as inflation in Australia, its growth rate and Trade Balance. Market sentiment – whether investors are taking on more risky assets (risk-on) or seeking safe-havens (risk-off) – is also a factor, with risk-on positive for AUD.
The Reserve Bank of Australia (RBA) influences the Australian Dollar (AUD) by setting the level of interest rates that Australian banks can lend to each other. This influences the level of interest rates in the economy as a whole. The main goal of the RBA is to maintain a stable inflation rate of 2-3% by adjusting interest rates up or down. Relatively high interest rates compared to other major central banks support the AUD, and the opposite for relatively low. The RBA can also use quantitative easing and tightening to influence credit conditions, with the former AUD-negative and the latter AUD-positive.
China is Australia’s largest trading partner so the health of the Chinese economy is a major influence on the value of the Australian Dollar (AUD). When the Chinese economy is doing well it purchases more raw materials, goods and services from Australia, lifting demand for the AUD, and pushing up its value. The opposite is the case when the Chinese economy is not growing as fast as expected. Positive or negative surprises in Chinese growth data, therefore, often have a direct impact on the Australian Dollar and its pairs.
Iron Ore is Australia’s largest export, accounting for $118 billion a year according to data from 2021, with China as its primary destination. The price of Iron Ore, therefore, can be a driver of the Australian Dollar. Generally, if the price of Iron Ore rises, AUD also goes up, as aggregate demand for the currency increases. The opposite is the case if the price of Iron Ore falls. Higher Iron Ore prices also tend to result in a greater likelihood of a positive Trade Balance for Australia, which is also positive of the AUD.
The Trade Balance, which is the difference between what a country earns from its exports versus what it pays for its imports, is another factor that can influence the value of the Australian Dollar. If Australia produces highly sought after exports, then its currency will gain in value purely from the surplus demand created from foreign buyers seeking to purchase its exports versus what it spends to purchase imports. Therefore, a positive net Trade Balance strengthens the AUD, with the opposite effect if the Trade Balance is negative.
20:32
United States CFTC Gold NC Net Positions: $300.8K vs $279.4K
20:32
Australia CFTC AUD NC Net Positions increased to $-71.3K from previous $-77.6K
20:32
Japan CFTC JPY NC Net Positions increased to ¥-14.7K from previous ¥-29.4K
20:32
United Kingdom CFTC GBP NC Net Positions dipped from previous £0.4K to £-8.3K
20:32
United States CFTC Oil NC Net Positions down to 298.8K from previous 306.3K
20:31
United States CFTC S&P 500 NC Net Positions fell from previous $-30.5K to $-75.7K
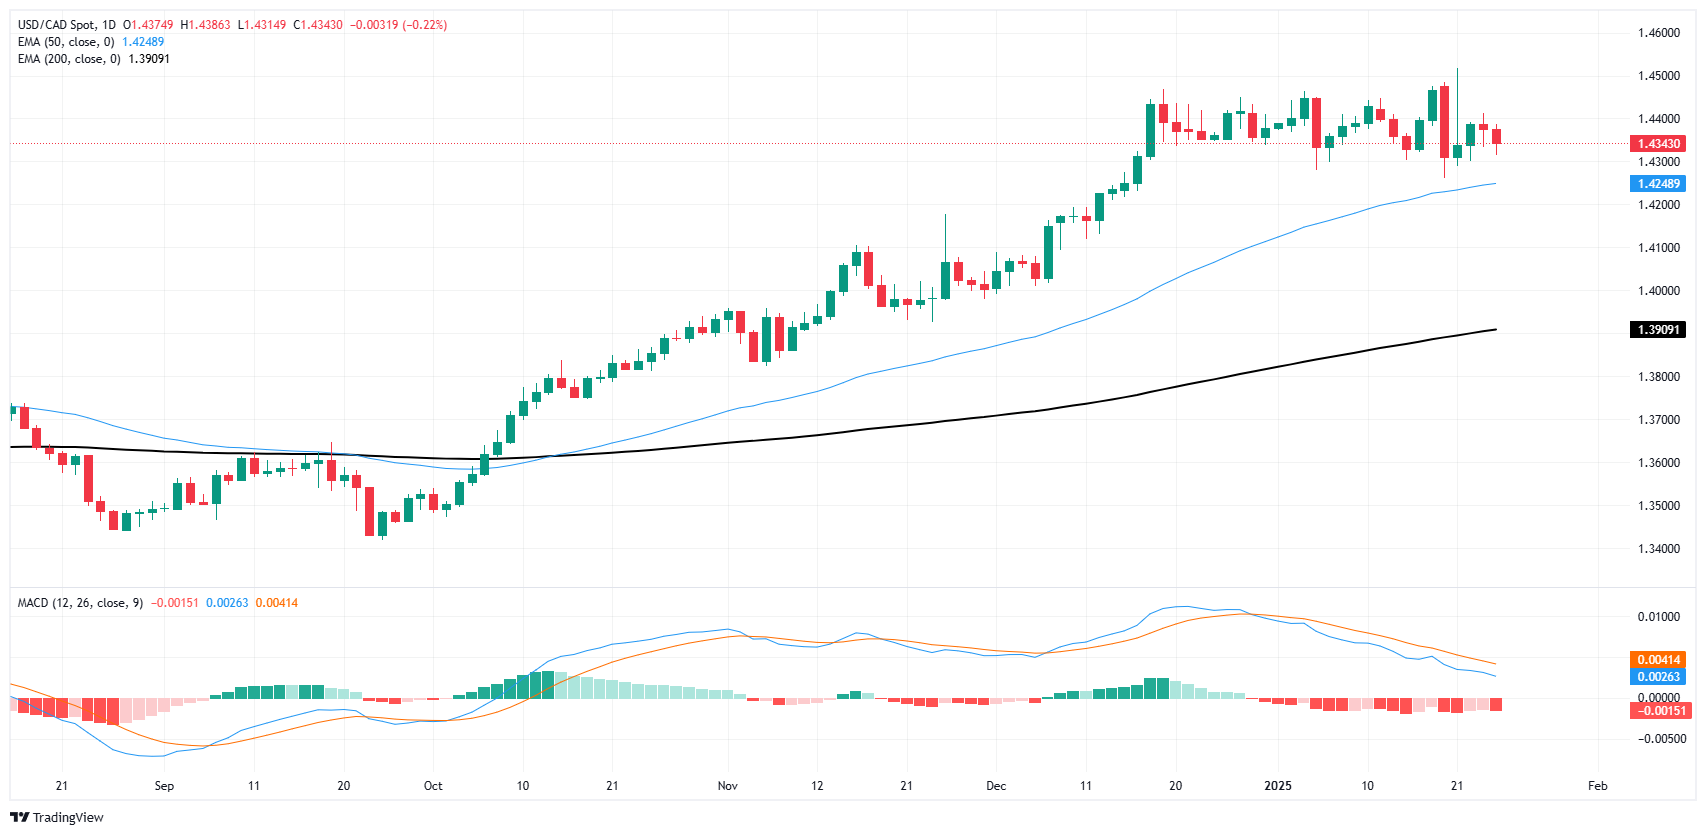
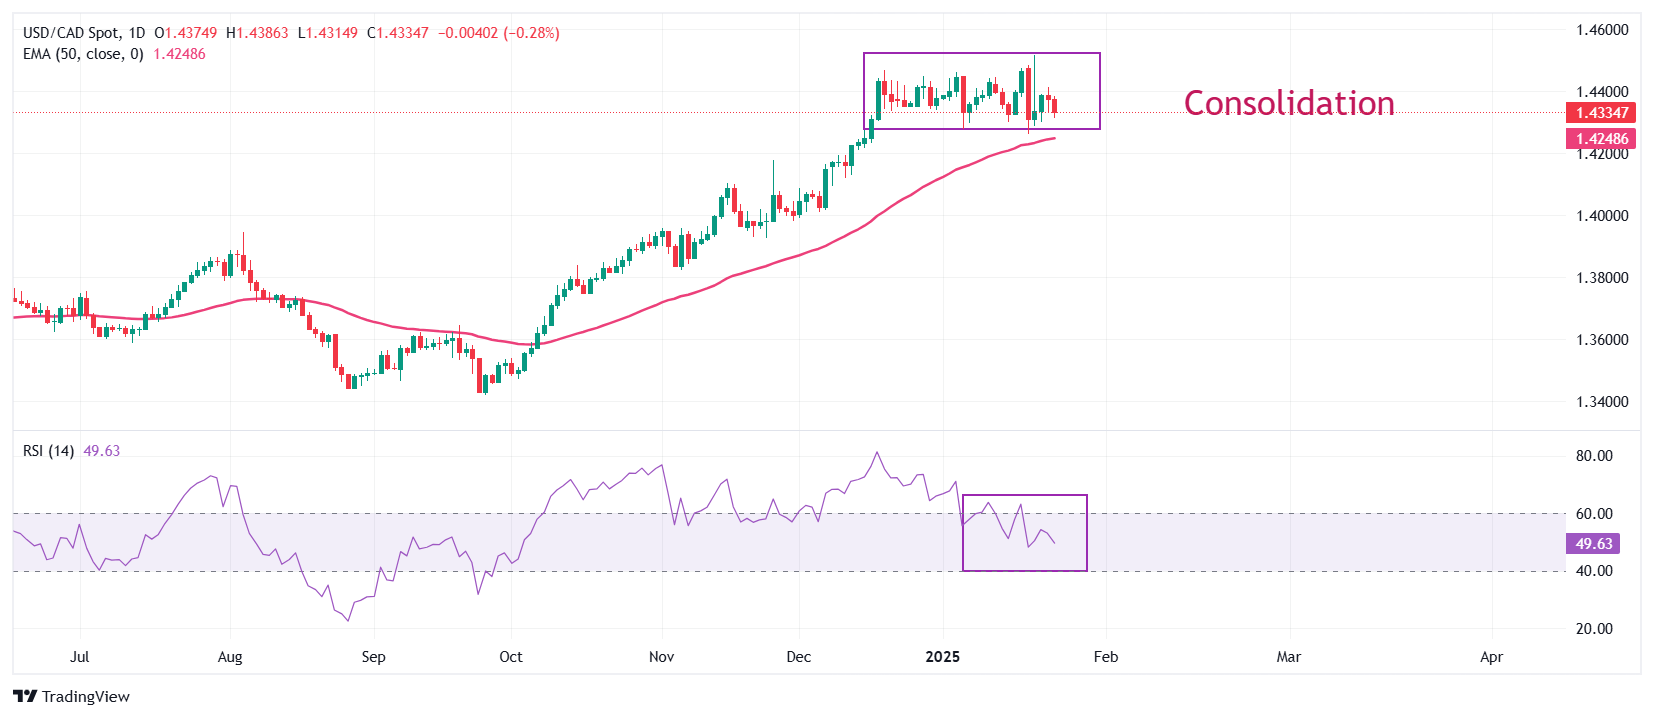
The Canadian Dollar made some headway against the Greenback on Friday.
Bank of Canada poised to deliver another rate cut next week.
Weakness in the US Dollar Index drives CAD higher than the CAD itself.
The Canadian Dollar (CAD) gained around one-quarter of one percent against the Greenback on Friday, testing higher but still firmly entrenched in a consolidation pattern that kicked off in mid-December. The US Dollar is softening across the board to wrap up a largely unremarkable trading week, rather than the Loonie finding any intrinsic bidding pressure, implying that bullish momentum is unlikely to be sustained.
The Bank of Canada (BoC) is poised to deliver another quarter-point rate cut next week, while the Federal Reserve (Fed) is broadly anticipated to stand pat on interest rates through the first half of the year. With USD/CAD’s interest rate differential set to widen even further, it is unlikely that FX markets will find much reason to bid up the Loonie after both central banks make their rate call appearances, both scheduled for next Wednesday.
Daily digest market movers: CAD gains thin ground on upshot in risk sentiment
The CAD climbed around a quarter of a percent against the Greenback.
Loonie gains are coming from softening market demand for USD rather than any intrinsic strength.
The BoC is expected to cut interest rates by 25 bps next week.
The Fed, due only hours after, is expected to hold steady.
Little else of note is on the economic data docket for the Loonie next week.
Canadian Dollar price forecast
USD/CAD’s consolidation phase continues to grind sideways as Loonie traders struggle to push into either direction decisively. Price action remains constrained around the 1.4400 handle, though the CAD frequently tests into fresh multi-year lows.
The pair’s last bullish phase has truly run out of gas as the 50-day Exponential Moving Average (EMA) rises into 1.4250, but signs of a technical turnaround remain absent. Near-term bids remain constrained by a technical floor priced in at the 1.4300 handle.
USD/CAD daily chart
Canadian Dollar FAQs
The key factors driving the Canadian Dollar (CAD) are the level of interest rates set by the Bank of Canada (BoC), the price of Oil, Canada’s largest export, the health of its economy, inflation and the Trade Balance, which is the difference between the value of Canada’s exports versus its imports. Other factors include market sentiment – whether investors are taking on more risky assets (risk-on) or seeking safe-havens (risk-off) – with risk-on being CAD-positive. As its largest trading partner, the health of the US economy is also a key factor influencing the Canadian Dollar.
The Bank of Canada (BoC) has a significant influence on the Canadian Dollar by setting the level of interest rates that banks can lend to one another. This influences the level of interest rates for everyone. The main goal of the BoC is to maintain inflation at 1-3% by adjusting interest rates up or down. Relatively higher interest rates tend to be positive for the CAD. The Bank of Canada can also use quantitative easing and tightening to influence credit conditions, with the former CAD-negative and the latter CAD-positive.
The price of Oil is a key factor impacting the value of the Canadian Dollar. Petroleum is Canada’s biggest export, so Oil price tends to have an immediate impact on the CAD value. Generally, if Oil price rises CAD also goes up, as aggregate demand for the currency increases. The opposite is the case if the price of Oil falls. Higher Oil prices also tend to result in a greater likelihood of a positive Trade Balance, which is also supportive of the CAD.
While inflation had always traditionally been thought of as a negative factor for a currency since it lowers the value of money, the opposite has actually been the case in modern times with the relaxation of cross-border capital controls. Higher inflation tends to lead central banks to put up interest rates which attracts more capital inflows from global investors seeking a lucrative place to keep their money. This increases demand for the local currency, which in Canada’s case is the Canadian Dollar.
Macroeconomic data releases gauge the health of the economy and can have an impact on the Canadian Dollar. Indicators such as GDP, Manufacturing and Services PMIs, employment, and consumer sentiment surveys can all influence the direction of the CAD. A strong economy is good for the Canadian Dollar. Not only does it attract more foreign investment but it may encourage the Bank of Canada to put up interest rates, leading to a stronger currency. If economic data is weak, however, the CAD is likely to fall.
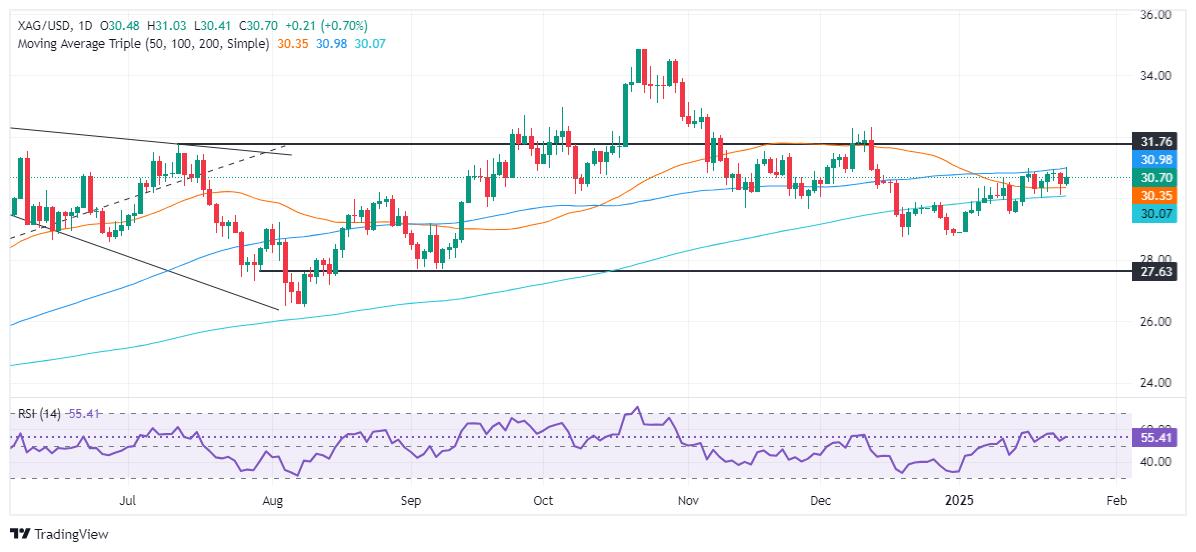
Silver rebounds from $30.36, crosses 50-day SMA but struggles with higher resistance levels.
RSI indicates rising buyer interest; however, significant resistance at $32.32 still challenges momentum.
For bearish trend to resume, silver must fall below 200-day SMA and $30.00, with next supports at $29.51 and $28.89.
Silver price recovers some ground and trades with gains of 0.91% yet it has failed to clear key resistance at the 100-day Simple Moving Average (SMA) at $30.95. At the time of writing, XAG/USD trades at $30.70 after bouncing off a low of $30.36.
XAG/USD Price Forecast: Technical outlook
Silver recovered after testing the 200-day SMA near $30.05 and rose above the 50-day SMA but faces stir resistance at $30.95. The trend is tilted to the downside as the grey metal carved a series of successively lower highs and lower lows. Even though the Relative Strength Index (RSI) suggests that buyers are gathering momentum, the grey metal has to surpass $32.32, the latest cycle high hit on December 12.
On the other hand, sellers must surpass the 200-day SMA and the $30.00 mark for a bearish continuation. Once taken out, the next support would be the January 13 low of $29.51, followed by the January 1 low of $28.89.
XAG/USD Price Chart – Daily
Silver FAQs
Silver is a precious metal highly traded among investors. It has been historically used as a store of value and a medium of exchange. Although less popular than Gold, traders may turn to Silver to diversify their investment portfolio, for its intrinsic value or as a potential hedge during high-inflation periods. Investors can buy physical Silver, in coins or in bars, or trade it through vehicles such as Exchange Traded Funds, which track its price on international markets.
Silver prices can move due to a wide range of factors. Geopolitical instability or fears of a deep recession can make Silver price escalate due to its safe-haven status, although to a lesser extent than Gold's. As a yieldless asset, Silver tends to rise with lower interest rates. Its moves also depend on how the US Dollar (USD) behaves as the asset is priced in dollars (XAG/USD). A strong Dollar tends to keep the price of Silver at bay, whereas a weaker Dollar is likely to propel prices up. Other factors such as investment demand, mining supply – Silver is much more abundant than Gold – and recycling rates can also affect prices.
Silver is widely used in industry, particularly in sectors such as electronics or solar energy, as it has one of the highest electric conductivity of all metals – more than Copper and Gold. A surge in demand can increase prices, while a decline tends to lower them. Dynamics in the US, Chinese and Indian economies can also contribute to price swings: for the US and particularly China, their big industrial sectors use Silver in various processes; in India, consumers’ demand for the precious metal for jewellery also plays a key role in setting prices.
Silver prices tend to follow Gold's moves. When Gold prices rise, Silver typically follows suit, as their status as safe-haven assets is similar. The Gold/Silver ratio, which shows the number of ounces of Silver needed to equal the value of one ounce of Gold, may help to determine the relative valuation between both metals. Some investors may consider a high ratio as an indicator that Silver is undervalued, or Gold is overvalued. On the contrary, a low ratio might suggest that Gold is undervalued relative to Silver.
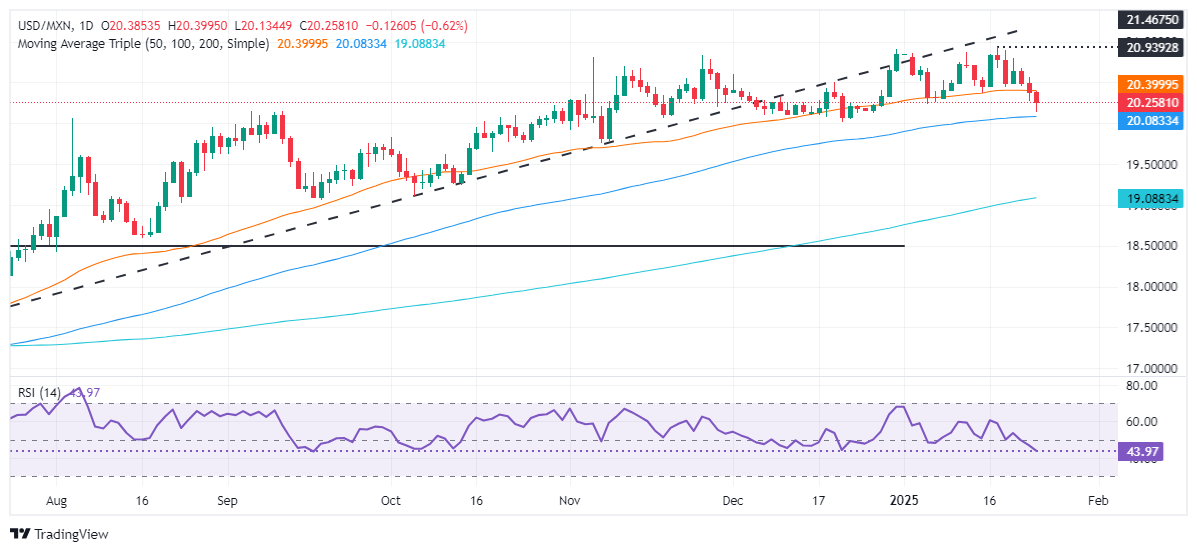
Trump's moderate comments on Mexico at WEF reduce trade worries; key GDP and trade data anticipated.
The Mexican Peso (MXN) surged in early trading during the North American session as mixed economic growth figures emerged in Mexico, though broad US Dollar (USD) weakness kept the Peso bid. At the time of writing, the USD/MXN trades at 20.16, down 1%.
The Instituto Nacional de Estadistica Geografia e Informatica (INEGI) revealed that November’s Economic Activity improved monthly but not yearly. With more than 2.70% gains, the Mexican currency is set to post its best weekly performance since September 2024.
United States (US) President Donald Trump tempered his comments about Mexico and delivered upbeat remarks about the country at the World Economic Forum (WEF), which eased trade policy fears and sponsored a leg-down on USD/MXN.
Meanwhile, mid-month inflation for January dipped towards the Banco de Mexico (Banxico) 3% goal. The Consumer Price Index (CPI) rose by 3.69% YoY, from 4.44% reported in December, while the core CPI rose moderately from 3.62% to 3.72% YoY.
In the US, S&P Global revealed that manufacturing activity exited contractionary territory but failed to bolster the Greenback. Meanwhile, Consumer Sentiment revealed by the University of Michigan (UoM) deteriorated compared to preliminary ratings, while housing data improved via Existing Home Sales.
Mexico’s economy has continued to cool down and is expected to grow by just 1% in 2025. The slowdown benefited the disinflation process and supports Banxico’s dovish stance.
The Federal Reserve (Fed) is expected to keep rates unchanged. The board's main reasons for that decision are the robustness of the US economy, as portrayed by healthy economic growth, a strong labor market and stickier inflation numbers.
Next week, Mexico’s economic docket will feature the Balance of Trade, jobs data and the preliminary reading of the Gross Domestic Product (GDP) for the last quarter of 2024.
The Mexican Peso advances versus the US Dollar even though the lowest inflation figures suggest that Banxico will cut rates. Contrarily, the Fed is expected to keep monetary policy unchanged and wait for the March meeting.
INEGI revealed that Economic Activity for November improved from -0.7% to 0.4% MoM. In the twelve-month period, the figures dipped from 0.8% to 0.5%, missing the 0.6% projected.
Citi revealed its Expectations Survey, in which Mexican private economists revised Gross Domestic Product (GDP) figures for 2025 downward to 1%.
Regarding inflation expectations, analysts estimate headline and core to inflation to dip below 4%, each at 3.91% and 3.68%, while the exchange rate would likely end near 20.95.
Economists estimate that Banco de Mexico (Banxico) will lower rates by 25 basis points (bps) from 10.00% to 9.75%, though some analysts expect a 50-bps cut at the February 6 meeting.
US S&P Global Manufacturing PMI for December increased by 50.1 from 49.4, exceeding the forecast. Meanwhile, the Services PMI deteriorated from 56.8 to 52.8.
Money market futures have priced in 45 bps of Fed rate cuts in 2025, according to CME FedWatch Tool data.
The USD/MXN falls below the 50-day Simple Moving Average (SMA) of 20.37 and extended its losses toward the 100-day SMA at 20.22, but bears failed to push prices below the latter, as it consolidates near the mid-point of the 20.20 – 20,30 range.
Momentum turned bearish as portrayed by the Relative Strength Index (RSI). Therefore if USD/MXN tumbles beneath 20.20, the next support would be the 20.00 figure. On further weakness, the next support would be November 7 swing low of 19.75, ahead of the October 18 low of 19.64.
Conversely, for a bullish resumption, the USD/MXN must climb above 20.55 so buyers have a clear path to challenge the year-to-date (YTD) high at 20.90. Once surpassed, the next stop would be 21.00, followed by March 8, 2022, peaking at 21.46 ahead of the 22.00 figure.
Mexican Peso FAQs
The Mexican Peso (MXN) is the most traded currency among its Latin American peers. Its value is broadly determined by the performance of the Mexican economy, the country’s central bank’s policy, the amount of foreign investment in the country and even the levels of remittances sent by Mexicans who live abroad, particularly in the United States. Geopolitical trends can also move MXN: for example, the process of nearshoring – or the decision by some firms to relocate manufacturing capacity and supply chains closer to their home countries – is also seen as a catalyst for the Mexican currency as the country is considered a key manufacturing hub in the American continent. Another catalyst for MXN is Oil prices as Mexico is a key exporter of the commodity.
The main objective of Mexico’s central bank, also known as Banxico, is to maintain inflation at low and stable levels (at or close to its target of 3%, the midpoint in a tolerance band of between 2% and 4%). To this end, the bank sets an appropriate level of interest rates. When inflation is too high, Banxico will attempt to tame it by raising interest rates, making it more expensive for households and businesses to borrow money, thus cooling demand and the overall economy. Higher interest rates are generally positive for the Mexican Peso (MXN) as they lead to higher yields, making the country a more attractive place for investors. On the contrary, lower interest rates tend to weaken MXN.
Macroeconomic data releases are key to assess the state of the economy and can have an impact on the Mexican Peso (MXN) valuation. A strong Mexican economy, based on high economic growth, low unemployment and high confidence is good for MXN. Not only does it attract more foreign investment but it may encourage the Bank of Mexico (Banxico) to increase interest rates, particularly if this strength comes together with elevated inflation. However, if economic data is weak, MXN is likely to depreciate.
As an emerging-market currency, the Mexican Peso (MXN) tends to strive during risk-on periods, or when investors perceive that broader market risks are low and thus are eager to engage with investments that carry a higher risk. Conversely, MXN tends to weaken at times of market turbulence or economic uncertainty as investors tend to sell higher-risk assets and flee to the more-stable safe havens.
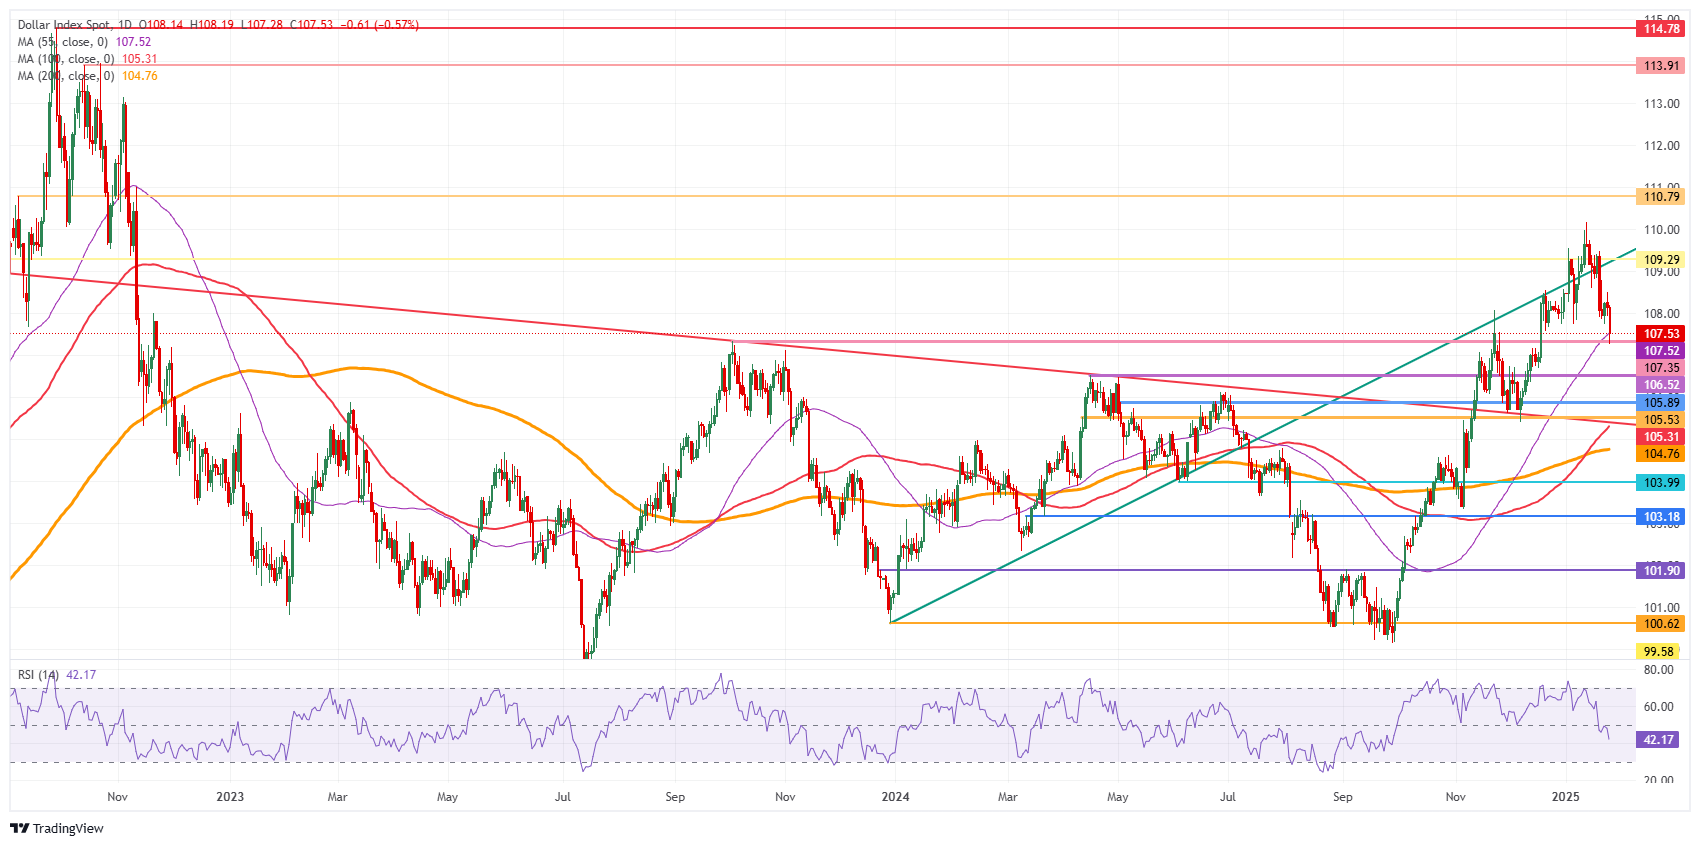
The US Dollar Index remains under pressure, testing the 107.50 level after a steep weekly decline of over 2%.
S&P Global Composite PMI signals slower growth at 52.4 in January, compared to 55.4 in December.
Markets now turn their attention to the next week’s Fed decision.
The US Dollar Index (DXY), which measures the value of the US Dollar against a basket of currencies, is experiencing sustained losses as it sinks below 107.50, its lowest level this week. US President Trump’s softer tone on proposed tariffs on China added to the currency’s bearish sentiment. Meanwhile, economic data continued to show mixed signals, leaving traders cautious.
Daily digest market movers: US Dollar slips after economic data and Trump remarks
The S&P Global Composite PMI dropped significantly to 52.4 in January from 55.4 in December, showing a slower pace of expansion.
Manufacturing PMI climbed to 50.1, exceeding forecasts of 49.6, reflecting a slight recovery in factory production activity.
Services PMI decreased to 52.8 from 56.8, signaling weaker momentum in service sector growth.
On Thursday, US Initial Jobless Claims rose to 223,000 for the week ending January 18, higher than the prior week’s revised 217,000 figure.
Continuing Jobless Claims jumped by 46,000 to 1.899 million, highlighting increasing challenges in the labor market.
Regarding the new administration’s plans, President Trump softens rhetoric on Chinese tariffs at Davos, suggesting some potential easing of trade tensions.
DXY technical outlook: Signs of deeper bearish momentum
The US Dollar Index (DXY) has dropped below the key 108.00 level, showing continued vulnerability to bearish momentum. The RSI remains under 50, signaling weaker relative strength, while MACD histogram bars deepen in negative territory, suggesting further downside.
The 20-day Simple Moving Average (SMA) around 108.00 now acts as a critical resistance level. A failure to reclaim this threshold could lead to additional losses with the next support zone seen near 107.00. Conversely, a recovery above 108.00 could stabilize the Greenback’s outlook and limit further declines.
US Dollar FAQs
The US Dollar (USD) is the official currency of the United States of America, and the ‘de facto’ currency of a significant number of other countries where it is found in circulation alongside local notes. It is the most heavily traded currency in the world, accounting for over 88% of all global foreign exchange turnover, or an average of $6.6 trillion in transactions per day, according to data from 2022. Following the second world war, the USD took over from the British Pound as the world’s reserve currency. For most of its history, the US Dollar was backed by Gold, until the Bretton Woods Agreement in 1971 when the Gold Standard went away.
The most important single factor impacting on the value of the US Dollar is monetary policy, which is shaped by the Federal Reserve (Fed). The Fed has two mandates: to achieve price stability (control inflation) and foster full employment. Its primary tool to achieve these two goals is by adjusting interest rates. When prices are rising too quickly and inflation is above the Fed’s 2% target, the Fed will raise rates, which helps the USD value. When inflation falls below 2% or the Unemployment Rate is too high, the Fed may lower interest rates, which weighs on the Greenback.
In extreme situations, the Federal Reserve can also print more Dollars and enact quantitative easing (QE). QE is the process by which the Fed substantially increases the flow of credit in a stuck financial system. It is a non-standard policy measure used when credit has dried up because banks will not lend to each other (out of the fear of counterparty default). It is a last resort when simply lowering interest rates is unlikely to achieve the necessary result. It was the Fed’s weapon of choice to combat the credit crunch that occurred during the Great Financial Crisis in 2008. It involves the Fed printing more Dollars and using them to buy US government bonds predominantly from financial institutions. QE usually leads to a weaker US Dollar.
Quantitative tightening (QT) is the reverse process whereby the Federal Reserve stops buying bonds from financial institutions and does not reinvest the principal from the bonds it holds maturing in new purchases. It is usually positive for the US Dollar.
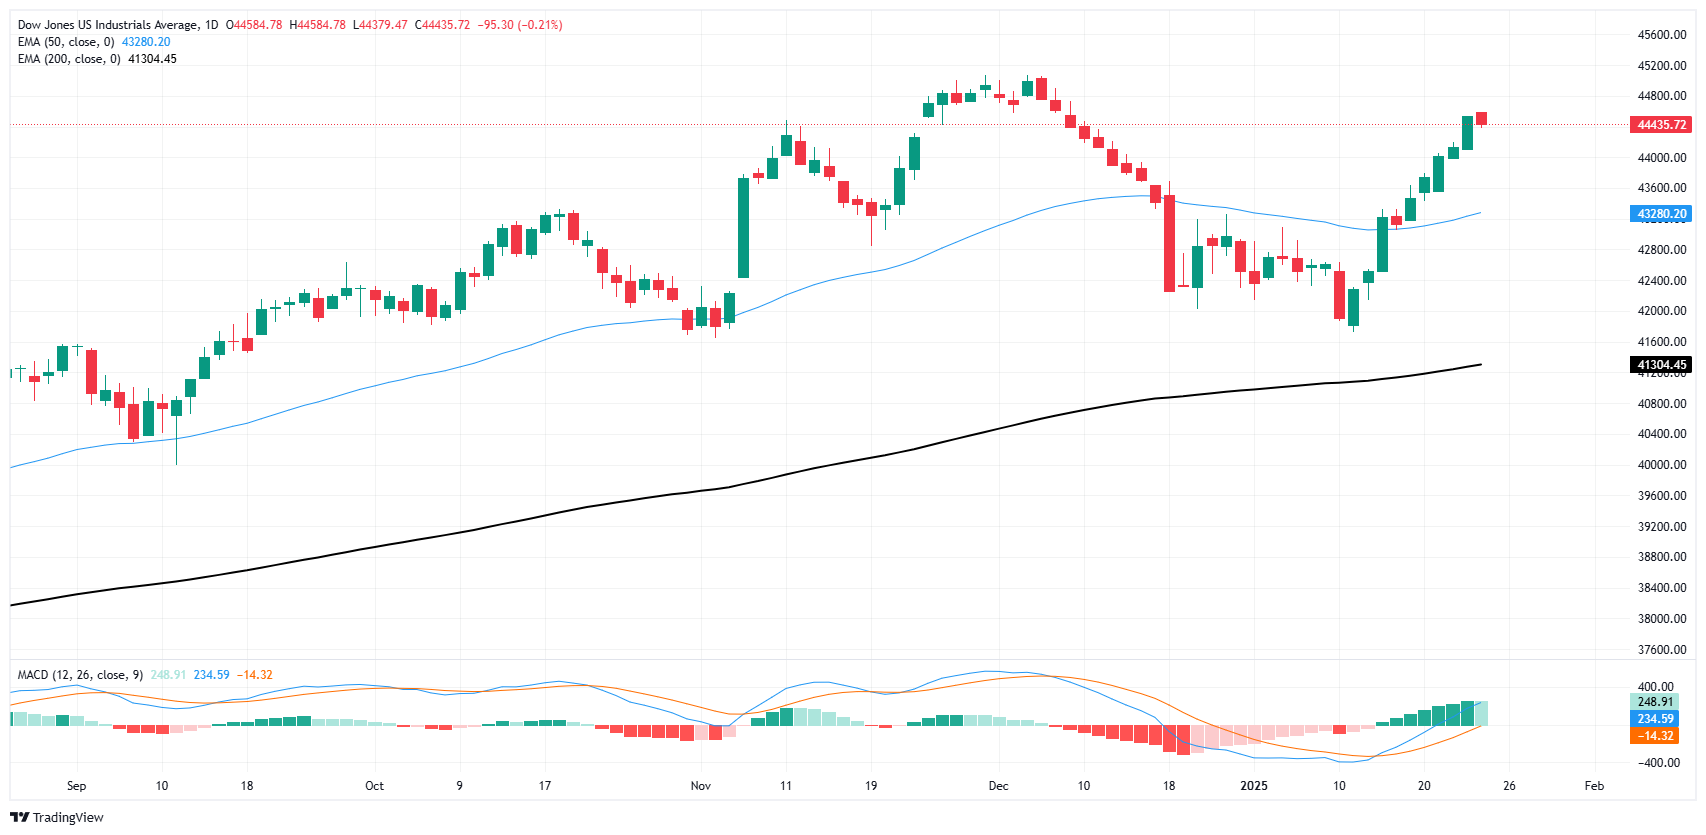
The Dow Jones is freezing in place on Friday, treading water near 44,500.
Despite a quiet end to the week, equities are poised for strong bullish closes.
US PMI data came in more mixed than expected, to little effect.
The Dow Jones Industrial Average (DJIA) churned in the midrange on Friday, testing down between 50 and 100 points on a slow trading day. The Dow Jones is capping off an otherwise firmly bullish week, with the index gaining around 2.3% from Monday’s opening bids. The DJIA has gained ground for the second week in a row, firmly hinting that the bull market is back after a six-week backslide.
President Donald Trump stoked the flames of pro-equity sentiment this week by not instituting the day-one tariffs he promised on the campaign trail. He also announced this week that he would “demand” lower interest rates from the Federal Reserve (Fed) and plans to request a drop in oil prices from Saudi Arabia and the Organization of the Petroleum Exporting Countries (OPEC).
The S&P Global Purchasing Managers Index (PMI) survey results for January were even more mixed than analysts anticipated. According to an ambiguous number of survey respondents, businesses saw a better-than-expected improvement in forward-looking expectations for growth in the manufacturing sector. Still, services-based businesses are more despondent about future business conditions than most anticipated.
January’s Manufacturing sector PMI rose to 50.1 from the previous month’s 49.4, surpassing the forecast of 49.6. The Services PMI for the same period shrank to 52.8 from 56.8, well below the expected 56.5, but still remains in positive territory overall, meaning purchasing managers who bothered to respond to the survey don’t expect much growth in the coming month, but don’t expect an outright contraction in business conditions either.
Dow Jones news
Despite some steeper losses in key overweighted stocks dragging the Dow slightly lower on Friday, the index itself is roughly on balance, with about half of the board’s listed equities still finding higher ground to wrap up the trading week. Walt Disney Co (DIS) rallied 1.8% to $113 per share, mainly on the back of expectations that past performance is indicative of future results after the entertainment monolith returned 24% over 2024 to people holding its shares. On the low side, Nvidia (NVDA) fell 2.5%, declining below $144 per share as investors fear the company may be doomed now that its run of seeing 100%-plus growth in annualized revenues may be over.
Dow Jones price forecast
The Dow Jones Industrial Average is once again knocking on record highs just above 45,000 set late last November. The DJIA initially declined 7.4% top-to-bottom in a six week backslide after posting the fresh record, but the wheels are back on the road as buyers continue to tilt into risk appetite.
The Dow Jones has climbed 6.8% from January’s swing low into 41,730, testing the 44,500 region after closing in the green for all but one of the last nine consecutive trading sessions. The immediate barrier to fresh record highs will be 45,000 major handle itself, while a pullback to the 50-day Exponential Moving Average (EMA) near 43,275 could hamper bullish momentum.
Dow Jones daily chart
Dow Jones FAQs
The Dow Jones Industrial Average, one of the oldest stock market indices in the world, is compiled of the 30 most traded stocks in the US. The index is price-weighted rather than weighted by capitalization. It is calculated by summing the prices of the constituent stocks and dividing them by a factor, currently 0.152. The index was founded by Charles Dow, who also founded the Wall Street Journal. In later years it has been criticized for not being broadly representative enough because it only tracks 30 conglomerates, unlike broader indices such as the S&P 500.
Many different factors drive the Dow Jones Industrial Average (DJIA). The aggregate performance of the component companies revealed in quarterly company earnings reports is the main one. US and global macroeconomic data also contributes as it impacts on investor sentiment. The level of interest rates, set by the Federal Reserve (Fed), also influences the DJIA as it affects the cost of credit, on which many corporations are heavily reliant. Therefore, inflation can be a major driver as well as other metrics which impact the Fed decisions.
Dow Theory is a method for identifying the primary trend of the stock market developed by Charles Dow. A key step is to compare the direction of the Dow Jones Industrial Average (DJIA) and the Dow Jones Transportation Average (DJTA) and only follow trends where both are moving in the same direction. Volume is a confirmatory criteria. The theory uses elements of peak and trough analysis. Dow’s theory posits three trend phases: accumulation, when smart money starts buying or selling; public participation, when the wider public joins in; and distribution, when the smart money exits.
There are a number of ways to trade the DJIA. One is to use ETFs which allow investors to trade the DJIA as a single security, rather than having to buy shares in all 30 constituent companies. A leading example is the SPDR Dow Jones Industrial Average ETF (DIA). DJIA futures contracts enable traders to speculate on the future value of the index and Options provide the right, but not the obligation, to buy or sell the index at a predetermined price in the future. Mutual funds enable investors to buy a share of a diversified portfolio of DJIA stocks thus providing exposure to the overall index.
18:01
United States Baker Hughes US Oil Rig Count declined to 472 from previous 478
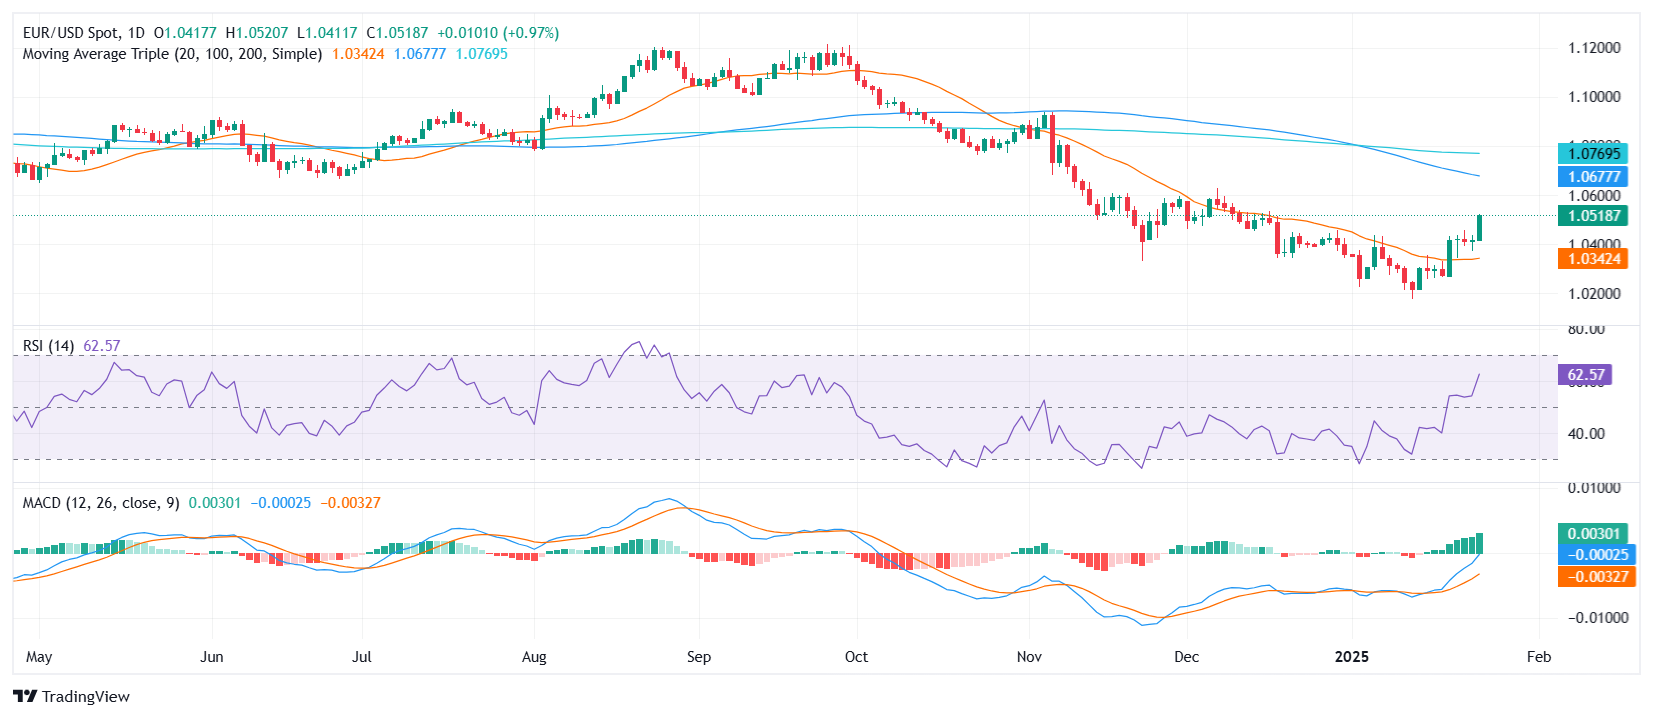
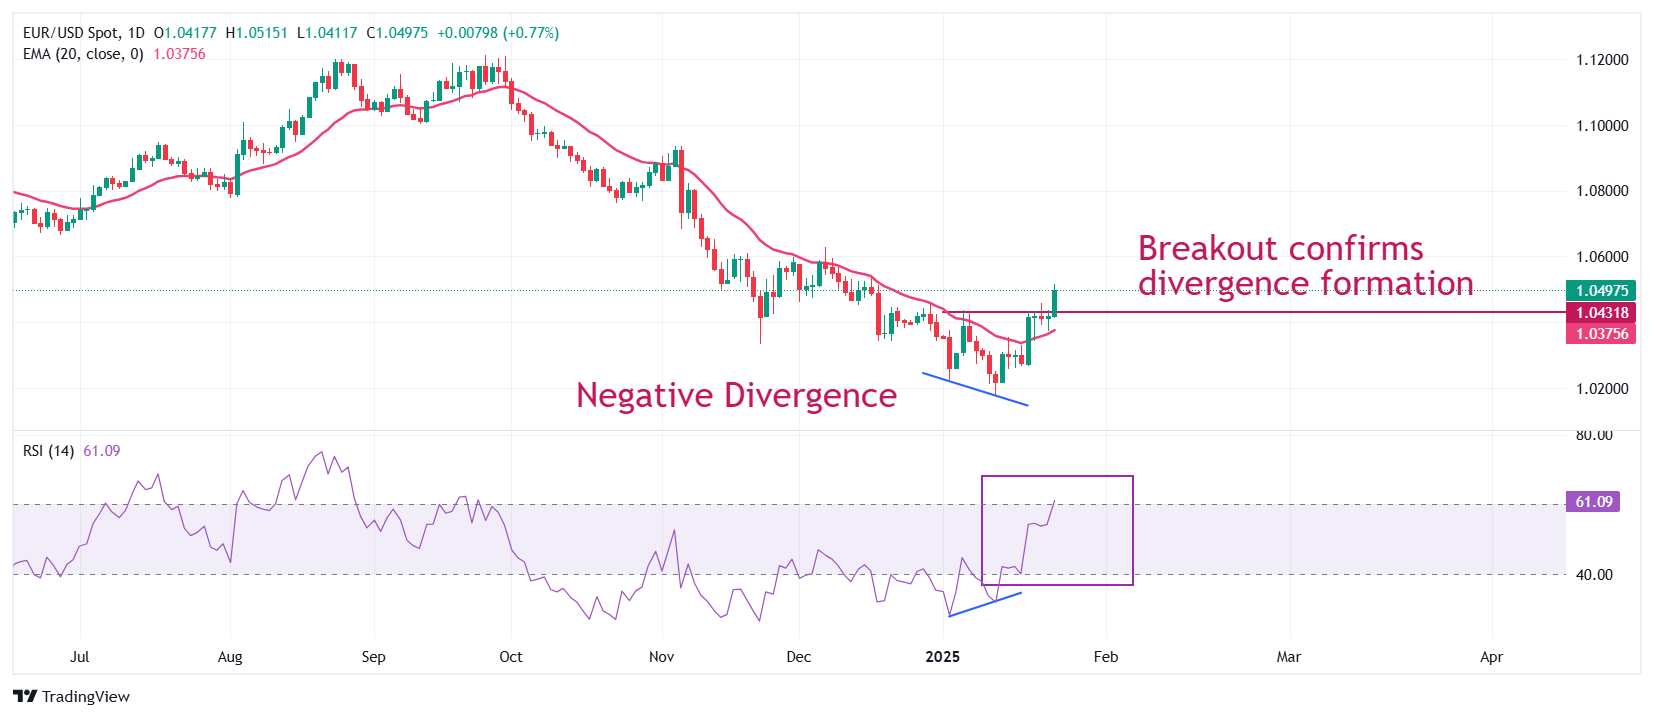
EUR/USD advances on Friday, marking a solid recovery to 1.0485.
Technical indicators point to strengthening momentum, with the pair nearing short-term resistance.
Focus shifts to whether buyers can maintain traction above the 1.0500 psychological level.
The EUR/USD pair ended the week on a bullish note, climbing 0.66% to settle at 1.0485 on Friday. This move signals a continuation of its recovery, following recent consolidation within a relatively narrow trading range. The pair’s ability to maintain upward pressure highlights growing buyer confidence as it approaches key resistance levels.
Technical readings reflect the strengthening bullish bias. The Relative Strength Index (RSI) has surged to 62, well into positive territory and rising sharply, indicating robust buying interest and room for further gains. Meanwhile, the Moving Average Convergence Divergence (MACD) histogram is printing rising green bars, confirming growing upward momentum and underscoring increased demand.
For the immediate outlook, the 1.0500 mark will act as a pivotal resistance, with a decisive break above it opening the door to the next target at 1.0530. On the downside, support rests at 1.0450, followed by the 1.0420 level, which could serve as a safety net if selling pressure re-emerges. Traders will watch these levels closely to assess the pair’s ability to sustain its bullish trajectory.
EUR/USD daily chart
15:00
United States UoM 5-year Consumer Inflation Expectation came in at 3.2% below forecasts (3.3%) in January
15:00
United States Existing Home Sales (MoM) above forecasts (4.19M) in December: Actual (4.24M)
15:00
United States Existing Home Sales Change (MoM) fell from previous 4.8% to 2.2% in December
15:00
United States Michigan Consumer Sentiment Index below expectations (73.2) in January: Actual (71.1)
The US private sector expanded at a softening pace in January.
US Dollar Index stays deep in negative territory below 107.50.
The economic activity in the US' private sector continued to expand in January, albeit at a softer pace, with the S&P Global Composite PMI declining to 52.4 from 55.4 in December.
In the same period, the Manufacturing PMI improved to 50.1 from 49.4, surpassing the market expectation of 49.6. Finally, the Services PMI declined to 52.8 from 56.8.
Commenting on the survey's findings, "US businesses are starting 2025 in an upbeat mood on hopes that the new administration will help drive stronger economic growth," said Chris Williamson, Chief Business Economist at S&P Global Market Intelligence.
"Rising optimism is most notable in the manufacturing sector, where expectations of growth over the coming year have surged higher as factories await support from the new policies of the Trump administration, though service providers are also entering 2025 in good spirits," Williamson added.
Market reaction
The US Dollar (USD) stays under bearish pressure following the PMI data. At the time of press, the US Dollar Index was down 0.5% on the day at 107.57.
14:45
United States S&P Global Composite PMI down to 52.4 in January from previous 55.4
14:45
United States S&P Global Services PMI below expectations (56.5) in January: Actual (52.8)
14:45
United States S&P Global Manufacturing PMI came in at 50.1, above expectations (49.6) in January
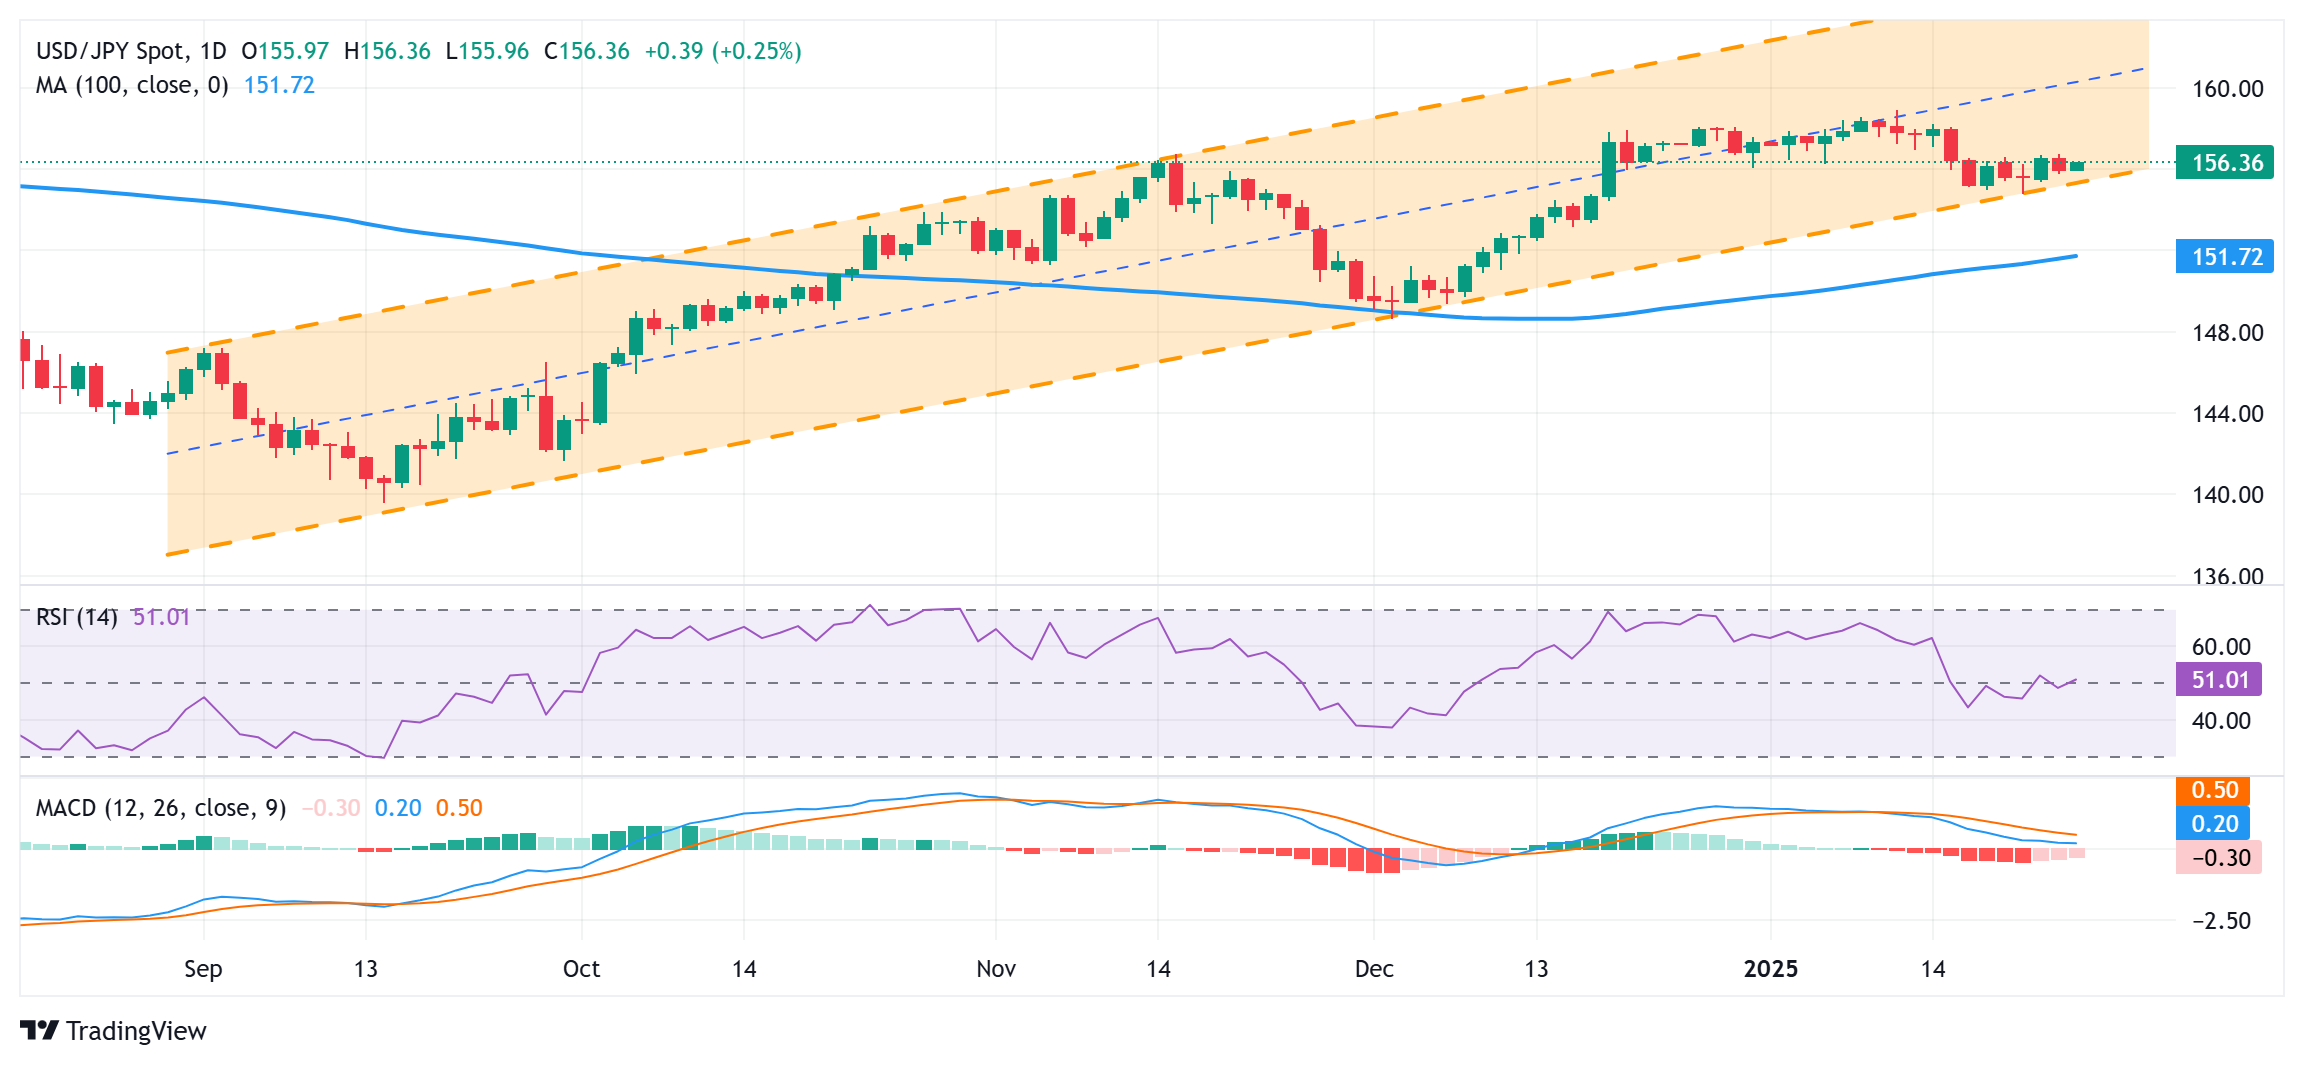
USD/JPY recovers sharply to near 156.50 as Japanese Yen underperforms its major peers.
The BoJ refrained from providing a specific policy-tightening path.
US President Trump has pushed back fears of imposing tariffs on China.
The USD/JPY recovers Bank of Japan’s (BoJ) interest rate hike-inspired losses and rises to near 156.60 in Friday’s North American session. The Japanese Yen (JPY) has turned upside down in the aftermath of the BoJ’s monetary policy announcement.
Japanese Yen PRICE Today
The table below shows the percentage change of Japanese Yen (JPY) against listed major currencies today. Japanese Yen was the strongest against the US Dollar.
USD
EUR
GBP
JPY
CAD
AUD
NZD
CHF
USD
-0.55%
-0.50%
0.27%
-0.31%
-0.31%
-0.46%
-0.02%
EUR
0.55%
0.05%
0.82%
0.24%
0.23%
0.09%
0.52%
GBP
0.50%
-0.05%
0.78%
0.19%
0.18%
0.04%
0.48%
JPY
-0.27%
-0.82%
-0.78%
-0.60%
-0.60%
-0.76%
-0.32%
CAD
0.31%
-0.24%
-0.19%
0.60%
-0.00%
-0.15%
0.29%
AUD
0.31%
-0.23%
-0.18%
0.60%
0.00%
-0.14%
0.28%
NZD
0.46%
-0.09%
-0.04%
0.76%
0.15%
0.14%
0.43%
CHF
0.02%
-0.52%
-0.48%
0.32%
-0.29%
-0.28%
-0.43%
The heat map shows percentage changes of major currencies against each other. The base currency is picked from the left column, while the quote currency is picked from the top row. For example, if you pick the Japanese Yen from the left column and move along the horizontal line to the US Dollar, the percentage change displayed in the box will represent JPY (base)/USD (quote).
The initial reaction from the Yen was very bullish after the BoJ raised its key borrowing rates by 25 basis points (bps) to 0.5%, as expected. However, it dived later. Only one policymaker, Toyoaki Nakamura, dissented to the decision to tighten the monetary policy further. The sell-off in the Yen came after BoJ Governor Kazuo Ueda’s press conference in which he refrained from committing a pre-defined policy-tightening path.
When asked about the impact of United States (US) President Donald Trump’s tariff policies on BoJ’s monetary policy stance, Ueda said, “There's very high uncertainty on the scale of tariffs. Once there is more clarity, we will take that into our forecasts and reflect them in deciding policy."
Though investors have underpinned the US Dollar (USD) against the Yen, it is underperforming its other peers as its risk-premium has diminished significantly. The US Dollar Index (DXY), which tracks the Greenback’s value against six major currencies, slumps to 107.45, the lowest level seen in over a month.
USD’s risk premium has been diminished as Trump has dialed back expectations of tariffs on China. In an interview with Fox News on Thursday, Trump said that he could reach a deal with China without raising tariffs.
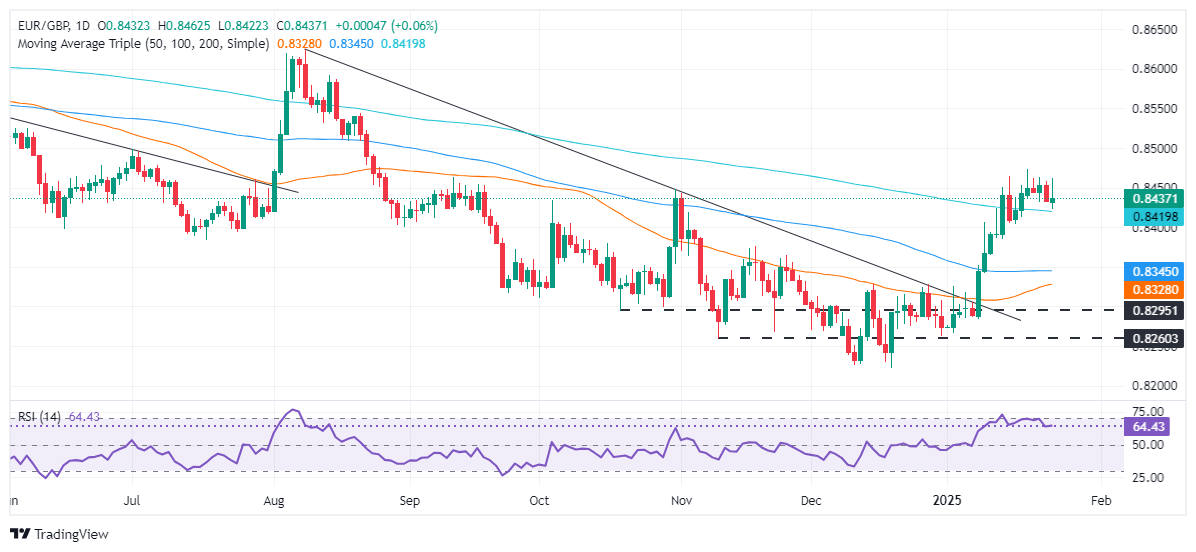
EUR/GBP struggles to sustain uptrend, facing resistance near 0.8473.
Pair tests 200-day SMA at 0.8422; could revisit year-to-date high if support holds.
Potential downward move targets 100-day SMA at 0.8348 if support breaks.
The EUR/GBP failed to extend its gains for the second straight day, as stir resistance near 0.8473 was strong enough to be cleared by bulls. Therefore, the cross tumbles towards the 200-day Simple Moving Average (SMA) at 0.8422 and print losses of 0.03%.
EUR/GBP Price Forecast: Technical outlook
The pair resumed its uptrend on January 8, with the EUR/GBP posting gains of 2.29% in a seven-day span. Nevertheless, the EUR/GBP seems overextended, and it has consolidated above the 200-day SMA. If buyers hold prices above the latter, they could test the year-to-date (YTD) high at 0.8470.
On further strength, 0.8500 comes into play, followed by the August 24 peak at 0.8544. A breach of the latter will expose the August 14 daily high at 0.8592.
Conversely, if sellers drive EUR/GBP below the 200-day SMA, it will reach 0.8400. Further downside is clear, once the latter is surpassed, with bears targeting the 100-day SMA at 0.8348.
EUR/GBP Price Chart – Daily
Euro FAQs
The Euro is the currency for the 19 European Union countries that belong to the Eurozone. It is the second most heavily traded currency in the world behind the US Dollar. In 2022, it accounted for 31% of all foreign exchange transactions, with an average daily turnover of over $2.2 trillion a day. EUR/USD is the most heavily traded currency pair in the world, accounting for an estimated 30% off all transactions, followed by EUR/JPY (4%), EUR/GBP (3%) and EUR/AUD (2%).
The European Central Bank (ECB) in Frankfurt, Germany, is the reserve bank for the Eurozone. The ECB sets interest rates and manages monetary policy. The ECB’s primary mandate is to maintain price stability, which means either controlling inflation or stimulating growth. Its primary tool is the raising or lowering of interest rates. Relatively high interest rates – or the expectation of higher rates – will usually benefit the Euro and vice versa. The ECB Governing Council makes monetary policy decisions at meetings held eight times a year. Decisions are made by heads of the Eurozone national banks and six permanent members, including the President of the ECB, Christine Lagarde.
Eurozone inflation data, measured by the Harmonized Index of Consumer Prices (HICP), is an important econometric for the Euro. If inflation rises more than expected, especially if above the ECB’s 2% target, it obliges the ECB to raise interest rates to bring it back under control. Relatively high interest rates compared to its counterparts will usually benefit the Euro, as it makes the region more attractive as a place for global investors to park their money.
Data releases gauge the health of the economy and can impact on the Euro. Indicators such as GDP, Manufacturing and Services PMIs, employment, and consumer sentiment surveys can all influence the direction of the single currency. A strong economy is good for the Euro. Not only does it attract more foreign investment but it may encourage the ECB to put up interest rates, which will directly strengthen the Euro. Otherwise, if economic data is weak, the Euro is likely to fall. Economic data for the four largest economies in the euro area (Germany, France, Italy and Spain) are especially significant, as they account for 75% of the Eurozone’s economy.
Another significant data release for the Euro is the Trade Balance. This indicator measures the difference between what a country earns from its exports and what it spends on imports over a given period. If a country produces highly sought after exports then its currency will gain in value purely from the extra demand created from foreign buyers seeking to purchase these goods. Therefore, a positive net Trade Balance strengthens a currency and vice versa for a negative balance.
CTAs are being whipsawed in Copper and Aluminum following President Trump's dampened tone with respect to tariffs on China, TDS’ Senior Commodity Strategist Daniel Ghali notes.
Trump's tone shrinks the number of Copper and Aluminum CTAs
“The stronger price action overnight is likely to catalyze notable algo buying activity in the red metal, but the set-up for algo flows still doesn't look great with our simulations of future prices suggesting that no scenario for price action over the coming week will attract subsequent buying programs.”
Importantly, new ATHs in gold could finally catalyze a breakout in silver markets, where we see unique implications from the dislocations in metals markets associated with tariff threats. The market is sleepwalking into a #silversqueeze, TDS’ Senior Commodity Strategist Daniel Ghali notes.
XAU/XAG ratio sits at the highs
“A breakout appears imminent given a) the XAU/XAG ratio sits at the highs, b) CTAs and discretionary traders both hold significant dry-powder to deploy, c) SHFE silver aggregate open interest sits at multiyear lows, but the largest traders in Shanghai have been adding to their books over the last months.
“D) London silver continues to trade tight, e) assumptions that any potential #silversqueeze will easily be resolved fail to recognize that pressure release valves require higher prices first before they can kick in. Explosive upside convexity in silver markets remains severely underpriced.”
USD/CAD slumps to near 1.4320 as the US Dollar faces selling pressure.
US Trump’s call for instant rate cuts has dampened the US Dollar’s appeal.
The BoC is widely anticipated to cut interest rates by 25 bps to 3% next week.
The USD/CAD pair falls sharply to near 1.4320 in Friday’s North American session. The Loonie pair faces a sharp sell-off as the US Dollar (USD) tumbles after United States (US) President Donald Trump calls for the need for immediate interest rate cuts in his speech at the World Economic Forum (WEF) at Davos.
The impact is clearly visible on the US Dollar Index (DXY), which has posted a fresh monthly low near 107.45.
Trump’s call for swift policy-easing has come just a few days before the Federal Reserve’s (Fed) first monetary policy on January 28-29, in which the central bank is certain to keep interest rates unchanged in the range of 4.25%-4.50%.
Higher tariffs on Canada would boost expectations of further policy-easing by the Bank of Canada (BoC), which is widely anticipated to cut interest rates by 25 basis points (bps) to 3% on Wednesday.
USD/CAD trades in a tight range of 1.4260-1.4465 for over a month. The outlook of the Loonie pair remains firm as the 50-day Exponential Moving Average (EMA) slopes higher, which trades around 1.4248.
The 14-day Relative Strength Index (RSI) falls into the 40.00-60.00 range, suggesting a sideways trend.
The rally in the Loonie pair could advance to near the round-level resistance of 1.4600 and March 2020 high of 1.4668 if the asset breaks above the January 21 high of 1.4518.
On the contrary, a downside move below the December 11 low of 1.4120 could drag the asset towards the December 4 high of around 1.4080, followed by the psychological support of 1.4000.
USD/CAD daily chart
Canadian Dollar FAQs
The key factors driving the Canadian Dollar (CAD) are the level of interest rates set by the Bank of Canada (BoC), the price of Oil, Canada’s largest export, the health of its economy, inflation and the Trade Balance, which is the difference between the value of Canada’s exports versus its imports. Other factors include market sentiment – whether investors are taking on more risky assets (risk-on) or seeking safe-havens (risk-off) – with risk-on being CAD-positive. As its largest trading partner, the health of the US economy is also a key factor influencing the Canadian Dollar.
The Bank of Canada (BoC) has a significant influence on the Canadian Dollar by setting the level of interest rates that banks can lend to one another. This influences the level of interest rates for everyone. The main goal of the BoC is to maintain inflation at 1-3% by adjusting interest rates up or down. Relatively higher interest rates tend to be positive for the CAD. The Bank of Canada can also use quantitative easing and tightening to influence credit conditions, with the former CAD-negative and the latter CAD-positive.
The price of Oil is a key factor impacting the value of the Canadian Dollar. Petroleum is Canada’s biggest export, so Oil price tends to have an immediate impact on the CAD value. Generally, if Oil price rises CAD also goes up, as aggregate demand for the currency increases. The opposite is the case if the price of Oil falls. Higher Oil prices also tend to result in a greater likelihood of a positive Trade Balance, which is also supportive of the CAD.
While inflation had always traditionally been thought of as a negative factor for a currency since it lowers the value of money, the opposite has actually been the case in modern times with the relaxation of cross-border capital controls. Higher inflation tends to lead central banks to put up interest rates which attracts more capital inflows from global investors seeking a lucrative place to keep their money. This increases demand for the local currency, which in Canada’s case is the Canadian Dollar.
Macroeconomic data releases gauge the health of the economy and can have an impact on the Canadian Dollar. Indicators such as GDP, Manufacturing and Services PMIs, employment, and consumer sentiment surveys can all influence the direction of the CAD. A strong economy is good for the Canadian Dollar. Not only does it attract more foreign investment but it may encourage the Bank of Canada to put up interest rates, leading to a stronger currency. If economic data is weak, however, the CAD is likely to fall.
13:31
Canada New Housing Price Index (YoY) declined to 0.1% in December from previous 0.2%
13:30
Canada New Housing Price Index (MoM) below expectations (0.2%) in December: Actual (-0.1%)
CTAs were likely to buy Gold in the coming sessions in (nearly) every reasonable scenario for prices, TDS’ Senior Commodity Strategist Daniel Ghali notes.
USD's rally failes to weigh on precious metals
“We now estimate that price action overnight has been sufficiently strong to catalyze the largest buying program since the summer of 2024. As a result, CTA trend followers are set to add approximately +14% of their max size, providing a strong impulse for prices to break into new all-time highs.”
“Macro funds have replenished their war chest of dry-powder to deploy, whereas rates markets are only pricing 1.5 cuts for this year, the USD's relentless rally failed to weigh on precious metals amid signs of Mystery Buying, US10y yields have already considerably increased, and geopolitical uncertainty remains elevated, suggesting the balance of risks now implies that macro funds will redeploy their capital into the yellow metal's warm embrace.”
“Further, Gold markets have seen significant relief for EFPs without damaging flat prices.”
The Pound Sterling (GBP) is tracking its major currency peers higher against the USD on the session—but is lagging the EUR somewhat, Scotiabank’s Chief FX Strategist Shaun Osborne notes.
PMI data and USD softness push GBP/USD upwards
“UK PMI data was also supportive, however. Services PMI rose to 51.2 in January, ahead of forecasts of 50.8. Manufacturing also improved to 48.2.”
“A nice turn higher is developing on the Cable charts. The weekly reflects a potential bullish ‘morning star’ cancel pattern (assuming a firm close today) while the daily chart shows spot testing major trend resistance (off the late September peak) at 1.2417—which coincides with initial retracement resistance at 1.2415.”
“A firm daily close should see GBP gains extend towards 1.25/1.26.”
The Euro (EUR) has managed to push a little more decisively through the low 1.04 area overnight, with the help of easing, for now, tariff concerns and firmer than forecast PMI data, reflecting solid, German Services data, Scotiabank’s Chief FX Strategist Shaun Osborne notes.
EZ PMIs and narrower spreads help Euro gains
“Eurozone Manufacturing PMI rose a point to 46.1 while Services eased fractionally to 51.4 in January, driving the Composite index to 50.2. EUR gains are supported by narrower, though still significant, spreads. The 2Y cash bond spread has narrowed to –198bps, the narrowest since early November, helping pull spot a little closer to fair value (1.0592, by our measure).”
“Spot nosed above 1.05 earlier before drifting back slightly but the key—technical—point here is that solid EUR gains on the week are (finally, it would seem) settling more clearly above the low 1.04 area that has capped recent gains and also represents the initial Fibonacci retracement resistance from the EUR’s drop from 1.12.”
“The next retracement target is 1.0574 (38.2%), with the low 1.06 area also likely to represent firm resistance.”
The Canadian Dollar (CAD) is picking up a little support amid the broader decline in the USD into the end of the week but gains remain suitably measured, Scotiabank’s Chief FX Strategist Shaun Osborne notes.
CAD gains modestly
“Canada is clearly not off the tariff hook—and next week is likely to see the Bank of Canada cut rates while the Fed sits on its hands, reinforcing punishingly wide yields spreads for the CAD. Oil prices have slipped somewhat, following President Trump’s comments to the Davos/WEF yesterday, and commodity prices more broadly have consolidated over the past week after a solid start to the year.”
“Ordinarily, the improvement in commodity prices/Canadian terms of trade through January so far would be a mild positive for the CAD at least. The USD negative technical signals are starting to mount up. The USD has eased below trend support off the September low this week and continues to carve out what might be a bearish, broadening top on the daily chart.”
“A low weekly close—likely, at this point—puts a bearish outside range reversal on the weekly chart. The CAD has an opportunity to steady or pick up a little ground in the short run. A push under 1.4250 in the next few days could see losses extend towards 1.40/1.41.”
The New Zealand Dollar (NZD) has been having a good run, Rabobank’s FX analyst Jane Folley reports.
NZD/USD is likely to struggle to rally in the weeks ahead
“In the year to date it is the second best performing G10 currency after the AUD. This is despite NZD/USD moving close to 0.5542 on January 13 which was its lowest level since October 2022. A key factor behind the emergence of a better tone in the NZD is growing confidence that the New Zealand economy will be able to move away from last year’s recessionary conditions and post an economic recovery in the year ahead.”
“That said, it is widely expected that this will necessitate further rate cuts from the RBNZ this year. Although some of the broadbased strength of the USD has been sapped this week by relief that tariffs have not be announced by President Trump in the first days after his inauguration, we expect the USD to remain firm in the year ahead.”
“This suggest that NZD/USD is likely to struggle to rally significantly in the weeks ahead. NZD/USD is currently positioned close to the 50-day SMA at 0.5524. This is likely to offer resistance.”
The US Dollar retreats on all fronts and against all major peers.
US President Trump commented that tariffs on China might not finally be imposed.
The US Dollar Index (DXY) sinks below 108.00 and hits a key moving average.
The US Dollar Index (DXY), which tracks the performance of the US Dollar against six different major currencies, sinks below 107.50 at the time of writing on Friday after US President Donald Trump left surprised with comments the previous day casting doubts on the application of tariffs on China. The comments came after Trump had a phone call with China’s President Xi Jinping. Meanwhile, the Bank of Japan (BoJ) hiked interest rates by 25 basis points, which triggered substantial losses for the US Dollar (USD) against the Japanese Yen (JPY).
In the economic data front, Markit has already released Germany’s Purchasing Managers Index (PMI) preliminary readings for January, with some strong upbeat numbers, fueling more Euro (EUR) strength against the US Dollar (USD). Later this Friday, the US will receive its S&P Global PMI preliminary readings for the same month. The University of Michigan will close off the day with the final reading of its Consumer Sentiment Index for January.
Daily digest market movers: Messy to say the least
US President Donald Trump released comments about his phone call with Chinese President Xi Jinping. He surprised markets by saying he does not want to impose tariffs on China, Bloomberg reported.
US President Trump commented on the Federal Reserve and US rates, affirming that he would demand an immediate cut in US interest rates, Bloomberg reports.
Germany saw its preliminary Services PMI jump to 52.5 in January, beating the 51.0 estimate and above the previous 51.2. The Composite PMI was able to head out of contraction, reaching 50.1 and beating the expected 48.2 and the previous 48.0.
At 14:45 GMT, the US will receive its PMI preliminary reading for January from S&P Global:
Services are expected to soften to 56.5, coming from 56.8 in December’s final reading.
Manufacturing is expected to remain in contraction at 49.6, coming from 49.4.
At 15:00 GMT, the University of Michigan’s final reading for its Consumer Sentiment Index for January is expected to remain stable at 73.2. The 5-year inflation expectation component is also set to remain unchanged at 3.3%.
Equities are mixed, with China and Europe in positive territory as markets tune down Trump’s tariffs risk. However, after that same headline, US equities face a setback and are trading negatively.
The CME FedWatch tool projects a 52.2% chance that interest rates will remain unchanged at current levels in the May meeting, suggesting a rate cut in June. Expectations are that the Federal Reserve (Fed) will remain data-dependent with uncertainties that could influence inflation during US President Donald Trump’s term.
The US 10-year yield is trading around 4.631%, off its poor performance seen earlier this week at 4.528% and still has a long way to go back to the more-than-one-year high from last week at 4.807%.
US Dollar Index Technical Analysis: Sigh of relief
The US Dollar Index (DXY) is taking some punches and heading lower, hand in hand with US yields. Although US President Trump might suddenly soften his stance on tariffs, it is still early in his term to rule out any tariff implementation on China and other countries. Tail risks are forming, with markets starting to downplay the actual stance, which might still see the US Dollar rally if Trump slaps tariffs on China.
The DXY has its work cut out to recover to levels seen at the start of this week. First, the big psychological level at 108.00 needs to be recovered. From there, 109.29 (July 14, 2022, high and rising trendline) is next to pare back incurred losses from this week. Further up, the next upside level to hit before advancing further remains at 110.79 (September 7, 2022, high).
On the downside, the convergence of the high of October 3, 2023 and the 55-day Simple Moving Average (SMA) around 107.50 should act as a double safety feature to support the DXY price. For now, that looks to be holding, though the Relative Strength Index (RSI) still has some room left to the downside. Hence, rather look for 106.52 or even 105.89 as better levels for US Dollar bulls to engage and trigger a reversal.
US Dollar Index: Daily Chart
US Dollar FAQs
The US Dollar (USD) is the official currency of the United States of America, and the ‘de facto’ currency of a significant number of other countries where it is found in circulation alongside local notes. It is the most heavily traded currency in the world, accounting for over 88% of all global foreign exchange turnover, or an average of $6.6 trillion in transactions per day, according to data from 2022. Following the second world war, the USD took over from the British Pound as the world’s reserve currency. For most of its history, the US Dollar was backed by Gold, until the Bretton Woods Agreement in 1971 when the Gold Standard went away.
The most important single factor impacting on the value of the US Dollar is monetary policy, which is shaped by the Federal Reserve (Fed). The Fed has two mandates: to achieve price stability (control inflation) and foster full employment. Its primary tool to achieve these two goals is by adjusting interest rates. When prices are rising too quickly and inflation is above the Fed’s 2% target, the Fed will raise rates, which helps the USD value. When inflation falls below 2% or the Unemployment Rate is too high, the Fed may lower interest rates, which weighs on the Greenback.
In extreme situations, the Federal Reserve can also print more Dollars and enact quantitative easing (QE). QE is the process by which the Fed substantially increases the flow of credit in a stuck financial system. It is a non-standard policy measure used when credit has dried up because banks will not lend to each other (out of the fear of counterparty default). It is a last resort when simply lowering interest rates is unlikely to achieve the necessary result. It was the Fed’s weapon of choice to combat the credit crunch that occurred during the Great Financial Crisis in 2008. It involves the Fed printing more Dollars and using them to buy US government bonds predominantly from financial institutions. QE usually leads to a weaker US Dollar.
Quantitative tightening (QT) is the reverse process whereby the Federal Reserve stops buying bonds from financial institutions and does not reinvest the principal from the bonds it holds maturing in new purchases. It is usually positive for the US Dollar.
President Trump’s comments to the Davos WEF yesterday contained much of the same as his recent pronouncements—tax cuts, lower oil prices and a demand that interest rates drop ‘immediately’. Tariffs got some airtime, but the lack of specifics remains a hindrance on the US Dollar’s (USD) performance, Scotiabank’s Chief FX Strategist Shaun Osborne notes.
USD slides as President Trump soft pedals China tariffs
“In addition, the president commented last night that he’d ‘rather not’ have to impose tariffs on China—prompting a further slide in the USD. Markets have been holding significant long USD positions and the USD’s run up around the presidential election was due in some significant part to the expectation that broad and aggressive tariff action would be slapped on the US’ main trading partners from day one. The more nuanced approach to tariffs is prompting a shake out of positioning—and there may be more to come.”
“The major currencies are showing broad gains on the USD today and the DXY is showing a 1.6% loss on the week, its biggest fall since a similar decline in late August. Technical pointers are leaning bearish for the DXY, suggesting the index could ease another 1% or so in the short run. The SEK, ZAR and MXN are leading gains on the day, with the EUR also notching up a solid rise, with the help of Eurozone data.”
“Havens like the CHF and JPY are lagging, with the Japanese currency more or less flat on the session despite the BoJ delivering the expected 25bps rate hike earlier (to 0.5%, the highest since 2008). The BoJ upgraded its view on the strength of inflation, keeping the door open to more tightening down the road. Before the decision, Japan reported higher than expected CPI for December (+3.6% Y/Y). Narrower spreads should help keep a firm lid on USD/JPY around the 160 point but spot gains may be limited by the fact that the USD is trading a little below our fair value estimate (157) currently.”
11:30
India Bank Loan Growth increased to 11.5% in January 6 from previous 11.2%
11:30
India FX Reserves, USD down to $623.98B in January 13 from previous $625.87B
EUR/JPY soars to near 153.50 on stronger-than-projected Eurozone PMI growth in January.
The ECB is almost certain to cut interest rates on Thursday.
The BoJ refrained from committing a pre-defined rate hike path.
The EUR/JPY pair rises sharply to near 153.50 in Friday’s European session. The asset strengthens on the back of strong appeal for the Euro (EUR) as the flash Eurozone HCOB Purchasing Managers’ Index (PMI) data for January has come in surprisingly stronger.
The HCOB PMI data, compiled by S&P Global, showed that the overall business activity expanded after contracting for two months. The Composite PMI, which gauges the overall private sector activity, advances to 50.2 from 49.6 in December. Economists expected the overall business activity to continue to contract but at a slower pace. The report also showed that strong business activity in the Euro area majorly came from the German economy, which also returned into the expansion, while, the French economy continued to decline.
Surprisingly upbeat Eurozone PMI data has fears of weakening economic outlook, however, it is unlikely to diminish firm market expectations that the European Central Bank (ECB) will cut interest rates in the policy meeting on Thursday. The ECB is almost certain to cut its Deposit Facility rate by 25 basis points (bps) to 2.75%. Traders are price in three more interest rate cuts by the ECB in next three policy meetings.
Meanwhile, the Japanese Yen (JPY) weakens across the board as markets had already priced in a 25-basis points (bps) interest rate hike by the Bank of Japan (BoJ), which pushed borrowing rates higher to 0.5%. The BoJ has also revised inflation forecast higher, expects price pressures to remain above 2% until FY2026 amid confidence over firm wage outlook.
Japanese Yen PRICE Today
The table below shows the percentage change of Japanese Yen (JPY) against listed major currencies today. Japanese Yen was the strongest against the US Dollar.
USD
EUR
GBP
JPY
CAD
AUD
NZD
CHF
USD
-0.68%
-0.56%
0.00%
-0.32%
-0.53%
-0.66%
-0.17%
EUR
0.68%
0.12%
0.69%
0.36%
0.15%
0.03%
0.52%
GBP
0.56%
-0.12%
0.56%
0.24%
0.02%
-0.10%
0.39%
JPY
0.00%
-0.69%
-0.56%
-0.33%
-0.55%
-0.68%
-0.19%
CAD
0.32%
-0.36%
-0.24%
0.33%
-0.22%
-0.34%
0.15%
AUD
0.53%
-0.15%
-0.02%
0.55%
0.22%
-0.12%
0.32%
NZD
0.66%
-0.03%
0.10%
0.68%
0.34%
0.12%
0.48%
CHF
0.17%
-0.52%
-0.39%
0.19%
-0.15%
-0.32%
-0.48%
The heat map shows percentage changes of major currencies against each other. The base currency is picked from the left column, while the quote currency is picked from the top row. For example, if you pick the Japanese Yen from the left column and move along the horizontal line to the US Dollar, the percentage change displayed in the box will represent JPY (base)/USD (quote).
The BoJ didn’t offer cues about when and at which pace the central bank will raise interest rates further. "We don't have any preset idea,” BoJ Governor Kazuo Ueda said. He added that the central bank make a decision at each policy meeting by looking at “economic and price developments as well as risks”.
Today’s BoJ rate hike is a step on the road to normalization, consistent with a less oversold Japanese Yen (JPY). The Dollar Index (DXY) seeing its biggest two-week since August, is consistent with the recent phase of dollar strength losing momentum. But range-trading is more likely than a significant downtrend, for now, Societe Genrale’s FX expert Kit Juckes notes.
USD is up against the GBP, down against the rest
“The third full week of 2025 is ending and so far, the pound is the weakest of the G10 currencies while the Australian and New Zealand dollars are fighting it out for top place. The USD is up against the pound, down against the rest, and the DXY is set to fall for a second week in a row for the first time since the latest rally kicked off at the end of September.”
“It’s the biggest two-week fall since August and the before that, the biggest since 2023. Finally, this fall has also helped move the Dollar Index loser to where relative rates might suggest it should be – current ‘fair value’ on that basis is around 104.5.”
“DXY and EUR/USD are pretty stuck in ranges, which I’ll define as 99 to 110 for the DXY, consistent with EUR/USD in a 1-1.12 range, until something changes dramatically. Indeed, a lot has to change before we get back to EUR/USD 1.10. This morning’s marginally better PMIs were welcome, but don’t count as a game-changer.”
US yields plunge, and equities rally after President Trump commented that he might not impose tariffs on China.
Gold is back on track to hit the all-time high of $2,790 and is set to close off the week with a firm gain.
Gold’s price (XAU/USD) pops higher and trades at $2,774 at the time of writing on Friday after US President Donald Trump surprised with comments the previous day casting doubts on the application of tariffs on China. The comments came after Trump had a phone call with China’s President Xi Jinping. Meanwhile, US yields are retreating after the Bank of Japan (BoJ) hiked interest rates by 25 basis points.
In the economic data front, the US will receive its S&P Global Purchasing Managers Index (PMI) preliminary readings for January this Friday. The University of Michigan will close off the day with its Consumer Sentiment Index for January, the final reading. Headline risk might retake place with US President Donald Trump adding remarks on tariffs.
Daily digest market movers: Angry mob
US President Donald Trump commented on his phone call with Chinese Prime Minister Xi Jinping that he does not want to impose tariffs on China and that a deal would be more constructive, Bloomberg reported.
President Trump also talked about the Federal Reserve (Fed) and US rates, affirming that he would demand an immediate drop. While lower borrowing costs are typically bullish for precious metals, traders are cautious as monetary policy is set by the central bank, which is due to publish its interest rate decision next week, Bloomberg reports.
US yields are off their weekly lows, with the US 10-year benchmark rate currently trading at 4.625%, recovering from its poor performance earlier this week at 4.528%. However, it still has a long way to go before it reaches the more-than-one-year high from last week at 4.807%.
Technical Analysis: More dovish than ever?
Gold price rallies again, thanks to US President Donald Trump’s statement after his phone call with Chinese President Xi Jinping that he would rather not impose tariffs on China. It looks like Trump is backtracking on earlier comments made during his campaign. A tail risk could grow here, in case negotiations are not going the way t Trump wants, he can still implement tariffs anyway.
First line of support remains $2,721, a sort of double top in November and December broken on Tuesday. Just below that, $2,709 (October 23, 2024, low) is in focus as a second nearby support. In case both abovementioned levels snap, look for a dive back to $2,680 with a full-swing sell-off.
Gold is back on its way to the all-time high of $2,790, which is less than 1% away from current levels. Once above that, a fresh all-time high will present itself. Meanwhile, some analysts and strategists have penciled in calls for $3,000, but $2,800 looks to be a good starting point as the next resistance on the upside.
XAU/USD: Daily Chart
Gold FAQs
Gold has played a key role in human’s history as it has been widely used as a store of value and medium of exchange. Currently, apart from its shine and usage for jewelry, the precious metal is widely seen as a safe-haven asset, meaning that it is considered a good investment during turbulent times. Gold is also widely seen as a hedge against inflation and against depreciating currencies as it doesn’t rely on any specific issuer or government.
Central banks are the biggest Gold holders. In their aim to support their currencies in turbulent times, central banks tend to diversify their reserves and buy Gold to improve the perceived strength of the economy and the currency. High Gold reserves can be a source of trust for a country’s solvency. Central banks added 1,136 tonnes of Gold worth around $70 billion to their reserves in 2022, according to data from the World Gold Council. This is the highest yearly purchase since records began. Central banks from emerging economies such as China, India and Turkey are quickly increasing their Gold reserves.
Gold has an inverse correlation with the US Dollar and US Treasuries, which are both major reserve and safe-haven assets. When the Dollar depreciates, Gold tends to rise, enabling investors and central banks to diversify their assets in turbulent times. Gold is also inversely correlated with risk assets. A rally in the stock market tends to weaken Gold price, while sell-offs in riskier markets tend to favor the precious metal.
The price can move due to a wide range of factors. Geopolitical instability or fears of a deep recession can quickly make Gold price escalate due to its safe-haven status. As a yield-less asset, Gold tends to rise with lower interest rates, while higher cost of money usually weighs down on the yellow metal. Still, most moves depend on how the US Dollar (USD) behaves as the asset is priced in dollars (XAU/USD). A strong Dollar tends to keep the price of Gold controlled, whereas a weaker Dollar is likely to push Gold prices up.
USD/JPY recently formed a lower peak near 158.85 than the one achieved last year at 162, Societe Genrale’s FX experts note.
USD/JPY can fall down to 154.30/153.75 and below
“Daily MACD has been posting negative divergence highlighting receding upward momentum. The pair is now challenging the confluence of the 50-DMA and a multi-month ascending trend line. It will be interesting to see if the pair attempts a rebound from this MA. Failure to overcome the high achieved earlier this week near 156.75 could denote risk of a deeper pullback.”
“Next potential supports could be located at 154.30/153.75, the 50% retracement from December and 152.80.”
The equity and credit markets rallied and the US yield curve bear steepened after the first executive orders and the salvo of announcements by President Trump on trade tariffs, tax cuts and the desire for lower oil prices and interest rates. The correlation of the dollar and the shape of the Treasury curve is going through a first and tentative regime change, although the proximity of the Fed and ECB meetings next week calls for caution in drawing premature conclusions, Societe Genrale’s FX experts note.
US Dollar falls out of favour.
“It is noteworthy that the CAD and MXN both strengthened yesterday and are on track for weekly gains with broader G10 and EM, despite the threat of 25% US tariffs on 1 February on imports from Canada and Mexico. Since the election last November, the steeper yield curve has featured as a catalyst for a stronger dollar. However, the relationship rolled over in the last 48 hours, a test for the heretofore successful strategy of buying dollar dips. Both the yuan and the euro also ignored the tariff threat from the US.”
“EUR/USD rose to a new high of 1.0457, narrowing the gap with 2y bond spreads. The Scandis outperformed this week in G10. Latam, driven by the BRL, and CEE led by the PLN, excelled in EM. Dispersion in bond land was evident in the outperformance of the UK and Australia relative to Europe, Canada and the US. Brent crude touched a low of $78/bbl after Trump vowed to bring down the price of oil as a mechanism to stop the war in Ukraine. Lower energy prices would also serve his purpose of lowering inflation.”
“The Fed meets next week and is overwhelmingly expected to keep interest rates on hold. Pricing for the March FOMC was static at around -7bp. The rise in US continuing claims to 1.899m, the highest since November 2021, stands out, but did not change perceptions about the resilience of the labour market. Demand for new IG and benchmark bonds was rock solid in the US and Europe. Strong bidding was evident for syndicated debt in France and the UK. Investors also flocked to Spanish and US debt. Japanese investors scooped up foreign bonds for a second successive week and raised allocation to non-Japanese stocks for a sixth successive week.”
ECB President Lagarde reaffirmed the case for a rate cut next week. The ESTR curve is pricing in cuts next week and in March. Tensions appear to exist among the Council hawks, which could result in a more balanced than categorically dovish decision next week. Holzmann made the case to wait a bit longer for the next rate cut, Societe Genrale’s team of experts notes.
Cutting pace is dependent on incoming data
“For Lagarde, the ECB is not behind the curve on interest rates, the direction is clear and the pace is dependent on incoming data. She is not overly concerned on any inflation export from the US. Buba president Nagel called on the next government to consider adjusting the debt brake rules to allow for more investment in infrastructure and energy.”
“Business confidence in France improved a fraction to 95 in December. Canada’s retail sales disappointed in November but households were probably inclined to postpone spending until December when the sales tax was temporarily reduced. Core sales decreased by -0.7% in November.”
“Statistics Canada’s first estimate for December retail sales is +1.6% mom. Inflation slowed to 1.8% last month and the core (trimmed) decreased to 2.5%. The BoC is widely expected to lower the policy rate next week by 25bp to 3.0%. Norges Bank kept rates on hold at 4.50% and repeated that the policy rate will likely be reduced in March. In Japan, headline CPI accelerated to 3.6% in December, core rose to 3.0%.”
EUR/USD raises sharply to near 1.0500 as upbeat Eurozone preliminary PMI data for January has strengthened the Euro.
The ECB is widely anticipated to cut its Deposit Facility rate by 25 bps to 2.75% on Thursday.
Trump’s call on immediate rate cuts and his soft tone for China have weighed heavily on the US Dollar.
EUR/USD rallies to near the psychological resistance of 1.0500 in Friday’s European session as the Hamburg Commercial Bank (HCOB) reported that the Eurozone preliminary Composite Purchasing Managers Index (PMI) grew in January after shrinking in the last two months. Flash HCOB PMI report, compiled by S&P Global, showed that overall business activity expanded. The Composite PMI rose to 50.2 from 49.6 in November. Economists expected the PMI to continue to decline but at a slower pace to 49.7.
“The kick-off to the new year is mildly encouraging. The private sector is back in cautious growth mode after two months of shrinking. The drag from the manufacturing sector has eased a bit, while the services sector continues to grow moderately. Germany played a major role in improving the eurozone economy, with the composite index jumping back into expansionary territory. In contrast, France's economy remained in contraction,” Dr. Cyrus de la Rubia, Chief Economist at Hamburg Commercial Bank, said.
The report also showed robust labor demand and new business in the services sector. Meanwhile, the manufacturing sector continues to experience layoffs and declining new orders.
Upbeat Eurozone PMI has improved the appeal of the Euro (EUR) in the near term but is unlikely to fix its weak broader outlook on the back of firm European Central Bank (ECB) dovish bets. The ECB is all set to cut its Deposit Facility rate by 25 basis points (bps) to 2.75% on Thursday and would continue to follow the process in the next three policy meetings as officials are confident that inflationary pressures will sustainably return to the desired rate of 2%.
Daily digest market movers: EUR/USD surges as USD’s risk-premium diminishes
EUR/USD strengthens as the US Dollar (USD) risk-premium has diminished significantly. The US Dollar Index (DXY), which tracks the Greenback’s value against six major currencies, is down near 0.6% on Friday and posts a fresh five-week low near 107.45. The USD’s risk-premium has eased significantly as United States (US) President Donald Trump has signaled that he could reach a deal with China without using tariffs.
The Dollar has gained almost 10% since October, partly due to market expectations that President Trump would impose lethal tariffs on its trading partners soon after returning to the White House. During the election campaign, Trump commented that if he won, he would impose 60% tariffs on China and 25% on other North American economies.
President Trump said in an interview with Fox News on Thursday that he had a friendly conversation with Chinese leader Xi Jinping and could reach a deal over trade practices. Trump added that he would rather not use tariffs against China but called tariffs a "tremendous power," Reuters report.
In addition to Trump’s assumption of tariff relaxation on China, his endorsement of immediate interest rate cuts in his comments at the World Economic Forum (WEF) in Davos on Thursday has also sent the US Dollar on the back foot.
Going forward, the major trigger for the US Dollar will be the Federal Reserve’s (Fed) monetary policy, which will be announced on Wednesday. The Fed is almost certain to keep interest rates unchanged in the range of 4.25%-4.50%. Investors will pay close attention to Fed Chair Jerome Powell’s conference to determine whether officials agree with President Trump's views.
In Friday’s session, investors will focus on the preliminary US S&P Global PMI data for January, which will be published at 14:45 GMT.
Technical Analysis: EUR/USD refreshes monthly high near 1.0500
EUR/USD posts a fresh monthly high near 1.0500 on Friday. The major currency pair strengthens after breaking above the 50-day Exponential Moving Average (EMA), which trades around 1.0456, on Monday. The pair has continued attracting bids since declining to an over-two-year low of 1.0175 on January 13.
The pair has entered the path of a bullish reversal after a breakout of the January 6 high of 1.0430, which has confirmed a divergence in the asset’s price and the 14-day Relative Strength Index (RSI). On January 13, the RSI formed a higher low, while the pair made lower lows.
Looking down, the January 20 low of 1.0266 will be the key support zone for the pair. Conversely, the December 6 high of 1.0630 will be the key barrier for the Euro bulls.
Euro FAQs
The Euro is the currency for the 19 European Union countries that belong to the Eurozone. It is the second most heavily traded currency in the world behind the US Dollar. In 2022, it accounted for 31% of all foreign exchange transactions, with an average daily turnover of over $2.2 trillion a day. EUR/USD is the most heavily traded currency pair in the world, accounting for an estimated 30% off all transactions, followed by EUR/JPY (4%), EUR/GBP (3%) and EUR/AUD (2%).
The European Central Bank (ECB) in Frankfurt, Germany, is the reserve bank for the Eurozone. The ECB sets interest rates and manages monetary policy. The ECB’s primary mandate is to maintain price stability, which means either controlling inflation or stimulating growth. Its primary tool is the raising or lowering of interest rates. Relatively high interest rates – or the expectation of higher rates – will usually benefit the Euro and vice versa. The ECB Governing Council makes monetary policy decisions at meetings held eight times a year. Decisions are made by heads of the Eurozone national banks and six permanent members, including the President of the ECB, Christine Lagarde.
Eurozone inflation data, measured by the Harmonized Index of Consumer Prices (HICP), is an important econometric for the Euro. If inflation rises more than expected, especially if above the ECB’s 2% target, it obliges the ECB to raise interest rates to bring it back under control. Relatively high interest rates compared to its counterparts will usually benefit the Euro, as it makes the region more attractive as a place for global investors to park their money.
Data releases gauge the health of the economy and can impact on the Euro. Indicators such as GDP, Manufacturing and Services PMIs, employment, and consumer sentiment surveys can all influence the direction of the single currency. A strong economy is good for the Euro. Not only does it attract more foreign investment but it may encourage the ECB to put up interest rates, which will directly strengthen the Euro. Otherwise, if economic data is weak, the Euro is likely to fall. Economic data for the four largest economies in the euro area (Germany, France, Italy and Spain) are especially significant, as they account for 75% of the Eurozone’s economy.
Another significant data release for the Euro is the Trade Balance. This indicator measures the difference between what a country earns from its exports and what it spends on imports over a given period. If a country produces highly sought after exports then its currency will gain in value purely from the extra demand created from foreign buyers seeking to purchase these goods. Therefore, a positive net Trade Balance strengthens a currency and vice versa for a negative balance.
USD/CNH could stay below 7.30 for now, despite Trump threatening to impose a 10% US tariff on Chinese goods comes February 1, OCBC’s FX & Credit StrategistChang Wei Liang notes.
Trump holds back on introducing universal tariffs for now
“In his Davos speech yesterday, Trump spoke positively about his relationship with President Xi, saying that all that he was seeking is a fair trading relationship with China. This suggests that the outcome of US-China negotiations will drive any tariff decisions, following an earlier call between the two leaders to discuss trade, fentanyl, and TikTok.”
“Trump has held back on introducing universal tariffs so far, but he has also directed the US Commerce and Treasury Departments to probe economic and national security risks of large trade deficits, and recommend appropriate measures.”
The Bank of Japan (BoJ) hiked rates by 25bp this morning, in line with market expectations and consensus. Markets are still assessing Governor Kazuo Ueda’s press conference as we write, but the reaction in the yen to the whole event signals a hawkish surprise, primarily related to the upward revision in headline and core CPI forecast projections, ING’s FX analyst Francesco Pesole notes.
USD/JPY can be pushed into the 155.0 mark
“Policymakers now expect 2.4% inflation (up from 1.9%) in 2025 and the BoJ added that it will ‘continue to raise the policy interest rate and adjust the degree of monetary accommodation’, echoing the language used in the July statement. Some previous remarks by Ueda on potentially delaying the hike if markets proved too volatile following Trump’s inauguration have been clarified, with the statement highlighting that markets have been stable on the whole.”
“USD/JPY briefly traded below 155.0 this morning before paring back some losses as Ueda delivered a rather cautious tone at the press conference. He gave no indication about the timing for the rate hike or the pace of further tightening. Two-year JPY swap rates are up only modestly to 0.74%, signalling there is still room for a hawkish repricing down the line to help the yen.”
“We now expect two more hikes in May and October this year, which would help the yen counter the generalised dollar strength and keep some pressure on USD/JPY into the 155.0 mark.”
The EIA released its weekly natural gas storage report in which US working storage was reported to have fallen by 223Bcf, less than the 248Bcf draw the market was expecting. The smaller-than-expected draw and forecasts for some warmer weather saw Henry Hub tick lower yesterday, ING’s commodity analyst Warren Patterson notes.
Concerns over EU gas storage remain unchanged
“European gas prices remain relatively well supported, with TTF trading just shy of EUR50/MWh. Concerns over EU gas storage remain with inventories now below 58% full, down from 74% at the same stage last year and below the five-year average of 66%.”
“The market and member countries are becoming increasingly concerned about the task of refilling storage through the injection season and the fact that the forward curve provides no incentive to store gas for next winter. The forward curve is in backwardation between summer 2025 and winter 2025/26. Talk of subsiding the refill of storage is growing.”
Donald Trump’s address in Davos yesterday included most of the threats related to implementing his America First vision – something markets are becoming accustomed to. Comments on oil prices and interest rates seemed to attract more headlines. Trump said OPEC should increase production to allow a decline in oil prices, which led to another leg lower in oil prices which have been under pressure since touching multi-month highs last week. The new administration plan is to drive down energy costs and by extension interest rates, ING’s commodity analyst Warren Patterson notes.
Trump wants oil prices to go down
Trump also said that he will discuss with Federal Reserve Chair Jerome Powell his view on rates “at the right time”, which probably suggests the government’s pressure shouldn’t be felt just yet when the FOMC meets next week. We expect a decision to hold rates steady next week will not be the trigger of another round of USD longs unwinding.”
“Overnight, the dollar did however take a hit as Trump surprisingly told Fox News he’d rather not impose tariffs on China. This seems to feed into the growing sense that Trump is underdelivering on protectionism compared to pre-inauguration remarks, and that ultimately some of those tariff threats may not materialize as long as some concessions are made on trade.”
“We would not be entirely surprised if Trump’s next comments on the matter point in the opposite direction. But barring that, the dollar momentum may remain soft today. On the data side, watch for US S&P Global PMIs today – expectations are for a small recovery in the manufacturing index – and home sales data (the latter for December).”
Oil prices came under pressure yesterday after President Trump's virtual address at the World Economic Forum at Davos, where he called for lower oil prices. The president said he would ask Saudi Arabia and OPEC members to bring prices down by increasing output. Trump said that lower oil prices could be used as a way to pressure Russia and help bring an end to the war in Ukraine, ING’s commodity analyst Warren Patterson notes.
Oil prices trades lower after President Trump’s speech at WEF
“In his previous term, President Trump was very vocal about OPEC needing to pump more oil. However, with Russia becoming increasingly more aligned with OPEC members through the OPEC+ alliance, as well as higher fiscal breakeven oil prices for key members, it will be no easy task to convince OPEC to increase output. According to the IMF, Saudi Arabia is estimated to have a fiscal breakeven oil price just shy of US$91/bbl. Furthermore, lower oil prices would also be an obstacle to significantly increasing US oil production.”
“The EIA’s weekly oil report showed that US commercial crude oil inventories fell by 1.02m barrels over the last week. This is the ninth consecutive week of declines in crude inventories, which leaves stocks at their lowest level since March 2022. This decline came despite refiners slashing run rates, which was driven by maintenance largely in the US Gulf Coast.”
“Refiners cut utilization rates by 5.8pp week-on-week, which saw crude oil inputs decline by 1.13m b/d. On the trade side, crude imports increased 621k b/d WoW, while exports also increased by 437k b/d. The increase in imports was largely driven by stronger flows from Canada. As for refined products, gasoline stocks increased by 2.33m barrels, despite the big fall in refinery activity. However, gasoline stocks on the East Coast fell following the temporary outage along the Colonial pipeline. Meanwhile, distillate stocks fell by 3.07m barrels WoW.”
President Christine Lagarde delivers remarks in Davos today after having reiterated the guidance for gradual cuts earlier this week, ING’s FX analyst Francesco Pesole notes.
EUR/USD is a touch away from 1.050
“That echoed what we have heard from other ECB members – even the more hawkish ones – and next week’s expected rate cut should be accompanied by a similar message that may just leave the market unfazed.”
“EUR/USD has received another small boost from Trump’s seemingly benign comments on China tariffs. The risk premium in EUR/USD has been halved from 3% to 1.5% since 9 January. We are not convinced that the gap will be entirely closed given lingering uncertainty about Trump’s trade hostility against the EU. But that China headline overnight has likely paved the way for testing 1.0500 in the coming days.”
UK Services PMI climbed to 51.2 in January, a positive surprise.
Manufacturing PMI in the UK jumped to 48.2 in January.
GBP/USD extends gains to near 1.2450 after UK business PMIs.
The seasonally adjusted S&P Global/CIPS UK Manufacturing Purchasing Managers’ Index (PMI) ticked higher to 48.2 in January from 47 in December. The data beat the market expectations of 47.1.
Meanwhile, the Preliminary UK Services Business Activity Index rose to 51.2 in January after recording 51.1 in December while coming in above the estimated 50.6 print.
FX implications
GBP/USD builds on the rebound to retest 1.2450 after the encouraging UK PMI data. The pair is adding 0.68% on the day, as of writing.
British Pound PRICE Today
The table below shows the percentage change of British Pound (GBP) against listed major currencies today. British Pound was the strongest against the US Dollar.
USD
EUR
GBP
JPY
CAD
AUD
NZD
CHF
USD
-0.83%
-0.66%
-0.40%
-0.34%
-0.62%
-0.74%
-0.43%
EUR
0.83%
0.17%
0.42%
0.50%
0.21%
0.09%
0.40%
GBP
0.66%
-0.17%
0.27%
0.32%
0.04%
-0.09%
0.22%
JPY
0.40%
-0.42%
-0.27%
0.05%
-0.24%
-0.36%
-0.05%
CAD
0.34%
-0.50%
-0.32%
-0.05%
-0.29%
-0.41%
-0.10%
AUD
0.62%
-0.21%
-0.04%
0.24%
0.29%
-0.12%
0.16%
NZD
0.74%
-0.09%
0.09%
0.36%
0.41%
0.12%
0.30%
CHF
0.43%
-0.40%
-0.22%
0.05%
0.10%
-0.16%
-0.30%
The heat map shows percentage changes of major currencies against each other. The base currency is picked from the left column, while the quote currency is picked from the top row. For example, if you pick the British Pound from the left column and move along the horizontal line to the US Dollar, the percentage change displayed in the box will represent GBP (base)/USD (quote).
Silver prices (XAG/USD) rose on Friday, according to FXStreet data. Silver trades at $30.93 per troy ounce, up 1.47% from the $30.48 it cost on Thursday.
Silver prices have increased by 7.05% since the beginning of the year.
Unit measure
Silver Price Today in USD
Troy Ounce
30.93
1 Gram
0.99
The Gold/Silver ratio, which shows the number of ounces of Silver needed to equal the value of one ounce of Gold, stood at 89.78 on Friday, down from 90.34 on Thursday.
Silver FAQs
Silver is a precious metal highly traded among investors. It has been historically used as a store of value and a medium of exchange. Although less popular than Gold, traders may turn to Silver to diversify their investment portfolio, for its intrinsic value or as a potential hedge during high-inflation periods. Investors can buy physical Silver, in coins or in bars, or trade it through vehicles such as Exchange Traded Funds, which track its price on international markets.
Silver prices can move due to a wide range of factors. Geopolitical instability or fears of a deep recession can make Silver price escalate due to its safe-haven status, although to a lesser extent than Gold's. As a yieldless asset, Silver tends to rise with lower interest rates. Its moves also depend on how the US Dollar (USD) behaves as the asset is priced in dollars (XAG/USD). A strong Dollar tends to keep the price of Silver at bay, whereas a weaker Dollar is likely to propel prices up. Other factors such as investment demand, mining supply – Silver is much more abundant than Gold – and recycling rates can also affect prices.
Silver is widely used in industry, particularly in sectors such as electronics or solar energy, as it has one of the highest electric conductivity of all metals – more than Copper and Gold. A surge in demand can increase prices, while a decline tends to lower them. Dynamics in the US, Chinese and Indian economies can also contribute to price swings: for the US and particularly China, their big industrial sectors use Silver in various processes; in India, consumers’ demand for the precious metal for jewellery also plays a key role in setting prices.
Silver prices tend to follow Gold's moves. When Gold prices rise, Silver typically follows suit, as their status as safe-haven assets is similar. The Gold/Silver ratio, which shows the number of ounces of Silver needed to equal the value of one ounce of Gold, may help to determine the relative valuation between both metals. Some investors may consider a high ratio as an indicator that Silver is undervalued, or Gold is overvalued. On the contrary, a low ratio might suggest that Gold is undervalued relative to Silver.
(An automation tool was used in creating this post.)
09:30
United Kingdom S&P Global/CIPS Manufacturing PMI came in at 48.2, above expectations (47.1) in January
09:30
United Kingdom S&P Global/CIPS Composite PMI registered at 50.9 above expectations (50) in January
09:30
United Kingdom S&P Global/CIPS Services PMI registered at 51.2 above expectations (50.6) in January
Citing government sources, Germany’s newspaper Handelsblatt reported on Friday that the government lowered its economic growth projection for 2025 to 0.3%, down from previous estimate of 1.1%.
Market reaction
The German growth projection fails to move the needle around the Euro, as EUR/USD rallies 0.77% on the day to near 1.0500.
AUD/USD attracts some buyers after Trump said that he could reach a trade deal with China.
Bets for more Fed rate cuts weigh on the USD amid a positive risk tone and also lend support.
Spot prices remain on track to snap a three-week losing streak as traders look to US PMIs.
The AUD/USD pair breakout of a two-day-old consolidative trading range and climbs to over a one-month top, around the 0.6330 area on the last day of the week. Spot prices stick to intraday positive bias through the first half of the European session, with bulls now awaiting a move beyond the 50-day Simple Moving Average (SMA) before positioning for further gains amid broad-based US Dollar (USD) weakness.
The USD Index (DXY), which tracks the Greenback against a basket of currencies, drops to a one-month low amid bets that the Federal Reserve (Fed) will lower borrowing costs further by the end of this year. The expectations were lifted by US President Donald Trump's comments on Thursday, saying that he will demand that interest rates drop immediately. This, along with a generally positive risk tone, undermines the safe-haven buck and provides a goodish lift to the AUD/USD pair.
The global risk sentiment gets an additional boost on Friday after Trump said that he would rather not use tariffs on China and that he could reach a trade deal with the world's second-largest economy. Moreover, Trump's remarks ease inflation concerns and trigger a fresh leg down in the US Treasury bond yields, which turns out to be another factor weighing on the USD. Apart from this, technical buying above the 0.6300 mark contributes to the AUD/USD pair's intraday positive move.
With the latest leg up, spot prices have now rallied around 200 pips from the lowest level since April 2020 touched earlier this month and remain on track to snap a three-week losing streak. Traders now look forward to the release of the flash US PMIs for some impetus later during the early North American session for some impetus. The focus will then shift to the official Chinese PMIs on Monday, which will influence sentiment surrounding the China-proxy Australian Dollar (AUD).
Australian Dollar FAQs
One of the most significant factors for the Australian Dollar (AUD) is the level of interest rates set by the Reserve Bank of Australia (RBA). Because Australia is a resource-rich country another key driver is the price of its biggest export, Iron Ore. The health of the Chinese economy, its largest trading partner, is a factor, as well as inflation in Australia, its growth rate and Trade Balance. Market sentiment – whether investors are taking on more risky assets (risk-on) or seeking safe-havens (risk-off) – is also a factor, with risk-on positive for AUD.
The Reserve Bank of Australia (RBA) influences the Australian Dollar (AUD) by setting the level of interest rates that Australian banks can lend to each other. This influences the level of interest rates in the economy as a whole. The main goal of the RBA is to maintain a stable inflation rate of 2-3% by adjusting interest rates up or down. Relatively high interest rates compared to other major central banks support the AUD, and the opposite for relatively low. The RBA can also use quantitative easing and tightening to influence credit conditions, with the former AUD-negative and the latter AUD-positive.
China is Australia’s largest trading partner so the health of the Chinese economy is a major influence on the value of the Australian Dollar (AUD). When the Chinese economy is doing well it purchases more raw materials, goods and services from Australia, lifting demand for the AUD, and pushing up its value. The opposite is the case when the Chinese economy is not growing as fast as expected. Positive or negative surprises in Chinese growth data, therefore, often have a direct impact on the Australian Dollar and its pairs.
Iron Ore is Australia’s largest export, accounting for $118 billion a year according to data from 2021, with China as its primary destination. The price of Iron Ore, therefore, can be a driver of the Australian Dollar. Generally, if the price of Iron Ore rises, AUD also goes up, as aggregate demand for the currency increases. The opposite is the case if the price of Iron Ore falls. Higher Iron Ore prices also tend to result in a greater likelihood of a positive Trade Balance for Australia, which is also positive of the AUD.
The Trade Balance, which is the difference between what a country earns from its exports versus what it pays for its imports, is another factor that can influence the value of the Australian Dollar. If Australia produces highly sought after exports, then its currency will gain in value purely from the surplus demand created from foreign buyers seeking to purchase its exports versus what it spends to purchase imports. Therefore, a positive net Trade Balance strengthens the AUD, with the opposite effect if the Trade Balance is negative.
Eurozone Manufacturing PMI rose to 46.1 in January, beating 45.3 forecast.
Bloc’s Services PMI eased to 51.4 in January vs. 51.6 estimated.
EUR/USD keeps gains near 1.0500 after German, Eurozone PMI data.
The Eurozone manufacturing sector remained in contraction while the services sector activity expanded less-than-expected in January, according to the data from the HCOB's latest Purchasing Managers Index (PMI) Survey published on Friday.
The Eurozone Manufacturing Purchasing Managers Index (PMI) advanced to 46.1 in January, beating the market expectations of 45.3.
The bloc’s Services PMI ticked lower to 51.4 January from 51.6 in December. The data came in below the market consensus of 51.6 and hit a two-month low.
The HCOB Eurozone PMI Composite jumped to 50.2 in January vs. December’s 49.6. The data reached a five-month top.
EUR/USD reaction to the Eurozone PMIs data
EUR/USD holds higher ground near 1.0500 on the mixed Eurozone PMI data, adding 0.80% on a daily basis.
Euro FAQs
The Euro is the currency for the 19 European Union countries that belong to the Eurozone. It is the second most heavily traded currency in the world behind the US Dollar. In 2022, it accounted for 31% of all foreign exchange transactions, with an average daily turnover of over $2.2 trillion a day. EUR/USD is the most heavily traded currency pair in the world, accounting for an estimated 30% off all transactions, followed by EUR/JPY (4%), EUR/GBP (3%) and EUR/AUD (2%).
The European Central Bank (ECB) in Frankfurt, Germany, is the reserve bank for the Eurozone. The ECB sets interest rates and manages monetary policy. The ECB’s primary mandate is to maintain price stability, which means either controlling inflation or stimulating growth. Its primary tool is the raising or lowering of interest rates. Relatively high interest rates – or the expectation of higher rates – will usually benefit the Euro and vice versa. The ECB Governing Council makes monetary policy decisions at meetings held eight times a year. Decisions are made by heads of the Eurozone national banks and six permanent members, including the President of the ECB, Christine Lagarde.
Eurozone inflation data, measured by the Harmonized Index of Consumer Prices (HICP), is an important econometric for the Euro. If inflation rises more than expected, especially if above the ECB’s 2% target, it obliges the ECB to raise interest rates to bring it back under control. Relatively high interest rates compared to its counterparts will usually benefit the Euro, as it makes the region more attractive as a place for global investors to park their money.
Data releases gauge the health of the economy and can impact on the Euro. Indicators such as GDP, Manufacturing and Services PMIs, employment, and consumer sentiment surveys can all influence the direction of the single currency. A strong economy is good for the Euro. Not only does it attract more foreign investment but it may encourage the ECB to put up interest rates, which will directly strengthen the Euro. Otherwise, if economic data is weak, the Euro is likely to fall. Economic data for the four largest economies in the euro area (Germany, France, Italy and Spain) are especially significant, as they account for 75% of the Eurozone’s economy.
Another significant data release for the Euro is the Trade Balance. This indicator measures the difference between what a country earns from its exports and what it spends on imports over a given period. If a country produces highly sought after exports then its currency will gain in value purely from the extra demand created from foreign buyers seeking to purchase these goods. Therefore, a positive net Trade Balance strengthens a currency and vice versa for a negative balance.
09:00
Eurozone HCOB Services PMI came in at 51.4 below forecasts (51.6) in January
09:00
Eurozone HCOB Composite PMI registered at 50.2 above expectations (49.7) in January
09:00
Eurozone HCOB Manufacturing PMI above forecasts (45.3) in January: Actual (46.1)
Germany’s Manufacturing PMI improved to 44.1 in January vs. 42 estimated.
Services PMI for the German economy rose to 52.5 in January vs. 51 anticipated.
EUR/USD picks up fresh bids to close in on 1.0500 after upbeat German PMIs.
The German manufacturing and services sectors activity improved in January, the preliminary business activity report published by the HCOB survey showed Friday.
The HCOB Manufacturing PMI in the Eurozone’s top economy unexpectedly rose to 44.1 this month, compared to December’s 42.5 while beating the expected 42 figure. The measure hit n eight-month high.
Meanwhile, Services PMI bounced to 52.5 in January from 51.2 in December. The market consensus was 51 in the reported period. The gauge reached a six-month top.
The HCOB Preliminary German Composite Output Index stood at 50.1 in January vs. 48 in December and 48.2 estimates. The index was at its highest in seven months.
FX implications
EUR/USD recovers further to test 1.0500 after the upbeat German data, currently trading 0.74% higher on the day.
Euro PRICE Today
The table below shows the percentage change of Euro (EUR) against listed major currencies today. Euro was the strongest against the US Dollar.
USD
EUR
GBP
JPY
CAD
AUD
NZD
CHF
USD
-0.66%
-0.35%
-0.51%
-0.28%
-0.60%
-0.71%
-0.37%
EUR
0.66%
0.31%
0.18%
0.38%
0.06%
-0.05%
0.29%
GBP
0.35%
-0.31%
-0.12%
0.06%
-0.25%
-0.36%
-0.03%
JPY
0.51%
-0.18%
0.12%
0.19%
-0.14%
-0.25%
0.10%
CAD
0.28%
-0.38%
-0.06%
-0.19%
-0.33%
-0.43%
-0.09%
AUD
0.60%
-0.06%
0.25%
0.14%
0.33%
-0.11%
0.21%
NZD
0.71%
0.05%
0.36%
0.25%
0.43%
0.11%
0.33%
CHF
0.37%
-0.29%
0.03%
-0.10%
0.09%
-0.21%
-0.33%
The heat map shows percentage changes of major currencies against each other. The base currency is picked from the left column, while the quote currency is picked from the top row. For example, if you pick the Euro from the left column and move along the horizontal line to the US Dollar, the percentage change displayed in the box will represent EUR (base)/USD (quote).
08:30
Germany HCOB Services PMI above expectations (51) in January: Actual (52.5)
08:30
Germany HCOB Manufacturing PMI came in at 44.1, above forecasts (42) in January
08:30
Germany HCOB Composite PMI registered at 50.1 above expectations (48.2) in January
08:15
France HCOB Composite PMI came in at 48.3, above forecasts (47.7) in January
08:15
France HCOB Services PMI registered at 48.9, below expectations (49.4) in January
08:15
France HCOB Manufacturing PMI above expectations (42.1) in January: Actual (45.3)
NZD/USD jumps strongly to near 0.5700 as US President Trump signaled that he could reach a deal with China.
Trump’s assumption of making a deal with China without imposing tariffs has diminished the risk-premium of the US Dollar.
The Fed is unlikely to be impacted by Trump’s call for immediate rate cuts.
The NZD/USD pair soars slightly above the key level of 0.5700 in Friday’s European session. The Kiwi pair strengthens amid an improvement in appeal of antipodeans after comments from United States (US) President Donald Trump in an interview with Fox News on Thursday signaled that the nation could reach to a deal with China without using tariffs.
Donald Trump said that he discussed an array of issues with China, including TikTok, trade, and Taiwan before returning to the White House. He added, "It was a good, friendly conversation,” and a trade deal can be achieved “without exercising tariffs”.
During the inauguration ceremony, Trump threatened to impose 10% tariffs on China and 25% on Mexico and Canada.
Trump’s soft tone with China has improved the New Zealand Dollar’s (NZD) appeal, given that New Zealand (NZ) is one of the leading trading partners of China.
Meanwhile, Trump’s friendly talk with China has diminished risk premium of the US Dollar (USD), which had a strong run in last few months. The US Dollar Index (DXY), which tracks the Greenback’s value against six major currencies, tumbles to near 107.55, the lowest level in almost a month.
The Greenback has also faced selling pressure from Trump’s speech at the World Economic Forum (WEF) in Davos, in which he endorsed the need for immediate interest rate cuts. With oil prices going down, I'll demand that interest rates drop immediately, and likewise, they should be dropping all over the world," Trump said.
Trump’s comments are unlikely to impact the Federal Reserve’s (Fed) monetary policy stance, as the Fed is an independent body.
New Zealand Dollar FAQs
The New Zealand Dollar (NZD), also known as the Kiwi, is a well-known traded currency among investors. Its value is broadly determined by the health of the New Zealand economy and the country’s central bank policy. Still, there are some unique particularities that also can make NZD move. The performance of the Chinese economy tends to move the Kiwi because China is New Zealand’s biggest trading partner. Bad news for the Chinese economy likely means less New Zealand exports to the country, hitting the economy and thus its currency. Another factor moving NZD is dairy prices as the dairy industry is New Zealand’s main export. High dairy prices boost export income, contributing positively to the economy and thus to the NZD.
The Reserve Bank of New Zealand (RBNZ) aims to achieve and maintain an inflation rate between 1% and 3% over the medium term, with a focus to keep it near the 2% mid-point. To this end, the bank sets an appropriate level of interest rates. When inflation is too high, the RBNZ will increase interest rates to cool the economy, but the move will also make bond yields higher, increasing investors’ appeal to invest in the country and thus boosting NZD. On the contrary, lower interest rates tend to weaken NZD. The so-called rate differential, or how rates in New Zealand are or are expected to be compared to the ones set by the US Federal Reserve, can also play a key role in moving the NZD/USD pair.
Macroeconomic data releases in New Zealand are key to assess the state of the economy and can impact the New Zealand Dollar’s (NZD) valuation. A strong economy, based on high economic growth, low unemployment and high confidence is good for NZD. High economic growth attracts foreign investment and may encourage the Reserve Bank of New Zealand to increase interest rates, if this economic strength comes together with elevated inflation. Conversely, if economic data is weak, NZD is likely to depreciate.
The New Zealand Dollar (NZD) tends to strengthen during risk-on periods, or when investors perceive that broader market risks are low and are optimistic about growth. This tends to lead to a more favorable outlook for commodities and so-called ‘commodity currencies’ such as the Kiwi. Conversely, NZD tends to weaken at times of market turbulence or economic uncertainty as investors tend to sell higher-risk assets and flee to the more-stable safe havens.
The Pound Sterling posts a fresh two-week high above 1.2400 against the US Dollar after US President Trump supported immediate interest rate cuts from the Fed.
The Fed is widely anticipated to keep interest rates steady on Wednesday.
Investors await the preliminary UK/US PMI data for January.
The Pound Sterling (GBP) jumps to near 1.2400 against the US Dollar (USD) on Friday. The GBP/USD gains as the US Dollar is onset to end the week with the highest losses in almost two months. The US Dollar Index (DXY), which tracks the Greenback’s value against six major currencies, slumps to near 107.60, the lowest level in over a month after United States (US) President Donald Trump signaled the need for immediate interest rate cuts by the Federal Reserve (Fed) in his commentary at the World Economic Forum (WEF) on Thursday.
"With oil prices going down, I'll demand that interest rates drop immediately, and likewise they should be dropping all over the world," Trump said. His comments have come just a few days before the announcement of the Fed’s first monetary policy meeting on January 29, in which it is certain to announce a pause in the policy-easing cycle and keep interest rates unchanged in the range of 4.25%-4.50%, according to the CME FedWatch tool.
Trump’s call for reducing interest rates immediately is unlikely to impact the Fed, an independent body dedicated to achieving its agenda of maintaining full employment with price stability.
In Friday’s session, the US Dollar will be influenced by the preliminary S&P Global PMI data for January, which will be published at 14:45GMT. The PMI data is expected to show that overall US private business activity remained almost steady in the month.
Daily digest market movers: Pound Sterling outperforms US Dollar
The Pound Sterling performs broadly sideways against its major peers, except the US Dollar, ahead of the preliminary United Kingdom (UK) S&P Global/CIPS Purchasing Managers Index (PMI) data for January, which will be published at 09:30 GMT. Investors will pay close attention to the private business activity data as they are worried about the UK economic outlook due to tight fiscal rules set by Chancellor of the Exchequer Rachel Reeves in the Autumn budget.
The agency is expected to report that the Composite PMI dropped to 50.0 from 50.4 in December, suggesting that overall private business activity expanded but at a slower pace. The Composite PMI is set to rise moderately as manufacturing sector activity continues to contract and the demand in the service sector expands at a slower pace.
Soft PMI numbers would boost market expectations that the Bank of England (BoE) will reduce interest rates by 25 basis points (bps) to 4.5% in February’s monetary policy meeting. However, strong numbers are unlikely to diminish these expectations, as dovish bets have been fuelled by soft inflation and employment data, and weak household spending.
On the fiscal front, Rachel Reeves said in an interview with the Wall Street Journal (WSJ) at the sidelines of the World Economic Forum in Davos that she is prepared to announce new measures in A budget update on March 26 to ensure meet fiscal rules. Reeves announced in October that the government will rely on foreign financing only for investment.
Technical Analysis: Pound Sterling rises to near 1.2400
The Pound Sterling climbs to near 1.2400 against the US Dollar on Friday. The GBP/USD pair gains after breaking above the 20-day Exponential Moving Average (EMA), which trades around 1.2363.
The 14-day Relative Strength Index (RSI) rebounds to near 50.00 from the 20.00-40.00 range, suggesting that the bearish momentum has ended, at least for now.
Looking down, the January 13 low of 1.2100 and the October 2023 low of 1.2050 will act as key support zones. On the upside, the 50-day EMA near 1.2515 will act as key resistance.
Pound Sterling FAQs
The Pound Sterling (GBP) is the oldest currency in the world (886 AD) and the official currency of the United Kingdom. It is the fourth most traded unit for foreign exchange (FX) in the world, accounting for 12% of all transactions, averaging $630 billion a day, according to 2022 data. Its key trading pairs are GBP/USD, also known as ‘Cable’, which accounts for 11% of FX, GBP/JPY, or the ‘Dragon’ as it is known by traders (3%), and EUR/GBP (2%). The Pound Sterling is issued by the Bank of England (BoE).
The single most important factor influencing the value of the Pound Sterling is monetary policy decided by the Bank of England. The BoE bases its decisions on whether it has achieved its primary goal of “price stability” – a steady inflation rate of around 2%. Its primary tool for achieving this is the adjustment of interest rates. When inflation is too high, the BoE will try to rein it in by raising interest rates, making it more expensive for people and businesses to access credit. This is generally positive for GBP, as higher interest rates make the UK a more attractive place for global investors to park their money. When inflation falls too low it is a sign economic growth is slowing. In this scenario, the BoE will consider lowering interest rates to cheapen credit so businesses will borrow more to invest in growth-generating projects.
Data releases gauge the health of the economy and can impact the value of the Pound Sterling. Indicators such as GDP, Manufacturing and Services PMIs, and employment can all influence the direction of the GBP. A strong economy is good for Sterling. Not only does it attract more foreign investment but it may encourage the BoE to put up interest rates, which will directly strengthen GBP. Otherwise, if economic data is weak, the Pound Sterling is likely to fall.
Another significant data release for the Pound Sterling is the Trade Balance. This indicator measures the difference between what a country earns from its exports and what it spends on imports over a given period. If a country produces highly sought-after exports, its currency will benefit purely from the extra demand created from foreign buyers seeking to purchase these goods. Therefore, a positive net Trade Balance strengthens a currency and vice versa for a negative balance.
EUR/GBP receives support ahead of the PMI readings from the Eurozone, Germany, and the UK.
The Euro may face challenges as traders expect the ECB to implement a series of rate cuts.
The Pound Sterling could face challenges amid the latest softer economic data from the United Kingdom.
EUR/GBP recovers after registering losses in the previous session, trading around 0.8440 during early European hours on Friday. The EUR/GBP cross gains traction ahead of the preliminary January readings for the HCOB Purchasing Managers Index (PMI) from the Eurozone and Germany. Traders are also eyeing the release of the UK’s preliminary S&P Global PMI data.
The Euro strengthens against its peers, supported by improved risk sentiment following recent comments from US President Donald Trump. Trump called for an immediate interest rate cut by the US Federal Reserve, citing falling Oil prices as a reason. “With oil prices going down, I’ll demand that interest rates drop immediately, and likewise, they should be dropping all over the world,” Trump stated during the World Economic Forum in Davos, Switzerland.
However, the Euro's upside may be capped as markets expect the European Central Bank (ECB) to implement a series of rate cuts, with a 25 basis point reduction anticipated at each of the next four policy meetings. These expectations are fueled by concerns over the Eurozone’s economic outlook and subdued inflationary pressures.
Meanwhile, the Pound Sterling (GBP) faces challenges after disappointing UK data, including weaker-than-expected December inflation and retail sales, declining labor demand through November, and sluggish GDP growth.
The softer economic reports from the United Kingdom (UK) have strengthened expectations of a 25 basis point rate cut by the Bank of England (BoE) in February, with markets now pricing in a near-certain reduction of the BoE’s policy rate to 4.5% at its next meeting. As a result, the upside potential for the British Pound may remain constrained in the near term.
Interest rates FAQs
Interest rates are charged by financial institutions on loans to borrowers and are paid as interest to savers and depositors. They are influenced by base lending rates, which are set by central banks in response to changes in the economy. Central banks normally have a mandate to ensure price stability, which in most cases means targeting a core inflation rate of around 2%. If inflation falls below target the central bank may cut base lending rates, with a view to stimulating lending and boosting the economy. If inflation rises substantially above 2% it normally results in the central bank raising base lending rates in an attempt to lower inflation.
Higher interest rates generally help strengthen a country’s currency as they make it a more attractive place for global investors to park their money.
Higher interest rates overall weigh on the price of Gold because they increase the opportunity cost of holding Gold instead of investing in an interest-bearing asset or placing cash in the bank. If interest rates are high that usually pushes up the price of the US Dollar (USD), and since Gold is priced in Dollars, this has the effect of lowering the price of Gold.
The Fed funds rate is the overnight rate at which US banks lend to each other. It is the oft-quoted headline rate set by the Federal Reserve at its FOMC meetings. It is set as a range, for example 4.75%-5.00%, though the upper limit (in that case 5.00%) is the quoted figure. Market expectations for future Fed funds rate are tracked by the CME FedWatch tool, which shapes how many financial markets behave in anticipation of future Federal Reserve monetary policy decisions.
USD/CAD depreciated as US President Donald Trump asked the Fed to reduce interest rates immediately.
The US Dollar struggles as US Treasury yields lose ground following Trump's comments.
The commodity-linked CAD receives upward support from the improvement in crude Oil prices.
USD/CAD extends its losses for the second consecutive day, trading around 1.4330 during the early European hours on Friday. This downside of the USD/CAD pair is attributed to the weaker US Dollar amid risk-on sentiment following recent remarks from US President Donald Trump late Thursday.
Trump said he wants the US Federal Reserve (Fed) to cut interest rates immediately. "With oil prices going down, I'll demand that interest rates drop immediately, and likewise they should be dropping all over the world," said Trump at the World Economic Forum in Davos, Switzerland.
The US Dollar Index (DXY), which measures the US Dollar's performance against six major currencies, continues to decline as US Treasury yields lose ground following Trump's comments. The DXY has fallen below 107.00, with the 2-year and 10-year US Treasury yields standing at 4.26% and 4.63%, respectively, at the time of writing.
Traders will likely monitor the release of the preliminary US S&P Global Purchasing Managers Index (PMI) and the Michigan Consumer Sentiment Index for January.
The commodity-linked Canadian Dollar (CAD) receives upward support from improved crude Oil prices. West Texas Intermediate (WTI) Oil price halts its six-day losing streak, trading around $74.50 per barrel at the time of writing.
However, crude Oil prices are headed for a weekly decline after US President Donald Trump issued a sweeping plan to boost US production and demanded OPEC (Organization of the Petroleum Exporting Countries) lower crude prices.
Canadian Dollar FAQs
The key factors driving the Canadian Dollar (CAD) are the level of interest rates set by the Bank of Canada (BoC), the price of Oil, Canada’s largest export, the health of its economy, inflation and the Trade Balance, which is the difference between the value of Canada’s exports versus its imports. Other factors include market sentiment – whether investors are taking on more risky assets (risk-on) or seeking safe-havens (risk-off) – with risk-on being CAD-positive. As its largest trading partner, the health of the US economy is also a key factor influencing the Canadian Dollar.
The Bank of Canada (BoC) has a significant influence on the Canadian Dollar by setting the level of interest rates that banks can lend to one another. This influences the level of interest rates for everyone. The main goal of the BoC is to maintain inflation at 1-3% by adjusting interest rates up or down. Relatively higher interest rates tend to be positive for the CAD. The Bank of Canada can also use quantitative easing and tightening to influence credit conditions, with the former CAD-negative and the latter CAD-positive.
The price of Oil is a key factor impacting the value of the Canadian Dollar. Petroleum is Canada’s biggest export, so Oil price tends to have an immediate impact on the CAD value. Generally, if Oil price rises CAD also goes up, as aggregate demand for the currency increases. The opposite is the case if the price of Oil falls. Higher Oil prices also tend to result in a greater likelihood of a positive Trade Balance, which is also supportive of the CAD.
While inflation had always traditionally been thought of as a negative factor for a currency since it lowers the value of money, the opposite has actually been the case in modern times with the relaxation of cross-border capital controls. Higher inflation tends to lead central banks to put up interest rates which attracts more capital inflows from global investors seeking a lucrative place to keep their money. This increases demand for the local currency, which in Canada’s case is the Canadian Dollar.
Macroeconomic data releases gauge the health of the economy and can have an impact on the Canadian Dollar. Indicators such as GDP, Manufacturing and Services PMIs, employment, and consumer sentiment surveys can all influence the direction of the CAD. A strong economy is good for the Canadian Dollar. Not only does it attract more foreign investment but it may encourage the Bank of Canada to put up interest rates, leading to a stronger currency. If economic data is weak, however, the CAD is likely to fall.
07:00
Sweden Producer Price Index (YoY) climbed from previous 0.3% to 2% in December
07:00
Sweden Producer Price Index (MoM) down to 0.1% in December from previous 3.1%
WTI price could further depreciate as President Trump issued a sweeping plan to boost US production.
Trump asked OPEC to bring down crude prices during his speech at the World Economic Forum in Davos.
EIA Crude Oil Stocks fell by 1.017 million barrels last week, against the anticipated 2.1 million barrel drop.
West Texas Intermediate (WTI) Oil price halts its six-day losing streak, trading around $74.40 per barrel during the Asian hours on Friday. Crude Oil prices are on track for a weekly decline after US President Donald Trump announced a comprehensive plan to increase US production and called on OPEC (the Organization of the Petroleum Exporting Countries) to lower crude Oil prices.
In a speech delivered Thursday at the World Economic Forum in Davos, Switzerland, President Trump urged OPEC and its leading member, Saudi Arabia, to reduce the cost of crude Oil, according to Reuters.
Oil prices receive upward support from recent remarks from US President Donald Trump late Thursday. Trump expressed his desire for the US Federal Reserve (Fed) to lower interest rates without delay. “With Oil prices falling, I’ll demand that interest rates be cut immediately, and they should be reduced worldwide,” he said during the World Economic Forum in Davos, Switzerland. Lower borrowing costs would likely improve economic conditions in the United States (US), hence, supporting the demand for crude Oil.
Additionally, Oil demand may have increased following President Trump's remarks expressing a preference to avoid tariffs on China, the world's largest Oil importer. Trump voiced optimism about a potential trade deal with China after speaking with President Xi Jinping on Thursday, signaling possible progress in US-China trade negotiations.
Meanwhile, the US Energy Information Administration (EIA) weekly report showed that crude oil stockpiles in the United States for the week ending January 17 fell by 1.017 million barrels. This marked a smaller decline compared to the previous drop of 1.962 million barrels and fell less than the market consensus, which had anticipated a 2.1 million barrel decrease.
WTI Oil FAQs
WTI Oil is a type of Crude Oil sold on international markets. The WTI stands for West Texas Intermediate, one of three major types including Brent and Dubai Crude. WTI is also referred to as “light” and “sweet” because of its relatively low gravity and sulfur content respectively. It is considered a high quality Oil that is easily refined. It is sourced in the United States and distributed via the Cushing hub, which is considered “The Pipeline Crossroads of the World”. It is a benchmark for the Oil market and WTI price is frequently quoted in the media.
Like all assets, supply and demand are the key drivers of WTI Oil price. As such, global growth can be a driver of increased demand and vice versa for weak global growth. Political instability, wars, and sanctions can disrupt supply and impact prices. The decisions of OPEC, a group of major Oil-producing countries, is another key driver of price. The value of the US Dollar influences the price of WTI Crude Oil, since Oil is predominantly traded in US Dollars, thus a weaker US Dollar can make Oil more affordable and vice versa.
The weekly Oil inventory reports published by the American Petroleum Institute (API) and the Energy Information Agency (EIA) impact the price of WTI Oil. Changes in inventories reflect fluctuating supply and demand. If the data shows a drop in inventories it can indicate increased demand, pushing up Oil price. Higher inventories can reflect increased supply, pushing down prices. API’s report is published every Tuesday and EIA’s the day after. Their results are usually similar, falling within 1% of each other 75% of the time. The EIA data is considered more reliable, since it is a government agency.
OPEC (Organization of the Petroleum Exporting Countries) is a group of 12 Oil-producing nations who collectively decide production quotas for member countries at twice-yearly meetings. Their decisions often impact WTI Oil prices. When OPEC decides to lower quotas, it can tighten supply, pushing up Oil prices. When OPEC increases production, it has the opposite effect. OPEC+ refers to an expanded group that includes ten extra non-OPEC members, the most notable of which is Russia.
USD/CHF remains under selling pressure around 0.9045 in Friday’s early European session, down 0.23% on the day.
Trump's rate cut calls undermine the USD against the CHF.
Easing Middle East geopolitical tensions might cap the upside for the Swiss Franc.
The USD/CHF pair remains on the defensive around 0.9045 during the early European session on Friday, pressured by the weaker US Dollar (USD) broadly. Traders will closely monitor the flash US S&P Purchasing Managers Index (PMI) for January, which is due later on Friday.
During a virtual address to the World Economic Forum in Davos, Switzerland, US President Donald Trump on Thursday called for a drop in interest rates after asking for a reduction of oil prices set by a group of nations known as OPEC, which includes Saudi Arabia. "With oil prices going down, I'll demand that interest rates drop immediately, and likewise they should be dropping all over the world," said Trump.
The Greenback remains weak following Trump’s remarks. Market players await more cues from the US economic data and further clarity on tariff announcements. The US Federal Reserve (Fed) is scheduled for its next decision on interest rates next week, which is widely expected to hold interest rates steady at the current level of between 4.25% and 4.5%, according to the CME FedWatch Tool.
Although Trump tariff threats would have only a limited impact on Swiss inflation, easing geopolitical tensions in the Middle East after Israel and Hamas agreed to a ceasefire deal might cap the upside for the Swiss Franc (CHF), a safe-haven currency. However, any signs of renewed geopolitical risks or rising global uncertainties could boost the CHF against the USD.
Swiss Franc FAQs
The Swiss Franc (CHF) is Switzerland’s official currency. It is among the top ten most traded currencies globally, reaching volumes that well exceed the size of the Swiss economy. Its value is determined by the broad market sentiment, the country’s economic health or action taken by the Swiss National Bank (SNB), among other factors. Between 2011 and 2015, the Swiss Franc was pegged to the Euro (EUR). The peg was abruptly removed, resulting in a more than 20% increase in the Franc’s value, causing a turmoil in markets. Even though the peg isn’t in force anymore, CHF fortunes tend to be highly correlated with the Euro ones due to the high dependency of the Swiss economy on the neighboring Eurozone.
The Swiss Franc (CHF) is considered a safe-haven asset, or a currency that investors tend to buy in times of market stress. This is due to the perceived status of Switzerland in the world: a stable economy, a strong export sector, big central bank reserves or a longstanding political stance towards neutrality in global conflicts make the country’s currency a good choice for investors fleeing from risks. Turbulent times are likely to strengthen CHF value against other currencies that are seen as more risky to invest in.
The Swiss National Bank (SNB) meets four times a year – once every quarter, less than other major central banks – to decide on monetary policy. The bank aims for an annual inflation rate of less than 2%. When inflation is above target or forecasted to be above target in the foreseeable future, the bank will attempt to tame price growth by raising its policy rate. Higher interest rates are generally positive for the Swiss Franc (CHF) as they lead to higher yields, making the country a more attractive place for investors. On the contrary, lower interest rates tend to weaken CHF.
Macroeconomic data releases in Switzerland are key to assessing the state of the economy and can impact the Swiss Franc’s (CHF) valuation. The Swiss economy is broadly stable, but any sudden change in economic growth, inflation, current account or the central bank’s currency reserves have the potential to trigger moves in CHF. Generally, high economic growth, low unemployment and high confidence are good for CHF. Conversely, if economic data points to weakening momentum, CHF is likely to depreciate.
As a small and open economy, Switzerland is heavily dependent on the health of the neighboring Eurozone economies. The broader European Union is Switzerland’s main economic partner and a key political ally, so macroeconomic and monetary policy stability in the Eurozone is essential for Switzerland and, thus, for the Swiss Franc (CHF). With such dependency, some models suggest that the correlation between the fortunes of the Euro (EUR) and the CHF is more than 90%, or close to perfect.
Here is what you need to know on Friday, January 24:
The Japanese Yen (JPY) gathers strength against its major rivals early Friday following the Bank of Japan's (BoJ) decision to raise the policy rate by 25 basis points. Later in the day preliminary January Manufacturing and Services PMI data for Germany, the Eurozone, the UK and the US will be watched closely by market participants.
Japanese Yen PRICE Today
The table below shows the percentage change of Japanese Yen (JPY) against listed major currencies today. Japanese Yen was the strongest against the US Dollar.
USD
EUR
GBP
JPY
CAD
AUD
NZD
CHF
USD
-0.46%
-0.48%
-0.77%
-0.34%
-0.68%
-0.75%
-0.32%
EUR
0.46%
-0.02%
-0.23%
0.13%
-0.21%
-0.28%
0.14%
GBP
0.48%
0.02%
-0.21%
0.14%
-0.19%
-0.27%
0.16%
JPY
0.77%
0.23%
0.21%
0.34%
-0.01%
-0.08%
0.35%
CAD
0.34%
-0.13%
-0.14%
-0.34%
-0.34%
-0.41%
0.02%
AUD
0.68%
0.21%
0.19%
0.00%
0.34%
-0.07%
0.32%
NZD
0.75%
0.28%
0.27%
0.08%
0.41%
0.07%
0.42%
CHF
0.32%
-0.14%
-0.16%
-0.35%
-0.02%
-0.32%
-0.42%
The heat map shows percentage changes of major currencies against each other. The base currency is picked from the left column, while the quote currency is picked from the top row. For example, if you pick the Japanese Yen from the left column and move along the horizontal line to the US Dollar, the percentage change displayed in the box will represent JPY (base)/USD (quote).
Following its first policy meeting of the year, the BoJ announced that it hiked the short-term rate target by 25 bps from 0.15%- 0.25% to 0.40%- 0.50%. In the policy statement, the BoJ noted Japan's economy is recovering moderately, albeit with some weakness, and added that the underlying inflation is gradually heightening toward the BoJ's target.
In the post-meeting press conference, BoJ Governor Kazuo Ueda noted that the impact of foreign exchange rates on prices has become larger than in the past. "We will keep adjusting the degree of easing if our economic, price outlook is to be realised," Ueda reiterated.
After closing in negative territory, USD/JPY stays under bearish pressure and trades near 155.00 in the early European session. Reflecting the broad-based JPY Strength, EUR/JPY and GBP/JPY pairs both trade marginally lower on the day.
While speaking during the World Economic Forum hosted in Davos, Switzerland, on Thursday, US President Donald Trump noted that EU tariffs were making it very difficult to bring products into Europe and reiterated that tariffs on imports from Canada and Mexico will begin on February 1. Early Friday, Trump spoke again, this time noting that he would rather not have to use tariffs on China but called tariffs a "tremendous power." The US Dollar (USD) struggles to find demand early Friday. At the time of press, the USD Index was down 0.4% on the day near 107.70.
EUR/USD gains traction in the European morning on Friday and trades above 1.0450. Later in the session, European Central Bank President Christine Lagarde will participate in Stakeholder Dialogue 'The global economic outlook' during the World Economic Forum.
After posting modest gains on Thursday, GBP/USD gathers bullish momentum early Friday and trades at a fresh two-week high above 1.2400.
Following Thursday's choppy action, Gold extends its weekly rally early Friday and trades above $2,770 for the first time since late October, when it set a record high of $2,790.
Central banks FAQs
Central Banks have a key mandate which is making sure that there is price stability in a country or region. Economies are constantly facing inflation or deflation when prices for certain goods and services are fluctuating. Constant rising prices for the same goods means inflation, constant lowered prices for the same goods means deflation. It is the task of the central bank to keep the demand in line by tweaking its policy rate. For the biggest central banks like the US Federal Reserve (Fed), the European Central Bank (ECB) or the Bank of England (BoE), the mandate is to keep inflation close to 2%.
A central bank has one important tool at its disposal to get inflation higher or lower, and that is by tweaking its benchmark policy rate, commonly known as interest rate. On pre-communicated moments, the central bank will issue a statement with its policy rate and provide additional reasoning on why it is either remaining or changing (cutting or hiking) it. Local banks will adjust their savings and lending rates accordingly, which in turn will make it either harder or easier for people to earn on their savings or for companies to take out loans and make investments in their businesses. When the central bank hikes interest rates substantially, this is called monetary tightening. When it is cutting its benchmark rate, it is called monetary easing.
A central bank is often politically independent. Members of the central bank policy board are passing through a series of panels and hearings before being appointed to a policy board seat. Each member in that board often has a certain conviction on how the central bank should control inflation and the subsequent monetary policy. Members that want a very loose monetary policy, with low rates and cheap lending, to boost the economy substantially while being content to see inflation slightly above 2%, are called ‘doves’. Members that rather want to see higher rates to reward savings and want to keep a lit on inflation at all time are called ‘hawks’ and will not rest until inflation is at or just below 2%.
Normally, there is a chairman or president who leads each meeting, needs to create a consensus between the hawks or doves and has his or her final say when it would come down to a vote split to avoid a 50-50 tie on whether the current policy should be adjusted. The chairman will deliver speeches which often can be followed live, where the current monetary stance and outlook is being communicated. A central bank will try to push forward its monetary policy without triggering violent swings in rates, equities, or its currency. All members of the central bank will channel their stance toward the markets in advance of a policy meeting event. A few days before a policy meeting takes place until the new policy has been communicated, members are forbidden to talk publicly. This is called the blackout period.
Bank of Japan (BoJ) Governor Kazuo Ueda speaks at the post-policy meeting press conference on Friday, explaining the reasons behind the decision to raise the interest rate to 0.50%.
Additional quotes
Japan's economy is recovering moderately, although some weak moves are seen.
Likelihood for realizing outlook is rising.
Global financial, capital markets have been stable on the whole.
Virtuous cycle to strengthen gradually.
Price trend is rising towards 2% inflation target.
Must pay due attention to financial, FX markets, impact on Japan's economy, prices.
FX impact on prices has become larger than in past, as firms are more eager to wage, price hikes.
Will keep adjusting degree of easing if our economic, price outlook is to be realized.
Will guide policy from standpoint of sustainably, stably achieving price target.
Board judged that spring wage talks will result in strong hikes again this year.
Growing number of firms expressed intentions to continue raising wages steadily in this spring's wage talks.
The US economy is in solid shape.
Easy monetary conditions will keep supporting economy as real rates remain significantly negative.
Timing and scope of raising rates further depend on economy, financial and price conditions.
No preset idea in mind on future adjustments.
Not seeing that severe behind the curve situation right now.
At this point US tariff policies are uncertain, cannot comment on impact.
Will provide view once details become clear.
Necessary to raise rates in accordance with economic temperature.
Appropriate response will be to gradually ascertain how underlying inflation rise in the future.
Need to think about impact of rate hike in context of rising inflation, wages.
On CPI 2025 forecast, says upward revision mostly towards middle of calendar year.
After that, we expect CPI rise to settle after mid-2025.
Will carefully monitor impact on markets, economy, policy etc from rate hike.
developing story ...
Market reaction
USD/JPY has come under renewed sellling pressure following these comments. The pair was last seen trading 0.63% lower on the day at 155.05.
Bank of Japan FAQs
The Bank of Japan (BoJ) is the Japanese central bank, which sets monetary policy in the country. Its mandate is to issue banknotes and carry out currency and monetary control to ensure price stability, which means an inflation target of around 2%.
The Bank of Japan embarked in an ultra-loose monetary policy in 2013 in order to stimulate the economy and fuel inflation amid a low-inflationary environment. The bank’s policy is based on Quantitative and Qualitative Easing (QQE), or printing notes to buy assets such as government or corporate bonds to provide liquidity. In 2016, the bank doubled down on its strategy and further loosened policy by first introducing negative interest rates and then directly controlling the yield of its 10-year government bonds. In March 2024, the BoJ lifted interest rates, effectively retreating from the ultra-loose monetary policy stance.
The Bank’s massive stimulus caused the Yen to depreciate against its main currency peers. This process exacerbated in 2022 and 2023 due to an increasing policy divergence between the Bank of Japan and other main central banks, which opted to increase interest rates sharply to fight decades-high levels of inflation. The BoJ’s policy led to a widening differential with other currencies, dragging down the value of the Yen. This trend partly reversed in 2024, when the BoJ decided to abandon its ultra-loose policy stance.
A weaker Yen and the spike in global energy prices led to an increase in Japanese inflation, which exceeded the BoJ’s 2% target. The prospect of rising salaries in the country – a key element fuelling inflation – also contributed to the move.
Silver price advanced as President Trump expressed his desire for the US Federal Reserve (Fed) to lower interest rates without delay.
Trump stated that he "would rather not have to use tariffs on China" and is hopeful about reaching a deal.
The demand for the precious Silver increases due to weaker US Dollar and Treasury yields.
Silver price (XAG/USD) recovers its recent losses, trading around $30.80 per troy ounce during the Asian trading session on Friday. The demand for non-interest-bearing Silver rises following comments made by US President Donald Trump late Thursday.
Trump expressed his desire for the US Federal Reserve (Fed) to lower interest rates without delay. “With Oil prices falling, I’ll demand that interest rates be cut immediately, and they should be reduced worldwide,” he said during the World Economic Forum in Davos, Switzerland.
Additionally, industrial demand for Silver may have strengthened following US President Donald Trump's comments about his preference to avoid tariffs on China, the world's largest consumer of metals and a manufacturing hub. Trump expressed optimism about reaching a deal with China after a conversation with President Xi Jinping on Thursday, suggesting potential progress in US-China trade negotiations.
Traders are likely to continue turning to safe-haven assets like Silver, remaining cautious amid uncertainty surrounding the impact of Trump’s proposed tariffs and immigration policies. On Tuesday, Trump also announced plans to impose a 25% tariff on imports from Canada and Mexico, along with duties on the European Union.
The US Dollar Index (DXY), which measures the US Dollar's performance against six major currencies, continues to decline as US Treasury yields depreciate amid improved risk sentiment. The DXY has fallen below 107.00, with the 2-year and 10-year US Treasury yields standing at 4.26% and 4.63%, respectively, at the time of writing. This shift could be contributing to the uptrend in non-yielding metals like Silver, which are seeing increased appeal.
Silver FAQs
Silver is a precious metal highly traded among investors. It has been historically used as a store of value and a medium of exchange. Although less popular than Gold, traders may turn to Silver to diversify their investment portfolio, for its intrinsic value or as a potential hedge during high-inflation periods. Investors can buy physical Silver, in coins or in bars, or trade it through vehicles such as Exchange Traded Funds, which track its price on international markets.
Silver prices can move due to a wide range of factors. Geopolitical instability or fears of a deep recession can make Silver price escalate due to its safe-haven status, although to a lesser extent than Gold's. As a yieldless asset, Silver tends to rise with lower interest rates. Its moves also depend on how the US Dollar (USD) behaves as the asset is priced in dollars (XAG/USD). A strong Dollar tends to keep the price of Silver at bay, whereas a weaker Dollar is likely to propel prices up. Other factors such as investment demand, mining supply – Silver is much more abundant than Gold – and recycling rates can also affect prices.
Silver is widely used in industry, particularly in sectors such as electronics or solar energy, as it has one of the highest electric conductivity of all metals – more than Copper and Gold. A surge in demand can increase prices, while a decline tends to lower them. Dynamics in the US, Chinese and Indian economies can also contribute to price swings: for the US and particularly China, their big industrial sectors use Silver in various processes; in India, consumers’ demand for the precious metal for jewellery also plays a key role in setting prices.
Silver prices tend to follow Gold's moves. When Gold prices rise, Silver typically follows suit, as their status as safe-haven assets is similar. The Gold/Silver ratio, which shows the number of ounces of Silver needed to equal the value of one ounce of Gold, may help to determine the relative valuation between both metals. Some investors may consider a high ratio as an indicator that Silver is undervalued, or Gold is overvalued. On the contrary, a low ratio might suggest that Gold is undervalued relative to Silver.
EUR/USD gains ground to around 1.0450 in Friday’s early European session, adding 0.30% on the day.
Trump said he will demand lower interest rates.
ECB is expected to cut the deposit rate on January 30.
The EUR/USD pair attracts some buyers to 1.0450 during the early Asian session on Friday, bolstered by the weakening of the US Dollar (USD). The preliminary reading of the HCOB Purchasing Managers Index (PMI) for January from the Eurozone and Germany will be released later on Friday. On the US docket, flash S&P PMI for January will take center stage.
US President Donald Trump’s remarks at the World Economic Forum in Davos drag the USD lower against a basket of major currencies. Trump said late Thursday that he wants to see interest rates drop immediately, and likewise, they should be dropping all over the world.
"It seems like the markets are more concerned about rate cuts and any kind of greater indicator that there'll be more rate cuts,” said David Eng, Investment Adviser at Sonora Wealth Group in Vancouver.
Across the pond, recent comments from the European Central Bank (ECB) policymakers indicated that a rate cut was likely. ECB Croatian central bank chief Boris Vujcic said earlier this week that market expectations for ECB interest rate cuts are reasonable and risks around the inflation outlook are broadly balanced.
Meanwhile, ECB President Christine Lagarde emphasized on Wednesday that the central bank is “not overly concerned” about the risk of inflation from abroad and will continue to reduce interest rates at a gradual pace. Markets have priced in nearly 96% odds the ECB will reduce the rates at the upcoming meeting.
Euro FAQs
The Euro is the currency for the 19 European Union countries that belong to the Eurozone. It is the second most heavily traded currency in the world behind the US Dollar. In 2022, it accounted for 31% of all foreign exchange transactions, with an average daily turnover of over $2.2 trillion a day. EUR/USD is the most heavily traded currency pair in the world, accounting for an estimated 30% off all transactions, followed by EUR/JPY (4%), EUR/GBP (3%) and EUR/AUD (2%).
The European Central Bank (ECB) in Frankfurt, Germany, is the reserve bank for the Eurozone. The ECB sets interest rates and manages monetary policy. The ECB’s primary mandate is to maintain price stability, which means either controlling inflation or stimulating growth. Its primary tool is the raising or lowering of interest rates. Relatively high interest rates – or the expectation of higher rates – will usually benefit the Euro and vice versa. The ECB Governing Council makes monetary policy decisions at meetings held eight times a year. Decisions are made by heads of the Eurozone national banks and six permanent members, including the President of the ECB, Christine Lagarde.
Eurozone inflation data, measured by the Harmonized Index of Consumer Prices (HICP), is an important econometric for the Euro. If inflation rises more than expected, especially if above the ECB’s 2% target, it obliges the ECB to raise interest rates to bring it back under control. Relatively high interest rates compared to its counterparts will usually benefit the Euro, as it makes the region more attractive as a place for global investors to park their money.
Data releases gauge the health of the economy and can impact on the Euro. Indicators such as GDP, Manufacturing and Services PMIs, employment, and consumer sentiment surveys can all influence the direction of the single currency. A strong economy is good for the Euro. Not only does it attract more foreign investment but it may encourage the ECB to put up interest rates, which will directly strengthen the Euro. Otherwise, if economic data is weak, the Euro is likely to fall. Economic data for the four largest economies in the euro area (Germany, France, Italy and Spain) are especially significant, as they account for 75% of the Eurozone’s economy.
Another significant data release for the Euro is the Trade Balance. This indicator measures the difference between what a country earns from its exports and what it spends on imports over a given period. If a country produces highly sought after exports then its currency will gain in value purely from the extra demand created from foreign buyers seeking to purchase these goods. Therefore, a positive net Trade Balance strengthens a currency and vice versa for a negative balance.
USD/CNH drops to the monthly low at 7.2475 on Friday.
Trump stated that he "would rather not have to use tariffs on China" and is hopeful about reaching a deal.
PBOC maintained the interest rate at 2.00% and injected 200 billion Yuan through a one-year MLF to financial institutions.
USD/CNH, representing the US Dollar (USD) against the offshore Chinese Yuan (CNH), breaks its three-day losing streak, trading around 7.2510 during the Asian session on Friday. The CNH gains ground as US President Donald Trump stated that he "would rather not have to use tariffs on China" and is hopeful about reaching a deal. Trump's remarks came after his conversation with China’s President Xi Jinping on Thursday, hinting at potential progress in US-China trade negotiations.
Additionally, risk sentiment improved following late Thursday’s remarks from Trump at the World Economic Forum in Davos, Switzerland. Trump said he wants the US Federal Reserve (Fed) to cut interest rates immediately. "With oil prices going down, I'll demand that interest rates drop immediately, and likewise they should be dropping all over the world," Trump said.
China's Commerce Ministry stated on Thursday that they are "willing to work with the US to promote stable and healthy economic and trade relations." The Ministry added that "tariff measures are detrimental to China, the US, and the global economy." These remarks came in response to US President Donald Trump's threat of a 10% tariff on Chinese imports.
On Friday, the People’s Bank of China (PBOC) maintained the interest rate at 2.00% and injected 200 billion Yuan ($27.46 billion) through a one-year medium-term lending facility (MLF) to selected financial institutions, according to Reuters.
Additionally, Chinese authorities on Thursday introduced several measures to stabilize its stock markets, including allowing pension funds to increase investments in domestic equities. A pilot scheme enabling insurers to purchase equities will be launched in the first half of 2025, with an initial scale of at least 100 billion Yuan.
PBOC FAQs
The primary monetary policy objectives of the People's Bank of China (PBoC) are to safeguard price stability, including exchange rate stability, and promote economic growth. China’s central bank also aims to implement financial reforms, such as opening and developing the financial market.
The PBoC is owned by the state of the People's Republic of China (PRC), so it is not considered an autonomous institution. The Chinese Communist Party (CCP) Committee Secretary, nominated by the Chairman of the State Council, has a key influence on the PBoC’s management and direction, not the governor. However, Mr. Pan Gongsheng currently holds both of these posts.
Unlike the Western economies, the PBoC uses a broader set of monetary policy instruments to achieve its objectives. The primary tools include a seven-day Reverse Repo Rate (RRR), Medium-term Lending Facility (MLF), foreign exchange interventions and Reserve Requirement Ratio (RRR). However, The Loan Prime Rate (LPR) is China’s benchmark interest rate. Changes to the LPR directly influence the rates that need to be paid in the market for loans and mortgages and the interest paid on savings. By changing the LPR, China’s central bank can also influence the exchange rates of the Chinese Renminbi.
Yes, China has 19 private banks – a small fraction of the financial system. The largest private banks are digital lenders WeBank and MYbank, which are backed by tech giants Tencent and Ant Group, per The Straits Times. In 2014, China allowed domestic lenders fully capitalized by private funds to operate in the state-dominated financial sector.
USD attracts sellers for the second straight day amid bets for additional rate cuts by the Fed.
Trump says he would rather not impose tariffs on China, triggering a fall in the US bond yields.
The hawkish BoJ-inspired rally in the JPY contributes to the offered tone surrounding the buck.
The US Dollar Index (DXY), which tracks the Greenback against a basket of currencies, drifts lower for the second straight day and drops to a fresh monthly low during the Asian session on Friday. The index is currently placed around the 107.80 region, down nearly 0.35% for the day, and remains on track to register losses for the second consecutive week.
The markets have been pricing in the possibility that the Federal Reserve (Fed) will lower borrowing costs twice this year in the wake of signs of inflationary pressures in the US. Adding to this, US President Donald Trump, speaking remotely at the World Economic Forum in Davos, said on Thursday that he will apply pressure to bring down interest rates. This, in turn, is seen as a key factor undermining the USD.
Meanwhile, Trump said earlier this Friday that his conversation with Chinese President Xi Jinping was friendly and that he could reach a trade deal with China and would rather not use tariffs. This eases worries that Trump's protectionist policies could boost inflation and supports prospects for further policy easing by the Fed, triggering a modest downtick in the US Treasury bond yields and weighing on the buck.
Furthermore, the Bank of Japan's (BoJ) hawkish rate hike provides a strong boost to the Japanese Yen (JPY) and exerts additional pressure on the buck. Apart from this, a generally positive tone around the equity markets further dents the Greenback's relative safe-haven status and contributes to the intraday slide. Traders now look forward to the release of the flash US PMIs for a fresh impetus later during the US session.
US Dollar PRICE Today
The table below shows the percentage change of US Dollar (USD) against listed major currencies today. US Dollar was the strongest against the Swiss Franc.
USD
EUR
GBP
JPY
CAD
AUD
NZD
CHF
USD
-0.32%
-0.32%
-0.51%
-0.26%
-0.50%
-0.54%
-0.19%
EUR
0.32%
-0.01%
-0.19%
0.06%
-0.18%
-0.22%
0.12%
GBP
0.32%
0.00%
-0.17%
0.07%
-0.18%
-0.22%
0.13%
JPY
0.51%
0.19%
0.17%
0.24%
-0.01%
-0.06%
0.30%
CAD
0.26%
-0.06%
-0.07%
-0.24%
-0.25%
-0.28%
0.07%
AUD
0.50%
0.18%
0.18%
0.01%
0.25%
-0.04%
0.27%
NZD
0.54%
0.22%
0.22%
0.06%
0.28%
0.04%
0.34%
CHF
0.19%
-0.12%
-0.13%
-0.30%
-0.07%
-0.27%
-0.34%
The heat map shows percentage changes of major currencies against each other. The base currency is picked from the left column, while the quote currency is picked from the top row. For example, if you pick the US Dollar from the left column and move along the horizontal line to the Japanese Yen, the percentage change displayed in the box will represent USD (base)/JPY (quote).
05:01
India HSBC Manufacturing PMI climbed from previous 56.4 to 58 in January
05:00
India HSBC Composite PMI: 57.9 (January) vs previous 59.2
05:00
Singapore Industrial Production (MoM) registered at -0.7% above expectations (-1.2%) in December
05:00
Singapore Industrial Production (YoY) above expectations (6.4%) in December: Actual (10.6%)
05:00
India HSBC Services PMI down to 56.8 in January from previous 59.3
GBP/JPY tests immediate support at the lower boundary of the ascending channel around the 192.30 level.
The 14-day RSI remains just below the 50 mark, suggesting that bearish momentum is still in play.
The currency cross faces primary resistance at the 9-day EMA at 192.36, followed by the 14-day EMA at 192.79.
The GBP/JPY cross remains subdued for the second successive session, trading around 192.30 during the Asian hours on Friday. An analysis of the daily chart suggests the formation of an ascending channel pattern, indicating a potential bullish bias.
The 14-day Relative Strength Index (RSI), a key momentum indicator, remains just below the 50 level, signaling that bearish momentum is still in play. A move above the 50 mark would confirm the shift toward a bullish bias. Additionally, the GBP/JPY cross trades below the 9- and 14-day Exponential Moving Averages (EMAs), suggesting weaker short-term price momentum.
On the downside, the GBP/JPY cross tests immediate support at the lower boundary of the ascending channel around the 192.30 level. A break below this support could strengthen the bearish bias, putting downward pressure on the currency cross and potentially driving it toward the seven-week low at 189.34, recorded on January 17.
The GBP/JPY cross faces primary resistance at the 9-day EMA at 192.36, followed by the 14-day EMA at 192.79. A move above the latter could boost short-term price momentum, supporting the currency cross to test the upper boundary of the ascending channel at the 194.00 level.
GBP/JPY: Daily Chart
British Pound PRICE Today
The table below shows the percentage change of British Pound (GBP) against listed major currencies today. British Pound was the weakest against the Japanese Yen.
USD
EUR
GBP
JPY
CAD
AUD
NZD
CHF
USD
-0.32%
-0.35%
-0.56%
-0.27%
-0.53%
-0.54%
-0.22%
EUR
0.32%
-0.03%
-0.24%
0.05%
-0.22%
-0.22%
0.10%
GBP
0.35%
0.03%
-0.21%
0.08%
-0.19%
-0.19%
0.13%
JPY
0.56%
0.24%
0.21%
0.28%
0.00%
-0.01%
0.32%
CAD
0.27%
-0.05%
-0.08%
-0.28%
-0.27%
-0.27%
0.06%
AUD
0.53%
0.22%
0.19%
-0.00%
0.27%
-0.00%
0.30%
NZD
0.54%
0.22%
0.19%
0.00%
0.27%
0.00%
0.31%
CHF
0.22%
-0.10%
-0.13%
-0.32%
-0.06%
-0.30%
-0.31%
The heat map shows percentage changes of major currencies against each other. The base currency is picked from the left column, while the quote currency is picked from the top row. For example, if you pick the British Pound from the left column and move along the horizontal line to the US Dollar, the percentage change displayed in the box will represent GBP (base)/USD (quote).
Gold prices rose in India on Friday, according to data compiled by FXStreet.
The price for Gold stood at 7,690.87 Indian Rupees (INR) per gram, up compared with the INR 7,640.13 it cost on Thursday.
The price for Gold increased to INR 89,704.84 per tola from INR 89,108.82 per tola a day earlier.
Unit measure
Gold Price in INR
1 Gram
7,690.87
10 Grams
76,909.30
Tola
89,704.84
Troy Ounce
239,224.20
FXStreet calculates Gold prices in India by adapting international prices (USD/INR) to the local currency and measurement units. Prices are updated daily based on the market rates taken at the time of publication. Prices are just for reference and local rates could diverge slightly.
Gold has played a key role in human’s history as it has been widely used as a store of value and medium of exchange. Currently, apart from its shine and usage for jewelry, the precious metal is widely seen as a safe-haven asset, meaning that it is considered a good investment during turbulent times. Gold is also widely seen as a hedge against inflation and against depreciating currencies as it doesn’t rely on any specific issuer or government.
Central banks are the biggest Gold holders. In their aim to support their currencies in turbulent times, central banks tend to diversify their reserves and buy Gold to improve the perceived strength of the economy and the currency. High Gold reserves can be a source of trust for a country’s solvency. Central banks added 1,136 tonnes of Gold worth around $70 billion to their reserves in 2022, according to data from the World Gold Council. This is the highest yearly purchase since records began. Central banks from emerging economies such as China, India and Turkey are quickly increasing their Gold reserves.
Gold has an inverse correlation with the US Dollar and US Treasuries, which are both major reserve and safe-haven assets. When the Dollar depreciates, Gold tends to rise, enabling investors and central banks to diversify their assets in turbulent times. Gold is also inversely correlated with risk assets. A rally in the stock market tends to weaken Gold price, while sell-offs in riskier markets tend to favor the precious metal.
The price can move due to a wide range of factors. Geopolitical instability or fears of a deep recession can quickly make Gold price escalate due to its safe-haven status. As a yield-less asset, Gold tends to rise with lower interest rates, while higher cost of money usually weighs down on the yellow metal. Still, most moves depend on how the US Dollar (USD) behaves as the asset is priced in dollars (XAU/USD). A strong Dollar tends to keep the price of Gold controlled, whereas a weaker Dollar is likely to push Gold prices up.
(An automation tool was used in creating this post.)
Gold price catches fresh bids on Friday and resumes over a one-month-old uptrend.
Worries about a fresh wave of global trade wars underpin the safe-haven commodity.
Bets for more Fed rate cuts weigh on the USD and further benefit the XAU/USD pair.
Gold price (XAU/USD) regains positive traction following the previous day's brief pause and climbs to the $2,777 area, the highest level since October 31 during the Asian session on Friday. Investors remain concerned that US President Donald Trump's trade policies could trigger trade wars and elevate market volatility, which continues to drive haven flows towards the precious metal. Moreover, the prospects for additional interest rate cuts by the Federal Reserve (Fed) drag the US Dollar (USD) closer to the monthly low and turn out to be another factor that benefits the non-yielding yellow metal.
Meanwhile, US President Donald Trump's comments that he would rather not have to use tariffs on China provide an additional boost to the global risk sentiment, though it does little to dent the bullish sentiment surrounding the Gold price. That said, slightly overbought conditions on short-term charts might hold back bulls from placing fresh bets around the XAU/USD and positioning for any further appreciating move. Nevertheless, the commodity remains on track to register strong weekly gains and has now moved well within striking distance of the all-time peak, around the $2,790 area touched in October.
Gold price bulls retain control on Trump uncertainty and weak US Dollar
Investors remain concerned about the potential economic fallout from US President Donald Trump's tariffs, which continues to push the safe-haven Gold price higher on Friday.
The US Dollar slides back closer to the monthly trough in reaction to Trump's remarks on Thursday that he will apply pressure on the Federal Reserve to bring down interest rates.
The markets started pricing in the possibility that the US central bank will lower borrowing costs twice by the end of this year amid signs of abating inflationary pressures in the US.
Trump said on Friday that his conversation with Chinese President Xi Jinping was friendly and that he could reach a trade deal with China and would rather not use tariffs.
This eases worries that Trump's protectionist policies could boost inflation and supports prospects for further policy easing by the Fed, benefiting the non-yielding yellow metal.
Traders now look forward to the flash PMIs for fresh insight into the global economic health, which might influence the broader risk sentiment and drive the XAU/USD.
Gold price could pause near all-time peak, around the $2,790 region
From a technical perspective, the emergence of some dip-buying on Thursday and the subsequent move up validate a bullish breakout through the $2,720-2,725 supply zone. That said, the Relative Strength Index (RSI) on the daily chart has moved on the verge of breaking into overbought territory, making it prudent to wait for some near-term consolidation or a modest pullback before positioning for further gains. Hence, some follow-through momentum is more likely to confront a stiff hurdle near the all-time peak, around the $2,790 region.
On the flip side, immediate support is pegged near the $2,760-2,758 area, below which the Gold price could slide to retest the overnight swing low, around the $2,736-2,735 region. Any further slide could be seen as a buying opportunity and remain limited near the $2,725-2,720 resistance-turned-support. The latter should act as a key pivotal point, which if broken decisively might shift the bias in favor of bearish trades and pave the way for deeper losses.
Gold FAQs
Gold has played a key role in human’s history as it has been widely used as a store of value and medium of exchange. Currently, apart from its shine and usage for jewelry, the precious metal is widely seen as a safe-haven asset, meaning that it is considered a good investment during turbulent times. Gold is also widely seen as a hedge against inflation and against depreciating currencies as it doesn’t rely on any specific issuer or government.
Central banks are the biggest Gold holders. In their aim to support their currencies in turbulent times, central banks tend to diversify their reserves and buy Gold to improve the perceived strength of the economy and the currency. High Gold reserves can be a source of trust for a country’s solvency. Central banks added 1,136 tonnes of Gold worth around $70 billion to their reserves in 2022, according to data from the World Gold Council. This is the highest yearly purchase since records began. Central banks from emerging economies such as China, India and Turkey are quickly increasing their Gold reserves.
Gold has an inverse correlation with the US Dollar and US Treasuries, which are both major reserve and safe-haven assets. When the Dollar depreciates, Gold tends to rise, enabling investors and central banks to diversify their assets in turbulent times. Gold is also inversely correlated with risk assets. A rally in the stock market tends to weaken Gold price, while sell-offs in riskier markets tend to favor the precious metal.
The price can move due to a wide range of factors. Geopolitical instability or fears of a deep recession can quickly make Gold price escalate due to its safe-haven status. As a yield-less asset, Gold tends to rise with lower interest rates, while higher cost of money usually weighs down on the yellow metal. Still, most moves depend on how the US Dollar (USD) behaves as the asset is priced in dollars (XAU/USD). A strong Dollar tends to keep the price of Gold controlled, whereas a weaker Dollar is likely to push Gold prices up.
AUD/JPY trades in positive territory around 98.20 in Friday’s Asian session, up 0.22% on the day.
BoJ hiked the interest rate to 0.50% in the January meeting, as expected.
Trump said he would rather not use tariffs against China.
The AUD/JPY cross remains firm near 98.20 during the Asian trading hours on Friday. However, the upside of the cross might be limited amid the stronger Japanese Yen (JPY) after the Bank of Japan's (BoJ) interest rate decision.
As widely expected, the BoJ decided to hike the short-term rate target by 25 basis points (bps) from 0.15%- 0.25% to 0.40%- 0.50% at its January meeting on Friday. The Japanese central bank raised the interest rate to its highest level since 2008 after having held steady for three straight meetings. The JPY pares losses in an immediate reaction to the BoJ rate decision.
Data released by the Japan Statistics Bureau on Friday showed that the country’s National Consumer Price Index (CPI) climbed 3.6% YoY in December, compared to 2.9% in the previous reading.
Furthermore, the National CPI ex Fresh food came in at 3.0% YoY in December versus 2.7% prior, in line with the market consensus of 3.0%. Finally, CPI ex Fresh Food, Energy rose 2.4% YoY in December, compared to the previous reading of 2.4% (revised from 2.7%).
On the other hand, US President Donald Trump said Friday that he would rather not use tariffs against China but called tariffs a "tremendous power." This positive development could provide some support to the China-proxy Aussie, as China is a major trading partner to Australia.
Bank of Japan FAQs
The Bank of Japan (BoJ) is the Japanese central bank, which sets monetary policy in the country. Its mandate is to issue banknotes and carry out currency and monetary control to ensure price stability, which means an inflation target of around 2%.
The Bank of Japan embarked in an ultra-loose monetary policy in 2013 in order to stimulate the economy and fuel inflation amid a low-inflationary environment. The bank’s policy is based on Quantitative and Qualitative Easing (QQE), or printing notes to buy assets such as government or corporate bonds to provide liquidity. In 2016, the bank doubled down on its strategy and further loosened policy by first introducing negative interest rates and then directly controlling the yield of its 10-year government bonds. In March 2024, the BoJ lifted interest rates, effectively retreating from the ultra-loose monetary policy stance.
The Bank’s massive stimulus caused the Yen to depreciate against its main currency peers. This process exacerbated in 2022 and 2023 due to an increasing policy divergence between the Bank of Japan and other main central banks, which opted to increase interest rates sharply to fight decades-high levels of inflation. The BoJ’s policy led to a widening differential with other currencies, dragging down the value of the Yen. This trend partly reversed in 2024, when the BoJ decided to abandon its ultra-loose policy stance.
A weaker Yen and the spike in global energy prices led to an increase in Japanese inflation, which exceeded the BoJ’s 2% target. The prospect of rising salaries in the country – a key element fuelling inflation – also contributed to the move.
EUR/JPY maintains its position despite a rate hike by the Bank of Japan on Friday.
The BoJ raised its short-term rate target by 25 basis points to 0.40%-0.50%, marking the highest rate level since 2008.
The Euro strengthens as risk sentiment improves following recent remarks from US President Donald Trump.
EUR/JPY recovers recent losses, hovering around 163.00 during Friday's Asian session. The EUR/JPY cross remains resilient despite the Bank of Japan (BoJ) raising its short-term rate target by 25 basis points (bps) from 0.15%-0.25% to 0.40%-0.50% following its two-day monetary policy review. This move, in line with market expectations, marks the highest rate level since 2008 after three consecutive meetings of holding steady.
Data from the Japan Statistics Bureau released on Friday showed that the National Consumer Price Index (CPI) rose 3.6% year-over-year (YoY) in December, up from 2.9% in the previous month. Core consumer prices increased as expected, climbing from 2.7% to 3.0% – the highest level since mid-2023. Additionally, the core measure excluding fresh food and energy prices held steady, rising 2.4% YoY in December, supported by robust private consumption.
The Euro appreciates against its peers amid improved risk sentiment following recent remarks from US President Donald Trump. Trump said he wants the US Federal Reserve (Fed) to cut interest rates immediately at the World Economic Forum in Davos, Switzerland.
Moreover, Trump expressed optimism, stating that he "would rather not have to use tariffs on China" and is hopeful about reaching a deal. Trump's remarks came after his conversation with China’s President Xi Jinping on Thursday, hinting at potential progress in US-China trade negotiations.
However, the Euro’s upside could be restrained as markets anticipate a 25 basis point (bps) rate cut at each of the next four ECB policy meetings, driven by concerns over the Eurozone’s economic outlook and the belief that inflationary pressures will remain subdued.
Economic Indicator
BoJ Interest Rate Decision
The Bank of Japan (BoJ) announces its interest rate decision after each of the Bank’s eight scheduled annual meetings. Generally, if the BoJ is hawkish about the inflationary outlook of the economy and raises interest rates it is bullish for the Japanese Yen (JPY). Likewise, if the BoJ has a dovish view on the Japanese economy and keeps interest rates unchanged, or cuts them, it is usually bearish for JPY.
GBP/USD appreciated as US President Donald Trump asked the Fed to cut interest rates immediately.
Traders expect the Fed to keep its benchmark overnight rate steady in the 4.25%-4.50% range in January.
The BoE is anticipated to deliver a 25 basis point rate cut in February.
GBP/USD extends its gains for the second successive day, trading around 1.2400 during the Asian hours on Friday. The pair’s upside could be attributed to the remarks from US President Donald Trump on late Thursday.
President Trump said he wants the US Federal Reserve (Fed) to cut interest rates immediately. "With oil prices going down, I'll demand that interest rates drop immediately, and likewise they should be dropping all over the world," said Trump at the World Economic Forum in Davos, Switzerland.
Traders expect the Federal Reserve (Fed) to keep its benchmark overnight rate steady in the 4.25%-4.50% range at its January meeting. Moreover, Trump’s policies could drive inflationary pressures, potentially limiting the Fed to just one more rate cut.
However, the upside of the GBP/USD pair could be limited as the Pound Sterling (GBP) could face headwinds following recent data including softer-than-expected UK inflation and retail sales data for December, weakening labor demand over the three months to November, and tepid GDP growth.
These factors have led traders to anticipate a 25 basis point (bps) rate cut by the Bank of England (BoE) in February. Markets are now pricing in a near-certain reduction in the BoE’s policy rate to 4.5% at its upcoming meeting.
Traders are expected to closely watch the release of preliminary S&P Global Purchasing Managers Index (PMI) for both the United Kingdom and the United States for January. Additionally, the US Michigan Consumer Sentiment Index will be in focus. These indicators are likely to offer important insights into short-term economic trends.
British Pound PRICE Today
The table below shows the percentage change of British Pound (GBP) against listed major currencies today. British Pound was the strongest against the US Dollar.
USD
EUR
GBP
JPY
CAD
AUD
NZD
CHF
USD
-0.30%
-0.35%
-0.05%
-0.33%
-0.50%
-0.55%
-0.20%
EUR
0.30%
-0.06%
0.26%
-0.03%
-0.20%
-0.25%
0.11%
GBP
0.35%
0.06%
0.33%
0.03%
-0.15%
-0.19%
0.16%
JPY
0.05%
-0.26%
-0.33%
-0.30%
-0.48%
-0.54%
-0.17%
CAD
0.33%
0.03%
-0.03%
0.30%
-0.17%
-0.22%
0.13%
AUD
0.50%
0.20%
0.15%
0.48%
0.17%
-0.04%
0.28%
NZD
0.55%
0.25%
0.19%
0.54%
0.22%
0.04%
0.35%
CHF
0.20%
-0.11%
-0.16%
0.17%
-0.13%
-0.28%
-0.35%
The heat map shows percentage changes of major currencies against each other. The base currency is picked from the left column, while the quote currency is picked from the top row. For example, if you pick the British Pound from the left column and move along the horizontal line to the US Dollar, the percentage change displayed in the box will represent GBP (base)/USD (quote).
The Australian Dollar extends its gains following the PBOC's conducting a medium-term loan operation.
Australia's Judo Bank Composite PMI increased to 50.3 in January, slightly higher than December's reading of 50.2, signaling modest private sector expansion.
President Trump called for the US Federal Reserve to implement an immediate interest rate cut.
The Australian Dollar (AUD) continues its upward momentum against the US Dollar (USD) for the third consecutive session on Friday. The AUD/USD pair strengthens as US President Donald Trump expressed optimism, stating that he "would rather not have to use tariffs on China" and is hopeful about reaching a deal. Trump's remarks came after his conversation with China’s President Xi Jinping on Thursday, hinting at potential progress in US-China trade negotiations.
Traders will likely monitor the release of the preliminary US S&P Global Purchasing Managers Index (PMI) and the Michigan Consumer Sentiment Index for January.
The People’s Bank of China (PBOC) maintained the interest rate at 2.00% and injected 200 billion Yuan ($27.46 billion) through a one-year medium-term lending facility (MLF) to select financial institutions, according to Reuters.
Australia’s Judo Bank’s Composite Purchasing Managers Index (PMI) edged higher to 50.3 in January, up from 50.2 in December. This marked the fourth consecutive month of modest private sector expansion, driven by growth in the services sector while manufacturing output stabilized.
The Judo Bank Manufacturing PMI climbed to 49.8 in January from 47.8 in December, the highest reading in 12 months, breaking a streak of 13 consecutive months of contraction. However, the Services PMI dipped to 50.4 from 50.8, hitting a six-month low and indicating a slowdown in the sector's growth.
On Thursday, Chinese authorities introduced several measures to stabilize its stock markets, including allowing pension funds to increase investments in domestic equities. A pilot scheme enabling insurers to purchase equities will be launched in the first half of 2025, with an initial scale of at least 100 billion Yuan. Meanwhile, the People’s Bank of China (PBoC) said that they “will expand the scope and increase the scale of liquidity tools to fund share purchases at the proper time.”
Australian Dollar could appreciate as Trump asks Fed to cut interest rates
The US Dollar Index (DXY), which tracks the performance of the US Dollar against six major currencies, maintains its position above 108.00 at the time of writing.
Late Thursday, Trump said he wants the US Federal Reserve (Fed) to cut interest rates immediately. "With oil prices going down, I'll demand that interest rates drop immediately, and likewise they should be dropping all over the world," said Trump at the World Economic Forum in Davos, Switzerland.
The US Dollar could face challenges as Trump's remarks came before the Federal Reserve's (Fed) monetary policy meeting scheduled for January 28 and 29, with expectations the US central bank will hold rates steady.
Traders expect the Fed to keep its benchmark overnight rate steady in the 4.25%-4.50% range at its January meeting. Moreover, Trump’s policies could drive inflationary pressures, potentially limiting the Fed to just one more rate cut.
President Trump announced plans to implement a 10% tariff on Chinese imports starting February 1, citing concerns over fentanyl shipments from China to Mexico and Canada, according to Reuters. Given the strong trade ties between China and Australia, Australian markets are sensitive to changes in China's economic landscape.
In response, Chinese Vice Premier Ding Xuexiang warned on Tuesday about the potential trade war fallout, stating that "there are no winners" in such conflicts. His remarks come as China braces for possible tariffs under the Trump administration, as reported by CNBC.
Technical Analysis: Australian Dollar remains below 0.6300 within ascending channel
The AUD/USD pair trades near 0.6280 on Friday, with a daily chart analysis indicating movement within an ascending channel pattern, suggesting a potential bullish bias. Additionally, the 14-day Relative Strength Index (RSI) remains above 50, reinforcing positive market sentiment.
On the upside, the AUD/USD pair could test the psychological resistance level at 0.6300, with the next target near the upper boundary of the ascending channel around 0.6330.
The initial support appears at the nine-day Exponential Moving Average (EMA) at 0.6252, followed by the 14-day EMA at 0.6244. Stronger support is seen at the ascending channel's lower boundary around 0.6230, with further support at the psychological level of 0.6200.
AUD/USD: Daily Chart
Australian Dollar PRICE Today
The table below shows the percentage change of Australian Dollar (AUD) against listed major currencies today. Australian Dollar was the weakest against the New Zealand Dollar.
USD
EUR
GBP
JPY
CAD
AUD
NZD
CHF
USD
-0.21%
-0.25%
0.16%
-0.22%
-0.34%
-0.40%
-0.15%
EUR
0.21%
-0.05%
0.34%
-0.01%
-0.13%
-0.19%
0.05%
GBP
0.25%
0.05%
0.41%
0.04%
-0.08%
-0.14%
0.10%
JPY
-0.16%
-0.34%
-0.41%
-0.37%
-0.50%
-0.56%
-0.31%
CAD
0.22%
0.01%
-0.04%
0.37%
-0.12%
-0.18%
0.07%
AUD
0.34%
0.13%
0.08%
0.50%
0.12%
-0.05%
0.16%
NZD
0.40%
0.19%
0.14%
0.56%
0.18%
0.05%
0.23%
CHF
0.15%
-0.05%
-0.10%
0.31%
-0.07%
-0.16%
-0.23%
The heat map shows percentage changes of major currencies against each other. The base currency is picked from the left column, while the quote currency is picked from the top row. For example, if you pick the Australian Dollar from the left column and move along the horizontal line to the US Dollar, the percentage change displayed in the box will represent AUD (base)/USD (quote).
Australian Dollar FAQs
One of the most significant factors for the Australian Dollar (AUD) is the level of interest rates set by the Reserve Bank of Australia (RBA). Because Australia is a resource-rich country another key driver is the price of its biggest export, Iron Ore. The health of the Chinese economy, its largest trading partner, is a factor, as well as inflation in Australia, its growth rate and Trade Balance. Market sentiment – whether investors are taking on more risky assets (risk-on) or seeking safe-havens (risk-off) – is also a factor, with risk-on positive for AUD.
The Reserve Bank of Australia (RBA) influences the Australian Dollar (AUD) by setting the level of interest rates that Australian banks can lend to each other. This influences the level of interest rates in the economy as a whole. The main goal of the RBA is to maintain a stable inflation rate of 2-3% by adjusting interest rates up or down. Relatively high interest rates compared to other major central banks support the AUD, and the opposite for relatively low. The RBA can also use quantitative easing and tightening to influence credit conditions, with the former AUD-negative and the latter AUD-positive.
China is Australia’s largest trading partner so the health of the Chinese economy is a major influence on the value of the Australian Dollar (AUD). When the Chinese economy is doing well it purchases more raw materials, goods and services from Australia, lifting demand for the AUD, and pushing up its value. The opposite is the case when the Chinese economy is not growing as fast as expected. Positive or negative surprises in Chinese growth data, therefore, often have a direct impact on the Australian Dollar and its pairs.
Iron Ore is Australia’s largest export, accounting for $118 billion a year according to data from 2021, with China as its primary destination. The price of Iron Ore, therefore, can be a driver of the Australian Dollar. Generally, if the price of Iron Ore rises, AUD also goes up, as aggregate demand for the currency increases. The opposite is the case if the price of Iron Ore falls. Higher Iron Ore prices also tend to result in a greater likelihood of a positive Trade Balance for Australia, which is also positive of the AUD.
The Trade Balance, which is the difference between what a country earns from its exports versus what it pays for its imports, is another factor that can influence the value of the Australian Dollar. If Australia produces highly sought after exports, then its currency will gain in value purely from the surplus demand created from foreign buyers seeking to purchase its exports versus what it spends to purchase imports. Therefore, a positive net Trade Balance strengthens the AUD, with the opposite effect if the Trade Balance is negative.
The Indian Rupee weakens in Friday’s Asian session.
USD demand and foreign portfolio outflows could drag the INR lower.
The flash HSBC India PMI and US S&P PMI data will be the highlights later on Friday.
The Indian Rupee (INR) loses ground, snapping the two-day winning streak on Friday. Increased US Dollar (USD) demand from foreign banks operating in India, foreign portfolio outflows from Indian equities and the uncertainty surrounding tariff announcements by US President Donald Trump weigh on the local currency.
However, the Reserve Bank of India (RBI) allowed the Indian Rupee to move both ways with minimal intervention. This, in turn, might help limit the INR’s losses. Additionally, a fall in crude oil prices could provide some support to the INR as India is the world's third-largest oil consumer.
Investors will keep an eye on the preliminary reading of HSBC India’s Purchasing Managers Index (PMI), which is due later on Friday. On the US docket, the flash S&P PMI data for January will be in the spotlight.
Indian Rupee remains weak amid President Trump’s demands
Moody's Ratings on Thursday noted the Indian Rupee has depreciated by around 5% in the last two years and has fallen by 20% in the last five years, making it one of the weakest-performing currencies in South and Southeast Asia.
Attributing the fall in the Indian rupee solely to the US dollar getting stronger, said former RBI Governor Raghuram Rajan. He added that any intervention by the Indian central bank on this could end up harming Indian exports, even as he urged policymakers to focus on creating more jobs and boosting household consumption.
Trump stated at the World Economic Forum in Davos, Switzerland, that he would ask Saudi Arabia and the Organization of the Petroleum Exporting Countries (OPEC) to lower the price of oil.
"With oil prices going down, I'll demand that interest rates drop immediately, and likewise they should be dropping all over the world," said Trump.
The US Initial Jobless Claims for the week ending January 18 rose to 223K, compared to 217K in the previous week, according to the US Department of Labor (DoL) on Thursday. This reading came in above the market consensus of 220K.
Continuing Jobless Claims increased 46K to 1.899M for the week ending January 11.
USD/INR’s uptrend remains uninterrupted
The Indian Rupee trades on a softer note on the day. The positive view of the USD/INR pair remains in place, with the price holding above the ascending trend line and the key 100-day Exponential Moving Average (EMA) on the daily chart. The path of least resistance is to the upside as the 14-day Relative Strength Index (RSI) stands above the midline near 66.70.
The all-time high of 86.69 acts as an immediate resistance level for USD/INR. Any follow-through buying above the mentioned level could draw in some buyers to the 87.00 psychological mark.
On the bearish side, the initial support level is seen at 86.18, the low of January 20. A breach of this level could see the next downside target at 85.85, the low of January 10, followed by 85.65, the low of January 7.
Indian Rupee FAQs
The Indian Rupee (INR) is one of the most sensitive currencies to external factors. The price of Crude Oil (the country is highly dependent on imported Oil), the value of the US Dollar – most trade is conducted in USD – and the level of foreign investment, are all influential. Direct intervention by the Reserve Bank of India (RBI) in FX markets to keep the exchange rate stable, as well as the level of interest rates set by the RBI, are further major influencing factors on the Rupee.
The Reserve Bank of India (RBI) actively intervenes in forex markets to maintain a stable exchange rate, to help facilitate trade. In addition, the RBI tries to maintain the inflation rate at its 4% target by adjusting interest rates. Higher interest rates usually strengthen the Rupee. This is due to the role of the ‘carry trade’ in which investors borrow in countries with lower interest rates so as to place their money in countries’ offering relatively higher interest rates and profit from the difference.
Macroeconomic factors that influence the value of the Rupee include inflation, interest rates, the economic growth rate (GDP), the balance of trade, and inflows from foreign investment. A higher growth rate can lead to more overseas investment, pushing up demand for the Rupee. A less negative balance of trade will eventually lead to a stronger Rupee. Higher interest rates, especially real rates (interest rates less inflation) are also positive for the Rupee. A risk-on environment can lead to greater inflows of Foreign Direct and Indirect Investment (FDI and FII), which also benefit the Rupee.
Higher inflation, particularly, if it is comparatively higher than India’s peers, is generally negative for the currency as it reflects devaluation through oversupply. Inflation also increases the cost of exports, leading to more Rupees being sold to purchase foreign imports, which is Rupee-negative. At the same time, higher inflation usually leads to the Reserve Bank of India (RBI) raising interest rates and this can be positive for the Rupee, due to increased demand from international investors. The opposite effect is true of lower inflation.
US President Donald Trump said Friday that he “would rather not have to use tariffs on China.”
Trump further noted that he thinks can make a deal with China.
His comments came after he spoke to China's President Xi Jinping on Thursday.
Market reaction
Trump’s comments lift risk sentiment, propping up the higher-yielding Australian Dollar (AUD) against the US Dollar (USD). At the time of writing, AUD/USD is 0.27% higher on the day at 0.6301.
Australian Dollar FAQs
One of the most significant factors for the Australian Dollar (AUD) is the level of interest rates set by the Reserve Bank of Australia (RBA). Because Australia is a resource-rich country another key driver is the price of its biggest export, Iron Ore. The health of the Chinese economy, its largest trading partner, is a factor, as well as inflation in Australia, its growth rate and Trade Balance. Market sentiment – whether investors are taking on more risky assets (risk-on) or seeking safe-havens (risk-off) – is also a factor, with risk-on positive for AUD.
The Reserve Bank of Australia (RBA) influences the Australian Dollar (AUD) by setting the level of interest rates that Australian banks can lend to each other. This influences the level of interest rates in the economy as a whole. The main goal of the RBA is to maintain a stable inflation rate of 2-3% by adjusting interest rates up or down. Relatively high interest rates compared to other major central banks support the AUD, and the opposite for relatively low. The RBA can also use quantitative easing and tightening to influence credit conditions, with the former AUD-negative and the latter AUD-positive.
China is Australia’s largest trading partner so the health of the Chinese economy is a major influence on the value of the Australian Dollar (AUD). When the Chinese economy is doing well it purchases more raw materials, goods and services from Australia, lifting demand for the AUD, and pushing up its value. The opposite is the case when the Chinese economy is not growing as fast as expected. Positive or negative surprises in Chinese growth data, therefore, often have a direct impact on the Australian Dollar and its pairs.
Iron Ore is Australia’s largest export, accounting for $118 billion a year according to data from 2021, with China as its primary destination. The price of Iron Ore, therefore, can be a driver of the Australian Dollar. Generally, if the price of Iron Ore rises, AUD also goes up, as aggregate demand for the currency increases. The opposite is the case if the price of Iron Ore falls. Higher Iron Ore prices also tend to result in a greater likelihood of a positive Trade Balance for Australia, which is also positive of the AUD.
The Trade Balance, which is the difference between what a country earns from its exports versus what it pays for its imports, is another factor that can influence the value of the Australian Dollar. If Australia produces highly sought after exports, then its currency will gain in value purely from the surplus demand created from foreign buyers seeking to purchase its exports versus what it spends to purchase imports. Therefore, a positive net Trade Balance strengthens the AUD, with the opposite effect if the Trade Balance is negative.
The People's Bank of China (PBOC) conducted a medium-term loan operation on Friday and left the interest rate unchanged, per Reuters.
The Chinese central bank injected 200 billion Yuan ($27.46 billion) worth of one-year medium-term lending facility (MLF) loans to some financial institutions at 2.00%, unchanged from the previous rate.
PBOC FAQs
The primary monetary policy objectives of the People's Bank of China (PBoC) are to safeguard price stability, including exchange rate stability, and promote economic growth. China’s central bank also aims to implement financial reforms, such as opening and developing the financial market.
The PBoC is owned by the state of the People's Republic of China (PRC), so it is not considered an autonomous institution. The Chinese Communist Party (CCP) Committee Secretary, nominated by the Chairman of the State Council, has a key influence on the PBoC’s management and direction, not the governor. However, Mr. Pan Gongsheng currently holds both of these posts.
Unlike the Western economies, the PBoC uses a broader set of monetary policy instruments to achieve its objectives. The primary tools include a seven-day Reverse Repo Rate (RRR), Medium-term Lending Facility (MLF), foreign exchange interventions and Reserve Requirement Ratio (RRR). However, The Loan Prime Rate (LPR) is China’s benchmark interest rate. Changes to the LPR directly influence the rates that need to be paid in the market for loans and mortgages and the interest paid on savings. By changing the LPR, China’s central bank can also influence the exchange rates of the Chinese Renminbi.
Yes, China has 19 private banks – a small fraction of the financial system. The largest private banks are digital lenders WeBank and MYbank, which are backed by tech giants Tencent and Ant Group, per The Straits Times. In 2014, China allowed domestic lenders fully capitalized by private funds to operate in the state-dominated financial sector.
The Japanese Yen bulls opt to lighten their bets ahead of the crucial BoJ policy decision.
Japan's core inflation accelerates in December and lifts bets for a BoJ interest rate hike.
The US Dollar hangs near the monthly low set this week and could cap the USD/JPY pair.
The Japanese Yen (JPY) ticks lower during the Asian session on Friday amid some repositioning ahead of the highly-anticipated Bank of Japan (BoJ) policy decision. The downside for the JPY, however, seems cushioned amid firming expectations that the BoJ will hike interest rates amid signs of broadening inflationary pressures in Japan. In fact, government data released earlier today showed that Japan's core consumer prices rose at the fastest annual pace in 16 months. Moreover, a core reading that excludes both fresh food and energy prices remained above the BoJ’s 2% annual target for a fourth straight month.
Meanwhile, the prospects for further policy tightening by the BoJ and bets that the Federal Reserve (Fed) will cut interest rates twice this year could narrow the US-Japan rate differential. Apart from this, worries about US President Donald Trump's trade policies should continue to act as a tailwind for the JPY. The US Dollar (USD), on the other hand, languishes near the monthly low amid concerns over the implications of a Fed-Trump policy clash on interest rates. This, in turn, favors the USD bears and might further contribute to keeping a lid on any meaningful upside for the USD/JPY pair.
Japanese Yen struggles to lure buyers despite stronger domestic CPI; focus remains on BoJ
Data released by the Japan Statistics Bureau this Friday showed that the National Consumer Price Index (CPI) climbed 3.6% YoY in December, compared to the previous month's reading of 2.9%.
Further details of the report revealed that Japan's core consumer prices rose in line with expectations, from 2.7% to 3.0% during the reported month – marking its highest level since mid-2023.
Adding to this, a core reading, which strips out the effect of both fresh food and energy prices, remained steady and rose 2.4% in December from a year earlier amid strong private consumption.
This, along with expectations that annual springtime wage negotiations would yield bumper wage hikes again in 2025, gives the Bank of Japan more impetus to raise interest rates further.
The BoJ is scheduled to announce its decision at the end of a two-day policy meeting this Friday and is widely expected to raise the short-term interest rates from 0.25% to a 17-year high of 0.50%.
The preliminary Purchasing Managers' Index (PMI) showed that manufacturing activity in Japan contracted for the seventh straight month in January, while services sector activity picked up.
Meanwhile, US President Donald Trump, speaking remotely at the World Economic Forum in Davos, said on Thursday that he will apply pressure on the Federal Reserve to bring down interest rates.
This comes on top of signs of easing inflationary pressures in the US and reaffirms bets that the Fed will lower borrowing costs twice this year, which keeps the US Dollar close to the monthly low.
Traders on Friday will also confront the release of flash PMIs, which could provide a fresh insight into the global economic health and might influence demand for the safe-haven Japanese Yen.
USD/JPY bears need to wait for a sustained break and acceptance below ascending channel support
From a technical perspective, the USD/JPY pair, so far, has managed to defend support marked by the lower end of a multi-month-old ascending channel, currently pegged near the 155.35 area. This is closely followed by the 155.00 psychological mark and the 154.80-154.75 region, or over a one-month low touched on Tuesday. Some follow-through selling below the latter will be seen as a fresh trigger for bearish traders and drag spot prices to the 154.00 round figure en route to the mid-153.00s and the 153.00 mark.
On the flip side, the overnight swing high, around the 156.75 area, could offer some resistance ahead of the 157.00 round figure. A sustained strength beyond the latter should pave the way for a further move up towards the 157.55 area en route to the 158.00 mark. The momentum could extend further towards the 158.35-158.40 region, above which the USD/JPY pair could retest the multi-month peak, around the 159.00 neighborhood touched on January 10.
Bank of Japan FAQs
The Bank of Japan (BoJ) is the Japanese central bank, which sets monetary policy in the country. Its mandate is to issue banknotes and carry out currency and monetary control to ensure price stability, which means an inflation target of around 2%.
The Bank of Japan embarked in an ultra-loose monetary policy in 2013 in order to stimulate the economy and fuel inflation amid a low-inflationary environment. The bank’s policy is based on Quantitative and Qualitative Easing (QQE), or printing notes to buy assets such as government or corporate bonds to provide liquidity. In 2016, the bank doubled down on its strategy and further loosened policy by first introducing negative interest rates and then directly controlling the yield of its 10-year government bonds. In March 2024, the BoJ lifted interest rates, effectively retreating from the ultra-loose monetary policy stance.
The Bank’s massive stimulus caused the Yen to depreciate against its main currency peers. This process exacerbated in 2022 and 2023 due to an increasing policy divergence between the Bank of Japan and other main central banks, which opted to increase interest rates sharply to fight decades-high levels of inflation. The BoJ’s policy led to a widening differential with other currencies, dragging down the value of the Yen. This trend partly reversed in 2024, when the BoJ decided to abandon its ultra-loose policy stance.
A weaker Yen and the spike in global energy prices led to an increase in Japanese inflation, which exceeded the BoJ’s 2% target. The prospect of rising salaries in the country – a key element fuelling inflation – also contributed to the move.
NZD/USD softens to near 0.5675 in Friday's early Asian session.
The RBNZ is expected to cut its Official Cash Rate by 50 bps in the February meeting.
Trump said he would demand that interest rates drop immediately.
The NZD/USD pair trades in negative territory around 0.5675 during the early Asian session on Friday. The New Zealand Dollar (NZD) struggles to gain ground amid the uncertainty surrounding tariff announcements on China by US President Donald Trump and the dovish stance of the Reserve Bank of New Zealand (RBNZ).
New Zealand's Consumer Price Index (CPI) inflation data for the fourth quarter of 2024 revealed that underlying inflation continues to soften, raising the bets that the RBNZ will deliver further rate cuts. Swaps markets are now pricing in nearly 90% possibility of another 50 basis points (bps) reduction on February 19, adding to the two delivered earlier in the cycle. The RBNZ is expected to deliver a total of 100 bps of rate cuts for the remainder of 2025.
On the other hand, the downside for the pair might be limited after Trump’s remarks. Late Thursday, Trump said he wants the US Federal Reserve (Fed) to cut interest rates immediately. "With oil prices going down, I'll demand that interest rates drop immediately, and likewise they should be dropping all over the world," said Trump at the World Economic Forum in Davos, Switzerland.
Investors will closely monitor further clarity on Trump’s tariff policies as well as the US economic data. The flash US S&P Global Manufacturing and Services Purchasing Managers Index (PMI) for January will take center stage later on Friday. Additionally, the US Existing Home Sales and Michigan Consumer Sentiment Index data will be published.
New Zealand Dollar FAQs
The New Zealand Dollar (NZD), also known as the Kiwi, is a well-known traded currency among investors. Its value is broadly determined by the health of the New Zealand economy and the country’s central bank policy. Still, there are some unique particularities that also can make NZD move. The performance of the Chinese economy tends to move the Kiwi because China is New Zealand’s biggest trading partner. Bad news for the Chinese economy likely means less New Zealand exports to the country, hitting the economy and thus its currency. Another factor moving NZD is dairy prices as the dairy industry is New Zealand’s main export. High dairy prices boost export income, contributing positively to the economy and thus to the NZD.
The Reserve Bank of New Zealand (RBNZ) aims to achieve and maintain an inflation rate between 1% and 3% over the medium term, with a focus to keep it near the 2% mid-point. To this end, the bank sets an appropriate level of interest rates. When inflation is too high, the RBNZ will increase interest rates to cool the economy, but the move will also make bond yields higher, increasing investors’ appeal to invest in the country and thus boosting NZD. On the contrary, lower interest rates tend to weaken NZD. The so-called rate differential, or how rates in New Zealand are or are expected to be compared to the ones set by the US Federal Reserve, can also play a key role in moving the NZD/USD pair.
Macroeconomic data releases in New Zealand are key to assess the state of the economy and can impact the New Zealand Dollar’s (NZD) valuation. A strong economy, based on high economic growth, low unemployment and high confidence is good for NZD. High economic growth attracts foreign investment and may encourage the Reserve Bank of New Zealand to increase interest rates, if this economic strength comes together with elevated inflation. Conversely, if economic data is weak, NZD is likely to depreciate.
The New Zealand Dollar (NZD) tends to strengthen during risk-on periods, or when investors perceive that broader market risks are low and are optimistic about growth. This tends to lead to a more favorable outlook for commodities and so-called ‘commodity currencies’ such as the Kiwi. Conversely, NZD tends to weaken at times of market turbulence or economic uncertainty as investors tend to sell higher-risk assets and flee to the more-stable safe havens.
On Friday, the People’s Bank of China (PBOC) set the USD/CNY central rate for the trading session ahead at 7.1705 as compared to the previous day's fix of 7.1708 and 7.2779 Reuters estimates.
PBOC FAQs
The primary monetary policy objectives of the People's Bank of China (PBoC) are to safeguard price stability, including exchange rate stability, and promote economic growth. China’s central bank also aims to implement financial reforms, such as opening and developing the financial market.
The PBoC is owned by the state of the People's Republic of China (PRC), so it is not considered an autonomous institution. The Chinese Communist Party (CCP) Committee Secretary, nominated by the Chairman of the State Council, has a key influence on the PBoC’s management and direction, not the governor. However, Mr. Pan Gongsheng currently holds both of these posts.
Unlike the Western economies, the PBoC uses a broader set of monetary policy instruments to achieve its objectives. The primary tools include a seven-day Reverse Repo Rate (RRR), Medium-term Lending Facility (MLF), foreign exchange interventions and Reserve Requirement Ratio (RRR). However, The Loan Prime Rate (LPR) is China’s benchmark interest rate. Changes to the LPR directly influence the rates that need to be paid in the market for loans and mortgages and the interest paid on savings. By changing the LPR, China’s central bank can also influence the exchange rates of the Chinese Renminbi.
Yes, China has 19 private banks – a small fraction of the financial system. The largest private banks are digital lenders WeBank and MYbank, which are backed by tech giants Tencent and Ant Group, per The Straits Times. In 2014, China allowed domestic lenders fully capitalized by private funds to operate in the state-dominated financial sector.
00:30
Japan Jibun Bank Manufacturing PMI came in at 48.8, below expectations (49.7) in January
00:30
Japan Jibun Bank Services PMI climbed from previous 50.9 to 52.7 in January
Japan’s National Consumer Price Index (CPI) climbed 3.6% YoY in December, compared to the previous reading of 2.9%, according to the latest data released by the Japan Statistics Bureau on Friday.
Further details unveil that the National CPI ex Fresh food arrived at 3.0% YoY in December versus 2.7% prior. The figure was in line with the market consensus of 3.0%.
CPI ex Fresh Food, Energy rose 2.4% YoY in December, compared to the previous reading of 2.4% (revised from 2.7%).
Market reaction to Japan’s National CPI data
Following Japan’s CPI inflation data, the USD/JPY pair is up 0.08% on the day at 156.09.
Japanese Yen FAQs
The Japanese Yen (JPY) is one of the world’s most traded currencies. Its value is broadly determined by the performance of the Japanese economy, but more specifically by the Bank of Japan’s policy, the differential between Japanese and US bond yields, or risk sentiment among traders, among other factors.
One of the Bank of Japan’s mandates is currency control, so its moves are key for the Yen. The BoJ has directly intervened in currency markets sometimes, generally to lower the value of the Yen, although it refrains from doing it often due to political concerns of its main trading partners. The BoJ ultra-loose monetary policy between 2013 and 2024 caused the Yen to depreciate against its main currency peers due to an increasing policy divergence between the Bank of Japan and other main central banks. More recently, the gradually unwinding of this ultra-loose policy has given some support to the Yen.
Over the last decade, the BoJ’s stance of sticking to ultra-loose monetary policy has led to a widening policy divergence with other central banks, particularly with the US Federal Reserve. This supported a widening of the differential between the 10-year US and Japanese bonds, which favored the US Dollar against the Japanese Yen. The BoJ decision in 2024 to gradually abandon the ultra-loose policy, coupled with interest-rate cuts in other major central banks, is narrowing this differential.
The Japanese Yen is often seen as a safe-haven investment. This means that in times of market stress, investors are more likely to put their money in the Japanese currency due to its supposed reliability and stability. Turbulent times are likely to strengthen the Yen’s value against other currencies seen as more risky to invest in.
WTI price declines to $74.10 in Friday’s early Asian session.
Trump said he will ask OPEC to lower oil prices.
US crude oil inventories dropped by 1.017 million barrels last week, according to the EIA.
West Texas Intermediate (WTI), the US crude oil benchmark, is trading around $74.10 on Friday. The WTI price extends its downside after US President Donald Trump urged Saudi Arabia and the Organization of the Petroleum Exporting Countries (OPEC) to cut their prices.
Uncertainty over how Trump's proposed tariffs and energy policies could weigh on the WTI price. Trump said on Thursday that he will ask Saudi Arabia and OPEC to lower the price of oil. “I’m also going to ask Saudi Arabia and OPEC to bring down the cost of oil, said Trump durin g his speech at the World Economic Forum in Davos, Switzerland.
Additionally, the expectations of increased US production under President Trump further undermine the WTI price. Earlier this week, Trump declared a national energy emergency and used the authority to rapidly approve new oil, gas, and electricity projects that would normally take years to get permits.
US crude inventories fell for the ninth consecutive week. The US Energy Information Administration (EIA) weekly report showed crude oil stockpiles in the United States for the week ending January 17 declined by 1.017 million barrels, compared to a fall of 1.962 million barrels in the previous week. The market consensus estimated that stocks would decrease by 2.1 million barrels.
Oil traders will keep an eye on the developments surrounding Trump’s policy announcements. Also, the preliminary US S&P Global Purchasing Managers Index (PMI) for January will be published later on Friday. In case of a weaker-than-expected outcome, this could drag the US Dollar (USD) lower and provide some support to the USD-denominated commodity price.
WTI Oil FAQs
WTI Oil is a type of Crude Oil sold on international markets. The WTI stands for West Texas Intermediate, one of three major types including Brent and Dubai Crude. WTI is also referred to as “light” and “sweet” because of its relatively low gravity and sulfur content respectively. It is considered a high quality Oil that is easily refined. It is sourced in the United States and distributed via the Cushing hub, which is considered “The Pipeline Crossroads of the World”. It is a benchmark for the Oil market and WTI price is frequently quoted in the media.
Like all assets, supply and demand are the key drivers of WTI Oil price. As such, global growth can be a driver of increased demand and vice versa for weak global growth. Political instability, wars, and sanctions can disrupt supply and impact prices. The decisions of OPEC, a group of major Oil-producing countries, is another key driver of price. The value of the US Dollar influences the price of WTI Crude Oil, since Oil is predominantly traded in US Dollars, thus a weaker US Dollar can make Oil more affordable and vice versa.
The weekly Oil inventory reports published by the American Petroleum Institute (API) and the Energy Information Agency (EIA) impact the price of WTI Oil. Changes in inventories reflect fluctuating supply and demand. If the data shows a drop in inventories it can indicate increased demand, pushing up Oil price. Higher inventories can reflect increased supply, pushing down prices. API’s report is published every Tuesday and EIA’s the day after. Their results are usually similar, falling within 1% of each other 75% of the time. The EIA data is considered more reliable, since it is a government agency.
OPEC (Organization of the Petroleum Exporting Countries) is a group of 12 Oil-producing nations who collectively decide production quotas for member countries at twice-yearly meetings. Their decisions often impact WTI Oil prices. When OPEC decides to lower quotas, it can tighten supply, pushing up Oil prices. When OPEC increases production, it has the opposite effect. OPEC+ refers to an expanded group that includes ten extra non-OPEC members, the most notable of which is Russia.
00:01
United Kingdom GfK Consumer Confidence below expectations (-18) in January: Actual (-22)
Giao dịch trên thị trường tài chính (đặc biệt là giao dịch sử dụng các công cụ biên) mở ra những cơ hội lớn và tạo điều kiện cho các nhà đầu tư sẵn sàng mạo hiểm để thu lợi nhuận, tuy nhiên nó mang trong mình nguy cơ rủi ro khá cao. Chính vì vậy trước khi tiến hành giao dịch cần phải xem xét mọi mặt vấn đề chấp nhận tiến hành giao dịch cụ thể xét theo quan điểm của nguồn lực tài chính sẵn có và mức độ am hiểu thị trường tài chính.
Sử dụng thông tin: sử dụng toàn bộ hay riêng biệt các dữ liệu trên trang web của công ty TeleTrade như một nguồn cung cấp thông tin nhất định. Việc sử dụng tư liệu từ trang web cần kèm theo liên kết đến trang teletrade.vn. Việc tự động thu thập số liệu cũng như thông tin từ trang web TeleTrade đều không được phép.
Nhấn nút "Đăng ký" để nhận thông báo về chương trình khuyến mãi và Bonus
Cảm ơn bạn đã ghé thăm teletrade.org!
Thông tin trên trang web này có thể không tuân thủ luật pháp của quốc gia nơi bạn sống.
Vẫn xem thông tin.
Tôi xác nhận rằng các tài liệu trên trang web này không dành cho cư dân EU và tôi có thể không có quyền đăng ký tài khoản bên teletrade.org, nhưng tôi vẫn muốn tiếp tục.