- Phân tích
- Tin tức và các công cụ
- Tin tức thị trường
Tin tức thì trường
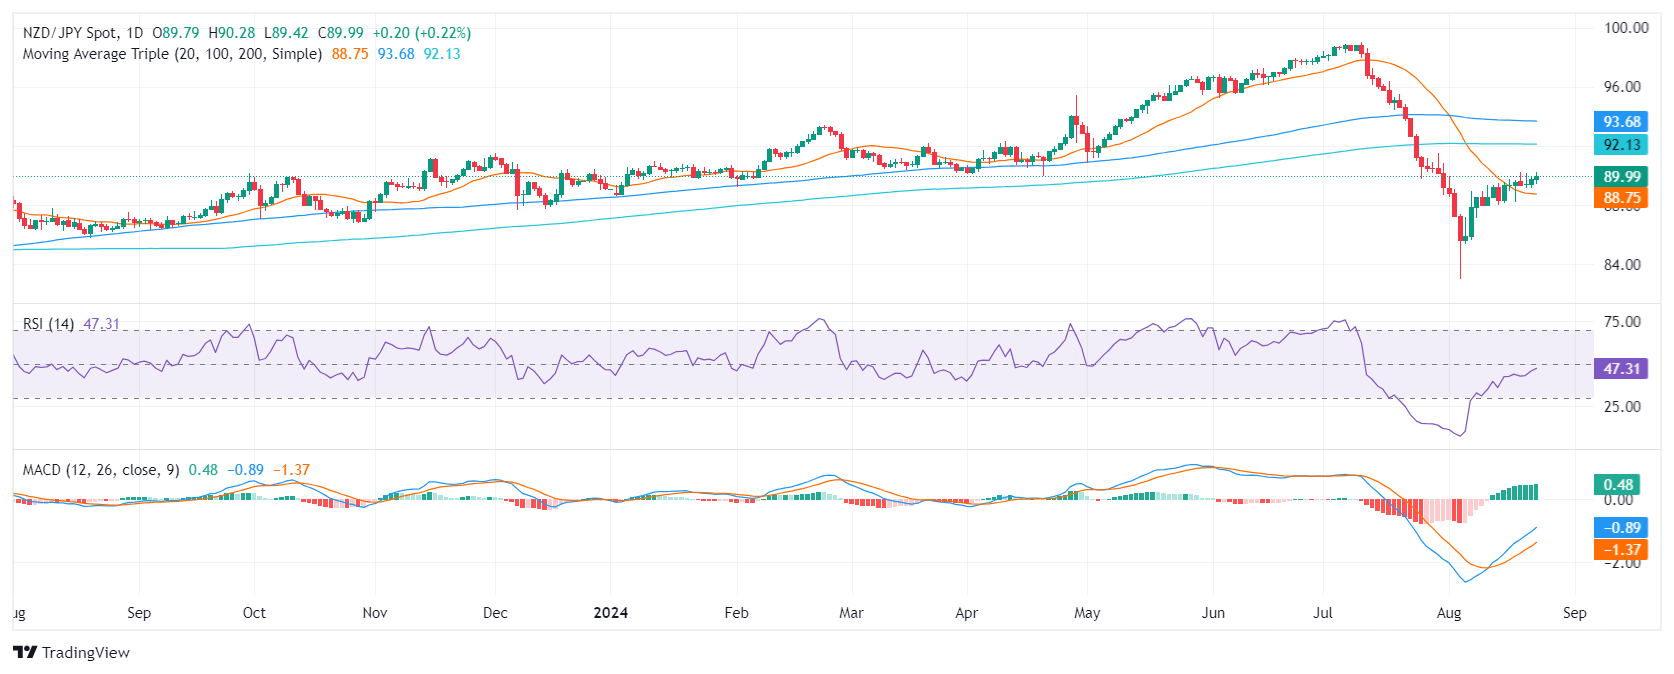
- NZD/JPY gained ground on Friday's session, mildly to 89.95.
- The RSI holds near neutral territory, indicating a balance between buying and selling forces.
- The MACD shows flat green bars, suggesting that momentum is stabilizing.
The NZD/JPY currency pair is consolidating sideways within a familiar range below 90.00. Technical indicators display mixed signals, with the Relative Strength Index (RSI) hinting at neutral sentiment and the Moving Average Convergence Divergence (MACD) showcasing a stabilizing momentum.
The RSI, reflecting the momentum of price changes, currently sits just below 50. This reading suggests that neither buyers nor sellers have a clear advantage in the market, resulting in a balanced sentiment. Meanwhile, the MACD, a trend-following indicator, is showing flat green bars, indicating that the bullish momentum is neither gaining nor losing strength.
The pair has been hovering within a trading range defined by the 89.00 support and 90.20 resistance levels. Volume has been relatively low, indicating a lack of decisive buying or selling pressure. A break above 90.20 could signal a potential bullish continuation, opening the way towards 90.50 and 91.00. Conversely, a break below 89.00 could trigger a bearish move towards 88.50 and 88.00.
NZD/JPY daily chart
- EUR/USD tipped into 1.1300 for the first time in over a year on Friday.
- Fed policymakers open the door to rate cuts during Jackson Hole.
- Coming up next week: key EU and US inflation prints.
EUR/USD rallied into its second-best day of August, climbing seven-tenths of one percent as the US Dollar tumbles across the board. Market risk appetite is pinned into the ceiling after Federal Reserve (Fed) officials broadly tipped their hand to investors, signalling that the US central bank is finally ready to start cutting interest rates.
Forecasting the Coming Week: Recession concerns take over Fed’s easing
According to the CME’s FedWatch Tool, rate markets are pricing in roughly three-to-one odds of a double cut on September 18, with the rest of the rate board still committed to a single quarter-point cut. Bets of a 50 bps opening rate trim in September rose after Fed Chairman Jerome Powell, while speaking at the Jackson Hole Economic Symposium on Friday, openly admitted that the time has finally come for the US central bank to begin pushing reference rates down.
Coming up: EU, US inflation metrics loom ahead late next week
Next week will open with a notably quiet data docket, however key inflation data points for both the EU and the US loom ahead in the darkness. US Gross Domestic Product (GDP) growth figures will serve as a precursor event on Thursday, but Fiber traders will broadly be focusing on an inflation double header slated for next Friday.
Preliminary EU Harmonized Index of Consumer Prices (HICP) inflation figures for August will kick off next Friday’s data docket, and the figures are widely forecast to show key EU inflation metrics continuing to cool toward the 2% annualized target set by the European Central Bank (ECB). On the US side, Personal Consumption Expenditure Price Index (PCE) inflation is expected to hold steady above the Fed’s own desired 2% target, with core PCE inflation for the year ended in July set to come in at or near the previous period’s 2.6%.
EUR/USD price forecast
Despite some hitches along the way, Fiber managed to squeeze out a fresh 13-month high on Friday, testing chart territory north of 1.1300. Despite a firm bullish presence in the order flow, intraday price action struggled to hold the key price level, but still wrapped up the trading week with a solid 1.51% gain, one of the pair’s best single-week performances since November of last year.
EUR/USD bids continue to stretch higher after the pair caught a bounce from the last swing low into the 200-day Exponential Moving Average (EMA) rising into 1.0850. Without a convincing break of 1.1300 on the table, bidders could see renewed short interest dragging price action back into the low side in the near-term.
EUR/USD daily chart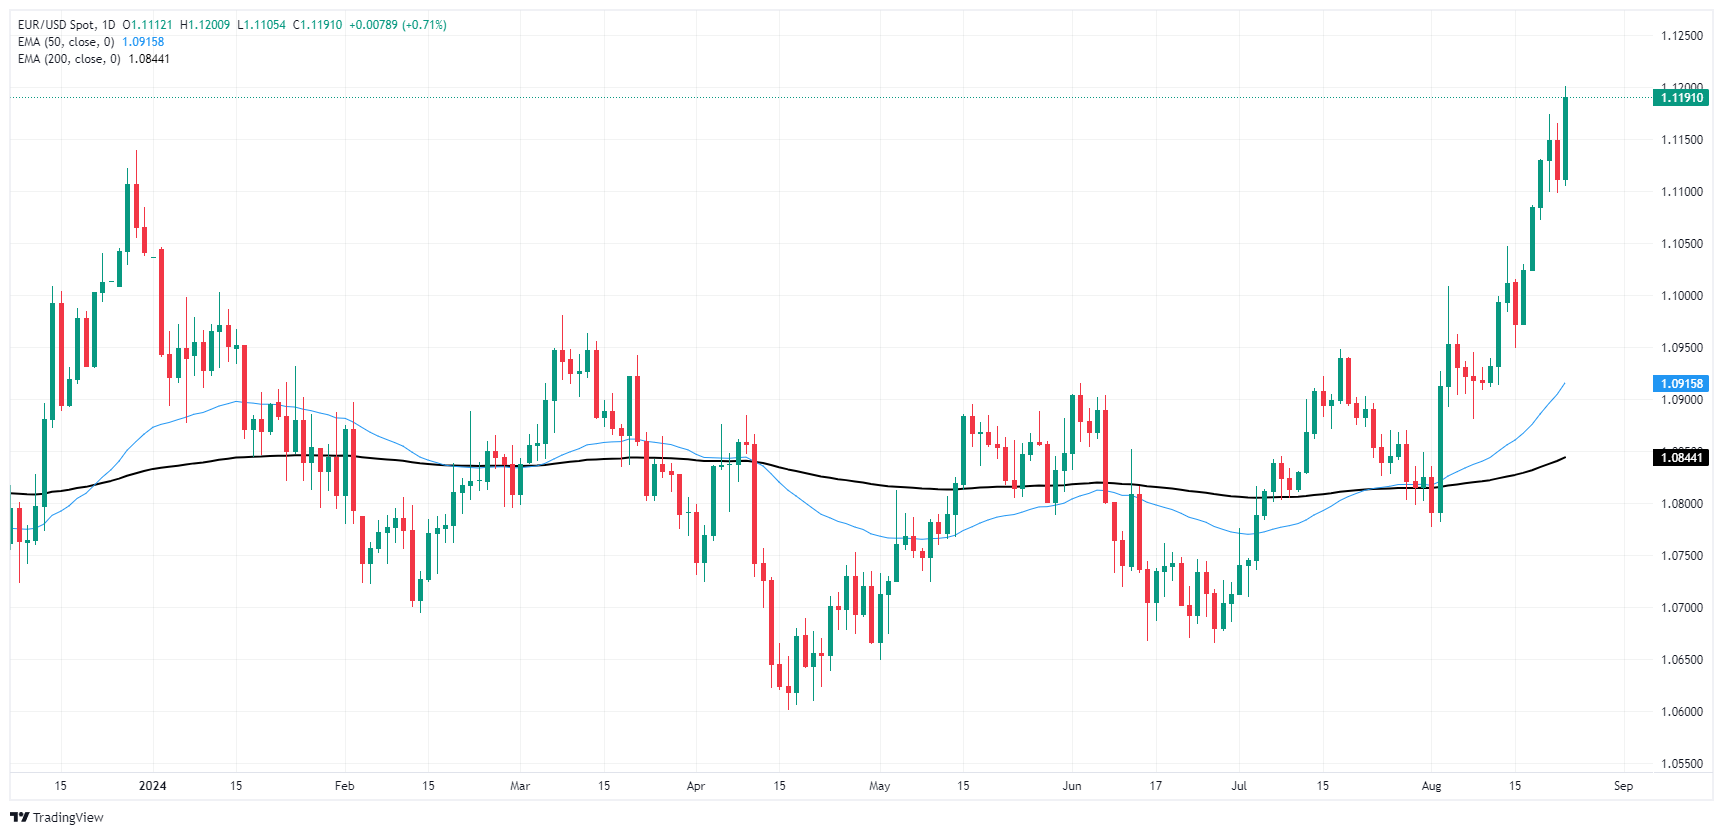
Euro FAQs
The Euro is the currency for the 20 European Union countries that belong to the Eurozone. It is the second most heavily traded currency in the world behind the US Dollar. In 2022, it accounted for 31% of all foreign exchange transactions, with an average daily turnover of over $2.2 trillion a day. EUR/USD is the most heavily traded currency pair in the world, accounting for an estimated 30% off all transactions, followed by EUR/JPY (4%), EUR/GBP (3%) and EUR/AUD (2%).
The European Central Bank (ECB) in Frankfurt, Germany, is the reserve bank for the Eurozone. The ECB sets interest rates and manages monetary policy. The ECB’s primary mandate is to maintain price stability, which means either controlling inflation or stimulating growth. Its primary tool is the raising or lowering of interest rates. Relatively high interest rates – or the expectation of higher rates – will usually benefit the Euro and vice versa. The ECB Governing Council makes monetary policy decisions at meetings held eight times a year. Decisions are made by heads of the Eurozone national banks and six permanent members, including the President of the ECB, Christine Lagarde.
Eurozone inflation data, measured by the Harmonized Index of Consumer Prices (HICP), is an important econometric for the Euro. If inflation rises more than expected, especially if above the ECB’s 2% target, it obliges the ECB to raise interest rates to bring it back under control. Relatively high interest rates compared to its counterparts will usually benefit the Euro, as it makes the region more attractive as a place for global investors to park their money.
Data releases gauge the health of the economy and can impact on the Euro. Indicators such as GDP, Manufacturing and Services PMIs, employment, and consumer sentiment surveys can all influence the direction of the single currency. A strong economy is good for the Euro. Not only does it attract more foreign investment but it may encourage the ECB to put up interest rates, which will directly strengthen the Euro. Otherwise, if economic data is weak, the Euro is likely to fall. Economic data for the four largest economies in the euro area (Germany, France, Italy and Spain) are especially significant, as they account for 75% of the Eurozone’s economy.
Another significant data release for the Euro is the Trade Balance. This indicator measures the difference between what a country earns from its exports and what it spends on imports over a given period. If a country produces highly sought after exports then its currency will gain in value purely from the extra demand created from foreign buyers seeking to purchase these goods. Therefore, a positive net Trade Balance strengthens a currency and vice versa for a negative balance.
- GBP/USD vaulted over 1.3200 on broad-market Greenback weakness.
- Fed gave a head nod to impending rate cuts, sending risk appetite into the ceiling.
- Coming up next week: UK Monday holiday, US GDP and PCE inflation.
GBP/USD found a Fed-fueled surge on Friday, climbing roughly a full percent through the day’s trading and closing the week with a seventh consecutive bullish daily candle as the US Dollar slumps across the board.
Forecasting the Coming Week: Recession concerns take over Fed’s easing
According to the CME’s FedWatch Tool, rate markets are pricing in roughly three-to-one odds of a double cut on September 18, with the rest of the rate board still committed to a single quarter-point cut. Bets of a 50 bps opening rate trim in September rose after Fed Chairman Jerome Powell, while speaking at the Jackson Hole Economic Symposium on Friday, openly admitted that the time has finally come for the US central bank to begin pushing reference rates down.
Up ahead: UK bankers take a break, US PCE inflation figures loom
Coming up next week, Cable traders will want to keep an eye out for the UK’s upcoming bank holiday on Monday. Throughout the rest of the week, UK economic data releases remain limited, though money markets will be paying extra-close attention to upcoming US Gross Domestic Product (GDP) growth and Personal Consumption Expenditure (PCE) inflation figures slated for later next week.
British Pound PRICE This week
The table below shows the percentage change of British Pound (GBP) against listed major currencies this week. British Pound was the strongest against the US Dollar.
| USD | EUR | GBP | JPY | CAD | AUD | NZD | CHF | |
|---|---|---|---|---|---|---|---|---|
| USD | -1.49% | -2.07% | -2.24% | -1.27% | -1.85% | -3.05% | -2.04% | |
| EUR | 1.49% | -0.65% | -0.73% | 0.24% | -0.45% | -1.74% | -0.58% | |
| GBP | 2.07% | 0.65% | -0.29% | 0.81% | 0.14% | -1.08% | 0.08% | |
| JPY | 2.24% | 0.73% | 0.29% | 0.95% | 0.37% | -0.68% | 0.08% | |
| CAD | 1.27% | -0.24% | -0.81% | -0.95% | -0.62% | -1.72% | -0.82% | |
| AUD | 1.85% | 0.45% | -0.14% | -0.37% | 0.62% | -1.10% | -0.10% | |
| NZD | 3.05% | 1.74% | 1.08% | 0.68% | 1.72% | 1.10% | 1.12% | |
| CHF | 2.04% | 0.58% | -0.08% | -0.08% | 0.82% | 0.10% | -1.12% |
The heat map shows percentage changes of major currencies against each other. The base currency is picked from the left column, while the quote currency is picked from the top row. For example, if you pick the British Pound from the left column and move along the horizontal line to the US Dollar, the percentage change displayed in the box will represent GBP (base)/USD (quote).
GBP/USD price forecast
Cable chart action was notably one-sided this week, with GBP/USD climbing steadily from Monday’s opening bids near 1.2950. The pair climbed over 2.1% this week in a firm march up the chart paper, extending a recovery bid from August’s early swing low to 1.2665.
GBP/USD knocked into a fresh 29-month high on Friday, and the pair is up an impressive 28% since hitting all-time lows in 3Q 2022. Cable’s current bull run has yet to show signs of exhaustion, and the pair has closed in the green for all but one of the last 11 consecutive trading days, marking a dizzying run up the chart.
GBP/USD 4-hour chart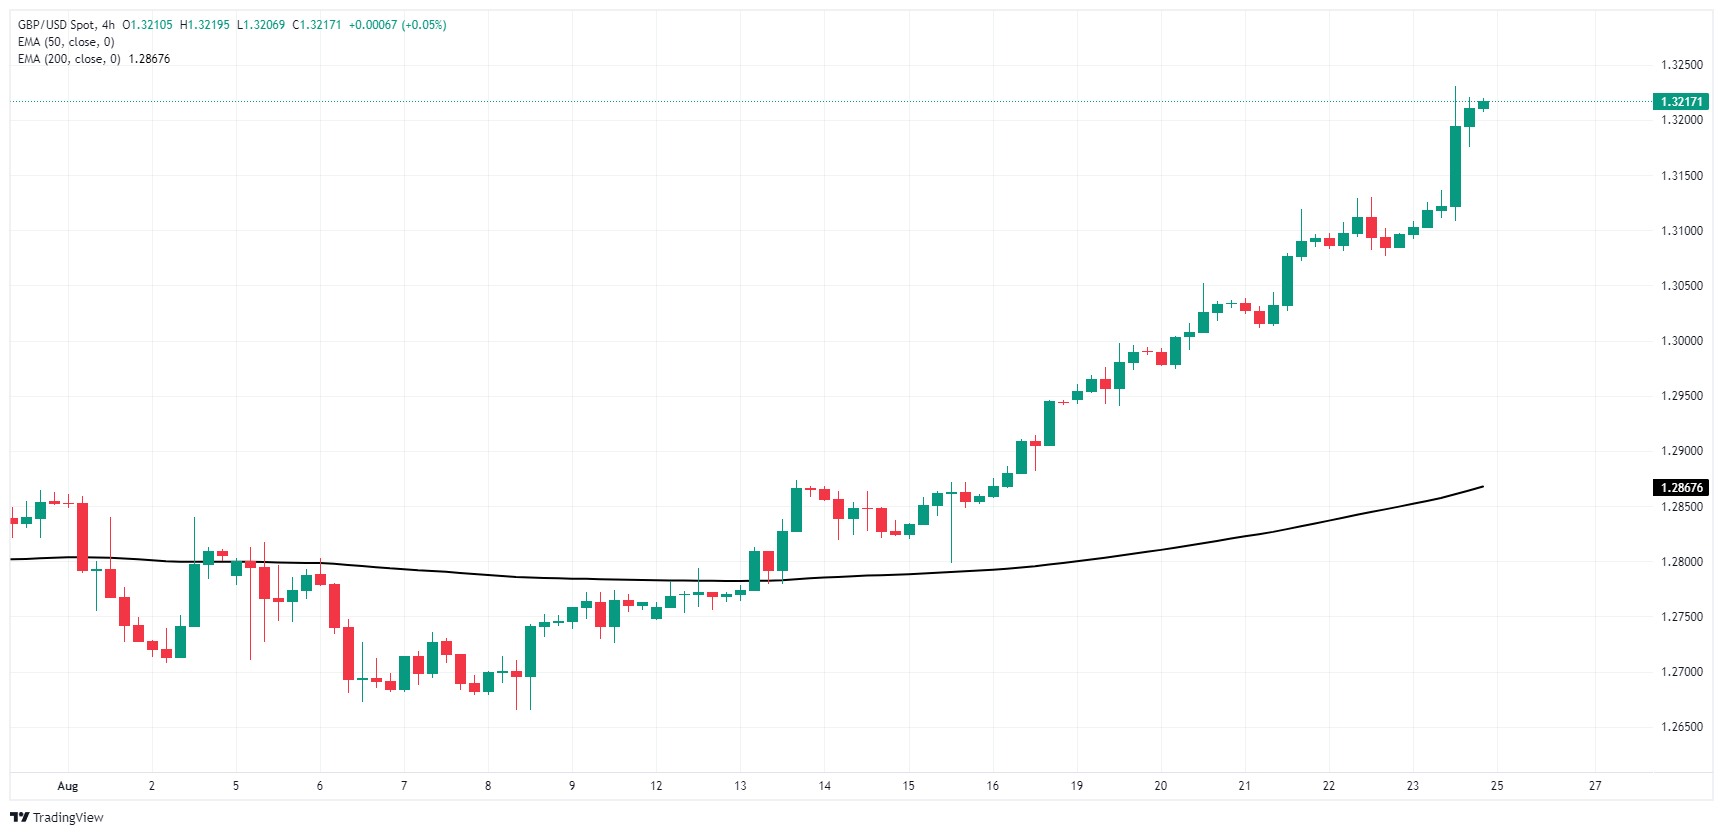
GBP/USD daily chart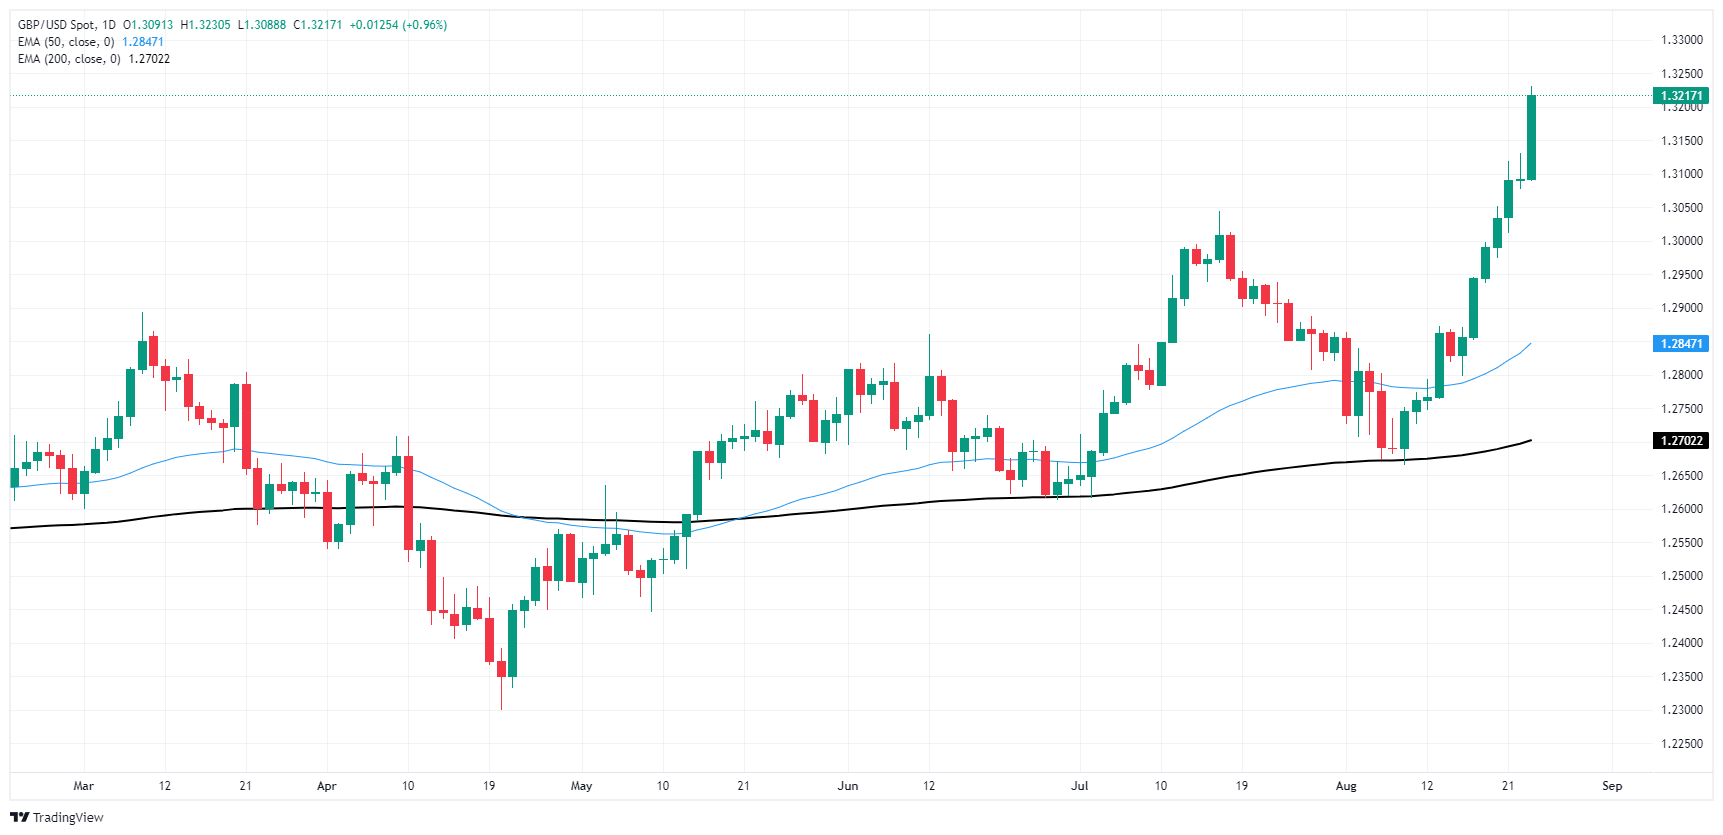
Pound Sterling FAQs
The Pound Sterling (GBP) is the oldest currency in the world (886 AD) and the official currency of the United Kingdom. It is the fourth most traded unit for foreign exchange (FX) in the world, accounting for 12% of all transactions, averaging $630 billion a day, according to 2022 data. Its key trading pairs are GBP/USD, aka ‘Cable’, which accounts for 11% of FX, GBP/JPY, or the ‘Dragon’ as it is known by traders (3%), and EUR/GBP (2%). The Pound Sterling is issued by the Bank of England (BoE).
The single most important factor influencing the value of the Pound Sterling is monetary policy decided by the Bank of England. The BoE bases its decisions on whether it has achieved its primary goal of “price stability” – a steady inflation rate of around 2%. Its primary tool for achieving this is the adjustment of interest rates. When inflation is too high, the BoE will try to rein it in by raising interest rates, making it more expensive for people and businesses to access credit. This is generally positive for GBP, as higher interest rates make the UK a more attractive place for global investors to park their money. When inflation falls too low it is a sign economic growth is slowing. In this scenario, the BoE will consider lowering interest rates to cheapen credit so businesses will borrow more to invest in growth-generating projects.
Data releases gauge the health of the economy and can impact the value of the Pound Sterling. Indicators such as GDP, Manufacturing and Services PMIs, and employment can all influence the direction of the GBP. A strong economy is good for Sterling. Not only does it attract more foreign investment but it may encourage the BoE to put up interest rates, which will directly strengthen GBP. Otherwise, if economic data is weak, the Pound Sterling is likely to fall.
Another significant data release for the Pound Sterling is the Trade Balance. This indicator measures the difference between what a country earns from its exports and what it spends on imports over a given period. If a country produces highly sought-after exports, its currency will benefit purely from the extra demand created from foreign buyers seeking to purchase these goods. Therefore, a positive net Trade Balance strengthens a currency and vice versa for a negative balance.
- NZD/USD rose by 1.55% to close at 0.6235.
- The RSI has risen above 70, while the MACD is showing rising green bars, indicating strong bullish momentum.
- A break above 0.6250 could lead to a further rally towards 0.6300.
In Friday's session, the NZD/USD rose by 1.55% to 0.6235, ending the week on a strong bullish note. The pair has broken out of a short-term consolidation range and is now facing a key resistance level at 0.6250. A break above this level could lead to a further rally towards 0.6300.
On the daily chart, the RSI has risen near 70, indicating strong bullish momentum but with the potential of a downward consolidation. The MACD is also showing rising green bars, supporting the positive outlook. The volume has been increasing over the past few sessions, suggesting that the current bullish momentum is likely to continue.
NZD/USD daily chart
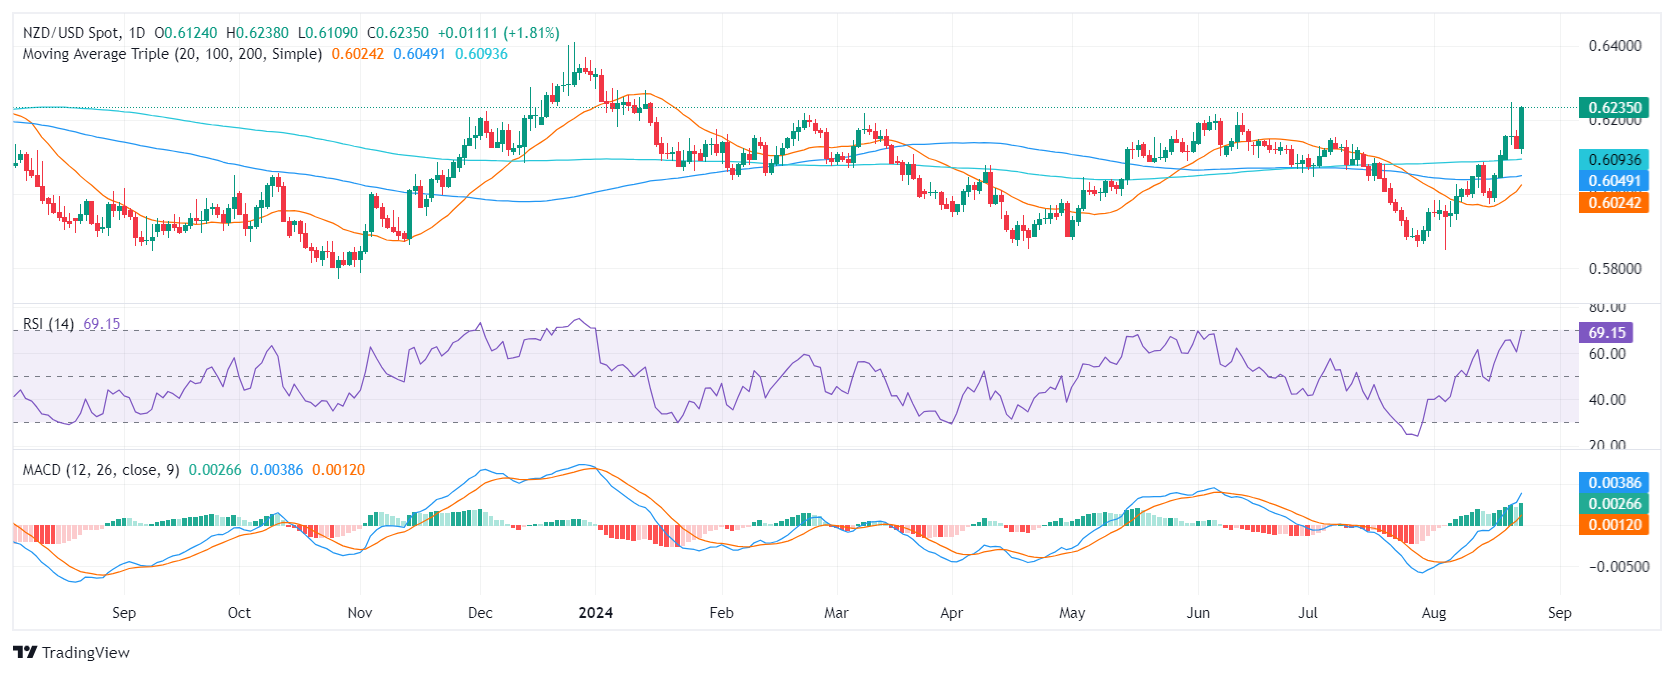
The NZD/USD pair is facing immediate resistance at 0.6255. A consolidation above this level could open the door for a further rally to retest the 0.6300 zone. On the downside, immediate support lies in the range of 0.6200 and 0.6150. A break below 0.6150 could lead to a further decline towards 0.6100.
- Gold prices jump over 1% after Fed Chair Powell hints at upcoming rate cuts, expressing confidence in inflation nearing the 2% target.
- The US Dollar Index (DXY) falls 0.82% to 100.68, as Powell’s remarks push traders to bet on a 50 bps rate cut in September.
- US 10-year Treasury yields drop five basis points to 3.80%, supporting bullion's rise, as market eyes the August Nonfarm Payrolls report for further guidance.
Gold price edges up over 1% on Friday as the Greenback and US Treasury bond yields dive following dovish remarks from Federal Reserve Chair Jerome Powell, who signaled he’s confident that inflation is edging towards the 2% goal and that rates should be cut. The XAU/USD trades at $2510 after bouncing off daily lows of $2484.
Bullion prices rose sharply as Powell said, “The time has come for policy to adjust. " He acknowledged that inflation is on the path to 2% and expressed that the Fed has shifted towards achieving the maximum employment mandate.
After those remarks, Gold reclaimed the $2500 figure, and the Greenback extended its losses. The US Dollar Index (DXY), which measures the dollar’s performance against a basket of six currencies, dropped 0.82% and traded at 100.68.
US Treasury bond yields immediately dropped, with the US 10-year benchmark note slumping five basis points to 3.80%. Traders increased their bets that the Fed would cut rates by 50 bps at the September meeting.
The CME FedWatch Tool shows that market participants had fully priced in a 25 bps cut, while odds for a larger size stand at 36.5%, up from 24% a day ago.
Now, with the Fed shifting towards the jobs market, the August Nonfarm Payrolls report would be the last piece of the puzzle to determine the size of the cut.
Daily digest market movers: Gold price advances ahead of next week’s US inflation report
- If US economic data continues to be soft, the Gold price uptrend will remain, which would increase speculation about a big-size rate cut.
- After Powell’s speech, other Fed officials made notable comments. Philadelphia Fed President Patrick Harker stated that the Fed needs to lower rates methodically. Chicago Fed President Austan Goolsbee added that monetary policy is currently at its most restrictive level, and the Fed’s focus is now shifting toward achieving its employment mandate.
- Next week, the US economic docket will feature Durable Goods Orders, the Conference Board (CB) Consumer Confidence index, Initial Jobless Claims data for the week ending August 24, and the Fed’s favorite inflation gauge, the Core Personal Consumption Expenditures (PCE) Price Index.
- Additionally, Fed speakers led by Christopher Waller and Atlanta’s Fed President Raphael Bostic would cross the wires to prepare the ground ahead of the September meeting.
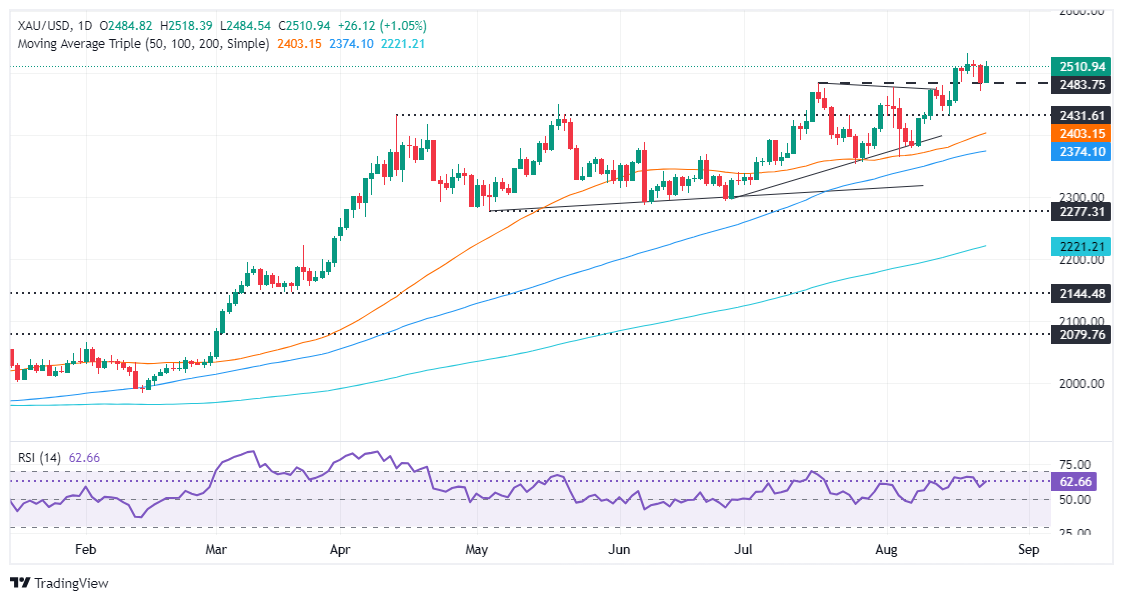
Technical outlook: Gold’s uptrend intact as buyers eye $2,550
Gold's uptrend remains intact and might extend if buyers lift prices above the all-time high (ATH) of $2,531. A breach of the latter will expose the $2,550 mark, followed by the $2,600 mark.
On the flip side, if Gold achieves a daily close below $2,500, a re-test of the previous all-time high (ATH) of $2,483 is on the cards. If surpassed, Gold’s next support would be the May 20 peak of $2,450, followed by the 50-day Simple Moving Average (SMA) at $2,402.
Gold FAQs
Gold has played a key role in human’s history as it has been widely used as a store of value and medium of exchange. Currently, apart from its shine and usage for jewelry, the precious metal is widely seen as a safe-haven asset, meaning that it is considered a good investment during turbulent times. Gold is also widely seen as a hedge against inflation and against depreciating currencies as it doesn’t rely on any specific issuer or government.
Central banks are the biggest Gold holders. In their aim to support their currencies in turbulent times, central banks tend to diversify their reserves and buy Gold to improve the perceived strength of the economy and the currency. High Gold reserves can be a source of trust for a country’s solvency. Central banks added 1,136 tonnes of Gold worth around $70 billion to their reserves in 2022, according to data from the World Gold Council. This is the highest yearly purchase since records began. Central banks from emerging economies such as China, India and Turkey are quickly increasing their Gold reserves.
Gold has an inverse correlation with the US Dollar and US Treasuries, which are both major reserve and safe-haven assets. When the Dollar depreciates, Gold tends to rise, enabling investors and central banks to diversify their assets in turbulent times. Gold is also inversely correlated with risk assets. A rally in the stock market tends to weaken Gold price, while sell-offs in riskier markets tend to favor the precious metal.
The price can move due to a wide range of factors. Geopolitical instability or fears of a deep recession can quickly make Gold price escalate due to its safe-haven status. As a yield-less asset, Gold tends to rise with lower interest rates, while higher cost of money usually weighs down on the yellow metal. Still, most moves depend on how the US Dollar (USD) behaves as the asset is priced in dollars (XAU/USD). A strong Dollar tends to keep the price of Gold controlled, whereas a weaker Dollar is likely to push Gold prices up.
- AUD/USD soared on Friday after Powell’s words at the Jackson Hole Symposium.
- Powell hinted that the Fed is ready to cut rates.
- On the other hand, the RBA is comfortable with restrictive rates, which favors the Aussie.
AUD/USD rose by more than 1% to 0.6790 in Friday’s session, finding stability around 0.6725. This upward move comes as the US Dollar weakens following Federal Reserve (Fed) Chair Jerome Powell's speech at the Jackson Hole symposium.
Despite mixed economic signals from Australia, the Reserve Bank of Australia's (RBA) cautious stance due to high inflation continues to support the Australian Dollar.
Daily digest market movers: Aussie gains strength on monetary policy divergences
- Australian Dollar is bolstered by the latest RBA meeting minutes, which reveal a reluctance to ease monetary policy soon.
- RBA projects inflation to stay above the 2-3% target until the end of 2025, suggesting interest rates may remain elevated for an extended period.
- Governor Bullock has recently stated that the bank has no plans of cutting in the near term.
- China’s recent measures to support the housing market are not expected to have a significant impact due to underlying debt issues, but they do offer some additional support for the Australian Dollar, given the close economic ties between Australia and China.
Technical analysis: AUD/USD sees rising momentum, might consolidate
After briefly consolidating, the AUD/USD rose to highs not seen since January around 0.6790. The Relative Strength Index (RSI) is around 67, indicating that the pair is near the overbought threshold. Meanwhile, the Moving Average Convergence Divergence (MACD) shows rising green bars, suggesting building bullish momentum.
Volume has remained high over the past sessions, reflecting strong interest from buyers. Resistance levels to watch include 0.6800 and 0.6850, while support levels are at 0.6700 and 0.6650.
Australian Dollar FAQs
One of the most significant factors for the Australian Dollar (AUD) is the level of interest rates set by the Reserve Bank of Australia (RBA). Because Australia is a resource-rich country another key driver is the price of its biggest export, Iron Ore. The health of the Chinese economy, its largest trading partner, is a factor, as well as inflation in Australia, its growth rate and Trade Balance. Market sentiment – whether investors are taking on more risky assets (risk-on) or seeking safe-havens (risk-off) – is also a factor, with risk-on positive for AUD.
The Reserve Bank of Australia (RBA) influences the Australian Dollar (AUD) by setting the level of interest rates that Australian banks can lend to each other. This influences the level of interest rates in the economy as a whole. The main goal of the RBA is to maintain a stable inflation rate of 2-3% by adjusting interest rates up or down. Relatively high interest rates compared to other major central banks support the AUD, and the opposite for relatively low. The RBA can also use quantitative easing and tightening to influence credit conditions, with the former AUD-negative and the latter AUD-positive.
China is Australia’s largest trading partner so the health of the Chinese economy is a major influence on the value of the Australian Dollar (AUD). When the Chinese economy is doing well it purchases more raw materials, goods and services from Australia, lifting demand for the AUD, and pushing up its value. The opposite is the case when the Chinese economy is not growing as fast as expected. Positive or negative surprises in Chinese growth data, therefore, often have a direct impact on the Australian Dollar and its pairs.
Iron Ore is Australia’s largest export, accounting for $118 billion a year according to data from 2021, with China as its primary destination. The price of Iron Ore, therefore, can be a driver of the Australian Dollar. Generally, if the price of Iron Ore rises, AUD also goes up, as aggregate demand for the currency increases. The opposite is the case if the price of Iron Ore falls. Higher Iron Ore prices also tend to result in a greater likelihood of a positive Trade Balance for Australia, which is also positive of the AUD.
The Trade Balance, which is the difference between what a country earns from its exports versus what it pays for its imports, is another factor that can influence the value of the Australian Dollar. If Australia produces highly sought after exports, then its currency will gain in value purely from the surplus demand created from foreign buyers seeking to purchase its exports versus what it spends to purchase imports. Therefore, a positive net Trade Balance strengthens the AUD, with the opposite effect if the Trade Balance is negative.
- Mexican Peso rallies sharply with USD/MXN falling over 2%.
- Mexico’s economy shows mixed signals, with Q2 GDP growth at 2.1% YoY but a contraction in economic activity, as Banxico debates the appropriateness of recent rate cuts.
- Powell's speech at Jackson Hole hints at upcoming rate cuts.
The Mexican Peso rallied sharply against the Greenback on Friday after Federal Reserve (Fed) Chair Jerome Powell announced that the central bank is ready to begin its easing cycle. This undermined the US Dollar, which is tumbling to a new yearly low, according to the US Dollar Index (DXY). Therefore, the USD/MXN collapses over 2% and trades at 19.06 after retreating from a daily peak of 19.53.
The USD/MXN extended its losses on Powell’s remarks, who said, “The time has come for policy to adjust.”
He added that the Fed is data-dependent regarding the size and timing of easing and added that he’s confident that inflation will hit the Fed’s 2% goal. Regarding achieving the maximum employment task, he said that risks are skewed to the upside.
After Powell’s speech, traders priced in a 33% chance of a 50-basis-point rate cut by the Fed at the September meeting. Meanwhile, the December 2024 fed funds rate futures contract shows market players expect 100 basis points of easing in 2024.
Meanwhile, Mexico’s economic docket remained absent on Friday. Yet Thursday’s data proved that the country grew 2.1% YoY in the final Gross Domestic Product (GDP) reading for the second quarter of 2024. Regarding economic activity, used by the Instituto Nacional de Estadistica Geografia e Informatica (INEGI) as a measure of growth, the economy contracted at a -0.6 % pace, missing estimates and May’s data, each at 0.9% and 1.6%, respectively.
On Thursday, Banxico revealed its last meeting minutes, in which the central bank lowered rates to 10.75%. The minutes revealed that while “the inflation outlook still calls for a restrictive monetary policy,” the “significant progress” on inflation suggested it was appropriate to “reduce the level of monetary restriction.”
Deputy Governors Jonathan Heath and Irene Espinosa, who voted against the rate cut, expressed concerns that jeopardizing the credibility of the Mexican central bank could be detrimental.
Daily digest market movers: Mexican Peso bolstered by Powell’s dovish tilt
- Mexico’s mid-month inflation in August dipped from 5.61% to 5.16%, less than economists estimate at 5.31%. Core inflation dropped below the 4% threshold, decreasing from 4.02% to 3.98% YoY, below expectations of a 4.06% increase.
- Given Mexico’s fundamental backdrop of economic deceleration and inflation aiming lower, it could open the door to further easing by Banxico despite the split decision witnessed in August.
- Reuters cited sources who said Mexico’s data and the Fed’s commencement of its easing cycle increase the odds of the Mexican central bank cutting interest rates again in September.
- If the Fed aggressively lowers interest rates, it could boost the Mexican Peso prospects, and the USD/MXN could drop below the psychological 19.00 figure.
- After Powell’s speech, other Fed officials crossed the newswires. Philadelphia Fed’s Patrick Harker said the Fed needs to move rates down methodically. Chicago Fed’s Austan Goolsbee added that policy is at its tightest restrictive level and that the Fed’s focus is shifting towards achieving the job mandate.
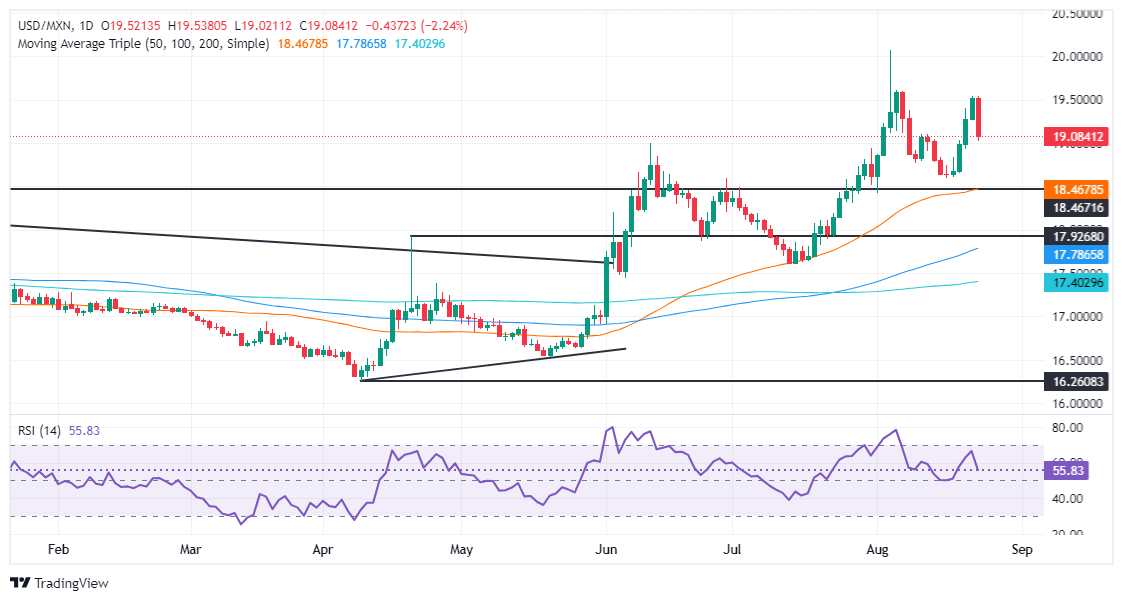
Technical outlook: Mexican Peso appreciates as traders push USD/MXN toward 19.00
The USD/MXN remains upwardly biased, yet a double top formation looms. Momentum is shifting to the downside, yet the Relative Strength Index (RSI) remains in bullish territory.
If USD/MXN edges below 19.00, this could exacerbate a leg-down toward the August 19 low of 18.59 on further weakness, the pair could test the 50-day Simple Moving Average (SMA) at 18.45, followed by the psychological 18.00 mark.
On the other hand, if buyers keep the USD/MXN above 19.00, that could pave the way for a consolidation. If the pair clears the 19.40 mark, look for a move toward the 20.00 figure before testing the year-to-date (YTD) high at 20.22.
Mexican Peso FAQs
The Mexican Peso (MXN) is the most traded currency among its Latin American peers. Its value is broadly determined by the performance of the Mexican economy, the country’s central bank’s policy, the amount of foreign investment in the country and even the levels of remittances sent by Mexicans who live abroad, particularly in the United States. Geopolitical trends can also move MXN: for example, the process of nearshoring – or the decision by some firms to relocate manufacturing capacity and supply chains closer to their home countries – is also seen as a catalyst for the Mexican currency as the country is considered a key manufacturing hub in the American continent. Another catalyst for MXN is Oil prices as Mexico is a key exporter of the commodity.
The main objective of Mexico’s central bank, also known as Banxico, is to maintain inflation at low and stable levels (at or close to its target of 3%, the midpoint in a tolerance band of between 2% and 4%). To this end, the bank sets an appropriate level of interest rates. When inflation is too high, Banxico will attempt to tame it by raising interest rates, making it more expensive for households and businesses to borrow money, thus cooling demand and the overall economy. Higher interest rates are generally positive for the Mexican Peso (MXN) as they lead to higher yields, making the country a more attractive place for investors. On the contrary, lower interest rates tend to weaken MXN.
Macroeconomic data releases are key to assess the state of the economy and can have an impact on the Mexican Peso (MXN) valuation. A strong Mexican economy, based on high economic growth, low unemployment and high confidence is good for MXN. Not only does it attract more foreign investment but it may encourage the Bank of Mexico (Banxico) to increase interest rates, particularly if this strength comes together with elevated inflation. However, if economic data is weak, MXN is likely to depreciate.
As an emerging-market currency, the Mexican Peso (MXN) tends to strive during risk-on periods, or when investors perceive that broader market risks are low and thus are eager to engage with investments that carry a higher risk. Conversely, MXN tends to weaken at times of market turbulence or economic uncertainty as investors tend to sell higher-risk assets and flee to the more-stable safe havens.
- The Canadian Dollar surged 0.80% against the Greenback on Friday.
- Canada saw an unexpected improvement in core Retail Sales.
- Fed officials give a nod to a rate cutting cycle, sparking a fresh risk bid.
The Canadian Dollar (CAD) is mixed on Friday, but found a surge of fresh bidding against the US Dollar on the back of fresh nods to rate cuts from the Federal Reserve (Fed) sent the Greenback into the floor. The CAD is up over eight-tenths of one percent against the USD, and on pace to see its single-best day against the Greenback since mid-2023.
Canada reported a better-than-expected upswing in core Retail Sales in June, but headline Retail Sales contracted as-expected over the same period, keeping CAD bidding suppressed. Canadian economic figures remain thin next week, until next Friday’s update print in Canadian Q2 Gross Domestic Product (GDP).
Daily digest market movers
- The Canadian Dollar is up over 0.8% against a slumping US Dollar on Friday.
- Federal Reserve (Fed) officials finally opened the door to a rate-cutting cycle.
- Fed policymakers opened the floodgates with Fed Chairman Jerome Powell giving the nod to a September rate cut while speaking at the Jackson Hole Economic Symposium.
- Markets are fully geared for a September rate cut.
- At the current cut, Markets are betting on one-in-three odds of a double cut for 50 bps on September 18, with the rest of the board still expecting a quarter-point trim.
Canadian Dollar price forecast
The Canadian Dollar (CAD) surged to multi-month highs against the US Dollar on Friday, climbing over 0.8% and tapping the 1.3500 handle for the first time since early April. The CAD is on pace to close higher against the US Dollar for a third straight week, and is up around 3.3% in a recovery from August’s lows against the Greenback.
The US Dollar’s broad-market softening has sent the USD/CAD chart into a plunge that is picking up speed, extending below the 200-day Exponential Moving Average (EMA) near 1.3632. Shortsellers of the pair are firmly in control, but near-term exhaustion could be on the cards as price action rediscovers early 2024’s technical congestion zone.
USD/CAD daily chart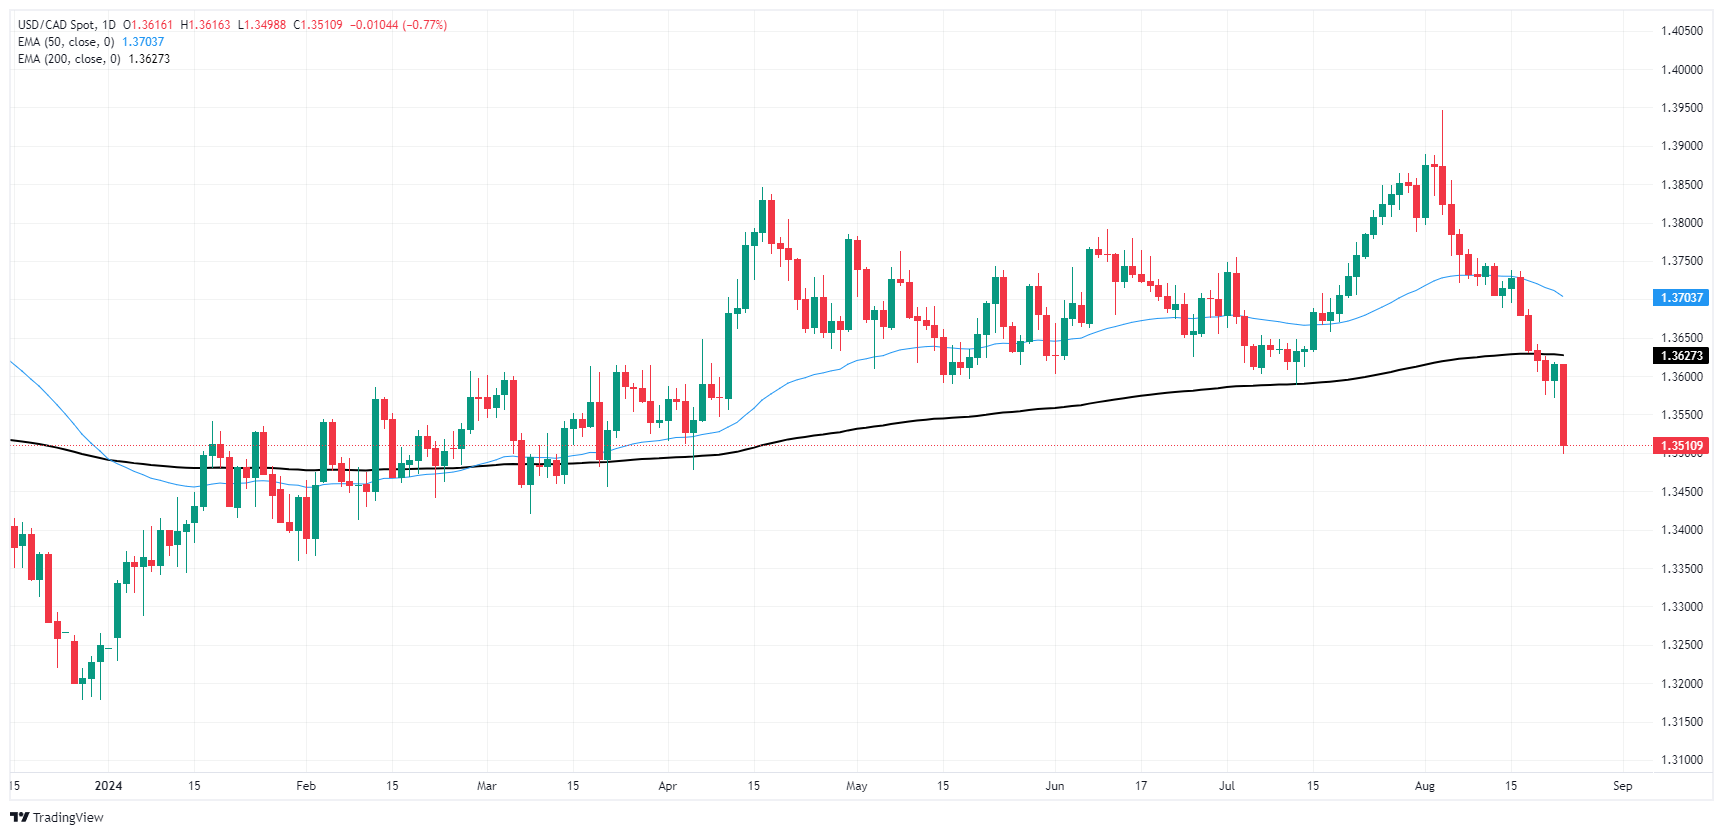
Canadian Dollar FAQs
The key factors driving the Canadian Dollar (CAD) are the level of interest rates set by the Bank of Canada (BoC), the price of Oil, Canada’s largest export, the health of its economy, inflation and the Trade Balance, which is the difference between the value of Canada’s exports versus its imports. Other factors include market sentiment – whether investors are taking on more risky assets (risk-on) or seeking safe-havens (risk-off) – with risk-on being CAD-positive. As its largest trading partner, the health of the US economy is also a key factor influencing the Canadian Dollar.
The Bank of Canada (BoC) has a significant influence on the Canadian Dollar by setting the level of interest rates that banks can lend to one another. This influences the level of interest rates for everyone. The main goal of the BoC is to maintain inflation at 1-3% by adjusting interest rates up or down. Relatively higher interest rates tend to be positive for the CAD. The Bank of Canada can also use quantitative easing and tightening to influence credit conditions, with the former CAD-negative and the latter CAD-positive.
The price of Oil is a key factor impacting the value of the Canadian Dollar. Petroleum is Canada’s biggest export, so Oil price tends to have an immediate impact on the CAD value. Generally, if Oil price rises CAD also goes up, as aggregate demand for the currency increases. The opposite is the case if the price of Oil falls. Higher Oil prices also tend to result in a greater likelihood of a positive Trade Balance, which is also supportive of the CAD.
While inflation had always traditionally been thought of as a negative factor for a currency since it lowers the value of money, the opposite has actually been the case in modern times with the relaxation of cross-border capital controls. Higher inflation tends to lead central banks to put up interest rates which attracts more capital inflows from global investors seeking a lucrative place to keep their money. This increases demand for the local currency, which in Canada’s case is the Canadian Dollar.
Macroeconomic data releases gauge the health of the economy and can have an impact on the Canadian Dollar. Indicators such as GDP, Manufacturing and Services PMIs, employment, and consumer sentiment surveys can all influence the direction of the CAD. A strong economy is good for the Canadian Dollar. Not only does it attract more foreign investment but it may encourage the Bank of Canada to put up interest rates, leading to a stronger currency. If economic data is weak, however, the CAD is likely to fall.
- DXY Index declines as investors favor riskier assets following Powell's dovish speech.
- Powell hinted that the economic outlook is coming closer to the Fed’s goal.
- Markets have already priced in a September cut.
The US Dollar (USD), measured by the US Dollar Index (DXY), resumed its decline on Friday, falling from below the 101.00 level due to a shift toward riskier investments. This shift was influenced by the dovish tone of US Federal Reserve (Fed) Chairman Jerome Powell's speech at Jackson Hole.
Despite concerns about decelerating job growth, Fed officials, including Powell, maintain positive views on the US labor market. Data suggests that the US economy continues to expand above trend, suggesting that the market may be overestimating the need for rapid monetary easing.
Daily digest market movers: US Dollar softens after Powell’s speech
- Chair Powell stated that inflation has significantly declined, bringing the economy closer to the Fed's 2% target.
- Powell observed a noticeable cooling in the labor market, suggesting the economy is no longer overheated.
- Fed Chair also noted that the balance of risks has shifted, with reduced inflation risks but heightened concerns about employment.
- Chair Powell stated that future rate cuts will be determined by data, economic outlook and the balance of risks.
- Market participants have increased bets on a Fed rate cut in response to Powell's comments, with a September cut now being fully priced in.
DXY technical outlook: Bearish bias is clearer, correction possible
The technical outlook of the DXY Index remains bearish. However, buyers have been attempting to initiate an uptrend. The index remains below its 20, 100 and 200-day Simple Moving Averages (SMAs), indicating a bearish bias. The Relative Strength Index (RSI) is below 30, indicating continued and over-extended selling pressure. The Moving Average Convergence Divergence (MACD) remains in negative territory with red bars.
That being said, as indicators show oversold signals, there is potential for a correction to the upside.
Support Levels: 101.00, 100.50, 100.30
Resistance Levels: 101.50, 101.80, 102.20.
US Dollar FAQs
The US Dollar (USD) is the official currency of the United States of America, and the ‘de facto’ currency of a significant number of other countries where it is found in circulation alongside local notes. It is the most heavily traded currency in the world, accounting for over 88% of all global foreign exchange turnover, or an average of $6.6 trillion in transactions per day, according to data from 2022. Following the second world war, the USD took over from the British Pound as the world’s reserve currency. For most of its history, the US Dollar was backed by Gold, until the Bretton Woods Agreement in 1971 when the Gold Standard went away.
The most important single factor impacting on the value of the US Dollar is monetary policy, which is shaped by the Federal Reserve (Fed). The Fed has two mandates: to achieve price stability (control inflation) and foster full employment. Its primary tool to achieve these two goals is by adjusting interest rates. When prices are rising too quickly and inflation is above the Fed’s 2% target, the Fed will raise rates, which helps the USD value. When inflation falls below 2% or the Unemployment Rate is too high, the Fed may lower interest rates, which weighs on the Greenback.
In extreme situations, the Federal Reserve can also print more Dollars and enact quantitative easing (QE). QE is the process by which the Fed substantially increases the flow of credit in a stuck financial system. It is a non-standard policy measure used when credit has dried up because banks will not lend to each other (out of the fear of counterparty default). It is a last resort when simply lowering interest rates is unlikely to achieve the necessary result. It was the Fed’s weapon of choice to combat the credit crunch that occurred during the Great Financial Crisis in 2008. It involves the Fed printing more Dollars and using them to buy US government bonds predominantly from financial institutions. QE usually leads to a weaker US Dollar.
Quantitative tightening (QT) is the reverse process whereby the Federal Reserve stops buying bonds from financial institutions and does not reinvest the principal from the bonds it holds maturing in new purchases. It is usually positive for the US Dollar.
Federal Reserve (Fed) Bank of Chicago President Austan Goolsbee noted on Friday that the Fed has seen broad success in achieving its goals, and that inflation should continue to head towards the US central bank's target range.
Key highlights
I support the Fed's new focus on the job markets.
Inflation is on a path to 2%.
Policy is now at its tightest point of the entire hike cycle.
Everything we wanted to happen to get rates down, has happened.
By almost all measures, the job market is cooling.
I don't think inflation will get stuck above 2%.
- The Dow Jones rallied to 41,200.00 after Fed officials agreed its time to cut rates.
- Equities have immediately moved on to guessing how many rate cuts in 2024.
- Rate markets see 100 bps in cuts by 2024 year-end.
The Dow Jones Industrial Average (DJIA) lurched higher on Friday after the Federal Reserve (Fed) gave a nod of the head to upcoming rate cuts. Several Fed policymakers appeared before markets to signal a long-awaited shift in policy stance that markets have been rallying for since at least last December, when investors had initially priced in an eye-watering six rate cuts for over 200 bps by the end of 2024.
Read more: Jerome Powell repeats timing and pace of rate cuts will depend on data
Fast-forward to late August, and traders are now grappling with whether or not the Fed’s September rate call will be for 25 or 50 bps. According to the CME’s FedWatch Tool, rate markets are pricing in roughly three-to-one odds of a double cut on September 18, with the rest of the rate board still committed to a single quarter-point cut. Bets of a 50 bps opening rate trim in September rose after Fed Chairman Jerome Powell, while speaking at the Jackson Hole Economic Symposium on Friday, openly admitted that the time has finally come for the US central bank to begin pushing reference rates down.
Dow Jones news
Despite a broad topside pivot in market sentiment on Friday, roughly a third of the Dow Jones index is still grappling with the low side. Procter & Gamble Co. (PG) tumbled around one percent, falling to $168.41 per share after it was revealed that COO Shailesh Jejurikar sold nearly a third of his stake in the company. On the bullish side of the board, Dow Inc. (DOW) rallied 2% to $53.62.
Dow Jones price forecast
The Dow Jones managed to tap 41,200.00 for the first time since late July amidst a broad rally in equities. With the index continuing to test higher ground, the DJIA is on pace to again challenge all-time highs priced in at 41,371.38 set in mid-July.
Despite a firm bullish stance, bidders are at risk of running out of momentum with price action strung along the high side. The Dow Jones continues to trade well above the 200-day Exponential Moving Average (EMA) at 38,187.93, and a near-term pullback will see the Dow Jones skid back into the 50-day EMA rising into the 40,000.00 major price handle.
Read more Dow Jones news: Intel sinks 6% as German factory investment becomes less certain
Dow Jones daily chart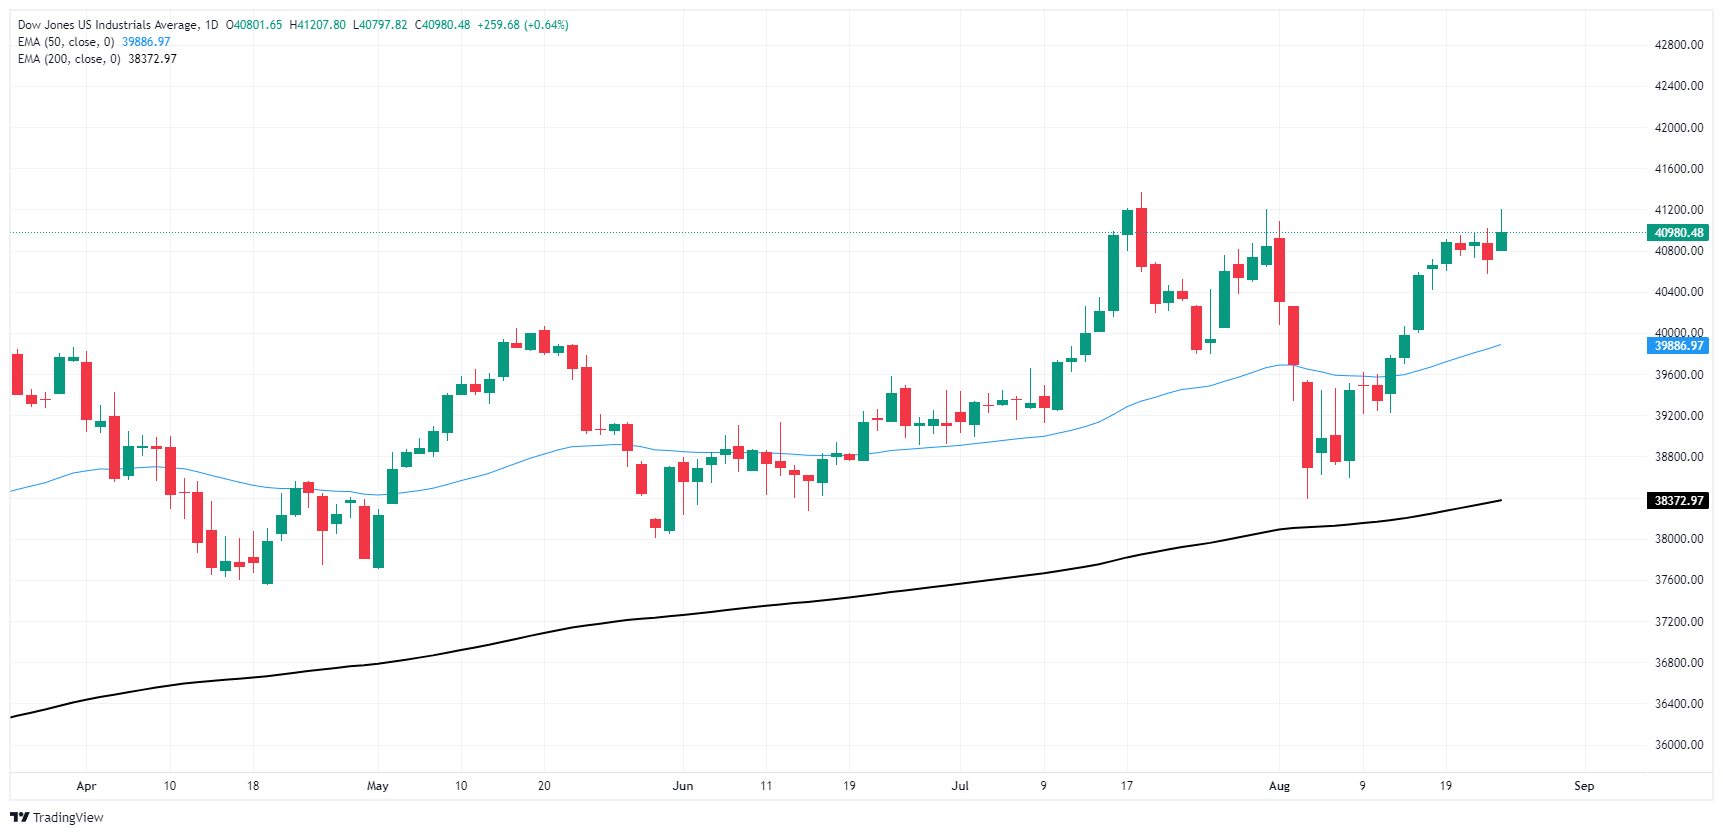
Dow Jones FAQs
The Dow Jones Industrial Average, one of the oldest stock market indices in the world, is compiled of the 30 most traded stocks in the US. The index is price-weighted rather than weighted by capitalization. It is calculated by summing the prices of the constituent stocks and dividing them by a factor, currently 0.152. The index was founded by Charles Dow, who also founded the Wall Street Journal. In later years it has been criticized for not being broadly representative enough because it only tracks 30 conglomerates, unlike broader indices such as the S&P 500.
Many different factors drive the Dow Jones Industrial Average (DJIA). The aggregate performance of the component companies revealed in quarterly company earnings reports is the main one. US and global macroeconomic data also contributes as it impacts on investor sentiment. The level of interest rates, set by the Federal Reserve (Fed), also influences the DJIA as it affects the cost of credit, on which many corporations are heavily reliant. Therefore, inflation can be a major driver as well as other metrics which impact the Fed decisions.
Dow Theory is a method for identifying the primary trend of the stock market developed by Charles Dow. A key step is to compare the direction of the Dow Jones Industrial Average (DJIA) and the Dow Jones Transportation Average (DJTA) and only follow trends where both are moving in the same direction. Volume is a confirmatory criteria. The theory uses elements of peak and trough analysis. Dow’s theory posits three trend phases: accumulation, when smart money starts buying or selling; public participation, when the wider public joins in; and distribution, when the smart money exits.
There are a number of ways to trade the DJIA. One is to use ETFs which allow investors to trade the DJIA as a single security, rather than having to buy shares in all 30 constituent companies. A leading example is the SPDR Dow Jones Industrial Average ETF (DIA). DJIA futures contracts enable traders to speculate on the future value of the index and Options provide the right, but not the obligation, to buy or sell the index at a predetermined price in the future. Mutual funds enable investors to buy a share of a diversified portfolio of DJIA stocks thus providing exposure to the overall index.
Through most of this year, EUR/USD has been contained by a 1.10 to 1.06 range, Rabobank’s Senior FX Strategist Jane Foley notes.
EUR/USD set to trade at 1.12 on a 3-month scale
“This month’s break higher and the advent of a new policy cycle for the Fed suggests that a new range is in the process of being drawn out. The forthcoming releases of US August labour data and the next round of US CPI inflation numbers suggest scope for volatility in the US Dollar (USD) crosses near-term as the market finetunes its expectations for the size of the Fed policy decision in September.”
“We see scope for pullbacks potentially to EUR/USD1.10 if key US data in early September prints on the firm side of market forecasts. That said, on the back of Rabo’s revised view that four consecutive Fed rate cuts may be on the cards, we have revised up our 3- and 6-month EUR/USD forecasts to 1.12 and 1.11 respectively from 1.09.”
We have left our 9- and 12-month EUR/USD forecast at 1.10 on the assumption that US inflation fears could be given another boost next year as a consequence of the US election outcome.
Federal Reserve (Fed) Bank of Philadelphia Patrick Harker hit newswires on Friday, noting that Fed moves on interest rates need to be "methodical", telegraphing that policymakers are targeting a series of cuts through the rest of 2024 as the US central bank gears up for a dovish pivot.
Key highlights
We need to start moving rates down.
The Fed should start the process of cuts, and keep moving.
I don't see large outsize risk of labor deterioration. In our view, the jobless rate will not peak above 5%.
Contacts urging the Fed not to stop and start rate cuts.
The neutral rate is somewhere around 3%.
Bank of England (BoE) Governor Andrew noted late Friday that inflation still remains a key sticking point for the UK's central bank, though many price pressures have eased faster than the BoE initially feared.
Key highlights
Market events like those of two weeks ago or so will happen; the test is not whether they happen but whether they trigger wider instability.
Second round inflation effects appear to be smaller than we expected.
Communicating when we decide to accommodate short-run shocks or trade-offs between inflation and activity is essential but difficult.
It is too early to declare victory on inflation.
I am cautiously optimistic that inflation expectations are better anchored.
Signs of disinflation are coming from China.
Less inflation persistence is not something we can take for granted.
The policy setting will need to remain restrictive for sufficiently long.
Inflation is not back at the target on a sustained basis.
We need to chart a steady course on monetary policy.
- GBP/USD jumps over 1% after Powell signals potential rate cuts, reaching its highest level in two years.
- Powell’s Jackson Hole speech emphasizes data-dependent rate adjustments, with confidence in inflation returning to 2%.
- US Dollar Index (DXY) drops 0.80% to 100.71, while the US 10-year Treasury yield falls to 3.81%, reflecting market expectations for a September rate cut.
The GBP/USD climbed sharply during the North American session after Federal Reserve Chair Jerome Powell gave the green light to cutting interest rates, as he’s confident that inflation is edging towards the central bank's 2% goal. The pair traded above 1.3200, at around new two-year highs, gaining over 1%.
GBP/USD hits new two-year highs above 1.3200
At his Jackson Hole speech, Jerome Powell said, “The time has come for policy to adjust,” adding that the size and timing of rate cuts would be data dependent. He said he’s confident that inflation “is on a sustainable path back to 2%,” though he mentioned that risks in employment had tilted to the upside.
Meanwhile, traders of Fed funds futures had priced in a 33% chance of the Fed cutting its interest rates by 50 basis points at the upcoming September meeting.
In response to Powell’s speech, traders dumped the Greenback, which, according to the US Dollar Index (DXY), has fallen 0.80% and exchanged hands at 100.71. At the same time, the US 10-year Treasury note yield dropped four basis points to 3.81%.
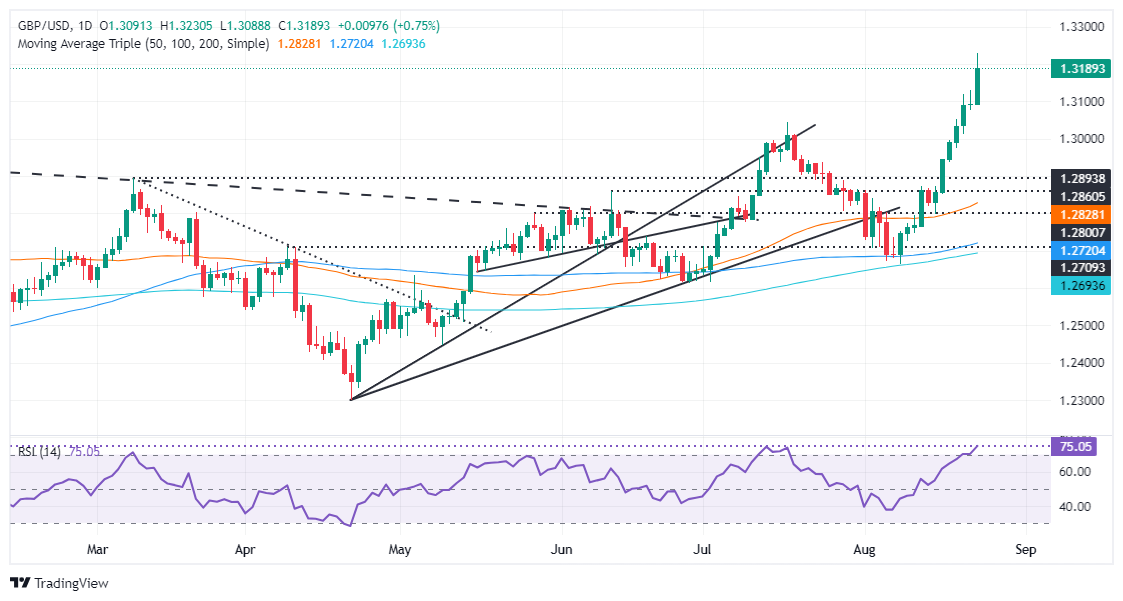
GBP/USD Price Forecast: Technical outlook
From a technical perspective, the GBP/USD uptrend remains intact, but if traders fail to sustain the exchange rate above 1.3200, this could exacerbate a pullback. Buyers remain in charge, according to the Relative Strength Index (RSI), which despite being at overbought conditions, due to the strength of the trend, has not hit the 80 level. Therefore, the path pof least resistance is tilted to the upside.
The GBP/USD first resistance would be 1.3200. A breach of the latter will expose the year-to-date (YTD) high at 1.3230, followed by 1.3250 and the 1.3300 mark.
In the event of a correction, the first support for GBP/USD is seen at 1.3100. Once surpassed, the next support would be the 1.3045 July 17 daily high, previous resistance turned support, ahead of 1.3000.
Pound Sterling FAQs
The Pound Sterling (GBP) is the oldest currency in the world (886 AD) and the official currency of the United Kingdom. It is the fourth most traded unit for foreign exchange (FX) in the world, accounting for 12% of all transactions, averaging $630 billion a day, according to 2022 data. Its key trading pairs are GBP/USD, aka ‘Cable’, which accounts for 11% of FX, GBP/JPY, or the ‘Dragon’ as it is known by traders (3%), and EUR/GBP (2%). The Pound Sterling is issued by the Bank of England (BoE).
The single most important factor influencing the value of the Pound Sterling is monetary policy decided by the Bank of England. The BoE bases its decisions on whether it has achieved its primary goal of “price stability” – a steady inflation rate of around 2%. Its primary tool for achieving this is the adjustment of interest rates. When inflation is too high, the BoE will try to rein it in by raising interest rates, making it more expensive for people and businesses to access credit. This is generally positive for GBP, as higher interest rates make the UK a more attractive place for global investors to park their money. When inflation falls too low it is a sign economic growth is slowing. In this scenario, the BoE will consider lowering interest rates to cheapen credit so businesses will borrow more to invest in growth-generating projects.
Data releases gauge the health of the economy and can impact the value of the Pound Sterling. Indicators such as GDP, Manufacturing and Services PMIs, and employment can all influence the direction of the GBP. A strong economy is good for Sterling. Not only does it attract more foreign investment but it may encourage the BoE to put up interest rates, which will directly strengthen GBP. Otherwise, if economic data is weak, the Pound Sterling is likely to fall.
Another significant data release for the Pound Sterling is the Trade Balance. This indicator measures the difference between what a country earns from its exports and what it spends on imports over a given period. If a country produces highly sought-after exports, its currency will benefit purely from the extra demand created from foreign buyers seeking to purchase these goods. Therefore, a positive net Trade Balance strengthens a currency and vice versa for a negative balance.
- EUR/GBP extended losses on Friday and the 0.8500 support is gone.
- Mixed technical indicators point towards a potential downtrend.
- The 0.83700 level remains a potential target for the bears as August gains are being cleared.
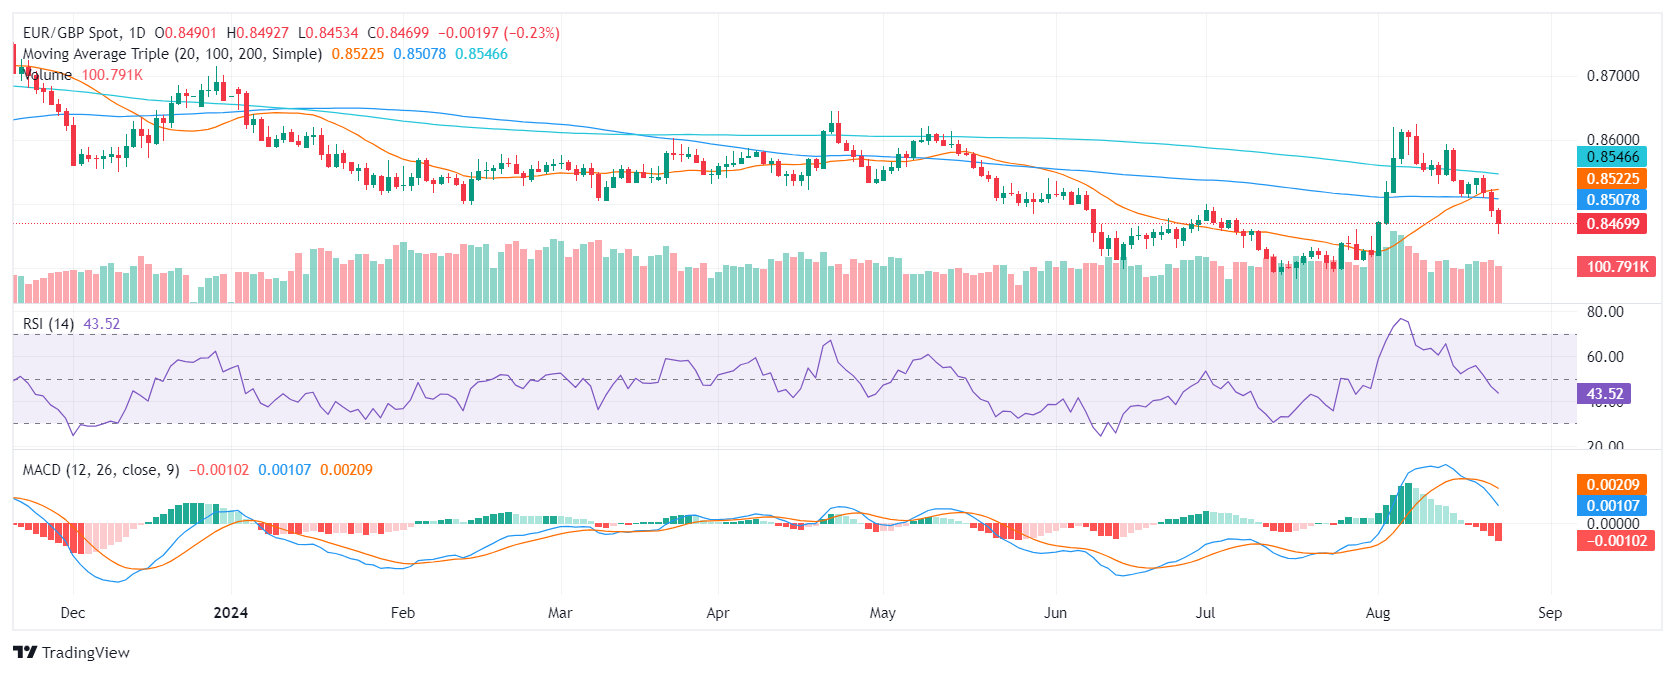
On Friday, the EUR/GBP pair is extending its losses from Friday, falling by 0.18% to trade at 0.8470. The pair lost further ground below the 0.8500 level and has cleared a great deal of August gains which had propelled the pair to a high above 0.8600.
The daily Relative Strength Index (RSI) has fallen to 44 suggesting that the momentum is turning in favor of the sellers. The Moving Average Convergence Divergence (MACD) is printing rising red bars, which shows that the bearish pressure is strengthening.
If the pair fails to hold the 0.8470 level, it could fall to 0.8370 (late July’s bottom) if the selling pressure remains strong. On the other hand, a recovery above 0.85000 could bring gains to 0.8550.
EUR/GBP daily chart
Global markets are pricing a fast return to normalization, a cutting cycle steep enough that it has few historical analogies outside of a recession, TDS Senior Commodity Strategist Daniel Ghali notes.
Markets price quick interest-rate cuts
“While there is an argument to be made that this is consistent with a period of disinflation from elevated levels, we see a low bar to challenge ‘this time is different’ pricing. At the same time, the set-up in Gold is such that a period of high deficits, slowing growth, sticky inflation fears, currency devaluation and an imminent cutting cycle has already attracted macro fund capital to the Yellow Metal's warm embrace.”
“Macro fund long positioning as a proportion of aggregate open interest is now beyond its 95th percentile, which has historically marked significant turning points for macro narratives as highlighted in our first chart of the day. This time around, the set-up also features 'max long' CTAs and Shanghai trader positioning at record highs.”
“Chinese ETF and broad commodity index outflows have already commenced, however. This begs the question: who will blink first?”
- Traders react by selling the Greenback, pushing EUR/USD to its highest level of the year at 1.1183.
- Fed Chair Powell signals readiness to adjust policy, opening the door for potential rate cuts, boosting the EUR/USD.
- US 10-year Treasury yield drops to 3.81% as market anticipates possible 50 basis point cut at the September Fed meeting.
The EUR/USD rallied sharply after hitting a daily low of 1.1105 after Federal Reserve Chairman Jerome Powell said, “The time has come for policy to adjust,” opening the door to ease policy. Therefore, the major jumped toward 1.1170 and posted gains of over 0.54%.
EUR/USD soared after Fed Chair Powell hints at rate cuts
In his speech at Jackson Hole, Powell stated that the size and timing of rate cuts would be data-dependent, adopting a stance like the European Central Bank (ECB). He added that he’s confident that inflation “is on a sustainable path back to 2%,” adding that those risks have diminished, contrary to increasing risks on employment.
Meanwhile, traders of Fed funds futures had priced in a 33% chance of the Fed cutting its interest rates by 50 basis points at the upcoming September meeting.
In response to Powell’s speech, traders ditched the Greenback, and the EUR/USD hit a new yearly high of 1.1183 before retreating to current exchange rates. At the same time, the US 10-year Treasury note yield dropped four basis points to 3.81%.
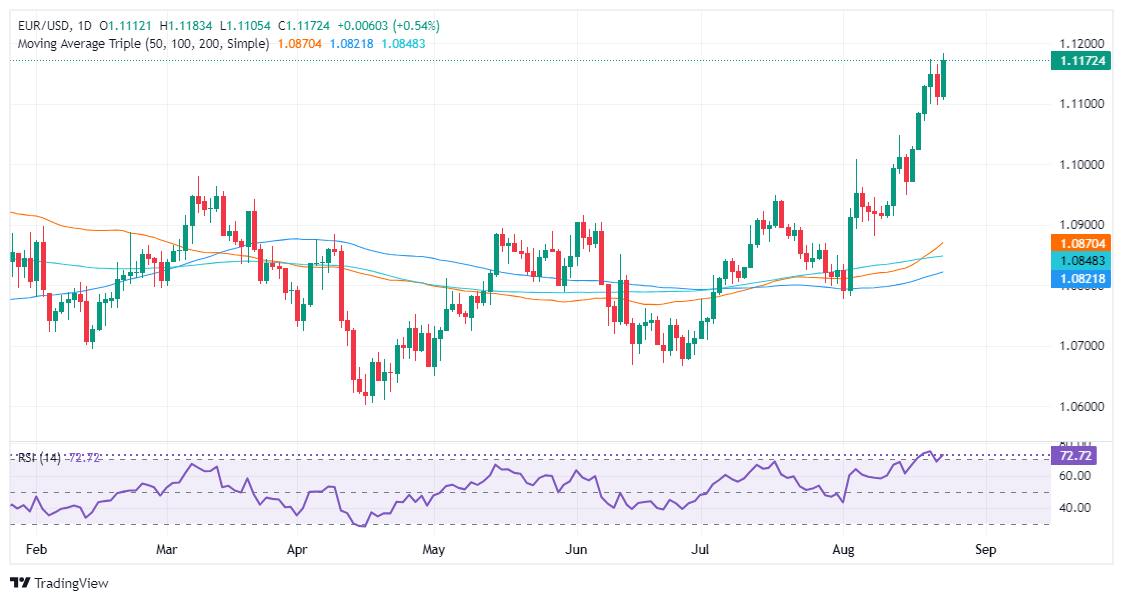
EUR/USD Price Forecast: Technical outlook
The daily chart hints that the EUR/USD could test the 1.1200 figure, which, once cleared, would expose the July 18, 2023, peak at 1.1275 ahead of testing 1.1300.
From a momentum standpoint, buyers are gathering steam, as depicted by the Relative Strength Index (RSI), clearing the 70 level. Due to the strength of the uptrend, the most extreme readings suggest that 80 would be considered overbought.
On the other hand, if EUR/USD fails to clear the 1.1200 mark, the pair could be subject to a pullback, which could pave the way for retesting 1.1100 before diving toward the August 14 high of 1.1047.
Euro FAQs
The Euro is the currency for the 20 European Union countries that belong to the Eurozone. It is the second most heavily traded currency in the world behind the US Dollar. In 2022, it accounted for 31% of all foreign exchange transactions, with an average daily turnover of over $2.2 trillion a day. EUR/USD is the most heavily traded currency pair in the world, accounting for an estimated 30% off all transactions, followed by EUR/JPY (4%), EUR/GBP (3%) and EUR/AUD (2%).
The European Central Bank (ECB) in Frankfurt, Germany, is the reserve bank for the Eurozone. The ECB sets interest rates and manages monetary policy. The ECB’s primary mandate is to maintain price stability, which means either controlling inflation or stimulating growth. Its primary tool is the raising or lowering of interest rates. Relatively high interest rates – or the expectation of higher rates – will usually benefit the Euro and vice versa. The ECB Governing Council makes monetary policy decisions at meetings held eight times a year. Decisions are made by heads of the Eurozone national banks and six permanent members, including the President of the ECB, Christine Lagarde.
Eurozone inflation data, measured by the Harmonized Index of Consumer Prices (HICP), is an important econometric for the Euro. If inflation rises more than expected, especially if above the ECB’s 2% target, it obliges the ECB to raise interest rates to bring it back under control. Relatively high interest rates compared to its counterparts will usually benefit the Euro, as it makes the region more attractive as a place for global investors to park their money.
Data releases gauge the health of the economy and can impact on the Euro. Indicators such as GDP, Manufacturing and Services PMIs, employment, and consumer sentiment surveys can all influence the direction of the single currency. A strong economy is good for the Euro. Not only does it attract more foreign investment but it may encourage the ECB to put up interest rates, which will directly strengthen the Euro. Otherwise, if economic data is weak, the Euro is likely to fall. Economic data for the four largest economies in the euro area (Germany, France, Italy and Spain) are especially significant, as they account for 75% of the Eurozone’s economy.
Another significant data release for the Euro is the Trade Balance. This indicator measures the difference between what a country earns from its exports and what it spends on imports over a given period. If a country produces highly sought after exports then its currency will gain in value purely from the extra demand created from foreign buyers seeking to purchase these goods. Therefore, a positive net Trade Balance strengthens a currency and vice versa for a negative balance.
After a period of short covering, CTAs are now set to add back their shorts in platinum markets in nearly every scenario for prices over the coming week.
Palladium is also prone to a sell-off
“In fact, only a big uptape would prevent CTA selling activity from being catalyzed, and our simulations of future prices even suggest that an uptape will lead to CTA selling activity. Algos could potentially add up to -35% of their max size in a big downtape. This set-up presents significant downside asymmetry for the coming week.”
“In Palladium markets, while current prices are consistent with some CTA buying activity this session, the window for an algo short-squeeze play is already coming to a close, with CTA selling activity now expected to resume even in a flat tape over the coming week. Upside asymmetries have already dissipated, and downside asymmetries are also emerging.”
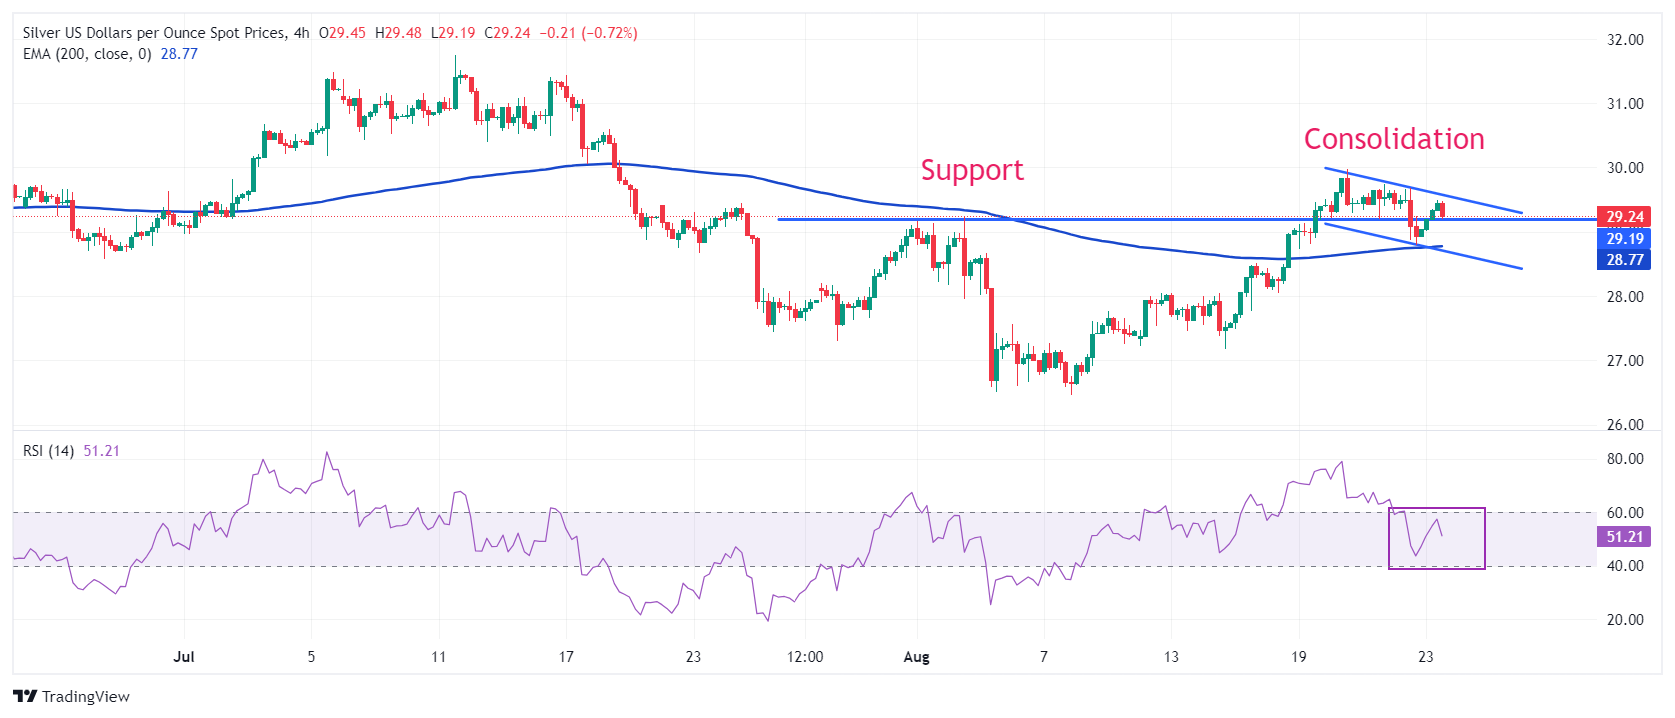
- Silver price gains to near $29.30 in the countdown to Fed Powell’s speech.
- Jerome Powell is expected to provide fresh cues on interest rates and the economic outlook.
- US bond yields remain under pressure on firm Fed rate cut prospects.
Silver price (XAG/USD) rises to near $29.30 in Friday’s North American session, with investors focusing on the Federal Reserve (Fed) Chair Jerome Powell’s speech at the Jackson Hole (JH) Symposium. The white metal gains as bond yields decline on expectations that Jerome Powell will deliver a dovish guidance on interest rates.
10-year US Treasury yields fall to near 3.84%. Lower yields on interest-bearing assets bode poorly for non-yielding assets, such as Silver, given that they reduce the opportunity cost of holding an investment in them.
The US Dollar Index (DXY), which tracks the Greenback’s value against six major currencies, recovers its intraday losses and rebounds to near 101.50.
Market participants are optimistic about Powell’s dovish guidance but they want more clarity on the likely size of interest rate cuts in September. According to the CME FedWatch tool, 30-day Federal Funds Futures pricing data shows that the probability of 50 basis points (bps) interest-rate cut in September is 28.5%. While rest is favoring a 25-bps interest rate reduction.
Investors will also focus on Powell’s speech to know about whether chances of ‘soft landing’ are intact. Market experts started anticipating a potential United States (US) recession after the Nonfarm Payrolls (NFP) report for July indicated a sharp slowdown in the labor demand and an increase in the Unemployment Rate to 4.3%, the highest level seen since November 2021.
Silver technical analysis
Silver price turns sideways after a decisive break above August 2 high of $29.20, which faltered the lower high lower low formation on a four-hour timeframe. The 200-period Exponential Moving Average (EMA) near $28.77 acts as cushion for Silver price bulls.
The 14-period Relative Strength Index (RSI) falls to near 60.00, suggesting that the bullish momentum has concluded for now. However, the bullish bias remains intact.
Silver four-hour chart
Silver FAQs
Silver is a precious metal highly traded among investors. It has been historically used as a store of value and a medium of exchange. Although less popular than Gold, traders may turn to Silver to diversify their investment portfolio, for its intrinsic value or as a potential hedge during high-inflation periods. Investors can buy physical Silver, in coins or in bars, or trade it through vehicles such as Exchange Traded Funds, which track its price on international markets.
Silver prices can move due to a wide range of factors. Geopolitical instability or fears of a deep recession can make Silver price escalate due to its safe-haven status, although to a lesser extent than Gold's. As a yieldless asset, Silver tends to rise with lower interest rates. Its moves also depend on how the US Dollar (USD) behaves as the asset is priced in dollars (XAG/USD). A strong Dollar tends to keep the price of Silver at bay, whereas a weaker Dollar is likely to propel prices up. Other factors such as investment demand, mining supply – Silver is much more abundant than Gold – and recycling rates can also affect prices.
Silver is widely used in industry, particularly in sectors such as electronics or solar energy, as it has one of the highest electric conductivity of all metals – more than Copper and Gold. A surge in demand can increase prices, while a decline tends to lower them. Dynamics in the US, Chinese and Indian economies can also contribute to price swings: for the US and particularly China, their big industrial sectors use Silver in various processes; in India, consumers’ demand for the precious metal for jewellery also plays a key role in setting prices.
Silver prices tend to follow Gold's moves. When Gold prices rise, Silver typically follows suit, as their status as safe-haven assets is similar. The Gold/Silver ratio, which shows the number of ounces of Silver needed to equal the value of one ounce of Gold, may help to determine the relative valuation between both metals. Some investors may consider a high ratio as an indicator that Silver is undervalued, or Gold is overvalued. On the contrary, a low ratio might suggest that Gold is undervalued relative to Silver.
The Pound Sterling (GBP) retains a firm tone as spot continues to ride the positive sentiment which developed around yesterday’s constructive PMI data, Scotiabank’s Chief FX Strategist Shaun Osborne notes.
Few signs of weakness in the GBP’s technical picture
“Improving growth momentum, wages and slow progress on services CPI suggest that Bailey’s comments should support the cautious outlook for UK rates in the next few months (markets are not expecting another reduction in the Bank’s target rate until November).”
“There are few signs of weakness in the GBP’s technical picture. The bull run from the early August low has extended more or less as expected and nudged higher to a fraction under 1.3140 earlier, an effective retest of the July 2023 high.”
“Intraday trend support is close at 1.3110 and losses through here may signal some modest, corrective losses but minor dips to the mid/upper 1.30s should find support.”
EUR/USD is consolidating, trading essentially flat on the day as markets await the Powell comments, Scotiabank’s Chief FX Strategist Shaun Osborne notes.
The market consolidates this week’s gains through 1.11
“ECB Governor Kazaks commented on Thursday that he was ‘very much’ open to a rate cut in September but there was a debate about the size and pace of easing moving forward. Governor Vujcic said earlier today that “gradual” rate cuts were possible if the inflation outlook holds. ECB inflation expectations came in a tenth higher than forecast at to 2.8% and 2.4% for the 1Y and 3Y measures respectively.”
“There may be some tentative signs of softness creeping into EURUSD price action as the market consolidates this week’s gains through 1.11. The broader trend higher in the EUR remains strong but short-term oscillators are looking very stretched, which may signal potential for some further consolidation.”
“Intraday price trends suggest weakness back under 1.1095/00 may prompt more corrective, short-term EUR losses towards the low 1.10s.”
The US Dollar (USD) is likely to edge lower; given the mild downward pressure, any decline is unlikely to reach July’s low of 7.0636, UOB Group FX strategists Quek Ser Leang and Peter Chia note.
The near term target is 7.0636
24-HOUR VIEW: “We expected USD to trade in a range between 7.1150 and 7.1450 yesterday. However, USD traded in a range of 7.1259/7.1485, closing at 7.1460 (+0.19%). The slight increase in momentum could lead to USD edging higher today, but any advance is likely limited to a test of 7.1550. Support levels are at 7.1370 and 7.1280.”
1-3 WEEKS VIEW: “Our update from yesterday (22 Aug, spot at 7.1300) remains valid. As highlighted, 'the recent price action has resulted in an increase in downward momentum, albeit not much.' As long as USD remains below 7.1750, it is likely to edge lower in the coming days. Given the mild downward pressure, any decline is unlikely to reach July’s low of 7.0636.”
- USD/CAD dips to near 1.3580 amid multiple headwinds.
- Canadian Retail Sales fell by 0.3% in June, as expected, amid weak demand for automobiles.
- Investors await Fed Powell’s speech at the Jackson Hole Symposium.
The USD/CAD pair slides further to near 1.3580 in Friday’s New York session. The Loonie asset weakens after Statistics Canada reported that monthly Retail Sales data for June came in better than projected.
Monthly Retail Sales contracted consecutively by 0.3%, as expected, due to poor demand for automobiles. While Retail Sales, excluding automobiles, unexpectedly rose by 0.3%. Economists estimated the data to decline by 0.2%. This suggests that households postponed their demand for big-ticket items to avoid higher interest obligations. This would prompt expectations of more interest rate cuts by the Bank of Canada (BoC).
Meanwhile, the market sentiment remains favorable for risky assets. S&P 500 futures have posted significant gains in the early American session. The US Dollar Index (DXY), which tracks the Greenback’s value against six major currencies, edges lower to near 101.40.
Going forward, the major trigger for the Loonie asset will be the Federal Reserve (Fed) Chair Jerome Powell’s speech at the Jackson Hole (JH) Symposium at 14:00 GMT. Fed Powell is expected to provide guidance on interest rates and the United States (US) economic outlook.
Market experts expect that Jerome Powell will refrain from providing a specific rate-cut path. However, he is expected to show comfort to market expectations of the Fed pivoting to policy-normalization in September. Investors would like for cues about the likely size of interest rate cuts next month.
Economic Indicator
Retail Sales ex Autos (MoM)
The Retail Sales ex Auto data, released by Statistics Canada on a monthly basis, measures the total value of goods sold by retailers in Canada excluding the key sector of motor vehicles and parts. Changes in Retail Sales are widely followed as an indicator of consumer spending. Percent changes reflect the rate of changes in such sales, with the MoM reading comparing sales values in the reference month with the previous month. Generally, a high reading is seen as bullish for the Canadian Dollar (CAD), while a low reading is seen as bearish.
Read more.Last release: Fri Aug 23, 2024 12:30
Frequency: Monthly
Actual: 0.3%
Consensus: -0.2%
Previous: -1.3%
Source: Statistics Canada
- AUD/USD is correcting within its short-term uptrend.
- The pair broke below a key trendline but has recovered over recent periods.
AUD/USD corrects back after becoming overbought.
The pair pulls back below the trendline for its short-term uptrend during August – a bearish sign – however, it has also tracked higher over recent periods after posting a swing low at 0.6697 on August 22.
AUD/USD 4-hour Chart
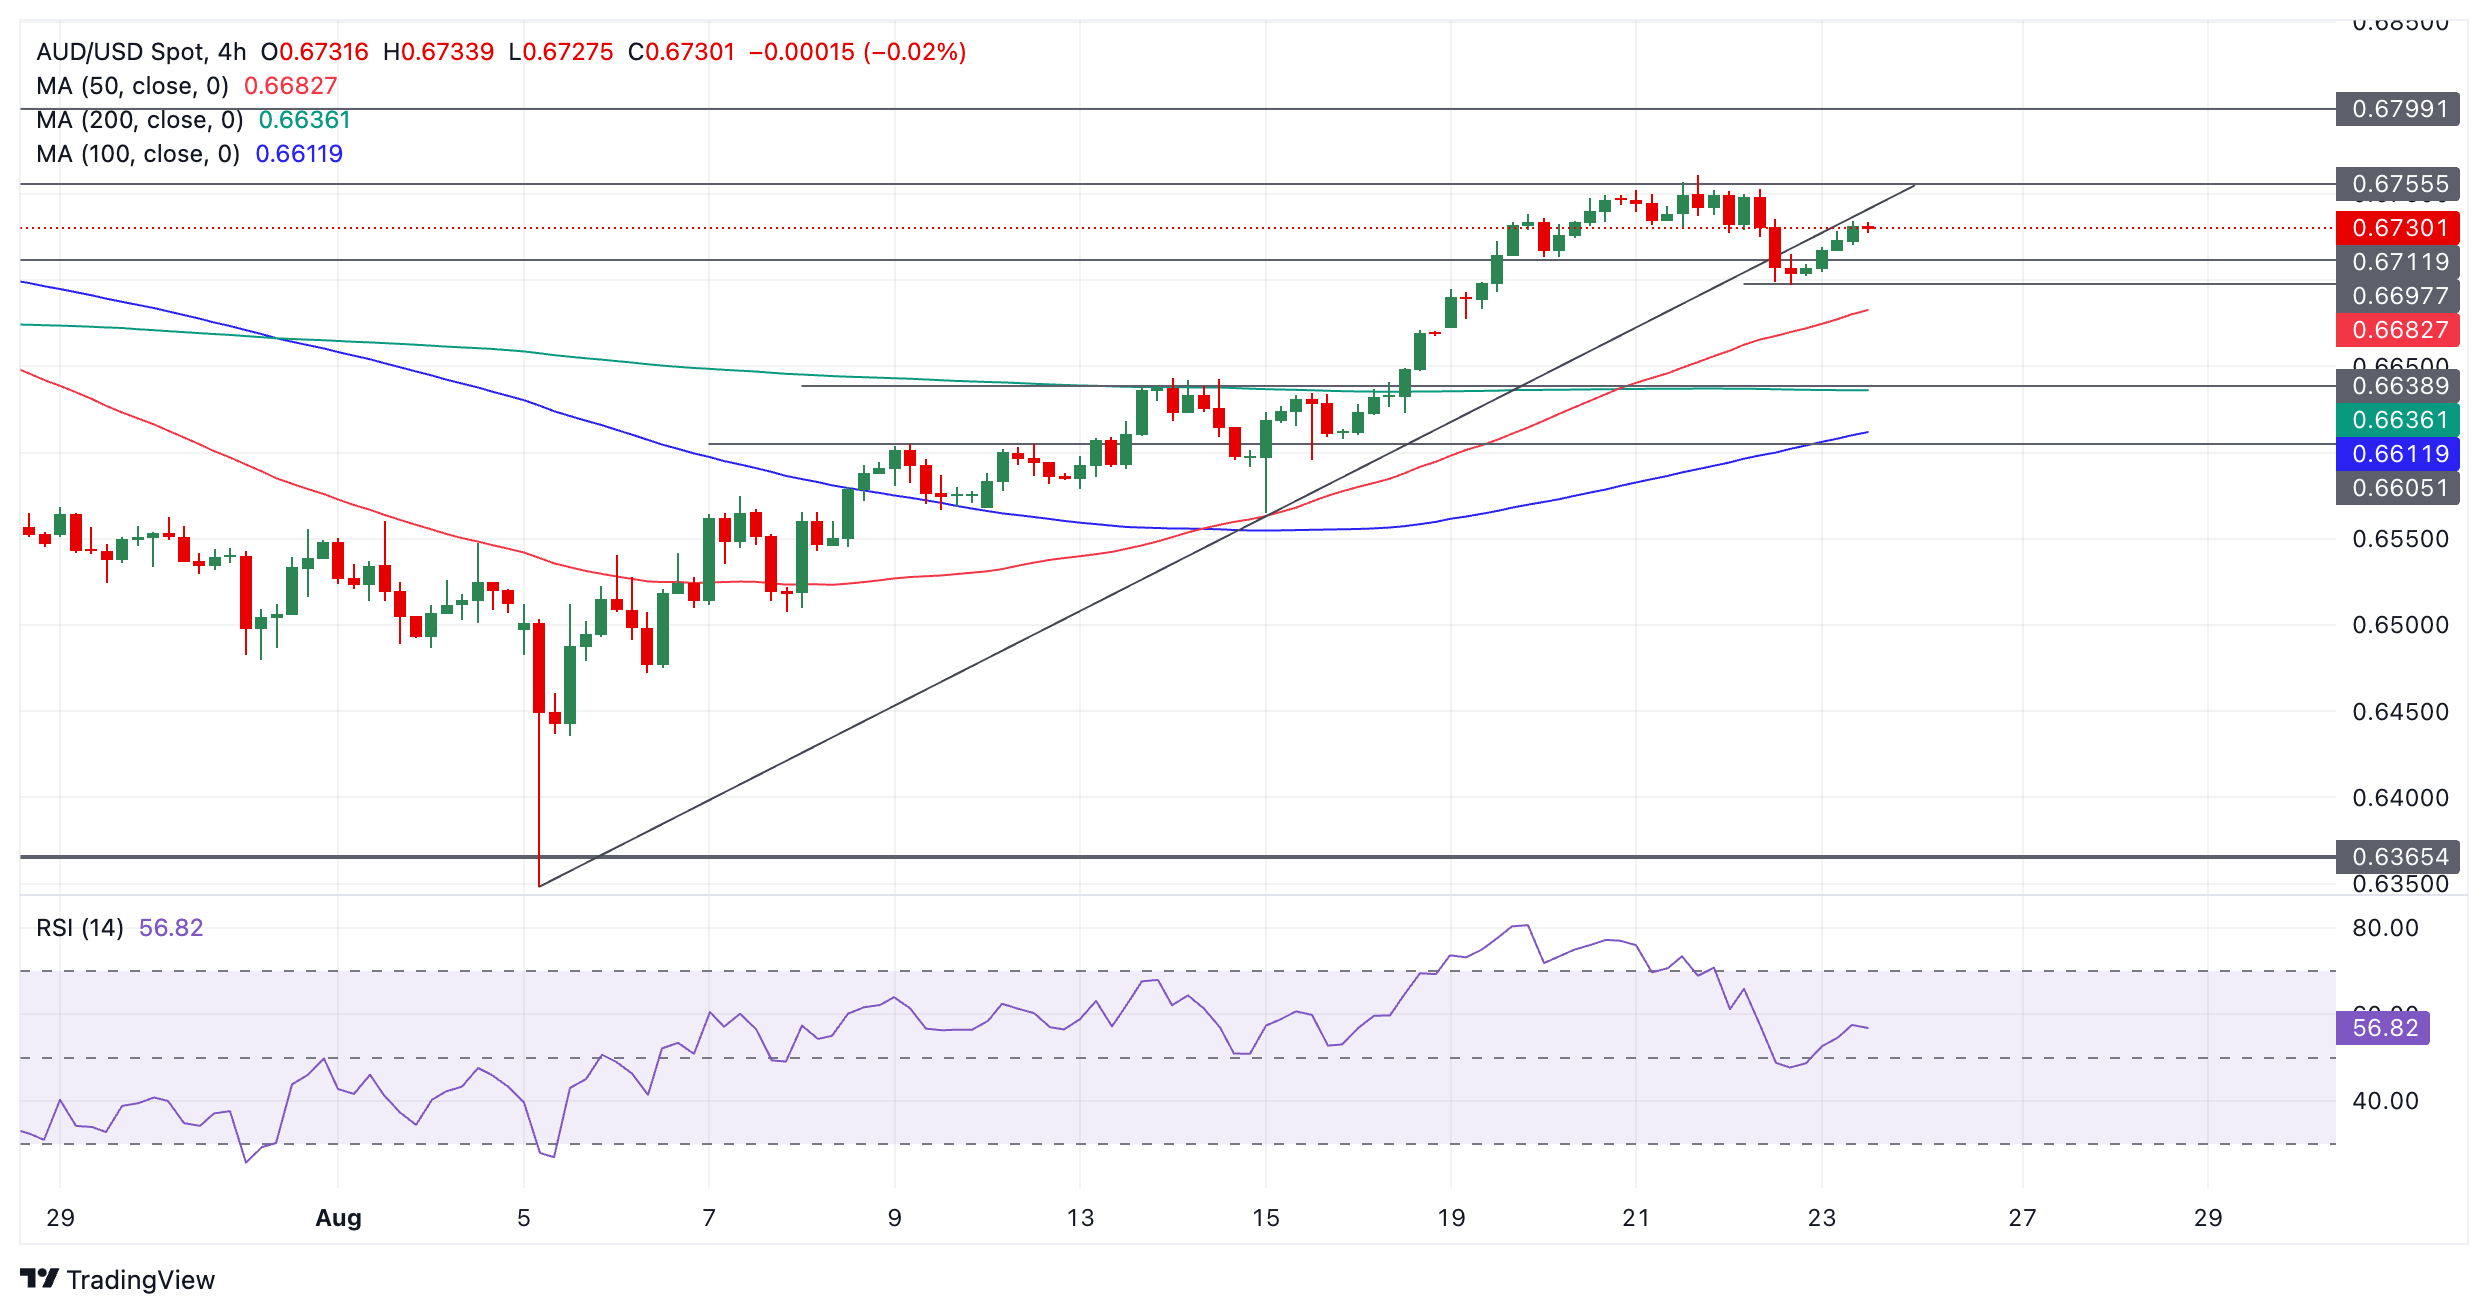
AUD/USD is still probably in a short-term uptrend which given “the trend is your friend” favors more upside. The pair might continue up to 0.6799, the July 11 high. A break back above the August high of 0.6761 would help confirm further upside.
A break below the 0.6697 (swing low and low of August 22), however, would indicate the correction had still further to fall, perhaps to a downside target at either the 50-period Simple Moving Average (SMA) at 0.6683 or the 200 SMA at 0.6636.
Atlanta Federal Reserve President Raphael Bostic said on Friday that they are going to have to think hard about what's happening in labor markets, per Reuters.
Key takeaways
"We want a calm, orderly return to normalization."
"We are close to being ready to cut rates."
"Our policy has had its effect and we can start pathway back to normal policy posture."
"We can't wait until inflation is back down to 2% to alter policy rate."
"Labor market is a sign that we are getting back to much more normalized place."
"Number on inflation over last couple of months have made me more confident it's returning to 2%."
"We still have a ways to go on inflation though, don't assume we are done."
"You can't ignore the data, takes us closer to moving."
"I just want to make sure next couple of data points are consistent with that."
"Jobs revision figures didn't change that much for me."
Market reaction
The US Dollar Index showed no reaction to these remarks and was last seen trading modestly lower on the day at 101.45.
Bank of England (BoE) Governor Andrew Bailey speaks today in Jackson Hole (1600) and we think he may emulate Powell’s approach in saying as little as possible. Bailey does not have to deal with aggressively dovish pricing (-39bp by year-end), but the UK still needs to gain much more confidence on the inflation front, ING’s FX strategist Francesco Pesole notes.
A rebound to 0.8550-0.8600 remains highly likely
“August has not really seen many remarks from BoE policymakers: the latest ones were from a hawk, Catherine Mann, who once again emphasised the risks of structural wage-price inflation. Before then, it was Chief Economist Huw Pill who spoke on 2 August and said the BoE shouldn’t be promising rate cuts in the very short term.”
“There is a good chance Bailey’s speech will be a non-event for sterling. EUR/GBP has returned below 0.8500 on the back of eurozone-UK growth differentials, but we remain wary of chasing the pair lower given the rate-spread picture. A rebound to 0.8550-0.8600 remains our call for the coming weeks.”
- GBP/JPY makes gains after a run of positive data out of the UK, including strong PMIs.
- Upside is limited by the strength of the Yen after comments from BoJ governor Ueda.
- Japanese inflation data raises concerns inflation could be easing making it more difficult for BoJ to normalize policy.
GBP/JPY is exchanging hands in the 191.60s on Friday, marginally up on the day – its third day of gains in a row so far. The pair benefits from a stronger Pound Sterling (GBP) which has risen after the release of survey data pointed to a pick up in business activity in August.
According to a survey gauging purchasing managers in major sectors – the preliminary UK S&P Global/CIPS Composite Purchasing Manager Index (PMI) – responses were positive, clocking a rise to 53.4 in August from 52.8 in July, and beating economists’ expectations of 52.9, data showed on Thursday.
The S&P Global/CIPS Manufacturing PMI rose to 52.5 from 52.1, beating expectations it would remain unchanged. The UK Services PMI increased to 53.3 from 52.5 when a rise to 52.8 had been estimated.
The data gave GBP a lift in all its pairs and compared favorably to the more mixed picture in other major economies.
It built on the recent positive UK Retail Sales data which showed a return to growth in sales in July after a decline in June.
Not all the data out of the UK has been positive of late: government borrowing was higher than estimated in July, although how this impacts the financial markets depends partly on the government’s response over time. Consumer Confidence missed estimates in August and Factory Orders came out mixed.
Overall market expectations continue to price in a 0.25% cut by the Bank of England (BoE) before the end of 2024, with some analysts predicting a total of 0.50% of cuts (in two tranches) prior to year end. The expectation of lower interest rates are negative for a currency because they reduce foreign capital inflows, so if markets maintain their current narrative GBP is likely to remain capped.
The Japanese Yen (JPY), meanwhile, did gain some support on Friday after the Governor of the Bank of Japan (BoJ) Kazuo Ueda testified in parliament. Ueda reiterated that the BoJ “will raise interest rates further if the economy and prices move in line with our projections.” His suggestion that interest rates could rise, strengthening the Yen.
According to Brown Brothers Harriman, swaps markets “imply a 36% probability of a 25 bps BoJ rate hike by December” following Ueda’s speech.
However, markets are skeptical about the extent to which Japanese inflation will continue rising, leaving the BoJ unable to raise interest rates.
Recent data for July, for example, showed the Japanese Consumer Price Index (CPI) excluding fresh food and energy eased from 2.2% YoY in June to 1.9% in July, bringing it below the BoJ’s 2.0% target for the first time since 2022. One reason for the decline was a sharp fall in processed food inflation, whereas “other industrial products” inflation kept just above 2.0%.
Headline CPI held at 2.8% the same as June and CPI ex fresh food rose to 2.7% from 2.6% in line with economists estimates. However, these two metricsremained elevated more because of the phasing out of energy subsidies from the Japanese government, rather than increased demand – and subsidies are due to be reinstated in September.
“Headline inflation held steady at 2.8% in July, while inflation excluding fresh food edged up from 2.6% to 2.7%, in line with the analyst consensus. However, the main reason for that persistent strength was a further sharp rise in energy inflation, from 7.7% to 12.0%, which boosted headline inflation by 0.3%-pts. The surge in energy inflation largely reflects the temporary phasing out of the government’s energy subsidies, but those subsidies will be reinstated from September so energy inflation will fall again before long,” says Marcel Thieliant, Head of Asia-Pacific at Capital Economics.
Moreover, services inflation remains weak in Japan despite claims by the government that wages are rising. The CPI data showed services inflation falling to 1.4% in July from 1.7% previously.
Nevertheless despite the decline in CPI ex fresh food and energy to below the BoJ’s target, the BoJ forecast such a decline itself, and Governor Ueda did caveat his testimony that the bank would only raise interest rates if the data came out in line with its projections.
“All told, the July inflation figures clearly diminish the case for further tightening. That said, the Bank has already factored in a further slowdown in underlying inflation in its forecasts. Bank of Japan Board members’ median forecast for inflation excluding fresh food and energy for the fiscal year that ends in March 2025 is 1.9%. Given that this inflation gauge has averaged 2.2% in the first four months of the fiscal year, it will need to fall below 2% soon to meet that forecast,” adds Thieliant.
The Australian Dollar (AUD) could continue to advance, possibly to last month’s high, near 0.6800, UOB Group FX strategists Quek Ser Leang and Peter Chia note.
0.6800 is the next level to watch
24-HOUR VIEW: “We expected AUD to trade in a 0.6720/0.6765 range. Our view was incorrect, as it dropped to a low of 0.6697, closing lower by 0.58% (0.6705). There has been a slight increase in downward momentum, but probably not enough to threaten the strong support at 0.6660. Resistance is at 0.6725; a breach of 0.6750 would mean that the current mild downward pressure has faded.”
1-3 WEEKS VIEW: “Yesterday (22 Aug, spot at 0.6750), we indicated that ‘while upward momentum has slowed somewhat, it is too early to call for an end to the advance in AUD.’ We added, ‘provided that the ‘strong support’ level at 0.6660 is not taken out, AUD could continue to advance, possibly to last month’s high, near 0.6800.’ There is no change in our view.”
The Canadian Dollar (CAD) retains a firm undertone but is struggling to extend gains beyond the upper 1.35 zone, Scotiabank’s Chief FX Strategist Shaun Osborne notes.
USD decline has room to run
“Our fair value estimate has edged a little higher to 1.3631 today, underscoring the limited pathways—right now—to additional CAD gains. The Canadian government intervened yesterday to impose binding arbitration on Canada’s railways and unions to halt the lockout across Canada’s freight network, removing the risk of significant damage to vital supply chains and the economy.”
“That potential CAD negative has been removed, at least. Canadian Retail Sales are forecast to drop 0.3% in the month, in line with preliminary estimates released with the weak May data. The bear trend in USD/CAD remains well-entrenched on the charts. Short-term price trends suggest a minor pause in the USD decline but there are no signs of a pending reversal.”
“Intraday oscillators are looking somewhat extended but the daily DMI oscillator suggests the USD decline has room to run. Intraday resistance is 1.3625/35, with stronger resistance at 1.3675/00. Support is 1.3550/60.”
With the exception of Hungarian labour market data, the calendar is empty for Friday in the region. Even so, the focus shifts to the global story and news from Jackson Hole, ING’s FX strategist Frantisek Taborsky notes.
CEE is outperforming the emerging market space
“Thursday's EUR/USD reversal already visibly hurt CEE currencies. However, local rates still kept pace with rising core rates and with weak summer liquidity, the market remained almost unchanged. For today and Monday, we see a rather bearish outlook for the CEE region given the market's caution on Fed cuts and switching into risk-off mode.”
“Still, CEE is outperforming the emerging market space, and given the rather dovish market expectations in the region and higher EUR/USD, CEE currencies should be supported and maintain at least current levels, with more gains later.”
“The main focus should be on EUR/HUF, which usually sets the tone for the National Bank of Hungary meeting, scheduled for Tuesday next week. Although we do not expect a rate cut this time despite the low EUR/HUF levels, the main question is still whether the next meeting in September is live.”
The New Zealand Dollar (NZD) is expected to trade in a sideways range of 0.6120/0.6160. On the weekly chart, overbought advance doesn’t appear to be losing steam yet; NZD could potentially reach June’s high of 0.6223, UOB Group FX strategists Quek Ser Leang and Peter Chia note.
The 0.6223 level is the potential target
24-HOUR VIEW: “We noted yesterday that ‘the price action is likely part of a sideways trading phase,’ and we expected NZD to trade between 0.6135 and 0.6180. NZD then traded in a range of 0.6129/0.6169, closing at 0.6141 (-0.24%). The price action still seems to be part of a sideways trading phase. Today, NZD is expected to trade in a range of 0.6120/0.6160.
1-3 WEEKS VIEW: “Our update from yesterday (22 Aug, spot at 0.6160) remains valid. As highlighted, the current overbought advance doesn’t seem to be losing steam yet. NZD could potentially rise further and reach June’s high of 0.6223. However, to keep the momentum going, NZD must not break below 0.6090 (no change in ‘strong support’ level from yesterday).”
The US Dollar (USD) is under pressure, but it does not appear to have sufficient momentum to threaten 141.66, the low registered early this month, UOB Group FX strategists Quek Ser Leang and Peter Chia note.
USD has a small chance to fall towards 141.66 near term
24-HOUR VIEW: “Two days ago, USD traded between 144.44 and 146.59, closing largely unchanged at 145.26 (+0.01%). Yesterday, we indicated that we ‘are not able to glean much out of the price action,’ and we expected USD to trade in a range between 144.40 and 146.50. USD subsequently traded in a 144.84/146.52 range, closing on a firm note at 146.26 (+0.69%). The price movements have resulted in a slight increase in upward momentum. Today, we expect USD to edge higher, but advance is unlikely to break above 147.10. Support levels are at 145.80 and 145.25.”
1-3 WEEKS VIEW: “We continue to hold the same view as yesterday (22 Aug, spot at 145.25). As highlighted, while USD is under pressure, it does appear to have sufficient momentum to threaten 141.66, the low registered early this month. Note that there is another support level at 144.00. On the upside, should USD break above 148.00, it would indicate that the current downward pressure has faded.”
- Oil pops above $73.00, but the price outlook remains clouded as an Oil surplus for 2025 looks inevitable.
- Morgan Stanley cuts its Brent Oil price forecast by $5 to $80 per barrel for the end of 2024.
- The US Dollar Index hovers around 101.00 ahead of Fed Chairman Powell's speech.
Oil prices are rebounding slightly on Friday, extending Thursday’s gains after snapping the losing streak for this week. The rebound, however, could be short-lived as the price outlook remains clouded by concerns over demand and a vast supply surplus at hand if OPEC does not alter the upcoming unwinding of production cuts. OPEC is caught between a rock and a hard place, because sticking to their earlier commitments makes the cartel creditworthy, while coming back on previous statements would make markets less compelled to listen to any further communication from OPEC, and therefore losing grip on Oil pricing.
The US Dollar Index (DXY), which tracks the performance of the US Dollar against six major currencies, is facing a moment of truth. The annual Jackson Hole Symposium gets underway with the main event being a speech by US Federal Reserve Chairman Jerome Powell. The speech has a lot of weight as it is seen as a market-moving and policy-changing event, outside of the scheduled Fed policy meetings.
At the time of writing, Crude Oil (WTI) trades at $73.64 and Brent Crude at $77.36.
Oil news and market movers: September meeting OPEC pivotal
- Bloomberg Analytics reports that the Oil market has little room to process additional OPEC barrels that will be released onto markets once the production cuts have been lifted.
- Morgan Stanley issued a report this Friday trimming its forecast to $80 per barrel for Brent Crude, down $5 previously expected. Global demand growth is set to diminish as well from 1.1 million barrels per day from 1.2 million barrels due to sluggish Chinese demand.
- Near 17:00 GMT, the Baker Hughes Oil rig count is to be released. The previous count came in at 483, with no forecast available.
- US Federal Reserve Chairman Jerome Powell is set to speak at 14:00 GMT. His speech will be released at that time while he will be taking the stage.
Oil Technical Analysis: Oil advances while DXY lags
Oil not only snaps this week’s losing streak, it also breaks up its correlation with the US Dollar Index (DXY) that markets have seen in the past few days. While the DXY is rather sideways to lower for this Friday, Crude price is popping higher by 1%. This renewed enthusiasm among Oil traders should be taken with a pinch of salt considering the medium-term outlook, but at least it is helping Oil to avoid a decline below $70.00 for now.
On the upside, it becomes very difficult to be bullish with a lot of resistance levels nearby. The first element to look out for is the pivotal $75.27. Next up is the double level at $77.65, which aligns with both a descending trendline and the 200-day Simple Moving Average (SMA). In case bulls are able to break above it, the 100-day SMA at $78.45 could trigger a rejection.
On the downside, the low from August 5 at $71.17 is working its magic as it was able to eke out this bounce that now enters its second day of existence. Under $70.00, the $68.00 big figure is the first level to watch followed by $67.11, which is the lowest point from the triple bottom seen back in June 2023.
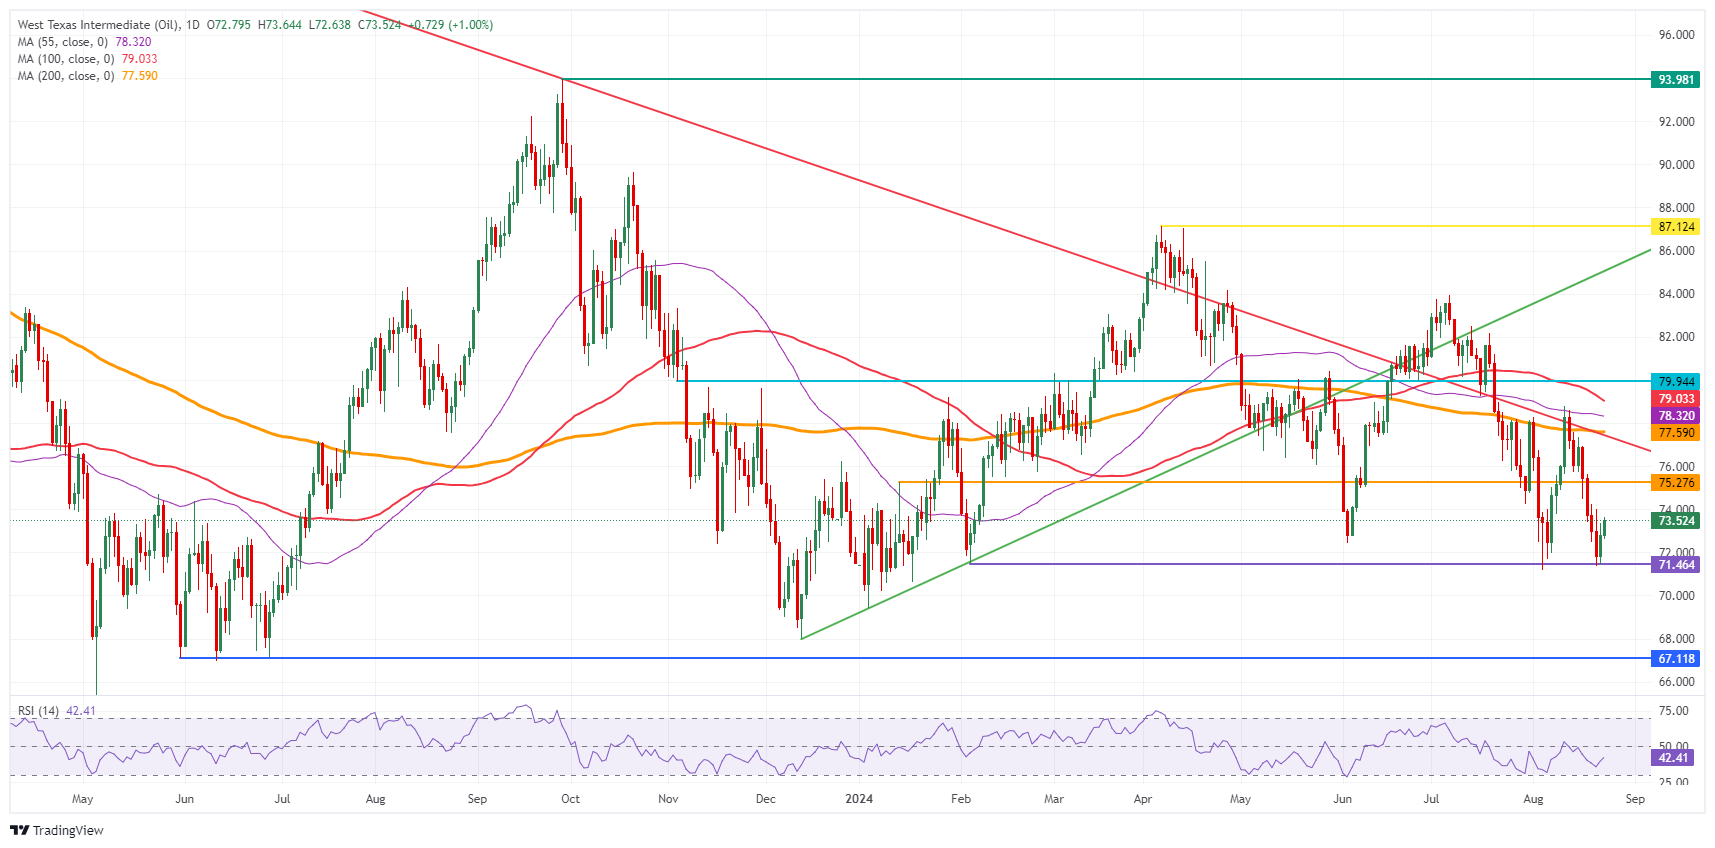
US WTI Crude Oil: Daily Chart
WTI Oil FAQs
WTI Oil is a type of Crude Oil sold on international markets. The WTI stands for West Texas Intermediate, one of three major types including Brent and Dubai Crude. WTI is also referred to as “light” and “sweet” because of its relatively low gravity and sulfur content respectively. It is considered a high quality Oil that is easily refined. It is sourced in the United States and distributed via the Cushing hub, which is considered “The Pipeline Crossroads of the World”. It is a benchmark for the Oil market and WTI price is frequently quoted in the media.
Like all assets, supply and demand are the key drivers of WTI Oil price. As such, global growth can be a driver of increased demand and vice versa for weak global growth. Political instability, wars, and sanctions can disrupt supply and impact prices. The decisions of OPEC, a group of major Oil-producing countries, is another key driver of price. The value of the US Dollar influences the price of WTI Crude Oil, since Oil is predominantly traded in US Dollars, thus a weaker US Dollar can make Oil more affordable and vice versa.
The weekly Oil inventory reports published by the American Petroleum Institute (API) and the Energy Information Agency (EIA) impact the price of WTI Oil. Changes in inventories reflect fluctuating supply and demand. If the data shows a drop in inventories it can indicate increased demand, pushing up Oil price. Higher inventories can reflect increased supply, pushing down prices. API’s report is published every Tuesday and EIA’s the day after. Their results are usually similar, falling within 1% of each other 75% of the time. The EIA data is considered more reliable, since it is a government agency.
OPEC (Organization of the Petroleum Exporting Countries) is a group of 13 Oil-producing nations who collectively decide production quotas for member countries at twice-yearly meetings. Their decisions often impact WTI Oil prices. When OPEC decides to lower quotas, it can tighten supply, pushing up Oil prices. When OPEC increases production, it has the opposite effect. OPEC+ refers to an expanded group that includes ten extra non-OPEC members, the most notable of which is Russia.
French CPI surprised yesterday, but the global investor community quickly agreed this was down to a short-term boost to services from the Olympic games, which translated into a likely spurious boost in the eurozone-wide surveys. The news from Germany was instead quite grim, as both manufacturing and services slowed more than expected and the composite index fell further into contraction to 48.5, ING’s FX strategist Francesco Pesole notes.
EUR/USD to break below 1.1100 short term
“We have repeatedly highlighted how that does not matter hugely for the euro as long as inflation and wages prevent large cuts from the ECB. The Bank’s own measure of negotiated wages slowed from 4.7% to 3.6% in 2Q, but swap rates and the euro did not really react to the release as German wage data released earlier this week painted a much more worrying picture, and there is a strong suspicion the decline in eurozone negotiated wages might be due to one-off factors.”
“Incidentally, the PMI report showed German output charge inflation was the highest since February. Markets remain comfortable with pricing slightly less than one cut per ECB meeting by year-end (69bp in total), and things may not change until the next batch of key data releases move the needle again.”
“EUR/USD has room to climb in the coming weeks, but investors may use an unexciting Powell speech today to lock in some profit and have the pair re-test the robustness of the 1.1100 support. The ECB CPI expectations report this morning is expected to show a marginal decline from 2.8% to 2.8% in the one-year gauge, and may not move the market significantly.”
While the FOMC members ultimately voted to stay on pause for the 8 th consecutive time in July, the minutes of the July FOMC indicated that participants viewed the incoming data as enhancing their confidence that inflation was moving toward the Committee's objective, UOB Group Senior Economist Alvin Liew notes.
Fed puts September rate cut into serious consideration
“The key takeaway from the US Federal Reserve’s (Fed) minutes of its 30/31 July 2024 Federal Open Market Committee (FOMC) meeting was that, while several participants thought it was plausible to cut rate in July, all participants ultimately agreed to hold rates. Importantly, the minutes noted that the “vast majority” thought it will be appropriate to cut rates in the September meeting.”
“The minutes indicated that the risks to inflation and unemployment are in better balance, while some see labor market at risk of more severe deterioration. Almost all the FOMC participants expect the progress of US disinflation to continue. Separately, BLS released the annual payrolls benchmark revision which lowered the jobs gain by 818,000 between Apr 2023 and Mar 2024, the largest revision since 2009. However, if we take other key data into consideration, the current situation is starkly different from (better than) 2009 despite the similar sized revisions.”
“After keeping the FFTR steady at 5.25-5.50% in the Julyy FOMC, we continue to hold the view the Fed will subsequently start to ease monetary policy in late 3Q, where we factor in 50 bps of rate cuts for the remainder of 2024. We still refrain from calling for a bigger 50-bps cut in September as the overall economic and labor market data still points to a soft US landing and aggressive easing is unnecessary at this juncture.”
- EUR/GBP has fallen to a cluster of support at the level of the lower trendline of its falling channel.
- There is a good chance the pair could find its feet and recover from this key technical level.
EUR/GBP continues descending within a falling channel, clearly visible on the 4-hour chart below.
The declining sequence of peaks and troughs supposes the pair is in a short-term downtrend, and given “the trend is your friend” this biases prices to further weakness.
However, even strongly trending prices experience pull backs from time to time, and EUR/GBP has reached the lower channel line of the channel where previously it found support and began counter-trend reactions back up inside the channel. There is a chance the same may happen again.
EUR/GBP 4-hour Chart
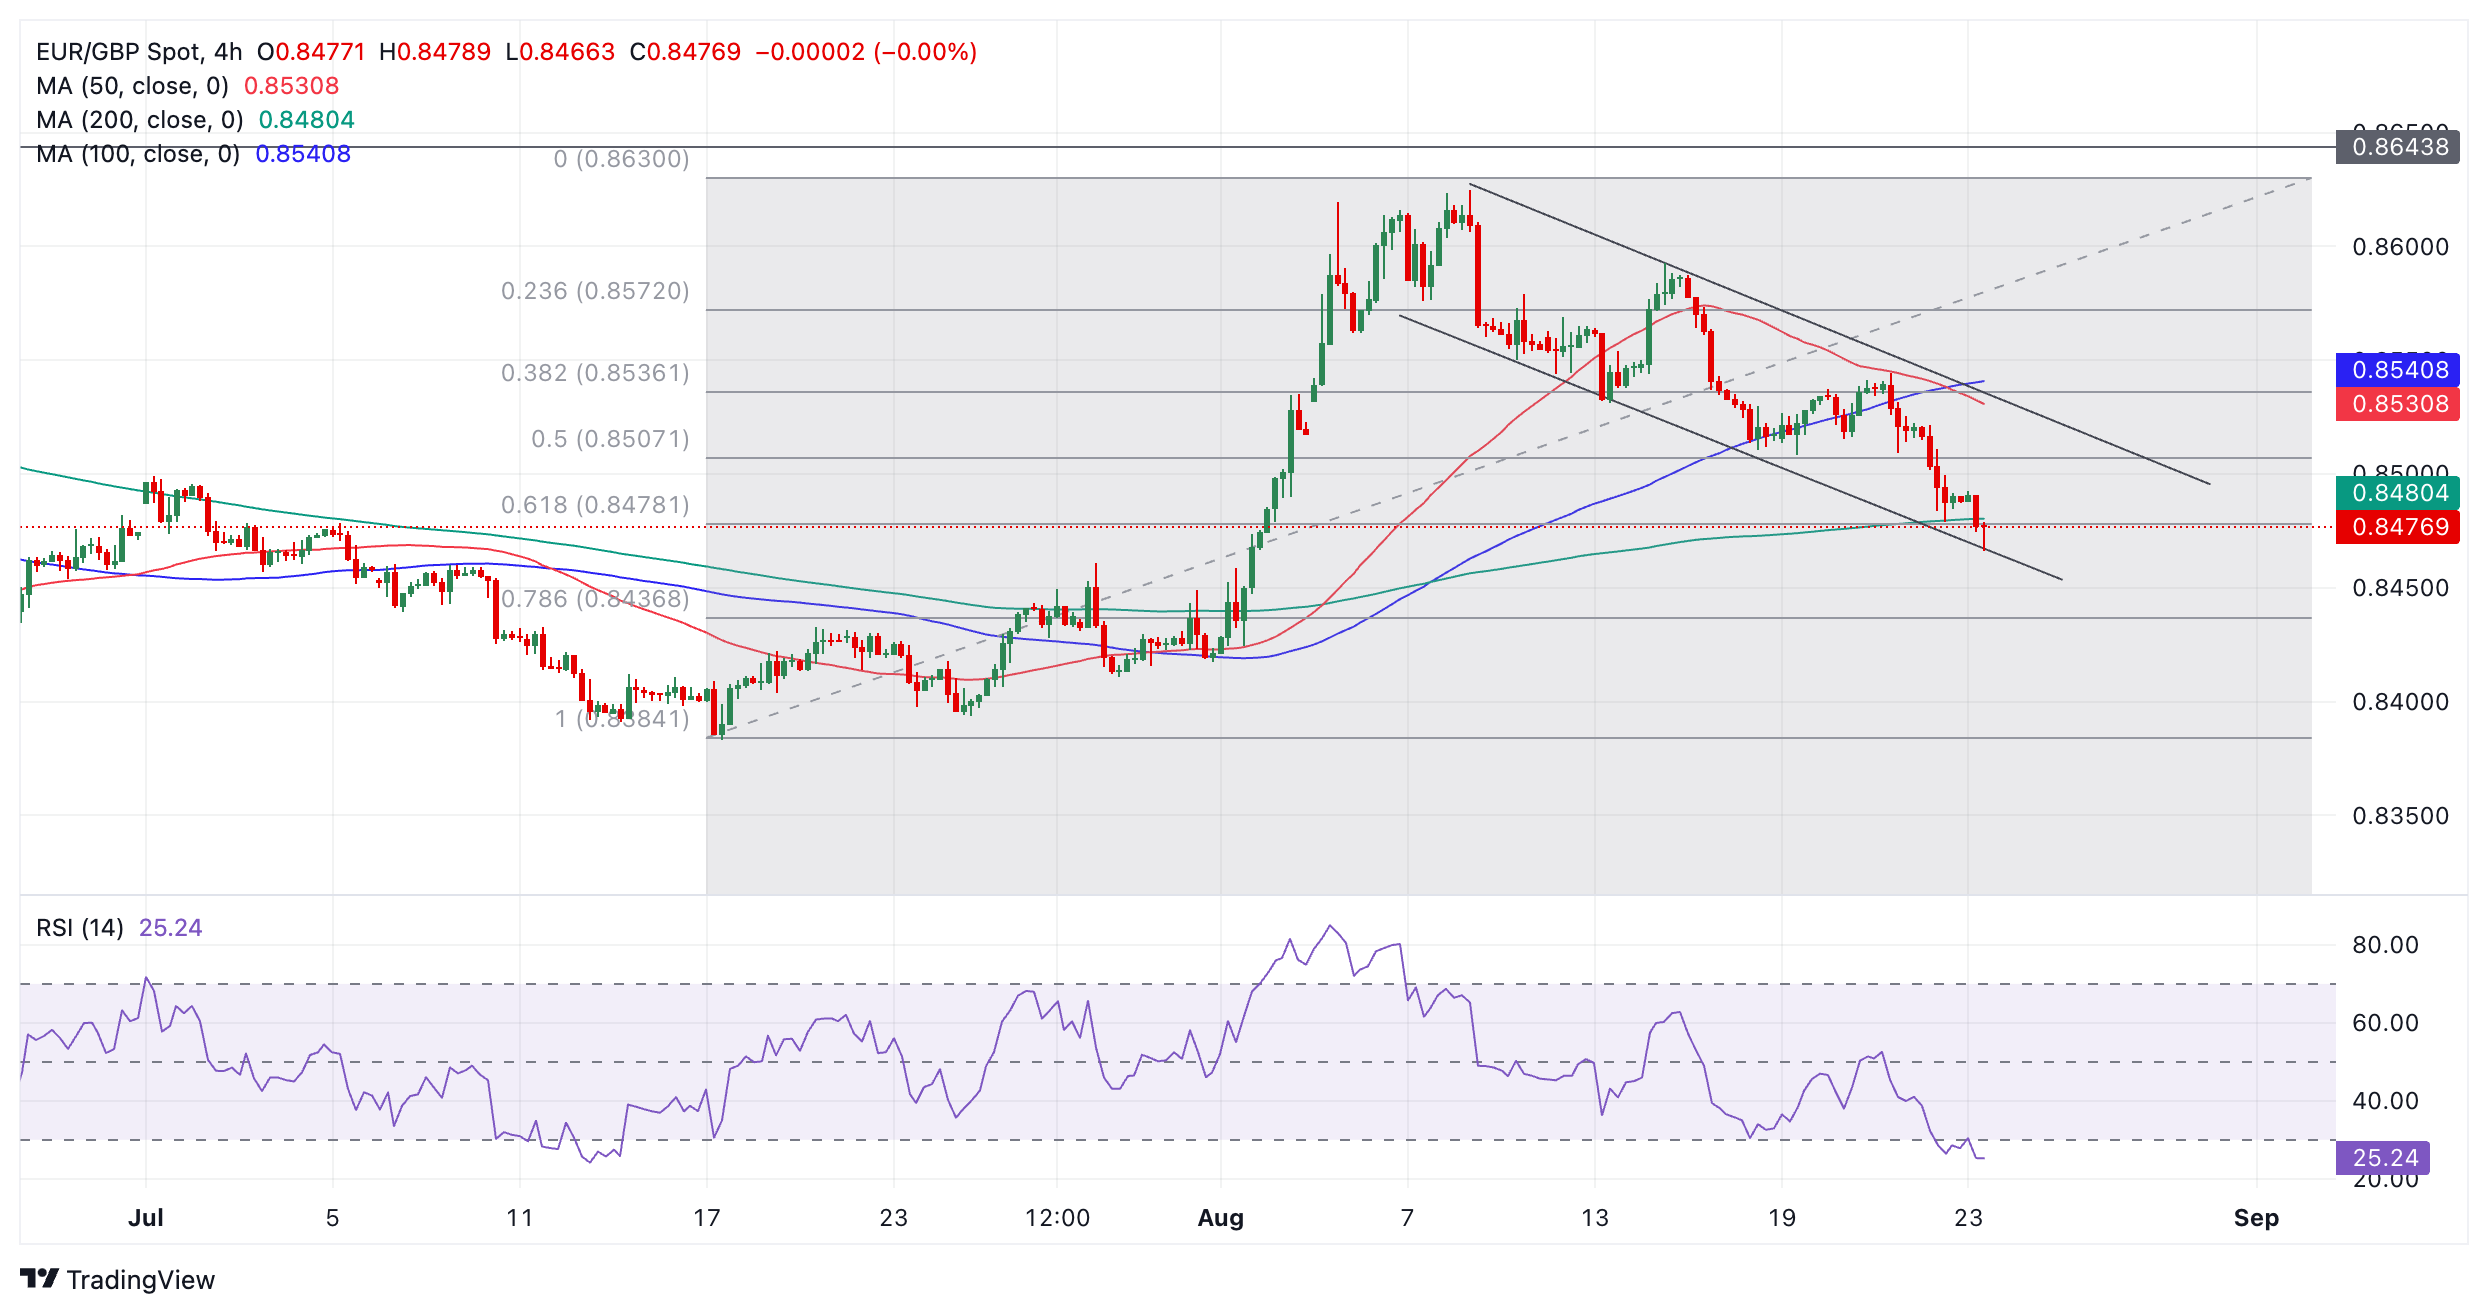
Further supporting the pull-back hypothesis is the fact the Relative Strength Index (RSI) is heavily oversold. Although this alone is not enough to signal a recovery it does caution traders not to add to their short positions. Those wishing to trade the counter-trend rally should wait for RSI to exit oversold and re-enter neutral territory before placing buy orders.
EUR/GBP is also testing both the 200-period Simple Moving Average (SMA) and the 0.618 Fibonacci retracement level of the late-June and early-August rally at 0.8478. On the daily chart (not shown) it is also testing the key 50-day SMA. This confluence of support further increases the probability of a recovery unfolding.
The price itself is forming what might end up as a bullish Hammer Japanese candlestick reversal pattern on the current 4-hour bar, however, until the period ends it is not possible to be certain. For such patterns to gain confirmation they also need to be followed by a bullish green candle.
It is possible – given the short-term downtrend – that EUR/GBP could break below the channel line and continue falling. A decisive break below the lower channel line would validate such a breakout. It would be a very bearish sign but unlikely to last as such moves are often signs of exhaustion.
A decisive break would be one accompanied by a longer-than-average red candlestick which closed below the channel line near its low, or three red candlesticks in a row that broke below the level.
The long-term trend (weekly chart) is still bearish whilst the medium-term trend is bullish.
- EUR/JPY rebounds from the intraday low of 161.20 and recovers its entire intraday losses.
- BoJ Ueda leaned towards more interest rate hikes this year, given that price pressures remain steady.
- The ECB is expected to deliver two more interest rate cuts this year.
The EUR/JPY recovers its entire intraday losses and moves to near 162.50 in Friday’s European session. The cross fell earlier after hawkish guidance from Bank of Japan (BoJ) Governor Kazuo Ueda strengthened the Japanese Yen (JPY).
Kazuo Ueda said during a parliamentary hearing that short-term interest rates would need to be raised again if inflationary pressures remain steady. Market participants are also anticipating that the BoJ will tighten its monetary policy further, given the strong Japan’s economic outlook and price pressures well above the bank’s target of 2%.
Meanwhile, Japan’s National Consumer Price Index (CPI), excluding fresh food, grew expectedly in July. The data released in Friday’s Asian session showed that the underlying inflation rose by 2.7%, as expected, from 2.6% in June.
On the Eurozone front, growing speculation of more interest rate cuts by the European Central Bank (ECB) this year could weigh on the Euro (EUR). The ECB is widely anticipated to resume its policy-easing cycle again in September and deliver one more interest rate cut in the last quarter of this year. Market expectations for ECB rate cuts have been prompted by the Eurozone’s uncertain economic outlook and slowing wage pressures.
Flash Eurozone HCOB PMI report for August showed that the overall economic activity rose due to the Olympic Games in Paris, which is a one-time event and not a structural change. The report also indicated a sharp contraction in the German economy amid vulnerable overseas demand.
Meanwhile, soft Eurozone Q2 Negotiated Wage Rates have eased fears of inflation remaining persistent. The wage growth measure rose by 3.55%, slower than 4.74% came in the first quarter of this year.
Economic Indicator
National CPI ex Fresh Food (YoY)
Japan’s National Consumer Price Index (CPI), released by the Statistics Bureau of Japan on a monthly basis, measures the price fluctuation of goods and services purchased by households nationwide excluding fresh food, whose prices often fluctuate depending on the weather. The YoY reading compares prices in the reference month to the same month a year earlier. Generally, a high reading is seen as bullish for the Japanese Yen (JPY), while a low reading is seen as bearish.
Read more.Last release: Thu Aug 22, 2024 23:30
Frequency: Monthly
Actual: 2.7%
Consensus: 2.7%
Previous: 2.6%
Source: Statistics Bureau of Japan
Crude oil rallied after moving into oversold territory earlier this week, triggering a wave of buying from opportunistic investors, ANZ commodity strategists note.
Oil prices remain depressed
“The recent slump was driven by concerns of a hard economic landing in the US. However, data showed the labour market is cooling gradually instead of rapidly slowing. This was supported by signs of robust demand in the US.”
“Commercial crude oil stockpiles fell by a larger than expected 4,649kbbl last week, while gasoline and distillate inventories also recorded large drawdowns. The market continues to muse over OPEC’s next move. The producer group announced earlier this year that it plans to increase output in Q4 as the market recovered.”
“However, prices remain depressed. This has seen Saudi Arabia’s sales from oil exports fall to a three year low of USD17.7bn in June. This could see these plans delayed in an effort to support prices.”
- The US Dollar turns south after snapping the recent selling spree on Thursday.
- All eyes are on Fed’s Chair Jerome Powell, who is expected to deliver on market expectations for rate cuts at Jackson Hole.
- The US Dollar index trades just above 101.00 and faces a substantial technical position on the weekly chart.
The US Dollar (USD) softens on Friday, trying to keep the gains it acquired on Thursday after economic data and Fed speakers provided a much-needed boost to the Greenback. Kansas City Fed Bank President Jeffrey Schmid said to be cautious about current market expectations of big rate cuts, and upbeat US Purchasing Managers Index (PMI) numbers showed a resilient Services sector. The end of the week will be driven by US Federal Reserve Chairman Jerome Powell’s speech at Jackson Hole. A lot has been written and debated on what Powell will say: markets are expecting him to open the door to rate cuts in September, but Powell might not commit to calling out when and how much the Fed will cut.
On the economic data front, it will all be around the Fed. Three other Fed members will be speaking on financial news outlets such as CNBC and Bloomberg television before and after Fed Powell’s speech in order to guide markets and tweak communication in case they see any market movements which could point to a misinterpretation by markets.
Daily digest market movers: Saying it best by saying nothing at all
- The Jackson Hole schedule from Jackson Hole:
- At 12:00 GMT, Federal Reserve Bank of Atlanta President Raphael Bostic will speak on CNBC. An hour later, at 13:00 GMT, he will speak again on Bloomberg Television.
- At 14:00 GMT, Fed Chairman Jerome Powell will speak at the Jackson Hole Symposium. His speech will be released at that time. So any market movements will already have taken place probably before Powell has said one word on the stage.
- Federal Reserve Bank of Philadelphia President Patrick Harker will comment at 15:00 GMT on Bloomberg Television to guide markets.
- President and chief executive officer of the Federal Reserve Bank of Chicago Austan Goolsbee, will try to guide markets towards the closing bell with further comments and guidance at 16:30 GMT on CNBC, followed by comments around 17:45 GMT on Fox and again at 18:15 GMT on Bloomberg Television.
- At 14:00 GMT, New Home Sales will come out, but expect this number to be overshadowed by the speech from Fed Chairman Powell. Previous sales were down 0.6% in June, with no forecast available for the July number.
- Equities overall are not really spooked by the upcoming pivotal speech from Fed Chairman Powell and are advancing further. Asia is set to close this week on a positive note, Europe posts green numbers as well and US futures are even more optimistic.
- The CME Fedwatch Tool shows a 75.5% chance of a 25 basis points (bps) interest rate cut by the Fed in September against a 24.5% chance for a 50 bps cut. Another 25 bps cut (if September is a 25 bps cut) is expected in November by 51.1%, while there is a 41.0% chance that rates will be 75 bps below the current levels and a 7.9% probability of rates being 100 basis points lower.
- The US 10-year benchmark rate trades at 3.85%, just below the high of this week of around 3.90%.
Economic Indicator
Fed's Chair Powell speech
Jerome H. Powell took office as a member of the Board of Governors of the Federal Reserve System on May 25, 2012, to fill an unexpired term. On November 2, 2017, President Donald Trump nominated Powell to serve as the next Chairman of the Federal Reserve. Powell assumed office as Chair on February 5, 2018.
Read more.Next release: Fri Aug 23, 2024 14:00
Frequency: Irregular
Consensus: -
Previous: -
Source: Federal Reserve
US Dollar Index Technical Analysis: Is everything in it?
The US Dollar Index (DXY) has the potential to move substantially this afternoon. Very high anticipations that Fed Chairman Powell will confirm rate cuts are underway is the minimum base case in the market expectations. Any less than that could see some substantial Dollar bids coming in, with the DXY soaring higher, while a verbal confirmation of a rate cut in September and by how much would see the DXY flirt with a break below 100.00.
For a recovery, the DXY faces a long road ahead. First, 101.90 is the level to reclaim. A steep 2% uprising would be needed to get the DXY to 103.18 from where it is trading now, around 101.00. A very heavy resistance level near 104.00 not only holds a pivotal technical value, but it also bears the 200-day Simple Moving Average (SMA) as the second heavyweight to cap price action.
On the downside, 100.62 (low from December 28) will be the next vital support in order to avoid another meltdown. Should it break, the low of July 14, 2023, at 99.58 will be the ultimate level to look out for.
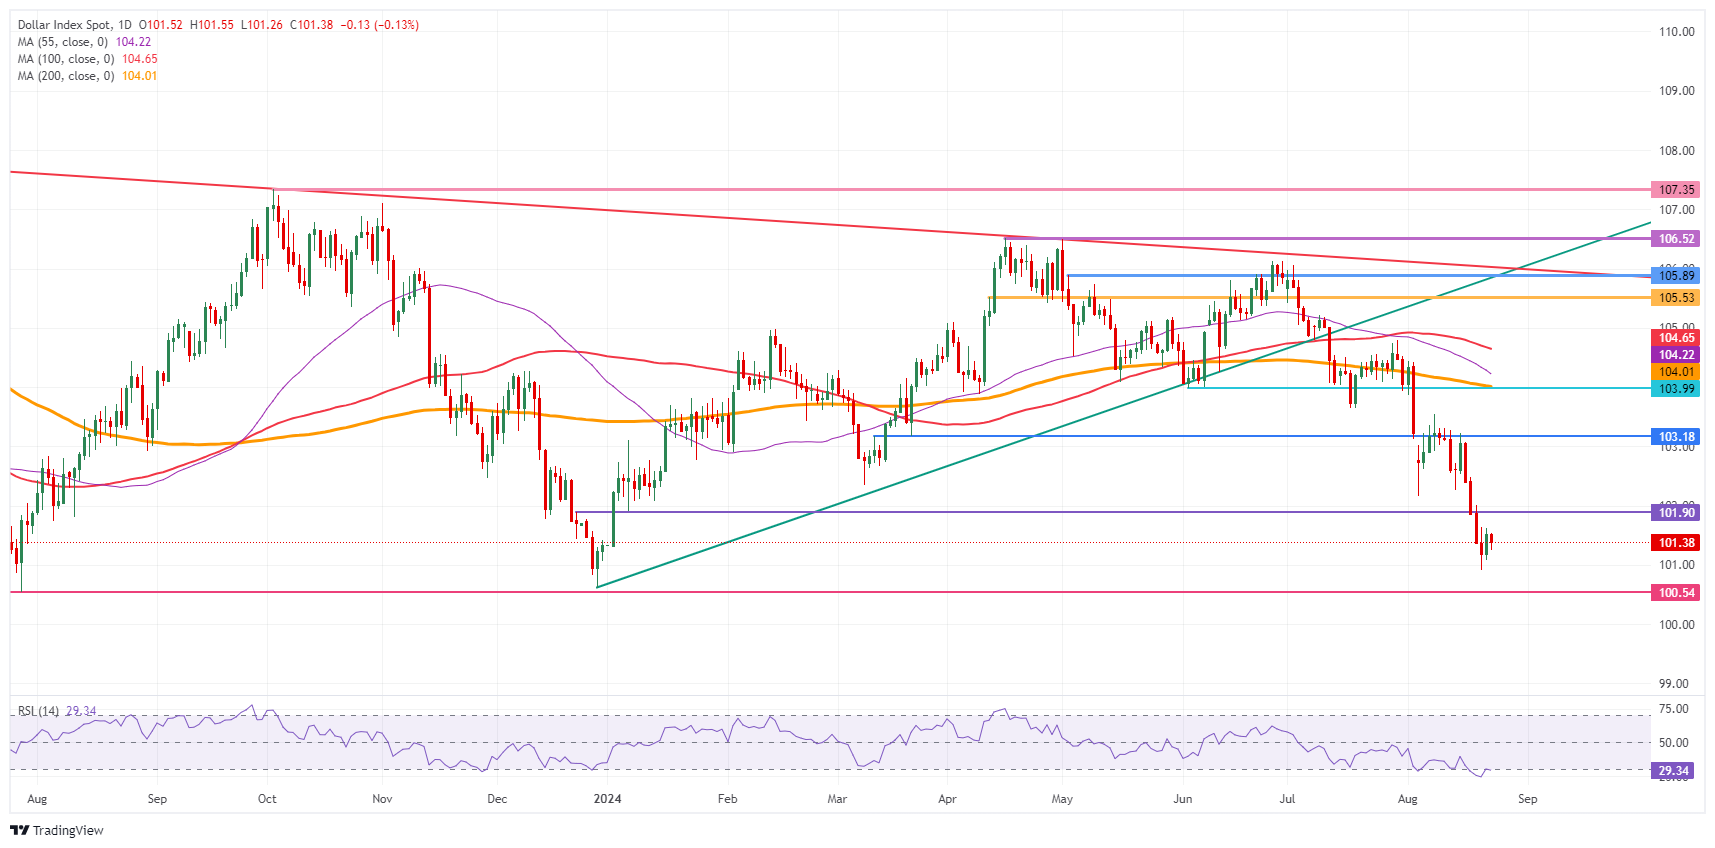
US Dollar Index: Daily Chart
US Dollar FAQs
The US Dollar (USD) is the official currency of the United States of America, and the ‘de facto’ currency of a significant number of other countries where it is found in circulation alongside local notes. It is the most heavily traded currency in the world, accounting for over 88% of all global foreign exchange turnover, or an average of $6.6 trillion in transactions per day, according to data from 2022. Following the second world war, the USD took over from the British Pound as the world’s reserve currency. For most of its history, the US Dollar was backed by Gold, until the Bretton Woods Agreement in 1971 when the Gold Standard went away.
The most important single factor impacting on the value of the US Dollar is monetary policy, which is shaped by the Federal Reserve (Fed). The Fed has two mandates: to achieve price stability (control inflation) and foster full employment. Its primary tool to achieve these two goals is by adjusting interest rates. When prices are rising too quickly and inflation is above the Fed’s 2% target, the Fed will raise rates, which helps the USD value. When inflation falls below 2% or the Unemployment Rate is too high, the Fed may lower interest rates, which weighs on the Greenback.
In extreme situations, the Federal Reserve can also print more Dollars and enact quantitative easing (QE). QE is the process by which the Fed substantially increases the flow of credit in a stuck financial system. It is a non-standard policy measure used when credit has dried up because banks will not lend to each other (out of the fear of counterparty default). It is a last resort when simply lowering interest rates is unlikely to achieve the necessary result. It was the Fed’s weapon of choice to combat the credit crunch that occurred during the Great Financial Crisis in 2008. It involves the Fed printing more Dollars and using them to buy US government bonds predominantly from financial institutions. QE usually leads to a weaker US Dollar.
Quantitative tightening (QT) is the reverse process whereby the Federal Reserve stops buying bonds from financial institutions and does not reinvest the principal from the bonds it holds maturing in new purchases. It is usually positive for the US Dollar.
Price action suggests there is scope for Pound Sterling (GBP) to rise to, and potentially break above the 2023 peak of 1.3144, UOB Group FX strategists Quek Ser Leang and Peter Chia note.
GBP bulls target the 1.3144 level
24-HOUR VIEW: “GBP surged two days ago. Yesterday, we indicated that ‘while GBP could continue to rise, it might not be able to break clearly above last year’s high of 1.3144.’ GBP subsequently rose to 1.3130, pulling back to close largely unchanged at 1.3093 (+0.02%). The pullback in overbought conditions indicates that GBP is likely to trade in a range today, probably between 1.3065 and 1.3125.”
1-3 WEEKS VIEW: “We highlighted yesterday (22 Aug, spot at 1.3090) that the recent price action suggests there is scope for GBP to rise to, and potentially break above the 2023 peak of 1.3144. We continue to hold the same view. The likelihood of GBP breaking above 1.3144 will remain intact as long as 1.2970 (‘strong support’ level was at 1.2950 yesterday) is not breached. Looking ahead, the next level to monitor above 1.3144 is 1.3200.”
Gold fell below $2,500 per troy ounce, as a stronger US Dollar weakened investor demand, ANZ commodity strategists note.
Gold markets are waiting for Powell to talk
“Gold fell below USD2,500/oz. This came amid concerns that the market is overplaying the prospects of aggressive rate cuts by the Fed. Swap traders are pricing in almost 100bps of cuts by year end, a level many prominent commentators believe is too much.”
“Investor positioning in Gold is also extremely net long, leaving the market open to selling should the Fed not live up to these expectations. This places a lot of importance on Federal Reserve Chair Jerome Powell’s speech at Jackson Hole later today.”
The Japanese Yen (JPY) enters today's risk event with decent momentum, having appreciated over 2% in the past seven days, ING’s FX strategist Francesco Pesole notes.
Markets remain relatively hesitant about a BoJ move by year-end
“Overnight, Bank of Japan Governor Kazuo Ueda maintained a generally hawkish tone in a likely attempt to show independence from the recent turmoil in the Japanese stock market.”
“Further rate hikes are on the table, and the marginal CPI surprise (2.8% vs 2.7% year-on-year) this morning is also helping the hawkish case. Markets remain relatively hesitant about a move by year-end though, with only 10bp priced in by December. We think the chance of a hike is – once again – underpriced.”
“Today, USD/JPY may trade higher on Powell’s cautious tone, but the path forward remains downward-sloping for the pair, in our view, as the pressure on the yen from carry trades looks unlikely to build up again into a Fed cut.”
The latest batch of US data has not firmly argued in favour of a 50bp Federal Reserve rate cut in September, and most FOMC members have also appeared to moderately push back against that prospect in recent off-meeting comments. Yesterday, US services S&P Global PMIs were stronger than expected and compensated for another decline in manufacturing, while initial jobless claims rose only slightly, in line with consensus, to 232k. Continuing claims – a measure of the difficulty of re-entering the workforce – were less than expected and were revised lower for the previous week, ING’s FX strategist Francesco Pesole notes.
All eyes on Jackson Hole
“The payroll revisions published earlier this week showed the jobs market is loosening from a weaker position, but other activity/jobs indicators are not flashing amber, which should allow Fed Chair Jerome Powell to keep communication relatively balanced as he speaks at Jackson Hole today (1500 BST). He will probably use this speech to prepare markets for a September cut.”
“When looking at market pricing, there is probably not much incentive to open the door to a 50bp move at this stage. 100bp is fully expected over the next three meetings, and the market tendency to price in more aggressively on the dovish side means hints of half-point moves could take the Fed funds futures curve uncomfortably low for the Fed. It appears more likely that Powell will re-emphasise the focus on both sides of the mandate.”
“The risks for the USD are slightly upside-tilted today in our view. That said, we don’t expect Powell’s speech to have long-lasting ramifications for FX, and we retain a bearish bias on USD in the near term as the rebuilding of speculative positions following the recent rebalancing still looks more likely to favour dollar shorts.”
- USD/CAD hovers near 1.3600, the potential breakdown region of the Broadening Triangle chart pattern.
- Investors keenly await Fed Powell’s speech at the JH Symposium.
- The Canadian Dollar will dance to the tunes of the monthly Retail Sales data for June.
The USD/CAD pair falls back below 1.3600 after a short-lived pullback move to near 1.3616 in Friday’s European session. The Loonie asset weakens as the US Dollar (USD) struggles to hold Thursday’s recovery move, driven by better-than-estimated preliminary United States (US) S&P Global PMI for August.
The US Dollar Index (DXY), which tracks the Greenback’s value against six major currencies, falls to near 101.30. The Greenback is expected to remain on the sidelines, with investors focusing on the Federal Reserve (Fed) Chair Jerome Powell’s speech at the Jackson Hole (JH) Symposium.
In the JH event at 14:00 GMT, Jerome Powell is expected to provide fresh guidance on interest rates and the economic outlook. The Fed is widely anticipated to start reducing its key borrowing rates from the September meeting but traders are split over the likely size of interest rate cuts.
Meanwhile, the Canadian Dollar (CAD) will be influenced by the domestic monthly Retail Sales data for June, which will be published at 12:30 GMT. The Retail Sales data, a key measure of consumer spending that prompts inflationary pressures, is estimated to have declined consequently. The consumer spending measure is expected to have contracted by 0.3% after dropping 0.8% in May.
Lower sales at retail stores point to a decline in the purchasing power of households, which would prompt expectations of more Bank of Canada’s (BoC) interest rate cuts this year.
USD/CAD is on the verge of delivering a breakdown of the Broadening Triangle chart formation on a daily timeframe. The asset hovers near the horizontal support of the above-mentioned chart pattern below 1.3600.
The overall trend is bearish as it trades below the 200-day Exponential Moving Average (EMA), which trades around 1.3630.
The 14-day Relative Strength Index (RSI) oscillates in the bearish range of 20.00-40.00, suggesting a firm downside momentum.
More downside would appear if the asset breaks below April 9 low of 1.3540. This would drag the asset towards the psychological support of 1.3500, followed by March 21 low of 1.3456.
In an alternate scenario, a recovery move above August 12 high of 1.3750 would drive the asset toward the round-level resistance of 1.3800 and April 17 high near 1.3840.
USD/CAD daily chart
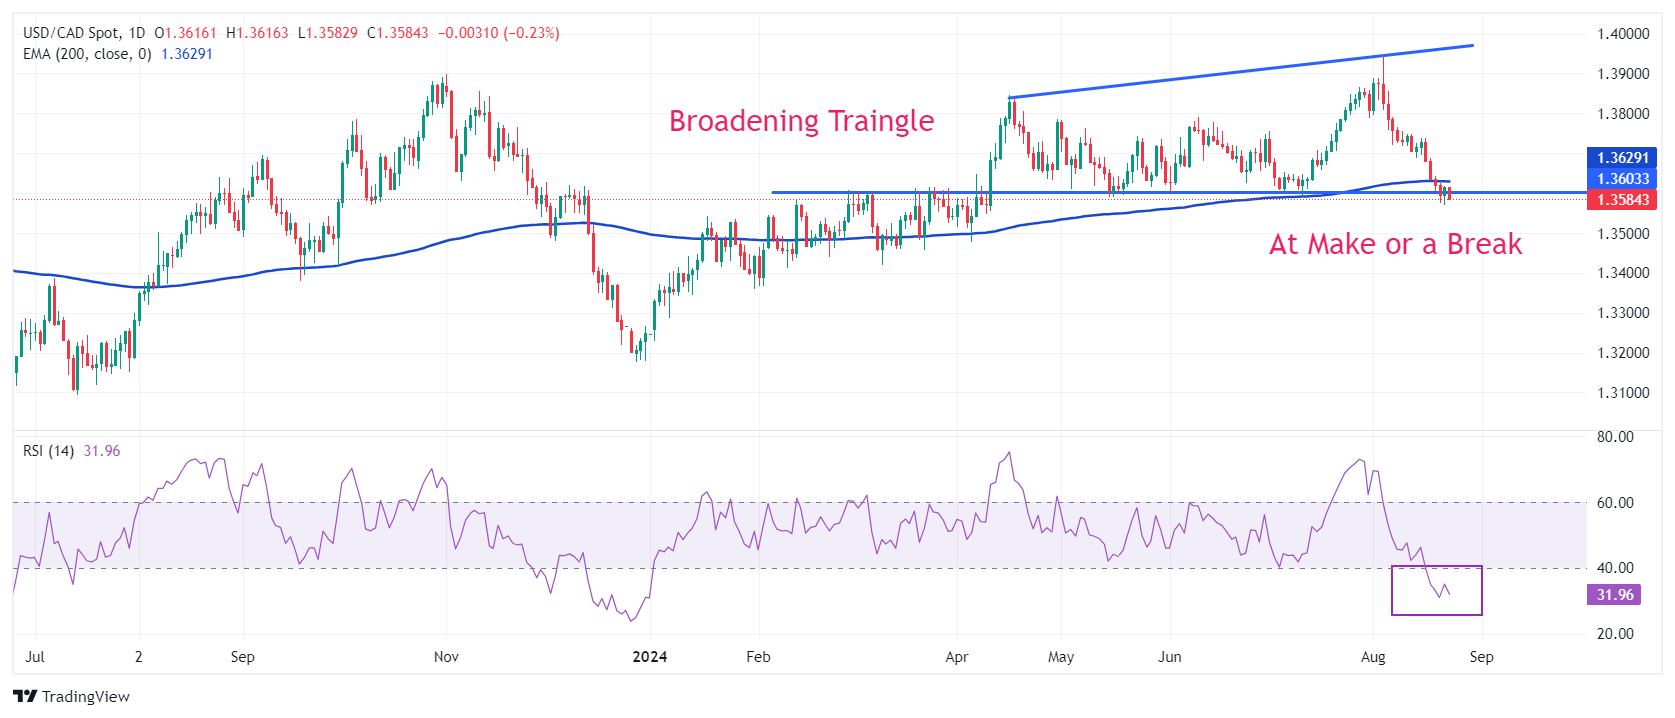
Canadian Dollar FAQs
The key factors driving the Canadian Dollar (CAD) are the level of interest rates set by the Bank of Canada (BoC), the price of Oil, Canada’s largest export, the health of its economy, inflation and the Trade Balance, which is the difference between the value of Canada’s exports versus its imports. Other factors include market sentiment – whether investors are taking on more risky assets (risk-on) or seeking safe-havens (risk-off) – with risk-on being CAD-positive. As its largest trading partner, the health of the US economy is also a key factor influencing the Canadian Dollar.
The Bank of Canada (BoC) has a significant influence on the Canadian Dollar by setting the level of interest rates that banks can lend to one another. This influences the level of interest rates for everyone. The main goal of the BoC is to maintain inflation at 1-3% by adjusting interest rates up or down. Relatively higher interest rates tend to be positive for the CAD. The Bank of Canada can also use quantitative easing and tightening to influence credit conditions, with the former CAD-negative and the latter CAD-positive.
The price of Oil is a key factor impacting the value of the Canadian Dollar. Petroleum is Canada’s biggest export, so Oil price tends to have an immediate impact on the CAD value. Generally, if Oil price rises CAD also goes up, as aggregate demand for the currency increases. The opposite is the case if the price of Oil falls. Higher Oil prices also tend to result in a greater likelihood of a positive Trade Balance, which is also supportive of the CAD.
While inflation had always traditionally been thought of as a negative factor for a currency since it lowers the value of money, the opposite has actually been the case in modern times with the relaxation of cross-border capital controls. Higher inflation tends to lead central banks to put up interest rates which attracts more capital inflows from global investors seeking a lucrative place to keep their money. This increases demand for the local currency, which in Canada’s case is the Canadian Dollar.
Macroeconomic data releases gauge the health of the economy and can have an impact on the Canadian Dollar. Indicators such as GDP, Manufacturing and Services PMIs, employment, and consumer sentiment surveys can all influence the direction of the CAD. A strong economy is good for the Canadian Dollar. Not only does it attract more foreign investment but it may encourage the Bank of Canada to put up interest rates, leading to a stronger currency. If economic data is weak, however, the CAD is likely to fall.
Silver prices (XAG/USD) rose on Friday, according to FXStreet data. Silver trades at $29.45 per troy ounce, up 1.59% from the $28.99 it cost on Thursday.
Silver prices have increased by 23.76% since the beginning of the year.
| Unit measure | Silver Price Today in USD |
|---|---|
| Troy Ounce | 29.45 |
| 1 Gram | 0.95 |
The Gold/Silver ratio, which shows the number of ounces of Silver needed to equal the value of one ounce of Gold, stood at 84.92 on Friday, down from 85.72 on Thursday.
Silver FAQs
Silver is a precious metal highly traded among investors. It has been historically used as a store of value and a medium of exchange. Although less popular than Gold, traders may turn to Silver to diversify their investment portfolio, for its intrinsic value or as a potential hedge during high-inflation periods. Investors can buy physical Silver, in coins or in bars, or trade it through vehicles such as Exchange Traded Funds, which track its price on international markets.
Silver prices can move due to a wide range of factors. Geopolitical instability or fears of a deep recession can make Silver price escalate due to its safe-haven status, although to a lesser extent than Gold's. As a yieldless asset, Silver tends to rise with lower interest rates. Its moves also depend on how the US Dollar (USD) behaves as the asset is priced in dollars (XAG/USD). A strong Dollar tends to keep the price of Silver at bay, whereas a weaker Dollar is likely to propel prices up. Other factors such as investment demand, mining supply – Silver is much more abundant than Gold – and recycling rates can also affect prices.
Silver is widely used in industry, particularly in sectors such as electronics or solar energy, as it has one of the highest electric conductivity of all metals – more than Copper and Gold. A surge in demand can increase prices, while a decline tends to lower them. Dynamics in the US, Chinese and Indian economies can also contribute to price swings: for the US and particularly China, their big industrial sectors use Silver in various processes; in India, consumers’ demand for the precious metal for jewellery also plays a key role in setting prices.
Silver prices tend to follow Gold's moves. When Gold prices rise, Silver typically follows suit, as their status as safe-haven assets is similar. The Gold/Silver ratio, which shows the number of ounces of Silver needed to equal the value of one ounce of Gold, may help to determine the relative valuation between both metals. Some investors may consider a high ratio as an indicator that Silver is undervalued, or Gold is overvalued. On the contrary, a low ratio might suggest that Gold is undervalued relative to Silver.
(An automation tool was used in creating this post.)
The Euro (EUR) is likely to trade in a range between 1.1085 and 1.1155. Solid momentum indicates further EUR strength; it remains to be seen if the 2023 high of 1.1275 is within reach, UOB Group FX strategists Quek Ser Leang and Peter Chia note.
Momentum may take EUR/USD above 1.1155
24-HOUR VIEW: “We expected EUR to ‘trade in a higher range of 1.1110/1.1180’ yesterday. However, it traded in a lower range instead, between 1.1095 and 1.1164, closing at 1.1112 (-0.34%). The price action is likely part of a range trading phase. Today, we expect USD to trade between 1.1085 and 1.1155.”
1-3 WEEKS VIEW: “Our view from yesterday (22 Aug, spot at 1.1155) remains unchanged. As indicated, solid momentum after the recent price action indicates further EUR strength is likely. However, it remains to be seen whether the 2023 high of 1.1275 is within reach in the next couple of weeks. Overall, we will hold a positive EUR view provided that the ‘strong support’ level at 1.1045 (no change in ‘strong support’ level) is not breached.”
- The Pound Sterling outperforms the US Dollar as Fed rate-cut bets remain firm.
- Investors await the speeches from Fed Powell and BoE Bailey to get fresh guidance on the US and the UK interest-rate outlook.
- The BoE is expected to cut interest rates gradually.
The Pound Sterling (GBP) extends its winning streak for a seventh trading session against the US Dollar (USD) on Friday. The GBP/USD pair trades within a touching distance of a year-to-date high of 1.3130 as the US Dollar (USD) struggles to hold its Thursday’s upward move, which was mostly driven by better-than-projected flash United States (US) S&P Global PMI data for August.
The US Dollar Index (DXY), which tracks the Greenback’s value against six major currencies, hovers near 101.40 and is expected to perform sideways ahead of Federal Reserve (Fed) Chair Jerome Powell’s speech at 14:00 GMT in the Jackson Hole (JH) Symposium.
Investors will look for cues about the potential size of interest rate cuts in September, given that the Fed is widely anticipated to pivot to policy normalization. Market participants will also expect some interest-rate guidance and economic performance for the rest of the year.
Philadelphia Fed Bank President Patrick Harker said in an interview at the JH event on Thursday that the central bank should focus more on a steady course of easing, which should be started from September, rather than the size of policy action, reported Reuters.
Separately, Boston Fed Bank President Susan Collins also showed support for interest rate cuts in September. Collins remained confident about the Fed achieving its goals without triggering a recession.
Daily digest market movers: Pound Sterling outperforms on optimism over BoE’s slower policy-easing process
- The Pound Sterling performs strongly against its major peers, except Asia-Pacific currencies, on firm speculation that the Bank of England’s (BoE) policy-easing cycle will be slower than that of other major central banks. Robust expectations for a slower BoE policy-normalization process are backed by a strong United Kingdom (UK) economic outlook and still high wage growth.
- Flash UK S&P Global/CIPS PMI data for August, released Thursday, showed that the overall business activity rose at a faster pace to a four-month high at 53.4, driven by a strong expansion in manufacturing as well as the services sector. The report also signaled a sharp reduction in the backlog of work and positive sentiment towards the business outlook that points to strong job creation.
- These strong economic prospects, however, are unlikely to ease market speculation of one more interest rate cut by the BoE this year as input prices in the service sector eased to their lowest level in just over three-and-a-half years in August. This is a relief for BoE policymakers as they appeared uncomfortable in cutting interest rates while inflation in the service sector remains elevated.
- Apart from Powell, investors also await BoE Governor Andrew Bailey’s speech at the JH Symposium, which is scheduled at 19:00 GMT. Andrew Bailey is expected to provide fresh cues about whether the BoE will cut interest rates in September.
Technical Analysis: Pound Sterling aims to recapture a two-year high of 1.3140
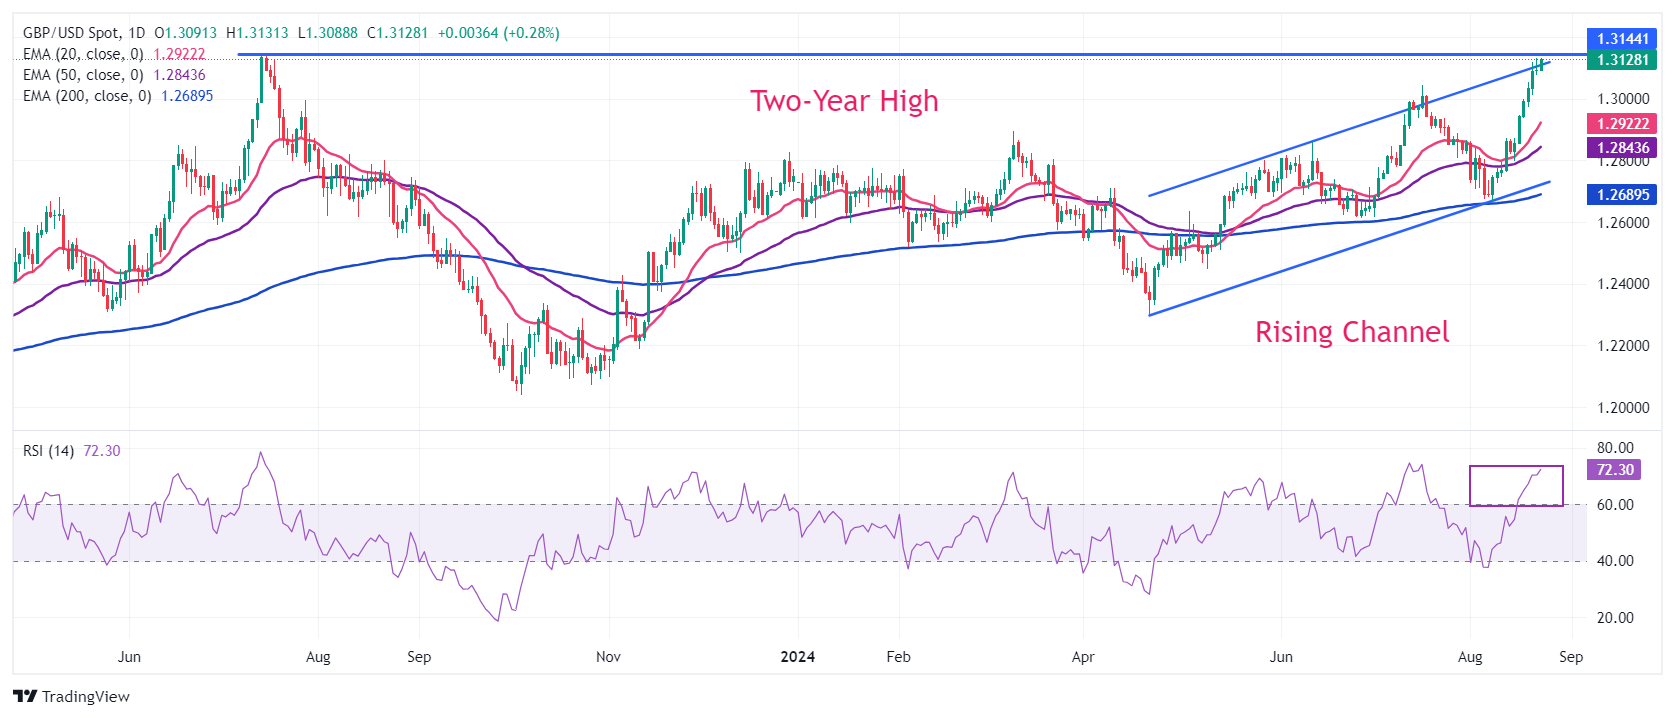
The Pound Sterling is inch far from revisiting a more-than-two-year high of 1.3140. The GBP/USD pair moves higher in a Rising Channel chart pattern in which each pullback is considered a buying opportunity by market participants. All short-to-long Exponential Moving Average (EMA) are sloping higher, suggesting that the overall trend is bullish.
The 14-period Relative Strength Index (RSI) oscillates in the bullish range of 60.00-80.00, suggesting a strong upside momentum. Still, it has reached overbought levels at around 70.00, increasing the chances of a corrective pullback. On the downside, the psychological level of 1.3000 will be the crucial support for the Pound Sterling bulls.
Pound Sterling FAQs
The Pound Sterling (GBP) is the oldest currency in the world (886 AD) and the official currency of the United Kingdom. It is the fourth most traded unit for foreign exchange (FX) in the world, accounting for 12% of all transactions, averaging $630 billion a day, according to 2022 data. Its key trading pairs are GBP/USD, aka ‘Cable’, which accounts for 11% of FX, GBP/JPY, or the ‘Dragon’ as it is known by traders (3%), and EUR/GBP (2%). The Pound Sterling is issued by the Bank of England (BoE).
The single most important factor influencing the value of the Pound Sterling is monetary policy decided by the Bank of England. The BoE bases its decisions on whether it has achieved its primary goal of “price stability” – a steady inflation rate of around 2%. Its primary tool for achieving this is the adjustment of interest rates. When inflation is too high, the BoE will try to rein it in by raising interest rates, making it more expensive for people and businesses to access credit. This is generally positive for GBP, as higher interest rates make the UK a more attractive place for global investors to park their money. When inflation falls too low it is a sign economic growth is slowing. In this scenario, the BoE will consider lowering interest rates to cheapen credit so businesses will borrow more to invest in growth-generating projects.
Data releases gauge the health of the economy and can impact the value of the Pound Sterling. Indicators such as GDP, Manufacturing and Services PMIs, and employment can all influence the direction of the GBP. A strong economy is good for Sterling. Not only does it attract more foreign investment but it may encourage the BoE to put up interest rates, which will directly strengthen GBP. Otherwise, if economic data is weak, the Pound Sterling is likely to fall.
Another significant data release for the Pound Sterling is the Trade Balance. This indicator measures the difference between what a country earns from its exports and what it spends on imports over a given period. If a country produces highly sought-after exports, its currency will benefit purely from the extra demand created from foreign buyers seeking to purchase these goods. Therefore, a positive net Trade Balance strengthens a currency and vice versa for a negative balance.
- AUD/USD attracts some dip-buyers on Friday amid a modest USD weakness.
- The divergent Fed-RBA policy outlook offers additional support to the major.
- Bulls now await Fed Chair Jerome Powell’s speech before placing fresh bets.
The AUD/USD pair regains positive traction on Friday and for now, seems to have stalled its modest retracement slide from the 0.6760 area, or over a one-month high touched earlier this week. Spot prices stick to intraday gains through the first half of the European session and currently trade around the 0.6725 region, up 0.30% for the day.
The US Dollar (USD) struggles to capitalize on the overnight recovery from the YTD low and attracts fresh sellers amid dovish Federal Reserve (Fed) expectations, which, in turn, is seen lending some support to the AUD/USD pair. In fact, the markets now seem convinced that the US central bank will begin its policy easing cycle in September and have fully priced in a 25 basis points (bps) rate cut. Furthermore, the CME Group's FedWatch Tool indicates the possibility of a larger, 50 bps rate cut next month and about a 100 bps of easing by the end of this year.
The Australian Dollar (AUD), on the other hand, continues to draw support from the Reserve Bank of Australia's (RBA) hawkish stance, showing readiness to hike interest rates again in the face of more upside risks to inflation. This is seen as another factor acting as a tailwind for the AUD/USD pair. Bulls, however, might refrain from placing aggressive bets and prefer to wait for Fed Chair Jerome Powell's speech at the Jackson Hole Symposium. Investors will look for cues about the rate-cut path, which will influence the USD and provide some meaningful impetus.
From a technical perspective, the recent breakout through the 0.6600 confluence – comprising 100- and 200-day Simple Moving Averages (SMA) – and a subsequent strength beyond the 0.6700 mark was seen as a fresh trigger for bulls. Moreover, oscillators on the daily chart are holding comfortably in positive territory and are still away from being in the overbought zone. This, in turn, suggests that the path of least resistance for the AUD/USD pair is to the upside and supports prospects for an extension of the recent strong recovery from the YTD low touched earlier this month.
Bulls, however, might wait for some follow-through buying beyond the 0.6750 horizontal barrier before placing fresh bets. The AUD/USD pair might then aim to challenge the YTD peak, around the 0.6800 round figure mark, before climbing further towards the December 2023 swing high, around the 0.6870 region.
On the flip side, the 0.6700 mark is likely to protect the immediate downside ahead of the 0.6675 zone, below which the AUD/USD pair could slide back to the 0.6600 confluence resistance breakpoint, now turned support. The latter should act as a strong base, which if broken decisively might prompt aggressive technical selling and drag spot prices to the 0.6550-0.6545 intermediate support en route to the 0.6500 psychological mark.
AUD/USD daily chart
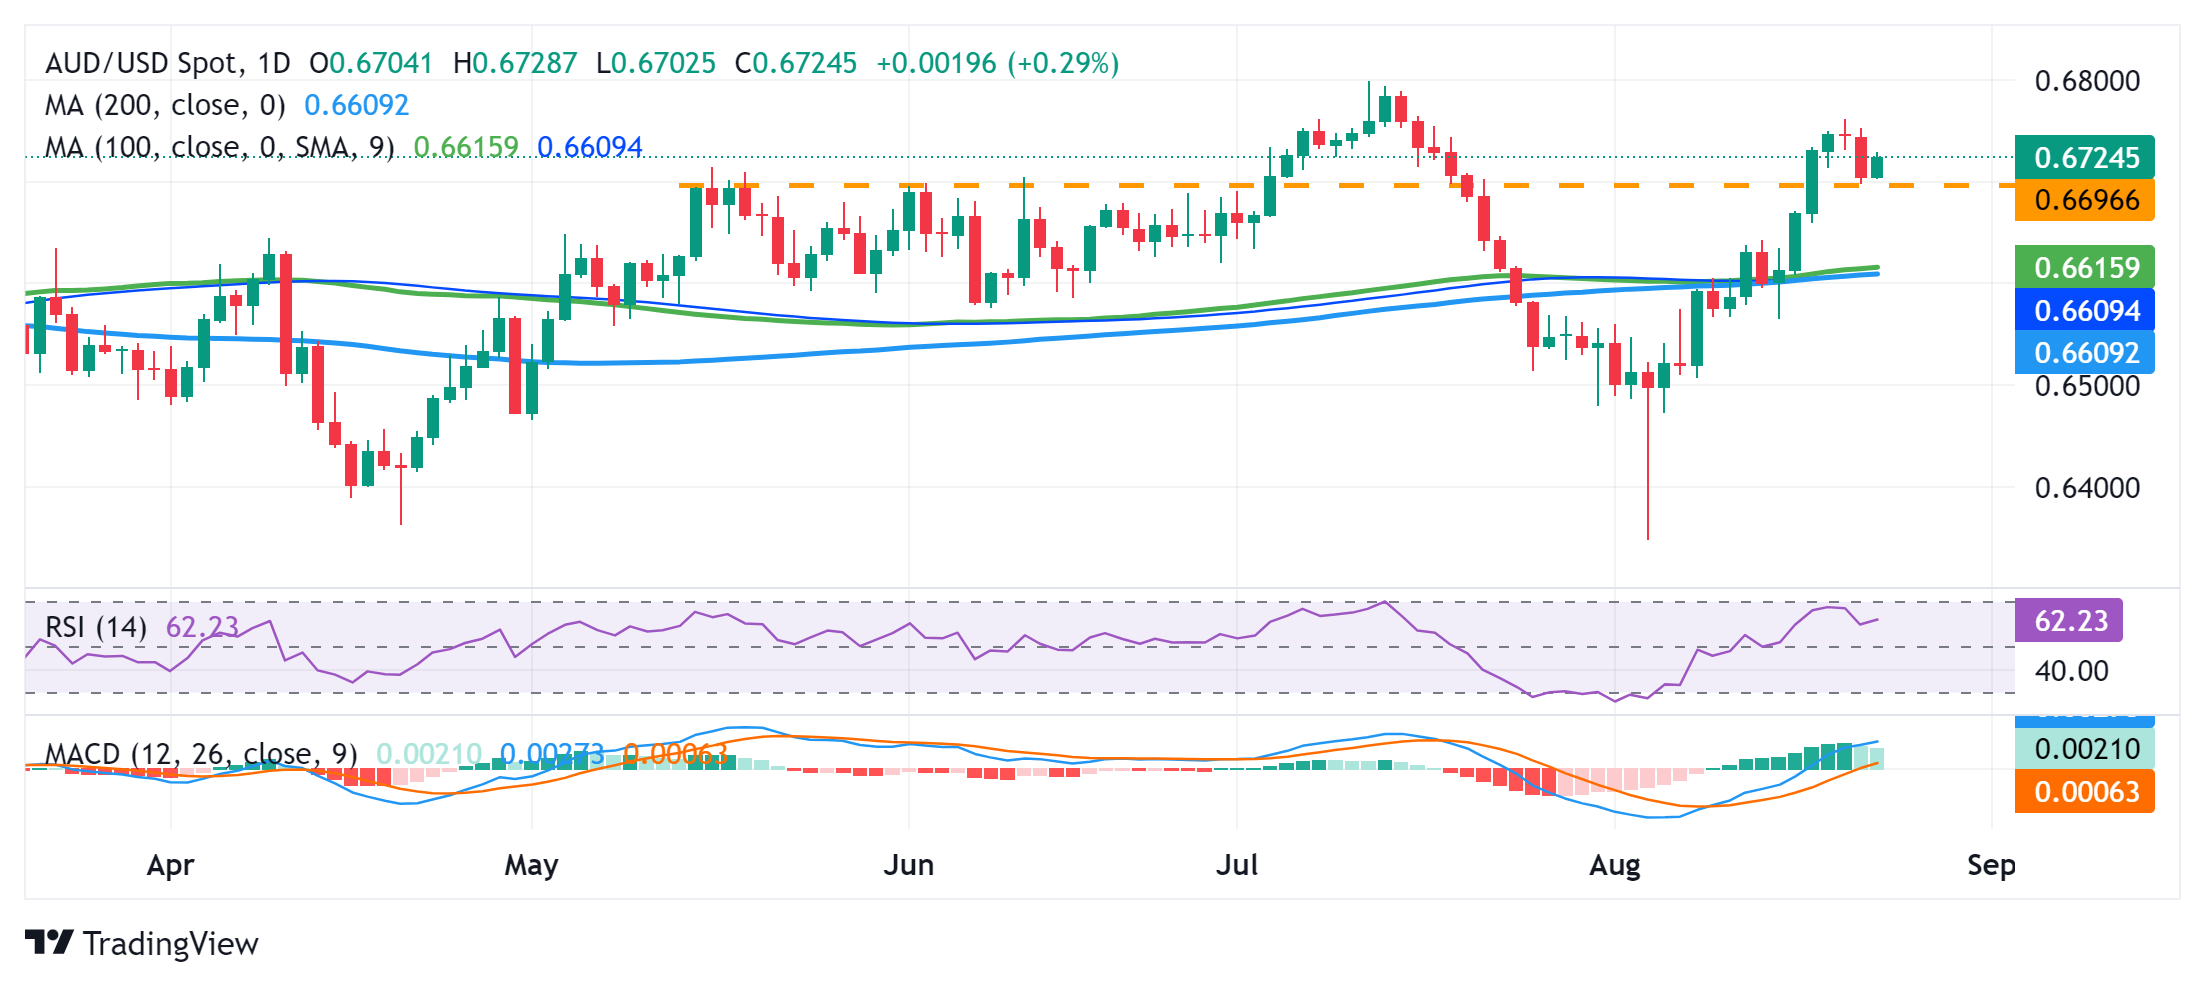
Economic Indicator
Fed's Chair Powell speech
Jerome H. Powell took office as a member of the Board of Governors of the Federal Reserve System on May 25, 2012, to fill an unexpired term. On November 2, 2017, President Donald Trump nominated Powell to serve as the next Chairman of the Federal Reserve. Powell assumed office as Chair on February 5, 2018.
Read more.Next release: Fri Aug 23, 2024 14:00
Frequency: Irregular
Consensus: -
Previous: -
Source: Federal Reserve
- Fed Chairman Jerome Powell is due to speak on monetary policy at the Jackson Hole Symposium.
- All eyes remain on Powell’s speech for fresh cues on the US interest-rate outlook.
- The US Dollar is set rock on Powell’s speech after Wednesday’s dovish Fed Minutes.
US Federal Reserve (Fed) Chairman Jerome Powell is scheduled to deliver a speech titled “Reassessing the Effectiveness and Transmission of Monetary Policy” on the second day of the annual Jackson Hole Economic Symposium on Friday at 14:00 GMT.
Market participants will closely scrutinize Powell’s speech for any fresh hints on the trajectory of monetary policy, particularly about the magnitude of the Fed’s first interest-rate cut in years and the potential scope and timing of subsequent rate reductions.
His words are expected to stir markets, injecting intense volatility around the US Dollar (USD), as the world’s most powerful central bank heads toward a policy pivot as early as September.
In the July policy meeting, the Fed left the federal funds rate unchanged in the range of 5.25%-5.50% and shifted focus to the second component of its dual mandate – full employment.
Fed Chair Powell said during the post-policy meeting press conference that the labor market “has come into better balance”. “We are attentive to risks on both sides of the dual mandate,” Powell said, a shift from maintaining earlier that they are “highly attentive” to inflation risks.
"The unemployment rate remains low. Data suggests the labor market has returned to where it was on the eve of the pandemic. A broad set of labor market indicators show it is strong but not overheated,” Powell added.
Since then, other Fed policymakers have voiced their concerns about the strength of the labor market.
The US employment data for July, however, came in weak and spurred recessionary fears. The headline Nonfarm payrolls increased by 114,000 jobs last month after rising by a downwardly revised 179,000 in June, according to the US Bureau of Labor Statistics (BLS). The Unemployment Rate climbed to 4.3% from 4.1% in June.
Markets began pricing in a roughly 75% chance of 50 basis points (bps) interest-rate cut by the Fed in September while predicting 115 bps of cuts this year, which only has three scheduled Fed meetings left.
Following the US Consumer Price Index (CPI) data release, the odds of a big Fed rate cut diminished. Though the annual inflation rate in the US slowed for a fourth consecutive month to 2.9% in July, the lowest since March 2021, compared to 3.0% in June, the monthly CPI rebounded 0.2% last month after falling 0.1% in June, the BLS reported on August 14.
Recession fears were quelled last week after a strong Retail Sales report and encouraging Unemployment Claims data pointed to economic resilience. Despite encouraging US economic prospects, the outrightly dovish Minutes of the Fed’s July meeting and the Nonfarm Payrolls Benchmark Revision are leading markets to still price in a 35% probability of a 50 bps cut for September while the odds for a 25 bps rate reduction stand at 65%.
Most policymakers thought that "if the data continued to come in about as expected, it would likely be appropriate to ease policy at the next meeting," the Minutes said. Further, the Minutes read that several of them would have even been willing to reduce borrowing costs already in the July meeting itself.
Meanwhile, the US Labor Department said that Nonfarm Payrolls (NFP) for the period from April 2023 to March 2024 was lowered by 818,000. The revision represented a total downward change of about 0.5%, prompting Fed policymakers to factor in the indication that the job market was softer than previously thought as they considered the pace of rate reductions.
Against this backdrop, the US Dollar (USD) braces for a two-way risk in the run-up to the highly anticipated Jackson Hole showdown.
How could Powell speech at Jackson Hole affect the US Dollar?
Even though Fed Chair Jerome Powell confirmed a September rate cut at the press conference, he is unlikely to pre-commit to any particular rate-cut trajectory. However, if he pushes back against the expectations for an aggressive easing, sticking to the bank’s data-depending approach, the US Dollar could see fresh signs of life against its major counterparts.
In the case of Powell explicitly noting that the Fed has gained sufficient confidence in inflation progress while admitting loosening labor market conditions, markets are likely to ramp up bets for a big and aggressive rate cut cycle in the upcoming months. This could offer extra legs to the ongoing US Dollar downfall.
Markets are wagering as much as a full percentage point worth of rate cuts by the end of this year, per Reuters.
Dhwani Mehta, Analyst at FXStreet, offers a brief technical outlook for the US Dollar Index (DXY):
“The DXY is heavily oversold on the daily time frame, and hence, a decent recovery cannot be ruled out in the coming days. The 14-day Relative Strength Index (RSI) is trending below the 30 level, currently near 25, suggesting that upside risks remain intact for the US Dollar Index.”
“If the downtrend sustains, the next cushion is seen at the 100.50 psychological barrier, below which the 100.00 threshold will be tested. Further, the July 18, 2023, low of 99.57 will be on sellers’ radars. On the flip side, buyers need to find acceptance above the static resistance at 102.00 for an extended recovery toward the August 8 high of 103.54,” Dhwani adds.
Economic Indicator
Fed's Chair Powell speech
Jerome H. Powell took office as a member of the Board of Governors of the Federal Reserve System on May 25, 2012, to fill an unexpired term. On November 2, 2017, President Donald Trump nominated Powell to serve as the next Chairman of the Federal Reserve. Powell assumed office as Chair on February 5, 2018.
Read more.Next release: Fri Aug 23, 2024 14:00
Frequency: Irregular
Consensus: -
Previous: -
Source: Federal Reserve
Fed FAQs
Monetary policy in the US is shaped by the Federal Reserve (Fed). The Fed has two mandates: to achieve price stability and foster full employment. Its primary tool to achieve these goals is by adjusting interest rates. When prices are rising too quickly and inflation is above the Fed’s 2% target, it raises interest rates, increasing borrowing costs throughout the economy. This results in a stronger US Dollar (USD) as it makes the US a more attractive place for international investors to park their money. When inflation falls below 2% or the Unemployment Rate is too high, the Fed may lower interest rates to encourage borrowing, which weighs on the Greenback.
The Federal Reserve (Fed) holds eight policy meetings a year, where the Federal Open Market Committee (FOMC) assesses economic conditions and makes monetary policy decisions. The FOMC is attended by twelve Fed officials – the seven members of the Board of Governors, the president of the Federal Reserve Bank of New York, and four of the remaining eleven regional Reserve Bank presidents, who serve one-year terms on a rotating basis.
In extreme situations, the Federal Reserve may resort to a policy named Quantitative Easing (QE). QE is the process by which the Fed substantially increases the flow of credit in a stuck financial system. It is a non-standard policy measure used during crises or when inflation is extremely low. It was the Fed’s weapon of choice during the Great Financial Crisis in 2008. It involves the Fed printing more Dollars and using them to buy high grade bonds from financial institutions. QE usually weakens the US Dollar.
Quantitative tightening (QT) is the reverse process of QE, whereby the Federal Reserve stops buying bonds from financial institutions and does not reinvest the principal from the bonds it holds maturing, to purchase new bonds. It is usually positive for the value of the US Dollar.
- Gold finds support from former range highs and bounces ahead of speech from Fed Chairman Jerome Powell.
- The speech could solar the outlook for Fed policy on interest rates, a key driver for Gold.
- Technically, XAU/USD lifts off support and remains in an uptrend, though risks of a near-term reversal have increased.
Gold (XAU/USD) bounces past the $2,490s on Friday after pulling back down to technical support at $2,470 in the previous session. The precious metal’s recovery is aided by a weaker US Dollar (USD) – to which it is negatively correlated – and lower US Treasury yields of a longer majority (US 3-month Note yields are actually slightly higher at the time of publication), which indicate the market expects interest rates to fall in the future – a plus for Gold as it is a non-interest paying asset.
The overall outlook remains positive for Gold ahead of the key event for the day – the speech of the Chairman of the Federal Reserve (Fed), Jerome Powell, at the central banker symposium in Jackson Hole. Powell is expected to confirm market expectations that the Fed will cut interest rate cuts at its September 18 meeting.
Gold broadly supported by negative US data
Gold trades up a half of a percent after shedding over 1.0% on Thursday. Gold’s decline of the previous day was helped by a fall in the probability that the Fed will cut interest rates by a bumper 0.50% in September. From a chance of mid-30% the probability has fallen to mid-20% overnight, according to the CME FedWatch tool. Mixed Purchasing Manager Survey (PMI) data and Jobless Claims on Thursday, as well as recent prudent commentary from some Fed officials, could have been a factor in the recalibration.
Preliminary S&P Global Composite Purchasing Manager Index (PMI) data for August – which gauges activity levels in key industry sectors – fell to 54.1 from 54.3 in July, although this was not as much as the decline to 53.5 that economists had expected.
US Manufacturing PMI fell to 48.0 from 49.6 when no-change had been expected. Services, meanwhile, rose to 55.2 from 55.0, when a decline to 54.0 had been forecast.
Jobless Claims were mixed, with Initial Jobless Claims rising to 232K – slightly above the previous upwardly-revised 228K, and estimates of 230K – but Continuing Claims marginally lower than expected, though higher than previously.
Technical Analysis: Gold pulls back to top of old range and bounces
Gold (XAU/USD) corrects back down to support at the top of its old range and uses it as a launchpad for a recovery on Friday. Despite recent weakness, the short-term trend remains bullish. Given “the trend is your friend” this continues to favor longs over shorts.
XAU/USD Daily Chart
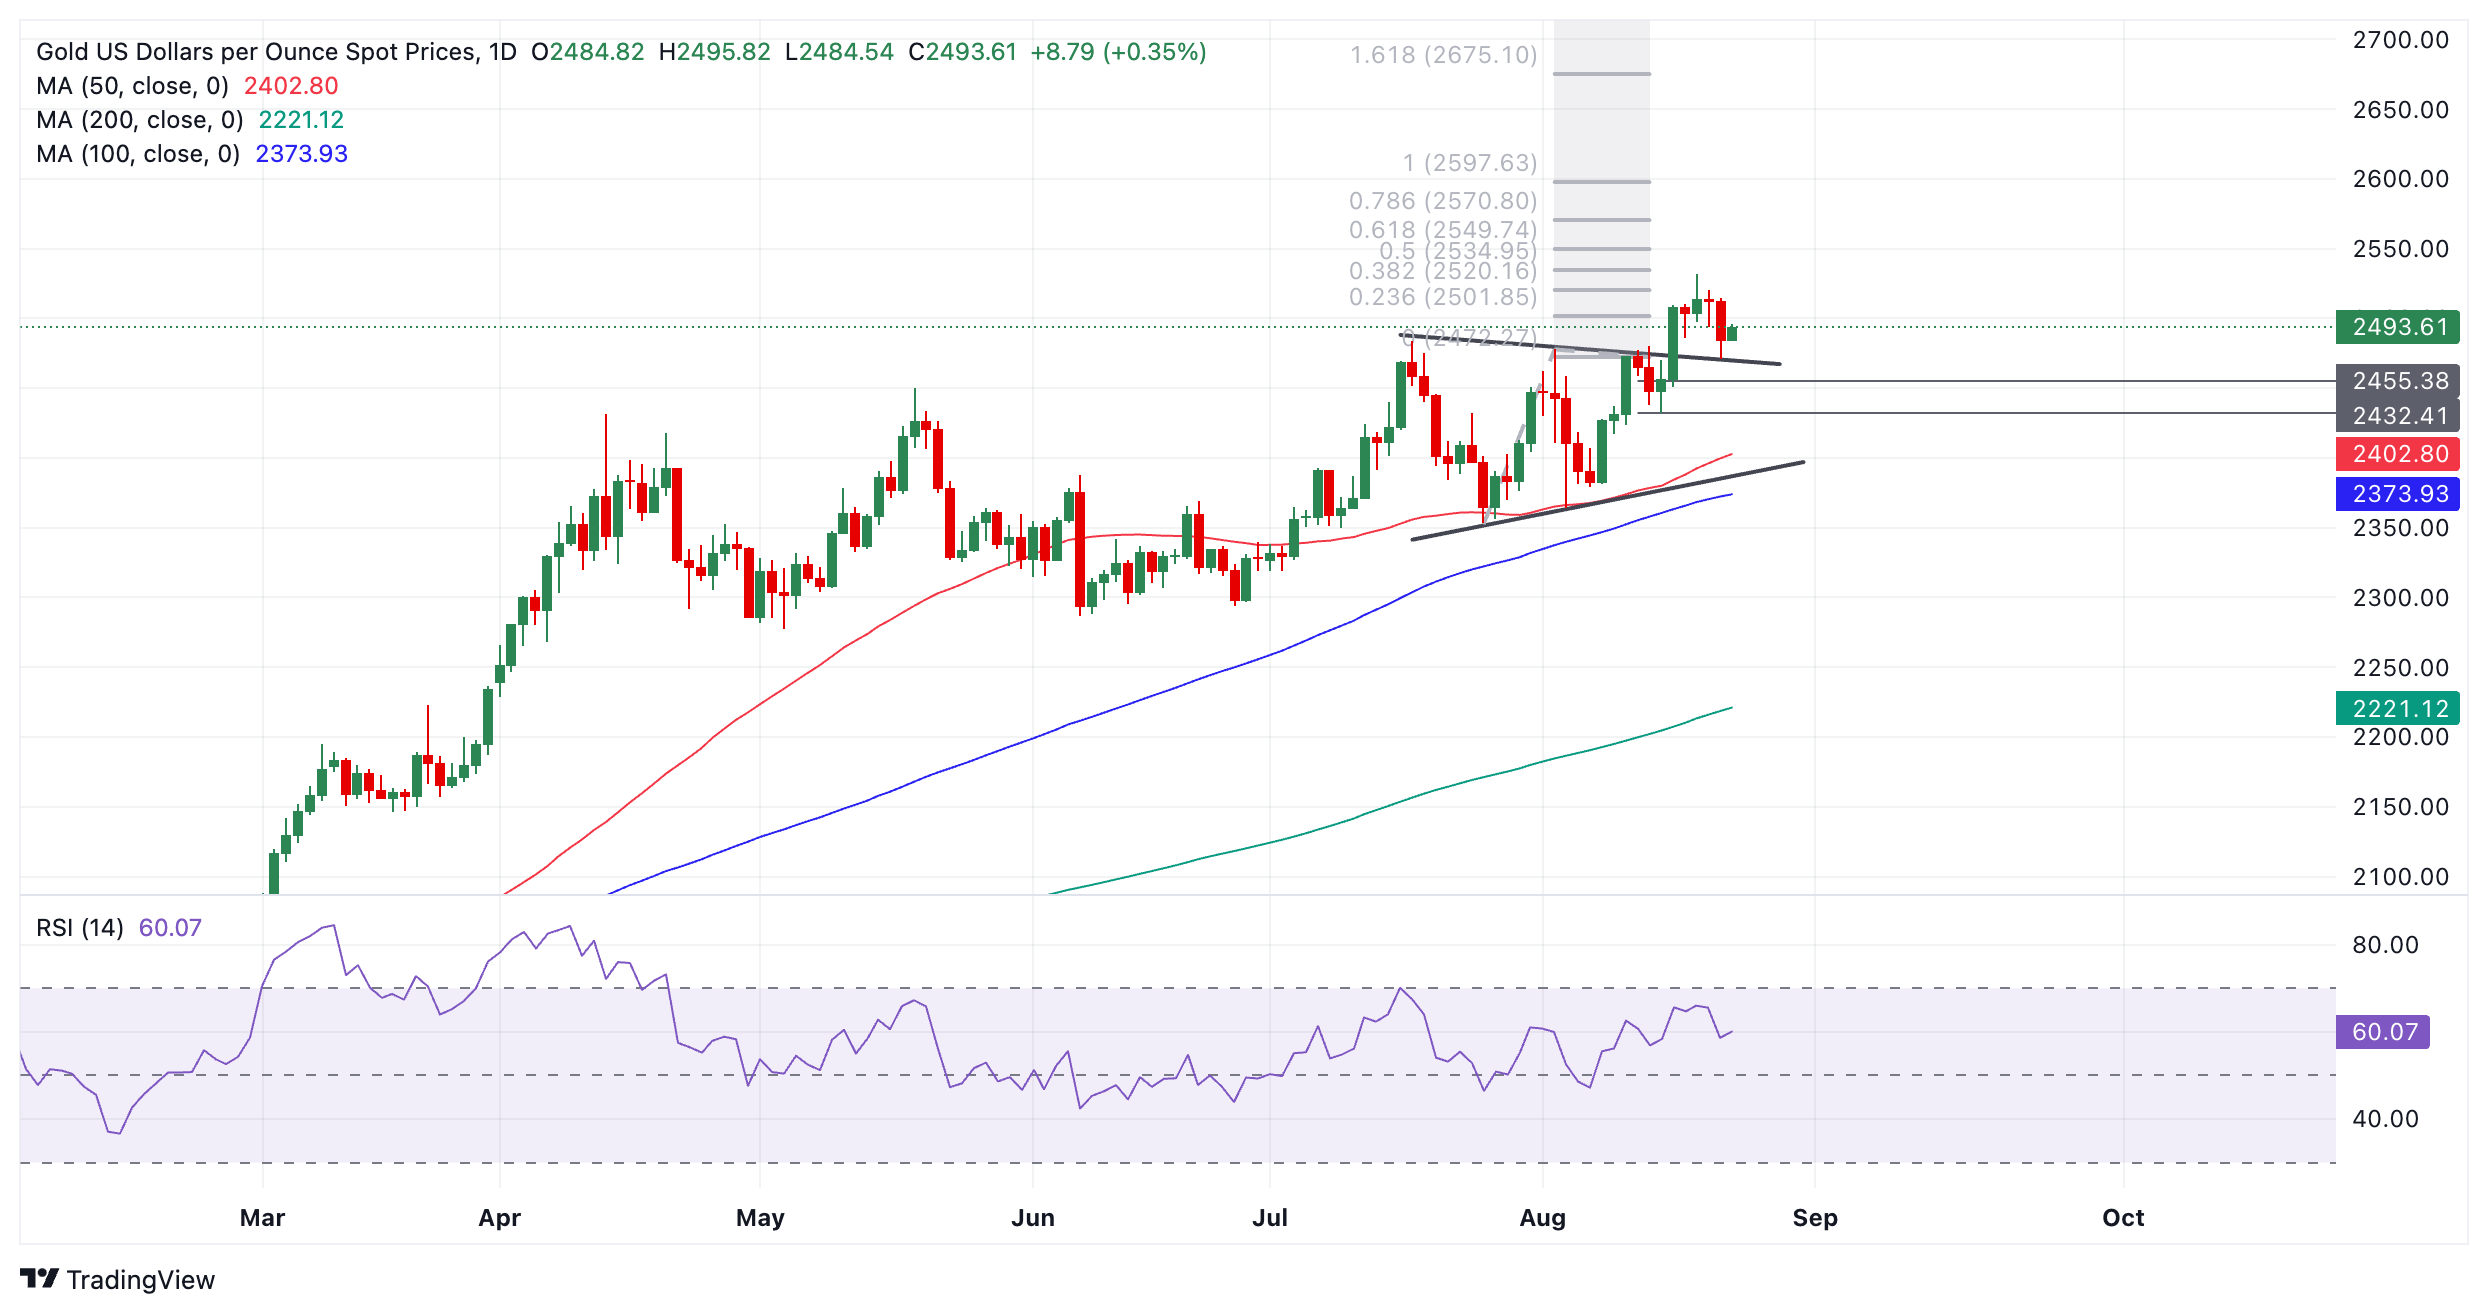
The breakout of the range on August 14 generated an upside target at roughly $2,550, calculated by taking the 0.618 Fibonacci ratio of the range’s height and extrapolating it higher. This target is the minimum expectation for a follow-through after a breakout based on principles of technical analysis.
A break back inside the range, however, could negate the upside projected target. Such a move would be confirmed on a close below $2,470 (August 22 low). It would change the picture for Gold and bring the short-term uptrend into doubt.
Gold is in a broad uptrend on medium and long-term time frames, however, which further supports an overall bullish outlook for the precious metal.
Gold FAQs
Gold has played a key role in human’s history as it has been widely used as a store of value and medium of exchange. Currently, apart from its shine and usage for jewelry, the precious metal is widely seen as a safe-haven asset, meaning that it is considered a good investment during turbulent times. Gold is also widely seen as a hedge against inflation and against depreciating currencies as it doesn’t rely on any specific issuer or government.
Central banks are the biggest Gold holders. In their aim to support their currencies in turbulent times, central banks tend to diversify their reserves and buy Gold to improve the perceived strength of the economy and the currency. High Gold reserves can be a source of trust for a country’s solvency. Central banks added 1,136 tonnes of Gold worth around $70 billion to their reserves in 2022, according to data from the World Gold Council. This is the highest yearly purchase since records began. Central banks from emerging economies such as China, India and Turkey are quickly increasing their Gold reserves.
Gold has an inverse correlation with the US Dollar and US Treasuries, which are both major reserve and safe-haven assets. When the Dollar depreciates, Gold tends to rise, enabling investors and central banks to diversify their assets in turbulent times. Gold is also inversely correlated with risk assets. A rally in the stock market tends to weaken Gold price, while sell-offs in riskier markets tend to favor the precious metal.
The price can move due to a wide range of factors. Geopolitical instability or fears of a deep recession can quickly make Gold price escalate due to its safe-haven status. As a yield-less asset, Gold tends to rise with lower interest rates, while higher cost of money usually weighs down on the yellow metal. Still, most moves depend on how the US Dollar (USD) behaves as the asset is priced in dollars (XAU/USD). A strong Dollar tends to keep the price of Gold controlled, whereas a weaker Dollar is likely to push Gold prices up.
- Silver is possibly resuming its short-term uptrend after completing a correction.
- The preceding correction took the form of a possible abc correction that looks complete.
- Silver is sideways on higher time frames.
Silver (XAG/USD) has been in a short-term uptrend since early August but after peaking on August 20 it pulled back down. This correction may have bottomed out now and the precious metal could be at the start of a resumption of the prior uptrend.
The correction possibly unfolded in the form of a three-wave abc correction. Given wave “c” reached a similar length to wave “a” the pattern has now probably finished. This makes it more likely Silver could be resuming its dominant short-term uptrend.
Silver 4-hour Chart
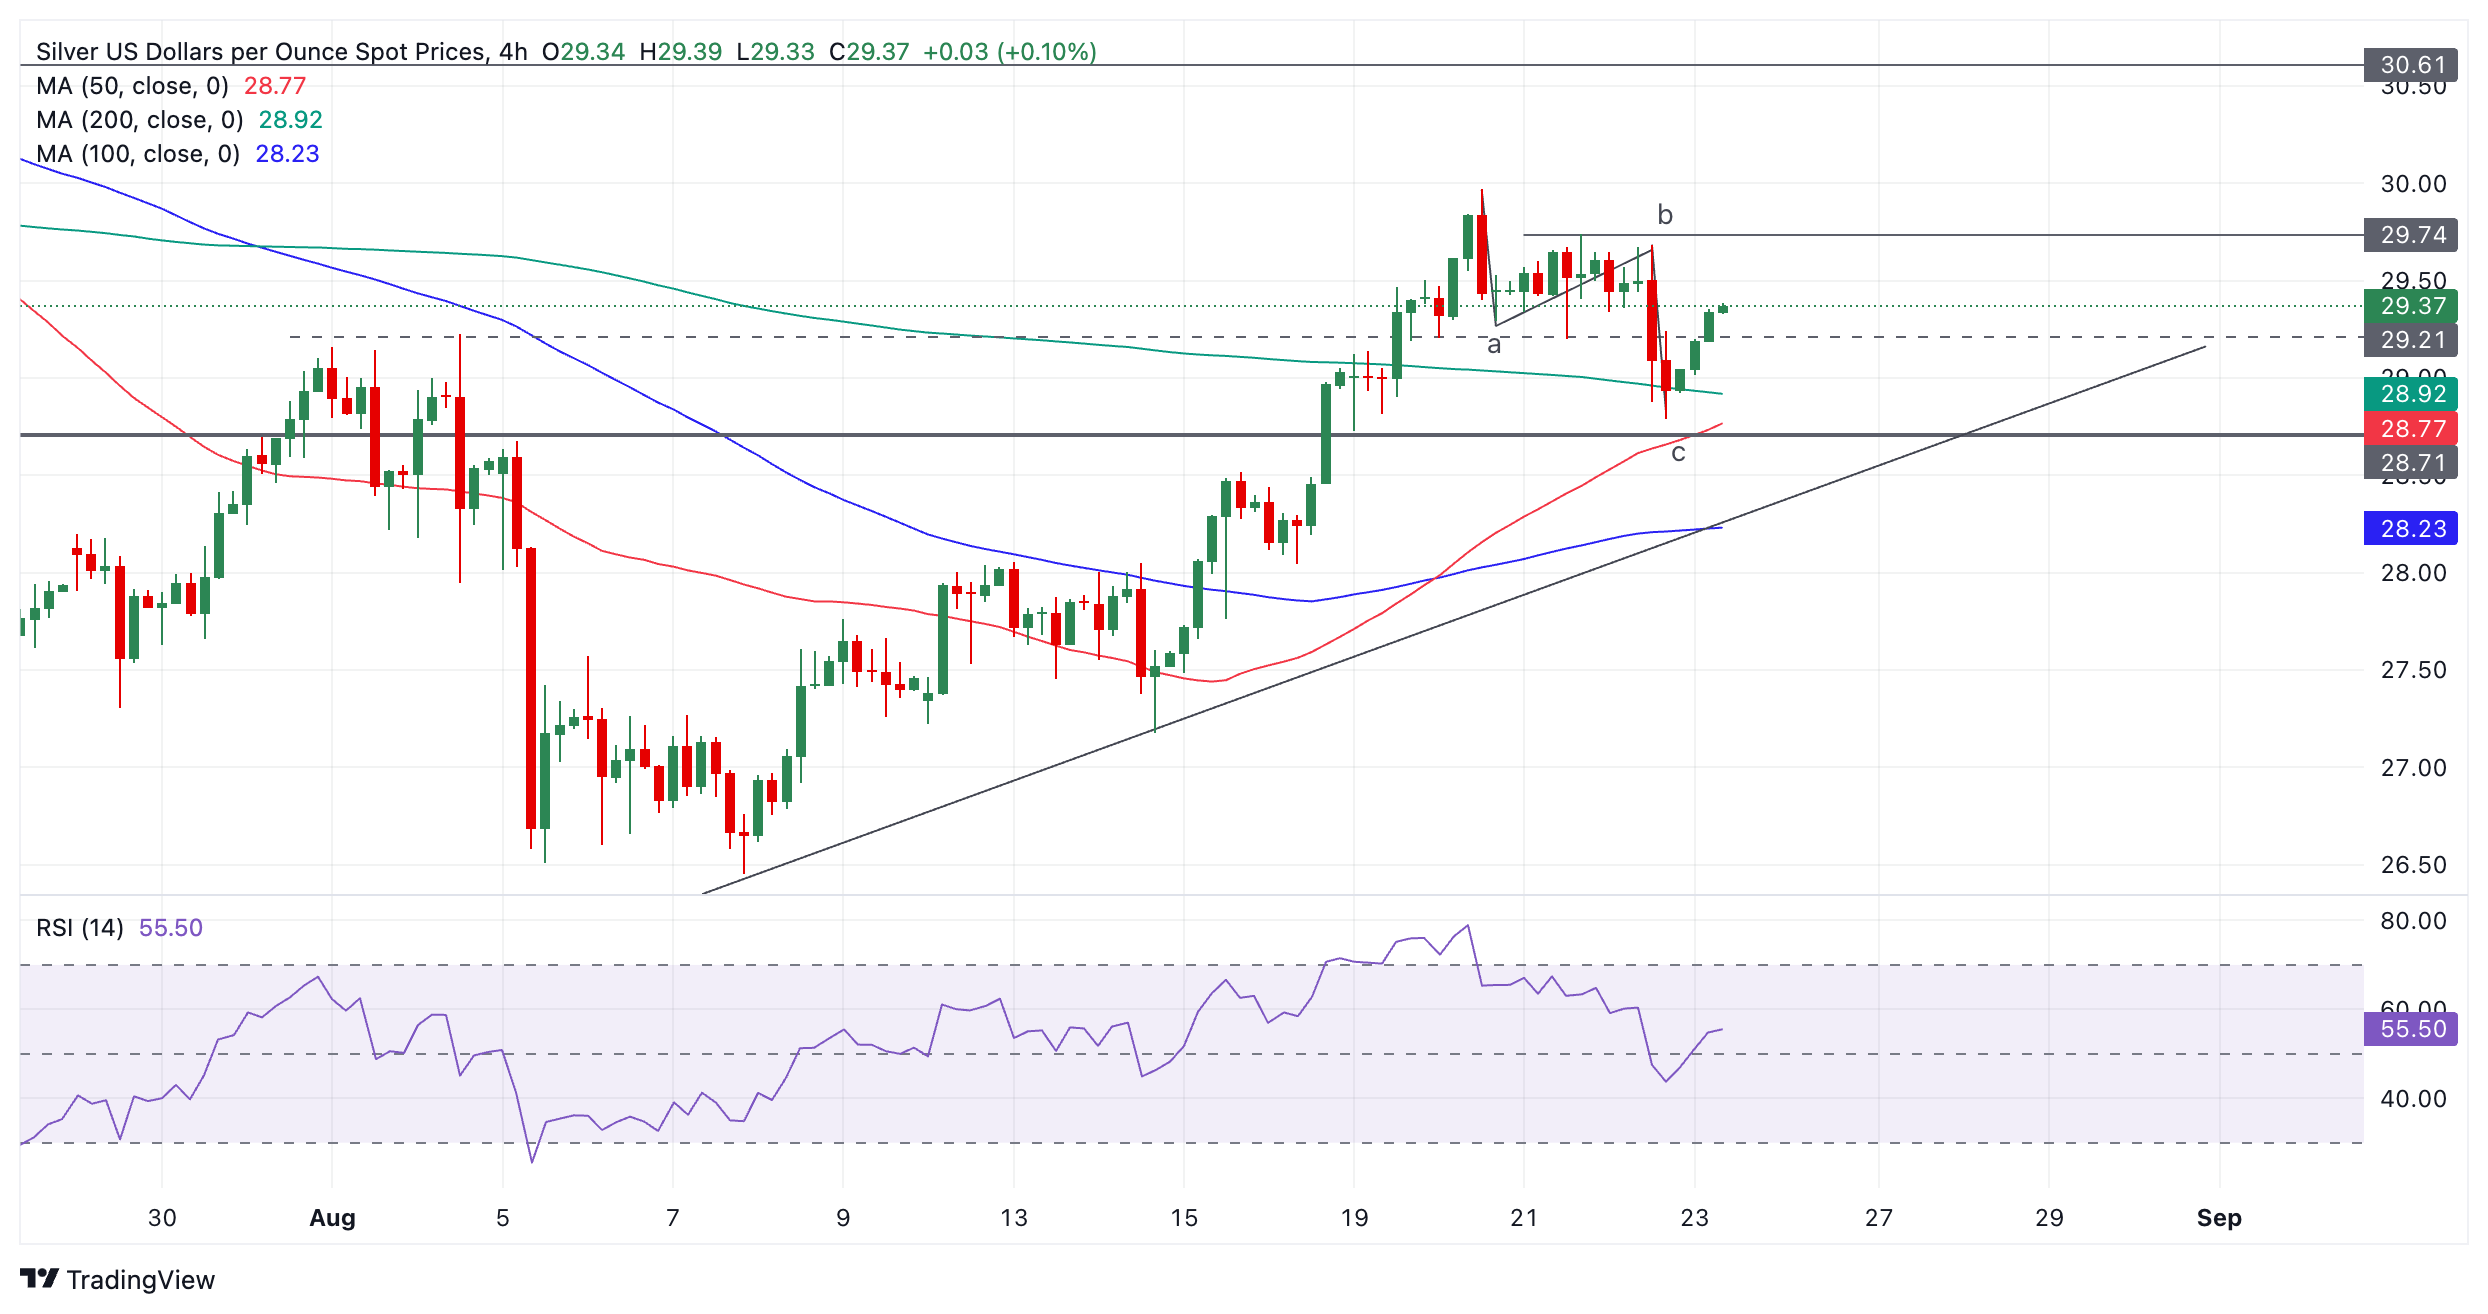
Silver has broken above resistance at $29.21 (August 2 high) and is on its way up to the next key resistance level at the top of wave “b” of the abc correction at $29.74. A break above that would provide more confirmation the uptrend was resuming.
The next upside target after that lies at the $30.61 resistance high (July 18 swing high).
The trend on the medium and longer-term charts is unclear and therefore probably sideways, indicating little directional bias from higher time frames.
- The Mexican Peso tries to find a floor after losing an average of roughly 5% in its most traded pairs so far this week.
- Weakness has come about as a result of cooler inflation data, weaker retail sales and political factors.
- Technically, USD/MXN extends its uptrend within a rising channel.
The Mexican Peso (MXN) trades just off its lows of the week on Friday after a run of three consecutive days where it lost a minimum of over 1.0% in value per day, in its three most-traded pairs (USD/MXN, EUR/MXN and GBP/MXN). This brings the Peso’s total depreciation so far this week to between 4.0% and 6.0% depending on the pair in question.
A combination of cooler-than-expected Mexican inflation data for August, weaker retails sales in July and resurfacing concerns regarding the impact of proposed changes to the Mexican constitution by the new government, are weighing.
These factors, and the unwinding of the carry trade, in which investors borrow in a currency where interest rates are low – like the Japanese Yen (JPY) – in order to purchase a currency where interest rates are high – like the Peso – (thereby pocketing the differential) are providing headwinds for the Peso.
The decline in Mexican 1st half-month inflation and core inflation in August indicates a greater chance of a further 0.25% cut in interest rates in September. Since lower interest rates are negative for a currency – as they reduce foreign capital inflows – MXN is pressured lower.
At the time of writing, one US Dollar (USD) buys 19.49 Mexican Pesos, EUR/MXN trades at 21.69, and GBP/MXN at 25.57.
Mexican Peso weakens the most against Pound Sterling
The Mexican Peso is weakening the most versus the Pound Sterling (GBP), against which it has fallen by 6.02% so far this week.
The Pound has been supported in all its pairs by higher-than-expected UK Retail Sales data and more recently, survey data from key sector purchasing managers showing upbeat activity and an optimistic outlook in the major industry groups of the economy.
The preliminary S&P Global/CIPS Composite Purchasing Manager Index (PMI) for August, for example, rose to 53.4 from 52.8 in July, and beat estimates of 52.9. Both Manufacturing and Services PMIs also rose more than expected.
MXN weakens versus Euro despite negative data
Against the Euro (EUR), the Mexican Peso has fallen 5.57% so far this week despite lackluster data out of the Eurozone.
Eurozone’s Negotiated Wage Rates growth in Q2 fell quite steeply to 3.55% from 4.74% in Q1, and German HCOB PMIs fell in August in all major sectors.
Furthermore, the large gains in French Services PMI to 55.0 from 50.1 was almost exclusively put down to the passing effect of the Paris Olympics, whilst underlying French data remained weak, according to Capital Economics.
“Part of the improvement (in Eurozone PMIs) seems to have been due to a temporary boost from the Paris Olympics. The Composite PMI for France rose to a 17-month high, entirely due to a very large increase in the services index. But the employment, output expectation, and backlog of work indices fell, suggesting that the underlying economic situation in France actually worsened,” says Franziska Palmas, Senior Europe Economist at Capital Economics.
Surprise losses against the weakening US Dollar
The Mexican Peso has fallen 4.68% against the US Dollar so far this week, despite USD itself falling to new year-to-date lows according to the US Dollar Index (DXY).
USD was pressured by increasing bets the Fed will cut rates in September. The Minutes of the Fed July policy meeting, for example, noted, “the vast majority” of participants observed that “it would likely be appropriate to ease policy at the next meeting (September 18)”.
Additionally, the downward revision of 818,000 to the Nonfarm Payroll (NFP) survey results in the 12 months to March 2024 reignited question marks about the health of the US employment market. The US PMI data for August was mixed.
Fed Chairman Jerome Powell’s speech at the central banking symposium in Jackson Hole on Friday could impact USD pairs, although he is expected to endorse the view that rate cuts are coming down the track.
Technical Analysis: USD/MXN continues rallying within rising channel
USD/MXN extends its rally within a rising channel.
After falling in a Measured Move within the channel that ended with a foreshortened final “c” wave a new leg higher within the channel has started to unfold.
USD/MXN Daily Chart
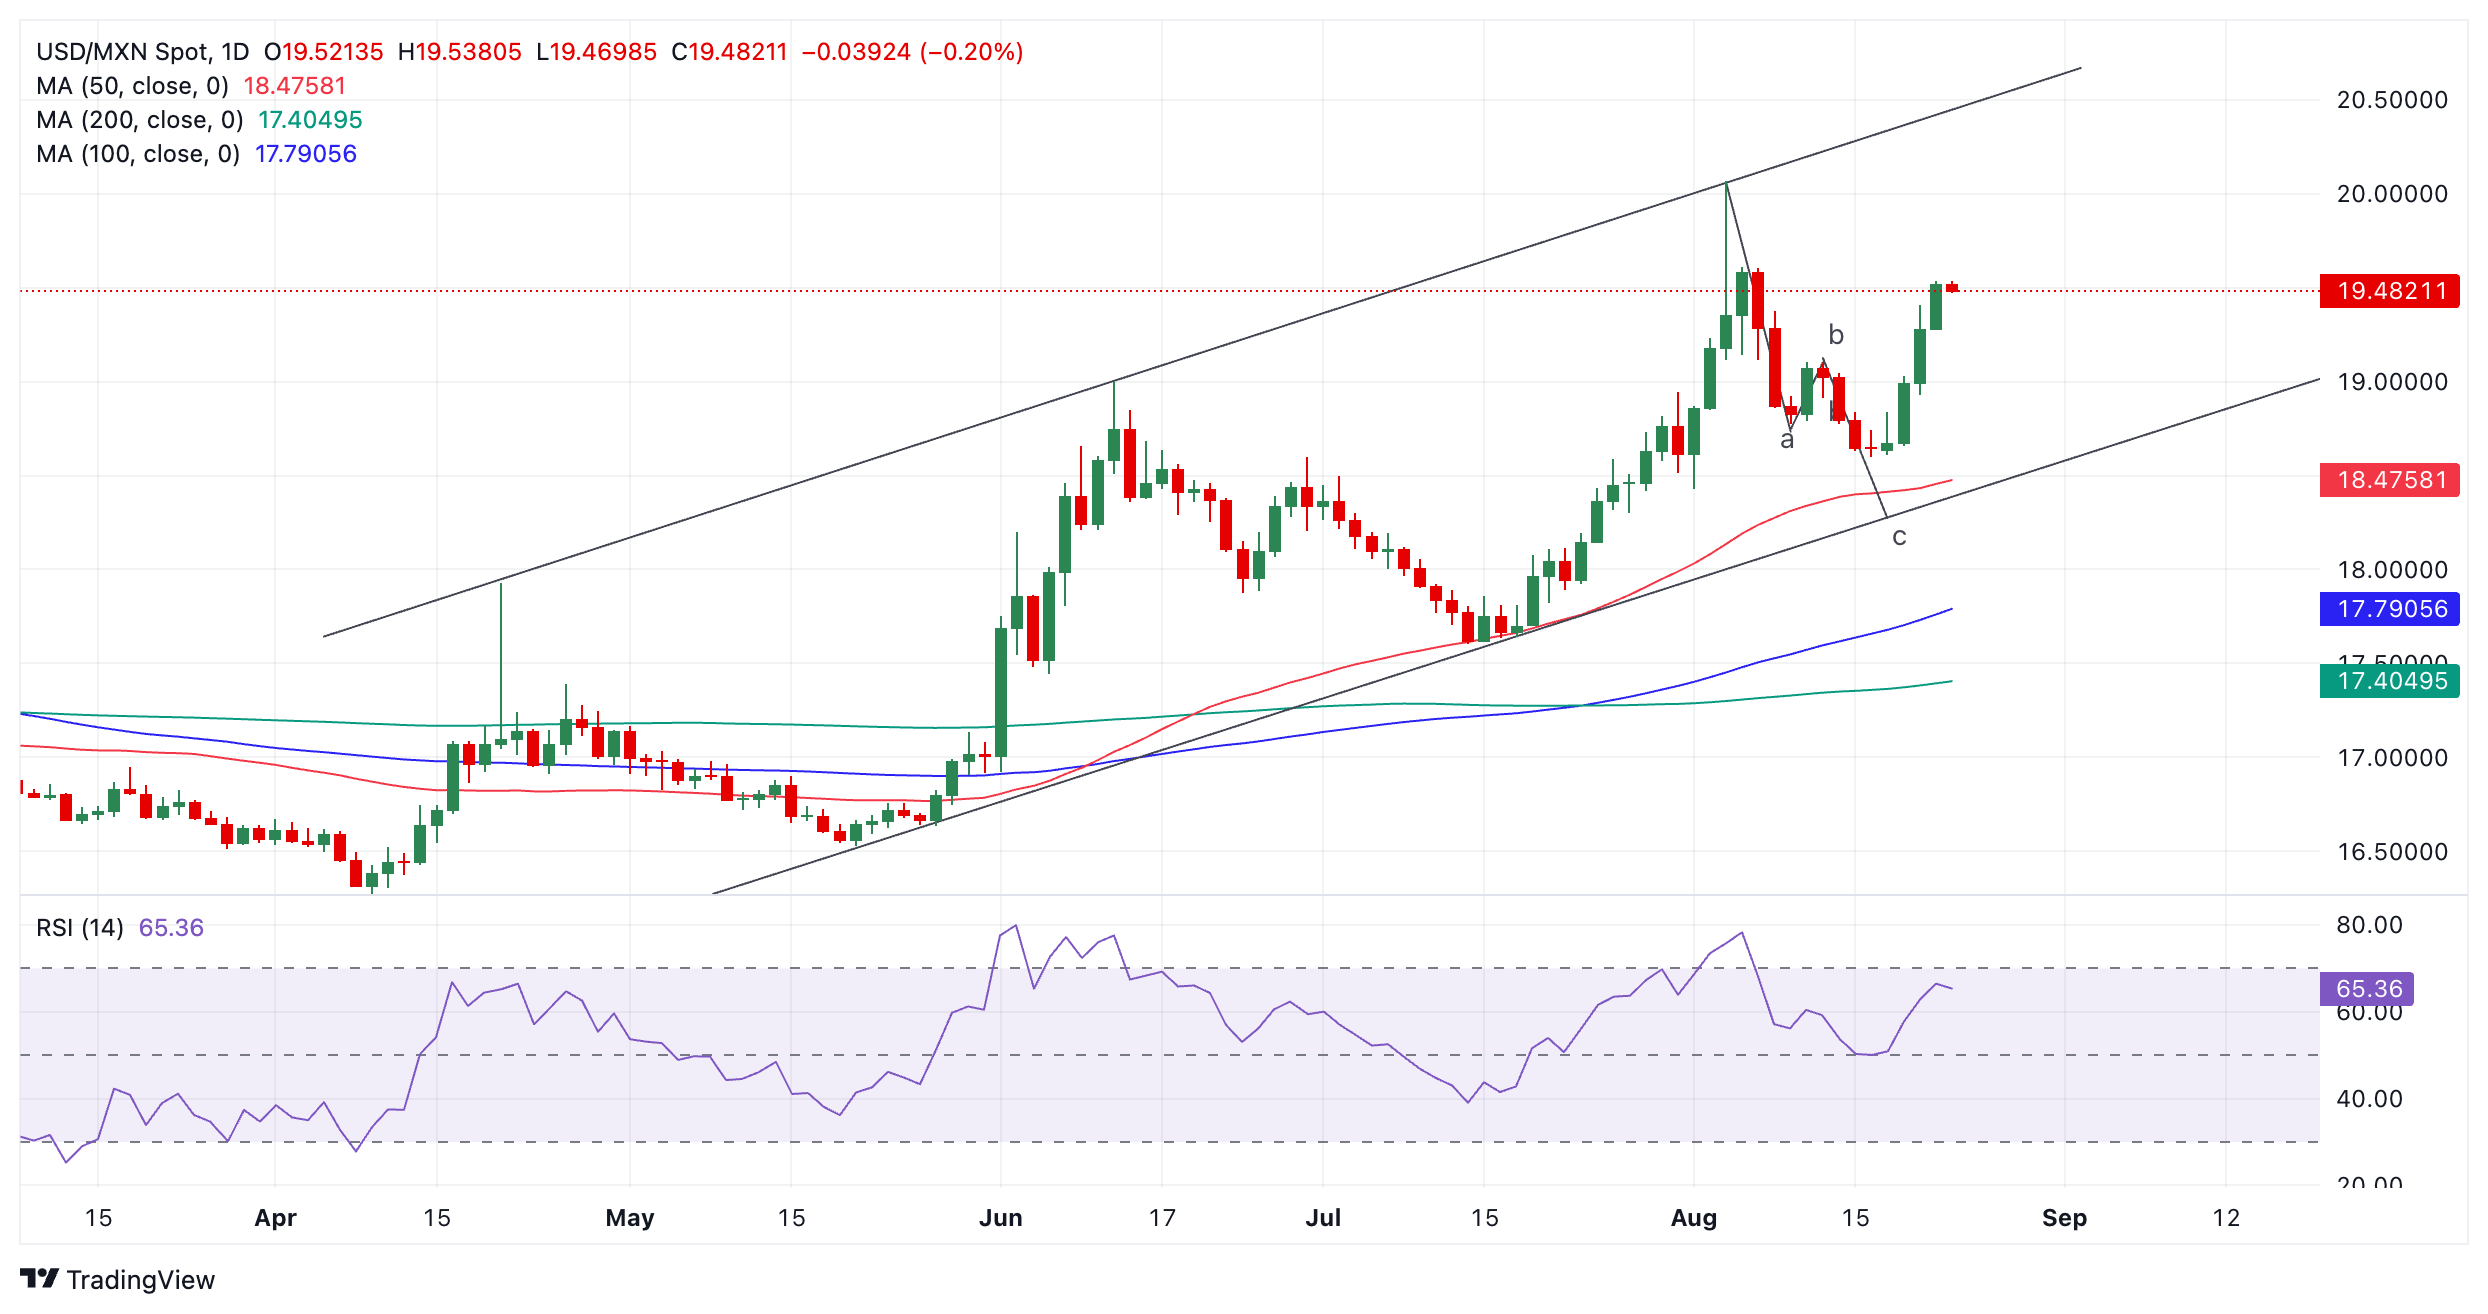
The up leg could take the pair back up to the channel highs at roughly 20.50. A break above 19.61, the August 6 high, would provide added bullish confirmation.
The overall trend on the medium and longer-term time frames is arguably up, suggesting a bullish backdrop that provides extra support to the view that a new upward move is underway.
Mexican Peso FAQs
The Mexican Peso (MXN) is the most traded currency among its Latin American peers. Its value is broadly determined by the performance of the Mexican economy, the country’s central bank’s policy, the amount of foreign investment in the country and even the levels of remittances sent by Mexicans who live abroad, particularly in the United States. Geopolitical trends can also move MXN: for example, the process of nearshoring – or the decision by some firms to relocate manufacturing capacity and supply chains closer to their home countries – is also seen as a catalyst for the Mexican currency as the country is considered a key manufacturing hub in the American continent. Another catalyst for MXN is Oil prices as Mexico is a key exporter of the commodity.
The main objective of Mexico’s central bank, also known as Banxico, is to maintain inflation at low and stable levels (at or close to its target of 3%, the midpoint in a tolerance band of between 2% and 4%). To this end, the bank sets an appropriate level of interest rates. When inflation is too high, Banxico will attempt to tame it by raising interest rates, making it more expensive for households and businesses to borrow money, thus cooling demand and the overall economy. Higher interest rates are generally positive for the Mexican Peso (MXN) as they lead to higher yields, making the country a more attractive place for investors. On the contrary, lower interest rates tend to weaken MXN.
Macroeconomic data releases are key to assess the state of the economy and can have an impact on the Mexican Peso (MXN) valuation. A strong Mexican economy, based on high economic growth, low unemployment and high confidence is good for MXN. Not only does it attract more foreign investment but it may encourage the Bank of Mexico (Banxico) to increase interest rates, particularly if this strength comes together with elevated inflation. However, if economic data is weak, MXN is likely to depreciate.
As an emerging-market currency, the Mexican Peso (MXN) tends to strive during risk-on periods, or when investors perceive that broader market risks are low and thus are eager to engage with investments that carry a higher risk. Conversely, MXN tends to weaken at times of market turbulence or economic uncertainty as investors tend to sell higher-risk assets and flee to the more-stable safe havens.
- NZD/USD attracts some dip-buying on Friday amid the dovish Fed-inspired USD weakness.
- The disappointing release of New Zealand Retail Sales data does little to hinder the move up.
- Traders now look forward to Fed Chair Powell’s speech before placing fresh directional bets.
The NZD/USD pair regains some positive traction on Friday, albeit lacks follow-through and remains confined in a three-day-old range through the early European session. Spot prices currently trade around mid-0.6100s, well within the striking distance of over a two-month peak touched on Wednesday, as traders now look to Federal Reserve (Fed) Chair Jerome Powell's speech for a fresh impetus.
Powell's remarks will be scrutinized for cues about the US central bank's policy path and whether a cooling labor market could force the Fed to announce a larger-than-normal, 50 basis points (bps) rate cut in September. The expectations were fueled by data released on Wednesday, which showed that US employers added 818K fewer jobs than reported during the year through March. Hence, the outlook will play a key role in influencing the near-term US Dollar (USD) price dynamics and determining the next leg of a directional move for the NZD/USD pair.
In the meantime, growing acceptance that the Fed will begin its policy easing cycle next month and lower borrowing costs by 100 bps by the end of this year fails to assist the USD to capitalize on the overnight recovery from the YTD low. This helps offset weaker New Zealand data, showing that Retail Sales declined more-than-expected, by 1.2% QoQ in the second quarter as compared to a 0.5% increase in the previous quarter and acts as a tailwind for the NZD/USD pair. That said, a combination of factors might cap further gains for the currency pair.
Against the backdrop of China's economic woes, renewed fears of a potential recession in the US tempers investors' appetite for riskier assets and might act as a headwind for the risk-sensitive Kiwi. This, along with the Reserve Bank of New Zealand's (RBNZ) surprise rate cut earlier this month and a dovish tilt, indicating more cuts over the coming months, might hold back traders from placing aggressive bullish bets around the NZD/USD pair. Nevertheless, spot prices remain on track to register strong gains for the fourth successive week.
US Dollar FAQs
The US Dollar (USD) is the official currency of the United States of America, and the ‘de facto’ currency of a significant number of other countries where it is found in circulation alongside local notes. It is the most heavily traded currency in the world, accounting for over 88% of all global foreign exchange turnover, or an average of $6.6 trillion in transactions per day, according to data from 2022. Following the second world war, the USD took over from the British Pound as the world’s reserve currency. For most of its history, the US Dollar was backed by Gold, until the Bretton Woods Agreement in 1971 when the Gold Standard went away.
The most important single factor impacting on the value of the US Dollar is monetary policy, which is shaped by the Federal Reserve (Fed). The Fed has two mandates: to achieve price stability (control inflation) and foster full employment. Its primary tool to achieve these two goals is by adjusting interest rates. When prices are rising too quickly and inflation is above the Fed’s 2% target, the Fed will raise rates, which helps the USD value. When inflation falls below 2% or the Unemployment Rate is too high, the Fed may lower interest rates, which weighs on the Greenback.
In extreme situations, the Federal Reserve can also print more Dollars and enact quantitative easing (QE). QE is the process by which the Fed substantially increases the flow of credit in a stuck financial system. It is a non-standard policy measure used when credit has dried up because banks will not lend to each other (out of the fear of counterparty default). It is a last resort when simply lowering interest rates is unlikely to achieve the necessary result. It was the Fed’s weapon of choice to combat the credit crunch that occurred during the Great Financial Crisis in 2008. It involves the Fed printing more Dollars and using them to buy US government bonds predominantly from financial institutions. QE usually leads to a weaker US Dollar.
Quantitative tightening (QT) is the reverse process whereby the Federal Reserve stops buying bonds from financial institutions and does not reinvest the principal from the bonds it holds maturing in new purchases. It is usually positive for the US Dollar.
- AUD/JPY loses gains as BoJ’s Ueda indicated no change in policy easing stance if the upcoming data align with forecasts.
- BoJ Governor Ueda stated that he is not considering selling long-term Japanese government bonds as a tool for adjusting rates.
- The Australian Dollar receives support from the improved risk aversion ahead of the Fed Powell’s speech.
AUD/JPY retraces its recent gains from the previous two days, trading around 97.80 during the early European hours on Friday. The Japanese Yen (JPY) strengthens following the speech by Bank of Japan (BoJ) Governor Kazuo Ueda in Parliament on Friday. Ueda stated that "the BoJ raised rates in July as the economy and inflation moved largely in line with forecasts."
BoJ Governor Ueda also indicated that there would be no change in the stance on adjusting monetary easing if the economy and inflation continue to align with forecasts. Ueda noted that recent BoJ policy decisions have been appropriate and warned that outlining the future policy path could lead to unnecessary speculation.
Ueda also stated that he is “not considering selling long-term Japanese government bonds (JGBs) as a tool for adjusting interest rates.” He noted that any reduction in JGB purchases would only account for about 7-8% of the balance sheet, which is a relatively small decrease. Ueda added that if the economy aligns with their projections, there could be a phase where they might adjust interest rates slightly further.
The downside of the AUD/JPY cross could be restrained as the Australian Dollar (AUD) receives support from improved risk-on sentiment ahead of the US Federal Reserve (Fed) Chair Jerome Powell’s speech at the Jackson Hole Symposium scheduled later on Friday. Powell may deliver a statement about the possibility of interest rate cuts in the United States (US), which is highly anticipated by market participants.
The Aussie Dollar could receive support from the hawkish mood surrounding the Reserve Bank of Australia (RBA) about its policy outlook. RBA Governor Michele Bullock expressed that the Australian central bank will not hesitate to raise rates again to combat inflation if needed. Additionally, RBA's August Meeting Minutes suggested that the cash rate might stay unchanged for an extended period.
Interest rates FAQs
Interest rates are charged by financial institutions on loans to borrowers and are paid as interest to savers and depositors. They are influenced by base lending rates, which are set by central banks in response to changes in the economy. Central banks normally have a mandate to ensure price stability, which in most cases means targeting a core inflation rate of around 2%. If inflation falls below target the central bank may cut base lending rates, with a view to stimulating lending and boosting the economy. If inflation rises substantially above 2% it normally results in the central bank raising base lending rates in an attempt to lower inflation.
Higher interest rates generally help strengthen a country’s currency as they make it a more attractive place for global investors to park their money.
Higher interest rates overall weigh on the price of Gold because they increase the opportunity cost of holding Gold instead of investing in an interest-bearing asset or placing cash in the bank. If interest rates are high that usually pushes up the price of the US Dollar (USD), and since Gold is priced in Dollars, this has the effect of lowering the price of Gold.
The Fed funds rate is the overnight rate at which US banks lend to each other. It is the oft-quoted headline rate set by the Federal Reserve at its FOMC meetings. It is set as a range, for example 4.75%-5.00%, though the upper limit (in that case 5.00%) is the quoted figure. Market expectations for future Fed funds rate are tracked by the CME FedWatch tool, which shapes how many financial markets behave in anticipation of future Federal Reserve monetary policy decisions.
- EUR/USD edges higher as the US Dollar drops as traders shift their focus to Fed Powell’s speech at the Jackson Hole Symposium.
- Investors look for fresh interest-rate guidance for September and the remainder of the year.
- The ECB is widely anticipated to cut interest rates again in September.
EUR/USD recovers mildly to near 1.1120 in Friday’s European session after correcting from a fresh year-to-date high of 1.1174 on Thursday. The major currency pair edges higher as the US Dollar (USD) resumes its recent weakness after a decent recovery move a day earlier, amid caution ahead of Federal Reserve (Fed) Chair Jerome Powell’s speech at the Jackson Hole (JH) Symposium.
The US Dollar Index (DXY), which tracks the Greenback’s value against six major currencies, drops to near 101.30 after recovering from a more-than-seven-month low of 101.00 to nearly 101.60 on Thursday. The US Dollar bounced back strongly after the flash US S&P Global PMI report for August showed that the Composite PMI came in better than estimated at 54.1. Overall, the report showed that business activity was boosted by a robust expansion in the services sector, while the manufacturing part of the economy contracted at a faster-than-expected pace.
In his speech at the JH Symposium – scheduled at 14:00 GMT – Jerome Powell is expected to provide cues on interest rates and the United States (US) economic outlook. Market participants are keen to know the size of interest rate cuts in the September meeting, given that a “vast majority” of officials said that "if the data continued to come in about as expected, it would likely be appropriate to ease policy at the next meeting,” according to Federal Open Market Committee (FOMC) minutes of July 30-31 policy meeting.
Investors also consider the chances of the US economy to achieve a “soft landing”, knowing that price pressures are on track to return to the desired rate of 2%. Fears of a potential US recession escalated after the Nonfarm Payrolls (NFP) report for July indicated a sharp slowdown in the labor demand and an increase in the Unemployment Rate to 4.3%, the highest level seen since November 2021.
Analysts don’t expect Jerome Powell to provide a preset interest rate path. However, he may call rate cuts in September as appropriate, given that risks have now expanded to both aspects of dual mandate (inflation and employment).
Daily digest market movers: EUR/USD recovers slightly as US Dollar corrects
- EUR/USD edges higher from the round-level support of 1.1100 as investors underpin the Euro (EUR) against the US Dollar. However, the Euro is underperforming against other major peers as markets increasingly expect the European Central Bank (ECB) to reduce interest rates again in September.
- Rising expectations of ECB rate cuts in September are supported by the uncertainty over the Eurozone’s economic outlook and cooling wage pressures.
- The flash Eurozone HCOB PMI report for August, released on Thursday, rose to 51.2, higher than expected, indicating that overall business activity expanded at a faster pace. However, this rosy picture signaled by the PMI surveys was linked to strong demand from the Olympic Games in Paris and it is likely to be short-lived rather than structural. Therefore, the uncertainty over the economic performance in the coming months remains intact.
- PMI data also signaled that business activity in the Eurozone’s largest economy, Germany, declined sharply mainly due to a significant drop in foreign demand, with no recovery in sight, signaling the need for fresh stimulus to boost demand.
- Meanwhile, a sharp decline in the Q2 Negotiated Wage Rates propelled hopes of more ECB rate cuts this year. The data, which was released in Thursday’s European trading hours, showed that Negotiated Wage Rates grew at a slower pace of 3.55% from 4.74% in the first quarter this year, easing fears of inflation remaining persistent.
- Economists at ING said in a note on Thursday, "The European Central Bank has remained uncomfortable with cutting interest rates while wage growth is elevated.” Lower wage growth in Q2 should help ease policymakers’ concerns in this matter.
Euro Price Today:
Euro PRICE Today
The table below shows the percentage change of Euro (EUR) against listed major currencies today. Euro was the strongest against the Swiss Franc.
| EUR | USD | GBP | JPY | CAD | AUD | NZD | CHF | |
|---|---|---|---|---|---|---|---|---|
| EUR | 0.09% | -0.08% | -0.36% | -0.08% | -0.17% | -0.13% | 0.19% | |
| USD | -0.09% | -0.17% | -0.44% | -0.16% | -0.25% | -0.45% | 0.11% | |
| GBP | 0.08% | 0.17% | -0.27% | 0.02% | -0.09% | -0.03% | 0.03% | |
| JPY | 0.36% | 0.44% | 0.27% | 0.25% | 0.17% | 0.20% | 0.31% | |
| CAD | 0.08% | 0.16% | -0.02% | -0.25% | -0.09% | -0.04% | 0.04% | |
| AUD | 0.17% | 0.25% | 0.09% | -0.17% | 0.09% | 0.05% | 0.11% | |
| NZD | 0.13% | 0.45% | 0.03% | -0.20% | 0.04% | -0.05% | 0.06% | |
| CHF | -0.19% | -0.11% | -0.03% | -0.31% | -0.04% | -0.11% | -0.06% |
The heat map shows percentage changes of major currencies against each other. The base currency is picked from the left column, while the quote currency is picked from the top row. For example, if you pick the Euro from the left column and move along the horizontal line to the US Dollar, the percentage change displayed in the box will represent EUR (base)/USD (quote).
Technical Analysis: EUR/USD remains above 1.1100
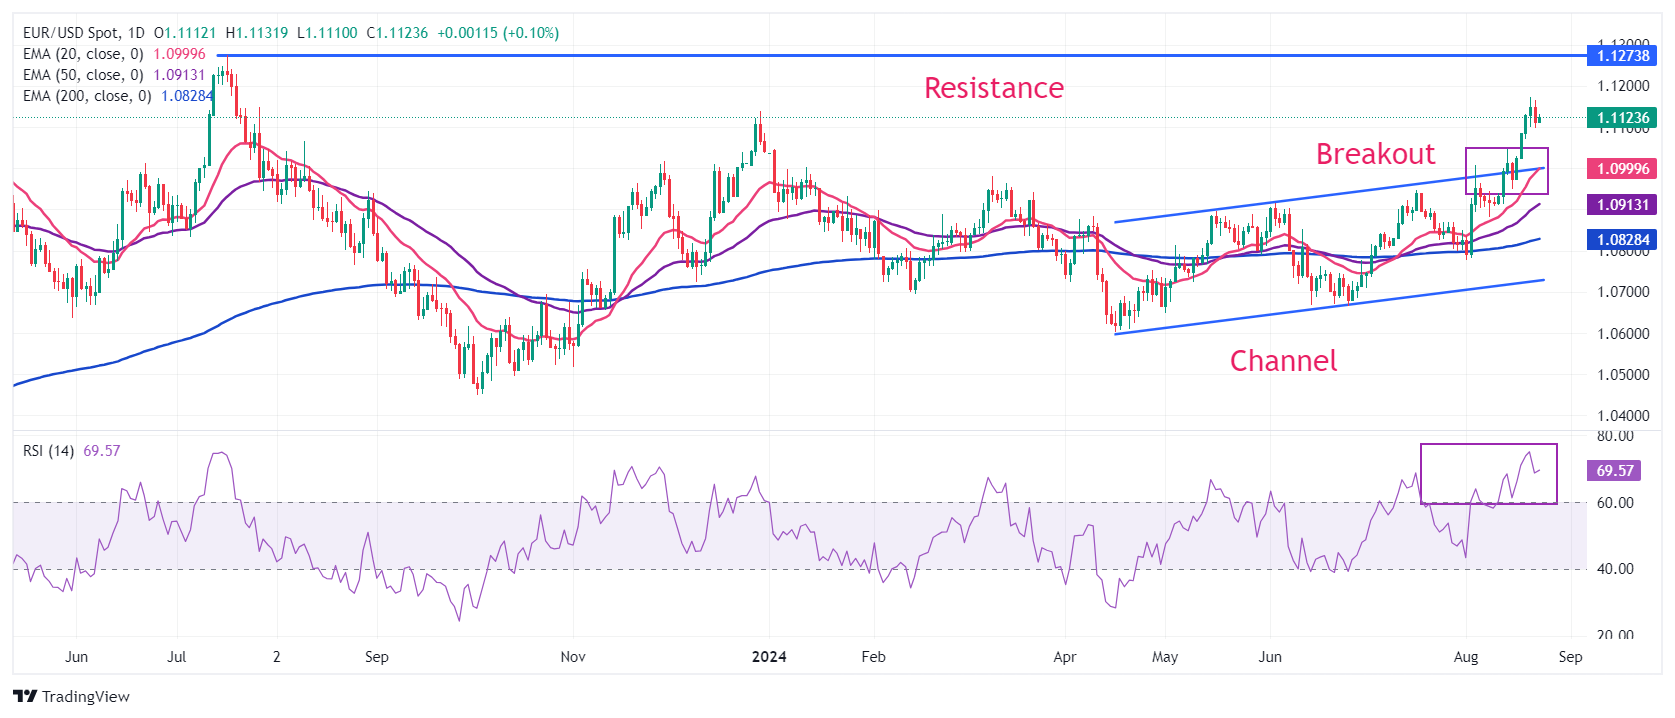
EUR/USD holds above the round-level support of 1.1100, with investors focusing on Fed Powell’s speech at the JH Symposium. The outlook of the shared currency pair has remained upbeat after a breakout of a channel formation on a daily time frame. All short-to-long-term Exponential Moving Averages (EMAs) are sloping higher, suggesting a strong uptrend.
The 14-day Relative Strength Index (RSI) oscillates in the bullish range of 60.00-80.00, touching overbought levels but still suggesting a strong upside momentum.
In case of a decisive break above the December 28, 2023, high at 1.1140, Euro bulls could aim to recapture round-level resistance of 1.1200. On the downside, the round-level figure of 1.1100 acts as a major support zone.
Euro FAQs
The Euro is the currency for the 20 European Union countries that belong to the Eurozone. It is the second most heavily traded currency in the world behind the US Dollar. In 2022, it accounted for 31% of all foreign exchange transactions, with an average daily turnover of over $2.2 trillion a day. EUR/USD is the most heavily traded currency pair in the world, accounting for an estimated 30% off all transactions, followed by EUR/JPY (4%), EUR/GBP (3%) and EUR/AUD (2%).
The European Central Bank (ECB) in Frankfurt, Germany, is the reserve bank for the Eurozone. The ECB sets interest rates and manages monetary policy. The ECB’s primary mandate is to maintain price stability, which means either controlling inflation or stimulating growth. Its primary tool is the raising or lowering of interest rates. Relatively high interest rates – or the expectation of higher rates – will usually benefit the Euro and vice versa. The ECB Governing Council makes monetary policy decisions at meetings held eight times a year. Decisions are made by heads of the Eurozone national banks and six permanent members, including the President of the ECB, Christine Lagarde.
Eurozone inflation data, measured by the Harmonized Index of Consumer Prices (HICP), is an important econometric for the Euro. If inflation rises more than expected, especially if above the ECB’s 2% target, it obliges the ECB to raise interest rates to bring it back under control. Relatively high interest rates compared to its counterparts will usually benefit the Euro, as it makes the region more attractive as a place for global investors to park their money.
Data releases gauge the health of the economy and can impact on the Euro. Indicators such as GDP, Manufacturing and Services PMIs, employment, and consumer sentiment surveys can all influence the direction of the single currency. A strong economy is good for the Euro. Not only does it attract more foreign investment but it may encourage the ECB to put up interest rates, which will directly strengthen the Euro. Otherwise, if economic data is weak, the Euro is likely to fall. Economic data for the four largest economies in the euro area (Germany, France, Italy and Spain) are especially significant, as they account for 75% of the Eurozone’s economy.
Another significant data release for the Euro is the Trade Balance. This indicator measures the difference between what a country earns from its exports and what it spends on imports over a given period. If a country produces highly sought after exports then its currency will gain in value purely from the extra demand created from foreign buyers seeking to purchase these goods. Therefore, a positive net Trade Balance strengthens a currency and vice versa for a negative balance.
Here is what you need to know on Friday, August 23:
The US Dollar (USD) Index struggles to build on the recovery gains it recorded on Thursday and retreats toward the lower limit of its weekly range. The US economic docket will feature New Home Sales data for July on Friday. More importantly, Federal Reserve (Fed) Chairman Jerome Powell will deliver a keynote speech at the Jackson Hole Symposium at 14:00 GMT.
US Dollar PRICE This week
The table below shows the percentage change of US Dollar (USD) against listed major currencies this week. US Dollar was the weakest against the New Zealand Dollar.
| USD | EUR | GBP | JPY | CAD | AUD | NZD | CHF | |
|---|---|---|---|---|---|---|---|---|
| USD | -0.88% | -1.31% | -1.40% | -0.66% | -0.78% | -1.74% | -1.65% | |
| EUR | 0.88% | -0.51% | -0.47% | 0.22% | 0.00% | -1.03% | -0.80% | |
| GBP | 1.31% | 0.51% | -0.13% | 0.69% | 0.51% | -0.46% | -0.29% | |
| JPY | 1.40% | 0.47% | 0.13% | 0.68% | 0.59% | -0.23% | -0.39% | |
| CAD | 0.66% | -0.22% | -0.69% | -0.68% | -0.14% | -1.00% | -1.02% | |
| AUD | 0.78% | -0.00% | -0.51% | -0.59% | 0.14% | -0.88% | -0.81% | |
| NZD | 1.74% | 1.03% | 0.46% | 0.23% | 1.00% | 0.88% | 0.11% | |
| CHF | 1.65% | 0.80% | 0.29% | 0.39% | 1.02% | 0.81% | -0.11% |
The heat map shows percentage changes of major currencies against each other. The base currency is picked from the left column, while the quote currency is picked from the top row. For example, if you pick the US Dollar from the left column and move along the horizontal line to the Japanese Yen, the percentage change displayed in the box will represent USD (base)/JPY (quote).
The USD outperformed its rivals on Thursday as the preliminary S&P Global PMI data for August showed that the economic activity in the private sector continued to expand at a healthy pace. Meanwhile, the risk-averse market atmosphere, as reflected by the sharp declines seen in Wall Street's main indexes, provided an additional boost to the currency. After rising 0.4% on Thursday and snapping a four-day losing streak, the USD Index stays on the back foot and was last seen losing 0.2% on the day at around 101.30. In the meantime, US stock index futures gain between 0.3% and 0.55%, pointing to an improving risk mood in the European session.
Bank of Japan (BoJ) Governor Kazuo Ueda told the Japanese parliament on Friday that there is no change in their stance about adjusting monetary easing if the economy and inflation continue to move in line with forecasts. Ueda further noted that they are not thinking about selling long-term Japanese government bonds as a tool to adjust interest rates. USD/JPY came under renewed bearish pressure following Ueda's remarks and was last seen trading at around 145.50, where it was losing 0.5% on the day. Earlier in the day, the data from Japan showed that the National Consumer Price Index rose 2.8% on a yearly basis in July, matching the flash estimate.
EUR/USD lose more than 0.3% on Thursday but managed to hold above 1.1100. The pair holds its ground early Friday and trades near 1.1120.
GBP/USD closed flat on Thursday despite the USD strength. The pair continues to stretch higher in the European morning and was last seen trading above 1.3100.
Gold extended its correction from the record-high it set earlier in the week and lost over 1% on Thursday. XAU/USD edges higher in the European morning on Friday but remains below $2,500.
Economic Indicator
Fed's Chair Powell speech
Jerome H. Powell took office as a member of the Board of Governors of the Federal Reserve System on May 25, 2012, to fill an unexpired term. On November 2, 2017, President Donald Trump nominated Powell to serve as the next Chairman of the Federal Reserve. Powell assumed office as Chair on February 5, 2018.
Read more.Next release: Fri Aug 23, 2024 14:00
Frequency: Irregular
Consensus: -
Previous: -
Source: Federal Reserve
- GBP/JPY may find immediate resistance around the 21-day EMA at 191.63.
- The daily chart analysis indicates a potential for a weakening bullish bias.
- A breach below the ascending channel could signal the emergence of a bearish bias.
GBP/JPY retraces its recent gains from the previous two days, trading around 190.90 during the Asian session on Friday. The daily chart analysis indicates that the pair is attempting to break below the lower boundary of the ascending channel, suggesting a potential for a weakening bullish bias. Additionally, the 14-day Relative Strength Index (RSI) is positioned below the 50 level, indicating that bearish momentum is in play.
The MACD (Moving Average Convergence Divergence) line is above the signal line, suggesting that there is some upward momentum in the short term. However, the MACD line is still below the zero line, signaling the overall trend is still bearish. This could indicate a potential recovery or a temporary upward movement within a broader downtrend.
In terms of resistance, the 21-day Exponential Moving Average (EMA) at 191.63 level appears as the immediate barrier. A break above the 21-day EMA could reinforce the bullish sentiment and support the pair GBP/JPY cross to explore the region around the upper boundary of the ascending channel at the 195.50 level.
On the downside, a successful breach below the ascending channel may cause the emergence of the bearish bias and put downward pressure on the GBP/JPY cross to navigate the area around the seven-month low at 180.09 level, which was recorded on August 5. Further support appears at throwback support at 178.50 level.
GBP/JPY: Daily Chart
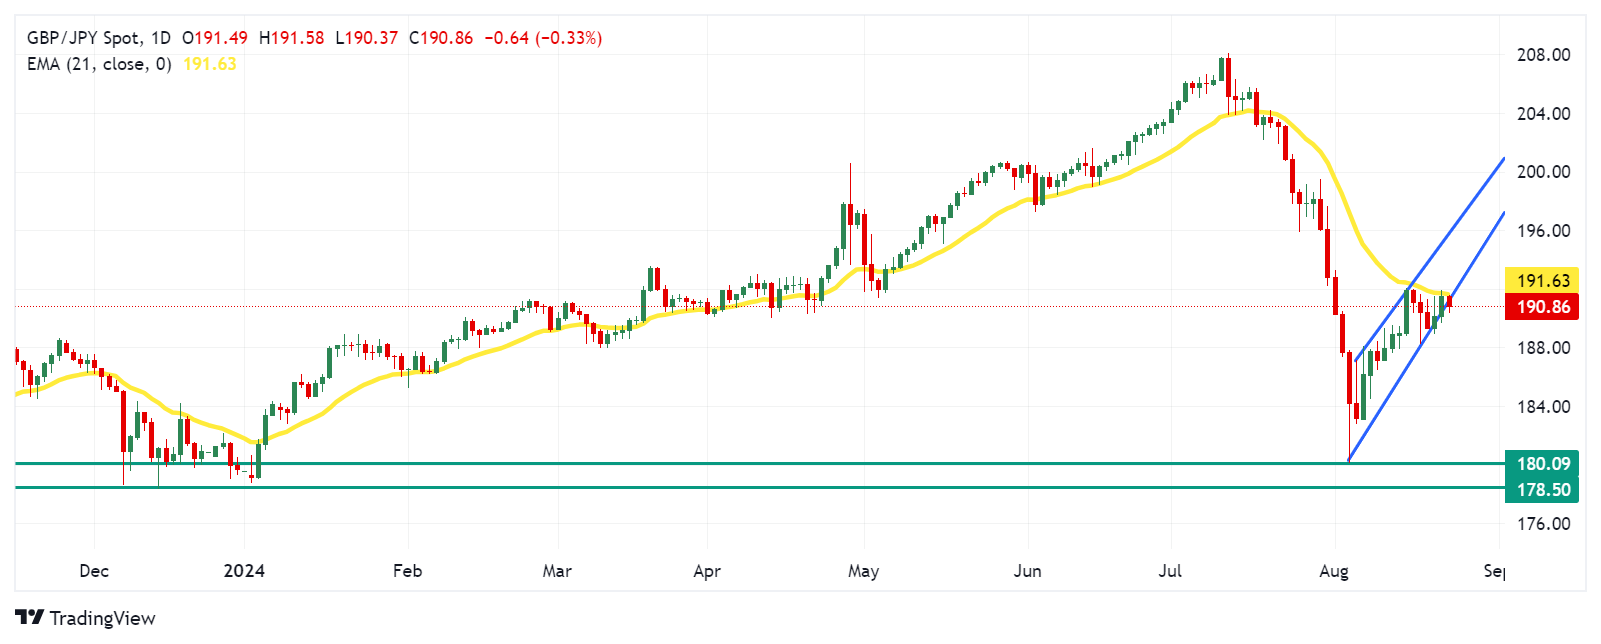
British Pound PRICE Today
The table below shows the percentage change of British Pound (GBP) against listed major currencies today. British Pound was the weakest against the Japanese Yen.
| USD | EUR | GBP | JPY | CAD | AUD | NZD | CHF | |
|---|---|---|---|---|---|---|---|---|
| USD | -0.15% | -0.25% | -0.64% | -0.19% | -0.34% | -0.57% | 0.07% | |
| EUR | 0.15% | -0.10% | -0.47% | -0.05% | -0.20% | -0.20% | 0.21% | |
| GBP | 0.25% | 0.10% | -0.40% | 0.04% | -0.10% | -0.08% | 0.07% | |
| JPY | 0.64% | 0.47% | 0.40% | 0.42% | 0.28% | 0.27% | 0.46% | |
| CAD | 0.19% | 0.05% | -0.04% | -0.42% | -0.15% | -0.13% | 0.03% | |
| AUD | 0.34% | 0.20% | 0.10% | -0.28% | 0.15% | 0.02% | 0.17% | |
| NZD | 0.57% | 0.20% | 0.08% | -0.27% | 0.13% | -0.02% | 0.15% | |
| CHF | -0.07% | -0.21% | -0.07% | -0.46% | -0.03% | -0.17% | -0.15% |
The heat map shows percentage changes of major currencies against each other. The base currency is picked from the left column, while the quote currency is picked from the top row. For example, if you pick the British Pound from the left column and move along the horizontal line to the US Dollar, the percentage change displayed in the box will represent GBP (base)/USD (quote).
- EUR/GBP trades in negative territory near 0.8485 in Friday’s early European session.
- The preliminary UK August PMI data was better than expected, pushing back the expectation of a BoE rate cut.
- Investors expect two more rate cuts from the European Central Bank (ECB) this year.
The EUR/GBP cross extends its decline near 0.8485 during the early European trading hours on Friday. The lower bets that the Bank of England (BoE) will cut the interest rate in September after the upbeat Purchasing Managers' Index (PMI) reports provide some support to the Pound Sterling (GBP) and drag the cross lower. Later on Friday, the BoE Governor Andrew Bailey’s speech will be closely watched.
Business activity in the UK showed its strongest growth in four months alongside cooling price pressures, according to a survey on Thursday. S&P Global’s Composite Purchasing Managers’ Index (PMI) rose to 53.4 in August from 52.8 in the previous month. The figure was slightly higher than the expectation of 52.9. This encouraging report scaled back investors’ bets on a BoE interest rate cut next month, which has boosted the GBP against the Euro (EUR). Financial markets are now pricing in less than 30% possibility of a BoE September rate cut after Thursday's PMI data.
On the Euro front, the European Central Bank (ECB) maintained interest rates unchanged at its July meeting, hinting at the likelihood of rate reduction later this year, according to minutes from its recent meeting released on Thursday. Investors have priced in around a 90% odds of 25 basis points (bps) cut in the deposit rate to 3.5% in September and see at least one more move before the end of the year. This, in turn, weighs on the shared currency.
The ECB Governing Council member Martins Kazaks said that he’s ready to discuss another interest rate cut at the September meeting, voicing confidence in inflation returning to 2% as well as worries over the economy.
Pound Sterling FAQs
The Pound Sterling (GBP) is the oldest currency in the world (886 AD) and the official currency of the United Kingdom. It is the fourth most traded unit for foreign exchange (FX) in the world, accounting for 12% of all transactions, averaging $630 billion a day, according to 2022 data. Its key trading pairs are GBP/USD, aka ‘Cable’, which accounts for 11% of FX, GBP/JPY, or the ‘Dragon’ as it is known by traders (3%), and EUR/GBP (2%). The Pound Sterling is issued by the Bank of England (BoE).
The single most important factor influencing the value of the Pound Sterling is monetary policy decided by the Bank of England. The BoE bases its decisions on whether it has achieved its primary goal of “price stability” – a steady inflation rate of around 2%. Its primary tool for achieving this is the adjustment of interest rates. When inflation is too high, the BoE will try to rein it in by raising interest rates, making it more expensive for people and businesses to access credit. This is generally positive for GBP, as higher interest rates make the UK a more attractive place for global investors to park their money. When inflation falls too low it is a sign economic growth is slowing. In this scenario, the BoE will consider lowering interest rates to cheapen credit so businesses will borrow more to invest in growth-generating projects.
Data releases gauge the health of the economy and can impact the value of the Pound Sterling. Indicators such as GDP, Manufacturing and Services PMIs, and employment can all influence the direction of the GBP. A strong economy is good for Sterling. Not only does it attract more foreign investment but it may encourage the BoE to put up interest rates, which will directly strengthen GBP. Otherwise, if economic data is weak, the Pound Sterling is likely to fall.
Another significant data release for the Pound Sterling is the Trade Balance. This indicator measures the difference between what a country earns from its exports and what it spends on imports over a given period. If a country produces highly sought-after exports, its currency will benefit purely from the extra demand created from foreign buyers seeking to purchase these goods. Therefore, a positive net Trade Balance strengthens a currency and vice versa for a negative balance.
FX option expiries for Aug 23 NY cut at 10:00 Eastern Time, via DTCC, can be found below.
EUR/USD: EUR amounts
- 1.0900 681m
- 1.1000 919m
- 1.1050 675m
- 1.1100 1.2b
- 1.1140 638m
GBP/USD: GBP amounts
- 1.2950 421m
- 1.3100 598m
USD/JPY: USD amounts
- 142.00 695m
- 146.00 626m
- 146.25 613m
USD/CAD: USD amounts
- 1.3600 700m
- 1.3700 735m
- 1.3800 1.1b
Bank of Japan (BoJ) Governor Kazuo Ueda spoke in the Japanese parliament on Friday, noting that he is “not thinking about selling long-term JGBs as a tool to adjust interest rates.”
Additional quotes
Reduction in JGB purchases would represent just 7-8% of balance sheet, not large reduction.
If economy moves in line with our projection, there will be phase where we can adjust interest rates a little further.
Communicating with overseas counterparts through various ways.
Believe Deputy Gov Uchida's remarks in August were appropriate.
Basic stance is monitor how market moves affect economy when considering monetary policy ahead.
No comment on rulung party lawmakers' remarks on monetary policy before July meeting.
July decision followed our thorough analysis on economy, price situations.
- USD/CHF depreciates as traders expect a dovish statement on policy outlook by the Fed’s Powell.
- The decline in the US Treasury yields contributes to the downward pressure on the US Dollar.
- The safe-haven CHF may extend its gain due to the ongoing deadlock in securing a truce between Israel and Hamas.
USD/CHF edges lower as the US Dollar (USD) loses ground ahead of the US Federal Reserve (Fed) Chair Jerome Powell’s speech at the Jackson Hole Symposium scheduled later in the North American session. Powell may deliver a statement about the possibility of interest rate cuts in the United States (US), which is highly anticipated by market participants. The USD/CHF pair trades around 0.8520 during the Asian session on Friday.
The US Dollar Index (DXY), which measures the value of the US Dollar against its six major peers, faces challenges amid declining US Treasury yields. The DXY trades around 101.30 with 2-year and 10-year yields on US bond coupons standing at 3.99% and 3.85%, respectively, at the time of writing.
On Thursday, Federal Reserve Bank of Boston President Susan Collins indicated that it will soon be appropriate to start cutting rates, emphasizing that incoming data will guide the pace of these cuts. Meanwhile, Kansas City Fed President Jeff Schmid mentioned that he is closely examining the factors behind the rise in the unemployment rate and will rely on data to determine whether to support a rate reduction next month.
The Swiss Franc (CHF) may advance further due to safe-haven flows due to the ongoing deadlock in securing a truce between Israel and Hamas. The stalemate increases the risk of a broader conflict in the Middle East. Disagreements over Israel's military presence in Gaza and Palestinian prisoner releases are hindering progress on a ceasefire and hostage deal.
Sources, including two Hamas officials and three Western diplomats, indicate that these disputes have arisen from additional demands introduced by Israel after Hamas initially accepted a ceasefire proposal, according to Reuters.
Commerzbank FX Analyst Michael Pfister expects moderate weakness for the Swiss franc (CHF) in the near term, forecasting that the Swiss National Bank (SNB) will likely reduce interest rates further. However, Pfister emphasized to remember that global demand for safe-haven assets may remain strong due to ongoing uncertainties.
Swiss Franc FAQs
The Swiss Franc (CHF) is Switzerland’s official currency. It is among the top ten most traded currencies globally, reaching volumes that well exceed the size of the Swiss economy. Its value is determined by the broad market sentiment, the country’s economic health or action taken by the Swiss National Bank (SNB), among other factors. Between 2011 and 2015, the Swiss Franc was pegged to the Euro (EUR). The peg was abruptly removed, resulting in a more than 20% increase in the Franc’s value, causing a turmoil in markets. Even though the peg isn’t in force anymore, CHF fortunes tend to be highly correlated with the Euro ones due to the high dependency of the Swiss economy on the neighboring Eurozone.
The Swiss Franc (CHF) is considered a safe-haven asset, or a currency that investors tend to buy in times of market stress. This is due to the perceived status of Switzerland in the world: a stable economy, a strong export sector, big central bank reserves or a longstanding political stance towards neutrality in global conflicts make the country’s currency a good choice for investors fleeing from risks. Turbulent times are likely to strengthen CHF value against other currencies that are seen as more risky to invest in.
The Swiss National Bank (SNB) meets four times a year – once every quarter, less than other major central banks – to decide on monetary policy. The bank aims for an annual inflation rate of less than 2%. When inflation is above target or forecasted to be above target in the foreseeable future, the bank will attempt to tame price growth by raising its policy rate. Higher interest rates are generally positive for the Swiss Franc (CHF) as they lead to higher yields, making the country a more attractive place for investors. On the contrary, lower interest rates tend to weaken CHF.
Macroeconomic data releases in Switzerland are key to assessing the state of the economy and can impact the Swiss Franc’s (CHF) valuation. The Swiss economy is broadly stable, but any sudden change in economic growth, inflation, current account or the central bank’s currency reserves have the potential to trigger moves in CHF. Generally, high economic growth, low unemployment and high confidence are good for CHF. Conversely, if economic data points to weakening momentum, CHF is likely to depreciate.
As a small and open economy, Switzerland is heavily dependent on the health of the neighboring Eurozone economies. The broader European Union is Switzerland’s main economic partner and a key political ally, so macroeconomic and monetary policy stability in the Eurozone is essential for Switzerland and, thus, for the Swiss Franc (CHF). With such dependency, some models suggest that the correlation between the fortunes of the Euro (EUR) and the CHF is more than 90%, or close to perfect.
Gold prices rose in India on Friday, according to data compiled by FXStreet.
The price for Gold stood at 6,727.50 Indian Rupees (INR) per gram, up compared with the INR 6,702.95 it cost on Thursday.
The price for Gold increased to INR 78,468.18 per tola from INR 78,181.86 per tola a day earlier.
| Unit measure | Gold Price in INR |
|---|---|
| 1 Gram | 6,727.50 |
| 10 Grams | 67,274.95 |
| Tola | 78,468.18 |
| Troy Ounce | 209,248.60 |
FXStreet calculates Gold prices in India by adapting international prices (USD/INR) to the local currency and measurement units. Prices are updated daily based on the market rates taken at the time of publication. Prices are just for reference and local rates could diverge slightly.
Gold FAQs
Gold has played a key role in human’s history as it has been widely used as a store of value and medium of exchange. Currently, apart from its shine and usage for jewelry, the precious metal is widely seen as a safe-haven asset, meaning that it is considered a good investment during turbulent times. Gold is also widely seen as a hedge against inflation and against depreciating currencies as it doesn’t rely on any specific issuer or government.
Central banks are the biggest Gold holders. In their aim to support their currencies in turbulent times, central banks tend to diversify their reserves and buy Gold to improve the perceived strength of the economy and the currency. High Gold reserves can be a source of trust for a country’s solvency. Central banks added 1,136 tonnes of Gold worth around $70 billion to their reserves in 2022, according to data from the World Gold Council. This is the highest yearly purchase since records began. Central banks from emerging economies such as China, India and Turkey are quickly increasing their Gold reserves.
Gold has an inverse correlation with the US Dollar and US Treasuries, which are both major reserve and safe-haven assets. When the Dollar depreciates, Gold tends to rise, enabling investors and central banks to diversify their assets in turbulent times. Gold is also inversely correlated with risk assets. A rally in the stock market tends to weaken Gold price, while sell-offs in riskier markets tend to favor the precious metal.
The price can move due to a wide range of factors. Geopolitical instability or fears of a deep recession can quickly make Gold price escalate due to its safe-haven status. As a yield-less asset, Gold tends to rise with lower interest rates, while higher cost of money usually weighs down on the yellow metal. Still, most moves depend on how the US Dollar (USD) behaves as the asset is priced in dollars (XAU/USD). A strong Dollar tends to keep the price of Gold controlled, whereas a weaker Dollar is likely to push Gold prices up.
(An automation tool was used in creating this post.)
- GBP/USD gathers strength near 1.3105 in Friday’s early European session.
- Fed’s Collins said it will soon be appropriate to start cutting rates as data amid progress on inflation.
- The first reading of UK August PMI data came in stronger than expected, pushing back the expectation of a BoE rate cut.
The GBP/USD pair trades in positive territory for the seventh consecutive day near 1.3105 during the early European session on Friday. The confidence of investors that the US Federal Reserve (Fed) will start easing monetary policy in the upcoming September meeting continues to undermine the US Dollar (USD) broadly.
The Bank of England (BoE) Governor Andrew Bailey and Fed Chair Jerome Powell's speech at the Jackson Hole Symposium on Friday will be in the spotlight and might give a clearer direction about the interest rate path. The minutes of the July 30-31 FOMC meeting showed that the majority of Fed policymakers backed the case for a rate cut next month amid progress in bringing down inflation to the target. On Thursday, Boston Fed President Susan Collins said that it will soon be appropriate to start cutting rates as data on inflation are consistent with more confidence inflation getting back to 2%.
On the other hand, investors slightly pushed back their expectations on a Bank of England (BoE) interest rate cut in September after the upbeat Purchasing Managers' Index (PMI) reports. This, in turn, further boosts the Pound Sterling (GBP) against the Greenback. Data released by the Chartered Institute of Procurement & Supply and S&P Global on Thursday showed that preliminary UK Composite PMI beat the estimation, jumping to 53.4 in August from 52.8 in July.
Meanwhile, Manufacturing PMI rose to 52.5 in August versus 52.1 prior, better than the 52.1 expected. The Services figure climbed to 53.3 in the same month from 52.5 in July, above the consensus of 52.8. The markets are now pricing in less than 30% odds of a BoE September rate cut after Thursday's PMI data.
Pound Sterling FAQs
The Pound Sterling (GBP) is the oldest currency in the world (886 AD) and the official currency of the United Kingdom. It is the fourth most traded unit for foreign exchange (FX) in the world, accounting for 12% of all transactions, averaging $630 billion a day, according to 2022 data. Its key trading pairs are GBP/USD, aka ‘Cable’, which accounts for 11% of FX, GBP/JPY, or the ‘Dragon’ as it is known by traders (3%), and EUR/GBP (2%). The Pound Sterling is issued by the Bank of England (BoE).
The single most important factor influencing the value of the Pound Sterling is monetary policy decided by the Bank of England. The BoE bases its decisions on whether it has achieved its primary goal of “price stability” – a steady inflation rate of around 2%. Its primary tool for achieving this is the adjustment of interest rates. When inflation is too high, the BoE will try to rein it in by raising interest rates, making it more expensive for people and businesses to access credit. This is generally positive for GBP, as higher interest rates make the UK a more attractive place for global investors to park their money. When inflation falls too low it is a sign economic growth is slowing. In this scenario, the BoE will consider lowering interest rates to cheapen credit so businesses will borrow more to invest in growth-generating projects.
Data releases gauge the health of the economy and can impact the value of the Pound Sterling. Indicators such as GDP, Manufacturing and Services PMIs, and employment can all influence the direction of the GBP. A strong economy is good for Sterling. Not only does it attract more foreign investment but it may encourage the BoE to put up interest rates, which will directly strengthen GBP. Otherwise, if economic data is weak, the Pound Sterling is likely to fall.
Another significant data release for the Pound Sterling is the Trade Balance. This indicator measures the difference between what a country earns from its exports and what it spends on imports over a given period. If a country produces highly sought-after exports, its currency will benefit purely from the extra demand created from foreign buyers seeking to purchase these goods. Therefore, a positive net Trade Balance strengthens a currency and vice versa for a negative balance.
- Silver price gains ground as market participants expect Fed’s Powell to deliver a statement about the possible rate cuts.
- Boston Fed President Susan Collins expressed her support for beginning interest rate cuts next month.
- The safe-haven Silver may advance further due to the ongoing deadlock in securing a truce between Israel and Hamas.
Silver price (XAG/USD) price moves above $29.00 per troy ounce during Friday’s Asian hours. Non-yielding Silver prices gain ground ahead of the US Federal Reserve (Fed) Chair Jerome Powell’s speech at the Jackson Hole Symposium later in the North American session. Powell may deliver a statement about the possibility of interest rate cuts in the United States (US), which is highly anticipated by market participants.
Several Federal Reserve officials have recently shown optimism about a potential rate cut next month, a perspective also reflected in the latest FOMC minutes. On Thursday, Federal Reserve Bank of Boston President Susan Collins expressed confidence that the US central bank can reduce inflation without causing a recession and indicated her support for beginning interest rate cuts next month, per Reuters.
Kansas City Fed President Jeff Schmid mentioned in an interview with broadcaster CNBC at Jackson Hole, that he is closely examining the factors behind the rise in the unemployment rate and will rely on data to determine whether to support a rate reduction next month.
CME FedWatch Tool suggests that the markets are now pricing in 73.5% odds of a 25 basis point (bps) Fed rate cut in its September meeting, up from 62.0% a day ago. The probability of a 50 basis point rate cut decreased to 26.5% from 38.0% a day earlier.
Silver, a traditional safe-haven asset, may gain support due to the ongoing deadlock in securing a truce between Israel and Hamas. The stalemate increases the risk of a broader conflict in the Middle East. Disagreements over Israel's military presence in Gaza and Palestinian prisoner releases are hindering progress on a ceasefire and hostage deal. Sources, including two Hamas officials and three Western diplomats, indicate that these disputes have arisen from additional demands introduced by Israel after Hamas initially accepted a ceasefire proposal, according to Reuters.
However, Silver demand faced challenges after recent industrial output data from China’s National Bureau of Statistics showed a struggling economy in the world’s largest manufacturing hub. Given Silver's importance in various industrial applications, this downturn in industrial demand is significant.
Silver FAQs
Silver is a precious metal highly traded among investors. It has been historically used as a store of value and a medium of exchange. Although less popular than Gold, traders may turn to Silver to diversify their investment portfolio, for its intrinsic value or as a potential hedge during high-inflation periods. Investors can buy physical Silver, in coins or in bars, or trade it through vehicles such as Exchange Traded Funds, which track its price on international markets.
Silver prices can move due to a wide range of factors. Geopolitical instability or fears of a deep recession can make Silver price escalate due to its safe-haven status, although to a lesser extent than Gold's. As a yieldless asset, Silver tends to rise with lower interest rates. Its moves also depend on how the US Dollar (USD) behaves as the asset is priced in dollars (XAG/USD). A strong Dollar tends to keep the price of Silver at bay, whereas a weaker Dollar is likely to propel prices up. Other factors such as investment demand, mining supply – Silver is much more abundant than Gold – and recycling rates can also affect prices.
Silver is widely used in industry, particularly in sectors such as electronics or solar energy, as it has one of the highest electric conductivity of all metals – more than Copper and Gold. A surge in demand can increase prices, while a decline tends to lower them. Dynamics in the US, Chinese and Indian economies can also contribute to price swings: for the US and particularly China, their big industrial sectors use Silver in various processes; in India, consumers’ demand for the precious metal for jewellery also plays a key role in setting prices.
Silver prices tend to follow Gold's moves. When Gold prices rise, Silver typically follows suit, as their status as safe-haven assets is similar. The Gold/Silver ratio, which shows the number of ounces of Silver needed to equal the value of one ounce of Gold, may help to determine the relative valuation between both metals. Some investors may consider a high ratio as an indicator that Silver is undervalued, or Gold is overvalued. On the contrary, a low ratio might suggest that Gold is undervalued relative to Silver.
- USD/CAD meets with a fresh supply on Friday amid dovish Fed-inspired USD selling bias.
- An uptick in oil prices underpins the Loonie and further contributes to the tone offered.
- Traders now look to Canadian Retail Sales data and Powell’s speech for a fresh impetus.
The USD/CAD pair struggles to capitalize on the previous day's recovery from the 1.3570 area or the lowest level since April 10 and attracts fresh sellers during the Asian session on Friday. Spot prices slide back below the 1.3600 mark in the last hour and seem vulnerable to prolonging a well-established downtrend witnessed over the past three weeks or so.
Thursday's US Dollar (USD) recovery move from the YTD low runs out of steam rather quickly amid growing acceptance that the Federal Reserve (Fed) will begin its monetary policy easing cycle soon. The bets were reaffirmed by the annual benchmark review of employment data released on Wednesday, which indicated that the US job growth over the past year to March was significantly weaker than initially estimated. This, in turn, resurfaced fears about a potential recession in the world's largest economy and fueled speculations about the possibility of a larger-than-normal, 50 basis points interest rate cut by the Fed in September. The dovish outlook puts some pressure on the US Treasury bond yields and the USD, which, in turn, is seen as a key factor dragging the USD/CAD pair lower.
Meanwhile, expectations that an interest rate cut by the Fed will boost economic activity, and fuel demand, lend some support to Crude Oil prices. This, in turn, is seen underpinning the commodity-linked currency Loonie and contributing to the offered tone surrounding the USD/CAD pair. That said, market concerns about a slowdown in the US and China – the world's two largest economies – and hopes for a ceasefire in Gaza keep a lid on any meaningful upside for Crude Oil prices. Traders might also refrain from placing aggressive USD bearish bets ahead of Fed Chair Jerome Powell's speech, which will be looked upon for cues about the interest rate trajectory.
Ahead of the key central bank event risk, the release of monthly Retail Sales data from Canada, along with Oil price dynamics, will influence the Canadian Dollar (CAD) and produce short-term trading opportunities. Nevertheless, the USD/CAD pair remains on track to register heavy losses for the third successive week. Moreover, this week's breakdown below the very important 200-day Simple Moving Average (SMA) suggests that the path of least resistance for spot prices remains to the downside.
Economic Indicator
Retail Sales (MoM)
The Retail Sales data, released by Statistics Canada on a monthly basis, measures the total value of goods sold by retailers in Canada based on a sampling of retail stores of different types and sizes. Changes in Retail Sales are widely followed as an indicator of consumer spending. Percent changes reflect the rate of changes in such sales, with the MoM reading comparing sales values in the reference month with the previous month. Generally, a high reading is seen as bullish for the Canadian Dollar (CAD), while a low reading is seen as bearish.
Read more.Next release: Fri Aug 23, 2024 12:30
Frequency: Monthly
Consensus: -0.3%
Previous: -0.8%
Source: Statistics Canada
- The Japanese Yen appreciates following the speech from the BoJ Governor Kazuo Ueda.
- Japan’s National CPI rose by 2.8% YoY in July, remaining at its highest level since February.
- Fed Chair Powell may deliver a statement about the possibility of rate cuts at the Jackson Hole Symposium.
The Japanese Yen (JPY) strengthens against the US Dollar (USD) following the release of the National Consumer Price Index (CPI) inflation data and a speech by Bank of Japan (BoJ) Governor Kazuo Ueda in Parliament on Friday. Ueda stated that "the BoJ raised rates in July as the economy and inflation moved largely in line with forecasts."
BoJ Governor Ueda also indicated that there would be no change in the stance on adjusting monetary easing if the economy and inflation continue to align with forecasts. Ueda noted that recent BoJ policy decisions have been appropriate and warned that outlining the future policy path could lead to unnecessary speculation.
The USD/JPY pair depreciates as the US Dollar receives downward pressure from lower Treasury yields. However, the Greenback gained ground following the mixed S&P Global Purchasing Managers Index (PMI) data released on Thursday.
Furthermore, the US Federal Reserve (Fed) Chair Jerome Powell is set to speak at the Jackson Hole Symposium later on Friday. Powell may deliver a statement about the possibility of interest rate cuts in the United States (US), which is highly anticipated by market participants.
Daily Digest Market Movers: Japanese Yen advances after the BoJ Governor Ueda’s speech
- Japan’s National Consumer Price Index increased by 2.8% year-on-year in July, maintaining this rate for the third consecutive month and remaining at its highest level since February. Additionally, the National CPI excluding Fresh Food rose by 2.7%, the highest reading since February, aligning with expectations.
- The US Composite PMI edged down to 54.1 in August, a four-month low, from 54.3 in July, but remained above market expectations of 53.5. This indicates continued expansion in US business activity, marking 19 consecutive months of growth.
- The S&P Global US Services PMI increased to 55.2 in August 2024, from 55.0 in July, defying expectations of a drop to 54.0. Meanwhile, the Manufacturing PMI declined to 48.0 in August from 49.6 the previous month, falling short of market expectations of 49.6 and signaling the second consecutive contraction in US factory activity at the sharpest rate this year.
- On Thursday, Federal Reserve Bank of Boston President Susan Collins expressed confidence that the US central bank can reduce inflation without causing a recession and indicated her support for beginning interest rate cuts next month. In an interview with Reuters at Jackson Hole, Collins stated, "I think there's a clear path to achieving our goals without an unnecessary downturn, and with a labor market that remains healthy."
- Kansas City Fed President Jeff Schmid mentioned in an interview with broadcaster CNBC at Jackson Hole, that he is closely examining the factors behind the rise in the unemployment rate and will rely on data to determine whether to support a rate reduction next month.
- FOMC Minutes for July’s policy meeting indicated that most Fed officials agreed last month that they would likely cut their benchmark interest rate at the upcoming meeting in September as long as inflation continued to cool.
- Japan's Merchandise Trade Balance fell into a deficit of ¥621.84 billion in July, reversing the surplus of ¥224.0 billion reported in June and missing market estimates of a ¥330.7 billion shortfall. Japan's imports surged by 16.6% year-on-year in July, reaching a 19-month high of ¥10,241.01 billion, significantly up from the 3.2% rise in June. Meanwhile, exports increased by 10.3% YoY to a seven-month high of ¥9,619.17 billion, falling short of market forecasts of 11.4%.
Technical Analysis: USD/JPY falls toward 145.50 around the downtrend line
USD/JPY trades around 145.60 on Friday. Analysis of the daily chart shows that the pair is positioned above a downtrend line, suggesting a weakening of a bearish bias. However, the 14-day Relative Strength Index (RSI) remains just above 30, indicating that the bearish trend may still be in play.
For support levels, the USD/JPY pair tests the downtrend line at the 145.50 level. A break below this level could reinforce the bearish bias and push the pair to navigate the region around the seven-month low of 141.69, which was recorded on August 5. A further drop could drive the pair toward the throwback support level at 140.25.
On the upside, the USD/JPY pair could encounter immediate resistance around the nine-day Exponential Moving Average (EMA) at the 146.46 level. A breakthrough above the nine-day EMA could support the pair to test the resistance level at 154.50, which has transitioned from previous support to current resistance.
USD/JPY: Daily Chart
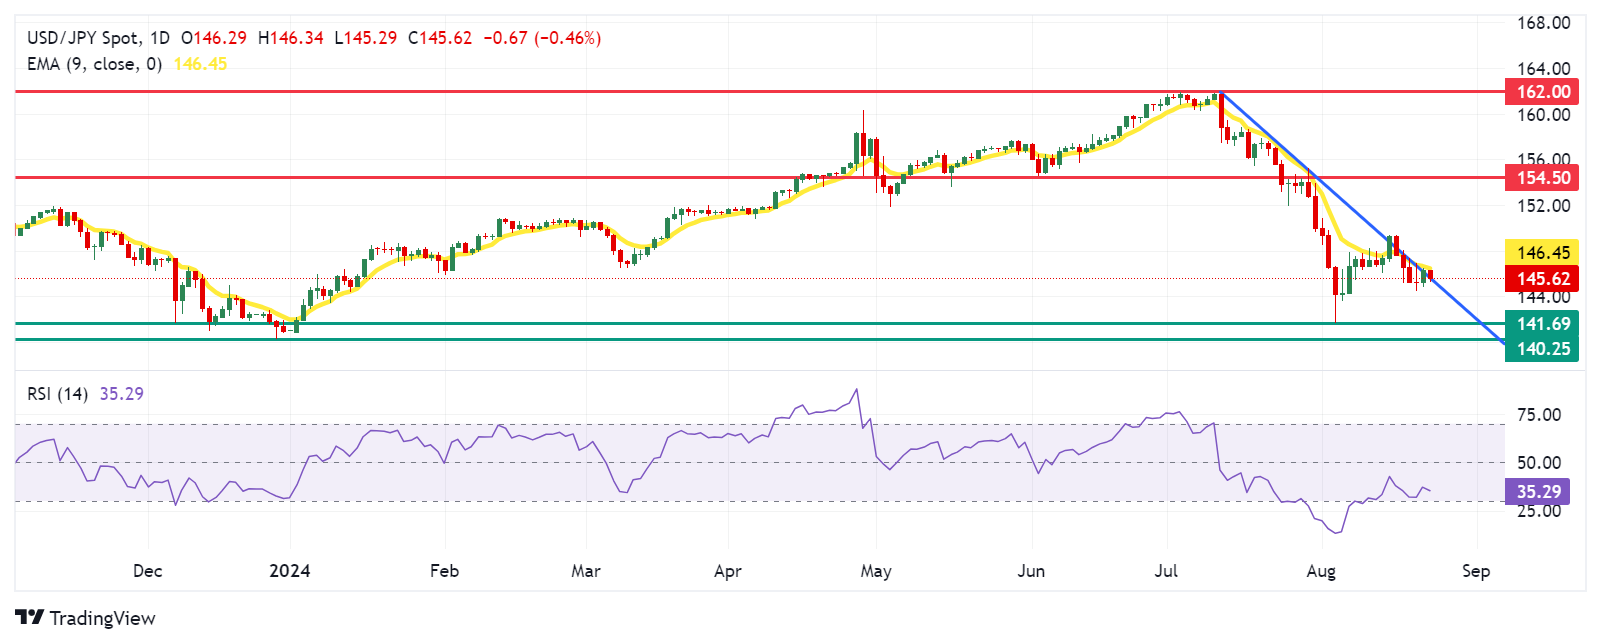
Japanese Yen PRICE Today
The table below shows the percentage change of Japanese Yen (JPY) against listed major currencies today. Japanese Yen was the strongest against the US Dollar.
| USD | EUR | GBP | JPY | CAD | AUD | NZD | CHF | |
|---|---|---|---|---|---|---|---|---|
| USD | -0.14% | -0.12% | -0.47% | -0.15% | -0.23% | -0.45% | 0.14% | |
| EUR | 0.14% | 0.02% | -0.31% | 0.00% | -0.09% | -0.07% | 0.28% | |
| GBP | 0.12% | -0.02% | -0.34% | -0.04% | -0.11% | -0.07% | 0.02% | |
| JPY | 0.47% | 0.31% | 0.34% | 0.31% | 0.24% | 0.24% | 0.38% | |
| CAD | 0.15% | -0.01% | 0.04% | -0.31% | -0.08% | -0.05% | 0.06% | |
| AUD | 0.23% | 0.09% | 0.11% | -0.24% | 0.08% | 0.03% | 0.12% | |
| NZD | 0.45% | 0.07% | 0.07% | -0.24% | 0.05% | -0.03% | 0.10% | |
| CHF | -0.14% | -0.28% | -0.02% | -0.38% | -0.06% | -0.12% | -0.10% |
The heat map shows percentage changes of major currencies against each other. The base currency is picked from the left column, while the quote currency is picked from the top row. For example, if you pick the Japanese Yen from the left column and move along the horizontal line to the US Dollar, the percentage change displayed in the box will represent JPY (base)/USD (quote).
Japanese Yen FAQs
The Japanese Yen (JPY) is one of the world’s most traded currencies. Its value is broadly determined by the performance of the Japanese economy, but more specifically by the Bank of Japan’s policy, the differential between Japanese and US bond yields, or risk sentiment among traders, among other factors.
One of the Bank of Japan’s mandates is currency control, so its moves are key for the Yen. The BoJ has directly intervened in currency markets sometimes, generally to lower the value of the Yen, although it refrains from doing it often due to political concerns of its main trading partners. The current BoJ ultra-loose monetary policy, based on massive stimulus to the economy, has caused the Yen to depreciate against its main currency peers. This process has exacerbated more recently due to an increasing policy divergence between the Bank of Japan and other main central banks, which have opted to increase interest rates sharply to fight decades-high levels of inflation.
The BoJ’s stance of sticking to ultra-loose monetary policy has led to a widening policy divergence with other central banks, particularly with the US Federal Reserve. This supports a widening of the differential between the 10-year US and Japanese bonds, which favors the US Dollar against the Japanese Yen.
The Japanese Yen is often seen as a safe-haven investment. This means that in times of market stress, investors are more likely to put their money in the Japanese currency due to its supposed reliability and stability. Turbulent times are likely to strengthen the Yen’s value against other currencies seen as more risky to invest in.
- EUR/USD attracts some dip-buying on Friday amid the dovish Fed-inspired USD slide.
- The Euro bulls seem unaffected by rising bets for more interest rate cuts by the ECB.
- Investors now look to Fed Chair Jerome Powell’s speech for some meaningful impetus.
The EUR/USD pair regains positive traction on the last day of the week and for now, seems to have stalled its pullback from the vicinity of over a one-year high touched on Wednesday. Spot prices currently trade around the 1.1125 region and draw support from the emergence of fresh selling around the US Dollar (USD).
Data published on Wednesday showed that US job growth over the past year to March was significantly weaker than initially estimated. Adding to this, a rise in the US Weekly Initial Jobless Claims further pointed to a cooling labor market, which, along with a slump in the US Manufacturing PMI, suggested that the economy is at risk of a slowdown. This, in turn, reaffirms market bets for an imminent start of the Federal Reserve's (Fed) rate-cutting cycle in September and fails to assist the USD in capitalizing on the overnight goodish rebound from the YTD low. This, to a larger extent, overshadows Thursday's mixed Eurozone PMI prints and turns out to be a key factor offering some support to the EUR/USD pair.
In fact, HCOB's preliminary composite Eurozone PMI, compiled by S&P Global, came in at 54.1 as compared to the estimates of 53.5, though marked a slight downtick from 54.3 in the previous month. That said, business activity in Germany – the Eurozone's largest economy – contracted for a second consecutive month and by more than expected. Adding to this, the negotiated wage growth in the Euro area slowed to 3.55% for Q2 2024, from 4.74% in Q1 2024. This, in turn, strengthens the case for two more rate cuts from the European Central Bank (ECB) this year. This might hold back traders from placing aggressive bullish bets around the shared currency and cap any meaningful appreciating move for the EUR/USD pair.
Meanwhile, the accounts of the ECB July policy meeting showed that the September meeting was widely seen as a good time to re-evaluate the level of monetary policy restriction. Adding to this, ECB Governing Council member Martins Kazaks voiced confidence in inflation returning to 2% as well as worries over the economy and said that he’s ready to discuss another interest rate cut at the September meeting. Hence, any subsequent move up might continue to confront some resistance, though the bearish sentiment surrounding the Greenback might continue to act as a tailwind for the EUR/USD pair.
Economic Indicator
Fed's Chair Powell speech
Jerome H. Powell took office as a member of the Board of Governors of the Federal Reserve System on May 25, 2012, to fill an unexpired term. On November 2, 2017, President Donald Trump nominated Powell to serve as the next Chairman of the Federal Reserve. Powell assumed office as Chair on February 5, 2018.
Read more.Next release: Fri Aug 23, 2024 14:00
Frequency: Irregular
Consensus: -
Previous: -
Source: Federal Reserve
- EUR/JPY loses momentum around 161.95 in Friday’s Asian session.
- BoJ’s Ueda reaffirmed his resolve to hike, if inflation stayed on course to sustainably hit the 2% target.
- ECB’s Kazaks said he’s ready to discuss another interest rate cut at the September meeting.
The EUR/JPY cross weakens to near 161.95, snapping the two-day winning streak on Friday during the Asian trading hours. The Japanese Yen (JPY) strengthens amid hawkish remarks from the Bank of Japan’s (BoJ) Governor Kazuo Ueda.
BoJ Governor Kazuo Ueda told the Japanese parliament on Friday that the Japanese central bank raised the interest rate in July as the economy and inflation moved in line with price target protections. Ueda further stated that he expects to adjust policy if the economy moves as planned while saying that the BoJ's policy path to a neutral interest rate remains highly uncertain. Hawkish remarks from Japanese authorities are likely to support the JPY in the near term.
Additionally, Japan’s Consumer Price Index (CPI) inflation in July remained above the BoJ’s 2% target, heightening expectations for the Japanese central bank to raise rates again. The Core CPI inflation, which strips out prices of fresh food, rose to 2.7% YoY in July from 2.6% in June, in line with the market expectation. The headline National CPI climbed 2.8% YoY in July, compared to 2.8% in the previous reading, the Japan Statistics Bureau reported on Friday.
On the other hand, investors anticipate the European Central Bank (ECB) to further loosen its monetary policy, which weighs on the Euro (EUR). The markets have priced in nearly a 90% chance of a 25 basis points (bps) cut in the deposit rate to 3.5% in September and see at least one more move before the end of the year. European Central Bank (ECB) Governing Council member Martins Kazaks said on Thursday that he’s ready to discuss another interest rate cut at the September meeting, voicing confidence in inflation returning to 2% as well as worries over the economy, per Bloomberg.
Japanese Yen FAQs
The Japanese Yen (JPY) is one of the world’s most traded currencies. Its value is broadly determined by the performance of the Japanese economy, but more specifically by the Bank of Japan’s policy, the differential between Japanese and US bond yields, or risk sentiment among traders, among other factors.
One of the Bank of Japan’s mandates is currency control, so its moves are key for the Yen. The BoJ has directly intervened in currency markets sometimes, generally to lower the value of the Yen, although it refrains from doing it often due to political concerns of its main trading partners. The current BoJ ultra-loose monetary policy, based on massive stimulus to the economy, has caused the Yen to depreciate against its main currency peers. This process has exacerbated more recently due to an increasing policy divergence between the Bank of Japan and other main central banks, which have opted to increase interest rates sharply to fight decades-high levels of inflation.
The BoJ’s stance of sticking to ultra-loose monetary policy has led to a widening policy divergence with other central banks, particularly with the US Federal Reserve. This supports a widening of the differential between the 10-year US and Japanese bonds, which favors the US Dollar against the Japanese Yen.
The Japanese Yen is often seen as a safe-haven investment. This means that in times of market stress, investors are more likely to put their money in the Japanese currency due to its supposed reliability and stability. Turbulent times are likely to strengthen the Yen’s value against other currencies seen as more risky to invest in.
- WTI is seen consolidating in a narrow range on Friday amid mixed fundamental cues.
- Concerns about slowing demand and easing geopolitical tensions act as a headwind.
- Dovish Fed expectations continue to undermine the USD and could lend some support.
West Texas Intermediate (WTI) US crude Oil prices struggle to capitalize on the previous day's bounce from the vicinity of a two-week low – levels just below mid-$71.00s – and oscillates in a narrow band during the Asian session on Friday. The commodity currently trades around the $72.75 region, nearly unchanged for the day, and remains on track to register steep weekly losses amid concerns over slowing demand.
A downward revision of the number of jobs added by US employers this year through March resurfaced fears about a potential recession in the world's top oil-consuming nation. This comes on top of persistent worries about an economic slowdown in China – the world's top oil importer – and turns out to be a key factor acting as a headwind for the black liquid. Apart from this, hopes for a ceasefire in Gaza contribute to capping the upside for Crude Oil prices.
In fact, US officials stated that an agreement between Israel and Hamas was close. This, in turn, eases concerns about a wider conflict in the Middle East and supply disruptions from the key Oil producing region. That said, government data released on Wednesday showed an outsize drawdown in US Crude inventories. This, along with expectations that an interest rate cut by the Federal Reserve will boost economic activity, could limit the downside for Crude Oil prices.
Market players seem convinced that the US central bank will begin its policy-easing cycle and announce a 25 basis points rate cut at the September meeting. This, in turn, fails to assist the US Dollar (USD) to capitalize on the overnight goodish recovery from the YTD low and should further offer some support to USD-denominated commodities, including Crude Oil prices. This, in turn, warrants some caution before positioning for an extension of a nearly two-week-old downtrend.
WTI Oil FAQs
WTI Oil is a type of Crude Oil sold on international markets. The WTI stands for West Texas Intermediate, one of three major types including Brent and Dubai Crude. WTI is also referred to as “light” and “sweet” because of its relatively low gravity and sulfur content respectively. It is considered a high quality Oil that is easily refined. It is sourced in the United States and distributed via the Cushing hub, which is considered “The Pipeline Crossroads of the World”. It is a benchmark for the Oil market and WTI price is frequently quoted in the media.
Like all assets, supply and demand are the key drivers of WTI Oil price. As such, global growth can be a driver of increased demand and vice versa for weak global growth. Political instability, wars, and sanctions can disrupt supply and impact prices. The decisions of OPEC, a group of major Oil-producing countries, is another key driver of price. The value of the US Dollar influences the price of WTI Crude Oil, since Oil is predominantly traded in US Dollars, thus a weaker US Dollar can make Oil more affordable and vice versa.
The weekly Oil inventory reports published by the American Petroleum Institute (API) and the Energy Information Agency (EIA) impact the price of WTI Oil. Changes in inventories reflect fluctuating supply and demand. If the data shows a drop in inventories it can indicate increased demand, pushing up Oil price. Higher inventories can reflect increased supply, pushing down prices. API’s report is published every Tuesday and EIA’s the day after. Their results are usually similar, falling within 1% of each other 75% of the time. The EIA data is considered more reliable, since it is a government agency.
OPEC (Organization of the Petroleum Exporting Countries) is a group of 13 Oil-producing nations who collectively decide production quotas for member countries at twice-yearly meetings. Their decisions often impact WTI Oil prices. When OPEC decides to lower quotas, it can tighten supply, pushing up Oil prices. When OPEC increases production, it has the opposite effect. OPEC+ refers to an expanded group that includes ten extra non-OPEC members, the most notable of which is Russia.
- NZD/USD maintains its position near the two-month high of 0.6178, marked on Wednesday.
- The US Dollar receives downward pressure from the lower Treasury yields.
- Retail Sales fell by 1.2% QoQ in Q2, swinging from a 0.4% growth in Q1.
NZD/USD retraces its recent gains toward two-month highs, trading around 0.6150 during the Asian session on Friday. This upside of the NZD/USD pair could be attributed to the tepid US Dollar (USD) amid improved risk sentiment. Traders assess the US Federal Reserve (Fed) Chair Jerome Powell’s speech at the Jackson Hole Symposium later in the North American session.
The decline in the US Treasury yields put pressure on the Greenback. US Dollar Index (DXY), which measures the value of the US Dollar against its six major peers, trades around 101.30. 2-year and 10-year yields on US bond coupons stand at 3.98% and 3.84%, respectively, at the time of writing.
However, the US Dollar received support from the mixed S&P Global Purchasing Managers Index (PMI) data released on Thursday. The US Composite PMI dipped slightly to 54.1 in August, a four-month low, down from 54.3 in July, yet remained above market expectations of 53.5. This suggests that US business activity continues to expand, marking 19 straight months of growth.
The S&P Global US Services PMI inched up to 55.2 in August 2024, from 55.0 in July, defying expectations of a drop to 54.0. Meanwhile, the Manufacturing PMI declined to 48.0 in August from 49.6 the previous month, falling short of market expectations of 49.6 and signaling the second consecutive contraction in US factory activity at the sharpest rate this year.
In New Zealand, Retail Sales fell by 1.2% quarter-on-quarter in the second quarter, following a downward revision to 0.4% growth in the first quarter, and exceeding market expectations of a 1.0% decline. This drop in retail activity continues the downward trend observed over the past eight quarters.
The Reserve Bank of New Zealand (RBNZ) has initiated its easing cycle, lowering its Official Cash Rate (OCR) to 5.25% in August and signaling more cuts to come. Markets have fully priced in an additional 25 basis point cuts in October and November.
New Zealand Dollar FAQs
The New Zealand Dollar (NZD), also known as the Kiwi, is a well-known traded currency among investors. Its value is broadly determined by the health of the New Zealand economy and the country’s central bank policy. Still, there are some unique particularities that also can make NZD move. The performance of the Chinese economy tends to move the Kiwi because China is New Zealand’s biggest trading partner. Bad news for the Chinese economy likely means less New Zealand exports to the country, hitting the economy and thus its currency. Another factor moving NZD is dairy prices as the dairy industry is New Zealand’s main export. High dairy prices boost export income, contributing positively to the economy and thus to the NZD.
The Reserve Bank of New Zealand (RBNZ) aims to achieve and maintain an inflation rate between 1% and 3% over the medium term, with a focus to keep it near the 2% mid-point. To this end, the bank sets an appropriate level of interest rates. When inflation is too high, the RBNZ will increase interest rates to cool the economy, but the move will also make bond yields higher, increasing investors’ appeal to invest in the country and thus boosting NZD. On the contrary, lower interest rates tend to weaken NZD. The so-called rate differential, or how rates in New Zealand are or are expected to be compared to the ones set by the US Federal Reserve, can also play a key role in moving the NZD/USD pair.
Macroeconomic data releases in New Zealand are key to assess the state of the economy and can impact the New Zealand Dollar’s (NZD) valuation. A strong economy, based on high economic growth, low unemployment and high confidence is good for NZD. High economic growth attracts foreign investment and may encourage the Reserve Bank of New Zealand to increase interest rates, if this economic strength comes together with elevated inflation. Conversely, if economic data is weak, NZD is likely to depreciate.
The New Zealand Dollar (NZD) tends to strengthen during risk-on periods, or when investors perceive that broader market risks are low and are optimistic about growth. This tends to lead to a more favorable outlook for commodities and so-called ‘commodity currencies’ such as the Kiwi. Conversely, NZD tends to weaken at times of market turbulence or economic uncertainty as investors tend to sell higher-risk assets and flee to the more-stable safe havens.
| Raw materials | Closed | Change, % |
|---|---|---|
| Silver | 28.98 | -1.89 |
| Gold | 248.445 | -1.1 |
| Palladium | 925.84 | -1.97 |
- The Indian Rupee strengthens in Friday’s Asian session.
- Fed's dovish remarks, decline of crude oil prices and RBI intervention continue to underpin the INR.
- Investors will closely monitor Fed Chair Jerome Powell’s speech on Friday.
The Indian Rupee (INR) trades with mild gains on Friday as the dovish US Federal Reserve (Fed) minutes and lower crude oil prices support the local currency. Traders also expect the INR’s downside might be limited as the Reserve Bank of India (RBI) might step in to sell the USD and prevent the INR from breaching the key 84.00 level.
Nonetheless, the relentless Greenback demand from importers and ongoing foreign fund outflows might dampen investor sentiments and drag the Indian Rupee lower. The Fed Chair Jerome Powell's speech at the Jackson Hole Symposium will take center stage on Friday, which could offer some insight into the future US interest rate path.
Daily Digest Market Movers: Indian Rupee rebounds, but potential upside seems limited
- The Reserve Bank of India (RBI) released the minutes of the Monetary Policy Committee (MPC) meeting on Thursday, highlighting that the policy must continue to be actively disinflationary to ensure anchoring of inflation to its target level.
- The Indian central bank noted that headline inflation has seen upward movement in June to 5.1% as food inflation pressures increased and offset the impact of subdued core inflation and deflation in the fuel group.
- The preliminary HSBC India Manufacturing Purchasing Managers Index (PMI) declined to 57.9 in August from 58.1 in July. Services PMI rose to 60.4 in August from the previous reading of 60.3.
- The US S&P Global Composite PMI fell slightly to 54.1 in August's flash estimate from 54.3 in July, better than the expectation of 53.5. Meanwhile, Manufacturing PMI dropped to 48 in the same period from 49.6. Services PMI rose to 55.2 in August versus 55 prior.
- Federal Reserve Bank of Boston President Susan Collins stated that it will soon be appropriate to begin cutting rates, adding that incoming data will guide the pace of rate cuts.
- Kansas City Fed President Jeff Schmid noted Thursday that he was looking more closely at the dynamics behind the increase in the unemployment rate and would let data guide his decision on whether to support a rate reduction next month.
- Investors are now pricing in around 76% odds of a 25 basis points (bps) Fed rate cut in its September meeting, according to the CME FedWatch Tool.
Technical Analysis: USD/INR’s constructive outlook remains in place
Indian Rupee trades firmer on the day. The most notable feature of the USD/INR pair is the strong uptrend as the price remains above the key 100-day Exponential Moving Average (EMA) and the 11-week-old uptrend line. Additionally, the 14-day Relative Strength Index (RSI) points higher above the midline near 58.40, suggesting that the bullish momentum is sustained.
If USD/INR pops up bullish pressure above the 84.00 psychological mark, the pair could retest the record high of 84.24. A decisive break above this level may attract buyers to 84.50.
Sustained trading below the ascending trendline around 83.92 could draw in sellers and drag the pair to 83.77, the low of August 20. The next contention level to watch is the 100-day EMA at 83.57.
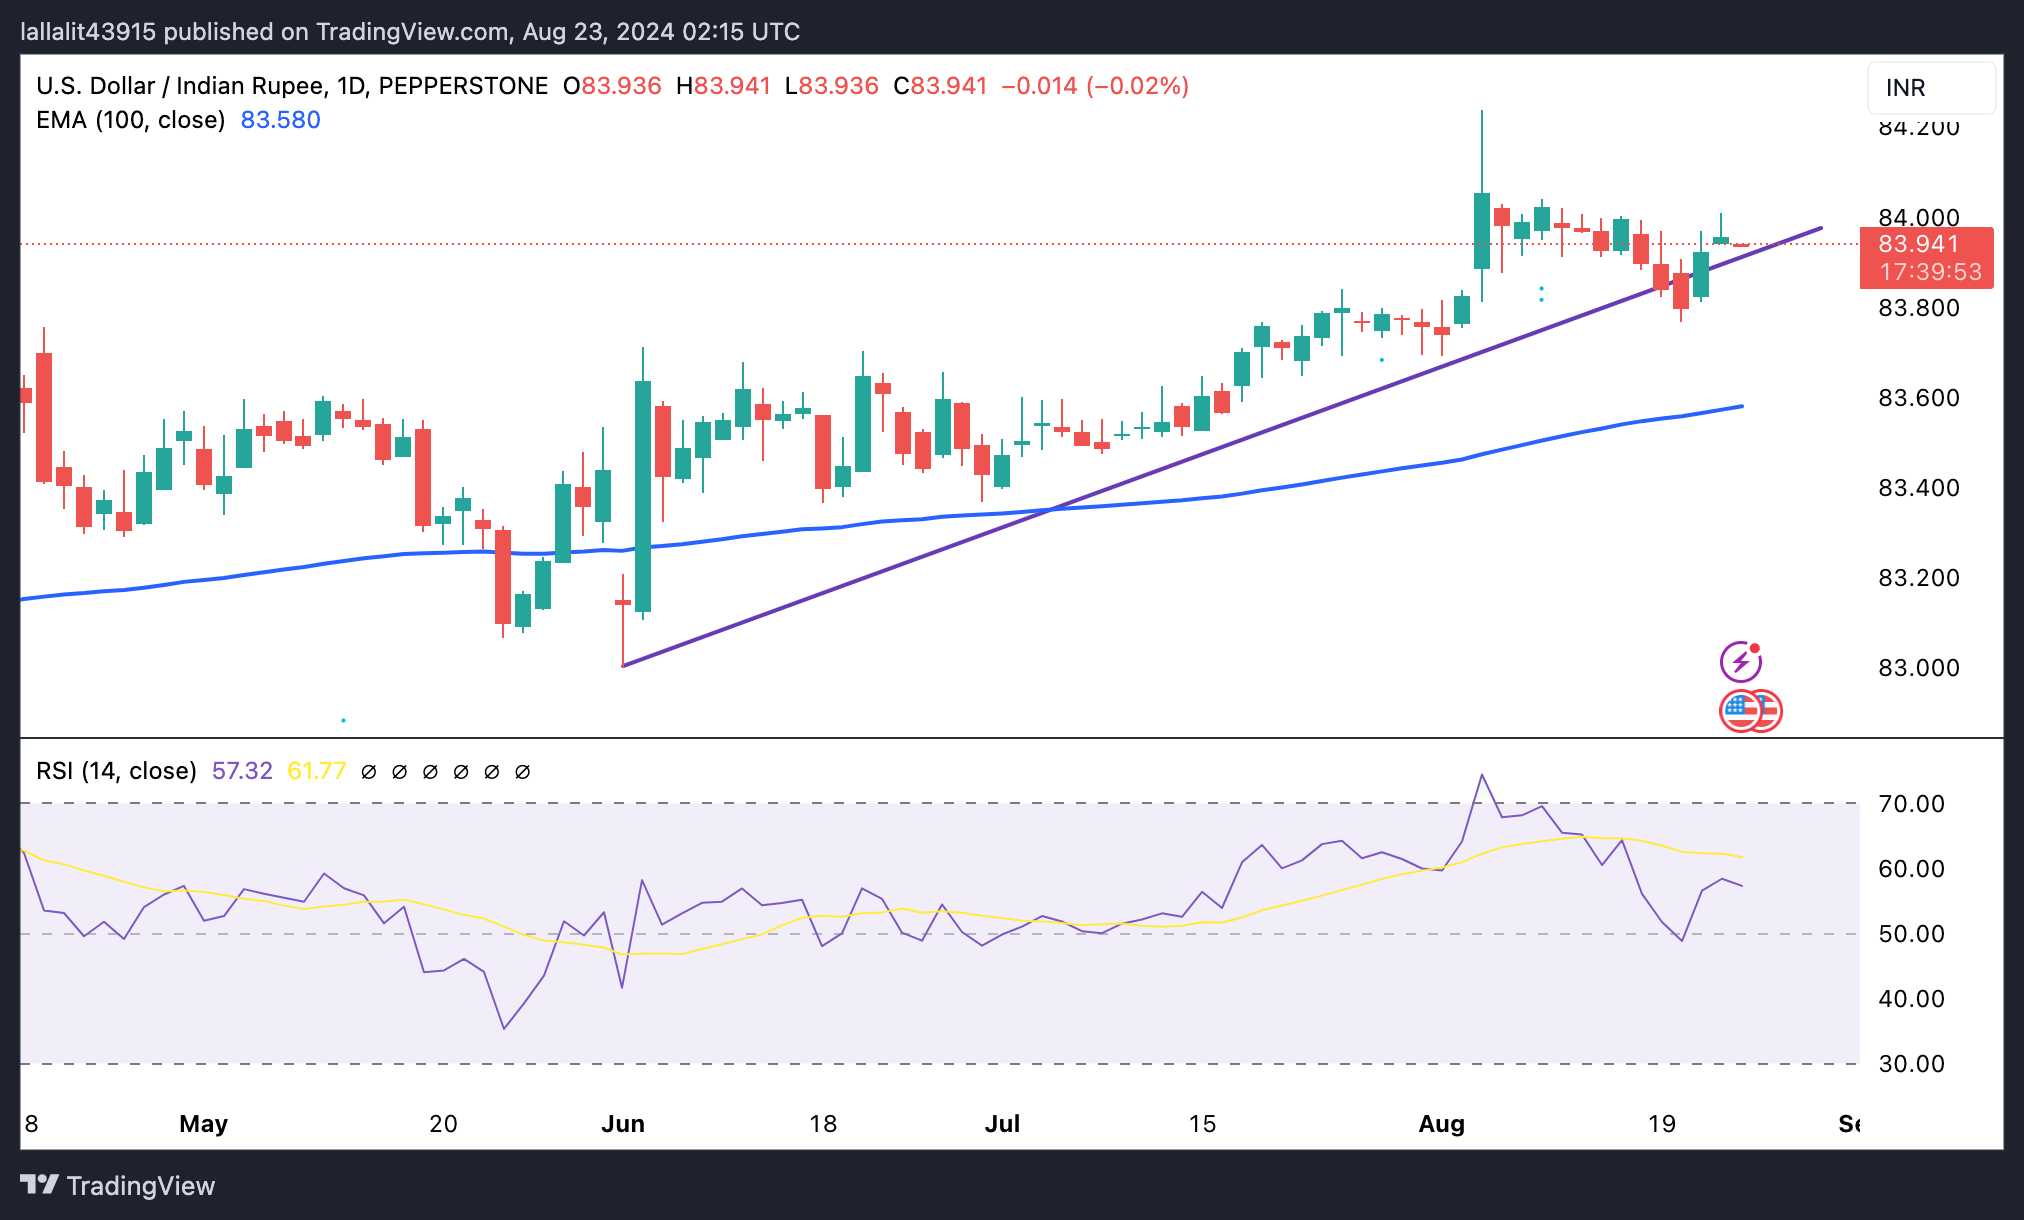
Indian Rupee FAQs
The Indian Rupee (INR) is one of the most sensitive currencies to external factors. The price of Crude Oil (the country is highly dependent on imported Oil), the value of the US Dollar – most trade is conducted in USD – and the level of foreign investment, are all influential. Direct intervention by the Reserve Bank of India (RBI) in FX markets to keep the exchange rate stable, as well as the level of interest rates set by the RBI, are further major influencing factors on the Rupee.
The Reserve Bank of India (RBI) actively intervenes in forex markets to maintain a stable exchange rate, to help facilitate trade. In addition, the RBI tries to maintain the inflation rate at its 4% target by adjusting interest rates. Higher interest rates usually strengthen the Rupee. This is due to the role of the ‘carry trade’ in which investors borrow in countries with lower interest rates so as to place their money in countries’ offering relatively higher interest rates and profit from the difference.
Macroeconomic factors that influence the value of the Rupee include inflation, interest rates, the economic growth rate (GDP), the balance of trade, and inflows from foreign investment. A higher growth rate can lead to more overseas investment, pushing up demand for the Rupee. A less negative balance of trade will eventually lead to a stronger Rupee. Higher interest rates, especially real rates (interest rates less inflation) are also positive for the Rupee. A risk-on environment can lead to greater inflows of Foreign Direct and Indirect Investment (FDI and FII), which also benefit the Rupee.
Higher inflation, particularly, if it is comparatively higher than India’s peers, is generally negative for the currency as it reflects devaluation through oversupply. Inflation also increases the cost of exports, leading to more Rupees being sold to purchase foreign imports, which is Rupee-negative. At the same time, higher inflation usually leads to the Reserve Bank of India (RBI) raising interest rates and this can be positive for the Rupee, due to increased demand from international investors. The opposite effect is true of lower inflation.
- Gold price edges higher and moves away from the weekly low touched on Thursday.
- Dovish Fed expectations prompt fresh USD selling and continue to act as a tailwind.
- Geopolitical risks further act as a tailwind ahead of Fed Chair Jerome Powell’s speech.
Gold price (XAU/USD) fell more than 1% on Thursday as bulls opted to take some profits off the table amid a goodish rebound in the US Treasury bond yields and the US Dollar (USD). The downside, however, remains cushioned in the wake of growing acceptance that the Federal Reserve (Fed) will start lowering borrowing costs in September. The bets were reaffirmed by rather unimpressive US macro data, which pointed to a cooling labor market and suggested that the economy is at risk of a slowdown. This tempers investors' appetite for riskier assets and offers support to the safe-haven precious metal.
Apart from this, worries about a broader conflict in the Middle East assisted the Gold price in attracting some dip-buyers during the Asian session on Friday. The XAU/USD, however, remains below the $2,500 psychological mark as traders now seem reluctant and prefer to wait on the sidelines ahead of Fed Chair Jerome Powell's speech at the Jackson Hole Symposium, due later this Friday. Powell's remarks will be scrutinized closely for fresh cues about the Fed's rate-cut path. Apart from this, geopolitical developments will play a key role in influencing the XAU/USD and determining the near-term trajectory.
Daily Digest Market Movers: Gold price attracts fresh buyers amid dovish Fed expectations, renewed USD selling
- The US Dollar staged a goodish bounce from the 2024 low touched the previous day amid rebounding US Treasury bond yields and drove flows away from the Gold price on Thursday.
- The attempted USD recovery lacks follow-through in the wake of bets for an imminent start of the Federal Reserve's rate-cutting cycle in September, which helps limit losses for the XAU/USD.
- On the economic data front, the US Department of Labor (DoL) reported that Initial Jobless Claims rose to a seasonally adjusted 232,000 in the week ending August 17, up from the 228K previous.
- This follows the annual benchmark review of employment data released on Wednesday, which showed that US employers added 818,000 fewer jobs than reported during the year through March.
- Moreover, the minutes of the July 30-31 FOMC meeting revealed that an increasing number of policymakers backed the case for a rate cut next month amid progress in bringing down inflation.
- The S&P Global flash PMI indicated that business activity in the US manufacturing sector shrank at the fastest pace this year, while the gauge for the services sector unexpectedly ticked higher.
- The composite PMI showed that the business activity in the US private sector continued to expand at a healthy pace and a fall in selling price inflation to a level close to the pre-pandemic average.
- Kansas City Fed President Jeffrey Schmid said that there is still work to do on sustainably getting inflation back to 2% and that he needs to see more data before supporting the decision to reduce rates.
- Philadelphia Fed President Patrick Harker said that jobs market revisions weren't a surprise and that he was on board with a September interest rate cut as long as the data performs as expected.
- Separately, Boston Fed President Susan Collins said that it will soon be appropriate to begin cutting rates as data on inflation are consistent with more confidence inflation getting back to 2%.
- The market attention now shifts to Fed Chair Jerome Powell's speech, which will be scrutinized for cues about the interest rate trajectory and provide a fresh directional impetus to the yellow metal.
Technical Analysis: Gold price could accelerate the corrective slide once the $2,470 pivotal support is broken decisively
From a technical perspective, the overnight downfall stalled near the $2,370 horizontal resistance breakpoint, now turned support, which should now act as a key pivotal point. A convincing break below might prompt some technical selling and drag the Gold price towards the next relevant support near the $2,345-2,343 region. The corrective decline could extend further towards the 50-day Simple Moving Average (SMA), currently pegged just above the $2,400 round figure.
On the flip side, momentum back above the $2,500 mark now seems to confront some resistance near the $2,513-2,514 area. This is followed by the record high, around the $2,531-2,532 region, which if cleared will be seen as a fresh trigger for bullish traders and set the stage for an extension of the Gold price's recent well-established uptrend.
Gold FAQs
Gold has played a key role in human’s history as it has been widely used as a store of value and medium of exchange. Currently, apart from its shine and usage for jewelry, the precious metal is widely seen as a safe-haven asset, meaning that it is considered a good investment during turbulent times. Gold is also widely seen as a hedge against inflation and against depreciating currencies as it doesn’t rely on any specific issuer or government.
Central banks are the biggest Gold holders. In their aim to support their currencies in turbulent times, central banks tend to diversify their reserves and buy Gold to improve the perceived strength of the economy and the currency. High Gold reserves can be a source of trust for a country’s solvency. Central banks added 1,136 tonnes of Gold worth around $70 billion to their reserves in 2022, according to data from the World Gold Council. This is the highest yearly purchase since records began. Central banks from emerging economies such as China, India and Turkey are quickly increasing their Gold reserves.
Gold has an inverse correlation with the US Dollar and US Treasuries, which are both major reserve and safe-haven assets. When the Dollar depreciates, Gold tends to rise, enabling investors and central banks to diversify their assets in turbulent times. Gold is also inversely correlated with risk assets. A rally in the stock market tends to weaken Gold price, while sell-offs in riskier markets tend to favor the precious metal.
The price can move due to a wide range of factors. Geopolitical instability or fears of a deep recession can quickly make Gold price escalate due to its safe-haven status. As a yield-less asset, Gold tends to rise with lower interest rates, while higher cost of money usually weighs down on the yellow metal. Still, most moves depend on how the US Dollar (USD) behaves as the asset is priced in dollars (XAU/USD). A strong Dollar tends to keep the price of Gold controlled, whereas a weaker Dollar is likely to push Gold prices up.
- The Australian Dollar gains ground due to an improved risk-on mood on Friday.
- The AUD may appreciate further due to the hawkish sentiment surrounding the RBA’s stance on its policy outlook.
- The US Composite PMI indicated that business activity continues to grow, marking 19 consecutive months of expansion.
The Australian Dollar (AUD) retraces its recent gains against the US Dollar (USD) amid rising risk-on sentiment on Friday. Traders await the US Federal Reserve (Fed) Chair Jerome Powell’s speech at the Jackson Hole Symposium later in the North American session.
The AUD/USD pair could advance further due to the hawkish mood surrounding the Reserve Bank of Australia (RBA) about its policy outlook. RBA Governor Michele Bullock expressed that the Australian central bank will not hesitate to raise rates again to combat inflation if needed. Additionally, RBA's August Meeting Minutes suggested that the cash rate might stay unchanged for an extended period.
The US Dollar (USD) depreciates amid lower Treasury yields on Friday. However, the Greenback received support from the mixed S&P Global Purchasing Managers Index (PMI) data released on Thursday.
The US Composite PMI dipped slightly to 54.1 in August, a four-month low, down from 54.3 in July, yet remained above market expectations of 53.5. This suggests that US business activity continues to expand, marking 19 straight months of growth.
Daily Digest Market Movers: Australian Dollar appreciates due to improved risk sentiment
- CME FedWatch Tool suggests that the markets are now pricing in 73.5% odds of a 25 basis point (bps) Fed rate cut in its September meeting, up from 62.0% a day ago. The probability of a 50 basis point rate cut decreased to 26.5% from 38.0% a day earlier.
- The S&P Global US Services PMI inched up to 55.2 in August 2024, from 55.0 in July, defying expectations of a drop to 54.0. Meanwhile, the Manufacturing PMI declined to 48.0 in August from 49.6 the previous month, falling short of market expectations of 49.6 and signaling the second consecutive contraction in US factory activity at the sharpest rate this year.
- Australia's Judo Bank Composite Purchasing Managers Index (PMI) rose to 51.4 in August, up from 49.9 in July. This increase marks the fastest expansion in three months, driven by a stronger performance in the services sector, despite a more pronounced contraction in manufacturing production.
- On Thursday, Federal Reserve Bank of Boston President Susan Collins indicated that it will soon be appropriate to start cutting rates, emphasizing that the pace of these cuts will be guided by incoming data. Meanwhile, Kansas City Fed President Jeff Schmid mentioned that he is closely examining the factors behind the rise in the unemployment rate and will rely on data to determine whether to support a rate reduction next month.
- The Judo Bank Australia Services PMI climbed to 52.2 in August from 50.4 in July, marking the fastest expansion in services output in three months, according to preliminary data. Meanwhile, the Manufacturing PMI slightly increased to 48.7 from 47.5 reading, signaling a continued but slower decline in the sector's health for the seventh consecutive month.
- FOMC Minutes for July’s policy meeting indicated that most Fed officials agreed last month that they would likely cut their benchmark interest rate at the upcoming meeting in September as long as inflation continued to cool.
- On Tuesday, the RBA Minutes suggested that the board members had considered a rate hike earlier this month before ultimately deciding that maintaining current rates would better balance the risks. Additionally, RBA members agreed that a rate cut is unlikely soon.
Technical Analysis: Australian Dollar rebounds from 0.6700 to move back into the ascending channel
The Australian Dollar trades around 0.6710 on Friday. Daily chart analysis shows the AUD/USD pair has breached below the ascending channel, suggesting a weakening of a bullish bias. However, the 14-day Relative Strength Index (RSI) remains above the 50 mark, supporting the ongoing bullish momentum.
On the upside, the AUD/USD pair could test the upper boundary of the ascending channel at the 0.6740 level. A return to the ascending channel would reinforce the bullish bias and lead the pair to test the seven-month high of 0.6798. A break above this level could lead the pair to explore the region around the upper boundary of the ascending channel at the 0.6880 level.
For support, the AUD/USD pair may find support near the nine-day Exponential Moving Average (EMA) at the 0.6684 level. If it falls below this level, it could test the throwback level at 0.6575, followed by another throwback level at 0.6470.
AUD/USD: Daily Chart
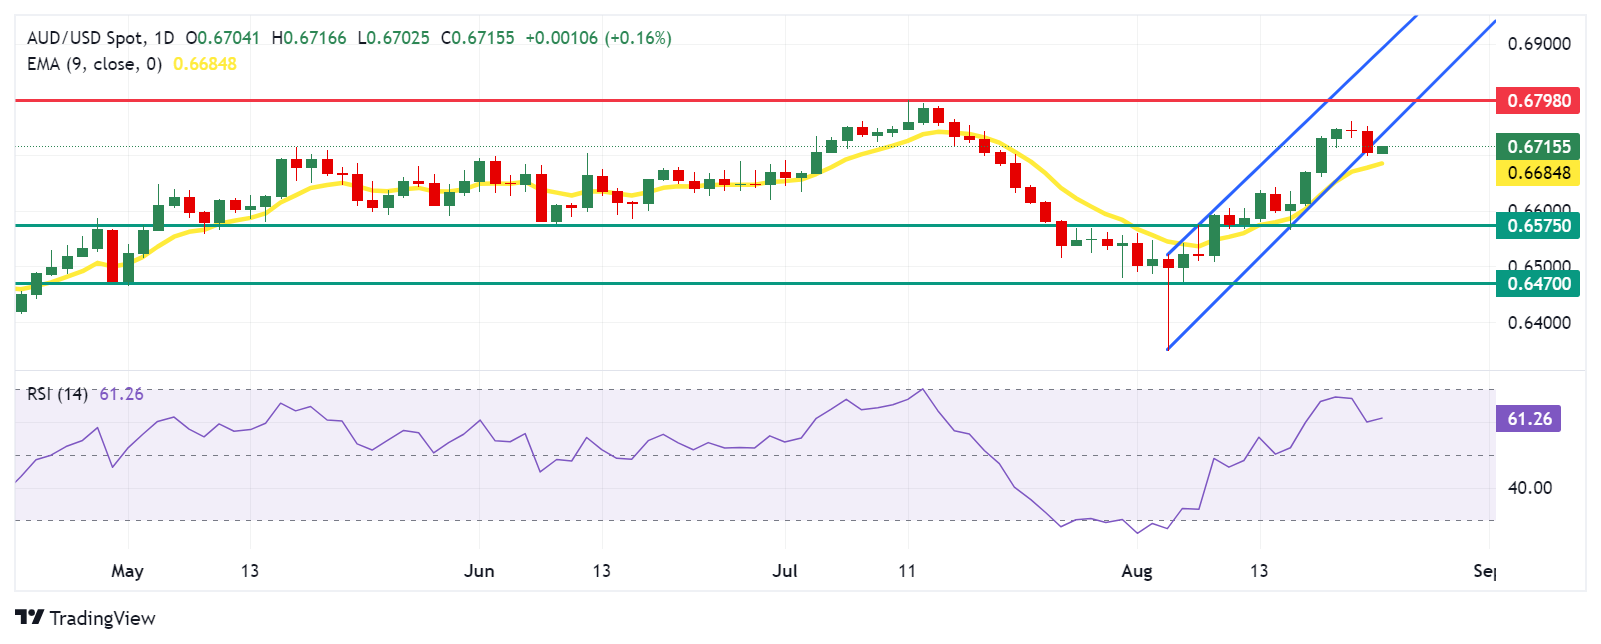
Australian Dollar PRICE Today
The table below shows the percentage change of Australian Dollar (AUD) against listed major currencies today. Australian Dollar was the strongest against the US Dollar.
| USD | EUR | GBP | JPY | CAD | AUD | NZD | CHF | |
|---|---|---|---|---|---|---|---|---|
| USD | -0.13% | -0.10% | -0.47% | -0.13% | -0.18% | -0.47% | 0.13% | |
| EUR | 0.13% | 0.04% | -0.32% | -0.00% | -0.05% | -0.11% | 0.24% | |
| GBP | 0.10% | -0.04% | -0.36% | -0.04% | -0.08% | -0.13% | -0.03% | |
| JPY | 0.47% | 0.32% | 0.36% | 0.31% | 0.26% | 0.19% | 0.33% | |
| CAD | 0.13% | 0.00% | 0.04% | -0.31% | -0.05% | -0.10% | 0.00% | |
| AUD | 0.18% | 0.05% | 0.08% | -0.26% | 0.05% | -0.05% | 0.04% | |
| NZD | 0.47% | 0.11% | 0.13% | -0.19% | 0.10% | 0.05% | 0.10% | |
| CHF | -0.13% | -0.24% | 0.03% | -0.33% | -0.01% | -0.04% | -0.10% |
The heat map shows percentage changes of major currencies against each other. The base currency is picked from the left column, while the quote currency is picked from the top row. For example, if you pick the Australian Dollar from the left column and move along the horizontal line to the US Dollar, the percentage change displayed in the box will represent AUD (base)/USD (quote).
Australian Dollar FAQs
One of the most significant factors for the Australian Dollar (AUD) is the level of interest rates set by the Reserve Bank of Australia (RBA). Because Australia is a resource-rich country another key driver is the price of its biggest export, Iron Ore. The health of the Chinese economy, its largest trading partner, is a factor, as well as inflation in Australia, its growth rate and Trade Balance. Market sentiment – whether investors are taking on more risky assets (risk-on) or seeking safe-havens (risk-off) – is also a factor, with risk-on positive for AUD.
The Reserve Bank of Australia (RBA) influences the Australian Dollar (AUD) by setting the level of interest rates that Australian banks can lend to each other. This influences the level of interest rates in the economy as a whole. The main goal of the RBA is to maintain a stable inflation rate of 2-3% by adjusting interest rates up or down. Relatively high interest rates compared to other major central banks support the AUD, and the opposite for relatively low. The RBA can also use quantitative easing and tightening to influence credit conditions, with the former AUD-negative and the latter AUD-positive.
China is Australia’s largest trading partner so the health of the Chinese economy is a major influence on the value of the Australian Dollar (AUD). When the Chinese economy is doing well it purchases more raw materials, goods and services from Australia, lifting demand for the AUD, and pushing up its value. The opposite is the case when the Chinese economy is not growing as fast as expected. Positive or negative surprises in Chinese growth data, therefore, often have a direct impact on the Australian Dollar and its pairs.
Iron Ore is Australia’s largest export, accounting for $118 billion a year according to data from 2021, with China as its primary destination. The price of Iron Ore, therefore, can be a driver of the Australian Dollar. Generally, if the price of Iron Ore rises, AUD also goes up, as aggregate demand for the currency increases. The opposite is the case if the price of Iron Ore falls. Higher Iron Ore prices also tend to result in a greater likelihood of a positive Trade Balance for Australia, which is also positive of the AUD.
The Trade Balance, which is the difference between what a country earns from its exports versus what it pays for its imports, is another factor that can influence the value of the Australian Dollar. If Australia produces highly sought after exports, then its currency will gain in value purely from the surplus demand created from foreign buyers seeking to purchase its exports versus what it spends to purchase imports. Therefore, a positive net Trade Balance strengthens the AUD, with the opposite effect if the Trade Balance is negative.
Bank of Japan (BoJ) Governor Kazuo Ueda told the Japanese parliament on Friday, “the BoJ raised rates in July as economy and inflation moved mostly in line with forecast.“
Additional quotes
No change in stance about adjusting monetary easing if economy, inflation move in line with forecast.
Recent BoJ policy decisions have been appropriate.
Showing future policy path could cause unnecessary speculation.
Rise in import prices continued longer than expected.
Weak Yen could affect BoJ’s price projections.
FX moves affect economy through various channels.
FX moves at times could affect economy, as well as risks to economic forecast.
FX moves could affect BoJ’s median forecast, in which case we will decide what would be appropriate policy response to such change in forecasts.
FX volatility could also create upside, downside risks to our forecasts, in which case we will scrutinize degree of risk to determine whether policy response needed.
Hard to promise when and in what form we can disclose Japan's estimated neutral rate.
If we can sufficiently narrow down estimated neutral rate, we must disclose our findings to public, media, markets.
Market reaction
USD/JPY extends losses to challenge 145.50 in reaction to Governor Ueda’s comments. The pair is down 0.44% on the day.
Japanese Finance Minister Shunichi Suzuki said on Friday that he will conduct interventions in response to sudden currency movements.
Key quotes
Sees lingering deflationary pressures.
Warns of risk of deflation returning.
Warns against sudden movements in the foreign exchange market.
Weak Yen has pros and cons.
Japan has taken action, including FX intervention, as excessive volatility in forex is not desirable.
Market reaction
At the time of writing, USD/JPY is trading 0.27% lower on the day at 145.88.
Bank of Japan FAQs
The Bank of Japan (BoJ) is the Japanese central bank, which sets monetary policy in the country. Its mandate is to issue banknotes and carry out currency and monetary control to ensure price stability, which means an inflation target of around 2%.
The Bank of Japan has embarked in an ultra-loose monetary policy since 2013 in order to stimulate the economy and fuel inflation amid a low-inflationary environment. The bank’s policy is based on Quantitative and Qualitative Easing (QQE), or printing notes to buy assets such as government or corporate bonds to provide liquidity. In 2016, the bank doubled down on its strategy and further loosened policy by first introducing negative interest rates and then directly controlling the yield of its 10-year government bonds.
The Bank’s massive stimulus has caused the Yen to depreciate against its main currency peers. This process has exacerbated more recently due to an increasing policy divergence between the Bank of Japan and other main central banks, which have opted to increase interest rates sharply to fight decades-high levels of inflation. The BoJ’s policy of holding down rates has led to a widening differential with other currencies, dragging down the value of the Yen.
A weaker Yen and the spike in global energy prices have led to an increase in Japanese inflation, which has exceeded the BoJ’s 2% target. With wage inflation becoming a cause of concern, the BoJ looks to move away from ultra loose policy, while trying to avoid slowing the activity too much.
The People’s Bank of China (PBOC) set the USD/CNY central rate for the trading session ahead on Friday at 7.1358, as against the previous day's fix of 7.1228 and 7.1480 Reuters estimates.
- USD/JPY loses traction to near 146.20 in Wednesday’s early Asian session.
- Japan’s CPI inflation continued to rise in July, adding to expectations for another BoJ rate increase.
- Fed’s Collins said it will soon be appropriate to begin cutting rates.
The USD/JPY pair trades on a weaker note near 146.20 during the early Asian session on Friday. The Japanese Yen (JPY) edges higher after the release of National Consumer Price Index (CPI) inflation data and the Bank of Japan's (BoJ) Governor Kazuo Ueda’s speech. Traders will closely watch US Federal Reserve (Fed) Chair Jerome Powell’s speech at the Jackson Hole Symposium later on Friday.
Data released by the Japan Statistics Bureau on Friday revealed that the country’s headline National CPI climbed 2.8% YoY in July, compared to 2.8% in June. Meanwhile, Core inflation, which strips out prices of fresh food, came in at 2.7% YoY in the same report period versus 2.6% prior, This figure was in line with the market expectation and may have revitalized the BoJ's interest rate-hike case, which lifts the JPY against its rivals
The so-called “core-core” inflation rate, which strips out prices of both fresh food and energy, fell to 1.9% YoY in July from 2.2% in June. This figure registered the lowest level since September 2022.
Additionally, the hawkish comments from BoJ’s Governor Ueda boost the JPY broadly. The BoJ Governor Kazuo Ueda said on Friday that the Japanese economy is moving in line with price target protections. Ueda added that the central bank expects to adjust policy if economy moves as planned.
On the other hand, markets expect the Fed to begin easing policy in its September meeting. Minutes released on Wednesday indicated that the majority of Fed members support a rate cut in the upcoming meeting next month. Investors are now pricing in around 76% odds of a 25 basis points (bps) Fed rate cut in its September meeting, according to the CME FedWatch Tool. Markets see a full percentage point worth of rate cuts anticipated by the end of this year.
On Thursday, Federal Reserve Bank of Boston President Susan Collins stated that it will soon be appropriate to begin cutting rates, adding that incoming data will guide the pace of rate cuts. Kansas City Fed President Jeff Schmid noted Thursday that he was looking more closely at the dynamics behind the increase in the unemployment rate and would let data guide his decision on whether to support a rate reduction next month. The attention will shift to the the Fed’s Powell speech later on Friday, which could give some hints about the US interest rate path.
Bank of Japan FAQs
The Bank of Japan (BoJ) is the Japanese central bank, which sets monetary policy in the country. Its mandate is to issue banknotes and carry out currency and monetary control to ensure price stability, which means an inflation target of around 2%.
The Bank of Japan has embarked in an ultra-loose monetary policy since 2013 in order to stimulate the economy and fuel inflation amid a low-inflationary environment. The bank’s policy is based on Quantitative and Qualitative Easing (QQE), or printing notes to buy assets such as government or corporate bonds to provide liquidity. In 2016, the bank doubled down on its strategy and further loosened policy by first introducing negative interest rates and then directly controlling the yield of its 10-year government bonds.
The Bank’s massive stimulus has caused the Yen to depreciate against its main currency peers. This process has exacerbated more recently due to an increasing policy divergence between the Bank of Japan and other main central banks, which have opted to increase interest rates sharply to fight decades-high levels of inflation. The BoJ’s policy of holding down rates has led to a widening differential with other currencies, dragging down the value of the Yen.
A weaker Yen and the spike in global energy prices have led to an increase in Japanese inflation, which has exceeded the BoJ’s 2% target. With wage inflation becoming a cause of concern, the BoJ looks to move away from ultra loose policy, while trying to avoid slowing the activity too much.
The Bank of Japan (BoJ) Governor Kazuo Ueda responded to a parliamentary question on Friday, saying that the Japanese economy is moving in line with price target protections. Ueda further stated that he will closely watch the market moves with a sense of urgency as uncertainties remain.
Key quotes
Sees stocks recovering from mid-August onward.
Adjusts overblown concerns about the US economy.
To monitor markets with high urgency.
Sees financial markets in unstable conditions.
July rate increase aligned with the Bank of Japan's economic expectations.
Emphasizes the need for clear communication of the bank's policies.
To maintain cautious communication.
Expects to adjust policy if economy moves as planned.
Maintains stance on adjusting easing measures with increased certainty.
To maintain close collaboration with government.
Market reaction to the BoJ’s Ueda speech
At the time of writing, USD/JPY is trading 0.11% lower on the day to trade at 146.12.
Bank of Japan FAQs
The Bank of Japan (BoJ) is the Japanese central bank, which sets monetary policy in the country. Its mandate is to issue banknotes and carry out currency and monetary control to ensure price stability, which means an inflation target of around 2%.
The Bank of Japan has embarked in an ultra-loose monetary policy since 2013 in order to stimulate the economy and fuel inflation amid a low-inflationary environment. The bank’s policy is based on Quantitative and Qualitative Easing (QQE), or printing notes to buy assets such as government or corporate bonds to provide liquidity. In 2016, the bank doubled down on its strategy and further loosened policy by first introducing negative interest rates and then directly controlling the yield of its 10-year government bonds.
The Bank’s massive stimulus has caused the Yen to depreciate against its main currency peers. This process has exacerbated more recently due to an increasing policy divergence between the Bank of Japan and other main central banks, which have opted to increase interest rates sharply to fight decades-high levels of inflation. The BoJ’s policy of holding down rates has led to a widening differential with other currencies, dragging down the value of the Yen.
A weaker Yen and the spike in global energy prices have led to an increase in Japanese inflation, which has exceeded the BoJ’s 2% target. With wage inflation becoming a cause of concern, the BoJ looks to move away from ultra loose policy, while trying to avoid slowing the activity too much.
| Index | Change, points | Closed | Change, % |
|---|---|---|---|
| NIKKEI 225 | 259.21 | 38211.01 | 0.68 |
| Hang Seng | 249.99 | 17641 | 1.44 |
| KOSPI | 6.54 | 2707.67 | 0.24 |
| ASX 200 | 16.5 | 8027 | 0.21 |
| DAX | 44.44 | 18493.39 | 0.24 |
| CAC 40 | -0.61 | 7524.11 | -0.01 |
| Dow Jones | -177.71 | 40712.78 | -0.43 |
| S&P 500 | -50.21 | 5570.64 | -0.89 |
| NASDAQ Composite | -299.64 | 17619.35 | -1.67 |
| Pare | Closed | Change, % |
|---|---|---|
| AUDUSD | 0.67026 | -0.63 |
| EURJPY | 162.477 | 0.47 |
| EURUSD | 1.111 | -0.38 |
| GBPJPY | 191.418 | 0.87 |
| GBPUSD | 1.3091 | 0.02 |
| NZDUSD | 0.61368 | -0.35 |
| USDCAD | 1.36131 | 0.18 |
| USDCHF | 0.85199 | 0.05 |
| USDJPY | 146.252 | 0.86 |


© 2000-2026. Bản quyền Teletrade.
Trang web này được quản lý bởi Teletrade D.J. LLC 2351 LLC 2022 (Euro House, Richmond Hill Road, Kingstown, VC0100, St. Vincent and the Grenadines).
Thông tin trên trang web không phải là cơ sở để đưa ra quyết định đầu tư và chỉ được cung cấp cho mục đích làm quen.
Giao dịch trên thị trường tài chính (đặc biệt là giao dịch sử dụng các công cụ biên) mở ra những cơ hội lớn và tạo điều kiện cho các nhà đầu tư sẵn sàng mạo hiểm để thu lợi nhuận, tuy nhiên nó mang trong mình nguy cơ rủi ro khá cao. Chính vì vậy trước khi tiến hành giao dịch cần phải xem xét mọi mặt vấn đề chấp nhận tiến hành giao dịch cụ thể xét theo quan điểm của nguồn lực tài chính sẵn có và mức độ am hiểu thị trường tài chính.
Sử dụng thông tin: sử dụng toàn bộ hay riêng biệt các dữ liệu trên trang web của công ty TeleTrade như một nguồn cung cấp thông tin nhất định. Việc sử dụng tư liệu từ trang web cần kèm theo liên kết đến trang teletrade.vn. Việc tự động thu thập số liệu cũng như thông tin từ trang web TeleTrade đều không được phép.
Xin vui lòng liên hệ với pr@teletrade.global nếu có câu hỏi.
ngân hàng