- Phân tích
- Tin tức và các công cụ
- Tin tức thị trường
Tin tức thì trường
- GBP/USD cycled on Monday just above 1.2900 with low momentum.
- A quiet start to the week gives way to key data prints for both the US and the UK.
- Wednesday kicks off the week’s meaningful data with UK and US PMIs.
GBP/USD slid sideways on Monday, churning just north of 1.2900 as markets take a breather from last week’s late surge in Greenback bidding. The Cable is cycling an intraday technical level near 1.2925 as markets brace for a fresh round of key data due on both sides of the Atlantic beginning on Wednesday.
Forex Today: Key US data prompt some caution
Monday opened the new trading week on a quiet note as the economic data docket remains thin for the early week. Tuesday brings mid-tier US Existing Home Sales Change for June, while GBP/USD traders will be looking ahead to Wednesday’s double-header of Purchasing Managers Index (PMI) data prints. The UK’s Manufacturing and Services PMI for July are expected to tick up slightly, with MoM Services PMI numbers expected to print at 52.5 compared to the previous month’s 52.1.
The US follows up on Wednesday with its own PMIs. Forecasting models are expecting July’s US Services PMI to ease back to 54.4 versus the previous 55.3. Thursday will continue the high-impact US data trend with annualized Gross Domestic Product (GDP) for 2024’s second quarter. Key US inflation data will round out the trading week with Friday’s US Personal Consumption Expenditure - Price Index (PCE) inflation.
British Pound PRICE This week
The table below shows the percentage change of British Pound (GBP) against listed major currencies this week. British Pound was the strongest against the Swiss Franc.
| USD | EUR | GBP | JPY | CAD | AUD | NZD | CHF | |
|---|---|---|---|---|---|---|---|---|
| USD | 0.00% | 0.01% | -0.02% | 0.00% | 0.00% | 0.01% | 0.04% | |
| EUR | -0.01% | 0.02% | 0.00% | 0.01% | -0.02% | -0.01% | 0.02% | |
| GBP | -0.01% | -0.02% | 0.00% | -0.01% | -0.01% | -0.00% | 0.01% | |
| JPY | 0.02% | 0.00% | 0.00% | 0.02% | -0.00% | -0.00% | 0.00% | |
| CAD | -0.00% | -0.01% | 0.00% | -0.02% | -0.01% | -0.01% | 0.02% | |
| AUD | -0.00% | 0.02% | 0.01% | 0.00% | 0.01% | 0.00% | 0.05% | |
| NZD | -0.01% | 0.01% | 0.00% | 0.00% | 0.01% | -0.01% | 0.02% | |
| CHF | -0.04% | -0.02% | -0.01% | -0.01% | -0.02% | -0.05% | -0.02% |
The heat map shows percentage changes of major currencies against each other. The base currency is picked from the left column, while the quote currency is picked from the top row. For example, if you pick the British Pound from the left column and move along the horizontal line to the US Dollar, the percentage change displayed in the box will represent GBP (base)/USD (quote).
GBP/USD technical outlook
Despite being knocked off recent 12-month highs above 1.3000, Cable continues to bid above 1.2900. The pair remains firmly planted in bull country. The pair’s recent backslide still leaves bids trading well north of the 200-day Exponential Moving Average (EMA) at 1.2635.
Near-term price action remains constrained around the 200-hour EMA at 1.2922, with an intraday technical floor priced in near 1.2900.
GBP/USD hourly chart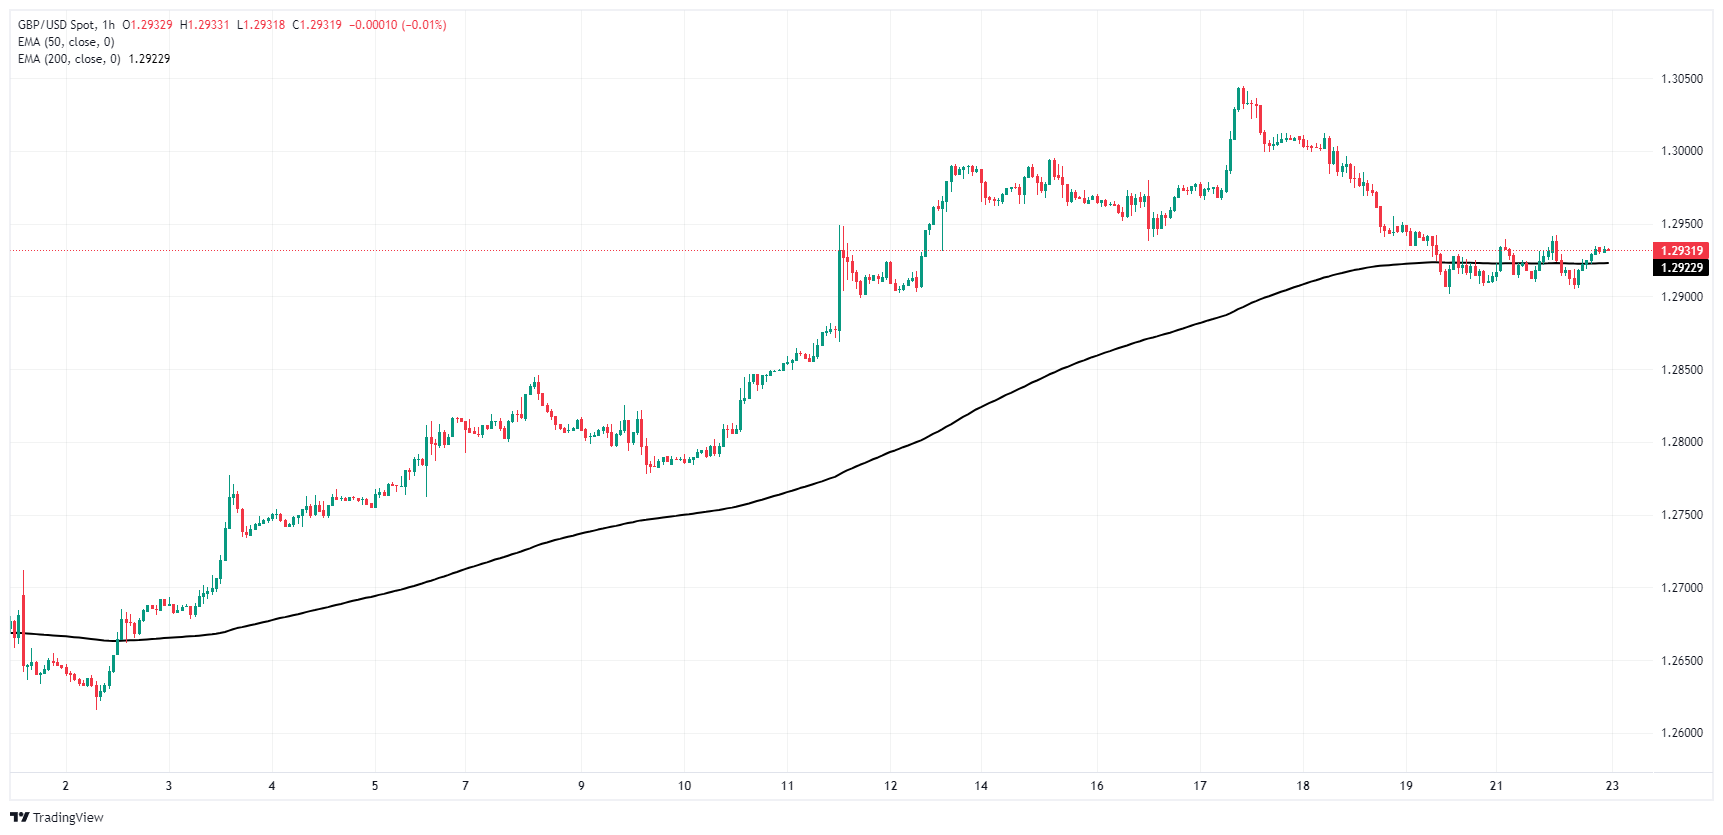
GBP/USD daily chart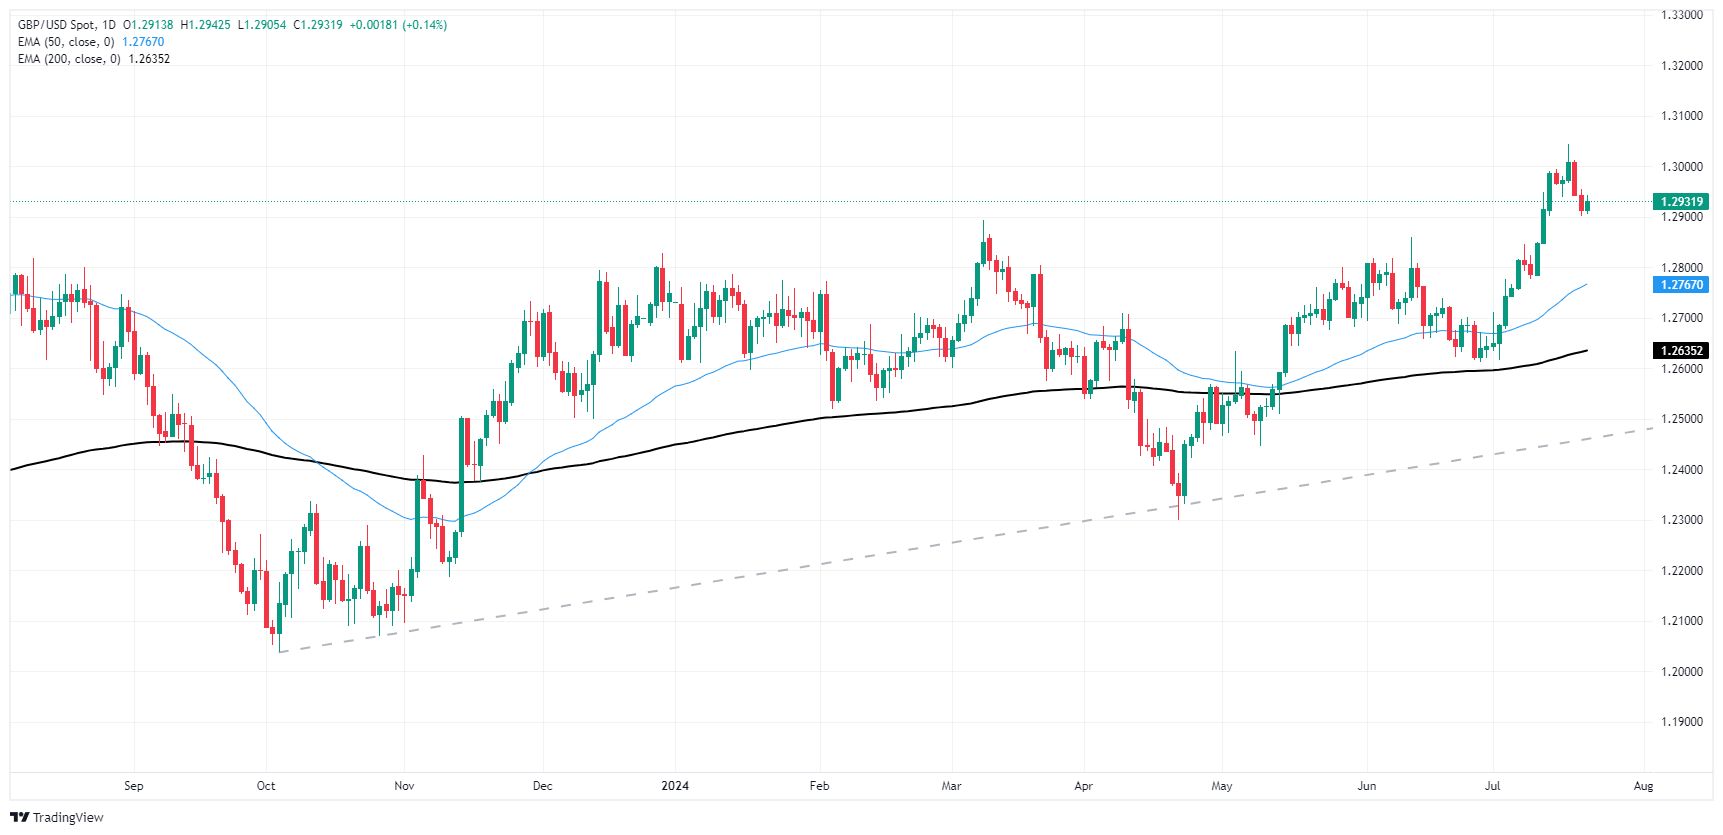
Pound Sterling FAQs
The Pound Sterling (GBP) is the oldest currency in the world (886 AD) and the official currency of the United Kingdom. It is the fourth most traded unit for foreign exchange (FX) in the world, accounting for 12% of all transactions, averaging $630 billion a day, according to 2022 data. Its key trading pairs are GBP/USD, aka ‘Cable’, which accounts for 11% of FX, GBP/JPY, or the ‘Dragon’ as it is known by traders (3%), and EUR/GBP (2%). The Pound Sterling is issued by the Bank of England (BoE).
The single most important factor influencing the value of the Pound Sterling is monetary policy decided by the Bank of England. The BoE bases its decisions on whether it has achieved its primary goal of “price stability” – a steady inflation rate of around 2%. Its primary tool for achieving this is the adjustment of interest rates. When inflation is too high, the BoE will try to rein it in by raising interest rates, making it more expensive for people and businesses to access credit. This is generally positive for GBP, as higher interest rates make the UK a more attractive place for global investors to park their money. When inflation falls too low it is a sign economic growth is slowing. In this scenario, the BoE will consider lowering interest rates to cheapen credit so businesses will borrow more to invest in growth-generating projects.
Data releases gauge the health of the economy and can impact the value of the Pound Sterling. Indicators such as GDP, Manufacturing and Services PMIs, and employment can all influence the direction of the GBP. A strong economy is good for Sterling. Not only does it attract more foreign investment but it may encourage the BoE to put up interest rates, which will directly strengthen GBP. Otherwise, if economic data is weak, the Pound Sterling is likely to fall.
Another significant data release for the Pound Sterling is the Trade Balance. This indicator measures the difference between what a country earns from its exports and what it spends on imports over a given period. If a country produces highly sought-after exports, its currency will benefit purely from the extra demand created from foreign buyers seeking to purchase these goods. Therefore, a positive net Trade Balance strengthens a currency and vice versa for a negative balance.
- USD/CAD trades on a stronger note around 1.3755 in Tuesday’s early Asian session.
- Fed officials noted that the central bank is getting “closer” to start easing its policy.
- The BoC is expected to cut interest rates by 25 bps at its July meeting on Wednesday.
The USD/CAD pair trades in positive territory for the fifth consecutive day near 1.3755, snapping the four-day winning streak during the early Asian session on Tuesday. The USD Index (DXY) consolidates around 104.30 ahead of important US economic data releases later in the week. The Bank of Canada (BoC) will announce its interest rate decision on Wednesday.
The US Federal Reserve (Fed) Chair Jerome Powell and his colleagues noted that they are becoming more hopeful about the progress on inflation in recent months. New York Fed President John Williams and Governor Christopher Waller indicated that the central bank is getting “closer” to where it wants to be in terms of rate cuts. Traders in Fed Funds Futures markets have fully priced in rate cuts in September, with at least two quarter-point cuts in 2024.
The expectation of Fed rate cuts this year has weighed on the Greenback for the time being. However, traders will take more cues from the data this week. The US Existing Home Sales, the Richmond Fed Manufacturing Index, and the API crude oil inventories data are due on Tuesday.
On the Loonie front, The BoC is anticipated to cut rates again by 25 basis points (bps) to 4.5% as inflation eases. Traders have priced in nearly 93% odds of BoC rate cuts on Wednesday and a total of 75 bps cut in borrowing costs this year. "A rate cut is likely to be delivered," said Taylor Schleich, rates strategist at the National Bank of Canada. Meanwhile, oil demand concerns and easing geopolitical fears might drag crude oil prices lower and undermine the commodity-linked Canadian Dollar (CAD) in the near term.
Canadian Dollar FAQs
The key factors driving the Canadian Dollar (CAD) are the level of interest rates set by the Bank of Canada (BoC), the price of Oil, Canada’s largest export, the health of its economy, inflation and the Trade Balance, which is the difference between the value of Canada’s exports versus its imports. Other factors include market sentiment – whether investors are taking on more risky assets (risk-on) or seeking safe-havens (risk-off) – with risk-on being CAD-positive. As its largest trading partner, the health of the US economy is also a key factor influencing the Canadian Dollar.
The Bank of Canada (BoC) has a significant influence on the Canadian Dollar by setting the level of interest rates that banks can lend to one another. This influences the level of interest rates for everyone. The main goal of the BoC is to maintain inflation at 1-3% by adjusting interest rates up or down. Relatively higher interest rates tend to be positive for the CAD. The Bank of Canada can also use quantitative easing and tightening to influence credit conditions, with the former CAD-negative and the latter CAD-positive.
The price of Oil is a key factor impacting the value of the Canadian Dollar. Petroleum is Canada’s biggest export, so Oil price tends to have an immediate impact on the CAD value. Generally, if Oil price rises CAD also goes up, as aggregate demand for the currency increases. The opposite is the case if the price of Oil falls. Higher Oil prices also tend to result in a greater likelihood of a positive Trade Balance, which is also supportive of the CAD.
While inflation had always traditionally been thought of as a negative factor for a currency since it lowers the value of money, the opposite has actually been the case in modern times with the relaxation of cross-border capital controls. Higher inflation tends to lead central banks to put up interest rates which attracts more capital inflows from global investors seeking a lucrative place to keep their money. This increases demand for the local currency, which in Canada’s case is the Canadian Dollar.
Macroeconomic data releases gauge the health of the economy and can have an impact on the Canadian Dollar. Indicators such as GDP, Manufacturing and Services PMIs, employment, and consumer sentiment surveys can all influence the direction of the CAD. A strong economy is good for the Canadian Dollar. Not only does it attract more foreign investment but it may encourage the Bank of Canada to put up interest rates, leading to a stronger currency. If economic data is weak, however, the CAD is likely to fall.
- Silver trades with minimal gains of 0.05%, consolidating above the $29.00 mark.
- Downward momentum is flattening, suggesting potential range-bound trading in the near term.
- Key levels: Support at $28.57 (June 26 low) and resistance at $30.17 (50-DMA) before targeting $31.00.
Silver price extended its losses yet bounced off daily lows beneath $29.00 and trade with minimal gains of 0.05% as Tuesday’s Asian session begins. At the time of writing, the grey metal trades at $29.11, set to remain consolidated at around current levels.
XAG/USD Price Analysis: Technical outlook
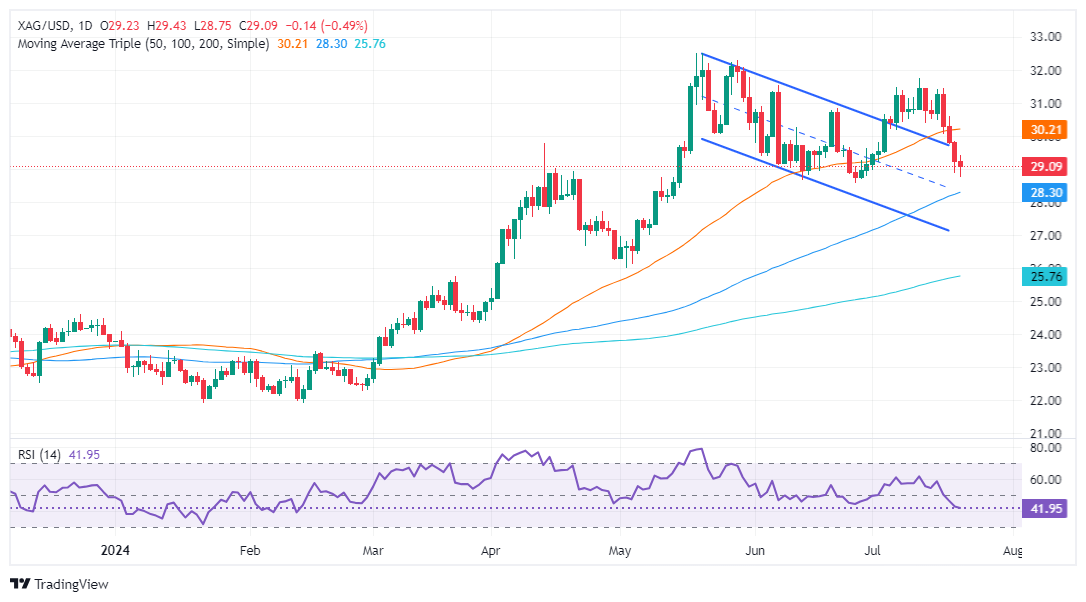
Silver remains bullish-biased but is set to remain consolidated above the $29.00 figure. Momentum remains downward biased, though it has begun to turn flat, paving the way for some range-bound trading.
If XAU/USD drops below $29.00, the next support would be the June 26 low at $28.57, followed by the 100-DMA at $28.23.
For a bullish continuation, the XAG/USD must climb above $29.50 so buyers can test the $30.00 mark. On further strength, Silver’s next resistance would be the 50-DMA at $30.17 before challenging the $31.00 mark.
XAG/USD Price Action – Daily Chart
Silver FAQs
Silver is a precious metal highly traded among investors. It has been historically used as a store of value and a medium of exchange. Although less popular than Gold, traders may turn to Silver to diversify their investment portfolio, for its intrinsic value or as a potential hedge during high-inflation periods. Investors can buy physical Silver, in coins or in bars, or trade it through vehicles such as Exchange Traded Funds, which track its price on international markets.
Silver prices can move due to a wide range of factors. Geopolitical instability or fears of a deep recession can make Silver price escalate due to its safe-haven status, although to a lesser extent than Gold's. As a yieldless asset, Silver tends to rise with lower interest rates. Its moves also depend on how the US Dollar (USD) behaves as the asset is priced in dollars (XAG/USD). A strong Dollar tends to keep the price of Silver at bay, whereas a weaker Dollar is likely to propel prices up. Other factors such as investment demand, mining supply – Silver is much more abundant than Gold – and recycling rates can also affect prices.
Silver is widely used in industry, particularly in sectors such as electronics or solar energy, as it has one of the highest electric conductivity of all metals – more than Copper and Gold. A surge in demand can increase prices, while a decline tends to lower them. Dynamics in the US, Chinese and Indian economies can also contribute to price swings: for the US and particularly China, their big industrial sectors use Silver in various processes; in India, consumers’ demand for the precious metal for jewellery also plays a key role in setting prices.
Silver prices tend to follow Gold's moves. When Gold prices rise, Silver typically follows suit, as their status as safe-haven assets is similar. The Gold/Silver ratio, which shows the number of ounces of Silver needed to equal the value of one ounce of Gold, may help to determine the relative valuation between both metals. Some investors may consider a high ratio as an indicator that Silver is undervalued, or Gold is overvalued. On the contrary, a low ratio might suggest that Gold is undervalued relative to Silver.
- NZD/USD stumbles downwards, surrendering the pivotal 0.6000 mark, following its worst week since January.
- The pair settled at 0.5980 on Monday, ensuring a daily loss of approximately 0.50%.
- NZD/USD continues to remain under the key SMA of 20, 100, and 200 days, suggesting a prevailing bearish bias.
In Monday's session, the NZD/USD continued its downward trajectory, with a fall of 0.50% to reach 0.5980. The inability of bulls to defend the 0.6000 level culminated in a slip to lows last seen in early May, subsequently affirming the currency pair's bearish bias.
The daily technical indicators further consolidate this downward trend. The Relative Strength Index (RSI) remains around 32, indicating sustained selling pressure from Friday's session. Furthermore, the Moving Average Convergence Divergence (MACD) continues to print rising red bars, thereby bolstering the growing bearish sentiment. However, the RSI stands near oversold terrain, so a correction might be on the horizon.
NZD/USD daily chart
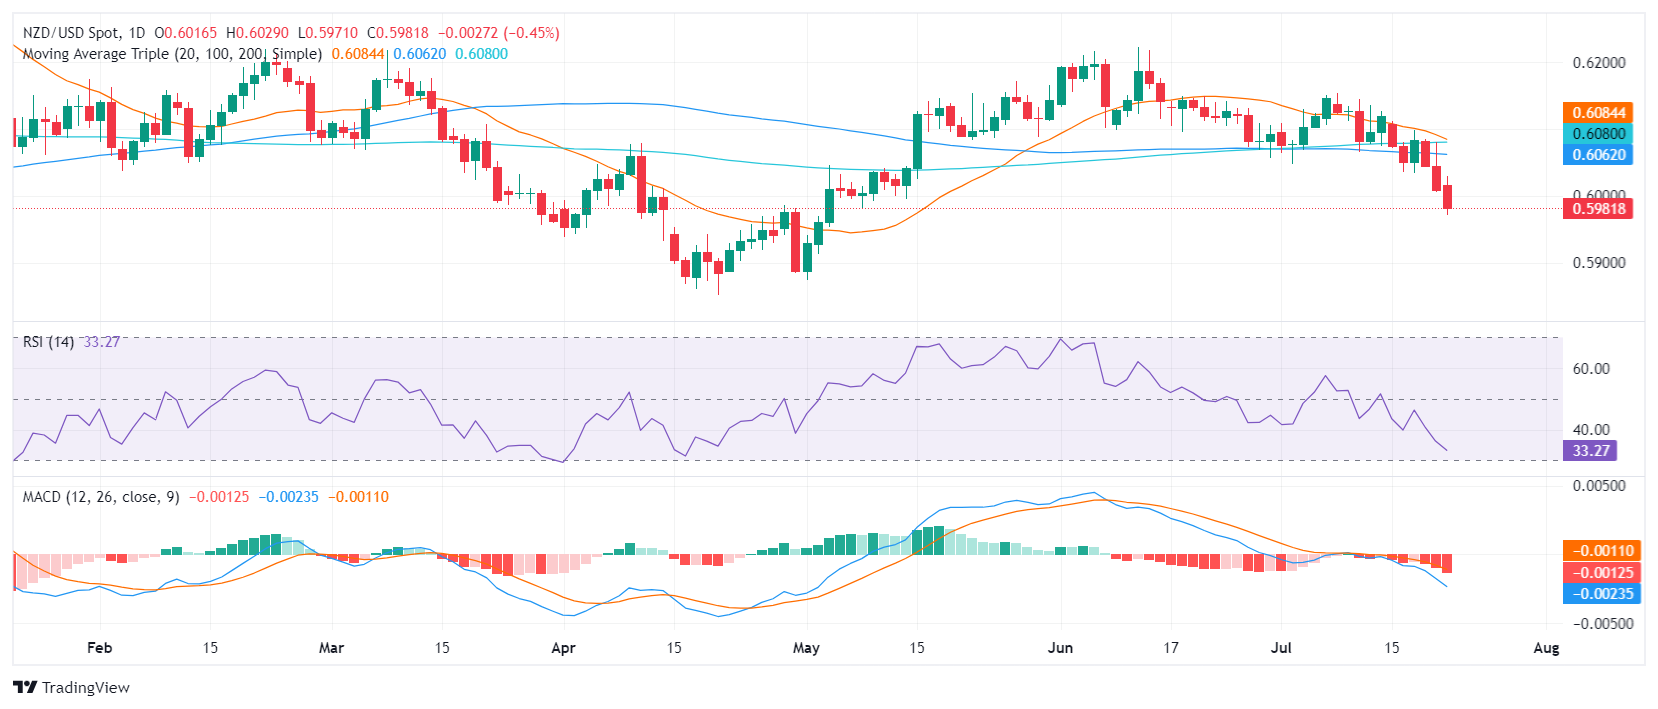
Resistance now lies at the former support level of 0.6000 and then around 0.6050. In contrast, potent support is currently noted at the 0.5980 line, below which resides the 0.5950-0.5930 range. Should the bearish inclination persist and cause a subsequent fall below these levels, it would strengthen the overall bearish narrative.
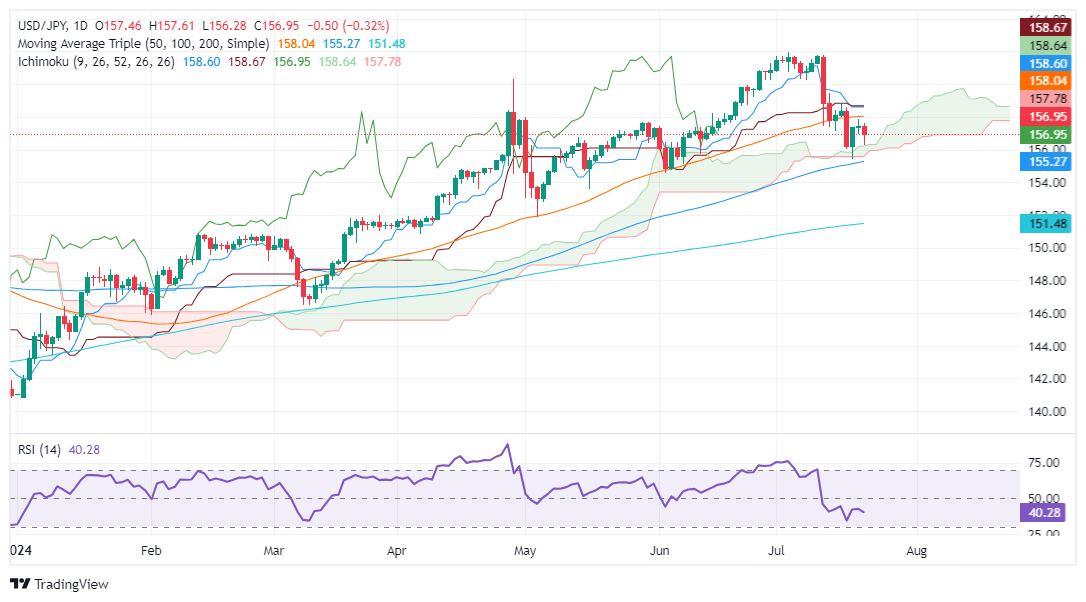
- USD/JPY trades below 157.00, near the Ichimoku Cloud’s narrowest top, signaling potential downside.
- Technical indicators show bearish momentum: Tenkan-Sen below Kijun-Sen, Chikou Span piercing below price action.
- Key support levels: 156.28 (July 22 low), 155.90/156.00 (Kumo bottom), 155.37 (July 18 low).
The USD/JPY registered losses of more than 0.20% on Monday, remaining near the top of the narrowest part of the Ichimoku Cloud (Kumo) as traders eye further downside. As Tuesday’s Asian session begins, the pair trades at 156.96, virtually unchanged.
USD/JPY Price Analysis: Technical outlook
From a technical perspective, the USD/JPY is neutral to downward biased as more bearish technical signals emerge. This, alongside releasing a deceleration of inflation, could weigh on the Greenback and push the spot price lower. Momentum suggests that sellers are in control, opening the door for further downside.
The crossing of the Tenkan-Sen below the Kijun-Sen and the Chikou Span piercing below price action are the leading signals that warned traders that the pair’s trend could change.
If USD/JPY drops below the July 22 low of 156.28, that would pave the way for further downside. The next support would be the bottom of the Kumo at around 155.90/156.00, followed by the July 18 test at 155.37. on additional weakness, the pair would aim toward the June 4 daily low of 154.55.
Conversely, if USD/JPY climbs past the latest cycle peak at 157.86, the next resistance would be 158.00. Further gains are seen, but buyers will clash with the Tenkan-Sen, coinciding with the Kijun-Sen at around 156.58.
USD/JPY Price Action – Daily Chart
Japanese Yen FAQs
The Japanese Yen (JPY) is one of the world’s most traded currencies. Its value is broadly determined by the performance of the Japanese economy, but more specifically by the Bank of Japan’s policy, the differential between Japanese and US bond yields, or risk sentiment among traders, among other factors.
One of the Bank of Japan’s mandates is currency control, so its moves are key for the Yen. The BoJ has directly intervened in currency markets sometimes, generally to lower the value of the Yen, although it refrains from doing it often due to political concerns of its main trading partners. The current BoJ ultra-loose monetary policy, based on massive stimulus to the economy, has caused the Yen to depreciate against its main currency peers. This process has exacerbated more recently due to an increasing policy divergence between the Bank of Japan and other main central banks, which have opted to increase interest rates sharply to fight decades-high levels of inflation.
The BoJ’s stance of sticking to ultra-loose monetary policy has led to a widening policy divergence with other central banks, particularly with the US Federal Reserve. This supports a widening of the differential between the 10-year US and Japanese bonds, which favors the US Dollar against the Japanese Yen.
The Japanese Yen is often seen as a safe-haven investment. This means that in times of market stress, investors are more likely to put their money in the Japanese currency due to its supposed reliability and stability. Turbulent times are likely to strengthen the Yen’s value against other currencies seen as more risky to invest in.
- GBP/JPY is slowly finding balance after a fresh round of suspected Yenterventions.
- The trading week kicks off with a data-light start.
- UK PMI activity figures, Japanese Tokyo CPI due later in the week.
GBP/JPY continued a near-term pattern of testing the low side on Monday, briefly dipping below the 202.00 handle before recovering back into familiar territory near 203.00. The pair has been knocked off of 16-year highs above 208.00 after a fresh round of suspected Yenterventions from the Bank of Japan (BoJ) the week before last, but downside momentum has drained out quickly. The Yen’s near-term resurgence now appears poised to face renewed threat as broader markets have little reason to bid JPY higher.
The trading week opened on a quiet note, and GBP/JPY traders will have to wait until they’re over the midweek hump for any meaningful data. UK S&P Global/SIPS Manufacturing and Services Purchasing Managers Index (PMI) figures are due early Wednesday, while the latest Japanese Tokyo Consumer Price Index (CPI) inflation print is slated for early Friday. Markets are expecting a slight uptick in UK PMI activity in July. Investors are also expecting another uptick in Japanese Tokyo CPI inflation, but the figures are still broadly unlikely to spark rate hikes from the hypereasy BoJ.
GBP/JPY technical outlook
The Guppy continues to underperform, testing into the low side, but near-term bearish momentum is evaporating and daily candlesticks continue to churn just north of the 50-day Exponential Moving Average (EMA) at 201.52. Price action continues to trade well above the 200-day EMA at 192.40, and a recent tumble from the 208.00 handle appears set to be cut short.
GBP/JPY hourly chart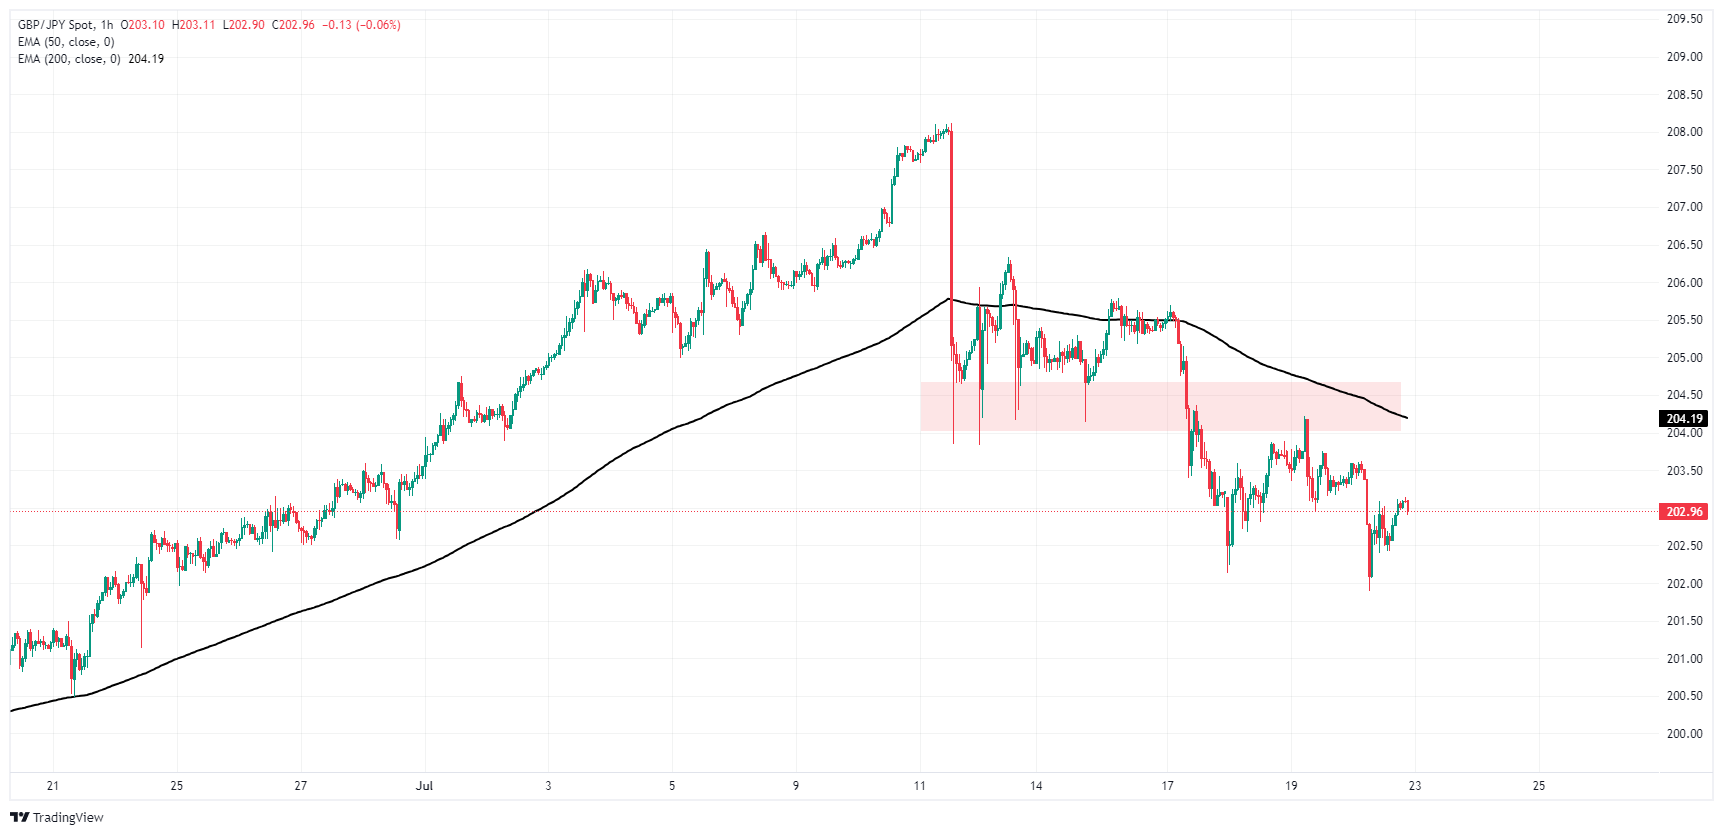
GBP/JPY daily chart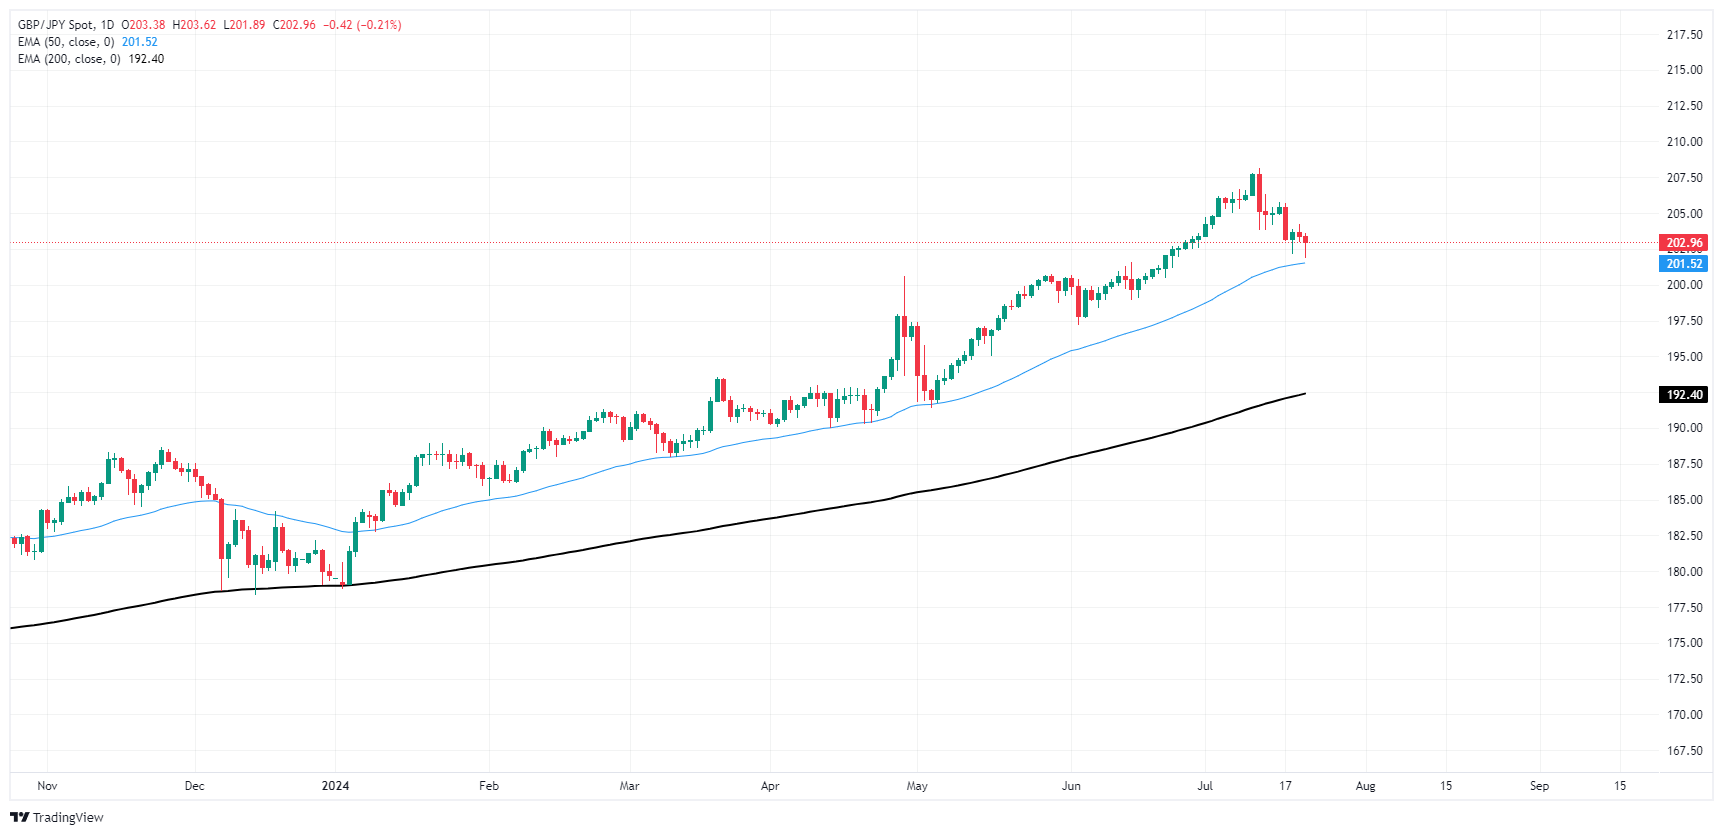
Japanese Yen FAQs
The Japanese Yen (JPY) is one of the world’s most traded currencies. Its value is broadly determined by the performance of the Japanese economy, but more specifically by the Bank of Japan’s policy, the differential between Japanese and US bond yields, or risk sentiment among traders, among other factors.
One of the Bank of Japan’s mandates is currency control, so its moves are key for the Yen. The BoJ has directly intervened in currency markets sometimes, generally to lower the value of the Yen, although it refrains from doing it often due to political concerns of its main trading partners. The current BoJ ultra-loose monetary policy, based on massive stimulus to the economy, has caused the Yen to depreciate against its main currency peers. This process has exacerbated more recently due to an increasing policy divergence between the Bank of Japan and other main central banks, which have opted to increase interest rates sharply to fight decades-high levels of inflation.
The BoJ’s stance of sticking to ultra-loose monetary policy has led to a widening policy divergence with other central banks, particularly with the US Federal Reserve. This supports a widening of the differential between the 10-year US and Japanese bonds, which favors the US Dollar against the Japanese Yen.
The Japanese Yen is often seen as a safe-haven investment. This means that in times of market stress, investors are more likely to put their money in the Japanese currency due to its supposed reliability and stability. Turbulent times are likely to strengthen the Yen’s value against other currencies seen as more risky to invest in.
- AUD/JPY persists downwards, dropping to 104.30, marking the lowest level since June 18.
- The negative short-term outlook remains steady as the pair tallied seven losing days out of the last eight.
In Monday's trading, the AUD/JPY pair has continued its downward trend, declining by more than 0.90% to touch 104.30. This substantiates the dominance of the bears and magnifies the prevailing negative short-term outlook as the pair reaches new lows.
The daily Relative Strength Index (RSI) currently stands at 35, falling even further below Friday’s reading of 42, indicating the strengthening of the negative momentum. The same trend is implied by the Moving Average Convergence Divergence (MACD) which continues to print rising red bars, suggesting a resumption of the selling activity, despite any minor rebounds.
AUD/JPY daily chart
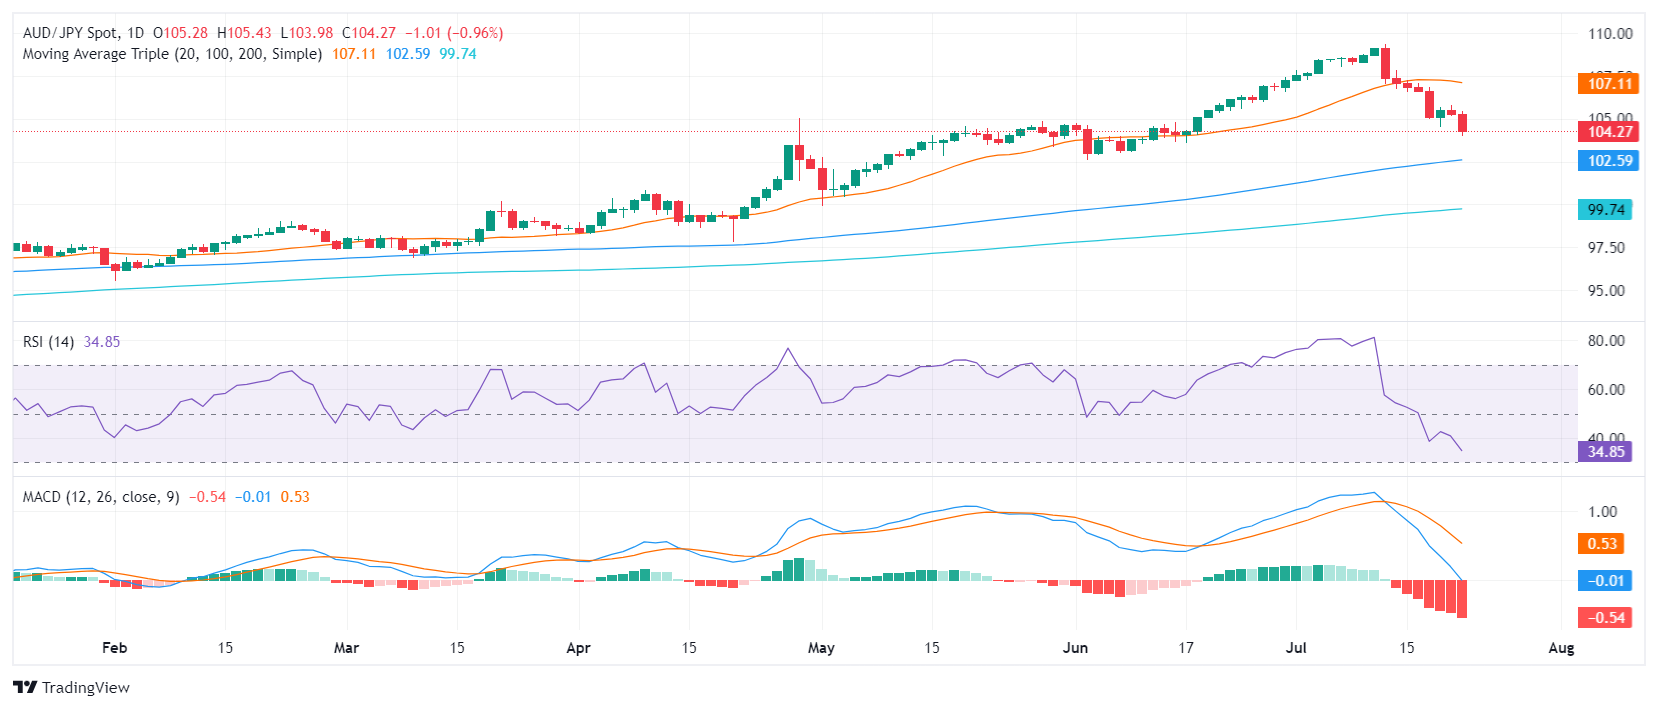
When analyzed from a broader perspective, the AUD/JPY's short-term bearish momentum seems to endure, with the pair further below the 20-day Simple Moving Average (SMA). However, it remains above both the 100 and 200-day SMA which suggests an overall positive outlook. Looking towards the future, immediate support levels seem to have been established around 104.30, which buyers must attempt to maintain to fend off a deeper correction. Speaking of recovery, the bulls must target the 104.50 area, and subsequently, regain the previous support of 105.00 to moderate the potential losses.
- Political factors centered around the upcoming presidential turnover influenced market sentiments on Monday.
- Markets are bracing themselves for a packed US economic calendar, creating a volatile week for the USD.
- Dovish bets on the Fed remain steady.
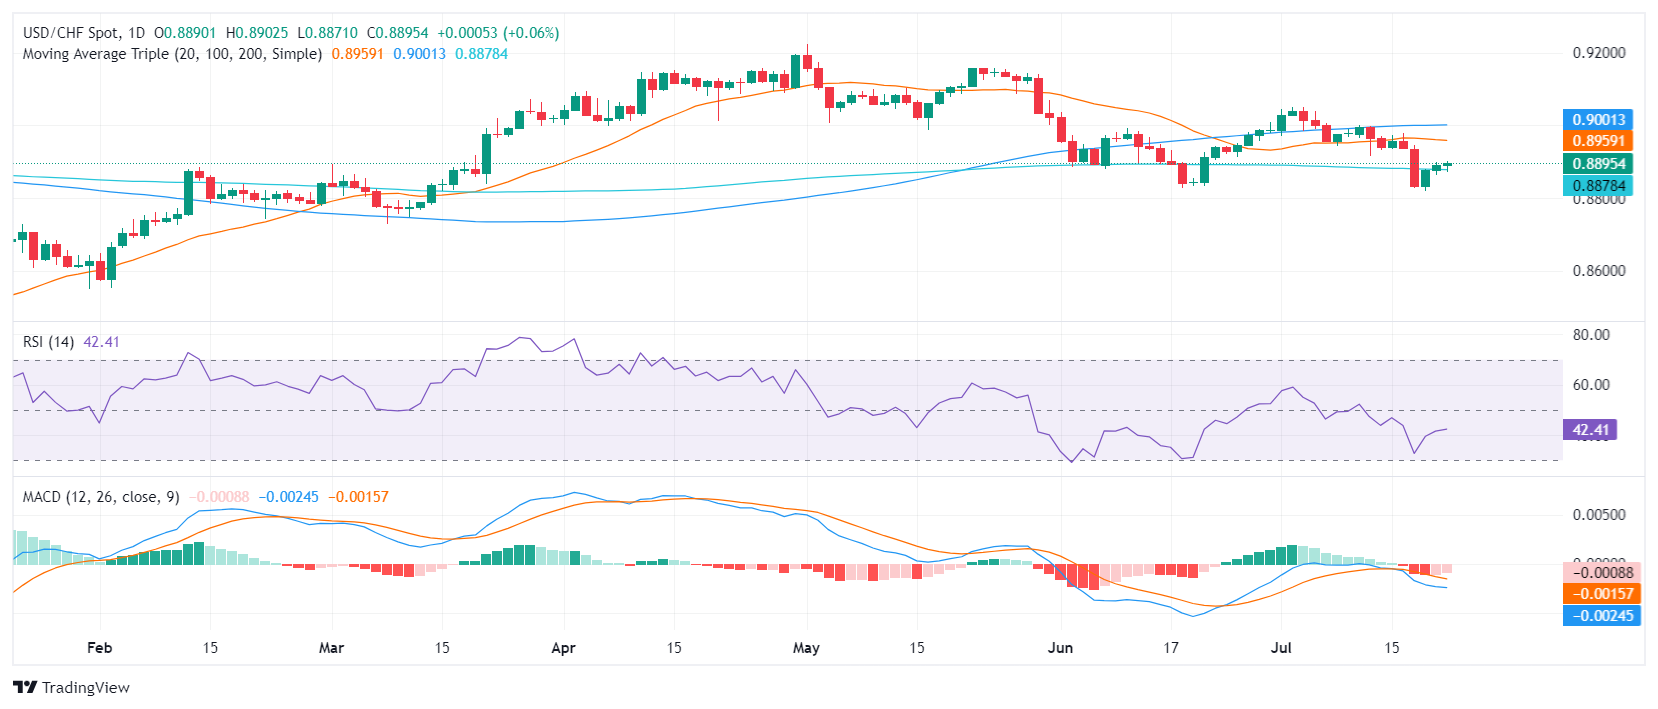
On Monday, the USD/CHF gained slightly to 0.8895. Markets are digesting the announcement of US President Joe Biden withdrawing from the presidential race, which caused risk appetites to shift which might limit the upside for the pair. Monday looks quiet, but markets are preparing for a busy week with the US economic calendar.
Joe Biden's expected departure from the presidential race favored former President Donald Trump, causing investors to shift towards riskier assets. This, along with the anticipation of a dovish stance from the Federal Reserve, limits the upside for the US Dollar. Investors this week will focus on key indicators such as the Gross Domestic Product (GDP) Q2 revisions and Personal Consumption Expenditures (PCE). These elements are anticipated to add a layer of volatility to the USD. In addition, the S&P PMIs to be released on Wednesday will be closely monitored.
Regarding the Federal Reserve position, markets are betting on a 90% chance of a cut in September, but these odds might change with the week’s economic data.
USD/CHF technical analysis
The short-term technical outlook for the pair is neutral to bearish. The USD/CHF is currently below the 20-day and 100-day Simple Moving Average (SMA) and the focus is on whether the buyers will defend the 200-day SMA. Meanwhile, technical indicators remain relatively level, but in negative territory.
Key support levels are at 0.8880 (the 20-day SMA), 0.8850, and 0.8830, while resistance levels stand at 0.8890, 0.8900, and 0.8930.
USD/CHF daily chart
- Gold price drops 0.14%, trading at $2,397, influenced by higher US Treasury yields.
- US President Biden exits race and endorses VP Harris, creating political uncertainty and undermining Gold.
- Wall Street opens positively post-Biden’s announcement, US Dollar Index remains steady at 104.34.
Gold price extends its losses for the fourth straight day yet remains hovering around $2,400, capped by rising US Treasury bond yields. The Greenback stays firm as investors diggest news that US President Joe Biden exited the Presidential race and endorsed Vice President Kamala Harris, who would like to compete against former US President Donald Trump in the November 5 elections. The XAU/USD trades at $2,397, down 0.14%.
Wall Street began the week on a positive note, which could be seen as a positive signal after Biden’s decision. Meanwhile, the US 10-year benchmark note coupon edged up two basis points to 4.26%, a headwind for the precious metal.
Analyst at Stone X commented that Trump’s victory would be favorable to Gold due to his tax cuts proposals, less regulation, and a widened budget deficit. "Trump would be inflationary and potentially incendiary in geopolitical terms, while Harris' foreign affairs policy is as yet undefined so that favours gold for now, but not possibly in the longer term."
Meanwhile, traders are eyeing the release of the preliminary reading of Gross Domestic Product (GDP) figures for the second quarter alongside the Federal Reserve’s preferred gauge for inflation, the Core Personal Consumption Expenditure (PCE) Price Index.
The US Dollar Index (DXY), which tracks the currency's performance against six other currencies and is virtually unchanged at 104.34. This has kept Gold prices beneath the $2,400 mark.
Daily digest market movers: Gold price drops beneath key support at $2,400
- Gold traders eye the release of crucial economic data, like Durable Goods Orders, the release of the preliminary Q2 GDP number, and the Core PCE for June.
- Durable Goods Orders are expected to increase from 0.1% to 0.4% MoM
- The Gross Domestic Product for Q2 is foreseen to edge higher from Q1 2024, 1.4% to 1.9% QoQ, hinting the economy is accelerating as the year progresses.
- The Fed’s preferred measure for inflation, the Core PCE is expected to dip from 2.6% to 2.5% YoY.
- The latest Consumer Price Index (CPI) data revealed a continuation of the disinflation process in the United States (US), boosting Gold prices and increasing the likelihood that the Fed will cut interest rates beginning in September.
- December 2024 fed funds rate futures contract implies that the Fed will ease policy by 48 basis points (bps) toward the end of the year, down from 50 last Friday.
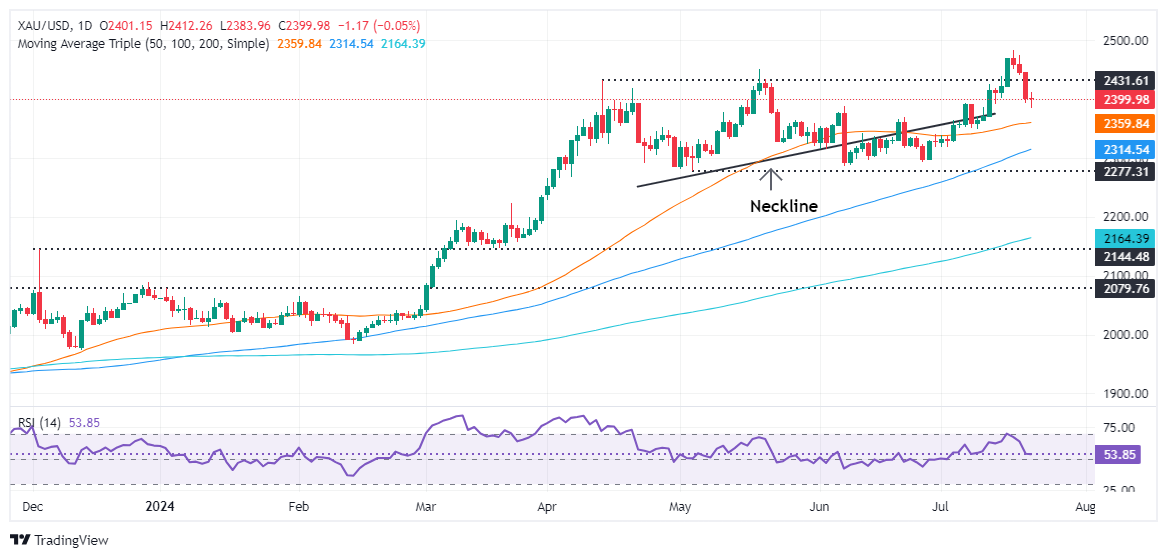
Technical analysis: Gold remains defensive, yet appears to have bottomed out
The Gold price extended its losses, pulling back from all-time peaks, yet Monday’s drop was minimal compared to Friday’s loss of more than 1.80%. Momentum favors buyers, as the Relative Strength Index (RSI) stands at bullish territory while also turning flat instead of pointing downwards.
For XAU/USD to extend its losses, sellers must keep spot prices below $2,400. In that event, the first support would be the 50-day Simple Moving Average (SMA) at $2,359. Once sellers clear the 100-day SMA at $2,315, further losses are seen before falling toward $2,300.
Otherwise, if XAU/USD stays above $2,400 and reclaims $2,450, that can pave the way to challenge the all-time high of $2,483 ahead of hitting $2,500.
Gold FAQs
Gold has played a key role in human’s history as it has been widely used as a store of value and medium of exchange. Currently, apart from its shine and usage for jewelry, the precious metal is widely seen as a safe-haven asset, meaning that it is considered a good investment during turbulent times. Gold is also widely seen as a hedge against inflation and against depreciating currencies as it doesn’t rely on any specific issuer or government.
Central banks are the biggest Gold holders. In their aim to support their currencies in turbulent times, central banks tend to diversify their reserves and buy Gold to improve the perceived strength of the economy and the currency. High Gold reserves can be a source of trust for a country’s solvency. Central banks added 1,136 tonnes of Gold worth around $70 billion to their reserves in 2022, according to data from the World Gold Council. This is the highest yearly purchase since records began. Central banks from emerging economies such as China, India and Turkey are quickly increasing their Gold reserves.
Gold has an inverse correlation with the US Dollar and US Treasuries, which are both major reserve and safe-haven assets. When the Dollar depreciates, Gold tends to rise, enabling investors and central banks to diversify their assets in turbulent times. Gold is also inversely correlated with risk assets. A rally in the stock market tends to weaken Gold price, while sell-offs in riskier markets tend to favor the precious metal.
The price can move due to a wide range of factors. Geopolitical instability or fears of a deep recession can quickly make Gold price escalate due to its safe-haven status. As a yield-less asset, Gold tends to rise with lower interest rates, while higher cost of money usually weighs down on the yellow metal. Still, most moves depend on how the US Dollar (USD) behaves as the asset is priced in dollars (XAU/USD). A strong Dollar tends to keep the price of Gold controlled, whereas a weaker Dollar is likely to push Gold prices up.
The FX universe traded mostly within a range bound theme, as investor assessed the political front in the US, while cautiousness kicked in ahead of important data releases due later in the week.
Here is what you need to know on Tuesday, July 23:
The USD Index (DXY) saw its recent uptick somewhat curtailed, faltering once again around the 200-day SMA near 104.40. Existing Home Sales, the Richmond Fed Manufacturing Index and the weekly report on crude oil inventories by the API are all due on July 23.
EUR/USD regained some acceptable traction and managed to revisit the 1.0900 neighbourhood. On July 23, the European Commission will publish its Consumer Confidence gauge. In addition, the ECB’s Lane will also speak.
GBP/USD picked up pace and reversed two daily pullbacks in a row, shifting its attention back to the 1.3000 region. The next data release of note in the UK will be the preliminary PMIs for the month of July on July 24.
The erratic performance in the greenback and higher US and Japanese yields left USD/JPY with modest losses around the 157.00 zone. The advanced Jibun Bank PMIs are next in “The Land of the Rising Sun” on July 24.
AUD/USD extended its bearish move further south of 0.6700 the figure on the back of lower commodities and disheartening news from China. Coming up next on the Australian docket will be the Judo Bank flash PMIs.
Demand concerns and easing geopolitical fears weighed on WTI and dragged prices to fresh lows below the $78.00 mark per barrel.
Gold prices remained on the defensive and broke below the key $2,400 mark per ounce troy. Same performance saw Silver prices retreat for the fourth straight day and print new monthly lows near $28.70 per ounce.
- AUD/USD registered sharp declines on Monday towards 0.6640.
- During the Asian session, the PBOC loan prime rate was cut by 10 basis points.
- Aussie’s stability is supported by the hawkish RBA stance, which remains reluctant to embrace cuts.
In Monday's session, the Australian Dollar (AUD) presented additional losses against the USD, with AUD/USD beginning the new week around 0.6640. This loss is largely attributed to falling Copper prices and the People Bank’s of China rate cut of 10 basis points. Revised Gross Domestic Product (GDP) Q2 figures and Personal Consumption Expenditures (PCE) from the US, along with Judo PMIs from Australia, are anticipated to shape the week's trading direction.
Despite some signs of weakness in the Australian economy, stubbornly high inflation continues to prompt the Reserve Bank of Australia (RBA) to delay rate cuts, potentially limiting any further decline in the AUD. The RBA maintains its stance amongst the last central banks within the G10 countries likely to begin rate cuts, a commitment that could extend the AUD's recent gains.
Daily digest market movers: Aussie down as markets await new data to get fresh clues on the RBA’s stance
- The People's Bank of China (PBoC) announced new interest rates. The 5-year interest rate was set at 3.85%, which fell short of the expected 3.95%. Similarly, the 1-year interest rate was adjusted to 3.35%, below the anticipated 3.45%.
- In addition, Copper prices fell by nearly 1% on Monday which weighed on the Australian currency as Australia is a big export.
- The Australian Bureau of Statistics (ABS) confirmed last week strong employment figures but that the Unemployment Rate ticked higher to 4.1%, up from 4.0%.
- The reaction of the Reserve Bank of Australia (RBA) to this data will be closely watched, but as for now, the bank isn’t giving signs of easing on its hawkish stance.
- Meanwhile, the market currently predicts a 50% likelihood of the RBA implementing a rate hike either in September or November, reflecting the bank's hawkish stance.
- For the Federal Reserve, the chances of a rate cut in September stand at approximately 90%, near to being priced in.
- However incoming data from both countries will continue shaping those expectations.
AUD/USD Technical analysis: AUD/USD plunges and remains below the 20-day SMA
While the AUD/USD pair has entered a correction period after early July's sharp gains, the main concern lies with the loss of the core support around 0.6000-0.6040. As technical indicators such as the Relative Strength Index (RSI) and the Moving Average Convergence Divergence (MACD) hint at weakening momentum, a deeper downside might be looming unless the pair retains the mentioned range.
Australian Dollar FAQs
One of the most significant factors for the Australian Dollar (AUD) is the level of interest rates set by the Reserve Bank of Australia (RBA). Because Australia is a resource-rich country another key driver is the price of its biggest export, Iron Ore. The health of the Chinese economy, its largest trading partner, is a factor, as well as inflation in Australia, its growth rate and Trade Balance. Market sentiment – whether investors are taking on more risky assets (risk-on) or seeking safe-havens (risk-off) – is also a factor, with risk-on positive for AUD.
The Reserve Bank of Australia (RBA) influences the Australian Dollar (AUD) by setting the level of interest rates that Australian banks can lend to each other. This influences the level of interest rates in the economy as a whole. The main goal of the RBA is to maintain a stable inflation rate of 2-3% by adjusting interest rates up or down. Relatively high interest rates compared to other major central banks support the AUD, and the opposite for relatively low. The RBA can also use quantitative easing and tightening to influence credit conditions, with the former AUD-negative and the latter AUD-positive.
China is Australia’s largest trading partner so the health of the Chinese economy is a major influence on the value of the Australian Dollar (AUD). When the Chinese economy is doing well it purchases more raw materials, goods and services from Australia, lifting demand for the AUD, and pushing up its value. The opposite is the case when the Chinese economy is not growing as fast as expected. Positive or negative surprises in Chinese growth data, therefore, often have a direct impact on the Australian Dollar and its pairs.
Iron Ore is Australia’s largest export, accounting for $118 billion a year according to data from 2021, with China as its primary destination. The price of Iron Ore, therefore, can be a driver of the Australian Dollar. Generally, if the price of Iron Ore rises, AUD also goes up, as aggregate demand for the currency increases. The opposite is the case if the price of Iron Ore falls. Higher Iron Ore prices also tend to result in a greater likelihood of a positive Trade Balance for Australia, which is also positive of the AUD.
The Trade Balance, which is the difference between what a country earns from its exports versus what it pays for its imports, is another factor that can influence the value of the Australian Dollar. If Australia produces highly sought after exports, then its currency will gain in value purely from the surplus demand created from foreign buyers seeking to purchase its exports versus what it spends to purchase imports. Therefore, a positive net Trade Balance strengthens the AUD, with the opposite effect if the Trade Balance is negative.
- Dow Jones climbed around one hundred points amid tepid Monday markets.
- Broad-market hopes for a Fed rate cut have run into the ceiling.
- Key US activity and inflation data looms ahead later in the week.
The Dow Jones Industrial Average (DJIA) climbed around one hundred points on Monday in a thin recovery from last week’s late pullback. Equities are drifting into the high end, but the Dow Jones is holding steady as investors gear up for a fresh round of key US data due later in the week.
According to the CME’s FedWatch Tool, rate markets are still pricing in an all-but-certain rate cut from the Federal Reserve (Fed) in September. Rate traders are pricing in 95% odds of at least a quarter-point rate trim when the Federal Open Market Committee (FOMC) meets on September 18.
A fresh round of S&P Global Manufacturing and Services Purchasing Managers Index (PMI) figures are due on Wednesday, followed by a Gross Domestic Product print on Thursday. Friday will wrap up the trading week with an update to the Personal Consumption Expenditure - Price Index (PCE) inflation figures.
Market participants looking for a Fed rate cut will be hoping for easing figures, and Wednesday’s Services PMI for July is expected to ease to 54.4 from 55.3. Annualized Q2 US GDP is expected to accelerate to 1.9% from 1.4%, and Friday’s PCE Price Index inflation for June is broadly expected to tick higher on the near end of the curve, forecast to print at 0.1% MoM versus the previous 0.0% print.
Dow Jones news
About a third of the Dow Jones is in the red on Monday, with concentrated losses in major names keeping prices more subdued across the wider index. Verizon Communications Inc. (VZ) reported a miss against quarterly revenue estimates, falling nearly 7% to $38.78 per share. On the high side, Nike Inc. (NKE) recovered ground on Monday, climbing 3.3% to $75.09 per share.
Dow Jones technical outlook
The Dow Jones is cycling familiar levels on Monday, but leaning into the bullish side. Intraday price action is crimped below 40,500.00, while a near-term floor is priced in near 40,200.00. Despite a rapid pullback from record highs last week, the Dow Jones is still trading firmly north of the 200-day Exponential Moving Average (EMA) at 37,893.31, and it won’t take much of a push for a fresh round of bidding to test into new record prices near 41,500.00.
Dow Jones five minute chart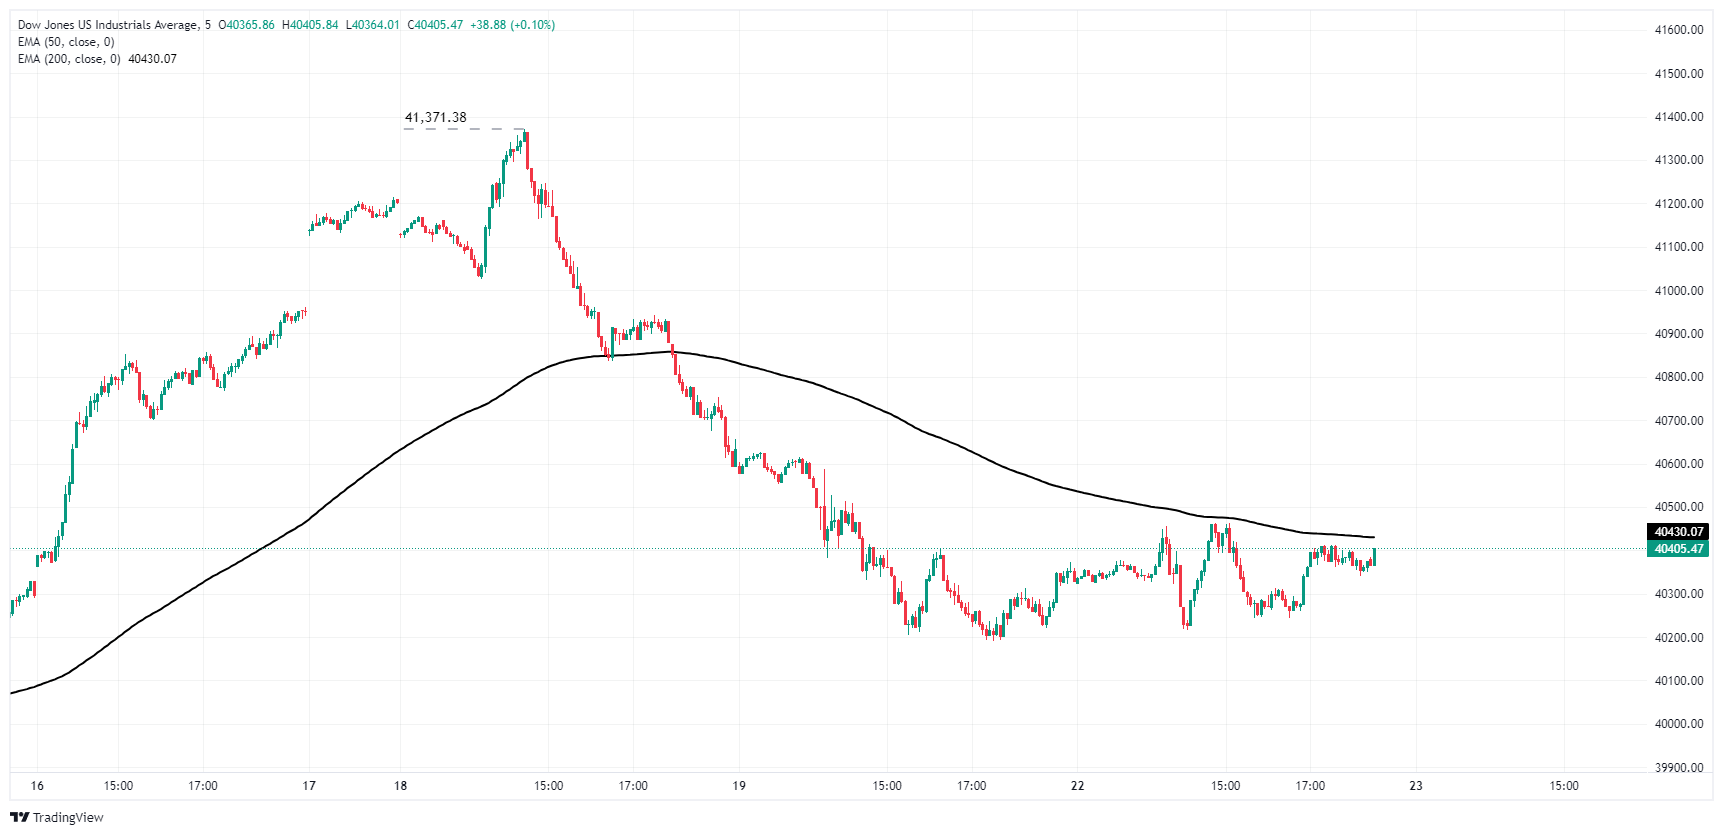
Dow Jones daily chart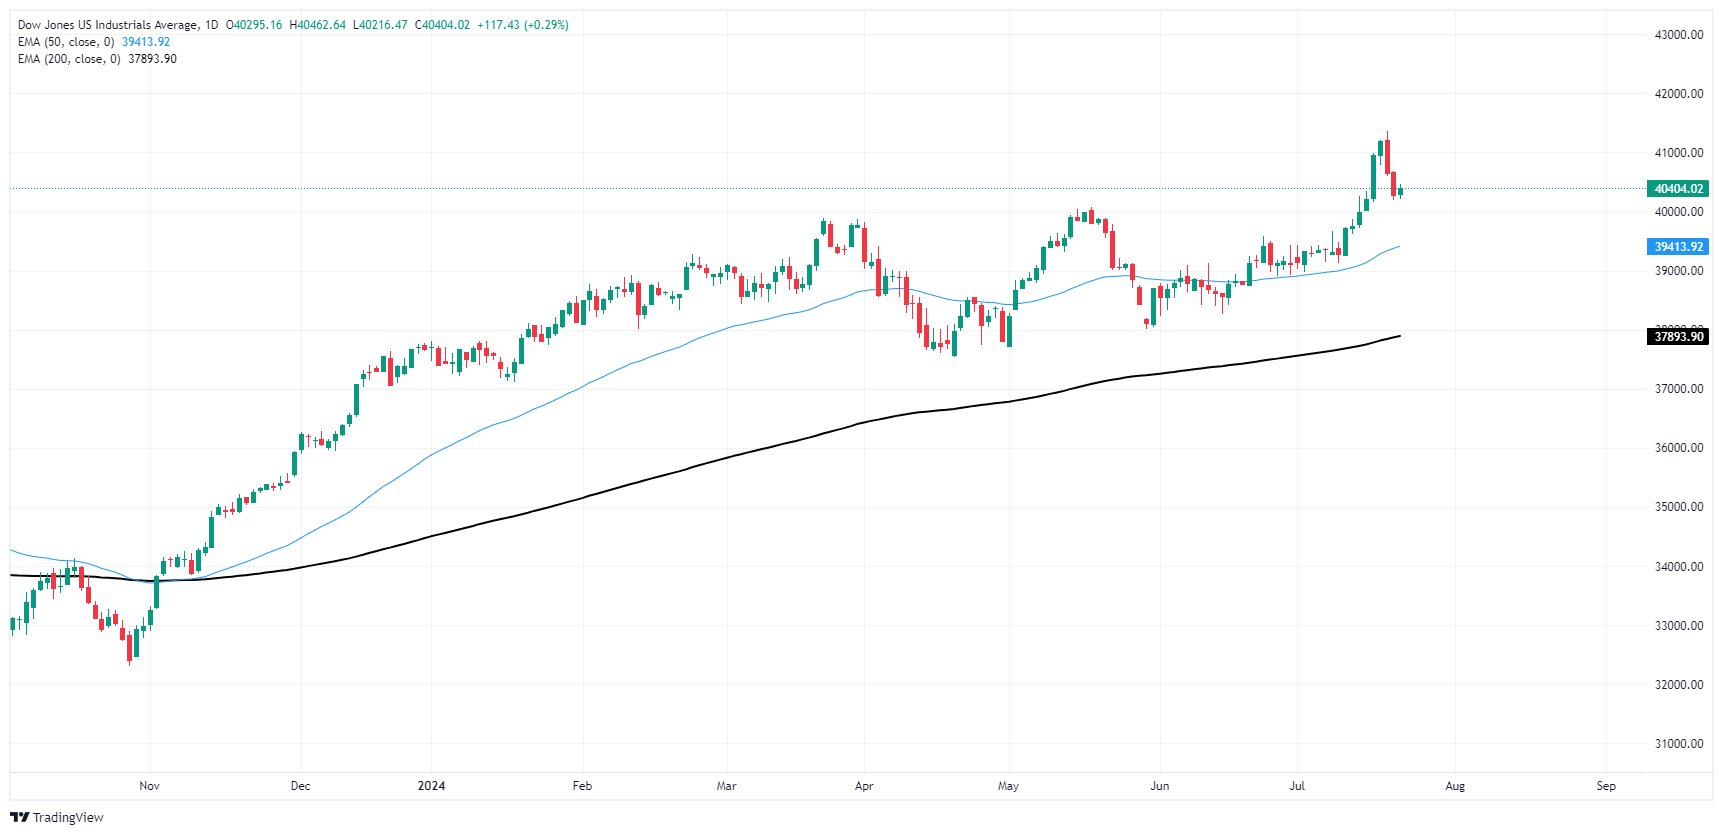
Dow Jones FAQs
The Dow Jones Industrial Average, one of the oldest stock market indices in the world, is compiled of the 30 most traded stocks in the US. The index is price-weighted rather than weighted by capitalization. It is calculated by summing the prices of the constituent stocks and dividing them by a factor, currently 0.152. The index was founded by Charles Dow, who also founded the Wall Street Journal. In later years it has been criticized for not being broadly representative enough because it only tracks 30 conglomerates, unlike broader indices such as the S&P 500.
Many different factors drive the Dow Jones Industrial Average (DJIA). The aggregate performance of the component companies revealed in quarterly company earnings reports is the main one. US and global macroeconomic data also contributes as it impacts on investor sentiment. The level of interest rates, set by the Federal Reserve (Fed), also influences the DJIA as it affects the cost of credit, on which many corporations are heavily reliant. Therefore, inflation can be a major driver as well as other metrics which impact the Fed decisions.
Dow Theory is a method for identifying the primary trend of the stock market developed by Charles Dow. A key step is to compare the direction of the Dow Jones Industrial Average (DJIA) and the Dow Jones Transportation Average (DJTA) and only follow trends where both are moving in the same direction. Volume is a confirmatory criteria. The theory uses elements of peak and trough analysis. Dow’s theory posits three trend phases: accumulation, when smart money starts buying or selling; public participation, when the wider public joins in; and distribution, when the smart money exits.
There are a number of ways to trade the DJIA. One is to use ETFs which allow investors to trade the DJIA as a single security, rather than having to buy shares in all 30 constituent companies. A leading example is the SPDR Dow Jones Industrial Average ETF (DIA). DJIA futures contracts enable traders to speculate on the future value of the index and Options provide the right, but not the obligation, to buy or sell the index at a predetermined price in the future. Mutual funds enable investors to buy a share of a diversified portfolio of DJIA stocks thus providing exposure to the overall index.
- Mexican Peso gains 0.55%, trading at 17.92, after better-than-expected Economic Activity data.
- INEGI reports strong economic activity for May, offsetting slow retail sales growth.
- US political developments with Biden's withdrawal and endorsement of Harris impact market sentiment, favoring high-beta currencies.
The Mexican Peso recovered on Monday after ending the week with more than 2.30% losses. Mexico’s economic data was mixed, though the Economic Activity indicator, which measures growth, was better than expected and bolstered the Mexican currency. Therefore, the USD/MXN drops below the 18.00 figure and trades with gains of 0.55% at around 17.92.
The Mexican National Statistics Agency (INEGI) revealed that economic activity in May exceeded estimates and April's data on a monthly and annual basis. This helped the Peso, which remains appreciating against the US Dollar. Contrarily, Retail Sales for the same period increased slowly, hinting that Government infrastructure projects drive the economy.
Across the border, breaking news emerged on Sunday that US President Joe Biden dropped from the Presidential race and endorsed the current Vice President Kamala Harris to obtain the ticket of the Democrats and compete against former President Donald Trump.
After that, US equity futures opened higher during the Asian session, while Wall Street traded in the green. This undermined the Greenback and favored high-beta currencies like the Mexican Peso.
Last week, Trump’s comments put Mexico in the spotlight, commenting that he will end illegal immigration “by closing the border and completing the wall.” He added, “China and Mexico have taken 68 percent of our automotive industry, but we are going to get it back.”
The remarks threaten to prevent companies from relocating to Mexico, which could weaken the Mexican Peso.
The US Dollar Index (DXY), which tracks the buck’s value against the other six currencies, stays virtually unchanged at around 104.30.
Daily digest market movers: Mexican Peso recovers some ground
- Mexico’s Economic Activity in May increased by 0.7%, exceeding April’s -0.6% MoM contraction. On an annual basis, it slowed from 5.4% to 1.6%.
- May Retail Sales were worse than April’s, rising 0.1% MoM, trailing a 0.5% increase, and 0.3% YoY, down from 3.2%.
- The International Monetary Fund (IMF) adjusted Mexico’s Gross Domestic Product (GDP) expectations for 2024 from 2.4% to 2.2% due to the country’s economic slowdown and the US economic downturn.
- Fitch Ratings reaffirmed Mexico’s BBB- rating with a stable outlook but noted that the proposed judicial reform could impact the country. The credit rating agency expressed uncertainty about the upcoming administration's ability to narrow the fiscal deficit, anticipated a slight economic downturn in 2025, and mentioned that trade tensions with the US could leave Mexico vulnerable.
- The CME FedWatch Tools show that the chances of a quarter-percentage-rate cut to the federal funds rate in September are at 94%.
- June consumer inflation figures were lower than expected in the United States, increasing the chances that the Federal Reserve would lower borrowing costs in 2024 by at least 48 basis points, according to the December 2024 fed funds rate futures contract.
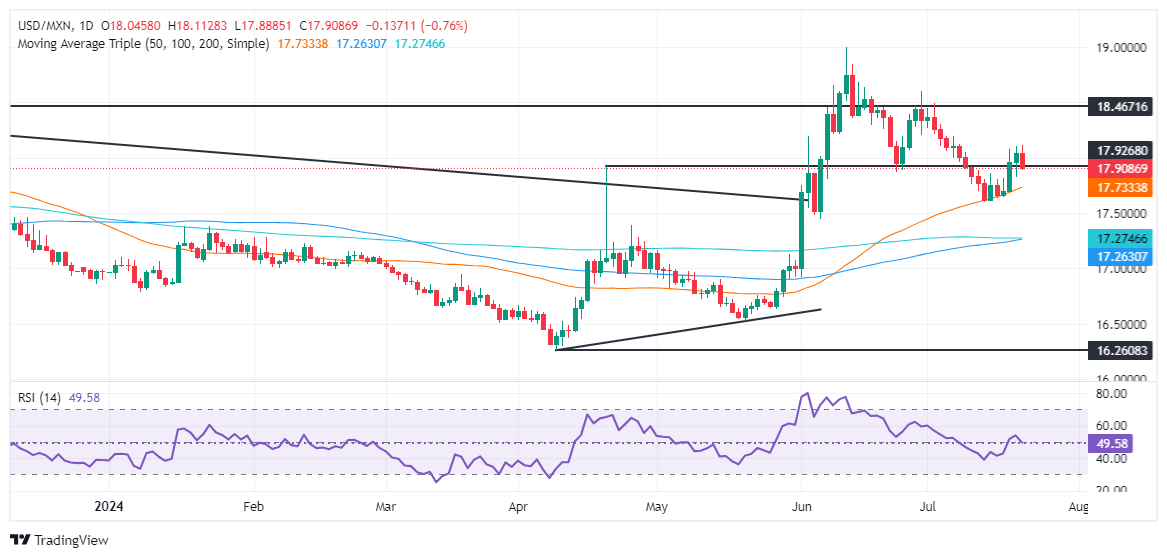
Technical analysis: Mexican Peso surges as USD/MXN slumps below 18.00
The USD/MXN retreated beneath 18.00; it seems to be poised to edge lower and test key support levels, the 50-day Simple Moving Average (SMA) at 17.72, the first support level.
Momentum shifted bearishly, as depicted by the Relative Strength Index (RSI), though it meanders around the 50-neutral line. That said, in the short term, the USD/MXN could be headed for a correction before resuming upwards.
If USD/MXN drops below the 50-day SMA, the next support would be the latest cycle low of 17.58; the July 12 high turned support. A breach of the latter will expose the January 23 peak at 17.38.
If USD/MXN extends its gains above the psychological 18.00 figure, that will expose key resistance levels. Once breached, the next stop would be the July 5 high at 18.19, followed by the June 28 high of 18.59, allowing buyers to aim for the YTD high at 18.99.
Mexican Peso FAQs
The Mexican Peso (MXN) is the most traded currency among its Latin American peers. Its value is broadly determined by the performance of the Mexican economy, the country’s central bank’s policy, the amount of foreign investment in the country and even the levels of remittances sent by Mexicans who live abroad, particularly in the United States. Geopolitical trends can also move MXN: for example, the process of nearshoring – or the decision by some firms to relocate manufacturing capacity and supply chains closer to their home countries – is also seen as a catalyst for the Mexican currency as the country is considered a key manufacturing hub in the American continent. Another catalyst for MXN is Oil prices as Mexico is a key exporter of the commodity.
The main objective of Mexico’s central bank, also known as Banxico, is to maintain inflation at low and stable levels (at or close to its target of 3%, the midpoint in a tolerance band of between 2% and 4%). To this end, the bank sets an appropriate level of interest rates. When inflation is too high, Banxico will attempt to tame it by raising interest rates, making it more expensive for households and businesses to borrow money, thus cooling demand and the overall economy. Higher interest rates are generally positive for the Mexican Peso (MXN) as they lead to higher yields, making the country a more attractive place for investors. On the contrary, lower interest rates tend to weaken MXN.
Macroeconomic data releases are key to assess the state of the economy and can have an impact on the Mexican Peso (MXN) valuation. A strong Mexican economy, based on high economic growth, low unemployment and high confidence is good for MXN. Not only does it attract more foreign investment but it may encourage the Bank of Mexico (Banxico) to increase interest rates, particularly if this strength comes together with elevated inflation. However, if economic data is weak, MXN is likely to depreciate.
As an emerging-market currency, the Mexican Peso (MXN) tends to strive during risk-on periods, or when investors perceive that broader market risks are low and thus are eager to engage with investments that carry a higher risk. Conversely, MXN tends to weaken at times of market turbulence or economic uncertainty as investors tend to sell higher-risk assets and flee to the more-stable safe havens.
- The Canadian Dollar went in both directions on quiet Monday.
- Canada has another rate call looming ahead on Wednesday.
- A tepid start to the trading week leaves CAD traders to tread water.
The Canadian Dollar (CAD) went sideways on Monday, finding some gains against the Antipodeans but shedding further weight against the US Dollar. CAD traders are buckling down for the long wait to Wednesday’s rate call from the Bank of Canada (BoC), with a light economic calendar on the offer for the first half of the trading week.
The Bank of Canada is broadly expected to begin delivering a series of rate cuts this week as the Canadian central bank shrugs off a recent uptick in key inflation metrics and bends the knee to financial markets as well as housing industry advocates, an industry that accounts for an outsized proportion of the Canadian economy. Record housing prices are already crimping economic activity as Canada struggles beneath the weight of shelter and housing costs that have run well ahead of median incomes.
Daily digest market movers: BoC rate cut takes center stage for CAD traders
- The BoC is broadly expected to deliver another quarter-point cut in July after an initial cut in June.
- Markets will be tuning into BoC Governor Tiff Macklem’s Press Conference after the rate call to try and suss out how many more cuts the BoC could be poised to deliver in 2024.
- Rate markets are broadly pricing in around 65 more basis points in cuts through December.
- Market flows are tipped in favor of the Greenback on Monday, giving the USD a firm leg up.
- Key US activity and inflation figures are due later this week. After a stellar run in rate cut expectations the week before, markets could be leery heading into the release window.
Canadian Dollar PRICE Today
The table below shows the percentage change of Canadian Dollar (CAD) against listed major currencies today. Canadian Dollar was the strongest against the Australian Dollar.
| USD | EUR | GBP | JPY | CAD | AUD | NZD | CHF | |
|---|---|---|---|---|---|---|---|---|
| USD | -0.03% | -0.04% | -0.17% | 0.23% | 0.69% | 0.69% | 0.22% | |
| EUR | 0.03% | -0.01% | -0.19% | 0.21% | 0.76% | 0.67% | 0.18% | |
| GBP | 0.04% | 0.01% | -0.28% | 0.21% | 0.77% | 0.67% | 0.18% | |
| JPY | 0.17% | 0.19% | 0.28% | 0.44% | 0.94% | 0.84% | 0.34% | |
| CAD | -0.23% | -0.21% | -0.21% | -0.44% | 0.55% | 0.47% | -0.02% | |
| AUD | -0.69% | -0.76% | -0.77% | -0.94% | -0.55% | -0.09% | -0.59% | |
| NZD | -0.69% | -0.67% | -0.67% | -0.84% | -0.47% | 0.09% | -0.45% | |
| CHF | -0.22% | -0.18% | -0.18% | -0.34% | 0.02% | 0.59% | 0.45% |
The heat map shows percentage changes of major currencies against each other. The base currency is picked from the left column, while the quote currency is picked from the top row. For example, if you pick the Canadian Dollar from the left column and move along the horizontal line to the US Dollar, the percentage change displayed in the box will represent CAD (base)/USD (quote).
Technical analysis: Tepid Canadian Dollar gets buoyed by Antipodeans but losses ground against Greenback
The Canadian Dollar (CAD) was functionally rudderless on Monday, pushed around by broader market flows. The CAD gained around one-half of one percent against the Australian Dollar (AUD) and the New Zealand Dollar (NZD) as the Antipodeans fall across the board. A Monday bid in the Greenback caused CAD to shed roughly one-third of one percent against the US Dollar.
USD/CAD continues to grind its way back towards 1.3800, and the pair is on pace to close Monday in the green after an early tease towards the 1.3700 handle. The pair has closed bullish for all but one of the last seven consecutive trading days, and is set to chalk in day number eight as bidders grapple with 1.3750.
Daily candlesticks found bullish support at the 200-day Exponential Moving Average (EMA) at 1.3597 after a dip below 1.3600 in mid-July. Despite a firm bullish recovery, bidding action is running aground of a supply zone priced in just above 1.3750.
USD/CAD hourly chart
USD/CAD daily chart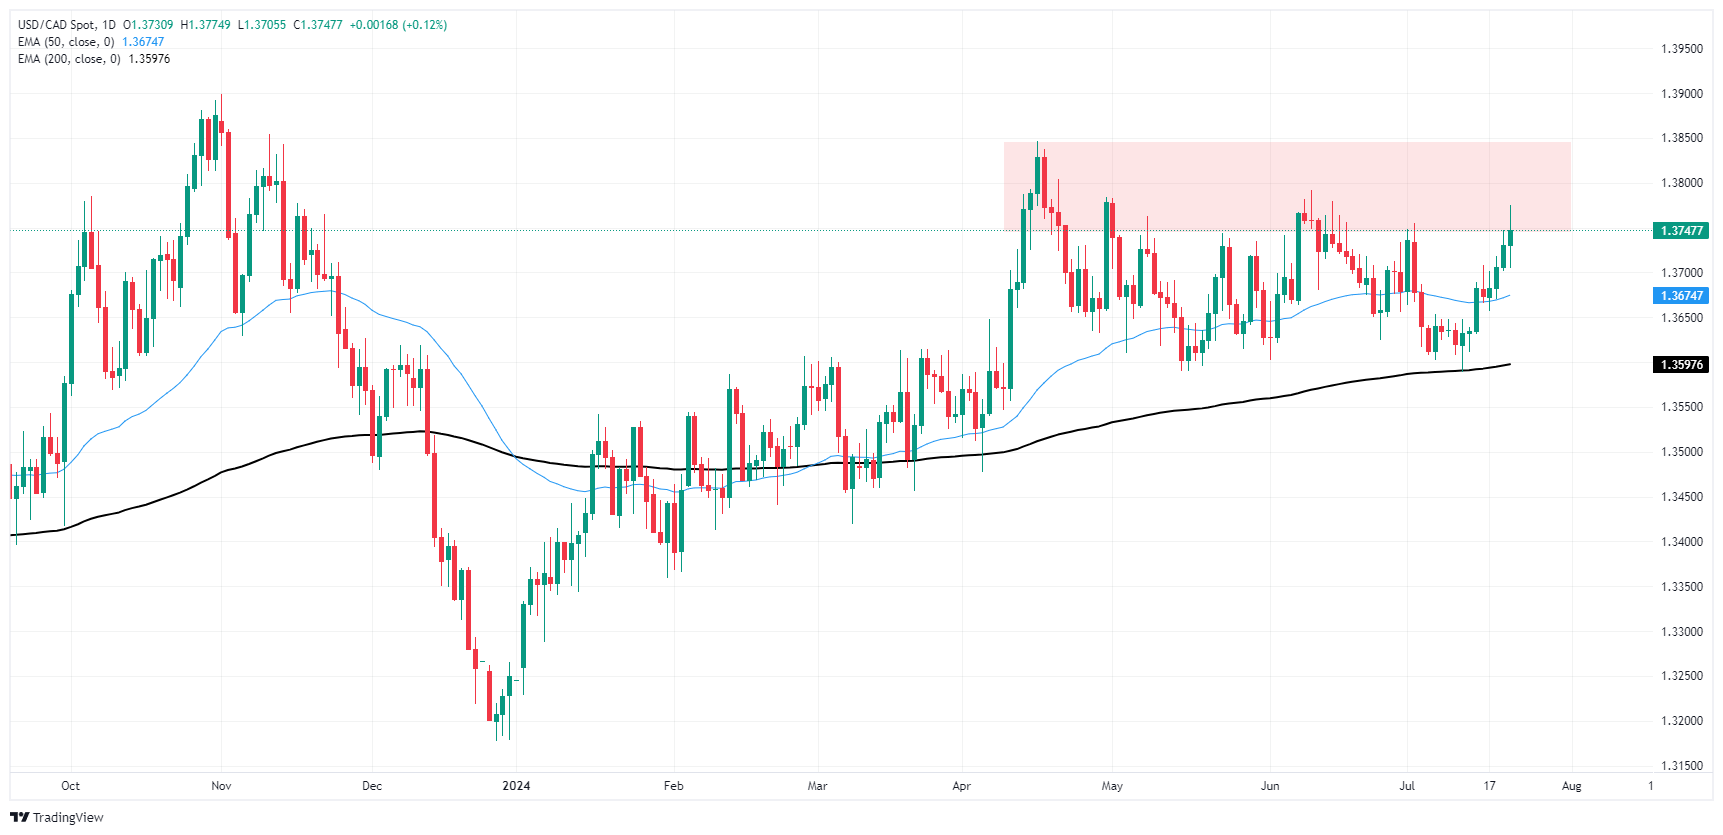
Canadian Dollar FAQs
The key factors driving the Canadian Dollar (CAD) are the level of interest rates set by the Bank of Canada (BoC), the price of Oil, Canada’s largest export, the health of its economy, inflation and the Trade Balance, which is the difference between the value of Canada’s exports versus its imports. Other factors include market sentiment – whether investors are taking on more risky assets (risk-on) or seeking safe-havens (risk-off) – with risk-on being CAD-positive. As its largest trading partner, the health of the US economy is also a key factor influencing the Canadian Dollar.
The Bank of Canada (BoC) has a significant influence on the Canadian Dollar by setting the level of interest rates that banks can lend to one another. This influences the level of interest rates for everyone. The main goal of the BoC is to maintain inflation at 1-3% by adjusting interest rates up or down. Relatively higher interest rates tend to be positive for the CAD. The Bank of Canada can also use quantitative easing and tightening to influence credit conditions, with the former CAD-negative and the latter CAD-positive.
The price of Oil is a key factor impacting the value of the Canadian Dollar. Petroleum is Canada’s biggest export, so Oil price tends to have an immediate impact on the CAD value. Generally, if Oil price rises CAD also goes up, as aggregate demand for the currency increases. The opposite is the case if the price of Oil falls. Higher Oil prices also tend to result in a greater likelihood of a positive Trade Balance, which is also supportive of the CAD.
While inflation had always traditionally been thought of as a negative factor for a currency since it lowers the value of money, the opposite has actually been the case in modern times with the relaxation of cross-border capital controls. Higher inflation tends to lead central banks to put up interest rates which attracts more capital inflows from global investors seeking a lucrative place to keep their money. This increases demand for the local currency, which in Canada’s case is the Canadian Dollar.
Macroeconomic data releases gauge the health of the economy and can have an impact on the Canadian Dollar. Indicators such as GDP, Manufacturing and Services PMIs, employment, and consumer sentiment surveys can all influence the direction of the CAD. A strong economy is good for the Canadian Dollar. Not only does it attract more foreign investment but it may encourage the Bank of Canada to put up interest rates, leading to a stronger currency. If economic data is weak, however, the CAD is likely to fall.
- US Dollar DXY kicked off the week with a slump after a brief rebound at the end of last week but managed to clear daily losses.
- The anticipated exit of President Joe Biden from the presidential race invigorates investors' risk appetite which might limit the upside.
- Dovish Fed expectations might also present a challenge to the green currency.
As the week opened, the US Dollar, measured by the DXY index, exhibited a decline towards the 104.30 area and then recovered to 104.40. US President Joe Biden's expected departure from the presidential race has favored former President Donald Trump, and this upheaval has spurred investors to lean towards riskier assets. Complementing this, the expectation of a dovish stance from the Federal Reserve continues to present challenges to the Greenback. Further indicators to look out for during the week are the Gross Domestic Product (GDP) Q2 revisions and Personal Consumption Expenditures (PCE), which are widely anticipated to add an element of volatility in the USD.
Although the US economy is indeed showing early signs of disinflation, market confidence in a favorable September rate cut from the Federal Reserve remains steady. Even so, Fed officials express a strained demeanor and emphasize the importance of adhering to a data-dependant approach before rushing into any hasty interest rate reductions.
Daily digest market movers: DXY has a bumpy ride due to Fed policy outlook and impending US elections
- The outlook for the Fed's policy and the unsettled politics of the US election continue to be the two major catalysts driving the USD's trajectory.
- As former President Trump becomes the favorite, after Joe Biden’s extir, investors will focus on three broad areas: immigration, tariffs, and fiscal policies. So markets will keep an eye on Trump’s hints about its economic plans.
- The CME FedWatch Tool sheds light on the widespread anticipation about the September rate cut as investors are pricing in a 25 bps cut.
- The upcoming GDP and PCE data are likely to shape the USD dynamics for the week ahead as they will guide markets on the next Fed moves.
DXY Technical outlook: Bearish signs persist despite attempts to rise above 200-day SMA
The DXY index might have tallied minor gains last week, but the bearish outlook remains unchanged, primarily as the index faces a tough time ascending above the 200-day Simple Moving Average (SMA) at 104.30. The bearish stance is further supported by the daily indicators like the Relative Strength Index (RSI) and Moving Average Convergence Divergence (MACD), which remain in negative area, suggesting a continuation of downside momentum.
US Dollar FAQs
The US Dollar (USD) is the official currency of the United States of America, and the ‘de facto’ currency of a significant number of other countries where it is found in circulation alongside local notes. It is the most heavily traded currency in the world, accounting for over 88% of all global foreign exchange turnover, or an average of $6.6 trillion in transactions per day, according to data from 2022. Following the second world war, the USD took over from the British Pound as the world’s reserve currency. For most of its history, the US Dollar was backed by Gold, until the Bretton Woods Agreement in 1971 when the Gold Standard went away.
The most important single factor impacting on the value of the US Dollar is monetary policy, which is shaped by the Federal Reserve (Fed). The Fed has two mandates: to achieve price stability (control inflation) and foster full employment. Its primary tool to achieve these two goals is by adjusting interest rates. When prices are rising too quickly and inflation is above the Fed’s 2% target, the Fed will raise rates, which helps the USD value. When inflation falls below 2% or the Unemployment Rate is too high, the Fed may lower interest rates, which weighs on the Greenback.
In extreme situations, the Federal Reserve can also print more Dollars and enact quantitative easing (QE). QE is the process by which the Fed substantially increases the flow of credit in a stuck financial system. It is a non-standard policy measure used when credit has dried up because banks will not lend to each other (out of the fear of counterparty default). It is a last resort when simply lowering interest rates is unlikely to achieve the necessary result. It was the Fed’s weapon of choice to combat the credit crunch that occurred during the Great Financial Crisis in 2008. It involves the Fed printing more Dollars and using them to buy US government bonds predominantly from financial institutions. QE usually leads to a weaker US Dollar.
Quantitative tightening (QT) is the reverse process whereby the Federal Reserve stops buying bonds from financial institutions and does not reinvest the principal from the bonds it holds maturing in new purchases. It is usually positive for the US Dollar.
The Bank of England's (BoE) broad trade-weighted sterling index is now barely 3% away from the levels traded in June 2016, before the Brexit vote. Some are no doubt making the case that this is a removal of the Brexit risk premium in sterling, aided by new Prime Minister Keir Starmer's desire to engage more closely with Europe, FX strategist at ING Chris Turner notes.
Close to pre-Brexit vote levels
“While we have some sympathy with that view, we ascribe sterling strength more to sticky UK inflation and the limited pricing of BoE rate cuts this year, plus July's drop in the dollar on the back of softer US price data.”
“According to our medium-term fair value models, we see GBP/USD as fairly priced (i.e., not significantly undervalued) and we see fund managers reaching the same conclusions in buy-side investor surveys too.”
“We are still officially looking for three BoE rate cuts this year (versus two currently priced) and when the UK data allows it, we think sterling will come lower. The 1 August MPC rate meeting will also be the first big opportunity since the UK election to hear what the BoE are really thinking. We see this as a downside risk to sterling too.”
Last week, investors had already started to price President Joe Biden's withdrawal from November's race. The DXY dollar index opened in Asia today about 0.1% lower on the news, but quickly edged higher, as did US yields, FX strategist at ING Chris Turner notes.
Markets don’t care much about Biden’s withdrawal
“On the subject of politics, it looks like the US data this week could actually be good news for the Democrats. Second quarter US GDP on Thursday is expected to bounce back above 2% quarter-on-quarter annualised, while Friday's release of June's core PCE inflation data should see the Federal Reserve's preferred gauge of inflation coming in on target at 0.2% month-on-month.”
“This set of releases looks unlikely to move the needle on the pricing of Fed cuts this year, where the market currently expects a 57bp reduction. We doubt consensus releases here have to send the dollar much lower, and instead, they will probably cement the low volatility environment currently in place in FX markets.”
“In addition, this week sees $183bn of two, five and seven-year US Treasury notes being auctioned. A US fiscal crisis is one of investors' top fears over the next 18 months, and auction results will therefore be scrutinised this week. On a quiet day for data, we think the market will be focusing on whether USD/CNH trades above 7.30 again, and DXY could edge up to the 104.55/85 area.”
A reversal of the Trump trade threatens Gold bugs, TDS senior commodity strategist Daniel Ghali notes.
Window for downside open in the Yellow Metal
“Recall, our gauge of discretionary trader positioning in Gold remains bloated relative to rates market expectations, with signs that the Trump trade has contributed to some froth above and beyond what is consistent with expectations of Fed cuts alone.
“Positioning risks are now asymmetrically skewed to the downside in the Yellow Metal, with Commodity Trading Advisors (CTAs) effectively sitting on a 'max long' position that remains vulnerable to a break south of $2380/oz, whereas even a modest reversal of the Trump trade could catalyze additional selling activity.”
“With Asia on a buyer's strike, as highlighted by the plummeting SGE premium alongside notable long liquidations on Shanghai Futures Exchange (SHFE), a liquidity vacuum could ensue with fewer buyers to offset potential liquidations from a potential reversal of the Trump trade compounded by CTA selling activity in a downtape. The window for downside is open in the Yellow Metal.”
Now is not the time to kick off supercycle trades. The breakdown in base metals is intensifying as commodity demand sentiment plummets, TDS senior commodity strategist Daniel Ghali notes.
Aluminum and Copper turn to the downside
“LME Aluminum is now likely to come under additional pressure as Commodity Trading Advisor (CTA) selling activity mounts with algos now starting to build up a notable net short position. We expect trend followers to sell an additional -15% of their max size as trend signals continue to deteriorate, with some scope for additional selling activity shortly below current prices.”
“While Copper's plunge is consistent with fundamentals, the Red Metal's descend has been aided by the export arbitrage weighing on bullish spec positions, defying expectations for the supercycle to buoy prices to stratospheric heights.”
Massive selling activity could hit the tapes in Platinum, TDS senior commodity strategist Daniel Ghali notes, TDS senior commodity strategist Daniel Ghali notes.
Platinum and Palladium are under a massive selling program
“Current price action is consistent with a massive selling program, as Commodity Trading Advisors (CTAs) sell nearly -45% of the algos' max size.”
“This increases conviction in our view that Platinum could have more to lose than Palladium, with our advanced positioning analytics still pointing to upside asymmetry in positioning risks for the latter, given discretionary traders also likely still hold a substantial net short position.”
“With our real-time gauge of commodity demand sentiment still plummeting, a tactical relative value play appears to be an efficient expression of this view.”
- GBP/USD at 1.2910, stable despite US political developments, after touching high of 1.2942.
- Technicals: GBP/USD finds support at 1.2894, consolidating from highs.
- Bullish momentum holds; RSI positive with resistance at 1.2950, 1.3044 and supports at 1.2860, 1.2803.
The Pound Sterling begins the week virtually flat against the Greenback on Monday, trading at around 1.2910 after hitting a daily high of 1.2942.
Over the weekend, political developments in the US saw President Joe Biden drop out of the presidential race and endorse Vice-President Kamala Harris. The effects are pending to be felt by the Forex markets, though Wall Street recovers ground.
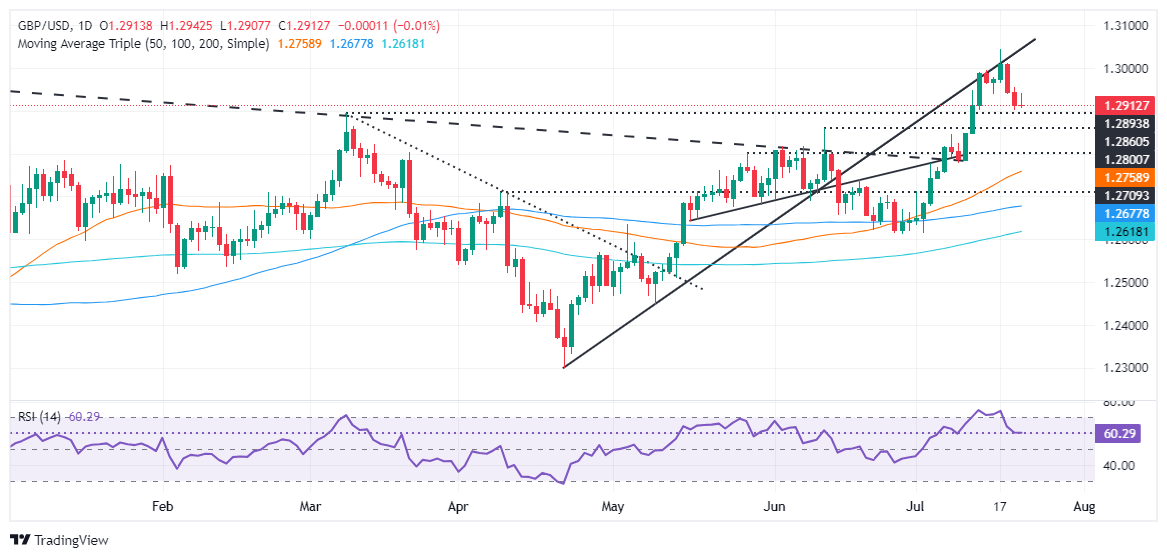
GBP/USD Price Analysis: Technical outlook
From a technical standpoint, the GBP/USD consolidates after rallying from 1.2600 to 1.3000 during the last three weeks. Nevertheless, the pair pulled back from recent highs and faced solid support at 1.2894, and the March 8 peak turned support.
Momentum suggests buyers had stepped in, capping the GBP/USD drop. The Relative Strength Index (RSI) stays in bullish territory, though market participants remain undecisive about lifting the Pound or letting it slide for a deeper correction.
For a bullish continuation, buyers must reclaim the 1.2950 psychological figure before testing the July 17 high at 1.3044. Once cleared, the next supply zone to encounter would be last year’s high at 1.3142.
Conversely, if GBP/USD tumbles under 1.2900, the first support would be the June 12 high turned support at 1.2860. Once surpassed, further downside lies ahead, like the March 21 high at 1.2803, before aiming toward the 50-day moving average (DMA) at 1.2757.
GBP/USD Price Action – Daily Chart
Pound Sterling FAQs
The Pound Sterling (GBP) is the oldest currency in the world (886 AD) and the official currency of the United Kingdom. It is the fourth most traded unit for foreign exchange (FX) in the world, accounting for 12% of all transactions, averaging $630 billion a day, according to 2022 data. Its key trading pairs are GBP/USD, aka ‘Cable’, which accounts for 11% of FX, GBP/JPY, or the ‘Dragon’ as it is known by traders (3%), and EUR/GBP (2%). The Pound Sterling is issued by the Bank of England (BoE).
The single most important factor influencing the value of the Pound Sterling is monetary policy decided by the Bank of England. The BoE bases its decisions on whether it has achieved its primary goal of “price stability” – a steady inflation rate of around 2%. Its primary tool for achieving this is the adjustment of interest rates. When inflation is too high, the BoE will try to rein it in by raising interest rates, making it more expensive for people and businesses to access credit. This is generally positive for GBP, as higher interest rates make the UK a more attractive place for global investors to park their money. When inflation falls too low it is a sign economic growth is slowing. In this scenario, the BoE will consider lowering interest rates to cheapen credit so businesses will borrow more to invest in growth-generating projects.
Data releases gauge the health of the economy and can impact the value of the Pound Sterling. Indicators such as GDP, Manufacturing and Services PMIs, and employment can all influence the direction of the GBP. A strong economy is good for Sterling. Not only does it attract more foreign investment but it may encourage the BoE to put up interest rates, which will directly strengthen GBP. Otherwise, if economic data is weak, the Pound Sterling is likely to fall.
Another significant data release for the Pound Sterling is the Trade Balance. This indicator measures the difference between what a country earns from its exports and what it spends on imports over a given period. If a country produces highly sought-after exports, its currency will benefit purely from the extra demand created from foreign buyers seeking to purchase these goods. Therefore, a positive net Trade Balance strengthens a currency and vice versa for a negative balance.
- EUR/USD hovers around 1.0870, remains on defensive due to multiple headwinds.
- A few ECB policymakers remain comfortable with expectations of two more rate cuts.
- The US Dollar will dance to the tunes of a slew of US data.
The EUR/USD pair trades close to near immediate support of 1.0870 in Monday’s American session. The major currency pair remains on tenterhooks amid increasing speculation the European Central Bank (ECB) will cut interest rates two times more this year and a recovery move in the US Dollar (USD)
ECB policymakers see market speculation for two more rate cuts: one in September and the following in December as appropriate. ECB policymaker Francois Villeroy de Galhau said in an interview on French radio BFM Business, "Market expectations for the path of interest rates seem rather reasonable to me at the moment," Reuters reported.
Last week, the ECB left interest rates unchanged amid concerns that aggressive policy easing could spurt price pressures again. ECB President Christine Lagarde refrained from pre-committing a specific rate-cut path.
This week, investors will focus on the preliminary Eurozone HCOB PMI data for July, which will be published on Wednesday. The report is estimated to show that the Composite PMI expanded to 51.1 from the former release of 50.9 due to growth in activities in manufacturing as well as service sectors.
Meanwhile, the US Dollar recovers its intraday losses that were prompted by growing uncertainty over the United States (US) parliamentary elections. The US Dollar Index (DXY), which tracks the Greenback’s value against six major currencies, hovers near three-day high around 104.40.
This week, the US Dollar will be influenced by the US economic data such as: S&P Global PMI, Q2 Gross Domestic Product (GDP), Durable Goods Orders and the Personal Consumption Expenditure Price Index (PCE) for June.
Euro FAQs
The Euro is the currency for the 20 European Union countries that belong to the Eurozone. It is the second most heavily traded currency in the world behind the US Dollar. In 2022, it accounted for 31% of all foreign exchange transactions, with an average daily turnover of over $2.2 trillion a day. EUR/USD is the most heavily traded currency pair in the world, accounting for an estimated 30% off all transactions, followed by EUR/JPY (4%), EUR/GBP (3%) and EUR/AUD (2%).
The European Central Bank (ECB) in Frankfurt, Germany, is the reserve bank for the Eurozone. The ECB sets interest rates and manages monetary policy. The ECB’s primary mandate is to maintain price stability, which means either controlling inflation or stimulating growth. Its primary tool is the raising or lowering of interest rates. Relatively high interest rates – or the expectation of higher rates – will usually benefit the Euro and vice versa. The ECB Governing Council makes monetary policy decisions at meetings held eight times a year. Decisions are made by heads of the Eurozone national banks and six permanent members, including the President of the ECB, Christine Lagarde.
Eurozone inflation data, measured by the Harmonized Index of Consumer Prices (HICP), is an important econometric for the Euro. If inflation rises more than expected, especially if above the ECB’s 2% target, it obliges the ECB to raise interest rates to bring it back under control. Relatively high interest rates compared to its counterparts will usually benefit the Euro, as it makes the region more attractive as a place for global investors to park their money.
Data releases gauge the health of the economy and can impact on the Euro. Indicators such as GDP, Manufacturing and Services PMIs, employment, and consumer sentiment surveys can all influence the direction of the single currency. A strong economy is good for the Euro. Not only does it attract more foreign investment but it may encourage the ECB to put up interest rates, which will directly strengthen the Euro. Otherwise, if economic data is weak, the Euro is likely to fall. Economic data for the four largest economies in the euro area (Germany, France, Italy and Spain) are especially significant, as they account for 75% of the Eurozone’s economy.
Another significant data release for the Euro is the Trade Balance. This indicator measures the difference between what a country earns from its exports and what it spends on imports over a given period. If a country produces highly sought after exports then its currency will gain in value purely from the extra demand created from foreign buyers seeking to purchase these goods. Therefore, a positive net Trade Balance strengthens a currency and vice versa for a negative balance.
The Chineze Yuan (CNH) edged down after the People’s Bank of China (PBOC) unexpectedly cut the seven-day reverse repo rate, BBH FX analysts note.
China looks set for weaker growth in the years ahead
“CNH edged down after the People’s Bank of China (PBOC) unexpectedly cut the seven-day reverse repo rate 10 bp to a historic low of 1.70%. The PBOC is trying to shore-up sluggish Chinese economic activity.”
“However, until China deals with its huge debt overhang (total debt is more than 300% of GDP), the country looks set for weaker growth in the years ahead.”
The US Dollar (USD) is trading on the defensive, underperforming the most against JPY. The US yield curve inverted slightly, and US equity futures are higher, BBH FX analysts note.
The US yield curve is slightly inverted
“USD is trading on the defensive, underperforming the most against JPY. The US yield curve inverted slightly, and US equity futures are higher.”
“USD will likely remain under short-term downside pressure against major currencies as Fed funds rate expectations continue to diverge from the FOMC’s Dot Plot.”
“Fed funds futures are pricing-in over 60 bp of cuts by December 2024 while the FOMC has only 25 bp of cut pencilled-in this year.”
The Pound Sterling (GBP) is trading modestly firmer on the daily chart today. While gains are slight, they may be enough to signal a halt in the GBP’s recent softness, Scotiabank’s FX analyst Shaun Osborne notes.
Cable is showing signs of steadying around 1.29
“Cable is showing signs of steadying around 1.29. There were no data reports from the UK today but preliminary July PMI data are released tomorrow may—or may not—help settle equivocal market bets on the outlook for a BoE rate cut at the August 1 policy decision. Swaps suggest 11bps of easing is priced in at this point.”
“Sterling is trading modestly firmer on the daily chart today. While gains are slight, they may be enough to signal a halt (and possibly a rebound) in the GBP’s recent softness. The daily candle pattern shows a possible ‘harami’ signal developing today which—if confirmed through the close of trade on the day—should signal firmer support at 1.2900/10. Resistance is 1.2970/75 and 1.3045/50.”
The Euro (EUR) is little changed on the session and is consolidating above key short-term support at 1.0875, Scotiabank’s FX analyst Shaun Osborne notes.
A break below 1.0875to lead EUR to 1.0750
“The EUR is little changed on the session. ECB policymakers continue to suggest that the ECB is in no rush to cut rates—Makhlouf said as much earlier today while Kazimir, a hawk, commented that while bets for two rate cuts were not fully misplaced, they weren’t a baseline expectation for the bank either.”
“Spot is consolidating above key short-term support at 1.0875—a potential Head & Shoulders trigger on the intraday chart. A break below this point would suggest more EUR weakness towards 1.0750 over the next week or so. Intraday resistance is 1.0910/20 ahead of 1.0950.”
- The Oil price dives further amid growing concerns over China’s economic outlook.
- The PBoC surprisingly reduced its Loan Prime Rate by 10 bps.
- Kamala Harris’s nomination for Democrats’ leader has increased US political uncertainty.
West Texas intermediate (WTI), futures on NYMEX, extends its downside below $78.00 in Monday’s American session. The Oil price weakens as an unexpected decision by the People’s Bank of China (PBoC) to cut its benchmark rates has pointed to concerns over the China’s economic outlook. China is the world’s largest Oil importer and an uncertainty over its economic prospects is an unfavorable situation for the Oil price.
The PBoC lowered its one-year and five-year Loan Prime Rate (LPR) by 10 basis points to 3.35% and 3.85%, respectively. It is expected that the rate-cut move from the PBoC has come due to weaker-than-expected Q2 Gross Domestic Product (GDP) growth rate. The data came in showed that the economy grew by 0.7%, slower than estimates of 1.1% and the former release of 1.5%.
Apart from growing demand concerns, easing fears of the Oil market remaining tight have also weighed heavily on the Oil price. A note from Morgan Stanley showed that it expects the supply from OPEC and non-OPEC players to grow by about 2.5 million barrels per day in 2025, well ahead of demand growth.
Meanwhile, the United States (US) political uncertainty has also weighed on the Oil price. According to market speculation, Doanld Trump-led-Republican is expected to win presidential elections. Trump has promised to increase US Oil production if he comes out victorious.
The US Dollar Index (DXY), which tracks the Greenback’s value against six major currencies, edges lower as US Vice President Kamala Harris appears as nominee of Democrats.
Going forward, the Oil price will be influenced by preliminary S&P Global Manufacturing PMI data from various nations, which will indicate the global demand outlook.
Brent Crude Oil FAQs
Brent Crude Oil is a type of Crude Oil found in the North Sea that is used as a benchmark for international Oil prices. It is considered ‘light’ and ‘sweet’ because of its high gravity and low sulfur content, making it easier to refine into gasoline and other high-value products. Brent Crude Oil serves as a reference price for approximately two-thirds of the world's internationally traded Oil supplies. Its popularity rests on its availability and stability: the North Sea region has well-established infrastructure for Oil production and transportation, ensuring a reliable and consistent supply.
Like all assets supply and demand are the key drivers of Brent Crude Oil price. As such, global growth can be a driver of increased demand and vice versa for weak global growth. Political instability, wars, and sanctions can disrupt supply and impact prices. The decisions of OPEC, a group of major Oil-producing countries, is another key driver of price. The value of the US Dollar influences the price of Brent Crude Oil, since Oil is predominantly traded in US Dollars, thus a weaker US Dollar can make Oil more affordable and vice versa.
The weekly Oil inventory reports published by the American Petroleum Institute (API) and the Energy Information Agency (EIA) impact the price of Brent Crude Oil. Changes in inventories reflect fluctuating supply and demand. If the data shows a drop in inventories it can indicate increased demand, pushing up Oil price. Higher inventories can reflect increased supply, pushing down prices. API’s report is published every Tuesday and EIA’s the day after. Their results are usually similar, falling within 1% of each other 75% of the time. The EIA data is considered more reliable, since it is a government agency.
OPEC (Organization of the Petroleum Exporting Countries) is a group of 13 Oil producing nations who collectively decide production quotas for member countries at twice-yearly meetings. Their decisions often impact Brent Crude Oil prices. When OPEC decides to lower quotas, it can tighten supply, pushing up Oil prices. When OPEC increases production, it has the opposite effect. OPEC+ refers to an expanded group that includes ten extra non-OPEC members, the most notable of which is Russia.
The Canadian Dollar (CAD) is a mild underperformer this morning alongside its commodity cousins (AUD and NZD) which are also booking minor losses on the US Dollar (USD) on the session, Scotiabank’s FX analyst Shaun Osborne notes.
Is set to reach the 1.39+ area
“Commodity FX is ignoring firmer stocks while the high beta currencies may be reflecting some spillover from a weaker CNY/CNH after the PBoC surprised markets with a cut in the 1W reverse repo rate, the first reduction in a year. The CAD’s focus this week falls squarely on Wednesday’s BoC policy decision where a 25bps cut is more or less fully priced in at this point.”
“The CAD’s slide after failing to crack 1.36 earlier this month has been relentless, with the CAD managing only one positive session in the last eight trading days. USD gains remain capped in the mid-1.37s for now but a break above 1.3750 would suggest additional gains to the 1.38 area in the short run and could c. Support is 1.3650/75.”
There has not (yet) been a strong reaction in the market to the news that Biden is stepping back from his re-election bid. Both the US yield curve and EUR/USD are trading close to where they were on Friday afternoon. While US politics could bring plenty of volatility this summer, today it is the Japanese Yen (JPY) which is again stealing the limelight in the FX market, Rabobank’s senior FX strategist Jane Foley notes.
JPY is the best G10 performer
“The JPY is the best performing G10 currency on a 1-day view. It is also the best G10 performer on a 5-day view and in the month to date as speculators reduce their short positions. That said, the 100-day sma provided decent support last week. Insofar as the Trump trade implies a stronger USD, US politics will play into the outlook for USD/JPY this year.”
“It is still unclear whether the BoJ will see the justification for a move next week. An absence of hawkish signals from the BoJ on July 31 could yet result in another pop higher in USD/JPY, particularly if Trump’s position on US opinion polls holds firm.”
“While there is plenty of scope for near-term volatility in USD/JPY, we see improved chances of the JPY winning back ground later in the year based on the assumption that a recovery in Japanese real wages will allow for a more hawkish BoJ. We retain a 6-month forecast of USD/JPY152.00.”
The US Dollar (USD) net long positions have increased. The Euro (EUR) net long positions surged, driven by an increase in long positions, and the Pound Sterling (GBP) net long positions increased for the third consecutive week, in dramatic fashion, driven by an increase in long positions, Rabobank’s senior FX strategist Jane Foley notes.
GBP outperforms everyone
“USD net long positions have increased, driven by a decrease in short positions. Joe Biden announced his decision to drop out of the US presidential race over the weekend. We expect the “Trump trade” to unwind, at least partially, and the implications of this decision to be reflected in next week’s COT positioning.”
“EUR net long positions surged, driven by an increase in long positions, ahead of last week’s ECB policy meeting. The ECB released its decision to maintain the 4.25% refinancing rate, as anticipated by Bloomberg surveyed analysts and traders alike. It left the door wide open for a move in September.”
“GBP net long positions increased for the third consecutive week, in dramatic fashion, driven by an increase in long positions. GBP longs are at record levels at 0.183M contracts. GBP has retained its position as the best performing G10 currency year-to-date following the UK July 4 election.”
The People's Bank of China (PBoC) unexpectedly cut its benchmark rate, the 7-day reverse repo rate, by 10 basis points to 1.7% last night, the first rate cut since August last year, Commerzbank’s FX strategist Volkmar Baur notes.
The market is set to ignore negative scenarios
“The impact of monetary policy in general and the policy rate in particular on the currency is less pronounced than on other currencies due to the existing capital controls and the structure of the Chinese economy, it can still have an indirect impact. This is because lowering the policy rate has a certain signaling effect.”
“Short-term impulses were never expected from the Third Plenum, which ended last week. This meeting is always about longer-term developments and reforms. And while the initial communique was somewhat disappointing, the more detailed documents released over the weekend offer a bit more hope for a number of constructive reforms, for example in fiscal policy.”
“So, the signal of near-term support from PBoC is important, especially in light of the weak Q2 growth numbers. The Politburo officially meets this week, so signals for further support measures could also come out of this meeting. I would expect the market will be able to discount more negative scenarios of a more pronounced growth slowdown, which should help the CNY.”
CE3 high-beta currencies usually outperform the Euro (EUR) (versus the US Dollar (USD)), which means that they strengthen against the Euro, Commerzbank’s FX strategist Tatha Ghose notes.
HUF is likely to underperform PLN
“The high-beta relationship is summarised by the two figures which show percent changes in EUR/PLN and EUR/HUF against percent changes in EUR/USD (the downward sloping lines represent that if the change in EUR/USD is positive, the change in EUR/HUF, for example, will be negative). The figures also show that currently, the exchange rates are very much in line with where they should be.”
“This means that if EUR were to peak out and USD were to make a comeback, there will be no major mis-alignment or mis-pricing, which PLN or HUF would first have to undo, before they could resume their usual beta relationship. Hence, we may assume that they will straightaway weaken from current levels due to a lower EUR, in line with their beta characteristic.”
“Also, HUF has a slightly greater beta than PLN (slightly steeper slope of the trendline), hence is likely to underperform PLN as their mutual rally reverses. This means that PLN/HUF will rise if EUR begins to weaken again. Such a view obviously is based on mechanical reaction characteristics to euro movements, not on specifically fundamental factors.”
The Japanese government wants a stronger Yen (JPY). It seems fairly clear that the Japanese Ministry of Finance (MOF) has intervened several times in recent days to support JPY. At the same time, there is a high probability (even this morning!) that a future US government wants to see a weak US Dollar (USD), Commerzbank’s FX strategist Ulrich Leuchtmann notes.
A possible policy coordination between the Fed and MoF
“This is a rare case in which the governments on both sides of the USD/JPY pair are in agreement about the direction in which they would like the market outcome to change. In technical jargon, this is called 'international policy coordination', although that word literally could be understood in many different ways. Economists mean this.”
“The great example of international policy coordination is the Plaza Accord, the agreement of the G5 finance ministers and central bank governors (USA, Japan, Germany, France, UK), who met at the Plaza Hotel in New York on September 22, 1985 and agreed to weaken the US dollar against the other four currencies by means of intervention. Followed by a Louvre Accord of the G6 (including Canada) when they had to decide that the USD devaluation should be enough.”
“Whether this was it or not, economists have come to the conclusion that international policy coordination is a bad idea. But I now fear that every generation repeats the mistakes of the past, because they only learn from their own failures and do not draw lessons from the experiences of their elders. That's why I don't want to rule out the possibility that there could be a repeat of “Plaza 1985” after 40 years.”
- AUD/USD extends its downside trend to 0.6660 on a dismal market mood.
- US political uncertainty and PBoC’s surprise rate-cut decision dampen investors’ risk appetite.
- The US Dollar will dance to the tunes of the US economic data.
The AUD/USD pair extends its losing spree for the sixth trading session on Monday. The Aussie asset slides further to near 0.6660 as cautious market sentiment weighs heavily on Asia-Pacific currencies and equities of the world’s largest continent.
Investors’ risk appetite weakened due to uncertainty over the United States (US) Presidential elections and an unexpected rate-cut announcement by the People’s Bank of China (PBoC). The nomination of US Vice President Kamala Harris for leading the Democratic against Donald Trump-led-Republicans has increased political uncertainty as she was endorsed of Kamala Harris by all state Democratic Party Chairs.
In addition to US political uncertainty, the PBoC's surprise rate-cut move to boost liquidity stimulus to spur domestic demand has raised concerns over China’s economic outlook. The PBoC cut its one-year and five-year Loan Prime Rate (LPR) to 3.35% and 3.85%, respectively.
On the policy front, growing speculation that the Reserve Bank of Australia (RBA) could raise interest rates further this year due to persistent price pressures.
Meanwhile, the US Dollar (USD) edges lower due to deepening political uncertainty. The US Dollar Index (DXY), which tracks the Greenback’s value against six major currencies, falls slightly to 104.20.
This week, the US Dollar will be guided by a slew of US economic data. Top-tier economic data such as Q2 Gross Domestic Product (GDP) and the Personal Consumption Expenditure Price Index (PCE) for June will provide cues about when the Federal Reserve (Fed) will start reducing interest rates this year.
Economic Indicator
PBoC Interest Rate Decision
The People’s Bank of China’s (PBoC) Monetary Policy Committee (MPC) holds scheduled meetings on a quarterly basis. However, China’s benchmark interest rate – the loan prime rate (LPR), a pricing reference for bank lending – is fixed every month. If the PBoC forecasts high inflation (hawkish) it raises interest rates, which is bullish for the Renminbi (CNY). Likewise, if the PBoC sees inflation in the Chinese economy falling (dovish) and cuts or keeps interest rates unchanged, it is bearish for CNY. Still, China’s currency doesn’t have a floating exchange rate determined by markets and its value against the US Dollar is fixed mainly by the PBoC on a daily basis.
Read more.Last release: Mon Jul 22, 2024 01:15
Frequency: Irregular
Actual: 3.35%
Consensus: 3.45%
Previous: 3.45%
Source: The People's Bank of China
After US President Joe Biden withdrew his candidacy for re-election, there should be an effect on the currency market. After all, everyone says that speculative market participants had positioned themselves in line with the effects that are supposedly to be expected if Donald Trump becomes US president again. And, since the chances of almost every Democrat candidate are likely to be higher than those of the apparently mentally unfit Biden, there should be a partial reversal of the Trump trade today. But that’s not the case, Commerzbank’s FX strategist Ulrich Leuchtmann notes.
USD doesn’t react much to Biden stepping down
“The Dollar Index (DXY) opened this morning in Asia with only slight twitches, but is essentially trading at the same levels as on Friday. The yields on US government bonds are also only marginally changed. And even the Mexican peso – the “mother of all Trump trades” – is trading more or less where it ended last week. Why?”
“The fact that Biden would withdraw his candidacy was already being whispered on Friday. The timing of his communication is likely to have only very marginal effects on the outcome of the election in November. And thus, the market reaction this morning should also be minimal. I'm not sure whether the talk about the Trump trade has any substance or is just another urban legend.”
“The foreseeable effects of a Trump presidency on the USD exchange rates will depend on the Fed. Or rather, on how far it is under the thumb of the White House and how far it can maintain its independence. That is not clear. Therefore, I strongly advocate being prepared for anything. But I don't see what direction an alleged Trump trade should point in on the currency market.”
- USD/CAD gains to near 1.3750 with BoC policy in focus.
- The Canadian Dollar weakens due to multiple headwinds.
- The US Dollar edges lower ahead of a busy US data week.
The USD/CAD pair rises to near 1.3750 in Monday’s European after recovering its intraday losses. The Loonie asset strengthens as the Canadian Dollar weakens due to a sharp correction in oil prices and uncertainty ahead of the Bank of Canada’s (BoC) interest-rate policy, scheduled for Wednesday.
West Texas Intermediate (WTI), futures on NYMEX, declines to near $78.30, amid uncertainty over China’s economic outlook. Investors worry that the Chinese economy struggles for a firm-footing due to weak domestic demand. The economy grew at a slower-than-expected pace in the second quarter this year.
It is worth noting that Canada is the leading supplier of Oil to the United States (US) and higher Oil prices support the Canadian Dollar.
On the monetary policy front, investors expect that the BoC will deliver subsequent rate cuts on Wednesday. The BoC is expected to cut interest rates again by 25 basis points (bps) to 4.5% due to easing price pressures and cooling labor market conditions.
Meanwhile, the US Dollar (USD) has corrected gradually as the withdrawal of the re-election bid by US President Joe Biden has induced political uncertainty. The US Dollar Index (DXY), which tracks the Greenback’s value against six major currencies, slides to near 104.20.
This week, the US Dollar will be guided by a slew of US economic data, which will provide cues about when the Federal Reserve (Fed) will start lowering interest rates this year.
Economic Indicator
BoC Interest Rate Decision
The Bank of Canada (BoC) announces its interest rate decision at the end of its eight scheduled meetings per year. If the BoC believes inflation will be above target (hawkish), it will raise interest rates in order to bring it down. This is bullish for the CAD since higher interest rates attract greater inflows of foreign capital. Likewise, if the BoC sees inflation falling below target (dovish) it will lower interest rates in order to give the Canadian economy a boost in the hope inflation will rise back up. This is bearish for CAD since it detracts from foreign capital flowing into the country.
Read more.Next release: Wed Jul 24, 2024 13:45
Frequency: Irregular
Consensus: 4.5%
Previous: 4.75%
Source: Bank of Canada
The People’s Bank of China (PBOC) unexpectedly cut its key 7-day reverse repo rate by 10 bps to 1.7% on Mon. It signals policymakers’ concerns over the slowing growth, UOB Group Economist Ho Woei Chen notes.
PBOC cuts rates amid the slowing growth
“PBOC unexpectedly cut its key 7-day reverse repo rate by 10 bps to 1.7% on Mon, prompting banks to lower the 1Y and 5Y LPRs by a similar quantum to 3.35% and 3.85% respectively. The earlier than expected rate cut in Jul likely signaled policymakers’ concerns over the slowing growth while the easing pressure on the CNY could also be a factor.”
“The central bank had left its 1Y medium-term lending facility (MLF) rate unchanged at 2.50% last week. The move today indicates that PBOC is shifting to the 7-day reverse repo rate as the main policy benchmark.”
“We still see room for an additional 15 bps rate cut for the rest of this year to bring the 1Y LPR lower to 3.20% by end-4Q24. Given the convergence of the 1Y and 5Y LPR, the room for the 5Y LPR to be further lowered may be more limited and we thus expect it to stay on hold at 3.85% through the rest of 2024. In the near-term, there is also the possibility of a 50 bps cut to the reserve requirement ratio (RRR).”
- Gold price edges higher but remains uncertain amid expectations for Trump winning the US presidential elections.
- US President Biden withdraws the re-election bid and nominates Kamala Harris to lead the Democrats.
- The US Dollar edges lower ahead of US data-packed week
Gold price (XAU/USD) exhibits uncertainty near key support of $2,400 in Monday’s European session. The precious metal remains on tenterhooks amid growing speculation that Donald Trump-led-Republicans will win the United States (US) presidential elections in November.
Market experts see Trump’s victory as favorable for economic growth as he has promised cuts in corporate taxes and interest rates. This has fuelled upside risks to consumer inflation expectations. Experts also expect further trade restrictions if Republicans enter the White House. The prospects of Donald Trump winning elections grew after an assassination attack on him and US President Joe Biden’s withdrawal from the re-election bid, which has paved the way for Vice President Kamala Harris as the nominee of Democrats.
Rising odds of Trump’s victory have improved the US Dollar’s appeal. The US Dollar Index (DXY), which tracks the Greenback’s value against six major currencies, slightly retraces to 104.20 on Monday after a strong recovery from a four-month low of 103.65.
10-year US Treasury yields decline to 4.22%. Lower yields on interest-bearing assets reduce the opportunity cost of investing in non-yielding assets, such as Gold.
Daily digest market movers: Gold price steadies ahead of busy US week
- Gold price finds temporary support near $2,400 after declining consecutively for three trading days, with the focus on US data-packed week. The economic data will provide fresh cues about when the Federal Reserve (Fed) will start reducing interest rates this year.
- This week, investors will focus on the preliminary S&P Global Purchasing Managers Index (PMI) for July, Q2 Gross Domestic Product (GDP), and the Durable Goods Orders and Personal Consumption Expenditure Price Index (PCE) for June. According to the estimates, advanced PMI expanded at a slower pace than the previous month. Meanwhile, the GDP is expected to expand at a strong pace of 2.0% on an annualized basis from the former release of 1.4%.
- Investors will keenly focus on the core PCE inflation data, which is the Fed’s preferred inflation gauge. On a monthly basis, the inflation measure is estimated to have grown at a faster pace of 0.2% from the former reading of 0.1%.
- Currently, financial markets expect the Fed to begin lowering its key borrowing rates in September and deliver two rate cuts this year against one projected by policymakers in the latest dot plot.
- Recently, the confidence of Fed officials that inflation has returned on its path to 2% has increased. June’s inflation readings showed that price pressures grew at a slower-than-expected pace. Also, monthly headline inflation deflated for the first time in more than four years.
Technical Analysis: Gold hovers around $2,400
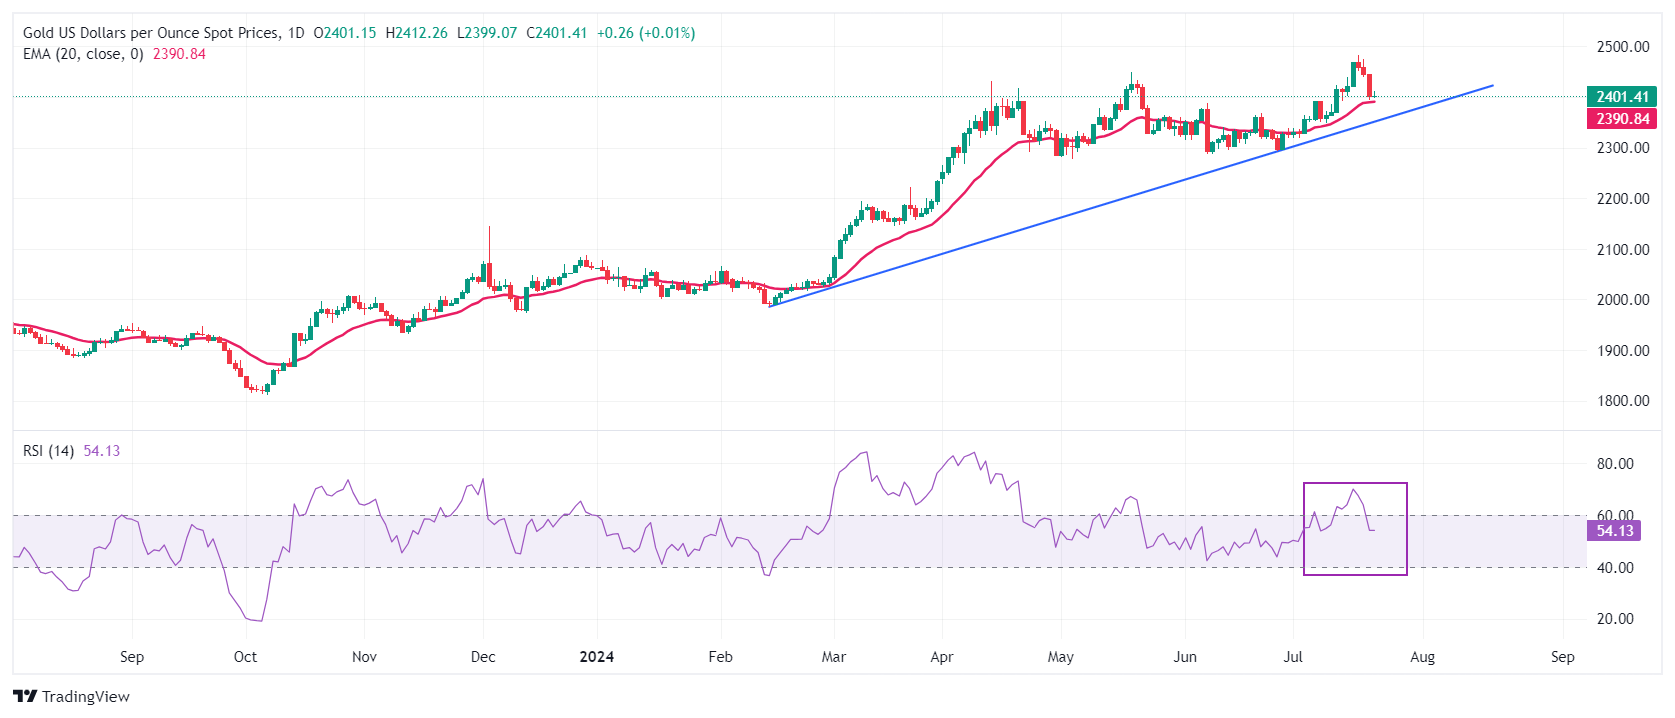
Gold price trades in a tight range near $2,400 on Monday. The precious metal declines to near the 20-day Exponential Moving Average (EMA), which trades around $2,390, and suggests that the near-term outlook has not weakened yet technically.
Advancing trendline plotted from the February 14 low at $1,984.30 will be a major support for Gold bulls.
The 14-day Relative Strength Index (RSI) drops inside the 40.00-60.00 range, suggesting that the upside momentum has stalled. However, the upside bias remains intact.
A fresh upside would appear if the Gold price breaks above the all-time-high around $2,480.
Gold FAQs
Gold has played a key role in human’s history as it has been widely used as a store of value and medium of exchange. Currently, apart from its shine and usage for jewelry, the precious metal is widely seen as a safe-haven asset, meaning that it is considered a good investment during turbulent times. Gold is also widely seen as a hedge against inflation and against depreciating currencies as it doesn’t rely on any specific issuer or government.
Central banks are the biggest Gold holders. In their aim to support their currencies in turbulent times, central banks tend to diversify their reserves and buy Gold to improve the perceived strength of the economy and the currency. High Gold reserves can be a source of trust for a country’s solvency. Central banks added 1,136 tonnes of Gold worth around $70 billion to their reserves in 2022, according to data from the World Gold Council. This is the highest yearly purchase since records began. Central banks from emerging economies such as China, India and Turkey are quickly increasing their Gold reserves.
Gold has an inverse correlation with the US Dollar and US Treasuries, which are both major reserve and safe-haven assets. When the Dollar depreciates, Gold tends to rise, enabling investors and central banks to diversify their assets in turbulent times. Gold is also inversely correlated with risk assets. A rally in the stock market tends to weaken Gold price, while sell-offs in riskier markets tend to favor the precious metal.
The price can move due to a wide range of factors. Geopolitical instability or fears of a deep recession can quickly make Gold price escalate due to its safe-haven status. As a yield-less asset, Gold tends to rise with lower interest rates, while higher cost of money usually weighs down on the yellow metal. Still, most moves depend on how the US Dollar (USD) behaves as the asset is priced in dollars (XAU/USD). A strong Dollar tends to keep the price of Gold controlled, whereas a weaker Dollar is likely to push Gold prices up.
The US Dollar (USD) is likely to edge higher. As upward momentum is not strong; any advance is unlikely to reach 7.2980. USD is still trading in a 7.2600/7.3100 range, UOB Group FX strategists Quek Ser Leang and Peter Chia note.
Rangebound within 7.2600/7.3100
24-HOUR VIEW: “We expected USD to trade in 7.2682/7.2880 range last Friday. USD then traded between 7.2763 and 7.2895, closing at 7.2867 (+0.11%). There has been a slight increase in momentum. Today, USD is likely to edge higher. As upward momentum is not strong, any advance is unlikely to reach 7.2980. Support is at 7.2770, followed by 7.2700.”
1-3 WEEKS VIEW: “Our most recent narrative was from last Thursday (18 Jul, spot at 7.2680), wherein ‘downward momentum is building again, but USD must break and stay below 7.2600 before a decline to 7.2400 can be expected.’ We indicated that ‘the chance of USD breaking clearly below 7.2600 will remain intact provided that 7.2900 is not breached.’ On Friday, USD rose, reaching a high of 7.2895. While our ‘strong resistance’ of 7.2900 has not been clearly breached yet, the buildup in momentum has largely faded. From here, it appears that USD is still trading in a 7.2600/7.3100 range.”
Silver prices (XAG/USD) fell on Monday, according to FXStreet data. Silver trades at $29.06 per troy ounce, down 0.58% from the $29.23 it cost on Friday.
Silver prices have increased by 22.12% since the beginning of the year.
| Unit measure | Silver Price Today in USD |
|---|---|
| Troy Ounce | 29.06 |
| 1 Gram | 0.93 |
The Gold/Silver ratio, which shows the number of ounces of Silver needed to equal the value of one ounce of Gold, stood at 82.65 on Monday, up from 82.15 on Friday.
Silver FAQs
Silver is a precious metal highly traded among investors. It has been historically used as a store of value and a medium of exchange. Although less popular than Gold, traders may turn to Silver to diversify their investment portfolio, for its intrinsic value or as a potential hedge during high-inflation periods. Investors can buy physical Silver, in coins or in bars, or trade it through vehicles such as Exchange Traded Funds, which track its price on international markets.
Silver prices can move due to a wide range of factors. Geopolitical instability or fears of a deep recession can make Silver price escalate due to its safe-haven status, although to a lesser extent than Gold's. As a yieldless asset, Silver tends to rise with lower interest rates. Its moves also depend on how the US Dollar (USD) behaves as the asset is priced in dollars (XAG/USD). A strong Dollar tends to keep the price of Silver at bay, whereas a weaker Dollar is likely to propel prices up. Other factors such as investment demand, mining supply – Silver is much more abundant than Gold – and recycling rates can also affect prices.
Silver is widely used in industry, particularly in sectors such as electronics or solar energy, as it has one of the highest electric conductivity of all metals – more than Copper and Gold. A surge in demand can increase prices, while a decline tends to lower them. Dynamics in the US, Chinese and Indian economies can also contribute to price swings: for the US and particularly China, their big industrial sectors use Silver in various processes; in India, consumers’ demand for the precious metal for jewellery also plays a key role in setting prices.
Silver prices tend to follow Gold's moves. When Gold prices rise, Silver typically follows suit, as their status as safe-haven assets is similar. The Gold/Silver ratio, which shows the number of ounces of Silver needed to equal the value of one ounce of Gold, may help to determine the relative valuation between both metals. Some investors may consider a high ratio as an indicator that Silver is undervalued, or Gold is overvalued. On the contrary, a low ratio might suggest that Gold is undervalued relative to Silver.
(An automation tool was used in creating this post.)
European Central Bank (ECB) policymaker and Slovakian central bank Governor Peter Kazimir said Monday, the “market pricing of two rate cuts by year-end is not entirely misplaced,” adding that “such pricing isn't a given at the moment.”
Additional quotes
No need to rush decisions.
Data will set the stage for September decision.
The door remains open to additional easing should conditions warrant it.
Market reaction
At the time of writing, EUR/USD is adding 0.12% on the day to trade near 1.0900.
There is still room for the New Zealand Dollar (NZD) to drop below 0.6000, UOB Group FX strategists Quek Ser Leang and Peter Chia note.
Set to drop towards 0.5980
24-HOUR VIEW: “Last Friday, when NZD was trading at 0.6045, we held the view that NZD ‘is likely to decline.’ We highlighted that ‘support levels are at 0.6030 and 0.6005.’ We also highlighted that ‘0.6005 is likely out of reach for now.’ Our view of NZD declining was correct. However, it dropped more than expected, almost reaching 0.6005 (low has been 0.6006). The rebound in early Asian trading today indicates slowing momentum. This, combined with oversold conditions, suggests that instead of continuing to weaken, NZD is more likely to trade in a sideways range of 0.6010/0.6045.”
1-3 WEEKS VIEW: “We highlighted last Wednesday (17 Jul, spot at 0.6070) ‘downward momentum is building, but not sufficiently enough to suggest the start of a sustained decline.’ After NZD dropped, we highlighted on Friday (19 Jul, spot at 0.6045) that ‘downward momentum has increased further, and the chance of NZD breaking below 0.6030 has also increased.’ We added, ‘the next level to watch below 0.6030 is 0.6005.’ NZD subsequently fell to a low of 0.6006. From here, oversold short-term conditions could lead to a couple of days of sideways trading. As long as 0.6070 (‘strong resistance’ level previously at 0.6085) is not breached, there is room for NZD to drop to and possibly below 0.6005. Looking ahead, the next support below 0.6005 is at 0.5980.”
There is scope for the Australian Dollar (AUD) to drop below 0.6660; it is too early to determine if 0.6640 is within reach, UOB Group FX strategists Quek Ser Leang and Peter Chia note.
Is set to test 0.6640
24-HOUR VIEW: “We indicated last Friday that AUD could dip below 0.6680. We also indicated that ‘the next support at 0.6640 is highly unlikely to come into view.’ However, AUD dipped less than expected, only reaching a low of 0.6681. AUD rebounded upon opening today. The rebound in oversold conditions and slowing momentum suggest it is unlikely to weaken further. Today, AUD is more likely to trade sideways between 0.6685 and 0.6725.”
1-3 WEEKS VIEW: “Our update from last Friday (19 Jul, spot at 0.6700) still stands. As highlighted, while there is scope for AUD to drop below 0.6660, it is too early to determine if there is enough momentum for it to reach 0.6640. On the upside, a breach of 0.6755 (no change in ‘strong resistance’ level) would indicate that AUD is not declining further.”
- USD/CHF depreciates as risk sentiment improves due to the dovish Fed.
- US President Joe Biden announced that he will not seek re-election against former President Donald Trump.
- The Swiss Franc could limit its upside due to the rising odds of the SNB reducing rates further.
USD/CHF loses ground after two days of gains, trading around 0.8880 during the European hours on Monday. The dovish outlook on the Federal Reserve's policy is exerting pressure on the US Dollar (USD), weakening the USD/CHF pair. According to CME Group’s FedWatch Tool, the likelihood of a 25-basis point rate cut at the September Fed meeting has risen to 91.7%, up from 90.3% a week ago.
Federal Reserve Bank of New York President John Williams stated on Friday that the long-term trends that caused declines in neutral interest rates before the pandemic continue to prevail. Williams noted, "My own Holston-Laubach-Williams estimates for r-star in the United States, Canada, and the Euro area are about the same level as they were before the pandemic," according to Bloomberg.
US President Joe Biden abandoned his re-election bid on Sunday under growing pressure from his fellow Democrats and endorsed Vice President Kamala Harris as the party's candidate to face Republican Donald Trump in the November election, according to Reuters.
Traders await the release of Global Purchasing Managers Index (PMI) and Gross Domestic Product (GDP) data later this week to gain fresh insights into the economic conditions of the United States (US).
On CHF’s side, the expectation that the Swiss National Bank (SNB) might cut interest rates further could weigh on the Swiss Franc (CHF). Kyle Chapman, FX markets analyst at Ballinger Group, stated, "I expect the SNB to follow up with a third cut next quarter, and there is potential for a fourth in December if there is still high conviction in the restrictive level of monetary policy."
Swiss Franc FAQs
The Swiss Franc (CHF) is Switzerland’s official currency. It is among the top ten most traded currencies globally, reaching volumes that well exceed the size of the Swiss economy. Its value is determined by the broad market sentiment, the country’s economic health or action taken by the Swiss National Bank (SNB), among other factors. Between 2011 and 2015, the Swiss Franc was pegged to the Euro (EUR). The peg was abruptly removed, resulting in a more than 20% increase in the Franc’s value, causing a turmoil in markets. Even though the peg isn’t in force anymore, CHF fortunes tend to be highly correlated with the Euro ones due to the high dependency of the Swiss economy on the neighboring Eurozone.
The Swiss Franc (CHF) is considered a safe-haven asset, or a currency that investors tend to buy in times of market stress. This is due to the perceived status of Switzerland in the world: a stable economy, a strong export sector, big central bank reserves or a longstanding political stance towards neutrality in global conflicts make the country’s currency a good choice for investors fleeing from risks. Turbulent times are likely to strengthen CHF value against other currencies that are seen as more risky to invest in.
The Swiss National Bank (SNB) meets four times a year – once every quarter, less than other major central banks – to decide on monetary policy. The bank aims for an annual inflation rate of less than 2%. When inflation is above target or forecasted to be above target in the foreseeable future, the bank will attempt to tame price growth by raising its policy rate. Higher interest rates are generally positive for the Swiss Franc (CHF) as they lead to higher yields, making the country a more attractive place for investors. On the contrary, lower interest rates tend to weaken CHF.
Macroeconomic data releases in Switzerland are key to assessing the state of the economy and can impact the Swiss Franc’s (CHF) valuation. The Swiss economy is broadly stable, but any sudden change in economic growth, inflation, current account or the central bank’s currency reserves have the potential to trigger moves in CHF. Generally, high economic growth, low unemployment and high confidence are good for CHF. Conversely, if economic data points to weakening momentum, CHF is likely to depreciate.
As a small and open economy, Switzerland is heavily dependent on the health of the neighboring Eurozone economies. The broader European Union is Switzerland’s main economic partner and a key political ally, so macroeconomic and monetary policy stability in the Eurozone is essential for Switzerland and, thus, for the Swiss Franc (CHF). With such dependency, some models suggest that the correlation between the fortunes of the Euro (EUR) and the CHF is more than 90%, or close to perfect.
Scope for the Pound Sterling (GBP) to rebound, but any advance is unlikely to reach 1.2980, otherwise it is likely to consolidate between 1.2850 and 1.3020 for the time being, UOB Group FX strategists Quek Ser Leang and Peter Chia note.
Set to consolidate between 1.2850 and 1.3020
24-HOUR VIEW: “Last Thursday, GBP dropped sharply to a low of 1.2941. On Friday, when GBP was trading at 1.2950, we highlighted that ‘while the decline seems to be running ahead of itself, there is room for GBP to drop to 1.2915 before the risk of a rebound increases.’ We also highlighted that ‘the next support at 1.2850 is unlikely to come under threat.’ While our view for GBP to decline was not wrong, it fell more than expected (low of 1.2901). GBP rebounded upon opening today. Today, there is scope for GBP to rebound further, but any advance is unlikely to reach 1.2980 (minor resistance is at 1.2960). On the downside, support levels are at 1.2920 and 1.2905.”
1-3 WEEKS VIEW: “We continue to hold the same view as last Friday (19 Jul, spot at 1.2950). As highlighted, the recent advance in GBP has come to an end. GBP appears to have entered a consolidation phase, and it is likely to trade between 1.2850 and 1.3020 for the time being.”
The Euro (EUR) strength has ended; for the time being, it is likely to trade in a range between 1.0845 and 1.0945, UOB Group FX strategists Quek Ser Leang and Peter Chia note.
Rangebound for the time being
24-HOUR VIEW: “We expected EUR to trade sideways between 1.0885 and 1.0935 last Friday. However, it dipped to 1.0874 before closing at 1.0877 (- 0.17%). EUR traded on a firm note upon opening today. The price action did not result in any increase in downward momentum. Instead, upward momentum has improved somewhat with the firm start today. From here, barring a break below 1.0875 (minor support is at 1.0885), EUR could edge higher. Given the lackluster momentum, a sustained break above 1.0920 is unlikely.”
1-3 WEEKS VIEW: “Last Friday (19 Jul, spot at 1.0900), we noted a rapid loss in momentum. We pointed out that ‘should EUR break below 1.0885, it would mean that the EUR strength that started two weeks ago (as annotated in the chart below) has come to end.’ EUR subsequently dropped below 1.0885 (low has been 1.0874). The current price action is likely part of a range trading phase. For the time being, we expect EUR to trade between 1.0845 and 1.0945.”
- USD/MXN loses ground due to increased risk sentiment amid dovish Fed.
- CME Group’s FedWatch Tool suggests a 91.7% probability of a 25-basis point rate cut in September.
- Trump claims that “China and Mexico have taken 68% of our automotive industry, but we are going to get it back.”
USD/MXN breaks its three-day winning streak, trading around 18.00 during the European hours on Monday. The dovish sentiment surrounding the Federal Reserve's policy stance puts pressure on the US Dollar (USD) and undermines the USD/MXN pair. According to CME Group’s FedWatch Tool, the markets show a 91.7% probability of a 25-basis point rate cut at the September Fed meeting, up from 90.3% a week earlier.
The US Dollar Index (DXY), which measures the value of the US Dollar (USD) against six other major currencies, edges lower after two days of gains, trading around 104.20, which could be attributed to the decline in the US Treasury yields. 2-year and 10-year yields on US Treasury bonds stand at 4.51% and 4.21%, respectively.
US President Joe Biden abandoned his re-election bid on Sunday under growing pressure from his fellow Democrats and endorsed Vice President Kamala Harris as the party's candidate to face Republican Donald Trump in the November election, according to Reuters.
On the MXN front, the IMF has revised Mexico's 2024 GDP growth outlook downward to 2.2% from 2.4%, citing an economic slowdown, particularly in manufacturing due to reduced US economic activity. This has pressured the Bank of Mexico (Banxico) to adopt a more accommodative stance, according to Mexico Business News.
Additionally, former president Donald Trump's comments have put Mexico in the spotlight. Trump stated that he would end illegal immigration “by closing the border and completing the wall,” and claimed, “China and Mexico have taken 68% of our automotive industry, but we are going to get it back.” These remarks, reported by Bloomberg News, threaten to discourage companies from relocating to Mexico, which could weaken the Mexican Peso (MXN).
Mexican Peso FAQs
The Mexican Peso (MXN) is the most traded currency among its Latin American peers. Its value is broadly determined by the performance of the Mexican economy, the country’s central bank’s policy, the amount of foreign investment in the country and even the levels of remittances sent by Mexicans who live abroad, particularly in the United States. Geopolitical trends can also move MXN: for example, the process of nearshoring – or the decision by some firms to relocate manufacturing capacity and supply chains closer to their home countries – is also seen as a catalyst for the Mexican currency as the country is considered a key manufacturing hub in the American continent. Another catalyst for MXN is Oil prices as Mexico is a key exporter of the commodity.
The main objective of Mexico’s central bank, also known as Banxico, is to maintain inflation at low and stable levels (at or close to its target of 3%, the midpoint in a tolerance band of between 2% and 4%). To this end, the bank sets an appropriate level of interest rates. When inflation is too high, Banxico will attempt to tame it by raising interest rates, making it more expensive for households and businesses to borrow money, thus cooling demand and the overall economy. Higher interest rates are generally positive for the Mexican Peso (MXN) as they lead to higher yields, making the country a more attractive place for investors. On the contrary, lower interest rates tend to weaken MXN.
Macroeconomic data releases are key to assess the state of the economy and can have an impact on the Mexican Peso (MXN) valuation. A strong Mexican economy, based on high economic growth, low unemployment and high confidence is good for MXN. Not only does it attract more foreign investment but it may encourage the Bank of Mexico (Banxico) to increase interest rates, particularly if this strength comes together with elevated inflation. However, if economic data is weak, MXN is likely to depreciate.
As an emerging-market currency, the Mexican Peso (MXN) tends to strive during risk-on periods, or when investors perceive that broader market risks are low and thus are eager to engage with investments that carry a higher risk. Conversely, MXN tends to weaken at times of market turbulence or economic uncertainty as investors tend to sell higher-risk assets and flee to the more-stable safe havens.
- The Pound Sterling retreats against the US Dollar ahead of a US data-packed week.
- Growing speculation for Trump’s victory has improved the US Dollar’s appeal.
- A sharp decline in UK Retail Sales has boosted BoE rate-cut hopes.
The Pound Sterling (GBP) fails to extend a slight recovery above the immediate resistance of 1.2930 against the US Dollar (USD) in Monday’s European session. The near-term outlook of the GBP/USD pair has become uncertain after a corrective move from an annual high of 1.3044 recorded last Wednesday. The Cable faced selling pressure as improved speculation for Donald Trump winning United States (US) presidential elections this year prompted the US Dollar’s appeal.
The expectations for Donald Trump increased as US President Joe Biden decided to endorse Vice President Kamala Harris to nominate herself as a contender for elections.
Investors expect Donald Trump's election victory to lead to a rise in trade restrictions that will increase inflation. The US Dollar Index (DXY), which tracks the Greenback’s value against six major currencies, rose to 104.40 but corrected slightly in Monday’s London session.
Meanwhile, firm speculation that the Federal Reserve (Fed) will start reducing interest rates from the September meeting will limit the upside in the US Dollar.
This week, investors will keenly focus on a string of US economic data such as the preliminary S&P Global Purchasing Managers Index (PMI) for July, Q2 Gross Domestic Product (GDP), June’s Durable Goods Orders, and the Personal Consumption Expenditures (PCE) Price Index, the Fed's favorite inflation gauge, for June.
Daily digest market movers: Pound Sterling will dance to the tunes of S&P Global PMIs
- The Pound Sterling falls back after a short-lived pullback move to near 1.2930. The British currency appears vulnerable near the round-level support of 1.2900 as a sharp decline in the United Kingdom (UK) Retail Sales data for June has raised doubts over whether the Bank of England (BoE) will leave interest rates unchanged in its August policy meeting.
- Data released on Friday showed that UK monthly Retail Sales contracted at a faster-than-expected pace of 1.2% in June. Economists expected a decline of 0.4% against 2.9% growth in May. The decline in Retail Sales was noted across all areas except for automotive fuel. Retail Sales data is a key measure of consumer spending, which drives consumer inflation. Weak domestic demand weighs on price pressures.
- Apart from a sharp contraction in Retail Sales, Average Earnings declined expectedly in three months ending in May. However, the pace at which wages are growing is still higher than what is needed for BoE officials to gain confidence in reducing interest rates.
- Meanwhile, expectations of persistent consumer inflation have slightly increased as UK new Finance Minister Rachel Reeves has promised to consider a wage increase for public sector employees later this month.
- Going forward, the next trigger for the Pound Sterling will be the preliminary S&P Global/CIPS PMI data for July, which will be published on Wednesday. The report is expected to show that the Manufacturing PMI expanded at a faster pace to 51.1 from the former release of 50.9. The Composite PMI is estimated to have increased to 52.5 from 52.3 in May.
Technical Analysis: Pound Sterling corrects from annual highs
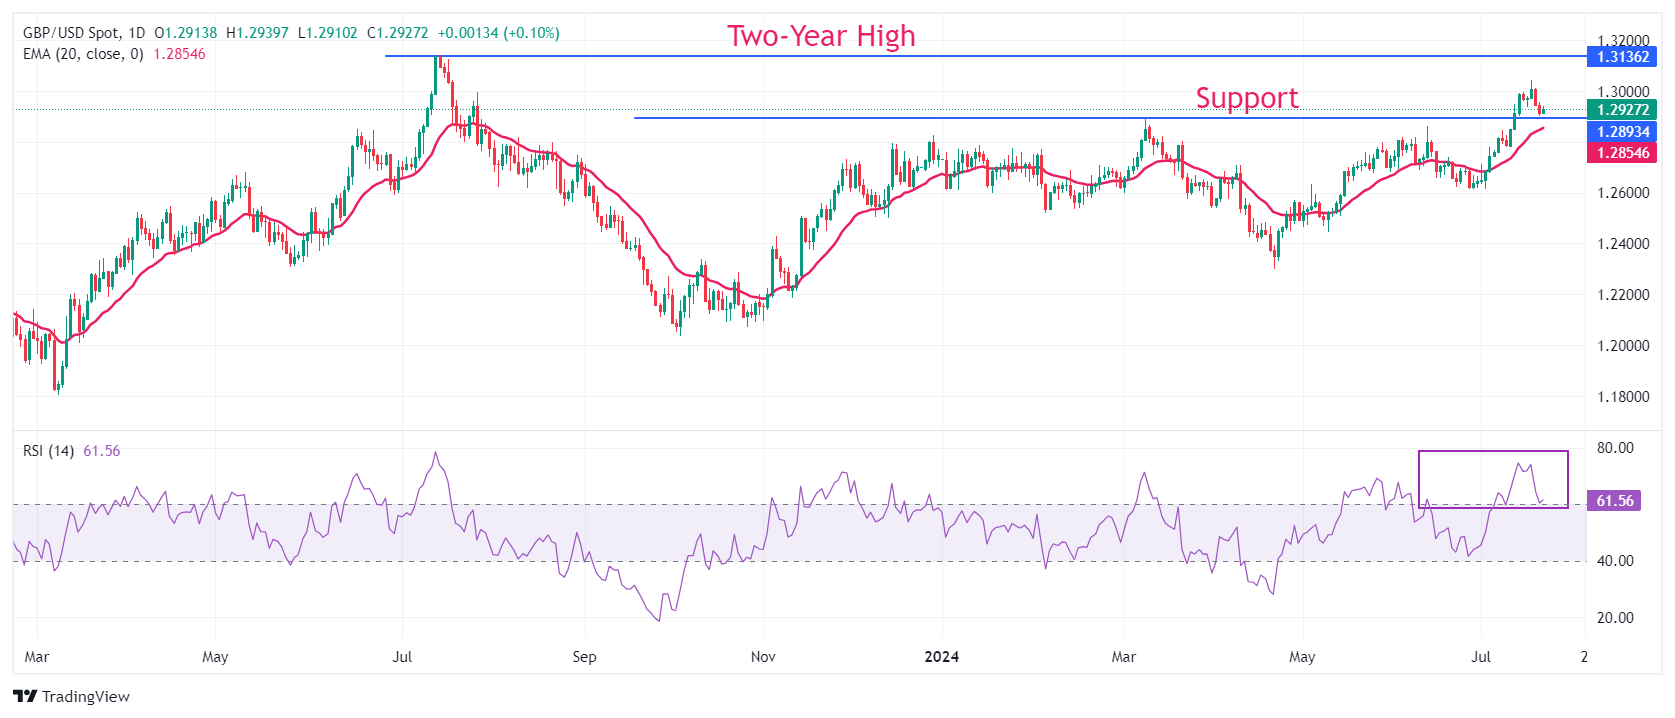
The Pound Sterling struggles to recover after correcting to near 1.2930 against the US Dollar. The GBP/USD pair weakens after facing a sell-off from a fresh annual high of 1.3044 on Wednesday.
The upward-sloping 20-day Exponential Moving Average (EMA) near 1.2850 suggests that the uptrend is intact. After turning slightly overbought, the 14-day Relative Strength Index (RSI) declines and is expected to find a cushion near 60.00.
On the upside, a two-year high near 1.3140 will be a key resistance zone for the Cable. On the other hand, the March 8 high near 1.2900 will be a key support for the Pound Sterling bulls.
Pound Sterling FAQs
The Pound Sterling (GBP) is the oldest currency in the world (886 AD) and the official currency of the United Kingdom. It is the fourth most traded unit for foreign exchange (FX) in the world, accounting for 12% of all transactions, averaging $630 billion a day, according to 2022 data. Its key trading pairs are GBP/USD, aka ‘Cable’, which accounts for 11% of FX, GBP/JPY, or the ‘Dragon’ as it is known by traders (3%), and EUR/GBP (2%). The Pound Sterling is issued by the Bank of England (BoE).
The single most important factor influencing the value of the Pound Sterling is monetary policy decided by the Bank of England. The BoE bases its decisions on whether it has achieved its primary goal of “price stability” – a steady inflation rate of around 2%. Its primary tool for achieving this is the adjustment of interest rates. When inflation is too high, the BoE will try to rein it in by raising interest rates, making it more expensive for people and businesses to access credit. This is generally positive for GBP, as higher interest rates make the UK a more attractive place for global investors to park their money. When inflation falls too low it is a sign economic growth is slowing. In this scenario, the BoE will consider lowering interest rates to cheapen credit so businesses will borrow more to invest in growth-generating projects.
Data releases gauge the health of the economy and can impact the value of the Pound Sterling. Indicators such as GDP, Manufacturing and Services PMIs, and employment can all influence the direction of the GBP. A strong economy is good for Sterling. Not only does it attract more foreign investment but it may encourage the BoE to put up interest rates, which will directly strengthen GBP. Otherwise, if economic data is weak, the Pound Sterling is likely to fall.
Another significant data release for the Pound Sterling is the Trade Balance. This indicator measures the difference between what a country earns from its exports and what it spends on imports over a given period. If a country produces highly sought-after exports, its currency will benefit purely from the extra demand created from foreign buyers seeking to purchase these goods. Therefore, a positive net Trade Balance strengthens a currency and vice versa for a negative balance.
Here is what you need to know on Monday, July 22:
The US Dollar (USD) struggles to find demand at the beginning of the week, while US stock index futures trade in positive territory. Federal Reserve Bank of Chicago's National Activity Index for June will be the only data featured in the US economic calendar on Monday. Meanwhile, investors will keep a close eye on political developments in the US after President Joe Biden announced on Sunday that he is withdrawing from the 2024 Presidential election.
US Dollar PRICE Last 7 days
The table below shows the percentage change of US Dollar (USD) against listed major currencies last 7 days. US Dollar was the strongest against the New Zealand Dollar.
| USD | EUR | GBP | JPY | CAD | AUD | NZD | CHF | |
|---|---|---|---|---|---|---|---|---|
| USD | 0.21% | 0.47% | -0.96% | 0.72% | 1.78% | 1.84% | -0.72% | |
| EUR | -0.21% | 0.29% | -0.95% | 0.71% | 1.60% | 1.82% | -0.74% | |
| GBP | -0.47% | -0.29% | -1.15% | 0.41% | 1.31% | 1.48% | -1.03% | |
| JPY | 0.96% | 0.95% | 1.15% | 1.69% | 2.54% | 2.78% | 0.04% | |
| CAD | -0.72% | -0.71% | -0.41% | -1.69% | 0.98% | 1.11% | -1.44% | |
| AUD | -1.78% | -1.60% | -1.31% | -2.54% | -0.98% | 0.22% | -2.31% | |
| NZD | -1.84% | -1.82% | -1.48% | -2.78% | -1.11% | -0.22% | -2.53% | |
| CHF | 0.72% | 0.74% | 1.03% | -0.04% | 1.44% | 2.31% | 2.53% |
The heat map shows percentage changes of major currencies against each other. The base currency is picked from the left column, while the quote currency is picked from the top row. For example, if you pick the US Dollar from the left column and move along the horizontal line to the Japanese Yen, the percentage change displayed in the box will represent USD (base)/JPY (quote).
After posting recovery gains on Thursday and Friday, the USD Index stays on the back foot but manages to hold above 104.00 in the European morning on Monday. In the meantime, the benchmark 10-year US Treasury bond yield retreats toward 4.2%, losing over 0.5% on the day. Following his announcement of dropping out of the race, President Biden endorsed Vice President Kamala Harris in an X post that read: "I want to offer my full support and endorsement for Kamala to be the nominee of our party this year. Democrats — it’s time to come together and beat Trump. Let’s do this."
The People's Bank of China (PBoC) announced early Monday that it cut the one-year Loan Prime Rate (LPR) by 10 basis points (bps) from 3.45% to 3.35% and lowered the five-year LPR from 3.95% to 3.85%. Additionally, the PBoC cut its interest rate for the 7-day reverse report to 1.7% from 1.8%. After losing 1.5% and snapping a five-week winning streak last week, AUD/USD continues to push lower on Monday and was last seen losing 0.3% on the day at around 0.6660.
EUR/USD registered losses on Thursday and Friday, closing the previous week virtually unchanged after the bullish action seen in the first half. The pair holds steady and fluctuates in a narrow channel slightly below 1.0900 in the European morning on Monday.
Following a two-day decline, GBP/USD stages a modest recovery and trades above 1.2900 at the beginning of the week.
USD/JPY came under heavy bearish pressure in the late Asian session on Monday and dropped toward 156.00. Although the pair managed to erase a small portion of its losses, it was last seen losing still more than 0.5% on the day near 156.60.
After setting a new all-time high on Tuesday, Gold reversed its direction in the second half of the previous week and extended its decline on Friday, losing nearly 2% on the day. XAU/USD, however, ended the week slightly above the critical level of $2,400. Early Monday, the yellow metal moves up and down in a tight channel.
Risk sentiment FAQs
In the world of financial jargon the two widely used terms “risk-on” and “risk off'' refer to the level of risk that investors are willing to stomach during the period referenced. In a “risk-on” market, investors are optimistic about the future and more willing to buy risky assets. In a “risk-off” market investors start to ‘play it safe’ because they are worried about the future, and therefore buy less risky assets that are more certain of bringing a return, even if it is relatively modest.
Typically, during periods of “risk-on”, stock markets will rise, most commodities – except Gold – will also gain in value, since they benefit from a positive growth outlook. The currencies of nations that are heavy commodity exporters strengthen because of increased demand, and Cryptocurrencies rise. In a “risk-off” market, Bonds go up – especially major government Bonds – Gold shines, and safe-haven currencies such as the Japanese Yen, Swiss Franc and US Dollar all benefit.
The Australian Dollar (AUD), the Canadian Dollar (CAD), the New Zealand Dollar (NZD) and minor FX like the Ruble (RUB) and the South African Rand (ZAR), all tend to rise in markets that are “risk-on”. This is because the economies of these currencies are heavily reliant on commodity exports for growth, and commodities tend to rise in price during risk-on periods. This is because investors foresee greater demand for raw materials in the future due to heightened economic activity.
The major currencies that tend to rise during periods of “risk-off” are the US Dollar (USD), the Japanese Yen (JPY) and the Swiss Franc (CHF). The US Dollar, because it is the world’s reserve currency, and because in times of crisis investors buy US government debt, which is seen as safe because the largest economy in the world is unlikely to default. The Yen, from increased demand for Japanese government bonds, because a high proportion are held by domestic investors who are unlikely to dump them – even in a crisis. The Swiss Franc, because strict Swiss banking laws offer investors enhanced capital protection.
- The US Dollar loses ground as the Fed may cut interest rates in September.
- CME Group’s FedWatch Tool suggests a 91.7% probability of a 25-basis point rate cut in September.
- US President Joe Biden abandoned his re-election bid and endorsed Vice President Kamala Harris to face Republican Donald Trump.
The US Dollar Index (DXY), which measures the value of the US Dollar (USD) against six other major currencies, edges lower after two days of gains, trading around 104.20 during the early European hours on Monday.
The dovish sentiment surrounding the Federal Reserve's policy stance puts pressure on the Greenback. According to CME Group’s FedWatch Tool, the markets show a 91.7% probability of a 25-basis point rate cut at the September Fed meeting, up from 90.3% a week earlier.
US President Joe Biden abandoned his re-election bid on Sunday under growing pressure from his fellow Democrats and endorsed Vice President Kamala Harris as the party's candidate to face Republican Donald Trump in the November election, according to Reuters.
Read this article: US President Joe Biden stands down from reelection, endorses Kamala Harris
Federal Reserve Bank of New York President John Williams stated on Friday that the long-term trends that caused declines in neutral interest rates before the pandemic continue to prevail. Williams noted, "My own Holston-Laubach-Williams estimates for r-star in the United States, Canada, and the Euro area are about the same level as they were before the pandemic," according to Bloomberg.
Fed Chair Jerome Powell mentioned earlier this week that the three US inflation readings of this year "add somewhat to confidence" that inflation is on course to meet the Fed’s target sustainably, suggesting that a shift to interest rate cuts may not be far off.
Traders await the release of Global Purchasing Managers Index (PMI) and Gross Domestic Product (GDP) data later this week to gain fresh insights into the economic conditions of the United States (US).
US Dollar FAQs
The US Dollar (USD) is the official currency of the United States of America, and the ‘de facto’ currency of a significant number of other countries where it is found in circulation alongside local notes. It is the most heavily traded currency in the world, accounting for over 88% of all global foreign exchange turnover, or an average of $6.6 trillion in transactions per day, according to data from 2022. Following the second world war, the USD took over from the British Pound as the world’s reserve currency. For most of its history, the US Dollar was backed by Gold, until the Bretton Woods Agreement in 1971 when the Gold Standard went away.
The most important single factor impacting on the value of the US Dollar is monetary policy, which is shaped by the Federal Reserve (Fed). The Fed has two mandates: to achieve price stability (control inflation) and foster full employment. Its primary tool to achieve these two goals is by adjusting interest rates. When prices are rising too quickly and inflation is above the Fed’s 2% target, the Fed will raise rates, which helps the USD value. When inflation falls below 2% or the Unemployment Rate is too high, the Fed may lower interest rates, which weighs on the Greenback.
In extreme situations, the Federal Reserve can also print more Dollars and enact quantitative easing (QE). QE is the process by which the Fed substantially increases the flow of credit in a stuck financial system. It is a non-standard policy measure used when credit has dried up because banks will not lend to each other (out of the fear of counterparty default). It is a last resort when simply lowering interest rates is unlikely to achieve the necessary result. It was the Fed’s weapon of choice to combat the credit crunch that occurred during the Great Financial Crisis in 2008. It involves the Fed printing more Dollars and using them to buy US government bonds predominantly from financial institutions. QE usually leads to a weaker US Dollar.
Quantitative tightening (QT) is the reverse process whereby the Federal Reserve stops buying bonds from financial institutions and does not reinvest the principal from the bonds it holds maturing in new purchases. It is usually positive for the US Dollar.
- EUR/JPY trades on a softer note around 170.25 in Monday’s early European session, down 0.67% on the day.
- The growing speculation of a BoJ rate hike might support the JPY.
- The ECB's cautious stance might cap the cross’s downside.
The EUR/JPY cross faces some selling pressure near 170.25 during the early European trading hours on Monday. The higher chance that the Bank of Japan (BOJ) will hike at its July monetary policy meeting provides some support to the Japanese Yen (JPY). Traders will take more cues from the preliminary Eurozone July Purchasing Managers’ Index (PMI) on Wednesday, followed by the Japanese Tokyo Consumer Price Index (CPI) on Friday.
Japan's core inflation rose for a second straight month in June, fueling market expectations of a near-term interest rate hike by the Japanese central bank. BoJ Governor Kazuo Uedastated that the central bank will push up rates further if rising wages and service prices heighten prospects for durably achieving its 2% inflation target. Nonetheless, more than three-quarters of economists polled by Reuters anticipated the Bank of Japan (BOJ) to keep rates on hold this month due to lacklustre consumption and a fragile economy.
Additionally, the Japan Times reported that hedge funds pared bets against the JPY after a suspected double market intervention from Japanese authorities to bolster the currency. The fear of possible further foreign exchange (FX) intervention from Japanese officials is likely to boost the JPY in the near term.
On the other hand, the European Central Bank's (ECB) cautious approach to interest rates might cap the downside of the Euro (EUR). The ECB emphasized the data-dependent approach, leaving the timing of rate cuts uncertain. The ECB's cautious stance highlighted geopolitical risks and political uncertainties, which must be watchful and adaptive.
Japanese Yen FAQs
The Japanese Yen (JPY) is one of the world’s most traded currencies. Its value is broadly determined by the performance of the Japanese economy, but more specifically by the Bank of Japan’s policy, the differential between Japanese and US bond yields, or risk sentiment among traders, among other factors.
One of the Bank of Japan’s mandates is currency control, so its moves are key for the Yen. The BoJ has directly intervened in currency markets sometimes, generally to lower the value of the Yen, although it refrains from doing it often due to political concerns of its main trading partners. The current BoJ ultra-loose monetary policy, based on massive stimulus to the economy, has caused the Yen to depreciate against its main currency peers. This process has exacerbated more recently due to an increasing policy divergence between the Bank of Japan and other main central banks, which have opted to increase interest rates sharply to fight decades-high levels of inflation.
The BoJ’s stance of sticking to ultra-loose monetary policy has led to a widening policy divergence with other central banks, particularly with the US Federal Reserve. This supports a widening of the differential between the 10-year US and Japanese bonds, which favors the US Dollar against the Japanese Yen.
The Japanese Yen is often seen as a safe-haven investment. This means that in times of market stress, investors are more likely to put their money in the Japanese currency due to its supposed reliability and stability. Turbulent times are likely to strengthen the Yen’s value against other currencies seen as more risky to invest in.
- EUR/USD trades on a stronger note around 1.0885 in Monday’s early European session.
- The pair keeps the bullish vibe above the 100-period EMA, but the RSI indicator holds in bearish territory.
- The first downside target is seen at 1.0865; the immediate resistance level is located at 1.0900.
The EUR/USD pair trades with mild gains near 1.0885 during the early European session on Monday. The European Central Bank (ECB) left rates unchanged in July and maintained a data-dependent approach. ECB President Christine Lagarde reiterated that the central bank will maintain a restrictive policy stance as long as necessary to achieve the 2% inflation target.
According to the 4-hour chart, the EUR/USD pair maintains a positive stance unchanged above the key 100-period Exponential Moving Average (EMA). However, the Relative Strength Index (RSI) stands in bearish territory near 43.0, suggesting that further downside cannot be ruled out.
The initial support level for the major pair will emerge near the lower limit of the Bollinger Band at 1.0865. Further south, the next contention level is located at 1.0850, the 100-period EMA. Any follow-through selling below this level will see a drop to the 1.0800 psychological mark.
On the upside, a decisive break above the 1.0900 round figure will pave the way to 1.0950, the upper boundary of the Bollinger Band. Extended gains will expose 1.0981, a high of March 8. The crucial resistance level to watch is the 1.1000 level.
EUR/USD 4-hour chart
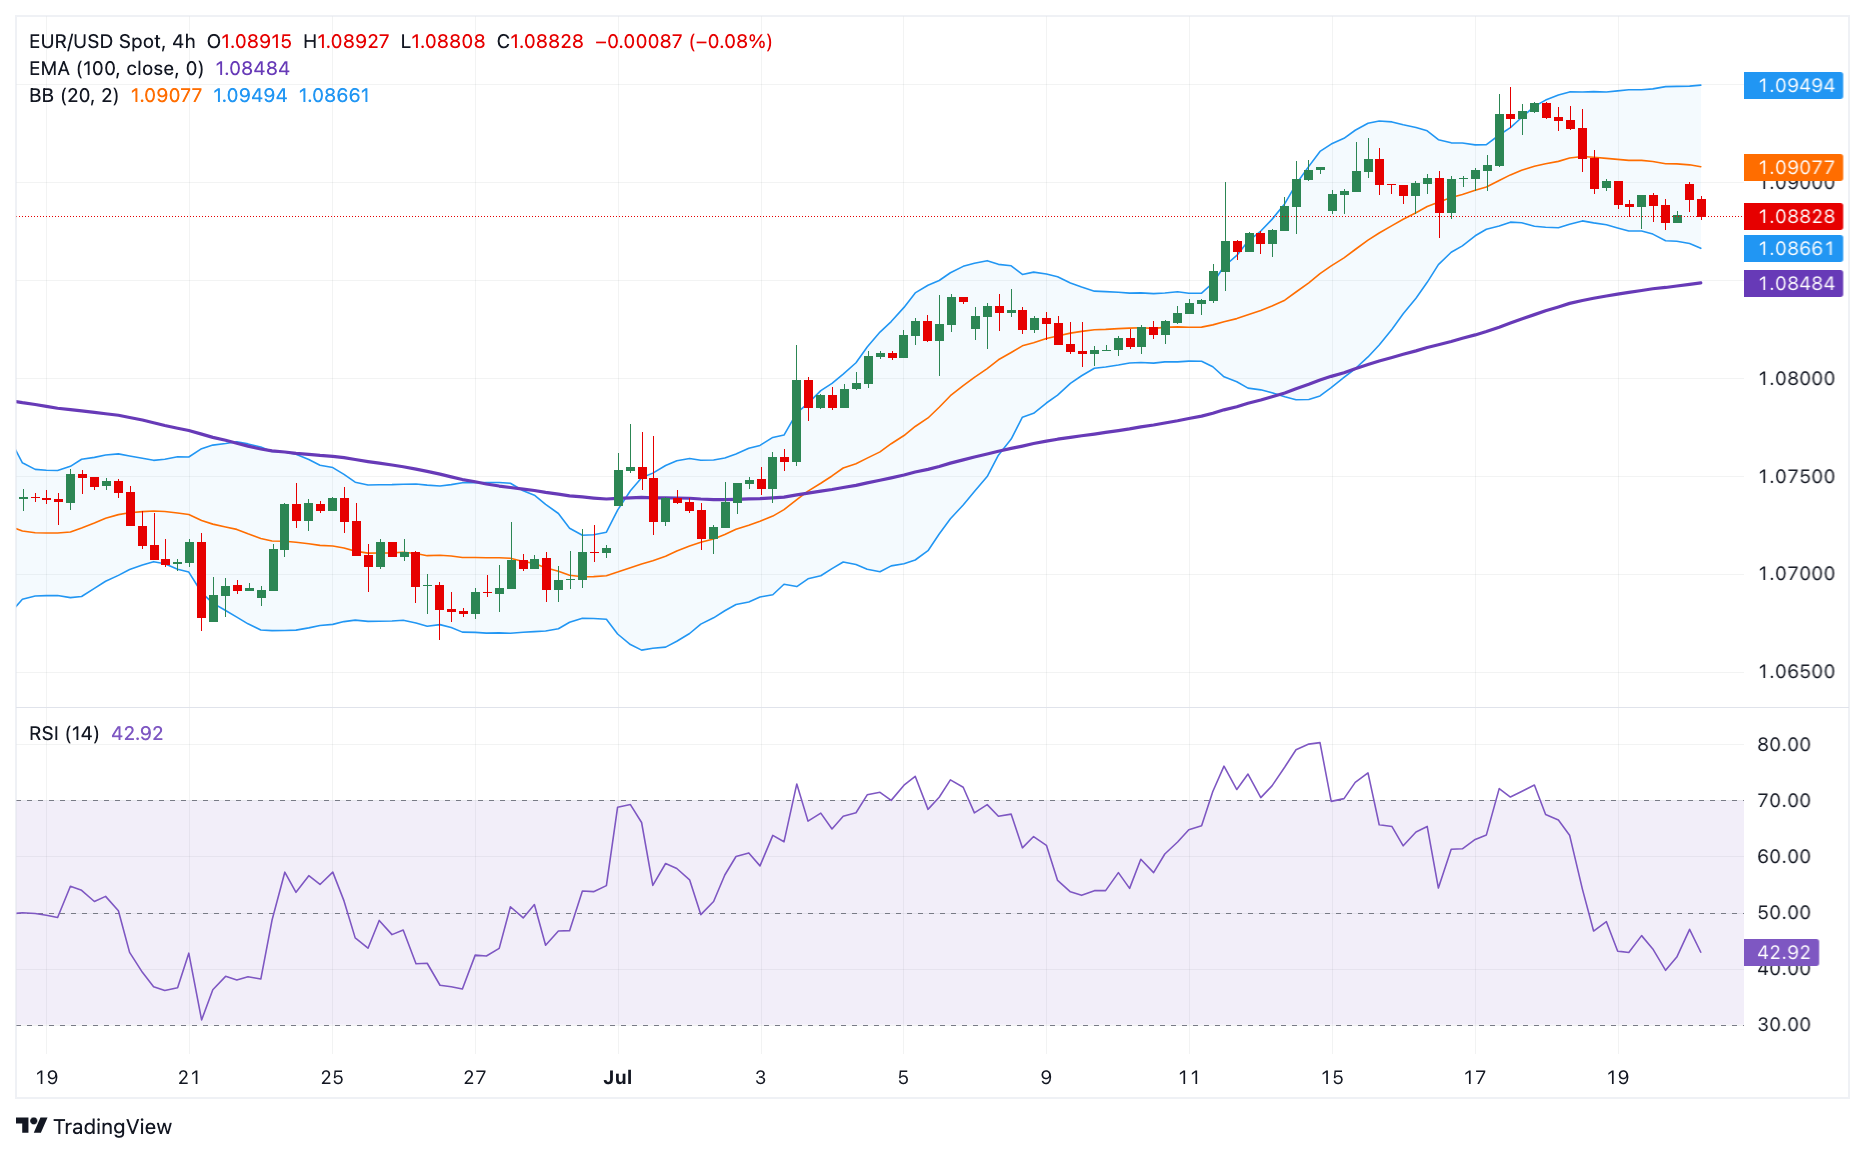
Euro FAQs
The Euro is the currency for the 20 European Union countries that belong to the Eurozone. It is the second most heavily traded currency in the world behind the US Dollar. In 2022, it accounted for 31% of all foreign exchange transactions, with an average daily turnover of over $2.2 trillion a day. EUR/USD is the most heavily traded currency pair in the world, accounting for an estimated 30% off all transactions, followed by EUR/JPY (4%), EUR/GBP (3%) and EUR/AUD (2%).
The European Central Bank (ECB) in Frankfurt, Germany, is the reserve bank for the Eurozone. The ECB sets interest rates and manages monetary policy. The ECB’s primary mandate is to maintain price stability, which means either controlling inflation or stimulating growth. Its primary tool is the raising or lowering of interest rates. Relatively high interest rates – or the expectation of higher rates – will usually benefit the Euro and vice versa. The ECB Governing Council makes monetary policy decisions at meetings held eight times a year. Decisions are made by heads of the Eurozone national banks and six permanent members, including the President of the ECB, Christine Lagarde.
Eurozone inflation data, measured by the Harmonized Index of Consumer Prices (HICP), is an important econometric for the Euro. If inflation rises more than expected, especially if above the ECB’s 2% target, it obliges the ECB to raise interest rates to bring it back under control. Relatively high interest rates compared to its counterparts will usually benefit the Euro, as it makes the region more attractive as a place for global investors to park their money.
Data releases gauge the health of the economy and can impact on the Euro. Indicators such as GDP, Manufacturing and Services PMIs, employment, and consumer sentiment surveys can all influence the direction of the single currency. A strong economy is good for the Euro. Not only does it attract more foreign investment but it may encourage the ECB to put up interest rates, which will directly strengthen the Euro. Otherwise, if economic data is weak, the Euro is likely to fall. Economic data for the four largest economies in the euro area (Germany, France, Italy and Spain) are especially significant, as they account for 75% of the Eurozone’s economy.
Another significant data release for the Euro is the Trade Balance. This indicator measures the difference between what a country earns from its exports and what it spends on imports over a given period. If a country produces highly sought after exports then its currency will gain in value purely from the extra demand created from foreign buyers seeking to purchase these goods. Therefore, a positive net Trade Balance strengthens a currency and vice versa for a negative balance.
FX option expiries for July 20 NY cut at 10:00 Eastern Time, via DTCC, can be found below.
EUR/USD: EUR amounts
- 1.0845 584m
- 1.0925 617m
- 1.0950 919m
- 1.0975 1.1b
GBP/USD: GBP amounts
- 1.2940 554m
- 1.2975 502m
USD/JPY: USD amounts
- 156.00 532m
- 157.30 415m
- 158.00 2.7b
USD/CHF: USD amounts
- 0.9200 738m
AUD/USD: AUD amounts
- 0.6655 420m
- 0.6700 997m
USD/CAD: USD amounts
- 1.3575 1.7b
- 1.3700 602m
EUR/GBP: EUR amounts
- 0.8375 480m
- 0.8415 400m
- 0.8450 432m
- 0.8465 416m
- 0.8475 510m
Gold prices rose in India on Monday, according to data compiled by FXStreet.
The price for Gold stood at 6,468.01 Indian Rupees (INR) per gram, up compared with the INR 6,457.95 it cost on Friday.
The price for Gold increased to INR 75,441.62 per tola from INR 75,324.30 per tola on friday.
| Unit measure | Gold Price in INR |
|---|---|
| 1 Gram | 6,468.01 |
| 10 Grams | 64,680.12 |
| Tola | 75,441.62 |
| Troy Ounce | 201,177.80 |
FXStreet calculates Gold prices in India by adapting international prices (USD/INR) to the local currency and measurement units. Prices are updated daily based on the market rates taken at the time of publication. Prices are just for reference and local rates could diverge slightly.
Gold FAQs
Gold has played a key role in human’s history as it has been widely used as a store of value and medium of exchange. Currently, apart from its shine and usage for jewelry, the precious metal is widely seen as a safe-haven asset, meaning that it is considered a good investment during turbulent times. Gold is also widely seen as a hedge against inflation and against depreciating currencies as it doesn’t rely on any specific issuer or government.
Central banks are the biggest Gold holders. In their aim to support their currencies in turbulent times, central banks tend to diversify their reserves and buy Gold to improve the perceived strength of the economy and the currency. High Gold reserves can be a source of trust for a country’s solvency. Central banks added 1,136 tonnes of Gold worth around $70 billion to their reserves in 2022, according to data from the World Gold Council. This is the highest yearly purchase since records began. Central banks from emerging economies such as China, India and Turkey are quickly increasing their Gold reserves.
Gold has an inverse correlation with the US Dollar and US Treasuries, which are both major reserve and safe-haven assets. When the Dollar depreciates, Gold tends to rise, enabling investors and central banks to diversify their assets in turbulent times. Gold is also inversely correlated with risk assets. A rally in the stock market tends to weaken Gold price, while sell-offs in riskier markets tend to favor the precious metal.
The price can move due to a wide range of factors. Geopolitical instability or fears of a deep recession can quickly make Gold price escalate due to its safe-haven status. As a yield-less asset, Gold tends to rise with lower interest rates, while higher cost of money usually weighs down on the yellow metal. Still, most moves depend on how the US Dollar (USD) behaves as the asset is priced in dollars (XAU/USD). A strong Dollar tends to keep the price of Gold controlled, whereas a weaker Dollar is likely to push Gold prices up.
(An automation tool was used in creating this post.)
- GBP/USD could test the upper boundary of the ascending channel around the level of 1.3000.
- Momentum indicators reflect short-term bullish momentum for the pair.
- The 14-day EMA at 1.2885 level could act as immediate support, followed by the lower boundary of the ascending channel.
GBP/USD breaks its two-day losses, trading around 1.2920 in Monday's Asian session. The analysis of the daily chart shows the pair lies within an ascending channel, signaling a bullish trend in the pair's price movements.
Moreover, the Moving Average Convergence Divergence (MACD), a momentum indicator, reflects short-term bullish momentum, with the MACD line above the centerline and the signal line. Additionally, the 14-day Relative Strength Index (RSI) sits above the 50 level, confirming the bullish trend.
In terms of resistance, the GBP/USD pair could test the upper boundary of the ascending channel around the psychological level of 1.3000. A breakthrough above this level could provide support for the pair to revisit the yearly high of 1.3044 level recorded on July 17.
On the downside, the immediate support appears at the 14-day Exponential Moving Average (EMA) at the 1.2885 level, followed by the lower threshold of the ascending channel around the 1.2830 level. A break below the latter could lead the GBP/USD pair to navigate the region around the throwback support level of 1.2615.
GBP/USD: Daily Chart
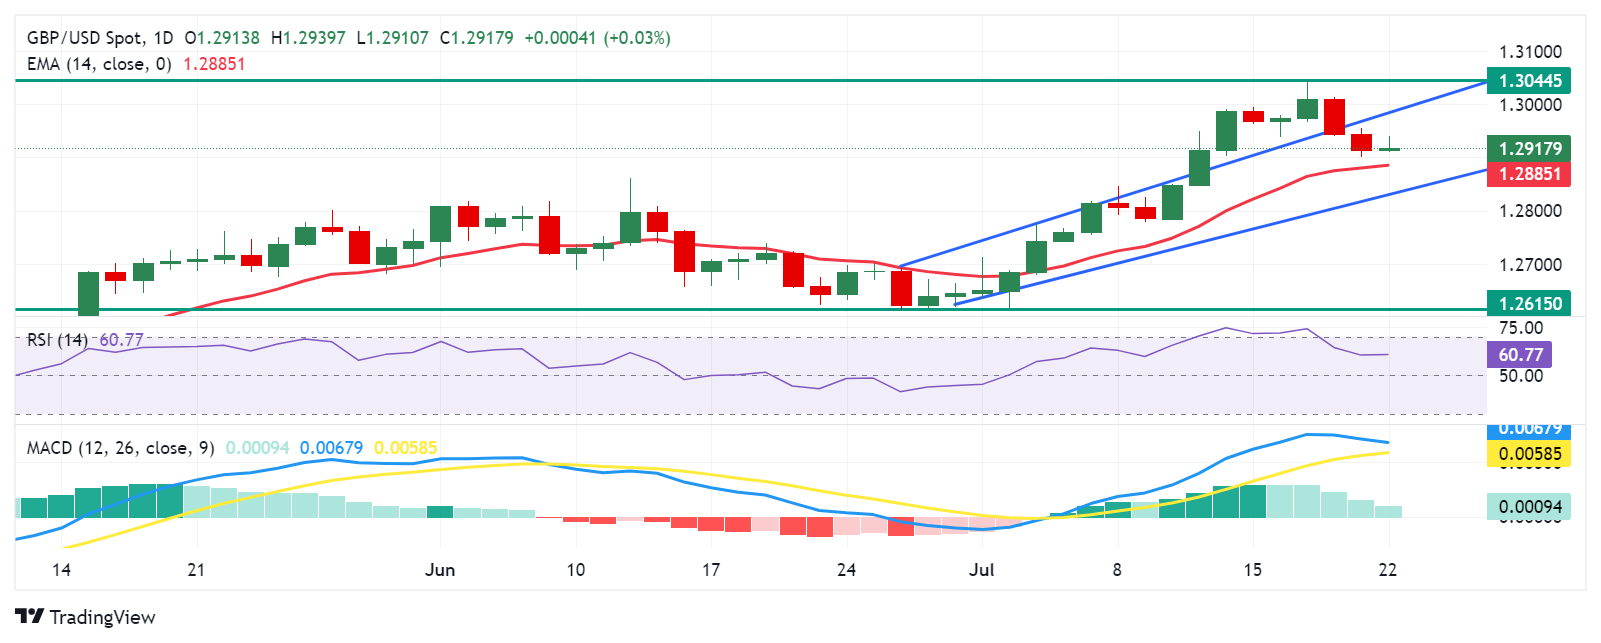
British Pound PRICE Today
The table below shows the percentage change of British Pound (GBP) against listed major currencies today. British Pound was the strongest against the Australian Dollar.
| USD | EUR | GBP | JPY | CAD | AUD | NZD | CHF | |
|---|---|---|---|---|---|---|---|---|
| USD | -0.04% | -0.02% | 0.03% | 0.12% | 0.28% | 0.37% | 0.10% | |
| EUR | 0.04% | 0.02% | 0.05% | 0.12% | 0.36% | 0.36% | 0.08% | |
| GBP | 0.02% | -0.02% | -0.06% | 0.09% | 0.35% | 0.34% | 0.05% | |
| JPY | -0.03% | -0.05% | 0.06% | 0.11% | 0.31% | 0.30% | -0.00% | |
| CAD | -0.12% | -0.12% | -0.09% | -0.11% | 0.26% | 0.26% | -0.02% | |
| AUD | -0.28% | -0.36% | -0.35% | -0.31% | -0.26% | 0.00% | -0.30% | |
| NZD | -0.37% | -0.36% | -0.34% | -0.30% | -0.26% | -0.00% | -0.25% | |
| CHF | -0.10% | -0.08% | -0.05% | 0.00% | 0.02% | 0.30% | 0.25% |
The heat map shows percentage changes of major currencies against each other. The base currency is picked from the left column, while the quote currency is picked from the top row. For example, if you pick the British Pound from the left column and move along the horizontal line to the US Dollar, the percentage change displayed in the box will represent GBP (base)/USD (quote).
- USD/CNH extends upside near 7.2935 on Monday.
- China’s PBoC cut its main benchmark lending rate for the first time since August 2023 in a bid to shore up the economy.
- The rising bets on the Fed rate cut this year might weigh on the Greenback and cap the pair’s upside.
The USD/CNH pair trades in positive territory for the third consecutive day around 7.2935 during the Asian trading hours on Monday. The uptick of the pair is bolstered by a surprise rate cut by the People's Bank of China (PBoC). The release
Early Monday, the Chinese central bank announced to cut the one-year Loan Prime Rate (LPR), benchmarks for the loans banks make to their customers, by 10 basis points (bps) from 3.45% to 3.35% and cut the five-year LPR from 3.95% to 3.85%. Additionally, the PBoC cut its main short-term policy rate for the first time since August 2023. The 7-day reverse repo was cut from 1.8% to 1.7%.
On the other hand, the prospect of a forthcoming Federal Reserve (Fed) rate cut might undermine the US Dollar (USD) and cap the upside for the pair. New York Federal Reserve President John Williams said on Friday that an interest rate cut could be warranted in the coming months, but not at its July policy meeting.
Meanwhile, Fed Governor Christopher Waller stated that inflation will continue to moderate towards the Fed's 2% target in the months ahead, adding that the time to lower the policy rate is drawing closer. According to the CME FedWatch Tool, investors are now pricing in the odds of a move at its July meeting less than 5%, and pricing in a nearly full rate cut is firmly expected in September.
Interest rates FAQs
Interest rates are charged by financial institutions on loans to borrowers and are paid as interest to savers and depositors. They are influenced by base lending rates, which are set by central banks in response to changes in the economy. Central banks normally have a mandate to ensure price stability, which in most cases means targeting a core inflation rate of around 2%. If inflation falls below target the central bank may cut base lending rates, with a view to stimulating lending and boosting the economy. If inflation rises substantially above 2% it normally results in the central bank raising base lending rates in an attempt to lower inflation.
Higher interest rates generally help strengthen a country’s currency as they make it a more attractive place for global investors to park their money.
Higher interest rates overall weigh on the price of Gold because they increase the opportunity cost of holding Gold instead of investing in an interest-bearing asset or placing cash in the bank. If interest rates are high that usually pushes up the price of the US Dollar (USD), and since Gold is priced in Dollars, this has the effect of lowering the price of Gold.
The Fed funds rate is the overnight rate at which US banks lend to each other. It is the oft-quoted headline rate set by the Federal Reserve at its FOMC meetings. It is set as a range, for example 4.75%-5.00%, though the upper limit (in that case 5.00%) is the quoted figure. Market expectations for future Fed funds rate are tracked by the CME FedWatch tool, which shapes how many financial markets behave in anticipation of future Federal Reserve monetary policy decisions.
- WTI attracts some buyers on Monday amid the US politics-inspired modest USD downtick.
- Geopolitical risks also lend support to Oil prices, though China’s economic woes cap gains.
- Friday’s breakdown and close below the 50-day SMA warrants caution for bullish traders.
West Texas Intermediate (WTI) US crude Oil prices kick off the new week on a positive note and reverse a part of Friday's heavy losses to the $78.50-$78.45 region, over a one-month trough. The commodity currently trades around the $78.85 region, up nearly 0.50% for the day, though lacks strong follow-through buying.
US President Joe Biden announced his exit from the presidential race on Sunday, prompting investors to unwind trades betting on a Trump victory. This comes on top of growing acceptance that the Federal Reserve (Fed) will begin its rate-cutting cycle in September and caps the recent US Dollar (USD) recovery from a multi-month low touched last week. This, in turn, is seen lending some support to the USD-denominated commodities, including Crude Oil prices.
Apart from this, concerns about supply chain disruption due to the protracted Russia-Ukraine war and the ongoing conflicts in the Middle East further act as a tailwind for the black liquid. Meanwhile, the initial market reaction to the US political development, however, turns out to be limited, which is evident from a modest USD bounce from the daily low. This, along with China's economic woes, should keep a lid on any meaningful upside for Crude Oil prices.
Even from a technical perspective, Friday's close below the 50-day Simple Moving Average (SMA) could be seen as a fresh trigger for bearish traders. Moreover, oscillators on the daily chart have just started gaining negative traction and suggest that the path of least resistance for the commodity is to the downside. Hence, any subsequent move up could be seen as a selling opportunity and runs the risk of fizzling out rather quickly in the absence of any relevant US macro data.
WTI Oil FAQs
WTI Oil is a type of Crude Oil sold on international markets. The WTI stands for West Texas Intermediate, one of three major types including Brent and Dubai Crude. WTI is also referred to as “light” and “sweet” because of its relatively low gravity and sulfur content respectively. It is considered a high quality Oil that is easily refined. It is sourced in the United States and distributed via the Cushing hub, which is considered “The Pipeline Crossroads of the World”. It is a benchmark for the Oil market and WTI price is frequently quoted in the media.
Like all assets, supply and demand are the key drivers of WTI Oil price. As such, global growth can be a driver of increased demand and vice versa for weak global growth. Political instability, wars, and sanctions can disrupt supply and impact prices. The decisions of OPEC, a group of major Oil-producing countries, is another key driver of price. The value of the US Dollar influences the price of WTI Crude Oil, since Oil is predominantly traded in US Dollars, thus a weaker US Dollar can make Oil more affordable and vice versa.
The weekly Oil inventory reports published by the American Petroleum Institute (API) and the Energy Information Agency (EIA) impact the price of WTI Oil. Changes in inventories reflect fluctuating supply and demand. If the data shows a drop in inventories it can indicate increased demand, pushing up Oil price. Higher inventories can reflect increased supply, pushing down prices. API’s report is published every Tuesday and EIA’s the day after. Their results are usually similar, falling within 1% of each other 75% of the time. The EIA data is considered more reliable, since it is a government agency.
OPEC (Organization of the Petroleum Exporting Countries) is a group of 13 Oil-producing nations who collectively decide production quotas for member countries at twice-yearly meetings. Their decisions often impact WTI Oil prices. When OPEC decides to lower quotas, it can tighten supply, pushing up Oil prices. When OPEC increases production, it has the opposite effect. OPEC+ refers to an expanded group that includes ten extra non-OPEC members, the most notable of which is Russia.
- Silver price depreciates as the slowing Chinese economy could negatively impact the industrial demand for the asset.
- The grey metal may limit its downside as challenges in mining production could lead to tighter supplies.
- The rising odds of the Fed reducing rates could support the demand for non-yielding assets like Silver.
Silver price (XAG/USD) continues its losing streak for the fourth consecutive day, trading around $29.20 per troy ounce during the Asian hours on Monday. The grey metal faces challenges due to a slowing Chinese economy, the world's largest manufacturing hub. China's industrial demand for Silver is significant, as it is essential in various applications such as electronics, solar panels, and automotive components.
However, Silver could limit its downside as supply could fail to keep pace. “Mining production has been affected by labor shortages and environmental regulations, leading to tighter supplies. According to the Silver Institute’s estimates, 2024 is expected to be the fourth consecutive year of a supply deficit, Business Standard cited Navneet Damani, group senior vice-president, head of commodities research, Motilal Oswal Financial Services.
Additionally, Silver prices may also find support as the dovish sentiment surrounding the Federal Reserve's policy stance could support the demand of the non-yielding asset. Lower interest rates could attract buyers toward assets like Silver. According to CME Group’s FedWatch Tool, the markets show a 91.7% probability of a 25-basis point rate cut at the September Fed meeting, up from 90.3% a week earlier.
Federal Reserve Bank of New York President John Williams stated on Friday that the long-term trends that caused declines in neutral interest rates before the pandemic continue to prevail. Williams noted, "My own Holston-Laubach-Williams estimates for r-star in the United States, Canada, and the Euro area are about the same level as they were before the pandemic," according to Bloomberg.
Silver FAQs
Silver is a precious metal highly traded among investors. It has been historically used as a store of value and a medium of exchange. Although less popular than Gold, traders may turn to Silver to diversify their investment portfolio, for its intrinsic value or as a potential hedge during high-inflation periods. Investors can buy physical Silver, in coins or in bars, or trade it through vehicles such as Exchange Traded Funds, which track its price on international markets.
Silver prices can move due to a wide range of factors. Geopolitical instability or fears of a deep recession can make Silver price escalate due to its safe-haven status, although to a lesser extent than Gold's. As a yieldless asset, Silver tends to rise with lower interest rates. Its moves also depend on how the US Dollar (USD) behaves as the asset is priced in dollars (XAG/USD). A strong Dollar tends to keep the price of Silver at bay, whereas a weaker Dollar is likely to propel prices up. Other factors such as investment demand, mining supply – Silver is much more abundant than Gold – and recycling rates can also affect prices.
Silver is widely used in industry, particularly in sectors such as electronics or solar energy, as it has one of the highest electric conductivity of all metals – more than Copper and Gold. A surge in demand can increase prices, while a decline tends to lower them. Dynamics in the US, Chinese and Indian economies can also contribute to price swings: for the US and particularly China, their big industrial sectors use Silver in various processes; in India, consumers’ demand for the precious metal for jewellery also plays a key role in setting prices.
Silver prices tend to follow Gold's moves. When Gold prices rise, Silver typically follows suit, as their status as safe-haven assets is similar. The Gold/Silver ratio, which shows the number of ounces of Silver needed to equal the value of one ounce of Gold, may help to determine the relative valuation between both metals. Some investors may consider a high ratio as an indicator that Silver is undervalued, or Gold is overvalued. On the contrary, a low ratio might suggest that Gold is undervalued relative to Silver.
- USD/CAD reverses an early dip to 1.3700, though the upside potential seems limited.
- The US political uncertainty and dovish Fed bets keep the USD bulls on the defensive.
- An uptick in Oil prices underpins the Loonie and contributes to capping for the major.
The USD/CAD pair attracts some dip-buying following an Asian session uptick to the 1.3700 neighborhood, albeit lacks follow-through and remains below a nearly three-week low touched on Friday. Spot prices currently trade around the 1.3725-1.3730 region – unchanged for the day – and the directionless intraday price move is sponsored by a combination of diverging forces.
The initial market reaction to US President Joe Biden's exit from the presidential race turned out to be short-lived, which is evident from a modest US Dollar (USD) bounce. This turns out to be a key factor acting as a tailwind for the USD/CAD pair. That said, dovish Federal Reserve (Fed) expectations hold back traders from placing aggressive bullish bets around the Greenback and cap the upside for the currency pair.
Investors now seem convinced that the US central bank will lower borrowing costs in September and have been pricing in two more rate cuts by year-end, which is anticipated to boost economic activity and fuel demand. This assists Crude Oil prices in reversing a part of Friday's heavy losses to a one-month low, underpinning the commodity-linked Loonie and contributing to keeping a lid on the USD/CAD pair.
Meanwhile, concerns about an economic slowdown in China – the world's top oil importer – should act as a headwind for Crude Oil prices. Traders also seem reluctant and prefer to wait for more cues about the Fed's policy path before placing directional bets around the USD/CAD pair. Hence, the market focus will remain glued to the US Personal Consumption Expenditures (PCE) Price Index data, due for release on Friday.
Market participants this week will also confront the release of flash PMIs, which should provide fresh insight into the health of the global economy and influence Crude Oil prices. In the meantime, the broader risk sentiment might continue to drive the USD and produce short-term trading opportunities around the USD/CAD pair in the absence of any relevant market-moving macro data, either from the US or Canada.
Canadian Dollar FAQs
The key factors driving the Canadian Dollar (CAD) are the level of interest rates set by the Bank of Canada (BoC), the price of Oil, Canada’s largest export, the health of its economy, inflation and the Trade Balance, which is the difference between the value of Canada’s exports versus its imports. Other factors include market sentiment – whether investors are taking on more risky assets (risk-on) or seeking safe-havens (risk-off) – with risk-on being CAD-positive. As its largest trading partner, the health of the US economy is also a key factor influencing the Canadian Dollar.
The Bank of Canada (BoC) has a significant influence on the Canadian Dollar by setting the level of interest rates that banks can lend to one another. This influences the level of interest rates for everyone. The main goal of the BoC is to maintain inflation at 1-3% by adjusting interest rates up or down. Relatively higher interest rates tend to be positive for the CAD. The Bank of Canada can also use quantitative easing and tightening to influence credit conditions, with the former CAD-negative and the latter CAD-positive.
The price of Oil is a key factor impacting the value of the Canadian Dollar. Petroleum is Canada’s biggest export, so Oil price tends to have an immediate impact on the CAD value. Generally, if Oil price rises CAD also goes up, as aggregate demand for the currency increases. The opposite is the case if the price of Oil falls. Higher Oil prices also tend to result in a greater likelihood of a positive Trade Balance, which is also supportive of the CAD.
While inflation had always traditionally been thought of as a negative factor for a currency since it lowers the value of money, the opposite has actually been the case in modern times with the relaxation of cross-border capital controls. Higher inflation tends to lead central banks to put up interest rates which attracts more capital inflows from global investors seeking a lucrative place to keep their money. This increases demand for the local currency, which in Canada’s case is the Canadian Dollar.
Macroeconomic data releases gauge the health of the economy and can have an impact on the Canadian Dollar. Indicators such as GDP, Manufacturing and Services PMIs, employment, and consumer sentiment surveys can all influence the direction of the CAD. A strong economy is good for the Canadian Dollar. Not only does it attract more foreign investment but it may encourage the Bank of Canada to put up interest rates, leading to a stronger currency. If economic data is weak, however, the CAD is likely to fall.
- The Japanese Yen extends losses despite the hawkish sentiment surrounding BoJ’s policy stance for next week.
- Japan’s Prime Minister Fumio Kishida stated that normalizing the BoJ’s monetary policy would help support a growth-driven economy.
- US President Joe Biden abandoned his re-election bid and endorsed Vice President Kamala Harris to face Republican Donald Trump.
The Japanese Yen (JPY) remains weak on Monday, extending its losing streak to a third consecutive session. Traders are gearing up for the Bank of Japan’s (BoJ) policy meeting next week, where an interest rate hike might be on the table to support the JPY. Japan’s Prime Minister Fumio Kishida stated that normalizing the central bank’s monetary policy would aid Japan's shift to a growth-driven economy, according to Nikkei Asia.
Speculative short positions in the Yen, which had risen to their second-highest level, have started to decline following Japan's suspected Yen-buying intervention this month, which surprised the market. As of Tuesday, Yen short positions held by market players such as hedge funds totaled a net 151,072 contracts, according to the US Commodity Futures Trading Commission. This marks a decrease of 30,961 contracts from the previous week and is the largest drop since May 7, when short positions fell by 33,466 contracts, according to another report by Nikkei Asia.
The USD/JPY could limit its upside as the US Dollar (USD) faces challenges due to rising bets on a Federal Reserve (Fed) rate cut in September increase and concerns about the fragility of the US labor market persist. According to CME Group’s FedWatch Tool, markets now indicate a 91.7% probability of a 25-basis point rate cut at the September Fed meeting, up from 90.3% a week earlier.
Daily Digest Market Movers: Japanese Yen remains weak despite intervention threat
- US President Joe Biden abandoned his re-election bid on Sunday under growing pressure from his fellow Democrats and endorsed Vice President Kamala Harris as the party's candidate to face Republican Donald Trump in the November election, according to Reuters.
- Federal Reserve Bank of New York President John Williams stated on Friday that the long-term trends that caused declines in neutral interest rates before the pandemic continue to prevail. Williams noted, "My own Holston-Laubach-Williams estimates for r-star in the United States, Canada, and the Euro area are about the same level as they were before the pandemic," according to Bloomberg.
- Japan's National Consumer Price Index (CPI) for June held steady at 2.8%, matching the previous month's figure and remaining at the highest level since February. Meanwhile, Core CPI inflation rose to 2.6%, slightly above the previous reading of 2.5% but just below the consensus estimate of 2.7%.
- JP Morgan has anticipated no rate hike from the Bank of Japan (BoJ) in July or at any point in 2024. A July rate increase is not their base case, and they do not expect any hikes for the remainder of 2024. They believe it is too early to adopt a bullish stance on the Yen.
- Kazushige Kamiyama, a senior Bank of Japan (BoJ) official and the central bank’s Osaka branch manager, said on Thursday that the BoJ wants to maintain an accommodative monetary environment as much as possible, per Jiji News Agency.
- During an interview with Bloomberg News on Tuesday, Donald Trump cautioned Fed Chair Jerome Powell against cutting US interest rates before November’s presidential vote. However, Trump also indicated that if re-elected, he would allow Powell to complete his term if he continued to "do the right thing" at the Federal Reserve.
- Data released on Tuesday showed that the Bank of Japan (BoJ) entered the foreign exchange market on consecutive trading days last Thursday and Friday. The current account balance data from the BoJ, released on Tuesday, indicates an anticipated liquidity drain of approximately ¥2.74 trillion ($17.3 billion) from the financial system on Wednesday due to various government sector transactions, according to Nikkei Asia.
- Fed Chair Jerome Powell mentioned earlier this week that the three US inflation readings of this year "add somewhat to confidence" that inflation is on course to meet the Fed’s target sustainably, suggesting that a shift to interest rate cuts may not be far off.
Technical Analysis: USD/JPY remains near 157.50
USD/JPY trades around 157.60 on Monday. The daily chart analysis shows that the pair is below its nine-day Exponential Moving Average (EMA) of 158.14, indicating short-term downward momentum. This suggests waiting for signs of a trend reversal before considering a buy. Additionally, the 14-day Relative Strength Index (RSI) is below 50, reinforcing a bearish outlook.
The USD/JPY pair may find significant support near June’s low of 154.55. A drop below this level could lead to a decline toward May’s low of 151.86.
On the upside, immediate resistance is at the nine-day EMA of 158.14. A break above this level could see the USD/JPY pair testing the resistance around the psychological level of 162.00.
USD/JPY: Daily Chart
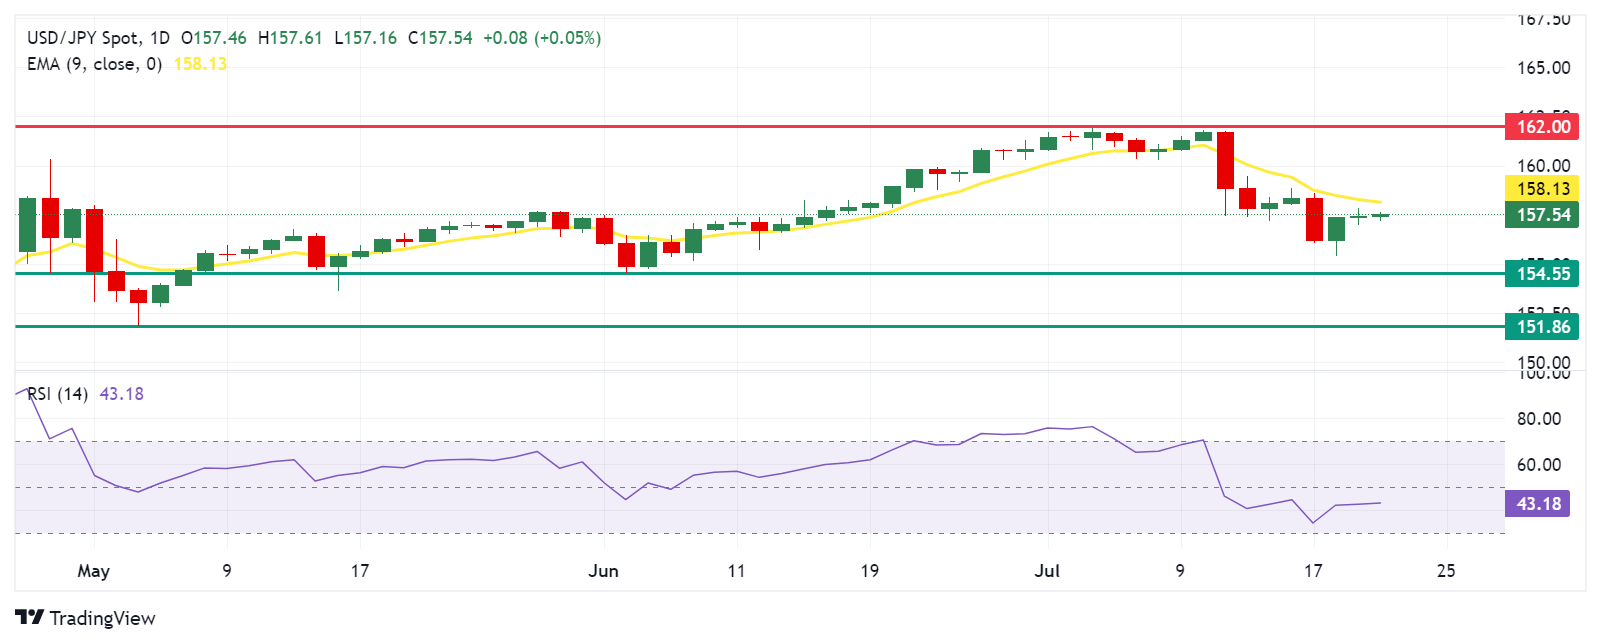
Japanese Yen PRICE Today
The table below shows the percentage change of Japanese Yen (JPY) against listed major currencies today. Japanese Yen was the weakest against the Euro.
| USD | EUR | GBP | JPY | CAD | AUD | NZD | CHF | |
|---|---|---|---|---|---|---|---|---|
| USD | -0.09% | -0.08% | 0.09% | 0.07% | 0.14% | 0.24% | 0.10% | |
| EUR | 0.09% | -0.00% | 0.17% | 0.12% | 0.28% | 0.28% | 0.13% | |
| GBP | 0.08% | 0.00% | 0.06% | 0.10% | 0.27% | 0.26% | 0.10% | |
| JPY | -0.09% | -0.17% | -0.06% | 0.01% | 0.11% | 0.10% | -0.07% | |
| CAD | -0.07% | -0.12% | -0.10% | -0.01% | 0.16% | 0.17% | 0.01% | |
| AUD | -0.14% | -0.28% | -0.27% | -0.11% | -0.16% | 0.00% | -0.17% | |
| NZD | -0.24% | -0.28% | -0.26% | -0.10% | -0.17% | -0.00% | -0.12% | |
| CHF | -0.10% | -0.13% | -0.10% | 0.07% | -0.01% | 0.17% | 0.12% |
The heat map shows percentage changes of major currencies against each other. The base currency is picked from the left column, while the quote currency is picked from the top row. For example, if you pick the Japanese Yen from the left column and move along the horizontal line to the US Dollar, the percentage change displayed in the box will represent JPY (base)/USD (quote).
Bank of Japan FAQs
The Bank of Japan (BoJ) is the Japanese central bank, which sets monetary policy in the country. Its mandate is to issue banknotes and carry out currency and monetary control to ensure price stability, which means an inflation target of around 2%.
The Bank of Japan has embarked in an ultra-loose monetary policy since 2013 in order to stimulate the economy and fuel inflation amid a low-inflationary environment. The bank’s policy is based on Quantitative and Qualitative Easing (QQE), or printing notes to buy assets such as government or corporate bonds to provide liquidity. In 2016, the bank doubled down on its strategy and further loosened policy by first introducing negative interest rates and then directly controlling the yield of its 10-year government bonds.
The Bank’s massive stimulus has caused the Yen to depreciate against its main currency peers. This process has exacerbated more recently due to an increasing policy divergence between the Bank of Japan and other main central banks, which have opted to increase interest rates sharply to fight decades-high levels of inflation. The BoJ’s policy of holding down rates has led to a widening differential with other currencies, dragging down the value of the Yen.
A weaker Yen and the spike in global energy prices have led to an increase in Japanese inflation, which has exceeded the BoJ’s 2% target. Still, the Bank judges that the sustainable and stable achievement of the 2% target has not yet come in sight, so any sudden change in the current policy looks unlikely.
- The Indian Rupee gains ground in Monday’s Asian session.
- Elevated oil prices might pressure the INR, while the renewed US Dollar demand might cap the local currency’s gains.
- Investors await the US Chicago Fed National Activity Index ahead of India’s Federal Budget on Tuesday.
The Indian Rupee (INR) trades with a slight positive bias on Monday amid the weaker US Dollar (USD). The rising speculations of a Federal Reserve (Fed) easing move in September have weighed on the Greenback in previous sessions. However, the high demand for USD, especially for defense and oil payments, might exert some selling pressure on the local currency. The downside for the INR might be limited amid the likely Reserve Bank of India (RBI) intervention to prevent a sharp depreciation in the Indian Rupee.
The US Chicago Fed National Activity Index for June is due on Monday. The highlights for this week will be the preliminary US S&P Global Purchasing Managers Index (PMI) for July, Gross Domestic Product (GDP) for the second quarter and the Personal Consumption Expenditures Price Index (PCE) data for June, which will be released on Wednesday, Thursday and Friday, respectively. On the Indian docket, traders will keep an eye on the Indian Union Budget on Tuesday.
Daily Digest Market Movers: Indian Rupee edges higher amid softer US Dollar
- The Indian Rupee closed at a record closing low of 83.6625 against the US Dollar on Friday, with likely intervention by the Reserve Bank of India (RBI) to stem losses. The currency was down 0.1% for the week, according to Reuters.
- India’s equity benchmark, BSE Sensex, fell 739 points, or 0.91%, to 80,605 on Friday. Meanwhile, the Nifty index closed at 24,531, down 270 points, or 1.1 % from its previous close.
- "We expect the Rupee to trade with a slight negative bias on weak global markets and a strength in the US Dollar. Weak Asian and European currencies may also weigh on the rupee," said Anuj Choudhary, Research Analyst at Sharekhan by BNP Paribas.
- New York Federal Reserve President John Williams said on Friday that an interest rate cut could be warranted in the coming months, but not at its July policy meeting, per WSJ.
- Financial markets are now pricing in the probability of a move at its July meeting less than 5% and pricing in nearly full rate cut is firmly expected in September, according to the CME FedWatch Tool.
Technical analysis: USD/INR keeps bullish vibe in the long term
The Indian Rupee trades on a stronger note on the day. The uptrend has been in play for the USD/INR pair as it has confirmed a breakout above the month-long trading range while holding above the key 100-day Exponential Moving Average (EMA) on the daily chart. Furthermore, the upward momentum is also supported by the 14-day Relative Strength Index (RSI) points higher above 63.60, suggesting that further upside could be on the horizon.
The immediate resistance level for the pair will emerge at the all-time high of 83.77. The crucial hurdle is seen at the 84.00 psychological level.
On the downside, the resistance-turned-support level at 83.65 acts as an initial contention level. The additional downside filter to watch is 83.51 (low of July 12), followed by 83.40 (100-day EMA).
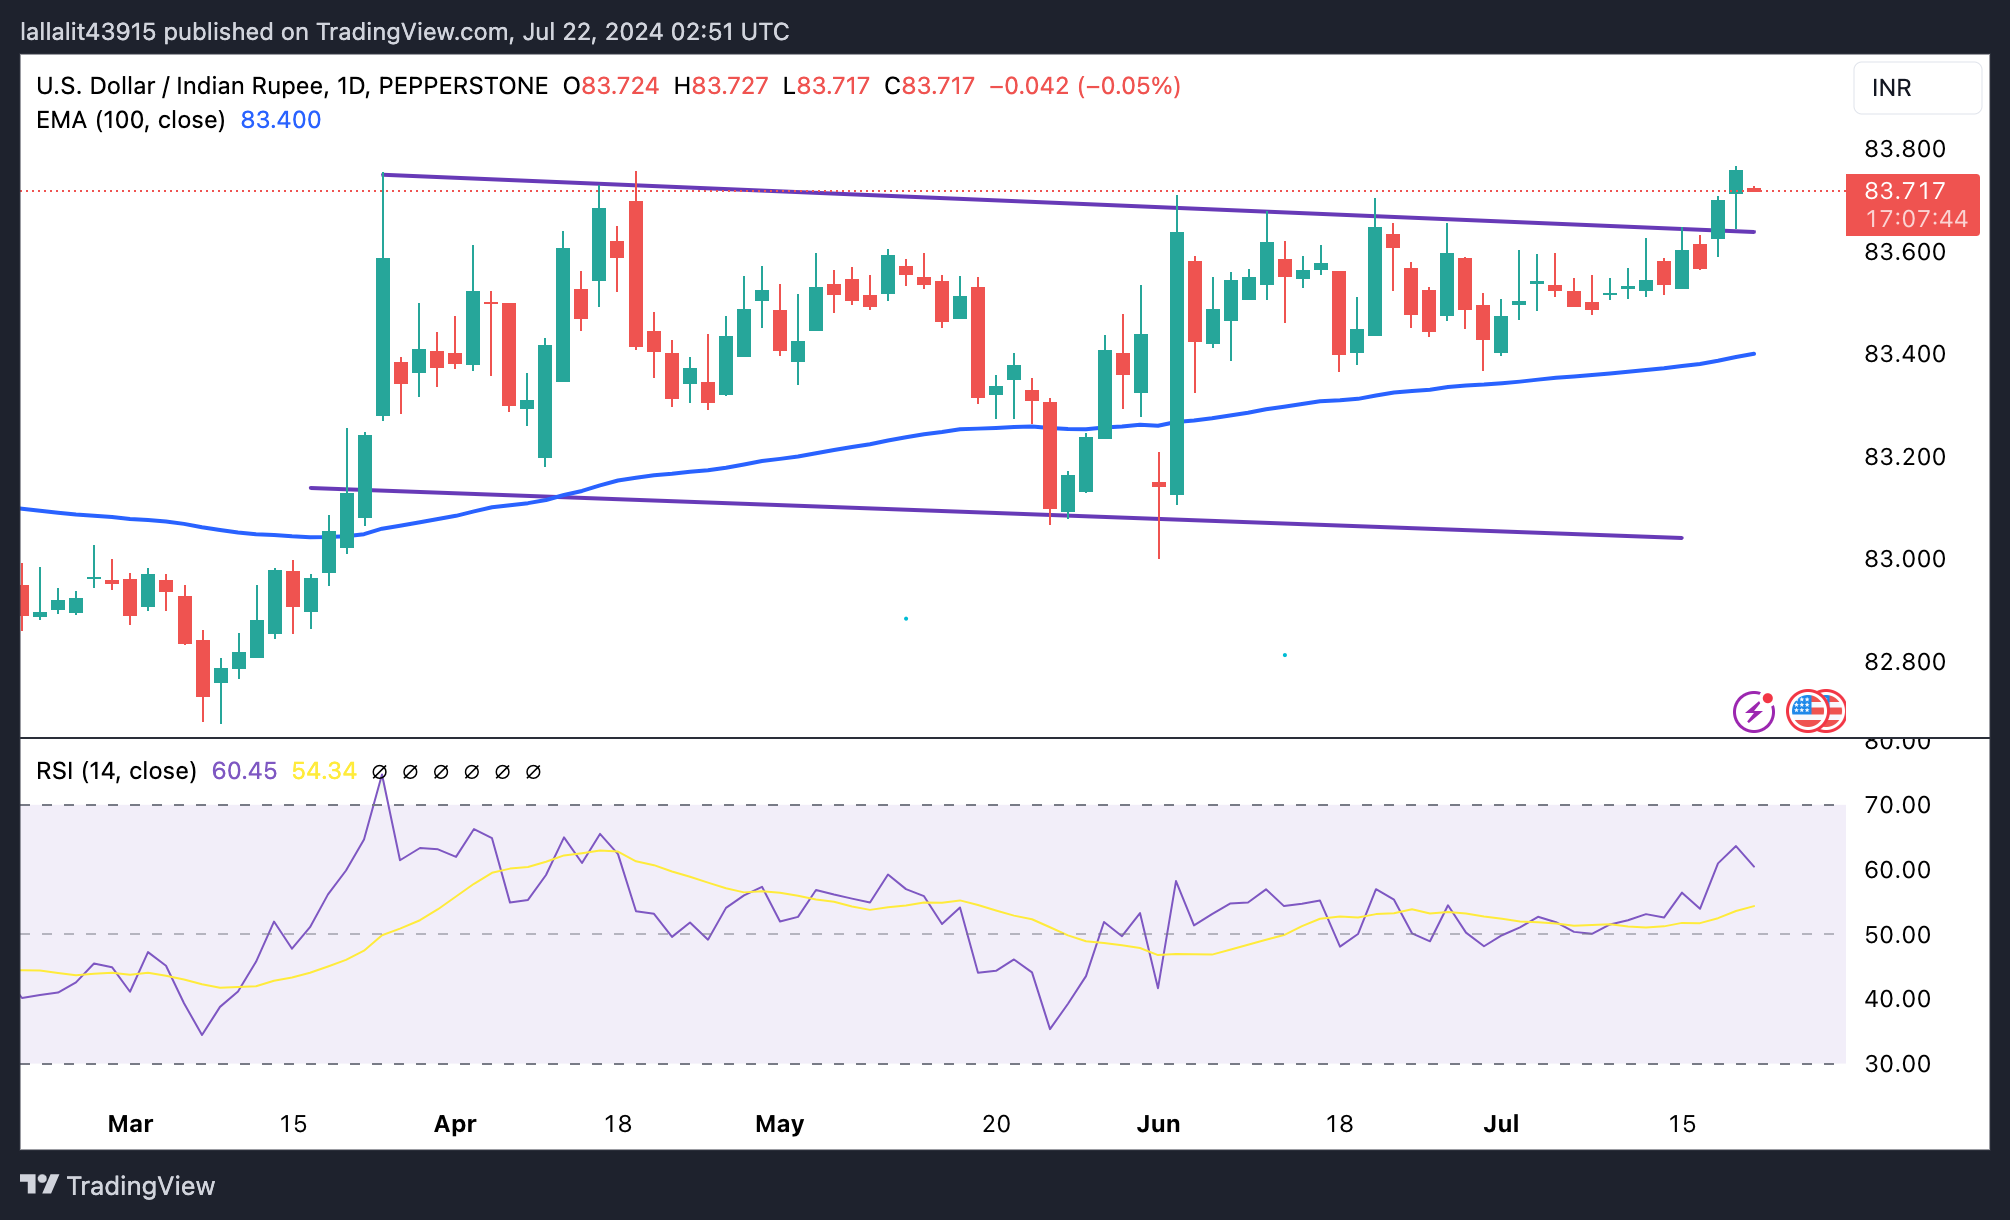
US Dollar price today
The table below shows the percentage change of US Dollar (USD) against listed major currencies today. US Dollar was the weakest against the Euro.
| USD | EUR | GBP | CAD | AUD | JPY | NZD | CHF | |
| USD | 0.06% | 0.08% | 0.13% | 0.36% | 0.12% | 0.36% | 0.10% | |
| EUR | -0.09% | 0.00% | 0.06% | 0.28% | 0.03% | 0.29% | 0.01% | |
| GBP | -0.08% | -0.02% | 0.04% | 0.27% | 0.01% | 0.28% | 0.00% | |
| CAD | -0.13% | -0.06% | -0.04% | 0.22% | -0.02% | 0.24% | -0.05% | |
| AUD | -0.36% | -0.28% | -0.27% | -0.21% | -0.25% | 0.03% | -0.26% | |
| JPY | -0.12% | -0.01% | -0.03% | 0.03% | 0.23% | 0.26% | -0.03% | |
| NZD | -0.35% | -0.29% | -0.28% | -0.24% | -0.01% | -0.24% | -0.28% | |
| CHF | -0.08% | 0.00% | 0.01% | 0.06% | 0.28% | 0.02% | 0.29% |
The heat map shows percentage changes of major currencies against each other. The base currency is picked from the left column, while the quote currency is picked from the top row. For example, if you pick the Euro from the left column and move along the horizontal line to the Japanese Yen, the percentage change displayed in the box will represent EUR (base)/JPY (quote).
Indian Rupee FAQs
The Indian Rupee (INR) is one of the most sensitive currencies to external factors. The price of Crude Oil (the country is highly dependent on imported Oil), the value of the US Dollar – most trade is conducted in USD – and the level of foreign investment, are all influential. Direct intervention by the Reserve Bank of India (RBI) in FX markets to keep the exchange rate stable, as well as the level of interest rates set by the RBI, are further major influencing factors on the Rupee.
The Reserve Bank of India (RBI) actively intervenes in forex markets to maintain a stable exchange rate, to help facilitate trade. In addition, the RBI tries to maintain the inflation rate at its 4% target by adjusting interest rates. Higher interest rates usually strengthen the Rupee. This is due to the role of the ‘carry trade’ in which investors borrow in countries with lower interest rates so as to place their money in countries’ offering relatively higher interest rates and profit from the difference.
Macroeconomic factors that influence the value of the Rupee include inflation, interest rates, the economic growth rate (GDP), the balance of trade, and inflows from foreign investment. A higher growth rate can lead to more overseas investment, pushing up demand for the Rupee. A less negative balance of trade will eventually lead to a stronger Rupee. Higher interest rates, especially real rates (interest rates less inflation) are also positive for the Rupee. A risk-on environment can lead to greater inflows of Foreign Direct and Indirect Investment (FDI and FII), which also benefit the Rupee.
Higher inflation, particularly, if it is comparatively higher than India’s peers, is generally negative for the currency as it reflects devaluation through oversupply. Inflation also increases the cost of exports, leading to more Rupees being sold to purchase foreign imports, which is Rupee-negative. At the same time, higher inflation usually leads to the Reserve Bank of India (RBI) raising interest rates and this can be positive for the Rupee, due to increased demand from international investors. The opposite effect is true of lower inflation.
- NZD/USD turns lower for the third straight day and drops to over a two-month trough.
- Bets for an early RBNZ rate cut and China’s economic woes continue to weigh on the Kiwi.
- Dovish Fed expectations and US politics undermine the USD, lending support to the pair.
The NZD/USD pair attracts fresh sellers following an Asian session uptick to the 0.6025-0.6030 region and turns lower for the third successive day on Monday. This also marks the fifth day of a negative move in the previous six and drags spot prices to the lowest level since May 14 in the last hour, with bears now awaiting acceptance below the 0.6000 psychological mark before positioning for further losses.
The New Zealand Dollar (NZD) continues with its relative underperformance in the wake of bets that the Reserve Bank of New Zealand (RBNZ) will cut interest rates soon in the wake of the weaker CPI report released last week. Apart from this, worries about a slowdown in China – the world's second-largest economy – dents demand for antipodean currencies, including the Kiwi, and contributes to the offered tone surrounding the NZD/USD pair.
The US Dollar (USD), on the other hand, meets with a fresh supply on the first day of a new week in reaction to the US political development over the weekend and dovish Federal Reserve (Fed) expectations. In fact, US President Joe Biden's exit from the presidential race on Sunday prompts investors to unwind some trades betting on a Trump victory. Furthermore, the markets have fully priced in a Fed rate cut move at the September policy meeting.
Moreover, investors anticipate that the US central bank will lower borrowing costs two more times by year-end. This, in turn, keeps the US Dollar (USD) bulls on the defensive and helps limit the downside for the NZD/USD pair. In the absence of any relevant market-moving economic releases from the US, the mixed fundamental backdrop makes it prudent to wait for some follow-through selling before placing fresh bearish bets around the pair.
New Zealand Dollar FAQs
The New Zealand Dollar (NZD), also known as the Kiwi, is a well-known traded currency among investors. Its value is broadly determined by the health of the New Zealand economy and the country’s central bank policy. Still, there are some unique particularities that also can make NZD move. The performance of the Chinese economy tends to move the Kiwi because China is New Zealand’s biggest trading partner. Bad news for the Chinese economy likely means less New Zealand exports to the country, hitting the economy and thus its currency. Another factor moving NZD is dairy prices as the dairy industry is New Zealand’s main export. High dairy prices boost export income, contributing positively to the economy and thus to the NZD.
The Reserve Bank of New Zealand (RBNZ) aims to achieve and maintain an inflation rate between 1% and 3% over the medium term, with a focus to keep it near the 2% mid-point. To this end, the bank sets an appropriate level of interest rates. When inflation is too high, the RBNZ will increase interest rates to cool the economy, but the move will also make bond yields higher, increasing investors’ appeal to invest in the country and thus boosting NZD. On the contrary, lower interest rates tend to weaken NZD. The so-called rate differential, or how rates in New Zealand are or are expected to be compared to the ones set by the US Federal Reserve, can also play a key role in moving the NZD/USD pair.
Macroeconomic data releases in New Zealand are key to assess the state of the economy and can impact the New Zealand Dollar’s (NZD) valuation. A strong economy, based on high economic growth, low unemployment and high confidence is good for NZD. High economic growth attracts foreign investment and may encourage the Reserve Bank of New Zealand to increase interest rates, if this economic strength comes together with elevated inflation. Conversely, if economic data is weak, NZD is likely to depreciate.
The New Zealand Dollar (NZD) tends to strengthen during risk-on periods, or when investors perceive that broader market risks are low and are optimistic about growth. This tends to lead to a more favorable outlook for commodities and so-called ‘commodity currencies’ such as the Kiwi. Conversely, NZD tends to weaken at times of market turbulence or economic uncertainty as investors tend to sell higher-risk assets and flee to the more-stable safe havens.
| Raw materials | Closed | Change, % |
|---|---|---|
| Silver | 29.198 | -2.08 |
| Gold | 240.034 | -1.82 |
| Palladium | 906.77 | -2.54 |
- Gold price attracts some buyers and snaps a three-day losing streak amid modest USD weakness.
- The US political development prompts some unwinding of the ‘Trump trade’ and weighs on the buck.
- September Fed rate cut bets further undermine the USD and benefit the non-yielding XAU/USD.
Gold price (XAU/USD) gains some positive traction during the Asian session on Monday and for now, seems to have stalled a three-day-old corrective decline from the all-time peak touched last week. Against the backdrop of bets for an imminent start of the Federal Reserve's (Fed) rate-cutting cycle in September, the US political development over the weekend prompts fresh selling around the US Dollar (USD) and benefits the precious metal.
Apart from this, worries about the US-China trade battle, along with geopolitical risks stemming from the protracted Russia-Ukraine war and the ongoing conflicts in the Middle East, turn out to be another factor lending support to the safe-haven Gold price. The uptick, however, lacks bullish conviction as investors seem reluctant and prefer to wait for more insights about the Fed's policy path before positioning for the next leg of a directional move.
Daily Digest Market Movers: Gold price draws support from US politics, Fed rate cut bets and softer USD
- A combination of supporting factors assists the Gold price to attract some buyers on the first day of a new week and snap a three-day losing streak to sub-$2,400 levels, or a one-week low touched on Friday.
- The US Dollar comes under renewed selling pressure in reaction to US President Joe Biden's exit from the presidential race on Sunday, which prompts investors to unwind some trades betting on a Trump victory.
- Vice President Kamala Harris solidified her position as the leading Democratic candidate in the Presidential race, though former President Donald Trump still remains a favorite in the betting market.
- Market participants, meanwhile, have fully priced in a September interest rate cut by the Federal Reserve, which contributes to keeping the USD bulls on the defensive and lends support to the XAU/USD.
- That said, the underlying bullish tone across the global equity markets cap gains for the safe-haven commodity as traders look to the US Personal Consumption Expenditures (PCE) Price Index data on Friday.
- The crucial inflation data will influence expectations about the Fed's rate-cut path, which, in turn, will drive USD demand in the near term and provide a fresh directional impetus to the commodity.
- Furthermore, this week's release of flash PMIs should provide cues about the health of the global economy and provide some impetus to the metal, allowing traders to grab short-term opportunities.
Technical Analysis: Gold price needs to break below the $2,390-2,385 confluence for bears to seize control
From a technical perspective, last week's corrective slide from the all-time peak stalled ahead of the $2,390-2,385 horizontal support. The said area coincides with the 50% retracement level of the June-July rally and the 100-period Simple Moving Average (SMA) on the 4-hour chart, which, in turn, should now act as a key pivotal point for short-term traders. A convincing break below is likely to pave the way for deeper losses and drag the Gold price to 61.8% Fibo. level, around the $2,366-2,365 region, en route to the $2,352-2,350 zone. Some follow-through selling will expose the 78.6% Fibo. level, near the $2,334-2,334 area, before the XAU/USD eventually drops to the $2,300 mark.
On the flip side, any subsequent move up is likely to confront some resistance near the $2,417-2,418 zone, above which a bout of a short-covering has the potential to lift the Gold price to the $2,437-2,438 region. A sustained strength beyond the latter will be seen as a fresh trigger for bullish traders and set the stage for a move towards challenging the all-time peak, around the $2,482 area touched on July 17, with some intermediate resistance near the $2,458 region.
Gold FAQs
Gold has played a key role in human’s history as it has been widely used as a store of value and medium of exchange. Currently, apart from its shine and usage for jewelry, the precious metal is widely seen as a safe-haven asset, meaning that it is considered a good investment during turbulent times. Gold is also widely seen as a hedge against inflation and against depreciating currencies as it doesn’t rely on any specific issuer or government.
Central banks are the biggest Gold holders. In their aim to support their currencies in turbulent times, central banks tend to diversify their reserves and buy Gold to improve the perceived strength of the economy and the currency. High Gold reserves can be a source of trust for a country’s solvency. Central banks added 1,136 tonnes of Gold worth around $70 billion to their reserves in 2022, according to data from the World Gold Council. This is the highest yearly purchase since records began. Central banks from emerging economies such as China, India and Turkey are quickly increasing their Gold reserves.
Gold has an inverse correlation with the US Dollar and US Treasuries, which are both major reserve and safe-haven assets. When the Dollar depreciates, Gold tends to rise, enabling investors and central banks to diversify their assets in turbulent times. Gold is also inversely correlated with risk assets. A rally in the stock market tends to weaken Gold price, while sell-offs in riskier markets tend to favor the precious metal.
The price can move due to a wide range of factors. Geopolitical instability or fears of a deep recession can quickly make Gold price escalate due to its safe-haven status. As a yield-less asset, Gold tends to rise with lower interest rates, while higher cost of money usually weighs down on the yellow metal. Still, most moves depend on how the US Dollar (USD) behaves as the asset is priced in dollars (XAU/USD). A strong Dollar tends to keep the price of Gold controlled, whereas a weaker Dollar is likely to push Gold prices up.
- The Australian Dollar appreciates as the tight labor market raises concerns about a potential rate hike from the RBA.
- The PBoC has cut one- and five-year loan prime rates by 10 basis points to 3.35% and 3.85%, respectively.
- US President Joe Biden announced that he will not seek re-election against former President Donald Trump.
The Australian Dollar (AUD) halts its five-day losing streak on Monday. The AUD receives support as robust employment data indicate tight labor market conditions and raise concerns about a potential interest rate hike from the Reserve Bank of Australia (RBA). Investors look forward to Australian manufacturing and services PMI figures this week to gauge the health of the economy.
The People’s Bank of China (PBoC) has cut one- and five-year loan prime rates by 10 basis points to 3.35% and 3.85%, respectively. Any change in the Chinese economy could impact the Australian markets as both countries are close trade partners.
The decline of the US Dollar (USD) provides some support for the AUD/USD pair. The Greenback faces challenges as bets on a Federal Reserve (Fed) rate cut in September increase and concerns about the fragility of the US labor market persist. According to CME Group’s FedWatch Tool, markets now indicate a 91.7% probability of a 25-basis point rate cut at the September Fed meeting, up from 90.3% a week earlier.
According to Reuters, markets are adjusting to a new US electoral landscape after President Joe Biden's unexpected announcement on Sunday that he will no longer seek re-election against former President Donald Trump.
Daily Digest Market Movers: Australian Dollar improves due to hawkish mood surrounding RBA
- China's $715 billion hedge fund industry braces for increased pressure as new regulations take effect next month. These stricter guidelines will require funds to meet higher asset thresholds and more stringent rules for investments and marketing. As a result, some investment firms are now seeking additional capital, according to a Reuters report.
- Federal Reserve Bank of New York President John Williams stated on Friday that the long-term trends that caused declines in neutral interest rates before the pandemic continue to prevail. Williams noted, "My own Holston-Laubach-Williams estimates for r-star in the United States, Canada, and the Euro area are about the same level as they were before the pandemic," according to Bloomberg.
- Australian Bureau of Statistics on Thursday showed that Employment Change increased by 50,200 in June from May, surpassing market forecasts of 20,000, data showed on Thursday.
- Reuters cited Sean Langcake, head of macroeconomic forecasting for Oxford Economics Australia, saying, "The current pace of employment growth suggests demand is resilient and cost pressures will remain. We think the RBA will stay the course and keep rates on hold, but August is certainly a live meeting."
- Westpac's summary of a note on inflation in Australia and the RBA indicates that Australia is expected to follow the same broad disinflation trend as other countries, given that they face largely similar economic shocks.
- Fed Chair Powell stated last week that the three US inflation readings from this year "add somewhat to confidence" that inflation is on track to meet the Fed’s target sustainably, suggesting that a shift to interest rate cuts may be imminent.
Technical Analysis: Australian Dollar holds position below 0.6700
The Australian Dollar trades around 0.6690 on Monday. The daily chart analysis shows that the AUD/USD pair depreciates within a descending channel, signaling a bearish bias. Although the 14-day Relative Strength Index (RSI) is slightly below the 50 level, suggesting an emergence of a bearish trend.
The AUD/USD pair might test the lower boundary of the descending channel around the 0.6640 level. A decline below this level could pressure the pair to navigate the throwback support around 0.6590.
The immediate resistance appears at the psychological level of 0.6700, followed by the nine-day Exponential Moving Average (EMA) at 0.6715. A breakthrough above the latter could lead the AUD/USD pair to test the upper boundary of the descending channel around the 0.6740 level.
AUD/USD: Daily Chart
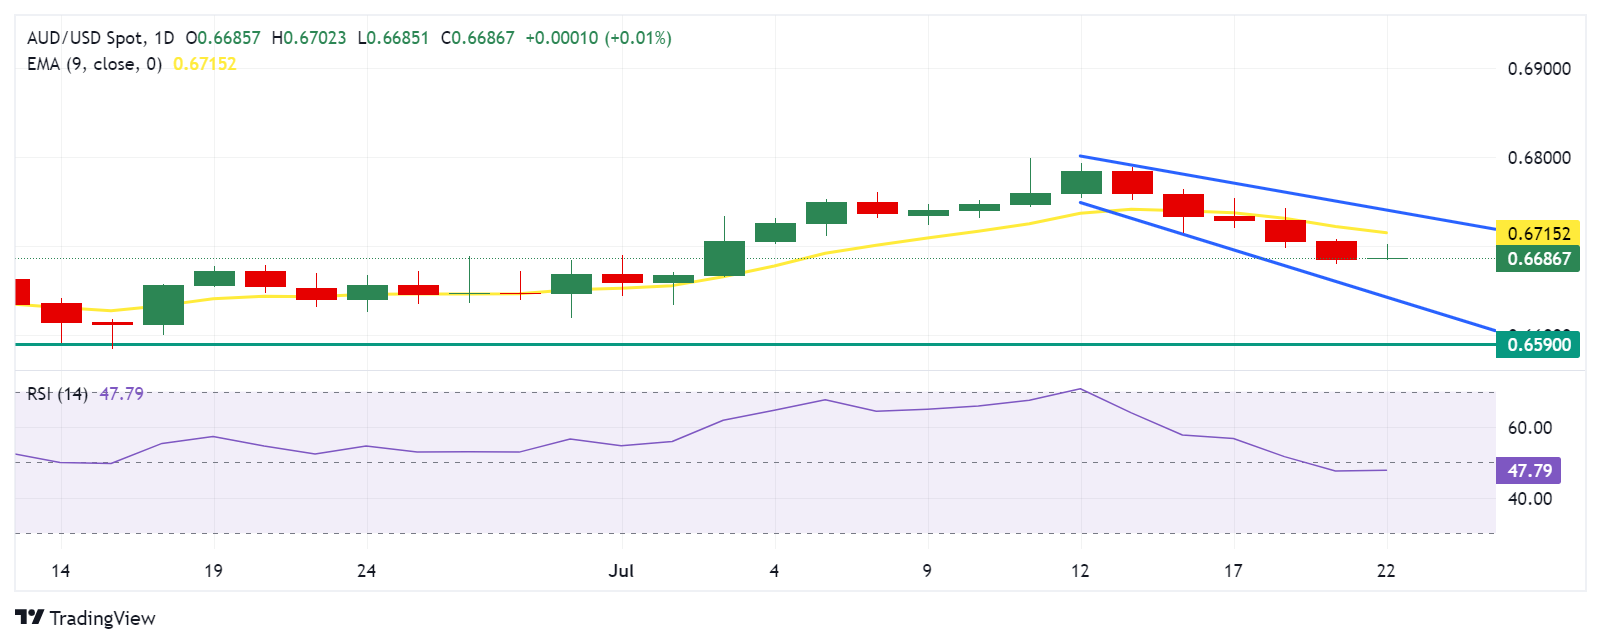
Australian Dollar PRICE Today
The table below shows the percentage change of Australian Dollar (AUD) against listed major currencies today. Australian Dollar was the strongest against the Japanese Yen.
| USD | EUR | GBP | JPY | CAD | AUD | NZD | CHF | |
|---|---|---|---|---|---|---|---|---|
| USD | -0.06% | -0.05% | 0.09% | 0.02% | 0.07% | 0.09% | 0.09% | |
| EUR | 0.06% | 0.00% | 0.15% | 0.07% | 0.18% | 0.13% | 0.09% | |
| GBP | 0.05% | -0.01% | 0.04% | 0.05% | 0.17% | 0.08% | 0.06% | |
| JPY | -0.09% | -0.15% | -0.04% | -0.05% | 0.04% | -0.05% | -0.08% | |
| CAD | -0.02% | -0.07% | -0.05% | 0.05% | 0.15% | 0.07% | 0.06% | |
| AUD | -0.07% | -0.18% | -0.17% | -0.04% | -0.15% | -0.08% | -0.10% | |
| NZD | -0.09% | -0.13% | -0.08% | 0.05% | -0.07% | 0.08% | 0.03% | |
| CHF | -0.09% | -0.09% | -0.06% | 0.08% | -0.06% | 0.10% | -0.03% |
The heat map shows percentage changes of major currencies against each other. The base currency is picked from the left column, while the quote currency is picked from the top row. For example, if you pick the Australian Dollar from the left column and move along the horizontal line to the US Dollar, the percentage change displayed in the box will represent AUD (base)/USD (quote).
Economic Indicator
PBoC Interest Rate Decision
The People’s Bank of China’s (PBoC) Monetary Policy Committee (MPC) holds scheduled meetings on a quarterly basis. However, China’s benchmark interest rate – the loan prime rate (LPR), a pricing reference for bank lending – is fixed every month. If the PBoC forecasts high inflation (hawkish) it raises interest rates, which is bullish for the Renminbi (CNY). Likewise, if the PBoC sees inflation in the Chinese economy falling (dovish) and cuts or keeps interest rates unchanged, it is bearish for CNY. Still, China’s currency doesn’t have a floating exchange rate determined by markets and its value against the US Dollar is fixed mainly by the PBoC on a daily basis.
Read more.Last release: Mon Jul 22, 2024 01:15
Frequency: Irregular
Actual: 3.35%
Consensus: 3.45%
Previous: 3.45%
Source: The People's Bank of China
On Monday, the People’s Bank of China (PBOC) set the USD/CNY central rate for the trading session ahead at 7.1335, as against the previous day's fix of 7.1315 and 7.2624 Reuters estimates.
The People's Bank of China (PBoC) announced on Monday that it cut the one-year Loan Prime Rate (LPR) by 10 basis points (bps) from 3.45% to 3.35% and cut the five-year LPR from 3.95% to 3.85%.
Furthermore, the PBoC announced to cut its interest rate for the 7-day reverse report to 1.7% from 1.8%. The rate cut will be effective immediately on Monday. Additionally, the Chinese central bank also eased medium-term lending facility (MLF) requirements.
Market reaction
At the time of writing, AUD/USD is holding higher ground near 0.6687, adding 0.02% on the day.
Australian Dollar FAQs
One of the most significant factors for the Australian Dollar (AUD) is the level of interest rates set by the Reserve Bank of Australia (RBA). Because Australia is a resource-rich country another key driver is the price of its biggest export, Iron Ore. The health of the Chinese economy, its largest trading partner, is a factor, as well as inflation in Australia, its growth rate and Trade Balance. Market sentiment – whether investors are taking on more risky assets (risk-on) or seeking safe-havens (risk-off) – is also a factor, with risk-on positive for AUD.
The Reserve Bank of Australia (RBA) influences the Australian Dollar (AUD) by setting the level of interest rates that Australian banks can lend to each other. This influences the level of interest rates in the economy as a whole. The main goal of the RBA is to maintain a stable inflation rate of 2-3% by adjusting interest rates up or down. Relatively high interest rates compared to other major central banks support the AUD, and the opposite for relatively low. The RBA can also use quantitative easing and tightening to influence credit conditions, with the former AUD-negative and the latter AUD-positive.
China is Australia’s largest trading partner so the health of the Chinese economy is a major influence on the value of the Australian Dollar (AUD). When the Chinese economy is doing well it purchases more raw materials, goods and services from Australia, lifting demand for the AUD, and pushing up its value. The opposite is the case when the Chinese economy is not growing as fast as expected. Positive or negative surprises in Chinese growth data, therefore, often have a direct impact on the Australian Dollar and its pairs.
Iron Ore is Australia’s largest export, accounting for $118 billion a year according to data from 2021, with China as its primary destination. The price of Iron Ore, therefore, can be a driver of the Australian Dollar. Generally, if the price of Iron Ore rises, AUD also goes up, as aggregate demand for the currency increases. The opposite is the case if the price of Iron Ore falls. Higher Iron Ore prices also tend to result in a greater likelihood of a positive Trade Balance for Australia, which is also positive of the AUD.
The Trade Balance, which is the difference between what a country earns from its exports versus what it pays for its imports, is another factor that can influence the value of the Australian Dollar. If Australia produces highly sought after exports, then its currency will gain in value purely from the surplus demand created from foreign buyers seeking to purchase its exports versus what it spends to purchase imports. Therefore, a positive net Trade Balance strengthens the AUD, with the opposite effect if the Trade Balance is negative.
- EUR/USD edges higher to 1.0895 in Monday’s early Asian session, up 0.12% on the day.
- Fed’s Williams said the US central bank was "getting us closer to a disinflationary trend that it’s looking for.
- The ECB left interest rates unchanged last week and gave no hints about rate cuts at its next meeting.
The EUR/USD pair gains ground near 1.0895 during the early Asian session on Monday. The decline of the US Dollar (USD) provides some support for the major pair. The German Retail Sales for May are due later in the day, followed by the US Chicago Fed National Activity Index for June.
The rising bets on the Federal Reserve (Fed) rate cut in September and the fragility of the US labor market exert some selling pressure on the Greenback. According to the CME FedWatch Tool, financial markets are now pricing in the probability of a move at its July meeting less than 5%, and pricing in a nearly full rate cut is firmly expected in September. New York Federal Reserve President John Williams said on Friday that an interest rate cut could be warranted in the coming months, but not at its July policy meeting.
On the Euro front, the European Central Bank (ECB) policy decision came as expected, with no change in the interest rates. The ECB President Christine Lagarde refrained from committing to a pre-defined rate-cut path. Lagarde said that while Eurozone inflation was on a “disinflationary track," the ECB would still need to keep rates high. The markets have priced in the odds for a September rate cut at 65%, down from 73% immediately before the decision. The data dependency approach from the ECB is likely to underpin the shared currency in the near term.
Euro FAQs
The Euro is the currency for the 20 European Union countries that belong to the Eurozone. It is the second most heavily traded currency in the world behind the US Dollar. In 2022, it accounted for 31% of all foreign exchange transactions, with an average daily turnover of over $2.2 trillion a day. EUR/USD is the most heavily traded currency pair in the world, accounting for an estimated 30% off all transactions, followed by EUR/JPY (4%), EUR/GBP (3%) and EUR/AUD (2%).
The European Central Bank (ECB) in Frankfurt, Germany, is the reserve bank for the Eurozone. The ECB sets interest rates and manages monetary policy. The ECB’s primary mandate is to maintain price stability, which means either controlling inflation or stimulating growth. Its primary tool is the raising or lowering of interest rates. Relatively high interest rates – or the expectation of higher rates – will usually benefit the Euro and vice versa. The ECB Governing Council makes monetary policy decisions at meetings held eight times a year. Decisions are made by heads of the Eurozone national banks and six permanent members, including the President of the ECB, Christine Lagarde.
Eurozone inflation data, measured by the Harmonized Index of Consumer Prices (HICP), is an important econometric for the Euro. If inflation rises more than expected, especially if above the ECB’s 2% target, it obliges the ECB to raise interest rates to bring it back under control. Relatively high interest rates compared to its counterparts will usually benefit the Euro, as it makes the region more attractive as a place for global investors to park their money.
Data releases gauge the health of the economy and can impact on the Euro. Indicators such as GDP, Manufacturing and Services PMIs, employment, and consumer sentiment surveys can all influence the direction of the single currency. A strong economy is good for the Euro. Not only does it attract more foreign investment but it may encourage the ECB to put up interest rates, which will directly strengthen the Euro. Otherwise, if economic data is weak, the Euro is likely to fall. Economic data for the four largest economies in the euro area (Germany, France, Italy and Spain) are especially significant, as they account for 75% of the Eurozone’s economy.
Another significant data release for the Euro is the Trade Balance. This indicator measures the difference between what a country earns from its exports and what it spends on imports over a given period. If a country produces highly sought after exports then its currency will gain in value purely from the extra demand created from foreign buyers seeking to purchase these goods. Therefore, a positive net Trade Balance strengthens a currency and vice versa for a negative balance.
- GBP/USD kicks off the new week on a positive note amid the emergence of some USD selling.
- September Fed rate cut bets, along with the US political development, weigh on the Greenback.
- Diminishing odds for an August rate cut by BoE support prospects for further gains for the GBP.
The GBP/USD pair attracts some buyers during the Asian session on Monday and for now, seems to have stalled its corrective slide from the 1.3045 area, or a one-year peak touched last week. Spot prices currently trade around the 1.2930 region, up over 0.10% for the day, though remain close to a one-week low set last Friday.
The US Dollar (USD) kicks off the new week on a weaker note in reaction to the US political development over the weekend and turns out to be a key factor lending some support to the GBP/USD pair. Following a long week of political turmoil, US President Joe Biden stepped down from the 2024 Presidential election. This, in turn, increases the chances of Donald Trump becoming the next US President, which, along with bets that the Federal Reserve (Fed) will cut interest rates in September, boosts investors' appetite for riskier assets and undermines the safe-haven Greenback.
The British Pound (GBP), on the other hand, continues to draw support from diminishing odds of an interest rate cut by the Bank of England (BoE) in August. In fact, BoE Chief Economist Huw Pill noted earlier this month that there is still some work to do before the domestic persistent component of inflation is gone. Adding to this, the UK consumer inflation rose slightly more than expected, by the 2% YoY rate in June. This comes on top of a better-than-expected GDP growth of 0.4% in May and forced investors to push back their expectations for an imminent rate cut.
Moving ahead, there isn't any relevant market-moving economic data due for release on Monday, either from the UK or the US, leaving the GBP/USD pair at the mercy of the USD price dynamics. Hence, the market focus will remain glued to the US political development, which will drive the broader risk sentiment and influence the buck. Nevertheless, the aforementioned fundamental backdrop seems tilted firmly in favor of bullish traders and supports prospects for a further intraday appreciating move for the currency pair.
Pound Sterling FAQs
The Pound Sterling (GBP) is the oldest currency in the world (886 AD) and the official currency of the United Kingdom. It is the fourth most traded unit for foreign exchange (FX) in the world, accounting for 12% of all transactions, averaging $630 billion a day, according to 2022 data. Its key trading pairs are GBP/USD, aka ‘Cable’, which accounts for 11% of FX, GBP/JPY, or the ‘Dragon’ as it is known by traders (3%), and EUR/GBP (2%). The Pound Sterling is issued by the Bank of England (BoE).
The single most important factor influencing the value of the Pound Sterling is monetary policy decided by the Bank of England. The BoE bases its decisions on whether it has achieved its primary goal of “price stability” – a steady inflation rate of around 2%. Its primary tool for achieving this is the adjustment of interest rates. When inflation is too high, the BoE will try to rein it in by raising interest rates, making it more expensive for people and businesses to access credit. This is generally positive for GBP, as higher interest rates make the UK a more attractive place for global investors to park their money. When inflation falls too low it is a sign economic growth is slowing. In this scenario, the BoE will consider lowering interest rates to cheapen credit so businesses will borrow more to invest in growth-generating projects.
Data releases gauge the health of the economy and can impact the value of the Pound Sterling. Indicators such as GDP, Manufacturing and Services PMIs, and employment can all influence the direction of the GBP. A strong economy is good for Sterling. Not only does it attract more foreign investment but it may encourage the BoE to put up interest rates, which will directly strengthen GBP. Otherwise, if economic data is weak, the Pound Sterling is likely to fall.
Another significant data release for the Pound Sterling is the Trade Balance. This indicator measures the difference between what a country earns from its exports and what it spends on imports over a given period. If a country produces highly sought-after exports, its currency will benefit purely from the extra demand created from foreign buyers seeking to purchase these goods. Therefore, a positive net Trade Balance strengthens a currency and vice versa for a negative balance.
| Index | Change, points | Closed | Change, % |
|---|---|---|---|
| NIKKEI 225 | -62.56 | 40063.79 | -0.16 |
| Hang Seng | -360.73 | 17417.68 | -2.03 |
| KOSPI | -28.89 | 2795.46 | -1.02 |
| ASX 200 | -64.9 | 7971.6 | -0.81 |
| DAX | -182.83 | 18171.93 | -1 |
| CAC 40 | -52.03 | 7534.52 | -0.69 |
| Dow Jones | -377.49 | 40287.53 | -0.93 |
| S&P 500 | -39.59 | 5505 | -0.71 |
| NASDAQ Composite | -144.28 | 17726.94 | -0.81 |
| Pare | Closed | Change, % |
|---|---|---|
| AUDUSD | 0.66838 | -0.33 |
| EURJPY | 171.405 | -0.01 |
| EURUSD | 1.08806 | -0.15 |
| GBPJPY | 203.371 | -0.12 |
| GBPUSD | 1.29108 | -0.25 |
| NZDUSD | 0.60076 | -0.61 |
| USDCAD | 1.37326 | 0.21 |
| USDCHF | 0.88882 | 0.16 |
| USDJPY | 157.517 | 0.14 |


© 2000-2026. Bản quyền Teletrade.
Trang web này được quản lý bởi Teletrade D.J. LLC 2351 LLC 2022 (Euro House, Richmond Hill Road, Kingstown, VC0100, St. Vincent and the Grenadines).
Thông tin trên trang web không phải là cơ sở để đưa ra quyết định đầu tư và chỉ được cung cấp cho mục đích làm quen.
Giao dịch trên thị trường tài chính (đặc biệt là giao dịch sử dụng các công cụ biên) mở ra những cơ hội lớn và tạo điều kiện cho các nhà đầu tư sẵn sàng mạo hiểm để thu lợi nhuận, tuy nhiên nó mang trong mình nguy cơ rủi ro khá cao. Chính vì vậy trước khi tiến hành giao dịch cần phải xem xét mọi mặt vấn đề chấp nhận tiến hành giao dịch cụ thể xét theo quan điểm của nguồn lực tài chính sẵn có và mức độ am hiểu thị trường tài chính.
Sử dụng thông tin: sử dụng toàn bộ hay riêng biệt các dữ liệu trên trang web của công ty TeleTrade như một nguồn cung cấp thông tin nhất định. Việc sử dụng tư liệu từ trang web cần kèm theo liên kết đến trang teletrade.vn. Việc tự động thu thập số liệu cũng như thông tin từ trang web TeleTrade đều không được phép.
Xin vui lòng liên hệ với pr@teletrade.global nếu có câu hỏi.
ngân hàng