- Phân tích
- Tin tức và các công cụ
- Tin tức thị trường
Tin tức thì trường
(raw materials / closing price /% change)
OIL 58.18 -0.31%
GOLD 1270.50 -0.01%
(index / closing price / change items /% change)
Nikkei -25.62 22866.10 -0.11
TOPIX +1.45 1822.61 +0.08
Hang Seng +132.97 29367.06 +0.45
CSI 300 +37.36 4067.85 +0.93
KOSPI -42.54 2429.83 -1.72
Euro Stoxx 50 +18.13 3570.78 +0.51
FTSE 100 +78.76 7603.98 +1.05
DAX +40.57 13109.74 +0.31
CAC 40 +33.20 5385.97 +0.62
DJIA +55.64 24782.29 +0.23
S&P 500 +5.32 2684.57 +0.20
NASDAQ +4.40 6965.36 +0.06
S&P/TSX +22.96 16182.63 +0.14
(pare/closed(GMT +3)/change, %)
EUR/USD $1,1865 -0,05%
GBP/USD $1,3382 +0,06%
USD/CHF Chf0,9883 +0,16%
USD/JPY Y113,34 -0,03%
EUR/JPY Y134,49 -0,08%
GBP/JPY Y151,65 0,00%
AUD/USD $0,7699 +0,44%
NZD/USD $0,7016 +0,05%
USD/CAD C$1,2737 -0,76%
07:00 Germany Gfk Consumer Confidence Survey January 10.7 10.8
07:45 France Consumer spending November -1.9% 1.5%
07:45 France GDP, q/q (Finally) Quarter III 0.6% 0.5%
08:00 Switzerland KOF Leading Indicator December 110.3 110.2
09:30 United Kingdom Current account, bln Quarter III -23.2 -21.2
09:30 United Kingdom Business Investment, y/y (Finally) Quarter III 2.5% 1.3%
09:30 United Kingdom Business Investment, q/q (Finally) Quarter III 0.5% 0.2%
09:30 United Kingdom GDP, y/y (Finally) Quarter III 1.5% 1.5%
09:30 United Kingdom GDP, q/q (Finally) Quarter III 0.3% 0.4%
13:30 Canada GDP (m/m) October 0.2% 0.2%
13:30 U.S. Durable goods orders ex defense November -0.8% 0.9%
13:30 U.S. Durable Goods Orders November -1.2% 2%
13:30 U.S. Durable Goods Orders ex Transportation November 0.4% 0.5%
13:30 U.S. PCE price index ex food, energy, Y/Y November 1.4% 1.5%
13:30 U.S. PCE price index ex food, energy, m/m November 0.2% 0.1%
13:30 U.S. Personal spending November 0.3% 0.5%
13:30 U.S. Personal Income, m/m November 0.4% 0.4%
15:00 U.S. New Home Sales November 0.685 0.654
15:00 U.S. Reuters/Michigan Consumer Sentiment Index (Finally) December 98.5 97.1
18:00 U.S. Baker Hughes Oil Rig Count December 747
The main indices of Wall Street have slightly increased, as investors expect a reduction in corporate tax rates, which will prompt companies to spend their additional capital on dividends, new projects and higher wages.
In addition, as it became known today, the US economy grew at the fastest pace for more than two years in the third quarter, relying on reliable business expenses, and is ready for what can be gained modestly in the coming year from drastic tax cuts taken Congress. The GDP grew by 3.2 percent year-on-year in the previous quarter, the Ministry of Commerce reported in its third GDP estimate. Although the estimate fell slightly from the 3.3 percent reported last month, it was the fastest rate since the first quarter of 2015 and was higher than the 3.1 percent increase in the second quarter. It also marked the first time since 2014 that the economy showed an increase of 3 percent or more for two consecutive quarters. But the growth rate for the period from July to September, probably, overestimate the health of the economy. Economists expected that GDP growth will be at the level of 3.3 percent.
Meanwhile, the Ministry of Labor stated that the number of Americans applying for unemployment benefits for the first time increased more than expected last week, but the main trend remained in line with the tightening of the labor market. Initial applications for state unemployment benefits increased by 20,000 to 245,000, seasonally adjusted for the week ending December 16. Data for the previous week were not revised. Since mid-October, applications have been limited to a range of 223,000 to 252,000. Economists expected that circulation would rise to 231,000.
Most components of the DOW index finished trading in positive territory (19 out of 30). The leader of growth was shares of Chevron Corporation (CVX, + 3.61%). Outsider were shares of Intel Corporation (INTC, -1.62%).
Almost all sectors of the S & P index recorded an increase. The raw materials sector grew most (+ 1.6%). The utilities sector showed the greatest decrease (-0.8%).
At closing:
DJIA + 0.22% 24.782.15 +55.50
Nasdaq + 0.06% 6.965.36 +4.40
S & P + 0.20% 2.684.58 +5.33
U.S. house prices rose in October, up 0.5 percent from the previous month, according to the Federal Housing Finance Agency (FHFA) seasonally adjusted monthly House Price Index (HPI). The previously reported 0.3 percent increase in September was revised upward to 0.5 percent. The FHFA monthly HPI is calculated using home sales price information from mortgages sold to, or guaranteed by, Fannie Mae and Freddie Mac. From October 2016 to October 2017, house prices were up 6.6 percent.
For the nine census divisions, seasonally adjusted monthly price changes from September 2017 to October 2017 ranged from -0.4 percent in the West North Central division to +2.8 percent in the East South Central division. The 12-month changes were all positive, ranging from +4.8 percent in the West North Central division to +8.7 percent in the Pacific division.
-
Change is for balance-sheet purposes only, has no implications for monetary policy
U.S. stock-index futures were slightly higher on Thursday as the Republican tax reform passed its final vote before going to President Donald Trump for his signature.
Global Stocks:
Nikkei 22,866.10 -25.62 -0.11%
Hang Seng 29,367.06 +132.97 +0.45%
Shanghai 3,300.68 +13.08 +0.40%
S&P/ASX 6,060.40 -15.20 -0.25%
FTSE 13,072.56 +3.39 +0.03%
CAC 5,351.45 -1.32 -0.02%
DAX 13,062.19 -6.98 -0.05%
Crude $57.78 (-0.53%)
Gold $1,268.90 (-0.06%)
Higher sales at new car dealers were the main contributor to the gain. Excluding sales at motor vehicle and parts dealers, retail sales increased 0.8%.
Sales were up in 7 of 11 subsectors, representing 79% of retail trade.
After removing the effects of price changes, retail sales in volume terms increased 1.4%.
Motor vehicle and parts dealers (+3.3%) recorded the largest gain in dollar terms across all subsectors. The increase was largely attributable to higher sales at new car dealers (+3.9%). Used car dealers (+1.7%) and automotive parts, accessories and tire stores (+1.2%) also posted higher sales. Sales at other motor vehicle dealers (-0.3%) were down for the third time in four months.
In the week ending December 16, the advance figure for seasonally adjusted initial claims was 245,000, an increase of 20,000 from the previous week's unrevised level of 225,000. The 4-week moving average was 236,000, an increase of 1,250 from the previous week's unrevised average of 234,750.
The Consumer Price Index (CPI) increased 2.1% on a year-over-year basis in November, following a 1.4% increase in October. The all-items excluding gasoline index rose 1.5% year over year in November after increasing 1.3% in October.
Prices were up in seven of the eight major CPI components in the 12 months to November, with the transportation and shelter indexes contributing the most to the increase. The clothing and footwear index declined on a year-over-year basis.
Transportation prices rose 5.9% on a year-over-year basis in November, following a 3.0% increase in October. Gasoline prices contributed the most to this acceleration, rising 19.6% year over year in November, after increasing 6.5% the previous month. The increase was partly attributable to higher crude oil prices in November, as well as a monthly decline one year earlier. The purchase of passenger vehicles index also accelerated to 3.6% on a year-over-year basis in November, following a 1.9% rise in October. The November increase was partly attributable to the greater availability of new 2018 model year vehicles.
Real gross domestic product (GDP) increased at an annual rate of 3.2 percent in the third quarter of 2017, according to the "third" estimate released by the Bureau of Economic Analysis. In the second quarter, real GDP increased 3.1 percent.
In the second estimate, the increase in real GDP was 3.3 percent. With this third estimate for the third quarter, personal consumption expenditures increased less than previously estimated, but the general picture of economic growth remains the same.
Real gross domestic income (GDI) increased 2.0 percent in the third quarter, compared with an increase of 2.3 percent in the second. The average of real GDP and real GDI, a supplemental measure of U.S. economic activity that equally weights GDP and GDI, increased 2.6 percent in the third quarter, compared with an increase of 2.7 percent in the second quarter
(company / ticker / price / change ($/%) / volume)
| ALCOA INC. | AA | 49.3 | 0.04(0.08%) | 1224 |
| Amazon.com Inc., NASDAQ | AMZN | 1,177.50 | -0.12(-0.01%) | 13986 |
| Apple Inc. | AAPL | 174.5 | 0.15(0.09%) | 51152 |
| AT&T Inc | T | 38.73 | 0.18(0.47%) | 24896 |
| Boeing Co | BA | 298.41 | 0.51(0.17%) | 4255 |
| Caterpillar Inc | CAT | 153.09 | 0.57(0.37%) | 4257 |
| Chevron Corp | CVX | 121.5 | 0.61(0.50%) | 1017 |
| Cisco Systems Inc | CSCO | 38.86 | 0.12(0.31%) | 5364 |
| Citigroup Inc., NYSE | C | 74.79 | 0.13(0.17%) | 35075 |
| Exxon Mobil Corp | XOM | 83 | 0.13(0.16%) | 1673 |
| Facebook, Inc. | FB | 177.85 | -0.04(-0.02%) | 17321 |
| FedEx Corporation, NYSE | FDX | 253.2 | 2.13(0.85%) | 4304 |
| Freeport-McMoRan Copper & Gold Inc., NYSE | FCX | 17.84 | 0.18(1.02%) | 42197 |
| General Electric Co | GE | 17.47 | 0.02(0.11%) | 62028 |
| Goldman Sachs | GS | 255.97 | 0.79(0.31%) | 2305 |
| Google Inc. | GOOG | 1,065.00 | 0.05(0.00%) | 362 |
| Home Depot Inc | HD | 187.95 | 0.64(0.34%) | 2766 |
| Intel Corp | INTC | 47.57 | 0.01(0.02%) | 20826 |
| JPMorgan Chase and Co | JPM | 106.45 | 0.31(0.29%) | 20688 |
| Merck & Co Inc | MRK | 55.99 | -0.12(-0.21%) | 2793 |
| Microsoft Corp | MSFT | 85.68 | 0.16(0.19%) | 6910 |
| Nike | NKE | 63.8 | 0.21(0.33%) | 11615 |
| Pfizer Inc | PFE | 36.63 | 0.17(0.47%) | 1415 |
| Procter & Gamble Co | PG | 91.4 | -0.13(-0.14%) | 935 |
| Tesla Motors, Inc., NASDAQ | TSLA | 329.5 | 0.52(0.16%) | 7385 |
| Twitter, Inc., NYSE | TWTR | 25.1 | -0.10(-0.40%) | 48807 |
| Verizon Communications Inc | VZ | 53 | 0.23(0.44%) | 459 |
| Visa | V | 112.55 | 0.43(0.38%) | 726 |
| Wal-Mart Stores Inc | WMT | 99 | 0.25(0.25%) | 541 |
| Walt Disney Co | DIS | 109.77 | 0.08(0.07%) | 6075 |
| Yandex N.V., NASDAQ | YNDX | 31.85 | -0.16(-0.50%) | 2064 |
Chevron (CVX) target raised to $160 at Cowen
Caterpillar (CAT) target raised to $160 from $145 at Citigroup
Exxon Mobil (XOM) upgraded to Focus Stock at Scotia Howard Weil
JPMorgan Chase (JPM) upgraded to Buy from Neutral at Buckingham Research
On daily time frame chart, we can see that the price is stuck in a consolidation zone.
We also can see that the price didn't respect the candlestick pattern.
However, if it keeps rejects the top of the consolidation then it can be possible to see the price falling to the bottom of the consolidation.

Public sector net borrowing (excluding public sector banks) decreased by £3.1 billion to £48.1 billion in the current financial year-to-date (April 2017 to November 2017), compared with the same period in 2016; this is the lowest year-to-date net borrowing since 2007.
Public sector net borrowing (excluding public sector banks) decreased by £0.2 billion to £8.7 billion in November 2017, compared with November 2016; this is the lowest November net borrowing since 2007.
The Office for Budget Responsibility (OBR) forecast that public sector net borrowing (excluding public sector banks) will be £49.9 billion during the financial year ending March 2018, an increase of £4.4 billion on the outturn net borrowing in the financial year ending March 2017.
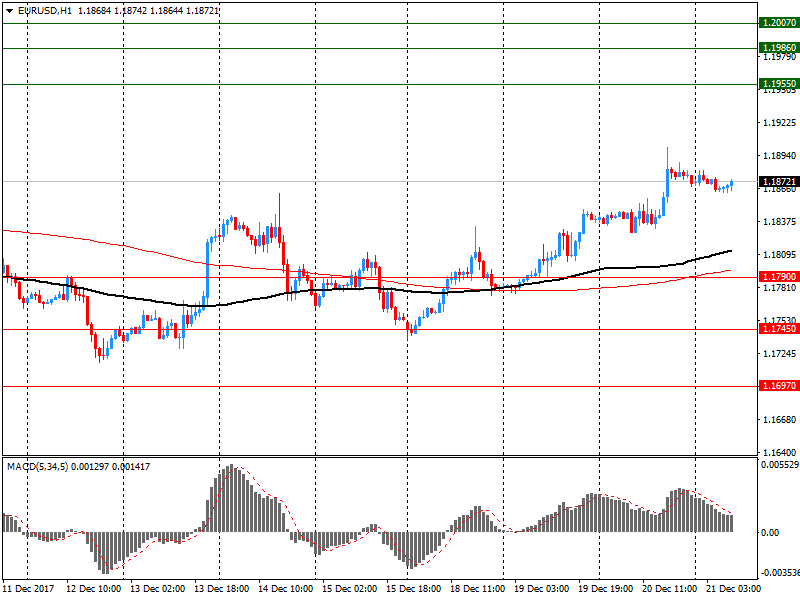
EUR/USD
Resistance levels (open interest**, contracts)
$1.2007 (3476)
$1.1986 (3744)
$1.1955 (616)
Price at time of writing this review: $1.1872
Support levels (open interest**, contracts):
$1.1790 (4781)
$1.1745 (3565)
$1.1697 (3931)
Comments:
- Overall open interest on the CALL options and PUT options with the expiration date January, 5 is 93791 contracts (according to data from December, 20) with the maximum number of contracts with strike price $1,2200 (5579);
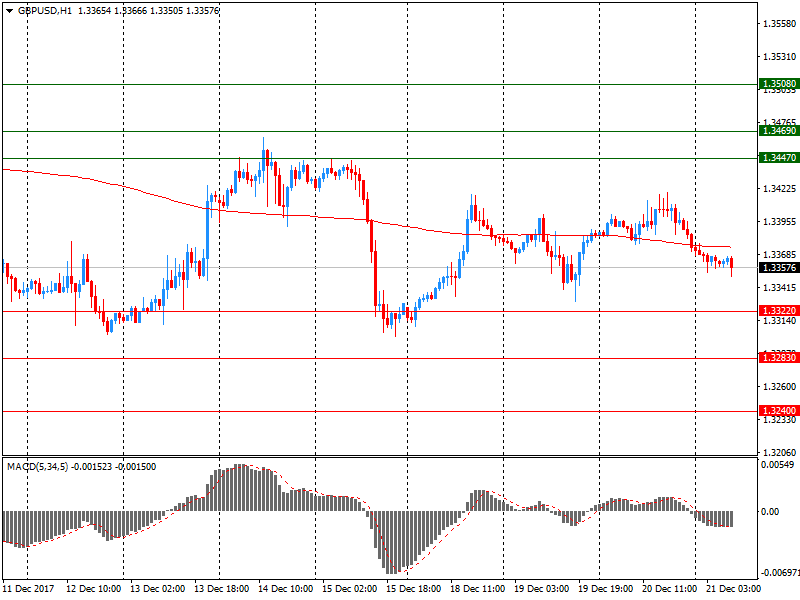
GBP/USD
Resistance levels (open interest**, contracts)
$1.3508 (2616)
$1.3469 (1586)
$1.3447 (859)
Price at time of writing this review: $1.3358
Support levels (open interest**, contracts):
$1.3322 (1842)
$1.3283 (2726)
$1.3240 (2768)
Comments:
- Overall open interest on the CALL options with the expiration date January, 5 is 31665 contracts, with the maximum number of contracts with strike price $1,3500 (4167);
- Overall open interest on the PUT options with the expiration date January, 5 is 33343 contracts, with the maximum number of contracts with strike price $1,3250 (2768);
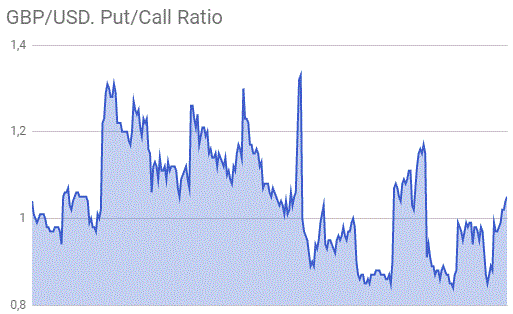
- The ratio of PUT/CALL was 1.05 versus 1.04 from the previous trading day according to data from December, 20
* - The Chicago Mercantile Exchange bulletin (CME) is used for the calculation.
** - Open interest takes into account the total number of option contracts that are open at the moment.
-
Bitcoin is now an instrument of speculative interest
-
Maintains 10-year jgb yield target around zero pct
-
Short-term interest rate target at -0.1 pct
-
Consumption increasing moderately
-
Raises assessment on capital expenditure
Foreign trade developed dynamically in November 2017. Within a year, exports rose by 9.5 per cent on a working day adjusted basis, while imports even grew by 16.4 per cent. Higher prices of goods played an important role here: real exports rose by 4.4 percent and imports by 6.8 percent. The trade balance closed with a surplus of 2.7 billion francs. Compared to the same month last year, exports increased by 9.5 on a working day adjusted basis Percent (real: + 4.4 percent). Relative to October 2017, exports decreased seasonally adjusted by 1.5 percent.
European stock markets dropped for a second straight day on Wednesday, with some preholiday selling taking place as the U.S. made a huge leap forward in approving highly anticipated tax reform.
Stock-market indexes closed marginally lower on Wednesday, with the Dow and S&P 500 retreating from record levels for a second session, as congressional Republicans sent tax-cut legislation to President Donald Trump for his signature. The small declines by major indexes belied bullish market breadth, however. Exchange data showed advancers outnumbered decliners on the NYSE and Nasdaq.
Asian markets offered a muted reaction on Thursday to the passage of US tax cuts as benefits to company bottom lines were already baked into stock prices, while bonds were spooked by the blowout in government debt needed to fund the giveaways.
© 2000-2026. Bản quyền Teletrade.
Trang web này được quản lý bởi Teletrade D.J. LLC 2351 LLC 2022 (Euro House, Richmond Hill Road, Kingstown, VC0100, St. Vincent and the Grenadines).
Thông tin trên trang web không phải là cơ sở để đưa ra quyết định đầu tư và chỉ được cung cấp cho mục đích làm quen.
Giao dịch trên thị trường tài chính (đặc biệt là giao dịch sử dụng các công cụ biên) mở ra những cơ hội lớn và tạo điều kiện cho các nhà đầu tư sẵn sàng mạo hiểm để thu lợi nhuận, tuy nhiên nó mang trong mình nguy cơ rủi ro khá cao. Chính vì vậy trước khi tiến hành giao dịch cần phải xem xét mọi mặt vấn đề chấp nhận tiến hành giao dịch cụ thể xét theo quan điểm của nguồn lực tài chính sẵn có và mức độ am hiểu thị trường tài chính.
Sử dụng thông tin: sử dụng toàn bộ hay riêng biệt các dữ liệu trên trang web của công ty TeleTrade như một nguồn cung cấp thông tin nhất định. Việc sử dụng tư liệu từ trang web cần kèm theo liên kết đến trang teletrade.vn. Việc tự động thu thập số liệu cũng như thông tin từ trang web TeleTrade đều không được phép.
Xin vui lòng liên hệ với pr@teletrade.global nếu có câu hỏi.


