- Phân tích
- Tin tức và các công cụ
- Tin tức thị trường
Tin tức thì trường
(raw materials / closing price /% change)
Oil 58.02 -0.12%
Gold 1269.40 -0.02%
(index / closing price / change items /% change)
Nikkei +23.72 22891.72 +0.10%
TOPIX +5.98 1821.16 +0.33%
Hang Seng -19.57 29234.09 -0.07%
CSI 300 -4.84 4030.49 -0.12%
Euro Stoxx 50 -29.57 3552.65 -0.83%
FTSE 100 -18.87 7525.22 -0.25%
DAX -146.62 13069.17 -1.11%
CAC 40 -30.14 5352.77 -0.56%
DJIA -28.10 24726.65 -0.11%
S&P 500 -2.22 2679.25 -0.08%
NASDAQ -2.89 6960.96 -0.04%
S&P/TSX +26.32 16159.67 +0.16%
(pare/closed(GMT +3)/change, %)
EUR/USD $1,1871 +0,26%
GBP/USD $1,3375 -0,07%
USD/CHF Chf0,98672 +0,19%
USD/JPY Y113,38 +0,44%
EUR/JPY Y134,59 +0,70%
GBP/JPY Y151,649 +0,37%
AUD/USD $0,7665 +0,05%
NZD/USD $0,7012 +0,57%
USD/CAD C$1,28341 -0,34%
00:30 Australia RBA Bulletin
03:00 Japan BoJ Interest Rate Decision -0.1% -0.1%
03:00 Japan BoJ Monetary Policy Statement
06:30 Japan BOJ Press Conference
07:00 Switzerland Trade Balance November 2.333 2.877
09:30 United Kingdom PSNB, bln November -7.46
13:30 Canada Retail Sales YoY October 6.2%
13:30 Canada Retail Sales, m/m October 0.1% 0%
13:30 Canada Consumer price index, y/y November 1.4% 1.3%
13:30 Canada Consumer Price Index m / m November 0.1% 0%
13:30 Canada Bank of Canada Consumer Price Index Core, y/y November 0.9% 0.8%
13:30 Canada Retail Sales ex Autos, m/m October 0.3% 0%
13:30 U.S. Continuing Jobless Claims December 1886 1928
13:30 U.S. PCE price index ex food, energy, q/q (Finally) Quarter III 0.9% 1.4%
13:30 U.S. Initial Jobless Claims December 225 241
13:30 U.S. Philadelphia Fed Manufacturing Survey December 22.7 23.0
13:30 U.S. Chicago Federal National Activity Index November 0.65 0.09
13:30 U.S. GDP, q/q (Finally) Quarter III 3.1% 3.3%
14:00 U.S. Housing Price Index, m/m October 0.3% 0.2%
15:00 Eurozone Consumer Confidence (Preliminary) December 0.1 0.0
15:00 U.S. Leading Indicators November 1.2% 0.4%
Major US stock markets closed below zero, as investors were waiting for news about the fate of the long-awaited tax bill
According to the latest information, the House of Representatives and the Senate passed a tax bill in the United States. For the adoption of the tax bill in the US Congress, 224 votes were given, against - 201 votes. The tax bill provides for tax cuts totaling $ 1.5 trillion in the next 10 years
Investors also analyzed data on the United States. The National Association of Realtors said that home sales in the secondary market rose for the third consecutive month in November and reached the highest rates in the last 11 years. In all major regions, except for the West, there was a significant increase in sales activity. Total secondary home sales, which are completed transactions, including single-family homes, urban homes, condominiums and cooperatives, jumped 5.6%, seasonally adjusted to 5.81 million in November from 5.50 million in October. After last month's growth, sales rose 3.8% compared to the same period last year, and they reached the highest levels since December 2006 (6.42 million).
Quotes of oil rose by about 1%, supported by the continued downtime of the Forties oil pipeline in the North Sea, as well as by statistics on oil reserves in the US. The Energy Ministry reported that oil reserves fell sharply last week, which was caused by an increase in the workload of oil refineries. In the week of December 9-15, oil reserves fell by 6.495 million barrels, to 436.491 million barrels. Analysts had expected a decline of 3.769 million barrels.
Most components of the DOW index finished trading in the red (19 out of 30). Outsider were shares of The Walt Disney Company (DIS, -1.65%). The leader of growth were the shares of Cisco Systems, Inc. (CSCO, + 1.20%).
Most sectors of the S & P index recorded a decline. The largest drop was shown by the utilities sector (-0.4%). The conglomerate sector grew most (+ 1.2%).
At closing:
DJIA -0.11% 24,726.65 -28.10
Nasdaq -0.04% 6,960.96 -2.89
S & P -0.08% 2,679.25 -2.22
U.S. commercial crude oil inventories (excluding those in the Strategic Petroleum Reserve) decreased by 6.5 million barrels from the previous week. At 436.5 million barrels, U.S. crude oil inventories are in the middle of the average range for this time of year.
Total motor gasoline inventories increased by 1.2 million barrels last week, and are near the upper limit of the average range. Finished gasoline inventories decreased while blending components inventories increased last week.
Distillate fuel inventories increased by 0.8 million barrels last week but are in the lower half of the average range for this time of year. Propane/propylene inventories decreased by 3.3 million barrels last week, and are in the middle of the average range. Total commercial petroleum inventories decreased by 14.2 million barrels last week.
Existing-home sales surged for the third straight month in November and reached their strongest pace in almost 11 years, according to the National Association of Realtors. All major regions except for the West saw a significant hike in sales activity last month.
Total existing-home sales, which are completed transactions that include single-family homes, townhomes, condominiums and co-ops, jumped 5.6 percent2 to a seasonally adjusted annual rate of 5.81 million in November from an upwardly revised 5.50 million in October. After last month's increase, sales are 3.8 percent higher than a year ago and are at their strongest pace since December 2006 (6.42 million).
U.S. stock-index futures were higher on Wednesday after the U.S. Senate approved the tax-reform bill in a 51-48 party line vote, taking President Donald Trump closer to his first major legislative victory.
Global Stocks:
Nikkei 22,891.72 +23.72 +0.10%
Hang Seng 29,234.09 -19.57 -0.07%
Shanghai 3,287.61 -8.93 -0.27%
S&P/ASX 6,075.60 +3.80 +0.06%
FTSE 7,545.34 +1.25 +0.02%
CAC 5,369.72 -13.19 -0.25%
DAX 13,178.99 -36.80 -0.28%
Crude $57.85 (+0.50%)
Gold $1,269.00 (+0.38%)
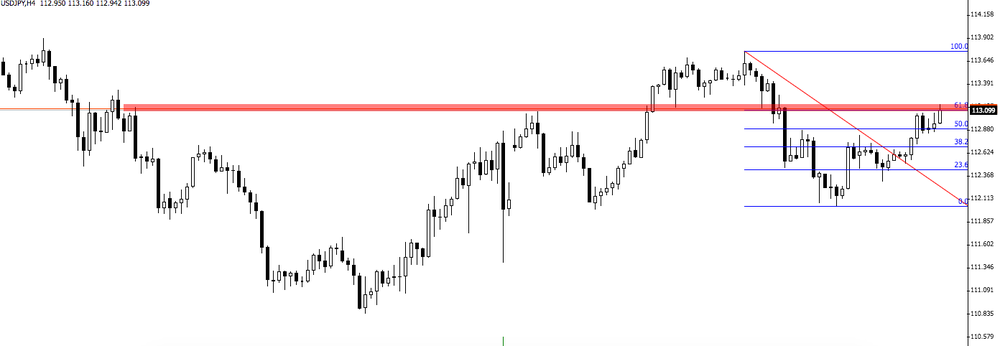
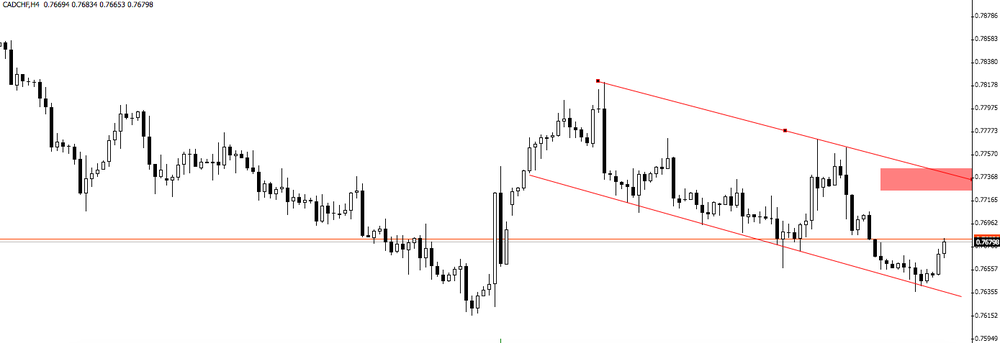
AUD/CAD is showing a potential to start a new bullish movement.
We can see that the price is rejecting the bottom of the downside channel which can be an opportunity to go long, at least, to the top of this channel.
EUR/USD: 1.1770 (EUR 478m), 1.1800-10 (1.5bn), 1.1820-25 (364m), 1.1880 (250m), 1.1900 (323m), 1.1940-50 (331m)
USD/JPY: 112.00 (USD 601m), 112.60 (650m), 113.00 (612m), 113.25-30 (890m), 113.50 (591m), 113.75-80 (380m), 114.00 (525m), 114.25 (300m)
GBP/USD: 1.3445-50 (GBP 226m), 1.3500 (204m)
USD/CHF: 0.9850 (USD 120m), 0.9895-00 (291m), 0.9950 (830m)
USD/CAD: 1.2750 (USD 297m), 1.2875 (160m), 1.2955-60 (601m), 1.3000 (2.5bn)
AUD/USD: 0.7595 (AUD 300m), 0.7700 (206m)
EUR/GBP: 0.8800 (EUR 529m), 0.9000 (809m)
(company / ticker / price / change ($/%) / volume)
| 3M Co | MMM | 238.87 | 0.48(0.20%) | 454 |
| ALCOA INC. | AA | 47.95 | 1.43(3.07%) | 4773 |
| ALTRIA GROUP INC. | MO | 73.14 | -0.10(-0.14%) | 18731 |
| Amazon.com Inc., NASDAQ | AMZN | 1,191.84 | 4.46(0.38%) | 9680 |
| Apple Inc. | AAPL | 175.04 | 0.50(0.29%) | 112083 |
| AT&T Inc | T | 38.31 | 0.26(0.68%) | 5406 |
| Barrick Gold Corporation, NYSE | ABX | 14.36 | 0.11(0.77%) | 24028 |
| Boeing Co | BA | 298.75 | 1.50(0.50%) | 4478 |
| Caterpillar Inc | CAT | 151.83 | 0.92(0.61%) | 10167 |
| Cisco Systems Inc | CSCO | 38.55 | 0.25(0.65%) | 1650 |
| Citigroup Inc., NYSE | C | 75.5 | 0.80(1.07%) | 936922 |
| Facebook, Inc. | FB | 180.27 | 0.76(0.42%) | 44375 |
| FedEx Corporation, NYSE | FDX | 247.2 | 4.66(1.92%) | 28391 |
| Ford Motor Co. | F | 12.75 | 0.06(0.47%) | 23611 |
| Freeport-McMoRan Copper & Gold Inc., NYSE | FCX | 17.52 | 0.19(1.10%) | 39926 |
| General Electric Co | GE | 17.65 | 0.06(0.34%) | 100010 |
| General Motors Company, NYSE | GM | 42.7 | 0.21(0.49%) | 1765 |
| Google Inc. | GOOG | 1,074.00 | 3.32(0.31%) | 1042 |
| Home Depot Inc | HD | 187.24 | 1.26(0.68%) | 2181 |
| Intel Corp | INTC | 47.7 | 0.66(1.40%) | 225553 |
| Johnson & Johnson | JNJ | 142 | 0.22(0.16%) | 359 |
| JPMorgan Chase and Co | JPM | 107.5 | 0.99(0.93%) | 25776 |
| McDonald's Corp | MCD | 174.23 | 0.84(0.48%) | 1279 |
| Microsoft Corp | MSFT | 86.44 | 0.61(0.71%) | 17042 |
| Nike | NKE | 64.64 | 0.40(0.62%) | 787 |
| Pfizer Inc | PFE | 37.09 | 0.15(0.41%) | 500 |
| Procter & Gamble Co | PG | 92 | 0.32(0.35%) | 2930 |
| Starbucks Corporation, NASDAQ | SBUX | 58.16 | 0.15(0.26%) | 369 |
| Tesla Motors, Inc., NASDAQ | TSLA | 333.4 | 2.30(0.69%) | 20690 |
| The Coca-Cola Co | KO | 46.16 | 0.03(0.07%) | 512 |
| Twitter, Inc., NYSE | TWTR | 25.36 | 0.28(1.12%) | 133747 |
| Verizon Communications Inc | VZ | 53.2 | 0.37(0.70%) | 598 |
| Visa | V | 112.75 | 0.61(0.54%) | 2286 |
| Wal-Mart Stores Inc | WMT | 99.04 | 0.24(0.24%) | 7244 |
| Walt Disney Co | DIS | 111.51 | -0.30(-0.27%) | 3769 |
| Yandex N.V., NASDAQ | YNDX | 31.85 | -0.41(-1.27%) | 2600 |
Twitter (TWTR) target raised to $30 from $25 at Argus
Alcoa (AA) upgraded to Outperform from Neutral at Credit Suisse
Wholesale sales increased 1.5% to $63.0 billion in October, more than offsetting the 1.1% decline in September. Gains were reported in six of seven subsectors, together representing 81% of total wholesale sales. The machinery, equipment and supplies and the personal and household goods subsectors contributed the most to the increase.
In volume terms, wholesale sales were up 1.2%.
In dollar terms, the machinery, equipment and supplies subsector reported the largest increase in October, as sales rose 5.2% to $12.7 billion. Sales were up in all four industries, led by the farm, lawn and garden machinery and equipment industry (+19.0%) following a 9.7% decline in September.
FedEx (FDX) reported Q2 FY 2018 earnings of $3.18 per share (versus $2.80 in Q2 FY 2017), beating analysts' consensus estimate of $2.88.
The company's quarterly revenues amounted to $16.300 bln (+9.4% y/y), beating analysts' consensus estimate of $15.670 bln.
The company also issued upside guidance for FY 2018, projecting EPS of $12.70-13.30 versus analysts' consensus estimate of $12.46.
FDX rose to $247.42 (+2.01%) in pre-market trading.
Retail sales rose in the year to December, building further on November's solid performance, according to the latest monthly CBI Distributive Trades Survey.
The survey of 109 firms, of which 56 were retailers, showed that in the year to December, retail sales and orders continued to rise, although both disappointed expectations of somewhat stronger growth.\
Overall, sales for the time of year were considered to be in line with seasonal norms. Growth in online sales remained reasonably firm in the year to December, at a pace just below the long-run average (indicating that the internet sales of Black Friday and Cyber Monday were unspectacular), and is expected to slow further in the year to January.
EUR/USD: 1.1770 (478m), 1.1800-10 (1.5b), 1.1820-25 (364m), 1.1880 (250m), 1.1900 (323m), 1.1940-50 (331m)
USD/JPY: 112.00 (601m), 112.60 (650m), 113.00 (612m), 113.25-30 (890m), 113.50 (591m), 113.75-80 (380m), 114.00 (525m), 114.25 (300m)
GBP/USD: 1.3445-50 (226m), 1.3500 (204m)
USD/CHF: 0.9850 (120m), 0.9895-00 (291m), 0.9950 (830m)
USD/CAD: 1.2750 (297m), 1.2875 (160m), 1.2955-60 (601m), 1.3000 (2.5b)
AUD/USD: 0.7595 (300m), 0.7700 (206m)
EUR/GBP: 0.8800 (529m), 0.9000 (809m)
-
Deputy governors Martin Flodén and Henry Ohlsson entered reservations against decision to begin reinvesting in january 2018 bonds that mature in 2019
-
Executive board has also decided to begin reinvesting in january 2018 bonds that mature in 2019
-
Sees repo rate averaging -0.27 pct in q4, 2018 vs pvs forecast -0.27 pct
-
Economic prospects and outlook for inflation in Sweden are largely unchanged from october
-
Important that krona does not appreciate too quickly
This reflected surpluses for goods (€26.2 billion), primary income (€9.8 billion) and services (€7.3 billion), which were partly offset by a deficit for secondary income (€12.5 billion).
The 12-month cumulated current account for the period ending in October 2017 recorded a surplus of €349.6 billion (3.2% of euro area GDP), compared with one of €363.4 billion (3.4% of euro area GDP) for the 12 months to October 2016. This development was due to a decrease in the surplus for goods (from €373.7 billion to €340.4 billion) and an increase in the deficit for secondary income (from €137.9 billion to €150.6 billion). These were partly offset by increases in the surpluses for services (from €48.4 billion to €66.2 billion) and primary income (from €79.1 billion to €93.6 billion).
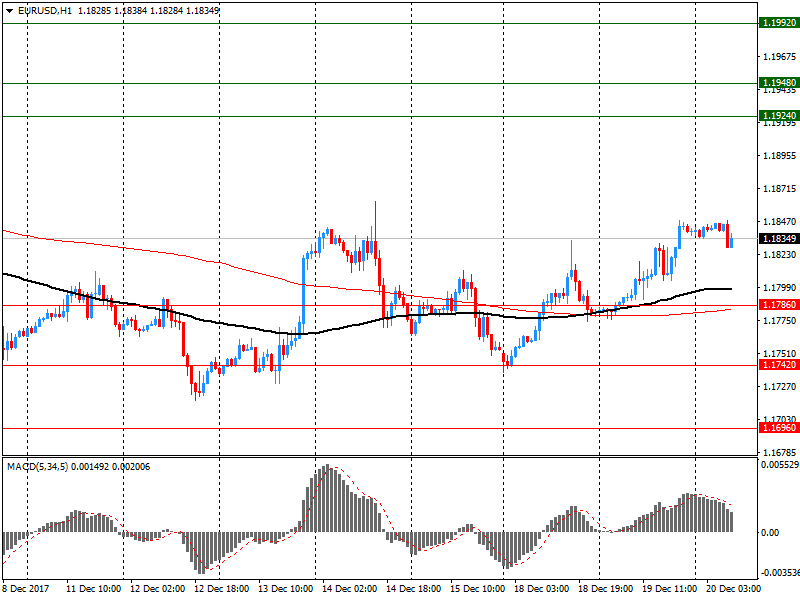
EUR/USD
Resistance levels (open interest**, contracts)
$1.1992 (3302)
$1.1948 (4104)
$1.1924 (616)
Price at time of writing this review: $1.1835
Support levels (open interest**, contracts):
$1.1786 (4828)
$1.1742 (3583)
$1.1696 (4051)
Comments:
- Overall open interest on the CALL options and PUT options with the expiration date January, 5 is 94002 contracts (according to data from December, 19) with the maximum number of contracts with strike price $1,2200 (5574);
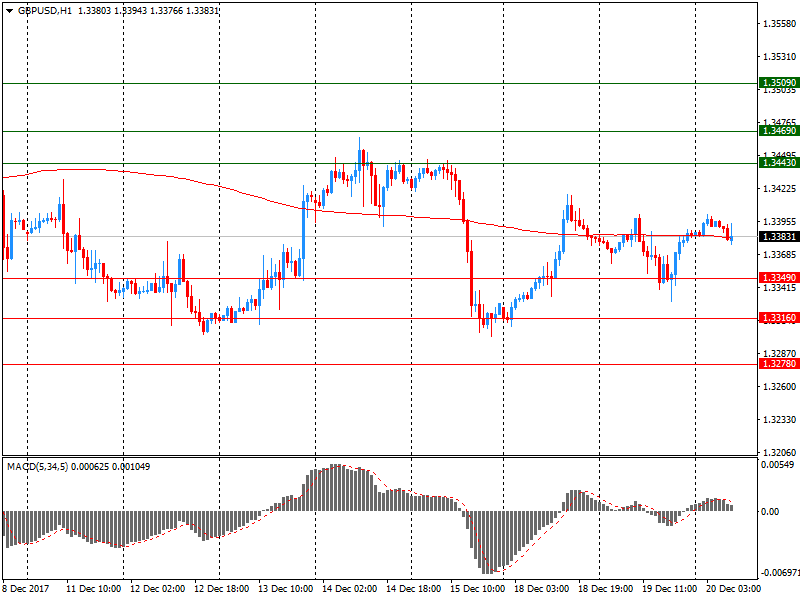
GBP/USD
Resistance levels (open interest**, contracts)
$1.3509 (2647)
$1.3469 (1586)
$1.3443 (859)
Price at time of writing this review: $1.3383
Support levels (open interest**, contracts):
$1.3349 (2253)
$1.3316 (1865)
$1.3278 (2712)
Comments:
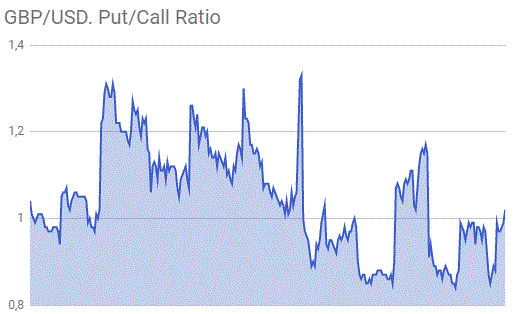
- Overall open interest on the CALL options with the expiration date January, 5 is 31618 contracts, with the maximum number of contracts with strike price $1,3500 (4136);
- Overall open interest on the PUT options with the expiration date January, 5 is 32925 contracts, with the maximum number of contracts with strike price $1,3300 (2712);
- The ratio of PUT/CALL was 1.04 versus 1.02 from the previous trading day according to data from December, 19
* - The Chicago Mercantile Exchange bulletin (CME) is used for the calculation.
** - Open interest takes into account the total number of option contracts that are open at the moment.
New Zealand's seasonally adjusted current account deficit for the September 2017 quarter narrowed to $1.3 billion, Stats NZ said today. This is $183 million smaller than the June quarter's deficit and was driven by a fall in imported good.
The shortfall between the value of exports and imports in the September quarter was much smaller than in the June quarter - the seasonally adjusted goods deficit was $26 million, down from the June quarter's $437 million deficit and the smallest since the June 2014 quarter.
In November 2017 the index of producer prices for industrial products rose by 2.5 compared with the corresponding month of the preceding year. In October 2017 the annual rate of change all over had been 2.7%, as reported by the Federal Statistical Office.
Compared with the preceding month October 2017 the overall index rose slightly by 0.1% in November 2017 (+0.3% in October and in September).
In November 2017 the price indices of all main industrial groups increased compared with November 2016: Prices of intermediate rose goods by 3.3%. Energy prices were up 3.0%, though the development of prices of the different energy carriers diverged. Prices of petroleum products increased by 8.5% and prices of electricity by 2.7%, whereas prices of natural gas (distribution) decreased by 3.7%. Prices of non-durable consumer goods rose by 2.4%. Prices of durable consumer goods increased by 1.2% whereas prices of capital goods increased by 1.1%.
European stocks closed lower on Tuesday as traders weighed up rising optimism that U.S. tax cuts will win passage this week against a disappointing reading on German business sentiment.
U.S. stock-market indexes closed slightly lower Tuesday as the House of Representatives, as expected, passed a bill that would deliver sweeping corporate tax cuts. The process hit a procedural snag after U.S. markets closed, however, which will force the House to vote again on the package Wednesday.
Asian stocks were mixed on Wednesday after US benchmarks dipped, with investors awaiting the final votes on US tax-cut legislation. Bond yields climbed amid focus on the outlook for increased supply in 2018, with less central bank buying. Japanese equity benchmarks saw small gains, while those in Seoul and Sydney were flat.
© 2000-2026. Bản quyền Teletrade.
Trang web này được quản lý bởi Teletrade D.J. LLC 2351 LLC 2022 (Euro House, Richmond Hill Road, Kingstown, VC0100, St. Vincent and the Grenadines).
Thông tin trên trang web không phải là cơ sở để đưa ra quyết định đầu tư và chỉ được cung cấp cho mục đích làm quen.
Giao dịch trên thị trường tài chính (đặc biệt là giao dịch sử dụng các công cụ biên) mở ra những cơ hội lớn và tạo điều kiện cho các nhà đầu tư sẵn sàng mạo hiểm để thu lợi nhuận, tuy nhiên nó mang trong mình nguy cơ rủi ro khá cao. Chính vì vậy trước khi tiến hành giao dịch cần phải xem xét mọi mặt vấn đề chấp nhận tiến hành giao dịch cụ thể xét theo quan điểm của nguồn lực tài chính sẵn có và mức độ am hiểu thị trường tài chính.
Sử dụng thông tin: sử dụng toàn bộ hay riêng biệt các dữ liệu trên trang web của công ty TeleTrade như một nguồn cung cấp thông tin nhất định. Việc sử dụng tư liệu từ trang web cần kèm theo liên kết đến trang teletrade.vn. Việc tự động thu thập số liệu cũng như thông tin từ trang web TeleTrade đều không được phép.
Xin vui lòng liên hệ với pr@teletrade.global nếu có câu hỏi.

