- Phân tích
- Tin tức và các công cụ
- Tin tức thị trường
Tin tức thì trường
Japan’s National Consumer Price Index (CPI) climbed 3.0% YoY in August, compared to the previous reading of 2.8%, according to the latest data released by the Japan Statistics Bureau on Friday,
Further details unveil that the National CPI ex Fresh food arrived at 2.8% YoY in August versus 2.7% prior. The figure was in line with the market consensus of 2.8%.
CPI ex Fresh Food, Energy increased 2.0% YoY in August, compared to the previous reading of 1.9% rise.
Market reaction to Japan’s National CPI data
Following the Japan’s CPI inflation data, the USD/JPY pair is up 0.08% on the day at 142.72.
Japanese Yen FAQs
The Japanese Yen (JPY) is one of the world’s most traded currencies. Its value is broadly determined by the performance of the Japanese economy, but more specifically by the Bank of Japan’s policy, the differential between Japanese and US bond yields, or risk sentiment among traders, among other factors.
One of the Bank of Japan’s mandates is currency control, so its moves are key for the Yen. The BoJ has directly intervened in currency markets sometimes, generally to lower the value of the Yen, although it refrains from doing it often due to political concerns of its main trading partners. The current BoJ ultra-loose monetary policy, based on massive stimulus to the economy, has caused the Yen to depreciate against its main currency peers. This process has exacerbated more recently due to an increasing policy divergence between the Bank of Japan and other main central banks, which have opted to increase interest rates sharply to fight decades-high levels of inflation.
The BoJ’s stance of sticking to ultra-loose monetary policy has led to a widening policy divergence with other central banks, particularly with the US Federal Reserve. This supports a widening of the differential between the 10-year US and Japanese bonds, which favors the US Dollar against the Japanese Yen.
The Japanese Yen is often seen as a safe-haven investment. This means that in times of market stress, investors are more likely to put their money in the Japanese currency due to its supposed reliability and stability. Turbulent times are likely to strengthen the Yen’s value against other currencies seen as more risky to invest in.
- EUR/USD wrapped itself around the 1.1150 level on Thursday.
- Broad-market Greenback selling has thrown USD-based pairs into a bullish tilt.
- Euro data remains light, markets focused on Fed cut splurge.
EUR/USD found the high end on Thursday, holding fast to the 1.1150 level, though most of the pair’s bullish momentum comes from a broad-market selloff in the Greenback rather than any particular bullish fix in the Euro.
The economic data docket has been particularly light on the European side of things this week. All that remains of moderate note to EUR traders is a scheduled appearance from European Central Bank (ECB) President Christine Lagarde on Friday. Still, even that will be happening during US market hours. ECB President Lagarde will be speaking at the Michel Camdessus Central Banking Lecture in Washington DC.
Forex Today: Will the BoJ surprise markets?
On the US side of things, Initial Jobless Claims eased back to 219K for the week ended September 13, down from the previous week’s revised 231K and under the median market forecast of 230K. The Philadelphia Fed Manufacturing Survey for September also printed well above expectations, with the spread index of manufacturing conditions improving to 1.7 from the previous seven-month low of -7.0 and handily beating the expected print of -1.0.
Fed Chair Jerome Powell convinced markets that the Fed’s outsized jumbo cut of 50 bps this week wasn’t a snap response to deteriorating economic conditions but rather an attempt to get ahead of the curve and bolster the US labor market. Powell successfully floated a rebranding of an entire half-percentage-point cut as a “recalibration,” and investors rewarded the Fed’s latest narrative pivot by pulling out of the Greenback across the board and plowing cash into higher-yielding assets.
EUR/USD price forecast
Despite this week’s Fed-fueled rally, EUR/USD continues to churn just north of the 1.1100 handle. The post-Fed rally has kept Fiber even-keeled in the midweek, but meaningful momentum has yet to materialize and the pair could be poised for an exhaustion play. However, EUR/USD is still cycling chart paper on the high end of recent momentum, and short pressure will have a difficult time staging a full pullback to the 50-day Exponential Moving Average (EMA) near 1.1000.
EUR/USD daily chart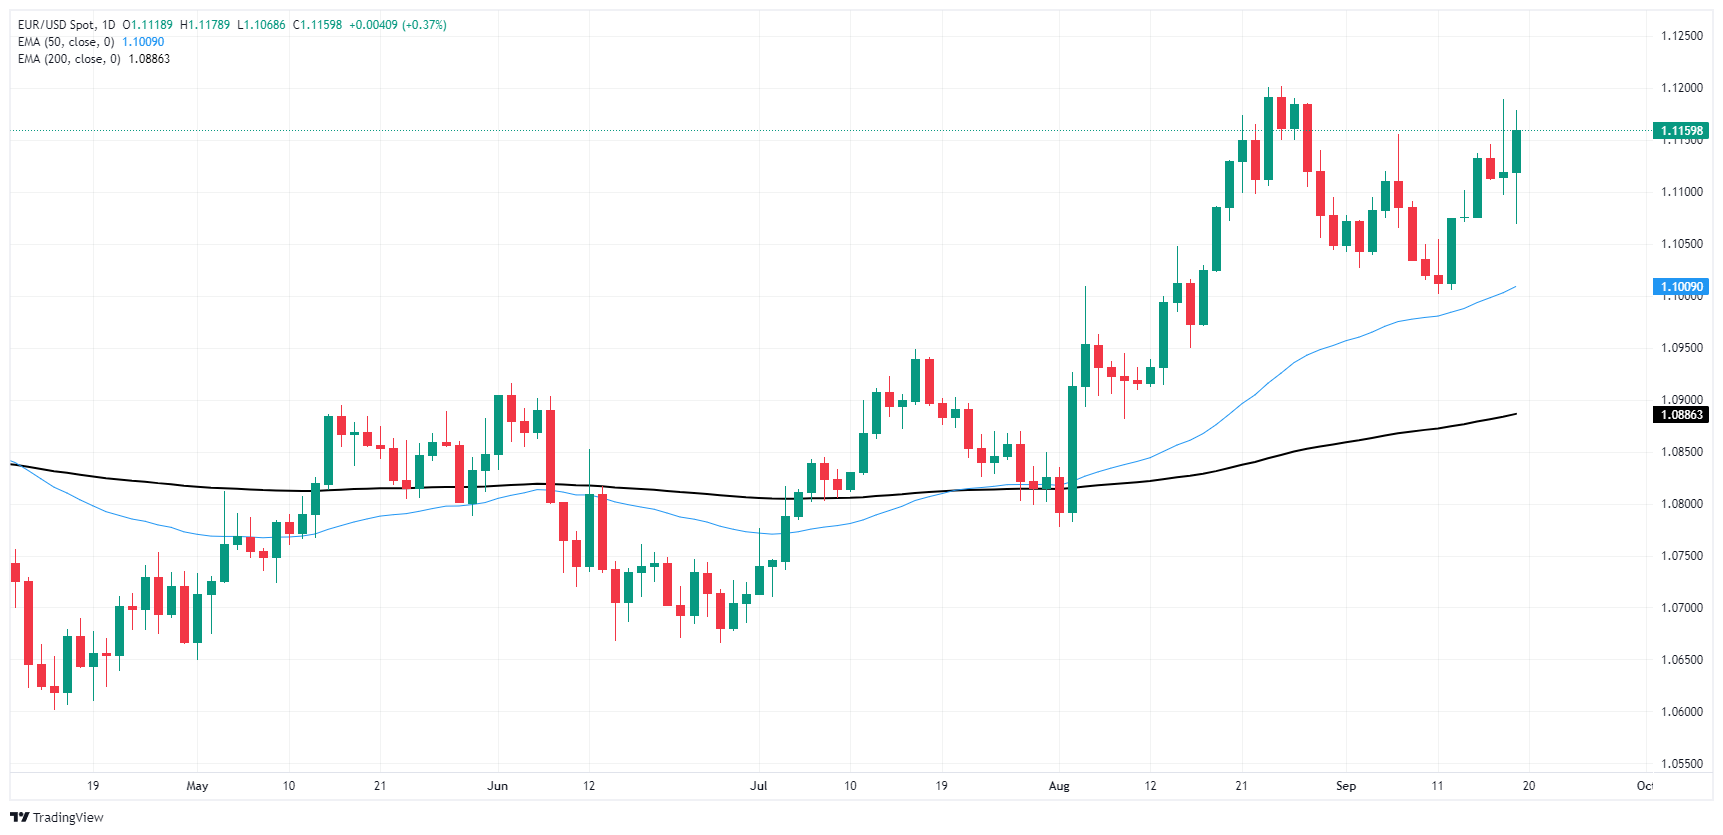
Euro FAQs
The Euro is the currency for the 20 European Union countries that belong to the Eurozone. It is the second most heavily traded currency in the world behind the US Dollar. In 2022, it accounted for 31% of all foreign exchange transactions, with an average daily turnover of over $2.2 trillion a day. EUR/USD is the most heavily traded currency pair in the world, accounting for an estimated 30% off all transactions, followed by EUR/JPY (4%), EUR/GBP (3%) and EUR/AUD (2%).
The European Central Bank (ECB) in Frankfurt, Germany, is the reserve bank for the Eurozone. The ECB sets interest rates and manages monetary policy. The ECB’s primary mandate is to maintain price stability, which means either controlling inflation or stimulating growth. Its primary tool is the raising or lowering of interest rates. Relatively high interest rates – or the expectation of higher rates – will usually benefit the Euro and vice versa. The ECB Governing Council makes monetary policy decisions at meetings held eight times a year. Decisions are made by heads of the Eurozone national banks and six permanent members, including the President of the ECB, Christine Lagarde.
Eurozone inflation data, measured by the Harmonized Index of Consumer Prices (HICP), is an important econometric for the Euro. If inflation rises more than expected, especially if above the ECB’s 2% target, it obliges the ECB to raise interest rates to bring it back under control. Relatively high interest rates compared to its counterparts will usually benefit the Euro, as it makes the region more attractive as a place for global investors to park their money.
Data releases gauge the health of the economy and can impact on the Euro. Indicators such as GDP, Manufacturing and Services PMIs, employment, and consumer sentiment surveys can all influence the direction of the single currency. A strong economy is good for the Euro. Not only does it attract more foreign investment but it may encourage the ECB to put up interest rates, which will directly strengthen the Euro. Otherwise, if economic data is weak, the Euro is likely to fall. Economic data for the four largest economies in the euro area (Germany, France, Italy and Spain) are especially significant, as they account for 75% of the Eurozone’s economy.
Another significant data release for the Euro is the Trade Balance. This indicator measures the difference between what a country earns from its exports and what it spends on imports over a given period. If a country produces highly sought after exports then its currency will gain in value purely from the extra demand created from foreign buyers seeking to purchase these goods. Therefore, a positive net Trade Balance strengthens a currency and vice versa for a negative balance.
US Treasury Secretary Janet Yellen said on Friday that the US Federal Reserve (Fed) rate cut is very positive sign for the US economy.
Key quotes
It reflects confidence on the part of the Fed that inflation has come way down and is on the path back to the two percent target, and that the risks with respect to inflation have really meaningfully diminished.
At the same time, we have a job market that remains strong.
Market reaction
The US Dollar Index showed no reaction to these comments and was last seen gaining 0.03% on the day at 100.67.
Interest rates FAQs
Interest rates are charged by financial institutions on loans to borrowers and are paid as interest to savers and depositors. They are influenced by base lending rates, which are set by central banks in response to changes in the economy. Central banks normally have a mandate to ensure price stability, which in most cases means targeting a core inflation rate of around 2%. If inflation falls below target the central bank may cut base lending rates, with a view to stimulating lending and boosting the economy. If inflation rises substantially above 2% it normally results in the central bank raising base lending rates in an attempt to lower inflation.
Higher interest rates generally help strengthen a country’s currency as they make it a more attractive place for global investors to park their money.
Higher interest rates overall weigh on the price of Gold because they increase the opportunity cost of holding Gold instead of investing in an interest-bearing asset or placing cash in the bank. If interest rates are high that usually pushes up the price of the US Dollar (USD), and since Gold is priced in Dollars, this has the effect of lowering the price of Gold.
The Fed funds rate is the overnight rate at which US banks lend to each other. It is the oft-quoted headline rate set by the Federal Reserve at its FOMC meetings. It is set as a range, for example 4.75%-5.00%, though the upper limit (in that case 5.00%) is the quoted figure. Market expectations for future Fed funds rate are tracked by the CME FedWatch tool, which shapes how many financial markets behave in anticipation of future Federal Reserve monetary policy decisions.
- GBP/USD continues to test fresh 30-month highs.
- Fed rate cut sparks broadbase Greenback selloff.
- BoE held rates despite early summer cut, UK Retail Sales in the pipe.
GBP/USD found a fresh 30-month high bid on Thursday, with a broad-market selloff in the US Dollar sparking a risk bid in Cable and bolstering the Pound Sterling. The Federal Reserve’s (Fed) 50 bps cut this week helped galvanized global markets into a risk-on stance, while the Bank of England’s (BoE) fearful rate hold did little to spark further strength under the GBP.
The only datapoint of note on Friday will be UK Retail Sales for August, though not much momentum is likely to come of it with investors exhausted after a double-header of central banks between the Fed and the BoE. UK MoM Retail Sales in August are expected to tick down to 0.4% from the previous 0.5%, while the annualized figure is expected to hold steady at 1.4%.
The BoE held interest rates steady at 5.0% early Thursday, with the Monetary Policy Committee (MPC) voting seven-to-one for another rate hold. The BoE initially opened the gates to rate cuts earlier in the summer with a quarter-point cut at the last meeting, but the move may have proved to be premature. BoE policymakers are waiting to see how the UK economy unfolds before making further rate adjustments.
On the US data side, Initial Jobless Claims eased back to 219K for the week ended September 13, down from the previous week’s revised 231K and under the median market forecast of 230K. The Philadelphia Fed Manufacturing Survey for September also printed well above expectations, with the spread index of manufacturing conditions improving to 1.7 from the previous seven-month low of -7.0 and handily beating the expected print of -1.0.
Fed Chair Jerome Powell convinced markets that the Fed’s outsized jumbo cut of 50 bps this week wasn’t a snap response to deteriorating economic conditions but rather an attempt to get ahead of the curve and bolster the US labor market. Powell successfully floated a rebranding of an entire half-percentage-point cut as a “recalibration,” and investors rewarded the Fed’s latest narrative pivot by plowing cash into risk assets across the board and yanking the rug out from beneath the safe-haven US Dollar.
Economic Indicator
Retail Sales (MoM)
The Retail Sales data, released by the Office for National Statistics on a monthly basis, measures the volume of sales of goods by retailers in Great Britain directly to end customers. Changes in Retail Sales are widely followed as an indicator of consumer spending. Percent changes reflect the rate of changes in such sales, with the MoM reading comparing sales volumes in the reference month with the previous month. Generally, a high reading is seen as bullish for the Pound Sterling (GBP), while a low reading is seen as bearish.
Read more.Next release: Fri Sep 20, 2024 06:00
Frequency: Monthly
Consensus: 0.4%
Previous: 0.5%
Source: Office for National Statistics
GBP/USD price forecast
Despite clipping into a fresh 30-month high on Thursday and crossing the 1.3300 handle, Cable bidders have struggled to push price action deep into bull country, and markets will enter the Friday wrapup with prices hovering near the key psychological level. A firm bullish trend is still baked into daily candlesticks with the pair climbing above the 50–day Exponential Moving Average (EMA) near 1.3000.
GBP/USD daily chart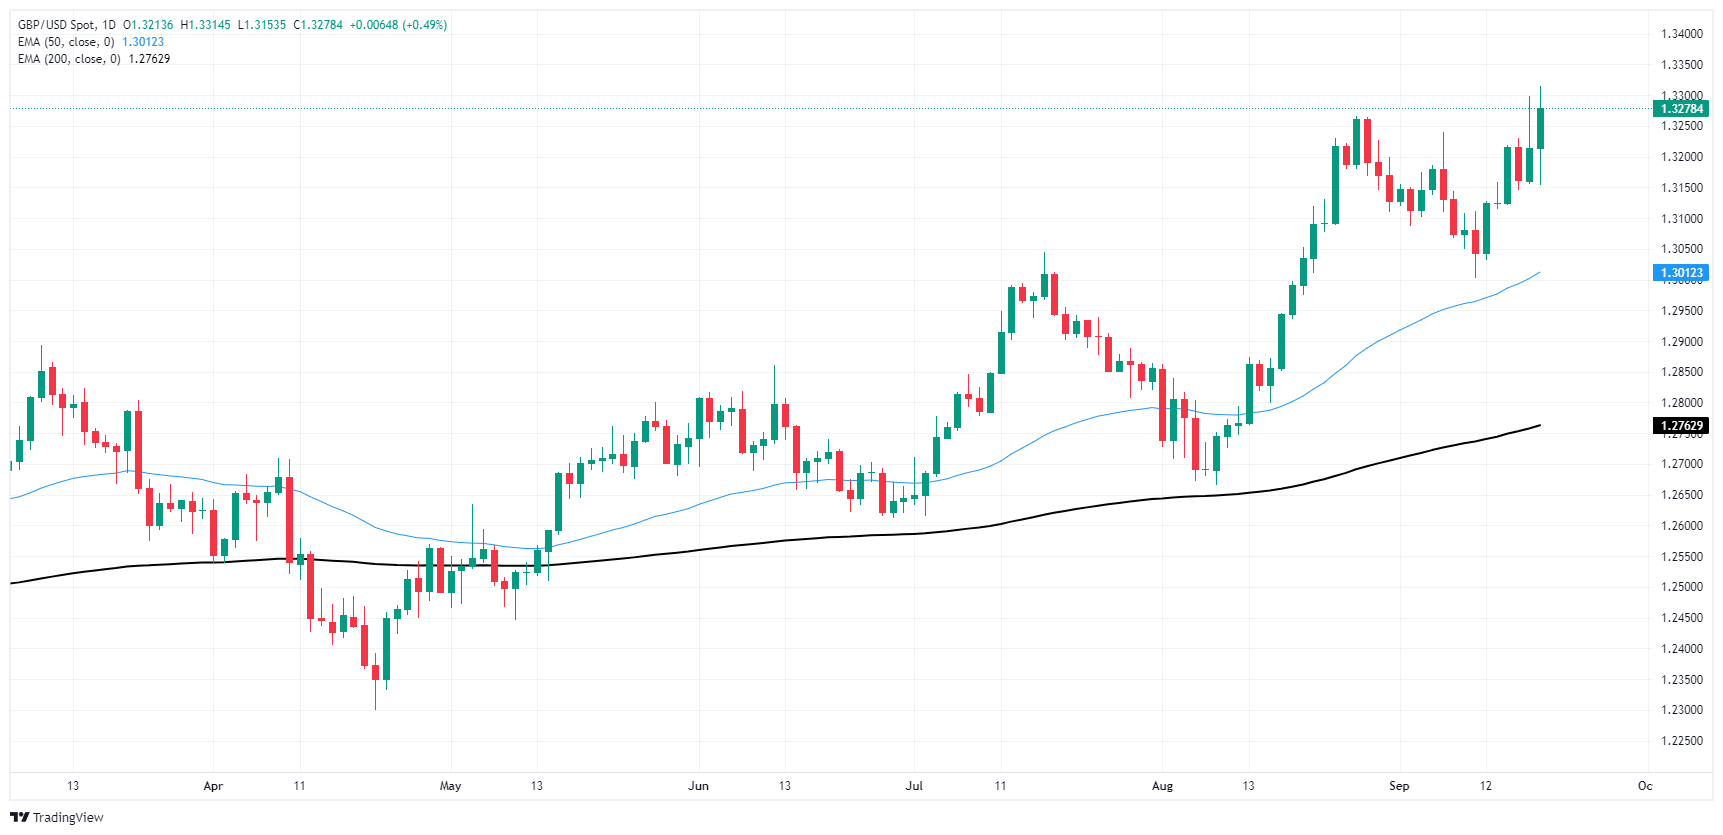
Pound Sterling FAQs
The Pound Sterling (GBP) is the oldest currency in the world (886 AD) and the official currency of the United Kingdom. It is the fourth most traded unit for foreign exchange (FX) in the world, accounting for 12% of all transactions, averaging $630 billion a day, according to 2022 data. Its key trading pairs are GBP/USD, aka ‘Cable’, which accounts for 11% of FX, GBP/JPY, or the ‘Dragon’ as it is known by traders (3%), and EUR/GBP (2%). The Pound Sterling is issued by the Bank of England (BoE).
The single most important factor influencing the value of the Pound Sterling is monetary policy decided by the Bank of England. The BoE bases its decisions on whether it has achieved its primary goal of “price stability” – a steady inflation rate of around 2%. Its primary tool for achieving this is the adjustment of interest rates. When inflation is too high, the BoE will try to rein it in by raising interest rates, making it more expensive for people and businesses to access credit. This is generally positive for GBP, as higher interest rates make the UK a more attractive place for global investors to park their money. When inflation falls too low it is a sign economic growth is slowing. In this scenario, the BoE will consider lowering interest rates to cheapen credit so businesses will borrow more to invest in growth-generating projects.
Data releases gauge the health of the economy and can impact the value of the Pound Sterling. Indicators such as GDP, Manufacturing and Services PMIs, and employment can all influence the direction of the GBP. A strong economy is good for Sterling. Not only does it attract more foreign investment but it may encourage the BoE to put up interest rates, which will directly strengthen GBP. Otherwise, if economic data is weak, the Pound Sterling is likely to fall.
Another significant data release for the Pound Sterling is the Trade Balance. This indicator measures the difference between what a country earns from its exports and what it spends on imports over a given period. If a country produces highly sought-after exports, its currency will benefit purely from the extra demand created from foreign buyers seeking to purchase these goods. Therefore, a positive net Trade Balance strengthens a currency and vice versa for a negative balance.
- USD/CAD trades on a weaker note around 1.3560 in Friday’s early Asian session.
- The speculation of additional rate cuts by the Fed this year continues to undermine the USD.
- Higher crude oil prices support the commodity-linked Loonie.
The USD/CAD pair attracts some sellers near 1.3560, snapping the two-day winning streak during the early Asian session on Friday. The Greenback edges lower as investors assessed the prospects of further rate cuts by the US Federal Reserve (Fed) in the months to come. The Bank of Canada (BoC) Governor Tiff Macklem will deliver a speech later on Friday.
The Fed surprised the financial markets with a 50 basis points (bps) rate cut on Wednesday, bringing its target range to 4.75% to 5.00%. Fed Chair Jerome Powell said the move was "strong" but that it was needed as price rises ease and job market concerns grow. The dovish stance of the US Fed and the expectation of additional rate cuts this year could further weigh on the US dollar (USD) in the near term.
Data released by the US Department of Labor (DoL) on Thursday showed that the US weekly Initial Jobless Claims slid to the lowest since May, signaling the labor market remains healthy despite a slowdown in hiring. US citizens that newly applied for unemployment insurance benefits came in at 219K for the week ending September 14. This figure was below the market consensus of 230K and lower than the previous week of 231K (revised from 230K).
On the other hand, the rise in crude oil prices provides some support to the commodity-linked Canadian Dollar (CAD). It's worth noting that Canada is the largest oil exporter to the United States (US), and higher crude oil prices tend to have a positive impact on the CAD value.
Canadian Dollar FAQs
The key factors driving the Canadian Dollar (CAD) are the level of interest rates set by the Bank of Canada (BoC), the price of Oil, Canada’s largest export, the health of its economy, inflation and the Trade Balance, which is the difference between the value of Canada’s exports versus its imports. Other factors include market sentiment – whether investors are taking on more risky assets (risk-on) or seeking safe-havens (risk-off) – with risk-on being CAD-positive. As its largest trading partner, the health of the US economy is also a key factor influencing the Canadian Dollar.
The Bank of Canada (BoC) has a significant influence on the Canadian Dollar by setting the level of interest rates that banks can lend to one another. This influences the level of interest rates for everyone. The main goal of the BoC is to maintain inflation at 1-3% by adjusting interest rates up or down. Relatively higher interest rates tend to be positive for the CAD. The Bank of Canada can also use quantitative easing and tightening to influence credit conditions, with the former CAD-negative and the latter CAD-positive.
The price of Oil is a key factor impacting the value of the Canadian Dollar. Petroleum is Canada’s biggest export, so Oil price tends to have an immediate impact on the CAD value. Generally, if Oil price rises CAD also goes up, as aggregate demand for the currency increases. The opposite is the case if the price of Oil falls. Higher Oil prices also tend to result in a greater likelihood of a positive Trade Balance, which is also supportive of the CAD.
While inflation had always traditionally been thought of as a negative factor for a currency since it lowers the value of money, the opposite has actually been the case in modern times with the relaxation of cross-border capital controls. Higher inflation tends to lead central banks to put up interest rates which attracts more capital inflows from global investors seeking a lucrative place to keep their money. This increases demand for the local currency, which in Canada’s case is the Canadian Dollar.
Macroeconomic data releases gauge the health of the economy and can have an impact on the Canadian Dollar. Indicators such as GDP, Manufacturing and Services PMIs, employment, and consumer sentiment surveys can all influence the direction of the CAD. A strong economy is good for the Canadian Dollar. Not only does it attract more foreign investment but it may encourage the Bank of Canada to put up interest rates, leading to a stronger currency. If economic data is weak, however, the CAD is likely to fall.
- The Bank of Japan is anticipated to maintain its policy rate unchanged.
- Investors’ focus should remain on the bank’s rate path for the next few months.
- BoJ Governor Kazuo Ueda is seen sticking to the recent hawkish narrative.
The Bank of Japan (BoJ) is expected to keep its short-term interest rate target between 0.15% and 0.25% on Friday, following the conclusion of its two-day monetary policy review.
The decision is set to be announced during the early Asian session. Notably, in March, the BoJ raised interest rates for the first time in 17 years, ending the negative interest rate policy that had been in place since 2016. On July 31, the central bank further surprised markets by hiking its policy rate by 15 basis points to 0.25%.
What can we expect from the BoJ interest rate decision?
As the meeting approaches, most expect a steady policy stance, but market participants will be closely watching for any shifts in the policy statement that might offer clues about when the bank plans to raise rates next.
Currently, money markets are anticipating an increase of about 25 basis points by the end of the year, which would bring the bank's policy rate to a maximum of 0.50% at the December 19 meeting.
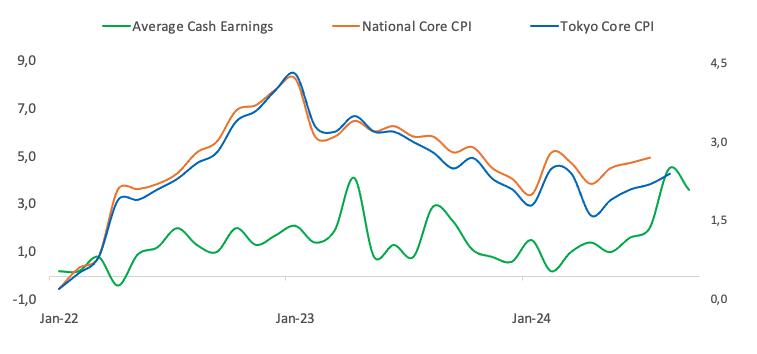
On the consumer front, real wage growth saw a positive turn in June (1.1% YoY) and July (0.4% YoY), which could encourage more spending and potentially push inflation higher. For now, inflation remains above the 2% target.
These factors make it tricky for the central bank to decide when to raise interest rates. If rising prices driven by cost pressures start to weigh on consumer spending, it could hinder the demand-driven inflation the Bank of Japan aims for before it can consider scaling back its stimulus measures.
Sanae Takaichi, a potential successor to Japanese Prime Minister Fumio Kishida, has suggested that the BoJ should avoid raising interest rates further, as it could dampen consumer sentiment and hinder capital expenditure.
From the BoJ, policymaker Naoki Tamura believed that the central bank must increase interest rates to at least 1% by the second half of the next fiscal year, highlighting the bank's commitment to steady monetary tightening. In addition, board member Junko Nakagawa argued that the BoJ would continue raising interest rates if inflation aligns with its forecast, but emphasized the need to consider market movements' effects on the broader economic and price outlook before deciding to increase rates. Furthermore, his colleague Hajime Takata cautioned that interest rate hikes should be cautious to avoid significant harm to businesses.
In the meantime, it is worth recalling that BoJ Governor Kazuo Ueda spoke before the Japanese Parliament in late August. In his testimony, he reaffirmed his commitment to raising interest rates if inflation continues to move toward the 2% target, indicating that recent market volatility would not disrupt the BoJ’s long-term plan for rate hikes. However, Ueda cautioned that markets remain unstable, which could influence the central bank’s inflation forecasts.
Ueda’s comments suggested that the central bank might take longer than initially anticipated to decide on its next rate hike, but remained on track to gradually raise borrowing costs from the current ultra-low levels.
According to a Reuters poll published last week, economists unanimously agreed that the BoJ will not raise interest rates at its September policy meeting, though a majority still anticipated an increase at some point by year-end.
As we get closer to the interest rate decision, analysts at Standard Chartered Global Research noted: “We now expect the Bank of Japan (BoJ) to hike the base rate by 25 bps in December (from 15 bps in Q2 and 10 bps in Q3-2025 prior) to 0.50% by end-2024 (0.25% prior) on stronger-than-expected inflation that has stayed above its 2% target for the past 21 months. Wages grew in real terms in June for the first time since March 2022, adding to concerns over demand-side inflation. The BoJ may hike earlier to avoid losing an opportunity to normalise policy before dovish pressures kick in from possible Fed rate cuts of 75 bps by end-2024, risk of a global recession, and China’s slowdown.”
How could the Bank of Japan interest rate decision affect USD/JPY?
The BoJ is largely expected to refrain from acting on the policy rate. However, Governor Ueda is seen sticking to his hawkish narrative, leaving the door open to the continuation of the “normalization” of the monetary policy in the next few months.
A glimpse at the broader picture shows that Fed-BoJ policy divergence remains at center stage. Following the recent 50 basis points rate cut by the Federal Reserve (Fed) in September and prospects of an additional 50 basis points of easing in the latter part of the year, a further downside in USD/JPY does appear as the most favourable scenario for the time being.
Looking at the techs surrounding USD/JPY, Senior Analyst at FXStreet Pablo Piovano suggests that “the resumption of the bid bias in the Japanese yen carries the potential to drag the pair to its 2024 bottom of 139.57 (September 16). A deeper retracement could see the spot revisit the July 2023 low of 137.23 (July 14) ahead of the March 2023 low of 129.63 (March 24)”.
On the upside, “there are initial barriers at the September peak of 147.20 (September 3), and the weekly high of 149.39 (August 15)”, Pablo adds.
Economic Indicator
BoJ Interest Rate Decision
The Bank of Japan (BoJ) announces its interest rate decision after each of the Bank’s eight scheduled annual meetings. Generally, if the BoJ is hawkish about the inflationary outlook of the economy and raises interest rates it is bullish for the Japanese Yen (JPY). Likewise, if the BoJ has a dovish view on the Japanese economy and keeps interest rates unchanged, or cuts them, it is usually bearish for JPY.
Read more.Last release: Wed Jul 31, 2024 03:55
Frequency: Irregular
Actual: 0.15%
Consensus: 0%
Previous: 0%
Source: Bank of Japan
Bank of Japan FAQs
The Bank of Japan (BoJ) is the Japanese central bank, which sets monetary policy in the country. Its mandate is to issue banknotes and carry out currency and monetary control to ensure price stability, which means an inflation target of around 2%.
The Bank of Japan has embarked in an ultra-loose monetary policy since 2013 in order to stimulate the economy and fuel inflation amid a low-inflationary environment. The bank’s policy is based on Quantitative and Qualitative Easing (QQE), or printing notes to buy assets such as government or corporate bonds to provide liquidity. In 2016, the bank doubled down on its strategy and further loosened policy by first introducing negative interest rates and then directly controlling the yield of its 10-year government bonds.
The Bank’s massive stimulus has caused the Yen to depreciate against its main currency peers. This process has exacerbated more recently due to an increasing policy divergence between the Bank of Japan and other main central banks, which have opted to increase interest rates sharply to fight decades-high levels of inflation. The BoJ’s policy of holding down rates has led to a widening differential with other currencies, dragging down the value of the Yen.
A weaker Yen and the spike in global energy prices have led to an increase in Japanese inflation, which has exceeded the BoJ’s 2% target. With wage inflation becoming a cause of concern, the BoJ looks to move away from ultra loose policy, while trying to avoid slowing the activity too much.
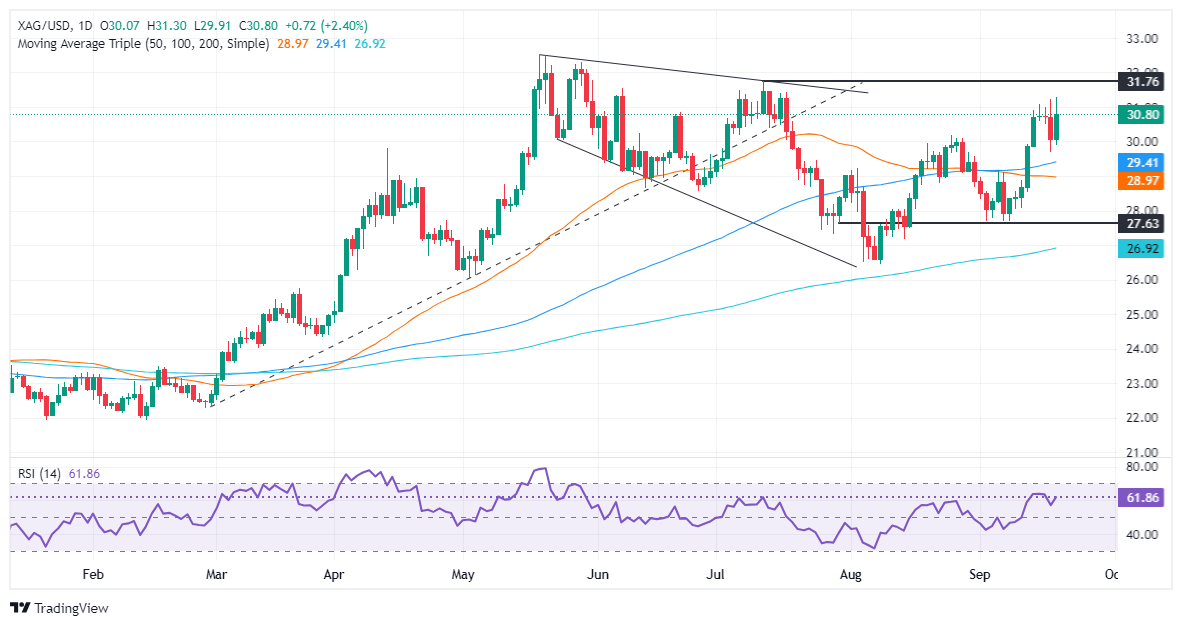
- Silver price breaks above a key resistance trendline, with a move toward $31.00 in sight after strong gains.
- Next resistance levels include the July 11 high at $31.75 and the May 29 peak at $32.29, with YTD high at $32.51 on the horizon.
- A bearish reversal would require a break below the September 18 low of $29.71, with further support at the 100-DMA of $29.43.
Silver climbed sharply during Thursday’s North American session, printing solid gains of over 2%, and closed at around $30.77. Investors, seeking risk and ditching the US Dollar, cheered the Federal Reserve's rate cut.
Market sentiment remains upbeat, with Wall Street's main index, the S&P 500, climbing to a record high. Meanwhile, the precious metals segment, led by Gold and Silver, surged sharply while the Greenback dropped over 0.30%, according to the US Dollar Index (DXY) at 100.63.
XAG/USD Price Forecast: Technical outlook
Silver price is threatening to decisively clear a downslope resistance trendline drawn from May 20 highs passing through $30.67. If this trendline is broken decisively, it will open the way to challenging $31.00.
In that outcome, XAG/USD next resistance will be the July 11 swing high at $31.75, followed by the May 29 peak at $32.29. On further strength, the year-to-date (YTD) high at $32.51 will be up for grabs.
Conversely, bears would need to push the grey’s metal price below the September 18 swing low of $29.71, ahead of testing the 100-day moving average (DMA) at $29.43
XAG/USD Price Action – Daily Chart
Silver FAQs
Silver is a precious metal highly traded among investors. It has been historically used as a store of value and a medium of exchange. Although less popular than Gold, traders may turn to Silver to diversify their investment portfolio, for its intrinsic value or as a potential hedge during high-inflation periods. Investors can buy physical Silver, in coins or in bars, or trade it through vehicles such as Exchange Traded Funds, which track its price on international markets.
Silver prices can move due to a wide range of factors. Geopolitical instability or fears of a deep recession can make Silver price escalate due to its safe-haven status, although to a lesser extent than Gold's. As a yieldless asset, Silver tends to rise with lower interest rates. Its moves also depend on how the US Dollar (USD) behaves as the asset is priced in dollars (XAG/USD). A strong Dollar tends to keep the price of Silver at bay, whereas a weaker Dollar is likely to propel prices up. Other factors such as investment demand, mining supply – Silver is much more abundant than Gold – and recycling rates can also affect prices.
Silver is widely used in industry, particularly in sectors such as electronics or solar energy, as it has one of the highest electric conductivity of all metals – more than Copper and Gold. A surge in demand can increase prices, while a decline tends to lower them. Dynamics in the US, Chinese and Indian economies can also contribute to price swings: for the US and particularly China, their big industrial sectors use Silver in various processes; in India, consumers’ demand for the precious metal for jewellery also plays a key role in setting prices.
Silver prices tend to follow Gold's moves. When Gold prices rise, Silver typically follows suit, as their status as safe-haven assets is similar. The Gold/Silver ratio, which shows the number of ounces of Silver needed to equal the value of one ounce of Gold, may help to determine the relative valuation between both metals. Some investors may consider a high ratio as an indicator that Silver is undervalued, or Gold is overvalued. On the contrary, a low ratio might suggest that Gold is undervalued relative to Silver.
- The NZD/USD pair has been choppy between 0.6159-0.6260 in the past sessions.
- The RSI shows rising buying pressure, whereas the MACD suggests a potential reversal in the bearish momentum.
On Thursday, the NZD/USD pair rose to 0.6239, above the 20-day Simple Moving Average (SMA) which served as a strong resistance in the last sessions. Indicators meanwhile look promising.
The Relative Strength Index (RSI) is at 59, in positive territory with a rising slope, signaling rising buying pressure. Conversely, the Moving Average Convergence Divergence (MACD) histogram is red and falling, suggesting that selling pressure may be declining. This presents a mixed outlook for the pair.
NZD/USD daily chart
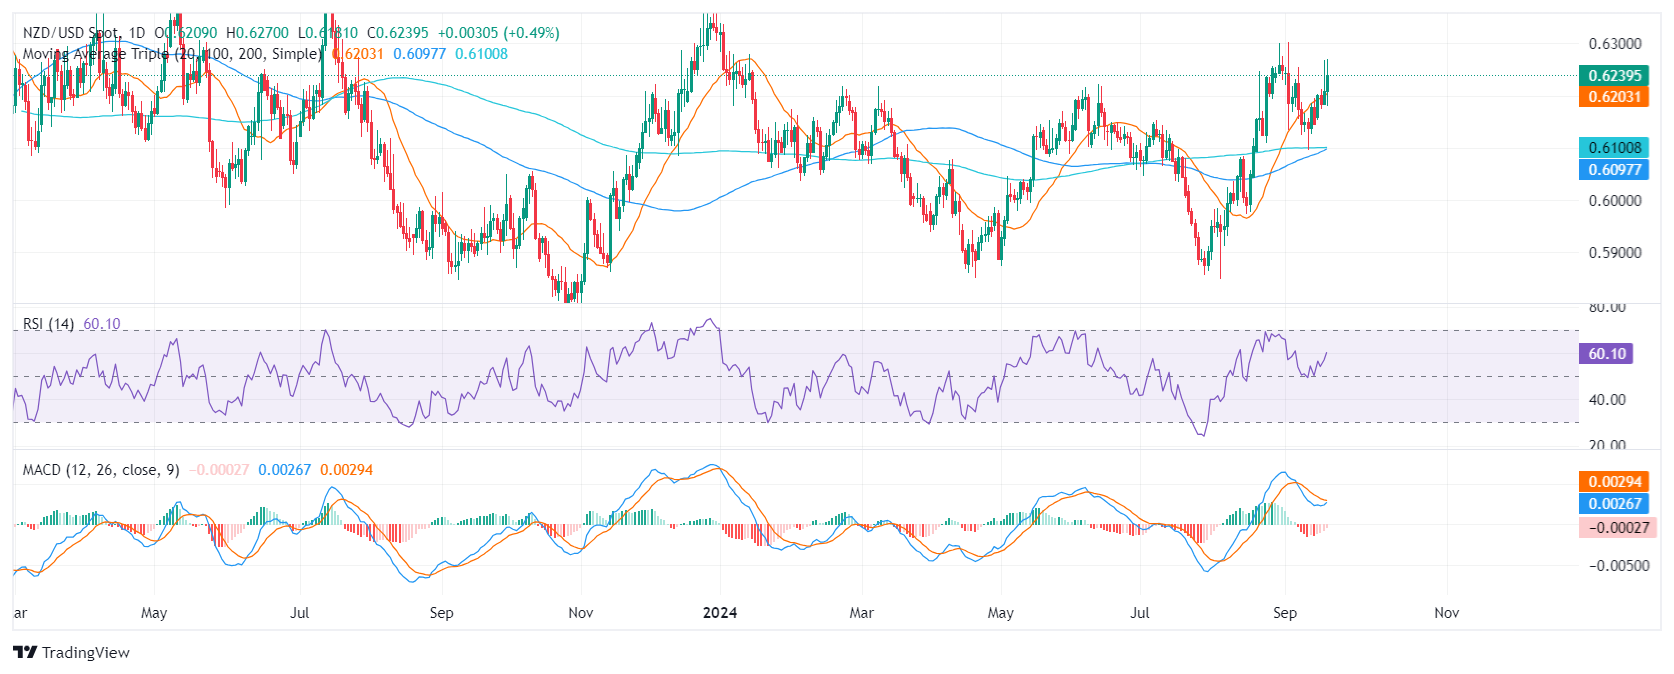
Key support levels include 0.6150, 0.6120, and 0.6100, while resistance levels are 0.6190, 0.6200, and 0.6230. A close above the 20-day SMA, currently at 0.6200, could signal further upward movement with the next target being at early September highs near 0.6300.
- AUD/USD rises due to a weaker US Dollar following a 50-basis-point rate cut by the Federal Reserve.
- Fed anticipates slower GDP growth and higher unemployment, while inflation is expected to decline.
- RBA hawkish stance also favors the Aussie.
The AUD/USD rose by 0.70% to 0.6815 in Thursday's session. This marks the fourth consecutive session of gains for the AUD/USD, as the Greenback continues to weaken in the wake of the Federal Reserve's (Fed) 50-basis-point rate cut. The Fed's decision to cut rates was driven by concerns about slowing global economic growth and rising unemployment.
Economic projections for Australia remain uncertain. Despite mixed indicators, the Reserve Bank of Australia (RBA) remains cautious due to elevated inflation. As a result, financial markets currently anticipate a modest 25-basis-point reduction in interest rates in 2024, reflecting the RBA's intention to maintain a hawkish monetary stance to combat inflationary pressures.
Daily digest market movers: Australian Dollar rising while markets punish the USD after Fed, Australian labor data
- The US dollar (USD) weakened on Thursday due to increased selling interest after the Federal Reserve's decision to lower interest rates more than expected.
- Gains in copper and iron ore prices also supported the AUD, although concerns about China's housing and industrial sectors may limit upside potential.
- The Reserve Bank of Australia (RBA) kept its Official Cash Rate (OCR) steady at 4.35% last month, indicating a cautious approach amid ongoing inflationary pressures.
- RBA Governor Michelle Bullock reiterated a cautious outlook, suggesting that rate cuts are unlikely in the near future.
- Despite the RBA's hawkish stance, the market anticipates rate cuts in late 2024, with a 70% probability of a 25-basis-point cut by December.
- A mixed labour market report in Australia for August showed an unchanged Unemployment Rate of 4.2%, while Employment Change increased by 47.5K individuals.
AUD/USD technical outlook: Pair embraces bullish bias indicators positive
Indicators continue to gain ground with the Relative Strength Index (RSI) and the Moving Average Convergence Divergence (MACD) indicating rising buying traction. In addition, with the pair at its highest level since January, the outlook is positive. Buyers now must retain the 0.6800 area.
Australian Dollar FAQs
One of the most significant factors for the Australian Dollar (AUD) is the level of interest rates set by the Reserve Bank of Australia (RBA). Because Australia is a resource-rich country another key driver is the price of its biggest export, Iron Ore. The health of the Chinese economy, its largest trading partner, is a factor, as well as inflation in Australia, its growth rate and Trade Balance. Market sentiment – whether investors are taking on more risky assets (risk-on) or seeking safe-havens (risk-off) – is also a factor, with risk-on positive for AUD.
The Reserve Bank of Australia (RBA) influences the Australian Dollar (AUD) by setting the level of interest rates that Australian banks can lend to each other. This influences the level of interest rates in the economy as a whole. The main goal of the RBA is to maintain a stable inflation rate of 2-3% by adjusting interest rates up or down. Relatively high interest rates compared to other major central banks support the AUD, and the opposite for relatively low. The RBA can also use quantitative easing and tightening to influence credit conditions, with the former AUD-negative and the latter AUD-positive.
China is Australia’s largest trading partner so the health of the Chinese economy is a major influence on the value of the Australian Dollar (AUD). When the Chinese economy is doing well it purchases more raw materials, goods and services from Australia, lifting demand for the AUD, and pushing up its value. The opposite is the case when the Chinese economy is not growing as fast as expected. Positive or negative surprises in Chinese growth data, therefore, often have a direct impact on the Australian Dollar and its pairs.
Iron Ore is Australia’s largest export, accounting for $118 billion a year according to data from 2021, with China as its primary destination. The price of Iron Ore, therefore, can be a driver of the Australian Dollar. Generally, if the price of Iron Ore rises, AUD also goes up, as aggregate demand for the currency increases. The opposite is the case if the price of Iron Ore falls. Higher Iron Ore prices also tend to result in a greater likelihood of a positive Trade Balance for Australia, which is also positive of the AUD.
The Trade Balance, which is the difference between what a country earns from its exports versus what it pays for its imports, is another factor that can influence the value of the Australian Dollar. If Australia produces highly sought after exports, then its currency will gain in value purely from the surplus demand created from foreign buyers seeking to purchase its exports versus what it spends to purchase imports. Therefore, a positive net Trade Balance strengthens the AUD, with the opposite effect if the Trade Balance is negative.
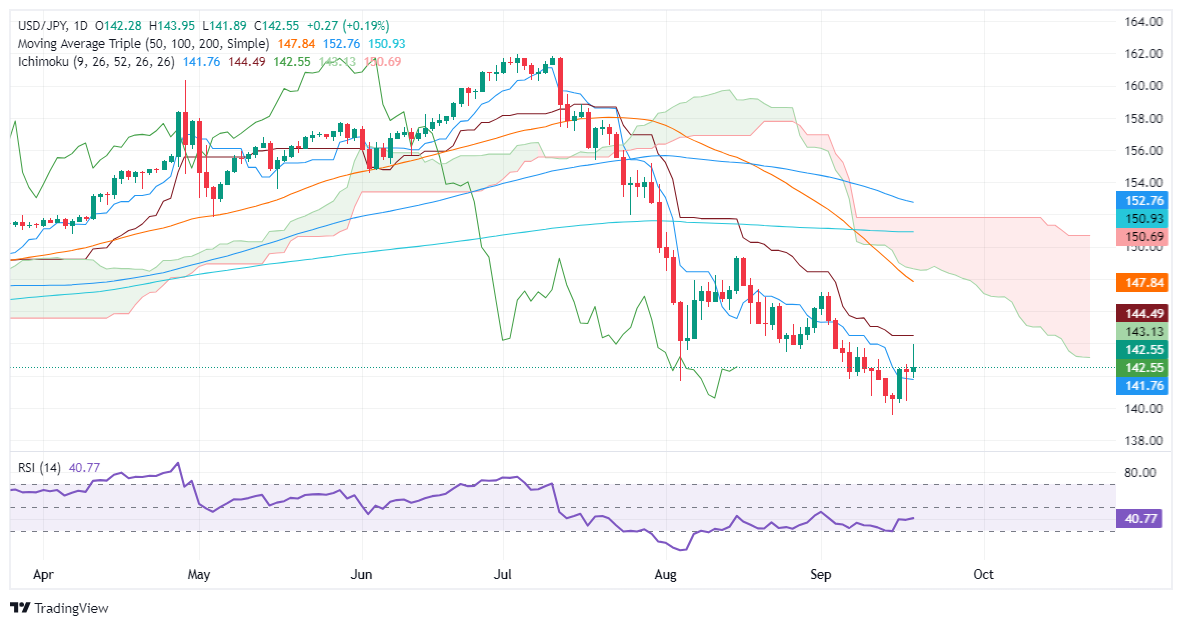
- USD/JPY's ‘shooting star’ candlestick hints at a possible bearish continuation despite current buyer momentum.
- Key supports: September 19 low at 141.88, 140.44, and YTD low at 139.58.
- Buyers need to surpass 143.94 resistance, with next target at Kijun-Sen at 144.48 for bullish control.
The USD/JPY held on to gains following Wednesday’s Federal Reserve decision but traded well below its daily peak of 143.94 as the Greenback registered losses.
Data-wise, the US docker featured initial jobless Claims for the last week, which fared better than expected but failed to boost the US Dollar. Meanwhile, traders eye the release of Japanese inflation data and the Bank of Japan's monetary policy decision.
USD/JPY Price Forecast: Technical outlook
The downtrend is set to continue despite recovering some ground. As Thursday’s session finishes, the USD/JPY retreated from the weekly high, forming a ‘shooting star’ candlestick. This means that bears are stepping into the market, paving the way for a re-test of the year-to-date (YTD) low of 139.58.
In the short term, momentum favors buyers, as depicted by the Relative Strength Index (RSI), though in the long term, the RSI is bearish.
For a bearish continuation, the USD/JPY must clear the September 19 low of 141.88, immediately followed by the Tenkan-Sen at 141.76. Those levels cleared, and the next demand zone would be the September 18 daily low of 140.44, followed by the YTD low of 139.58
Conversely, buyers must clear the September 19 high of 143.94 before testing the Kijun-Sen at 144.48.
USD/JPY Price Action – Daily Chart
Japanese Yen PRICE Today
The table below shows the percentage change of Japanese Yen (JPY) against listed major currencies today. Japanese Yen was the strongest against the Swiss Franc.
| USD | EUR | GBP | JPY | CAD | AUD | NZD | CHF | |
|---|---|---|---|---|---|---|---|---|
| USD | -0.40% | -0.51% | 0.20% | -0.34% | -0.71% | -0.53% | 0.10% | |
| EUR | 0.40% | -0.11% | 0.62% | 0.07% | -0.29% | -0.12% | 0.51% | |
| GBP | 0.51% | 0.11% | 0.72% | 0.17% | -0.20% | -0.01% | 0.60% | |
| JPY | -0.20% | -0.62% | -0.72% | -0.51% | -0.90% | -0.74% | -0.11% | |
| CAD | 0.34% | -0.07% | -0.17% | 0.51% | -0.37% | -0.19% | 0.43% | |
| AUD | 0.71% | 0.29% | 0.20% | 0.90% | 0.37% | 0.18% | 0.80% | |
| NZD | 0.53% | 0.12% | 0.01% | 0.74% | 0.19% | -0.18% | 0.63% | |
| CHF | -0.10% | -0.51% | -0.60% | 0.11% | -0.43% | -0.80% | -0.63% |
The heat map shows percentage changes of major currencies against each other. The base currency is picked from the left column, while the quote currency is picked from the top row. For example, if you pick the Japanese Yen from the left column and move along the horizontal line to the US Dollar, the percentage change displayed in the box will represent JPY (base)/USD (quote).
- The Canadian Dollar was given a boost from Fed-weakened Greenback.
- Canada remains under-represented on the economic calendar.
- Broader markets remain more interested in other avenues following Fed cut.
The Canadian Dollar (CAD) remains overall weaker on Thursday, though the CAD was able to eke out a stronger stance against the Greenback, with the USD getting pummeled after the Federal Reserve (Fed) cut interest rates for the first time in four years by an outsized 50 bps.
Canada is in a lull between key data releases after having printed the latest Consumer Price Index (CPI) figures earlier in the week. All that remains on the economic data docket for the CAD this week is Friday’s mid-tier Retail Sales figures from July, far too late for anybody to do anything about it. Bank of Canada (BoC) Governor Tiff Macklem is also slated to make an appearance on Friday, but the limited scope of the speech is unlikely to draw much bluster.
Daily digest market movers
- The Canadian Dollar is overall weaker on an under-performing Thursday, but still managed to eke out roughly one-third of one percent against the US Dollar.
- The Fed’s 50 bps jumbo cut this week was sold as a “recalibration” by Fed Chair Jerome Powell, who spun it as an advance move to shore up the US labor market, rather than a snap reaction to deteriorating economic indicators in the US.
- The BoC’s Governor Macklem will be giving a speech early Friday at the National Bureau of Economic Research Economics of Artificial Intelligence Conference, in Toronto. It is unlikely that much discussion of monetary policy will come out of it.
- Canadian Retail Sales from July are expected to hold steady on an annual basis of around 0.3% YoY.
- Canadian CPI figures released earlier this week did little to galvanize market confidence in the state of the Canadian economy after headline inflation sunk to 2.0% YoY from the previous 2.5%.
Canadian Dollar price forecast
The Canadian Dollar found a little bit of juice to gain ground against the Greenback on Thursday, gaining around 0.35%, but any CAD strength is purely a result of USD selling and hasn’t bled over to any other major currencies. USD/CAD has eased lower on broad-market risk appetite, pulling the pair down from recent congestion just south of the 200-day Exponential Moving Average (EMA) near 1.3600.
However, extended short pressure remains a risky play with the pair trading so close to August’s swing low into 1.3450, and the high side looks equally over-populated as technical resistance remains stiff above 1.3600.
USD/CAD daily chart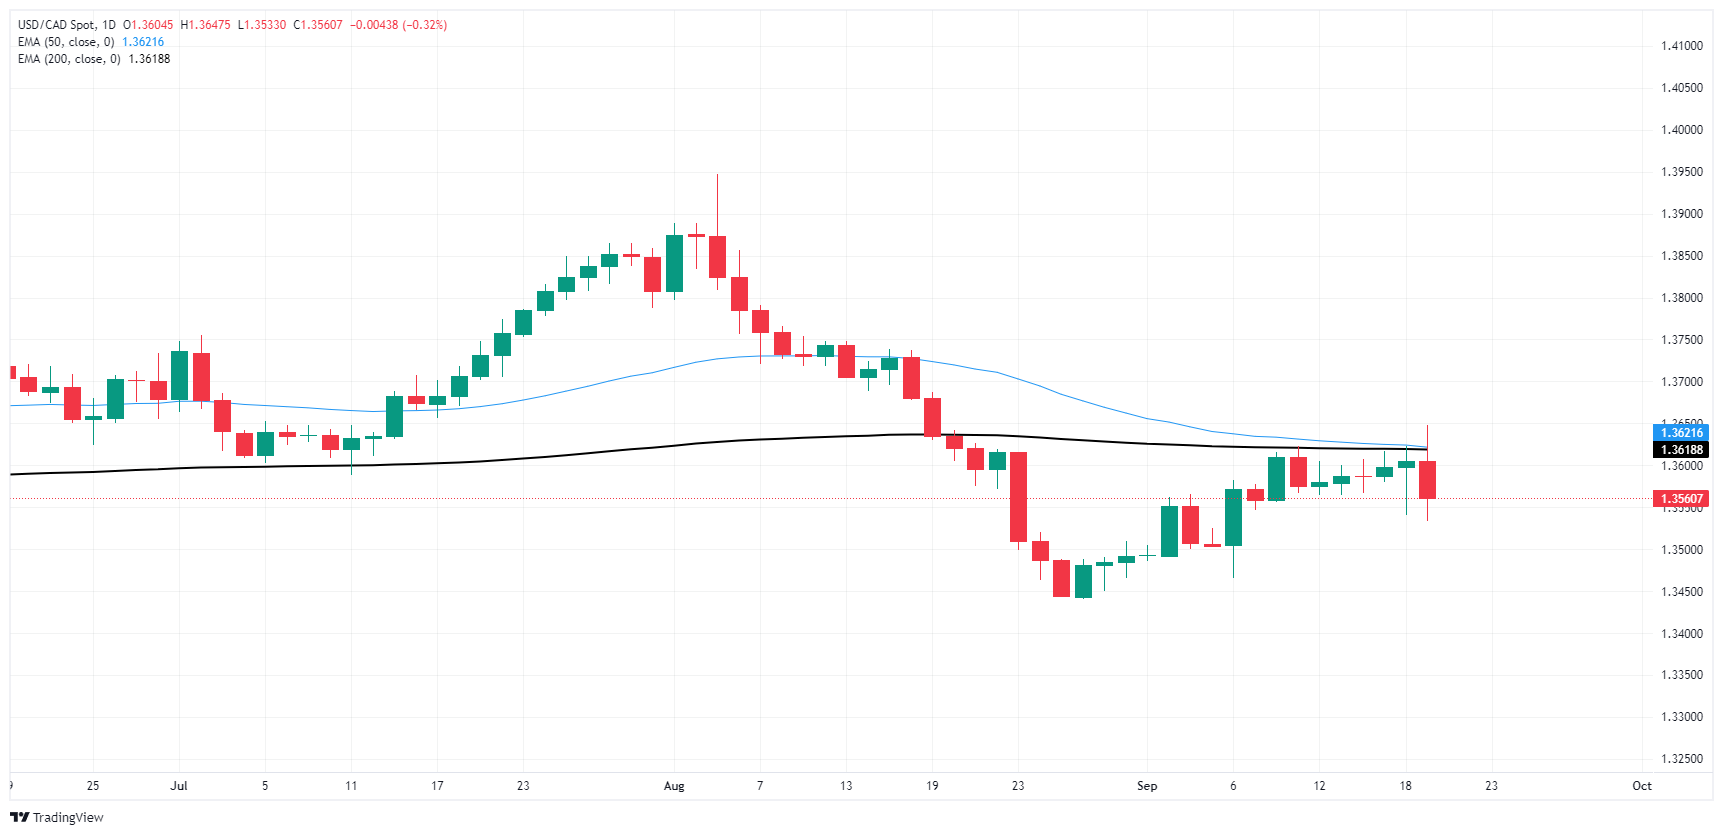
Canadian Dollar FAQs
The key factors driving the Canadian Dollar (CAD) are the level of interest rates set by the Bank of Canada (BoC), the price of Oil, Canada’s largest export, the health of its economy, inflation and the Trade Balance, which is the difference between the value of Canada’s exports versus its imports. Other factors include market sentiment – whether investors are taking on more risky assets (risk-on) or seeking safe-havens (risk-off) – with risk-on being CAD-positive. As its largest trading partner, the health of the US economy is also a key factor influencing the Canadian Dollar.
The Bank of Canada (BoC) has a significant influence on the Canadian Dollar by setting the level of interest rates that banks can lend to one another. This influences the level of interest rates for everyone. The main goal of the BoC is to maintain inflation at 1-3% by adjusting interest rates up or down. Relatively higher interest rates tend to be positive for the CAD. The Bank of Canada can also use quantitative easing and tightening to influence credit conditions, with the former CAD-negative and the latter CAD-positive.
The price of Oil is a key factor impacting the value of the Canadian Dollar. Petroleum is Canada’s biggest export, so Oil price tends to have an immediate impact on the CAD value. Generally, if Oil price rises CAD also goes up, as aggregate demand for the currency increases. The opposite is the case if the price of Oil falls. Higher Oil prices also tend to result in a greater likelihood of a positive Trade Balance, which is also supportive of the CAD.
While inflation had always traditionally been thought of as a negative factor for a currency since it lowers the value of money, the opposite has actually been the case in modern times with the relaxation of cross-border capital controls. Higher inflation tends to lead central banks to put up interest rates which attracts more capital inflows from global investors seeking a lucrative place to keep their money. This increases demand for the local currency, which in Canada’s case is the Canadian Dollar.
Macroeconomic data releases gauge the health of the economy and can have an impact on the Canadian Dollar. Indicators such as GDP, Manufacturing and Services PMIs, employment, and consumer sentiment surveys can all influence the direction of the CAD. A strong economy is good for the Canadian Dollar. Not only does it attract more foreign investment but it may encourage the Bank of Canada to put up interest rates, leading to a stronger currency. If economic data is weak, however, the CAD is likely to fall.
The Greenback could not sustain the optimism seen during the Asian trading hours, eventually surrendering that advance and ending the day with marked losses as investors assessed the prospects of further easing by the Fed in the months to come.
Here is what you need to know on Friday, September 20:
The US Dollar Index (DXY) maintained its bearish mood post-FOMC and revisited the 100.50 zone. The Fed’s Harker is only due to speak at the end of the week.
EUR/USD added to Wednesday’s uptick and revisited the 1.1180 region following increasing selling pressure in the US Dollar. The ECB’s Lagarde speaks on Friday, along with the release of the flash Consumer Confidence in the broader Euroland. In addition, Germany will release August’s Producer Prices.
GBP/USD surpassed the 1.3300 barrier for the first time since March 2022 on the back of the cautious hold by the BoE and further USD-selling. Retail Sales will be at the centre of the debate, seconded by Public Sector Net Borrowing and the GfK’s Consumer Confidence gauge.
The prevailing appetite for the risk-linked galaxy kept the Japanese Yen on the back foot and sponsored a move to around 144.00 in USD/JPY. An interesting docket in “The Land of the Rising Sun” will feature the BoJ meeting, followed by the Inflation Rate and weekly Foreign Bond Investment figures.
AUD/USD advanced for the fourth session in a row and finally managed to trespass the 0.6800 barrier to print new YTD highs on Thursday. The next relevant release Down Under will be the preliminary Judo Bank Manufacturing and Services PMIs on September 23.
Prices of the American reference WTI rose to two-week tops past the $71.00 mark per barrel following the widespread upbeat tone in the risk complex post-Fed’s rate cut.
Gold prices remained close to the all-time highs around the $2,600 mark per ounce troy, advancing markedly after two consecutive days of losses. Silver prices followed suit and climbed to new two-month highs past the $31.00 mark per ounce.
- Gold prices surge following the Fed's 50 bps rate cut, with officials citing inflation moving toward the 2% target.
- Fed Chair Powell signals labor market strength and cautious policy adjustments, stating no rush to normalize rates.
- US jobs data shows resilience, while rising US Treasury yields fail to support the Greenback, as the DXY drops 0.31% to 100.62.
Gold prices advanced on Thursday after the Federal Reserve (Fed) embarked on an easing cycle with a 50-basis-point (bps) rate cut. Traders ignored the rise of US Treasury yields, which correlate inversely to the non-yielding metal, which remains on its way toward reclaiming $2,600. At the time of writing, XAU/USD trades at $2,589, up over 1%.
Following the Fed's decision, bullion prices extended their gains after registering losses on Wednesday. Officials side with the larger of two cuts expected by Wall Street, justifying their decision by pointing to inflation moving sustainably toward the Fed’s 2% goal. Fed Chair Jerome Powell stressed that the Fed could maintain labor strength with policy adjustments.
Powell commented that risks of inflation diminished, while the labor market had risen. Still he added that if inflation persists, “We can dial back policy more slowly,” while adding that according to the bank’s projections, it’s “not in a rush” to normalize policy.
In the meantime, the US jobs data is taking the spotlight after Powell’s speech at Jackson Hole, in which he shifted toward attaining the maximum employment mandate. On Thursday, the US Labor Department revealed that the number of people filing for unemployment benefits was below expectations, indicating strength in the labor market.
Meanwhile, US Treasury yields follow Gold’s footsteps, with the 10-year T-note yielding 3.74%, rising three and a half basis points. However, this has failed to underpin the Greenback, which, according to the US Dollar Index (DXY), dropped 0.31% to 100.62.
Ahead this week, Philadelphia Fed President Patrick Harker will cross the wires amid a scarce docket in the US.
Daily digest market movers: Gold price recovers amid betterstrong US jobs market data
- Fed Governor Michelle Bowman voted to lower rates by a quarter of a percentage point at the September FOMC meeting.
- The Summary of Economic Projections indicates the Fed projects interest rates to end at 4.4% in 2024 and 3.4% in 2025. Inflation, as measured by the Core Personal Consumption Expenditures Price Index, is estimated to reach its 2% target by 2026, with forecasts of 2.6% in 2024 and 2.2% in 2025.
- US economy will likely grow at a 2% pace in 2024, with the Unemployment Rate rising to 4.4% by the end of the year.
- US Initial Jobless Claims for the week ending September 14 dipped from 231K to 219K, below estimates of 230K.
- US Existing Home Sales plunged 2.5% MoM in August after dipping from 3.96 million to 3.86 million, declining for the fourth time in the year.
- December 2024 fed funds rate futures contracting suggests that the Fed might lower rates by at least 69 basis points, implying that in the following two meetings this year the market expects one 50 bps and one 25 bps rate.
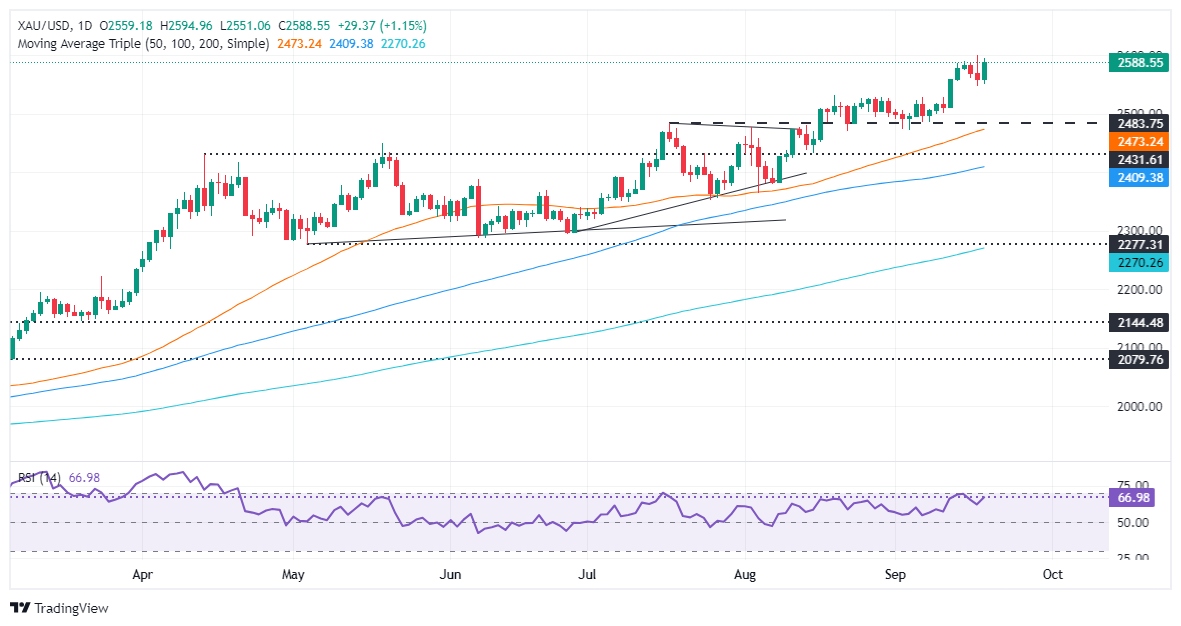
XAU/USD technical outlook: Gold price buyers target $2,600 after Fed’s decision
Gold price uptrend remains intact, but after Wednesday’s Shooting Star candlestick pattern, buyers must challenge the year-to-date peak of $2,599 if they would like to stay hopeful of conquering the $2,600 mark.
Momentum favors buyers. The Relative Strength Index (RSI) aims upwards in bullish territory and not in overbought territory. Therefore, the path of least resistance is tilted to the upside.
XAU/USD's first resistance would be $2,599, followed by $2,600. On further strength, buyers can challenge the psychological levels of $2,650 and $2,700.
If XAU/USD drops below the September 13 low of $2,556, the next support would be $2,550. Once cleared, the next stop would be the August 20 high, which turned into support at $2,531, before aiming toward the September 6 low of $2,485.
Gold FAQs
Gold has played a key role in human’s history as it has been widely used as a store of value and medium of exchange. Currently, apart from its shine and usage for jewelry, the precious metal is widely seen as a safe-haven asset, meaning that it is considered a good investment during turbulent times. Gold is also widely seen as a hedge against inflation and against depreciating currencies as it doesn’t rely on any specific issuer or government.
Central banks are the biggest Gold holders. In their aim to support their currencies in turbulent times, central banks tend to diversify their reserves and buy Gold to improve the perceived strength of the economy and the currency. High Gold reserves can be a source of trust for a country’s solvency. Central banks added 1,136 tonnes of Gold worth around $70 billion to their reserves in 2022, according to data from the World Gold Council. This is the highest yearly purchase since records began. Central banks from emerging economies such as China, India and Turkey are quickly increasing their Gold reserves.
Gold has an inverse correlation with the US Dollar and US Treasuries, which are both major reserve and safe-haven assets. When the Dollar depreciates, Gold tends to rise, enabling investors and central banks to diversify their assets in turbulent times. Gold is also inversely correlated with risk assets. A rally in the stock market tends to weaken Gold price, while sell-offs in riskier markets tend to favor the precious metal.
The price can move due to a wide range of factors. Geopolitical instability or fears of a deep recession can quickly make Gold price escalate due to its safe-haven status. As a yield-less asset, Gold tends to rise with lower interest rates, while higher cost of money usually weighs down on the yellow metal. Still, most moves depend on how the US Dollar (USD) behaves as the asset is priced in dollars (XAU/USD). A strong Dollar tends to keep the price of Gold controlled, whereas a weaker Dollar is likely to push Gold prices up.
- FOMC meeting ended with 50 bps interest rate cut to the 4.75%-5.00% range.
- The Dot Plot suggests a gradual easing cycle that hints at three cuts in 2024.
- Chair Powell stressed during his presser that the Fed is not in a rush.
The US Dollar Index (DXY), which measures the value of the USD against a basket of currencies, is trading flat near 100.70 on Thursday as the market digests the Federal Reserve's (Fed) 50-basis-point (bps) cut. The market overreacted to the news, intensifying expectations of further easing despite the Fed's efforts to indicate a gradual easing cycle. On Thursday, the US released strong Initial Jobless Claims figures, which stopped the USD’s bleeding.
The United States economy is experiencing mixed signals with signs of both deceleration and resilience. While some economic indicators suggest a slowdown, others indicate that activity remains robust. The Fed has indicated that the pace of future interest rate adjustments will be guided by incoming economic data, so the DXY index will be sensitive to incoming reports.
Daily digest market movers: US Dollar declining, market pricing in more easing
- FOMC cut rates by 50 bps on Wednesday, although the Dot Plot suggests a more gradual easing cycle going forward.
- Despite the Fed's efforts to push back against market easing expectations, they have intensified.
- After initially lowering its expectations following the decision, the market is now factoring in an additional 75 basis points of rate cuts by the end of the year.
- The market anticipates close to 250 basis points of further cuts over the next year, which would bring the fed funds rate significantly below the neutral level.
- Fed released updated macro forecasts, which show that growth remains robust in Q3.
- On the data front, US citizens who newly applied for unemployment insurance benefits reached 219K in the week ending September 14, below expectations and the previous weekly figure.
- Advance seasonally-adjusted insured unemployment rate was 1.2%, and the 4-week moving average was 227.
DXY technical outlook: DXY under bearish momentum, must recover 101.00
The DXY index indicators remain bearish, having lost the 20-day Simple Moving Average (SMA). Selling traction is mounting with the Relative Strength Index (RSI) trending downward below 50. The Moving Average Convergence Divergence (MACD) is printing lower green bars, indicating a shift to bearishness.
Supports are located at 100.50, 100.30 and 100.00, while resistance levels are at 101.00, 101.30 and 101.60.
US Dollar FAQs
The US Dollar (USD) is the official currency of the United States of America, and the ‘de facto’ currency of a significant number of other countries where it is found in circulation alongside local notes. It is the most heavily traded currency in the world, accounting for over 88% of all global foreign exchange turnover, or an average of $6.6 trillion in transactions per day, according to data from 2022. Following the second world war, the USD took over from the British Pound as the world’s reserve currency. For most of its history, the US Dollar was backed by Gold, until the Bretton Woods Agreement in 1971 when the Gold Standard went away.
The most important single factor impacting on the value of the US Dollar is monetary policy, which is shaped by the Federal Reserve (Fed). The Fed has two mandates: to achieve price stability (control inflation) and foster full employment. Its primary tool to achieve these two goals is by adjusting interest rates. When prices are rising too quickly and inflation is above the Fed’s 2% target, the Fed will raise rates, which helps the USD value. When inflation falls below 2% or the Unemployment Rate is too high, the Fed may lower interest rates, which weighs on the Greenback.
In extreme situations, the Federal Reserve can also print more Dollars and enact quantitative easing (QE). QE is the process by which the Fed substantially increases the flow of credit in a stuck financial system. It is a non-standard policy measure used when credit has dried up because banks will not lend to each other (out of the fear of counterparty default). It is a last resort when simply lowering interest rates is unlikely to achieve the necessary result. It was the Fed’s weapon of choice to combat the credit crunch that occurred during the Great Financial Crisis in 2008. It involves the Fed printing more Dollars and using them to buy US government bonds predominantly from financial institutions. QE usually leads to a weaker US Dollar.
Quantitative tightening (QT) is the reverse process whereby the Federal Reserve stops buying bonds from financial institutions and does not reinvest the principal from the bonds it holds maturing in new purchases. It is usually positive for the US Dollar.
- The Dow Jones broke above 42,000 to set a third straight all-time high on Thursday.
- Equities are firmly bullish after the Fed’s long-awaited rate cut this week.
- The Fed’s jumbo 50 bps on Wednesday has paved the way for further cuts this year.
The Dow Jones Industrial Average (DJIA) pierced the 42,000 psychological level on Thursday as equities drove higher in a broad-market bull run after the Federal Reserve (Fed) finally delivered its first rate cut in over four years. Equities have gone full-tilt into a risk-on stance, and the Dow Jones is on pace to close up nearly 600 points in record territory.
On the data side, US Initial Jobless Claims eased back to 219K for the week ended September 13, down from the previous week’s revised 231K and under the median market forecast of 230K. The Philadelphia Fed Manufacturing Survey for September also printed well above expectations, with the spread index of manufacturing conditions improving to 1.7 from the previous seven-month low of -7.0 and handily beating the expected print of -1.0.
Fed Chair Jerome Powell convinced markets that the Fed’s outsized jumbo cut of 50 bps this week wasn’t a snap response to deteriorating economic conditions but rather an attempt to get ahead of the curve and bolster the US labor market. Powell successfully floated a rebranding of an entire half-percentage-point cut as a “recalibration,” and investors rewarded the Fed’s latest narrative pivot by plowing cash into equities across the board.
Dow Jones news
Despite some securities stuck stubbornly in the red, most of the Dow Jones board is deep in the green on Thursday. Salesforce (CRM) and Caterpillar (CAT) have climbed over 5% from the morning’s open, tapping $266 and $373 per share, respectively. Salesforce is on the rise despite an announcement that Disney (DIS) would be ceasing their use of Salesforce-owned Slack as a company communication product after a security exploit allowed a hacking entity to capture and leak a terabyte of company information.
Dow Jones price forecast
With Dow Jones climbing around 600 points at its highest on Thursday, the major equity index is on pace to capture yet another record close as price action digs in north of 42,000. The Dow Jones’ stellar 2024 performance is continuing unabated, with the stock board set to close in the green for a fifth straight month.
Buyer exhaustion continues to threaten intraday positions built up from the midweek pullback into 41,500. However, any real threat would first require enough short pressure to get baked into the chart, a difficult proposition with current prices facing no technical resistance and the Dow Jones trading a blistering 8% above the long-term 200-day Exponential Moving Average (EMA) at 38,656.
Dow Jones daily chart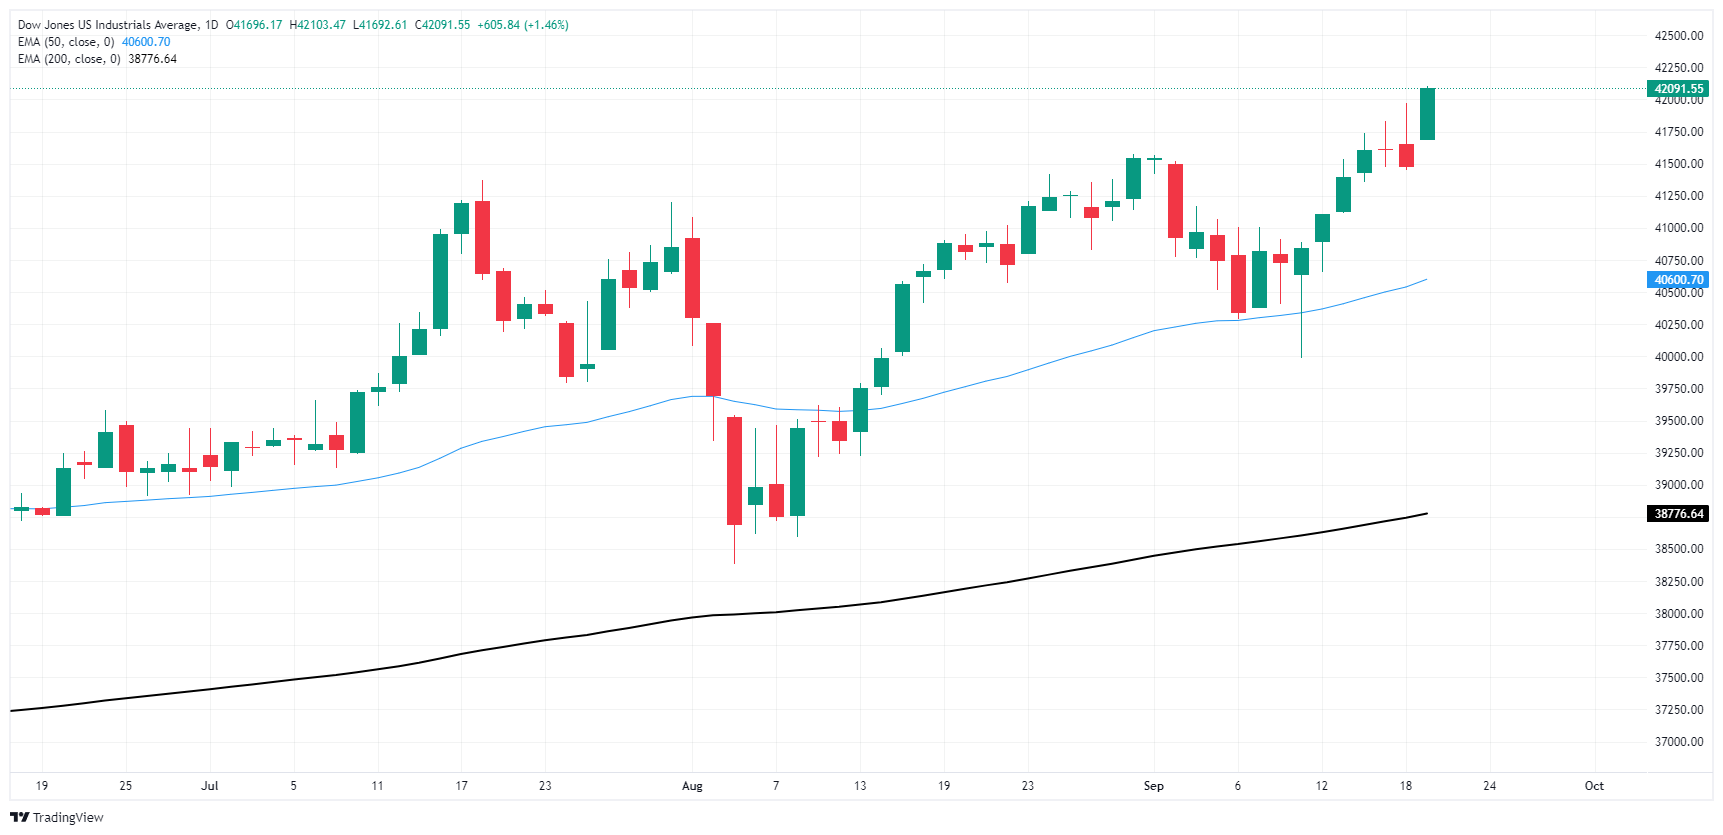
Dow Jones FAQs
The Dow Jones Industrial Average, one of the oldest stock market indices in the world, is compiled of the 30 most traded stocks in the US. The index is price-weighted rather than weighted by capitalization. It is calculated by summing the prices of the constituent stocks and dividing them by a factor, currently 0.152. The index was founded by Charles Dow, who also founded the Wall Street Journal. In later years it has been criticized for not being broadly representative enough because it only tracks 30 conglomerates, unlike broader indices such as the S&P 500.
Many different factors drive the Dow Jones Industrial Average (DJIA). The aggregate performance of the component companies revealed in quarterly company earnings reports is the main one. US and global macroeconomic data also contributes as it impacts on investor sentiment. The level of interest rates, set by the Federal Reserve (Fed), also influences the DJIA as it affects the cost of credit, on which many corporations are heavily reliant. Therefore, inflation can be a major driver as well as other metrics which impact the Fed decisions.
Dow Theory is a method for identifying the primary trend of the stock market developed by Charles Dow. A key step is to compare the direction of the Dow Jones Industrial Average (DJIA) and the Dow Jones Transportation Average (DJTA) and only follow trends where both are moving in the same direction. Volume is a confirmatory criteria. The theory uses elements of peak and trough analysis. Dow’s theory posits three trend phases: accumulation, when smart money starts buying or selling; public participation, when the wider public joins in; and distribution, when the smart money exits.
There are a number of ways to trade the DJIA. One is to use ETFs which allow investors to trade the DJIA as a single security, rather than having to buy shares in all 30 constituent companies. A leading example is the SPDR Dow Jones Industrial Average ETF (DIA). DJIA futures contracts enable traders to speculate on the future value of the index and Options provide the right, but not the obligation, to buy or sell the index at a predetermined price in the future. Mutual funds enable investors to buy a share of a diversified portfolio of DJIA stocks thus providing exposure to the overall index.
- Mexican Peso holds firm despite Fed's 50 bps rate cut.
- Fed projects federal funds rate at 4.4% for 2024, balancing price stability and employment goals.
- Investors await Banxico's upcoming decision with a 0.25% rate cut expected on September 26.
The Mexican Peso remained unchanged against the US Dollar during the North American session on Thursday after the Federal Reserve (Fed) lowered interest rates for the first time in four years. Data from the United States (US) failed to spark a movement on the exotic pair as the USD/MXN trades at 19.26, virtually unchanged.
A scarce Mexican economic docket leaves the emerging market currency leaning into the dynamics of the US economy. On Wednesday, the Fed cut rates by 50 basis points (bps) as it grew confident that inflation will “sustainably” attain its 2% goal and the labor market won’t soften further. In its monetary policy statement, Fed Chair Jerome Powell acknowledged that the dual mandate of price stability and maximum employment is now roughly balanced while noting that the economic outlook remains uncertain.
In the same meeting, Fed officials updated the Summary of Economic Projections (SEP) or Dot Plot, in which they foresee the federal funds rate finishing 2024 at 4.4%.
Recently, the US Department of Labor revealed that the number of Americans filing for unemployment benefits for the week ending September 14 was lower than expected but improved compared to the last reading.
The USD/MXN exotic pair rose toward a daily high of 19.40 after the data as this could dent the US central bank from easing policy aggressively, instead sticking to quarter percentage point reductions.
Meanwhile, investor eyes are on the Bank of Mexico (Banxico), which is expected to lower rates by 0.25% at the September 26 monetary policy meeting decision.
Daily digest market movers: Mexican Peso firm after Fed decision
- The widening of the interest rate differential between Mexico and the US could warrant further downside in the USD/MXN. Nevertheless, fears of the judicial reform capped the Mexican Peso from rallying.
- According to different banks and rating agencies, the impact of overhauling the judicial system remains far from being felt. The lack of a state of law and transparency could be factors in adjusting Mexico’s creditworthiness over the longer term.
- US Initial Jobless Claims for the week ending September 14 dipped from 231K to 219K, below estimates of 230K.
- US Existing Home Sales plunged 2.5% MoM in August, after dipping from 3.96 million to 3.86 million, declining for the fourth time in the year.
- During his press conference, Fed Chair Powell said the risks of inflation diminished and underscored that the economy remained strong. He kept the Fed’s options open, meaning that if inflation persists they can adjust the pace of easing.
- Powell added that SEP data shows the Committee is not in a rush to normalize policy.
- Fed expects inflation to condense to 2.6% in 2024, 2.2% in 2025 and 2% by 2026, according to the Core Personal Consumption Expenditures Price Index.
- Fed officials estimate the US economy will grow at a 2% pace in 2024, with the Unemployment Rate rising to 4.4% by the end of the year.
- December 2024 fed funds rate futures contracting suggests that the Fed might lower rates by at least 69 basis points, implying that in the following two meetings, the market expects one 50 bps and one 25 bps rate cut left in 2024.
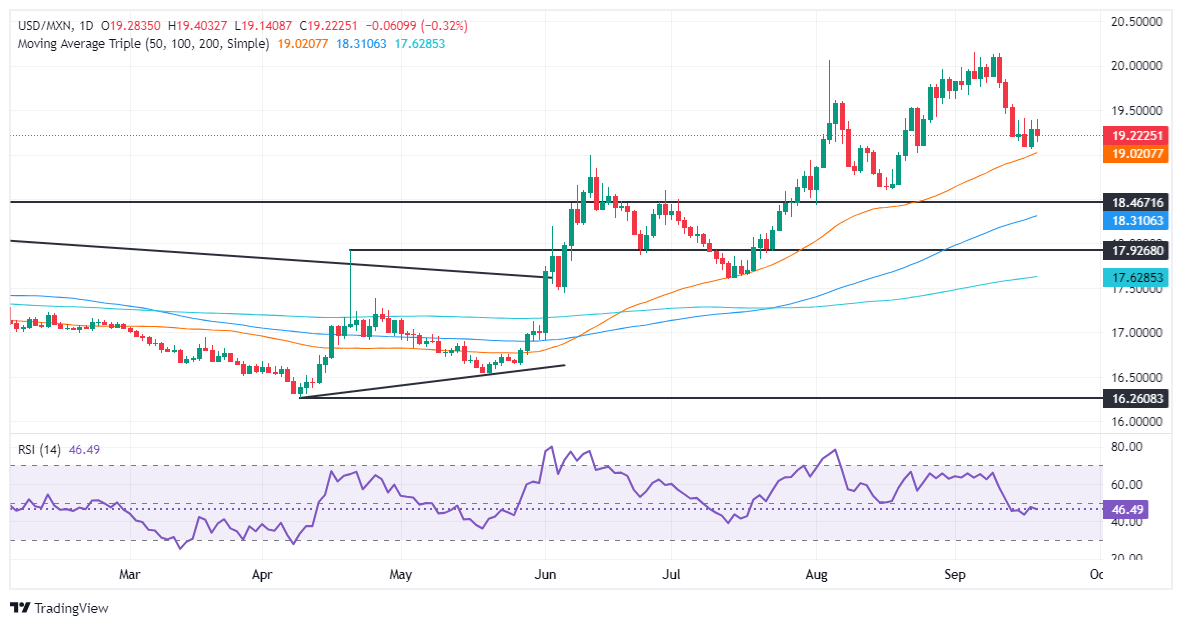
USD/MXN technical outlook: Mexican Peso falls as USD/MXN holds gains above 19.30
The USD/MXN uptrend remains in place, though the pair has failed to rally following the Fed’s decision. Next week, Banxico’s policy meeting could push the exchange rate out of the 19.00 – 19.50 range.
Momentum remains mixed but in the short-term it favors sellers as depicted by the Relative Strength Index (RSI).
That said, if the USD/MXN drops below the September 18 low of 19.06, it will expose the psychological 19.00 figure. Further losses lie underneath with the next support being the 50-day Simple Moving Average (SMA) at 18.99, followed by the last cycle low of 18.59, the August 19 daily low.
Conversely, If the USD/MXN climbs above 19.50, the next resistance would be the 20.00 psychological level. Further upside emerges at the yearly peak at 20.22, followed by the 20.50 mark.
Mexican Peso FAQs
The Mexican Peso (MXN) is the most traded currency among its Latin American peers. Its value is broadly determined by the performance of the Mexican economy, the country’s central bank’s policy, the amount of foreign investment in the country and even the levels of remittances sent by Mexicans who live abroad, particularly in the United States. Geopolitical trends can also move MXN: for example, the process of nearshoring – or the decision by some firms to relocate manufacturing capacity and supply chains closer to their home countries – is also seen as a catalyst for the Mexican currency as the country is considered a key manufacturing hub in the American continent. Another catalyst for MXN is Oil prices as Mexico is a key exporter of the commodity.
The main objective of Mexico’s central bank, also known as Banxico, is to maintain inflation at low and stable levels (at or close to its target of 3%, the midpoint in a tolerance band of between 2% and 4%). To this end, the bank sets an appropriate level of interest rates. When inflation is too high, Banxico will attempt to tame it by raising interest rates, making it more expensive for households and businesses to borrow money, thus cooling demand and the overall economy. Higher interest rates are generally positive for the Mexican Peso (MXN) as they lead to higher yields, making the country a more attractive place for investors. On the contrary, lower interest rates tend to weaken MXN.
Macroeconomic data releases are key to assess the state of the economy and can have an impact on the Mexican Peso (MXN) valuation. A strong Mexican economy, based on high economic growth, low unemployment and high confidence is good for MXN. Not only does it attract more foreign investment but it may encourage the Bank of Mexico (Banxico) to increase interest rates, particularly if this strength comes together with elevated inflation. However, if economic data is weak, MXN is likely to depreciate.
As an emerging-market currency, the Mexican Peso (MXN) tends to strive during risk-on periods, or when investors perceive that broader market risks are low and thus are eager to engage with investments that carry a higher risk. Conversely, MXN tends to weaken at times of market turbulence or economic uncertainty as investors tend to sell higher-risk assets and flee to the more-stable safe havens.
- EUR/GBP weakens further, and buying pressure continues to retreat.
- The latest price action and technical indicators suggest that further downside is on the table.
- The 0.8380 presents a strong barrier against the sellers.
Thursday's session saw the EUR/GBP slightly decline by 0.20% below 0.8400. Looking at the technicals the overall bias remains bearish as selling pressure intensifies, the cross must hold the 0.8380 line to avoid further losses.
The Relative Strength Index (RSI) is currently at 37 and is declining sharply in the negative area, indicating that selling pressure is rising. Moreover, the Moving Average Convergence Divergence (MACD) also suggests that selling pressure is rising, as the histogram is red and rising.
EUR/GBP daily chart
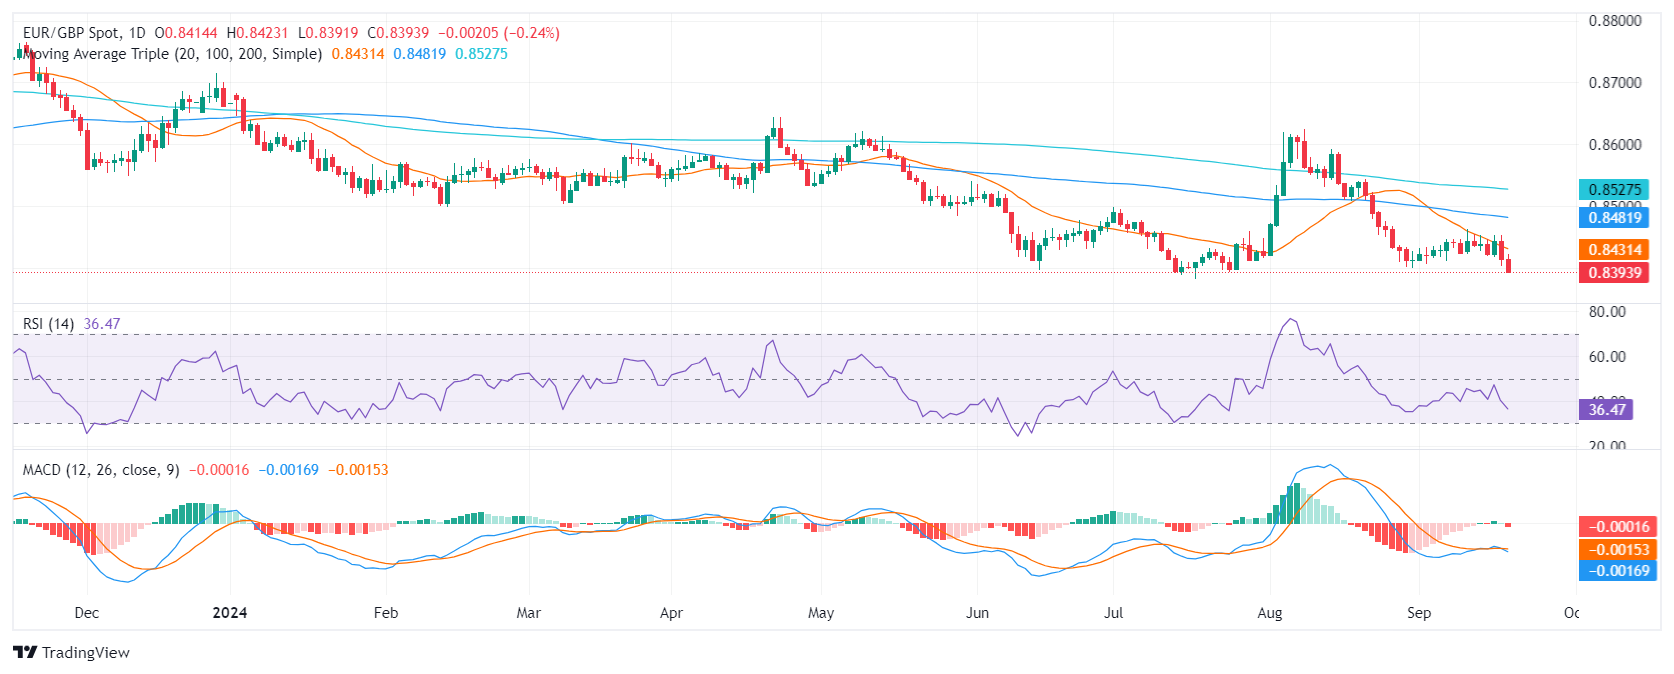
Based on the current technical picture, the EUR/GBP is likely to continue trading lower and support levels can be found at 0.8380, 0.8350, and 0.8330. Resistance levels can be found at 0.8430 (20-day SMA), 0.8450, and 0.8500. The 0.8380 is a strong support which if breached would mark a low since 2022 and would confirm a negative outlook for the cross.
- EUR/JPY gains 0.80% as risk-on sentiment pressures safe-haven currencies like the Yen and Swiss Franc.
- ECB’s Klas Knot suggests room for further rate cuts, while Isabel Schnabel pushes back, citing sticky services inflation in the Eurozone.
- BoJ expected to leave rates unchanged, but Governor Ueda hints at potential future hikes if the economy meets expectations.
The Euro rallied sharply against the Japanese Yen on Thursday amid a scarce economic docket. The aftermath of the Federal Reserve’s decision keeps the FX space seesawing as traders scramble after a 50-basis point “hawkish” rate cut. The EUR/JPY trades at 159.54, a gain of over 0.80%.
EUR/JPY rises on upbeat market mood, as ECB members divided on rate cuts and BoJ expected to hold rates
A risk-on impulse has weighed on safe-haven currencies like the Yen and the Swiss Franc. In addition, the rise of the USD/JPY boosted the EUR/JPY, alongside some European Central Bank (ECB) speakers crossing the wires.
Dutch Central Bank President Klas Knot stated that there’s room for further cuts attuned to market expectations. On the other hand, Isabel Schnabel pushed back against easing, commenting that services inflation remains stickier in large parts of the Euro area (EU) and that signs of transmission of monetary policy tightening are weakening.
On the Japanese front, the Bank of Japan is expected to keep rates unchanged at the upcoming meeting, though it’s expected to adjust its quantitative easing policy. The BoJ’s last policy meeting triggered market volatility, which the Japanese parliament questioned.
BoJ Governor Kazuo Ueda appeared in parliament and justified the bank’s decision, hinting that further hikes are coming if the economy performs as foreseen. Other BoJ members supported his view to continue to tighten monetary policy with the likes of Takata, Nakagawa, and Tamura, signaling that further rates are needed if firms increase capex, wages, and prices.
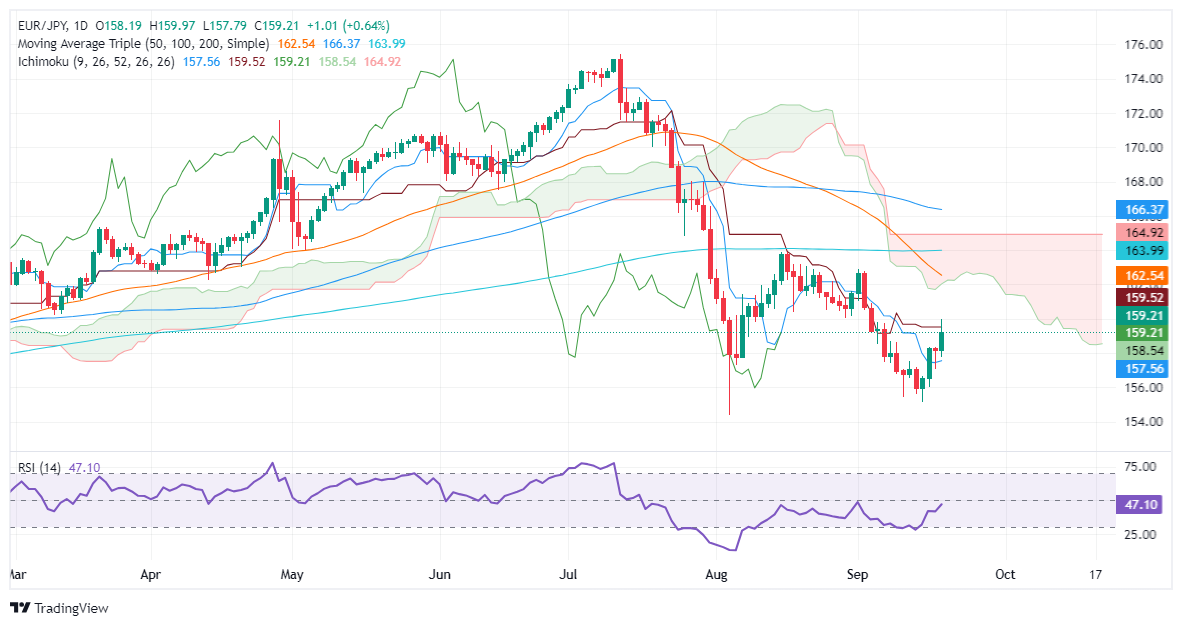
EUR/JPY Price Forecast: Technical outlook
From a technical standpoint, the EUR/JPY remains bearish, with price action standing below the Ichimoku Cloud (Kumo) and the 200-day moving average (DMA). Although the cross spiked toward 160.00 in a short time, it has failed to remain above the Kijun-Sen at 159.51, which opens the door for a pullback. If EUR/JPY drops decisively below 159.00, the next support would be the Senkou Span A at 158.53, followed by the psychological 158.00 figure ahead of the Tenkan-Sen at 157.55.
On the other hand, if buyers reclaim 160.00, look for a test of the bottom of the Kumo at 161.90-162.00.
Bank of Japan FAQs
The Bank of Japan (BoJ) is the Japanese central bank, which sets monetary policy in the country. Its mandate is to issue banknotes and carry out currency and monetary control to ensure price stability, which means an inflation target of around 2%.
The Bank of Japan has embarked in an ultra-loose monetary policy since 2013 in order to stimulate the economy and fuel inflation amid a low-inflationary environment. The bank’s policy is based on Quantitative and Qualitative Easing (QQE), or printing notes to buy assets such as government or corporate bonds to provide liquidity. In 2016, the bank doubled down on its strategy and further loosened policy by first introducing negative interest rates and then directly controlling the yield of its 10-year government bonds.
The Bank’s massive stimulus has caused the Yen to depreciate against its main currency peers. This process has exacerbated more recently due to an increasing policy divergence between the Bank of Japan and other main central banks, which have opted to increase interest rates sharply to fight decades-high levels of inflation. The BoJ’s policy of holding down rates has led to a widening differential with other currencies, dragging down the value of the Yen.
A weaker Yen and the spike in global energy prices have led to an increase in Japanese inflation, which has exceeded the BoJ’s 2% target. With wage inflation becoming a cause of concern, the BoJ looks to move away from ultra loose policy, while trying to avoid slowing the activity too much.
- NZD/USD faces pressure to grip a two-week high of 0.6270 due to a decent recovery in the US Dollar.
- Lower-than-expected US jobless claims data prompted US Dollar’s recovery.
- The NZ economy contracted at a slower-than-expected pace in the second quarter of this year.
The NZD/USD pair gains significantly by more than 0.5% but struggles to seize the two-week high of 0.6270 in Thursday’s North American session. The Kiwi asset faces slight pressure as the US Dollar (USD) has rebounded after the release of the United States (US) Initial Jobless Claims data for the week ending September.
The number of individuals claiming jobless benefits for the first time was 219K, lower than estimates of 230K, and the former release of 231K, upwardly revised from 230K. The impact of the better-than-expected jobless claims data is expected to be short-lived as market speculation for the Federal Reserve (Fed) interest rate cut path will pay a major role in its next move.
On Wednesday, the Fed delivered its first dovish decision in more than four years as policymakers are committed to restoring a higher Unemployment Rate and are confident that inflation is on track to return to the bank’s target of 2%. The Fed cut interest rates by 50 basis points (bps) to 4.75%-5.00%, and policymakers see federal fund rates heading to 4.4% by the year-end. On the contrary, traders expect interest rates to fall by a total of 125 bps this year to 4.00%-4.25%.
Meanwhile, the market sentiment is upbeat as investors expect the Fed to continue the policy-easing cycle aggressively. The S&P 500 has opened on a strong note, exhibiting a higher risk appetite of investors. The US Dollar Index (DXY), which tracks the Greenback’s value against six major currencies, recovers its intraday losses and bounces back above 101.00.
In the Asia-Pacific region, the New Zealand Dollar (NZD) strengthens as the domestic Q2 Gross Domestic Product (GDP) data came in better than expected. The NZ economy contracted by 0.2% after expanding by 0.1% in the previous quarter.
The pace at which the economy declined was slower than expectations of 0.4%. Going forward, investors will focus on the People’s Bank of China (PBoC) interest rate decision, which will be announced on Friday. It is worth noting that the NZ economy is one of the largest trading partners to China and a dovish decision by the PBoC would strengthen the Kiwi dollar.
New Zealand Dollar FAQs
The New Zealand Dollar (NZD), also known as the Kiwi, is a well-known traded currency among investors. Its value is broadly determined by the health of the New Zealand economy and the country’s central bank policy. Still, there are some unique particularities that also can make NZD move. The performance of the Chinese economy tends to move the Kiwi because China is New Zealand’s biggest trading partner. Bad news for the Chinese economy likely means less New Zealand exports to the country, hitting the economy and thus its currency. Another factor moving NZD is dairy prices as the dairy industry is New Zealand’s main export. High dairy prices boost export income, contributing positively to the economy and thus to the NZD.
The Reserve Bank of New Zealand (RBNZ) aims to achieve and maintain an inflation rate between 1% and 3% over the medium term, with a focus to keep it near the 2% mid-point. To this end, the bank sets an appropriate level of interest rates. When inflation is too high, the RBNZ will increase interest rates to cool the economy, but the move will also make bond yields higher, increasing investors’ appeal to invest in the country and thus boosting NZD. On the contrary, lower interest rates tend to weaken NZD. The so-called rate differential, or how rates in New Zealand are or are expected to be compared to the ones set by the US Federal Reserve, can also play a key role in moving the NZD/USD pair.
Macroeconomic data releases in New Zealand are key to assess the state of the economy and can impact the New Zealand Dollar’s (NZD) valuation. A strong economy, based on high economic growth, low unemployment and high confidence is good for NZD. High economic growth attracts foreign investment and may encourage the Reserve Bank of New Zealand to increase interest rates, if this economic strength comes together with elevated inflation. Conversely, if economic data is weak, NZD is likely to depreciate.
The New Zealand Dollar (NZD) tends to strengthen during risk-on periods, or when investors perceive that broader market risks are low and are optimistic about growth. This tends to lead to a more favorable outlook for commodities and so-called ‘commodity currencies’ such as the Kiwi. Conversely, NZD tends to weaken at times of market turbulence or economic uncertainty as investors tend to sell higher-risk assets and flee to the more-stable safe havens.
Bank of England (BoE) left the policy unchanged, as expected, at 5%, in a 8-1 split vote, Rabobank’s Senior Macro Strategist Stefan Koopman notes.
Another patient pause due in December
“As expected, unchanged policy from the Bank of England. In a 8-1 split vote, the MPC held the Bank rate at 5.00%. Only external member Dhingra dissented.”
“The majority view is that more cuts are needed, but at a gradual pace in order ‘not to cut interest rates too quickly, or too much’. The MPC believes there is a premium on patience. We think a 25bp cut in November is likely, before another patient pause in December.”
“The MPC also voted on the pace of gilt stock reduction for the 12 months ahead. It continues to proceed at a pace of GBP 100bn a year. That was also not a surprise. We don’t think this needs to be offset by lower policy rates.”
Price action in Gold is telling you that macro fund positioning is extreme, TDS commodity analyst Daniel Ghali notes.
The rise in macro fund positioning
“Of course, Gold's failure to rally north of the week's opening levels despite a 50bp cut from the Fed is one cue, but the strengthening correlation between Gold and the broad USD precisely mirrors the rise in macro fund positioning.”
“This contrasts with the last several years, where Gold's physical flows dominated financial flows, distorting the relationship with traditional financial indicators such as US rates & USD and provides additional evidence that Western macro & real money funds are the marginal buyers today.”
“However, we think macro fund positioning is already at extreme levels, analogous to July 2016 (Brexit referendum), Sep 2019 ("stealth QE") and the peak of the pandemic crisis in Mar2020. The strengthening correlation with the USD is case in point, and also hints at where the chink in the armor is for macro funds.”
The Fed joins the global easing cycle, and the focus now shifts to the relative pace of cuts, TDS macro analysts note.
Headline inflation to rise in the coming months
“While the relative timing of central banks' first cuts has been an important theme in markets in recent months, the focus now shifts to the relative pace of cuts, and here we see the Fed starting late and going faster. We see little reason why faster Fed cuts will spill over to other major central banks in the near-term, but risks skew to the downside in 2025 as inflation risks fade.”
“Despite souring sentiment in some regions, year-ahead growth forecasts have generally been revised up across the G5 in the last three months (the US is the exception). This is somewhat reflected in our global demand factor, which has moved off its lows, though still has some way to recover to positive territory.”
“Headline inflation will rise in the coming months in most economies. While mainly driven by base effects that central bankers will look through, it risks undoing some of the recent improvement in household inflation expectations.”
- GBP/USD rallies to new high for 2024 on Thursday. The trend is bullish.
- A bearish divergence with momentum, however, indicates an increased risk of a temporary setback.
GBP/USD has rallied to a new high for 2024 on Thursday; the pair reached 1.3314 during trading on Thursday, its highest price for the year.
The short, medium and long-term trends are bullish suggesting the current is flowing north. It is a principle of technical analysis that “the trend is your friend” so the odds favor still more upside.
GBP/USD Daily Chart
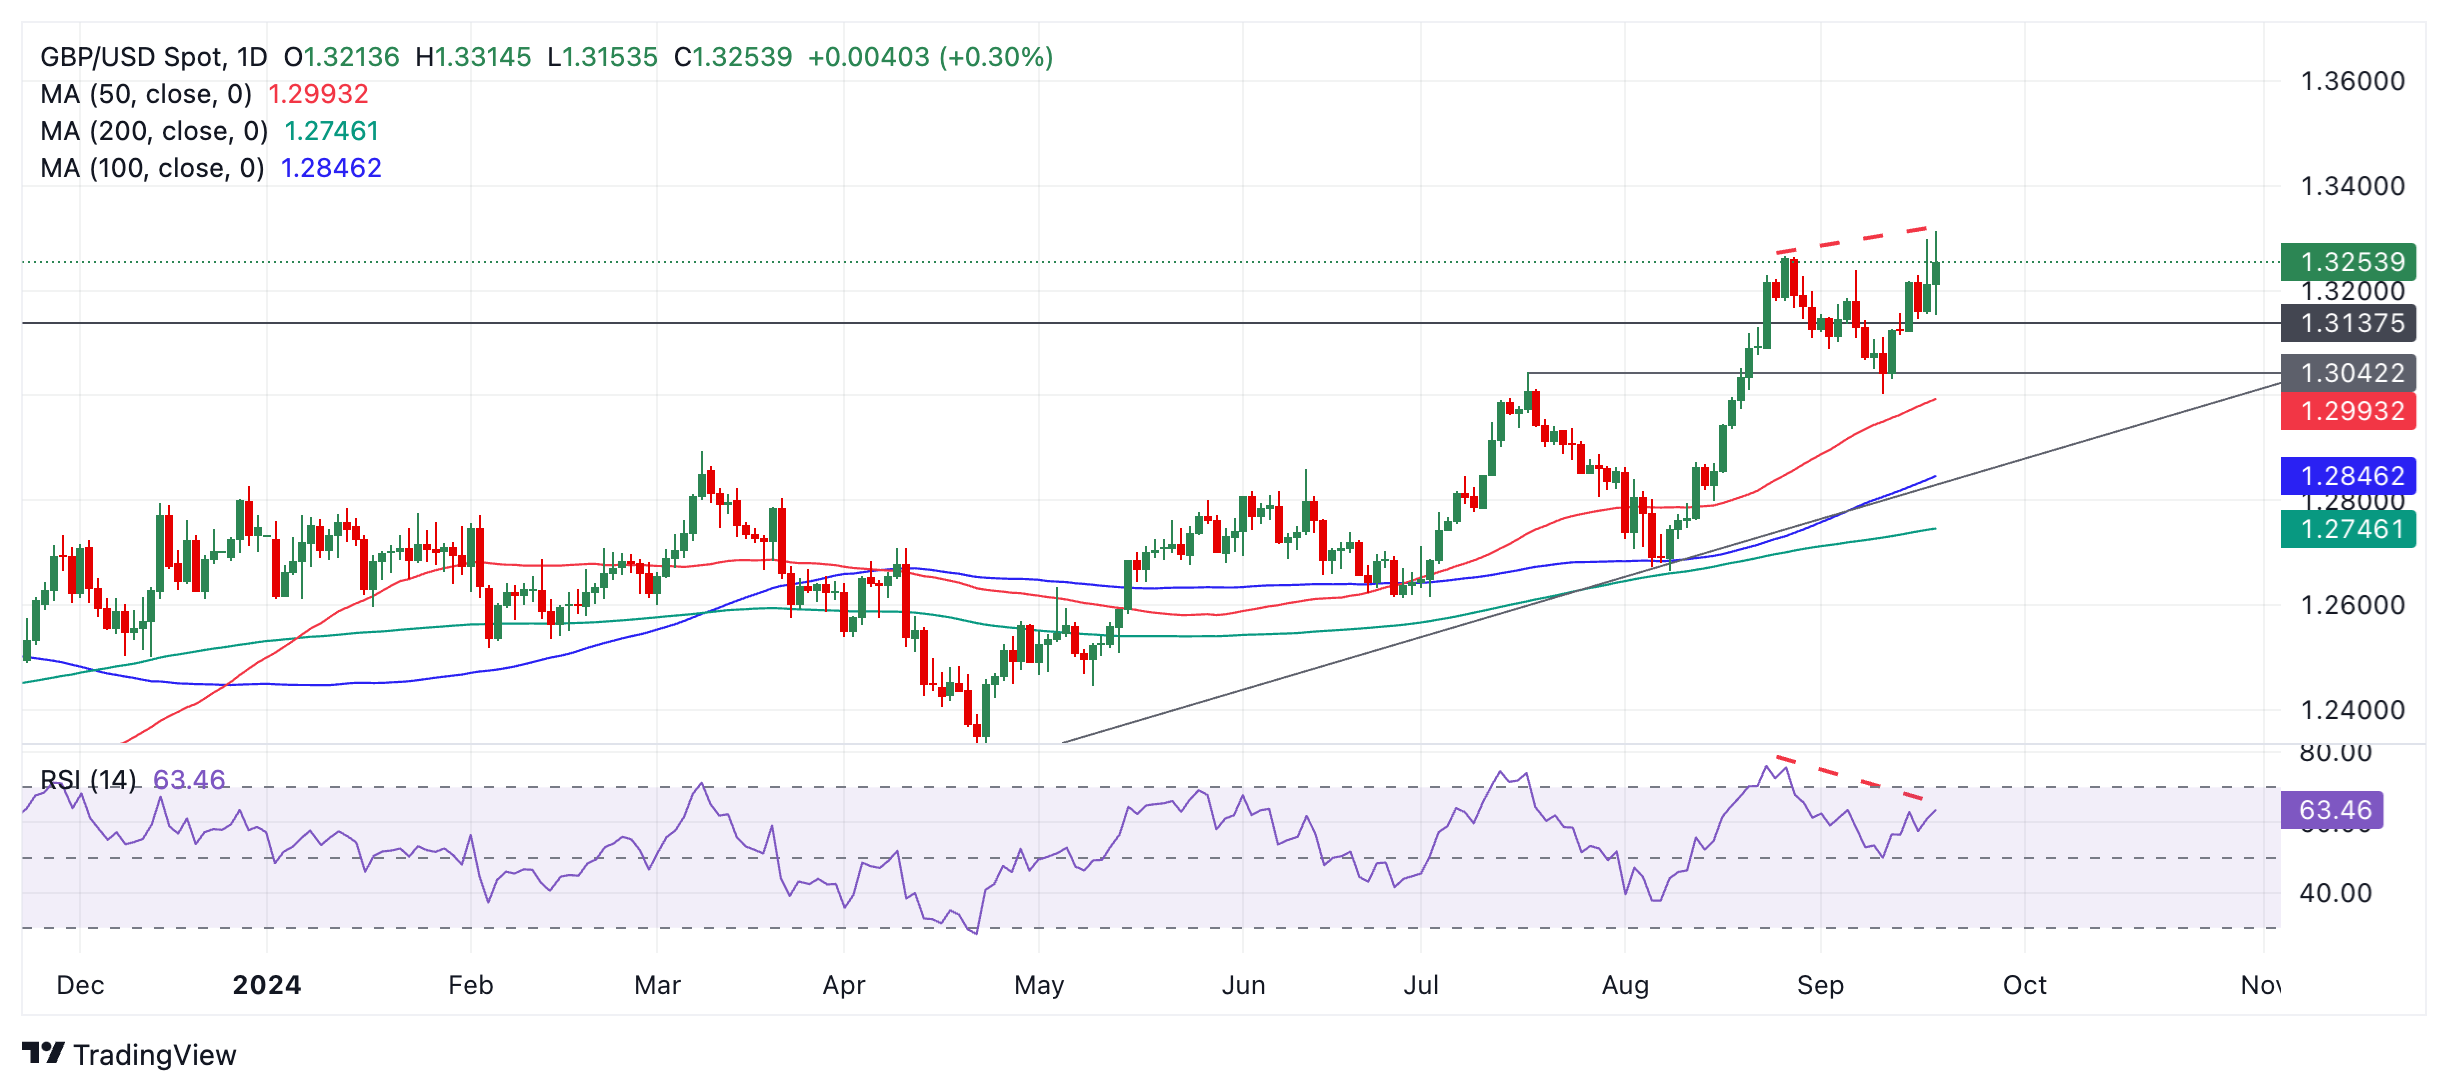
A break above 1.3314 would confirm more upside, targeting 1.3350 and then 1.3400.
However, price is showing bearish divergence with the Relative Strength Index (RSI) momentum indicator (red dashed lines on chart above). This happens when the price reaches a new high but the RSI does not. The non confirmation is a bearish sign as it indicates underlying weakness. There is an increased risk GBP/USD could pull back.
If the pair pulls back it will probably only be temporary as all three trend timeframes are bullish. Support at 1.3137 is likely to catch falling prices, or if not at 1.3042 (July 18 high).
- AUD/USD has posted a new high for the year, and could extend higher.
- It is showing bearish divergence with RSI so there is a risk of a pull back evolving.
AUD/USD reaches a new high for 2024 at 0.6839 on Thursday, after the leg higher that began at the September 11 lows extends. It has since edged back down marginally to just above the 0.6800 mark.
AUD/USD Daily Chart
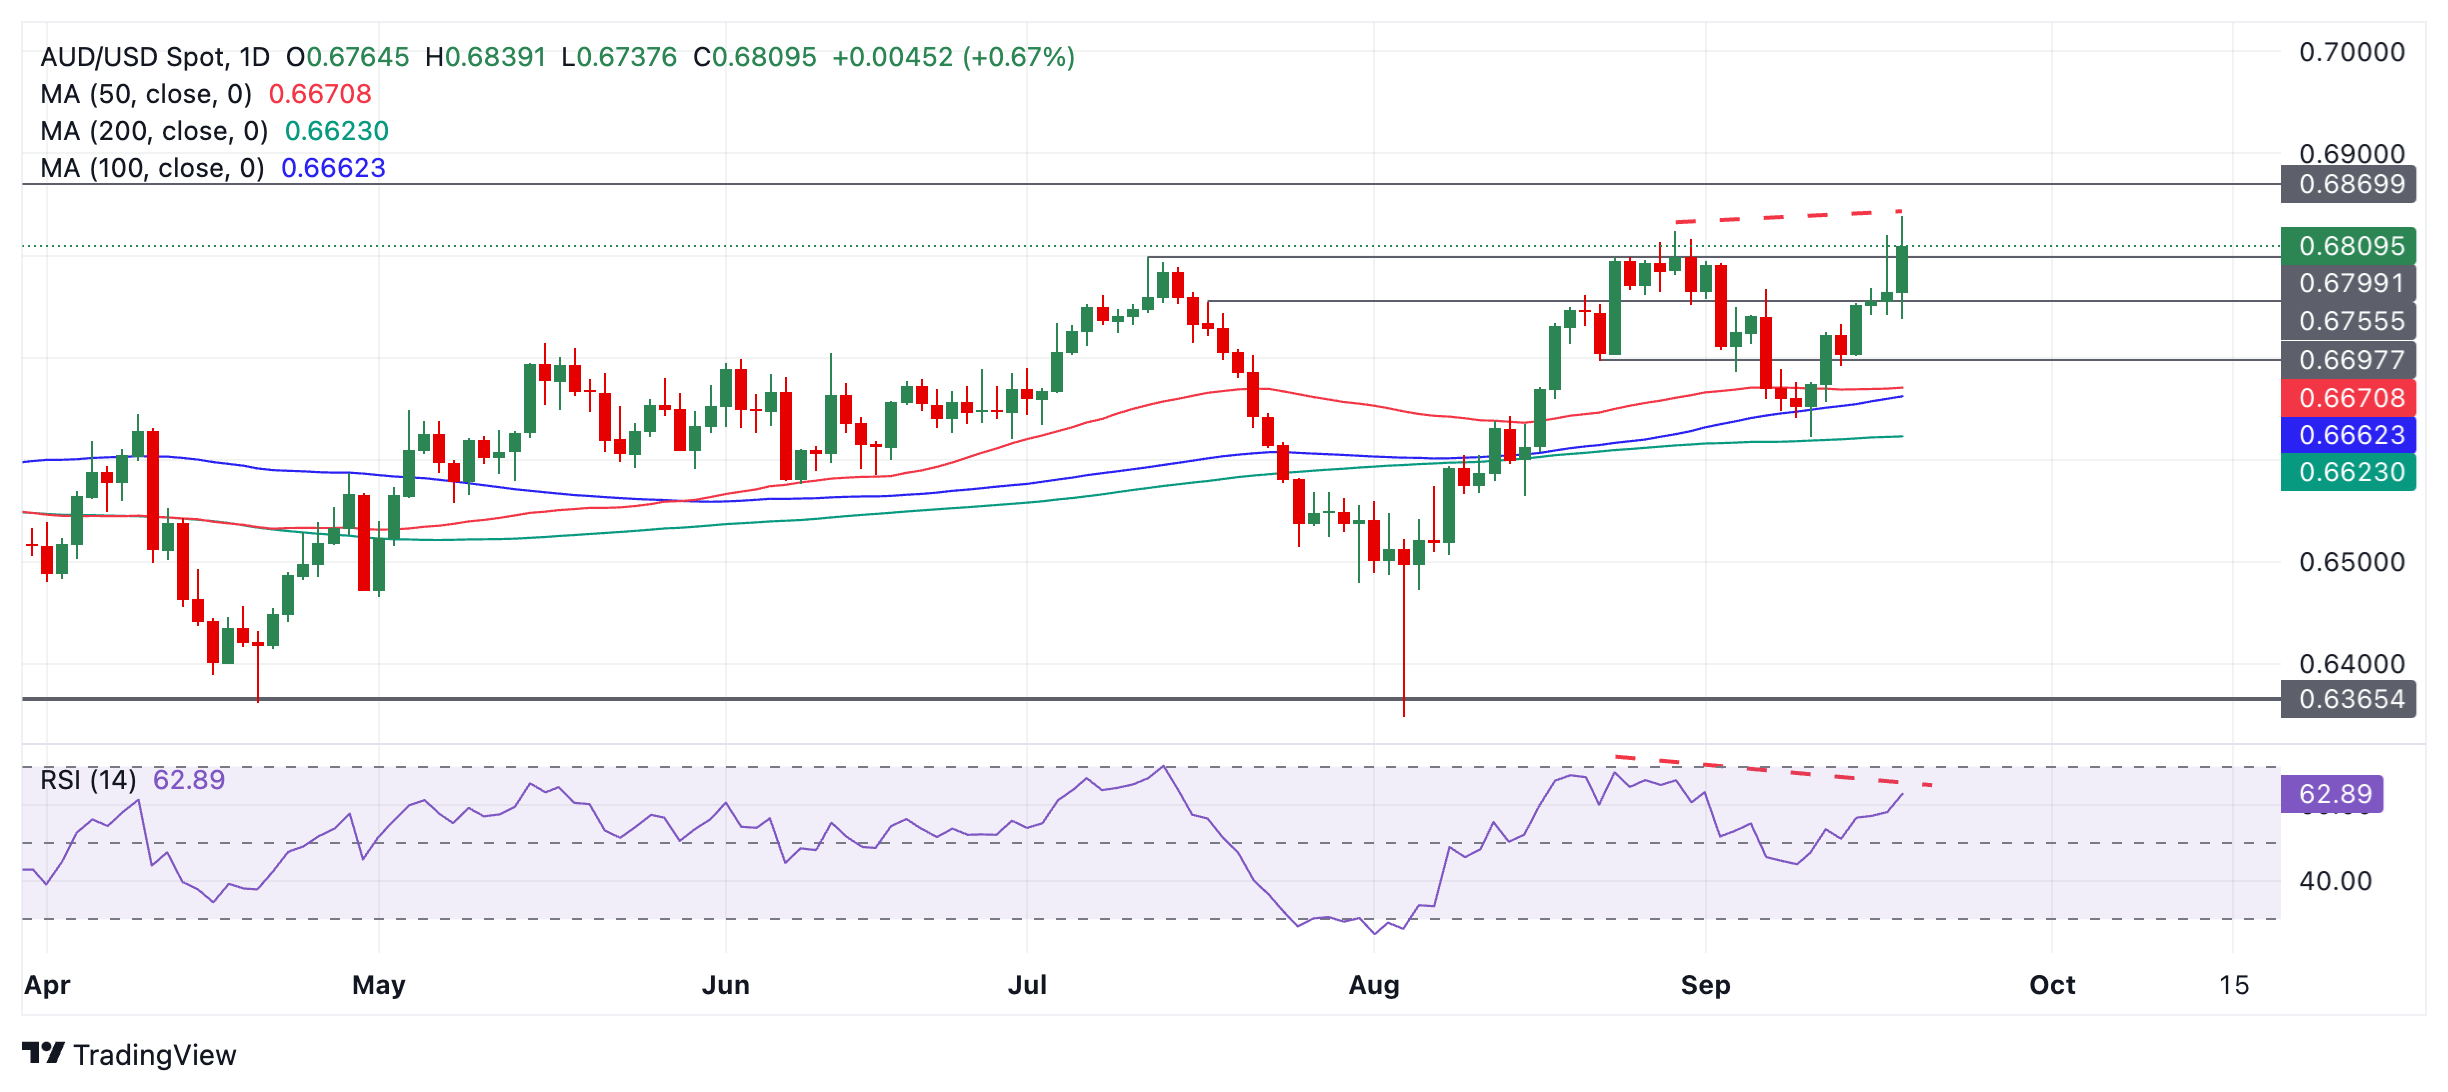
Price is showing mild bearish divergence with the Relative Strength Index (RSI) momentum indicator (red dashed lines on chart above). This happens when the price reaches a new high but the RSI does not. The non confirmation is a bearish sign as it indicates mild underlying weakness. It suggests AUD/USD is at risk of pulling back.
If a correction evolves it is likely to find support at around 0.6800 (July high), 0.6755 or 0.6698 (August 22 swing low).
AUD/USD is in a short-term uptrend, however, since the September 11 low and given it is a principle of technical analysis that “the trend is your friend” it will probably continue higher eventually – despite the bearish divergence with RSI. A break above the 0.6839 yearly high would confirm a continuation of the uptrend to a target at the 0.6870 level (December 2023 high).
Bank of England (BoE) Governor Andrew Bailey said on Thursday that he is optimistic that interest rates in the UK will fall but added that they need more evidence, per Reuters.
Bailey further explained that they need to see residual inflation pressures disappearing and that it's imperative that UK improved its current potential growth of 1.2%-1.3%. He also noted that the UK government will take the right decision on treatment of QT in fiscal rules.
Market reaction
These comments failed to trigger a noticeable reaction in GBP/USD. At the time of press, the pair was up 0.3% on the day at 1.3250.
- Initial Jobless Claims rose to 219K, down from the previous week's 231K.
- Continuing Jobless Claims increased to 1.829M in the week ending September 7.
US citizens that newly applied for unemployment insurance benefits reached 219K in the week ending September 14, according to the US Department of Labor (DoL) on Thursday. The prints came in below initial consensus (230K) and were lower than the previous weekly figure of 231K (revised from 230K).
Further details of the publication revealed that the advance seasonally adjusted insured unemployment rate was 1.2% and the 4-week moving average was 227.5K, a decrease of 3.5K from the previous week's revised average.
In addition, Continuing Claims dropped by 14K to 1.829M in the week ending September 7.
Market reaction
The US Dollar Index (DXY) trades in a volatile fashion and hovers just below the 101.00 mark following the release of US results.
- EUR/GBP declines following the BoE’s decision to keep interest rates unchanged.
- There had been speculation it might cut rates which would have weakened the Pound.
- The Euro retains support after hawkish commentary and data showing an increase in the Current Account surplus.
EUR/GBP is trading lower in the 0.8390s on Thursday, as it extends its breakdown from the shallow channel it had been edging higher within since the end of August.
The pair is trading a quarter of a percent lower on the day as the Pound Sterling (GBP) strengthens versus the Euro (EUR). The Pound is appreciating across the board after the Bank of England (BoE) voted by a majority of eight to one to keep interest rates unchanged at 5.00%. Only one member voted for a 0.25% cut. Sterling is seen gaining because relatively higher interest rates attract foreign investors, resulting in higher inflows of capital.
The BoE also announced it would be reducing its stock of gilts (UK government bonds) by 100 billion GBP between October 2024 and September 2025. This suggests it will not be buying gilts to replenish its existing stock when they mature. This, in turn, is likely to lead to a fall in gilt prices but a rise in gilt yields. Higher yields tend to support the Pound, but weigh on EUR/GBP.
The Euro, meanwhile, is also finding support due to hawkish commentary from European Central Bank (ECB) executive board member Isabel Schnabel, who said that “sticky services inflation is keeping headline inflation at an elevated level.” Her comments suggest the ECB will not cut interest rates aggressively since inflation remains high. However, she also added that “medium-term inflation projections often clustered around the 2% target,” and that “wage growth is expected to slow down as past price shocks unwind.”
Schnabel’s comments diverge from those of European Central Bank (ECB) Governing Council member and Bank of France President, François Villeroy de Galhau, who confirmed more cuts were on their way on Wednesday, saying that the “ECB is likely to continue to cut rates.”
Data showed the Eurozone registered a higher-than-expected Current Account surplus on Thursday. The Current Account in the Eurozone widened sharply to 48 billion EUR in July 2024 from 25.5 billion EUR a year earlier. A consistent surplus is a positive factor for a currency as it shows foreign demand for the currency to buy exports and services outweighs demand for foreign FX to buy imported goods and services.
EUR/GBP fell on Wednesday after core UK inflation data came out higher, beating estimates whilst Eurozone inflation was revised down. Relatively higher inflation supported Sterling because it indicates interest rates will remain relatively higher for longer.
The core Consumer Price Index (CPI) in the UK rose above expectations, registering a 3.6% increase YoY in August. This was well above the 3.3% of July and the 3.5% expected. In addition, services inflation also rose.
The Euro, meanwhile, experienced mild weakness after the Eurozone’s gauge of inflation, the Harmonized Index of Consumer Prices (HICP) was revised down to 0.1% MoM in August from a flash estimate of 0.2%, when no change was expected.
EUR/USD has climbed steadily through the overnight session to regain yesterday’s post-Fed peak against the USD, Scotiabank’s Chief FX Strategist Shaun Osborne notes.
EUR to retest upper 1.11s
“EUR gains are supported by narrowing yield spreads (EZ/US 2Y gap at –133bps today, the narrowest since May last year).”
“Narrower spreads suggest the EUR will remain well-supported on moderate dips and retain a firm tone against the USD for now. Fundamental challenges are creeping up on the EUR, however. The Bundesbank’s monthly report noted today that Germany may already be in a mild recession. A ‘broad-based, long-lasting slump’ was not expected, however.”
“Solid spot gains from the overnight low leave EURUSD trading close to yesterday’s peak and—despite the intraday chop yesterday—sustaining the bullish break out of the EUR August/September consolidation (bull flag). A push through minor resistance at 1.12 (August high) targets gains to 1.1275 (retracement and 2023 high). Support is 1.1120.”
The FOMC decision failed to shake the CAD out of its broad range. But the CAD has shaken off yesterday’s late session wobble to regain the mid-1.35s this morning amid broader USD weakness and firmer stocks and commodities, Scotiabank’s Chief FX Strategist Shaun Osborne notes.
CAD gains a cent from overnight low on the USD
“Spreads, which have been widening in the USD’s favour, should perhaps steady at least. Note USD/CAD is trading a little below estimated fair value (1.3583) this morning. BoC External Deputy Governor Nicolas Vincent speaks to the Sherbrooke Chamber of Commerce from around 08:15ET. His speech is titled ‘Monetary policy decision-making: behind the scenes’ but I doubt the comments will tell us much more than we already know.”
“USD/CAD pushed higher through to the mid1.36s in early Asian trade before sliding a cent over the balance of the session. Minor gains from the European session low around 1.3540 are not yet strong enough to suggest that a base for the USD is developing.”
“Trend momentum signals are leaning USD-bearish on the short-term chart and a low close for the USD on the day (which would confirm a bearish outside reversal) would suggest building downside risks for spot and a potential retest of the late August low at 1.3440.”
- GBP/JPY pivoted on September 11 and started moving higher.
- This new up move has extended following the BoE decision to leave interest rates unchanged.
GBP/JPY formed a Hammer candlestick reversal pattern at the September 11 lows and has been pushing higher ever since. It has had an extra left on Thursday following the Bank of England (BoE) interest rate decision.
GBP/JPY Daily Chart
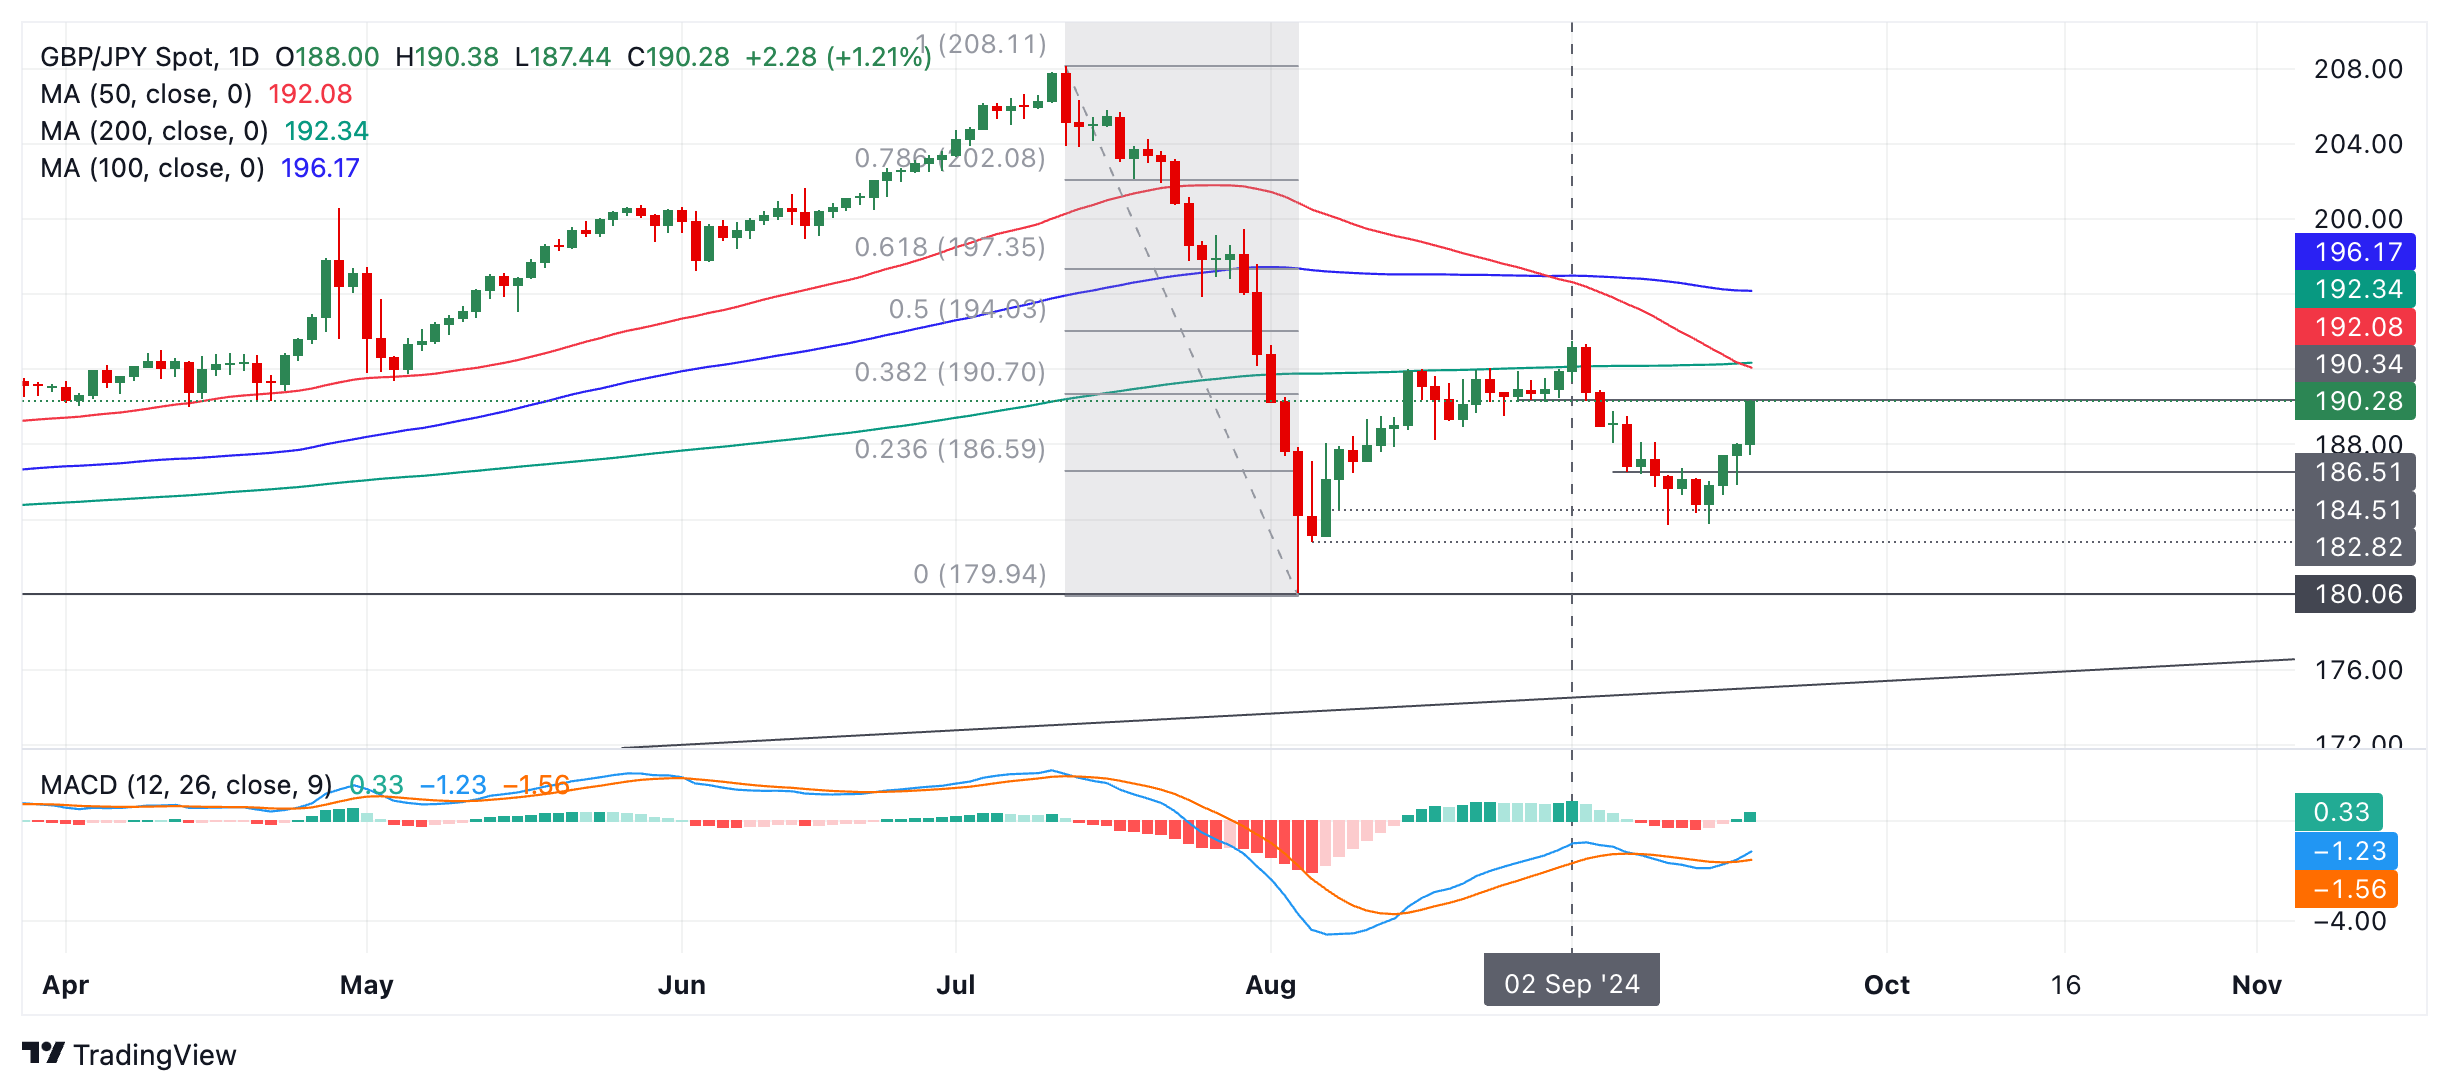
A new short-term uptrend appears to have formed and is carrying GBP/JPY higher. It is currently hitting support-turned-resistance at 190.34 and could stall. If it decisively breaks higher it will probably target the 50 and 200-day Simple Moving Averages at 192.08 and 190.34 respectively. These are likely to produce even more resistance and may be difficult to break above.
The medium-term trend is sideways and chaotic providing no hints as to where the underlying current is flowing.
This suggests caution should be exercised by traders as price could flip at any moment and start moving in the opposite direction.
The bold move from the Fed was accompanied by a significant shift in the Fed’s rate outlook. The USD weakened before reversing to trade little changed into the close Wednesday. A clear push below 100.50/55 targets a drop to the 99.00/50 area in the short run and will point to more sustained index weakness in the medium term, Scotiabank’s Chief FX Strategist Shaun Osborne notes.
USD back on the defensive this morning
“Chair Powell projected calm in yesterday’s press conference, suggesting the bold cut was not a ‘catch up’ move but rather recalibration in response to developments in the labour market and inflation since the last meeting. Still, the prospect of a steady string of rate cuts in the US versus slower progress in Europe will still drive pressure on the USD from a medium-term point of view.”
“The choppy market response to the decision yesterday—the USD weakened before reversing to trade little changed into the close Wednesday—looks like little more than position adjustment after the fact with the USD back on the defensive this morning.”
“Intraday price action for the USD looks quite soft and leaves the DXY pressuring support around the 100.50/55 area again. A clear push below this point targets a drop to the 99.00/50 area in the short run and will point to more sustained index weakness in the medium term.”
The BoE left policy on hold, as expected at today’s policy decision. The Pound Sterling (GBP) is slightly firmer on the hold, Scotiabank’s Chief FX Strategist Shaun Osborne notes.
BoE puts the rate on hold
«Policymakers were split on the decision again but the 8-1 vote was a bit cleaner than the 7-2 expected by markets. Swaps are pricing out a small amount of BoE easing risk over the balance of this year. Governor Bailey said the BoE should be able to cut rates ‘gradually’ over time. There is no press conference today but the governor and MPC member Mann are speaking tomorrow.”
“The Pound Sterling (GBP) is slightly firmer on the hold and split decision but gains through the low 1.33s take Cable to its highest since March 2022. GBP is finding firm support on weakness to the 1.3150 area and has rebounded strongly from yesterday’s late session to retest the 1.33 area.”
“GBP is maintaining a steady trend appreciation against the USD, supported by a bullish alignment of trend strength oscillators across the short-, medium– and long-term charts. Key resistance sits at 1.3330 (long-term retracement) ahead of a return to the 1.35/1.40 zone.”
- USD/CAD has formed a candlestick reversal pattern on the daily chart.
- This could mark an important reversal in the short-term trend.
USD/CAD is falling on Thursday, trading almost half a percentage point lower on the day, and forming a long red candlestick (see chart below).
USD/CAD Daily Chart
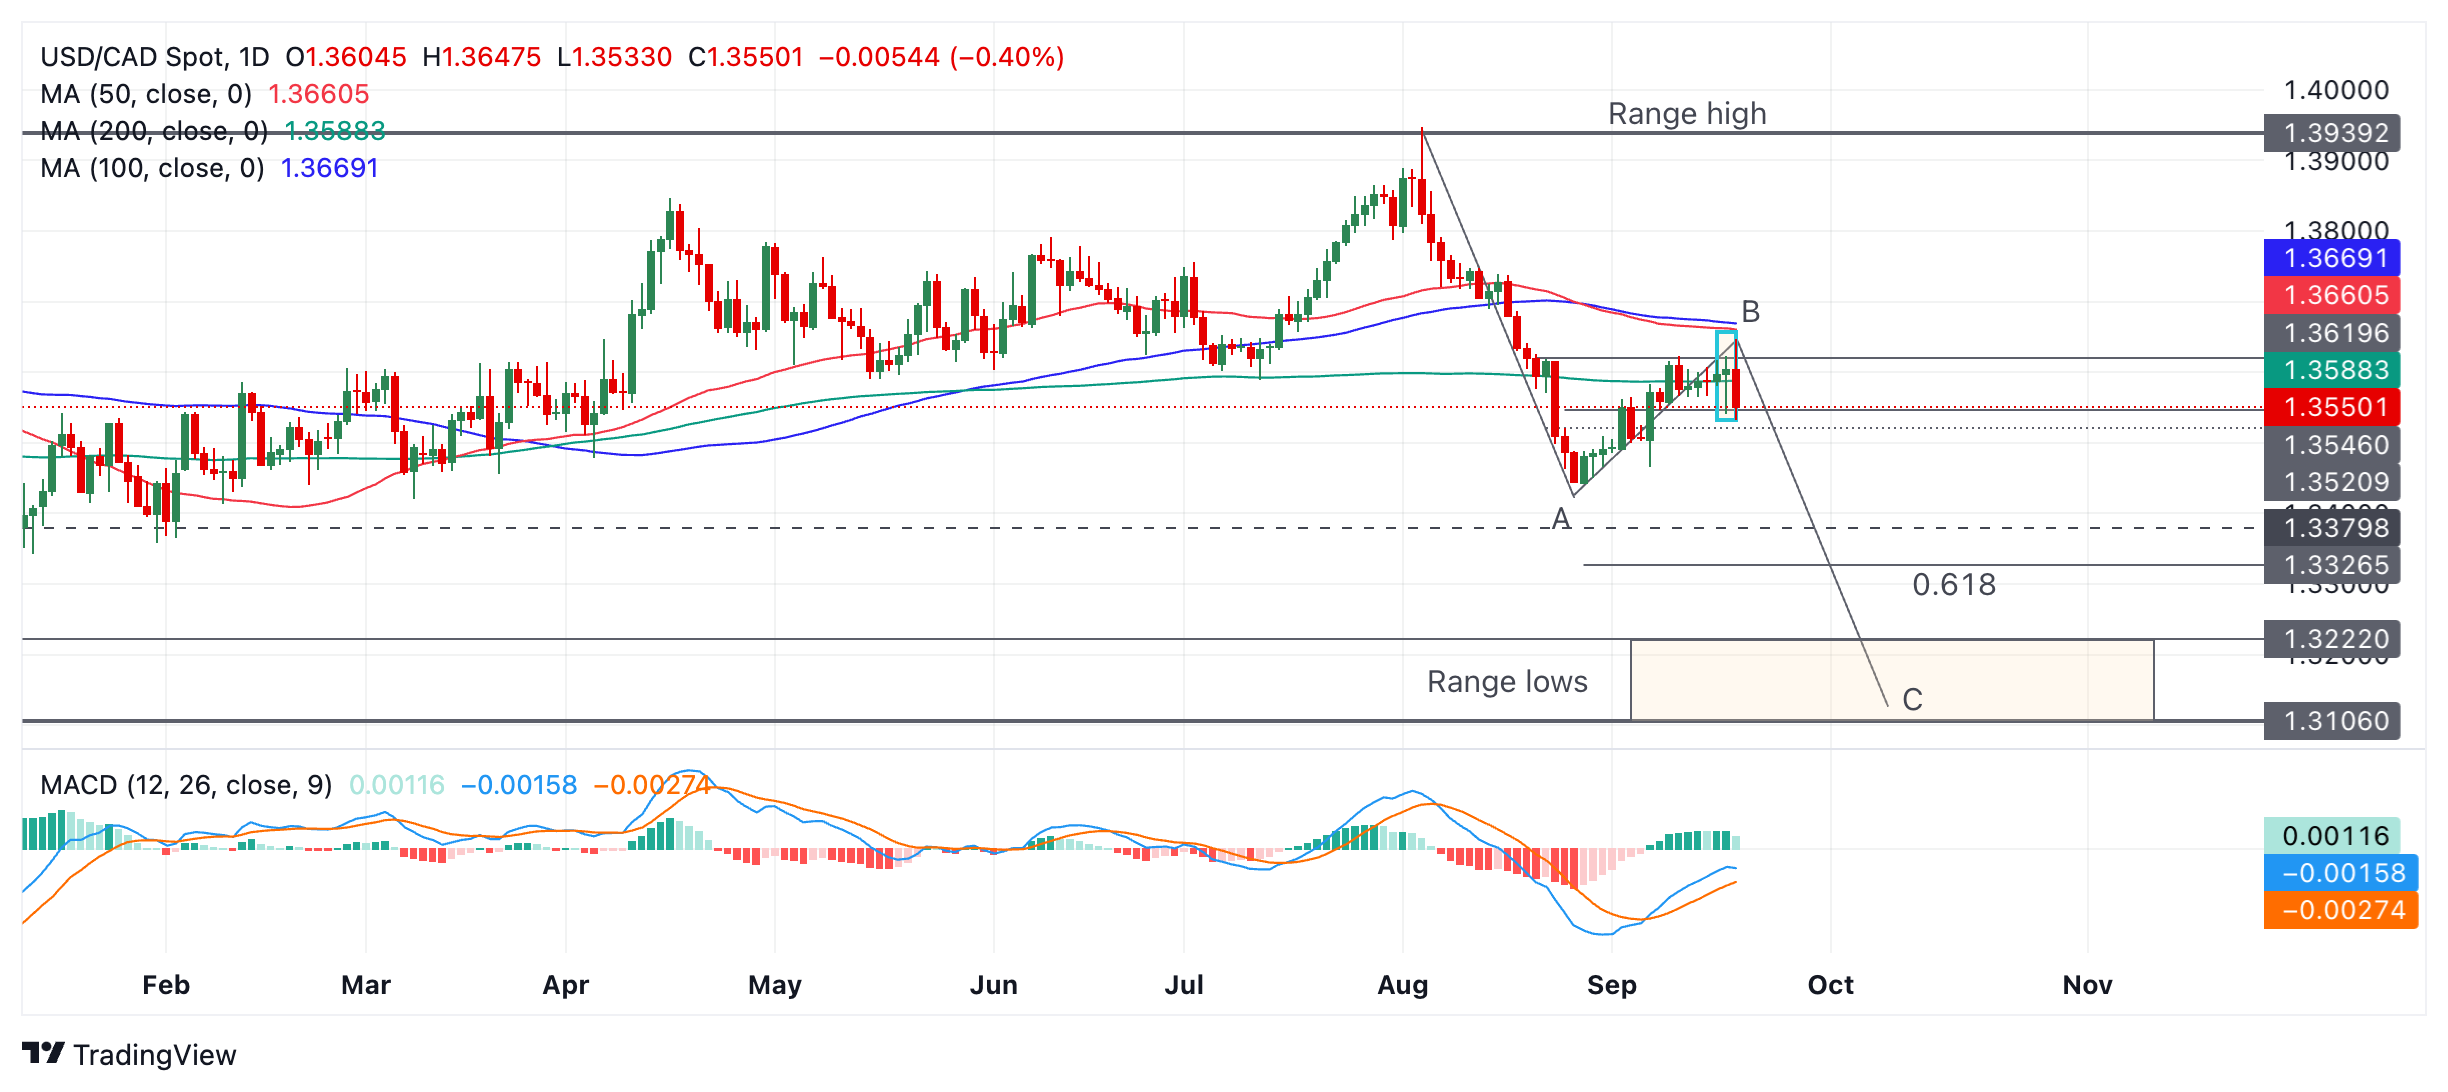
On Wednesday USD/CAD formed a bearish Hanging Man Japanese candlestick pattern (blue rectangle on chart above). This pattern forms when price rises to a new high, pulls back down during the same day, then recovers again and closes the day just below where it opened. If it is followed by a red down day, a short-term bearish reversal is confirmed.
Thursday’s red down day so far appears to be confirming the Hanging Man. It may be highlighting a pivot point, or reversal of the rally that began at the August 28 low.
USD/CAD is oscillating within a larger range and the overall structure of the move down from the range high appears to conform to that of an ABC pattern, or “Measured Move”. These patterns are like large zig-zags with wave C usually reaching a similar length to wave A. If USD/CAD really is forming an ABC pattern then C should end within the zone of the range lows (orange shaded rectangle on chart above).
It is also possible the move could reach a point where wave C is a Fibonacci 0.618 ratio of the length of wave A. If so it would probably reach 1.3326.
If Thursday ends as a bearish down day it will provide confirmation of an extension lower towards the aforesaid targets. A break below 1.3466 (September 6 low) would provide additional bearish confirmation.
- The US Dollar weakens slightly after a volatile ride on the back of the Fed rate decision.
- Traders are struggling to digest the interest-rate projections shown in the dot plot and Chair Powell’s comments.
- The US Dollar Index trades back into its tight bandwidth range after a very brief breakout.
The US Dollar (USD) trades back to where it was ahead of the US Federal Reserve (Fed) meeting during the European trading session on Thursday. Traders quickly pared back initial losses on Wednesday after Fed Chairman Jerome Powell said that a 50-basis-point (bps) rate cut would not be the new normal, although the Greenback is retreating further this Thursday. Going forward, it looks like economic data ahead of each rate decision will determine the size of the cut, if any, an assumption that was perceived as rather hawkish by markets.
On the economic data front, traders can get their hands dirty already with the weekly Jobless Claims, particularly because Powell reiterated that the labor market is important for the Fed’s dual mandate. The Philadelphia Fed Manufacturing Index will also be published, giving markets some more insights on how the manufacturing side of the economy is holding up.
Daily digest market movers: Markets got what they wanted
- Quick summary of the overnight Fed rate decision: A 50-basis-point rate cut was given with another 50 basis points decline expected for the remainder of 2024. Fed Chairman Powell reiterated that 50-basis-point cuts will not be the new normal and that the Fed will remain data-dependent in order to assess which rate cut size is appropriate for the upcoming meeting.
- The Bank of England (BoE) has kept its interest rate unchanged at 5%, with a vote split 8 to 1 with one member asking to cut rates. Governor Andrew Bailey said the BoE will reduce rates gradually over time.
- At 12:30 GMT, the weekly Jobless Claims are due. Initial Claims should remain stable at 230,000. Continuing Claims were previously at 1.85 million, with no forecast available for this week’s number.
- In the slew of that Jobless data, the Philadelphia Fed Manufacturing Survey for September will come out. A reading of -1 is expected, which is above the -7 from August.
- At 14:00 GMT, Existing Home Sales for August are due, with a small decline to 3.90 million units against 3.95 million in July.
- Equity markets are having a field day on the back of the Fed rate decision. In Japan, both the Nikkei and the Topix closed off over 2% higher. In Europe, all major indices have a 1% gain in sight and US futures doing even better ahead of the opening bell, with all three major indices gaining more than 1%.
- The CME Fedwatch Tool shows a 65.0% chance of a 25 basis point rate cut at the next Fed meeting on November 7. The remaining 35.0% is pricing in another 50-basis-point rate cut.
- The US 10-year benchmark rate trades at 3.69%, a touch higher from Wednesday and further off the 15-month low of 3.60%.
US Dollar Index Technical Analysis: Back to square one
The US Dollar Index (DXY) is back in its range after a very brief field trip lower, outside of that bandwidth that is determining the DXY moves for the past few weeks. With this Fed rate cut and projections for this year, a gradual further easing of the Greenback should play out. Expect pressure to build up again on the lower end of the bandwidth, which could be snapped if economic data deteriorates and leads the Fed towards another 50-basis-point rate cut in November.
The upper level of the recent range remains 101.90. Further up, the index could go to 103.18, with the 55-day Simple Moving Average (SMA) at 102.74 on the way. The next tranche up is very misty, with the 200-day SMA and the 100-day SMA at 103.79, just ahead of the big 104.00 round level.
On the downside, 100.62 (the low from December 28, 2023) has been broken overnight, though was unable to get a daily close below it. Should it happen, the low from July 14, 2023, at 99.58, will be the next level to look out for. If that level gives way, early levels from 2023 are coming in near 97.73.
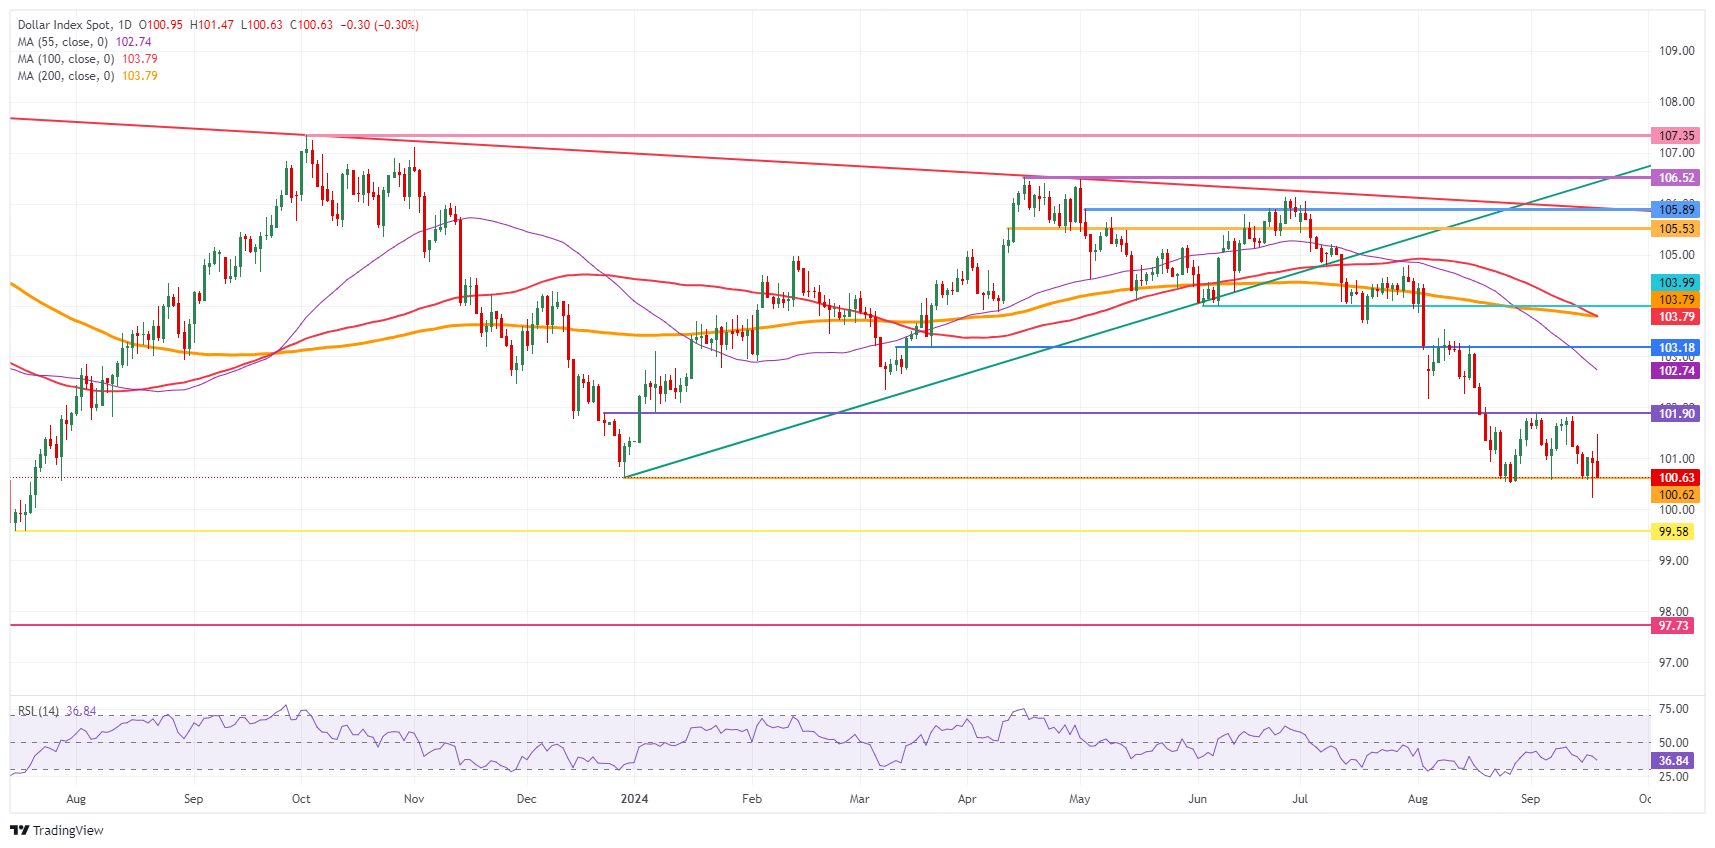
US Dollar Index: Daily Chart
US Dollar FAQs
The US Dollar (USD) is the official currency of the United States of America, and the ‘de facto’ currency of a significant number of other countries where it is found in circulation alongside local notes. It is the most heavily traded currency in the world, accounting for over 88% of all global foreign exchange turnover, or an average of $6.6 trillion in transactions per day, according to data from 2022. Following the second world war, the USD took over from the British Pound as the world’s reserve currency. For most of its history, the US Dollar was backed by Gold, until the Bretton Woods Agreement in 1971 when the Gold Standard went away.
The most important single factor impacting on the value of the US Dollar is monetary policy, which is shaped by the Federal Reserve (Fed). The Fed has two mandates: to achieve price stability (control inflation) and foster full employment. Its primary tool to achieve these two goals is by adjusting interest rates. When prices are rising too quickly and inflation is above the Fed’s 2% target, the Fed will raise rates, which helps the USD value. When inflation falls below 2% or the Unemployment Rate is too high, the Fed may lower interest rates, which weighs on the Greenback.
In extreme situations, the Federal Reserve can also print more Dollars and enact quantitative easing (QE). QE is the process by which the Fed substantially increases the flow of credit in a stuck financial system. It is a non-standard policy measure used when credit has dried up because banks will not lend to each other (out of the fear of counterparty default). It is a last resort when simply lowering interest rates is unlikely to achieve the necessary result. It was the Fed’s weapon of choice to combat the credit crunch that occurred during the Great Financial Crisis in 2008. It involves the Fed printing more Dollars and using them to buy US government bonds predominantly from financial institutions. QE usually leads to a weaker US Dollar.
Quantitative tightening (QT) is the reverse process whereby the Federal Reserve stops buying bonds from financial institutions and does not reinvest the principal from the bonds it holds maturing in new purchases. It is usually positive for the US Dollar.
- Silver price rallies above $31.00 in the aftermath of the Fed’s policy announcement.
- The Fed cut interest rates by 50 bps to 4.75%-5.00%.
- Fed’s bumper interest rate cut signals that inflation is on track to return to the bank’s target of 2%.
Silver price (XAG/USD) delivers a sharp rally above the crucial resistance of $31.00 in Thursday’s European session. The white metal strengthens as the US Dollar (USD) surrenders its early gains and declines. The US Dollar weakens as the dust settles after the Federal Reserve’s (Fed) monetary policy decision in which the central bank announced its first ever interest rate cut in more than four years.
Historically, lower interest rates by the Fed bode well for non-yielding assets, such as Silver, as they reduce the opportunity cost of holding an investment in them.
The US Dollar Index (DXY), which tracks the Greenback’s value against six major currencies, falls to near 100.60, following the Fed 50-basis points (bps) interest rate cut to 4.75%-5.00%. The Fed was widely anticipated to cut interest rates but traders were divided over potential rate cut size. A bumper interest rate cut by the Fed gives a clear indication that price pressures are on track to return to the bank’s target of 2%.
For the interest rate guidance, policymakers see the federal fund rate heading to 4.4% by year-end, which suggests that there will be at least 25 bps more decline in interest rates. On the contrary, the CME FedWatch tool shows that the central bank will cut 75 bps in the remaining monetary policies this year.
Silver technical analysis
Silver price strengthens as it has delivered a breakout of the downward-sloping trendline plotted from May 20 high of $32.50. The asset is expected to extend its upside towards the previous high of $32.50. Upward-sloping 20-day Exponential Moving Average (EMA) near $29.50 suggests that the near-term outlook is upbeat.
The 14-day Relative Strength Index (RSI) stands above 60.00. A fresh round of bullish momentum could occur if the oscillator sustains around this level.
Silver daily chart
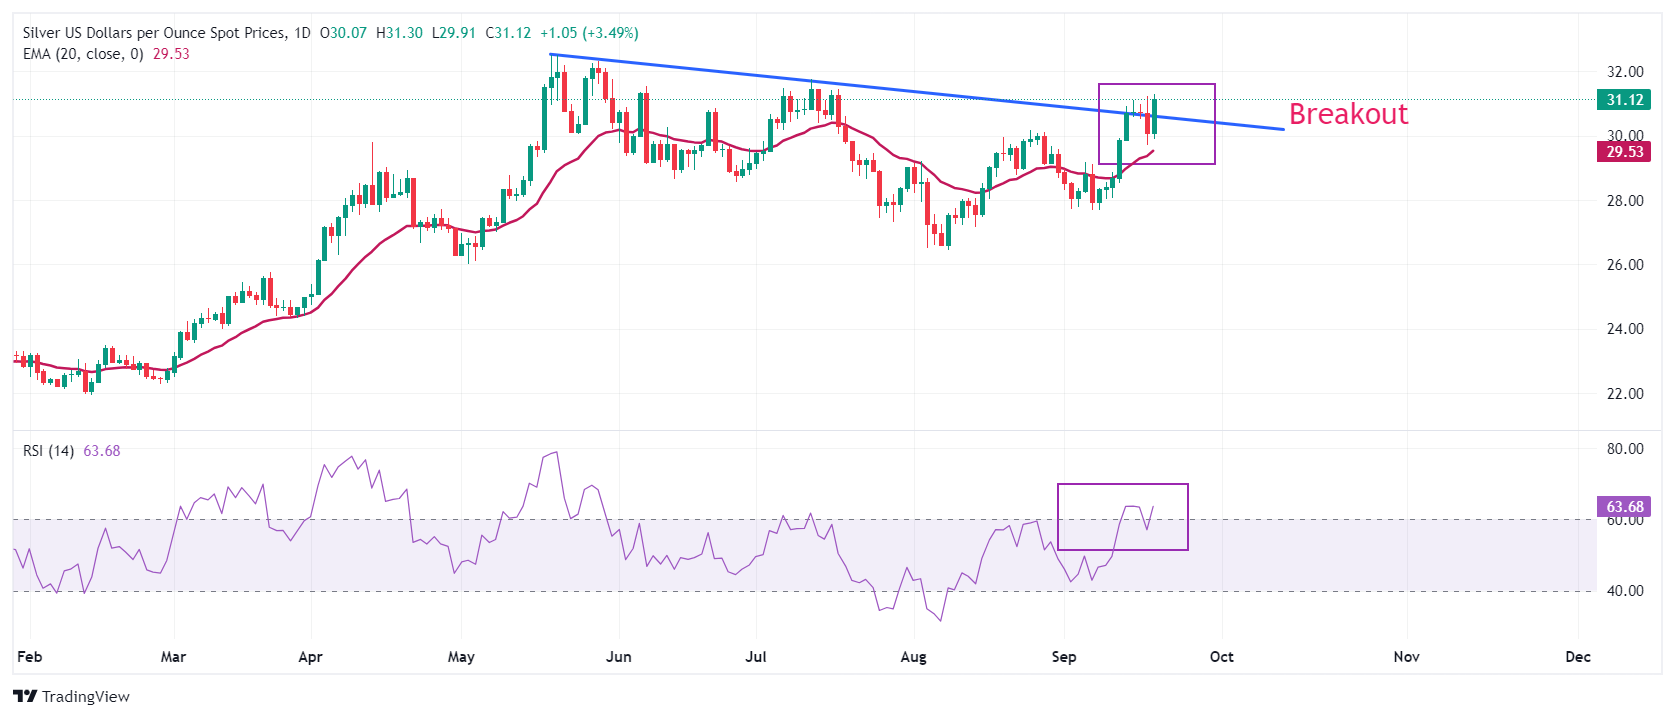
Silver FAQs
Silver is a precious metal highly traded among investors. It has been historically used as a store of value and a medium of exchange. Although less popular than Gold, traders may turn to Silver to diversify their investment portfolio, for its intrinsic value or as a potential hedge during high-inflation periods. Investors can buy physical Silver, in coins or in bars, or trade it through vehicles such as Exchange Traded Funds, which track its price on international markets.
Silver prices can move due to a wide range of factors. Geopolitical instability or fears of a deep recession can make Silver price escalate due to its safe-haven status, although to a lesser extent than Gold's. As a yieldless asset, Silver tends to rise with lower interest rates. Its moves also depend on how the US Dollar (USD) behaves as the asset is priced in dollars (XAG/USD). A strong Dollar tends to keep the price of Silver at bay, whereas a weaker Dollar is likely to propel prices up. Other factors such as investment demand, mining supply – Silver is much more abundant than Gold – and recycling rates can also affect prices.
Silver is widely used in industry, particularly in sectors such as electronics or solar energy, as it has one of the highest electric conductivity of all metals – more than Copper and Gold. A surge in demand can increase prices, while a decline tends to lower them. Dynamics in the US, Chinese and Indian economies can also contribute to price swings: for the US and particularly China, their big industrial sectors use Silver in various processes; in India, consumers’ demand for the precious metal for jewellery also plays a key role in setting prices.
Silver prices tend to follow Gold's moves. When Gold prices rise, Silver typically follows suit, as their status as safe-haven assets is similar. The Gold/Silver ratio, which shows the number of ounces of Silver needed to equal the value of one ounce of Gold, may help to determine the relative valuation between both metals. Some investors may consider a high ratio as an indicator that Silver is undervalued, or Gold is overvalued. On the contrary, a low ratio might suggest that Gold is undervalued relative to Silver.
Australia added 47.5 thousand jobs last month. The labor market remains tight, although there are signs of a slowdown, Commerzbank’s FX strategist Volkmar Baur notes.
Inflationary dynamics to prevent RBA relief
“Over the past 12 months, more than 30,000 new jobs have been created per month, which is still well above the pre-pandemic run rate (22,000 per month). This has led to wages rising too fast to bring inflation back into the central bank's target range. And this jobs report is unlikely to ease the RBA's concerns.”
“There are early signs of a slowdown: full-time jobs were actually cut, and the increase was only in part-time positions. However, given the large number of jobs, this will not be enough to change the RBA's mind next week.”
“Therefore, I expect that the RBA will still not cut rates next Tuesday and will leave them at 4.35%. This is not ideal given the recent weakness in the economy. The economy would certainly welcome some relief. But it is still necessary given the inflationary dynamics.”
Right before the decision was announced, the probability of a 50-basis-point move was only just over 60%, as implied by the futures market. To put it another way, almost half of the market participants were surprised by yesterday's decision of the Fed's Open Market Committee (FOMC), Commerzbank’s Head of FX and Commodity Research Ulrich Leuchtmann notes.
The market shifts its interest rate expectations downwards
“Now, I have been repeating like a mantra for as long as anyone can remember that 25 basis points more or less USD carry is irrelevant for USD exchange rates. The only thing relevant about yesterday's decision is what it says about the Fed's medium- to long-term course.”
“The market could shift its interest rate expectations downwards by less than yesterday's surprise, i.e. price in fewer interest rate cuts in the future, because yesterday's interest rate cut was already significant, so not much more is needed in the future. In fact, the market reacted just like that.”
“Even though Powell would never admit it, I still suspect that the Fed acts asymmetrically: that it hesitates for a long time before raising interest rates (like in 2021/22), but acts quickly when it comes to lowering interest rates (like yesterday).”
- Natural Gas receives technical rejection on the topside after attempts to break higher.
- European Gas reserves are 93% full while the Russian transit deal ends.
- The US Dollar Index eases after the Fed delivers a 50 basis point rate cut with more to come.
Natural Gas futures trade flat on Thursday after the recent rally, which brought prices to a fair value point. On the one hand, Europe is bracing for a cold spell where temperatures are set to drop below averages. On the other hand, the recent pager and walkie-talkie bombing from Hamas members by Israel is a setback for any peace deal or ceasefire in the region.
Meanwhile, the US Dollar Index (DXY), which tracks the Greenback's value against six major currencies, is on the back foot after the US Federal Reserve (Fed) delivered a 50 basis point (bps) interest rate cut. In its forecast, the central bank projected another 50 bps rate cut to take place by the end of 2024. Equities are having a field day on the back of this and are rallying across the globe while the Greenback is dipping lower against nearly every major currency.
Natural Gas is trading at $2.56 per MMBtu at the time of writing.
Natural Gas news and market movers: Europe gears up for first test of consumption
- European weather will come to the forefront in the coming weeks and months, with projected temperatures quite below the normal averages, Bloomberg reports.
- Uniper CEO Michael Lewis reported that Europe is well equipped to continue without the Russian gas supply, Bloomberg reports. On December 31, Austria and Slovakia will see the Russian gas flow running through Ukraine end as the transit deal will not be renewed or prolonged.
- The International Energy Agency (IEA), meanwhile, is also planning to end Russian gas flows through Ukraine after a transit deal expires at the end of the year, Reuters reports.
Natural Gas Technical Analysis: Equilibrium state for now
Natural Gas prices have topped out for now. The bullish elements that could drive price action higher, such as the end of the Russian gas transit supply, have been already priced in. Europe itself has secured enough gas to go through the upcoming heating season. The only wildcard remains the geopolitical tensions, which could drive Gas prices either way.
On the upside, that blue ascending trend line in the daily chart below acts as a short-term resistance, near $2.62. Should the Gas price make its way above it, a longer-term uptrend could play out here. Further up, $2.80 and $2.83 (red descending trend line) are coming into play.
On the downside, three clear levels can be identified to provide near-term and longer-term support in case prices retrace. The first is the 100-day Simple Moving Average (SMA) at $2.47. A leg lower, both the 200-day SMA and the 55-day SMA are around $2.28, just ahead of $2.13 (a pivotal level since 2023).
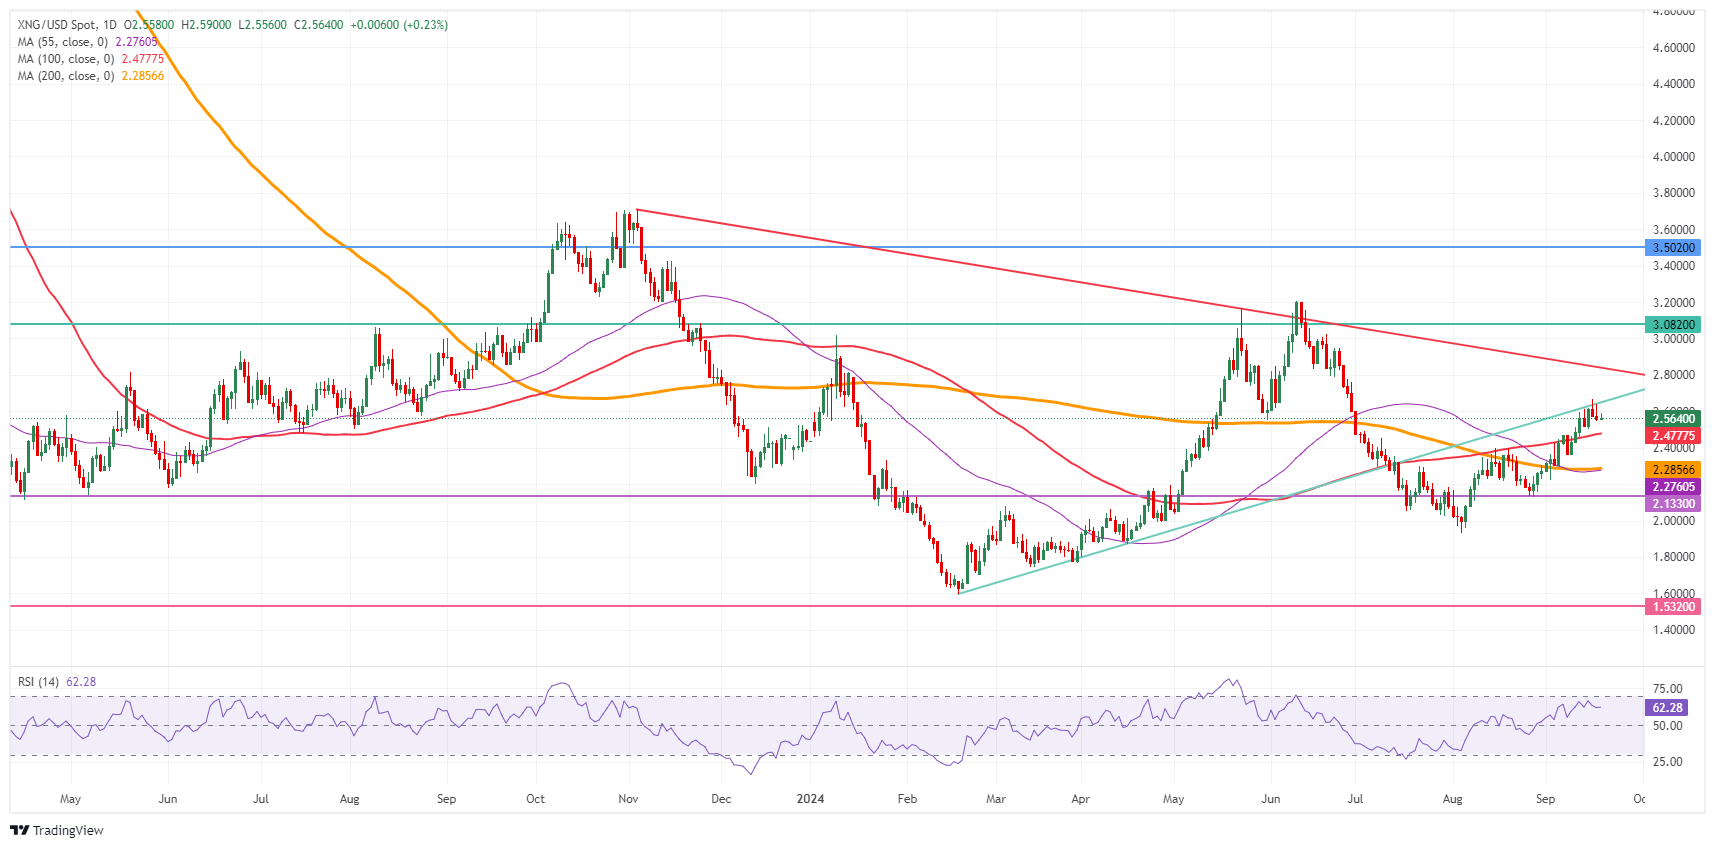
Natural Gas: Daily Chart
Natural Gas FAQs
Supply and demand dynamics are a key factor influencing Natural Gas prices, and are themselves influenced by global economic growth, industrial activity, population growth, production levels, and inventories. The weather impacts Natural Gas prices because more Gas is used during cold winters and hot summers for heating and cooling. Competition from other energy sources impacts prices as consumers may switch to cheaper sources. Geopolitical events are factors as exemplified by the war in Ukraine. Government policies relating to extraction, transportation, and environmental issues also impact prices.
The main economic release influencing Natural Gas prices is the weekly inventory bulletin from the Energy Information Administration (EIA), a US government agency that produces US gas market data. The EIA Gas bulletin usually comes out on Thursday at 14:30 GMT, a day after the EIA publishes its weekly Oil bulletin. Economic data from large consumers of Natural Gas can impact supply and demand, the largest of which include China, Germany and Japan. Natural Gas is primarily priced and traded in US Dollars, thus economic releases impacting the US Dollar are also factors.
The US Dollar is the world’s reserve currency and most commodities, including Natural Gas are priced and traded on international markets in US Dollars. As such, the value of the US Dollar is a factor in the price of Natural Gas, because if the Dollar strengthens it means less Dollars are required to buy the same volume of Gas (the price falls), and vice versa if USD strengthens.
- AUD/USD surges to near 0.6840 in the aftermath of the Fed’s policy announcement.
- The Fed cut its key borrowing rates by 50 bps to 4.75-5.00%.
- Australian Employment data for August came in better than expected.
The AUD/USD pair posts a fresh eight-month high near 0.6840 in Thursday’s European session. The Aussie asset strengthens as the US Dollar (USD) retreats in the aftermath of the Federal Reserve’s (Fed) monetary policy announcement.
The Fed delivered its first interest rate cut decision in more than four years in which it reduced borrowing rates by 50 basis points (bps) to 4.75%-5.00%. Market participants were certain that the Fed would pivot to policy normalization but were split over the likely interest rate cut size.
Historically. Fed’s dovish interest rate decisions result in a sharp increase in foreign flows to emerging markets and risk-perceived currencies. The market sentiment is upbeat due to the Fed’s bumper interest rate cut. S&P 500 futures have posted significant gains in the European session. The US Dollar Index (DXY), which tracks the Greenback’s value against its major peers, falls back from the weekly high of 101.50 to near 100.60.
Meanwhile, policymakers see the federal fund rate heading to 4.4% by year-end, suggesting that there will be another 50-bps decline in key borrowing rates. On the contrary, the CME FedWatch tool shows that the central bank will cut 75 bps in the remaining monetary policies this year.
On the Aussie front, upbeat Australian Employment data for August has strengthened the Australian Dollar (AUD). The report showed that Australian employers hired 47.5K fresh workers, higher than estimates of 25K but almost similar to the prior release of 48.9K, downwardly revised from 58.2K. The Unemployment Rate remains steady at 4.2%, as expected.
Australian Dollar PRICE Today
The table below shows the percentage change of Australian Dollar (AUD) against listed major currencies today. Australian Dollar was the strongest against the Japanese Yen.
| USD | EUR | GBP | JPY | CAD | AUD | NZD | CHF | |
|---|---|---|---|---|---|---|---|---|
| USD | -0.47% | -0.46% | 0.49% | -0.44% | -1.02% | -0.89% | -0.02% | |
| EUR | 0.47% | -0.00% | 0.96% | 0.03% | -0.52% | -0.43% | 0.45% | |
| GBP | 0.46% | 0.00% | 0.97% | 0.03% | -0.55% | -0.43% | 0.43% | |
| JPY | -0.49% | -0.96% | -0.97% | -0.89% | -1.49% | -1.40% | -0.52% | |
| CAD | 0.44% | -0.03% | -0.03% | 0.89% | -0.59% | -0.45% | 0.38% | |
| AUD | 1.02% | 0.52% | 0.55% | 1.49% | 0.59% | 0.12% | 0.99% | |
| NZD | 0.89% | 0.43% | 0.43% | 1.40% | 0.45% | -0.12% | 0.88% | |
| CHF | 0.02% | -0.45% | -0.43% | 0.52% | -0.38% | -0.99% | -0.88% |
The heat map shows percentage changes of major currencies against each other. The base currency is picked from the left column, while the quote currency is picked from the top row. For example, if you pick the Australian Dollar from the left column and move along the horizontal line to the US Dollar, the percentage change displayed in the box will represent AUD (base)/USD (quote).
The Pound Sterling (GBP) retains its position as the best performing G10 currency in the year to date, but it has never fully recovered to its pre-Brexit referendum levels vs. the EUR, but there’s scope for cable to head to 1.34 before the end of this year and for EUR/GBP to reach 0.83 on a 6-month view, Rabobank’s FX analyst Jane Foley notes.
GBP can continue its slow burning recovery
“GBP retains its position as the best performing G10 currency in the year to date. It took this mantle from the USD in July, in part due to optimism that the UK could be facing a more stable political backdrop and in part due to the expectations of a September Fed rate cut that started to mount that month.”
“In our view, GBP’s grind higher both this year and last year is a recovery from the weakness it had previously suffered, particularly in late 2022 during the Truss leadership. That said, GBP’s difficulty had pre-dated Truss – the pound has never recovered to its pre-Brexit referendum levels vs. the EUR.”
Looking ahead, we see scope that GBP can continue its slow burning recovery. On the back of a more aggressive pace of Fed easing, we see scope for cable to head to 1.34 before the end of this year and for EUR/GBP to reach 0.83 on a 6-month view. That said, the budget may complicate this outlook. Not only may it sour investor sentiment, but a hefty round of tax hikes could impact market expectations regarding the pace of BoE easing.
Wednesday's UK inflation figures did not come as any major surprise. CPI inflation was in line with the median of analyst estimates. The subcomponents did not surprise either. Nevertheless, the currency market took the release as an opportunity to trade the Pound Sterling (GBP) stronger, Commerzbank’s Head of FX and Commodity Research Ulrich Leuchtmann notes.
Visible price movements in GBP are expected
“The initial market reaction shows very clearly that the Pound Sterling (GBP) is currently benefiting particularly from the fact that the Bank of England (BoE) appears to be lagging behind. While the ECB has already cut its key rate twice and the Fed started with a big move, the market expects the BoE to make rather more leisurely interest rate cuts. That is what makes the pound so attractive.”
“Of course, this would quickly come to an end if inflation in the United Kingdom were to fall very rapidly (as is expected for the euro area and the US). Therefore, UK inflation figures are always a cause for nervousness for those who hold long GBP positions.”
“But the flip side of this previous nervousness is that if the figures do not give cause to question the BoE's positive outlook on GBP, relief will prevail. Relief does not mean massive GBP strength, but it does mean visible price movements.”
Those who find the Fed's decisions strange from time to time should remember that the Bank of Japan (BoJ) makes even stranger decisions. Friday morning (European time) is the next opportunity, Commerzbank’s Head of FX and Commodity Research Ulrich Leuchtmann notes.
BoJ meeting is a potential serious JPY mover
“Of course, an interest rate move is very unlikely tomorrow. None of the analysts surveyed by Bloomberg expect it, and the OIS market assigns it a probability of almost exactly 0% – although one should never speak of an ‘impossible event’ in the case of the BoJ, which is what statisticians mean by ‘0% probability’.”
“Nevertheless, tomorrow's meeting is potentially relevant for JPY exchange rates for other reasons. Because any occasion on which Japan's central bankers explain their strange policy is potentially illuminating. The emphasis, of course, is on ‘potentially’. The explanations they have given us so far are inadequate, to put it mildly.”
“If there is no better explanation tomorrow, I will feel vindicated in my view that the tradeoff between inflation and deflation risks from the BoJ's perspective is not as clear-cut as one might be led to believe. Ultimately, the fear of sustained inflation above 2% is perhaps greater than the fear of falling back into the zero-inflation trap.”
The US Dollar (USD) has potential to test the major resistance at 144.00. In the longer run, upward momentum is building; if USD can break above 144.00, it could trigger a stronger recovery towards 145.50, UOB Group FX analysts Quek Ser Leang and Victor Yong note.
USD/JPY can test 144.00 near term
24-HOUR VIEW: “Yesterday, we held the view that ‘as long as USD remains above 140.90, it could test 142.80 before leveling off.’ The subsequent price action did not turn out as we expected, as USD plummeted briefly to 140.43 in NY trade and then surged to close largely unchanged at 142.27 (-0.09%). USD continues to advance in early Asian trade today and could potentially test the major resistance at 144.00. On the downside, support can be found at 141.70 (minor support is at 142.40).”
1-3 WEEKS VIEW: " We indicated yesterday (18 Sep, spot at 142.00) that the recent USD weakness has stabilised. We expected USD to trade in a range between 140.00 and 144.00. USD traded on a firm note in Asian trade today, and upward momentum is building. From here, if it can break clearly above 144.00, it could trigger a stronger recovery towards 145.50. The likelihood of USD breaking clearly above 144.00 will remain intact, provided that the ‘strong support’ level at 141.00 is not breached.”
The Bank of England (BoE) announces its policy decision on Thursday, and everyone is expecting not rate cut. The notion that the BoE is threading more carefully than the Fed, and in general not giving away much in terms of guidance, is contributing to gilt underperformance and ultimately GBP strength. GBP/USD can end the week higher on the back of the Fed-BoE divergence, ING’s FX strategist Francesco Pesole notes.
The Fed-BoE divergence to push GBP/USD higher
“The Bank of England announces policy today, and we are fully aligned with the consensus and market pricing in expecting no rate cut. As discussed in our Bank of England preview, and in our post-UK CPI note, the inflation picture simply hasn’t improved enough to warrant more easing just yet.”
“The notion that the BoE is threading more carefully than the Fed, and in general not giving away much in terms of guidance, is contributing to gilt underperformance and ultimately GBP strength. That shouldn’t change after today’s meeting. Some focus will be on the plans for quantitative tightening, which will be announced today. The consensus is probably for the pace of balance sheet reduction to be kept the same (£100bn over the next year).”
We think GBP/USD can end the week higher on the back of the Fed-BoE divergence, attempting another break above 1.33. EUR/GBP could slip back below 0.8400 after the BoE, but we remain more reluctant to a sustainable outperformance of the pound over the euro beyond the near term.”
The New Zealand Dollar (NZD) is likely to trade in a 0.6150/0.6270 range, UOB Group FX analysts Quek Ser Leang and Victor Yong note.
Closing in on the 0.6270 hurdle
24-HOUR VIEW: “In NY trading, NZD traded in a volatile manner between 0.6184 and 0.6268, closing at 0.6208 (+0.33%). We are not able to glean much out of the choppy price movements. Today, we expect NZD to trade in a range, probably between 0.6180 and 0.6230.”
1-3 WEEKS VIEW: “On Tuesday (17 Sep, spot at 0.6185), we indicated that NZD is likely to trade in a 0.6135/0.6235 range for now. While NZD broke above 0.6235 yesterday, it pulled swiftly and sharply from 0.6268. There has been no increase in either downward momentum or upward momentum. We continue to expect NZD to trade in a range, albeit a higher and wider one of 0.6150/0.6270.”
Silver prices (XAG/USD) rose on Thursday, according to FXStreet data. Silver trades at $31.21 per troy ounce, up 3.79% from the $30.07 it cost on Wednesday.
Silver prices have increased by 31.17% since the beginning of the year.
| Unit measure | Silver Price Today in USD |
|---|---|
| Troy Ounce | 31.21 |
| 1 Gram | 1.00 |
The Gold/Silver ratio, which shows the number of ounces of Silver needed to equal the value of one ounce of Gold, stood at 83.00 on Thursday, down from 85.10 on Wednesday.
Silver FAQs
Silver is a precious metal highly traded among investors. It has been historically used as a store of value and a medium of exchange. Although less popular than Gold, traders may turn to Silver to diversify their investment portfolio, for its intrinsic value or as a potential hedge during high-inflation periods. Investors can buy physical Silver, in coins or in bars, or trade it through vehicles such as Exchange Traded Funds, which track its price on international markets.
Silver prices can move due to a wide range of factors. Geopolitical instability or fears of a deep recession can make Silver price escalate due to its safe-haven status, although to a lesser extent than Gold's. As a yieldless asset, Silver tends to rise with lower interest rates. Its moves also depend on how the US Dollar (USD) behaves as the asset is priced in dollars (XAG/USD). A strong Dollar tends to keep the price of Silver at bay, whereas a weaker Dollar is likely to propel prices up. Other factors such as investment demand, mining supply – Silver is much more abundant than Gold – and recycling rates can also affect prices.
Silver is widely used in industry, particularly in sectors such as electronics or solar energy, as it has one of the highest electric conductivity of all metals – more than Copper and Gold. A surge in demand can increase prices, while a decline tends to lower them. Dynamics in the US, Chinese and Indian economies can also contribute to price swings: for the US and particularly China, their big industrial sectors use Silver in various processes; in India, consumers’ demand for the precious metal for jewellery also plays a key role in setting prices.
Silver prices tend to follow Gold's moves. When Gold prices rise, Silver typically follows suit, as their status as safe-haven assets is similar. The Gold/Silver ratio, which shows the number of ounces of Silver needed to equal the value of one ounce of Gold, may help to determine the relative valuation between both metals. Some investors may consider a high ratio as an indicator that Silver is undervalued, or Gold is overvalued. On the contrary, a low ratio might suggest that Gold is undervalued relative to Silver.
(An automation tool was used in creating this post.)
- Gold shot higher after the Federal Reserve cut interest rates by a double-dose of 50 bps.
- The precious metal failed to hang onto gains and topples before recovering again on Thursday.
- Gold’s limited upside could be due to the Fed’s general assessment of the US economy as doing fine.
Gold (XAU/USD) edges higher and trades back in the $2,580s on Thursday after falling to the $2,540s following the US Federal Reserve (Fed) decision on interest rates the prior day.
The yellow metal popped to a new record high of $2,600 on Wednesday before quickly falling back following the much-anticipated Fed meeting, at which they decided to implement a 50 basis point (0.50%) cut to the fed funds rate. This lowers the Fed’s base rate to a range of 4.75%-5.25% from 5.25%-5.50% previously.
Gold peaks after Fed meets
Gold hit a record high of $2,600 after the Fed went ahead with a 50 bps rate cut on Wednesday, although the yellow metal failed to sustain its new highs. Several analysts explained the lack of volatility (financial asset prices changed only modestly after the announcement) due to the Fed’s easing cycle having already been priced in by financial markets ahead of the event.
“Is the easing cycle already priced in?” opined Thomas Mathews, Head of Markets, Asia Pacific for Capital Economics in a note on Thursday. “Markets barely reacted to the Fed’s 50 bps rate cut, on balance, and our base case is that further cuts won’t move the needle too much either.”
Gold upside may have been capped by the basically clean bill of health assigned to the US economy by the Fed. Gross Domestic Product (GDP) growth forecasts were only slightly revised down to 2.0% in 2024 from 2.1% previously and is expected to remain at that level until the end of 2027.
“Accompanying the larger cut was a signal of a fundamentally strong (US) economy with no suggestion that continued 50 bps cuts were likely,” said Jim Reid, Global Head of Research at Deutsche Bank. “Growth projections were little changed and the dot plot showed the median FOMC member expecting the fed funds range at 4.25-4.50% at year-end.”
Weaknesses in the labor market now appear to be the Fed’s major concern. The central bank revised up its Unemployment Rate forecast to 4.4% in 2024-2025 and only sees this falling back to 4.2% by the end of 2027. The focus for markets from here on, therefore, is likely to be on how well the labor market holds up.
But even the labor situation is not yet dire enough to give Gold a haven boost.
“Jobless Claims are actually still at very low levels, nothing like what you would see in a recession, and even quits’ rates and JOLTS’ rates are still stronger than they have been over the course of the last ten years,” said Janet Henry, Global Chief Economist at HSBC. The higher Unemployment Rate was partially due to high immigration in the US, she added, rather than inherent weakness.
Labor market metrics are a lagging indicator, said Henry, so there was a risk of unpleasant surprises ahead.
“If we get a shocking payrolls in November then we might be back to talking about another 50 bps cut,” said the economist in the interview with Bloomberg News.
Technical Analysis: Gold recovering after pullback
Gold is recovering after a volatile 24-hour period in which it shot up to a new high of $2,600 but then fell back down to a low in the $2,540s. It is now rebounding from the low and is already almost a percentage point higher on the day at the time of writing on Thursday.
Based on the technical analysis dictum that “the trend is your friend,” the odds favor more upside in line with the dominant long, medium, and short-term uptrends.
It is possible Gold’s correction could have further to go, but the overall current is drifting higher.
XAU/USD Daily Chart
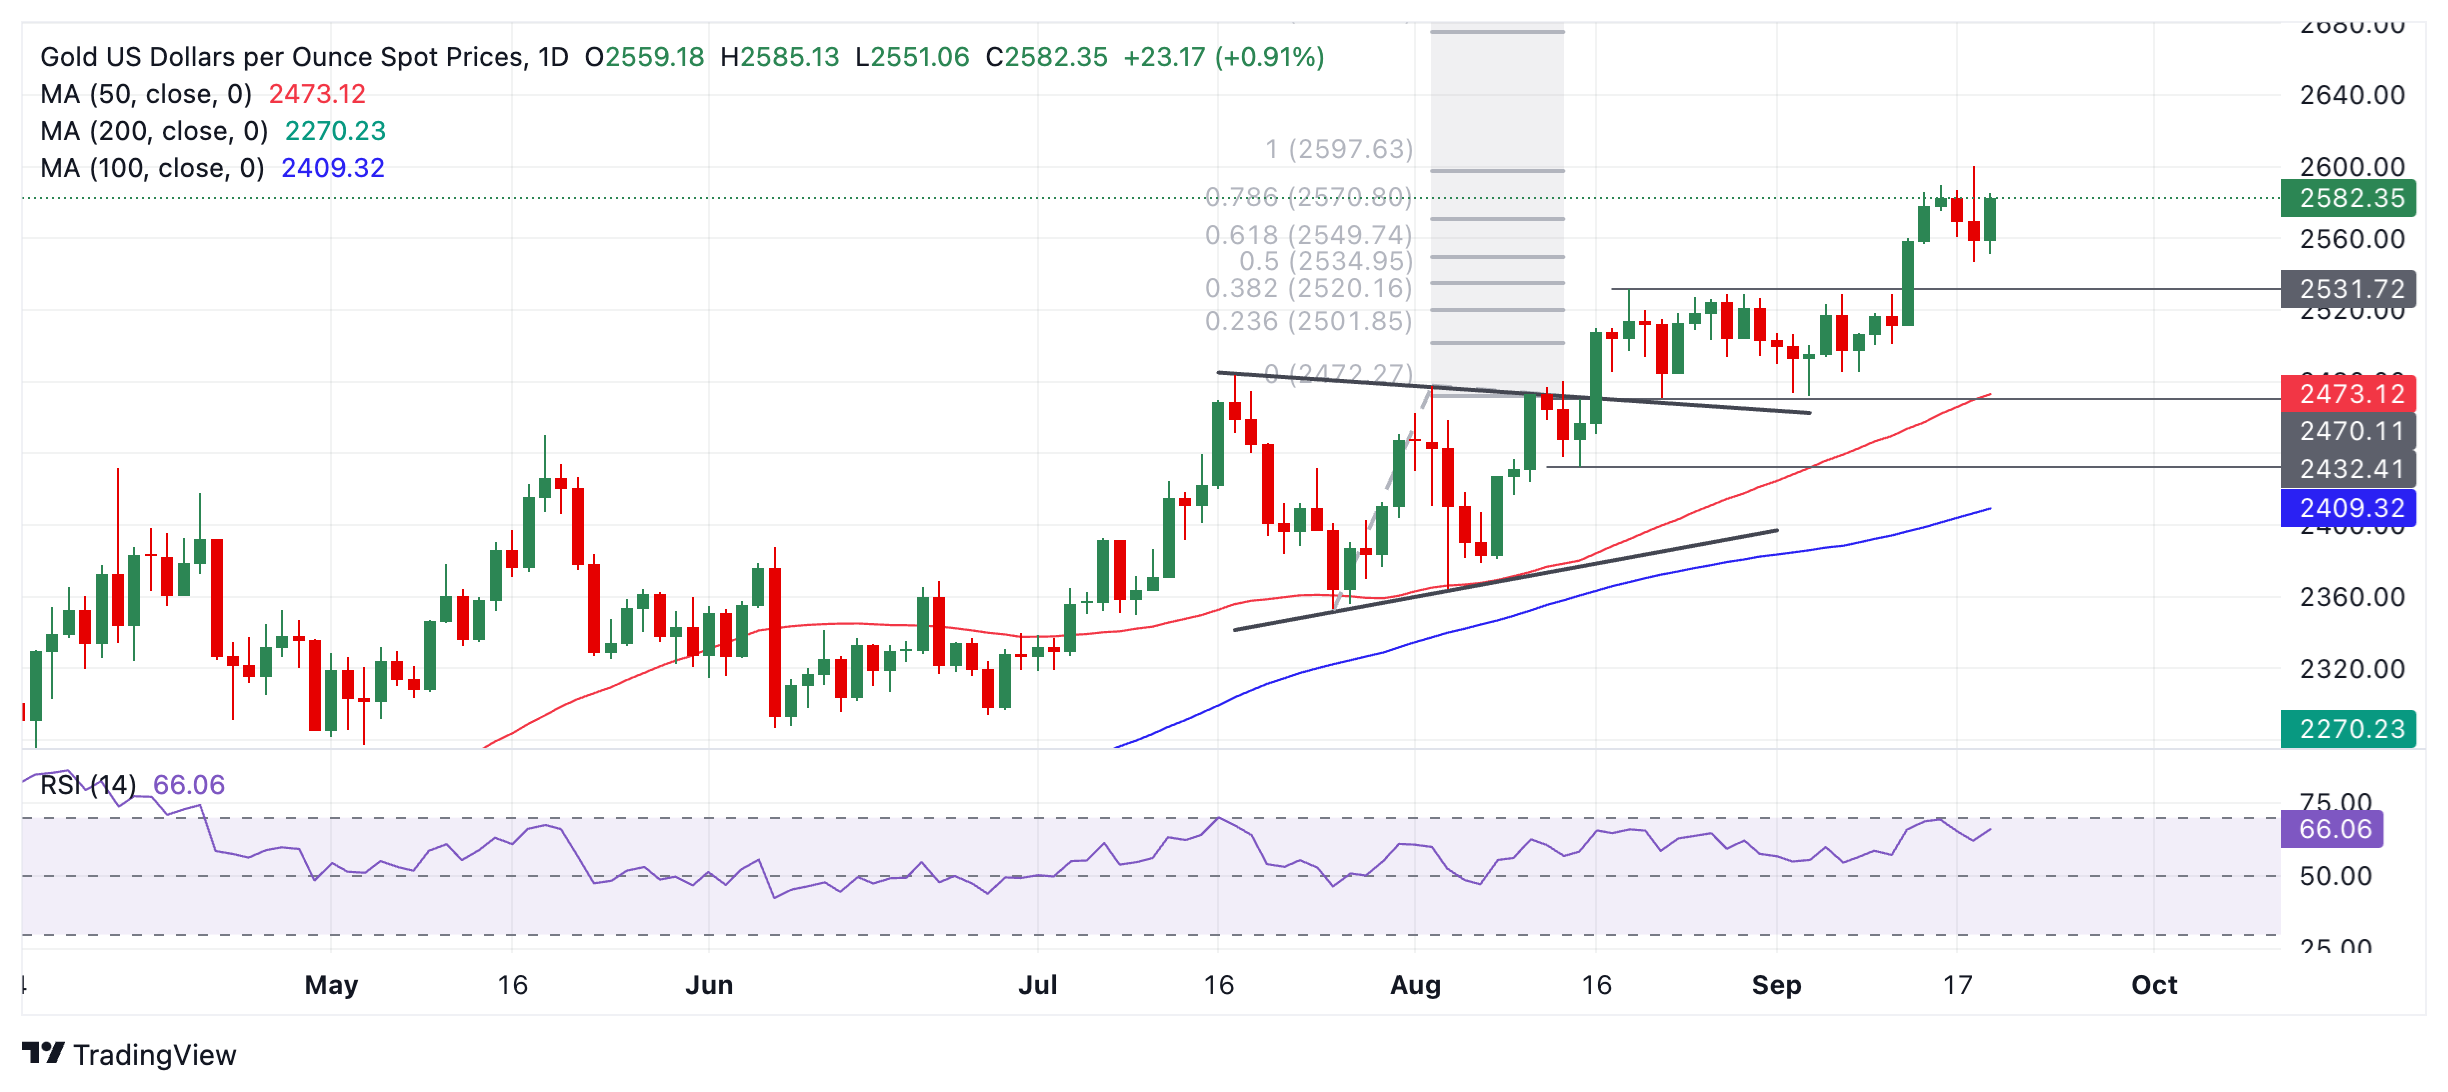
Gold is still not overbought in the daily chart, according to the Relative Strength Index (RSI), which also leaves room for more upside.
If it breaks above $2,600, it will print a higher high and confirm the uptrend is continuing. The next target above that would be round numbers: $2,650 and then $2,700.
In the event that Gold’s RSI enters the overbought zone on a closing basis, however, it will advise traders not to add to their long positions.
If it enters and then exits overbought, it will be a sign to close longs and sell as it would suggest a deeper correction is in the process of unfolding.
If the correction extends, firm support lies at $2,550, $2,544 (0.382 Fibonacci retracement of the September rally), and $2,530 (former range high).
Economic Indicator
Fed Interest Rate Decision
The Federal Reserve (Fed) deliberates on monetary policy and makes a decision on interest rates at eight pre-scheduled meetings per year. It has two mandates: to keep inflation at 2%, and to maintain full employment. Its main tool for achieving this is by setting interest rates – both at which it lends to banks and banks lend to each other. If it decides to hike rates, the US Dollar (USD) tends to strengthen as it attracts more foreign capital inflows. If it cuts rates, it tends to weaken the USD as capital drains out to countries offering higher returns. If rates are left unchanged, attention turns to the tone of the Federal Open Market Committee (FOMC) statement, and whether it is hawkish (expectant of higher future interest rates), or dovish (expectant of lower future rates).
Read more.Last release: Wed Sep 18, 2024 18:00
Frequency: Irregular
Actual: 5%
Consensus: 5.25%
Previous: 5.5%
Source: Federal Reserve
White House National Economic Council Director Lael Brainard said on Thursday that the Federal Reserve’s (Fed) decision on Wednesday to cut rates for the first time in four years sent a "clear signal that inflation has come back down.”
Further comments
Inflation was now at the same level seen in the month before the pandemic began.
The cut in interest rates would also save the average new car buyer nearly $1,100 over the life of their loan.
Further work was needed to drive down housing costs, support childcare needs and sustain the gains achieved for working class families.
Meanwhile, another official said that “the White House is monitoring geopolitical risks, including escalating tensions in the Middle East, but sees no significant risks to the broader economic outlook.”
US Dollar PRICE Today
The table below shows the percentage change of US Dollar (USD) against listed major currencies today. US Dollar was the weakest against the Australian Dollar.
| USD | EUR | GBP | JPY | CAD | AUD | NZD | CHF | |
|---|---|---|---|---|---|---|---|---|
| USD | -0.49% | -0.52% | 0.33% | -0.52% | -1.05% | -0.92% | -0.08% | |
| EUR | 0.49% | -0.04% | 0.83% | -0.02% | -0.55% | -0.43% | 0.41% | |
| GBP | 0.52% | 0.04% | 0.87% | 0.01% | -0.53% | -0.39% | 0.44% | |
| JPY | -0.33% | -0.83% | -0.87% | -0.83% | -1.38% | -1.29% | -0.43% | |
| CAD | 0.52% | 0.02% | -0.01% | 0.83% | -0.54% | -0.43% | 0.42% | |
| AUD | 1.05% | 0.55% | 0.53% | 1.38% | 0.54% | 0.13% | 0.96% | |
| NZD | 0.92% | 0.43% | 0.39% | 1.29% | 0.43% | -0.13% | 0.85% | |
| CHF | 0.08% | -0.41% | -0.44% | 0.43% | -0.42% | -0.96% | -0.85% |
The heat map shows percentage changes of major currencies against each other. The base currency is picked from the left column, while the quote currency is picked from the top row. For example, if you pick the US Dollar from the left column and move along the horizontal line to the Japanese Yen, the percentage change displayed in the box will represent USD (base)/JPY (quote).
- EUR/USD rises sharply above 1.1150 as investors expect the Fed to continue its aggressive policy-easing cycle.
- The Fed sees interest rates declining to 4.4% by year-end.
- ECB Nagel said that inflation is still higher than the ECB would like to see.
EUR/USD climbs above 1.1150 in Thursday’s European session, driven by a weakening US Dollar (USD), as the dust settles after the Federal Reserve’s (Fed) bumper interest rate cut and expectations of further policy-easing. The USD, tracked by the DXY USD Index, falls back below 100.70 after failing to hold onto a weekly high near 101.50.
The Fed delivered its first interest rate cut move in more than four years, cutting its key borrowing rates by 50 basis points (bps) to 4.75%-5.00%. This large cut by the Fed indicated that policymakers are committed to preventing a further deterioration in labor market conditions and are confident about progress in inflation falling towards the bank’s target of 2%.
Fed Chair Jerome Powell said at the press conference following the policy decision that the United States (US) is not exposed to a recession or even a slowdown. However, market participants expect that the Fed’s policy-easing cycle will be quite aggressive compared to that of other central banks.
According to the CME FedWatch tool, the central bank is expected to cut interest rates by 75 bps in the two meetings remaining this year, suggesting that there will be one more 50 bps rate cut either in November or December. 30-day Federal Funds Futures pricing data shows that the likelihood for the Fed reducing interest rates by 50 bps to 4.25%-4.50% in November is at 35% while the rest favors a 25-bps rate cut.
On the contrary, the Fed’s dot plot showed that policymakers see the federal funds rate heading to 4.4% by the year-end.
Going forward, investors will focus on Initial Jobless Claims data for the week ending September 13, which will be published at 12:30 GMT. The number of individuals claiming jobless benefits for the first time is expected to steady at 230K.
Daily digest market movers: EUR/USD gains on US Dollar’s weakness
- EUR/USD gains at the US Dollar’s expense, while the outlook of the Euro (EUR) is uncertain due to a growing debate about the European Central Bank’s likely interest rate path. ECB policymakers are divided over the policy-easing pace due to mixed views on the inflation outlook.
- ECB Governing Council member Peter Kazimir and President of Deutsche Bundesbank Joachim Nagel said they want to see more evidence to make sure that inflation will return to the levels the bank wants to see. Nagel said on Wednesday that he supports keeping interest rates sufficiently high to resolve price pressures, Reuters reported.
- On the contrary, ECB Governing Council member and Bank of France President François Villeroy de Galhau said last week that more rate cuts are needed to avoid the risk of inflation coming in too low. The comments from Villeroy came after the ECB delivered its second interest rate cut decision of its current policy-easing cycle.
- Currently, market participants expect that the ECB will cut interest rates one more time in any of its remaining monetary policy meetings this year.
Technical Analysis: EUR/USD bounces back from 20-day EMA
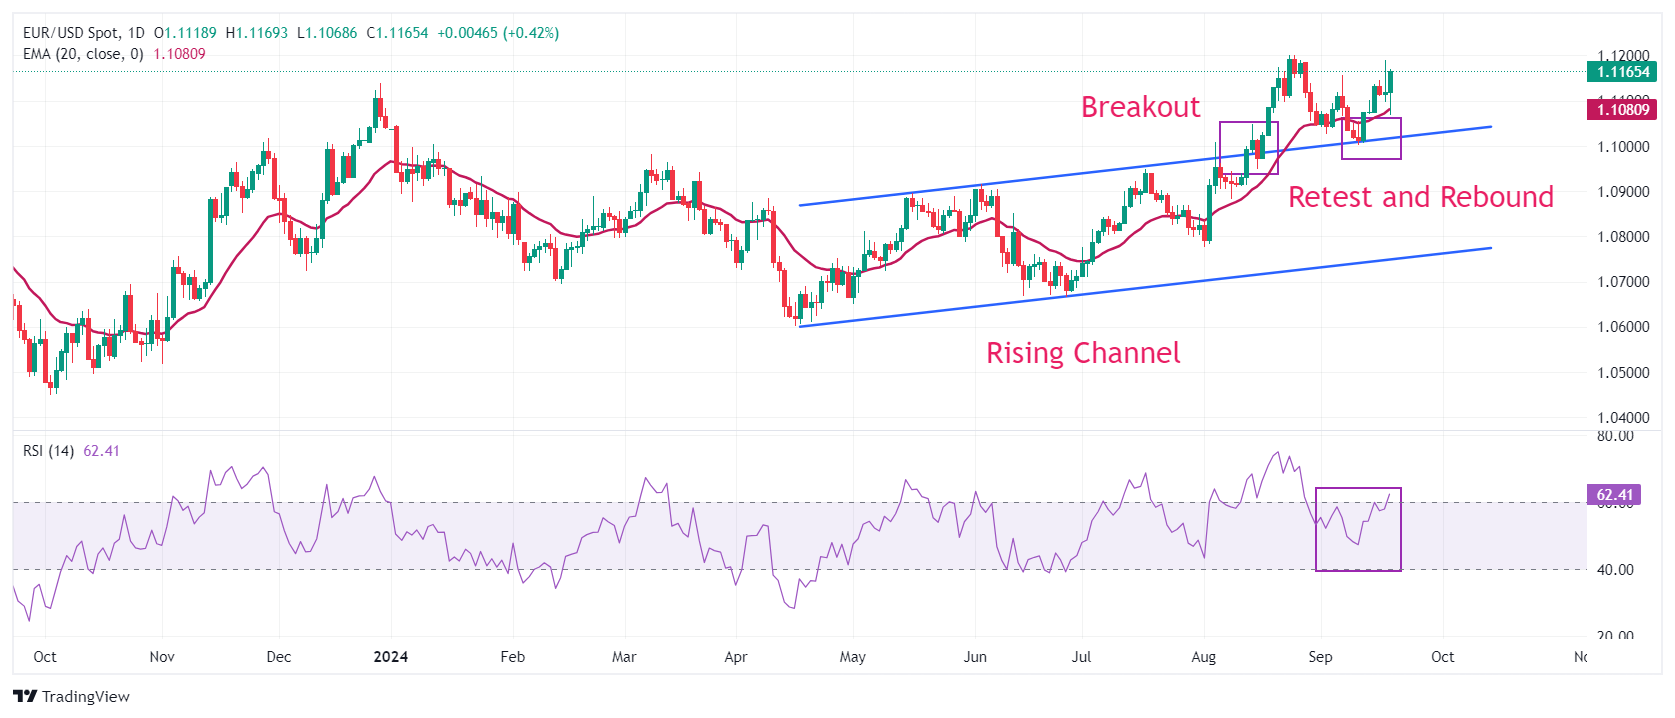
EUR/USD rises above 1.1150 in European trading hours in an intraday turnaround move after declining to near the 20-day Exponential Moving Average (EMA), which trades around 1.1060.
The major currency pair remains firm as it has confidently recovered after retesting the breakout of the Rising Channel chart pattern formed on a daily time frame near the psychological support of 1.1000.
The 14-day Relative Strength Index (RSI) moves higher to near 60.00. A bullish momentum would trigger if it sustains above the aforementioned level.
Looking up, the round-level resistance of 1.1200 will act as a major barricade for the Euro bulls. On the downside, the psychological level of 1.1000 and the July 17 high near 1.0950 will be major support zones.
Euro FAQs
The Euro is the currency for the 20 European Union countries that belong to the Eurozone. It is the second most heavily traded currency in the world behind the US Dollar. In 2022, it accounted for 31% of all foreign exchange transactions, with an average daily turnover of over $2.2 trillion a day. EUR/USD is the most heavily traded currency pair in the world, accounting for an estimated 30% off all transactions, followed by EUR/JPY (4%), EUR/GBP (3%) and EUR/AUD (2%).
The European Central Bank (ECB) in Frankfurt, Germany, is the reserve bank for the Eurozone. The ECB sets interest rates and manages monetary policy. The ECB’s primary mandate is to maintain price stability, which means either controlling inflation or stimulating growth. Its primary tool is the raising or lowering of interest rates. Relatively high interest rates – or the expectation of higher rates – will usually benefit the Euro and vice versa. The ECB Governing Council makes monetary policy decisions at meetings held eight times a year. Decisions are made by heads of the Eurozone national banks and six permanent members, including the President of the ECB, Christine Lagarde.
Eurozone inflation data, measured by the Harmonized Index of Consumer Prices (HICP), is an important econometric for the Euro. If inflation rises more than expected, especially if above the ECB’s 2% target, it obliges the ECB to raise interest rates to bring it back under control. Relatively high interest rates compared to its counterparts will usually benefit the Euro, as it makes the region more attractive as a place for global investors to park their money.
Data releases gauge the health of the economy and can impact on the Euro. Indicators such as GDP, Manufacturing and Services PMIs, employment, and consumer sentiment surveys can all influence the direction of the single currency. A strong economy is good for the Euro. Not only does it attract more foreign investment but it may encourage the ECB to put up interest rates, which will directly strengthen the Euro. Otherwise, if economic data is weak, the Euro is likely to fall. Economic data for the four largest economies in the euro area (Germany, France, Italy and Spain) are especially significant, as they account for 75% of the Eurozone’s economy.
Another significant data release for the Euro is the Trade Balance. This indicator measures the difference between what a country earns from its exports and what it spends on imports over a given period. If a country produces highly sought after exports then its currency will gain in value purely from the extra demand created from foreign buyers seeking to purchase these goods. Therefore, a positive net Trade Balance strengthens a currency and vice versa for a negative balance.
European Central Bank (ECB) executive board member Isabel Schnabel said in her scheduled appearance on Thursday that “sticky services inflation is keeping headline inflation at an elevated level.”
Additional quotes
Price pressures in the services sector are broad-based and global.
Pass-through of higher wages to producer prices is stronger in the services sector.
Momentum in services remains high and above levels consistent with price stability.
Medium-term inflation projections often clustered around 2% target.
Wage growth expected to slow down as past price shocks unwind.
Private sector forecasts suggest conditions for soft landing remain in place.
Signs that transmission of monetary policy tightening is weakening.
Market reaction
EUR/USD is holding latest gains near 1.1175 following these comments. The pair is up 0.49% on the day, at the time of writing.
The short-term rates picture continues to argue for a consolidation in the EUR/USD above 1.11, with some upside potential. If it wasn’t for the eurozone’s soft growth picture, EUR/USD would probably be trading closer to 1.13, but the short-term call is closer to 1.12 for EUR/USD, ING’s FX strategist Francesco Pesole notes.
The Thursday’s stage is set for quite a few ECB speakers
“Once the post-FOMC volatility settles, the short-term rates picture continues to argue for a consolidation in the pair above 1.11, with some upside potential. That was not just reinforced by the Fed’s larger-than-expected cut, but also by an increasingly vocal ECB hawkish front, which is preventing markets from pricing in another cut in the eurozone in October.”
“The EUR:USD 2-year swap spread has continued to shrink, now at -0.85bp. By comparison, that was -160bp in April, and -100bp a month ago. If it wasn’t for the eurozone’s soft growth picture, we would probably be trading closer to 1.13 now, based purely on rate differentials.”
“Today, the eurozone calendar doesn’t include any market-moving data, but quite a few ECB speakers. We will hear from one of the doves, Panetta, but also from the hawks Knot and Schnabel. Ultimately, the louder hawks should keep markets reluctant to price in more ECB easing, despite the Fed’s dovish influence.”
- WTI jumps to over a two-week high on Wednesday amid the emergence of fresh USD selling.
- The Fed’s oversized rate cut, along with a positive risk tone, undermines the safe-haven buck.
- Concerns about slowing global fuel demand might cap any further gains for Crude Oil prices.
West Texas Intermediate (WTI) US crude Oil prices regain positive traction after Wednesday's modest pullback and build on the recent recovery from the $64.75 area or the lowest level since May 2023 touched last week. The buying interest remains unabated through the first half of the European session and lifts the commodity to over a two-week high, closer to the $71.00 mark.
The Federal Reserve's (Fed) decision to start its policy easing cycle by lowering borrowing costs by 50 basis points on Wednesday fueled optimism over a pickup in economic activity and energy demand. This, along with the emergence of fresh US Dollar (USD) selling, turn out to be key factors pushing Crude Oil prices higher. Furthermore, the risk of a further escalation of tensions in the Middle East, especially after walkie-talkies used by the Lebanese armed group Hezbollah exploded on Wednesday, acting as a tailwind for the commodity.
Meanwhile, government data released on Wednesday showed a bigger-than-expected draw in US crude inventories, though was offset by builds in distillates and gasoline stockpiles. Adding to this, lingering concerns about weak global demand might cap any further appreciating move for Crude Oil prices. In fact, both the Organization of Petroleum Exporting Countries (OPEC) and the International Energy Agency (IEA) lowered their demand growth forecasts earlier this month amid persistent worries about a slowdown in China.
The concerns resurfaced following the release of poor Chinese macro data over the weekend, which pointed to signs of weakness in the world's largest economy and top Oil importer. This, in turn, warrants some caution for aggressive bullish traders and before positioning for an extension of the upward trajectory witnessed over the past week or so. Traders now look forward to the US macro data – Weekly Initial Jobless Claims, the Philly Fed Manufacturing Index and Existing Home Sales data – to grab short-term opportunities.
WTI Oil FAQs
WTI Oil is a type of Crude Oil sold on international markets. The WTI stands for West Texas Intermediate, one of three major types including Brent and Dubai Crude. WTI is also referred to as “light” and “sweet” because of its relatively low gravity and sulfur content respectively. It is considered a high quality Oil that is easily refined. It is sourced in the United States and distributed via the Cushing hub, which is considered “The Pipeline Crossroads of the World”. It is a benchmark for the Oil market and WTI price is frequently quoted in the media.
Like all assets, supply and demand are the key drivers of WTI Oil price. As such, global growth can be a driver of increased demand and vice versa for weak global growth. Political instability, wars, and sanctions can disrupt supply and impact prices. The decisions of OPEC, a group of major Oil-producing countries, is another key driver of price. The value of the US Dollar influences the price of WTI Crude Oil, since Oil is predominantly traded in US Dollars, thus a weaker US Dollar can make Oil more affordable and vice versa.
The weekly Oil inventory reports published by the American Petroleum Institute (API) and the Energy Information Agency (EIA) impact the price of WTI Oil. Changes in inventories reflect fluctuating supply and demand. If the data shows a drop in inventories it can indicate increased demand, pushing up Oil price. Higher inventories can reflect increased supply, pushing down prices. API’s report is published every Tuesday and EIA’s the day after. Their results are usually similar, falling within 1% of each other 75% of the time. The EIA data is considered more reliable, since it is a government agency.
OPEC (Organization of the Petroleum Exporting Countries) is a group of 13 Oil-producing nations who collectively decide production quotas for member countries at twice-yearly meetings. Their decisions often impact WTI Oil prices. When OPEC decides to lower quotas, it can tighten supply, pushing up Oil prices. When OPEC increases production, it has the opposite effect. OPEC+ refers to an expanded group that includes ten extra non-OPEC members, the most notable of which is Russia.
Further Pound Sterling (GBP) GBP strength is not ruled out, but any advance is expected to face significant resistance at 1.3300, UOB Group Quek Ser Leang and Victor Yong note.
GBP to test 1.3300 near term
24-HOUR VIEW: “In NY trade, GBP soared briefly to 1.3298, and then pulled back sharply, closing at 1.3214 (+0.39%). The price movements did not provide any clarity. Today, we expect GBP to trade sideways, likely between 1.3150 and 1.3250.”
1-3 WEEKS VIEW: “Our most recent narrative was from two days ago (17 Sep, spot at 1.3210), wherein the recent increase in momentum “is likely to lead to further GBP strength, potentially breaking above this year’s high, near 1.3270.” While GBP broke above 1.3270 in NY trade, it pulled back sharply from 1.3298. While there has been no further increase in momentum, further GBP strength is not ruled out. However, any advance is expected to face significant resistance at 1.3300. On the downside, should GBP break below 1.3120 (no change in ‘strong support’ level), it would mean the current upward pressure has faded.”
The Fed cut rates by 50bp yesterday, which came more as a surprise to economists' consensus than for markets, which had priced around a 65% probability of a half-point move. There was a substantial revision in the Dot Plot projections too, ING’s FX strategist Francesco Pesole notes.
FOMC caused volatility at the FX market
“The initial reaction in the FX market was markedly negative for the USD across the board, with the Yen (JPY), Norwegian krone (NOK) and New Zealand dollar (NZD) rallying around 1% and the Canadian dollar (CAD) unsurprisingly lagging other G10 currencies. By the time Powell’s conference had ended, those moves had been entirely unwound.”
“We have continued to observe higher FX volatility in the Asian session. After a brief overnight USD rally, we are largely back to pre-announcement levels in G10, with only JPY standing out as moderately weaker and the AUD moderately stronger following robust Australian jobs figures.”
“Ultimately, we see more room for markets to build speculative USD shorts into the US election, especially considering the USD-negative candidate (Kamala Harris) continues to fare quite well in post-debate polls.”
- The USD/CAD pair may depreciate further as it has breached below the lower boundary of the ascending channel.
- The emergence of the bearish trend could push the pair to navigate the region around its six-month low of 1.3441.
- The immediate barrier appears at the nine-day EMA at 1.3574 level and the 14-day EMA at 1.3576 level.
USD/CAD trades around 1.3550 during Thursday’s European hours. Analysis of the daily chart suggests a weakening of the bullish bias for the USD/CAD pair, as it has breached below the lower boundary of the ascending channel pattern.
Additionally, the 14-day Relative Strength Index (RSI) remains below the 50 level, confirming the bearish trend in play. Moreover, the nine-day Exponential Moving Average (EMA) is below the 14-day EMA, it indicates a weakening in the USD/CAD pair’s momentum.
On the downside, a break below the lower boundary of the ascending channel and the nine-day and the 14-day EMAs has triggered a bearish trend, potentially pressuring the USD/CAD pair to navigate the region around its six-month low of 1.3441, recorded on August 28.
Regarding the upside, the immediate barrier appears at the nine-day EMA at 1.3574 level, aligned with the 14-day EMA at 1.3576 level. A return to the ascending channel may reinforce the bullish bias and support the USD/CAD pair to test the "throwback support turns into a pullback resistance" level of 1.3590, followed by the psychological level of 1.3600.
USD/CAD: Daily Chart
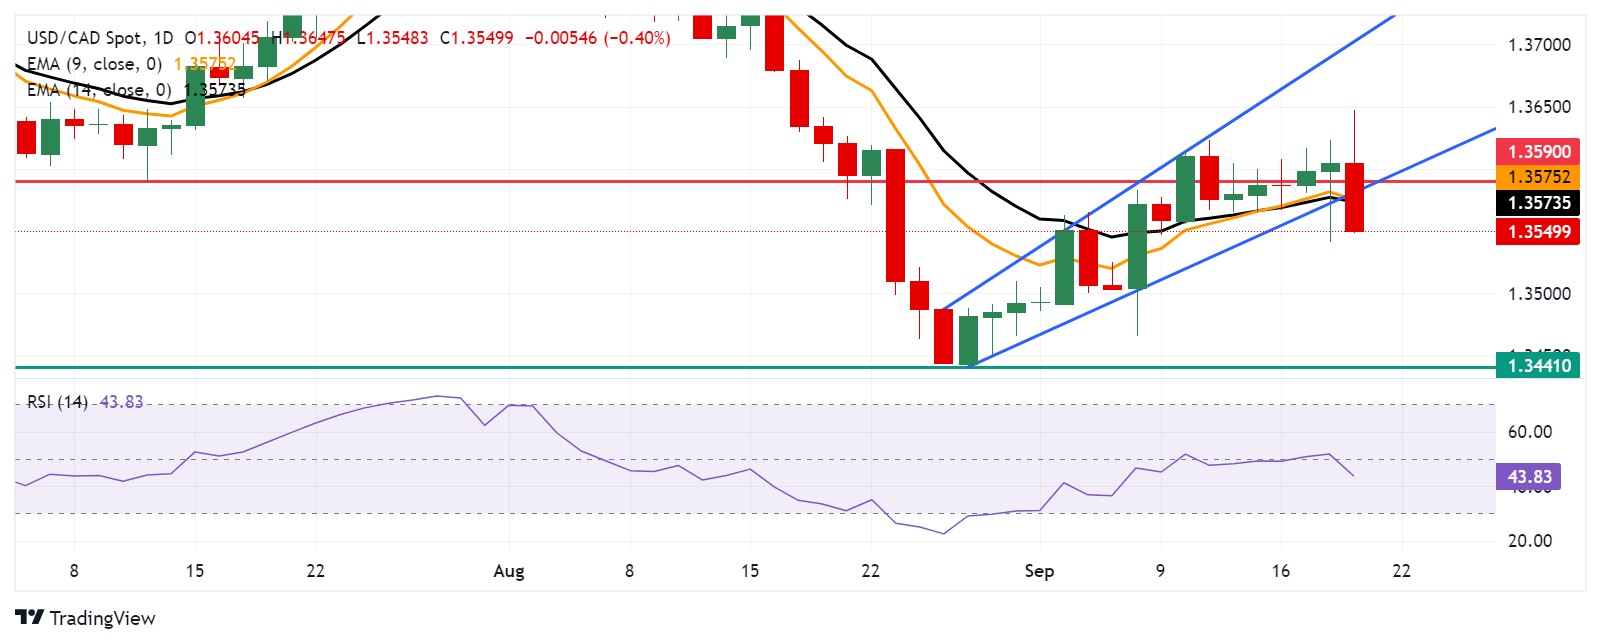
Canadian Dollar PRICE Today
The table below shows the percentage change of Canadian Dollar (CAD) against listed major currencies today. Canadian Dollar was the strongest against the Japanese Yen.
| USD | EUR | GBP | JPY | CAD | AUD | NZD | CHF | |
|---|---|---|---|---|---|---|---|---|
| USD | -0.39% | -0.35% | 0.27% | -0.41% | -0.95% | -0.81% | -0.02% | |
| EUR | 0.39% | 0.04% | 0.67% | -0.01% | -0.53% | -0.42% | 0.38% | |
| GBP | 0.35% | -0.04% | 0.64% | -0.06% | -0.59% | -0.47% | 0.32% | |
| JPY | -0.27% | -0.67% | -0.64% | -0.67% | -1.21% | -1.12% | -0.31% | |
| CAD | 0.41% | 0.01% | 0.06% | 0.67% | -0.54% | -0.40% | 0.38% | |
| AUD | 0.95% | 0.53% | 0.59% | 1.21% | 0.54% | 0.13% | 0.92% | |
| NZD | 0.81% | 0.42% | 0.47% | 1.12% | 0.40% | -0.13% | 0.80% | |
| CHF | 0.02% | -0.38% | -0.32% | 0.31% | -0.38% | -0.92% | -0.80% |
The heat map shows percentage changes of major currencies against each other. The base currency is picked from the left column, while the quote currency is picked from the top row. For example, if you pick the Canadian Dollar from the left column and move along the horizontal line to the US Dollar, the percentage change displayed in the box will represent CAD (base)/USD (quote).
Potential of the Euro (EUR) breaking above 1.1200 remains unclear, UOB Group Quek Ser Leang and Victor Yong note.
EUR may test 1.1200 near term
24-HOUR VIEW: “Yesterday, we expected EUR to trade in a 1.1085/1.1145 range. In NY trade, EUR soared briefly to 1.1189, plummeted to 1.1094 and then closed largely unchanged (1.1118, +0.04%). Despite the choppy price action, the underlying tone seems to have softened somewhat. Today, we expect EUR to trade in a range, albeit a lower one of 1.1080/1.1140.”
1-3 WEEKS VIEW: “Two days ago (17 Sep, spot at 1.1125), we highlighted that EUR “is likely to continue to rise, but it is unclear at this time if it has sufficient momentum to break above the year-to-date high, near 1.1200.” Yesterday, EUR rose briefly to 1.1188, pulling back to close largely unchanged. The price action did not result in any increase in momentum, and it is still unclear for now if EUR can break above 1.1200. However, only a breach of 1.1060 (‘strong support’ level previously at 1.1040) would indicate that the potential for EUR to rise above 1.1200 has dissipated.”
- USD/CHF struggles to preserve its intraday gains to a one-week high amid renewed USD selling.
- Rising US bond yields limit the USD losses and lend support to the pair amid the risk-on mood.
- SECO forecasts Swiss economic growth in 2024 and 2025 to be considerably below average.
The USD/CHF pair attracts some sellers following an intraday uptick to the 0.8515 area, or a one-week high and drops to a fresh daily low during the first half of the European session on Thursday. Spot prices currently trade around the 0.8455-0.8460 region, nearly unchanged for the day, and remain confined in a familiar range held since the beginning of this month.
The US Dollar (USD) comes under some renewed selling pressure and stalls the post-FOMC recovery from its lowest level since July 2023, which, in turn, exerts some downward pressure on the USD/CHF pair. Meanwhile, the Federal Reserve's (Fed) not-so-dovish outlook on Wednesday raised questions about the magnitude of interest rate cuts going forward and lent some support to the Greenback. In fact, the updated economic projections revealed that policymakers don't see inflation returning to the 2% target before 2026.
Adding to this, Fed Chair Jerome Powell Fed Chair Jerome Powell said during the post-meeting press conference that the central bank had no intention of returning to an ultra-low-rate regime and dashed hopes for a more aggressive policy easing. This is seen as a key factor that continues to push the US Treasury bond yields higher and should act as a tailwind for the buck. Apart from this, a generally positive risk tone could undermine the safe-haven Swiss Franc (CHF) and contribute to limiting the downside for the USD/CHF pair.
Furthermore, Switzerland’s State Secretariat for Economic Affairs (SECO), in its June economic forecasts, said that the government continues to expect economic growth in 2024 and 2025 to be considerably below average. This, in turn, warrants some caution for bearish traders and before positioning for any further depreciating move for the USD/CHF pair. Investors now look forward to the US macro data – Weekly Initial Jobless Claims, the Philly Fed Manufacturing Index and Existing Home Sales data – for short-term trading opportunities.
US Dollar PRICE Today
The table below shows the percentage change of US Dollar (USD) against listed major currencies today. US Dollar was the strongest against the Japanese Yen.
| USD | EUR | GBP | JPY | CAD | AUD | NZD | CHF | |
|---|---|---|---|---|---|---|---|---|
| USD | -0.27% | -0.30% | 0.29% | -0.39% | -0.91% | -0.67% | 0.07% | |
| EUR | 0.27% | -0.03% | 0.56% | -0.11% | -0.62% | -0.40% | 0.31% | |
| GBP | 0.30% | 0.03% | 0.59% | -0.09% | -0.61% | -0.37% | 0.33% | |
| JPY | -0.29% | -0.56% | -0.59% | -0.64% | -1.18% | -0.98% | -0.25% | |
| CAD | 0.39% | 0.11% | 0.09% | 0.64% | -0.53% | -0.28% | 0.42% | |
| AUD | 0.91% | 0.62% | 0.61% | 1.18% | 0.53% | 0.24% | 0.95% | |
| NZD | 0.67% | 0.40% | 0.37% | 0.98% | 0.28% | -0.24% | 0.72% | |
| CHF | -0.07% | -0.31% | -0.33% | 0.25% | -0.42% | -0.95% | -0.72% |
The heat map shows percentage changes of major currencies against each other. The base currency is picked from the left column, while the quote currency is picked from the top row. For example, if you pick the US Dollar from the left column and move along the horizontal line to the Japanese Yen, the percentage change displayed in the box will represent USD (base)/JPY (quote).
- AUD/JPY gains ground following the release of employment data on Thursday.
- Fed Chair Powell’s remarks tempered optimism, preventing stronger risk-sensitive currencies like AUD.
- The upside of the currency cross could be limited as the JPY receives support from the hawkish BoJ.
AUD/JPY continues its winning for the fourth successive day, trading around 97.10 during the early European hours. The Australian Dollar (AUD) received support following the labor market report released on Thursday.
Australian Employment Change rose to 47.5K in August, down from 58.2K in July but significantly above the consensus forecast of 25.0K. The Unemployment Rate held steady at 4.2% in August, consistent with both expectations and the previous month’s figure, according to data released by the Australian Bureau of Statistics (ABS).
The US Federal Reserve’s (Fed) 50 basis point interest rate cut on Wednesday may have improved market confidence and supported risk-sensitive currencies like the Australian Dollar. However, comments from Fed Chair Jerome Powell tempered optimism, preventing a stronger risk-on sentiment in the markets.
Fed’s Chair Powell stated in the post-meeting press conference, that the Fed is not in a hurry to ease policy and emphasized that half-percentage point rate cuts are not the "new pace." Additionally, Fed policymakers raised their long-term projection for the federal funds rate from 2.8% to 2.9%.
The upside of the AUD/JPY cross could be limited as the Japanese Yen (JPY) receives support from the hawkish sentiment surrounding the Bank of Japan (BoJ). Traders are anticipating the BoJ's policy decision, with expectations that rates will remain unchanged while leaving room for potential future rate hikes.
Additionally, Japan’s National Consumer Price Index (CPI) data will be closely monitored, as the inflation report could offer new insights into the Bank of Japan’s (BoJ) future interest rate trajectory.
Interest rates FAQs
Interest rates are charged by financial institutions on loans to borrowers and are paid as interest to savers and depositors. They are influenced by base lending rates, which are set by central banks in response to changes in the economy. Central banks normally have a mandate to ensure price stability, which in most cases means targeting a core inflation rate of around 2%. If inflation falls below target the central bank may cut base lending rates, with a view to stimulating lending and boosting the economy. If inflation rises substantially above 2% it normally results in the central bank raising base lending rates in an attempt to lower inflation.
Higher interest rates generally help strengthen a country’s currency as they make it a more attractive place for global investors to park their money.
Higher interest rates overall weigh on the price of Gold because they increase the opportunity cost of holding Gold instead of investing in an interest-bearing asset or placing cash in the bank. If interest rates are high that usually pushes up the price of the US Dollar (USD), and since Gold is priced in Dollars, this has the effect of lowering the price of Gold.
The Fed funds rate is the overnight rate at which US banks lend to each other. It is the oft-quoted headline rate set by the Federal Reserve at its FOMC meetings. It is set as a range, for example 4.75%-5.00%, though the upper limit (in that case 5.00%) is the quoted figure. Market expectations for future Fed funds rate are tracked by the CME FedWatch tool, which shapes how many financial markets behave in anticipation of future Federal Reserve monetary policy decisions.
- The Pound Sterling surges to near 1.3250 against the US Dollar following the Fed’s large rate cut and expectations of further policy easing.
- Investors focus on the BoE policy meeting, with markets expecting the UK central bank to leave interest rates unchanged at 5%.
- UK’s stubborn services inflation in August strengthened the case for the BoE keeping interest rates steady.
The Pound Sterling (GBP) recovers intraday losses in the aftermath of the Federal Reserve’s (Fed) policy announcement, rising above 1.3200 against the US Dollar (USD) in Thursday’s London session. The valuation of the British currency is expected to remain volatile ahead of the Bank of England (BoE) policy meeting at 11:00 GMT.
The BoE is expected to leave interest rates unchanged at 5% after opting for a cut in August as central bank officials remain concerned about inflation’s sustainable return to the bank’s target of 2%. Out of the nine Monetary Policy Committee (MPC) members, BoE external member Swati Dhingra and Deputy Governor Dave Ramsden are expected to vote for cutting interest rates for the second consecutive time. The rest of the MPC will likely support keeping rates at their current levels.
The United Kingdom (UK) Consumer Price Index (CPI) data for August showed that core inflation – which excludes volatile items – accelerated to 3.6%, higher than what markets expected. Services inflation, a closely watched indicator by BoE officials, rose sharply to 5.6% from 5.2% in July.
While the BoE is widely anticipated to keep interest rates steady, investors will focus on guidance for the remainder of the year. Currently, financial market participants expect that the BoE will cut interest rates one more time in any of its remaining monetary policy meetings.
Daily digest market movers: Pound Sterling outperforms US Dollar on firm Fed dovish bets
- The Pound Sterling climbs to near 1.3250 against the US Dollar as the latter falls sharply amid growing speculation that the policy-easing cycle from the Fed will be deeper than previously expected. The US Dollar Index (DXY), which tracks the Greenback’s value against six major currencies, retreats from a five-day high of 101.50.
- The Fed delivered a 50-basis points (bp) interest rate cut on Wednesday, which signaled that the central bank is confident that inflation is declining to the bank’s target of 2% and is increasingly concerned over deteriorating labor market conditions. Fed Chair Jerome Powell ruled out fears of the United States (US) economy entering a recession: "I don't see anything in the economy right now that suggests that the likelihood of a recession," he said, adding that "you see growth at a solid rate, you see inflation coming down, and you see a labor market that's still at very solid levels."
- Fed officials anticipate the federal funds rate heading to 4.4% by the end of the year, suggesting that the Fed will cut interest rates by 50 bps more. According to the CME FedWatch tool, the probability for the Fed reducing interest rates by 25 bps to 4.50%-4.75% in November is at 65.6%, while the rest favors a 50-bps rate cut.
- Analysts at Citi see the Fed reducing interest rates by 50 bps again in November. “Powell noted a number of times that today’s 50bp cut is a ‘commitment’ to not get behind the curve, which suggests the bar for further large rate reductions is very low. We continue to see risks as balanced toward a more rapid softening of labor market data and a more aggressive pace of rate cuts.”
- In Thursday’s US session, investors will focus on the Initial Jobless Claims data for the week ending September 13. Individuals claiming jobless benefits for the first time are expected to have remained steady at 230K.
Technical Analysis: Pound Sterling aims to recapture 1.3300
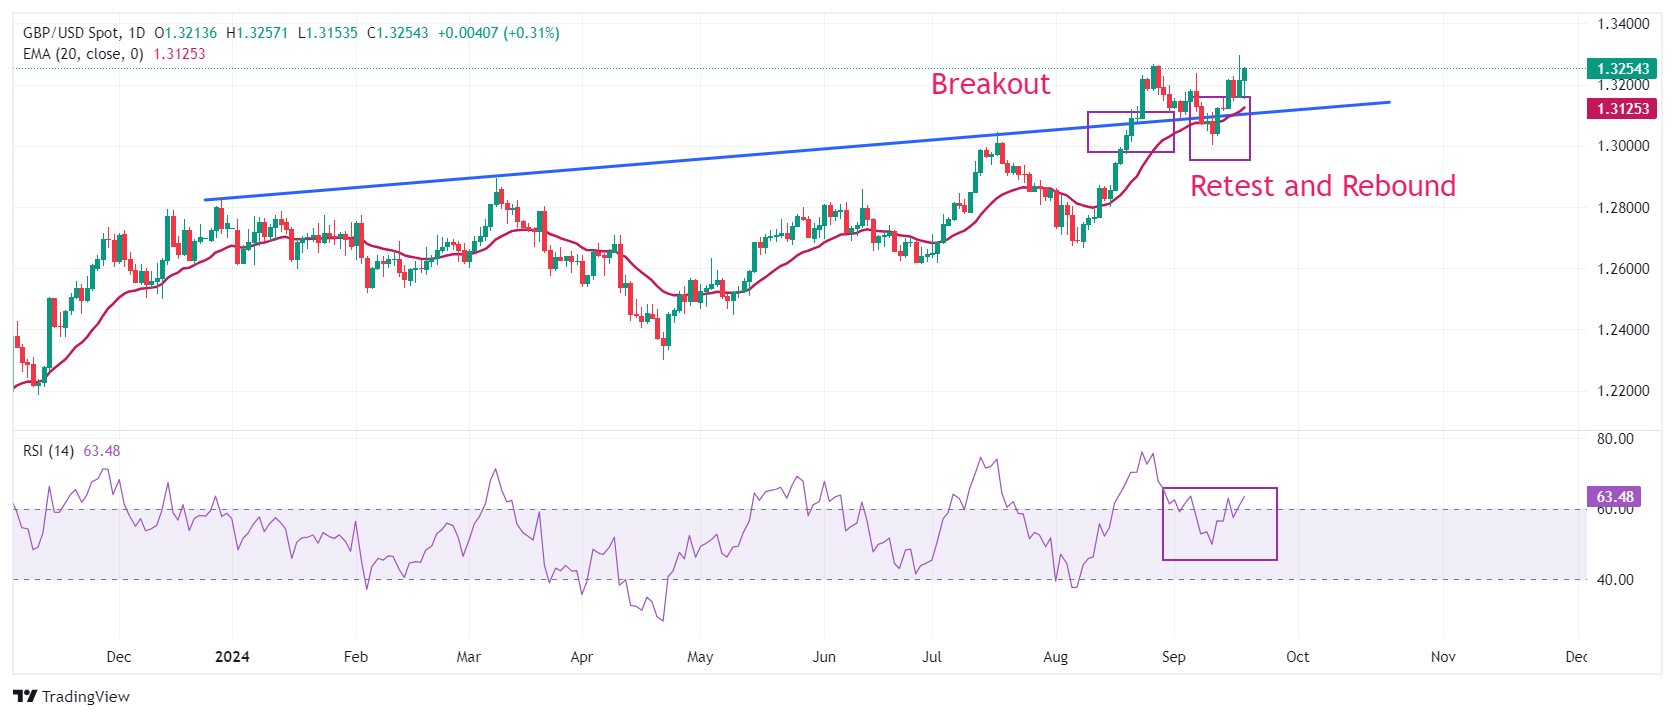
The Pound Sterling approaches 1.3300 against the US Dollar in European trading hours. The near-term outlook of the GBP/USD pair remains firm as it holds above the 20-day Exponential Moving Average (EMA) near 1.3100. Earlier, the Cable strengthened after recovering from a corrective move to near the trendline plotted from the December 28, 2023, high of 1.2828, from where it delivered a sharp increase after a breakout on August 21.
The 14-day Relative Strength Index (RSI) stands above 60.00. A fresh round of bullish momentum could occur if the oscillator sustains around this level.
Looking up, the Cable will face resistance near the August 27 high of 1.3266 and the psychological level of 1.3500. On the downside, the psychological level of 1.3000 emerges as crucial support.
Pound Sterling FAQs
The Pound Sterling (GBP) is the oldest currency in the world (886 AD) and the official currency of the United Kingdom. It is the fourth most traded unit for foreign exchange (FX) in the world, accounting for 12% of all transactions, averaging $630 billion a day, according to 2022 data. Its key trading pairs are GBP/USD, aka ‘Cable’, which accounts for 11% of FX, GBP/JPY, or the ‘Dragon’ as it is known by traders (3%), and EUR/GBP (2%). The Pound Sterling is issued by the Bank of England (BoE).
The single most important factor influencing the value of the Pound Sterling is monetary policy decided by the Bank of England. The BoE bases its decisions on whether it has achieved its primary goal of “price stability” – a steady inflation rate of around 2%. Its primary tool for achieving this is the adjustment of interest rates. When inflation is too high, the BoE will try to rein it in by raising interest rates, making it more expensive for people and businesses to access credit. This is generally positive for GBP, as higher interest rates make the UK a more attractive place for global investors to park their money. When inflation falls too low it is a sign economic growth is slowing. In this scenario, the BoE will consider lowering interest rates to cheapen credit so businesses will borrow more to invest in growth-generating projects.
Data releases gauge the health of the economy and can impact the value of the Pound Sterling. Indicators such as GDP, Manufacturing and Services PMIs, and employment can all influence the direction of the GBP. A strong economy is good for Sterling. Not only does it attract more foreign investment but it may encourage the BoE to put up interest rates, which will directly strengthen GBP. Otherwise, if economic data is weak, the Pound Sterling is likely to fall.
Another significant data release for the Pound Sterling is the Trade Balance. This indicator measures the difference between what a country earns from its exports and what it spends on imports over a given period. If a country produces highly sought-after exports, its currency will benefit purely from the extra demand created from foreign buyers seeking to purchase these goods. Therefore, a positive net Trade Balance strengthens a currency and vice versa for a negative balance.
- The Mexican Peso is moderating higher on Thursday as the global risk appetite supports emerging market currencies.
- The Peso weakened across the board on Wednesday after the Fed announced a mega 0.50% rate cut.
- USD/MXN is consolidating at the base of a rising channel and the 50-day SMA.
The Mexican Peso (MXN) edges higher in its most heavily-traded pairs during the European session on Thursday as global stocks rally amid an upbeat tone that is generally positive for emerging market FX.
On Wednesday, however, the Peso lost ground following the US Federal Reserve’s (Fed) decision to cut interest rates by a larger 0.50% at its meeting. MXN weakened by an average of 1.1% against the US Dollar (USD), Euro (EUR), and Pound Sterling (GBP) on the day.
The Mexican Peso was probably not helped by comments from Victor Manuel Herrera, President of the National Economic Research Committee at Instituto Mexicano de Ejecutivos de Finanzas (IMEF) on Wednesday. Herrera said that the Mexican government’s controversial judicial reforms and the scrapping of independent industry regulatory bodies might harm the Mexican economy by reducing its attractiveness to foreign investors, especially from the US.
Mexican Peso still overvalued – Capital Economics
The Mexican Peso remains overpriced, according to London-based advisory service Capital Economics, and given the state of precarious public finances, is, therefore, set for further declines in the future.
Well-publicized concerns about the left-leaning government’s radical constitutional reform plans aside, Mexico’s public finances are in poor shape, and the country’s indebtedness puts the economy at risk.
“President-elect Sheinbaum, protégé of the outgoing President Amlo, will inherit a myriad of economic issues. Most notably, the deteriorating public finances that are compounded by the heavily indebted state oil firm, Pemex, and could threaten Mexico’s investment grade sovereign credit rating,” says Joe Maher, Assistant Economist at Capital Economics.
Another factor weighing on the Peso is the unwinding of the so-called “carry trade,” in which investors borrow in a currency where interest rates are low, such as the Japanese Yen (JPY), and use the loan to buy a currency where interest rates are high, like the Peso. As long as the Peso does not depreciate against the Yen, those investors stand to earn the difference in the interest repayments on the Yen loan and the interest earned by being in Pesos. However, since the Yen has begun appreciating on the back of expectations that the Bank of Japan (BoJ) will raise interest rates, the carry trade has lost its luster.
Maher sees further downside pressure on the Peso from being overvalued on a Price Purchasing Parity (PPP) basis.
“The Peso has room to weaken further. For example, it is still somewhat stronger than what is implied by relative price levels in the US and Mexico,” says the Assistant Economist
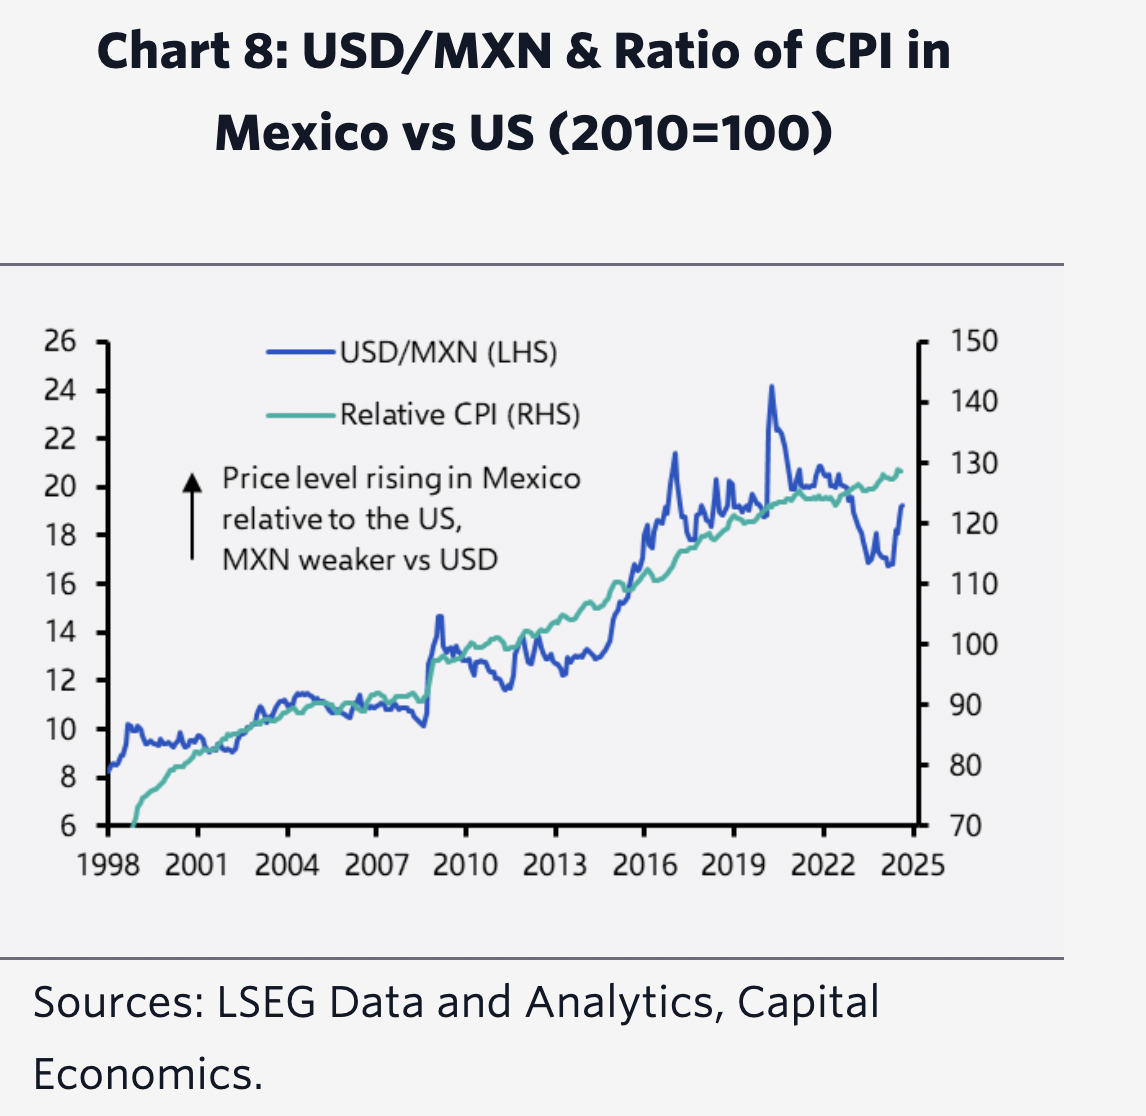
That said, the Mexican currency will gain some support from upbeat risk appetite. Capital Economics’s base case is that the US economy will avoid a recession, and if this holds true then the Peso should see gains.
“If we are correct in thinking that the US economy will avoid a recession, global risk appetite will probably stay strong, which would support Mexican assets and the peso,” he adds.
Nevertheless, Capital Economics revises down its forecasts, expecting the Peso to weaken to USD/MXN 20.00 by the end of 2024 and 21.00 by the end of 2025.
Technical Analysis: USD/MXN consolidates near bottom of channel
USD/MXN is consolidating near the bottom of a long-term rising channel.
The pair declined last week after forming a Three Black Crows Japanese candlestick pattern (shaded rectangle in the chart below). The pattern indicates prices could fall even further in the short term. Key support from the base of the channel and the 50-day Simple Moving Average at 19.02, however, stand in the way.
USD/MXN Daily Chart
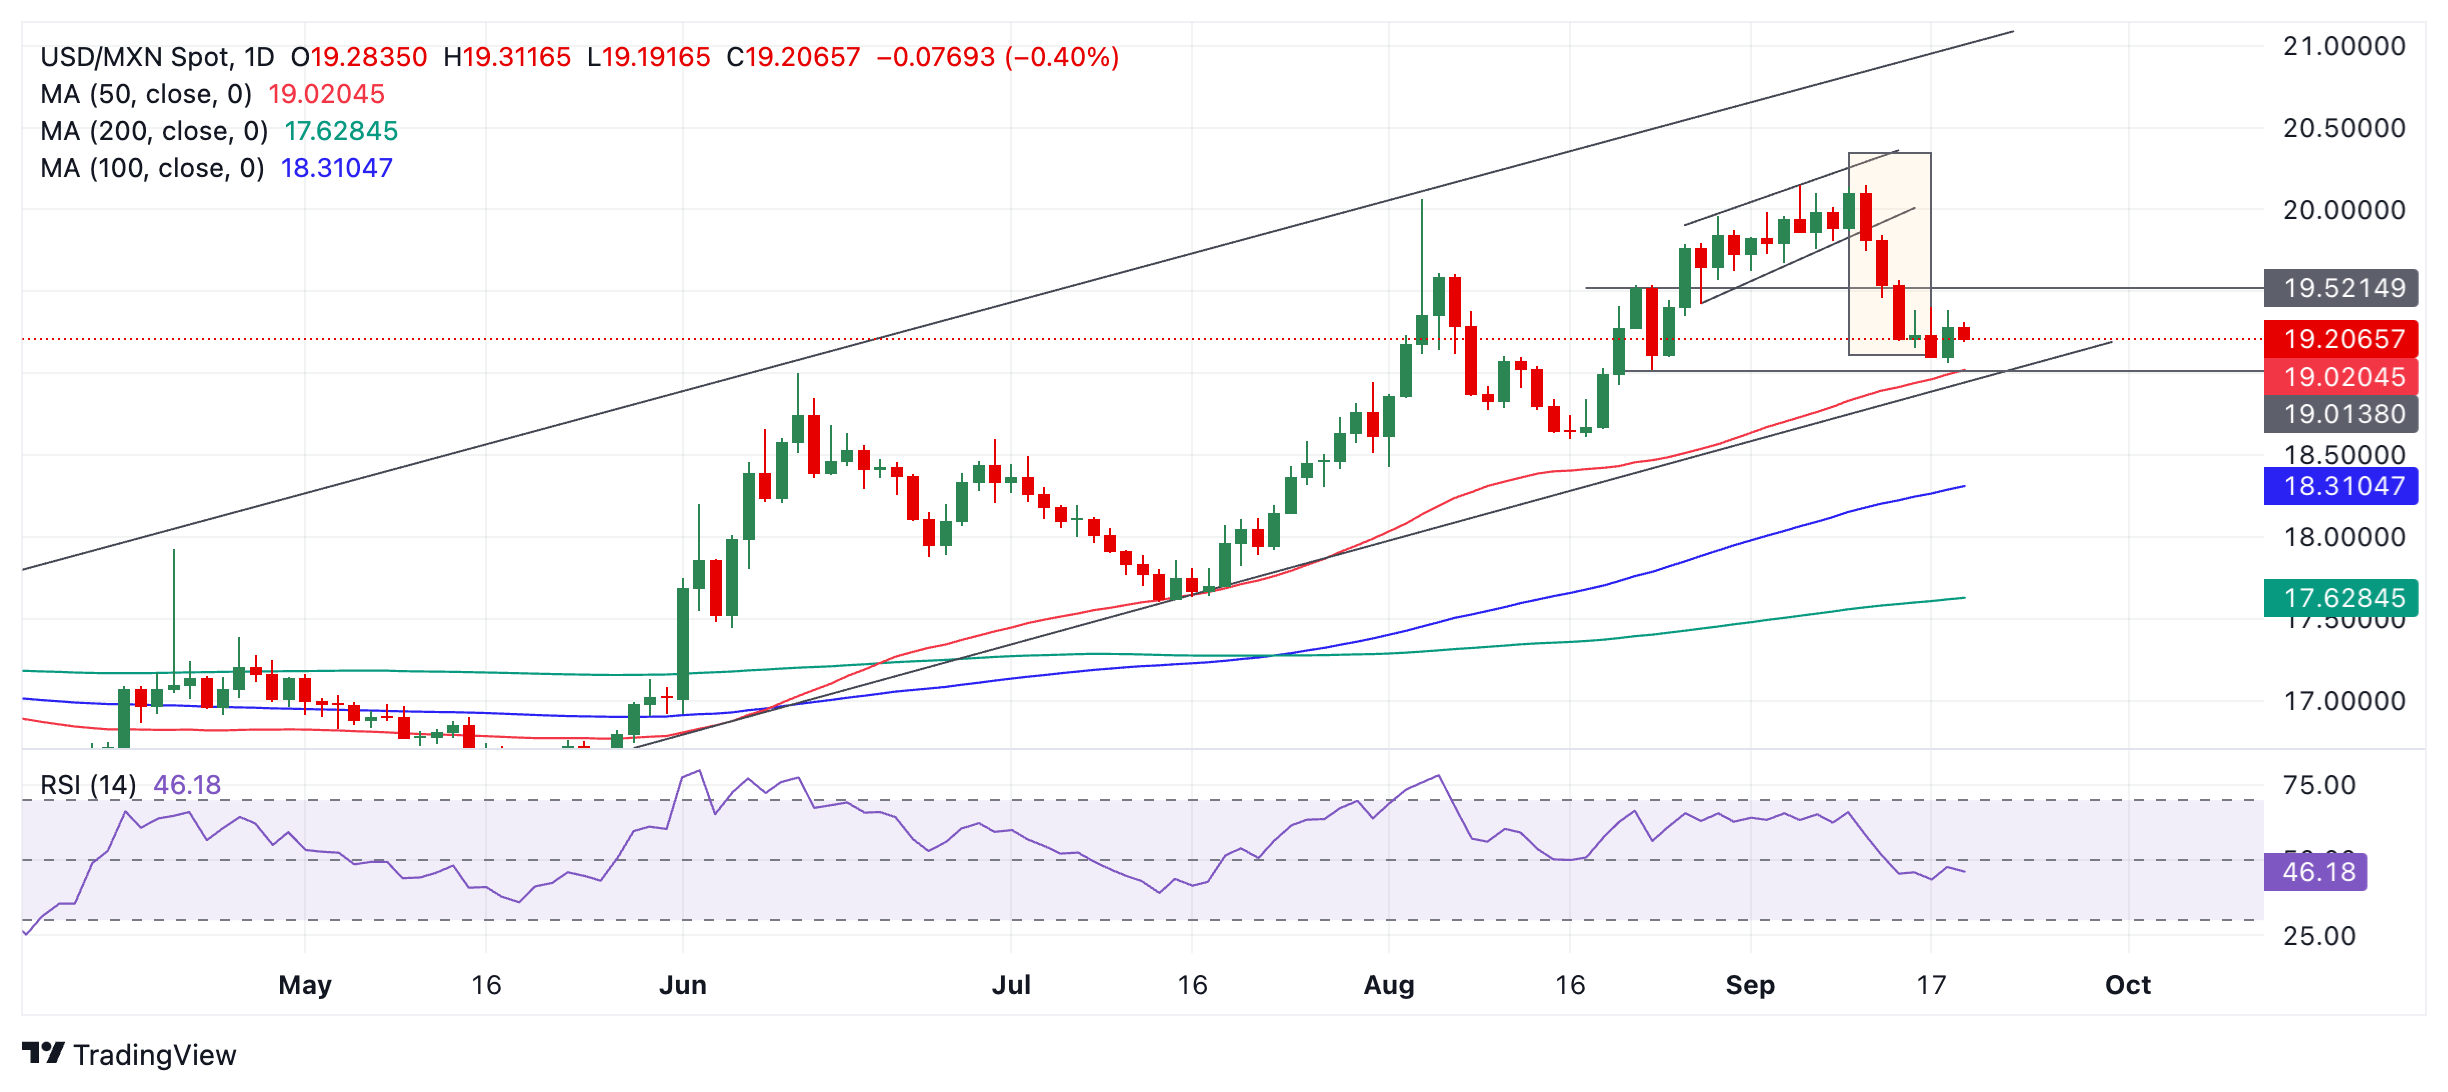
USD/MXN could extend weakness a little to the lower channel line at around 19.01 and the 50 SMA nearby. Despite being in a short-term downtrend, these firm support levels will be tough nuts for bears to crack. There is a risk that USD/MXN will simply stabilize and use the support shelf to launch a recovery within the channel, thereby extending the medium and long-term uptrends.
A decisive break below the lower channel line and 50 SMA would be required to alter the outlook and indicate a continuation of the down move.
A decisive break would be one accompanied by a long red candle that pierced well below the channel line and closed near its low, or three down days in a row that broke clearly below the line.
Here is what you need to know on Thursday, September 19:
Following the wild fluctuations seen in financial markets in the American session on Wednesday, volatility remains high early Thursday. The Bank of England (BoE) will announce monetary policy decisions during the European trading hours. Later in the day, the US economic calendar will feature weekly Initial Jobless Claims, August Existing Home Sales and September Philadelphia Fed Manufacturing Survey data.
Following the two-day policy meeting, the Federal Reserve (Fed) announced that it lowered the policy rate by 50 basis points (bps) to the range of 4.75%-5%. The revised Summary of Economic Projections (SEP), the so-called dot-plot, showed that policymakers foresee two more 25 bps rate reductions in the last two meetings of the year. The immediate reaction to the Fed policy decision triggered a heavy selloff in the US Dollar (USD).
US Dollar PRICE This week
The table below shows the percentage change of US Dollar (USD) against listed major currencies this week. US Dollar was the weakest against the Australian Dollar.
| USD | EUR | GBP | JPY | CAD | AUD | NZD | CHF | |
|---|---|---|---|---|---|---|---|---|
| USD | -0.59% | -0.90% | 1.02% | -0.20% | -1.70% | -1.34% | -0.24% | |
| EUR | 0.59% | -0.38% | 1.57% | 0.36% | -1.17% | -0.81% | 0.31% | |
| GBP | 0.90% | 0.38% | 1.86% | 0.73% | -0.80% | -0.43% | 0.69% | |
| JPY | -1.02% | -1.57% | -1.86% | -1.20% | -2.63% | -2.31% | -1.31% | |
| CAD | 0.20% | -0.36% | -0.73% | 1.20% | -1.57% | -1.14% | -0.15% | |
| AUD | 1.70% | 1.17% | 0.80% | 2.63% | 1.57% | 0.37% | 1.48% | |
| NZD | 1.34% | 0.81% | 0.43% | 2.31% | 1.14% | -0.37% | 1.13% | |
| CHF | 0.24% | -0.31% | -0.69% | 1.31% | 0.15% | -1.48% | -1.13% |
The heat map shows percentage changes of major currencies against each other. The base currency is picked from the left column, while the quote currency is picked from the top row. For example, if you pick the US Dollar from the left column and move along the horizontal line to the Japanese Yen, the percentage change displayed in the box will represent USD (base)/JPY (quote).
In the post-meeting press conference, however, Chairman Jerome Powell reiterated that they remain attentive to the risks on the both sides of the mandate. "If the economy remains solid, we can dial back the pace of cuts; equally, if the labor market deteriorates, we can respond," Powell added. After slumping to its lowest since July 2023 at 100.21, the USD Index staged a rebound and closed the day flat. In the early Asian session, the USD Index extended its recovery toward 101.50 but lost its traction. At the time of press, the index was in negative territory below 101.00. In the meantime, the benchmark 10-year US Treasury bond yield holds steady at around 3.7% after rising more than 1.5% on Wednesday and US stock index futures trade decisively higher after Wall Street's main indexes ended the previous day marginally lower.
The BoE is forecast to maintain the policy rate at 5%. Since there will not be a press conference, investors could react to changes in the policy statement and the vote split. After touching its highest level in over two years near 1.3300, GBP/USD erased a large portion of its daily gains on Wednesday. The pair holds its ground in the European morning on Thursday and trades at around 1.3250.
During the Asian trading hours, the data from Australia showed that the Unemployment Rate was unchanged at 4.2% in August as expected. In this period, the Employment Change was up 47.5K, better than analysts' estimate for an increase of 25K. AUD/USD gathered bullish momentum and climbed to a fresh 2024-high above 0.6800.
EUR/USD spiked toward 1.1200 with the immediate reaction to the Fed but lost its traction to close the day flat. The pair benefits from the renewed selling pressure surrounding the USD and rises toward 1.1150 on Thursday.
USD/JPY advanced to its highest level in nearly two weeks at 143.95 during the Asian trading hours on Thursday but reversed its direction. At the time of press, the pair was virtually unchanged on the day, trading near 142.20.
Gold reached a new all-time high of $2,600 in the American session on Wednesday. Although XAU/USD made a sharp U-turn and ended the day in the red, it started to gather bullish momentum early Thursday. XAU/USD was last seen rising more than 0.7% on the day near $2,580.
BoE FAQs
The Bank of England (BoE) decides monetary policy for the United Kingdom. Its primary goal is to achieve ‘price stability’, or a steady inflation rate of 2%. Its tool for achieving this is via the adjustment of base lending rates. The BoE sets the rate at which it lends to commercial banks and banks lend to each other, determining the level of interest rates in the economy overall. This also impacts the value of the Pound Sterling (GBP).
When inflation is above the Bank of England’s target it responds by raising interest rates, making it more expensive for people and businesses to access credit. This is positive for the Pound Sterling because higher interest rates make the UK a more attractive place for global investors to park their money. When inflation falls below target, it is a sign economic growth is slowing, and the BoE will consider lowering interest rates to cheapen credit in the hope businesses will borrow to invest in growth-generating projects – a negative for the Pound Sterling.
In extreme situations, the Bank of England can enact a policy called Quantitative Easing (QE). QE is the process by which the BoE substantially increases the flow of credit in a stuck financial system. QE is a last resort policy when lowering interest rates will not achieve the necessary result. The process of QE involves the BoE printing money to buy assets – usually government or AAA-rated corporate bonds – from banks and other financial institutions. QE usually results in a weaker Pound Sterling.
Quantitative tightening (QT) is the reverse of QE, enacted when the economy is strengthening and inflation starts rising. Whilst in QE the Bank of England (BoE) purchases government and corporate bonds from financial institutions to encourage them to lend; in QT, the BoE stops buying more bonds, and stops reinvesting the principal maturing on the bonds it already holds. It is usually positive for the Pound Sterling.
In its June economic forecasts, Switzerland’s State Secretariat for Economic Affairs (SECO) said that the “Swiss government continues to expect Switzerland's economic growth in 2024 to be considerably below average.”
Additional takeaways
Swiss government sees 2024 GDP (sport event adjusted) growth at +1.2% (previous forecast was +1.2%).
Swiss government sees 2025 GDP (sport event adjusted) growth at +1.6% (previous forecast was +1.7%).
Swiss government sees 2024 CPI at +1.2% (previous forecast was +1.4%).
Swiss government sees 2025 CPI at +0.7% (previous forecast was +1.1%).
Swiss government expects a moderate acceleration in growth for 2025, as global economic conditions gradually improve.
Market reaction
Despite the discouraging assessment, USD/CHF is down 0.08% on the day, trading at around 0.8455.
- EUR/GBP loses momentum around 0.8405 in Thursday’s early European session.
- The BoE is set to hold rates steady as it eyes stubborn inflation.
- ECB’s Nagel said Eurozone inflation is not where the ECB wants it to be.
The EUR/GBP cross drifts lower to near 0.8405 during the early European trading hours on Thursday. The recent UK Consumer Price Index (CPI) inflation data released on Wednesday dampens hopes that the Bank of England (BoE) will cut interest rates on Thursday, which provides some support to the Pound Sterling (GBP). All eyes will be on the BoE monetary policy meeting on Thursday.
The BoE is anticipated to leave the interest rate unchanged at 5.0% at its September meeting as the UK CPI inflation remains above the central bank's 2% target. The UK CPI rose at an annual pace of 2.2% in August, in line with the market consensus and the previous reading of 2.2%. Meanwhile, core CPI, excluding volatile food and energy items, jumped 3.6% YoY in August versus 3.3% in July, hotter than the 3.5% expected.
Traders expect the BoE to delay a second rate cut until November. However, if the UK central bank surprises a rate cut, it might exert some selling pressure on the Pound Sterling (GBP) and act as a tailwind for EUR/GBP.
Inflation in the eurozone, as measured by the Harmonized Index of Consumer Prices (HICP), dropped to its lowest level in three years, easing to 2.2% YoY in August, but remains above the ECB’s goal. ECB policymaker Joachim Nagel on Wednesday noted, "This is because the monetary policy course must remain sufficiently tight for long enough for the inflation rate to return to the 2% target in the medium term.
BoE FAQs
The Bank of England (BoE) decides monetary policy for the United Kingdom. Its primary goal is to achieve ‘price stability’, or a steady inflation rate of 2%. Its tool for achieving this is via the adjustment of base lending rates. The BoE sets the rate at which it lends to commercial banks and banks lend to each other, determining the level of interest rates in the economy overall. This also impacts the value of the Pound Sterling (GBP).
When inflation is above the Bank of England’s target it responds by raising interest rates, making it more expensive for people and businesses to access credit. This is positive for the Pound Sterling because higher interest rates make the UK a more attractive place for global investors to park their money. When inflation falls below target, it is a sign economic growth is slowing, and the BoE will consider lowering interest rates to cheapen credit in the hope businesses will borrow to invest in growth-generating projects – a negative for the Pound Sterling.
In extreme situations, the Bank of England can enact a policy called Quantitative Easing (QE). QE is the process by which the BoE substantially increases the flow of credit in a stuck financial system. QE is a last resort policy when lowering interest rates will not achieve the necessary result. The process of QE involves the BoE printing money to buy assets – usually government or AAA-rated corporate bonds – from banks and other financial institutions. QE usually results in a weaker Pound Sterling.
Quantitative tightening (QT) is the reverse of QE, enacted when the economy is strengthening and inflation starts rising. Whilst in QE the Bank of England (BoE) purchases government and corporate bonds from financial institutions to encourage them to lend; in QT, the BoE stops buying more bonds, and stops reinvesting the principal maturing on the bonds it already holds. It is usually positive for the Pound Sterling.
FX option expiries for Sept 19 NY cut at 10:00 Eastern Time, via DTCC, can be found below.
EUR/USD: EUR amounts
- 1.0910 1.3b
- 1.1020 891m
- 1.1070 869m
- 1.1090 909m
- 1.1100 3.6b
- 1.1105 1.2b
- 1.1125 1b
- 1.1140 932m
- 1.1150 2.2b
- 1.1200 3b
GBP/USD: GBP amounts
- 1.3250 864m
- 1.3300 1.2b
- 1.3350 685m
USD/JPY: USD amounts
- 141.00 1.5b
- 142.00 758m
- 143.00 889m
USD/CHF: USD amounts
- 0.8365 2.2b
- 0.8500 1.6b
AUD/USD: AUD amounts
- 0.6560 832m
- 0.6695 916m
- 0.6740 1.7b
- 0.6745 878m
- 0.6900 1b
USD/CAD: USD amounts
- 1.3420 535m
- 1.3600 924m
NZD/USD: NZD amounts
- 0.6035 600m
- 0.6140 1.1b
EUR/GBP: EUR amounts
- 0.8460 485m
- GBP/JPY gathers strength around 188.65 in Thursday’s early European session.
- The BoE will announce its interest rate decision on Thursday, with market participants widely expecting the rate to remain unchanged.
- The markets expect no change at the September BoJ meeting, which concludes Friday.
The GBP/JPY cross trades in positive territory for the fourth consecutive day near 188.65 on Thursday during the early European session. The weakening of the Japanese Yen (JPY) drags the cross lower. The Bank of England (BoE) will announce its interest rate decision later on Thursday. On Friday, all eyes will be on the Bank of Japan (BoJ) monetary policy meeting.
The BoE is expected to hold the interest rate at 5.0% at its September meeting on Thursday as UK Consumer Price Index (CPI) inflation remained at 2.2% in August, above the central bank's 2% target. Rob Wood, chief UK economist at economic research consultancy Pantheon Macroeconomics, said the inflation data released on Wednesday gave the BoE "little reason to rush to cut interest rates again" on Thursday.
The financial market expects the BoE to delay a second rate cut until November. However, if the UK central bank surprises a rate cut, it might cause the Pound Sterling (GBP) to weaken significantly.
The BoJ is anticipated to maintain its target range for short-term interest rates at 0% to 1% on Friday. “Since the BOJ decision is expected to remain unchanged, attention is likely to focus on Governor Ueda’s subsequent remarks,” said Rina Oshimo, a senior strategist at Okasan Securities Co. Additionally, Japan’s National Consumer Price Index (CPI) data will be closely monitored, as it might offer some hints about the BoJ’s future interest rate path.
Bank of Japan FAQs
The Bank of Japan (BoJ) is the Japanese central bank, which sets monetary policy in the country. Its mandate is to issue banknotes and carry out currency and monetary control to ensure price stability, which means an inflation target of around 2%.
The Bank of Japan has embarked in an ultra-loose monetary policy since 2013 in order to stimulate the economy and fuel inflation amid a low-inflationary environment. The bank’s policy is based on Quantitative and Qualitative Easing (QQE), or printing notes to buy assets such as government or corporate bonds to provide liquidity. In 2016, the bank doubled down on its strategy and further loosened policy by first introducing negative interest rates and then directly controlling the yield of its 10-year government bonds.
The Bank’s massive stimulus has caused the Yen to depreciate against its main currency peers. This process has exacerbated more recently due to an increasing policy divergence between the Bank of Japan and other main central banks, which have opted to increase interest rates sharply to fight decades-high levels of inflation. The BoJ’s policy of holding down rates has led to a widening differential with other currencies, dragging down the value of the Yen.
A weaker Yen and the spike in global energy prices have led to an increase in Japanese inflation, which has exceeded the BoJ’s 2% target. With wage inflation becoming a cause of concern, the BoJ looks to move away from ultra loose policy, while trying to avoid slowing the activity too much.
- The Bank of England is set to hold its interest rate at 5.0% on Thursday.
- United Kingdom’s annual inflation was stable at 2.2% in August.
- BoE policy announcements are likely to rock the Pound Sterling.
After a close call in August, the Bank of England’s (BoE) September interest rate decision is keenly awaited for fresh cues on the bank’s future policy action and the pace of its bond sales.
Thursday’s meeting is not a “Super Thursday” – there won’t be any Monetary Policy Report (MPR) or a press conference from Governor Andrew Bailey –, but the United Kingdom (UK) central bank’s announcements at 11:00 GMT are likely to have a significant impact on the performance of the Pound Sterling (GBP).
What to expect from the Bank of England policy announcements?
The Bank of England is widely expected to hold the key interest rate at 5.0% following its September policy meeting, with the key focus likely on the language in the policy statement and the Monetary Policy Committee’s (MPC) voting composition.
The BoE is seen sticking to its cautious stance on the easing path amid elevated services inflation in the UK, as it awaits the Autumn Budget from the new Labour government on October 30. No new economic projections could also dissuade the central bank from committing to any forward guidance.
Back in August, the BoE lowered the key policy rate by 25 basis points (bps) to 5.0% from 5.25%, with a 5-4 MPC vote in favor of such a move. Chief Economist Huw Pill preferred to maintain the rate at 5.25%.
Jonathan Haskel, another MPC member, voted to keep rates on hold in August but he has since been replaced by Alan Taylor. Markets are uncertain about Taylor’s policy stance, anticipating him to go with the majority during his first rate-setting meeting.
August inflation data released on Wednesday showed that the Consumer Price Index (CPI) rose at an annual pace of 2.2%, staying above the BoE’s 2.0% target while coming in below the central bank’s expectations of 2.4% in the reported period. However, the rebound in the UK services inflation to 5.6% in August from July’s 5.2% remains a cause for concern, adding to the odds that the BoE will maintain its cautious outlook on the policy path.
Adding to this, Althea Spinozzi, Head of Fixed Income Strategy at Saxo Bank said, “while wage growth has surprised to the downside, with the 3-month average weekly earnings at 4% (down from 4.5%), it remains significantly higher than pre-pandemic levels. This is keeping real disposable income elevated compared to the 2010-2020 average, adding to the inflationary backdrop.”
Previewing the BoE policy decision, Althea noted: “The Bank of England is expected to keep rates steady in September, reflecting a cautious approach due to persistent inflation, especially in services, and elevated wage growth.”
“The BoE is likely to announce a further £100 billion reduction in gilt holdings in the next twelve months, reducing the need for active sales, which could provide fiscal relief for the government in light of the Autumn Statement,” she added.
How will the BoE interest rate decision impact GBP/USD?
The Pound Sterling has entered a consolidative phase against the US Dollar, having tested offers above the 1.3200 threshold earlier this week. Will the BoE policy verdict revive the GBP/USD uptrend?
If the BoE communication suggests the bank’s prudence on the future easing cycle, markets would perceive that as a hawkish hold, providing a fresh boost to the Pound Sterling. In such a case, GBP/USD could stretch higher toward the 1.3300 mark. Alternatively, should the central bank acknowledge the progress in the disinflationary trend and express concerns over the economic prospects, it could fan expectations for further rate cuts this year, dragging the pair back toward 1.3000.
Dhwani Mehta, Asian Session Lead Analyst at FXStreet, offers a brief technical outlook for GBP/USD:
“The GBP/USD pair settled Wednesday above the falling trendline resistance on the daily chart at 1.3199, yielding a technical breakout. The 14-day Relative Strength Index (RSI) holds comfortably above the 50 level, currently near 60, suggesting that upside risks remain intact in the near term.
“Buyers, however, need to find a strong foothold above the 1.3250 psychological level to take on the upside. The next topside barriers are seen at the multi-year high of 1.3297 and 1.3350. Alternatively, acceptance below the 21-day Simple Moving Average (SMA) at 1.3153 is critical for a sustained correction. Further down, the July 17 high of 1.3045 will come to the rescue of the Pound Sterling should the downside extend. At that level, the 50-day SMA hangs around,” Dhwani adds.
Economic Indicator
BoE Interest Rate Decision
The Bank of England (BoE) announces its interest rate decision at the end of its eight scheduled meetings per year. If the BoE is hawkish about the inflationary outlook of the economy and raises interest rates it is usually bullish for the Pound Sterling (GBP). Likewise, if the BoE adopts a dovish view on the UK economy and keeps interest rates unchanged, or cuts them, it is seen as bearish for GBP.
Read more.Next release: Thu Sep 19, 2024 11:00
Frequency: Irregular
Consensus: 5%
Previous: 5%
Source: Bank of England
BoE FAQs
The Bank of England (BoE) decides monetary policy for the United Kingdom. Its primary goal is to achieve ‘price stability’, or a steady inflation rate of 2%. Its tool for achieving this is via the adjustment of base lending rates. The BoE sets the rate at which it lends to commercial banks and banks lend to each other, determining the level of interest rates in the economy overall. This also impacts the value of the Pound Sterling (GBP).
When inflation is above the Bank of England’s target it responds by raising interest rates, making it more expensive for people and businesses to access credit. This is positive for the Pound Sterling because higher interest rates make the UK a more attractive place for global investors to park their money. When inflation falls below target, it is a sign economic growth is slowing, and the BoE will consider lowering interest rates to cheapen credit in the hope businesses will borrow to invest in growth-generating projects – a negative for the Pound Sterling.
In extreme situations, the Bank of England can enact a policy called Quantitative Easing (QE). QE is the process by which the BoE substantially increases the flow of credit in a stuck financial system. QE is a last resort policy when lowering interest rates will not achieve the necessary result. The process of QE involves the BoE printing money to buy assets – usually government or AAA-rated corporate bonds – from banks and other financial institutions. QE usually results in a weaker Pound Sterling.
Quantitative tightening (QT) is the reverse of QE, enacted when the economy is strengthening and inflation starts rising. Whilst in QE the Bank of England (BoE) purchases government and corporate bonds from financial institutions to encourage them to lend; in QT, the BoE stops buying more bonds, and stops reinvesting the principal maturing on the bonds it already holds. It is usually positive for the Pound Sterling.
- USD/CHF maintains its position as the US Dollar appreciates after post-meeting comments from Fed’s Chair Powell.
- Fed’s Powell stated that 50 basis point rate cuts are not the “new pace”.
- The solid CHF leads to speculation of the SNB implementing a significant rate cut in 2024.
USD/CHF holds its gains around 0.8480 during Thursday’s Asian hours following a volatile session on Wednesday due to the US Federal Reserve’s (Fed) interest rate decision. Despite the Fed’s aggressive 50 basis point (bps) rate cut, the US Dollar (USD) recovered its daily losses due to the remarks made by Fed Chair Jerome Powell.
In the post-meeting press conference, Fed’s Powell stated that the central bank is not in a hurry to ease policy and emphasized that half-percentage point rate cuts are not the "new pace”. Furthermore, he commented on the aggressive 50 basis point rate cut, saying, “This decision reflects our increased confidence that, with the right adjustments to our policy approach, we can maintain a strong labor market, achieve moderate economic growth, and bring inflation down to a sustainable 2% level.”
Fed policymakers updated their quarterly economic forecasts, raising the median projection for unemployment to 4.4% by the end of 2024, up from the 4.0% estimate in June. They also increased their long-term projection for the federal funds rate from 2.8% to 2.9%, per Moneyweb.
The recent upside of the Swiss Franc (CHF) is leading to speculation that the Swiss National Bank (SNB) could be the first major central bank to implement a significant rate cut this year. Traders are likely to pay close attention to the Trade Balance data scheduled for release on Thursday. This report could provide valuable insights into the Swiss economic conditions.
Swiss Franc FAQs
The Swiss Franc (CHF) is Switzerland’s official currency. It is among the top ten most traded currencies globally, reaching volumes that well exceed the size of the Swiss economy. Its value is determined by the broad market sentiment, the country’s economic health or action taken by the Swiss National Bank (SNB), among other factors. Between 2011 and 2015, the Swiss Franc was pegged to the Euro (EUR). The peg was abruptly removed, resulting in a more than 20% increase in the Franc’s value, causing a turmoil in markets. Even though the peg isn’t in force anymore, CHF fortunes tend to be highly correlated with the Euro ones due to the high dependency of the Swiss economy on the neighboring Eurozone.
The Swiss Franc (CHF) is considered a safe-haven asset, or a currency that investors tend to buy in times of market stress. This is due to the perceived status of Switzerland in the world: a stable economy, a strong export sector, big central bank reserves or a longstanding political stance towards neutrality in global conflicts make the country’s currency a good choice for investors fleeing from risks. Turbulent times are likely to strengthen CHF value against other currencies that are seen as more risky to invest in.
The Swiss National Bank (SNB) meets four times a year – once every quarter, less than other major central banks – to decide on monetary policy. The bank aims for an annual inflation rate of less than 2%. When inflation is above target or forecasted to be above target in the foreseeable future, the bank will attempt to tame price growth by raising its policy rate. Higher interest rates are generally positive for the Swiss Franc (CHF) as they lead to higher yields, making the country a more attractive place for investors. On the contrary, lower interest rates tend to weaken CHF.
Macroeconomic data releases in Switzerland are key to assessing the state of the economy and can impact the Swiss Franc’s (CHF) valuation. The Swiss economy is broadly stable, but any sudden change in economic growth, inflation, current account or the central bank’s currency reserves have the potential to trigger moves in CHF. Generally, high economic growth, low unemployment and high confidence are good for CHF. Conversely, if economic data points to weakening momentum, CHF is likely to depreciate.
As a small and open economy, Switzerland is heavily dependent on the health of the neighboring Eurozone economies. The broader European Union is Switzerland’s main economic partner and a key political ally, so macroeconomic and monetary policy stability in the Eurozone is essential for Switzerland and, thus, for the Swiss Franc (CHF). With such dependency, some models suggest that the correlation between the fortunes of the Euro (EUR) and the CHF is more than 90%, or close to perfect.
- EUR/USD trades on a flat note around 1.1120 in Thursday’s early European session.
- The Fed cut rates by 50bps in the September meeting, bringing the new policy rate target to 4.75-5.00%.
- Eurozone annual HICP steadies at 2.2% in August, as expected.
The EUR/USD pair trades flat during the early European session on Thursday. The major pair initially edges higher to monthly highs of 1.1189 after a large rate cut by the Federal Reserve (Fed) at its September meeting and eases back to near 1.1120.
The Federal Open Market Committee (FOMC) started its easing cycle, lowering the Fed funds target range by 50 basis points (bps) to 4.75%-5.00% on Wednesday. However, the Fed's forward guidance didn't seem to be as dovish as expected, which help limit the US Dollar’s (USD) losses.
Fed Chair Jerome Powell stated that “it feels to me that neutral rate is probably significantly higher than it was pre-pandemic”. The median long-term interest rate shifted to 2.9% from 2.8%, with 7 participants now seeing the long-term rate at or above 3.25%. The median projection for unemployment by the end of 2024 was revised to 4.4% from the 4.0% projection in June. Powell reiterated at the press conference that employment markets have now properly normalised, and the additional slowdown is not welcomed by policymakers.
Data released by Eurostat showed that the Eurozone Harmonized Index of Consumer Prices (HICP) rose 2.2% YoY in August, in line with the expectation and the previous reading of 2.2%. Meanwhile, the core HICP inflation holds steady at 2.8% YoY in August, matching the expectation. The European Central Bank (ECB) policymaker Joachim Nagel said on Wednesday that Eurozone inflation is still not as low as the ECB would like, so interest rates need to remain sufficiently high to resolve price pressures.
Looking ahead, the ECB Executive Board Member Isabel Schnabel is set to speak later in the day. On the US docket, the US weekly Initial Jobless Claims, the Philly Fed Manufacturing Index and Existing Home Sales will be published.
Euro FAQs
The Euro is the currency for the 20 European Union countries that belong to the Eurozone. It is the second most heavily traded currency in the world behind the US Dollar. In 2022, it accounted for 31% of all foreign exchange transactions, with an average daily turnover of over $2.2 trillion a day. EUR/USD is the most heavily traded currency pair in the world, accounting for an estimated 30% off all transactions, followed by EUR/JPY (4%), EUR/GBP (3%) and EUR/AUD (2%).
The European Central Bank (ECB) in Frankfurt, Germany, is the reserve bank for the Eurozone. The ECB sets interest rates and manages monetary policy. The ECB’s primary mandate is to maintain price stability, which means either controlling inflation or stimulating growth. Its primary tool is the raising or lowering of interest rates. Relatively high interest rates – or the expectation of higher rates – will usually benefit the Euro and vice versa. The ECB Governing Council makes monetary policy decisions at meetings held eight times a year. Decisions are made by heads of the Eurozone national banks and six permanent members, including the President of the ECB, Christine Lagarde.
Eurozone inflation data, measured by the Harmonized Index of Consumer Prices (HICP), is an important econometric for the Euro. If inflation rises more than expected, especially if above the ECB’s 2% target, it obliges the ECB to raise interest rates to bring it back under control. Relatively high interest rates compared to its counterparts will usually benefit the Euro, as it makes the region more attractive as a place for global investors to park their money.
Data releases gauge the health of the economy and can impact on the Euro. Indicators such as GDP, Manufacturing and Services PMIs, employment, and consumer sentiment surveys can all influence the direction of the single currency. A strong economy is good for the Euro. Not only does it attract more foreign investment but it may encourage the ECB to put up interest rates, which will directly strengthen the Euro. Otherwise, if economic data is weak, the Euro is likely to fall. Economic data for the four largest economies in the euro area (Germany, France, Italy and Spain) are especially significant, as they account for 75% of the Eurozone’s economy.
Another significant data release for the Euro is the Trade Balance. This indicator measures the difference between what a country earns from its exports and what it spends on imports over a given period. If a country produces highly sought after exports then its currency will gain in value purely from the extra demand created from foreign buyers seeking to purchase these goods. Therefore, a positive net Trade Balance strengthens a currency and vice versa for a negative balance.
- NZD/USD may appreciate as daily chart analysis indicates a bullish bias.
- The upper boundary of the ascending channel at 0.6280 appears as the immediate resistance.
- The pair may find the support around the nine-day EMA at 0.6189 level.
NZD/USD trades around 0.6210 during the Asian session on Thursday. On the daily chart, the pair is consolidating within an ascending channel pattern, indicating a bullish bias. However, a break below the lower boundary of the channel could diminish this bullish sentiment.
The 14-day Relative Strength Index (RSI) remains above the 50 level, confirming the ongoing bullish trend. Additionally, the nine-day Exponential Moving Average (EMA) is above the 50-day EMA, suggesting that the NZD/USD pair is experiencing short-term upward momentum and is likely to continue its rise.
On the upside, the NZD/USD pair may test the upper boundary of the ascending channel at the 0.6280 level, followed by the eight-month high of 0.6302 recorded on September 3. A break above this high could drive the pair toward the psychological level of 0.6300.
On the downside, the NZD/USD pair might test immediate support around the nine-day EMA at the 0.6189 level, which is near the lower boundary of the ascending channel. A break below this channel could weaken the bullish sentiment and put pressure on the pair to approach the 50-day EMA at 0.6128.
NZD/USD: Daily Chart
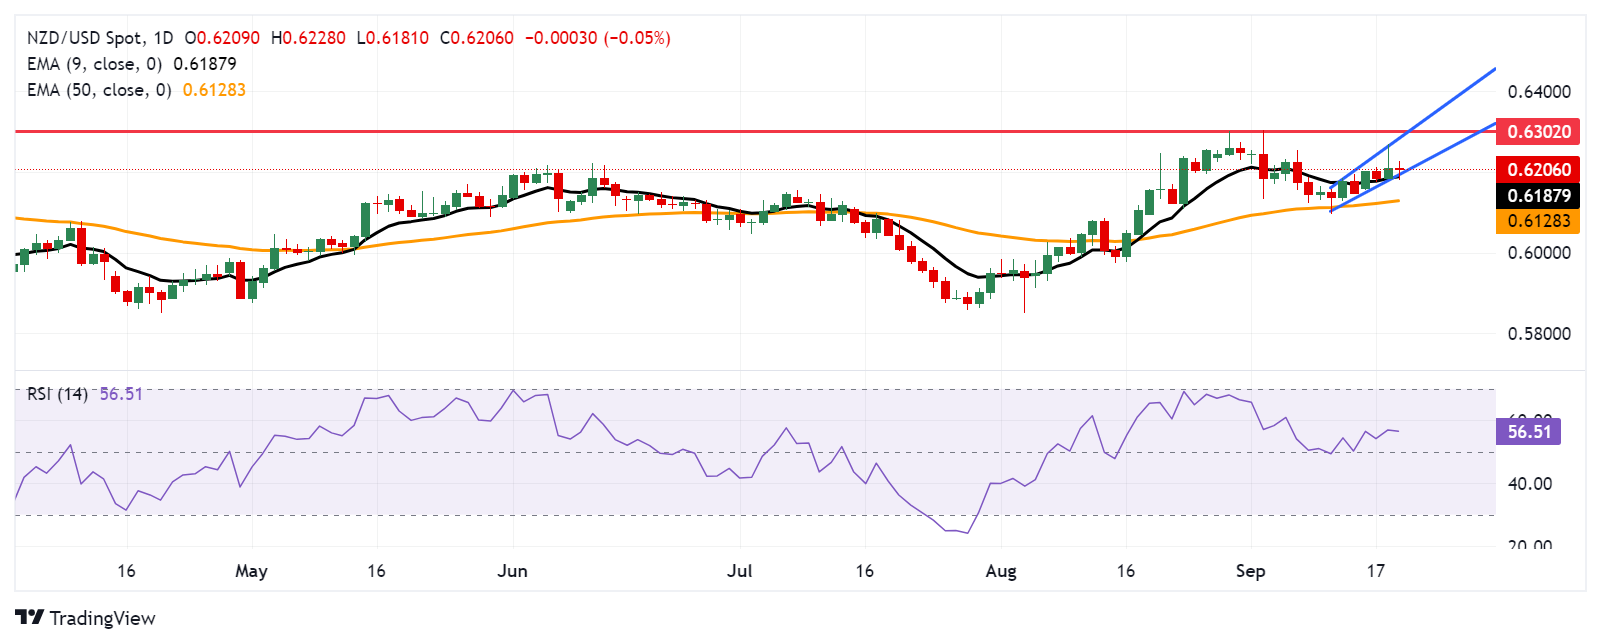
New Zealand Dollar PRICE Today
The table below shows the percentage change of New Zealand Dollar (NZD) against listed major currencies today. New Zealand Dollar was the strongest against the Japanese Yen.
| USD | EUR | GBP | JPY | CAD | AUD | NZD | CHF | |
|---|---|---|---|---|---|---|---|---|
| USD | 0.01% | 0.07% | 0.63% | -0.02% | -0.34% | 0.07% | 0.32% | |
| EUR | -0.01% | 0.05% | 0.62% | -0.03% | -0.34% | 0.05% | 0.31% | |
| GBP | -0.07% | -0.05% | 0.57% | -0.09% | -0.42% | -0.00% | 0.24% | |
| JPY | -0.63% | -0.62% | -0.57% | -0.62% | -0.96% | -0.59% | -0.32% | |
| CAD | 0.02% | 0.03% | 0.09% | 0.62% | -0.33% | 0.09% | 0.33% | |
| AUD | 0.34% | 0.34% | 0.42% | 0.96% | 0.33% | 0.41% | 0.65% | |
| NZD | -0.07% | -0.05% | 0.00% | 0.59% | -0.09% | -0.41% | 0.26% | |
| CHF | -0.32% | -0.31% | -0.24% | 0.32% | -0.33% | -0.65% | -0.26% |
The heat map shows percentage changes of major currencies against each other. The base currency is picked from the left column, while the quote currency is picked from the top row. For example, if you pick the New Zealand Dollar from the left column and move along the horizontal line to the US Dollar, the percentage change displayed in the box will represent NZD (base)/USD (quote).
- USD/CAD retreats from a one-month top and is pressured by a combination of factors.
- A positive risk tone prompts selling around the safe-haven buck and weighs on the pair.
- A fresh leg up in Oil prices underpins the Loonie and contributes to the intraday slide.
The USD/CAD pair struggles to capitalize on the Asian session move up to the 1.3645-1.3650 region, or a one-month top and drops to the lower end of its daily range in the last hour. Spot prices currently trade around the 1.3600 mark and for now, seem to have stalled a goodish rebound from a nearly two-week low touched on Wednesday.
The US Dollar (USD) surrenders a major part of its intraday gains to a one-week high amid the upbeat market mood, which turns out to be a key factor that attracts fresh sellers around the USD/CAD pair. Apart from this, rising Crude Oil prices underpin the commodity-linked Loonie and further contribute to the currency pair's intraday pullback of around 50 pips. The lack of follow-through selling, however, warrants some caution for bearish traders and before positioning for any further depreciating move.
The US Federal Reserve (Fed) decided to kick-start the policy-easing cycle with an oversized rate cut on Wednesday, though downplayed expectations for a more aggressive reduction in borrowing costs going forward. This, in turn, continues to push the US Treasury bond yields higher and should act as a tailwind for the Greenback. Apart from this, bets for a larger interest rate cut by the Bank of Canada (BoC) next month should cap the Canadian Dollar (CAD) and limit losses for the USD/CAD pair.
Dovish BoC expectations were fueled by consumer inflation figures released on Tuesday, which showed that Canada's CPI posted its smallest rate of increase since February 2021 and the core measures fell to the lowest level in 40 months. Even from a technical perspective, acceptance above the very important 200-day Simple Moving Average (SMA) and an intraday breakout through a one-week-old trading range supports prospects for some meaningful appreciating move in the near term.
Traders now look forward to the US economic docket – featuring the release of Weekly Initial Jobless Claims, the Philly Fed Manufacturing Index and Existing Home Sales data. Apart from this, US bond yields and the broader risk sentiment will drive demand for the safe-haven buck. This, along with Oil price dynamics, should allow traders to grab short-term opportunities around the USD/CAD pair.
Canadian Dollar FAQs
The key factors driving the Canadian Dollar (CAD) are the level of interest rates set by the Bank of Canada (BoC), the price of Oil, Canada’s largest export, the health of its economy, inflation and the Trade Balance, which is the difference between the value of Canada’s exports versus its imports. Other factors include market sentiment – whether investors are taking on more risky assets (risk-on) or seeking safe-havens (risk-off) – with risk-on being CAD-positive. As its largest trading partner, the health of the US economy is also a key factor influencing the Canadian Dollar.
The Bank of Canada (BoC) has a significant influence on the Canadian Dollar by setting the level of interest rates that banks can lend to one another. This influences the level of interest rates for everyone. The main goal of the BoC is to maintain inflation at 1-3% by adjusting interest rates up or down. Relatively higher interest rates tend to be positive for the CAD. The Bank of Canada can also use quantitative easing and tightening to influence credit conditions, with the former CAD-negative and the latter CAD-positive.
The price of Oil is a key factor impacting the value of the Canadian Dollar. Petroleum is Canada’s biggest export, so Oil price tends to have an immediate impact on the CAD value. Generally, if Oil price rises CAD also goes up, as aggregate demand for the currency increases. The opposite is the case if the price of Oil falls. Higher Oil prices also tend to result in a greater likelihood of a positive Trade Balance, which is also supportive of the CAD.
While inflation had always traditionally been thought of as a negative factor for a currency since it lowers the value of money, the opposite has actually been the case in modern times with the relaxation of cross-border capital controls. Higher inflation tends to lead central banks to put up interest rates which attracts more capital inflows from global investors seeking a lucrative place to keep their money. This increases demand for the local currency, which in Canada’s case is the Canadian Dollar.
Macroeconomic data releases gauge the health of the economy and can have an impact on the Canadian Dollar. Indicators such as GDP, Manufacturing and Services PMIs, employment, and consumer sentiment surveys can all influence the direction of the CAD. A strong economy is good for the Canadian Dollar. Not only does it attract more foreign investment but it may encourage the Bank of Canada to put up interest rates, leading to a stronger currency. If economic data is weak, however, the CAD is likely to fall.
Gold prices rose in India on Thursday, according to data compiled by FXStreet.
The price for Gold stood at 6,894.34 Indian Rupees (INR) per gram, up compared with the INR 6,884.92 it cost on Wednesday.
The price for Gold increased to INR 80,414.20 per tola from INR 80,304.38 per tola a day earlier.
| Unit measure | Gold Price in INR |
|---|---|
| 1 Gram | 6,894.34 |
| 10 Grams | 68,943.38 |
| Tola | 80,414.20 |
| Troy Ounce | 214,438.00 |
FXStreet calculates Gold prices in India by adapting international prices (USD/INR) to the local currency and measurement units. Prices are updated daily based on the market rates taken at the time of publication. Prices are just for reference and local rates could diverge slightly.
Gold FAQs
Gold has played a key role in human’s history as it has been widely used as a store of value and medium of exchange. Currently, apart from its shine and usage for jewelry, the precious metal is widely seen as a safe-haven asset, meaning that it is considered a good investment during turbulent times. Gold is also widely seen as a hedge against inflation and against depreciating currencies as it doesn’t rely on any specific issuer or government.
Central banks are the biggest Gold holders. In their aim to support their currencies in turbulent times, central banks tend to diversify their reserves and buy Gold to improve the perceived strength of the economy and the currency. High Gold reserves can be a source of trust for a country’s solvency. Central banks added 1,136 tonnes of Gold worth around $70 billion to their reserves in 2022, according to data from the World Gold Council. This is the highest yearly purchase since records began. Central banks from emerging economies such as China, India and Turkey are quickly increasing their Gold reserves.
Gold has an inverse correlation with the US Dollar and US Treasuries, which are both major reserve and safe-haven assets. When the Dollar depreciates, Gold tends to rise, enabling investors and central banks to diversify their assets in turbulent times. Gold is also inversely correlated with risk assets. A rally in the stock market tends to weaken Gold price, while sell-offs in riskier markets tend to favor the precious metal.
The price can move due to a wide range of factors. Geopolitical instability or fears of a deep recession can quickly make Gold price escalate due to its safe-haven status. As a yield-less asset, Gold tends to rise with lower interest rates, while higher cost of money usually weighs down on the yellow metal. Still, most moves depend on how the US Dollar (USD) behaves as the asset is priced in dollars (XAU/USD). A strong Dollar tends to keep the price of Gold controlled, whereas a weaker Dollar is likely to push Gold prices up.
(An automation tool was used in creating this post.)
- The Japanese Yen depreciated as Fed Chair Powell emphasized that 50 basis points cuts are not the "new pace.”
- The JPY’s downside could be restrained due to hawkish sentiment surrounding the Bank of Japan.
- Fed policymakers raised their long-term projection for the federal funds rate from 2.8% to 2.9%.
The Japanese Yen (JPY) has trimmed its intraday losses but remains weaker against the US Dollar (USD) on Thursday. Despite the US Federal Reserve’s (Fed) aggressive 50 basis point (bps) interest rate cut on Wednesday, the risk-sensitive JPY continued to depreciate.
Traders are now focusing on the Bank of Japan (BoJ) policy decision scheduled for Friday, with expectations that rates will be kept unchanged while leaving room for potential future rate hikes. Additionally, Japan’s National Consumer Price Index (CPI) data will be closely watched, as the inflation report could provide new insights into the BoJ’s future interest rate path.
The USD/JPY pair's upside could be attributed to remarks made by Fed Chair Jerome Powell. In the post-meeting press conference, Powell stated that the Fed is not in a hurry to ease policy and emphasized that half-percentage point rate cuts are not the "new pace."
Fed policymakers updated their quarterly economic forecasts, increasing the median projection for unemployment to 4.4% by the end of 2024, up from the 4.0% estimate made in June. They also raised their long-term projection for the federal funds rate from 2.8% to 2.9%.
Daily Digest Market Movers: Japanese Yen depreciates as Fed raises long-term projection for rates
- The Federal Open Market Committee (FOMC) lowered the federal funds rate to a range of 4.75% to 5.0%, marking the Fed’s first rate cut in over four years.
- Federal Reserve Chair Jerome Powell commented on the aggressive 50 basis point rate cut, saying, “This decision reflects our increased confidence that, with the right adjustments to our policy approach, we can maintain a strong labor market, achieve moderate economic growth, and bring inflation down to a sustainable 2% level.”
- Japan’s Merchandise Trade Balance Total recorded a larger trade deficit of ¥695.30 billion in August, up from ¥628.70 billion the previous month, but well below market expectations of a ¥1,380.0 billion shortfall. Exports increased by 5.6% year-over-year, marking the ninth consecutive month of growth, but fell short of the anticipated 10.0%. Imports rose by just 2.3%, the slowest pace in five months, significantly underperforming the projected 13.4% rise.
- JP Morgan CEO Jamie Dimon stated on Tuesday that whether the Federal Reserve cuts interest rates by 25 or 50 basis points, the impact will be “not earth-shattering.” Dimon emphasized, “They need to do it,” but noted that such moves are relatively minor in the grand scheme of things, as "there's a real economy" operating beneath the Fed’s rate changes, according to Bloomberg.
- US Retail Sales rose by 0.1% month-over-month in August, following a revised 1.1% increase in July, surpassing expectations of a 0.2% decline and indicating resilient consumer spending. Meanwhile, the Retail Sales Control Group increased by 0.3%, slightly below the previous month's 0.4% rise.
- Japanese Finance Minister Shunichi Suzuki stated on Tuesday that rapid foreign exchange (FX) fluctuations are undesirable. Suzuki emphasized that officials will closely monitor how FX movements affect the Japanese economy and people's livelihoods. The government will continue to assess the impact of a stronger Japanese Yen and respond accordingly, according to Reuters.
- Commerzbank FX analyst Volkmar Baur anticipated that the Bank of Japan will remain on the sidelines this week. Baur noted that the Federal Reserve's actions are likely to have a greater impact on the USD/JPY pair, suggesting that the JPY could have a strong chance of falling below 140.00 per USD even without a rate hike from the BoJ.
- On Friday, Fitch Ratings' latest report on the Bank of Japan's policy outlook suggests that the BoJ might raise rates to 0.5% by the end of 2024, 0.75% in 2025, and 1.0% by the end of 2026.
Technical Analysis: USD/JPY advances to near 143.00; next barrier at 21-day EMA
USD/JPY trades around 143.00 on Thursday. Analysis of the daily chart indicates that the pair is consolidating within a descending channel, which supports a bearish outlook. However, the 14-day Relative Strength Index (RSI) is rising toward the 50 level, and the price has moved above the nine-day Exponential Moving Average (EMA), suggesting a potential upward correction.
On the upside, the USD/JPY pair may initially face resistance at the 21-day EMA, located at the 143.73 level, and then at the upper boundary of the descending channel around 145.00.
For support, the USD/JPY pair might find immediate support at 139.58, which is the lowest level since June 2023, followed by the lower boundary of the descending channel near 137.75.
USD/JPY: Daily Chart
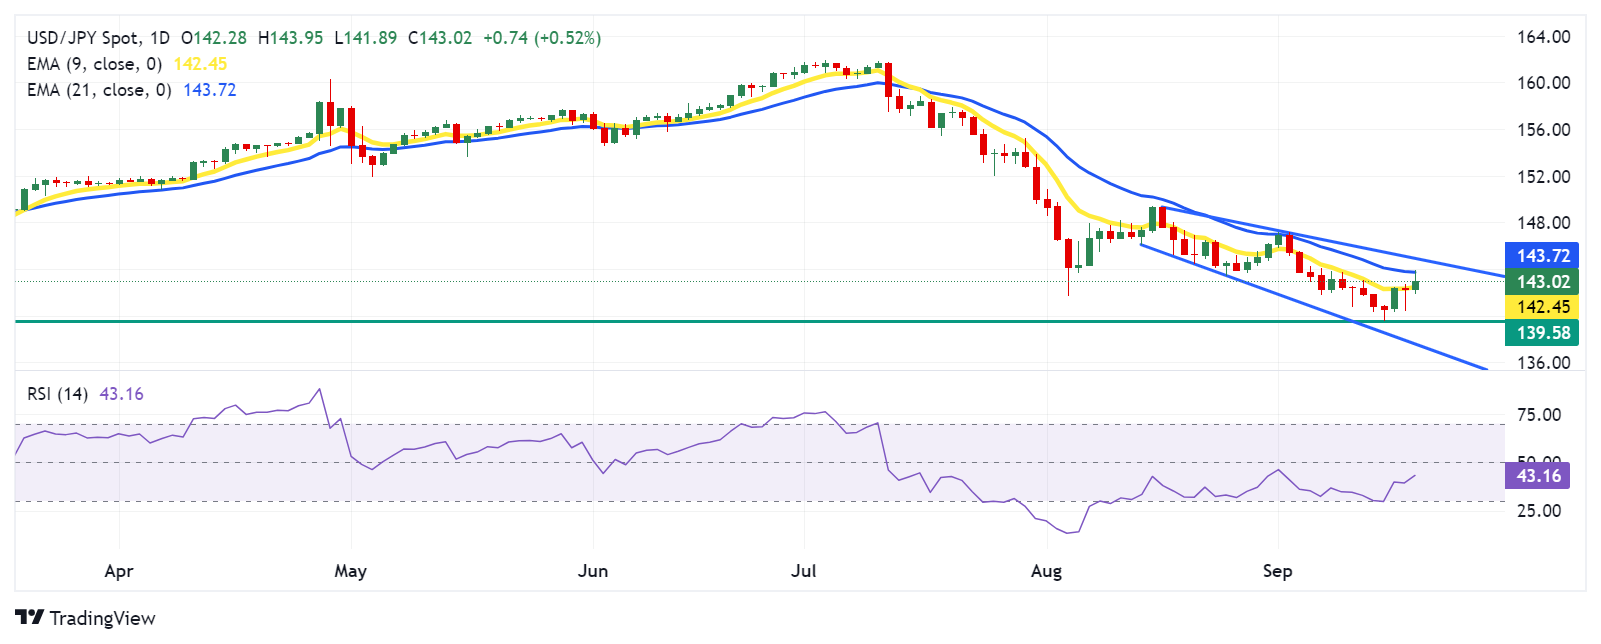
Japanese Yen PRICE Today
The table below shows the percentage change of Japanese Yen (JPY) against listed major currencies today. Japanese Yen was the weakest against the Australian Dollar.
| USD | EUR | GBP | JPY | CAD | AUD | NZD | CHF | |
|---|---|---|---|---|---|---|---|---|
| USD | 0.02% | 0.07% | 0.67% | -0.01% | -0.37% | -0.05% | 0.31% | |
| EUR | -0.02% | 0.04% | 0.67% | -0.02% | -0.36% | -0.06% | 0.32% | |
| GBP | -0.07% | -0.04% | 0.62% | -0.08% | -0.43% | -0.11% | 0.24% | |
| JPY | -0.67% | -0.67% | -0.62% | -0.67% | -1.04% | -0.76% | -0.38% | |
| CAD | 0.01% | 0.02% | 0.08% | 0.67% | -0.35% | -0.03% | 0.31% | |
| AUD | 0.37% | 0.36% | 0.43% | 1.04% | 0.35% | 0.32% | 0.67% | |
| NZD | 0.05% | 0.06% | 0.11% | 0.76% | 0.03% | -0.32% | 0.36% | |
| CHF | -0.31% | -0.32% | -0.24% | 0.38% | -0.31% | -0.67% | -0.36% |
The heat map shows percentage changes of major currencies against each other. The base currency is picked from the left column, while the quote currency is picked from the top row. For example, if you pick the Japanese Yen from the left column and move along the horizontal line to the US Dollar, the percentage change displayed in the box will represent JPY (base)/USD (quote).
Japanese Yen FAQs
The Japanese Yen (JPY) is one of the world’s most traded currencies. Its value is broadly determined by the performance of the Japanese economy, but more specifically by the Bank of Japan’s policy, the differential between Japanese and US bond yields, or risk sentiment among traders, among other factors.
One of the Bank of Japan’s mandates is currency control, so its moves are key for the Yen. The BoJ has directly intervened in currency markets sometimes, generally to lower the value of the Yen, although it refrains from doing it often due to political concerns of its main trading partners. The current BoJ ultra-loose monetary policy, based on massive stimulus to the economy, has caused the Yen to depreciate against its main currency peers. This process has exacerbated more recently due to an increasing policy divergence between the Bank of Japan and other main central banks, which have opted to increase interest rates sharply to fight decades-high levels of inflation.
The BoJ’s stance of sticking to ultra-loose monetary policy has led to a widening policy divergence with other central banks, particularly with the US Federal Reserve. This supports a widening of the differential between the 10-year US and Japanese bonds, which favors the US Dollar against the Japanese Yen.
The Japanese Yen is often seen as a safe-haven investment. This means that in times of market stress, investors are more likely to put their money in the Japanese currency due to its supposed reliability and stability. Turbulent times are likely to strengthen the Yen’s value against other currencies seen as more risky to invest in.
- Silver attracts fresh buyers on Wednesday and reverses a part of the overnight retracement slide.
- The technical setup favors bullish traders and supports prospects for a further appreciating move.
- Weakness below the $30.00 mark could be seen as a buying opportunity and remain cushioned.
Silver (XAG/USD) regains positive traction during the Asian session on Thursday and moves further away from the weekly low, around the $29.70 area touched the previous day. The white metal currently trades around the $30.35-$30.40 region, up nearly 1% for the day, and seems poised to appreciate further.
The recent breakout through the $29.35 confluence – comprising a short-term descending trend-line and the 100-day Simple Moving Average (SMA) – and the emergence of dip-buying on Thursday validate the positive outlook. Moreover, oscillators on the daily chart are holding in positive territory and are still far from being in the overbought zone. This, in turn, suggests that that the path of least resistance for the XAG/USD is to the upside.
From current levels, any subsequent move up is likely to confront some resistance near the $30.65-30.70 horizontal zone, above which the XAG/USD could aim to reclaim the $31.00 mark. The momentum could extend further towards the overnight swing high, around the $31.30-$31.25 region. Some follow-through buying could lift the commodity to the $31.45 region en route to the July swing high, around the $31.75 zone, and the $32.00 mark.
On the flip side, weakness below the $30.00 psychological mark might still be seen as a buying opportunity and remain limited near the aforementioned confluence resistance breakpoint, now turned support near the $29.35 region. The latter should act as a pivotal point, which if broken decisively could drag the XAG/USD below the $29.00 round figure, towards the $28.45-$28.40 intermediate support en route to the $28.00 mark.
Silver daily chart
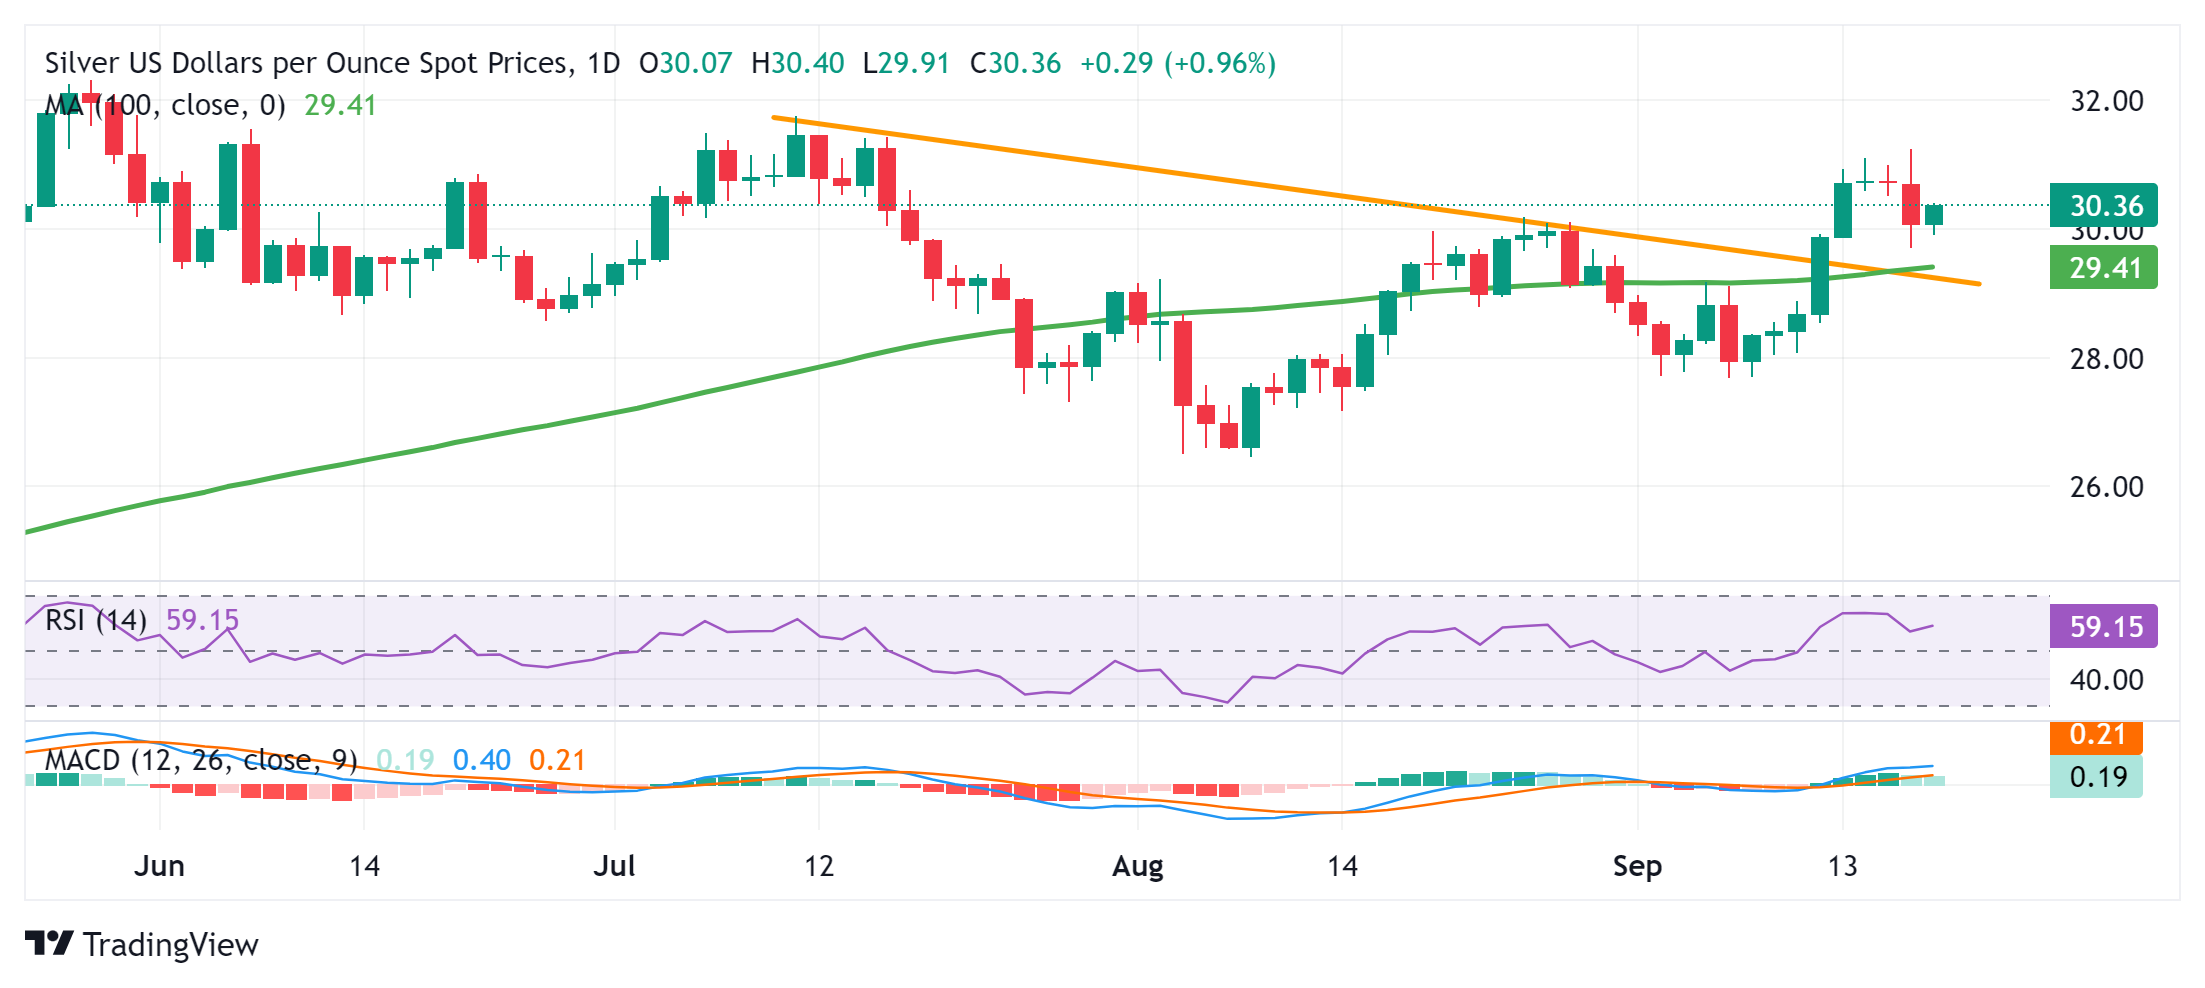
Silver FAQs
Silver is a precious metal highly traded among investors. It has been historically used as a store of value and a medium of exchange. Although less popular than Gold, traders may turn to Silver to diversify their investment portfolio, for its intrinsic value or as a potential hedge during high-inflation periods. Investors can buy physical Silver, in coins or in bars, or trade it through vehicles such as Exchange Traded Funds, which track its price on international markets.
Silver prices can move due to a wide range of factors. Geopolitical instability or fears of a deep recession can make Silver price escalate due to its safe-haven status, although to a lesser extent than Gold's. As a yieldless asset, Silver tends to rise with lower interest rates. Its moves also depend on how the US Dollar (USD) behaves as the asset is priced in dollars (XAG/USD). A strong Dollar tends to keep the price of Silver at bay, whereas a weaker Dollar is likely to propel prices up. Other factors such as investment demand, mining supply – Silver is much more abundant than Gold – and recycling rates can also affect prices.
Silver is widely used in industry, particularly in sectors such as electronics or solar energy, as it has one of the highest electric conductivity of all metals – more than Copper and Gold. A surge in demand can increase prices, while a decline tends to lower them. Dynamics in the US, Chinese and Indian economies can also contribute to price swings: for the US and particularly China, their big industrial sectors use Silver in various processes; in India, consumers’ demand for the precious metal for jewellery also plays a key role in setting prices.
Silver prices tend to follow Gold's moves. When Gold prices rise, Silver typically follows suit, as their status as safe-haven assets is similar. The Gold/Silver ratio, which shows the number of ounces of Silver needed to equal the value of one ounce of Gold, may help to determine the relative valuation between both metals. Some investors may consider a high ratio as an indicator that Silver is undervalued, or Gold is overvalued. On the contrary, a low ratio might suggest that Gold is undervalued relative to Silver.
- Indian Rupee weakens in Thursday’s Asian session.
- The increased liquidity flowing into the Indian market and dovish Fed drag the US Dollar down.
- Traders await the US weekly Initial Jobless Claims, the Philly Fed Manufacturing Index and Existing Home Sales on Thursday.
The Indian Rupee (INR) loses ground amid the recovery of the US Dollar (USD) on Thursday. The downside of the INR might be limited after the US Federal Reserve (Fed) made a large rate cut at its September meeting, which might weaken the US Dollar (USD). Furthermore, the persistent Foreign Institutional Investor (FII) funds into Indian equities could further strengthen the local currency.
Nonetheless, further rebound in crude oil prices could undermine the INR as India is the third-largest oil consumer after the United States (US) and China. Moving on, investors await the US weekly Initial Jobless Claims, the Philly Fed Manufacturing Index and Existing Home Sales, which are due later on Thursday.
Daily Digest Market Movers: Indian Rupee edges lower, but potential downside seems limited
- The Reserve Bank of India (RBI) is unlikely to ease the benchmark policy rate during 2024 given the uncertainty over food inflation, said State Bank of India (SBI) chairman C S Setty.
- Finance Minister Nirmala Sitharaman said on Wednesday that India is standing out globally in terms of economic growth and will continue to do so in the next few years.
- The Federal Open Market Committee (FOMC) decided to lower the federal funds rate by 50 basis points (bps) to a range of 4.75% to 5.00%, the Fed’s first rate cut in more than four years.
- Fed Chair Jerome Powell noted during a press conference that the half-point rate reduction did not represent any new pattern for the central bank but that policymakers want to keep the economy and the labor market in good shape.
- Fed policymakers revised their quarterly economic forecasts, raising the median projection for unemployment by the end of 2024 to 4.4% from the 4% projection in June. Fed officials raised their projection for the long-run federal funds rate to 2.9% from 2.8%.
Technical Analysis: USD/INR’s positive stance remains fragile in the longer term
The Indian Rupee trades softer on the day. The USD/INR pair has broken below the rectangle on the daily chart. The bullish outlook of the pair seems vulnerable as the price hovers the key 100-day Exponential Moving Average (EMA). If the pair closes below the 100-day EMA, it could resume the downside. Meanwhile, the 14-day Relative Strength Index (RSI) stands in the bearish zone below the midline near 38.0, suggesting the path of least resistance is to the downside.
The 100-day EMA at 83.64 acts as an initial support level for the pair. A breach of this level could see a drop to 83.31, the low of June 18. Extended losses could attract some sellers to the 83.00 psychological mark.
On the upside, the first upside barrier for USD/INR emerges at the support-turned-resistance level near 83.75. A crucial barrier is seen at the 83.90-84.00 region.
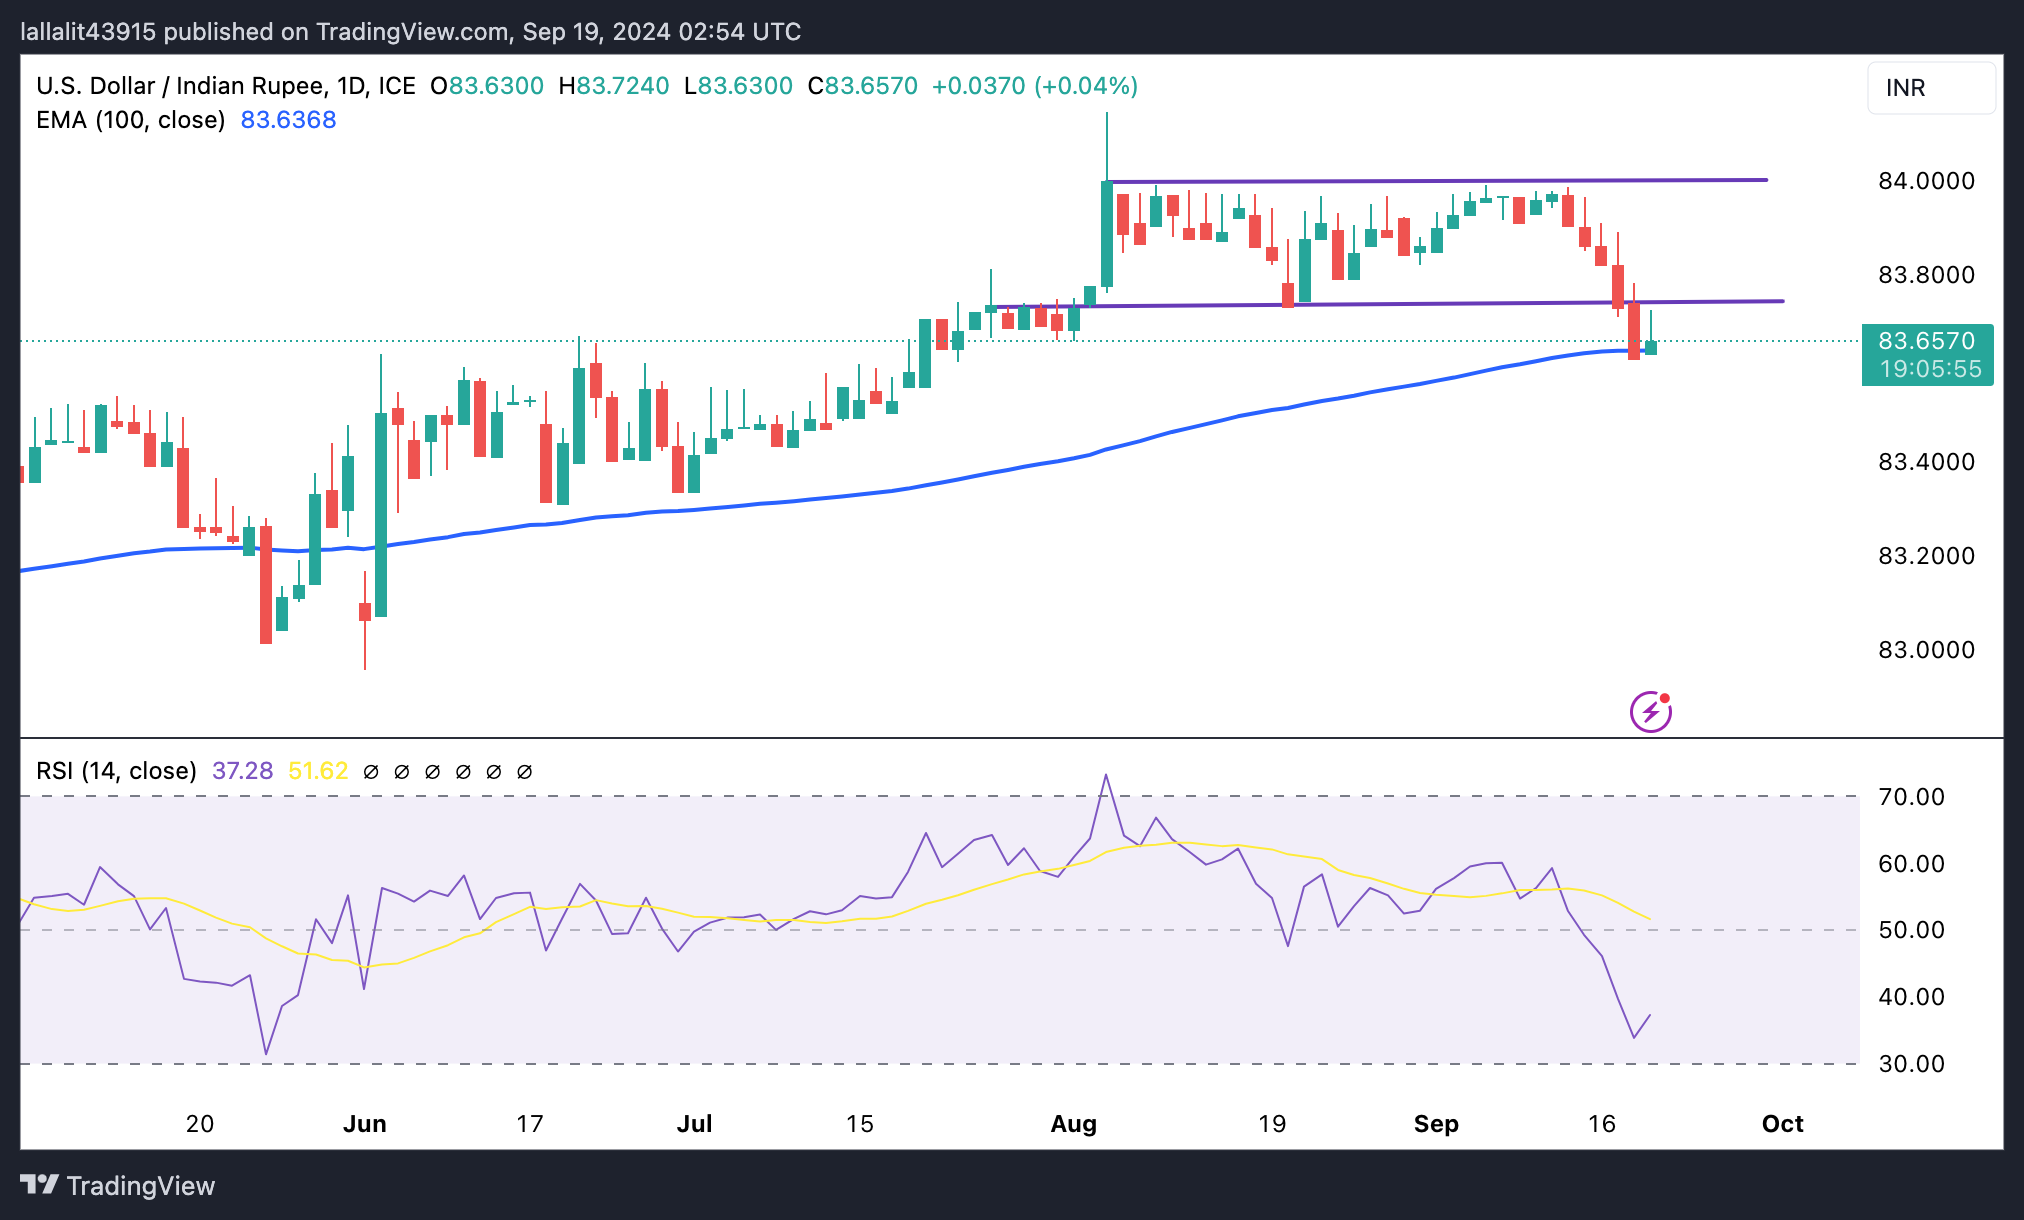
Indian Rupee FAQs
The Indian Rupee (INR) is one of the most sensitive currencies to external factors. The price of Crude Oil (the country is highly dependent on imported Oil), the value of the US Dollar – most trade is conducted in USD – and the level of foreign investment, are all influential. Direct intervention by the Reserve Bank of India (RBI) in FX markets to keep the exchange rate stable, as well as the level of interest rates set by the RBI, are further major influencing factors on the Rupee.
The Reserve Bank of India (RBI) actively intervenes in forex markets to maintain a stable exchange rate, to help facilitate trade. In addition, the RBI tries to maintain the inflation rate at its 4% target by adjusting interest rates. Higher interest rates usually strengthen the Rupee. This is due to the role of the ‘carry trade’ in which investors borrow in countries with lower interest rates so as to place their money in countries’ offering relatively higher interest rates and profit from the difference.
Macroeconomic factors that influence the value of the Rupee include inflation, interest rates, the economic growth rate (GDP), the balance of trade, and inflows from foreign investment. A higher growth rate can lead to more overseas investment, pushing up demand for the Rupee. A less negative balance of trade will eventually lead to a stronger Rupee. Higher interest rates, especially real rates (interest rates less inflation) are also positive for the Rupee. A risk-on environment can lead to greater inflows of Foreign Direct and Indirect Investment (FDI and FII), which also benefit the Rupee.
Higher inflation, particularly, if it is comparatively higher than India’s peers, is generally negative for the currency as it reflects devaluation through oversupply. Inflation also increases the cost of exports, leading to more Rupees being sold to purchase foreign imports, which is Rupee-negative. At the same time, higher inflation usually leads to the Reserve Bank of India (RBI) raising interest rates and this can be positive for the Rupee, due to increased demand from international investors. The opposite effect is true of lower inflation.
- GBP/USD attracts some dip-buyers amid expectations that the BoE will hold rates steady.
- Rising US bond yields assist the USD to gain some follow-through traction and caps gains.
- Bulls also seem reluctant to place aggressive bets and prefer to wait for the BoE decision.
The GBP/USD pair finds some support near the 1.3150 region on Thursday and for now, seems to have stalled its retracement slide from the 1.3300 neighborhood, or the highest level since March 2022 touched the previous day. Spot prices climb closer to the 1.3200 mark during the Asian session, albeit lack follow-through amid some follow-through US Dollar (USD) buying and currently trade with modest intraday losses.
The US Federal Reserve (Fed) decided to kick-start the policy-easing cycle and lowered borrowing costs by 50 basis points (bps) on Wednesday, though cooled hopes for oversized rate cuts going forward. Furthermore, Fed policymakers don't see inflation returning to the 2% target before 2026, triggering a sharp recovery in the US Treasury bond yields. This, in turn, lifts the USD Index (DXY), which tracks the Greenback against a basket of currencies, to a one-week high and turns out to be a key factor exerting some downward pressure on the GBP/USD pair.
Meanwhile, expectations that the Bank of England's (BoE) rate-cutting cycle is more likely to be slower than in the United States (US) continue to underpin the British Pound (GBP) and help limit losses for the currency pair. The UK Consumer Price Index (CPI) report released on Wednesday showed that inflation in the services sector accelerated more than expected in August. This reaffirmed bets that the BoE would hold rates steady at the end of the September policy meeting later this Thursday and warrant caution before placing bearish bets around the GBP/USD pair.
Traders might also prefer to move to the sidelines heading into the key central bank event risk. Nevertheless, the aforementioned fundamental backdrop suggests that the path of least resistance for the GBP/USD pair is to the upside. That said, the two-way price action witnessed over the past few days, along with the overnight failure near the 1.3300 mark, warrants some caution for bullish traders. Hence, some follow-through buying is needed to support prospects for an extension of the pair's move up from the 1.3000 psychological mark, or the monthly low touched last week.
Economic Indicator
BoE Interest Rate Decision
The Bank of England (BoE) announces its interest rate decision at the end of its eight scheduled meetings per year. If the BoE is hawkish about the inflationary outlook of the economy and raises interest rates it is usually bullish for the Pound Sterling (GBP). Likewise, if the BoE adopts a dovish view on the UK economy and keeps interest rates unchanged, or cuts them, it is seen as bearish for GBP.
Read more.Next release: Thu Sep 19, 2024 11:00
Frequency: Irregular
Consensus: 5%
Previous: 5%
Source: Bank of England
- WTI price gains ground but the overall market response has been relatively muted following the Fed rate cut.
- The Federal Open Market Committee reduced the federal funds rate to a range of 4.75% to 5.0%.
- US Crude Oil Stocks Change decreased by 1.63 million barrels the previous week, far exceeding the expected draw of 0.1 million barrels.
West Texas Intermediate (WTI) Oil price retraces its recent losses from the previous session, trading around $69.50 per barrel during the Asian hours on Thursday. The US Federal Reserve’s (Fed) decision to cut interest rates by 50 basis points, more than anticipated, provided support to Oil prices, though the overall market response has been relatively muted.
According to a Reuters report, ANZ analysts commented in a note, "The 50 basis point cut suggests significant economic challenges ahead, but bearish investors were left disappointed as the Fed also raised its medium-term outlook for rates."
The Federal Open Market Committee (FOMC) reduced the federal funds rate to a range of 4.75% to 5.0%, marking the Fed’s first rate cut in over four years. This decision underscores the Fed’s dedication to protecting the labor market and preventing the economy from slipping into recession. Lower borrowing costs could enhance the economic outlook in the United States, the world’s largest crude consumer, potentially supporting Oil demand.
Fed Chair Jerome Powell stated during a press conference after the monetary policy meeting, “This decision signifies our increased confidence that, with the right adjustment to our policy approach, we can sustain a strong labor market while achieving moderate economic growth and bringing inflation down to a sustainable 2% level.”
Additionally, WTI Oil prices may have found support after the US Energy Information Administration (EIA) reported a larger-than-expected decline in Crude Oil Stocks Change, which dropped by 1.63 million barrels to 417.5 million, far exceeding the forecasted 0.1 million-barrel draw for the week ending September 13. This swings from a previous stock increase of 0.833 million barrels.
WTI Oil FAQs
WTI Oil is a type of Crude Oil sold on international markets. The WTI stands for West Texas Intermediate, one of three major types including Brent and Dubai Crude. WTI is also referred to as “light” and “sweet” because of its relatively low gravity and sulfur content respectively. It is considered a high quality Oil that is easily refined. It is sourced in the United States and distributed via the Cushing hub, which is considered “The Pipeline Crossroads of the World”. It is a benchmark for the Oil market and WTI price is frequently quoted in the media.
Like all assets, supply and demand are the key drivers of WTI Oil price. As such, global growth can be a driver of increased demand and vice versa for weak global growth. Political instability, wars, and sanctions can disrupt supply and impact prices. The decisions of OPEC, a group of major Oil-producing countries, is another key driver of price. The value of the US Dollar influences the price of WTI Crude Oil, since Oil is predominantly traded in US Dollars, thus a weaker US Dollar can make Oil more affordable and vice versa.
The weekly Oil inventory reports published by the American Petroleum Institute (API) and the Energy Information Agency (EIA) impact the price of WTI Oil. Changes in inventories reflect fluctuating supply and demand. If the data shows a drop in inventories it can indicate increased demand, pushing up Oil price. Higher inventories can reflect increased supply, pushing down prices. API’s report is published every Tuesday and EIA’s the day after. Their results are usually similar, falling within 1% of each other 75% of the time. The EIA data is considered more reliable, since it is a government agency.
OPEC (Organization of the Petroleum Exporting Countries) is a group of 13 Oil-producing nations who collectively decide production quotas for member countries at twice-yearly meetings. Their decisions often impact WTI Oil prices. When OPEC decides to lower quotas, it can tighten supply, pushing up Oil prices. When OPEC increases production, it has the opposite effect. OPEC+ refers to an expanded group that includes ten extra non-OPEC members, the most notable of which is Russia.
| Raw materials | Closed | Change, % |
|---|---|---|
| Silver | 30.049 | -2.08 |
| Gold | 255.83 | -0.46 |
| Palladium | 1054.1 | -5.43 |
- Gold price struggles to lure buyers despite the Fed’s jumbo interest rate cut on Wednesday.
- A further recovery in the US bond yields underpins the USD and caps the non-yielding metal.
- Concerns about an economic slowdown, along with geopolitical risks, help limit the downside.
Gold price (XAU/USD) witnessed an intraday turnaround after hitting a new record high, around the $2,600 mark and settled in the red for the second straight day on Wednesday. The initial spike in the commodity followed the US Federal Reserve's (Fed) decision to kick-start the policy-easing cycle with an oversized rate cut. The rally, however, ran out of steam after Fed Chair Jerome Powell cooled hopes for a string of 50 basis point rate cuts ahead, which triggered a sharp US Dollar (USD) recovery from a 14-month low and weighed on the non-yielding yellow metal.
Gold price subsequently dropped to a four-day low, though a combination of factors helped limit further losses. Investors remain concerned about an economic slowdown in the United States (US) and China – the world's two largest economies. This, along with persistent geopolitical risks stemming from the ongoing conflicts in the Middle East, offers some support to the safe-haven precious metal. That said, some follow-through USD buying failed to assist the commodity in registering any meaningful recovery and remained depressed during the Asian session on Thursday.
Daily Digest Market Movers: Gold price is undermined by rising US bond yields and a modest USD strength; downside seems limited
- Gold prices faded from the post-FOMC spike to a fresh record high and dived to a multi-day low on Wednesday amid a goodish US Dollar recovery from its lowest level since July 2023.
- The Federal Reserve lowered its benchmark interest rate by 50 basis points to the 4.75%-5% range and forecast rates falling by another half of a percentage point by the end of this year.
- In the so-called dot plot, Fed members projected rates falling to 3.4% in 2025, down from a prior forecast of 4.1%, and declining to 2.9% in 2026, down from a prior forecast of 3.1%.
- The new economic projections revealed that the Fed doesn't see inflation returning to the 2% target before 2026, raising questions about the magnitude of interest rate cuts going forward.
- Meanwhile, Fed Chair Jerome Powell, during the post-meeting press conference, downplayed concerns about a recession amid cooling inflationary pressures and a very solid labor market.
- This, in turn, triggered a sharp rise in the US Treasury bond yields, which extends through the Asian session on Thursday and assists the Greenback to build on its recovery momentum.
- Iran-backed Hezbollah said it attacked Israeli artillery positions with rockets on Wednesday in retaliation to blasts in Lebanon, which killed 20 people and injured more than 450.
- Israel’s Defence Minister Yoav Gallant declared the start of a new phase in the war, raising the risk of a wider Middle East conflict, which could benefit the safe-haven XAU/USD.
Technical Outlook: Gold price could extend the corrective slide once the $2,532-2,530 immediate support is broken decisively
From a technical perspective, any subsequent slide is more likely to find decent support near the previous cycle high, around the $2,532-2,530 area. Some follow-through selling will expose the next relevant support near the $2,517-2,515 area, below which the Gold price could accelerate the corrective decline to the $2,500 psychological mark. The downward trajectory could extend further towards the $2,470 confluence – comprising the 50-day Simple Moving Average (SMA) and the lower boundary of a short-term ascending channel. The latter should act as a key pivotal point, which if broken decisively might shift the near-term bias in favor of bearish traders.
On the flip side, the $2,577-2,578 region now seems to act as an immediate hurdle ahead of the $2,600 mark, or the all-time peak touched on Wednesday. The subsequent move up could allow the Gold price to challenge the trend-channel resistance, currently pegged near the $2,610-2,612 region. A convincing breakout through the said barrier will be seen as a fresh trigger and set the stage for an extension of the recent well-established uptrend witnessed over the past three months or so.
Gold FAQs
Gold has played a key role in human’s history as it has been widely used as a store of value and medium of exchange. Currently, apart from its shine and usage for jewelry, the precious metal is widely seen as a safe-haven asset, meaning that it is considered a good investment during turbulent times. Gold is also widely seen as a hedge against inflation and against depreciating currencies as it doesn’t rely on any specific issuer or government.
Central banks are the biggest Gold holders. In their aim to support their currencies in turbulent times, central banks tend to diversify their reserves and buy Gold to improve the perceived strength of the economy and the currency. High Gold reserves can be a source of trust for a country’s solvency. Central banks added 1,136 tonnes of Gold worth around $70 billion to their reserves in 2022, according to data from the World Gold Council. This is the highest yearly purchase since records began. Central banks from emerging economies such as China, India and Turkey are quickly increasing their Gold reserves.
Gold has an inverse correlation with the US Dollar and US Treasuries, which are both major reserve and safe-haven assets. When the Dollar depreciates, Gold tends to rise, enabling investors and central banks to diversify their assets in turbulent times. Gold is also inversely correlated with risk assets. A rally in the stock market tends to weaken Gold price, while sell-offs in riskier markets tend to favor the precious metal.
The price can move due to a wide range of factors. Geopolitical instability or fears of a deep recession can quickly make Gold price escalate due to its safe-haven status. As a yield-less asset, Gold tends to rise with lower interest rates, while higher cost of money usually weighs down on the yellow metal. Still, most moves depend on how the US Dollar (USD) behaves as the asset is priced in dollars (XAU/USD). A strong Dollar tends to keep the price of Gold controlled, whereas a weaker Dollar is likely to push Gold prices up.
- The Australian Dollar edges lower despite the higher-than-expected increase in new jobs created in August.
- Australian Employment Change rose by 47.5K in August, surpassing the consensus forecast of 25.0K.
- Federal Reserve’s bumper rate cut signals its commitment to safeguarding the labor market and protecting the economy from recession.
The Australian Dollar (AUD) breaks its three-day winning streak against the US Dollar (USD), following the labor market report released on Thursday. Additionally, traders continue to assess the Federal Reserve’s (Fed) 50 basis points (bps) interest rate cut on Wednesday.
Australian Employment Change came in at 47.5K in August, down from 58.2K in July, but well above the consensus forecast of 25.0K. The Unemployment Rate remained steady at 4.2% in August, in line with both expectations and the previous month's figure, according to data released by the Australian Bureau of Statistics (ABS).
The Federal Open Market Committee (FOMC) lowered the federal funds rate to a range of 4.75% to 5.0%, marking the Fed’s first rate cut in over four years. This move signals the Fed’s commitment to safeguarding the labor market and steering the economy away from any signs of recession.
Federal Reserve Chair Jerome Powell stated during a press conference after the monetary policy meeting, “This decision signifies our increased confidence that, with the right adjustment to our policy approach, we can sustain a strong labor market while achieving moderate economic growth and bringing inflation down to a sustainable 2% level.”
Daily Digest Market Movers: Australian Dollar edges lower despite a stronger Employment Change
- Fed policymakers updated their quarterly economic forecasts, increasing the median projection for unemployment to 4.4% by the end of 2024, up from the 4% estimate made in June. They also raised their long-term projection for the federal funds rate from 2.8% to 2.9%.
- JP Morgan CEO Jamie Dimon stated on Tuesday that whether the Federal Reserve cuts interest rates by 25 or 50 basis points, the impact will be “not earth-shattering.” Dimon emphasized, “They need to do it,” but noted that such moves are relatively minor in the grand scheme of things, as "there's a real economy" operating beneath the Fed’s rate changes, according to Bloomberg.
- US Retail Sales rose by 0.1% month-over-month in August, following a revised 1.1% increase in July, surpassing expectations of a 0.2% decline and indicating resilient consumer spending. Meanwhile, the Retail Sales Control Group increased by 0.3%, slightly below the previous month's 0.4% rise.
- ANZ-Roy Morgan Australian Consumer Confidence climbed 1.8 points, reaching an eight-week high of 84.1. While ANZ notes that the rise was broad-based, confidence remains firmly in pessimistic territory.
- Economists at Goldman Sachs and Citi have reduced their 2024 GDP growth forecasts for China to 4.7%, falling short of Beijing's target of around 5.0%. SocGen describes the situation as a "downward spiral," while Barclays calls it "from bad to worse" and a "vicious cycle." Morgan Stanley also cautions that "things could get worse before they get better," according to a Reuters report.
- The University of Michigan’s Consumer Sentiment Index rose to 69.0 in September, exceeding the market expectations of 68.0 reading and marking a four-month high. This increase reflects a gradual improvement in consumers' outlook on the US economy after months of declining economic expectations.
- China's economy weakened in August, with a continued slowdown in industrial activity and declining real estate prices, as Beijing faces growing pressure to increase spending to boost demand. According to Business Standard, this was reported by the National Bureau of Statistics on Saturday.
- The Reserve Bank of Australia (RBA) Michele Bullock stated that it is premature to consider rate cuts due to persistently high inflation. Additionally, RBA Assistant Governor Sarah Hunter noted that while the labor market remains tight, wage growth appears to have peaked and is expected to slow further.
Technical Analysis: Australian Dollar falls to near 0.6750; next support at nine-day EMA
The AUD/USD pair trades near 0.6750 on Thursday. Technical analysis of the daily chart shows that the pair is positioned below the lower boundary of a rising wedge pattern, signaling a potential bearish reversal. However, the 14-day Relative Strength Index (RSI) remains slightly above the 50 mark, indicating that a bullish trend may still be in play.
Regarding the upside, the AUD/USD pair may test a seven-month high of 0.6798, followed by the lower boundary of the rising wedge at 0.6810 level. A return to the rising wedge would reinforce the bullish bias and push the pair toward the upper boundary of the rising wedge at the 0.6840 level.
On the downside, the AUD/USD pair may test the nine-day Exponential Moving Average (EMA) at 0.6733, with the next support at the psychological level of 0.6700. A break below this level could push the pair towards the throwback support zone around 0.6575.
AUD/USD: Daily Chart
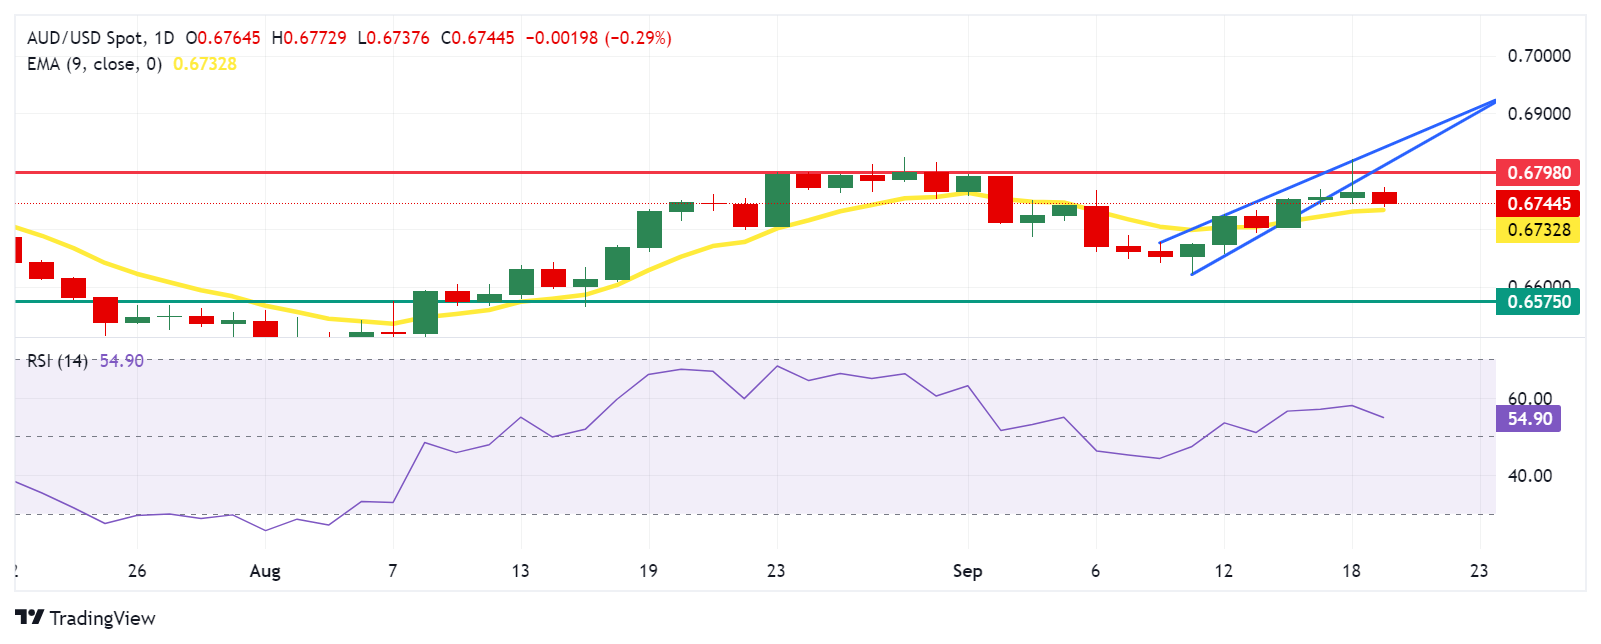
Australian Dollar PRICE Today
The table below shows the percentage change of Australian Dollar (AUD) against listed major currencies today. Australian Dollar was the weakest against the US Dollar.
| USD | EUR | GBP | JPY | CAD | AUD | NZD | CHF | |
|---|---|---|---|---|---|---|---|---|
| USD | 0.36% | 0.36% | 1.08% | 0.25% | 0.23% | 0.36% | 0.54% | |
| EUR | -0.36% | -0.01% | 0.72% | -0.11% | -0.11% | -0.00% | 0.18% | |
| GBP | -0.36% | 0.00% | 0.72% | -0.11% | -0.13% | 0.00% | 0.16% | |
| JPY | -1.08% | -0.72% | -0.72% | -0.80% | -0.83% | -0.74% | -0.55% | |
| CAD | -0.25% | 0.11% | 0.11% | 0.80% | -0.02% | 0.11% | 0.27% | |
| AUD | -0.23% | 0.11% | 0.13% | 0.83% | 0.02% | 0.13% | 0.28% | |
| NZD | -0.36% | 0.00% | -0.00% | 0.74% | -0.11% | -0.13% | 0.18% | |
| CHF | -0.54% | -0.18% | -0.16% | 0.55% | -0.27% | -0.28% | -0.18% |
The heat map shows percentage changes of major currencies against each other. The base currency is picked from the left column, while the quote currency is picked from the top row. For example, if you pick the Australian Dollar from the left column and move along the horizontal line to the US Dollar, the percentage change displayed in the box will represent AUD (base)/USD (quote).
Australian Dollar FAQs
One of the most significant factors for the Australian Dollar (AUD) is the level of interest rates set by the Reserve Bank of Australia (RBA). Because Australia is a resource-rich country another key driver is the price of its biggest export, Iron Ore. The health of the Chinese economy, its largest trading partner, is a factor, as well as inflation in Australia, its growth rate and Trade Balance. Market sentiment – whether investors are taking on more risky assets (risk-on) or seeking safe-havens (risk-off) – is also a factor, with risk-on positive for AUD.
The Reserve Bank of Australia (RBA) influences the Australian Dollar (AUD) by setting the level of interest rates that Australian banks can lend to each other. This influences the level of interest rates in the economy as a whole. The main goal of the RBA is to maintain a stable inflation rate of 2-3% by adjusting interest rates up or down. Relatively high interest rates compared to other major central banks support the AUD, and the opposite for relatively low. The RBA can also use quantitative easing and tightening to influence credit conditions, with the former AUD-negative and the latter AUD-positive.
China is Australia’s largest trading partner so the health of the Chinese economy is a major influence on the value of the Australian Dollar (AUD). When the Chinese economy is doing well it purchases more raw materials, goods and services from Australia, lifting demand for the AUD, and pushing up its value. The opposite is the case when the Chinese economy is not growing as fast as expected. Positive or negative surprises in Chinese growth data, therefore, often have a direct impact on the Australian Dollar and its pairs.
Iron Ore is Australia’s largest export, accounting for $118 billion a year according to data from 2021, with China as its primary destination. The price of Iron Ore, therefore, can be a driver of the Australian Dollar. Generally, if the price of Iron Ore rises, AUD also goes up, as aggregate demand for the currency increases. The opposite is the case if the price of Iron Ore falls. Higher Iron Ore prices also tend to result in a greater likelihood of a positive Trade Balance for Australia, which is also positive of the AUD.
The Trade Balance, which is the difference between what a country earns from its exports versus what it pays for its imports, is another factor that can influence the value of the Australian Dollar. If Australia produces highly sought after exports, then its currency will gain in value purely from the surplus demand created from foreign buyers seeking to purchase its exports versus what it spends to purchase imports. Therefore, a positive net Trade Balance strengthens the AUD, with the opposite effect if the Trade Balance is negative.
The People’s Bank of China (PBoC) set the USD/CNY central rate for the trading session ahead on Thursday at 7.0983, as compared to the previous day's fix of 7.0870 and 7.0924 Reuters estimates.
- USD/JPY edges higher to 143.55 in Thursday’s Asian session, up 0.90% on the day.
- The Fed lowered interest rates for the first time in more than four years with a bigger-than-usual reduction.
- The BoJ is anticipated to stand pat at its policy meeting on Friday.
The USD/JPY pair gains traction around 143.55 on Thursday during the early European session. The uptick of the major pair is bolstered by the recovery of the US Dollar (USD). Investors will shift their attention to the Bank of Japan (BoJ) interest rate decision on Friday.
The Federal Reserve (Fed) cut its interest rates by 50 basis points (bps) to 4.75%- 5.00% at the September meeting on Wednesday. Fed Chairman Jerome Powell stated during the press conference that the move was "strong" but needed as price rises ease and job market concerns grow.
Fed policymakers lowered their GDP growth forecast for 2024 to 2%, down from the previous projection of 2.1%. Fed officials raised their projection for the long-run federal funds rate to 2.9% from 2.8%. The Greenback swung between gains and losses after the Fed decision.
Meanwhile, the USD Index (DXY), a measure of the USD's value relative to the majority of its most significant trading partners, bounces off multi-month lows and reclaims the 101.00 barrier, gaining 0.20% on the day. However, the dovish stance of the US Fed and the expectation of additional rate cuts this year could weigh on the USD and limit the upside for the pair.
On the other hand, the BoJ is widely expected to keep interest rates on hold at its two-day meeting ending Friday. Nonetheless, a majority of economists polled by Reuters expect an increase by year-end. Since the Fed started its easing monetary policy in the September meeting, a narrowing gap between the US and Japanese interest rates might lift the Japanese Yen (JPY) against the USD.
Bank of Japan FAQs
The Bank of Japan (BoJ) is the Japanese central bank, which sets monetary policy in the country. Its mandate is to issue banknotes and carry out currency and monetary control to ensure price stability, which means an inflation target of around 2%.
The Bank of Japan has embarked in an ultra-loose monetary policy since 2013 in order to stimulate the economy and fuel inflation amid a low-inflationary environment. The bank’s policy is based on Quantitative and Qualitative Easing (QQE), or printing notes to buy assets such as government or corporate bonds to provide liquidity. In 2016, the bank doubled down on its strategy and further loosened policy by first introducing negative interest rates and then directly controlling the yield of its 10-year government bonds.
The Bank’s massive stimulus has caused the Yen to depreciate against its main currency peers. This process has exacerbated more recently due to an increasing policy divergence between the Bank of Japan and other main central banks, which have opted to increase interest rates sharply to fight decades-high levels of inflation. The BoJ’s policy of holding down rates has led to a widening differential with other currencies, dragging down the value of the Yen.
A weaker Yen and the spike in global energy prices have led to an increase in Japanese inflation, which has exceeded the BoJ’s 2% target. With wage inflation becoming a cause of concern, the BoJ looks to move away from ultra loose policy, while trying to avoid slowing the activity too much.
| Index | Change, points | Closed | Change, % |
|---|---|---|---|
| NIKKEI 225 | 176.95 | 36380.17 | 0.49 |
| ASX 200 | 1.2 | 8142.1 | 0.01 |
| DAX | -14.59 | 18711.49 | -0.08 |
| CAC 40 | -42.52 | 7444.9 | -0.57 |
| Dow Jones | -103.08 | 41503.1 | -0.25 |
| S&P 500 | -16.32 | 5618.26 | -0.29 |
| NASDAQ Composite | -54.76 | 17573.3 | -0.31 |
| Pare | Closed | Change, % |
|---|---|---|
| AUDUSD | 0.67624 | 0.09 |
| EURJPY | 158.005 | -0.13 |
| EURUSD | 1.11155 | 0.02 |
| GBPJPY | 187.833 | 0.28 |
| GBPUSD | 1.321 | 0.41 |
| NZDUSD | 0.62063 | 0.37 |
| USDCAD | 1.36025 | 0.05 |
| USDCHF | 0.84551 | -0.18 |
| USDJPY | 142.162 | -0.13 |
- NZD/USD loses ground around 0.6200 in Thursday’s early Asian session.
- New Zealand’s GDP fell 0.2% in Q2 vs. 0.1% growth prior, better than expected.
- The US Fed cut its interest rate by 50 bps to 4.75%-5.0% on Wednesday, as widely expected.
The NZD/USD pair edges lower to near 0.6200 during the early Asian session on Thursday. The recent GDP data revealed that New Zealand's economy shrank again in the second quarter, suggesting the depths of its economic malaise. Later on Thursday, the US weekly Initial Jobless Claims, the Philly Fed Manufacturing Index and Existing Home Sales will be released.
Data released by Statistics New Zealand showed on Thursday that the country’s Gross Domestic Product (GDP) contracted 0.2% QoQ in the second quarter (Q2) compared with the 0.1% growth in Q1. This reading came in above expectations of a 0.4% contraction. Meanwhile, the annual second-quarter GDP came in at -0.5%, compared with the 0.5% growth in Q1, in line with the estimations.
The stronger-than-expected GDP number failed to boost the Kiwi as traders continue to assess the Federal Reserve’s (Fed) jumbo interest rate cut in quite a volatile session on Wednesday. Financial markets are now pricing in more than 50% odds of a 50bp cut by the Reserve Bank of New Zealand (RBNZ) as soon as October.
On the USD’s front, the US Fed slashed its benchmark interest rate by 50 bps to 4.75%-5.0% for the first time in four years, as widely expected. Fed officials shift their focus to supporting a weakening job market and achieving a rare “soft landing," which curbs inflation without causing a sharp recession.
During the press conference, Fed Chair Jerome Powell said the half-point rate reduction did not represent any new pattern for the central bank but that policymakers want to keep the economy and the labor market in good shape.
GDP FAQs
A country’s Gross Domestic Product (GDP) measures the rate of growth of its economy over a given period of time, usually a quarter. The most reliable figures are those that compare GDP to the previous quarter e.g Q2 of 2023 vs Q1 of 2023, or to the same period in the previous year, e.g Q2 of 2023 vs Q2 of 2022. Annualized quarterly GDP figures extrapolate the growth rate of the quarter as if it were constant for the rest of the year. These can be misleading, however, if temporary shocks impact growth in one quarter but are unlikely to last all year – such as happened in the first quarter of 2020 at the outbreak of the covid pandemic, when growth plummeted.
A higher GDP result is generally positive for a nation’s currency as it reflects a growing economy, which is more likely to produce goods and services that can be exported, as well as attracting higher foreign investment. By the same token, when GDP falls it is usually negative for the currency. When an economy grows people tend to spend more, which leads to inflation. The country’s central bank then has to put up interest rates to combat the inflation with the side effect of attracting more capital inflows from global investors, thus helping the local currency appreciate.
When an economy grows and GDP is rising, people tend to spend more which leads to inflation. The country’s central bank then has to put up interest rates to combat the inflation. Higher interest rates are negative for Gold because they increase the opportunity-cost of holding Gold versus placing the money in a cash deposit account. Therefore, a higher GDP growth rate is usually a bearish factor for Gold price.


© 2000-2026. Bản quyền Teletrade.
Trang web này được quản lý bởi Teletrade D.J. LLC 2351 LLC 2022 (Euro House, Richmond Hill Road, Kingstown, VC0100, St. Vincent and the Grenadines).
Thông tin trên trang web không phải là cơ sở để đưa ra quyết định đầu tư và chỉ được cung cấp cho mục đích làm quen.
Giao dịch trên thị trường tài chính (đặc biệt là giao dịch sử dụng các công cụ biên) mở ra những cơ hội lớn và tạo điều kiện cho các nhà đầu tư sẵn sàng mạo hiểm để thu lợi nhuận, tuy nhiên nó mang trong mình nguy cơ rủi ro khá cao. Chính vì vậy trước khi tiến hành giao dịch cần phải xem xét mọi mặt vấn đề chấp nhận tiến hành giao dịch cụ thể xét theo quan điểm của nguồn lực tài chính sẵn có và mức độ am hiểu thị trường tài chính.
Sử dụng thông tin: sử dụng toàn bộ hay riêng biệt các dữ liệu trên trang web của công ty TeleTrade như một nguồn cung cấp thông tin nhất định. Việc sử dụng tư liệu từ trang web cần kèm theo liên kết đến trang teletrade.vn. Việc tự động thu thập số liệu cũng như thông tin từ trang web TeleTrade đều không được phép.
Xin vui lòng liên hệ với pr@teletrade.global nếu có câu hỏi.
ngân hàng