LƯU Ý: Tài liệu trong nguồn cấp dữ liệu tin tức và phân tích được cập nhật tự động, tải lại trang có thể làm chậm quá trình xuất hiện tài liệu mới. Để nhận được tài liệu nhanh chóng, chúng tôi khuyên bạn nên luôn mở nguồn cấp tin tức.
Sort by topic
tất cả tin tức
Sắp xếp theo cặp tiền tệ
19.02.2025
23:50
Japan Foreign Investment in Japan Stocks climbed from previous ¥-384.4B to ¥-352.8B in February 14
EUR/USD edges lower to 1.0425 in Wednesday’s late American session.
FOMC Minutes indicated that the Fed wants to take time before making adjustments to interest rates.
The fresh round of Trump’s tariff threats weighs on the Euro.
The EUR/USD pair weakens to near 1.0425 during the late American session on Wednesday. Tariff concerns from US President Donald Trump and geopolitical tension provide some support to the US Dollar (USD). Investors await the US weekly Initial Jobless Claims, the CB Leading Economic Index and the Philly Fed Manufacturing Index reports, which are due later on Thursday.
The minutes from the FOMC meeting released on Wednesday stated that it was appropriate to keep the target interest rate unchanged at the January meeting, adding that the Fed believes that it is well positioned to take time to assess the outlook for economic activity, the labor market and inflation. Fed policymakers agreed that inflation must show clear signs of slowing down before any further rate reductions can be made.
The Federal Reserve’s (Fed) Austan Goolsbee, Michael Barr and Alberto Musalem are set to speak on Thursday. Their remarks could offer some hints about the path ahead for US interest rates. Any hawkish comments from Fed policymakers could boost the Greenback in the near term.
The latest round of tariff threats lifts the Greenback and creates a headwind for EUR/USD. Trump has criticized the EU’s car tariffs and threatened reciprocal tariffs on various sectors. Late Tuesday, Trump said that he intends to impose auto tariffs "in the neighborhood of 25%" and similar duties on semiconductors and pharmaceutical imports.
Euro FAQs
The Euro is the currency for the 19 European Union countries that belong to the Eurozone. It is the second most heavily traded currency in the world behind the US Dollar. In 2022, it accounted for 31% of all foreign exchange transactions, with an average daily turnover of over $2.2 trillion a day. EUR/USD is the most heavily traded currency pair in the world, accounting for an estimated 30% off all transactions, followed by EUR/JPY (4%), EUR/GBP (3%) and EUR/AUD (2%).
The European Central Bank (ECB) in Frankfurt, Germany, is the reserve bank for the Eurozone. The ECB sets interest rates and manages monetary policy. The ECB’s primary mandate is to maintain price stability, which means either controlling inflation or stimulating growth. Its primary tool is the raising or lowering of interest rates. Relatively high interest rates – or the expectation of higher rates – will usually benefit the Euro and vice versa. The ECB Governing Council makes monetary policy decisions at meetings held eight times a year. Decisions are made by heads of the Eurozone national banks and six permanent members, including the President of the ECB, Christine Lagarde.
Eurozone inflation data, measured by the Harmonized Index of Consumer Prices (HICP), is an important econometric for the Euro. If inflation rises more than expected, especially if above the ECB’s 2% target, it obliges the ECB to raise interest rates to bring it back under control. Relatively high interest rates compared to its counterparts will usually benefit the Euro, as it makes the region more attractive as a place for global investors to park their money.
Data releases gauge the health of the economy and can impact on the Euro. Indicators such as GDP, Manufacturing and Services PMIs, employment, and consumer sentiment surveys can all influence the direction of the single currency. A strong economy is good for the Euro. Not only does it attract more foreign investment but it may encourage the ECB to put up interest rates, which will directly strengthen the Euro. Otherwise, if economic data is weak, the Euro is likely to fall. Economic data for the four largest economies in the euro area (Germany, France, Italy and Spain) are especially significant, as they account for 75% of the Eurozone’s economy.
Another significant data release for the Euro is the Trade Balance. This indicator measures the difference between what a country earns from its exports and what it spends on imports over a given period. If a country produces highly sought after exports then its currency will gain in value purely from the extra demand created from foreign buyers seeking to purchase these goods. Therefore, a positive net Trade Balance strengthens a currency and vice versa for a negative balance.
Federal Reserve Vice Chairman Philip Jefferson said late Wednesday the US central bank has time to weigh its next interest rate decision move, citing a robust economy and still above target inflation, per Reuters.
Key quotes
Says the Fed can take time when weighing the next monetary policy move.
US economic performance has been quite strong.
US monetary policy remains restrictive.
The US labor market is solid, and inflation has eased but is still elevated.
Fed rate cuts are lowering real-world borrowing costs.
Household balance sheets appear to be in good shape.
The path back to 2% inflation could be bumpy.
Some households are more stretched on the financial front.
Some households may face challenges weathering financial shocks.
Market reaction
At the time of writing, the US Dollar Index (DXY) is trading 0.02% lower on the day to trade at 107.17.
Fed FAQs
Monetary policy in the US is shaped by the Federal Reserve (Fed). The Fed has two mandates: to achieve price stability and foster full employment. Its primary tool to achieve these goals is by adjusting interest rates. When prices are rising too quickly and inflation is above the Fed’s 2% target, it raises interest rates, increasing borrowing costs throughout the economy. This results in a stronger US Dollar (USD) as it makes the US a more attractive place for international investors to park their money. When inflation falls below 2% or the Unemployment Rate is too high, the Fed may lower interest rates to encourage borrowing, which weighs on the Greenback.
The Federal Reserve (Fed) holds eight policy meetings a year, where the Federal Open Market Committee (FOMC) assesses economic conditions and makes monetary policy decisions. The FOMC is attended by twelve Fed officials – the seven members of the Board of Governors, the president of the Federal Reserve Bank of New York, and four of the remaining eleven regional Reserve Bank presidents, who serve one-year terms on a rotating basis.
In extreme situations, the Federal Reserve may resort to a policy named Quantitative Easing (QE). QE is the process by which the Fed substantially increases the flow of credit in a stuck financial system. It is a non-standard policy measure used during crises or when inflation is extremely low. It was the Fed’s weapon of choice during the Great Financial Crisis in 2008. It involves the Fed printing more Dollars and using them to buy high grade bonds from financial institutions. QE usually weakens the US Dollar.
Quantitative tightening (QT) is the reverse process of QE, whereby the Federal Reserve stops buying bonds from financial institutions and does not reinvest the principal from the bonds it holds maturing, to purchase new bonds. It is usually positive for the value of the US Dollar.
Reserve Bank of New Zealand Governor Adrian Orr said late Wednesday that New Zealand was now in an environment of low and stable inflation but warned the volatile international landscape could impact the economy, per Reuters.
Key quotes
There will be GDP growth, employment growth coming through, and low and stable inflation.
There was currently "geoeconomic fragmentation, so global potential growth will be lower and we will see international price volatility.
The best thing we can do is have headline inflation at 2% so that we can sort of absorb that future volatility.
Market reaction
At the press time, NZD/USD is up 0.05% on the day to trade at 0.5705.
RBNZ FAQs
The Reserve Bank of New Zealand (RBNZ) is the country’s central bank. Its economic objectives are achieving and maintaining price stability – achieved when inflation, measured by the Consumer Price Index (CPI), falls within the band of between 1% and 3% – and supporting maximum sustainable employment.
The Reserve Bank of New Zealand’s (RBNZ) Monetary Policy Committee (MPC) decides the appropriate level of the Official Cash Rate (OCR) according to its objectives. When inflation is above target, the bank will attempt to tame it by raising its key OCR, making it more expensive for households and businesses to borrow money and thus cooling the economy. Higher interest rates are generally positive for the New Zealand Dollar (NZD) as they lead to higher yields, making the country a more attractive place for investors. On the contrary, lower interest rates tend to weaken NZD.
Employment is important for the Reserve Bank of New Zealand (RBNZ) because a tight labor market can fuel inflation. The RBNZ’s goal of “maximum sustainable employment” is defined as the highest use of labor resources that can be sustained over time without creating an acceleration in inflation. “When employment is at its maximum sustainable level, there will be low and stable inflation. However, if employment is above the maximum sustainable level for too long, it will eventually cause prices to rise more and more quickly, requiring the MPC to raise interest rates to keep inflation under control,” the bank says.
In extreme situations, the Reserve Bank of New Zealand (RBNZ) can enact a monetary policy tool called Quantitative Easing. QE is the process by which the RBNZ prints local currency and uses it to buy assets – usually government or corporate bonds – from banks and other financial institutions with the aim to increase the domestic money supply and spur economic activity. QE usually results in a weaker New Zealand Dollar (NZD). QE is a last resort when simply lowering interest rates is unlikely to achieve the objectives of the central bank. The RBNZ used it during the Covid-19 pandemic.
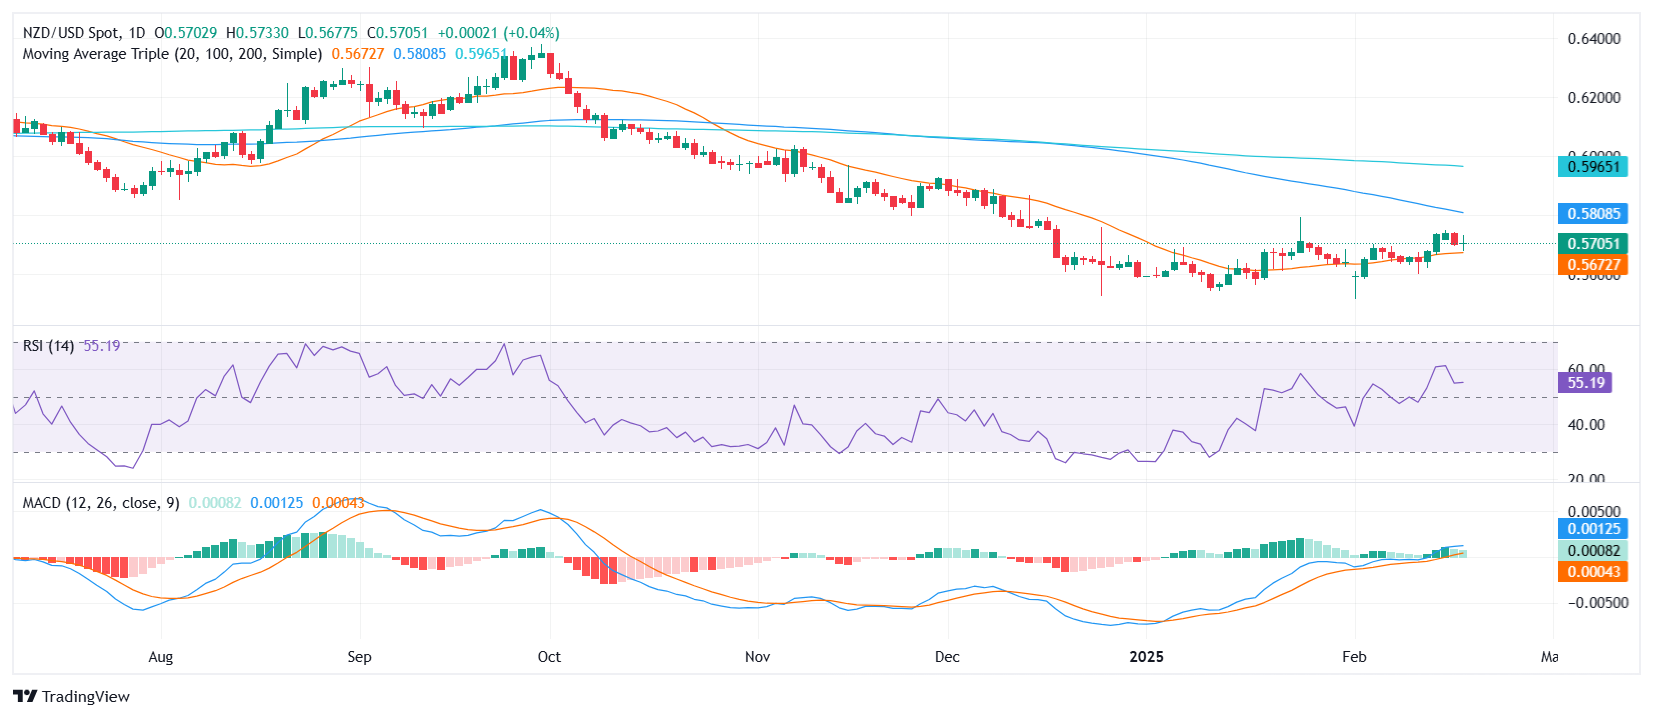
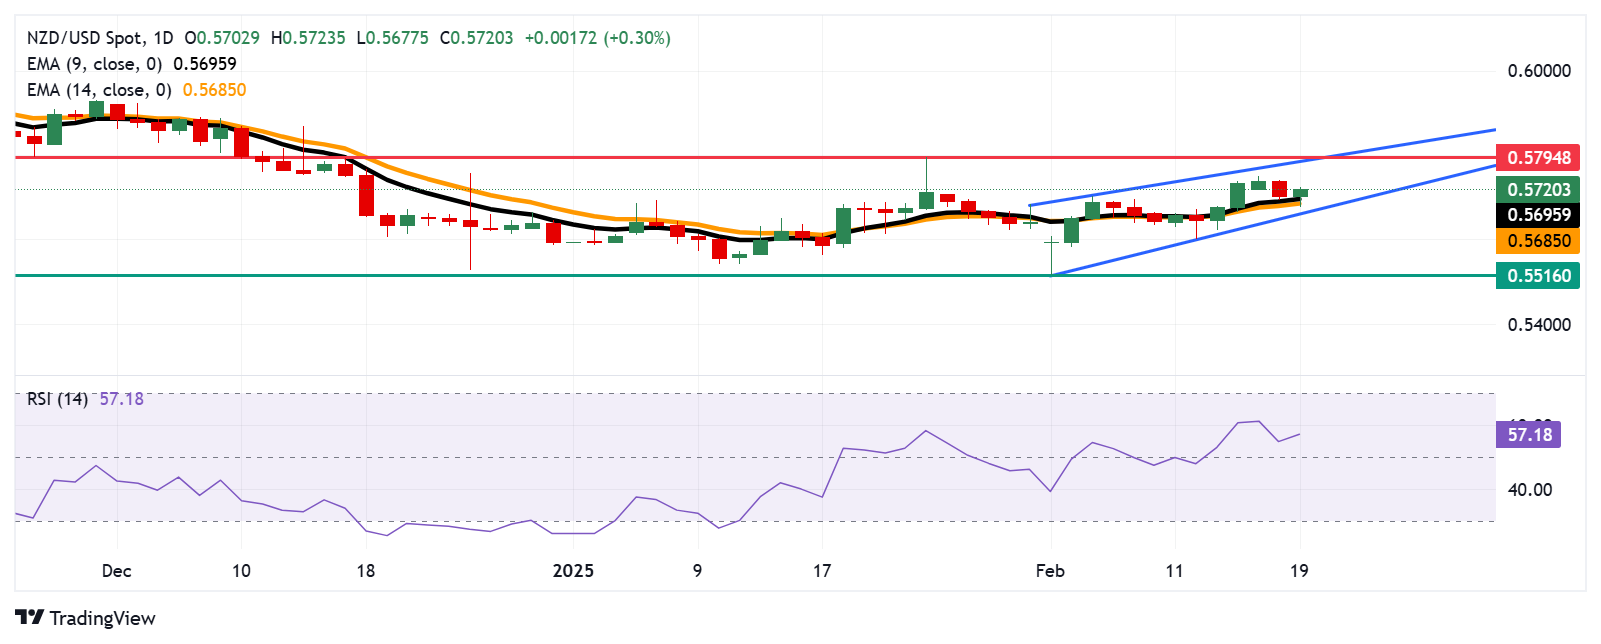
NZD/USD edges higher to 0.5705 on Wednesday, trading within a tight range following the RBNZ policy decision.
Bears tested the 20-day SMA, but buyers defended the level, keeping downside risks contained for now.
Momentum indicators remain flat but hold in positive territory, leaving room for a potential retest of support.
The NZD/USD pair traded with limited volatility on Wednesday, rising slightly to 0.5705 as the market digested the Reserve Bank of New Zealand’s (RBNZ) latest policy decision. Despite the subdued price action, sellers attempted to push the pair below the 20-day Simple Moving Average (SMA), but strong buying interest at that level prevented further declines.
Technical readings suggest indecision, with momentum indicators reflecting a neutral stance. The Relative Strength Index (RSI) remains flat at 56 but holds in positive territory, suggesting that bullish momentum is intact despite the lack of immediate upside traction. Meanwhile, the Moving Average Convergence Divergence (MACD) histogram prints flat green bars, reinforcing the view that the pair is consolidating rather than trending decisively.
Looking ahead, while buyers successfully defended the 20-day SMA support, a retest cannot be ruled out. A sustained break below this level could shift sentiment in favor of the bears, exposing further downside risks. On the flip side, if the pair stabilizes above 0.5700, the next upside target could be the 100-day SMA near 0.5825, which would signal renewed bullish control.
NZD/USD daily chart
22:01
United States API Weekly Crude Oil Stock above expectations (2.2M) in February 14: Actual (3.34M)
21:00
South Korea Consumer Sentiment Index rose from previous 91.2 to 95.2 in February
21:00
South Korea Producer Price Index Growth (YoY): 1.7% (January)
21:00
South Korea Producer Price Index Growth (MoM) up to 0.6% in January from previous 0.3%
DXY recovers but remains uncertain with key technical levels in focus.
The US Dollar Index (DXY), which tracks the US Dollar’s performance against six major currencies, trades slightly higher on Wednesday. Investors weigh the Federal Reserve’s (Fed) policy stance and the latest trade measures announced by US President Donald Trump, who confirmed that pharmaceutical and semiconductor imports will face 25% tariffs starting in April. At the time of writing, the DXY remains above 107.00 but struggles to establish a clear direction.
Daily digest market movers: US Dollar firms as Fed weighs balance sheet strategy
US President Donald Trump confirms 25% tariffs on pharmaceutical and semiconductor imports are set to begin in April.
Auto tariffs also reaffirmed at 25%, adding pressure to global trade tensions.
Trump shifts focus to trade policy after a lack of progress in Russia-Ukraine peace talks.
Fed Meeting Minutes highlight concerns over balance sheet reduction and debt ceiling impact.
Fed officials indicate that slowing or pausing balance sheet runoff may be appropriate.
Some participants believe trade and immigration policies could complicate the disinflation process.
Most Fed officials view risks to inflation and employment as roughly balanced.
A few Fed officials argue that inflation risks outweigh employment risks in policy decisions.
DXY technical outlook: Bulls need to reclaim key resistance levels
The US Dollar Index maintains modest gains above 107.00, but upside momentum remains limited. Despite the rebound, the 20-day Simple Moving Average (SMA) remains a key resistance level after being lost last week.
The Relative Strength Index (RSI) continues to hover in bearish territory, while the Moving Average Convergence Divergence (MACD) reflects steady downside pressure. A drop below the 100-day SMA at 106.30 would reinforce a negative short-term outlook. Bulls need stronger momentum to challenge the 107.50 resistance level and establish a more sustained recovery.
Fed FAQs
Monetary policy in the US is shaped by the Federal Reserve (Fed). The Fed has two mandates: to achieve price stability and foster full employment. Its primary tool to achieve these goals is by adjusting interest rates. When prices are rising too quickly and inflation is above the Fed’s 2% target, it raises interest rates, increasing borrowing costs throughout the economy. This results in a stronger US Dollar (USD) as it makes the US a more attractive place for international investors to park their money. When inflation falls below 2% or the Unemployment Rate is too high, the Fed may lower interest rates to encourage borrowing, which weighs on the Greenback.
The Federal Reserve (Fed) holds eight policy meetings a year, where the Federal Open Market Committee (FOMC) assesses economic conditions and makes monetary policy decisions. The FOMC is attended by twelve Fed officials – the seven members of the Board of Governors, the president of the Federal Reserve Bank of New York, and four of the remaining eleven regional Reserve Bank presidents, who serve one-year terms on a rotating basis.
In extreme situations, the Federal Reserve may resort to a policy named Quantitative Easing (QE). QE is the process by which the Fed substantially increases the flow of credit in a stuck financial system. It is a non-standard policy measure used during crises or when inflation is extremely low. It was the Fed’s weapon of choice during the Great Financial Crisis in 2008. It involves the Fed printing more Dollars and using them to buy high grade bonds from financial institutions. QE usually weakens the US Dollar.
Quantitative tightening (QT) is the reverse process of QE, whereby the Federal Reserve stops buying bonds from financial institutions and does not reinvest the principal from the bonds it holds maturing, to purchase new bonds. It is usually positive for the value of the US Dollar.
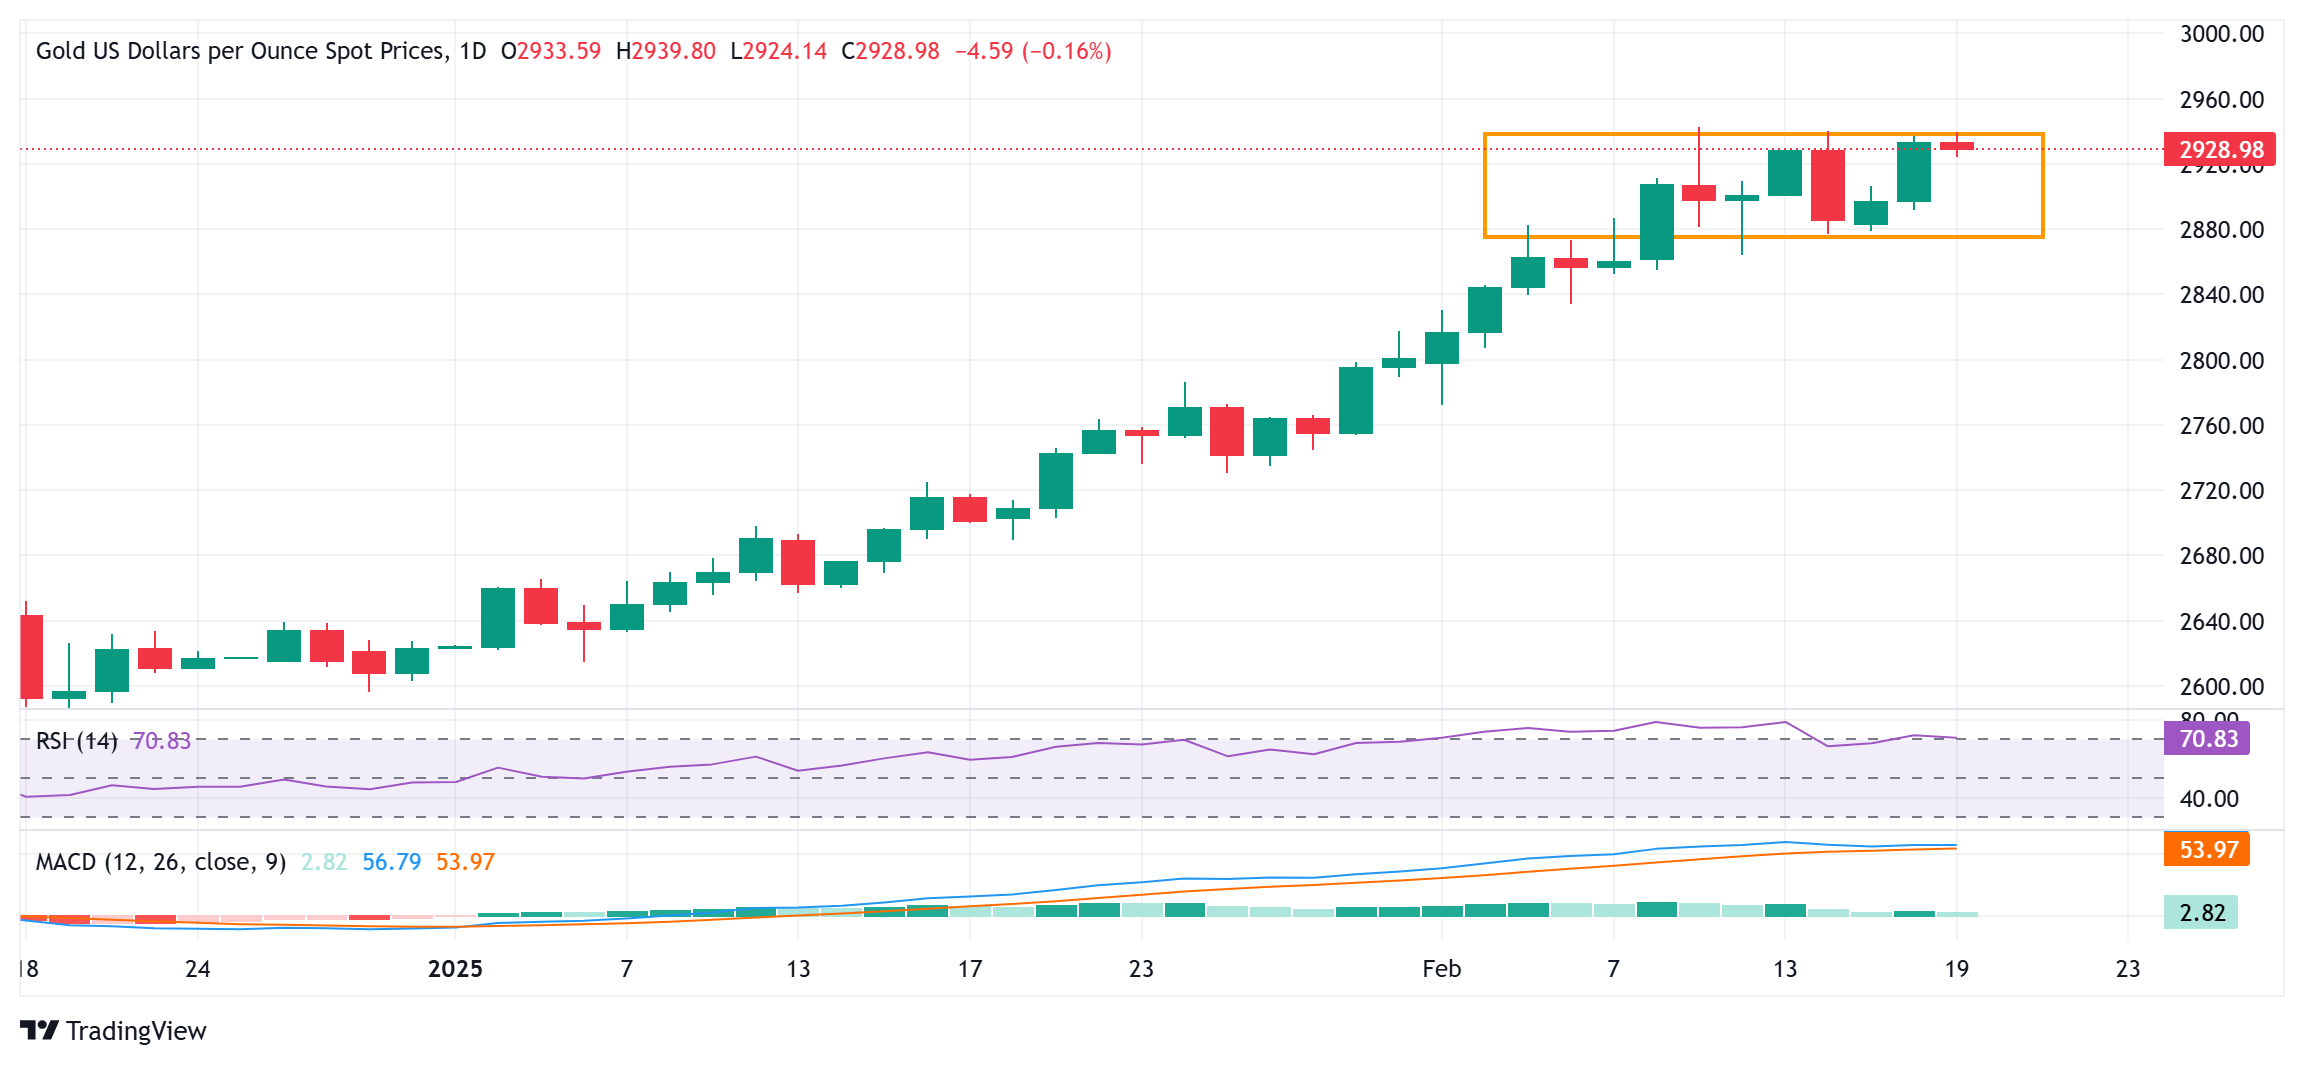
Gold hits new all-time high as Trump’s tariff threats fuel trade war fears.
Fed minutes reveal concerns over inflation risks, weighing on rate-cut expectations.
Traders eye US jobless claims and S&P Global Flash PMIs for further market cues.
Gold prices retreated on Wednesday during the North American session after the latest Federal Reserve’s (Fed) monetary policy minutes showed that all policymakers voted to keep rates unchanged at the January meeting. XAU/USD trades at around $2,925, down 0.31%.
The minutes showed that Fed officials judged the dual mandate risks to be roughly balanced, while “some participants cited potential changes in trade and immigration policy as having potential to hinder the disinflation process.” Participants noted that some measures of inflation expectations “had increased recently.”
Earlier, Gold hit a new all-time high of $2,946 during the European session after United States (US) President Donald Trump revealed that he would impose 25% tariffs on automobiles, pharmaceuticals and chip imports.
The non-yielding metal edged up amid the trade war scenario. However, it turned negative after the release of the Fed’s minutes.
Market participants will watch the release of last week's initial jobless claims and S&P Global Flash PMIs.
Daily digest market movers: Gold price losses steam after reaching record high
The US 10-year Treasury bond yield falls one and a half basis points (bps) and yields 4.535%.
US real yields, which correlate inversely to Bullion prices, drop two-and-a-half basis points to 2.072%, a headwind for Bullion prices.
Due to weather disruptions, January's US Housing Starts slid from 1.515 million to 1.366 million, or a 9.6% plunge.
US Building Permits for the same period improved, rising from 1.482 million to 1.483 million, a 0.1% increase.
Goldman Sachs upward revised XAU/USD price to $3,100 by year’s end as the investment bank said “structurally higher" central bank demand will add 9% to the price of the non-yielding metal.
The World Gold Council (WGC) revealed that central banks purchased more than 54% YoY to 333 tonnes following Trump’s victory, according to its data.
Money market fed funds rate futures are pricing in 40 basis points of easing by the Fed in 2025.
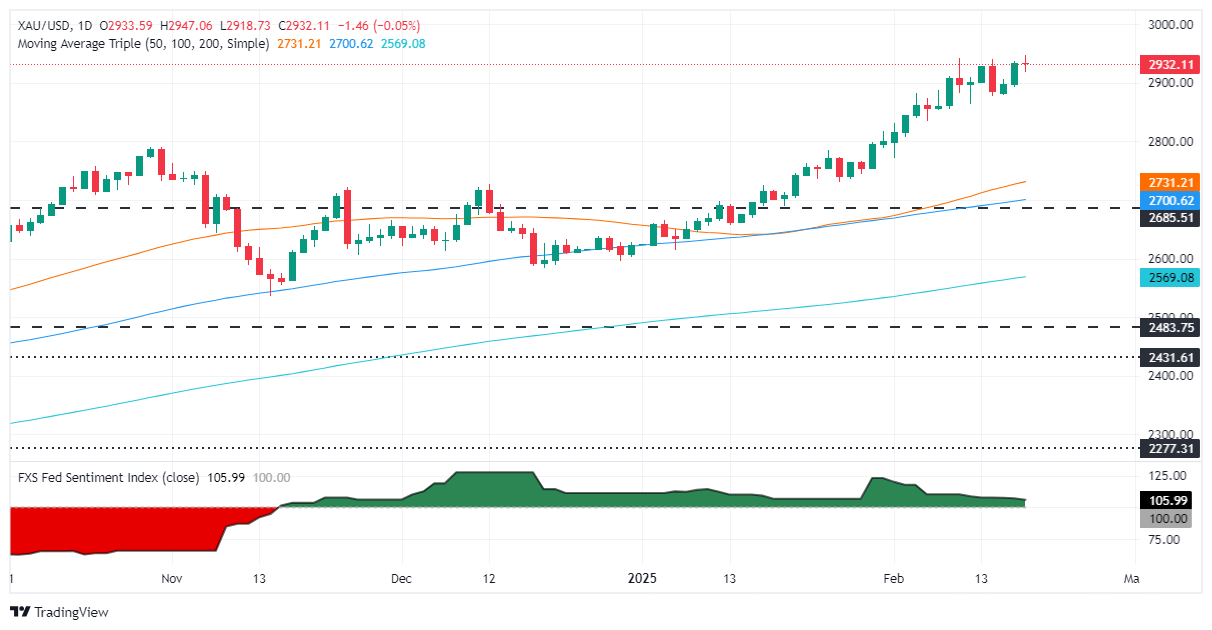
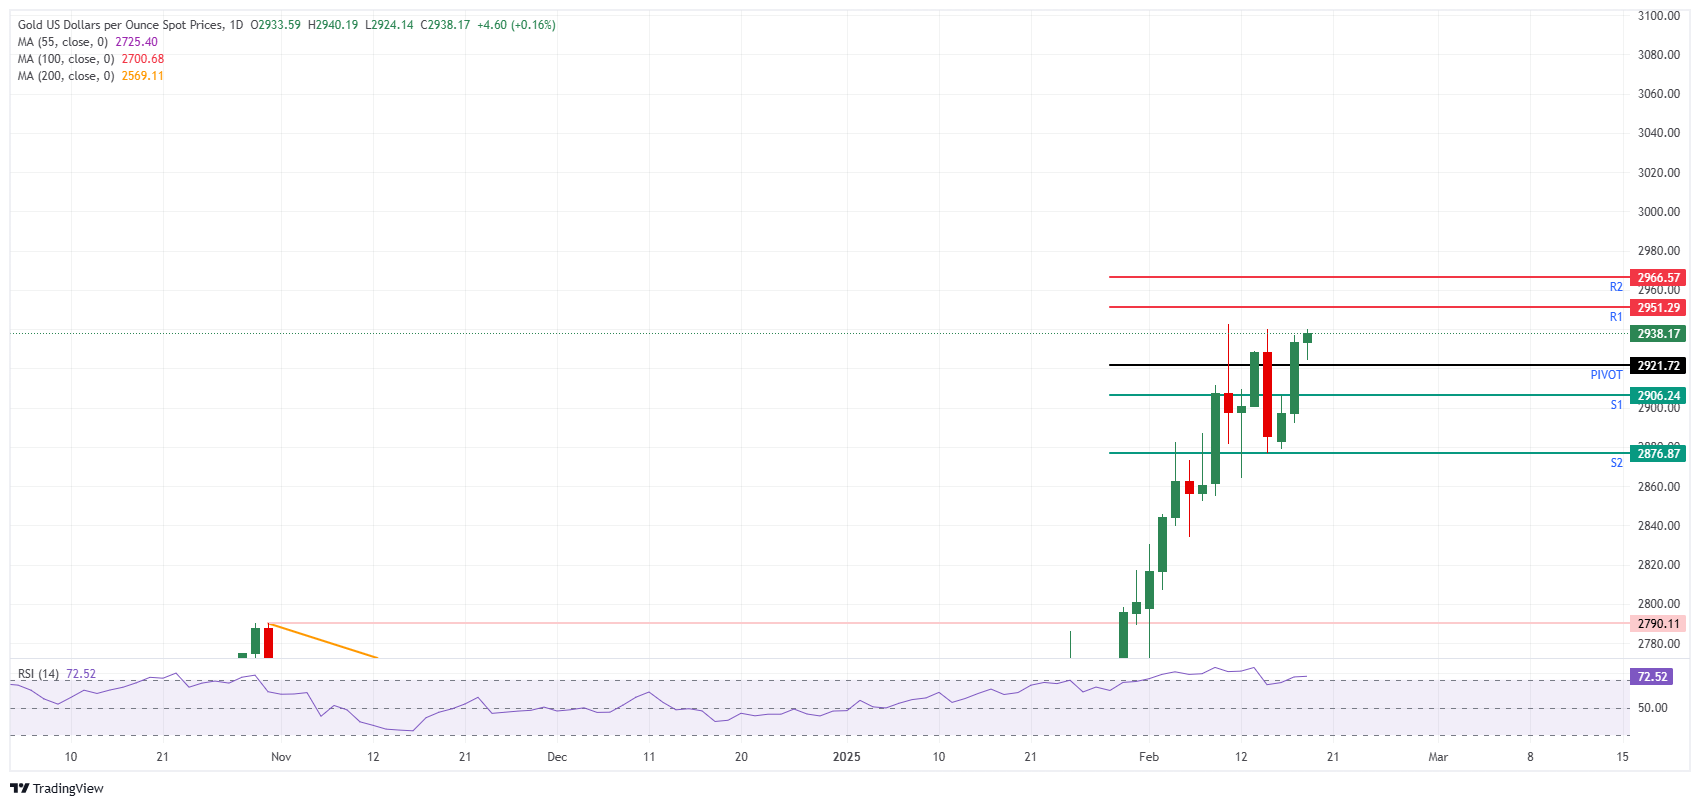
XAU/USD technical outlook: Gold price faces stir resistance and retreats
Gold price remains upwardly biased, though during the last seven days it has remained unable to clear the $2,950 hurdle. Price action seems overextended, further reinforced by buyers losing steam.
The Relative Strength Index (RSI) is about to exit overbought territory, which could lead to lower Gold prices. The first support would be the February 14 swing low of $2,877, followed by the February 12 daily low of $2,864.
On the other hand, if XAU/USD rises past $2,946, the first resistance would be the psychological $2,950, followed by $3,000.
Gold FAQs
Gold has played a key role in human’s history as it has been widely used as a store of value and medium of exchange. Currently, apart from its shine and usage for jewelry, the precious metal is widely seen as a safe-haven asset, meaning that it is considered a good investment during turbulent times. Gold is also widely seen as a hedge against inflation and against depreciating currencies as it doesn’t rely on any specific issuer or government.
Central banks are the biggest Gold holders. In their aim to support their currencies in turbulent times, central banks tend to diversify their reserves and buy Gold to improve the perceived strength of the economy and the currency. High Gold reserves can be a source of trust for a country’s solvency. Central banks added 1,136 tonnes of Gold worth around $70 billion to their reserves in 2022, according to data from the World Gold Council. This is the highest yearly purchase since records began. Central banks from emerging economies such as China, India and Turkey are quickly increasing their Gold reserves.
Gold has an inverse correlation with the US Dollar and US Treasuries, which are both major reserve and safe-haven assets. When the Dollar depreciates, Gold tends to rise, enabling investors and central banks to diversify their assets in turbulent times. Gold is also inversely correlated with risk assets. A rally in the stock market tends to weaken Gold price, while sell-offs in riskier markets tend to favor the precious metal.
The price can move due to a wide range of factors. Geopolitical instability or fears of a deep recession can quickly make Gold price escalate due to its safe-haven status. As a yield-less asset, Gold tends to rise with lower interest rates, while higher cost of money usually weighs down on the yellow metal. Still, most moves depend on how the US Dollar (USD) behaves as the asset is priced in dollars (XAU/USD). A strong Dollar tends to keep the price of Gold controlled, whereas a weaker Dollar is likely to push Gold prices up.
The US Dollar maintained its constructive path helped by fresh concerns around US tariffs and amid geopolitical tension in response to negotiations around a potential end of the Russia-Ukraine war.
Here is what you need to know on Thursday, February 20:
The US Dollar Index (DXY) added to Tuesday’s gains above the 107.00 barrier on the back of tariff concerns and despite declining US yields across the curve. The usual weekly Initial Jobless Claims are due, seconded by the Philly Fed Manufacturing Index, the CB Leading Economic Index, and the weekly report on US crude oil inventories by the EIA. In addition, the Fed’s Goolsbee, Barr, Musalem and Kugler are all due to speak.
EUR/USD came under extra selling pressure and receded to the 1.0400 zone, where some initial contention seems to have emerged. The advanced Consumer Confidence tracked by the European Commission will be in the spotlight, along with Producer Prices in Germany.
GBP/USD saw its decline pick up pace, breaking below the 1.2600 support despite firmer UK inflation data. The CBI Industrial Trends Orders will be released across the Channel.
Fresh buying interest in the Japanese yen prompted USD/JPY to leave behind Tuesday’s uptick and refocus on the downside, briefly retesting the 151.20 zone. The weekly Foreign Bond Investment figures are expected in “The Land of the Rising Sun”.
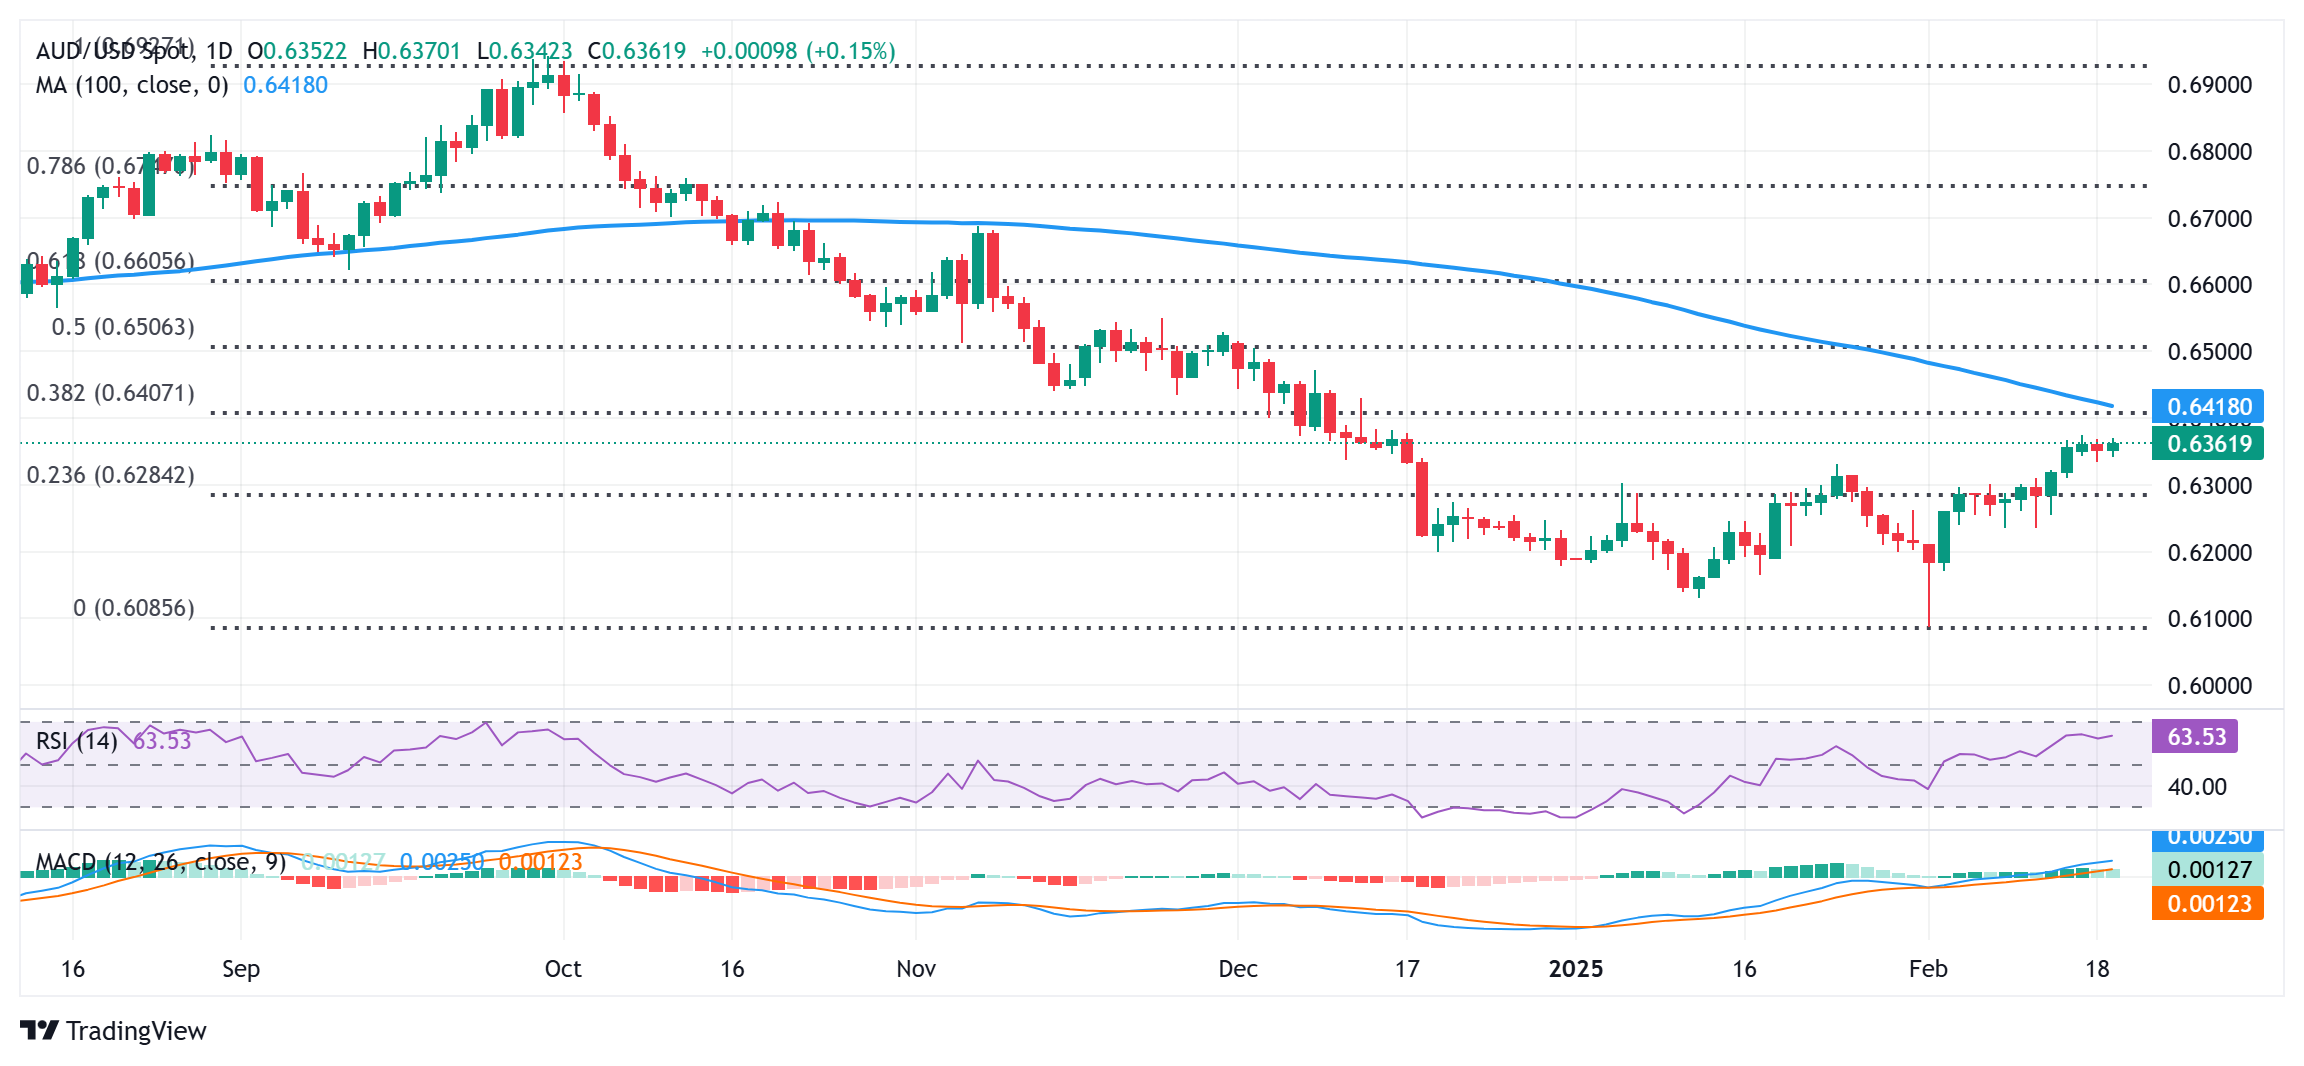
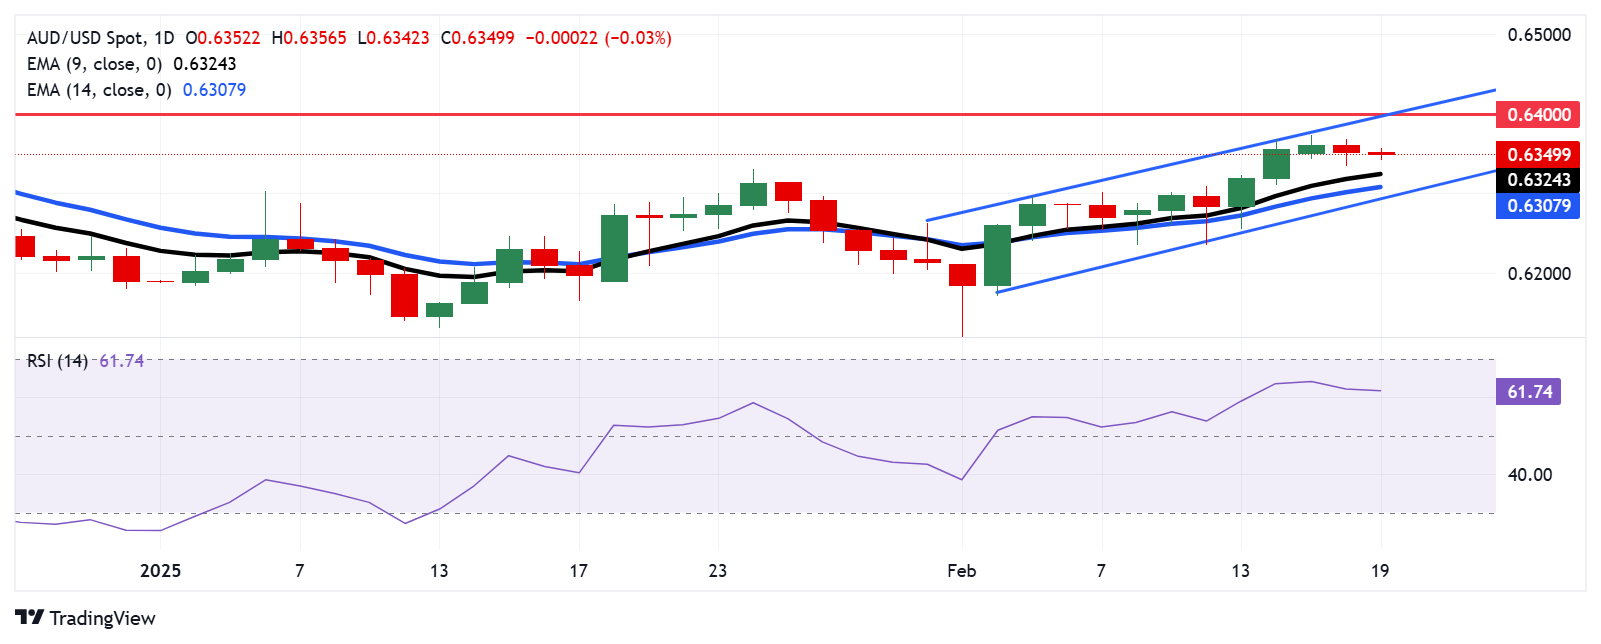
AUD/USD traded in a vacillating mood, although it managed well to keep the trade in the upper end of the range near 0.6350. The publication of the labour market report will be the salient event Down Under, seconded by preliminary S&P Global Manufacturing/Services/Composite PMIs.
The resurgence of tariff jitters, geopolitical tensions and supply woes saw the barrel of WTI advance for the third straight day, this time flirting with the $73.00 mark.
Prices of Gold rose to another record high near $2,950 per ounce troy, slowly approaching the key $3,000 mark. Silver prices could not sustain an early move past the $33.00 mark per ounce and eventually succumbed to the selling pressure.
USD/CAD stays firm above 1.4200 as risk aversion lifts US Dollar.
Canada’s rising inflation may delay BoC easing, adding uncertainty.
Traders await FOMC minutes for Fed’s stance on rate-cut timing.
The Canadian Dollar (CAD) retreats against the US Dollar on Wednesday, with the USD/CAD pair remaining afloat above the 1.4200 handle amid renewed fears about US President Donald Trump's tariff threats. The lack of Canadian data left traders adrift to the economic docket in the United States (US), particularly housing data for January.
The Canadian economic docket was empty, yet the latest round of inflation data witnessed an uptick, indicating that the Bank of Canada (BoC) might re-think twice before easing policy. In the US, Housing Starts in January disappointed investors, though Building Permits showed that construction continued to edge higher, although at an anemic pace.
Today’s US economic docket will also feature the release of the Federal Reserve’s (Fed) latest monetary policy meeting minutes. On January 27-28, the Fed decided to hold rates firm, pausing its easing cycle as inflation gathered steam. It should be said that Fed Jerome Powell turned slightly hawkish, saying that they’re not in a rush to cut interest rates.
Since then, most Fed officials have turned slightly cautious, adopting a wait-and-see mode regarding inflation.
Daily digest market movers: Canadian Dollar struggles to rally amid mixed US data
US Housing Starts fell sharply by 9.6% in January, dropping from 1.515 million to 1.366 million, as adverse weather conditions impacted construction activity.
In contrast, US Building Permits edged slightly higher, rising 0.1% from 1.482 million to 1.483 million during the same period, signaling resilience in future construction plans.
Interest rate differentials between Canada and the United States continued to weigh on the Loonie, which remained pressured for the third straight day. The USD/CAD hit a weekly high of 1.4244.
However, a reversal looms as the BoC might keep rates in check following the release of January’s CPI data. In that outcome, the USD/CAD could aim lower as the Canadian Dollar appreciates versus the Greenback.
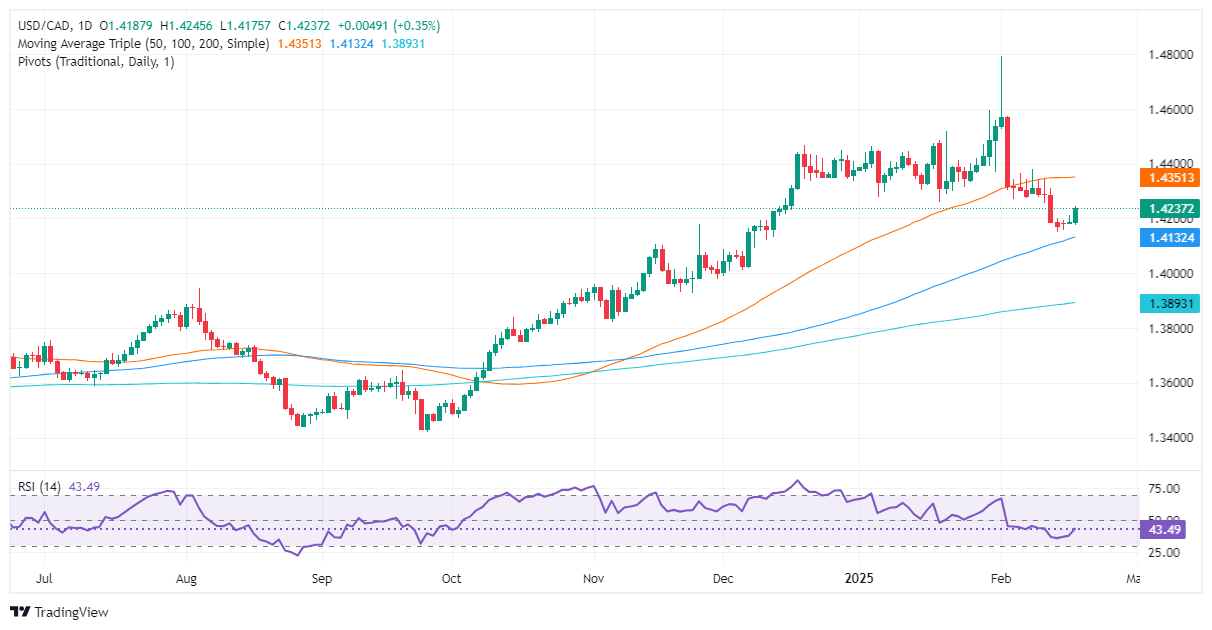
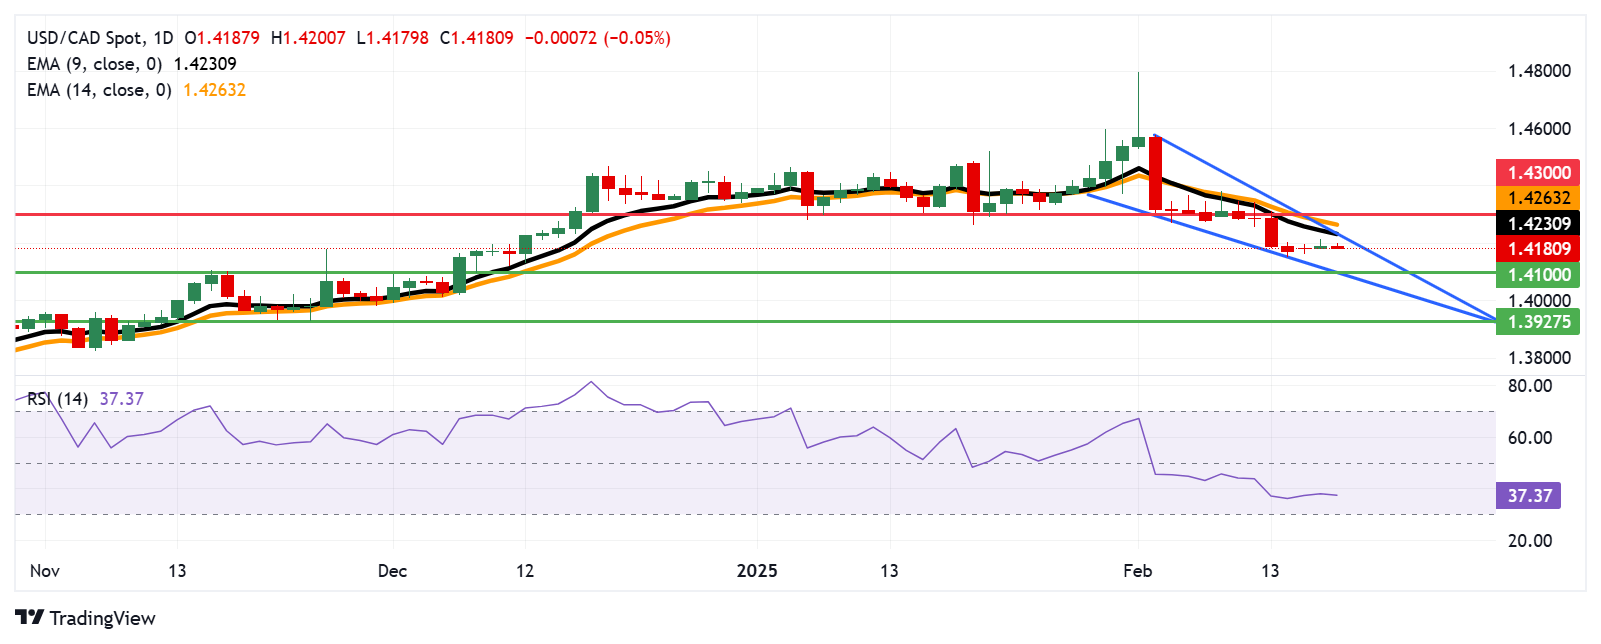
USD/CAD price forecast: Canadian Dollar set to appreciate further, despite posting losses
The USD/CAD uptrend lost steam after the pair peaked near 1.4800. Since then, sellers have taken over, pushing prices below the 50-day Simple Moving Average (SMA) at 1.4338 and clearing the January 20 daily low of 1.4260, a crucial level for buyers. Further downside lies ahead if bears push spot prices below the 100-day SMA at 1.4111.
Otherwise, if buyers lift USD/CAD past 1.4300, they must reclaim the 50-day SMA to remain hopeful of higher prices.
Canadian Dollar FAQs
The key factors driving the Canadian Dollar (CAD) are the level of interest rates set by the Bank of Canada (BoC), the price of Oil, Canada’s largest export, the health of its economy, inflation and the Trade Balance, which is the difference between the value of Canada’s exports versus its imports. Other factors include market sentiment – whether investors are taking on more risky assets (risk-on) or seeking safe-havens (risk-off) – with risk-on being CAD-positive. As its largest trading partner, the health of the US economy is also a key factor influencing the Canadian Dollar.
The Bank of Canada (BoC) has a significant influence on the Canadian Dollar by setting the level of interest rates that banks can lend to one another. This influences the level of interest rates for everyone. The main goal of the BoC is to maintain inflation at 1-3% by adjusting interest rates up or down. Relatively higher interest rates tend to be positive for the CAD. The Bank of Canada can also use quantitative easing and tightening to influence credit conditions, with the former CAD-negative and the latter CAD-positive.
The price of Oil is a key factor impacting the value of the Canadian Dollar. Petroleum is Canada’s biggest export, so Oil price tends to have an immediate impact on the CAD value. Generally, if Oil price rises CAD also goes up, as aggregate demand for the currency increases. The opposite is the case if the price of Oil falls. Higher Oil prices also tend to result in a greater likelihood of a positive Trade Balance, which is also supportive of the CAD.
While inflation had always traditionally been thought of as a negative factor for a currency since it lowers the value of money, the opposite has actually been the case in modern times with the relaxation of cross-border capital controls. Higher inflation tends to lead central banks to put up interest rates which attracts more capital inflows from global investors seeking a lucrative place to keep their money. This increases demand for the local currency, which in Canada’s case is the Canadian Dollar.
Macroeconomic data releases gauge the health of the economy and can have an impact on the Canadian Dollar. Indicators such as GDP, Manufacturing and Services PMIs, employment, and consumer sentiment surveys can all influence the direction of the CAD. A strong economy is good for the Canadian Dollar. Not only does it attract more foreign investment but it may encourage the Bank of Canada to put up interest rates, leading to a stronger currency. If economic data is weak, however, the CAD is likely to fall.
18:07
United States 20-Year Bond Auction declined to 4.83% from previous 4.9%
Dow Jones trades near 44,380 as investors await the Federal Reserve’s January meeting minutes.
Fed policymakers emphasized patience, removing language about inflation progress in their latest statement.
US President Donald Trump announced 25% tariffs on cars, pharmaceuticals, and semiconductors.
The Dow Jones Industrial Average (DJIA), which measures the performance of 30 large-cap United States (US) stocks, is under pressure, trading around 44,380. Investors are awaiting the Federal Reserve’s (Fed) January meeting minutes for insights into the central bank’s stance on inflation and interest rates. Market sentiment weakened after US President Donald Trump announced new tariffs on key imports.
Daily digest market movers: Dow Jones slides as Fed minutes loom
The Federal Reserve kept interest rates steady at 4.25%-4.50% but removed language suggesting inflation progress.
Fed officials reiterated that patience is necessary before making any policy adjustments, emphasizing the need for more data.
Philadelphia Fed President Patrick Harker and Atlanta Fed President Raphael Bostic signaled no rush to cut rates.
Elsewhere, President Donald Trump announced 25% tariffs on cars, pharmaceuticals, and semiconductors, effective by April.
In addition, trade tensions rose as US-Russia peace talks on Ukraine stalled, with Trump blaming Ukraine for the lack of progress which contributed to a sour market mood.
Market participants remain cautious ahead of the Federal Open Market Committee (FOMC) minutes release.
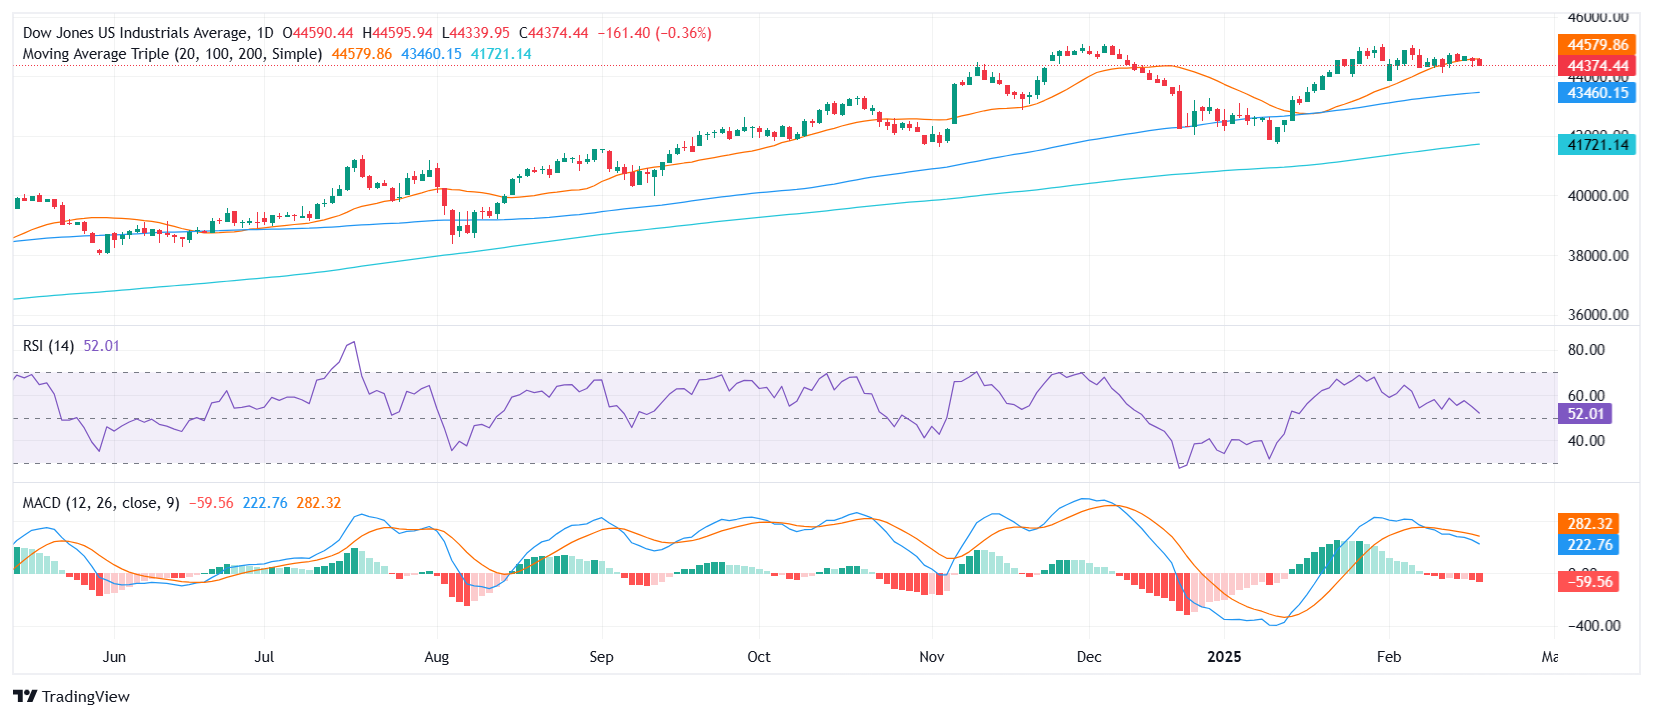
DJIA Technical Analysis
The Dow Jones has slipped below the 20-day SMA at 44,580, reinforcing bearish momentum. Sellers are gaining ground as uncertainty over Federal Reserve policy and trade tensions weigh on sentiment. A sustained move below 44,350 could accelerate declines while buyers need a recovery above 44,600 to regain control.
Fed FAQs
Monetary policy in the US is shaped by the Federal Reserve (Fed). The Fed has two mandates: to achieve price stability and foster full employment. Its primary tool to achieve these goals is by adjusting interest rates. When prices are rising too quickly and inflation is above the Fed’s 2% target, it raises interest rates, increasing borrowing costs throughout the economy. This results in a stronger US Dollar (USD) as it makes the US a more attractive place for international investors to park their money. When inflation falls below 2% or the Unemployment Rate is too high, the Fed may lower interest rates to encourage borrowing, which weighs on the Greenback.
The Federal Reserve (Fed) holds eight policy meetings a year, where the Federal Open Market Committee (FOMC) assesses economic conditions and makes monetary policy decisions. The FOMC is attended by twelve Fed officials – the seven members of the Board of Governors, the president of the Federal Reserve Bank of New York, and four of the remaining eleven regional Reserve Bank presidents, who serve one-year terms on a rotating basis.
In extreme situations, the Federal Reserve may resort to a policy named Quantitative Easing (QE). QE is the process by which the Fed substantially increases the flow of credit in a stuck financial system. It is a non-standard policy measure used during crises or when inflation is extremely low. It was the Fed’s weapon of choice during the Great Financial Crisis in 2008. It involves the Fed printing more Dollars and using them to buy high grade bonds from financial institutions. QE usually weakens the US Dollar.
Quantitative tightening (QT) is the reverse process of QE, whereby the Federal Reserve stops buying bonds from financial institutions and does not reinvest the principal from the bonds it holds maturing, to purchase new bonds. It is usually positive for the value of the US Dollar.
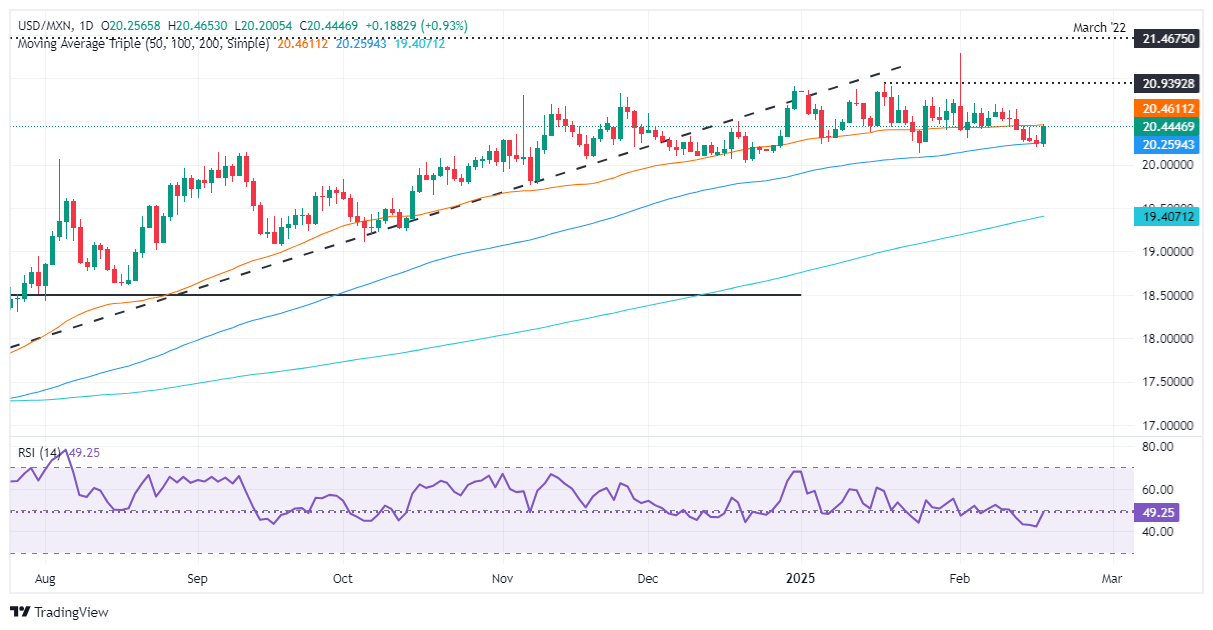
The Mexican Peso lost ground and slumped to a two-day low against the Greenback on Wednesday as US President Donald Trump targeted tariffs on cars, pharmaceuticals and computer chips. This fueled demand for the US Dollar's safe-haven status, which can be seen by the USD/MXN rising over 0.78%, trading at 20.40.
Market mood shifted negative amid a new round of Trump tariffs, which now include duties of around 25% on cars, pharmaceuticals and semiconductors. with an announcement as soon as April 2. This boosted the Greenback, which according to the US Dollar Index (DXY) hit a four-day peak of 107.32.
In the meantime, US housing data revealed earlier was mixed. Housing Starts plunged, while Building Permits maintained the “status quo.” Now eyes turn to the Minutes of the Federal Reserve’s (Fed) first monetary policy meeting of 2025.
The Fed turned more cautious after the latest inflation readings, suggesting that policy is not as restrictive as they thought. The rise of the Consumer Price Index (CPI) for five straight months might prevent the US central bank from cutting interest rates, at least for the first half of 2025.
Therefore, further USD/MXN upside is projected as monetary policy divergence between Banxico and the Fed favors further USD/MXN upside. The Fed is expected to keep rates steady, while Banxico is expected to cut rates again by 50 basis points at the next meeting.
Meanwhile, traders are eyeing the release of Mexico’s Retail Sales for December, which are expected to deteriorate on a monthly basis but improve despite contracting annually. After that, Banxico’s latest monetary policy minutes will be revealed.
Mexico’s Retail Sales in December are expected to show the economic slowdown. The final GDP reading for Q4 2024 is expected to show a contraction on a quarterly basis and is foreseen expanding annually.
Meanwhile, investors await Banxico’s minutes, which will help them gather clues about the intention of reducing rates at a 50 basis point (bps) pace during the year.
US Housing Starts in January dropped from 1.515 million to 1.366 million, or a 9.6% plunge, due to weather disruptions. At the same time, US Building Permits for the same period improved with figures rising from 1.482 million to 1.483 million, a 0.1% increase.
San Francisco Fed President Mary Daly said, “Policy needs to remain restrictive until…I see that we are really continuing to make progress on inflation.”
According to the December 2025 fed funds interest rate futures contract, the swaps market suggests that the Fed will reduce rates by 40 basis points toward year-end.
Trade disputes between the US and Mexico remain in the boiler room. Although the countries found common ground previously, USD/MXN traders should know that there is a 30-day pause and that tensions could arise toward the end of February.
USD/MXN technical outlook: Mexican Peso plunges as USD/MXN rises toward 50-day SMA
The USD/MXN uptrend resumed as the exotic pair tested the 100-day Simple Moving Average (SMA) at 20.22 but failed to clear the latter. Momentum favors buyers in the short term due to the Relative Strength Index (RSI) being in bearish territory.
Therefore, bulls must clear the 50-day SMA at 20.57, before targeting the January 117 peak at 20.93. Once surpassed, traders could target the year-to-date (YTD) high at 21.28, ahead of challenging 21.46. Conversely, if USD/MXN drops beneath the 100-day SMA, look for a fall to test the 20.00 figure.
Mexican Peso FAQs
The Mexican Peso (MXN) is the most traded currency among its Latin American peers. Its value is broadly determined by the performance of the Mexican economy, the country’s central bank’s policy, the amount of foreign investment in the country and even the levels of remittances sent by Mexicans who live abroad, particularly in the United States. Geopolitical trends can also move MXN: for example, the process of nearshoring – or the decision by some firms to relocate manufacturing capacity and supply chains closer to their home countries – is also seen as a catalyst for the Mexican currency as the country is considered a key manufacturing hub in the American continent. Another catalyst for MXN is Oil prices as Mexico is a key exporter of the commodity.
The main objective of Mexico’s central bank, also known as Banxico, is to maintain inflation at low and stable levels (at or close to its target of 3%, the midpoint in a tolerance band of between 2% and 4%). To this end, the bank sets an appropriate level of interest rates. When inflation is too high, Banxico will attempt to tame it by raising interest rates, making it more expensive for households and businesses to borrow money, thus cooling demand and the overall economy. Higher interest rates are generally positive for the Mexican Peso (MXN) as they lead to higher yields, making the country a more attractive place for investors. On the contrary, lower interest rates tend to weaken MXN.
Macroeconomic data releases are key to assess the state of the economy and can have an impact on the Mexican Peso (MXN) valuation. A strong Mexican economy, based on high economic growth, low unemployment and high confidence is good for MXN. Not only does it attract more foreign investment but it may encourage the Bank of Mexico (Banxico) to increase interest rates, particularly if this strength comes together with elevated inflation. However, if economic data is weak, MXN is likely to depreciate.
As an emerging-market currency, the Mexican Peso (MXN) tends to strive during risk-on periods, or when investors perceive that broader market risks are low and thus are eager to engage with investments that carry a higher risk. Conversely, MXN tends to weaken at times of market turbulence or economic uncertainty as investors tend to sell higher-risk assets and flee to the more-stable safe havens.
16:00
Russia Producer Price Index (MoM) climbed from previous 0.4% to 0.5% in January
16:00
Russia Producer Price Index (YoY) rose from previous 7.9% to 9.7% in January
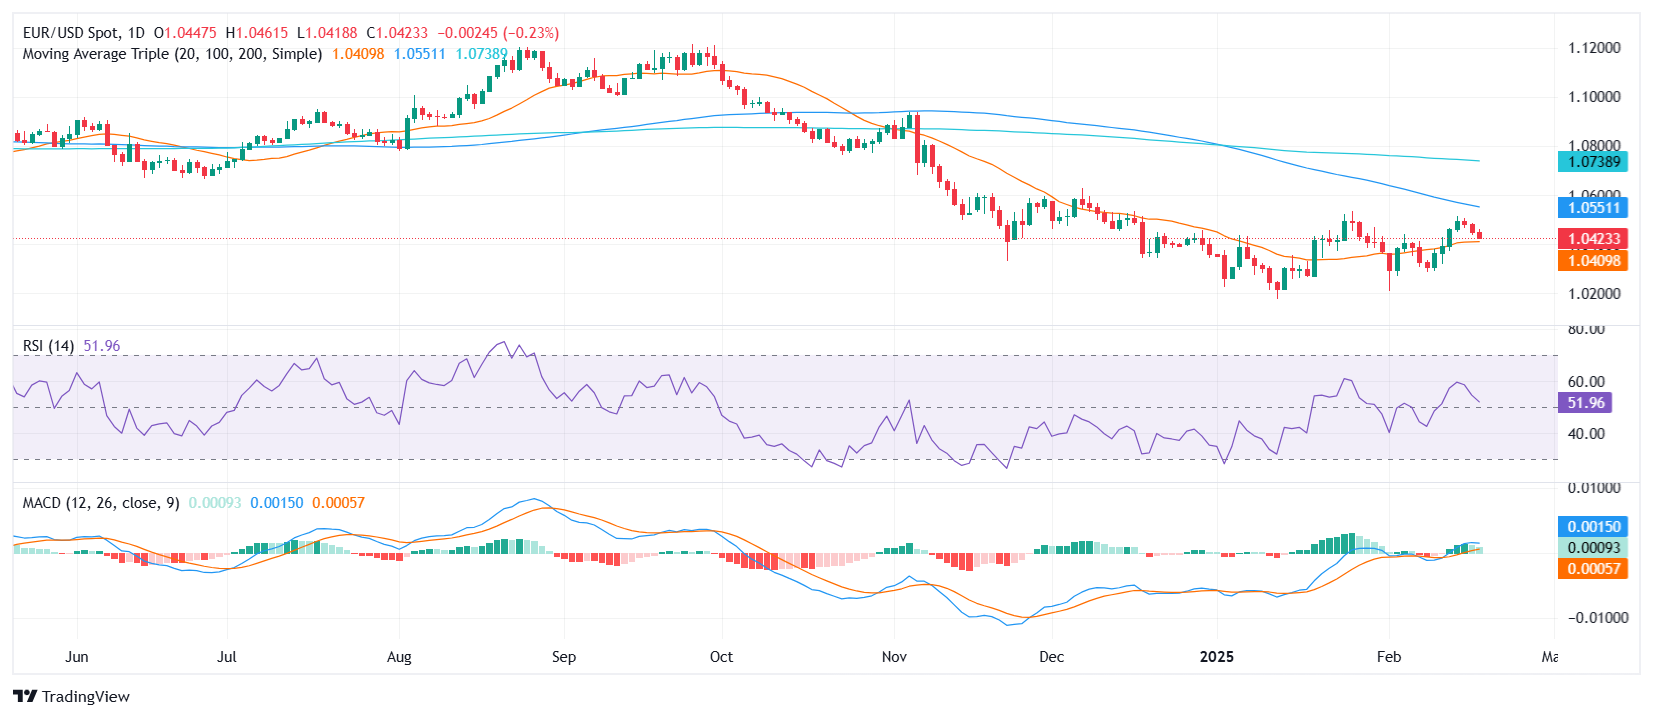
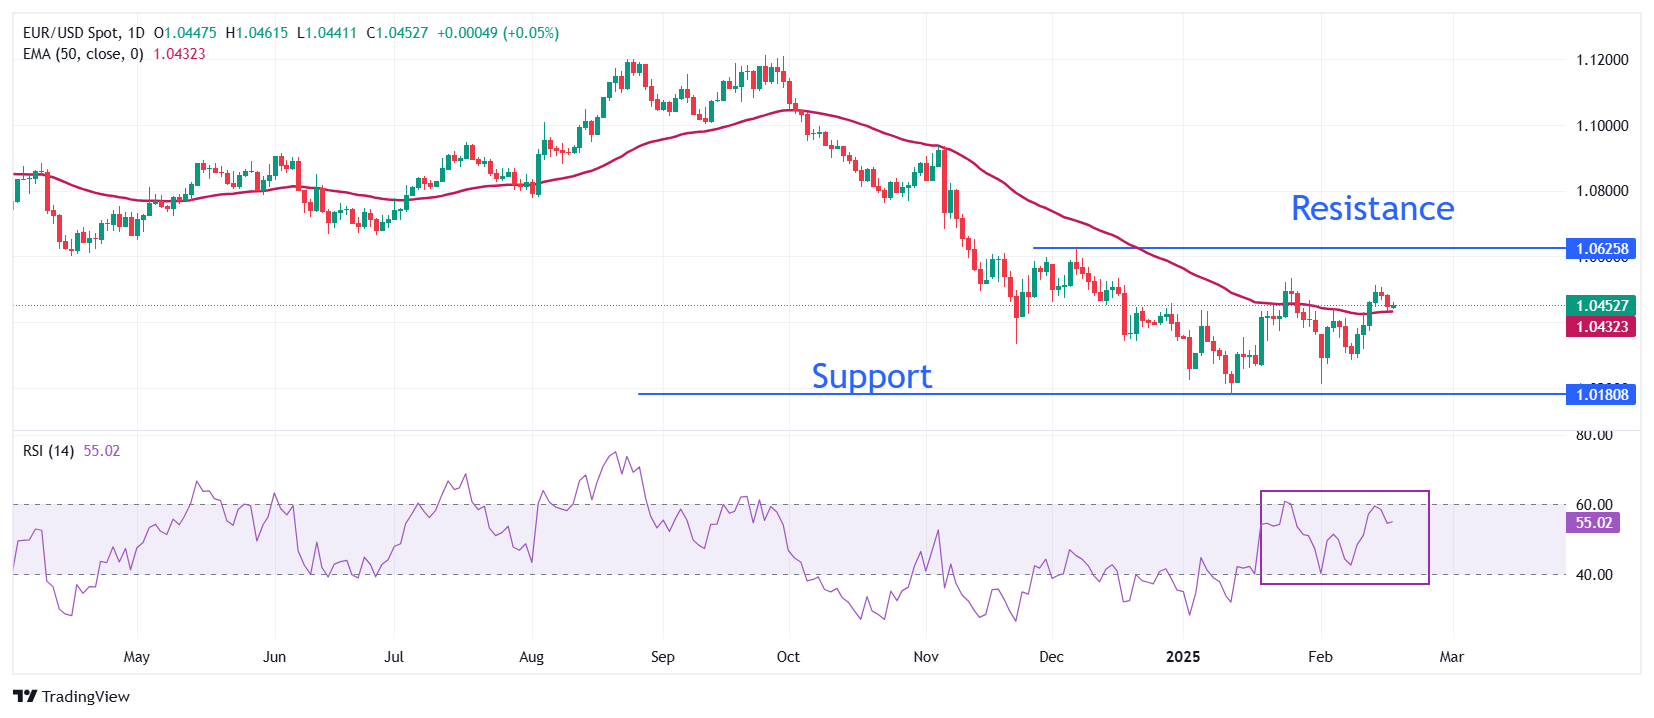
EUR/USD declines to 1.0430 on Wednesday, marking its third consecutive daily loss.
The pair has already shed more than 0.50% over the course of the week.
RSI drops to 53, signaling fading bullish momentum, while MACD histogram shows decreasing green bars.
The EUR/USD pair continued to pull back on Wednesday, shedding another 0.17% to trade around 1.0430. This marks its third straight day in the red, erasing over 0.50% of last week’s gains when the pair surged more than 1.50%. Despite the ongoing correction, the broader technical outlook remains constructive as long as the pair stays above the 20-day Simple Moving Average (SMA).
Momentum indicators reflect a shift in sentiment. The Relative Strength Index (RSI) declined sharply to 53, staying in positive territory but signaling waning buying pressure. Meanwhile, the Moving Average Convergence Divergence (MACD) histogram prints decreasing green bars, hinting that bullish momentum is losing traction. However, as long as EUR/USD remains above the 20-day SMA, buyers may still have room to regain control.
From a broader perspective, the 100-day and 20-day SMAs are converging near 1.0450, raising concerns about a potential bearish crossover. If this materializes, it could confirm that the recent rally was merely a temporary correction, shifting the long-term outlook back to the downside. For now, traders will keep an eye on whether the pair can maintain support above the 20-day SMA or if further downside pressure will trigger a deeper pullback.
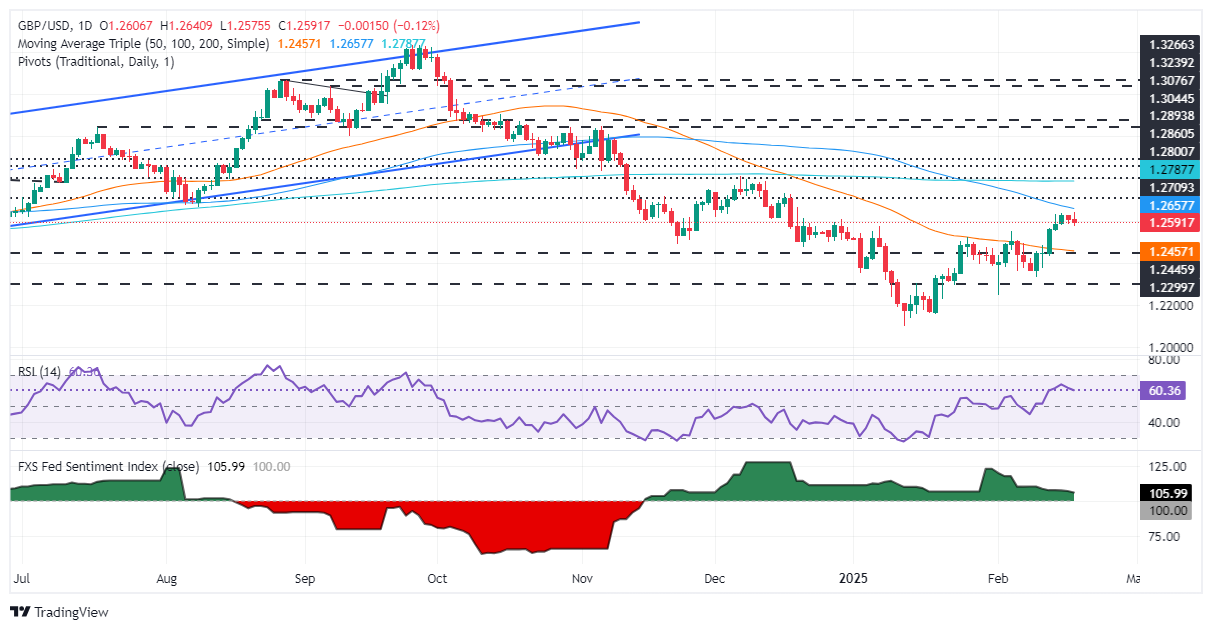
GBP/USD falls 0.21% as Trump’s tariff threats fuel safe-haven demand.
UK CPI jumps to 3%, exceeding forecasts, but BoE’s easing path remains intact.
FOMC minutes in focus as Fed signals no rush to cut rates.
The Pound Sterling retreated below 1.2600 during the North American session as housing data in the United States was mixed, while inflation in the United Kingdom hit its highest level since March 2024. Despite this, the GBP/USD trades at 1.2585, down 0.21%.
Pound weakens despite UK inflation surge, as Fed stance limits upside
Risk appetite spurred demand for haven assets like the Greenback after US President Donald Trump threatened to apply 25% tariffs on autos, pharmaceuticals, and chips. In the meantime, Housing Starts in the US tumbled in January due to weather disruptions, dropping from 1.515 million to 1.366 million, or a 9.6% plunge.
The US Census Bureau revealed that US Building Permits for the same period improved, with figures rising from 1.482 million to 1.483 million, a 0.1% increase.
Aside from this, investors await the release of the latest Federal Open Market Committee (FOMC) monetary policy meeting. In the last meeting, the Fed tweaked its language, removing the progress on inflation, emphasizing that it “remains somewhat elevated,” a slight hawkish tilt. Since then, most officials adhered to a more neutral stance saying the Central Bank is not in a rush to ease policy.
This favors further GBP/USD downside as the interest rate differential between the UK and the US reduced, as the BoE cut rates earlier this month.
Nevertheless, during the European Session, the UK's Consumer Price Index (CPI) rose by 3% in January, exceeding the economists’ forecast of a 2.8% increase. The Office for National Statistics (ONS) blamed the jump in inflation on a smaller-than-expected drop in airfares and rising petrol prices.
Given the fundamental backdrop, the GBP/USD might consolidate. The increase in wage growth figures and inflation would be challenging for the BoE, which embarked on an easing cycle. However, a minimum wage of 7% is due to start in April, and an economic slowdown paints a stagflationary scenario for the UK.
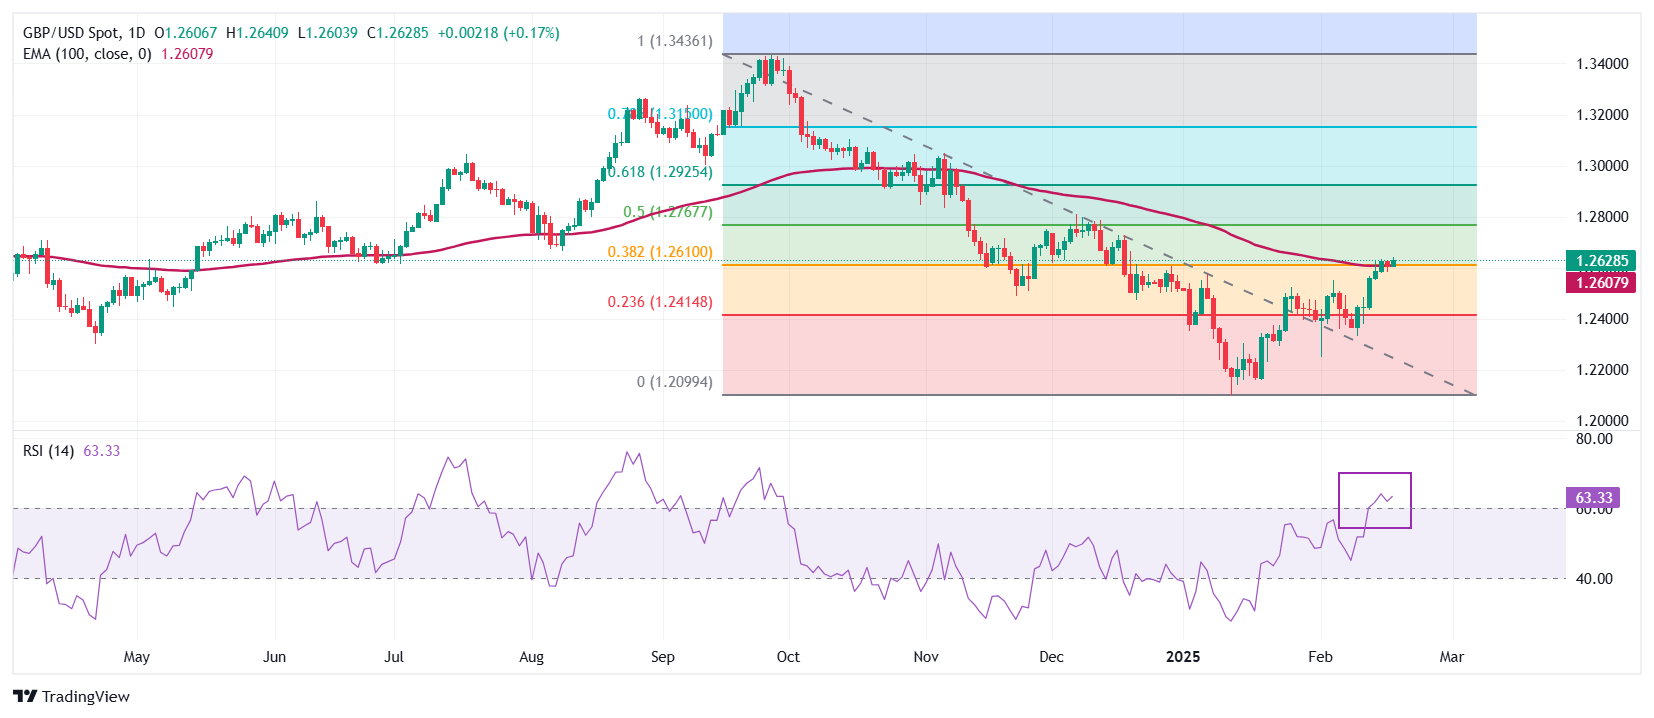
GBP/USD Price Analysis: Technical outlook
The GBP/USD dropped below 1.2600 following the release of US economic data. As risk appetite deteriorates, the Greenback climbs, and the pair hits a three-day low of 1.2578. Although the Relative Strength Index (RSI) remains bullish, buyers have lost a step, as the RSI aims lower. That said, if the pair drops below the February 5 high of 1.2549, a test of the 50-day Simple Moving Average (SMA) at 1.2463 is on the cards.
On the other hand, buyers reclaiming 1.2600 could challenge the year-to-date (YTD) peak at 1.2639.
British Pound PRICE Today
The table below shows the percentage change of British Pound (GBP) against listed major currencies today. British Pound was the strongest against the Canadian Dollar.
USD
EUR
GBP
JPY
CAD
AUD
NZD
CHF
USD
0.13%
0.12%
-0.47%
0.14%
0.07%
-0.14%
-0.07%
EUR
-0.13%
-0.01%
-0.60%
0.00%
-0.03%
-0.27%
-0.20%
GBP
-0.12%
0.00%
-0.59%
0.02%
-0.05%
-0.27%
-0.19%
JPY
0.47%
0.60%
0.59%
0.59%
0.53%
0.30%
0.39%
CAD
-0.14%
-0.01%
-0.02%
-0.59%
-0.06%
-0.28%
-0.21%
AUD
-0.07%
0.03%
0.05%
-0.53%
0.06%
-0.22%
-0.14%
NZD
0.14%
0.27%
0.27%
-0.30%
0.28%
0.22%
0.08%
CHF
0.07%
0.20%
0.19%
-0.39%
0.21%
0.14%
-0.08%
The heat map shows percentage changes of major currencies against each other. The base currency is picked from the left column, while the quote currency is picked from the top row. For example, if you pick the British Pound from the left column and move along the horizontal line to the US Dollar, the percentage change displayed in the box will represent GBP (base)/USD (quote).
NZD/USD surrenders some intraday gains but is still positive despite RBNZ’s dovish monetary policy guidance.
The RBNZ sees two more interest rate cuts in the next two meetings but at a slower pace of 25 bps.
Investors await FOMC minutes for fresh cues on the monetary policy outlook.
The NZD/USD pair gives up nominal gains after posting an intraday high around 0.5730 in North American trading hours on Wednesday. The Kiwi pair is still more than 0.1% higher after the Reserve Bank of New Zealand’s (RBNZ) monetary policy outcome.
The New Zealand Dollar (NZD) is outperforming its peers even though the RBNZ reduced its Official Cash Rate (OCR) by 50 basis points (bps) to 3.25% and guided a dovish monetary policy outlook. The central bank was already expected to continue easing the monetary policy with a bigger cut due to moderating inflationary pressures and a fragile economic outlook. The RBNZ also reduced its OCR by a larger-than-usual pace of 50 bps in the last two policy meetings.
New Zealand Dollar PRICE Today
The table below shows the percentage change of the New Zealand Dollar (NZD) against listed major currencies today. The New Zealand Dollar was the strongest against the Euro.
USD
EUR
GBP
JPY
CAD
AUD
NZD
CHF
USD
0.19%
0.18%
-0.30%
0.17%
0.11%
-0.11%
-0.03%
EUR
-0.19%
-0.01%
-0.47%
-0.02%
-0.09%
-0.29%
-0.22%
GBP
-0.18%
0.01%
-0.50%
-0.00%
-0.08%
-0.28%
-0.21%
JPY
0.30%
0.47%
0.50%
0.47%
0.40%
0.18%
0.26%
CAD
-0.17%
0.02%
0.00%
-0.47%
-0.07%
-0.28%
-0.21%
AUD
-0.11%
0.09%
0.08%
-0.40%
0.07%
-0.21%
-0.13%
NZD
0.11%
0.29%
0.28%
-0.18%
0.28%
0.21%
0.07%
CHF
0.03%
0.22%
0.21%
-0.26%
0.21%
0.13%
-0.07%
The heat map shows percentage changes of major currencies against each other. The base currency is picked from the left column, while the quote currency is picked from the top row. For example, if you pick the New Zealand Dollar from the left column and move along the horizontal line to the US Dollar, the percentage change displayed in the box will represent NZD (base)/USD (quote).
RBNZ Governor Adrian Orr said that the board is seeing a lower terminal rate than what it had projected in November. Orr guided two more 25 bps interest rate cuts in the April and May policy meetings.
Meanwhile, the US Dollar (USD) trades higher ahead of the Federal Open Market Committee (FOMC) minutes release for the January meeting, which will be published at 19:00 GMT. The US Dollar Index (DXY), which tracks the Greenback’s value against six major currencies, moves higher to near 107.15.
The New Zealand Dollar (NZD), also known as the Kiwi, is a well-known traded currency among investors. Its value is broadly determined by the health of the New Zealand economy and the country’s central bank policy. Still, there are some unique particularities that also can make NZD move. The performance of the Chinese economy tends to move the Kiwi because China is New Zealand’s biggest trading partner. Bad news for the Chinese economy likely means less New Zealand exports to the country, hitting the economy and thus its currency. Another factor moving NZD is dairy prices as the dairy industry is New Zealand’s main export. High dairy prices boost export income, contributing positively to the economy and thus to the NZD.
The Reserve Bank of New Zealand (RBNZ) aims to achieve and maintain an inflation rate between 1% and 3% over the medium term, with a focus to keep it near the 2% mid-point. To this end, the bank sets an appropriate level of interest rates. When inflation is too high, the RBNZ will increase interest rates to cool the economy, but the move will also make bond yields higher, increasing investors’ appeal to invest in the country and thus boosting NZD. On the contrary, lower interest rates tend to weaken NZD. The so-called rate differential, or how rates in New Zealand are or are expected to be compared to the ones set by the US Federal Reserve, can also play a key role in moving the NZD/USD pair.
Macroeconomic data releases in New Zealand are key to assess the state of the economy and can impact the New Zealand Dollar’s (NZD) valuation. A strong economy, based on high economic growth, low unemployment and high confidence is good for NZD. High economic growth attracts foreign investment and may encourage the Reserve Bank of New Zealand to increase interest rates, if this economic strength comes together with elevated inflation. Conversely, if economic data is weak, NZD is likely to depreciate.
The New Zealand Dollar (NZD) tends to strengthen during risk-on periods, or when investors perceive that broader market risks are low and are optimistic about growth. This tends to lead to a more favorable outlook for commodities and so-called ‘commodity currencies’ such as the Kiwi. Conversely, NZD tends to weaken at times of market turbulence or economic uncertainty as investors tend to sell higher-risk assets and flee to the more-stable safe havens.
The Minutes of the Fed’s January 28-29 policy meeting will be published on Wednesday.
Details surrounding the discussions on the decision to keep policy settings unchanged will be scrutinized by investors.
Markets see virtually no chance of a 25 bps Fed rate cut in March.
The Minutes of the United States (US) Federal Reserve’s (Fed) January 28-29 monetary policy meeting will be published on Wednesday at 19:00 GMT. Policymakers decided to maintain the policy rate at the range of 4.25%-4.5% at the first meeting of 2025. However, the central bank removed earlier language suggesting inflation had "made progress" toward its 2% target, instead stating that the pace of price increases "remains elevated."
Jerome Powell and co decided to hold policy settings unchanged after January meeting
The Federal Open Market Committee (FOMC) voted unanimously to keep the policy rate unchanged. The statement showed that officials expressed confidence that progress in reducing inflation will likely resume later this year but emphasized the need to pause and await further data to confirm this outlook.
In the post-meeting press conference, Fed Chairman Jerome Powell reiterated that they don’t need to be in a hurry to make any adjustments to the policy.
Commenting on the policy outlook earlier in the week, Philadelphia Fed President Patrick Harker said that the current economy argues for a steady policy for now. Similarly, Atlanta Fed President Raphael Bostic noted that the need for patience suggests that the next rate cut could happen later to give more time for information.
Economic Indicator
FOMC Minutes
FOMC stands for The Federal Open Market Committee that organizes 8 meetings in a year and reviews economic and financial conditions, determines the appropriate stance of monetary policy and assesses the risks to its long-run goals of price stability and sustainable economic growth. FOMC Minutes are released by the Board of Governors of the Federal Reserve and are a clear guide to the future US interest rate policy.
Minutes of the Federal Open Market Committee (FOMC) is usually published three weeks after the day of the policy decision. Investors look for clues regarding the policy outlook in this publication alongside the vote split. A bullish tone is likely to provide a boost to the greenback while a dovish stance is seen as USD-negative. It needs to be noted that the market reaction to FOMC Minutes could be delayed as news outlets don’t have access to the publication before the release, unlike the FOMC’s Policy Statement.
When will FOMC Minutes be released and how could it affect the US Dollar?
The FOMC will release the minutes of the January 28-29 policy meeting at 19:00 GMT on Wednesday. Investors will scrutinize the discussions surrounding the policy outlook.
In case the publication shows that policymakers are willing to wait until the second half of the year before reconsidering rate cuts, the immediate reaction could help the US Dollar (USD) gather strength against its rivals. On the other hand, the market reaction could remain subdued and short-lived if the document repeats that officials will adopt a patient approach to further policy easing without providing any fresh clues on the timing.
According to the CME FedWatch Tool, markets currently see virtually no chance of a 25 basis point rate cut in March. Moreover, they price in a more than 80% probability of another policy hold in May. Hence, the market positioning suggests that the publication would need to offer very clearly hawkish language to provide a steady boost to the USD.
Eren Sengezer, European Session Lead Analyst at FXStreet, shares a brief outlook for the USD Index:
“The Relative Strength Index (RSI) indicator on the daily chart stays well below 50 and the index remains below the 20-day Simple Moving Average (SMA), highlighting a bearish bias in the short term.”
“On the downside, 106.30-106.00 aligns as a key support area, where the 100-day SMA and the Fibonacci 38.2% retracement of the October 2024 - January 2025 uptrend are located. If this support area fails, 105.00-104.90 (200-day SMA, Fibonacci 50% retracement) could be set as the next bearish target. Looking north, resistances could be spotted at 107.50-107.70 (20-day SMA, Fibonacci 23.6% retracement), 108.00 (50-day SMA) and 109.00 (round level).”
Fed FAQs
Monetary policy in the US is shaped by the Federal Reserve (Fed). The Fed has two mandates: to achieve price stability and foster full employment. Its primary tool to achieve these goals is by adjusting interest rates. When prices are rising too quickly and inflation is above the Fed’s 2% target, it raises interest rates, increasing borrowing costs throughout the economy. This results in a stronger US Dollar (USD) as it makes the US a more attractive place for international investors to park their money. When inflation falls below 2% or the Unemployment Rate is too high, the Fed may lower interest rates to encourage borrowing, which weighs on the Greenback.
The Federal Reserve (Fed) holds eight policy meetings a year, where the Federal Open Market Committee (FOMC) assesses economic conditions and makes monetary policy decisions. The FOMC is attended by twelve Fed officials – the seven members of the Board of Governors, the president of the Federal Reserve Bank of New York, and four of the remaining eleven regional Reserve Bank presidents, who serve one-year terms on a rotating basis.
In extreme situations, the Federal Reserve may resort to a policy named Quantitative Easing (QE). QE is the process by which the Fed substantially increases the flow of credit in a stuck financial system. It is a non-standard policy measure used during crises or when inflation is extremely low. It was the Fed’s weapon of choice during the Great Financial Crisis in 2008. It involves the Fed printing more Dollars and using them to buy high grade bonds from financial institutions. QE usually weakens the US Dollar.
Quantitative tightening (QT) is the reverse process of QE, whereby the Federal Reserve stops buying bonds from financial institutions and does not reinvest the principal from the bonds it holds maturing, to purchase new bonds. It is usually positive for the value of the US Dollar.
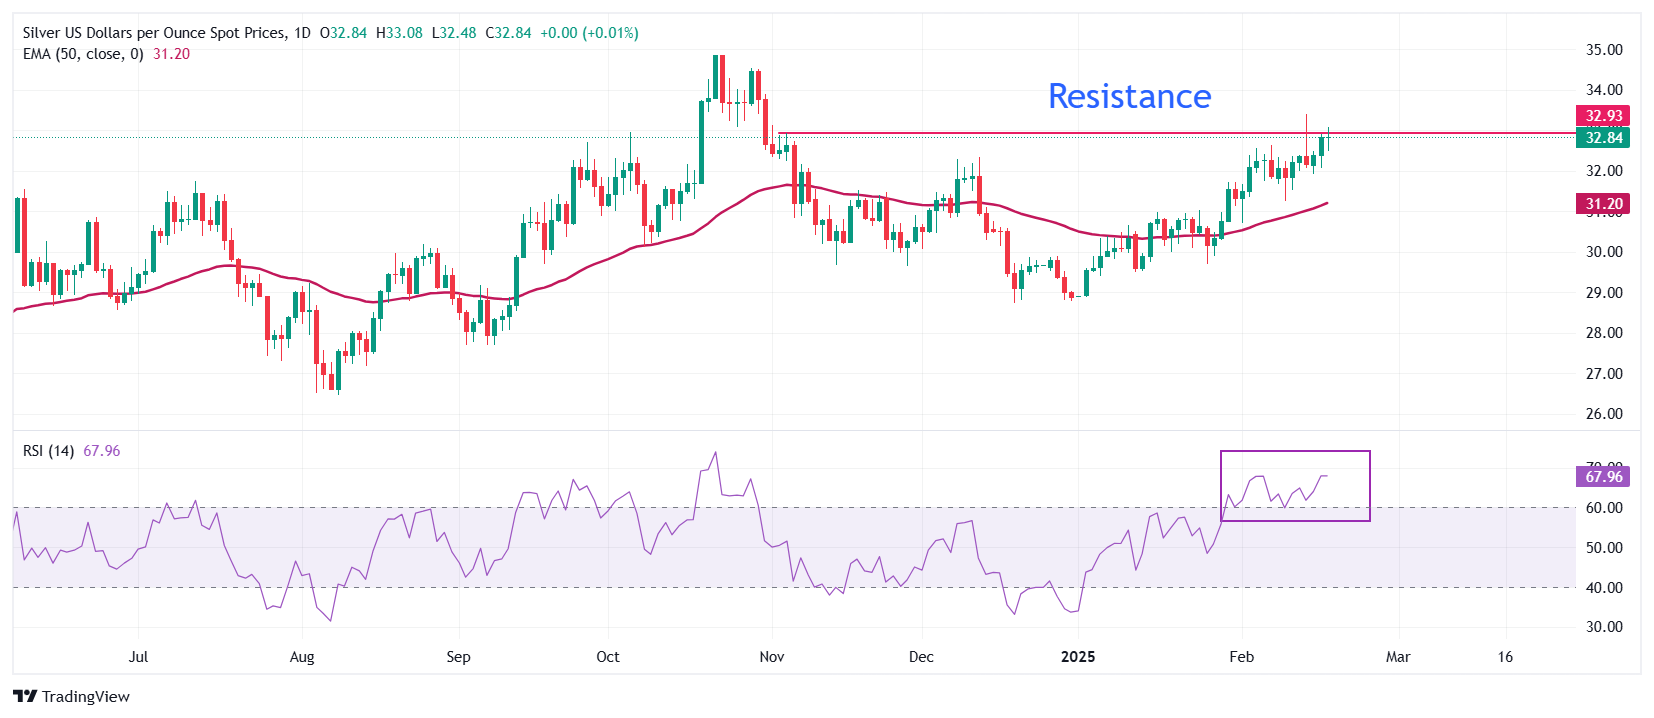
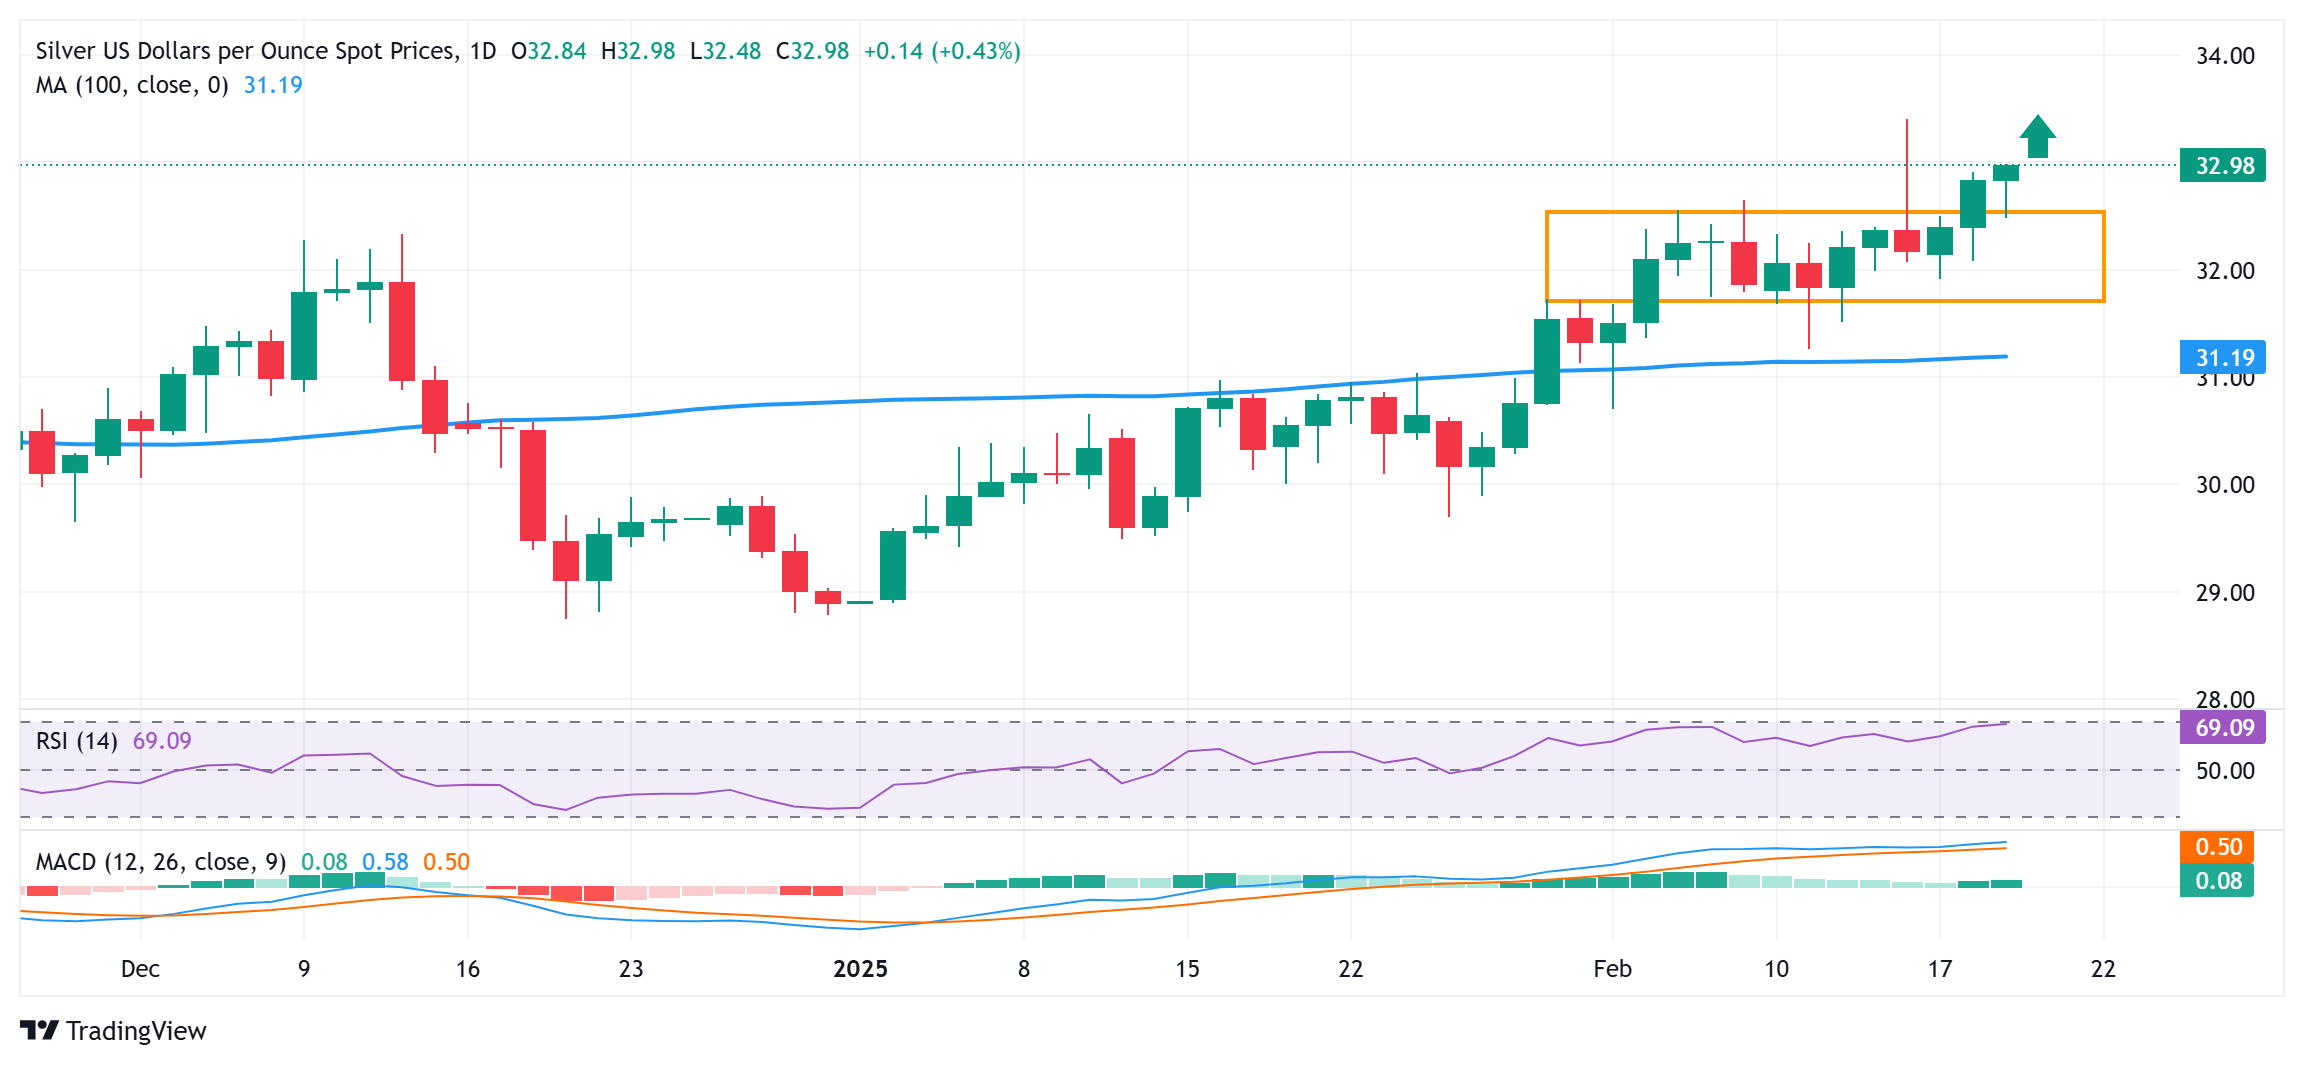
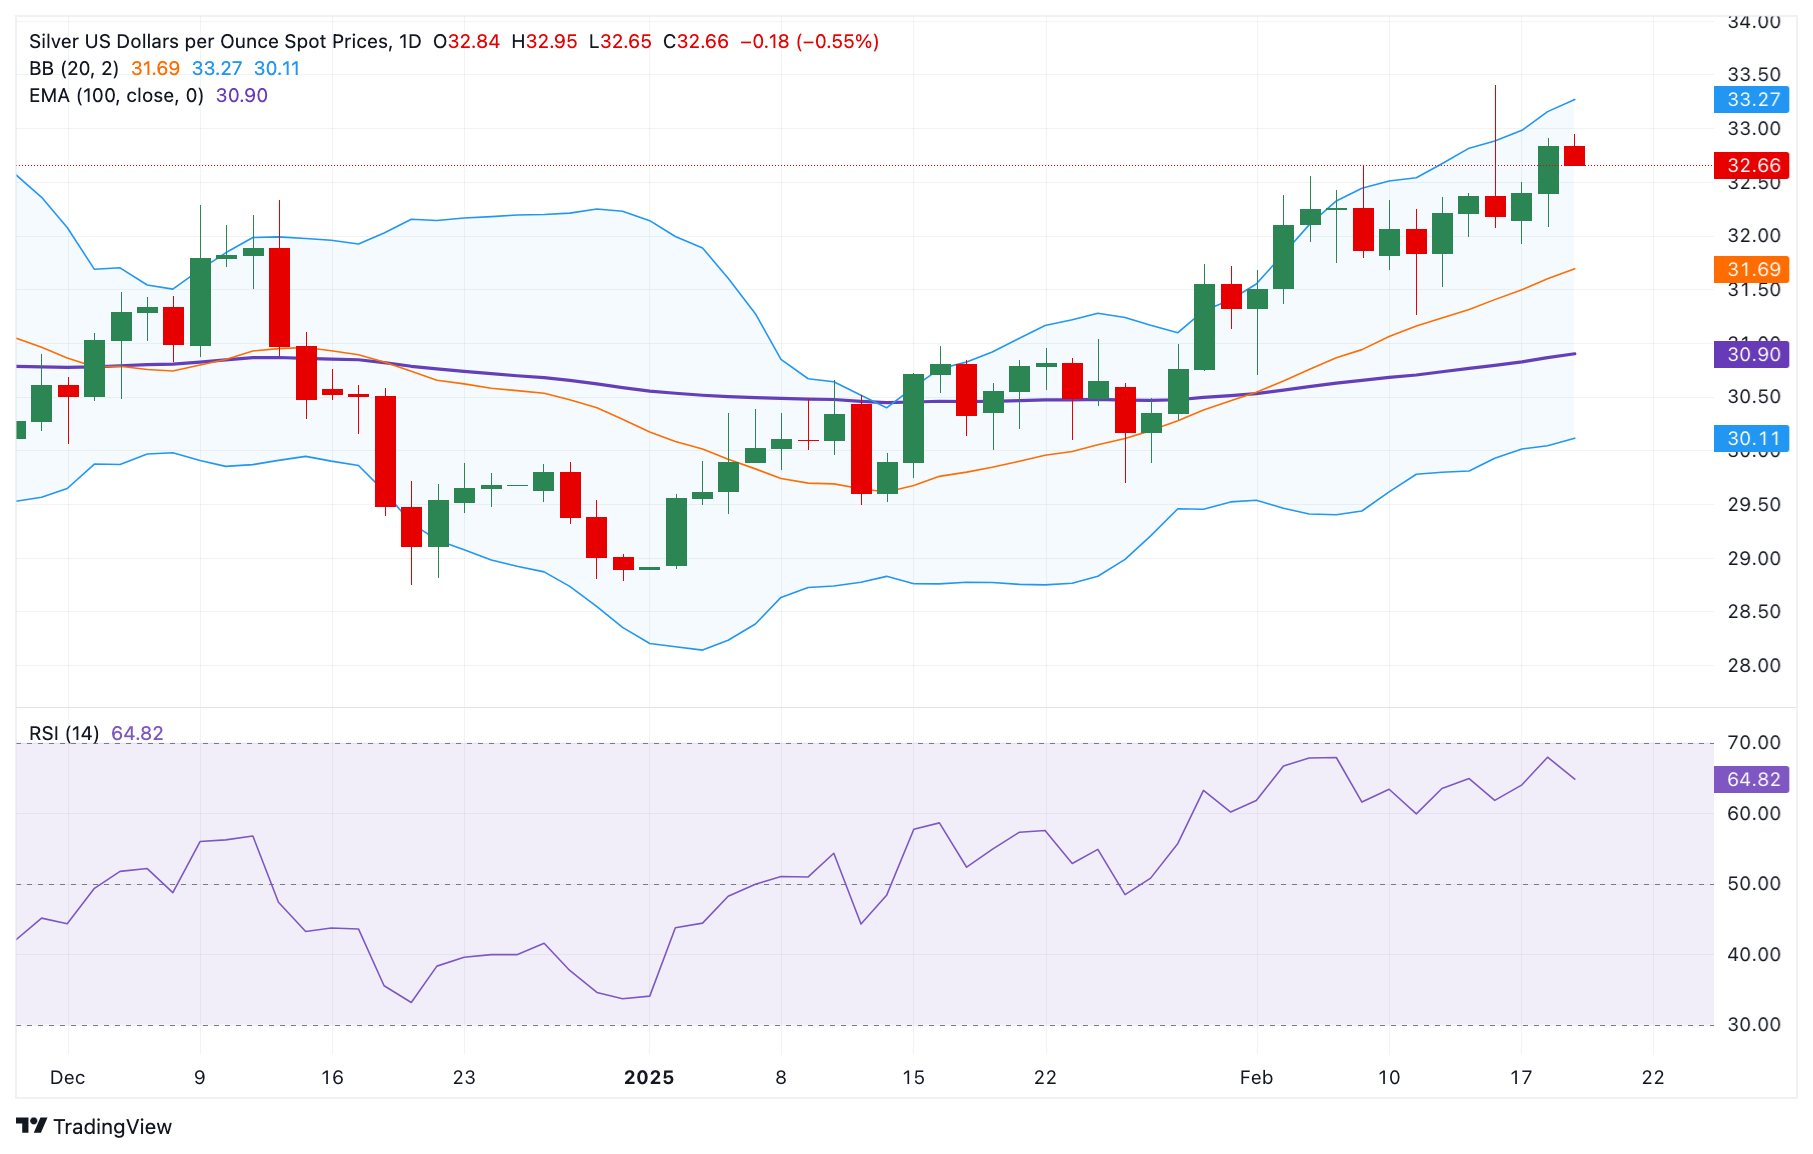
Silver price bounces back from the intraday low of $32.50 as market sentiment is slightly cautious on Trump’s tariff threats.
US Trump confirms more Russia-Ukraine peace talks.
Investors await FOMC minutes for fresh guidance on the monetary policy outlook.
Silver price (XAG/USD) recovers its intraday losses and turns flat around $33.00 in North American trading hours on Wednesday. The white metal bounces back as its safe-haven appeal remains firm amid fears of a global economic slowdown from potential tariffs by United States (US) President Donald Trump.
President Trump threatened to impose 25% tariffs on automobiles, pharmaceuticals and semiconductors and that tariffs could increase substantially next year. Trump added that some tariffs could enacted by April, the same timeframe in which he has planned to unveil the reciprocal tariff plan too.
While Silver’s safe-haven demand has remained firm due to Trump’s tariff threats, its upside could remain capped due to optimism over the Russia-Ukraine truce. Trump said on Tuesday that he discussed with Russia in Riyadh about ending the war in Ukraine and confirmed to have more talks along with leaders from Ukraine and Europe. More positive developments in Russia-Ukraine peace talks would ease the safe-haven premium of the Silver price.
Meanwhile, the US Dollar (USD) trades higher ahead of the release of the Federal Open Market Committee (FOMC) minutes of the January policy meeting, which will be published at 19:00 GMT. Signs of the Federal Reserve (Fed) holding interest rates at their current levels for longer would strengthen the US Dollar. Such a scenario bodes poorly for the Silver price.
Silver technical analysis
Silver price struggles to break above the key resistance of $32.98, which is plotted from the November 5 high. The outlook of the white metal is bullish as the 50-day Exponential Moving Average (EMA) has been sloping higher, which trades around $31.20.
The 14-day Relative Strength Index (RSI) oscillates in the 60.00-80.00 range, suggesting that the momentum is strongly bullish.
Looking down, the February 11 low of $31.26 will be the key support for the Silver price. While, the October 31 high of $33.90 will be the key barrier.
Silver daily chart
Silver FAQs
Silver is a precious metal highly traded among investors. It has been historically used as a store of value and a medium of exchange. Although less popular than Gold, traders may turn to Silver to diversify their investment portfolio, for its intrinsic value or as a potential hedge during high-inflation periods. Investors can buy physical Silver, in coins or in bars, or trade it through vehicles such as Exchange Traded Funds, which track its price on international markets.
Silver prices can move due to a wide range of factors. Geopolitical instability or fears of a deep recession can make Silver price escalate due to its safe-haven status, although to a lesser extent than Gold's. As a yieldless asset, Silver tends to rise with lower interest rates. Its moves also depend on how the US Dollar (USD) behaves as the asset is priced in dollars (XAG/USD). A strong Dollar tends to keep the price of Silver at bay, whereas a weaker Dollar is likely to propel prices up. Other factors such as investment demand, mining supply – Silver is much more abundant than Gold – and recycling rates can also affect prices.
Silver is widely used in industry, particularly in sectors such as electronics or solar energy, as it has one of the highest electric conductivity of all metals – more than Copper and Gold. A surge in demand can increase prices, while a decline tends to lower them. Dynamics in the US, Chinese and Indian economies can also contribute to price swings: for the US and particularly China, their big industrial sectors use Silver in various processes; in India, consumers’ demand for the precious metal for jewellery also plays a key role in setting prices.
Silver prices tend to follow Gold's moves. When Gold prices rise, Silver typically follows suit, as their status as safe-haven assets is similar. The Gold/Silver ratio, which shows the number of ounces of Silver needed to equal the value of one ounce of Gold, may help to determine the relative valuation between both metals. Some investors may consider a high ratio as an indicator that Silver is undervalued, or Gold is overvalued. On the contrary, a low ratio might suggest that Gold is undervalued relative to Silver.
14:05
United States Redbook Index (YoY) rose from previous 5.3% to 6.3% in February 14
13:30
United States Building Permits (MoM) above forecasts (1.46M) in January: Actual (1.483M)
13:30
United States Housing Starts Change fell from previous 15.8% to -9.8% in January
13:30
United States Housing Starts (MoM) below expectations (1.4M) in January: Actual (1.366M)
13:30
United States Building Permits Change: 0.1% (January) vs -0.7%
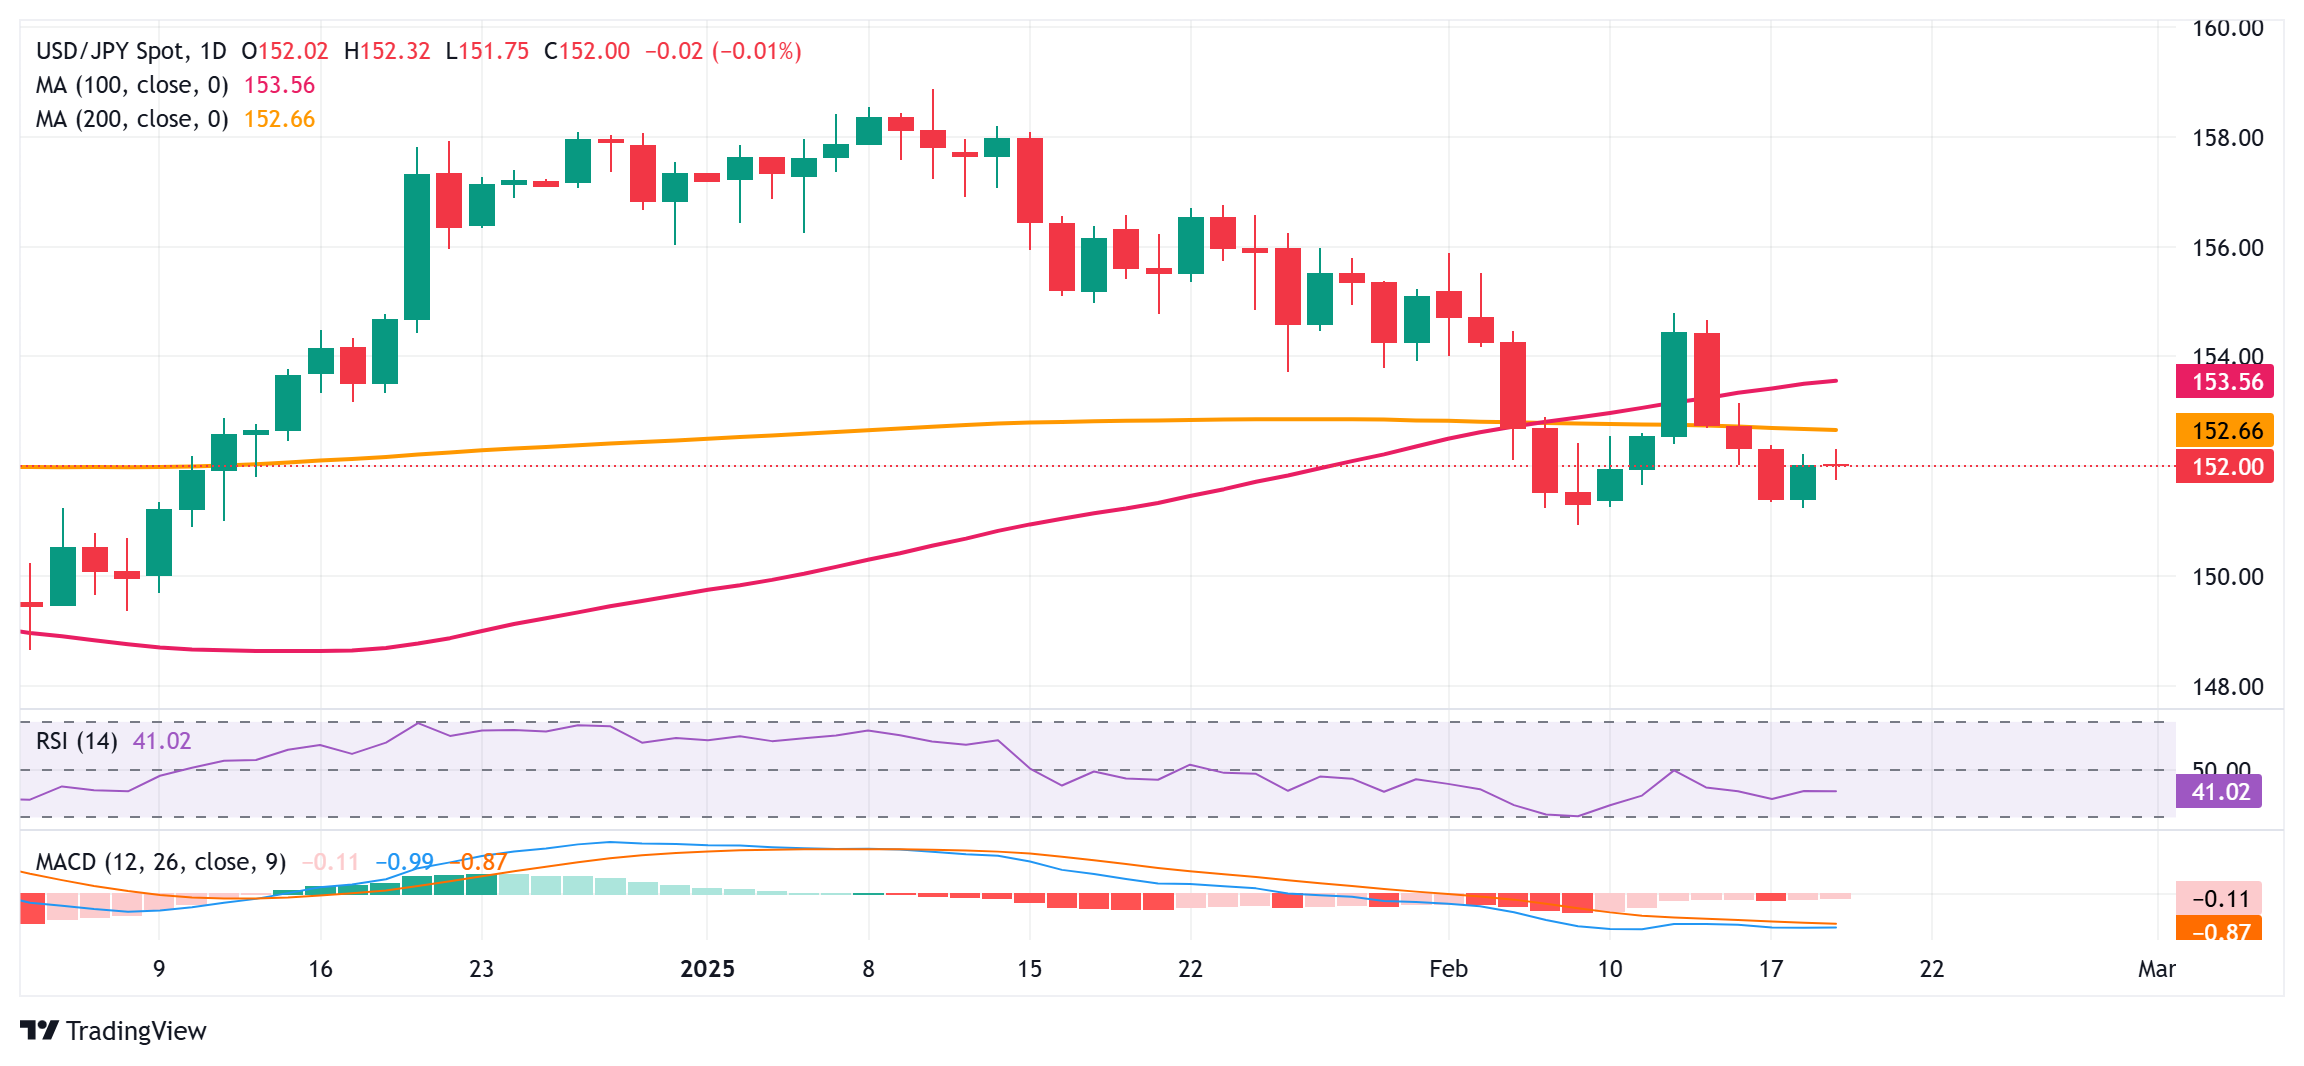
USD/JPY falls slightly even though the US Dollar trades higher, which indicates strength in the Japanese Yen (JPY).
President Trump threatens to impose 25% tariffs on automobiles, semiconductors and pharmaceuticals.
Investors await the FOMC minutes and Japan’s National CPI data for January.
The USD/JPY pair edges lower to near 151.90 in Wednesday’s North American session. The asset ticks lower even though the US Dollar (USD) trades higher, with the US Dollar Index (DXY) rising to near 107.20.
The Greenback gains as the market sentiment has turned slightly cautious due to tariff threats from United States (US) President Donald Trump. On Tuesday, Donald Trump threatened to impose 25% tariffs on imports of foreign cars, pharmaceuticals, and semiconductors. Trump didn’t provide any timeframe with intensions to allow local manufacturers to increase operating capacity.
Market participants expect Germany, Japan, South Korea, Taiwan, and India would be major casualties of Trump’s latest tariff threat.
Meanwhile, investors await Federal Open Market Committee (FOMC) minutes for the January meeting, which will be published at 19:00 GMT. In the January meeting, the Fed announced a pause in its monetary expansion cycle after cutting interest rates by 100 basis points (bps) in the last three meetings of 2024. Fed Chair Jerome Powell guided that monetary policy adjustments would become appropriate on when officials will see “real progress in inflation or at least some weakness in the labor market”.
On the Japan front, market participants will focus on the National Consumer Price Index (CPI) data for January, which will be released on Thursday. Economists expect the National CPU ex. Fresh Food to have accelerated to 3.1% from 3% in December. Hot inflation data would boost market expectations that the Bank of Japan (BoJ) will raise interest rates again this year.
Japanese Yen FAQs
The Japanese Yen (JPY) is one of the world’s most traded currencies. Its value is broadly determined by the performance of the Japanese economy, but more specifically by the Bank of Japan’s policy, the differential between Japanese and US bond yields, or risk sentiment among traders, among other factors.
One of the Bank of Japan’s mandates is currency control, so its moves are key for the Yen. The BoJ has directly intervened in currency markets sometimes, generally to lower the value of the Yen, although it refrains from doing it often due to political concerns of its main trading partners. The BoJ ultra-loose monetary policy between 2013 and 2024 caused the Yen to depreciate against its main currency peers due to an increasing policy divergence between the Bank of Japan and other main central banks. More recently, the gradually unwinding of this ultra-loose policy has given some support to the Yen.
Over the last decade, the BoJ’s stance of sticking to ultra-loose monetary policy has led to a widening policy divergence with other central banks, particularly with the US Federal Reserve. This supported a widening of the differential between the 10-year US and Japanese bonds, which favored the US Dollar against the Japanese Yen. The BoJ decision in 2024 to gradually abandon the ultra-loose policy, coupled with interest-rate cuts in other major central banks, is narrowing this differential.
The Japanese Yen is often seen as a safe-haven investment. This means that in times of market stress, investors are more likely to put their money in the Japanese currency due to its supposed reliability and stability. Turbulent times are likely to strengthen the Yen’s value against other currencies seen as more risky to invest in.
The Pound Sterling (GBP) is still struggling to make and hold ground through the low 1.26 area against the US Dollar (USD) following the UK inflation data earlier, Scotiabank's Chief FX Strategist Shaun Osborne notes.
More GBP losses ahead
"Headline inflation fell less than expected (- 0.1%) in January, pushing the Y/Y pace of price growth up to 3.0% (versus 2.8% expected and 2.5% in December). Services prices also picked up—to 5.0% Y/Y—but came in below forecasts (5.1%), a minor positive in the data. The report underscores the cautious approach to policy adjustment that BoE Governor Bailey has stressed recently."
"GBP made a little more progress through retracement resistance at 1.2610 earlier but spot’s inability to hold gains (and new cycle highs in particular) leave it looking prone to more softness. Support is 1.2580 and a daily close at or below here will point to more GBP losses ahead."
The Euro (EUR) softened through Asian and European trade following Trump’s auto tariff comments, Scotiabank's Chief FX Strategist Shaun Osborne notes.
Euro may extend losses to the upper 1.03s
"European auto stocks are down in response. Investors are also eying Sunday’s German federal election which is expected to deliver a win for the centerright CDU—but may also reflect a jump in support for the far right AfD."
"Spot losses through European trade are steadying in the low 1.04 area. The main feature of the short-term chart remains the EUR’s failure to extend through the low 1.05 zone last week after pushing higher from 1.03. After falling through support at 1.0440/50, losses may extend to the upper 1.03s. Support is 1.0375/80."
The Canadian Dollar (CAD) is little changed on the session as spot continues to pivot around 1.42 against the US Dollar (USD), Scotiabank's Chief FX Strategist Shaun Osborne notes.
CAD little changed on the day
"President Trump’s auto tariff threat has not fazed the CAD to any significant degree—it was not clear from his comments whether specific countries would be targeted or whether it would apply to all auto imports. Just add it to the list of other, overlapping threats that the president has leveled at Canada recently which may or may not eventually be imposed."
"The minor rebound in the USD from yesterday’s session low leaves spot trading close to our fair value estimate (1.4238) this morning. More range trading around the 1.42 point is likely, I think, for now while investors await developments. There are no Canadian data reports today."
"Spot gains through European trade may nudge risks towards a little more USD strength in the short run but the short-term pattern of trade looks pretty flat. Short-term oscillators remain bearish (for the USD) so scope for gains is likely limited to the 1.4260/80 area for now. Support is 1.4175/80."
The US Dollar (USD) continues to grind higher in relatively quiet trade. President Trump’s suggestion that he will probably introduce auto tariffs 'in the neighbourhood' of 25% (and similar for pharma and chip imports) on April 2 has weighed on global stock sentiment while also depressing fixed income, Scotiabank's Chief FX Strategist Shaun Osborne notes.
USD firmer as Trump revisits auto tariff threat
"US yields have firmed marginally but Treasurys are outperforming European debt where the major markets reflect a 3-5bps rise in 10Y yields. FX is relatively tranquil, however. The USD is firmer but not universally so and ranges are relatively tight. The NZD is outperforming after the RBNZ cut rates 50bps again—in line with expectations—but signaled the pace of rate cuts may slow. The AUD is finding a small bid on the Kiwi’s coattails; Australia reports employment data tonight."
"The JPY is moderately firmer after BoJ hawk Takata said the central bank should consider gradual policy tightening to contain inflation risks. June BoJ swaps are pricing in 15-16bps of tightening risk. The EUR is the main underachiever on the session, easing back to the low 1.04 area, with the GBP not too far behind after mixed UK inflation data. It’s another day of limited data releases—just Housing Starts and Building Permits from the US this morning. The Fed releases the minutes of the January policy meeting at 14ET."
"Its tone will likely underscore the pause in policy adjustment until members have more confidence in the inflation outlook. Jefferson, an FOMC voter, speaks at 17ET. The Mexican central bank releases its inflation report at 13.30ET. Moderate gains for the USD so far today suggest the rebound can extend a little more—but perhaps not too much—as markets await clarity on tariffs. The DXY continues to—roughly—track its evolution in the early days of the first Trump administration. If that is any guide, the DXY may edge back to the low/mid 108s over the next few weeks."
The US Dollar edges slightly higher on Wednesday, not making any big moves.
US President Donald Trump adds pharmaceuticals and semiconductors into the tariff family.
The US Dollar Index (DXY) recovers above 107.00 and is still looking for direction this week.
The US Dollar Index (DXY), which tracks the performance of the US Dollar (USD) against six major currencies, edges slightly higher on Wednesday and recovers above the 107.00 level on Wednesday, with traders seeing the DXY well positioned amidst all tariff and geopolitical headlines. Overnight, United States (US) President Donald Trump said that car tariffs will be around 25%, and that pharmaceutical and semiconductor imports will be added to the same scheme by April. President Trump tried to deflect the rather unsuccessful first day of negotiations between Russia and the US officials on a peace deal on Ukraine, lashing out at the latter and retaining that it is Ukraine’s fault a deal has not been made and probably will be difficult to make.
Regarding the economic calendar, all eyes shift to the Federal Open Market Committee (FOMC) Minutes from the Federal Reserve’s (Fed) January policy meeting. The Minutes could provide some support for the US Dollar, which has been softening due to weaker US Yields. A rather hawkish Minutes could jack up US rates again, phase out chances or odds on interest rate cuts for 2025, and see a stronger Greenback as the end result.
Daily digest market movers: Minutes matter
Weekly Mortgate Applications already fell substantially for this week, dropping 6.6% against last week's performance.
Before facing the Fed’s latest FOMC Minutes, the focus will first shift to the US housing market at 13:30 GMT.
January Building Permits are expected to slide to 1.460 million from 1.482 million in December.
Housing Starts in January are expected to slow down to 1.4 million, coming from 1.499 million.
At 19:00 GMT, the Federal Reserve will release its January notes from its monetary policy. Any hawkish tilts or undertones could be enough to push back current rate cut expectations for 2025 and could mean a stronger US Dollar in the outcome.
Equities are flat, with minor gains or losses across the board. The Shanghai Shenzhen Index is an outlier, closing 0.7% higher despite President Trump’s broadening of tariffs to include drugs and chips.
The CME FedWatch tool shows a 53.5% chance that interest rates will remain unchanged at current levels in June.
The US 10-year yield is trading around 4.56%, the highest level for this week.
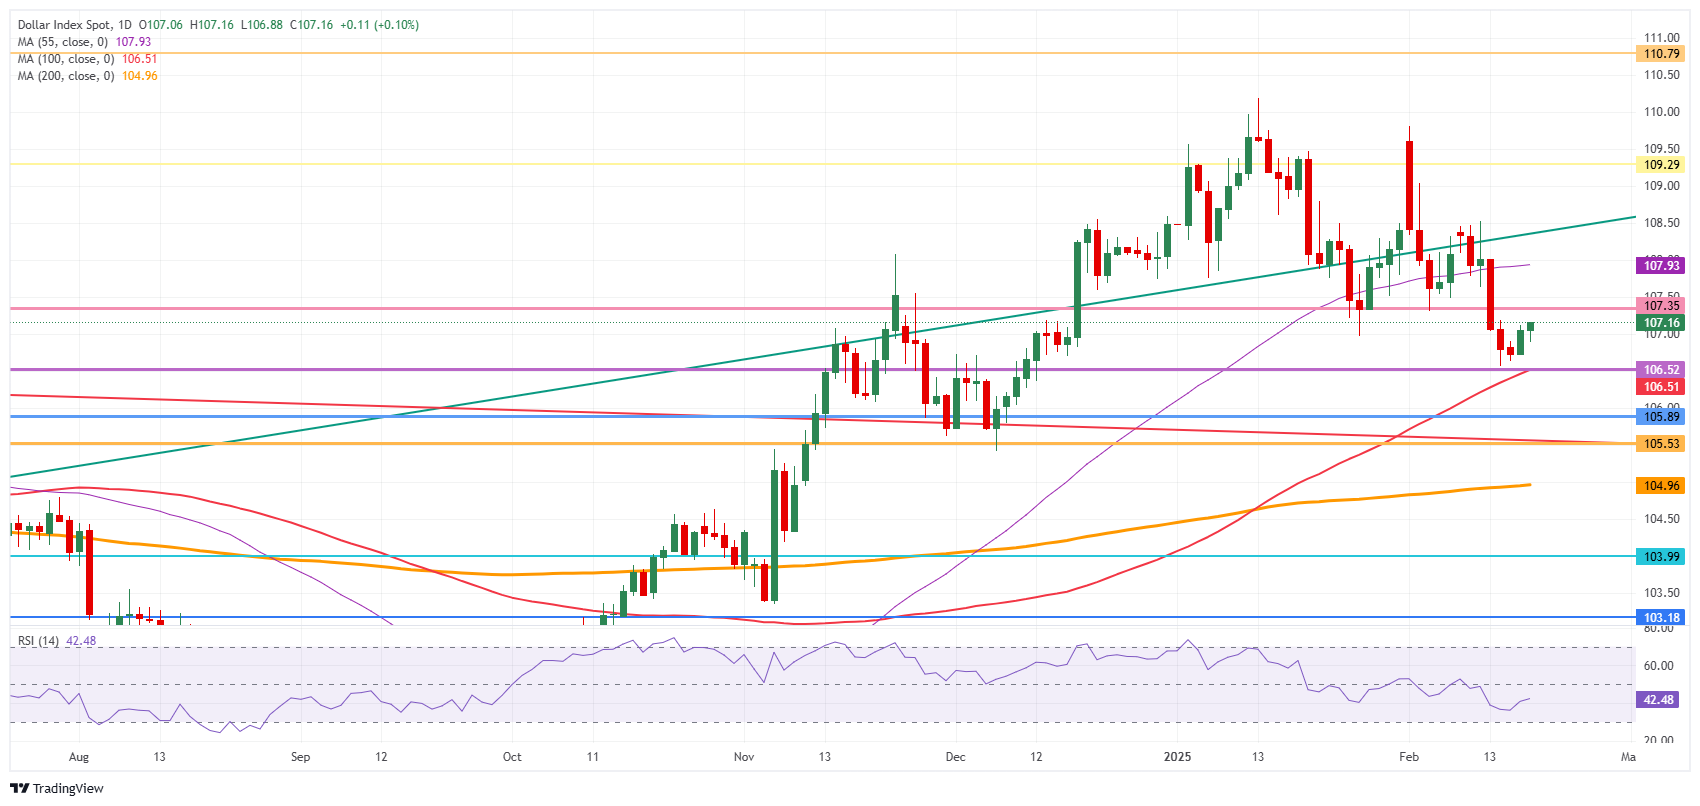
US Dollar Index Technical Analysis: Greenback just does not care
The US Dollar Index (DXY) is barely moving on the recent broadening of US President Donald Trump’s tariffs. The Greenback nearly did not move on the back of it and only started to tick up a little bit on Tuesday when the conclusion came that the first day of talks between Russia and the US officials did not really have any result. With the Fed releasing its January Minutes on Wednesday, maybe that can get the DXY moving in any direction.
On the upside, the previous support at 107.35 has now turned into a firm resistance. Further up, the 55-day SMA at 107.93 must be regained before reclaiming 108.00.
On the downside, look for 106.52 (April 16, 2024, high), 106.51 (100-day SMA), or even 105.89 (resistance in June 2024) as support levels. As the Relative Strength Index (RSI) momentum indicator in the daily chart shows room for more downside, the 200-day SMA at 104.96 could be a possible outcome.
The US Dollar (USD) is the official currency of the United States of America, and the ‘de facto’ currency of a significant number of other countries where it is found in circulation alongside local notes. It is the most heavily traded currency in the world, accounting for over 88% of all global foreign exchange turnover, or an average of $6.6 trillion in transactions per day, according to data from 2022. Following the second world war, the USD took over from the British Pound as the world’s reserve currency. For most of its history, the US Dollar was backed by Gold, until the Bretton Woods Agreement in 1971 when the Gold Standard went away.
The most important single factor impacting on the value of the US Dollar is monetary policy, which is shaped by the Federal Reserve (Fed). The Fed has two mandates: to achieve price stability (control inflation) and foster full employment. Its primary tool to achieve these two goals is by adjusting interest rates. When prices are rising too quickly and inflation is above the Fed’s 2% target, the Fed will raise rates, which helps the USD value. When inflation falls below 2% or the Unemployment Rate is too high, the Fed may lower interest rates, which weighs on the Greenback.
In extreme situations, the Federal Reserve can also print more Dollars and enact quantitative easing (QE). QE is the process by which the Fed substantially increases the flow of credit in a stuck financial system. It is a non-standard policy measure used when credit has dried up because banks will not lend to each other (out of the fear of counterparty default). It is a last resort when simply lowering interest rates is unlikely to achieve the necessary result. It was the Fed’s weapon of choice to combat the credit crunch that occurred during the Great Financial Crisis in 2008. It involves the Fed printing more Dollars and using them to buy US government bonds predominantly from financial institutions. QE usually leads to a weaker US Dollar.
Quantitative tightening (QT) is the reverse process whereby the Federal Reserve stops buying bonds from financial institutions and does not reinvest the principal from the bonds it holds maturing in new purchases. It is usually positive for the US Dollar.
12:00
United States MBA Mortgage Applications dipped from previous 2.3% to -6.6% in February 14
RBNZ cuts OCR to 3.75%, signalling more front-loaded easing. We see 50bps of cuts in Q2 (25bps prior), 25bps in Q3 (unchanged), and a pause in Q4 (25bps cut prior). Output gap deteriorates sharply, reinforcing the case for further easing in 2025. NZD reaction muted, with markets largely pricing in the move, Standard Chartered's analysts Bader Al Sarraf and Nicholas Chia note.
‘Orr’chestrated easing
"The Reserve Bank of New Zealand (RBNZ) delivered a widely anticipated 50bps cut, bringing the Official Cash Rate (OCR) down to 3.75%, in line with our expectation and the RBNZ’s prior forward guidance. However, the notable dovish shift came from the updated OCR track, which now suggests a faster path towards mid-neutral (3%) by year-end, at 3.1%, compared to the previous projection of 3.6% in November. The revised track signals another 50bps of cuts in Q2 (likely split as 25bps in both April and May), followed by a 25bps cut in Q3 and a potential pause in Q4."
"Inflation projections reflect diverging trends between tradables and non-tradables. The RBNZ revised tradables inflation higher, citing NZD depreciation, rising oil prices and trade uncertainty, while non-tradables inflation is expected to ease further due to soft domestic demand and a cooling labour market. Growth forecasts remain weak, with the output gap widening further into negative territory. We believe the market reaction was measured, as front-loaded easing was already priced in."
"While we maintain our terminal rate forecast of 3% by year-end, we adjust our forecast to now factor in an additional 25bps cut in Q2, bringing our end-Q2 forecast to 3.25% (vs 3.50% prior). Our Q3 call remains unchanged at 25bps, bringing the OCR to 3.00% (vs 3.25% prior), followed by a likely pause through year-end. The risk remains that the RBNZ could either accelerate the pace of easing if growth weakens further or slow the trajectory if inflation proves more persistent."
The Reserve Bank of New Zealand (RBNZ), at its first monetary policy of the year, decided to lower the Official Cash Rate (OCR) by 50bps to 3.75%. This is the RBNZ’s fourth cut since it kicked off an easing cycle in 2024, bringing rates lower by a total of 175bps since Aug 2024, UOB Group's Economist Lee Sue Ann notes.
RBNZ to act more cautiously from now on
"The Reserve Bank of New Zealand (RBNZ) cut interest rates by 50 bps from 4.25% to 3.75% earlier today (19 Feb), citing declining inflation, and said that it has the scope to cut rates even further in 2025. This is the RBNZ’s fourth cut since it kicked off an easing cycle in 2024."
"The RBNZ signaled further easing, stating that “if economic conditions continue to evolve as projected, the Committee has scope to lower the OCR further through 2025.” According to the latest projections, the OCR is expected to decline to 3.1% by year-end and remain at that level until early 2028."
"With the OCR now much closer to neutral and the economy recovering slowly, we expect a more cautious RBNZ from here. Our view is that this is likely the last 50bps cut. For now, we look for a further 75bps of rate cuts in clips of 25bps for the rest of this year, taking the OCR to 3.00% by 3Q25."
US Dollar (USD) is expected to trade between 7.2620 and 7.2850 vs Chinese Yuan (CNH). In the longer run, increase in momentum suggests USD could decline to the major support at 7.2300, UOB Group’s FX analysts Quek Ser Leang and Peter Chia note.
USD can decline to the major support at 7.2300
24-HOUR VIEW: "We noted yesterday that USD 'has likely entered a range trading phase, and it is likely to trade between 7.2500 and 7.2780.' However, USD traded in a higher range than expected (7.2658/7.2864) before closing at 7.2769 (+0.17%). The higher range did not result in any increase in upward momentum. Today, we expect USD to trade between 7.2620 and 7.2850."
1-3 WEEKS VIEW: "Two days ago (17 Feb, spot at 7.2600), we highlighted that, 'the increase in downward momentum suggests USD could decline the major support level at 7.2300.' USD then dropped to 7.2428 before rebounding. Momentum has slowed somewhat but as long as 7.2960 (no change in ‘strong resistance’ level) is not breached, there is still a chance for USD to decline."
USD/JPY traded on a softer footing this morning on comments from BoJ’s board member Takata – it is important for BoJ to continue to consider policy adjustments even after last month’s rate hike in order to avoid excessively high expectations that monetary easing might persist. USD/JPY was last at 151.77 levels, OCBC's FX analyst Christopher Wong notes.
Consolidation likely in the interim
"He also touched on the need to avoid letting upside inflation risks be realised. That said, tariff concerns somewhat negated the downside pressure on USD/JPY. Trump’s mention of 25% tariff on auto is likely to impact Japan as US is one of Japan’s largest trading partners."
"Japanese cars are amongst the top 5 most popular in US and the automotive industry is a key component to Japan’s economy. Japanese officials have already sought exemption from the US, but it’s status and how reciprocal tariffs (another concern) may pan out for Japan remains unclear at this point."
"Daily momentum is flat while RSI rose slightly. Consolidation likely in the interim. Support at 151.50 (38.2% fibo retracement of Sep low to Jan high), 150 levels. Resistance at 152.70 (200 DMA), 153.50/85 levels (21, 100 DMAs) and 154.30 levels."
The dollar continued its rebound yesterday, although early trading today is favouring some momentum in the yen and Antipodeans. In the coming days, markets will continue to carefully assess how close a truce in Ukraine is, and crucially at what conditions. So far, Russia and the US have held bilateral discussions that have excluded both Ukraine and the EU. Hints at future Moscow-Washington cooperation can reinforce the notion of isolation for Europe from a defence and economic perspective and contribute to a rotation away from European currencies into safe haven USD and JPY, ING’s FX analysts Francesco Pesole notes.
Moscow-Washington cooperation seems bad for Europe
"US Treasury underperformance likely helped the dollar regain some ground too. 10-year yields are back at the 4.55% mark, threatening a retest of the two highs of the past 30 days at 4.65%. We are also seeing a decline in the 30-day S&P500 – Bloomberg Dollar index correlation from the -0.60 peak a month ago to the current -0.35. In the immediate aftermath of the US election, that correlation had turned unusually positive. The S&P500 reaching new highs yesterday did not seem to interfere with the dollar recovery."
"The biggest macro event of the week is the FOMC minutes from the 29 January meeting released this evening. Markets have received multiple indications from Fed Chair Powell that there is no rush to cut rates and that the focus has shifted back to inflation concerns. We’ll be looking for any assessment of the new US administration policy plans in the minutes, and risks are probably a reinforcement of the hawkish message."
"Despite a more balanced picture for DXY after the past two days of dollar gains, the short-term valuation picture has not really moved back to the expensive side and the risks remain skewed to a stronger dollar in the coming days."
11:00
South Africa Retail Sales (YoY) dipped from previous 7.7% to 3.1% in December
Price movements are likely part of a 151.40/152.50 range trading phase. In the longer run, there has been a tentative buildup in downward momentum; USD must break and remain below 151.00 before further weakness is likely, UOB Group’s FX analysts Quek Ser Leang and Peter Chia note.
Below 151.00, further weakness is likely
24-HOUR VIEW: "When USD was at 151.45 yesterday, we noted 'a tentative buildup in downward momentum.' We indicated that USD 'could edge below 151.00, but it remains to be seen if it can maintain a foothold below this level.' Our view was incorrect, as USD rebounded to 152.22 before closing at 152.05 (+0.36%). The current price movements are likely part of a range trading phase, expected to be within a 151.40/152.50 range."
1-3 WEEKS VIEW: "We continue to hold the same view as yesterday (18 Feb, spot at 151.45). As indicated, 'there has been a tentative buildup in downward momentum, but USD must break and remain below 151.00 before further weakness can be expected.' The likelihood of USD breaking clearly below 151.00 will remain intact, provided that 152.75 (no change in ‘strong resistance’ level from yesterday) is not breached."
10:43
Germany 10-y Bond Auction declined to 2.52% from previous 2.54%
Australian Dollar (AUD) continued to trade near recent highs post-RBA cut yesterday. RBA cut its OCR by 25bps as expected, citing restrictive financial conditions 'which is weighing on demand and is helping to bring down underlying inflation'. The tone of the statement is somewhat balanced but still underscores our view that the rate-cutting cycle is likely to be a shallow one. AUD was last at 0.6360 levels, OCBC's FX analyst Christopher Wong notes.
Bullish momentum on daily chart intact
"RBA opined that 'the labour market has remained strong” and revised down unemployment rate to 4.2% from 4.4% previously anticipated. Labour cost growth has eased but remains high. At the press conference, Governor Bullock emphasised that the decision to cut rates 'do not imply that future rate cuts along the lines suggested by the market are coming' and later described market pricing as 'unrealistic'."
"She mentioned that the board will need more data that inflation is continuing to decline. RBA reiterated that they would highly prioritise 'sustainably returning inflation to target', and cautioned that 'disinflation could stall, and inflation would settle above the midpoint of target range'."
"Overall, we continue to view RBA rate cut cycle as shallow and is in a no-hurry-to-cut type of easing path. Bullish momentum on daily chart intact while RSI is near overbought conditions. 2-way trades likely. Resistance at 0.6370, 0.6420 (100-DMA). Support at 0.6310, 0.6280 (21-DMA)."
USD/CHF moves higher to near 0.9050 as the US Dollar ticks higher ahead of FOMC minutes.
The Fed guided in January that interest rates will remain at their current levels until the labor market is strong and price pressures are sticky.
The SNB is expected to follow an ultra-dovish monetary policy stance.
The USD/CHF pair extends its winning spree for the third trading day on Wednesday. The Swiss Franc pair gains to near 0.9050, while the US Dollar (USD) wobbles ahead of the Federal Open Market Committee (FOMC) minutes, which will be published at 19:00 GMT. The US Dollar Index (DXY), which gauges the Greenback’s value against six major currencies, trades near 107.00.
Investors await the FOMC minutes for the January policy meeting to get cues about how long the Federal Reserve (Fed) will continue with its restrictive monetary policy stance. The Fed left interest rates steady in the range of 4.25%-4.50% in January and guided that monetary policy adjustments won’t be appropriate until officials see “real progress in inflation or at least some weakness in the labor market”.
Meanwhile, the market sentiment is slightly favorable for risk-sensitive assets even though United States (US) President Donald Trump threatens to raise 25% tariffs on foreign cars, pharmaceuticals and semiconductors. It appears that investors are less concerned about Trump’s tariffs due to the absence of details about the timeframe.
The Swiss Franc (CHF) underperforms broadly as the Swiss National Bank (SNB) is expected to adopt an ultra-dovish monetary policy stance to uplift inflationary pressures, which have come down to 0.4%, the lowest level seen since May 2021.
USD/CHF strives to revisit its 15-month high, around 0.9200. The outlook of the Swiss Franc pair remains firm as the 20-week Exponential Moving Average (EMA) near 0.8950 is sloping higher.
The 14-week Relative Strength Index (RSI) falls into the 40.00-60.00 from the bullish range of 60.00-80.00, suggesting that the upside momentum has faded. However, the upside bias is intact.
For a fresh upside toward the round-level resistance of 0.9300 and the 16 March 2023 high of 0.9342, the asset needs to break decisively above the October 2023 high of 0.9244.
On the flip side, a downside move below the psychological support of 0.9000 would drag the asset towards the November 22 high of 0.8958, followed by the December 16 low of 0.8900.
USD/CHF weekly chart
US Dollar FAQs
The US Dollar (USD) is the official currency of the United States of America, and the ‘de facto’ currency of a significant number of other countries where it is found in circulation alongside local notes. It is the most heavily traded currency in the world, accounting for over 88% of all global foreign exchange turnover, or an average of $6.6 trillion in transactions per day, according to data from 2022. Following the second world war, the USD took over from the British Pound as the world’s reserve currency. For most of its history, the US Dollar was backed by Gold, until the Bretton Woods Agreement in 1971 when the Gold Standard went away.
The most important single factor impacting on the value of the US Dollar is monetary policy, which is shaped by the Federal Reserve (Fed). The Fed has two mandates: to achieve price stability (control inflation) and foster full employment. Its primary tool to achieve these two goals is by adjusting interest rates. When prices are rising too quickly and inflation is above the Fed’s 2% target, the Fed will raise rates, which helps the USD value. When inflation falls below 2% or the Unemployment Rate is too high, the Fed may lower interest rates, which weighs on the Greenback.
In extreme situations, the Federal Reserve can also print more Dollars and enact quantitative easing (QE). QE is the process by which the Fed substantially increases the flow of credit in a stuck financial system. It is a non-standard policy measure used when credit has dried up because banks will not lend to each other (out of the fear of counterparty default). It is a last resort when simply lowering interest rates is unlikely to achieve the necessary result. It was the Fed’s weapon of choice to combat the credit crunch that occurred during the Great Financial Crisis in 2008. It involves the Fed printing more Dollars and using them to buy US government bonds predominantly from financial institutions. QE usually leads to a weaker US Dollar.
Quantitative tightening (QT) is the reverse process whereby the Federal Reserve stops buying bonds from financial institutions and does not reinvest the principal from the bonds it holds maturing in new purchases. It is usually positive for the US Dollar.
Gold rallies higher for a third straight day in a row and hits a new all-time high on Wednesday.
Overnight, US President Donald Trump lashed out at Ukraine and committed again to several tariffs.
Technically, Tuesday’s daily close above $2,910 worked, boosting the Gold price to a fresh all-time high.
Gold’s price (XAU/USD) extends this week’s bullish momentum and hits a fresh all-time high at above $2,945 during the European trading session on Wednesday. The up-move comes after United States (US) President Donald Trump’s harsh words on Ukraine overnight, just hours after first talks between the US and Russia officials raised concerns among traders if a peace deal is even in the cards. Meanwhile, President Trump confirmed again that 25% tariffs on automobile imports are coming, extending to pharmaceutical and semiconductor imports in addition.
Meanwhile, the Federal Reserve (Fed) is set to release the Federal Open Market Committee (FOMC) Minutes for the January meeting. This could throw a spanner in the works for Gold, as several Fed officials have said in recent weeks that rates are reasonable where they are while some inflationary forces are enough for renewed concerns.
Daily digest market movers: Geopolitics take over
At 19:00 GMT, the Fed will release its January FOMC Minutes.
Late Tuesday, US President Donald Trump pledged to impose tariffs on automobiles, semiconductors, and pharmaceutical imports of around 25%, Bloomberg confirmed.
Turkish Gold miner Koza Altin aims to produce more than 40 tons of Gold in the next five years, the company says in an exchange filing after the market closed on Tuesday, Bloomberg reports.
The US 10-year benchmark is trading at the high of this week, near 4.56% at the time of writing.
Technical Analysis: Can it get there?
Gold is playing a dangerous game on Wednesday after reaching a fresh all-time high above $2,945. With the Fed Minutes for the January meeting being released later in the day, risk is building for an event that might push Gold back lower. From a technical point of view, this could be considered a rejection at the all-time high and might see sellers drive prices further down.
The daily Pivot Points have been reshuffled. The first support is seen at $2,921, which is the daily Pivot Point. It has already served as support during the Asian trading session. Should this level come under threat again, the S1 support at $2,906 could do its duty.
On the upside, the R1 resistance at $2,951 is the first barrier. The R2 resistance at $2,966 is the next level to be reached before considering the $3,000 mark.
XAU/USD: Daily Chart
Gold FAQs
Gold has played a key role in human’s history as it has been widely used as a store of value and medium of exchange. Currently, apart from its shine and usage for jewelry, the precious metal is widely seen as a safe-haven asset, meaning that it is considered a good investment during turbulent times. Gold is also widely seen as a hedge against inflation and against depreciating currencies as it doesn’t rely on any specific issuer or government.
Central banks are the biggest Gold holders. In their aim to support their currencies in turbulent times, central banks tend to diversify their reserves and buy Gold to improve the perceived strength of the economy and the currency. High Gold reserves can be a source of trust for a country’s solvency. Central banks added 1,136 tonnes of Gold worth around $70 billion to their reserves in 2022, according to data from the World Gold Council. This is the highest yearly purchase since records began. Central banks from emerging economies such as China, India and Turkey are quickly increasing their Gold reserves.
Gold has an inverse correlation with the US Dollar and US Treasuries, which are both major reserve and safe-haven assets. When the Dollar depreciates, Gold tends to rise, enabling investors and central banks to diversify their assets in turbulent times. Gold is also inversely correlated with risk assets. A rally in the stock market tends to weaken Gold price, while sell-offs in riskier markets tend to favor the precious metal.
The price can move due to a wide range of factors. Geopolitical instability or fears of a deep recession can quickly make Gold price escalate due to its safe-haven status. As a yield-less asset, Gold tends to rise with lower interest rates, while higher cost of money usually weighs down on the yellow metal. Still, most moves depend on how the US Dollar (USD) behaves as the asset is priced in dollars (XAU/USD). A strong Dollar tends to keep the price of Gold controlled, whereas a weaker Dollar is likely to push Gold prices up.
New Zealand Dollar (NZD) is likely to trade sideways between 0.5690 and 0.5730. In the longer run, price action suggests further NZD strength, potentially to 0.5790, UOB Group’s FX analysts Quek Ser Leang and Peter Chia note.
Price action suggests further NZD strength
24-HOUR VIEW: "Our view for NZD to 'trade between 0.5710 and 0.5745' yesterday was incorrect as it dipped to a low of 0.5695. The drop lacks momentum, and instead of continuing to decline, NZD is more likely to trade sideways between 0.5690 and 0.5730 today."
1-3 WEEKS VIEW: "We turned positive in NZD on Monday (17 Feb, spot at 0.5730), indicating that 'the price action suggests further NZD strength, potentially to 0.5790.' While NZD subsequently rose to 0.5750, it has since eased off from the high. Momentum has slowed somewhat, but as long as 0.5675 (no change in ‘strong support’ level) is not breached, there is still scope for NZD to strengthen."
Reserve Bank of New Zealand (RBNZ) cut rate by 50bp to bring OCR to 3.75%. This is widely expected. Its economy slipped into a technical recession in 3Q, with service sector showing a faster rate of contraction in Dec while manufacturing activity was in contraction territory. Consumer confidence, business confidence and activity outlook indicators were also lacklustre. NZD was last at 0.5727 levels, OCBC's FX analyst Christopher Wong notes.
NZD may be forming a base
"That said, recent data in Jan saw a pick-up in manufacturing and services sector. MPS also noted that economic growth is expected to recover during 2025. Lower interest rates will encourage spending, although elevated global economic uncertainty is expected to weigh on business investment decisions. Higher prices for some of our key commodities and a lower exchange rate will increase export revenues. Employment growth is expected to pick up in the second half of the year as the domestic economy recovers."
"At the press conference, Governor Orr guided for further cuts, of about 50bps by mid-July but indicated that the series of larger-than-usual interest rate cuts has come to an end. He is looking at a 25bp cut each in Apr and May. NZD fell first on policy decision as MPS continued to guide for easing bias – scope to lower the OCR further through 2025 if economic conditions evolve as projected. But NZD erased losses after Governor Orr signalled an end to the larger-than-usual magnitude of rate cuts and to revert to 25bp cuts instead."
"The OCR forecast table also indicated rates to bottom around 3.1% later this year. An end in sight for RBNZ’s rate cut cycle may imply that NZD may be forming a base, assuming the tariff impact is not overly drastic and China’s recovery finds better footing. Mild bullish momentum on daily chart intact though RSI eased. Consolidation likely. Support at 0.5655/75 levels (21, 50 DMAs). Resistance at 0.5750, 0.5810 (100-DMA)."
Australian Dollar (AUD) is likely to trade in a range between 0.6330 and 0.6365. In the longer run, momentum remains strong; AUD could continue to advance, potentially to 0.6410, UOB Group’s FX analysts Quek Ser Leang and Peter Chia note.
AUD potentially can continue to advance towards 0.6410
24-HOUR VIEW: "Two days ago, AUD traded in a range and closed largely unchanged at 0.6357 (+0.06%). Yesterday, we pointed out that we 'continue to expect range trading, but the softened underlying tone suggests a lower range of 0.6335/0.6370.' Our view was not wrong as AUD traded between 0.6333 and 0.6367 and closed largely unchanged again at 0.6354 (-0.04%). The price movements continue to suggest range trading, likely between 0.6330 and 0.6365."
1-3 WEEKS VIEW: "We have held a positive AUD view since early this month. In our latest narrative from two days ago (17 February, spot at 0.6355), we highlighted, 'momentum remains strong, and we continue to expect AUD to advance, potentially to 0.6410.' AUD traded in a range over the past couple of days, and we continue to hold the same view as long as 0.6305 (‘strong support’ level was at 0.6290 yesterday) is not breached."
US Dollar (USD) was a touch firmer amid hawkish Fedspeaks,, OCBC's FX analyst Christopher Wong notes.
Near term rebound risks not ruled out
"Daly said policy needs to remain restrictive until there is more progress on inflation. Earlier, Waller mentioned preferring to keep rates on hold for now until it is clear that inflation is fading (like it did in 2024). Week remaining brings housing starts, building permits (today); FOMC minutes (Thursday 3am SGT); prelim PMIs (Friday). DXY was; last at 107."
"Better print should be supportive of USD’s rebound momentum. Daily momentum is bearish but rise in RSI moderated. Potential bullish divergence on MACD may be forming. Near term rebound risks not ruled out. Resistance at 107.30, 107.80 (23.6% fibo, 21 DMA) and 108.50 levels. Support at 106.20/40 levels (100 DMA, 38.2% fibo retracement of Oct low to Jan high)."
"Overnight, Trump told reporters that he will impose 25% tariff on autos, pharmaceuticals and chips on 2 Apr. He had earlier set a 25% tariff on all steel and aluminium imports effective 12 Mar. FX reaction was relatively muted overall as it is somewhat within expectations. The bigger uncertainty is still on reciprocal tariffs, where details should be expected sometime later."
Silver prices (XAG/USD) rose on Wednesday, according to FXStreet data. Silver trades at $32.98 per troy ounce, up 0.44% from the $32.84 it cost on Tuesday.
Silver prices have increased by 14.16% since the beginning of the year.
Unit measure
Silver Price Today in USD
Troy Ounce
32.98
1 Gram
1.06
The Gold/Silver ratio, which shows the number of ounces of Silver needed to equal the value of one ounce of Gold, stood at 89.30 on Wednesday, broadly unchanged from 89.33 on Tuesday.
Silver FAQs
Silver is a precious metal highly traded among investors. It has been historically used as a store of value and a medium of exchange. Although less popular than Gold, traders may turn to Silver to diversify their investment portfolio, for its intrinsic value or as a potential hedge during high-inflation periods. Investors can buy physical Silver, in coins or in bars, or trade it through vehicles such as Exchange Traded Funds, which track its price on international markets.
Silver prices can move due to a wide range of factors. Geopolitical instability or fears of a deep recession can make Silver price escalate due to its safe-haven status, although to a lesser extent than Gold's. As a yieldless asset, Silver tends to rise with lower interest rates. Its moves also depend on how the US Dollar (USD) behaves as the asset is priced in dollars (XAG/USD). A strong Dollar tends to keep the price of Silver at bay, whereas a weaker Dollar is likely to propel prices up. Other factors such as investment demand, mining supply – Silver is much more abundant than Gold – and recycling rates can also affect prices.
Silver is widely used in industry, particularly in sectors such as electronics or solar energy, as it has one of the highest electric conductivity of all metals – more than Copper and Gold. A surge in demand can increase prices, while a decline tends to lower them. Dynamics in the US, Chinese and Indian economies can also contribute to price swings: for the US and particularly China, their big industrial sectors use Silver in various processes; in India, consumers’ demand for the precious metal for jewellery also plays a key role in setting prices.
Silver prices tend to follow Gold's moves. When Gold prices rise, Silver typically follows suit, as their status as safe-haven assets is similar. The Gold/Silver ratio, which shows the number of ounces of Silver needed to equal the value of one ounce of Gold, may help to determine the relative valuation between both metals. Some investors may consider a high ratio as an indicator that Silver is undervalued, or Gold is overvalued. On the contrary, a low ratio might suggest that Gold is undervalued relative to Silver.
(An automation tool was used in creating this post.)
09:30
United Kingdom DCLG House Price Index (YoY) came in at 4.6%, above expectations (3.2%) in December
USD/CAD trades cautiously below 1.4200 as investors await FOMC minutes for the January policy meeting.
The Fed cuts its key borrowing rates by 100 bps in 2024.
Canadian inflation accelerated in January, still it remained below BoC’s target of 2%.
The USD/CAD pair trades subduedly below 1.4200 in Wednesday’s European session. The Loonie pair is slightly down as the US Dollar (USD) ticks lower ahead of the Federal Open Market Committee (FOMC) minutes for the January policy meeting, which will be published at 19:00 GMT. The US Dollar Index (DXY), which tracks the Greenback’s value against six major currencies, wobbles around 107.00.
Investors will pay close attention to the FOMC minutes to get cues about the monetary policy outlook. Meanwhile, Fed officials have been guiding a restrictive monetary policy stance until they see inflationary pressures resuming to their journey on the 2% path.
In the January meeting, the Fed left interest rates steady in the range of 4.25%-4.50% after reducing them by 100 basis points (bps) in the last three policy meetings of 2024.
Globally, the market sentiment is slightly favorable for risk-perceived assets even though fears of United States (US) President Donald Trump have renewed. On Tuesday, Trump threatened to impose 25% tariffs on all imports of automobiles, semiconductors, and pharmaceuticals. He didn’t provide any timeline about when they get executed to offer some time to local manufacturers to pace up operating capacities.
Meanwhile, the Canadian Dollar (CAD) is broadly underperforming its peers even though inflationary pressures accelerated in January expectedly. On year, the Consumer Price Index (CPI) rose by 1.9% faster than 1.8% growth in December. Month-on-month inflation grew by 0.1% after deflating by 0.4% last month.
Hot Canadian CPI data is unlikely to restrict the Bank of Canada (BoC) from easing the monetary policy further. Despite an increase in inflation, it is still below the central bank’s target of 2%.
US Dollar FAQs
The US Dollar (USD) is the official currency of the United States of America, and the ‘de facto’ currency of a significant number of other countries where it is found in circulation alongside local notes. It is the most heavily traded currency in the world, accounting for over 88% of all global foreign exchange turnover, or an average of $6.6 trillion in transactions per day, according to data from 2022. Following the second world war, the USD took over from the British Pound as the world’s reserve currency. For most of its history, the US Dollar was backed by Gold, until the Bretton Woods Agreement in 1971 when the Gold Standard went away.
The most important single factor impacting on the value of the US Dollar is monetary policy, which is shaped by the Federal Reserve (Fed). The Fed has two mandates: to achieve price stability (control inflation) and foster full employment. Its primary tool to achieve these two goals is by adjusting interest rates. When prices are rising too quickly and inflation is above the Fed’s 2% target, the Fed will raise rates, which helps the USD value. When inflation falls below 2% or the Unemployment Rate is too high, the Fed may lower interest rates, which weighs on the Greenback.
In extreme situations, the Federal Reserve can also print more Dollars and enact quantitative easing (QE). QE is the process by which the Fed substantially increases the flow of credit in a stuck financial system. It is a non-standard policy measure used when credit has dried up because banks will not lend to each other (out of the fear of counterparty default). It is a last resort when simply lowering interest rates is unlikely to achieve the necessary result. It was the Fed’s weapon of choice to combat the credit crunch that occurred during the Great Financial Crisis in 2008. It involves the Fed printing more Dollars and using them to buy US government bonds predominantly from financial institutions. QE usually leads to a weaker US Dollar.
Quantitative tightening (QT) is the reverse process whereby the Federal Reserve stops buying bonds from financial institutions and does not reinvest the principal from the bonds it holds maturing in new purchases. It is usually positive for the US Dollar.
The Reserve Bank of New Zealand (RBNZ) cut rates by 50bp to 3.75%, in line with our call and the broader market consensus. The New Zealand Dollae (NZD) is trading on the strong side as the Bank did not revise its terminal rate projections lower (still at 3.10%), despite retaining an optimistic view that inflation will remain within the target band and flagging growing downside risks to the economy, ING’s FX analysts Francesco Pesole notes.
NZD/USD to return to 0.56 by the end of this quarter
"The indications are that this was the last 50bp reduction, and NZD is benefitting from seeing the end of the easing cycle sooner than previously thought. Early aggressive easing by the RBNZ suggests New Zealand can be better prepared to face trade headwinds than Australia, and we still expect a gradual depreciation in AUD/NZD in the medium run."
"For now, we don’t think the impact on NZD/USD from a slightly less dovish than expected RBNZ will be long-lasting. As we expect a return of US trade policy as a central market theme in the coming weeks, we think the Kiwi dollar remains vulnerable. And the RBNZ’s increased concerns about the growth outlook may allow some dovish repricing in the NZD curve despite the unchanged rate projections."
"We expect a return to 0.56 by the end of this quarter in NZD/USD, and a move to 0.55 in the second quarter as US protectionism risk intensifies."
EUR/JPY depreciates as expectations grow that the BoJ will raise interest rates to tackle persistent inflation.
Japan’s trade deficit increased to JPY 2,758.78 billion in January as annual imports surged to a 26-month high.
The Euro remains subdued due to rising odds of more ECB’s interest rate cuts.
EUR/JPY offers its gains from the previous session, trading around 158.50 during the European hours on Wednesday. The EUR/JPY cross weakens as the Japanese Yen (JPY) gains traction amid growing expectations that the Bank of Japan (BoJ) will continue raising interest rates to combat persistent inflation.
However, the JPY’s upside may be capped due to weaker-than-expected economic data. Japan’s core Machinery Orders—excluding ships and electric power—fell 1.2% month-on-month in December 2024, marking the steepest decline in four months and reversing November’s 3.4% growth. The reading also defied market projections for a modest 0.1% gain.
Japan’s trade deficit widened sharply to JPY 2,758.78 billion in January from JPY 1,766.54 billion a year earlier, exceeding market estimates of JPY 2,100 billion. Imports surged 16.7% YoY to a 26-month high, significantly outpacing December’s 1.7% growth and surpassing forecasts of 9.7%. Exports, however, expanded at a slower 7.2% YoY, marking the fourth consecutive month of growth but missing expectations of 7.9%.
The Euro is under pressure as sluggish growth in the Eurozone fuels expectations of further interest rate cuts by the European Central Bank (ECB). Analysts predict the ECB will implement quarter-point reductions at each meeting until mid-2025, bringing the deposit rate down to 2.0%.
On Wednesday, ECB policymaker Fabio Panetta acknowledged that economic weakness in the Eurozone is proving more persistent than expected. "We anticipated a recovery driven by consumer spending, but that has not materialized," he stated.
Interest rates FAQs
Interest rates are charged by financial institutions on loans to borrowers and are paid as interest to savers and depositors. They are influenced by base lending rates, which are set by central banks in response to changes in the economy. Central banks normally have a mandate to ensure price stability, which in most cases means targeting a core inflation rate of around 2%. If inflation falls below target the central bank may cut base lending rates, with a view to stimulating lending and boosting the economy. If inflation rises substantially above 2% it normally results in the central bank raising base lending rates in an attempt to lower inflation.
Higher interest rates generally help strengthen a country’s currency as they make it a more attractive place for global investors to park their money.
Higher interest rates overall weigh on the price of Gold because they increase the opportunity cost of holding Gold instead of investing in an interest-bearing asset or placing cash in the bank. If interest rates are high that usually pushes up the price of the US Dollar (USD), and since Gold is priced in Dollars, this has the effect of lowering the price of Gold.
The Fed funds rate is the overnight rate at which US banks lend to each other. It is the oft-quoted headline rate set by the Federal Reserve at its FOMC meetings. It is set as a range, for example 4.75%-5.00%, though the upper limit (in that case 5.00%) is the quoted figure. Market expectations for future Fed funds rate are tracked by the CME FedWatch tool, which shapes how many financial markets behave in anticipation of future Federal Reserve monetary policy decisions.
09:01
Eurozone Current Account s.a above forecasts (€30.2B) in December: Actual (€38.4B)
09:01
Eurozone Current Account n.s.a increased to €50.5B in December from previous €34.6B
AUD/USD attracts fresh buyers on Wednesday amid a modest USD weakness.
The technical setup favors bulls and supports prospects for additional gains.
Any slide below the 0.6335-0.6330 area could be seen as a buying opportunity.
The AUD/USD pair regains positive traction following the previous day's modest downtick and sticks to its positive bias through the first half of the European session amid a modest US Dollar (USD) downtick. Apart from this, the Reserve Bank of Australia's (RBA) relatively hawkish outlook assists spot prices to hold steady near the 0.6365 area, or just below the highest level since December 17 touched on Monday.
Looking at the broader picture, the AUD/USD pair has been oscillating in a narrow range since the beginning of the currency week. Against the backdrop of the recent goodish recovery from sub-0.6100 levels, or the lowest level since April 2020 touched earlier this month, this might still be categorized as a bullish consolidation phase. Moreover, positive oscillators on the daily chart suggest that the path of least resistance for spot prices remains to the upside.
Hence, some follow-through buying should allow the AUD/USD pair to surpass the 0.6400 round figure and climb further toward the 0.6415 confluence. The latter comprises the 100-day Simple Moving Average (SMA) and the 38.2% Fibonacci retracement level of the September 2024-February 2025 downfall. A sustained strength beyond would then lift spot prices to the 0.6500 psychological mark en route to the 200-day SMA, around the 0.6555-0.6560 zone.
On the flip side, the 0.6335-0.6330 region, or the lower boundary of the weekly range, might continue to act as an immediate support ahead of the 0.6300 mark. A convincing break below the latter could drag the AUD/USD pair further toward the 0.6265 intermediate support en route to the 0.6240-0.6235 zone. Some follow-through selling could make spot prices vulnerable to weaken further below the 0.6200 mark, towards the next relevant support near the 0.6145 area.
AUD/USD daily chart
Economic Indicator
FOMC Minutes
FOMC stands for The Federal Open Market Committee that organizes 8 meetings in a year and reviews economic and financial conditions, determines the appropriate stance of monetary policy and assesses the risks to its long-run goals of price stability and sustainable economic growth. FOMC Minutes are released by the Board of Governors of the Federal Reserve and are a clear guide to the future US interest rate policy.
Minutes of the Federal Open Market Committee (FOMC) is usually published three weeks after the day of the policy decision. Investors look for clues regarding the policy outlook in this publication alongside the vote split. A bullish tone is likely to provide a boost to the greenback while a dovish stance is seen as USD-negative. It needs to be noted that the market reaction to FOMC Minutes could be delayed as news outlets don’t have access to the publication before the release, unlike the FOMC’s Policy Statement.
Chance for Pound Sterling (GBP) to edge higher vs US Dollar (USD), but it is unlikely to break clearly above 1.2655. In the longer run, further GBP strength appears likely; the focus is at 1.2655, UOB Group’s FX analysts Quek Ser Leang and Peter Chia note.
Further GBP strength appears likely
24-HOUR VIEW: We highlighted yesterday that 'while there is scope for GBP to continue to edge higher, any advance is likely part of a higher trading range of 1.2580/1.2655.' We also highlighted that GBP 'is unlikely to break clearly above 1.2655.' Our expectation did not quite turn out as after dipping to a low of 1.2583, GBP rose but only touched 1.2628. Although upward momentum has not increased much, there is still a chance for GBP to edge higher today. However, a clear break above 1.2655 still seems unlikely. On the downside, support levels are at 1.2600 and 1.2580."
1-3 WEEKS VIEW: "Our update from two days ago (17 Feb, spot at 1.2580) is still valid. As highlighted, 'further GBP strength appears likely, and the focus now is at 1.2655.' Overall, only a breach of 1.2525 (no change in ‘strong support’ level) would mean that the GBP strength that started late last week has faded."
The release of January’s UK inflation data this morning has had little impact on the pound. Headline CPI accelerated to 3.0%, just above our 2.9% forecast and the consensus of 2.8%. However, this is primarily due to an unexpected surge in food prices in January, and markets are attaching little weight, ING’s FX analysts Francesco Pesole notes.
A move to 0.820 is not out of scope
"Services inflation came in marginally lower than expected at 5.0%. Although this marks a 0.6% acceleration from last month, December's figures were artificially low due to improper measurement of Christmas airfares."
"More significantly, our measure of core services, which excludes volatile items (including airfares) and rents, has shown steady improvement, now at 4.2%, down from 4.7% two months ago. We expect this benign trend in services inflation to persist in the second quarter and support our projection of one rate cut per quarter this year."
"EUR/GBP broke below 0.8300 yesterday as the euro continued to show idiosyncratic underperformance likely linked to the EU’s geopolitical isolationism relative to the US. We’d be careful picking a bottom in the pair just yet, and a move to 0.820 is not out of scope. In the longer run, we deem at least 25bp worth of dovish repricing is due in the GBP curve, which should offer some support to EUR/GBP."
The rise in the German ZEW index yesterday was likely due to improved investors' sentiment ahead of expectations for a market-friendly change in government, but does not seem to mirror any real change in sentiment on growth, ING’s FX analysts Francesco Pesole notes.
More downside risks for the EUR/USD
"The Euro (EUR) continues to follow sentiment on the implications of Russia-US talks, and we are starting to observe some signs of relative underperformance of European currencies that we suspect will be exacerbated by Trump’s more transactional approach to European NATO allies."
"Our short-term fair value model continues to show zero risk premium (i.e. undervaluation) on EUR/USD, suggesting more downside risks related to a repricing of US protectionism risk into FX. We could see the correction run until 1.040 this week."
EUR/USD is slightly up as the US Dollar trades with caution even though President Trump has threatened to impose 25% tariffs on a few items.
The Fed is expected to keep interest rates steady for longer.
Firm ECB dovish bets would continue to cap the Euro’s upside.
EUR/USD ticks higher to near 1.0460 in Wednesday’s European session as the US Dollar (USD) struggles to extend recovery despite multiple tailwinds. The US Dollar Index (DXY), which tracks the Greenback’s value against six major currencies, drops to near 106.90. On Tuesday, the DXY Index advanced to near 107.10 after recovering from its two-month low of 106.50, which it posted on Friday.
The Greenback struggles for more upside even though fears of United States (US) President Donald Trump’s tariffs have renewed. On Tuesday, President Trump announced that he plans to impose 25% tariffs on automobiles, semiconductors, and pharmaceuticals and that duties will increase further next year. He didn’t provide a clear timeline for when these tariffs will come into effect but said that some of them will be enacted by April 2.
Market participants expect Germany, Japan, South Korea, Taiwan, and India would be major casualties of Trump’s latest tariff threat.
Trump’s tariffs on automobiles would weigh on the German economy, which has been experiencing an economic contraction for the past two years. ECB policymaker and Bundesbank President Joachin Nagel said on Monday that our “strong export orientation” makes us “particularly vulnerable from potential Trump tariffs”.
Daily digest market movers: EUR/USD ticks higher at US Dollar’s expense
EUR/USD is slightly up as the US Dollar drops despite investors becoming increasingly confident that the Federal Reserve (Fed) will keep interest rates in the current range of 4.25%-4.50% for longer. According to the CME FedWatch tool, the Fed is expected to keep interest rates steady in the March, May, and June policy meetings.
On Tuesday, San Francisco Fed Bank President Mary Daly said in a community banking conference hosted by the American Bankers Association that monetary policy needs to remain “restrictive” until she sees that we are really continuing to make “progress on inflation”. Daly added that she wants to be careful before making any policy adjustment, with the labor market and economy remaining solid.
Regarding the impact of President Trump’s agenda on the economy, Daly said it is difficult to assess the impact of Trump’s policies on economic growth, labor supply, and inflation until she knows details and their "scope, magnitude, and timing."
For more cues on the interest rate outlook, investors will focus on the Federal Open Market Committee (FOMC) minutes for the January policy meeting, which will be published at 19:00 GMT.
On the ECB front, traders have fully priced in three more interest rate cuts this year as a few policymakers see risks to inflation undershooting the 2% target. The ECB also reduced its Deposit Facility rate by 25 basis points (bps) to 2.75% but didn’t commit to a pre-defined monetary expansion path.
Technical Analysis: EUR/USD holds 50-day EMA
EUR/USD trades in a tight range around 1.0450 in European trading hours on Wednesday. The 50-day Exponential Moving Average (EMA) continues to support the major currency pair around 1.0430.
The 14-day Relative Strength Index (RSI) struggles to break above 60.00. A bullish momentum would activate if the RSI (14) manages to sustain above that level.
Looking down, the February 10 low of 1.0285 will act as the major support zone for the pair. Conversely, the December 6 high of 1.0630 will be the key barrier for the Euro bulls.
Euro FAQs
The Euro is the currency for the 19 European Union countries that belong to the Eurozone. It is the second most heavily traded currency in the world behind the US Dollar. In 2022, it accounted for 31% of all foreign exchange transactions, with an average daily turnover of over $2.2 trillion a day. EUR/USD is the most heavily traded currency pair in the world, accounting for an estimated 30% off all transactions, followed by EUR/JPY (4%), EUR/GBP (3%) and EUR/AUD (2%).
The European Central Bank (ECB) in Frankfurt, Germany, is the reserve bank for the Eurozone. The ECB sets interest rates and manages monetary policy. The ECB’s primary mandate is to maintain price stability, which means either controlling inflation or stimulating growth. Its primary tool is the raising or lowering of interest rates. Relatively high interest rates – or the expectation of higher rates – will usually benefit the Euro and vice versa. The ECB Governing Council makes monetary policy decisions at meetings held eight times a year. Decisions are made by heads of the Eurozone national banks and six permanent members, including the President of the ECB, Christine Lagarde.
Eurozone inflation data, measured by the Harmonized Index of Consumer Prices (HICP), is an important econometric for the Euro. If inflation rises more than expected, especially if above the ECB’s 2% target, it obliges the ECB to raise interest rates to bring it back under control. Relatively high interest rates compared to its counterparts will usually benefit the Euro, as it makes the region more attractive as a place for global investors to park their money.
Data releases gauge the health of the economy and can impact on the Euro. Indicators such as GDP, Manufacturing and Services PMIs, employment, and consumer sentiment surveys can all influence the direction of the single currency. A strong economy is good for the Euro. Not only does it attract more foreign investment but it may encourage the ECB to put up interest rates, which will directly strengthen the Euro. Otherwise, if economic data is weak, the Euro is likely to fall. Economic data for the four largest economies in the euro area (Germany, France, Italy and Spain) are especially significant, as they account for 75% of the Eurozone’s economy.
Another significant data release for the Euro is the Trade Balance. This indicator measures the difference between what a country earns from its exports and what it spends on imports over a given period. If a country produces highly sought after exports then its currency will gain in value purely from the extra demand created from foreign buyers seeking to purchase these goods. Therefore, a positive net Trade Balance strengthens a currency and vice versa for a negative balance.
Euro (EUR) could dip to 1.0430 vs US Dollar (USD) before recovering; the strong support at 1.0415 is unlikely to come under threat. In the longer run, outlook for EUR is positive, with a technical target of 1.0530, UOB Group’s FX analysts Quek Ser Leang and Peter Chia note.
Outlook for EUR is positive
24-HOUR VIEW: "We expected EUR to 'consolidate in a 1.0455/1.0505 range' yesterday. Our expectation was incorrect, as EUR dropped to a low of 1.0434, closing at 1.0445 (-0.35%). Despite the decline, there is no significant increase in momentum. That said, EUR could dip to 1.0430 today before recovering. The strong support at 1.0415 is unlikely to come under threat. Resistance is at 1.0465, followed by 1.0485."
1-3 WEEKS VIEW: "Our most recent narrative was from last Friday (14 Feb, spot at 1.0460), wherein 'the outlook for EUR is positive, with a technical target of 1.0530.' EUR then rose to 1.0514 before easing. While upward momentum has slowed to an extent, only a breach of 1.0415 (no change in ‘strong support’ level) would indicate that 1.0530 is out of reach."
Silver turns positive for the third straight day and climbs to a fresh weekly high.
The technical setup favors bulls and supports prospects for further appreciation.
Any corrective slide toward $32.00 might now be seen as a buying opportunity.
Silver (XAG/USD) attracts some dip-buyers in the vicinity of the $32.00 round figure and turns positive for the third consecutive day on Wednesday. The white metal climbs to a fresh weekly high during the first half of the European session, with bulls now looking to build on the momentum beyond the $33.00 mark.
From a technical perspective, the overnight sustained close above the $32.50-$32.55 hurdle confirmed a fresh breakout through a short-term trading range and favors bullish traders. This, along with positive oscillators on the daily chart, suggests that the path of least resistance for the XAG/USD remains to the upside and supports prospects for additional gains.
The white metal now seems poised to advance further towards last Friday's swing high, around the $33.35-$33.40 zone before aiming to reclaim the $34.00 round-figure mark. The momentum could extend further towards the $34.45 intermediate hurdle and eventually lift the XAG/USD to the $35.00 neighborhood, or the multi-year peak touched in October.
On the flip side, any meaningful corrective pullback now seems to find decent support near the $32.00-$31.90 region. A further slide could be seen as a buying opportunity, which, in turn, should limit the downside for the XAG/USD near the $31.75-$31.70 horizontal zone. A convincing break below the latter might shift the near-term bias in favor of bearish traders.
The XAG/USD might then accelerate the fall towards retesting the 100-day Simple Moving Average (SMA), currently pegged near the $31.20 area, en route to the $31.00 round figure mark. Some follow-through should pave the way for a fall toward the next relevant support near the $30.25 region, the $30.00 psychological mark, and the $29.55-$29.50 horizontal zone.
Silver daily chart
Silver FAQs
Silver is a precious metal highly traded among investors. It has been historically used as a store of value and a medium of exchange. Although less popular than Gold, traders may turn to Silver to diversify their investment portfolio, for its intrinsic value or as a potential hedge during high-inflation periods. Investors can buy physical Silver, in coins or in bars, or trade it through vehicles such as Exchange Traded Funds, which track its price on international markets.
Silver prices can move due to a wide range of factors. Geopolitical instability or fears of a deep recession can make Silver price escalate due to its safe-haven status, although to a lesser extent than Gold's. As a yieldless asset, Silver tends to rise with lower interest rates. Its moves also depend on how the US Dollar (USD) behaves as the asset is priced in dollars (XAG/USD). A strong Dollar tends to keep the price of Silver at bay, whereas a weaker Dollar is likely to propel prices up. Other factors such as investment demand, mining supply – Silver is much more abundant than Gold – and recycling rates can also affect prices.
Silver is widely used in industry, particularly in sectors such as electronics or solar energy, as it has one of the highest electric conductivity of all metals – more than Copper and Gold. A surge in demand can increase prices, while a decline tends to lower them. Dynamics in the US, Chinese and Indian economies can also contribute to price swings: for the US and particularly China, their big industrial sectors use Silver in various processes; in India, consumers’ demand for the precious metal for jewellery also plays a key role in setting prices.
Silver prices tend to follow Gold's moves. When Gold prices rise, Silver typically follows suit, as their status as safe-haven assets is similar. The Gold/Silver ratio, which shows the number of ounces of Silver needed to equal the value of one ounce of Gold, may help to determine the relative valuation between both metals. Some investors may consider a high ratio as an indicator that Silver is undervalued, or Gold is overvalued. On the contrary, a low ratio might suggest that Gold is undervalued relative to Silver.
NZD/USD rose despite RBNZ’s decision to lower the Official Cash Rate by 50 basis points from 4.25% to 3.75%.
RBNZ Governor Orr indicated that the Official Cash Rate forecast suggests a 50 basis point reduction by mid-year.
The US Dollar remains subdued as Treasury yields fall ahead of the FOMC Meeting Minutes.
NZD/USD retraces its recent losses from the previous session, trading near 0.5720 during European hours on Wednesday. However, the pair faced challenges following the Reserve Bank of New Zealand’s (RBNZ) decision to lower the Official Cash Rate (OCR) by 50 basis points (bps) from 4.25% to 3.75%.
RBNZ Governor Adrian Orr delivers prepared remarks on the policy statement and addresses media questions at the post-meeting press conference. Orr said that the OCR path forecasts a 50 bps reduction by mid-year, likely around July, in two 25 bps increments. The economy has substantial spare capacity, making rate cuts in April and May appropriate.
However, the NZD/USD pair’s upside could be restrained amid rising risk sentiment following fresh tariff threats from US President Donald Trump. According to Bloomberg, Trump stated on Tuesday that he plans to impose a 25% tariff on foreign cars, with higher duties also expected on semiconductor chips and pharmaceuticals. He indicated that an official announcement could come as soon as April 2.
The NZD/USD pair gains support as the US Dollar (USD) struggles amid falling Treasury yields, despite ongoing caution regarding the Federal Reserve’s (Fed) policy outlook. Investors await the release of the FOMC Minutes later in the North American session.
The US Dollar Index (DXY), which measures the USD against six major currencies, has edged lower to around 107.00. Meanwhile, US Treasury yields stand at 4.30% for the 2-year note and 4.54% for the 10-year note at the time of writing.
On Tuesday, San Francisco Fed President Mary Daly noted that while US economic conditions remain positive, the outlook for rate cuts in 2025 remains uncertain. Philadelphia Fed President Patrick Harker reinforced the need for a steady interest rate policy, citing persistent inflation concerns.
Economic Indicator
FOMC Minutes
FOMC stands for The Federal Open Market Committee that organizes 8 meetings in a year and reviews economic and financial conditions, determines the appropriate stance of monetary policy and assesses the risks to its long-run goals of price stability and sustainable economic growth. FOMC Minutes are released by the Board of Governors of the Federal Reserve and are a clear guide to the future US interest rate policy.
Minutes of the Federal Open Market Committee (FOMC) is usually published three weeks after the day of the policy decision. Investors look for clues regarding the policy outlook in this publication alongside the vote split. A bullish tone is likely to provide a boost to the greenback while a dovish stance is seen as USD-negative. It needs to be noted that the market reaction to FOMC Minutes could be delayed as news outlets don’t have access to the publication before the release, unlike the FOMC’s Policy Statement.
The Pound Sterling attracts bids after the release of a hotter-than-expected UK inflation report for January.
BoE's Bailey expects the uptick in inflation won’t be persistent in nature.
US President Trump threatens to impose 25% tariffs on automobiles, semiconductors, and pharmaceuticals.
The Pound Sterling moves higher against its major peers after the release of the United Kingdom (UK) Consumer Price Index (CPI) data for January, which showed that inflationary pressures accelerated at a faster-than-expected pace. In the year, the headline CPI rose by 3%, faster than estimates of 2.8% and the December reading of 2.5%. In the same period, the core CPI – which excludes volatile components of food, energy, alcohol, and tobacco – grew by 3.7%, as expected, faster than the former reading of 3.2%.
Month-on-month headline CPI inflation deflated at a slower-than-projected pace of 0.1%, compared to the 0.3% growth in December. Economists expected headline inflation to deflate at that pace this month.
Inflation in the services sector, which is closely tracked by Bank of England (BoE) officials, accelerated to 5% from 4.4% in December.
The impact of high inflation data is unlikely to be secularly positive for the British currency. BoE officials have already communicated in their latest monetary policy statement that price pressures could tick higher in the short term due to rising energy prices before returning to their 2% path.
On Monday, BoE Governor Andrew Bailey also said in an interview with BusinessLine that the impact of an expected increase in inflation won’t be “persistent,” and still sees the “gradual disinflation going on”. Bailey added that a “sluggish state” of the economy is also likely to “act against inflation”, Reuters reported.
However, an increase in inflationary pressures is expected to restrict the BoE from further monetary easing.
Going forward, investors will focus on the UK Retail Sales data for January and the preliminary S&P Global/CIPS Purchasing Managers Index (PMI) data for February, which will be released on Friday.
Daily digest market movers: Pound Sterling gains against USD ahead of FOMC minutes
The Pound Sterling moves higher to near 1.2630 against the US Dollar (USD) in Wednesday’s European session. The GBP/USD pair rise as the US Dollar trades subduedly, with the US Dollar Index (DXY) wobbling around 107.00, ahead of the release of the Federal Open Market Committee (FOMC) minutes for the January meeting, which will be published at 19:00 GMT.
Investors will focus on FOMC minutes for the January decision to get cues about how long the Federal Reserve (Fed) will keep interest rates steady in the range of 4.25%-4.50%. In the January meeting, the Fed announced a pause in its monetary expansion cycle after cutting interest rates by 100 basis points (bps) in the last three meetings of 2024. Fed Chair Jerome Powell guided that monetary policy adjustments would become appropriate when officials see “real progress in inflation or at least some weakness in the labor market”.
On Tuesday, San Francisco Fed Bank President Mary Daly also favored a “restrictive” monetary policy stance until she sees a continuation in progress in the disinflation trend.
Meanwhile, renewed fears of tariffs by United States (US) President Donald Trump could strengthen the US Dollar. President Trump said on Tuesday that he plans to impose 25% tariffs on imports of automobiles, semiconductors, and pharmaceuticals, which could increase further over the next year. This could lead to a slowdown in the global economy.
The Pound Sterling trades above the key level of 1.2600 against the US Dollar in European trading hours on Wednesday. The GBP/USD pair gathers strength to break above the 38.2% Fibonacci retracement, which coincides with the 100-day Exponential Moving Average (EMA), around 1.2620.
The 14-day Relative Strength Index (RSI) advances above 60.00. A bullish momentum would activate if the RSI (14) sustains above that level.
Looking down, the February 3 low of 1.2250 will act as a key support zone for the pair. On the upside, the 50% Fibonacci retracement at 1.2767 will act as a key resistance zone.
Pound Sterling FAQs
The Pound Sterling (GBP) is the oldest currency in the world (886 AD) and the official currency of the United Kingdom. It is the fourth most traded unit for foreign exchange (FX) in the world, accounting for 12% of all transactions, averaging $630 billion a day, according to 2022 data. Its key trading pairs are GBP/USD, also known as ‘Cable’, which accounts for 11% of FX, GBP/JPY, or the ‘Dragon’ as it is known by traders (3%), and EUR/GBP (2%). The Pound Sterling is issued by the Bank of England (BoE).
The single most important factor influencing the value of the Pound Sterling is monetary policy decided by the Bank of England. The BoE bases its decisions on whether it has achieved its primary goal of “price stability” – a steady inflation rate of around 2%. Its primary tool for achieving this is the adjustment of interest rates. When inflation is too high, the BoE will try to rein it in by raising interest rates, making it more expensive for people and businesses to access credit. This is generally positive for GBP, as higher interest rates make the UK a more attractive place for global investors to park their money. When inflation falls too low it is a sign economic growth is slowing. In this scenario, the BoE will consider lowering interest rates to cheapen credit so businesses will borrow more to invest in growth-generating projects.
Data releases gauge the health of the economy and can impact the value of the Pound Sterling. Indicators such as GDP, Manufacturing and Services PMIs, and employment can all influence the direction of the GBP. A strong economy is good for Sterling. Not only does it attract more foreign investment but it may encourage the BoE to put up interest rates, which will directly strengthen GBP. Otherwise, if economic data is weak, the Pound Sterling is likely to fall.
Another significant data release for the Pound Sterling is the Trade Balance. This indicator measures the difference between what a country earns from its exports and what it spends on imports over a given period. If a country produces highly sought-after exports, its currency will benefit purely from the extra demand created from foreign buyers seeking to purchase these goods. Therefore, a positive net Trade Balance strengthens a currency and vice versa for a negative balance.
GBP/JPY remains subdued following the release of UK inflation data on Wednesday.
UK Consumer Price Index rose 3.0% YoY in January, remaining well above the BoE’s 2% target.
Japan’s trade deficit increased to JPY 2,758.78 billion in January as annual imports surged to a 26-month high.
GBP/JPY remains under pressure near 191.50 during early European trading on Wednesday, following the release of UK inflation data. The UK’s Office for National Statistics (ONS) reported that the Consumer Price Index (CPI) rose 3.0% year-over-year (YoY) in January, up from December’s 2.5% increase and exceeding market expectations of 2.8%. The reading remains well above the Bank of England’s (BoE) 2% target.
The monthly CPI inflation dipped to -0.1% in January from +0.3% in December, outperforming market forecasts of -0.3%. Meanwhile, Core CPI, which excludes volatile food and energy prices, climbed 3.7% YoY, aligning with market expectations and accelerating from December’s 3.2%. Additionally, services inflation surged to 5.0% YoY in January, up from 4.4% in the previous month.
The GBP/JPY pair weakens as the Japanese Yen (JPY) gains traction amid growing expectations that the Bank of Japan (BoJ) will continue raising interest rates to combat persistent inflation. However, the JPY’s upside may be capped as investors digest weaker-than-expected economic data.
Japan’s core Machinery Orders—excluding ships and electric power—fell 1.2% month-on-month in December 2024, marking the steepest decline in four months and reversing November’s 3.4% growth. The reading also defied market projections for a modest 0.1% gain.
Japan’s trade deficit widened sharply to JPY 2,758.78 billion in January from JPY 1,766.54 billion a year earlier, exceeding market estimates of JPY 2,100 billion. Imports surged 16.7% YoY to a 26-month high, significantly outpacing December’s 1.7% growth and surpassing forecasts of 9.7%. Exports, however, expanded at a slower 7.2% YoY, marking the fourth consecutive month of growth but missing expectations of 7.9%.
Economic Indicator
Consumer Price Index (YoY)
The United Kingdom (UK) Consumer Price Index (CPI), released by the Office for National Statistics on a monthly basis, is a measure of consumer price inflation – the rate at which the prices of goods and services bought by households rise or fall – produced to international standards. It is the inflation measure used in the government’s target. The YoY reading compares prices in the reference month to a year earlier. Generally, a high reading is seen as bullish for the Pound Sterling (GBP), while a low reading is seen as bearish.
The Bank of England is tasked with keeping inflation, as measured by the headline Consumer Price Index (CPI) at around 2%, giving the monthly release its importance. An increase in inflation implies a quicker and sooner increase of interest rates or the reduction of bond-buying by the BOE, which means squeezing the supply of pounds. Conversely, a drop in the pace of price rises indicates looser monetary policy. A higher-than-expected result tends to be GBP bullish.
West Texas Intermediate (WTI) Oil price advances on Wednesday, according to FXStreet data. WTI trades at $72.24 per barrel, up from Tuesday’s close at $71.74.
Brent Oil Exchange Rate (Brent crude) is also up, advancing from the $75.45 price posted on Tuesday, and trading at $75.94.
WTI Oil FAQs
WTI Oil is a type of Crude Oil sold on international markets. The WTI stands for West Texas Intermediate, one of three major types including Brent and Dubai Crude. WTI is also referred to as “light” and “sweet” because of its relatively low gravity and sulfur content respectively. It is considered a high quality Oil that is easily refined. It is sourced in the United States and distributed via the Cushing hub, which is considered “The Pipeline Crossroads of the World”. It is a benchmark for the Oil market and WTI price is frequently quoted in the media.
Like all assets, supply and demand are the key drivers of WTI Oil price. As such, global growth can be a driver of increased demand and vice versa for weak global growth. Political instability, wars, and sanctions can disrupt supply and impact prices. The decisions of OPEC, a group of major Oil-producing countries, is another key driver of price. The value of the US Dollar influences the price of WTI Crude Oil, since Oil is predominantly traded in US Dollars, thus a weaker US Dollar can make Oil more affordable and vice versa.
The weekly Oil inventory reports published by the American Petroleum Institute (API) and the Energy Information Agency (EIA) impact the price of WTI Oil. Changes in inventories reflect fluctuating supply and demand. If the data shows a drop in inventories it can indicate increased demand, pushing up Oil price. Higher inventories can reflect increased supply, pushing down prices. API’s report is published every Tuesday and EIA’s the day after. Their results are usually similar, falling within 1% of each other 75% of the time. The EIA data is considered more reliable, since it is a government agency.
OPEC (Organization of the Petroleum Exporting Countries) is a group of 12 Oil-producing nations who collectively decide production quotas for member countries at twice-yearly meetings. Their decisions often impact WTI Oil prices. When OPEC decides to lower quotas, it can tighten supply, pushing up Oil prices. When OPEC increases production, it has the opposite effect. OPEC+ refers to an expanded group that includes ten extra non-OPEC members, the most notable of which is Russia.
(An automation tool was used in creating this post.)
07:39
Indonesia Bank Indonesia Rate in line with forecasts (5.75%)
EUR/GBP softens to around 0.8285 in Wednesday’s early European session.
UK CPI inflation rose to 3.0% YoY in January vs. 2.8% expected.
The dovish stance from the ECB might drag the Euro lower.
The EUR/GBP cross weakens to near 0.8285 during the early European trading hours on Wednesday. The Pound Sterling (GBP) edges higher against the Euro (EUR) after the hotter-than-expected UK Consumer Price Index (CPI) inflation data for January. Later on Wednesday, the Eurozone Current Account will be released.
Data released by the United Kingdom’s Office for National Statistics on Wednesday showed that the country’s headline CPI rose 3.0% YoY in January, compared to a 2.5% increase in December. This reading came in hotter than the 2.8% expected. The Core CPI, which excludes the volatile prices of food and energy, climbed 3.7% YoY in January versus 3.2% prior, in line with the market consensus of 3.7%.
Meanwhile, the monthly UK CPI inflation fell to -0.1% in January from +0.3% in December. Markets projected a -0.3% reading. The Pound Sterling holds steady in an immediate reaction to the upbeat UK CPI inflation data.
Slower growth in the Eurozone triggered the expectations of further interest rate reductions from the European Central Bank (ECB), which might weigh on the shared currency. Analysts expect the European Central Bank (ECB) to deliver quarter-point cuts at every meeting until mid-2025. That would bring the deposit rate to 2.0%
Inflation FAQs
Inflation measures the rise in the price of a representative basket of goods and services. Headline inflation is usually expressed as a percentage change on a month-on-month (MoM) and year-on-year (YoY) basis. Core inflation excludes more volatile elements such as food and fuel which can fluctuate because of geopolitical and seasonal factors. Core inflation is the figure economists focus on and is the level targeted by central banks, which are mandated to keep inflation at a manageable level, usually around 2%.
The Consumer Price Index (CPI) measures the change in prices of a basket of goods and services over a period of time. It is usually expressed as a percentage change on a month-on-month (MoM) and year-on-year (YoY) basis. Core CPI is the figure targeted by central banks as it excludes volatile food and fuel inputs. When Core CPI rises above 2% it usually results in higher interest rates and vice versa when it falls below 2%. Since higher interest rates are positive for a currency, higher inflation usually results in a stronger currency. The opposite is true when inflation falls.
Although it may seem counter-intuitive, high inflation in a country pushes up the value of its currency and vice versa for lower inflation. This is because the central bank will normally raise interest rates to combat the higher inflation, which attract more global capital inflows from investors looking for a lucrative place to park their money.
Formerly, Gold was the asset investors turned to in times of high inflation because it preserved its value, and whilst investors will often still buy Gold for its safe-haven properties in times of extreme market turmoil, this is not the case most of the time. This is because when inflation is high, central banks will put up interest rates to combat it. Higher interest rates are negative for Gold because they increase the opportunity-cost of holding Gold vis-a-vis an interest-bearing asset or placing the money in a cash deposit account. On the flipside, lower inflation tends to be positive for Gold as it brings interest rates down, making the bright metal a more viable investment alternative.
Here is what you need to know on Wednesday, February 19:
Investors observe heightened volatility in some currencies early Wednesday following key data releases and central bank decisions. In the second half of the day, Housing Starts and Building Permits data for January will be featured in the US economic docket. Later in the American session, the Federal Reserve (Fed) will release the minuted of the January policy meeting.
US Dollar PRICE This week
The table below shows the percentage change of US Dollar (USD) against listed major currencies this week. US Dollar was the weakest against the Japanese Yen.
USD
EUR
GBP
JPY
CAD
AUD
NZD
CHF
USD
0.38%
-0.24%
-0.36%
0.02%
-0.18%
-0.08%
0.41%
EUR
-0.38%
-0.46%
-0.79%
-0.26%
-0.47%
-0.35%
0.13%
GBP
0.24%
0.46%
-0.23%
0.21%
0.04%
0.11%
0.60%
JPY
0.36%
0.79%
0.23%
0.37%
0.21%
0.50%
0.75%
CAD
-0.02%
0.26%
-0.21%
-0.37%
-0.18%
-0.10%
0.38%
AUD
0.18%
0.47%
-0.04%
-0.21%
0.18%
0.12%
0.62%
NZD
0.08%
0.35%
-0.11%
-0.50%
0.10%
-0.12%
0.49%
CHF
-0.41%
-0.13%
-0.60%
-0.75%
-0.38%
-0.62%
-0.49%
The heat map shows percentage changes of major currencies against each other. The base currency is picked from the left column, while the quote currency is picked from the top row. For example, if you pick the US Dollar from the left column and move along the horizontal line to the Japanese Yen, the percentage change displayed in the box will represent USD (base)/JPY (quote).
US President Donald Trump said late Tuesday that they are looking to impose auto tariffs "in the neighborhood of 25%" as early as April 2. He further added that they are also planning to charge similar duties on pharmaceutical and semiconductor imports. The US Dollar (USD) Index edged slightly higher in the American session and registered small gains for the day. Early Wednesday, the USD Index holds steady near 107.00.
The Reserve Bank of New Zealand (RBNZ) announced in the Asian session on Wednesday that it lowered the policy rate by 50 basis points (bps) to 3.75% from 4.25%, as anticipated. In the policy statement, the RBNZ noted that they have confidence to continue to lower rates and Governor Adrian Orr explained afterward that the policy rate is projected to be lowered by another 50 bps by July. After dropping to a daily low of 0.5677 with the immediate reaction to RBNZ announcements, NZD/USD regained its traction and was last seen trading in positive territory above 0.5700.
The UK's Office for National Statistics reported early Wednesday that inflation in the UK, as measured by the change in the Consumer Price Index (CPI), climbed to 3% in January from 2.5% in December. In the same period, the core CPI increased by 3.7%, as anticipated. Other details of the report showed that the Retail Price Index declined by 0.1% on a monthly basis. GBP/USD holds steady above 1.2600 following these data releases.
EUR/USD lost about 0.4% on Tuesday but managed to find a foothold. In the European morning on Wednesday, the pair trades in a tight range at around 1.0450.
After snapping a three-day losing streak on Tuesday, USD/JPY came under renewed bearish pressure and declined below 152.00 on Wednesday. Bank of Japan (BoJ) Board Member Hajime Takata said on Wednesday that the BoJ must gradually shift policy, even after January's rate hike, to avoid upside price risks from materializing.
Gold gathered bullish momentum and rose more than 1% on Tuesday. XAU/USD stays in a consolidation phase above $2,930 on Wednesday and remains within a touching distance of the all-time high it set at $2,942 earlier this month.
Fed FAQs
Monetary policy in the US is shaped by the Federal Reserve (Fed). The Fed has two mandates: to achieve price stability and foster full employment. Its primary tool to achieve these goals is by adjusting interest rates. When prices are rising too quickly and inflation is above the Fed’s 2% target, it raises interest rates, increasing borrowing costs throughout the economy. This results in a stronger US Dollar (USD) as it makes the US a more attractive place for international investors to park their money. When inflation falls below 2% or the Unemployment Rate is too high, the Fed may lower interest rates to encourage borrowing, which weighs on the Greenback.
The Federal Reserve (Fed) holds eight policy meetings a year, where the Federal Open Market Committee (FOMC) assesses economic conditions and makes monetary policy decisions. The FOMC is attended by twelve Fed officials – the seven members of the Board of Governors, the president of the Federal Reserve Bank of New York, and four of the remaining eleven regional Reserve Bank presidents, who serve one-year terms on a rotating basis.
In extreme situations, the Federal Reserve may resort to a policy named Quantitative Easing (QE). QE is the process by which the Fed substantially increases the flow of credit in a stuck financial system. It is a non-standard policy measure used during crises or when inflation is extremely low. It was the Fed’s weapon of choice during the Great Financial Crisis in 2008. It involves the Fed printing more Dollars and using them to buy high grade bonds from financial institutions. QE usually weakens the US Dollar.
Quantitative tightening (QT) is the reverse process of QE, whereby the Federal Reserve stops buying bonds from financial institutions and does not reinvest the principal from the bonds it holds maturing, to purchase new bonds. It is usually positive for the value of the US Dollar.
07:02
United Kingdom Retail Price Index (MoM) in line with expectations (-0.1%) in January
07:01
United Kingdom Producer Price Index - Input (YoY) n.s.a registered at -0.1% above expectations (-0.5%) in January
07:01
United Kingdom Core Consumer Price Index (YoY) meets forecasts (3.7%) in January
07:01
United Kingdom Producer Price Index - Output (YoY) n.s.a came in at 0.3%, above expectations (0.1%) in January
07:00
United Kingdom PPI Core Output (YoY) n.s.a remains at 1.5% in January
07:00
United Kingdom Consumer Price Index (MoM) registered at -0.1% above expectations (-0.3%) in January
07:00
United Kingdom Consumer Price Index (YoY) above expectations (2.8%) in January: Actual (3%)
07:00
United Kingdom Retail Price Index (YoY) came in at 3.6% below forecasts (3.7%) in January
07:00
United Kingdom Producer Price Index - Output (MoM) n.s.a above expectations (0.2%) in January: Actual (0.5%)
07:00
United Kingdom PPI Core Output (MoM) n.s.a: 0.3% (January) vs 0%
07:00
United Kingdom Producer Price Index - Input (MoM) n.s.a meets forecasts (0.8%) in January
Bank of Japan (BoJ) Board Member Hajime Takata is back on the wires this Wednesday, saying that he “won't comment on Japanese government bond (JGB) yield levels.”
Additional quotes
Long-term interest rates moving in line with state of Japan's economy.
Real interest rates remain negative.
Still not at stage to debate sale of the BoJ’s ETF holdings.
How to unload BoJ’s ETF holdings is something the BoJ must take time to deliberate.
The BoJ abandoned YCC so must allow markets to determine yield levels, though we also need to be vigilant to any sharp rise in market volatility.
We look at core inflation numbers excluding fresh food in gauging price trend.
But also mindful that rising fresh food costs could affect households' inflation expectations.
The closer we get towards the neutral rate, the harder it is to estimate the exact level.
No specific target, timing for further rate hikes.
It will be decided by looking at corporate activity, economy, and market moves.
Market reaction
As of writing, USD/JPY is trading 0.17% lower on the day at 151.71.
USD/CHF weakens to around 0.9030 in Wednesday’s early European.
Global geopolitical stress boosts the safe-haven flows, supporting the CHF.
Fed’s Daly said the central bank should keep short-term borrowing costs where they are until the progress is more visible.
The USD/CHF pair softens to near 0.9030 during the early European session on Wednesday. Tension-filled negotiations on the Russia-Ukraine conflict boost the safe-haven flows, benefiting the Swiss Franc (CHF). Traders will take more cues from the FOMC Minutes, which will be published later on Wednesday.
Ukraine President Volodymyr Zelenskiy said no peace deal could be made behind his back, per Reuters. Zelenskiy decided to postpone his visit to Saudi Arabia planned for Wednesday until March 10 to avoid giving "legitimacy" to the United States-Russia meetings. Investors will closely watch the developments surrounding the Russia-Ukraine peace talks. Any signs of escalating tensions between the two countries could boost the safe-haven currency like the CHF and create a headwind for the pair.
Data released by the Federal Reserve Bank of New York on Tuesday showed that the NY Empire State Manufacturing Index climbed to 5.7 in February from a fall of 12.6 in January. Meanwhile, San Francisco Fed President Mary Daly said on Tuesday that prospects of further rate cuts in 2025 remain uncertain despite an overall positive lean to US economic factors.
Market players brace for remarks by Fed officials later this week to gather more clues about the path ahead for US interest rates. Any hawkish comments from Fed policymakers could underpin the Greenback against the CHF in the near term.
Swiss Franc FAQs
The Swiss Franc (CHF) is Switzerland’s official currency. It is among the top ten most traded currencies globally, reaching volumes that well exceed the size of the Swiss economy. Its value is determined by the broad market sentiment, the country’s economic health or action taken by the Swiss National Bank (SNB), among other factors. Between 2011 and 2015, the Swiss Franc was pegged to the Euro (EUR). The peg was abruptly removed, resulting in a more than 20% increase in the Franc’s value, causing a turmoil in markets. Even though the peg isn’t in force anymore, CHF fortunes tend to be highly correlated with the Euro ones due to the high dependency of the Swiss economy on the neighboring Eurozone.
The Swiss Franc (CHF) is considered a safe-haven asset, or a currency that investors tend to buy in times of market stress. This is due to the perceived status of Switzerland in the world: a stable economy, a strong export sector, big central bank reserves or a longstanding political stance towards neutrality in global conflicts make the country’s currency a good choice for investors fleeing from risks. Turbulent times are likely to strengthen CHF value against other currencies that are seen as more risky to invest in.
The Swiss National Bank (SNB) meets four times a year – once every quarter, less than other major central banks – to decide on monetary policy. The bank aims for an annual inflation rate of less than 2%. When inflation is above target or forecasted to be above target in the foreseeable future, the bank will attempt to tame price growth by raising its policy rate. Higher interest rates are generally positive for the Swiss Franc (CHF) as they lead to higher yields, making the country a more attractive place for investors. On the contrary, lower interest rates tend to weaken CHF.
Macroeconomic data releases in Switzerland are key to assessing the state of the economy and can impact the Swiss Franc’s (CHF) valuation. The Swiss economy is broadly stable, but any sudden change in economic growth, inflation, current account or the central bank’s currency reserves have the potential to trigger moves in CHF. Generally, high economic growth, low unemployment and high confidence are good for CHF. Conversely, if economic data points to weakening momentum, CHF is likely to depreciate.
As a small and open economy, Switzerland is heavily dependent on the health of the neighboring Eurozone economies. The broader European Union is Switzerland’s main economic partner and a key political ally, so macroeconomic and monetary policy stability in the Eurozone is essential for Switzerland and, thus, for the Swiss Franc (CHF). With such dependency, some models suggest that the correlation between the fortunes of the Euro (EUR) and the CHF is more than 90%, or close to perfect.
USD/CAD trades within a falling wedge pattern, a bullish formation that indicates a potential breakout to the upside.
The pair could find immediate support around the falling wedge’s upper boundary at 1.4100.
The immediate resistance zone appears near the nine-day EMA at 1.4230, aligned with the upper boundary of the falling wedge.
The USD/CAD pair gives up its recent gains from the previous session, trading near 1.4180 during Asian hours on Wednesday. Technical analysis on the daily chart suggests a falling wedge pattern, a bullish formation that suggests a potential breakout to the upside.
Additionally, the 14-day Relative Strength Index (RSI) remains above the 30 level, supporting the current bearish outlook. However, a decline below 30 would indicate oversold conditions for the USD/CAD pair, potentially hinting at an upcoming upward correction.
However, the USD/CAD pair remains below the nine- and 14-day Exponential Moving Averages (EMAs), indicating persistent bearish sentiment and weak short-term price action. This positioning suggests continued selling pressure.
On the downside, the USD/CAD pair may find immediate support at the lower boundary of the falling wedge, aligning with the psychological level of 1.4100. A break below this channel would strengthen the bearish bias, potentially driving the pair toward the three-month low of 1.3927, last reached on November 25.
The USD/CAD pair may encounter immediate resistance near the nine-day EMA at 1.4230, which aligns with the upper boundary of the falling wedge. A further hurdle is seen at the 14-day EMA of 1.4263. A breakout above this key resistance zone could shift the bias to bullish, potentially driving the pair toward the psychological level of 1.4300.
USD/CAD: Daily Chart
Canadian Dollar PRICE Today
The table below shows the percentage change of Canadian Dollar (CAD) against listed major currencies today. Canadian Dollar was the weakest against the New Zealand Dollar.
USD
EUR
GBP
JPY
CAD
AUD
NZD
CHF
USD
-0.05%
-0.09%
-0.18%
-0.05%
-0.19%
-0.31%
-0.03%
EUR
0.05%
-0.04%
-0.11%
-0.01%
-0.15%
-0.26%
0.01%
GBP
0.09%
0.04%
-0.10%
0.05%
-0.11%
-0.22%
0.05%
JPY
0.18%
0.11%
0.10%
0.11%
-0.03%
-0.16%
0.12%
CAD
0.05%
0.00%
-0.05%
-0.11%
-0.14%
-0.27%
0.01%
AUD
0.19%
0.15%
0.11%
0.03%
0.14%
-0.12%
0.16%
NZD
0.31%
0.26%
0.22%
0.16%
0.27%
0.12%
0.28%
CHF
0.03%
-0.01%
-0.05%
-0.12%
-0.01%
-0.16%
-0.28%
The heat map shows percentage changes of major currencies against each other. The base currency is picked from the left column, while the quote currency is picked from the top row. For example, if you pick the Canadian Dollar from the left column and move along the horizontal line to the US Dollar, the percentage change displayed in the box will represent CAD (base)/USD (quote).
NZD/JPY recovers swiftly after the post-RBNZ slide to a one-week trough.
A positive risk tone undermines the JPY and also lends support to the cross.
BoJ rate hike bets help limit further JPY losses and cap gains for spot prices.
The NZD/JPY cross rebounds around 80-85 pips from a one-week trough touched during the Asian session on Wednesday and touches a fresh daily high, around the 87.00 mark in the last hour. Spot prices, however, struggle to capitalize on the move and currently trade near the 86.80 region, up less than 0.20% for the day.
The New Zealand Dollar (NZD) initially drifted lower after the Reserve Bank of New Zealand (RBNZ) delivered the widely expected outsized interest rate cut at the conclusion of the February policy meeting. The immediate market reaction, however, turned out to be short-lived as the central bank signaled that the end of the easing cycle was now not too distant and that further moves would be smaller in size. This, in turn, prompts some short-covering around the NZD/JPY cross.
In fact, RBNZ Governor Adrian Orr suggested further cuts of 25 basis points could come in April and May. Apart from this, a generally positive tone around the equity markets undermines the safe-haven Japanese Yen (JPY) and further contributes to the goodish intraday move up. That said, the growing acceptance that the Bank of Japan (BoJ) will hike interest rates further this year helps limit the downside for the JPY and keeps a lid on any further gains for the NZD/JPY cross.
Hence, it will be prudent to wait for strong follow-through buying before confirming that spot prices have bottomed out and positioning for an extension of the recent bounce from the 85.20 region, or a six-month low touched earlier this month.
Economic Indicator
RBNZ Interest Rate Decision
The Reserve Bank of New Zealand (RBNZ) announces its interest rate decision after its seven scheduled annual policy meetings. If the RBNZ is hawkish and sees inflationary pressures rising, it raises the Official Cash Rate (OCR) to bring inflation down. This is positive for the New Zealand Dollar (NZD) since higher interest rates attract more capital inflows. Likewise, if it reaches the view that inflation is too low it lowers the OCR, which tends to weaken NZD.
The Reserve Bank of New Zealand (RBNZ) holds monetary policy meetings seven times a year, announcing their decision on interest rates and the economic assessments that influenced their decision. The central bank offers clues on the economic outlook and future policy path, which are of high relevance for the NZD valuation. Positive economic developments and upbeat outlook could lead the RBNZ to tighten the policy by hiking interest rates, which tends to be NZD bullish. The policy announcements are usually followed by Governor Adrian Orr’s press conference.
EUR/USD trades with mild gains near 1.0450 in Wednesday’s Asian session.
Trump floated 25% tariffs on US auto, drug and chip imports.
Eurozone ZEW Economic Sentiment Index jumped to 24.2 in February vs. 24.3 expected.
The EUR/USD pair posts modest gains to around 1.0450 during the Asian trading hours on Wednesday, bolstered by the weakening of the US Dollar (USD). However, tariff concerns and tense Russia-Ukraine negotiations might boost the Greenback, a safe-haven currency, and cap the upside for the major pair.
US President Donald Trump said late Tuesday that he would likely impose tariffs on automobile, semiconductor and pharmaceutical imports of around 25%, with an announcement coming as soon as April 2.
Ukraine President Volodymyr Zelenskiy said no peace deal could be made for the time being. He postponed his visit to Saudi Arabia planned for Wednesday until March 10 to avoid giving "legitimacy" to the US-Russia talks. The uncertainty, geopolitical tensions and tariff threats could lift the USD and act as a tailwind for the pair.
Investors await the release of the FOMC Minutes for the January meeting, which are due later on Wednesday. This report could offer some hints about how policymakers are weighing the risk of a global trade war.
Across the pond, the Eurozone ZEW Economic Sentiment Index came in at 24.2 in February versus 18.0 prior, missing the estimation. The rising bets that the European Central Bank (ECB) will further cut the interest rates three times this year might weigh on the Euro (EUR).
Euro FAQs
The Euro is the currency for the 19 European Union countries that belong to the Eurozone. It is the second most heavily traded currency in the world behind the US Dollar. In 2022, it accounted for 31% of all foreign exchange transactions, with an average daily turnover of over $2.2 trillion a day. EUR/USD is the most heavily traded currency pair in the world, accounting for an estimated 30% off all transactions, followed by EUR/JPY (4%), EUR/GBP (3%) and EUR/AUD (2%).
The European Central Bank (ECB) in Frankfurt, Germany, is the reserve bank for the Eurozone. The ECB sets interest rates and manages monetary policy. The ECB’s primary mandate is to maintain price stability, which means either controlling inflation or stimulating growth. Its primary tool is the raising or lowering of interest rates. Relatively high interest rates – or the expectation of higher rates – will usually benefit the Euro and vice versa. The ECB Governing Council makes monetary policy decisions at meetings held eight times a year. Decisions are made by heads of the Eurozone national banks and six permanent members, including the President of the ECB, Christine Lagarde.
Eurozone inflation data, measured by the Harmonized Index of Consumer Prices (HICP), is an important econometric for the Euro. If inflation rises more than expected, especially if above the ECB’s 2% target, it obliges the ECB to raise interest rates to bring it back under control. Relatively high interest rates compared to its counterparts will usually benefit the Euro, as it makes the region more attractive as a place for global investors to park their money.
Data releases gauge the health of the economy and can impact on the Euro. Indicators such as GDP, Manufacturing and Services PMIs, employment, and consumer sentiment surveys can all influence the direction of the single currency. A strong economy is good for the Euro. Not only does it attract more foreign investment but it may encourage the ECB to put up interest rates, which will directly strengthen the Euro. Otherwise, if economic data is weak, the Euro is likely to fall. Economic data for the four largest economies in the euro area (Germany, France, Italy and Spain) are especially significant, as they account for 75% of the Eurozone’s economy.
Another significant data release for the Euro is the Trade Balance. This indicator measures the difference between what a country earns from its exports and what it spends on imports over a given period. If a country produces highly sought after exports then its currency will gain in value purely from the extra demand created from foreign buyers seeking to purchase these goods. Therefore, a positive net Trade Balance strengthens a currency and vice versa for a negative balance.
Gold prices fell in India on Wednesday, according to data compiled by FXStreet.
The price for Gold stood at 8,180.50 Indian Rupees (INR) per gram, down compared with the INR 8,196.71 it cost on Tuesday.
The price for Gold decreased to INR 95,415.70 per tola from INR 95,603.09 per tola a day earlier.
Unit measure
Gold Price in INR
1 Gram
8,180.50
10 Grams
81,804.96
Tola
95,415.70
Troy Ounce
254,446.60
FXStreet calculates Gold prices in India by adapting international prices (USD/INR) to the local currency and measurement units. Prices are updated daily based on the market rates taken at the time of publication. Prices are just for reference and local rates could diverge slightly.
Gold has played a key role in human’s history as it has been widely used as a store of value and medium of exchange. Currently, apart from its shine and usage for jewelry, the precious metal is widely seen as a safe-haven asset, meaning that it is considered a good investment during turbulent times. Gold is also widely seen as a hedge against inflation and against depreciating currencies as it doesn’t rely on any specific issuer or government.
Central banks are the biggest Gold holders. In their aim to support their currencies in turbulent times, central banks tend to diversify their reserves and buy Gold to improve the perceived strength of the economy and the currency. High Gold reserves can be a source of trust for a country’s solvency. Central banks added 1,136 tonnes of Gold worth around $70 billion to their reserves in 2022, according to data from the World Gold Council. This is the highest yearly purchase since records began. Central banks from emerging economies such as China, India and Turkey are quickly increasing their Gold reserves.
Gold has an inverse correlation with the US Dollar and US Treasuries, which are both major reserve and safe-haven assets. When the Dollar depreciates, Gold tends to rise, enabling investors and central banks to diversify their assets in turbulent times. Gold is also inversely correlated with risk assets. A rally in the stock market tends to weaken Gold price, while sell-offs in riskier markets tend to favor the precious metal.
The price can move due to a wide range of factors. Geopolitical instability or fears of a deep recession can quickly make Gold price escalate due to its safe-haven status. As a yield-less asset, Gold tends to rise with lower interest rates, while higher cost of money usually weighs down on the yellow metal. Still, most moves depend on how the US Dollar (USD) behaves as the asset is priced in dollars (XAU/USD). A strong Dollar tends to keep the price of Gold controlled, whereas a weaker Dollar is likely to push Gold prices up.
(An automation tool was used in creating this post.)
Gold price drifts lower as bulls opt to lighten their bets ahead of the FOMC minutes release.
Concerns about Trump’s tariff plans and trade war fears lend support to the commodity.
Fed rate cut bets undermine the USD and further act as a tailwind for the XAU/USD pair.
Gold price (XAU/USD) attracts some sellers during the Asian session on Wednesday and erodes a part of the previous day's strong move back up closer to the record high. The downtick could be attributed to some profit-taking amid a generally positive risk tone, which tends to undermine demand for the safe-haven bullion. That said, the uncertainty surrounding US President Donald Trump's tariff plans might continue to act as a tailwind for the precious metal.
Meanwhile, expectations that the Federal Reserve (Fed) might cut interest rates further this year, bolstered by a surprise drop in US Retail Sales, fail to assist the US Dollar (USD) to capitalize on Tuesday's modest gains. This should contribute to limiting any meaningful slide for the Gold price. Traders might opt to wait for the FOMC meeting minutes for cues about the rate-cut path before placing directional bets around the non-yielding yellow metal.
Gold price bulls turn cautious amid a positive risk tone, ahead of FOMC meeting minutes
The optimism over a delay in the implementation of US President Donald Trump's reciprocal tariffs and talks aimed at ending the protracted Russia-Ukraine war prompted some profit-taking around the Gold price on Wednesday.
Investors remain worried about a potential escalation in global trade tensions on the back of Trump's protectionist policies. This, along with bets for further policy easing by the Federal Reserve, supports the safe-haven bullion.
The disappointing release of US Retail Sales figures on Friday, along with mixed signals on inflation, suggests that the US central bank could possibly cut interest rates at the September or October monetary policy meeting.
In fact, the Fed Funds Futures see the possibility of a 40 basis point rate cut by the end of this year. This keeps a lid on the US Dollar (USD) recovery from a two-month low and should further underpin the XAU/USD.
San Francisco Fed President Mary Daly said on Tuesday that the US central bank should keep short-term borrowing costs where they are until the progress toward achieving the 2% inflation target is more visible.
Hence, the market focus will remain on the release of the Fed's January meeting minutes, which will be looked upon for clues about the central bank's interest rate trajectory and influence on the non-yielding yellow metal.
Gold price technical setup supports prospects for the emergence of dip-buying below $2,925
From a technical perspective, the range-bound price action might still be categorized as a bullish consolidation phase against the backdrop of the recent strong move up to the all-time peak. That said, the daily Relative Strength Index (RSI) remains close to the overbought territory and supports prospects for an extension of the consolidative price move. Nevertheless, the setup remains tilted in favor of bulls and suggests that the path of least resistance for the XAU/USD remains to the upside.
Meanwhile, weakness below the $2,925 area is likely to find some support near the $2,900 mark ahead of the $2,878-2,876 zone or the lower boundary of the short-term trading range. A convincing break below the latter could drag the Gold price to the $2,860-2,855 area en route to the $2,834 region. Failure to defend the said support levels might prompt some technical selling and drag the XAU/USD towards the $2,815 region en route to the $2,800 mark and the $2,785-2,784 area.
On the flip side, the $2,940-2,942 region, or the record high touched earlier this month, might continue to act as an immediate strong barrier. Some follow-through buying will be seen as a fresh trigger for bullish traders and set the stage for an extension of a well-established uptrend witnessed over the past two months or so.
Gold FAQs
Gold has played a key role in human’s history as it has been widely used as a store of value and medium of exchange. Currently, apart from its shine and usage for jewelry, the precious metal is widely seen as a safe-haven asset, meaning that it is considered a good investment during turbulent times. Gold is also widely seen as a hedge against inflation and against depreciating currencies as it doesn’t rely on any specific issuer or government.
Central banks are the biggest Gold holders. In their aim to support their currencies in turbulent times, central banks tend to diversify their reserves and buy Gold to improve the perceived strength of the economy and the currency. High Gold reserves can be a source of trust for a country’s solvency. Central banks added 1,136 tonnes of Gold worth around $70 billion to their reserves in 2022, according to data from the World Gold Council. This is the highest yearly purchase since records began. Central banks from emerging economies such as China, India and Turkey are quickly increasing their Gold reserves.
Gold has an inverse correlation with the US Dollar and US Treasuries, which are both major reserve and safe-haven assets. When the Dollar depreciates, Gold tends to rise, enabling investors and central banks to diversify their assets in turbulent times. Gold is also inversely correlated with risk assets. A rally in the stock market tends to weaken Gold price, while sell-offs in riskier markets tend to favor the precious metal.
The price can move due to a wide range of factors. Geopolitical instability or fears of a deep recession can quickly make Gold price escalate due to its safe-haven status. As a yield-less asset, Gold tends to rise with lower interest rates, while higher cost of money usually weighs down on the yellow metal. Still, most moves depend on how the US Dollar (USD) behaves as the asset is priced in dollars (XAU/USD). A strong Dollar tends to keep the price of Gold controlled, whereas a weaker Dollar is likely to push Gold prices up.
GBP/USD appreciates as the US Dollar loses ground amid lower Treasury yields.
Trump shared plans to impose a 25% tariff on foreign cars, with higher duties expected on semiconductor chips and pharmaceuticals.
Traders await the UK Consumer Price Index (CPI) data for fresh insights into the BoE’s policy outlook.
GBP/USD remains firm after losses in the previous session, trading around 1.2610 during the Asian session on Wednesday. Traders await the release of January’s Consumer Price Index (CPI) data from the United Kingdom (UK) scheduled to be released later in the day. The Pound Sterling (GBP) could see significant movement in response to the inflation report, which may influence the Bank of England’s (BoE) interest rate-cut strategy amid ongoing inflationary pressures.
The pair finds support as the US Dollar (USD) struggles amid falling Treasury yields, despite ongoing caution regarding the Federal Reserve’s (Fed) policy outlook. Investors await the release of the FOMC Minutes later in the North American session.
The US Dollar Index (DXY), which measures the USD against six major currencies, has edged lower to around 107.00. Meanwhile, US Treasury yields stand at 4.30% for the 2-year note and 4.54% for the 10-year note at the time of writing.
On Tuesday, San Francisco Fed President Mary Daly noted that while US economic conditions remain positive, the outlook for rate cuts in 2025 remains uncertain. Philadelphia Fed President Patrick Harker reinforced the need for a steady interest rate policy, citing persistent inflation concerns.
However, the USD could regain strength as risk sentiment shifts following fresh tariff threats from US President Donald Trump. According to Bloomberg, Trump stated on Tuesday that he plans to impose a 25% tariff on foreign cars, with higher duties also expected on semiconductor chips and pharmaceuticals. He indicated that an official announcement could come as soon as April 2.
Pound Sterling FAQs
The Pound Sterling (GBP) is the oldest currency in the world (886 AD) and the official currency of the United Kingdom. It is the fourth most traded unit for foreign exchange (FX) in the world, accounting for 12% of all transactions, averaging $630 billion a day, according to 2022 data. Its key trading pairs are GBP/USD, also known as ‘Cable’, which accounts for 11% of FX, GBP/JPY, or the ‘Dragon’ as it is known by traders (3%), and EUR/GBP (2%). The Pound Sterling is issued by the Bank of England (BoE).
The single most important factor influencing the value of the Pound Sterling is monetary policy decided by the Bank of England. The BoE bases its decisions on whether it has achieved its primary goal of “price stability” – a steady inflation rate of around 2%. Its primary tool for achieving this is the adjustment of interest rates. When inflation is too high, the BoE will try to rein it in by raising interest rates, making it more expensive for people and businesses to access credit. This is generally positive for GBP, as higher interest rates make the UK a more attractive place for global investors to park their money. When inflation falls too low it is a sign economic growth is slowing. In this scenario, the BoE will consider lowering interest rates to cheapen credit so businesses will borrow more to invest in growth-generating projects.
Data releases gauge the health of the economy and can impact the value of the Pound Sterling. Indicators such as GDP, Manufacturing and Services PMIs, and employment can all influence the direction of the GBP. A strong economy is good for Sterling. Not only does it attract more foreign investment but it may encourage the BoE to put up interest rates, which will directly strengthen GBP. Otherwise, if economic data is weak, the Pound Sterling is likely to fall.
Another significant data release for the Pound Sterling is the Trade Balance. This indicator measures the difference between what a country earns from its exports and what it spends on imports over a given period. If a country produces highly sought-after exports, its currency will benefit purely from the extra demand created from foreign buyers seeking to purchase these goods. Therefore, a positive net Trade Balance strengthens a currency and vice versa for a negative balance.
United Kingdom’s Office for National Statistics will publish the January CPI data on Wednesday.
The annual UK headline and core CPI inflation are expected to increase in January.
The Pound Sterling braces for volatility on the UK CPI report data release amid a prudent BoE.
The high-impact Consumer Price Index (CPI) data from the United Kingdom (UK) for January will be published by the Office for National Statistics (ONS) on Wednesday at 07:00 GMT.
The Pound Sterling (GBP) could witness a big reaction to the UK CPI inflation report, which will likely have a strong bearing on the Bank of England’s (BoE) interest rate-cut path amid upside risks to inflation.
What to expect from the next UK inflation report?
The UK Consumer Price Index is expected to rise at an annual rate of 2.8% in January after increasing by 2.5% in December.
The reading is set to move further away from the BoE’s 2.0% target.
Core CPI inflation, which excludes energy, food, alcohol and tobacco prices, is forecast to climb to 3.6% YoY in January from December’s 3.2%.
According to a Bloomberg survey of economists, official data is expected to show that service inflation jumped to 5.2% in January after falling to 4.4% in December.
Meanwhile, the British monthly CPI is seen declining 0.3% in the same period, as against the previous growth of 0.3%.
Previewing the UK inflation data, TD Securities analysts noted: “Inflation is set to rebound sharply after December airfares were surveyed early in the month and missed the usual seasonal bump. The Monetary Policy Committee (MPC) expects this too, and is looking for core inflation of 3.9% year-on-year (YoY), having set the bar quite high for upside inflation surprises in the next few months. Still, it'll make for uncomfortable reading even if some of the drivers are temporary.”
At its monetary policy meeting earlier this month, the BoE lowered the benchmark policy rate by 25 basis points (bps) to 4.5% after the UK annual headline and services inflation unexpectedly cooled in December.
However, BoE Governor Andrew Bailey maintained a cautious stance on future rate cuts, noting that "we must judge in future meetings whether underlying inflation pressures are easing enough to allow further cuts."
"We must proceed carefully,” he added.
Therefore, the January UK CPI data will be closely scrutinized for fresh hints on the BoE’s easing trajectory.
A hotter-than-expected headline and core inflation data will strengthen the expectations of the BoE’s prudent approach to policy easing, providing a fresh boost to the Pound Sterling uptrend. In this case, GBP/USD could target the 1.2700 round figure. On the other hand, a downside surprise in the inflation readings could rekindle bets for aggressive BoE rate cuts, fuelling a GBP/USD correction from over two-month highs.
Dhwani Mehta, Asian Session Lead Analyst at FXStreet, offers a brief technical outlook for the major and explains: “GBP/USD is challenging the key resistance near 1.2605 heading into the UK CPI data release, with the 14-day Relative Strength Index (RSI) momentum indicator in the daily chart holding firm above 50. The 21-day Simple Moving Average (SMA) is on the verge of crossing the 50-day SMA from below, which, if it occurs on a daily closing basis, will confirm a Bull Cross. These technical indicators point to a sustained uptrend for the pair.”
Mehta adds: “However, the pair needs acceptance above the 100-day SMA at 1.2665 to initiate a meaningful upside toward the 200-day SMA at 1.2788. Ahead of that level, the 1.2700 round level must be recovered. On the flip side, the immediate support is seen at the 21-day SMA and the 50-day SMA confluence at around 1.2460. Should the selling pressure intensify, the rising trendline support drawn from the January 13 low at 1.2357 will come to the buyers’ rescue.
Economic Indicator
Consumer Price Index (YoY)
The United Kingdom (UK) Consumer Price Index (CPI), released by the Office for National Statistics on a monthly basis, is a measure of consumer price inflation – the rate at which the prices of goods and services bought by households rise or fall – produced to international standards. It is the inflation measure used in the government’s target. The YoY reading compares prices in the reference month to a year earlier. Generally, a high reading is seen as bullish for the Pound Sterling (GBP), while a low reading is seen as bearish.
The Bank of England is tasked with keeping inflation, as measured by the headline Consumer Price Index (CPI) at around 2%, giving the monthly release its importance. An increase in inflation implies a quicker and sooner increase of interest rates or the reduction of bond-buying by the BOE, which means squeezing the supply of pounds. Conversely, a drop in the pace of price rises indicates looser monetary policy. A higher-than-expected result tends to be GBP bullish.
Inflation FAQs
Inflation measures the rise in the price of a representative basket of goods and services. Headline inflation is usually expressed as a percentage change on a month-on-month (MoM) and year-on-year (YoY) basis. Core inflation excludes more volatile elements such as food and fuel which can fluctuate because of geopolitical and seasonal factors. Core inflation is the figure economists focus on and is the level targeted by central banks, which are mandated to keep inflation at a manageable level, usually around 2%.
The Consumer Price Index (CPI) measures the change in prices of a basket of goods and services over a period of time. It is usually expressed as a percentage change on a month-on-month (MoM) and year-on-year (YoY) basis. Core CPI is the figure targeted by central banks as it excludes volatile food and fuel inputs. When Core CPI rises above 2% it usually results in higher interest rates and vice versa when it falls below 2%. Since higher interest rates are positive for a currency, higher inflation usually results in a stronger currency. The opposite is true when inflation falls.
Although it may seem counter-intuitive, high inflation in a country pushes up the value of its currency and vice versa for lower inflation. This is because the central bank will normally raise interest rates to combat the higher inflation, which attract more global capital inflows from investors looking for a lucrative place to park their money.
Formerly, Gold was the asset investors turned to in times of high inflation because it preserved its value, and whilst investors will often still buy Gold for its safe-haven properties in times of extreme market turmoil, this is not the case most of the time. This is because when inflation is high, central banks will put up interest rates to combat it. Higher interest rates are negative for Gold because they increase the opportunity-cost of holding Gold vis-a-vis an interest-bearing asset or placing the money in a cash deposit account. On the flipside, lower inflation tends to be positive for Gold as it brings interest rates down, making the bright metal a more viable investment alternative.
NZD/USD could rise toward the upper boundary of the ascending channel at 0.5790 level.
The 14-day RSI remains above the 50 mark, strengthening the bullish sentiment.
The immediate supports appear at nine- and 14-day EMAs of 0.5695 and 0.5685, respectively.
The NZD/USD pair trades near 0.5710 during Asian hours on Wednesday. However, the pair faced challenges following the Reserve Bank of New Zealand’s (RBNZ) decision to lower the Official Cash Rate (OCR) by 50 basis points (bps) from 4.25% to 3.75%.
RBNZ Governor Adrian Orr delivers prepared remarks on the policy statement and addresses media questions at the post-meeting press conference. Orr said that the OCR path forecasts a 50 bps reduction by mid-year, likely around July, in two 25 bps increments. The economy has substantial spare capacity, making rate cuts in April and May appropriate.
Technical analysis of the daily chart indicates a bullish market sentiment, with the pair remaining within an ascending channel pattern. The 14-day Relative Strength Index (RSI) stays above the 50 mark, reinforcing the bullish outlook. Additionally, the NZD/USD pair is positioned above the nine- and 14-day Exponential Moving Averages (EMAs), signaling a stronger short-term momentum.
To the upside, the NZD/USD pair could rise toward the upper boundary of the ascending channel at the 0.5790 level, followed by the two-month high of 0.5794, reached on January 24.
The NZD/USD pair tests immediate support at the nine-day EMA at 0.5695, followed by a 14-day EMA at 0.5685 level. Further support region appears at the ascending channel’s lower boundary at 0.5650 level.
A break below the channel would weaken the bullish bias and put downward pressure on the NZD/USD pair to navigate the region around 0.5516, its lowest point since October 2022, recorded on February 3.
NZD/USD: Daily Chart
New Zealand Dollar PRICE Today
The table below shows the percentage change of New Zealand Dollar (NZD) against listed major currencies today. New Zealand Dollar was the strongest against the Japanese Yen.
USD
EUR
GBP
JPY
CAD
AUD
NZD
CHF
USD
-0.03%
-0.07%
0.00%
-0.03%
-0.15%
-0.27%
0.00%
EUR
0.03%
-0.04%
0.06%
-0.00%
-0.12%
-0.24%
0.03%
GBP
0.07%
0.04%
0.08%
0.04%
-0.08%
-0.20%
0.07%
JPY
0.00%
-0.06%
-0.08%
-0.05%
-0.17%
-0.30%
-0.02%
CAD
0.03%
0.00%
-0.04%
0.05%
-0.12%
-0.24%
0.03%
AUD
0.15%
0.12%
0.08%
0.17%
0.12%
-0.11%
0.15%
NZD
0.27%
0.24%
0.20%
0.30%
0.24%
0.11%
0.27%
CHF
-0.00%
-0.03%
-0.07%
0.02%
-0.03%
-0.15%
-0.27%
The heat map shows percentage changes of major currencies against each other. The base currency is picked from the left column, while the quote currency is picked from the top row. For example, if you pick the New Zealand Dollar from the left column and move along the horizontal line to the US Dollar, the percentage change displayed in the box will represent NZD (base)/USD (quote).
The Japanese Yen attracts sellers for the second straight day due to a positive risk tone.
Bets for more interest rate hikes by the BoJ should help limit deeper losses for the JPY.
The divergent BoJ-Fed expectations should contribute to capping gains for USD/JPY.
The Japanese Yen (JPY) struggles to capitalize on a modest Asian session uptick and turns lower for the second consecutive day against its American counterpart on Wednesday. The optimism over a delay in the implementation of Trump's reciprocal tariffs and talks aimed at ending the Russia-Ukraine war remains supportive of a positive tone around the equity markets. This, in turn, is seen as a key factor undermining the safe-haven JPY, which, along with a modest US Dollar (USD) uptick, assists the USD/JPY pair to rebound around 40 pips from the daily low.
Any meaningful JPY depreciation, however, seems elusive in the wake of rising bets that the Bank of Japan (BoJ) will hike interest rates further amid signs of broadening inflation. Meanwhile, hawkish BoJ expectations led to the recent significant rise in Japanese bond yields. The resultant narrowing of the rate differential between Japan and other countries supports prospects for the emergence of some JPY dip-buying. This, in turn, warrants some caution before placing aggressive bullish bets around the USD/JPY pair ahead of the release of the FOMC minutes later today.
Japanese Yen bulls have the upper hand amid hawkish BoJ expectations
Bank of Japan Governor Kazuo Ueda and Deputy Governor Himino recently signaled the possibility of another rate hike if the economy and prices align with the projections.
Adding to this, BoJ Board Member Hajime Takata said on Wednesday that the central bank must gradually shift policy to avoid upside price risks from materializing.
Moreover, Japan's upbeat Q4 Gross Domestic Product (GDP) print on Monday boosted bets for further policy tightening by the BoJ amid signs of persistently high inflation.
The International Monetary Fund estimates Japan's neutral rate to be between 1% and 2%, and anticipates the BoJ to raise rates to around the mid-point of 1.5% by the end of 2027.
The yield on the benchmark 10-year Japanese government bond reached levels not seen since 2010 earlier this week, which should continue to underpin the Japanese Yen.
Officials from the US and Russia held a crucial meeting in Saudi Arabia to discuss ways to halt the almost three-year-old war in Ukraine and also agreed to hold more talks.
Furthermore, a delay in the implementation of US President Donald Trump's reciprocal tariffs remains supportive of a positive risk tone and undermines the safe-haven JPY.
Market participants now look forward to the release of minutes of the Federal Reserve's latest policy meeting in January for fresh cues about the future interest rate-cut path.
USD/JPY could attract fresh supply and remain capped near the 200-day SMA
From a technical perspective, any subsequent move up is more likely to face stiff resistance near the 200-day Simple Moving Average (SMA), currently pegged near the 152.65 region. This is followed by the 153.00 mark and the 100-day SMA barrier, around the 153.30-153.35 zone, which if cleared decisively should pave the way for additional gains. The USD/JPY pair might then accelerate the positive move towards reclaiming the 154.00 mark en route to the 154.45-154.50 supply zone, last week's swing high, around the 154.75-154.80 region, and the 155.00 psychological mark.
On the flip side, weakness below the 151.75 area, or the Asian session trough, could extend towards the overnight swing low, around the 151.25 region. Some follow-through selling, leading to a subsequent breakdown below the 151.00 mark, will be seen as a fresh trigger for bearish traders. The USD/JPY pair might then accelerate the fall towards the 150.60 intermediate support before eventually dropping to the 150.00 psychological mark. The downward trajectory could extend further towards the 149.60-149.55 region en route to the 149.00 mark and the December 2024 low, around the 148.65 region.
Japanese Yen FAQs
The Japanese Yen (JPY) is one of the world’s most traded currencies. Its value is broadly determined by the performance of the Japanese economy, but more specifically by the Bank of Japan’s policy, the differential between Japanese and US bond yields, or risk sentiment among traders, among other factors.
One of the Bank of Japan’s mandates is currency control, so its moves are key for the Yen. The BoJ has directly intervened in currency markets sometimes, generally to lower the value of the Yen, although it refrains from doing it often due to political concerns of its main trading partners. The BoJ ultra-loose monetary policy between 2013 and 2024 caused the Yen to depreciate against its main currency peers due to an increasing policy divergence between the Bank of Japan and other main central banks. More recently, the gradually unwinding of this ultra-loose policy has given some support to the Yen.
Over the last decade, the BoJ’s stance of sticking to ultra-loose monetary policy has led to a widening policy divergence with other central banks, particularly with the US Federal Reserve. This supported a widening of the differential between the 10-year US and Japanese bonds, which favored the US Dollar against the Japanese Yen. The BoJ decision in 2024 to gradually abandon the ultra-loose policy, coupled with interest-rate cuts in other major central banks, is narrowing this differential.
The Japanese Yen is often seen as a safe-haven investment. This means that in times of market stress, investors are more likely to put their money in the Japanese currency due to its supposed reliability and stability. Turbulent times are likely to strengthen the Yen’s value against other currencies seen as more risky to invest in.
Tariffs FAQs
Tariffs are customs duties levied on certain merchandise imports or a category of products. Tariffs are designed to help local producers and manufacturers be more competitive in the market by providing a price advantage over similar goods that can be imported. Tariffs are widely used as tools of protectionism, along with trade barriers and import quotas.
Although tariffs and taxes both generate government revenue to fund public goods and services, they have several distinctions. Tariffs are prepaid at the port of entry, while taxes are paid at the time of purchase. Taxes are imposed on individual taxpayers and businesses, while tariffs are paid by importers.
There are two schools of thought among economists regarding the usage of tariffs. While some argue that tariffs are necessary to protect domestic industries and address trade imbalances, others see them as a harmful tool that could potentially drive prices higher over the long term and lead to a damaging trade war by encouraging tit-for-tat tariffs.
During the run-up to the presidential election in November 2024, Donald Trump made it clear that he intends to use tariffs to support the US economy and American producers. In 2024, Mexico, China and Canada accounted for 42% of total US imports. In this period, Mexico stood out as the top exporter with $466.6 billion, according to the US Census Bureau. Hence, Trump wants to focus on these three nations when imposing tariffs. He also plans to use the revenue generated through tariffs to lower personal income taxes.
Silver price edges lower to $32.75 in Wednesday’s Asian session.
The constructive outlook of Silver remains in play above the 100-day EMA with the bullish RSI indicator.
The first upside barrier emerges at the $33.30-$33.40 region; the initial support level is located at $31.79.
Silver price (XAG/USD) attracts some sellers to near $32.75 during the Asian trading hours on Wednesday. The downside for the white metal might be limited amid the policy uncertainty, including tariff fears under US President Donald Trump’s administration. Later on Wednesday, the FOMC Minutes will be in the spotlight.
According to the daily chart, Silver keeps a bullish vibe at present as the price is well-supported above the key 100-day Exponential Moving Average (EMA). Furthermore, the upward momentum is supported by the 14-day Relative Strength Index (RSI), which is located above the midline near 66.30, suggesting that the path of least resistance is to the upside.
The immediate resistance level for Silver price emerges in the $33.30-$33.40 zone, representing the upper boundary of the Bollinger Band and the high of February 14. Any follow-through buying above this level could expose $34.55, the high of October 29, 2024. The next hurdle to watch is $34.87, the high of October 22, 2024.
On the other hand, the first downside target of the white metal is seen at $31.79, the low of February 7. The crucial contention level is located at the $31.00-$30.90 region, portraying the round mark and the 100-day EMA. Extended losses below the mentioned level could pave the way to $29.70, the low of January 27.
Silver price (XAG/USD) daily chart
Silver FAQs
Silver is a precious metal highly traded among investors. It has been historically used as a store of value and a medium of exchange. Although less popular than Gold, traders may turn to Silver to diversify their investment portfolio, for its intrinsic value or as a potential hedge during high-inflation periods. Investors can buy physical Silver, in coins or in bars, or trade it through vehicles such as Exchange Traded Funds, which track its price on international markets.
Silver prices can move due to a wide range of factors. Geopolitical instability or fears of a deep recession can make Silver price escalate due to its safe-haven status, although to a lesser extent than Gold's. As a yieldless asset, Silver tends to rise with lower interest rates. Its moves also depend on how the US Dollar (USD) behaves as the asset is priced in dollars (XAG/USD). A strong Dollar tends to keep the price of Silver at bay, whereas a weaker Dollar is likely to propel prices up. Other factors such as investment demand, mining supply – Silver is much more abundant than Gold – and recycling rates can also affect prices.
Silver is widely used in industry, particularly in sectors such as electronics or solar energy, as it has one of the highest electric conductivity of all metals – more than Copper and Gold. A surge in demand can increase prices, while a decline tends to lower them. Dynamics in the US, Chinese and Indian economies can also contribute to price swings: for the US and particularly China, their big industrial sectors use Silver in various processes; in India, consumers’ demand for the precious metal for jewellery also plays a key role in setting prices.
Silver prices tend to follow Gold's moves. When Gold prices rise, Silver typically follows suit, as their status as safe-haven assets is similar. The Gold/Silver ratio, which shows the number of ounces of Silver needed to equal the value of one ounce of Gold, may help to determine the relative valuation between both metals. Some investors may consider a high ratio as an indicator that Silver is undervalued, or Gold is overvalued. On the contrary, a low ratio might suggest that Gold is undervalued relative to Silver.
The Indian Rupee loses traction in Wednesday’s Asian session.
Renewed US Dollar demand, significant foreign fund outflows and higher crude oil prices undermine the INR.
Investors are bracing for the FOMC Minutes, which are due later on Wednesday.
The Indian Rupee (INR) trades in negative territory on Wednesday. The US Dollar (USD) demand due to the maturity of positions in the non-deliverable forwards (NDF) market and a decline in most Asian peers weigh on the INR. Additionally, persistent outflows from local stocks and a recovery in crude oil prices contribute to the local currency’s downside.
On the other hand, potential USD selling intervention by the Reserve Bank of India (RBI) might help limit the INR’s losses. Investors will keep an eye on the FOMC Minutes, which will be released later on Wednesday. Also, the US Housing Starts and Building Permits will be published.
Indian Rupee remains fragile amid global economic dynamics
India’s Gross Domestic Product (GDP) is projected to grow at 6.6% in the October-December quarter of 2024-25, down from 8.6% recorded in the same period of 2023-24, according to the Bank of Baroda on Tuesday.
ICRA has projected the year-on-year (YoY) expansion of the GDP to rise to 6.4% in the third quarter of the current fiscal year (Q3FY25) from the seven-quarter low of 5.4% in Q2FY25.
The NY Empire State Manufacturing Index climbed to 5.7 in February versus -12.6 in January, according to the Federal Reserve Bank of New York on Tuesday.
San Francisco Fed President Mary Daly said on Tuesday that prospects of further rate cuts in 2025 remain uncertain despite an overall positive lean to US economic factors.
USD/INR’s constructive outlook prevails despite consolidation in the shorter term
The Indian Rupee softens on the day. Technically, the USD/INR pair keeps the bullish bias on the daily timeframe, with the price holding above the key 100-day Exponential Moving Average (EMA). Additionally, the upward momentum is further supported by the 14-day Relative Strength Index (RSI), which is above the midline around 56.0, indicating that further upside looks favorable.
The immediate resistance level emerges near the 87.00 psychological level. More green candlesticks and sustained trading above the mentioned level could draw in more bullish demand and push USD/INR back to an all-time high near 88.00, en route to 88.50.
In case of a further downswing, the first downside target to watch is 86.58, the low of February 17. Extended losses could see a drop to 86.35, the low of February 12, followed by 86.14, the low of January 27.
Indian Rupee FAQs
The Indian Rupee (INR) is one of the most sensitive currencies to external factors. The price of Crude Oil (the country is highly dependent on imported Oil), the value of the US Dollar – most trade is conducted in USD – and the level of foreign investment, are all influential. Direct intervention by the Reserve Bank of India (RBI) in FX markets to keep the exchange rate stable, as well as the level of interest rates set by the RBI, are further major influencing factors on the Rupee.
The Reserve Bank of India (RBI) actively intervenes in forex markets to maintain a stable exchange rate, to help facilitate trade. In addition, the RBI tries to maintain the inflation rate at its 4% target by adjusting interest rates. Higher interest rates usually strengthen the Rupee. This is due to the role of the ‘carry trade’ in which investors borrow in countries with lower interest rates so as to place their money in countries’ offering relatively higher interest rates and profit from the difference.
Macroeconomic factors that influence the value of the Rupee include inflation, interest rates, the economic growth rate (GDP), the balance of trade, and inflows from foreign investment. A higher growth rate can lead to more overseas investment, pushing up demand for the Rupee. A less negative balance of trade will eventually lead to a stronger Rupee. Higher interest rates, especially real rates (interest rates less inflation) are also positive for the Rupee. A risk-on environment can lead to greater inflows of Foreign Direct and Indirect Investment (FDI and FII), which also benefit the Rupee.
Higher inflation, particularly, if it is comparatively higher than India’s peers, is generally negative for the currency as it reflects devaluation through oversupply. Inflation also increases the cost of exports, leading to more Rupees being sold to purchase foreign imports, which is Rupee-negative. At the same time, higher inflation usually leads to the Reserve Bank of India (RBI) raising interest rates and this can be positive for the Rupee, due to increased demand from international investors. The opposite effect is true of lower inflation.
The Australian Dollar declines as market sentiment deteriorates amid fresh tariff threats from US President Donald Trump.
Australia's Wage Price Index increased by 0.7% QoQ in Q4 2024, missing the expected 0.8% rise.
Hawkish remarks from Federal Reserve officials bolster the US Dollar.
The Australian Dollar (AUD) continues to weaken against the US Dollar (USD) for a second straight day on Wednesday, pressured by rising risk aversion following new tariff threats from US President Donald Trump.
Australia's Wage Price Index increased by 0.7% quarter-over-quarter in Q4 2024, falling short of the expected 0.8% rise and down from the previous quarter's 0.9% gain. Annually, the index grew by 3.2%, slowing from a revised 3.6% in the prior quarter and aligning with forecasts. This marks the slowest wage growth since Q3 2022.
The AUD faced additional downward pressure after the Reserve Bank of Australia (RBA) cut its Official Cash Rate (OCR) by 25 basis points (bps) to 4.10% on Tuesday—the first rate cut in four years.
Following the policy decision, RBA Governor Michele Bullock acknowledged that high interest rates have had an impact but cautioned that it is too soon to declare victory over inflation. Bullock also highlighted the strength of the job market and clarified that further rate cuts are not guaranteed, despite market expectations.
Australian Dollar weakens as the US Dollar strengthens on hawkish Fedspeak
The US Dollar Index (DXY), which tracks the US Dollar's performance against six major currencies, rises above 107.00 following Trump’s tariff threats and hawkish remarks from Federal Reserve (Fed) officials.
President Trump said late Tuesday that he would likely impose tariffs of around 25% on foreign cars, while semiconductor chips and drugs are set to face higher duties, per Bloomberg. Trump added that an announcement will come as soon as April 2.
San Francisco Fed President Mary Daly said on Tuesday that prospects of further rate cuts in 2025 remain uncertain despite an overall positive lean to US economic factors. Philadelphia Fed President Patrick Harker emphasized support for maintaining a steady interest rate policy, noting that inflation has remained elevated and persistent in recent months. Investors brace for the FOMC Minutes, which will be released on Wednesday.
Federal Reserve Governor Michelle Bowman stated on Monday that rising asset prices may have slowed the Fed’s recent progress on inflation. While Bowman expects inflation to decline, she cautioned that upside risks remain and emphasized the need for more certainty before considering rate cuts.
The US Census Bureau reported on Friday that Retail Sales fell by 0.9% in January, following a revised 0.7% increase in December (previously reported as 0.4%). This decline was sharper than the market’s expectation of a 0.1% drop.
Fed Chair Jerome Powell said in his semi-annual report to Congress that the board officials “do not need to be in a hurry" to cut interest rates due to strength in the job market and solid economic growth. He added that US President Donald Trump's tariff policies could put more upward pressure on prices, making it harder for the central bank to lower rates.
On Monday, Chinese President Xi Jinping led a meeting with Alibaba co-founder Jack Ma and other prominent entrepreneurs, signaling Beijing’s renewed support for the private sector, which is now seen as crucial to economic recovery, according to Bloomberg. Xi emphasized the need to eliminate barriers that hinder equal access to production resources and fair market competition.
Australian Dollar poised to surpass 0.6350 amid a bullish market bias
The AUD/USD pair hovers around 0.6340 on Wednesday, trading within an ascending channel pattern that signals a bullish market bias. The 14-day Relative Strength Index (RSI) remains above 50, reinforcing the positive outlook.
On the upside, the AUD/USD pair may test the upper boundary of the ascending channel, which aligns with the key psychological resistance at 0.6400.
Support levels include the nine-day Exponential Moving Average (EMA) at 0.6324, followed by the 14-day EMA at 0.6307. A stronger support zone is near the lower boundary of the ascending channel at 0.6290.
AUD/USD: Daily Chart
Australian Dollar PRICE Today
The table below shows the percentage change of Australian Dollar (AUD) against listed major currencies today. Australian Dollar was the weakest against the British Pound.
USD
EUR
GBP
JPY
CAD
AUD
NZD
CHF
USD
0.00%
-0.05%
0.14%
0.03%
0.07%
0.19%
0.05%
EUR
-0.01%
-0.05%
0.14%
0.02%
0.07%
0.19%
0.04%
GBP
0.05%
0.05%
0.19%
0.07%
0.12%
0.24%
0.09%
JPY
-0.14%
-0.14%
-0.19%
-0.13%
-0.08%
0.03%
-0.10%
CAD
-0.03%
-0.02%
-0.07%
0.13%
0.04%
0.16%
0.02%
AUD
-0.07%
-0.07%
-0.12%
0.08%
-0.04%
0.12%
-0.02%
NZD
-0.19%
-0.19%
-0.24%
-0.03%
-0.16%
-0.12%
-0.14%
CHF
-0.05%
-0.04%
-0.09%
0.10%
-0.02%
0.02%
0.14%
The heat map shows percentage changes of major currencies against each other. The base currency is picked from the left column, while the quote currency is picked from the top row. For example, if you pick the Australian Dollar from the left column and move along the horizontal line to the US Dollar, the percentage change displayed in the box will represent AUD (base)/USD (quote).
Australian Dollar FAQs
One of the most significant factors for the Australian Dollar (AUD) is the level of interest rates set by the Reserve Bank of Australia (RBA). Because Australia is a resource-rich country another key driver is the price of its biggest export, Iron Ore. The health of the Chinese economy, its largest trading partner, is a factor, as well as inflation in Australia, its growth rate and Trade Balance. Market sentiment – whether investors are taking on more risky assets (risk-on) or seeking safe-havens (risk-off) – is also a factor, with risk-on positive for AUD.
The Reserve Bank of Australia (RBA) influences the Australian Dollar (AUD) by setting the level of interest rates that Australian banks can lend to each other. This influences the level of interest rates in the economy as a whole. The main goal of the RBA is to maintain a stable inflation rate of 2-3% by adjusting interest rates up or down. Relatively high interest rates compared to other major central banks support the AUD, and the opposite for relatively low. The RBA can also use quantitative easing and tightening to influence credit conditions, with the former AUD-negative and the latter AUD-positive.
China is Australia’s largest trading partner so the health of the Chinese economy is a major influence on the value of the Australian Dollar (AUD). When the Chinese economy is doing well it purchases more raw materials, goods and services from Australia, lifting demand for the AUD, and pushing up its value. The opposite is the case when the Chinese economy is not growing as fast as expected. Positive or negative surprises in Chinese growth data, therefore, often have a direct impact on the Australian Dollar and its pairs.
Iron Ore is Australia’s largest export, accounting for $118 billion a year according to data from 2021, with China as its primary destination. The price of Iron Ore, therefore, can be a driver of the Australian Dollar. Generally, if the price of Iron Ore rises, AUD also goes up, as aggregate demand for the currency increases. The opposite is the case if the price of Iron Ore falls. Higher Iron Ore prices also tend to result in a greater likelihood of a positive Trade Balance for Australia, which is also positive of the AUD.
The Trade Balance, which is the difference between what a country earns from its exports versus what it pays for its imports, is another factor that can influence the value of the Australian Dollar. If Australia produces highly sought after exports, then its currency will gain in value purely from the surplus demand created from foreign buyers seeking to purchase its exports versus what it spends to purchase imports. Therefore, a positive net Trade Balance strengthens the AUD, with the opposite effect if the Trade Balance is negative.
Reserve Bank of New Zealand’s (RBNZ) Governor Adrian Orr explains the interest rate cut decision at a press conference following the February monetary policy meeting on Wednesday.
Orr is taking questions from the media.
Key quotes
OCR path projects 50 bps by mid this year, around July.
In two 25 bps steps.
Economy has significant spare capacity.
Cuts in April and May are about right.
Among near term risks is slower GDP growth.
Longer term risks include US tariffs which slow global growth.
Could see faster GDP growth at home if confidence returns.
3.75% is the high end of the range of neutral rates.
Tariffs are negative for growth globally and in New Zealand.
Developing story, please refresh the page for updates
NZD/USD keeps losses as Orr's press conference gets underway. The pair is down 0.32% on the day, currently at 0.5685.
RBNZ FAQs
The Reserve Bank of New Zealand (RBNZ) is the country’s central bank. Its economic objectives are achieving and maintaining price stability – achieved when inflation, measured by the Consumer Price Index (CPI), falls within the band of between 1% and 3% – and supporting maximum sustainable employment.
The Reserve Bank of New Zealand’s (RBNZ) Monetary Policy Committee (MPC) decides the appropriate level of the Official Cash Rate (OCR) according to its objectives. When inflation is above target, the bank will attempt to tame it by raising its key OCR, making it more expensive for households and businesses to borrow money and thus cooling the economy. Higher interest rates are generally positive for the New Zealand Dollar (NZD) as they lead to higher yields, making the country a more attractive place for investors. On the contrary, lower interest rates tend to weaken NZD.
Employment is important for the Reserve Bank of New Zealand (RBNZ) because a tight labor market can fuel inflation. The RBNZ’s goal of “maximum sustainable employment” is defined as the highest use of labor resources that can be sustained over time without creating an acceleration in inflation. “When employment is at its maximum sustainable level, there will be low and stable inflation. However, if employment is above the maximum sustainable level for too long, it will eventually cause prices to rise more and more quickly, requiring the MPC to raise interest rates to keep inflation under control,” the bank says.
In extreme situations, the Reserve Bank of New Zealand (RBNZ) can enact a monetary policy tool called Quantitative Easing. QE is the process by which the RBNZ prints local currency and uses it to buy assets – usually government or corporate bonds – from banks and other financial institutions with the aim to increase the domestic money supply and spur economic activity. QE usually results in a weaker New Zealand Dollar (NZD). QE is a last resort when simply lowering interest rates is unlikely to achieve the objectives of the central bank. The RBNZ used it during the Covid-19 pandemic.
Expect firms to deliver solid pay hikes in this year's wage talks.
Expect inflation to approach BoJ’s target driven by domestic factors.
Must be mindful of risk inflation may accelerate more than expected due to weak Yen, bumper pay hikes.
Hopeful Japan will progress toward durable achievement of BoJ’s price target from fiscal 2025 onward due to solid wage gains, home-made inflationary pressure.
Risk of big market fluctuation has receded, giving the BoJ more policy flexibility.
Market reaction
As of writing, USD/JPY is flriting with intraday lows near 151.80 on these above comments, down 0.12% on the day.
AUD/NZD appreciated as the RBNZ lowered its Official Cash Rate by 50 basis points on Wednesday.
Traders will closely monitor RBNZ Governor Adrian Orr’s press conference for clues on the central bank’s future policy direction.
Australia's Wage Price Index increased by 0.7% QoQ in Q4 2024, missing the expected 0.8% rise.
AUD/NZD extends its gains for the second successive session, trading around 1.1170 during Asian hours. The upside is driven by the Reserve Bank of New Zealand’s (RBNZ) decision to lower the Official Cash Rate (OCR) by 50 basis points (bps) from 4.25% to 3.75%, following the conclusion of the February policy meeting on Wednesday. The decision aligned with the market expectations.
Traders will closely watch RBNZ Governor Adrian Orr’s press conference for insights into the central bank’s future policy stance. Any dovish signals could add to selling pressure on the New Zealand Dollar (NZD), providing support for the AUD/NZD cross.
However, the upside of the AUD/NZD cross could be restrained as the Australian Dollar (AUD) remains subdued following the Reserve Bank of Australia’s (RBA) policy decision on Tuesday. The central bank lowered its Official Cash Rate (OCR) by 25 basis points (bps) to 4.10% on Tuesday, as widely expected, marking the first rate cut in four years.
Reserve Bank of Australia Governor Michele Bullock addressed the media after the policy meeting, stating that it’s clear high interest rates have had an impact. However, Bullock emphasized that it's too early to declare victory over inflation. She also noted the unexpectedly strong jobs market and clarified that the market's expectation of further rate cuts is not guaranteed.
Australia's Wage Price Index rose by 0.7% quarter-over-quarter in Q4 2024, below the expected 0.8% increase and the previous quarter's 0.9% rise. On an annual basis, the index grew by 3.2%, slowing from a revised 3.6% in the prior quarter and matching forecasts. This marked the slowest wage growth since Q3 2022.
Economic Indicator
RBNZ Interest Rate Decision
The Reserve Bank of New Zealand (RBNZ) announces its interest rate decision after its seven scheduled annual policy meetings. If the RBNZ is hawkish and sees inflationary pressures rising, it raises the Official Cash Rate (OCR) to bring inflation down. This is positive for the New Zealand Dollar (NZD) since higher interest rates attract more capital inflows. Likewise, if it reaches the view that inflation is too low it lowers the OCR, which tends to weaken NZD.
The Reserve Bank of New Zealand (RBNZ) holds monetary policy meetings seven times a year, announcing their decision on interest rates and the economic assessments that influenced their decision. The central bank offers clues on the economic outlook and future policy path, which are of high relevance for the NZD valuation. Positive economic developments and upbeat outlook could lead the RBNZ to tighten the policy by hiking interest rates, which tends to be NZD bullish. The policy announcements are usually followed by Governor Adrian Orr’s press conference.
01:30
China House Price Index increased to -5% in January from previous -5.3%
NZD/USD drifts lower for the second straight day after the RBNZ’s expected 50 bps rate cut.
Concerns about Trump’s reciprocal tariffs and trade war fears further weigh on the Kiwi.
Subdued USD price action could lend support to the pair amid a generally positive risk tone.
The NZD/USD pair attracts some sellers for the second straight day and drops to a three-day low, around the 0.5680-0.5675 area after the Reserve Bank of New Zealand (RBNZ) announced its policy decision this Wednesday.
As was widely expected, the RBNZ lowered the Official Cash Rate (OCR) by 50 basis points (bps) from 4.25% to 3.75% following the conclusion of the February policy meeting. Moreover, the accompanying monetary policy meeting minutes indicated that the committee has scope to lower the OCR further through 2025. This, in turn, exerts some downward pressure on the New Zealand Dollar (NZD) and drags the NZD/USD pair away from a nearly two-month top touched earlier this week.
The US Dollar (USD), on the other hand, struggles to capitalize on the previous day's positive move amid expectations that the Federal Reserve (Fed) would cut interest rates further this year. Apart from this, a generally positive tone around the equity markets caps the safe-haven Greenback and could offer some support to the risk-sensitive Kiwi. That said, worries about US President Donald Trump's reciprocal tariffs might hold back bulls from placing fresh bets around the NZD/USD pair.
Economic Indicator
RBNZ Interest Rate Decision
The Reserve Bank of New Zealand (RBNZ) announces its interest rate decision after its seven scheduled annual policy meetings. If the RBNZ is hawkish and sees inflationary pressures rising, it raises the Official Cash Rate (OCR) to bring inflation down. This is positive for the New Zealand Dollar (NZD) since higher interest rates attract more capital inflows. Likewise, if it reaches the view that inflation is too low it lowers the OCR, which tends to weaken NZD.
The Reserve Bank of New Zealand (RBNZ) holds monetary policy meetings seven times a year, announcing their decision on interest rates and the economic assessments that influenced their decision. The central bank offers clues on the economic outlook and future policy path, which are of high relevance for the NZD valuation. Positive economic developments and upbeat outlook could lead the RBNZ to tighten the policy by hiking interest rates, which tends to be NZD bullish. The policy announcements are usually followed by Governor Adrian Orr’s press conference.
01:00
New Zealand RBNZ Interest Rate Decision in line with forecasts (3.75%)
00:30
Australia Wage Price Index (YoY) in line with expectations (3.2%) in 4Q
00:30
Australia Wage Price Index (YoY) in line with expectations (3.2%) in 4Q
00:30
Australia Wage Price Index (QoQ) below forecasts (0.8%) in 4Q: Actual (0.7%)
00:30
Australia Wage Price Index (QoQ) below forecasts (0.8%) in 4Q: Actual (0.7%)
WTI price trades in positive territory near $71.70 in Wednesday’s early Asian session.
Supply disruptions mounted in Russia boost the WTI price.
Concerns over a potential global trade war might cap the upside for WTI.
West Texas Intermediate (WTI), the US crude oil benchmark, is trading around $71.70 during the early Asian session on Wednesday. The WTI price extends the rally amid the fears of supply disruptions in Russia.
WTI price edges higher after Ukrainian drones attacked a major Russian pipeline's pumping station, disrupting Kazakhstan's crude exports. On Tuesday, Russian Deputy Prime Minister Alexander Novak said that oil flows via the pipeline had been curtailed by 30-40%. According to Reuters estimates, a 30% decrease would reduce oil supplies by 380,000 barrels per day.
On the other hand, traders will closely monitor the developments surrounding further tariff policies from US President Donald Trump. Concerns over a potential global trade war could limit further gains for black gold.
Last week, US President Donald Trump ordered his administration to consider imposing reciprocal tariffs on numerous trading partners. Late Tuesday, Trump said late Tuesday that he would likely impose tariffs of around 25% on foreign cars, while semiconductor chips and drugs are set to face higher duties.
WTI Oil FAQs
WTI Oil is a type of Crude Oil sold on international markets. The WTI stands for West Texas Intermediate, one of three major types including Brent and Dubai Crude. WTI is also referred to as “light” and “sweet” because of its relatively low gravity and sulfur content respectively. It is considered a high quality Oil that is easily refined. It is sourced in the United States and distributed via the Cushing hub, which is considered “The Pipeline Crossroads of the World”. It is a benchmark for the Oil market and WTI price is frequently quoted in the media.
Like all assets, supply and demand are the key drivers of WTI Oil price. As such, global growth can be a driver of increased demand and vice versa for weak global growth. Political instability, wars, and sanctions can disrupt supply and impact prices. The decisions of OPEC, a group of major Oil-producing countries, is another key driver of price. The value of the US Dollar influences the price of WTI Crude Oil, since Oil is predominantly traded in US Dollars, thus a weaker US Dollar can make Oil more affordable and vice versa.
The weekly Oil inventory reports published by the American Petroleum Institute (API) and the Energy Information Agency (EIA) impact the price of WTI Oil. Changes in inventories reflect fluctuating supply and demand. If the data shows a drop in inventories it can indicate increased demand, pushing up Oil price. Higher inventories can reflect increased supply, pushing down prices. API’s report is published every Tuesday and EIA’s the day after. Their results are usually similar, falling within 1% of each other 75% of the time. The EIA data is considered more reliable, since it is a government agency.
OPEC (Organization of the Petroleum Exporting Countries) is a group of 12 Oil-producing nations who collectively decide production quotas for member countries at twice-yearly meetings. Their decisions often impact WTI Oil prices. When OPEC decides to lower quotas, it can tighten supply, pushing up Oil prices. When OPEC increases production, it has the opposite effect. OPEC+ refers to an expanded group that includes ten extra non-OPEC members, the most notable of which is Russia.
00:03
Australia Westpac Leading Index (MoM) climbed from previous -0.02% to 0.13% in January
Giao dịch trên thị trường tài chính (đặc biệt là giao dịch sử dụng các công cụ biên) mở ra những cơ hội lớn và tạo điều kiện cho các nhà đầu tư sẵn sàng mạo hiểm để thu lợi nhuận, tuy nhiên nó mang trong mình nguy cơ rủi ro khá cao. Chính vì vậy trước khi tiến hành giao dịch cần phải xem xét mọi mặt vấn đề chấp nhận tiến hành giao dịch cụ thể xét theo quan điểm của nguồn lực tài chính sẵn có và mức độ am hiểu thị trường tài chính.
Sử dụng thông tin: sử dụng toàn bộ hay riêng biệt các dữ liệu trên trang web của công ty TeleTrade như một nguồn cung cấp thông tin nhất định. Việc sử dụng tư liệu từ trang web cần kèm theo liên kết đến trang teletrade.vn. Việc tự động thu thập số liệu cũng như thông tin từ trang web TeleTrade đều không được phép.
Nhấn nút "Đăng ký" để nhận thông báo về chương trình khuyến mãi và Bonus
Cảm ơn bạn đã ghé thăm teletrade.org!
Thông tin trên trang web này có thể không tuân thủ luật pháp của quốc gia nơi bạn sống.
Vẫn xem thông tin.
Tôi xác nhận rằng các tài liệu trên trang web này không dành cho cư dân EU và tôi có thể không có quyền đăng ký tài khoản bên teletrade.org, nhưng tôi vẫn muốn tiếp tục.