- Phân tích
- Tin tức và các công cụ
- Tin tức thị trường
Tin tức thì trường
- EUR/USD backlides to 1.0900 handle on Thursday as US Dollar flows recover lost ground.
- The ECB held rates steady on Thursday as policymakers keep watching for inflation.
- Fiber traders to turn toward next week’s pan-EU inflation figures.
EUR/USD shed weight on Thursday, falling back into the 1.0900 key handle amid a broad-market recovery in Greenback bidding. An uptick in weekly US jobless claims helped to further support hopes for a September rate cut from the Federal Reserve (Fed), while the European Central Bank (ECB) balked in the face of lopsided economic data and opted to keep rates on hold for the time being.
Forex Today: Investors’ attention now looks at Fedspeak
With an ECB rate hold on the books for July, Fiber traders will be turning to next week’s pan-EU Harmonized Index of Consumer Prices (HICP) inflation data. Friday is a largely low-tier data showing for the Euro, leaving investors to sit and wait for next Tuesday’s inflation data to begin sussing out odds of a follow-up rate cut to the ECB’s initial rate trim in June.
US Initial Jobless Claims increased more than expected on Thursday, adding 243K new unemployment benefits seekers for the week ended July 12 compared to the expected 230K, and rising above the previous week’s revised 223K. With labor data softening, market expectations of a September rate cut will be further bolstered, but bets for a Fed rate trim have nowhere left to go with markets already pricing in nearly 100% odds of a quarter-point rate cut from the Federal Open Market Committee (FOMC) on September 18.
Euro PRICE This week
The table below shows the percentage change of Euro (EUR) against listed major currencies this week. Euro was the strongest against the New Zealand Dollar.
| USD | EUR | GBP | JPY | CAD | AUD | NZD | CHF | |
|---|---|---|---|---|---|---|---|---|
| USD | 0.07% | 0.32% | -0.57% | 0.44% | 1.17% | 1.04% | -0.76% | |
| EUR | -0.07% | 0.28% | -0.43% | 0.57% | 1.14% | 1.18% | -0.64% | |
| GBP | -0.32% | -0.28% | -0.63% | 0.27% | 0.85% | 0.84% | -0.92% | |
| JPY | 0.57% | 0.43% | 0.63% | 1.01% | 1.53% | 1.60% | -0.38% | |
| CAD | -0.44% | -0.57% | -0.27% | -1.01% | 0.66% | 0.62% | -1.20% | |
| AUD | -1.17% | -1.14% | -0.85% | -1.53% | -0.66% | 0.04% | -1.76% | |
| NZD | -1.04% | -1.18% | -0.84% | -1.60% | -0.62% | -0.04% | -1.81% | |
| CHF | 0.76% | 0.64% | 0.92% | 0.38% | 1.20% | 1.76% | 1.81% |
The heat map shows percentage changes of major currencies against each other. The base currency is picked from the left column, while the quote currency is picked from the top row. For example, if you pick the Euro from the left column and move along the horizontal line to the US Dollar, the percentage change displayed in the box will represent EUR (base)/USD (quote).
EUR/USD technical outlook
The Fiber saw its worst trading day in over a month on Thursday, flubbing recent bullish momentum and tumbling back into the 1.0900 handle after reaching a four-month high just shy of 1.0950. Intraday price action is still holding north of the 200-hour Exponential Moving Average (EMA) at 1.0879, but an extended slide could kick off another round of bearishness.
EUR/USD has cycled the 200-day EMA at 1.0800 since last November, and another technical rejection from 1.0900 leaves the Fiber exposed to a bearish reversal. A shortside push could see the pair tumbling back to June’s recent lows below 1.0700.
EUR/USD hourly chart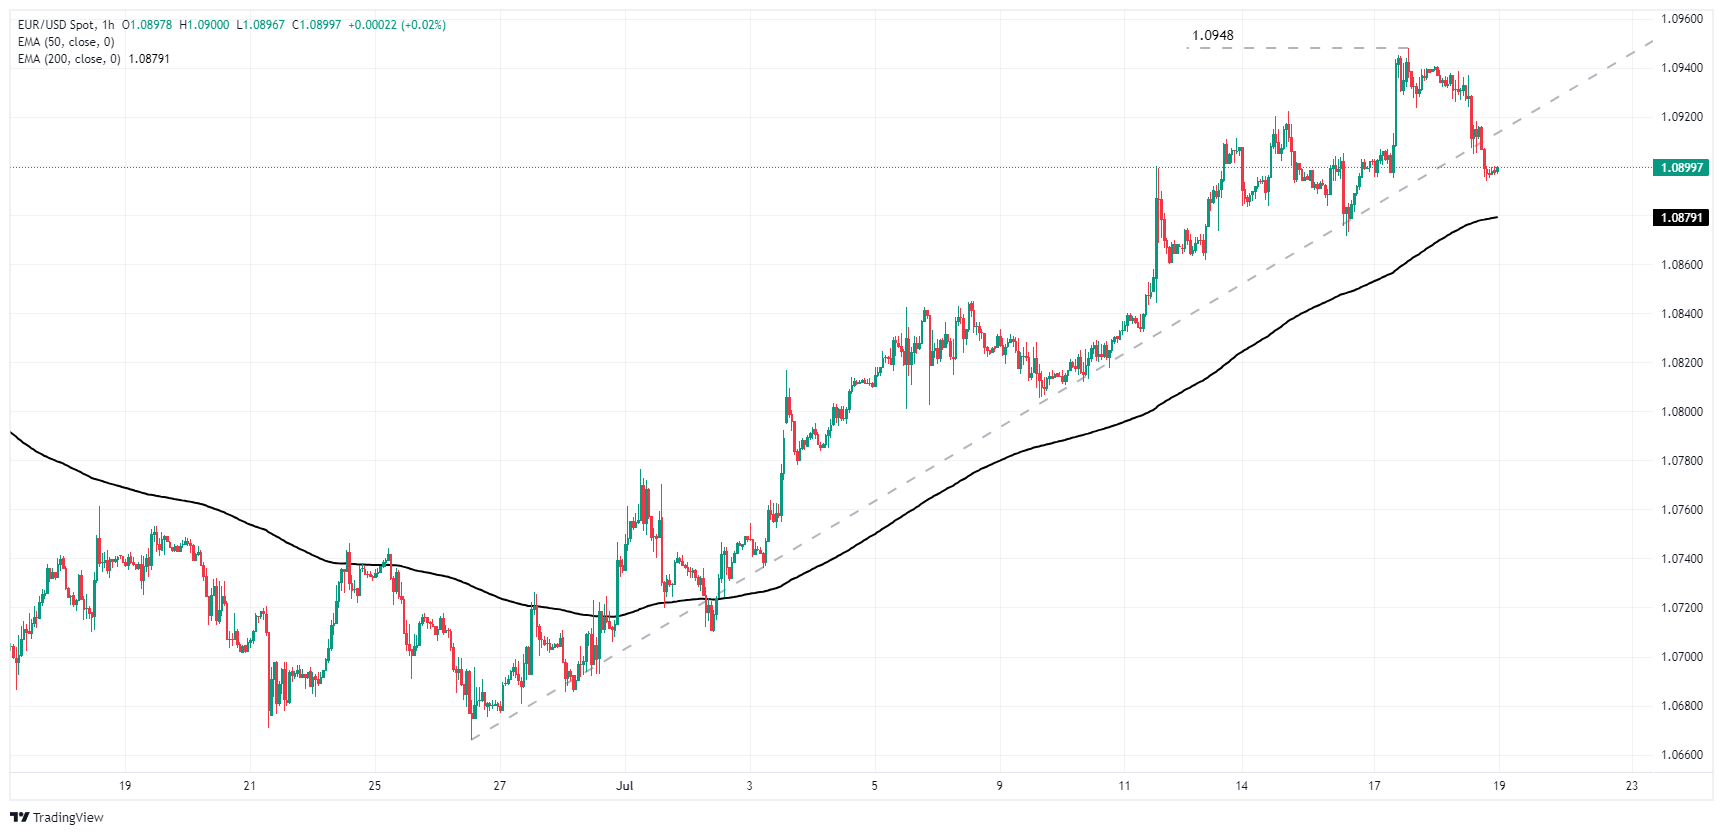
EUR/USD daily chart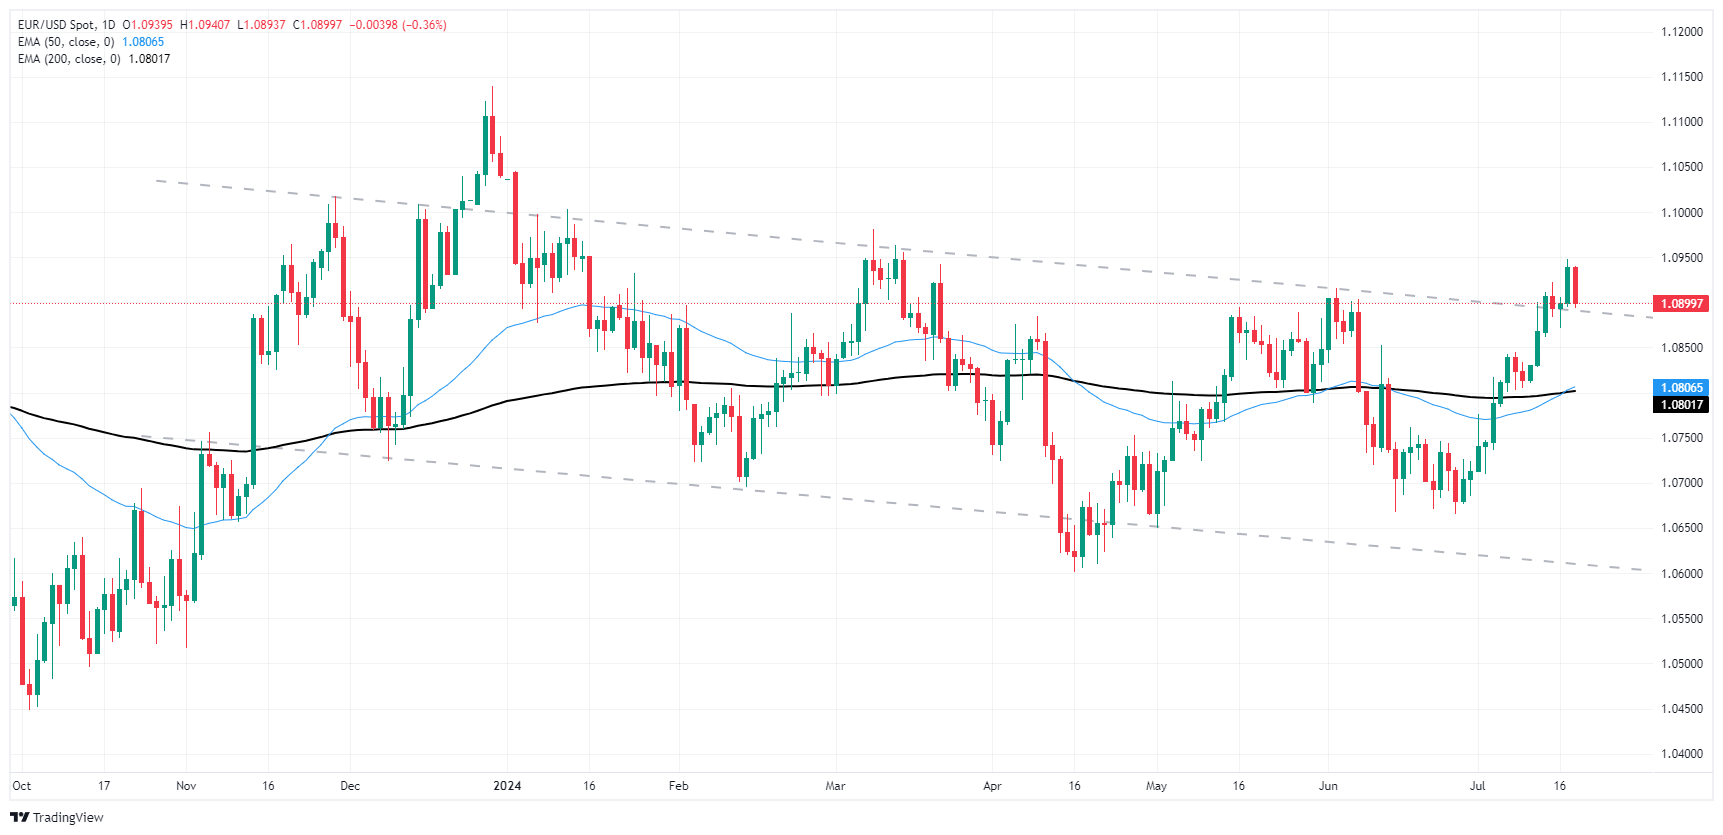
Euro FAQs
The Euro is the currency for the 20 European Union countries that belong to the Eurozone. It is the second most heavily traded currency in the world behind the US Dollar. In 2022, it accounted for 31% of all foreign exchange transactions, with an average daily turnover of over $2.2 trillion a day. EUR/USD is the most heavily traded currency pair in the world, accounting for an estimated 30% off all transactions, followed by EUR/JPY (4%), EUR/GBP (3%) and EUR/AUD (2%).
The European Central Bank (ECB) in Frankfurt, Germany, is the reserve bank for the Eurozone. The ECB sets interest rates and manages monetary policy. The ECB’s primary mandate is to maintain price stability, which means either controlling inflation or stimulating growth. Its primary tool is the raising or lowering of interest rates. Relatively high interest rates – or the expectation of higher rates – will usually benefit the Euro and vice versa. The ECB Governing Council makes monetary policy decisions at meetings held eight times a year. Decisions are made by heads of the Eurozone national banks and six permanent members, including the President of the ECB, Christine Lagarde.
Eurozone inflation data, measured by the Harmonized Index of Consumer Prices (HICP), is an important econometric for the Euro. If inflation rises more than expected, especially if above the ECB’s 2% target, it obliges the ECB to raise interest rates to bring it back under control. Relatively high interest rates compared to its counterparts will usually benefit the Euro, as it makes the region more attractive as a place for global investors to park their money.
Data releases gauge the health of the economy and can impact on the Euro. Indicators such as GDP, Manufacturing and Services PMIs, employment, and consumer sentiment surveys can all influence the direction of the single currency. A strong economy is good for the Euro. Not only does it attract more foreign investment but it may encourage the ECB to put up interest rates, which will directly strengthen the Euro. Otherwise, if economic data is weak, the Euro is likely to fall. Economic data for the four largest economies in the euro area (Germany, France, Italy and Spain) are especially significant, as they account for 75% of the Eurozone’s economy.
Another significant data release for the Euro is the Trade Balance. This indicator measures the difference between what a country earns from its exports and what it spends on imports over a given period. If a country produces highly sought after exports then its currency will gain in value purely from the extra demand created from foreign buyers seeking to purchase these goods. Therefore, a positive net Trade Balance strengthens a currency and vice versa for a negative balance.
- GBP/USD clipped back beneath 1.3000 handle on Thursday.
- Broad-market US Dollar selling is taking a breather.
- UK Retail Sales to wrap up the GBP’s trading week.
GBP/USD has settled back below the 1.3000 key level on Thursday as Greenback short pressures eases. Investors are taking a breather after a hard rally through the early trading week as market sentiment surged on Federal Reserve (Fed) rate cut expectations getting pinned to the ceiling.
Forex Today: Investors’ attention now looks at Fedspeak
UK data came in mostly as expected on Thursday, with a slightly better-than-expected but still lower print in unemployment claims. Meanwhile, US Initial Jobless Claims rose as rate-cut-hungry markets got further signs of a slowdown that will help bully the Fed into rate cuts beginning in September.
GBP traders will wrap up a hectic but overall unremarkable UK data docket this week with Friday’s UK Retail Sales for the month of June. MoM Retail Sales are forecast to contract by 0.4% after the previous month’s 2.9% surge, while annualized Retail Sales are expected to slow sharply to 0.2% versus the previous 1.3%.
US Initial Jobless Claims increased more than expected on Thursday, adding 243K new unemployment benefits seekers for the week ended July 12 compared to the expected 230K, and rising above the previous week’s revised 223K. With labor data softening, market expectations of a September rate cut will be further bolstered, but bets for a Fed rate trim have nowhere left to go with markets already pricing in nearly 100% odds of a quarter-point rate cut from the Federal Open Market Committee (FOMC) on September 18.
On the UK side, Average Earnings printed broadly as expected, while June’s Claimant Count Change eased to 32.3K from the previous revised 51.9K, however the figure failed to reach the modeled forecast of 23.4K.
British Pound PRICE This week
The table below shows the percentage change of British Pound (GBP) against listed major currencies this week. British Pound was the strongest against the New Zealand Dollar.
| USD | EUR | GBP | JPY | CAD | AUD | NZD | CHF | |
|---|---|---|---|---|---|---|---|---|
| USD | 0.07% | 0.32% | -0.55% | 0.43% | 1.16% | 1.06% | -0.75% | |
| EUR | -0.07% | 0.29% | -0.43% | 0.55% | 1.12% | 1.18% | -0.64% | |
| GBP | -0.32% | -0.29% | -0.61% | 0.26% | 0.82% | 0.84% | -0.92% | |
| JPY | 0.55% | 0.43% | 0.61% | 0.98% | 1.49% | 1.57% | -0.39% | |
| CAD | -0.43% | -0.55% | -0.26% | -0.98% | 0.65% | 0.62% | -1.19% | |
| AUD | -1.16% | -1.12% | -0.82% | -1.49% | -0.65% | 0.06% | -1.73% | |
| NZD | -1.06% | -1.18% | -0.84% | -1.57% | -0.62% | -0.06% | -1.80% | |
| CHF | 0.75% | 0.64% | 0.92% | 0.39% | 1.19% | 1.73% | 1.80% |
The heat map shows percentage changes of major currencies against each other. The base currency is picked from the left column, while the quote currency is picked from the top row. For example, if you pick the British Pound from the left column and move along the horizontal line to the US Dollar, the percentage change displayed in the box will represent GBP (base)/USD (quote).
GBP/USD technical outlook
GBP/USD recently set a 12-month high of 1.3044, but topside momentum drained out of the Cable and the pair is falling back to the 200-hour Exponential Moving Average (EMA) at 1.2922. An extended backslide will see short pressure building to force the pair back down to the 200-day EMA at 1.2621, but with price action trading well above the long-run moving average, a bullish recovery from 1.2800 isn’t off the table as the 50-day EMA rising into 1.2754.
GBP/USD hourly chart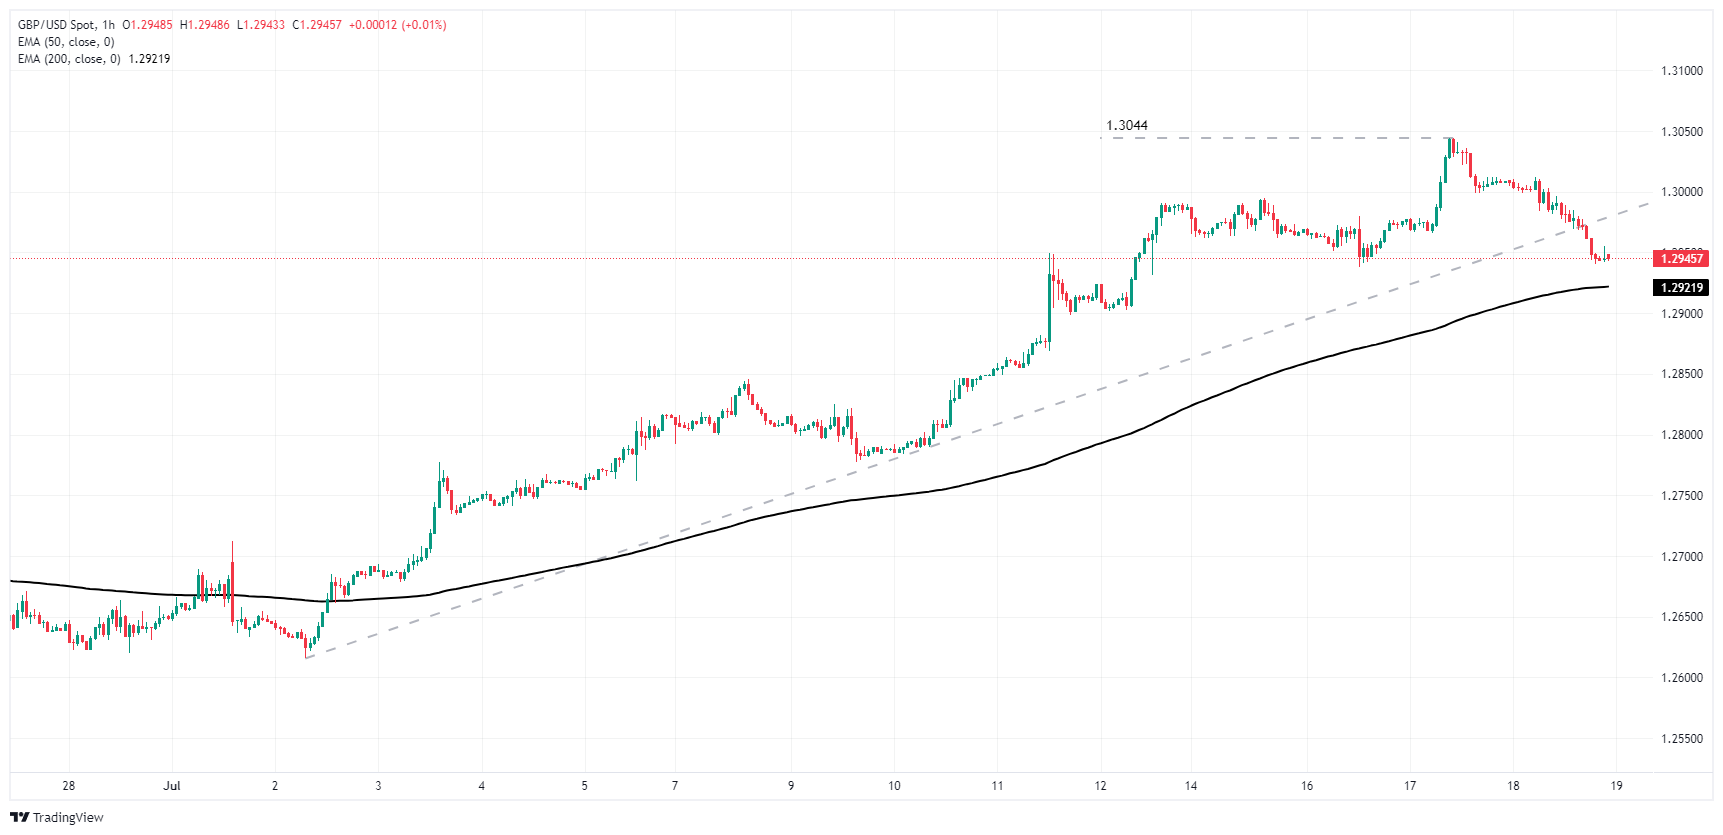
GBP/USD daily chart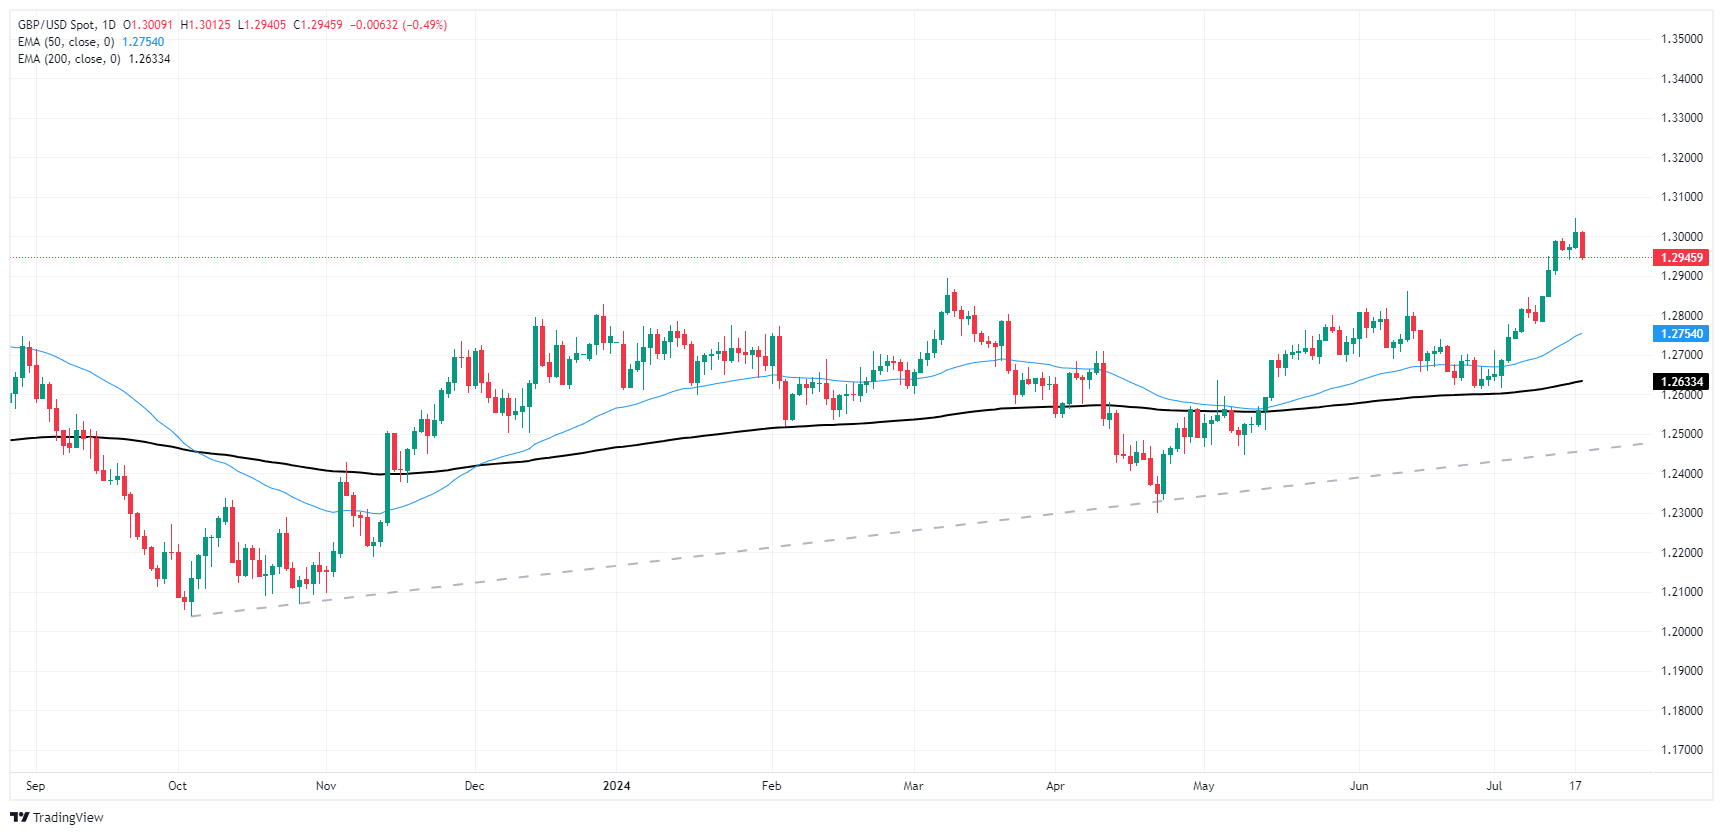
Pound Sterling FAQs
The Pound Sterling (GBP) is the oldest currency in the world (886 AD) and the official currency of the United Kingdom. It is the fourth most traded unit for foreign exchange (FX) in the world, accounting for 12% of all transactions, averaging $630 billion a day, according to 2022 data. Its key trading pairs are GBP/USD, aka ‘Cable’, which accounts for 11% of FX, GBP/JPY, or the ‘Dragon’ as it is known by traders (3%), and EUR/GBP (2%). The Pound Sterling is issued by the Bank of England (BoE).
The single most important factor influencing the value of the Pound Sterling is monetary policy decided by the Bank of England. The BoE bases its decisions on whether it has achieved its primary goal of “price stability” – a steady inflation rate of around 2%. Its primary tool for achieving this is the adjustment of interest rates. When inflation is too high, the BoE will try to rein it in by raising interest rates, making it more expensive for people and businesses to access credit. This is generally positive for GBP, as higher interest rates make the UK a more attractive place for global investors to park their money. When inflation falls too low it is a sign economic growth is slowing. In this scenario, the BoE will consider lowering interest rates to cheapen credit so businesses will borrow more to invest in growth-generating projects.
Data releases gauge the health of the economy and can impact the value of the Pound Sterling. Indicators such as GDP, Manufacturing and Services PMIs, and employment can all influence the direction of the GBP. A strong economy is good for Sterling. Not only does it attract more foreign investment but it may encourage the BoE to put up interest rates, which will directly strengthen GBP. Otherwise, if economic data is weak, the Pound Sterling is likely to fall.
Another significant data release for the Pound Sterling is the Trade Balance. This indicator measures the difference between what a country earns from its exports and what it spends on imports over a given period. If a country produces highly sought-after exports, its currency will benefit purely from the extra demand created from foreign buyers seeking to purchase these goods. Therefore, a positive net Trade Balance strengthens a currency and vice versa for a negative balance.
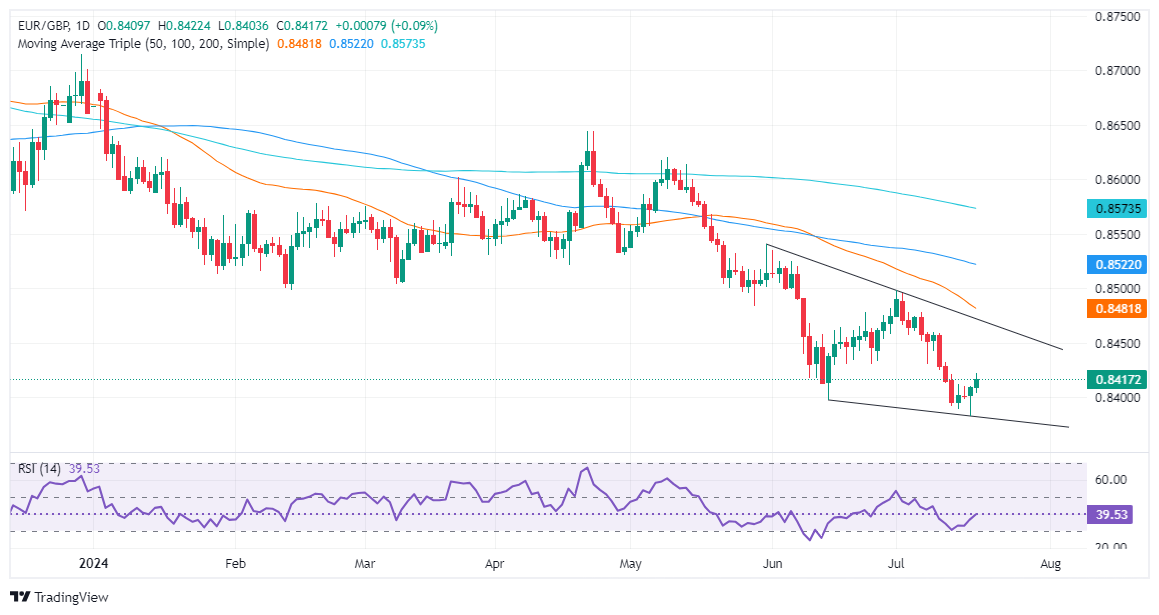
- EUR/GBP edges up to 0.8410 following the ECB's rate decision and strong UK jobs data.
- Technical analysis shows a potential 'falling wedge' pattern, indicating possible new weekly highs.
- Key resistance levels: 0.8460 (July 8 high), 0.8478 (50-DMA), and 0.8499 (July 1 peak); support levels: 0.8403 (July 18 low) and 0.8383 (YTD low).
The EUR/GBP edged up some 0.10% on Thursday after the European Central Bank (ECB) held rates unchanged. Additionally, solid jobs data from the United Kingdom (UK) kept the cross-pair from rallying after the ECB’s decision, so the pair remained at around the 0.8410 area for the second straight day.
EUR/GBP Price Analysis: Technical outlook
The EUR/GBP remains downward biased from a technical standpoint, and it seems that a ‘falling wedge’ is forming, which most likely pushes the cross-pair to new weekly highs.
Momentum favors sellers, with the Relative Strength Index (RSI) remaining bearish. Nevertheless, a positive divergence between price action falling to lower lows and the RSI registering higher lows might open the door for an upward correction.
Key resistance levels for the pair lie above July 8 high at 0.8460. A breach of the latter will expose the 50-day moving average (DMA) at 0.8478, before testing the July 1 peak of 0.8499. Further gains are seen above that level, with the 100-DMA at 0.8520 and the 200-DMA at 0.8572.
On the flip side, if EUR/GBP extends its losses past the July 18 bottom of 0.8403, the next support would be the year-to-date (YTD) low of 0.8383. A further downside is seen beneath the latter, at the August 2, 2022, low of 0.8339.
EUR/GBP Price Action – Daily Chart
Euro FAQs
The Euro is the currency for the 20 European Union countries that belong to the Eurozone. It is the second most heavily traded currency in the world behind the US Dollar. In 2022, it accounted for 31% of all foreign exchange transactions, with an average daily turnover of over $2.2 trillion a day. EUR/USD is the most heavily traded currency pair in the world, accounting for an estimated 30% off all transactions, followed by EUR/JPY (4%), EUR/GBP (3%) and EUR/AUD (2%).
The European Central Bank (ECB) in Frankfurt, Germany, is the reserve bank for the Eurozone. The ECB sets interest rates and manages monetary policy. The ECB’s primary mandate is to maintain price stability, which means either controlling inflation or stimulating growth. Its primary tool is the raising or lowering of interest rates. Relatively high interest rates – or the expectation of higher rates – will usually benefit the Euro and vice versa. The ECB Governing Council makes monetary policy decisions at meetings held eight times a year. Decisions are made by heads of the Eurozone national banks and six permanent members, including the President of the ECB, Christine Lagarde.
Eurozone inflation data, measured by the Harmonized Index of Consumer Prices (HICP), is an important econometric for the Euro. If inflation rises more than expected, especially if above the ECB’s 2% target, it obliges the ECB to raise interest rates to bring it back under control. Relatively high interest rates compared to its counterparts will usually benefit the Euro, as it makes the region more attractive as a place for global investors to park their money.
Data releases gauge the health of the economy and can impact on the Euro. Indicators such as GDP, Manufacturing and Services PMIs, employment, and consumer sentiment surveys can all influence the direction of the single currency. A strong economy is good for the Euro. Not only does it attract more foreign investment but it may encourage the ECB to put up interest rates, which will directly strengthen the Euro. Otherwise, if economic data is weak, the Euro is likely to fall. Economic data for the four largest economies in the euro area (Germany, France, Italy and Spain) are especially significant, as they account for 75% of the Eurozone’s economy.
Another significant data release for the Euro is the Trade Balance. This indicator measures the difference between what a country earns from its exports and what it spends on imports over a given period. If a country produces highly sought after exports then its currency will gain in value purely from the extra demand created from foreign buyers seeking to purchase these goods. Therefore, a positive net Trade Balance strengthens a currency and vice versa for a negative balance.
- NZD/USD finds difficulty in establishing above the 0.6070 level, hovering close to lows outlined in May.
- The pair continues to trade beneath the pivotal 20, 100, and 200-day SMA lines, pointing to a neutral to bearish outlook.
- Daily indicators maintain a bearish tilt as selling pressure persists.
During Thursday's session, the NZD/USD dropped by 0.60% to touch the 0.6050 level. The pair's struggle to remain firm above the 0.6070 mark keeps it near the lows recorded in May. Significantly, NZD/USD is still trading under the important Simple Moving Averages (SMA) of 20, 100, and 200 days, inferring a neutral to bearish perspective.
The daily technical indicators affirm the bearish stance. The Relative Strength Index (RSI) sits at 39, moving downward compared to the Wednesday session's reading of 45. Meanwhile, the Moving Average Convergence Divergence (MACD) continues to show rising red bars, indicating an escalating bearish momentum.
NZD/USD daily chart
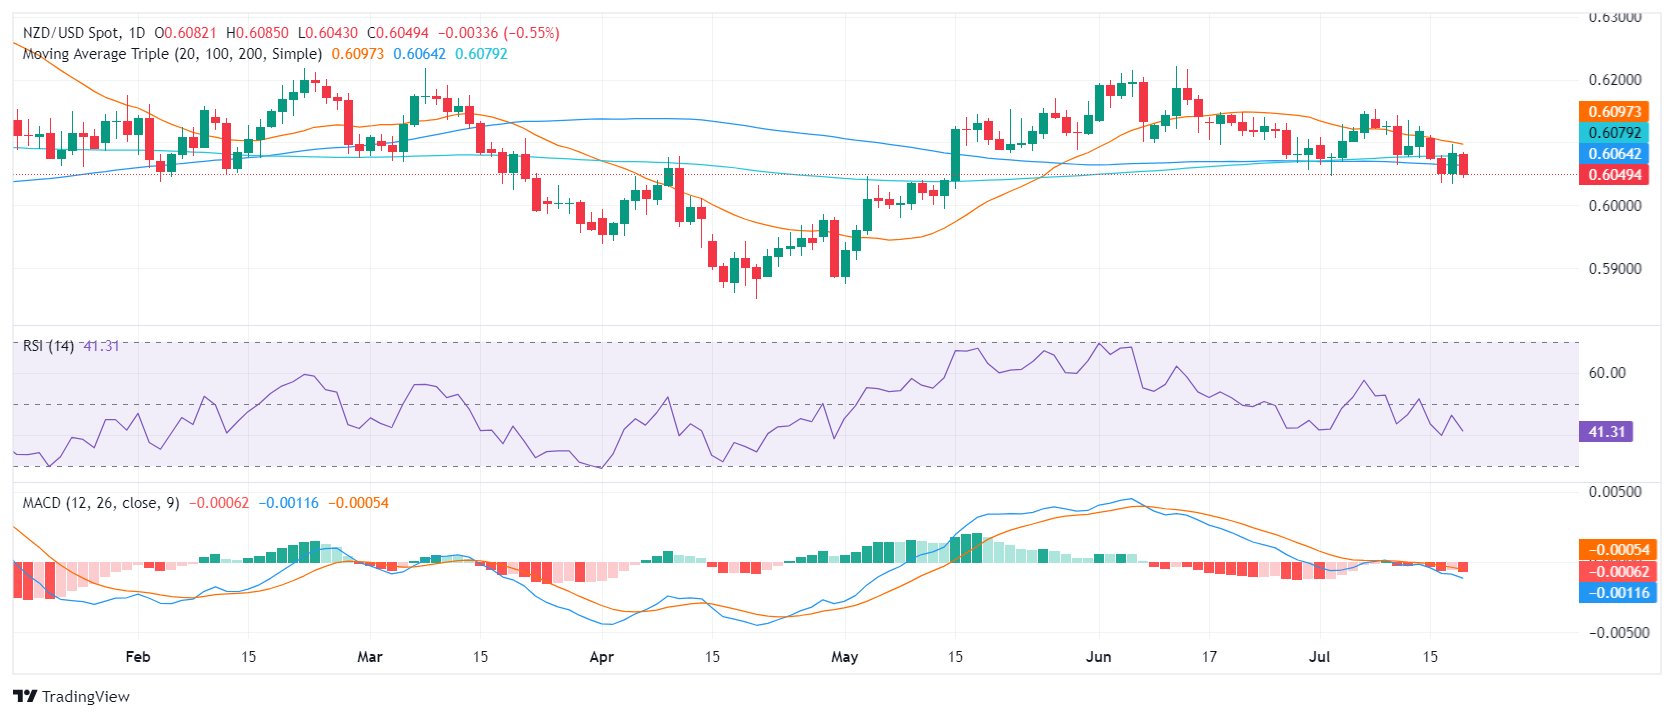
Resistance is now situated at the earlier support level of 0.6070, succeeded by the 20-day SMA around the 0.6100 level, then at 0.6150 and further above at 0.6200. Bulls require a decisive closing above these points to indicate a bullish reversal, shifting the focus upward.
The downside observes robust support at 0.6050, followed by 0.6030, adjusting to the bearish tilt, a significant benchmark at 0.6000 comes into sight. An appreciable plunge beneath these levels would certify the bearish outlook, potentially leading to a correction toward lower levels.
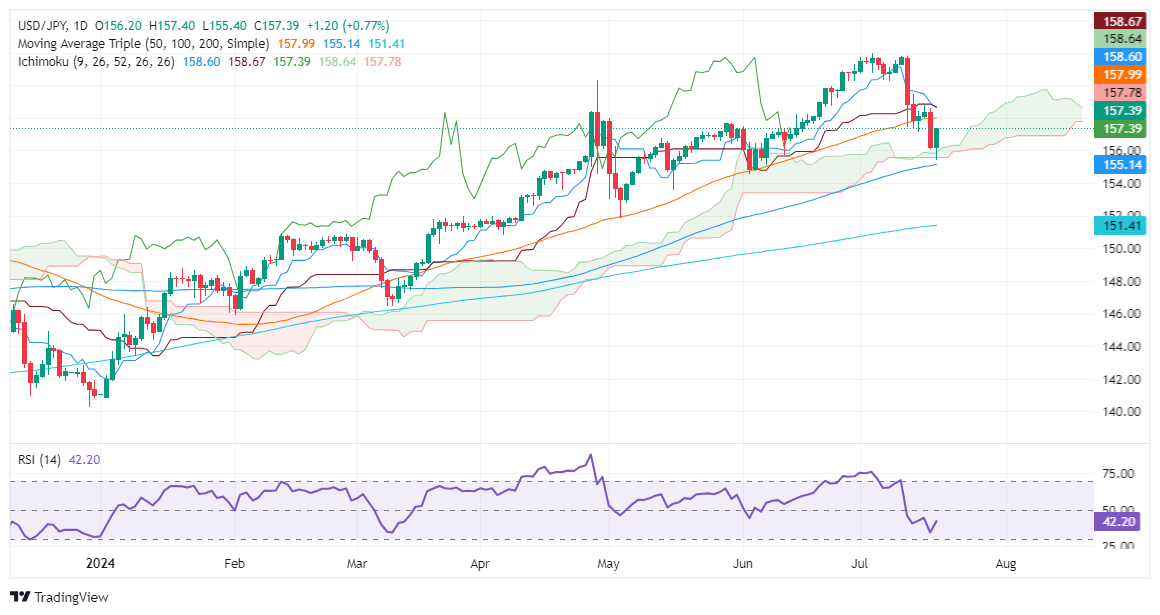
- USD/JPY rises to 157.39, up 0.70% after rebounding from 155.37 low.
- Bearish trend holds with RSI under 50, hinting at possible downtrend return.
- Key supports: 156.06, 155.37, 155.00; resistances: 157.50, July 16 high of 158.85.
The US Dollar stages a comeback against the Japanese Yen and pushes the USD/JPY pair higher on Thursday, posting gains of more than 0.70% and reclaiming the 157.00 figure at the time of writing. The major bounce off daily lows of 155.37, though a risk-on impulse lifted the exchange rate to the current spot price at 157.39.
USD/JPY Price Analysis: Technical outlook
The USD/JPY trims some of its Wednesday losses, bouncing from underneath the Ichimoku Cloud (Kumo) level of 155.37 and rising near the July 15 daily low of 157.14.
Momentum remains bearishly biased, with the Relative Strength Index (RSI) standing below the 50-neutral line. That said, the USD/JPY might resume its downtrend in the near term.
Therefore, the USD/JPY first support would be the July 17 low of 156.06. Once cleared, the next stop would be the bottom of the Kumo at 155.37 before slumping toward 155.00. A further downside is seen below that level, exposing the May 16 swing low of 153.61. A breach of the latter will expose the May 2 pivot low at 151.87, ahead of testing the 151.00 mark.
On the other hand, if buyers stepped in and pushed the USD/JPY above 157.50, look for a re-test of the July 16 peak at 158.85.
USD/JPY Price Action – Daily Chart
Japanese Yen FAQs
The Japanese Yen (JPY) is one of the world’s most traded currencies. Its value is broadly determined by the performance of the Japanese economy, but more specifically by the Bank of Japan’s policy, the differential between Japanese and US bond yields, or risk sentiment among traders, among other factors.
One of the Bank of Japan’s mandates is currency control, so its moves are key for the Yen. The BoJ has directly intervened in currency markets sometimes, generally to lower the value of the Yen, although it refrains from doing it often due to political concerns of its main trading partners. The current BoJ ultra-loose monetary policy, based on massive stimulus to the economy, has caused the Yen to depreciate against its main currency peers. This process has exacerbated more recently due to an increasing policy divergence between the Bank of Japan and other main central banks, which have opted to increase interest rates sharply to fight decades-high levels of inflation.
The BoJ’s stance of sticking to ultra-loose monetary policy has led to a widening policy divergence with other central banks, particularly with the US Federal Reserve. This supports a widening of the differential between the 10-year US and Japanese bonds, which favors the US Dollar against the Japanese Yen.
The Japanese Yen is often seen as a safe-haven investment. This means that in times of market stress, investors are more likely to put their money in the Japanese currency due to its supposed reliability and stability. Turbulent times are likely to strengthen the Yen’s value against other currencies seen as more risky to invest in.
- AUD/JPY cuts losses, rising to 105.40, still in lows in over a month.
- The five-day downtrend has been halted, indicating a potential settling of bearish sentiment.
In Thursday's session, the AUD/JPY pair cut a significant five-day losing streak, climbing by 0.30% to reach 105.50. This rise is symbolically indicative of an interruption to the extended bearish momentum experienced by the pair seen in the last sessions. Even so, indicator readings are still stationed in the negatives, creating the possibility for the pair's upward correction to be rather more corrective in nature.
The daily Relative Strength Index (RSI) for AUD/JPY now hovers at 43, marking the potential start of a mild rebound from its session's reading of 37. The Moving Average Convergence Divergence (MACD) still shows flat red bars, suggesting a pause in the intensified selling activity seen previously.
AUD/JPY daily chart
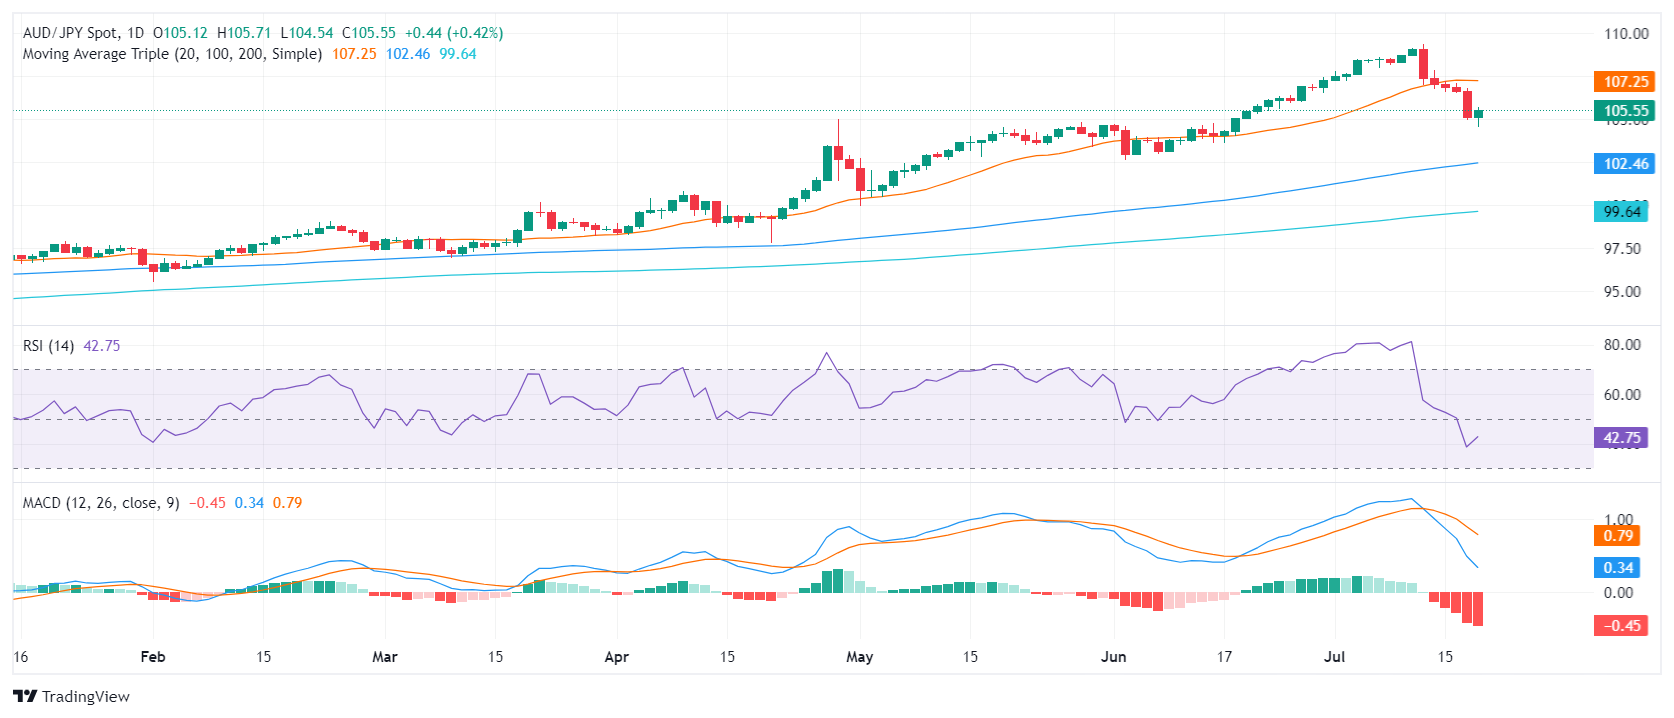
Looking at the broader picture, the AUD/JPY pair seems to continue its bearish course, emphasized by its position below its 20,100 and 200-day Simple Moving Average (SMA). Moving forward, immediate support levels rest at 105.00 and 104.30 which buyers must watch in anticipation of a potential deeper correction. To avoid further potential losses, buyers must strive to recover the 106.00 mark, extending their goal to the reclaiming of the 106.50 level.
- GBP/JPY pumped the brakes on a recent decline to give a meager bounce.
- UK labor data printed slightly better than expected, helped to bolster the Pound.
- Japanese National CPI inflation, UK Retail Sales in the barrel for Friday.
GBP/JPY recovered from a recent plunge on Thursday, bouncing back over the 203.00 handle. GBP bidding fell just short of reclaiming 204.00 through Thursday’s market session, and the Guppy is grinding out a recovery after suspected “Yenterventions” pushed the Yen higher across the board.
There has been no official confirmation from Japanese officials whether the Bank of Japan (BoJ) and Japan’s Ministry of Finance (MoF) directly intervened in global FX markets, but rapid, one-sided market flows and an extreme upswing in BoF financial operations reporting compared to market forecasts has tipped the BoJ’s hand. Defending the Yen is becoming an increasingly expensive project for the MoF.
UK Average Earnings printed exactly at expectations early Thursday, and UK Claimant Count Change figures in June printed at 32.3K MoM, less than the previous month’s revised 51.9K, but still higher than the forecast decline to 23.4K. UK Retail Sales are in the pipe for Friday, and median market forecasts expect the volume of retail spending to print a -0.4% decline versus the previous 2.9% surge.
Japanese National Consumer Price Index (CPI) inflation is due early Friday, with modelers expecting national-level CPI inflation to tick upwards to 2.7% YoY compared to the previous period’s 2.5%.However, national Japanese inflation figures tend to be front run by Tokyo CPI inflation released several weeks earlier, so impacts tend to be muted. Despite the forecast uptick, the figure is unlikely to be enough to force the BoJ out of its hyper easy monetary policy stance. With the Japanese Yen floundering at the bottom of a wide rate differential between all other major currencies, Yen weakness could be expected to continue.
GBP/JPY technical outlook
The Guppy hit a demand zone near 202.50 early Thursday, catching a bounce towards 204.00 as bidders find their footing and push GBP/JPY bids into a recovery mode. Intraday price action is still trading south of the 200-hour Exponential Moving Average (EMA) at 204.82, and 202.50 has been marked out as a line in the sand for continued short pressure.
Daily candles are holding above the 50-day EMA at 201.38, and despite suspected “Yenterventions”, the pair is still trading firmly into 16-year highs. Bids are trading well above the 200-day EMA at 192.18.
GBP/JPY hourly chart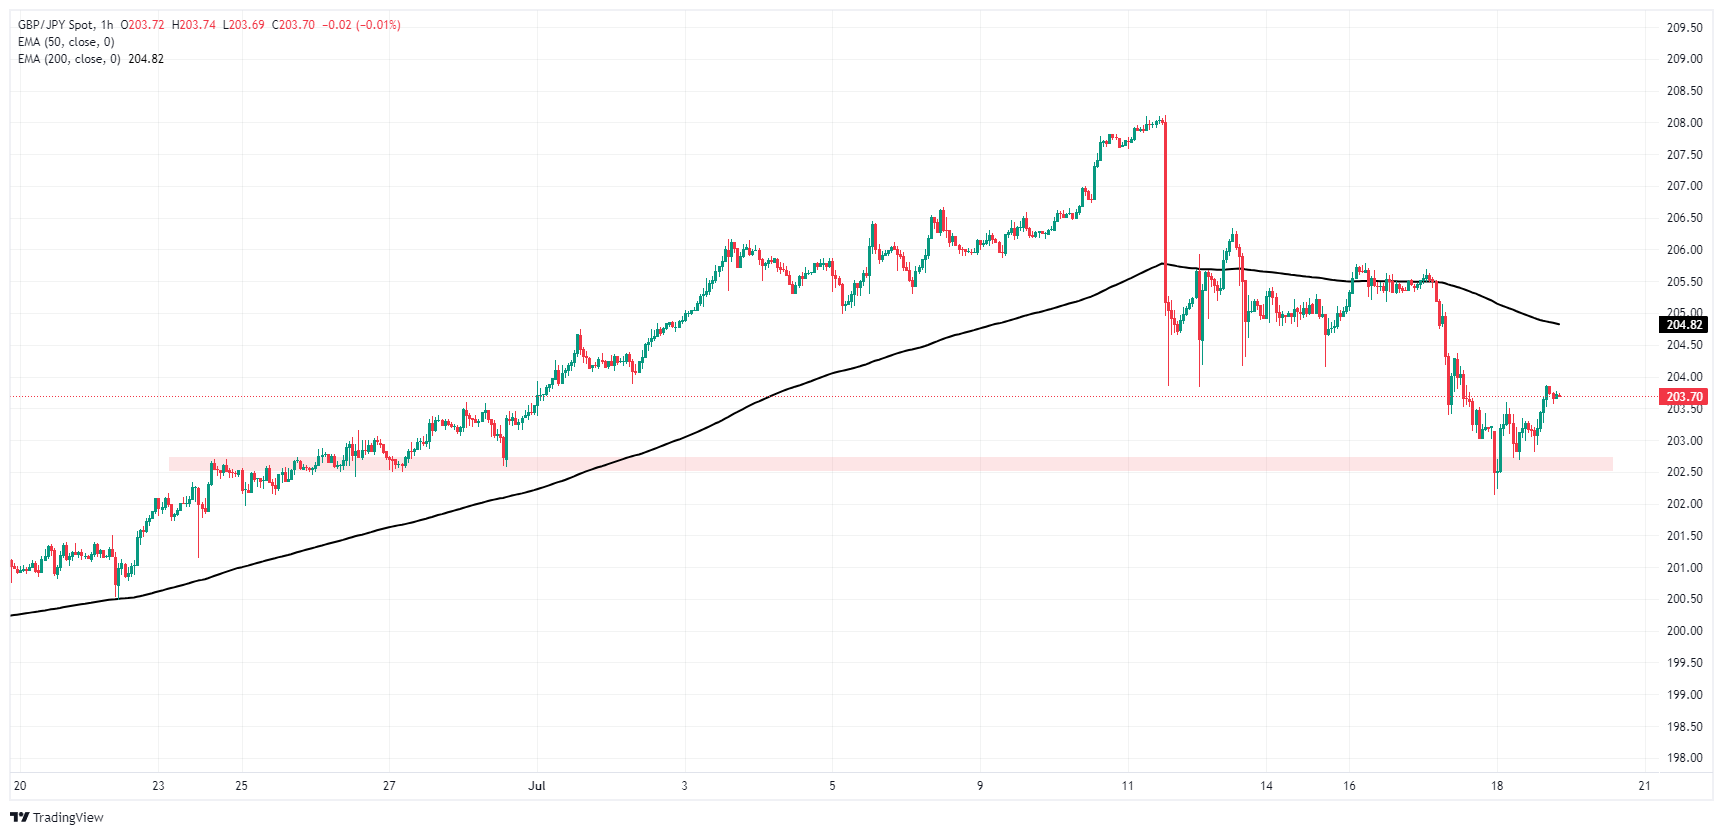
GBP/JPY daily chart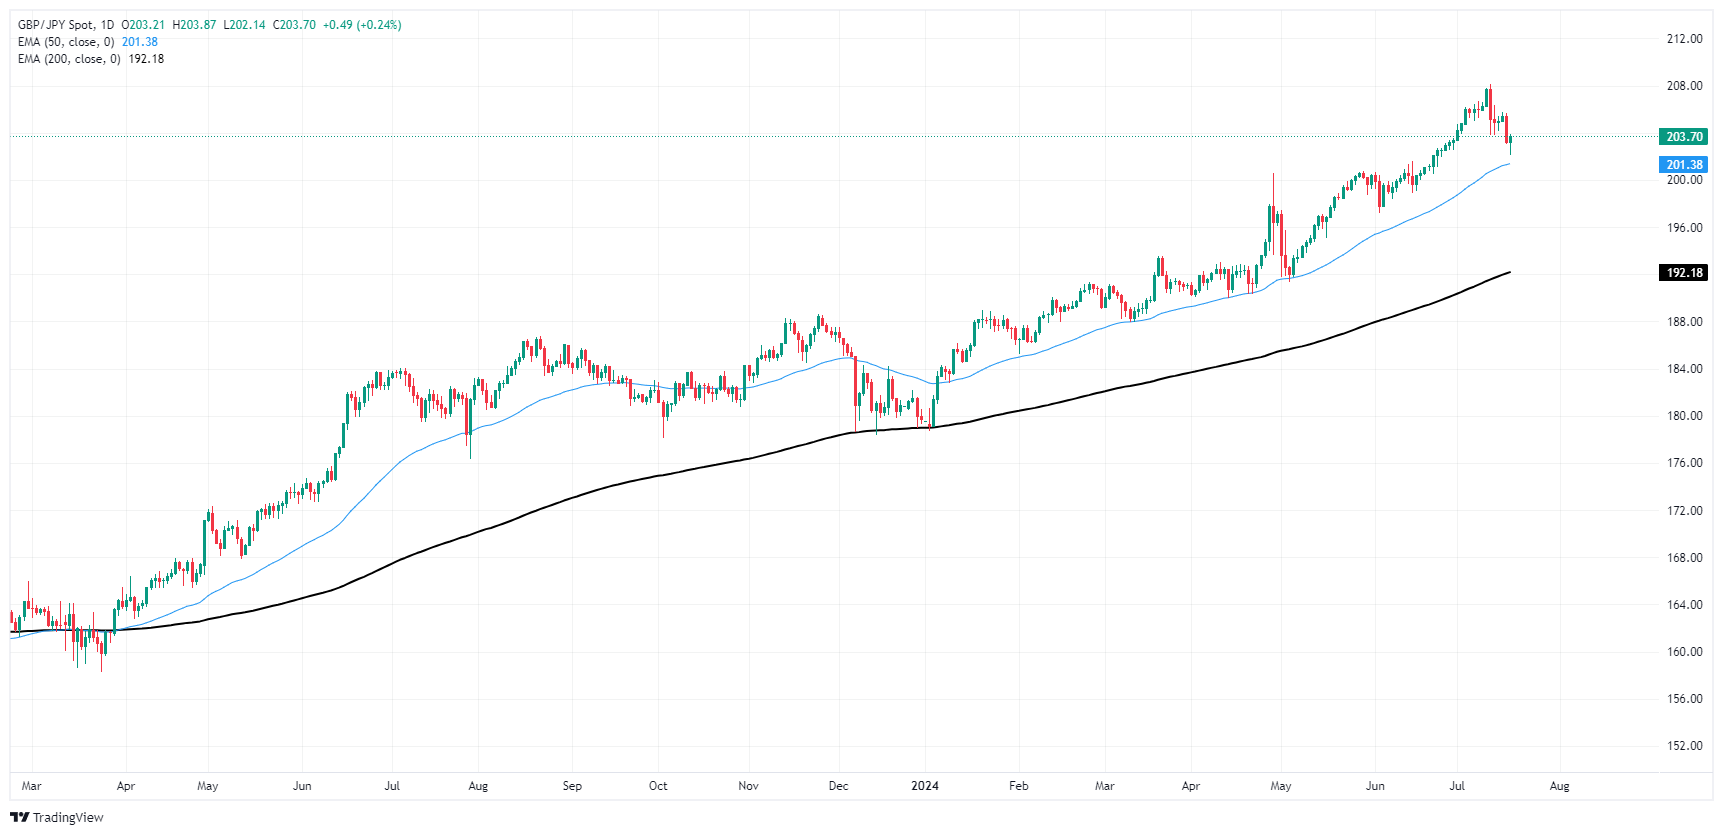
Pound Sterling FAQs
The Pound Sterling (GBP) is the oldest currency in the world (886 AD) and the official currency of the United Kingdom. It is the fourth most traded unit for foreign exchange (FX) in the world, accounting for 12% of all transactions, averaging $630 billion a day, according to 2022 data. Its key trading pairs are GBP/USD, aka ‘Cable’, which accounts for 11% of FX, GBP/JPY, or the ‘Dragon’ as it is known by traders (3%), and EUR/GBP (2%). The Pound Sterling is issued by the Bank of England (BoE).
The single most important factor influencing the value of the Pound Sterling is monetary policy decided by the Bank of England. The BoE bases its decisions on whether it has achieved its primary goal of “price stability” – a steady inflation rate of around 2%. Its primary tool for achieving this is the adjustment of interest rates. When inflation is too high, the BoE will try to rein it in by raising interest rates, making it more expensive for people and businesses to access credit. This is generally positive for GBP, as higher interest rates make the UK a more attractive place for global investors to park their money. When inflation falls too low it is a sign economic growth is slowing. In this scenario, the BoE will consider lowering interest rates to cheapen credit so businesses will borrow more to invest in growth-generating projects.
Data releases gauge the health of the economy and can impact the value of the Pound Sterling. Indicators such as GDP, Manufacturing and Services PMIs, and employment can all influence the direction of the GBP. A strong economy is good for Sterling. Not only does it attract more foreign investment but it may encourage the BoE to put up interest rates, which will directly strengthen GBP. Otherwise, if economic data is weak, the Pound Sterling is likely to fall.
Another significant data release for the Pound Sterling is the Trade Balance. This indicator measures the difference between what a country earns from its exports and what it spends on imports over a given period. If a country produces highly sought-after exports, its currency will benefit purely from the extra demand created from foreign buyers seeking to purchase these goods. Therefore, a positive net Trade Balance strengthens a currency and vice versa for a negative balance.
- Thursday's session witnessed the NZD/JPY pair rebounding, counterbalancing part of the bearish momentum.
- Despite the small rise, the cross still registers a weekly loss of 1.50%.
- Though corrective actions take place, technical indicators still depict a negative outlook.
In Thursday's session, the NZD/JPY pair managed to record a slight upsurge and landed at 95.15. Despite this rebounding action, the pair accumulated approximately 1.50% losses over the week, indicating a persistently negative outlook.
Day-to-day technical indicators extend the domination of the bears, despite the recent rebound. The Relative Strength Index (RSI), currently positioned at 33, indicates a northward momentum, an uplift from Wednesday's value of 28. However, it's still well within negative zone but has now scaped the oversold threshold. The Moving Average Convergence Divergence (MACD) continues to print flat red bars, demonstrating sustained but now halted selling pressure.
NZD/JPY daily chart
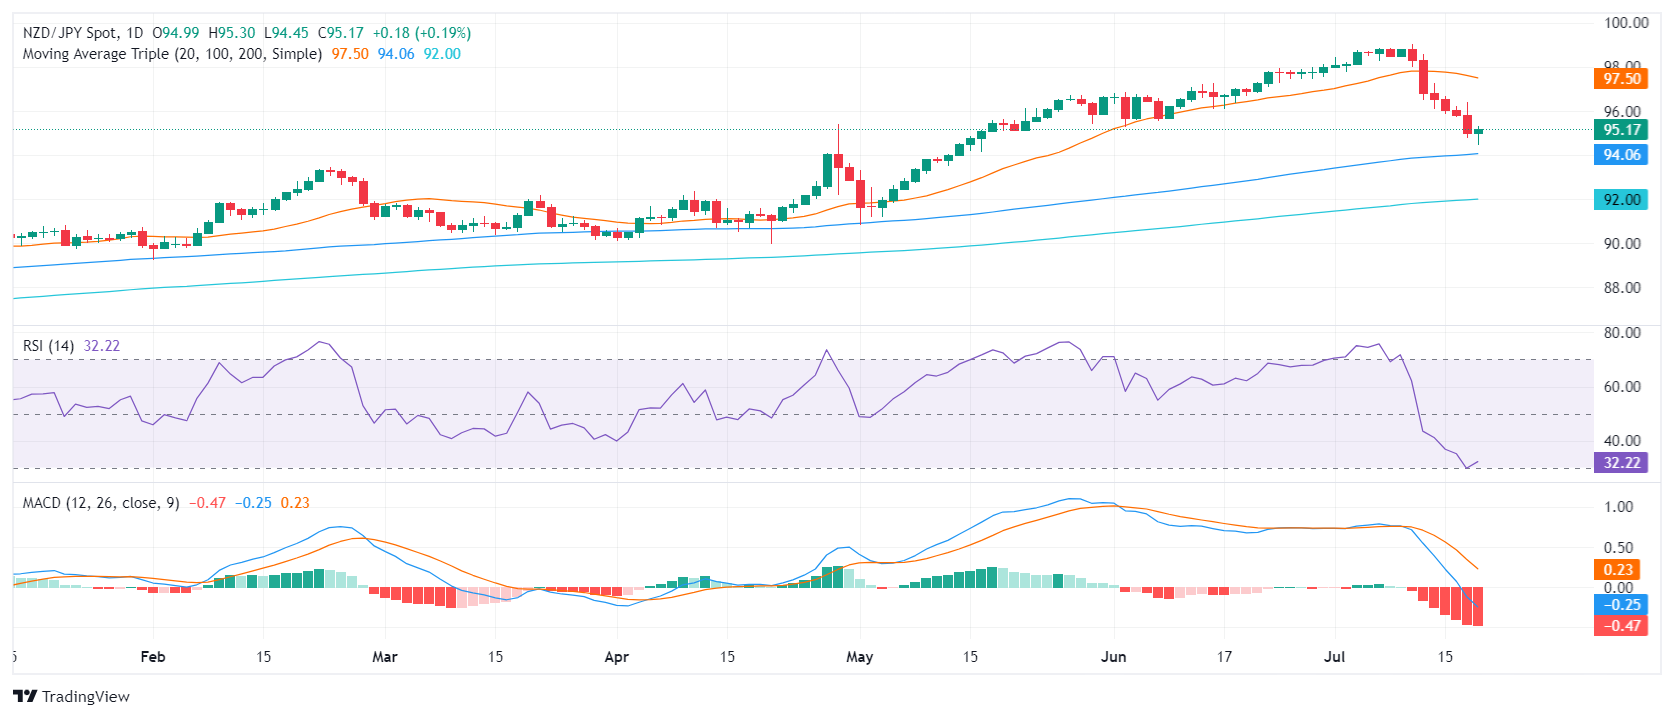
Reflective of the prevailing bearish tone, immediate support levels are now spotted lower at 94.50 and the crucial level at 94.00. A descent below these levels could confirm the bearish dominance over the short term. Resistances, on the other hand, are now at the previous support levels of 95.50, and 96.00.
- Gold is down more than 0.50% amid anticipation of a September Fed rate cut.
- US jobless claims exceed forecasts, suggesting economic slowdown and favoring lower rates.
- US Dollar Index up 0.43% to 104.18; 10-year Treasury yields increase by 2.5 basis points to 4.187%.
Gold prices continued to drop on Thursday, though remaining at around familiar levels of $2,450 per troy ounce, as speculation that the Federal Reserve would lower borrowing costs at the September meeting grew. At the time of writing, the XAU/USD trades at $2,443 with losses of 0.20% as the Greenback stages a recovery, underpinned by elevated US Treasury yields.
US jobs data revealed by the US Bureau of Labor Statistics (BLS) showed that more people than expected are applying for unemployment benefits, indicating an economic slowdown. This, added to last week’s string of data showing that inflation is aiming towards the Fed’s 2% goal, is beginning to gather policymakers' attention.
The number of Americans filing new applications for unemployment benefits rose more than expected last week, but there has been no material shift in the labor market, according to data released by the Labor Department on Thursday.
Lastly, Federal Reserve officials had expressed that the central bank could be “closer” to lower borrowing costs as the dual mandate risks had become more balanced. However, the International Monetary Fund (IMF) said on Thursday that the Fed should not cut interest rates until late 2024.
Given the backdrop, Gold prices recorded an all-time high of $2,483, but buyers failed to cling to gains as investors booked profits. This, along with former US President Donald Trump’s rhetoric of imposing at least 60% tariffs on China’s products, spurred flows to the American dollar.
The US Dollar Index, which tracks the currency's performance against six other currencies, is up 0.43% at 104.18. US Treasury bond yields are also rising across the yield curve, with the 10-year Treasury note yielding 4.187%, up more than two and a half basis points (bps).
Daily digest market movers: Gold retreats as buyers take a breather close to $2,500
- Weaker-than-expected US Consumer Price Index (CPI) data boosted gold prices above $2,400, as the increased likelihood of Fed rate cuts led to falling US Treasury bond yields.
- US Initial Jobless Claims, as reported by the BLS, showed that the number of Americans filing for unemployment benefits in the week ending July 13 rose to 243K, above the estimated 230K, exceeding the previous week's reading of 223K.
- December 2024 fed funds rate futures contract implies that the Fed will ease policy by 52 basis points (bps) toward the end of the year, up from 50 last Friday.
Gold technical analysis: XAU/USD tumbles beneath $2,460 as buyers take a breather
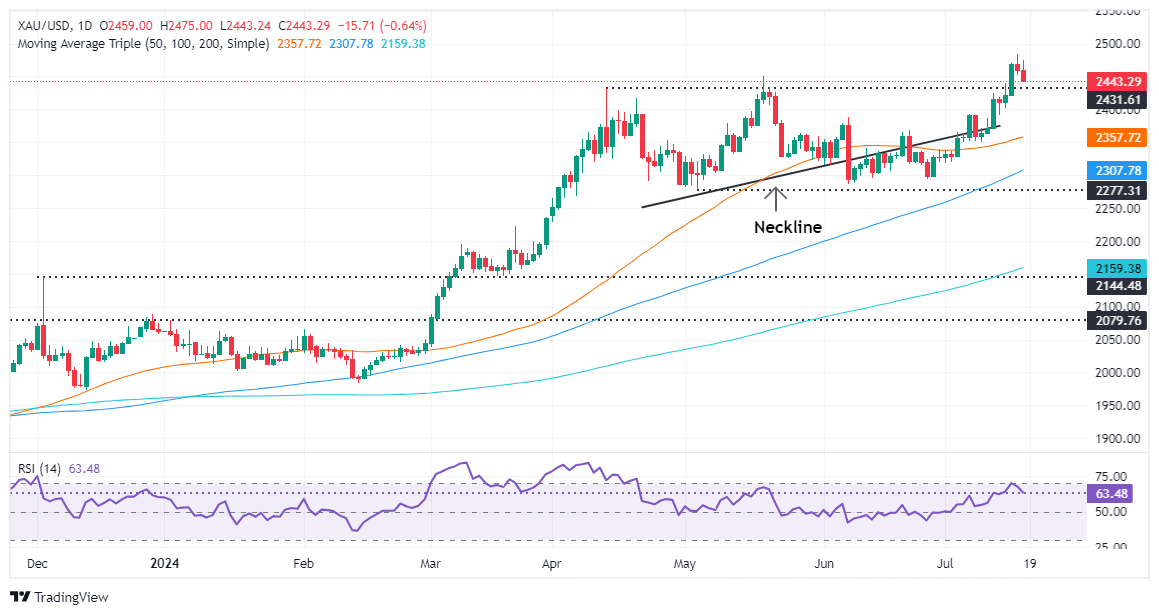
The Gold price is experiencing a pullback, hinting that traders are booking profits after rallying more than 8% during the last three weeks. Momentum remains bullish in the mid-term, but the Relative Strength Index (RSI) aims lower, which indicates that buyers are taking a respite before lifting the precious metal to higher prices.
In the short term, the XAU/USD is headed to the downside, and if it achieves a daily close below $2,450, that will pave the way to challenge $2,400. Further losses lie beneath, and XAU/USD could dive to the July 5 high at $2,392, followed by the psychological $2,350 mark.
Otherwise, if XAU/USD conquers $2,490, that can pave the way to print a new all-time high of $2,500.
Gold FAQs
Gold has played a key role in human’s history as it has been widely used as a store of value and medium of exchange. Currently, apart from its shine and usage for jewelry, the precious metal is widely seen as a safe-haven asset, meaning that it is considered a good investment during turbulent times. Gold is also widely seen as a hedge against inflation and against depreciating currencies as it doesn’t rely on any specific issuer or government.
Central banks are the biggest Gold holders. In their aim to support their currencies in turbulent times, central banks tend to diversify their reserves and buy Gold to improve the perceived strength of the economy and the currency. High Gold reserves can be a source of trust for a country’s solvency. Central banks added 1,136 tonnes of Gold worth around $70 billion to their reserves in 2022, according to data from the World Gold Council. This is the highest yearly purchase since records began. Central banks from emerging economies such as China, India and Turkey are quickly increasing their Gold reserves.
Gold has an inverse correlation with the US Dollar and US Treasuries, which are both major reserve and safe-haven assets. When the Dollar depreciates, Gold tends to rise, enabling investors and central banks to diversify their assets in turbulent times. Gold is also inversely correlated with risk assets. A rally in the stock market tends to weaken Gold price, while sell-offs in riskier markets tend to favor the precious metal.
The price can move due to a wide range of factors. Geopolitical instability or fears of a deep recession can quickly make Gold price escalate due to its safe-haven status. As a yield-less asset, Gold tends to rise with lower interest rates, while higher cost of money usually weighs down on the yellow metal. Still, most moves depend on how the US Dollar (USD) behaves as the asset is priced in dollars (XAU/USD). A strong Dollar tends to keep the price of Gold controlled, whereas a weaker Dollar is likely to push Gold prices up.
The ECB left its policy rates unchanged, as expected, while President Lagarde also failed to surprise markets. The Greenback, in the meantime, regained some fresh oxygen on the back of higher yields ahead of Fed speakers on Friday.
Here is what you need to know on Friday, July 19:
A decent rebound encouraged the USD Index (DXY) to flirt once again with the 104.00 region amidst a pick-up in US yields across the curve. Absent data releases on the US calendar on July 19, the focus of attention will be on speeches by the Fed’s Daly, Bowman, Williams, and Bostic.
The resumption of the selling pressure motivated EUR/USD to give away part of recent gains and retreat to the 1.0900 neighbourhood. On July 19, the EMU Current Account results will be published, and the ECB will release its Survey of Professional Forecasters (SPF).
In line with the rest of the risk complex, GBP/USD abandoned the area of recent peaks and receded to the sub-1.3000 zone. Retail Sales in the UK will take centre stage on July 19 along with Public Sector Net Borrowing and the GfK Consumer Confidence.
The improvement in the sentiment around the Greenback and higher US yields prompted USD/JPY to regain some upside traction and surpass the 157.00 mark. Japan’s Inflation Rate will be at the centre of the debate on July 19 seconded by weekly Foreign Bond Investment figures.
AUD/USD dropped for the fourth session in a row following the still unabated bearish trend in the commodity complex and persistent demand concerns stemming from China. There are no scheduled data releases Down Under on July 19.
WTI prices managed to edge a tad higher and add to Wednesday’s gains amidst persevering demand concerns, the slowdown of the US economy and prospects of interest rate cuts by the Fed.
Prices of Gold remained on the back foot and retreated further after reaching a record high near the $2,490 mark per ounce troy on Wednesday. Silver followed suit and built on Wednesday’s losses, breaking below the key $30.00 mark per ounce.
- AUD/USD slightly declined on Thursday, just below 0.6730.
- Newly released employment data sets the direction for possible RBA and Federal Reserve decisions.
- However, monetary divergences between both banks remain steady.
The Australian Dollar (AUD) suffered minor losses against the USD during Thursday's session, falling marginally to 0.6730. The AUD slightly faltered due to investor responses to both Australian and US labor market data that has provided further clues for the next Reserve Bank of Australia (RBA) and Federal Reserve decisions.
Despite the underperforming Australian economy, stubbornly high inflation pressures the RBA to defer rate cuts potentially limiting the AUD's downside. The RBA is anticipated to be among the final central banks within the G10 countries to introduce rate cuts, a factor that promises to sustain the AUD's momentum.
Daily digest market movers: Australian labor market data guides the AUD course.
- The Australian Bureau of Statistics (ABS) revealed an impressive 50.2K increase in employment changes, surmounting the earlier market forecasts of 20K and May's 39.5K record.
- On the negative side, the Unemployment Rate escalated slightly from 4.0% to 4.1%, and although minor, it might ease the RBA’s hawkish stance.
- On the US front, labor data indicates applicants for unemployment insurance benefits rose by 243K in the week ending on July 13.
- These figures exceeded initial forecasts and previous weekly records according to Thursday's report from the US Department of Labor.
- Currently, projections predict nearly a 50% chance of the RBA taking a rate hike, possibly in September or November.
- The potential rate cut by the Federal Reserve in September, however, seems a close deal and divergent approaches by the Fed and RBA towards their respective monetary policies could curb the losses of the pair.
Technical Analysis: AUD/USD continues flat, overall outlook stays positive.
Despite the losses in the week, the future of AUD/USD remains generally positive as the pair maintains levels not experienced since the beginning of the year. After the early July gains, indicators such as the Relative Strength Index (RSI) and the Moving Average Convergence Divergence (MACD) have shown weakening trends, implying the pair has entered a correction period. For the next sessions, the pair might side-ways trade in the 0.6700-0.6800 channel as buyers book profits.
Australian Dollar FAQs
One of the most significant factors for the Australian Dollar (AUD) is the level of interest rates set by the Reserve Bank of Australia (RBA). Because Australia is a resource-rich country another key driver is the price of its biggest export, Iron Ore. The health of the Chinese economy, its largest trading partner, is a factor, as well as inflation in Australia, its growth rate and Trade Balance. Market sentiment – whether investors are taking on more risky assets (risk-on) or seeking safe-havens (risk-off) – is also a factor, with risk-on positive for AUD.
The Reserve Bank of Australia (RBA) influences the Australian Dollar (AUD) by setting the level of interest rates that Australian banks can lend to each other. This influences the level of interest rates in the economy as a whole. The main goal of the RBA is to maintain a stable inflation rate of 2-3% by adjusting interest rates up or down. Relatively high interest rates compared to other major central banks support the AUD, and the opposite for relatively low. The RBA can also use quantitative easing and tightening to influence credit conditions, with the former AUD-negative and the latter AUD-positive.
China is Australia’s largest trading partner so the health of the Chinese economy is a major influence on the value of the Australian Dollar (AUD). When the Chinese economy is doing well it purchases more raw materials, goods and services from Australia, lifting demand for the AUD, and pushing up its value. The opposite is the case when the Chinese economy is not growing as fast as expected. Positive or negative surprises in Chinese growth data, therefore, often have a direct impact on the Australian Dollar and its pairs.
Iron Ore is Australia’s largest export, accounting for $118 billion a year according to data from 2021, with China as its primary destination. The price of Iron Ore, therefore, can be a driver of the Australian Dollar. Generally, if the price of Iron Ore rises, AUD also goes up, as aggregate demand for the currency increases. The opposite is the case if the price of Iron Ore falls. Higher Iron Ore prices also tend to result in a greater likelihood of a positive Trade Balance for Australia, which is also positive of the AUD.
The Trade Balance, which is the difference between what a country earns from its exports versus what it pays for its imports, is another factor that can influence the value of the Australian Dollar. If Australia produces highly sought after exports, then its currency will gain in value purely from the surplus demand created from foreign buyers seeking to purchase its exports versus what it spends to purchase imports. Therefore, a positive net Trade Balance strengthens the AUD, with the opposite effect if the Trade Balance is negative.
- Dow Jones rose into a fifth consecutive all-time high before receding on Thursday.
- Equities are paring back after a heady rally on rate cut hopes.
- September rate cut is fully priced in, Fed hold at the end of July expected.
The Dow Jones Industrial Average (DJIA) rallied into yet another record high on Thursday before turning lower and following the broader market into a soft pullback that dragged intraday prices back into the midweek range. The Dow Jones is trading firmly above the 40,000.00 major price handle after getting buoyed into all-time highs by investor expectations of a September rate cut getting pinned to the ceiling.
According to the CME’s FedWatch Tool, rate markets are pricing in over 98% odds of at least a quarter-point rate trim from the Federal Reserve (Fed) in September. Some particularly adventurous rate traders are pricing in a 5% chance of a first cut in July, but odds remain low at 5%.
Thursday’s Initial Jobless Claims print helped to keep rate cut hopes bolstered after the number of new jobless benefits seekers rose to 243K for the week ended July 12, well above the previous week’s revised 223K and vaulting over the forecast 230K. While jobless claims aren’t a market-mover, it helps add weight to expectations of a continued loosening in the US job market, a key component alongside inflation figures to help bully the Fed into a rate cutting cycle.
Dow Jones news
Despite easing back into the low end on Thursday, the Dow Jones is roughly on-balance, with about half of the index’s constituent equities in the green for the day. Intel Corp. (INTC) rose over 3% to $35.52 per share despite an overall decline in the chipmaking sector. Banking dominated the low end on Thursday, with JPMorgan Chase & Co. (JPM) and Goldman Sachs Group Inc. (GS) both declining. JPM shed -2.85% to $210.69 per share while GS eased lower -2.43% to $489.98 per share.
Dow Jones technical outlook
After hitting a fifth consecutive all-time high of 41,37138 on Thursday, the Dow Jones index eased back below 40,900.00 as bulls take a much-needed breather. The Dow Jones closed in the green for six straight trading days, rallying nearly 5.5% in the process.
The Dow Jones’ latest bullish push has sent prices well into record highs, and even Thursday’s moderate pullback of -300 points still leaves prices buried deep in bull country, trading nearly 4% above the 50-day Exponential Moving Average (EMA) at 39,345.00.
Dow Jones five minute chart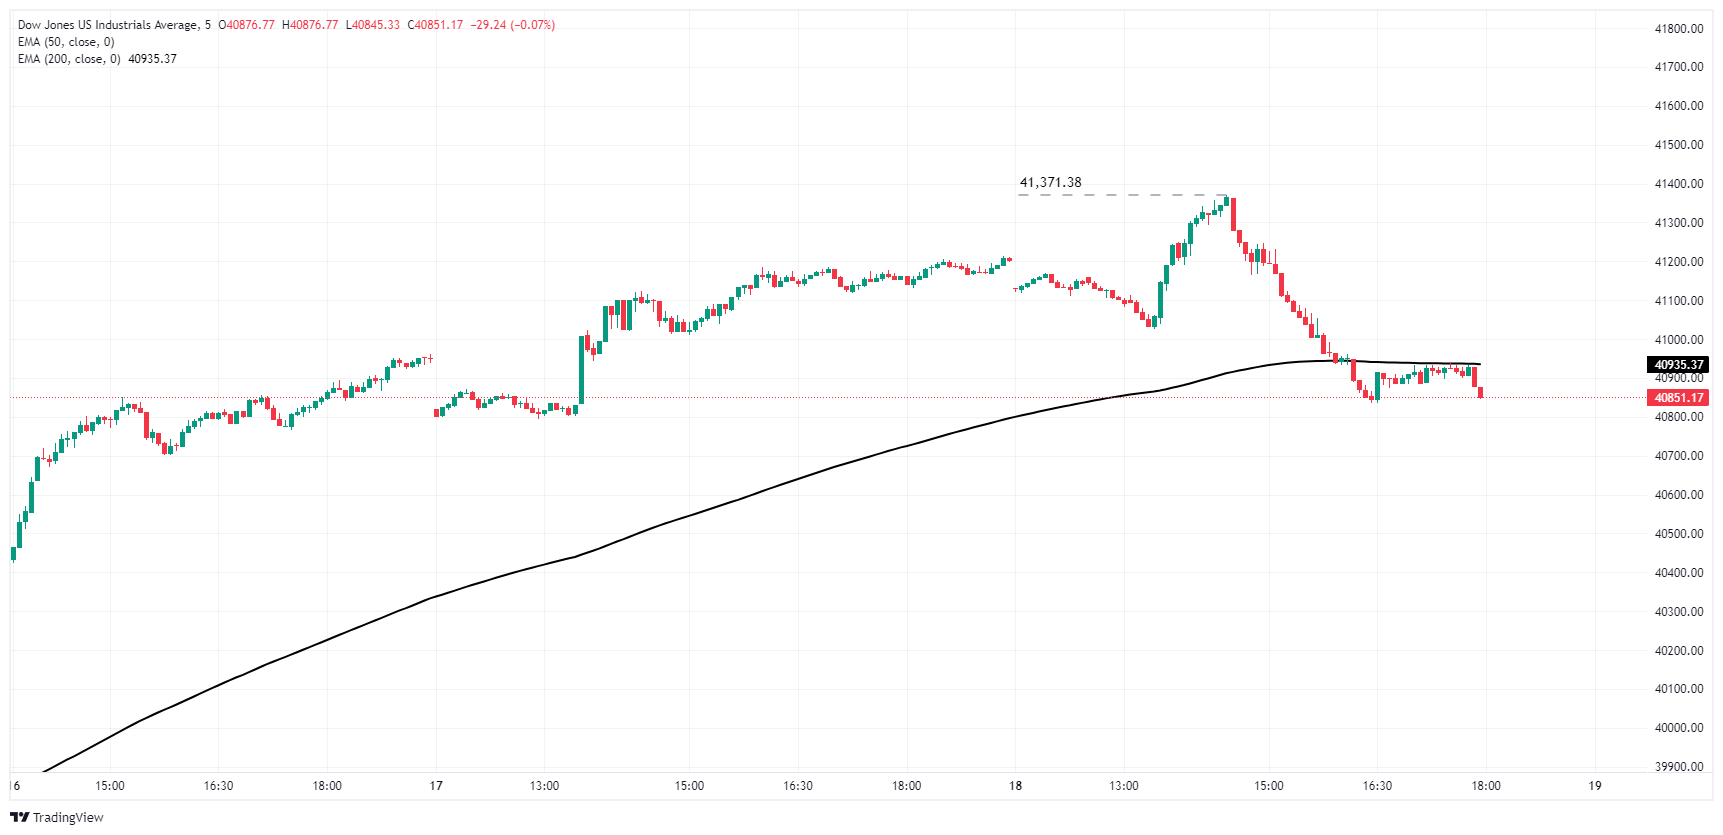
Dow Jones daily chart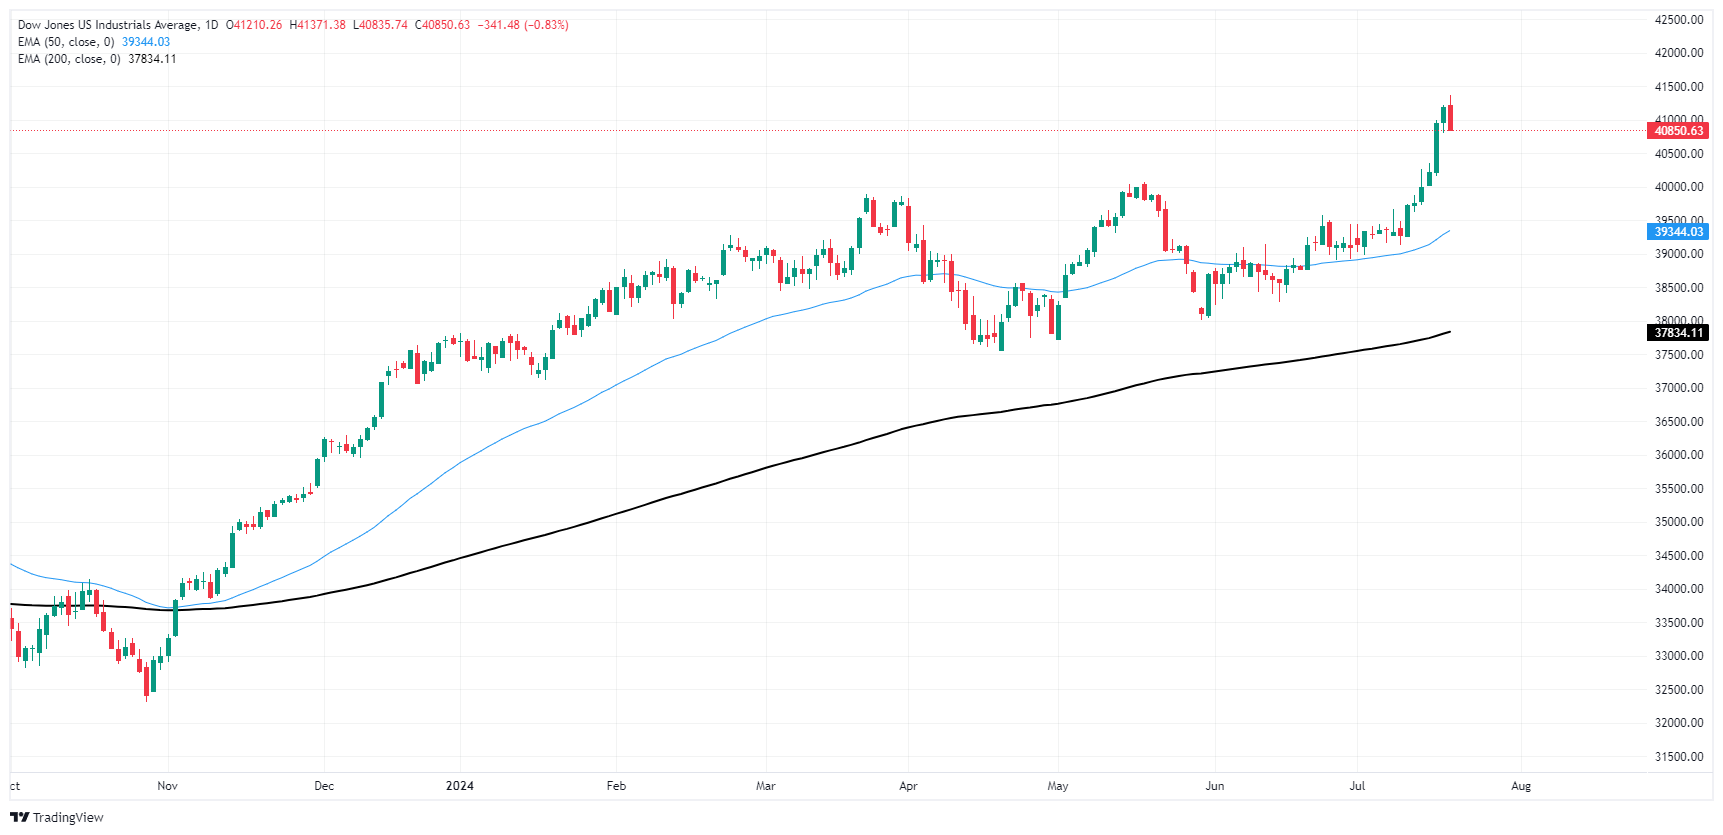
Dow Jones FAQs
The Dow Jones Industrial Average, one of the oldest stock market indices in the world, is compiled of the 30 most traded stocks in the US. The index is price-weighted rather than weighted by capitalization. It is calculated by summing the prices of the constituent stocks and dividing them by a factor, currently 0.152. The index was founded by Charles Dow, who also founded the Wall Street Journal. In later years it has been criticized for not being broadly representative enough because it only tracks 30 conglomerates, unlike broader indices such as the S&P 500.
Many different factors drive the Dow Jones Industrial Average (DJIA). The aggregate performance of the component companies revealed in quarterly company earnings reports is the main one. US and global macroeconomic data also contributes as it impacts on investor sentiment. The level of interest rates, set by the Federal Reserve (Fed), also influences the DJIA as it affects the cost of credit, on which many corporations are heavily reliant. Therefore, inflation can be a major driver as well as other metrics which impact the Fed decisions.
Dow Theory is a method for identifying the primary trend of the stock market developed by Charles Dow. A key step is to compare the direction of the Dow Jones Industrial Average (DJIA) and the Dow Jones Transportation Average (DJTA) and only follow trends where both are moving in the same direction. Volume is a confirmatory criteria. The theory uses elements of peak and trough analysis. Dow’s theory posits three trend phases: accumulation, when smart money starts buying or selling; public participation, when the wider public joins in; and distribution, when the smart money exits.
There are a number of ways to trade the DJIA. One is to use ETFs which allow investors to trade the DJIA as a single security, rather than having to buy shares in all 30 constituent companies. A leading example is the SPDR Dow Jones Industrial Average ETF (DIA). DJIA futures contracts enable traders to speculate on the future value of the index and Options provide the right, but not the obligation, to buy or sell the index at a predetermined price in the future. Mutual funds enable investors to buy a share of a diversified portfolio of DJIA stocks thus providing exposure to the overall index.
- Mexican Peso plummets more than 1% as USD/MXN trades above 17.90.
- Fitch reaffirms Mexico's BBB- rating, highlighting judicial reform and fiscal deficit concerns.
- US unemployment claims rise, boosting the US Dollar Index above 104.00, gaining 0.25%.
The Mexican Peso begins Thursday’s session on the backfoot against the Greenback as investors turn risk-averse, while the Greenback remains bid and trims some of Wednesday’s losses. The USD/MXN trades at 17.92, 1.30 % above its opening price.
Mexico’s economic docket remains absent, leaving traders adrift to market mood and US Dollar dynamics. Meanwhile, Fitch ratings reaffirmed Mexico’s BBB- qualification with a stable outlook.
In further comments, Fitch revealed that the proposed judicial reform would negatively affect Mexico’s institutional profile, but it's too early to gauge the impact. The credit rating agency stated there’s uncertainty in the upcoming administration to narrow the fiscal deficit, expects a slight economic slowdown in 2025, and added that trade tensions with the US could leave Mexico vulnerable.
Fitch reviews came after the International Monetary Fund (IMF) adjusted Mexico’s Gross Domestic Product (GDP) expectations for 2024 from 2.4% to 2.2% due to the country’s economic slowdown and the US economic downturn.
Across the border, the US Bureau of Labor Statistics (BLS) revealed that US unemployment claims rose above estimates and last week’s reading, indicating some slack in the labor market. Continuing claims also increased and hit its highest level since November 2021.
The Greenback rose after the data, with the US Dollar Index (DXY), which tracks the buck’s value against the other six currencies, climbing back above 104.00, gaining 0.25%.
Daily digest market movers: Mexican Peso trips down on US Dollar strength
- Mexico’s economic docket will be absent during the week, resuming on July 22, when the National Statistics Agency (INEGI) reveals growth figures for the month of May. Nevertheless, Bank of Mexico (Banxico) policymakers and political developments could rock the boat.
- US Initial Jobless Claims revealed by the BLS showed that the number of Americans filing for unemployment benefits in the week ending July 13 rose above estimates of 230K, coming at 243K, and exceeded the previous week's reading of 223K.
- Bloomberg’s interview of Donald Trump spooked investors as the former US President commented that he favors tax reductions, lower interest rates, and tariffs, including a 60% to 100% increase in China’s products and a 10% in the general rate in other countries.
- The CME FedWatch Tools show the chances for a quarter of a percentage rate cut to the federal funds rate in September are at 98%.
- June consumer inflation figures were lower than expected in the United States, increasing the chances that the Federal Reserve would lower borrowing costs in 2024 by at least 52 basis points, according to the December 2024 fed funds rate futures contract.
Technical analysis: Mexican Peso depreciates further as USD/MXN rallies above 17.90
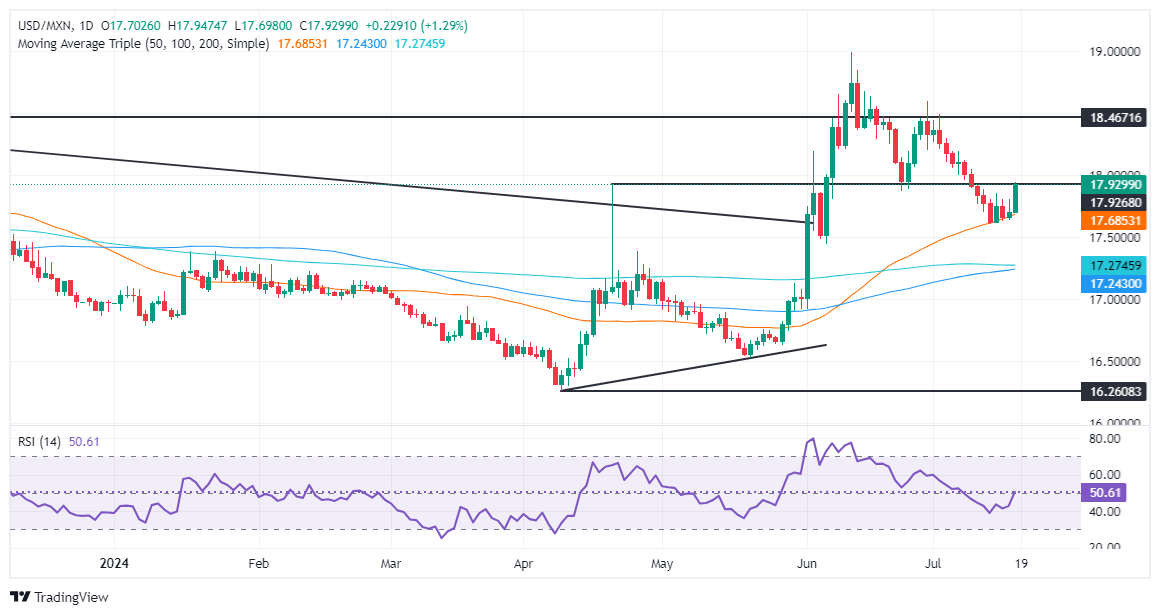
On Wednesday, I wrote, "The USD/MXN has bottomed at around the 50-day Simple Moving Average (SMA) after the pair tumbled more than 2.50% as the Mexican currency appreciated. However, buyers had stepped in, forming a floor at around 17.58-17.60.”
As of writing, the exotic pair is rallying sharply above the 17.90 figure after bouncing around the above-mentioned area, putting into play a test of the psychological 18.00 mark.
Momentum changed and favored buyers as the Relative Strength Index (RSI) aimed upward and pierced above its neutral line, hinting that bulls are stepping in.
If USD/MXN extends its gains above the psychological 18.00 figure, that will expose key resistance levels. Once breached, the next stop would be the July 5 high at 18.19, followed by the June 28 high of 18.59, allowing buyers to aim for the YTD high at 18.99.
On further weakness, if USD/MXN clears the 50-day SMA at 17.63, that would pave the way to challenge the December 5 high at 17.56, followed by the 200-day SMA at 17.27. Further losses would test the 100-day SMA at 17.21.
Mexican Peso FAQs
The Mexican Peso (MXN) is the most traded currency among its Latin American peers. Its value is broadly determined by the performance of the Mexican economy, the country’s central bank’s policy, the amount of foreign investment in the country and even the levels of remittances sent by Mexicans who live abroad, particularly in the United States. Geopolitical trends can also move MXN: for example, the process of nearshoring – or the decision by some firms to relocate manufacturing capacity and supply chains closer to their home countries – is also seen as a catalyst for the Mexican currency as the country is considered a key manufacturing hub in the American continent. Another catalyst for MXN is Oil prices as Mexico is a key exporter of the commodity.
The main objective of Mexico’s central bank, also known as Banxico, is to maintain inflation at low and stable levels (at or close to its target of 3%, the midpoint in a tolerance band of between 2% and 4%). To this end, the bank sets an appropriate level of interest rates. When inflation is too high, Banxico will attempt to tame it by raising interest rates, making it more expensive for households and businesses to borrow money, thus cooling demand and the overall economy. Higher interest rates are generally positive for the Mexican Peso (MXN) as they lead to higher yields, making the country a more attractive place for investors. On the contrary, lower interest rates tend to weaken MXN.
Macroeconomic data releases are key to assess the state of the economy and can have an impact on the Mexican Peso (MXN) valuation. A strong Mexican economy, based on high economic growth, low unemployment and high confidence is good for MXN. Not only does it attract more foreign investment but it may encourage the Bank of Mexico (Banxico) to increase interest rates, particularly if this strength comes together with elevated inflation. However, if economic data is weak, MXN is likely to depreciate.
As an emerging-market currency, the Mexican Peso (MXN) tends to strive during risk-on periods, or when investors perceive that broader market risks are low and thus are eager to engage with investments that carry a higher risk. Conversely, MXN tends to weaken at times of market turbulence or economic uncertainty as investors tend to sell higher-risk assets and flee to the more-stable safe havens.
- The Canadian Dollar found mixed bids on Thursday.
- Canada set for another rate call next week.
- A lack of meaningful data ahead of next Tuesday’s BoC showing leaves CAD adrift.
The Canadian Dollar (CAD) recovered some ground in mixed trading on Thursday but still shed weight against the Greenback, the market’s best-performing currency of the day. CAD traders are buckling down for the wait to next Tuesday’s rate call from the Bank of Canada (BoC), and broader market sentiment is paring back US Dollar short pressure after a mid-week surge in rate cut hopes sent the Greenback to the bottom.
Canada is set for a complicated showdown on interest rates from the BoC this week; while overall inflationary pressures have eased on the short end of the curve, core price growth readings have ticked higher, and a dip in price growth earlier in the year may have been a one-off.
Daily digest market movers: CAD recovers balance but still lower against the Greenback
- Canadian data on Thursday was strictly low tier, leaving the CAD at the mercy of broader market sentiment.
- The BoC’s upcoming rate call will show whether the Canadian central bank will follow the data or stick to its push to provide support for the Canadian economy by reducing financing costs on Canada’s already-outsized housing market.
- Canadian Retail Sales loom ahead on Friday, and will be the last key data print until next Tuesday’s BoC rate call.
- Canadian Retail Sales are forecast to dip into a -0.6% contraction MoM in May after the previous month’s 0.7% growth.
- US Initial Jobless Claims for the week ended July 12 ticked higher on Thursday, rising to 243K week-on-week compared to the previous week’s revised 223K, rising even higher than the forecast 230K. A rise in near-tear unemployment claims adds weight to expectations that the labor market is softening enough to help keep the Federal Reserve (Fed) on pace for a September rate cut.
Canadian Dollar PRICE Today
The table below shows the percentage change of Canadian Dollar (CAD) against listed major currencies today. Canadian Dollar was the strongest against the Japanese Yen.
| USD | EUR | GBP | JPY | CAD | AUD | NZD | CHF | |
|---|---|---|---|---|---|---|---|---|
| USD | 0.23% | 0.28% | 0.57% | 0.12% | 0.09% | 0.30% | 0.31% | |
| EUR | -0.23% | 0.05% | 0.33% | -0.10% | -0.15% | 0.07% | 0.08% | |
| GBP | -0.28% | -0.05% | 0.29% | -0.18% | -0.20% | 0.03% | 0.03% | |
| JPY | -0.57% | -0.33% | -0.29% | -0.44% | -0.46% | -0.28% | -0.24% | |
| CAD | -0.12% | 0.10% | 0.18% | 0.44% | -0.03% | 0.19% | 0.19% | |
| AUD | -0.09% | 0.15% | 0.20% | 0.46% | 0.03% | 0.23% | 0.27% | |
| NZD | -0.30% | -0.07% | -0.03% | 0.28% | -0.19% | -0.23% | 0.00% | |
| CHF | -0.31% | -0.08% | -0.03% | 0.24% | -0.19% | -0.27% | -0.00% |
The heat map shows percentage changes of major currencies against each other. The base currency is picked from the left column, while the quote currency is picked from the top row. For example, if you pick the Canadian Dollar from the left column and move along the horizontal line to the US Dollar, the percentage change displayed in the box will represent CAD (base)/USD (quote).
Technical analysis: CAD goes sideways, USD/CAD continues to grapple with 1.3700
The Canadian Dollar (CAD) gave a firmly mixed performance on Thursday, recovering recently-lost ground against some of its major currency peers but still under water against its key Greenback counterpart. The CAD is down roughly one-tenth of one percent against the US Dollar, but has rebounded around seven-tenths of one percent against the Japanese Yen.
USD/CAD continues to churn within reach of the 1.3700 handle. CAD bidders continue to defend the line, but bullish pressure underneath the USD is keeping the pair elevated and off of key technical levels.
A thin recovery from Wednesday’s dip below the 50-day Exponential Moving Average (EMA) at 1.3670 may have short legs, but a small recovery is still a recovery and USD/CAD continues to battle with the 1.3700 level. Intraday price action found a floor at the 200-hour EMA at 1.3663, and daily candles are poised to continue a bullish recovery after bids bottomed out at the 200-day EMA near 1.3595 last week.
USD/CAD hourly chart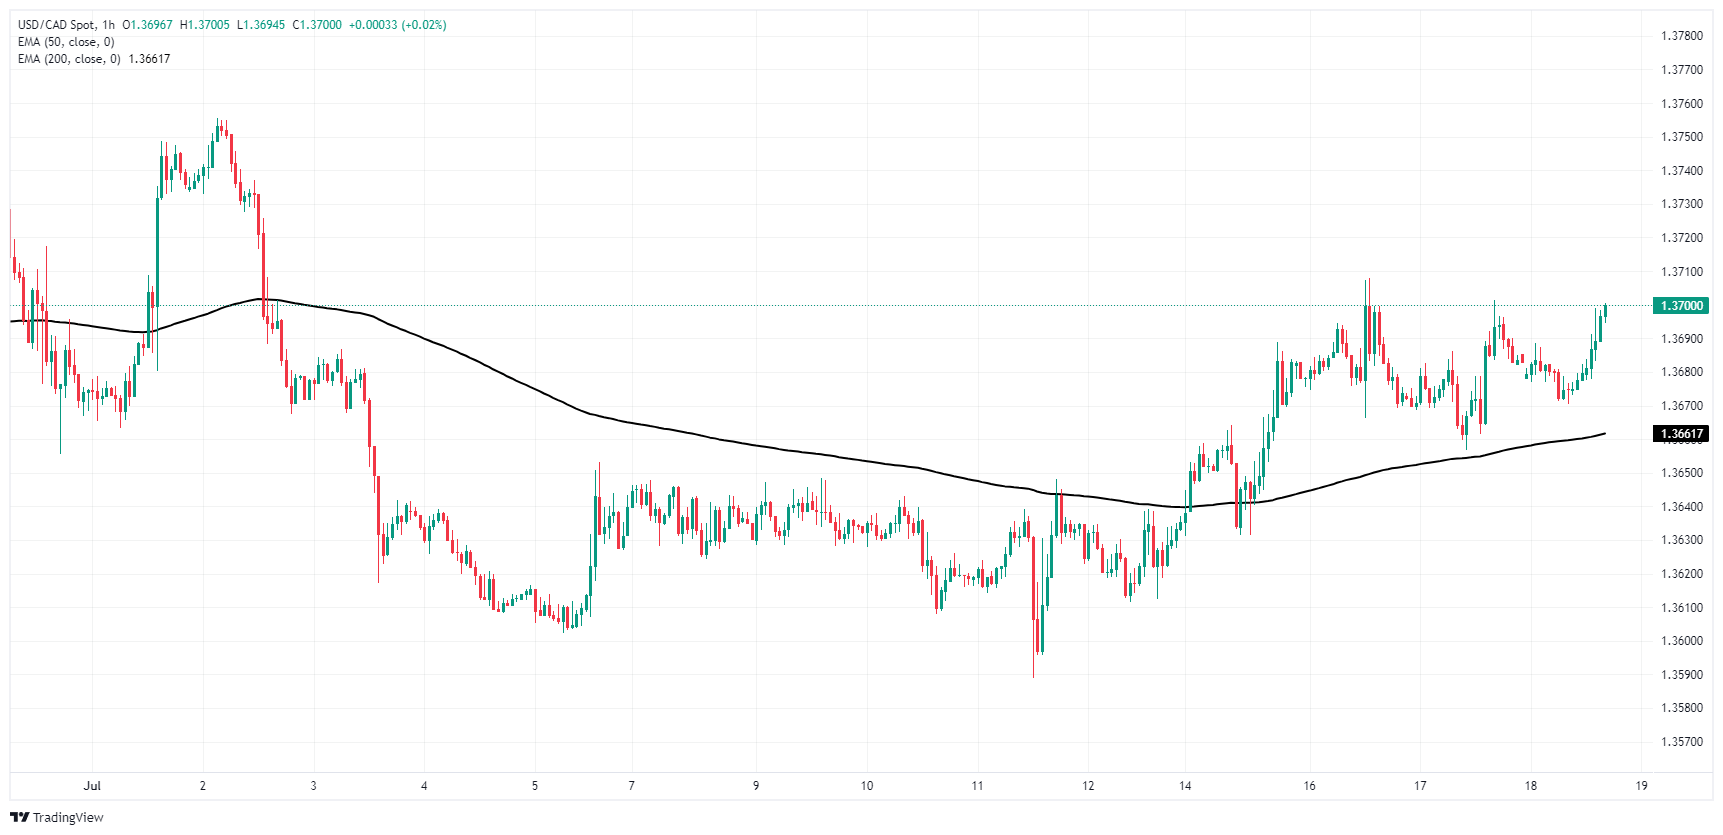
USD/CAD daily chart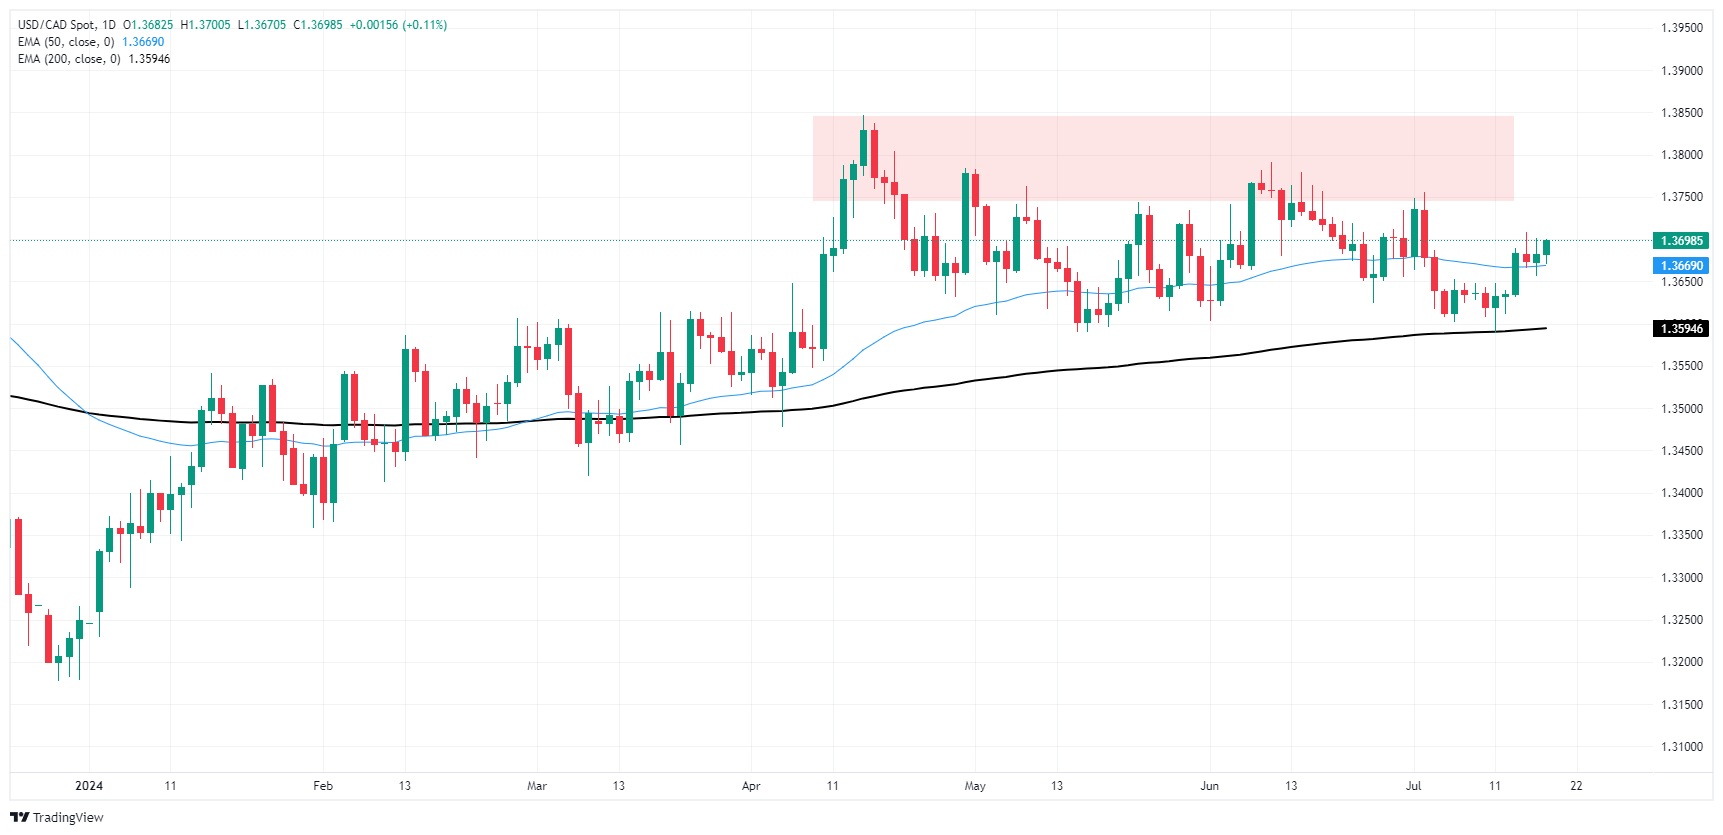
Canadian Dollar FAQs
The key factors driving the Canadian Dollar (CAD) are the level of interest rates set by the Bank of Canada (BoC), the price of Oil, Canada’s largest export, the health of its economy, inflation and the Trade Balance, which is the difference between the value of Canada’s exports versus its imports. Other factors include market sentiment – whether investors are taking on more risky assets (risk-on) or seeking safe-havens (risk-off) – with risk-on being CAD-positive. As its largest trading partner, the health of the US economy is also a key factor influencing the Canadian Dollar.
The Bank of Canada (BoC) has a significant influence on the Canadian Dollar by setting the level of interest rates that banks can lend to one another. This influences the level of interest rates for everyone. The main goal of the BoC is to maintain inflation at 1-3% by adjusting interest rates up or down. Relatively higher interest rates tend to be positive for the CAD. The Bank of Canada can also use quantitative easing and tightening to influence credit conditions, with the former CAD-negative and the latter CAD-positive.
The price of Oil is a key factor impacting the value of the Canadian Dollar. Petroleum is Canada’s biggest export, so Oil price tends to have an immediate impact on the CAD value. Generally, if Oil price rises CAD also goes up, as aggregate demand for the currency increases. The opposite is the case if the price of Oil falls. Higher Oil prices also tend to result in a greater likelihood of a positive Trade Balance, which is also supportive of the CAD.
While inflation had always traditionally been thought of as a negative factor for a currency since it lowers the value of money, the opposite has actually been the case in modern times with the relaxation of cross-border capital controls. Higher inflation tends to lead central banks to put up interest rates which attracts more capital inflows from global investors seeking a lucrative place to keep their money. This increases demand for the local currency, which in Canada’s case is the Canadian Dollar.
Macroeconomic data releases gauge the health of the economy and can have an impact on the Canadian Dollar. Indicators such as GDP, Manufacturing and Services PMIs, employment, and consumer sentiment surveys can all influence the direction of the CAD. A strong economy is good for the Canadian Dollar. Not only does it attract more foreign investment but it may encourage the Bank of Canada to put up interest rates, leading to a stronger currency. If economic data is weak, however, the CAD is likely to fall.
- US Dollar DXY finds some footing closer to 104.00 as sellers seem to take a breather.
- Federal Reserve officials continue to maintain a cautious stance, with a rate cut expected in September.
- Concerns over the US labor market might weigh on the USD.
On Thursday, the US Dollar measured by the DXY index experienced a rebound, closing in on the 104.00 mark, despite concerns over the labor market. The rise came about as sellers appeared to hit the pause button. Market anticipations of a rate cut in September by the Federal Reserve and the frailty in the US labor market will be key topics to follow as they might put additional pressure on the currency.
The US economic outlook shows indications of disinflation, with financial markets expressing confidence in a rate cut in September. Despite this, Federal Reserve officials display reluctance to rush into interest rate cuts and still adhere to a data-dependent approach.
Daily digest market movers: DXY rebound, rising jobless claims raise alarms about the US labor market health
- Data from the US Department of Labor indicated a surge in Jobless Claims for the week ended July 13 by 243K, surpassing initial predictions of 230K, and worse than the prior gain of 223K (revised from 239K).
- On a positive note, the Philadelphia Fed Manufacturing Survey for July recorded a markedly greater improvement than expected, hitting 13.9 after recording 1.3 in June.
- Following the data, dovish bets on the Fed remain steady.
- According to the CME FedWatch Tool, a rate cut in September seems to be priced and limits the upside for the USD.
- If data continues to come in weak, markets might consider a cut in the upcoming July meeting.
DXY Technical Outlook: Bearish outlook continues, slight recovery to the upside seems probable
The DXY managed a rebound near the vicinity of the 104.00 area but the outlook remains bearish with the index below the 20,100 and 200-day Simple Moving Average (SMA). With daily technical indicators, like the Relative Strength Index (RSI) and Moving Average Convergence Divergence (MACD), still languishing below 50, it indicates the weight of the bearish outlook has not subsided. However, the DXY index may see a minor correction to the upside in the forthcoming sessions.
The strong support levels remain at 103.50 and 103.00. However, the overall technical outlook continues to favor the bears.
US Dollar FAQs
The US Dollar (USD) is the official currency of the United States of America, and the ‘de facto’ currency of a significant number of other countries where it is found in circulation alongside local notes. It is the most heavily traded currency in the world, accounting for over 88% of all global foreign exchange turnover, or an average of $6.6 trillion in transactions per day, according to data from 2022. Following the second world war, the USD took over from the British Pound as the world’s reserve currency. For most of its history, the US Dollar was backed by Gold, until the Bretton Woods Agreement in 1971 when the Gold Standard went away.
The most important single factor impacting on the value of the US Dollar is monetary policy, which is shaped by the Federal Reserve (Fed). The Fed has two mandates: to achieve price stability (control inflation) and foster full employment. Its primary tool to achieve these two goals is by adjusting interest rates. When prices are rising too quickly and inflation is above the Fed’s 2% target, the Fed will raise rates, which helps the USD value. When inflation falls below 2% or the Unemployment Rate is too high, the Fed may lower interest rates, which weighs on the Greenback.
In extreme situations, the Federal Reserve can also print more Dollars and enact quantitative easing (QE). QE is the process by which the Fed substantially increases the flow of credit in a stuck financial system. It is a non-standard policy measure used when credit has dried up because banks will not lend to each other (out of the fear of counterparty default). It is a last resort when simply lowering interest rates is unlikely to achieve the necessary result. It was the Fed’s weapon of choice to combat the credit crunch that occurred during the Great Financial Crisis in 2008. It involves the Fed printing more Dollars and using them to buy US government bonds predominantly from financial institutions. QE usually leads to a weaker US Dollar.
Quantitative tightening (QT) is the reverse process whereby the Federal Reserve stops buying bonds from financial institutions and does not reinvest the principal from the bonds it holds maturing in new purchases. It is usually positive for the US Dollar.
In terms of the rhetoric provided by the Riksbank in recent weeks, there would appear to be relatively few concerns in Sweden about the risks associated with sticky inflation. There was no expectation in the market that the ECB would follow up its June rate cut with another move at today’s policy meeting on the back of signs of sticky wages and robust services sector price pressures, senior FX strategist at Rabobank Jane Foley notes.
EUR/SEK to move lower towards its long-term average levels
“The last Riksbank policy meeting, there were hints regarding the prospect of three, rather than two, more rate cuts in the second half of this year. The dovish sentiments of the Riksbank have weighed on the value of the Swedish Krona (SEK) vs. the Euro (EUR) since late June, with the recent rally in EUR/SEK wiping out around half of the gains the SEK had made against the single currency this spring.”
“That said, while interest rate differentials have weighed on the SEK, the door is wide open for an ECB rate cut in September. Hopes for further easing from the ECB combined with improvement in Sweden’s growth and fundamental outlook suggest scope for EUR/SEK to move lower and towards its long-term average levels over the months ahead.”
“As a consequence of the sell-off in the SEK in that period, EUR/SEK is currently trading well above its 5-year average level of 10.76. As growth returns, we expect the SEK to outperform the EUR. While Riksbank rate cuts are likely to hinder the SEK’s recovery near-term, on the assumption that the ECB cuts rates twice more this year, we maintain a 6-month EUR/SEK forecast of 11.00, though we have edged up our 1-month view.”
The ECB kept its policy rates unchanged, leaving the deposit facility rate at 3.75% and the main refinancing operations rate at 4.25%, senior macro strategist in Rabobank Bas van Geffen notes.
September rate cut remains very likely
“The ECB’s decision to leave rates on hold was moderated by a slightly dovish statement. We believe policymakers are inclined to look through near-term data, unless these materially impact their medium-term projections.”
“A September rate cut remains very likely, even though Lagarde stated that the outcome of that meeting is ‘wide open’. We see upside risks to our deposit rate forecast, but particularly later in the easing cycle.”
- GBP/USD drops below the 1.3000 mark, trading with over 0.20% losses as strong US Dollar prevails.
- Technical outlook shows momentum remains bullish with RSI still positive despite recent dip.
- Key support levels to watch: 1.2894, 1.2861, and 1.2817; resistance at 1.3044 and 1.3100 if buyers reclaim 1.3000.
The Pound Sterling reversed its course on Thursday against the Greenback, even though UK data was solid, while the US jobs market shows signs of weakness. Nevertheless, elevated US Treasury yields and a strong US Dollar pushed the GBP/USD below the 1.3000 figure, trading with more than 0.20% losses.
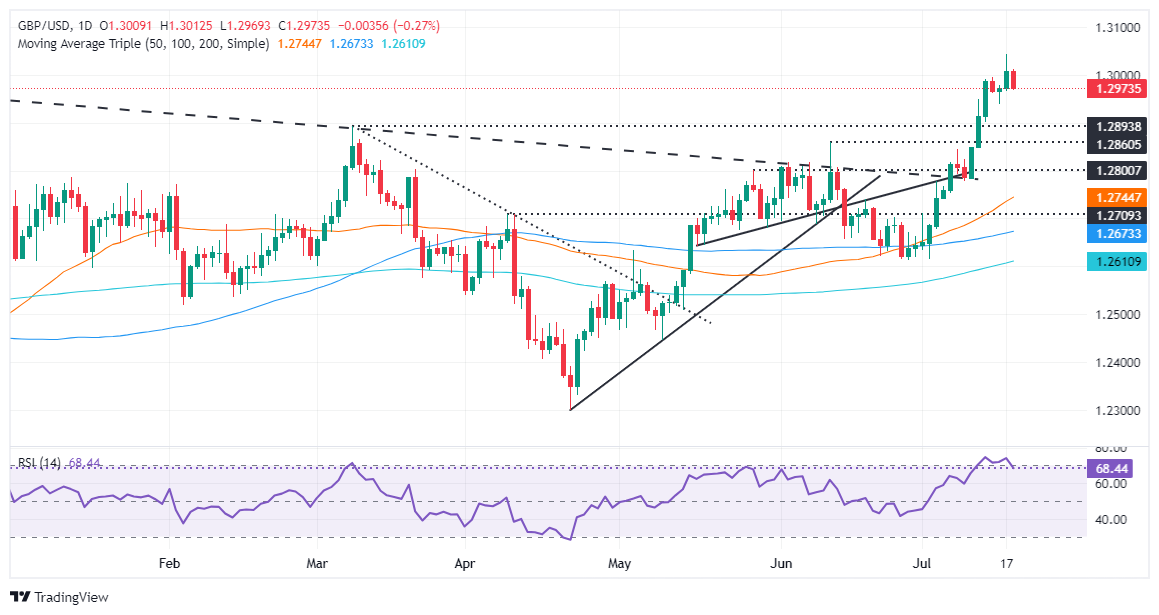
GBP/USD Price Analysis: Technical outlook
GBP/USD buyers had failed to cling to gains above the 1.3000 figure, and the pair reversed its course beneath the former. However, momentum remains on the buyers’ side, with the Relative Strength Index (RSI), which remains bullish despite exiting overbought conditions.
If sellers keep the major below 1.3000 and achieve a daily close below the latter, that will expose key support levels.
On further weakness, the GBP/USD first demand zone would be the March 8 peak turned support at 1.2894, followed by the June 12 high at 1.2861. Once those levels are cleared, the next stop would be the June 4 high at 1.2817.
If buyers reclaim 1.3000, the first resistance would be the yearly peak at 1.3044, ahead of testing 1.3100. On further strength, the next stop would be 1.3142, last year’s high.
GBP/USD Price Action – Daily Chart
Pound Sterling FAQs
The Pound Sterling (GBP) is the oldest currency in the world (886 AD) and the official currency of the United Kingdom. It is the fourth most traded unit for foreign exchange (FX) in the world, accounting for 12% of all transactions, averaging $630 billion a day, according to 2022 data. Its key trading pairs are GBP/USD, aka ‘Cable’, which accounts for 11% of FX, GBP/JPY, or the ‘Dragon’ as it is known by traders (3%), and EUR/GBP (2%). The Pound Sterling is issued by the Bank of England (BoE).
The single most important factor influencing the value of the Pound Sterling is monetary policy decided by the Bank of England. The BoE bases its decisions on whether it has achieved its primary goal of “price stability” – a steady inflation rate of around 2%. Its primary tool for achieving this is the adjustment of interest rates. When inflation is too high, the BoE will try to rein it in by raising interest rates, making it more expensive for people and businesses to access credit. This is generally positive for GBP, as higher interest rates make the UK a more attractive place for global investors to park their money. When inflation falls too low it is a sign economic growth is slowing. In this scenario, the BoE will consider lowering interest rates to cheapen credit so businesses will borrow more to invest in growth-generating projects.
Data releases gauge the health of the economy and can impact the value of the Pound Sterling. Indicators such as GDP, Manufacturing and Services PMIs, and employment can all influence the direction of the GBP. A strong economy is good for Sterling. Not only does it attract more foreign investment but it may encourage the BoE to put up interest rates, which will directly strengthen GBP. Otherwise, if economic data is weak, the Pound Sterling is likely to fall.
Another significant data release for the Pound Sterling is the Trade Balance. This indicator measures the difference between what a country earns from its exports and what it spends on imports over a given period. If a country produces highly sought-after exports, its currency will benefit purely from the extra demand created from foreign buyers seeking to purchase these goods. Therefore, a positive net Trade Balance strengthens a currency and vice versa for a negative balance.
USD/JPY has been the surprise package this week, retracing down to the 155/156 area seen in early June, ING’s FX strategist Francesco Pesole suggests.
Undervalued Yen pressures the US manufacturing sector
“Lower short-dated US rates have clearly been a big driver of the move, but politics has been playing a role here too. Donald Trump's Bloomberg interview highlighted the undervalued Yen (JPY) pressuring the US manufacturing sector.”
“And in Tokyo, political calls are growing louder that a weak Yen has passed its sell-by date. Investors' short Yen for the carry trade also have to deal with more opportunist Japanese FX intervention.”
“Ultimately, we think the US macro/rates story will dominate and should lead USD/JPY lower later this year. We currently have a 153 end-year forecast here.”
At the Third Plenum, China vowed to improve the market mechanism and create a fairer market environment for private businesses. Further opening-up was also highlighted, Danske Bank’s Chief Analyst Allan von Mehren notes.
China wants to create a fairer market environment
“This is an important signal at a time when popular perception is that China is moving toward a purely state driven economy. But at the end of the day what matters is the implementation and China has disappointed on this before.”
“Technology and innovation as well as fiscal and welfare reforms are also key priorities. The communiqué released gives a broad outline of priorities and we will get more detailed policy documents over the weekend.”
“Reforms or not, it will not do much to lift China out of the challenges short term as these are more related to the housing crisis. It does affect China's long term growth potential, though.”
The top ten participants trading in Shanghai Futures Exchange (SHFE) Gold continue to add to their Gold positions, growing their net length towards its highest levels on record, TDS senior commodity strategist Daniel Ghali note.
Trump trade contributes to recent gains
“Discretionary traders in Comex Gold have also been on the bid in recent weeks, with signs that the Trump trade has contributed to recent gains. And of course, Commodity Trading Advisors (CTAs) have contributed to the upside in price action over the last week. Looking forward, however, we see signs that upside momentum could be running out of steam in the near-term.”
“Nascent signs of a buyer's strike in Asia are emerging, with SGE Gold now trading at a slight discount. Chinese Gold ETFs have also recently shown signs of disinvestment, suggesting retail appetite in the nation is drying up at these higher prices. Discretionary trader positioning in Gold is also somewhat larger than is warranted by the market's expectations for Fed cuts over the next twelve months, pointing to some signs of froth.”
“And, for the first time in months, we now see downside asymmetry in CTA positioning risks as algo trend followers are now set to liquidate some length in nearly every scenario over the coming week. In fact, a continued melt-up in prices is now detrimental to CTA long positioning, given the funds' typical vol-targeting risk management frameworks.”
The notable declines in commodity demand expectations continue to threaten the energy complex although CTAs still hold substantial ammunition to deploy on the offer, TDS senior commodity strategist Daniel Ghali note.
Falling demand expectations threaten the energy complex
“While a sharp whipsaw in algo positioning was further supported by the DOE inventory data, the notable declines in commodity demand expectations continue to threaten the energy complex.”
“Barring a resurgence in supply risk premia, downside pressures are likely to continue to build, and notable speculative long positioning suggest that Commodity Trading Advisors (CTAs) still hold substantial ammunition to deploy on the offer.”
“That being said, our simulations suggest that, barring a large downtape, CTAs are less likely to offload their length over the coming week.”
Copper prices are breaking down as headlines from the Third Plenum fail to halt the sharp slide in our real-time gauge of commodity demand expectations, TDS senior commodity strategist Daniel Ghali note.
Commodity demand expectations decline
“A continued surge in China's Copper exports corroborates our view of the striking weakness in domestic demand. A press conference will still discuss key points raised at the Plenum, but the Politburo meeting at the end of the month is another venue where policymakers may announce specific economic policies to boost domestic demand.”
“However, Commodity Trading Advisors (CTAs) still hold a decent margin of safety before additional selling activity is catalyzed, necessitating a break below the $9000/t range on a third-Wed futures basis before the first large-scale selling program is sparked. Barring a surprise from Chinese policy announcements, the fast decline in commodity demand expectations suggest downside convexity is still rising.”
“Aluminium remains vulnerable to significant CTA selling activity, as a big downtape could force trend following algos to abandon their longs and build a notable short position over the coming week.”
In an interview with Yahoo Finance on Thursday, Federal Reserve (Fed) Bank of Chicago President Austan Goolsbee noted that they have had multiple months of better inflation data. Goolsbee noted that he feels a lot better on inflation but added that the fight is not done yet.
Key takeaways
"The labor market has been cooling to better balance."
"The cooling job market is definitely an area of concern."
"This is what the path to 2% inflation looks like."
"In real-rate terms, we have tightened substantially."
Market reaction
The US Dollar Index edged slightly higher following these comments and was last seen rising 0.25% on the day at 104.00.
As universally expected, the ECB left its policy rates on hold at today's meeting. The tone of the statement was roughly unchanged, but there were some growing signs of caution on the growth and employment outlooks, and the GC appears to be looking through the recent strength in underlying inflation, TDS FX analysts note.
Rate differentials move in the EUR's favor
As universally expected, the ECB kept its deposit rate unchanged at 3.75%% at today's meeting. The ECB meeting came with little new information. President Lagarde acknowledged the ongoing progress in domestic drivers of inflation. Tactically, we favour being long in EUR duration.
Not much for the Euro (EUR) to nibble on here, leaving the price action mostly unchanged. No one was looking for fireworks today so focus will turn towards data and the outlook for inflation. Markets continue to expect another move in September. For EUR/USD, much of the focus has come from the US side, with rate differentials moving in the EUR's favor.
For now, we think the USD has lots of bad news priced in, suggesting that EUR/USD provides good entry levels to fade the recent rally. Notably, our MRSI portfolios still lean long USD in most of the key macro portfolios, except rates. Currently, the risk, equity, carry, growth, and now short-term fair value (HFFV) are long the USD.
- AUD/USD climbs 0.09%, buoyed by strong Australian jobs data and weaker US employment.
- Australian jobs grow by 50.2K, beating forecasts; Unemployment Rate slightly up at 4.1%.
- US Jobless Claims rise to 243K, hinting at labor market slack and promoting a risk-on mood.
The Australian Dollar extended its gains on Thursday after data from the United States (US) showed the labor market continues to cool, following last week’s Initial Jobless Claims (IJC) report. Therefore, the AUD/USD pair trades at 0.6734, gaining 0.09%.
AUD/USD advances on strong Aussie’s jobs data
US equity futures point to a positive start, depicting a risk-on environment. This helps the high-beta status of the Aussie Dollar, which was boosted during the Asian session after posting a strong jobs report.
The Australian Bureau of Statistics (ABS) revealed that Employment Change increased by 50.2K, exceeding estimates of 20K and May’s 39.5K reading. Nonetheless, the Unemployment Rate ticked higher from 4% to 4.1%.
The data would test the Reserve Bank of Australia's (RBA) patience, as mentioned by TD Analysts in a note: “With measures of inflation continuing to track higher since the start of this year and the labour market holding up better than expected, the RBA's patience to remain on hold is likely to be tested.”
Aside from this, the recently released IJC report shows “some slack” in the US labor market. The number of Americans filing for unemployment benefits in the week ending July 13 rose above estimates of 230K, coming at 243K, and exceeded the previous week's reading of 223 K.
AUD/USD Price Analysis: Technical outlook
From a technical standpoint, the AUD/USD uptrend stays intact, yet the dip from yearly highs of 0.6798 toward the current exchange rate has opened the door to testing the May 4 high, which turned support at 0.6714.
Further US Dollar strength could push the pair below 0.6700, opening the door to challenge the 50-day moving average (DMA) at 0.6667, ahead of the 100-DMA at 0.6603. On the other hand, if buyers keep the AUD/USD exchange rate above 0.6700, that could pave the way for testing the YTD high at 0.6793.
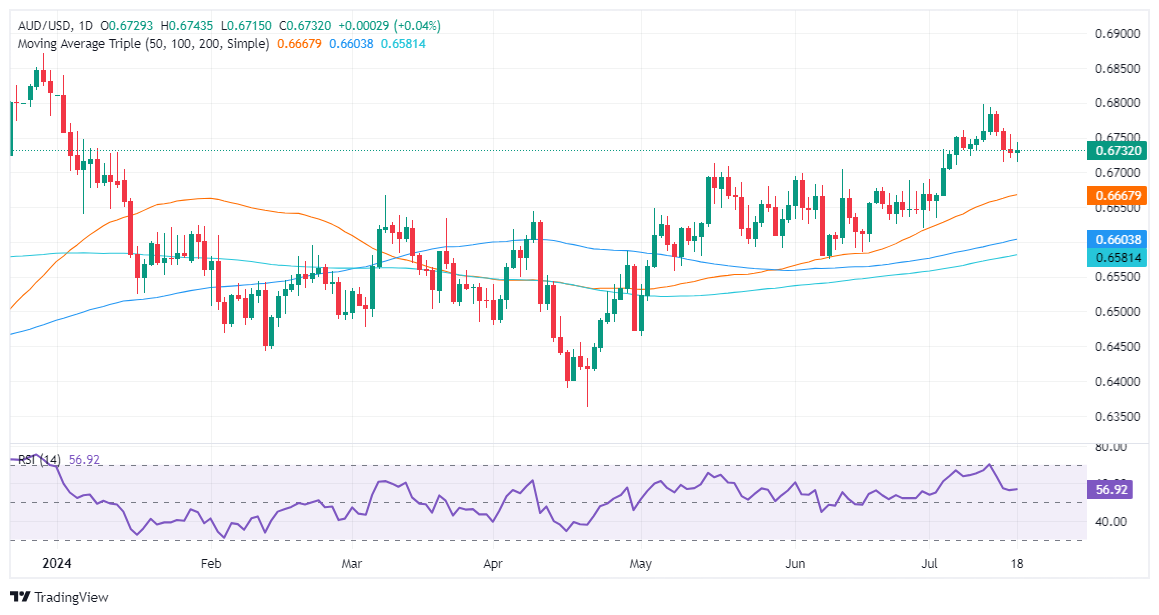
Australian Dollar FAQs
One of the most significant factors for the Australian Dollar (AUD) is the level of interest rates set by the Reserve Bank of Australia (RBA). Because Australia is a resource-rich country another key driver is the price of its biggest export, Iron Ore. The health of the Chinese economy, its largest trading partner, is a factor, as well as inflation in Australia, its growth rate and Trade Balance. Market sentiment – whether investors are taking on more risky assets (risk-on) or seeking safe-havens (risk-off) – is also a factor, with risk-on positive for AUD.
The Reserve Bank of Australia (RBA) influences the Australian Dollar (AUD) by setting the level of interest rates that Australian banks can lend to each other. This influences the level of interest rates in the economy as a whole. The main goal of the RBA is to maintain a stable inflation rate of 2-3% by adjusting interest rates up or down. Relatively high interest rates compared to other major central banks support the AUD, and the opposite for relatively low. The RBA can also use quantitative easing and tightening to influence credit conditions, with the former AUD-negative and the latter AUD-positive.
China is Australia’s largest trading partner so the health of the Chinese economy is a major influence on the value of the Australian Dollar (AUD). When the Chinese economy is doing well it purchases more raw materials, goods and services from Australia, lifting demand for the AUD, and pushing up its value. The opposite is the case when the Chinese economy is not growing as fast as expected. Positive or negative surprises in Chinese growth data, therefore, often have a direct impact on the Australian Dollar and its pairs.
Iron Ore is Australia’s largest export, accounting for $118 billion a year according to data from 2021, with China as its primary destination. The price of Iron Ore, therefore, can be a driver of the Australian Dollar. Generally, if the price of Iron Ore rises, AUD also goes up, as aggregate demand for the currency increases. The opposite is the case if the price of Iron Ore falls. Higher Iron Ore prices also tend to result in a greater likelihood of a positive Trade Balance for Australia, which is also positive of the AUD.
The Trade Balance, which is the difference between what a country earns from its exports versus what it pays for its imports, is another factor that can influence the value of the Australian Dollar. If Australia produces highly sought after exports, then its currency will gain in value purely from the surplus demand created from foreign buyers seeking to purchase its exports versus what it spends to purchase imports. Therefore, a positive net Trade Balance strengthens the AUD, with the opposite effect if the Trade Balance is negative.
EUR/USD appreciated by 2.1% to 1.0940 so far in July from its trendline support near 1.07, DBS senior FX strategist Philip Wee.
A significant trendline resistance at 1.0970
“This month’s rally was attributed to the European Central Bank’s signal at its forum in Sintra (on July 2) for a pause at today’s governing council meeting (which it did) vs. more Fed officials opening the door for a rate cut this year on US inflation resuming its decline amid over the rise in the unemployment rate.”
Politically, the Euro (EUR) was relieved that the far-right National Rally party fell to third position in the second round of the French elections despite its outsized gains in the first round. However, EUR/USD is coming up against a significant trendline resistance of around 1.0970. EUR is feeling the drag from some unwinding of yen carry trades.
USD/JPY plunged 1.4% to 156.20, its lowest close in six weeks, DBS senior FX strategist Philip Wee.
USD/JPY to decline to 150 by the end of 2024
“USD/JPY started retreating below 160 on July 11 after spending 11 days in a 160-162 range. Yesterday’s break below 158 (50-day moving average) opened the door towards 155.10 (100d MA). The yield carry trade against the JPY faces domestic and external risks.”
“Apart from suspected currency interventions by the Japanese government, Bank of Japan Governor Kazuo Ueda said last month that the central bank could raise interest rates again at its meeting on July 31. Tomorrow, consensus expects Japan’s National CPI inflation to rise a second month to 2.9% YoY in June from 2.8% in May, and excluding food, to 2.7% from 2.5%.”
“BOJ will likely announce a detailed plan to reduce its balance sheet. On the US front, the Fed is opening the door to start lowering US interest rates this year while leading US presidential candidate Donald Trump decried the JPY’s massive weakness. We maintain our forecast for USD/JPY to decline to 150 by the end of 2024 and 139 by December 2025.”
- NZD/USD declines to 0.6070 as the US Dollar gains firm footing.
- Investors expect that the Fed will start reducing interest rates in September.
- Higher-than-expected decline in NZ inflation has boosted early RBNZ rate-cut hopes.
The NZD/USD pair edges lower to near 0.6070 in Thursday’s American session. The kiwi asset drops as the US Dollar Index (DXY) gains ground after falling to almost a fresh four-month low near 103.70.
While the near-term outlook of the US Dollar (USD) remains uncertain as the Federal Reserve (Fed) is widely anticipated to begin cutting interest rates from the September meeting.
After a slower-than-expected United States (US) Consumer Price Index (CPI) report for June, Fed policymakers have gained some confidence that interest rates become warranted in the near term. On Wednesday, On Wednesday, Richmond Fed Bank President Thomas Barkin cited broadening disinflation as “very encouraged”. Barkin added he is sure policymakers will debate at the July policy meeting whether it is still appropriate to describe inflation as elevated, Reuters reported.
Meanwhile, growing speculation for early rate cuts by the Reserve Bank of New Zealand (RBNZ) has weighed on the New Zealand Dollar (NZD). The expectations for RBNZ early rate cuts rise as price pressures in the New Zealand (NZ) economy decelerated at a faster pace in the second quarter of this year.
NZ quarterly inflation grew by 0.4%, slower than expectations and Q1 reading of 0.6%. The annual CPI data decelerated at a robust pace to 3.3% from the consensus of 3.5% and the former release of 4.0%.
NZD/USD oscillates inside Wednesday’s trading range. Earlier, the asset finds a temporary support near 50% Fibonacci retracement (plotted from April 19 low near 0.5850 to June 12 high at 0.6222) at 0.6035 on a daily timeframe. The near-term outlook remains bearish as the 20-day Exponential Moving Average (EMA) near 0.6100 acts as major barricade to NZD bulls.
The 14-period Relative Strength Index (RSI) oscillates in the 40.00-60.00 range, suggesting indecisiveness among market participants.
Fresh upside would appear if the asset breaks above July 3 high at 0.6130 for targets near May 28 high around 0.6170 and June 12 high of 0.6222.
However, a breakdown below April 4 high around 0.6050 would expose the asset to the psychological support of 0.6000.
NZD/USD daily chart
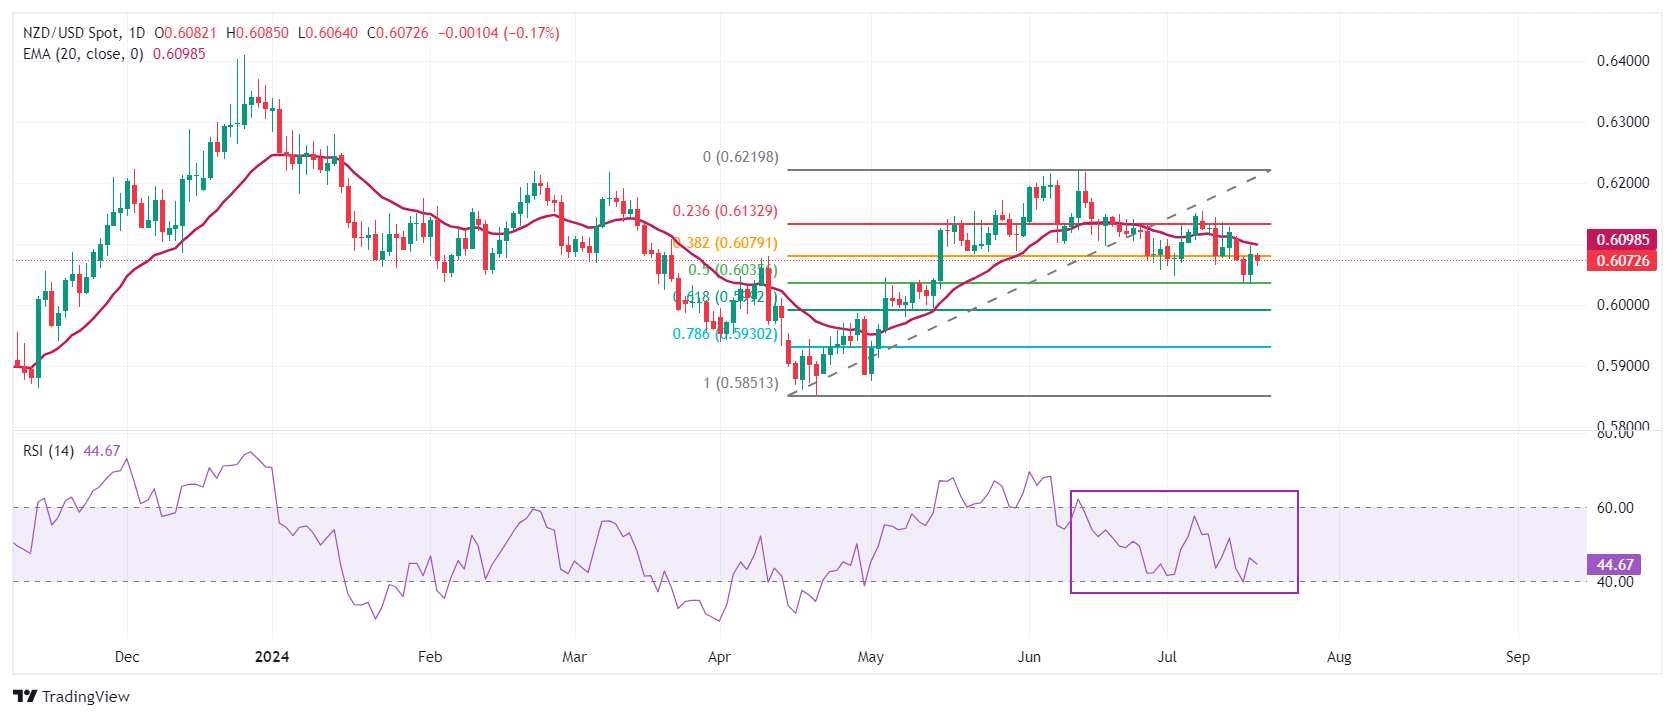
Economic Indicator
Consumer Price Index (QoQ)
The Consumer Price Index (CPI), released by Statistics New Zealand on a quarterly basis, measures changes in the price of goods and services bought by New Zealand households. The CPI is a key indicator to measure inflation and changes in purchasing trends. The QoQ reading compares prices in the reference quarter to the previous quarter. A high reading is seen as bullish for the New Zealand Dollar (NZD), while a low reading is seen as bearish.
Read more.Last release: Tue Jul 16, 2024 22:45
Frequency: Quarterly
Actual: 0.4%
Consensus: 0.6%
Previous: 0.6%
Source: Stats NZ
With the Reserve Bank of New Zealand's (RBNZ) inflation target being around the midpoint of 2%, Statistics New Zealand’s quarterly Consumer Price Index (CPI) publication is of high significance. The trend in consumer prices tends to influence RBNZ’s interest rates decision, which in turn, heavily impacts the NZD valuation. Acceleration in inflation could lead to faster tightening of the rates by the RBNZ and vice-versa. Actual figures beating forecasts render NZD bullish.
Christine Lagarde, President of the European Central Bank (ECB), explains the ECB's decision to leave key rates unchanged following the July policy meeting and responds to questions from the press.
Key quotes
"The policy decision was unanimous."
"We are determined not to have a predetermined rate path."
"September decision is wide open."
"September projections, plus other data, will be taken into account."
Interest rates FAQs
Interest rates are charged by financial institutions on loans to borrowers and are paid as interest to savers and depositors. They are influenced by base lending rates, which are set by central banks in response to changes in the economy. Central banks normally have a mandate to ensure price stability, which in most cases means targeting a core inflation rate of around 2%. If inflation falls below target the central bank may cut base lending rates, with a view to stimulating lending and boosting the economy. If inflation rises substantially above 2% it normally results in the central bank raising base lending rates in an attempt to lower inflation.
Higher interest rates generally help strengthen a country’s currency as they make it a more attractive place for global investors to park their money.
Higher interest rates overall weigh on the price of Gold because they increase the opportunity cost of holding Gold instead of investing in an interest-bearing asset or placing cash in the bank. If interest rates are high that usually pushes up the price of the US Dollar (USD), and since Gold is priced in Dollars, this has the effect of lowering the price of Gold.
The Fed funds rate is the overnight rate at which US banks lend to each other. It is the oft-quoted headline rate set by the Federal Reserve at its FOMC meetings. It is set as a range, for example 4.75%-5.00%, though the upper limit (in that case 5.00%) is the quoted figure. Market expectations for future Fed funds rate are tracked by the CME FedWatch tool, which shapes how many financial markets behave in anticipation of future Federal Reserve monetary policy decisions.
- Silver prices edge up 0.30%, trading at $30.35 after a sharp 3% decline.
- Technical outlook remains bullish, supported by the 50-DMA at $30.16 and RSI above the 50-neutral line.
- Key resistance at $30.50 and $31.00; support levels at 50-DMA and $29.48, with a critical psychological barrier at $29.00.
Silver's price edged up early in the North American session but remained below the psychological figure of $30.50 after posting losses of more than 3% on Wednesday. Rising US Treasury yields and a stronger US Dollar weighed on the precious metal, which trades at $30.35 and registers gains of 0.30%.
XAG/USD Price Analysis: Technical outlook
The grey metal remains bullish-biased, capped on the downside by the 50-day moving average (DMA) at $30.16. The Relative Strength Index (RSI) clings above the 50-neutral line, depicting that momentum favors buyers; hence, further upside is seen.
For a bullish continuation, the XAG/USD must climb above $30.50 so buyers can test the $31.00 mark. On further strength, Silver’s next resistance would be the July 17 peak at $31.42, before testing July 12 high at $31.75.
If the grey metal weakens further, the XAG/USD first support would be the 50-DMA before testing the July 3 daily low of $29.48. A breach of the latter will expose the $29.00 psychological figure.
XAG/USD Price Action – Daily Chart
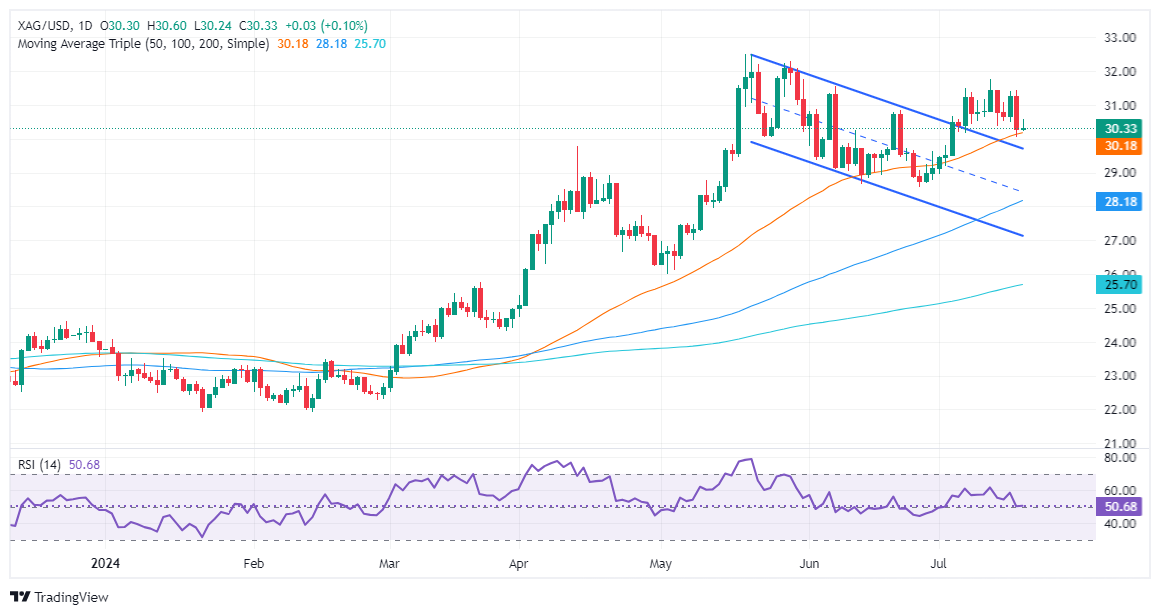
Silver FAQs
Silver is a precious metal highly traded among investors. It has been historically used as a store of value and a medium of exchange. Although less popular than Gold, traders may turn to Silver to diversify their investment portfolio, for its intrinsic value or as a potential hedge during high-inflation periods. Investors can buy physical Silver, in coins or in bars, or trade it through vehicles such as Exchange Traded Funds, which track its price on international markets.
Silver prices can move due to a wide range of factors. Geopolitical instability or fears of a deep recession can make Silver price escalate due to its safe-haven status, although to a lesser extent than Gold's. As a yieldless asset, Silver tends to rise with lower interest rates. Its moves also depend on how the US Dollar (USD) behaves as the asset is priced in dollars (XAG/USD). A strong Dollar tends to keep the price of Silver at bay, whereas a weaker Dollar is likely to propel prices up. Other factors such as investment demand, mining supply – Silver is much more abundant than Gold – and recycling rates can also affect prices.
Silver is widely used in industry, particularly in sectors such as electronics or solar energy, as it has one of the highest electric conductivity of all metals – more than Copper and Gold. A surge in demand can increase prices, while a decline tends to lower them. Dynamics in the US, Chinese and Indian economies can also contribute to price swings: for the US and particularly China, their big industrial sectors use Silver in various processes; in India, consumers’ demand for the precious metal for jewellery also plays a key role in setting prices.
Silver prices tend to follow Gold's moves. When Gold prices rise, Silver typically follows suit, as their status as safe-haven assets is similar. The Gold/Silver ratio, which shows the number of ounces of Silver needed to equal the value of one ounce of Gold, may help to determine the relative valuation between both metals. Some investors may consider a high ratio as an indicator that Silver is undervalued, or Gold is overvalued. On the contrary, a low ratio might suggest that Gold is undervalued relative to Silver.
Christine Lagarde, President of the European Central Bank (ECB), explains the ECB's decision to leave key rates unchanged following the July policy meeting and responds to questions from the press.
Key quotes
"Spent a lot of times discussing wages, profits, productivity."
"Various wage measures point us in the direction of rather elevated levels."
"These were taken into account in June projections."
"Surveys indicated that elevated wage growth will decline in 2025 and 2026."
"There is limited recovery in productivity."
ECB FAQs
The European Central Bank (ECB) in Frankfurt, Germany, is the reserve bank for the Eurozone. The ECB sets interest rates and manages monetary policy for the region. The ECB primary mandate is to maintain price stability, which means keeping inflation at around 2%. Its primary tool for achieving this is by raising or lowering interest rates. Relatively high interest rates will usually result in a stronger Euro and vice versa. The ECB Governing Council makes monetary policy decisions at meetings held eight times a year. Decisions are made by heads of the Eurozone national banks and six permanent members, including the President of the ECB, Christine Lagarde.
In extreme situations, the European Central Bank can enact a policy tool called Quantitative Easing. QE is the process by which the ECB prints Euros and uses them to buy assets – usually government or corporate bonds – from banks and other financial institutions. QE usually results in a weaker Euro. QE is a last resort when simply lowering interest rates is unlikely to achieve the objective of price stability. The ECB used it during the Great Financial Crisis in 2009-11, in 2015 when inflation remained stubbornly low, as well as during the covid pandemic.
Quantitative tightening (QT) is the reverse of QE. It is undertaken after QE when an economic recovery is underway and inflation starts rising. Whilst in QE the European Central Bank (ECB) purchases government and corporate bonds from financial institutions to provide them with liquidity, in QT the ECB stops buying more bonds, and stops reinvesting the principal maturing on the bonds it already holds. It is usually positive (or bullish) for the Euro.
Christine Lagarde, President of the European Central Bank (ECB), explains the ECB's decision to leave key rates unchanged following the July policy meeting and responds to questions from the press.
Key quotes
"Incoming data indicates that Euro area economy grew in the second quarter."
"Growth is likely slower than the first quarter."
"Services lead the recovery, industry and exports are weak."
"Investments point to muted growth in 2024."
"We expect recovery to be supported by consumption."
"The labour market remains resilient."
"More jobs were likely created in the second quarter, mainly in services."
"Domestic inflation remains high."
"Wages are still rising at an elevated rate."
"Growth in labour cost will remain elevated in near term."
"Recent data on compensation is in line with expectations."
"Wage growth is expected to moderate in the course of next year."
"Inflation to fluctuate near current levels for rest of the year."
"HICP to decline to target in second half of next year."
"Risks to growth are tilted to the downside."
Euro FAQs
The Euro is the currency for the 20 European Union countries that belong to the Eurozone. It is the second most heavily traded currency in the world behind the US Dollar. In 2022, it accounted for 31% of all foreign exchange transactions, with an average daily turnover of over $2.2 trillion a day. EUR/USD is the most heavily traded currency pair in the world, accounting for an estimated 30% off all transactions, followed by EUR/JPY (4%), EUR/GBP (3%) and EUR/AUD (2%).
The European Central Bank (ECB) in Frankfurt, Germany, is the reserve bank for the Eurozone. The ECB sets interest rates and manages monetary policy. The ECB’s primary mandate is to maintain price stability, which means either controlling inflation or stimulating growth. Its primary tool is the raising or lowering of interest rates. Relatively high interest rates – or the expectation of higher rates – will usually benefit the Euro and vice versa. The ECB Governing Council makes monetary policy decisions at meetings held eight times a year. Decisions are made by heads of the Eurozone national banks and six permanent members, including the President of the ECB, Christine Lagarde.
Eurozone inflation data, measured by the Harmonized Index of Consumer Prices (HICP), is an important econometric for the Euro. If inflation rises more than expected, especially if above the ECB’s 2% target, it obliges the ECB to raise interest rates to bring it back under control. Relatively high interest rates compared to its counterparts will usually benefit the Euro, as it makes the region more attractive as a place for global investors to park their money.
Data releases gauge the health of the economy and can impact on the Euro. Indicators such as GDP, Manufacturing and Services PMIs, employment, and consumer sentiment surveys can all influence the direction of the single currency. A strong economy is good for the Euro. Not only does it attract more foreign investment but it may encourage the ECB to put up interest rates, which will directly strengthen the Euro. Otherwise, if economic data is weak, the Euro is likely to fall. Economic data for the four largest economies in the euro area (Germany, France, Italy and Spain) are especially significant, as they account for 75% of the Eurozone’s economy.
Another significant data release for the Euro is the Trade Balance. This indicator measures the difference between what a country earns from its exports and what it spends on imports over a given period. If a country produces highly sought after exports then its currency will gain in value purely from the extra demand created from foreign buyers seeking to purchase these goods. Therefore, a positive net Trade Balance strengthens a currency and vice versa for a negative balance.
- EUR/JPY reaches 171.00, peaking at 171.19, after the ECB holds interest rates steady.
- ECB remarks on core inflation: slight increase due to one-off factors, though most metrics stable or decreased in June.
- ECB plans to reduce APP and PEPP portfolios, ceasing principal reinvestments, with an average monthly reduction of €7.5 billion.
The EUR/JPY remains at familiar levels after the European Central Bank decided to keep interest rates unchanged, with its deposit rate at 3.75% as expected, and would stick to its meeting-by-meeting approach, failing to provide an interest rate path. At the time of writing, the cross trades at around 171.00 after hitting a daily high of 171.19.
ECB maintains cautious stance, fails to outline clear rate path
In its monetary policy statement, the ECB mentioned that measures of core inflation edged slightly up due to “one-off factors,” but most measures remained stable or edged down in June. The ECB’s Governing Council noted that the policy “is keeping financing conditions restrictive.” It would keep it as it is “for as long as necessary” to ensure inflation returns to its 2% goal.
Regarding its Aset Purchase Program (APP), the ECB decided not to reinvest all the principal payments on its Asset Purchase Program (APP) and the Pandemic Emergency Purchase Program (PEPP), reducing the portfolio to average €7.5 billion per month.
In the meantime, traders eye ECB’s President Christine Lagarde's press conference at around 12:45 GMT.
EUR/JPY Price Analysis: Technical outlook
The EUR/JPY slid to its daily low of 170.01 during the Asian session, yet it has managed to recover some ground. After the ECB’s decision, it climbed back above the 50-day moving average (DMA)at 170.75.
Nevertheless, momentum remains on the sellers’ side, as the Relative Strength Index (RSI) shifted bearish following the Japanese authority's intervention in the FX space.
However, if EUR/JPY stays above 171.00, that could pave the way to test July’s 17 high of 172.83. On its way up, it would face key resistance levels: the Kijun-Sen at 171.47, followed by the Tenkan-Sen at 172.72. Afterward, buyers could test yesterday’s peak.
On the other hand, if a fall is below 171.00, sellers could challenge the 170.00 figure before prices drop inside the Ichimoku Cloud (Kumo).
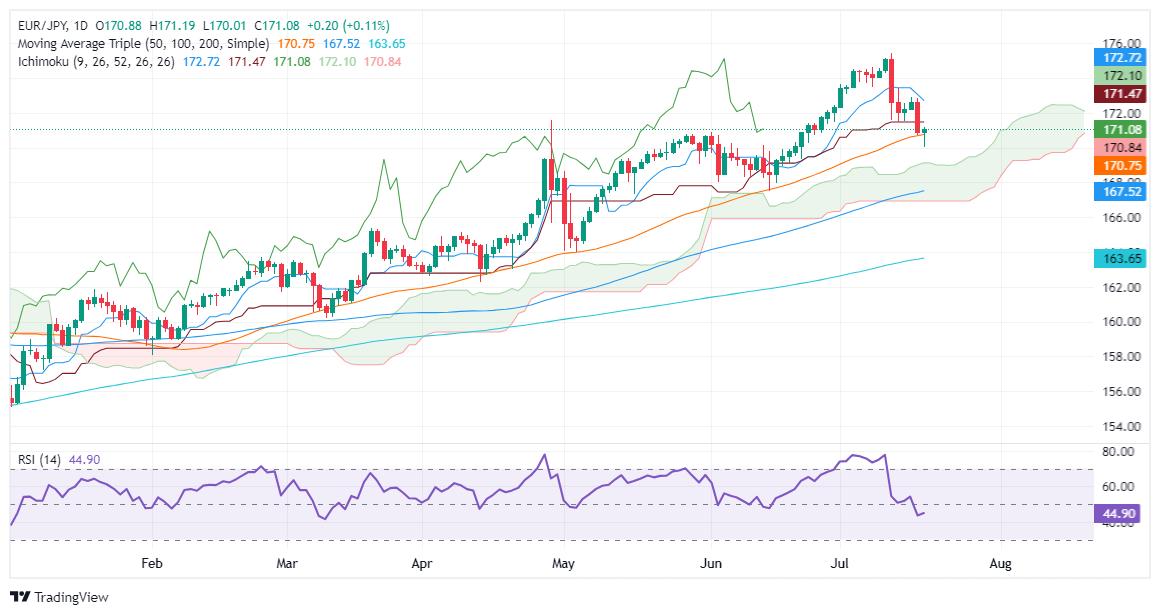
ECB FAQs
The European Central Bank (ECB) in Frankfurt, Germany, is the reserve bank for the Eurozone. The ECB sets interest rates and manages monetary policy for the region. The ECB primary mandate is to maintain price stability, which means keeping inflation at around 2%. Its primary tool for achieving this is by raising or lowering interest rates. Relatively high interest rates will usually result in a stronger Euro and vice versa. The ECB Governing Council makes monetary policy decisions at meetings held eight times a year. Decisions are made by heads of the Eurozone national banks and six permanent members, including the President of the ECB, Christine Lagarde.
In extreme situations, the European Central Bank can enact a policy tool called Quantitative Easing. QE is the process by which the ECB prints Euros and uses them to buy assets – usually government or corporate bonds – from banks and other financial institutions. QE usually results in a weaker Euro. QE is a last resort when simply lowering interest rates is unlikely to achieve the objective of price stability. The ECB used it during the Great Financial Crisis in 2009-11, in 2015 when inflation remained stubbornly low, as well as during the covid pandemic.
Quantitative tightening (QT) is the reverse of QE. It is undertaken after QE when an economic recovery is underway and inflation starts rising. Whilst in QE the European Central Bank (ECB) purchases government and corporate bonds from financial institutions to provide them with liquidity, in QT the ECB stops buying more bonds, and stops reinvesting the principal maturing on the bonds it already holds. It is usually positive (or bullish) for the Euro.
- Initial Jobless Claims rose by 243K vs. the previous week.
- Continuing Jobless Claims rose by nearly 1.870M.
US citizens that applied for unemployment insurance benefits increased by 243K in the week ending July 13 according to the US Department of Labor (DoL) on Thursday. The prints came in above initial estimates (230K) and were higher than the previous weekly gain of 223K (revised from 239K).
Further details of the publication revealed that the advance seasonally adjusted insured unemployment rate was 1.2% and the 4-week moving average was 234.75K, an increase of 1K from the previous week's revised average.
In addition, Continuing Claims increased by 20K to 1.867M in the week ended July 6.
(This story was corrected on July 18 at 12:45 GMT to say that Continuing Claims increased by 20K, not decreased).
- EUR/GBP gains ground as ECB maintains current interest rates at Thursday’s meeting.
- ECB has maintained its main refinancing rate at 4.25%, as expected.
- ECB President Christine Lagarde is expected to emphasize the need for more data to ensure confidence in the disinflation process.
EUR/GBP extends its gains for the second successive session, trading around 0.8420 during the European hours on Thursday. The Euro remains strong as the European Central Bank (ECB) decided to maintain its main refinancing rate at 4.25%, as expected, at its July Monetary Policy Meeting. The ECB's deposit facility rate also remains unchanged at 3.75%.
Traders are now looking forward to the ECB Press Conference later today, where ECB President Christine Lagarde will discuss monetary policy. Lagarde is unlikely to outline a specific path for rate cuts but is expected to emphasize the need for more data to ensure confidence in the disinflation process before considering further policy easing.
On the GBP’s front, the UK Claimant Count Change, which measures the number of people claiming jobless benefits, rose to 32.3K in June, surpassing market expectations of 23.4K. The previous month's figure was revised from 50.4K to 51.9K. Additionally, the ILO Unemployment Rate held steady at 4.4% in the three months to May, matching the previous period's rate. The market consensus was also for a 4.4% reading.
Meanwhile, the Office for National Statistics reported an Employment Change of 19.0K for the three months to May, indicating an increase in the number of employed persons. The previous reading had shown a decrease of 140K.
On Wednesday, the final UK Consumer Price Index (CPI) inflation figures met expectations, but a larger-than-anticipated decline in UK Producer Price Index (PPI) inflation briefly put pressure on the British Pound.
Traders anticipate the release of the UK Retail Sales data on Friday. Expectations are for a 0.4% month-over-month decline in June, following the previous month's 2.9% increase. Despite this, Retail Sales are forecasted to rise by 0.2%, compared to the prior 1.3% increase.
Economic Indicator
ECB Main Refinancing Operations Rate
One of the three key interest rates set by the European Central Bank (ECB), the main refinancing operations rate is the interest rate the ECB charges to banks for one-week long loans. It is announced by the European Central Bank at its eight scheduled annual meetings. If the ECB expects inflation to rise, it will increase its interest rates to bring it back down to its 2% target. This tends to be bullish for the Euro (EUR), since it attracts more foreign capital inflows. Likewise, if the ECB sees inflation falling it may cut the main refinancing operations rate to encourage banks to borrow and lend more, in the hope of driving economic growth. This tends to weaken the Euro as it reduces its attractiveness as a place for investors to park capital.
Read more.Last release: Thu Jul 18, 2024 12:15
Frequency: Irregular
Actual: 4.25%
Consensus: 4.25%
Previous: 4.25%
Source: European Central Bank
- The US Dollar rebounds on Thursday, driven by improved Treasury yields.
- Traders expect the Fed to reduce rates in September.
- ECB is expected to keep its main refinancing rate steady at 4.25% at Thursday’s meeting.
The US Dollar Index (DXY), which measures the value of the US Dollar (USD) against six other major currencies, rebounds due to improved US Treasury yields. The DXY holds gains around 103.80, with yields on 2-year and 10-year US Treasury bonds standing at 4.46% and 4.18%, respectively, during the European session on Thursday.
However, the US Dollar may limit its upside due to the high likelihood of a rate-cut decision by the Federal Reserve (Fed) in its September policy meeting. Federal Reserve officials have expressed increasing confidence that the pace of price increases is now more consistently aligning with policymakers' goals.
On Wednesday, Fed Governor Christopher Waller said that the US central bank is ‘getting closer’ to an interest rate cut. Meanwhile, Richmond Fed President Thomas Barkin stated that easing in inflation had begun to broaden and he would like to see it continue,” per Reuters.
According to CME Group’s FedWatch Tool, markets now indicate a 93.5% probability of a 25-basis point rate cut at the September Fed meeting, up from 69.7% a week earlier.
The New York Times reported on Wednesday that former President Donald Trump, in a meeting with House Republicans last month, expressed support for tax reductions, lower interest rates, and increased tariffs. These measures could potentially be inflationary for the economy and weaken the Greenback.
Traders anticipate the European Central Bank's (ECB) monetary policy meeting scheduled for later on Thursday. The ECB is expected to keep its main refinancing rate steady at 4.25% at July’s meeting. Additionally, traders will likely shift their attention to the US weekly Initial Jobless Claims and the Philly Fed Manufacturing Index, as well as a speech by the Fed’s Lorie Logan.
US Dollar FAQs
The US Dollar (USD) is the official currency of the United States of America, and the ‘de facto’ currency of a significant number of other countries where it is found in circulation alongside local notes. It is the most heavily traded currency in the world, accounting for over 88% of all global foreign exchange turnover, or an average of $6.6 trillion in transactions per day, according to data from 2022. Following the second world war, the USD took over from the British Pound as the world’s reserve currency. For most of its history, the US Dollar was backed by Gold, until the Bretton Woods Agreement in 1971 when the Gold Standard went away.
The most important single factor impacting on the value of the US Dollar is monetary policy, which is shaped by the Federal Reserve (Fed). The Fed has two mandates: to achieve price stability (control inflation) and foster full employment. Its primary tool to achieve these two goals is by adjusting interest rates. When prices are rising too quickly and inflation is above the Fed’s 2% target, the Fed will raise rates, which helps the USD value. When inflation falls below 2% or the Unemployment Rate is too high, the Fed may lower interest rates, which weighs on the Greenback.
In extreme situations, the Federal Reserve can also print more Dollars and enact quantitative easing (QE). QE is the process by which the Fed substantially increases the flow of credit in a stuck financial system. It is a non-standard policy measure used when credit has dried up because banks will not lend to each other (out of the fear of counterparty default). It is a last resort when simply lowering interest rates is unlikely to achieve the necessary result. It was the Fed’s weapon of choice to combat the credit crunch that occurred during the Great Financial Crisis in 2008. It involves the Fed printing more Dollars and using them to buy US government bonds predominantly from financial institutions. QE usually leads to a weaker US Dollar.
Quantitative tightening (QT) is the reverse process whereby the Federal Reserve stops buying bonds from financial institutions and does not reinvest the principal from the bonds it holds maturing in new purchases. It is usually positive for the US Dollar.
Cable has slipped back under 1.30 and has lost some ground versus the Euro (EUR) after the cross snapped higher from yesterday’s two-year low below 0.84, Scotiabank’s chief FX strategist Shaun Osborne notes.
GBP to continue up to 1.3045/50 resistance zone
“UK average weekly earnings data rose 5.7% (ex-bonus pay also rose 5.7%) in the MarchMay periods, unchanged from the previous reading. Unemployment was steady at 4.4%, as expected. The data were in line with expectations but hardly bolster the case for an August rate cut from the BoE (11-12bps priced in).”
“Cable weakness back under 1.30 represent a minor setback for the Pound Sterling (GBP). The underlying trend remains favourable and losses should remain limited amid bullishly aligned trend strength oscillators across a range of time frames. Intraday support sits at 1.2940/50. Minor resistance is 1.3045/50.”
The Euro (EUR) has drifted a little lower over the session so far but losses are marginal ahead of the ECB policy decision, Scotiabank’s chief FX strategist Shaun Osborne notes.
Lagarde to maintain a ‘data dependent’ approach
“There is all but zero chance of the ECB cutting interest rates today. Swaps are pricing in steady policy and comments from top officials have suggested rate cuts will come through at a measured pace. President Lagarde seems likely to maintain a ‘data dependent’ approach to the policy outlook which may sound a little hawkish amid still relatively elevated service sector inflation pressures.”
“Spot has edged a little lower from yesterday’s peak near 1.0950 but the minor decline is measured and may be taking the form of a small bull flag ahead of renewed gains (above 1.0935/40 this morning).”
“Intraday, daily and weekly trend strength oscillators are aligned bullishly for the EUR which suggests limited downside movement potential for spot and ongoing risks for renewed push higher. Support is 1.0900/10. Resistance is 1.0980; above here targets EUR gains towards 1.10/1.11.”
- AUD/USD finds interim support near 0.6700 on surprisingly upbeat Australian job growth.
- Upbear Australian labor demand has prompted prospects of RBA’s further policy tightening.
- US bond yields bounce back despite firm Fed rate-cut prospects.
The AUD/USD pair manages to gain firm-footing near the round-level support of 0.6700 in Thursday’s European session. The Aussie asset discovers buying interest as signs of strong job demand from Australia’s Employment data for June has improved expectations of further policy-tightening by the Reserve Bank of Australia (RBA).
The Australian Bureau of Statistics reported that number of individuals hired in June surprisingly rose to 50.2K. Economists expected fresh payrolls at 20K against the prior release of 39.5K, downwardly revised from 39.7K. However, the Unemployment Rate rose to 4.1% from the estimates and the former release of 4.0%.
Meanwhile, the US Dollar (USD) witnesses some buying as US bond yields bounce back. The US Dollar Index (DXY), which tracks the Greenback’s value against six major currencies, gains ground neat four-month low at 103.70. 10-year US Treasury yields recover to near 4.19%.
US bond yields bounce back even though the Federal Reserve (Fed) is widely expected to start reducing interest rates from the September meeting. The Fed is also expected to cut interest rates twice this year against once signalled by officials in the latest dot plot.
Strong expectations for Fed rate cuts have been prompted by easing price pressures. The United States (US) core Consumer Price Index (CPI), which excludes volatile food and energy items, decelerated for straight third month in June.
Australian Dollar FAQs
One of the most significant factors for the Australian Dollar (AUD) is the level of interest rates set by the Reserve Bank of Australia (RBA). Because Australia is a resource-rich country another key driver is the price of its biggest export, Iron Ore. The health of the Chinese economy, its largest trading partner, is a factor, as well as inflation in Australia, its growth rate and Trade Balance. Market sentiment – whether investors are taking on more risky assets (risk-on) or seeking safe-havens (risk-off) – is also a factor, with risk-on positive for AUD.
The Reserve Bank of Australia (RBA) influences the Australian Dollar (AUD) by setting the level of interest rates that Australian banks can lend to each other. This influences the level of interest rates in the economy as a whole. The main goal of the RBA is to maintain a stable inflation rate of 2-3% by adjusting interest rates up or down. Relatively high interest rates compared to other major central banks support the AUD, and the opposite for relatively low. The RBA can also use quantitative easing and tightening to influence credit conditions, with the former AUD-negative and the latter AUD-positive.
China is Australia’s largest trading partner so the health of the Chinese economy is a major influence on the value of the Australian Dollar (AUD). When the Chinese economy is doing well it purchases more raw materials, goods and services from Australia, lifting demand for the AUD, and pushing up its value. The opposite is the case when the Chinese economy is not growing as fast as expected. Positive or negative surprises in Chinese growth data, therefore, often have a direct impact on the Australian Dollar and its pairs.
Iron Ore is Australia’s largest export, accounting for $118 billion a year according to data from 2021, with China as its primary destination. The price of Iron Ore, therefore, can be a driver of the Australian Dollar. Generally, if the price of Iron Ore rises, AUD also goes up, as aggregate demand for the currency increases. The opposite is the case if the price of Iron Ore falls. Higher Iron Ore prices also tend to result in a greater likelihood of a positive Trade Balance for Australia, which is also positive of the AUD.
The Trade Balance, which is the difference between what a country earns from its exports versus what it pays for its imports, is another factor that can influence the value of the Australian Dollar. If Australia produces highly sought after exports, then its currency will gain in value purely from the surplus demand created from foreign buyers seeking to purchase its exports versus what it spends to purchase imports. Therefore, a positive net Trade Balance strengthens the AUD, with the opposite effect if the Trade Balance is negative.
The Canadian Dollar (CAD) is little changed on the session, leaving it as a marginal outperformer alongside the Australian Dollar (AUD) on a day where the US Dollar (USD) is trading a little higher overall, Scotiabank’s chief FX strategist Shaun Osborne notes.
USD seems unable to extend much above 1.37
“Market-moving news is in short supply for the CAD at the moment and the variables that might affect the currency are mostly stable. The CAD is trading a little below my fair value estimate (1.3597). The divergence is not significant but may help limit pressure on the CAD in the short run. More range trading between 1.36/1.37 looks likely for spot in the short run.”
“USD/CAD is well-supported around the 1.36 area, with the recent range base bolstered by the 200-day MA. Equally, though, the USD seems unable to extend much above 1.37. There is resistance at 1.3705/10 and 1.3750/55. Trend signals are mixed and weak, supporting the outlook for more flat, sideways range trade in the near term.”
Wednesday's UK inflation figures were slightly higher than expected, Commerzbank FX analysts Ulrich Leuchtmann and Michael Pfister note.
BoE to make its first rate cut soon enough
“Wednesday's UK inflation figures were slightly higher than expected. The headline rate came in at 2.0% y/y (1.9% expected), while the core rate was 3.5% (3.4% expected). However, the figures were very close, with the headline rate coming in at 1.97% and the economists' average at 1.94%.”
“A real surprise looks different. I suspect that the news was not so much that rates were slightly higher than expected. Rather, it was that this went against the global trend. While inflation figures in the US, Canada, Sweden, etc. have recently surprised to the downside, inflation in the UK has been (somewhat) more stubborn.”
“The next decision by the Bank of England (BoE) should be very exciting. We still tend to think that the BoE will then make its first rate cut soon. But whether it is in August or September, the key point will be that with core and services inflation continuing to be high, large rate cuts are unlikely to be an issue. The Pound Sterling should therefore remain well supported over the medium term.”
The Swiss Franc (CHF) benefited significantly on Wednesday both against the US Dollar (USD) and the Euro (EUR), Commerzbank FX analysts Ulrich Leuchtmann and Michael Pfister note.
SNB prefers a weaker Franc
“The move is somewhat surprising. In the past, it was always said that CHF would strengthen when the USD strengthened. Yesterday it was the other way round. The only way I can explain this is that when the market is worried about Federal Reserve’s (Fed) independence, it prefers to look for other currencies that are perceived as safe havens and where fewer rate cuts are expected.”
“However, things are now getting interesting because the SNB and the Japanese Ministry of Finance are currently pursuing opposing intervention policies. Japan wants a stronger Yen, while in Switzerland the SNB prefers a weaker Franc. I would therefore be cautious about betting on too much CHF strength.”
“SNB is unlikely to intervene at levels just below 0.97 in EUR/CHF. But if it goes further towards 0.95? Then the risk of intervention certainly increases.”
The possible BoJ intervention in the market on Friday was mostly unsuccessful. On Wednesday, the situation was very different. It very much smells like the BoJ traders had their fingers in the pie on Wednesday too, Commerzbank FX analysts Ulrich Leuchtmann and Michael Pfister note.
BoJ last intervention seems successful
“Readers of my generation may remember the movie Crocodile Dundee. In particular, the scene in which Paul Hogan says: ‘That's not a knife, THIS is a knife!’ This saying came to mind when I read that the daily balance reports of the Bank of Japan (BoJ) suggest that it not only intervened last Thursday (THIS was an intervention!), but also last Friday. In Hogan's sense: ‘That was not an intervention!’”
“The result of the possible intervention on Friday was more than modest. Yesterday, on the other hand, the situation was very different. In the general weakness of the USD, the USD/JPY movement stood out in particular. It very much smells like the BoJ traders had their fingers in the pie yesterday too.”
“If USD/JPY is already sliding due to a bout of general USD weakness, a round of intervention seems promising because in a phase in which the market is searching for a new equilibrium based on new information, interventions change this search process.”
- WTI price loses ground as US Dollar holds ground due to improved yields.
- Crude Oil may limit its downside as traders expect the Fed to reduce rates in September.
- Fed Governor Christopher Waller stated that the US central bank is ‘getting closer’ to a rate cut.
West Texas Intermediate (WTI) Oil price edges lower due to improved US Dollar (USD). WTI price trades around $81.20 per barrel during the European hours on Thursday. However, WTI price gained ground during Thursday’s Asian session, driven by a bigger-than-expected decline in crude stocks in the United States, the world's largest oil consumer.
The US Energy Information Administration (EIA) released the US Crude Oil Stocks Change on Wednesday, reporting a decrease of 4.87 million barrels for the week ending July 12. This decline exceeds the expected drop of 0.80 million barrels and the previous decrease of 3.443 million barrels.
Additionally, growing expectations of the Federal Reserve (Fed) reducing interest rates in September may improve the economic conditions in the United States. The lower borrowing cost would help in increasing economic activities, hence, boosting Oil demand.
On Wednesday, Fed Governor Christopher Waller said that the US central bank is ‘getting closer’ to an interest rate cut. Meanwhile, Richmond Fed President Thomas Barkin stated that easing in inflation had begun to broaden and he would like to see it continue,” per Reuters.
The price of crude Oil could face challenges due to a slowing Chinese economy in the second quarter, which reduces demand in the world's largest Oil-importing country. China's growth drivers remain uneven, and trade tensions are escalating, with the US and EU imposing new tariffs on Chinese electric vehicles (EVs).
WTI Oil FAQs
WTI Oil is a type of Crude Oil sold on international markets. The WTI stands for West Texas Intermediate, one of three major types including Brent and Dubai Crude. WTI is also referred to as “light” and “sweet” because of its relatively low gravity and sulfur content respectively. It is considered a high quality Oil that is easily refined. It is sourced in the United States and distributed via the Cushing hub, which is considered “The Pipeline Crossroads of the World”. It is a benchmark for the Oil market and WTI price is frequently quoted in the media.
Like all assets, supply and demand are the key drivers of WTI Oil price. As such, global growth can be a driver of increased demand and vice versa for weak global growth. Political instability, wars, and sanctions can disrupt supply and impact prices. The decisions of OPEC, a group of major Oil-producing countries, is another key driver of price. The value of the US Dollar influences the price of WTI Crude Oil, since Oil is predominantly traded in US Dollars, thus a weaker US Dollar can make Oil more affordable and vice versa.
The weekly Oil inventory reports published by the American Petroleum Institute (API) and the Energy Information Agency (EIA) impact the price of WTI Oil. Changes in inventories reflect fluctuating supply and demand. If the data shows a drop in inventories it can indicate increased demand, pushing up Oil price. Higher inventories can reflect increased supply, pushing down prices. API’s report is published every Tuesday and EIA’s the day after. Their results are usually similar, falling within 1% of each other 75% of the time. The EIA data is considered more reliable, since it is a government agency.
OPEC (Organization of the Petroleum Exporting Countries) is a group of 13 Oil-producing nations who collectively decide production quotas for member countries at twice-yearly meetings. Their decisions often impact WTI Oil prices. When OPEC decides to lower quotas, it can tighten supply, pushing up Oil prices. When OPEC increases production, it has the opposite effect. OPEC+ refers to an expanded group that includes ten extra non-OPEC members, the most notable of which is Russia.
There is probably a broad consensus in the market that a second Trump term would be inflationary. I don't need to repeat the arguments here. You can find them everywhere. But what does this statement mean for USD exchange rates? The answer is: it depends on the Federal Reserve's monetary policy, Commerzbank FX analysts Ulrich Leuchtmann and Michael Pfister note.
The Fed is to resist Trump’s pressure to be USD-positive
“Politicians cannot resist the temptation to use the money printing machine to finance policies that they consider desirable. However, central banks in civilized societies are removed from the political process, but populist political styles usually sweep aside such reservations. And that is precisely why people should pay particular attention to what Donald Trump says about the independence of the Fed.”
“Wim Duisenberg, who later became the first president of the ECB, said of the Bundesbank that it was like whipped cream: the more you beat it, the stiffer it gets. Central banks should get stiffer under political pressure, should resist it. In doing so, they achieve two things: the politicians who exerted pressure achieve the opposite and will think twice in the future before repeating their disrespectful behavior; the public sees that the central bank is independent.”
“If the Fed leaves its key interest rate unchanged in September, some observers will get the impression that it is doing so because of Trump's demand. If the Fed lowers the key interest rate in September, this may be seen as an immediate USD-negative signal. But it would also signal that the Fed is resisting political pressure. And that in turn would be USD-positive, especially in the long term of four upcoming Trump years.”
On Thursday meeting, the European Central Bank (ECB) will likely keep interest rates unchanged, but ECB President Christine Lagarde may make a comment that will cause volatility in EUR/USD, Commerzbank FX analysts Ulrich Leuchtmann and Michael Pfister note.
Lagarde comments may cause volatility in EUR/USD
“Interest rates will most likely remain unchanged. A major change in the general outlook is also unlikely. After the ECB committed to a rate cut before the June meeting and then had no choice but to follow through in the face of higher inflation rates, it will probably want to avoid making too clear a commitment this time.”
“Accordingly, one might expect the meeting to be rather unspectacular. Nevertheless, the jump in implied volatility is higher than in June. This is probably simply because everything was a foregone conclusion before the June meeting. The market probably knew that not much more than a rate cut would be announced. Today is different.”
“After all, there is always the possibility that ECB President Christine Lagarde will make a comment that will cause volatility in EUR/USD, for example regarding a possible rate cut in September, which our economists expect. So today could still be more exciting than June.”
The Euro (EU) NEER, which shows how EUR performs against those currencies with which Europeans trade, is calculated daily by the ECB. On Monday it reached a new all-time high. The previous high of December 18, 2008 was exceeded. And therefore: Europe's common currency has never been as strong as it is now, Commerzbank FX analysts Ulrich Leuchtmann and Michael Pfister note.
Euro zone is doing fine and dandy
“When you read the headline, you might think that your FX analyst has completely lost his mind. Because, of course, EUR/USD is miles below all-time highs. On three days in 2008, EUR/USD traded above 1.60. And now it's at a measly 1.09. But EUR/USD is not the measure that is relevant for the European economy. The USA is not the only trading partner of the euro zone. And that's why it doesn't matter.”
“That fact that many of the goods and services that the euro zone exports and imports are settled in US Dollars (USD) seems to suggest that the EUR/USD exchange rate is more relevant for Europe's economy than the NEER. In the short term, this argument may be correct. Because in the short term, foreign trade prices do not fluctuate at will. But it would be a strange world if the choice of transaction currency had a lasting effect on trade flows.”
“I the short term, the strength of EUR may well have a negative economic impact. In the long term, however, currency strength is positive. We receive a lot of consideration for our exports and can purchase imports cheaply. For the price competitiveness of exporters and companies that compete with imports, this may be stupid. But in the long term, it creates prosperity. So we should be happy.”
Silver prices (XAG/USD) rose on Thursday, according to FXStreet data. Silver trades at $30.59 per troy ounce, up 0.95% from the $30.30 it cost on Wednesday.
Silver prices have increased by 28.55% since the beginning of the year.
| Unit measure | Silver Price Today in USD |
|---|---|
| Troy Ounce | 30.59 |
| 1 Gram | 0.98 |
The Gold/Silver ratio, which shows the number of ounces of Silver needed to equal the value of one ounce of Gold, stood at 80.64 on Thursday, down from 81.16 on Wednesday.
Silver FAQs
Silver is a precious metal highly traded among investors. It has been historically used as a store of value and a medium of exchange. Although less popular than Gold, traders may turn to Silver to diversify their investment portfolio, for its intrinsic value or as a potential hedge during high-inflation periods. Investors can buy physical Silver, in coins or in bars, or trade it through vehicles such as Exchange Traded Funds, which track its price on international markets.
Silver prices can move due to a wide range of factors. Geopolitical instability or fears of a deep recession can make Silver price escalate due to its safe-haven status, although to a lesser extent than Gold's. As a yieldless asset, Silver tends to rise with lower interest rates. Its moves also depend on how the US Dollar (USD) behaves as the asset is priced in dollars (XAG/USD). A strong Dollar tends to keep the price of Silver at bay, whereas a weaker Dollar is likely to propel prices up. Other factors such as investment demand, mining supply – Silver is much more abundant than Gold – and recycling rates can also affect prices.
Silver is widely used in industry, particularly in sectors such as electronics or solar energy, as it has one of the highest electric conductivity of all metals – more than Copper and Gold. A surge in demand can increase prices, while a decline tends to lower them. Dynamics in the US, Chinese and Indian economies can also contribute to price swings: for the US and particularly China, their big industrial sectors use Silver in various processes; in India, consumers’ demand for the precious metal for jewellery also plays a key role in setting prices.
Silver prices tend to follow Gold's moves. When Gold prices rise, Silver typically follows suit, as their status as safe-haven assets is similar. The Gold/Silver ratio, which shows the number of ounces of Silver needed to equal the value of one ounce of Gold, may help to determine the relative valuation between both metals. Some investors may consider a high ratio as an indicator that Silver is undervalued, or Gold is overvalued. On the contrary, a low ratio might suggest that Gold is undervalued relative to Silver.
(An automation tool was used in creating this post.)
- USD/CAD depreciates as the Fed is highly expected to reduce rates in September.
- Fed Governor Christopher Waller stated that the US central bank is ‘getting closer’ to a rate cut.
- Lower WTI prices limit the upside of the commodity-linked Canadian Dollar.
USD/CAD retraces its recent gains from the previous session, trading around 1.3670 during the European session on Thursday. This downside is attributed to growing expectations of the Federal Reserve (Fed) reducing interest rates in September.
On Wednesday, Fed Governor Christopher Waller said that the US central bank is ‘getting closer’ to an interest rate cut. Meanwhile, Richmond Fed President Thomas Barkin stated that easing in inflation had begun to broaden and he would like to see it continue,” per Reuters.
According to CME Group’s FedWatch Tool, markets now indicate a 93.5% probability of a 25-basis point rate cut at the September Fed meeting, up from 69.7% a week earlier.
However, the decline in crude Oil prices limits the upside of the commodity-linked Canadian Dollar (CAD), given the fact that Canada is the biggest Oil exporter to the United States (US). West Texas Intermediate (WTI) Oil price trades around $81.30 per barrel at the time of writing.
Despite the dovish sentiment surrounding the Fed regarding its policy stance, US Treasury yields improve due to increased risk aversion. This might have put pressure on the Oil prices. 2-year and 10-year US Treasury bonds stand at 4.45% and 4.17%, respectively, at the time of writing.
However, WTI price gained ground in Thursday’s Asian session, driven by a bigger-than-expected decline in crude stocks in the United States, the world's largest oil consumer.
The US Energy Information Administration (EIA) released the US Crude Oil Stocks Change on Wednesday, reporting a decrease of 4.87 million barrels for the week ending July 12. This decline exceeds the expected drop of 0.80 million barrels and the previous decrease of 3.443 million barrels.
The softer Canadian inflation readings have spurred expectations that the Bank of Canada (BoC) would cut interest rates further next week, which may put a cap on the upside of the Canadian Dollar (CAD).
Canadian Dollar FAQs
The key factors driving the Canadian Dollar (CAD) are the level of interest rates set by the Bank of Canada (BoC), the price of Oil, Canada’s largest export, the health of its economy, inflation and the Trade Balance, which is the difference between the value of Canada’s exports versus its imports. Other factors include market sentiment – whether investors are taking on more risky assets (risk-on) or seeking safe-havens (risk-off) – with risk-on being CAD-positive. As its largest trading partner, the health of the US economy is also a key factor influencing the Canadian Dollar.
The Bank of Canada (BoC) has a significant influence on the Canadian Dollar by setting the level of interest rates that banks can lend to one another. This influences the level of interest rates for everyone. The main goal of the BoC is to maintain inflation at 1-3% by adjusting interest rates up or down. Relatively higher interest rates tend to be positive for the CAD. The Bank of Canada can also use quantitative easing and tightening to influence credit conditions, with the former CAD-negative and the latter CAD-positive.
The price of Oil is a key factor impacting the value of the Canadian Dollar. Petroleum is Canada’s biggest export, so Oil price tends to have an immediate impact on the CAD value. Generally, if Oil price rises CAD also goes up, as aggregate demand for the currency increases. The opposite is the case if the price of Oil falls. Higher Oil prices also tend to result in a greater likelihood of a positive Trade Balance, which is also supportive of the CAD.
While inflation had always traditionally been thought of as a negative factor for a currency since it lowers the value of money, the opposite has actually been the case in modern times with the relaxation of cross-border capital controls. Higher inflation tends to lead central banks to put up interest rates which attracts more capital inflows from global investors seeking a lucrative place to keep their money. This increases demand for the local currency, which in Canada’s case is the Canadian Dollar.
Macroeconomic data releases gauge the health of the economy and can have an impact on the Canadian Dollar. Indicators such as GDP, Manufacturing and Services PMIs, employment, and consumer sentiment surveys can all influence the direction of the CAD. A strong economy is good for the Canadian Dollar. Not only does it attract more foreign investment but it may encourage the Bank of Canada to put up interest rates, leading to a stronger currency. If economic data is weak, however, the CAD is likely to fall.
Scope for US Dollar (USD) to drop below 7.2600, but it might not be able to maintain a foothold below this level, UOB Group FX analysts Quek Ser Leang and Lee Sue Ann note.
A break below 7.2600 may lead to 7.2400
24-HOUR VIEW: “Yesterday, we indicated that USD could rise to 7.2990 before the risk of a pullback increases. However, USD plummeted from a high of 7.2909, reaching a low of 7.2611. While the sharp and swift drop appears to be running ahead of itself, there is scope for USD to drop below 7.2600. However, oversold conditions suggest it might not be able to maintain a foothold below this level. The next support at 7.2500 is unlikely to come into view. Should USD break above 7.2800 (minor resistance is at 7.2745), it would mean that it is not declining further.”
1-3 WEEKS VIEW: “Last Friday (12 Jul, spot at 7.2685), we indicated that USD ‘is likely to trade with a downward bias towards 7.2400, as long as it remains below 7.2910.’ After USD rose to 7.2924, we highlighted yesterday (17 Jul, spot at 7.2900) that ‘downward momentum has faded, but while upward momentum has increased slightly, it is not enough to suggest a sustained advance.’ We expected USD to trade in a 7.2600/7.3100 range. We did not anticipate USD to fell sharply to a low of 7.2611. Downward momentum is building again, but USD must break and stay below 7.2600 before a decline to 7.2400 can be expected. The chance of USD breaking clearly below 7.2600 will remain intact provided that 7.2900 is not breached.”
The US Dollar (USD) could decline further; it remains to be seen if 154.50 will come into view (there is another support level at 155.15), UOB Group FX analysts Quek Ser Leang and Lee Sue Ann note.
The level to watch is 154.50
24-HOUR VIEW: “We did not anticipate the outsized selloff that sent USD plunging to a low of 156.05. USD continues to decline in early Asian trade today. Given the impulsive downward momentum, it could decline further, but note that conditions are severely oversold, and it remains to be seen if 154.50 will come into view (there is another support level at 155.15). To keep the momentum going, USD must remain below 157.30 with minor resistance at 156.60.”
1-3 WEEKS VIEW: “In our most recent narrative from last Friday (12 Jul, spot at 159.00), we highlighted that ‘there is scope for JPY to continue to weaken, but it is too early to determine if the significant support level at 155.50 will come into view.’ We added, ‘All in all, the near-term bias is on the downside, as long as USD remains below 160.00.’ Yesterday, USD plunged to a low of 156.05. Today, in early Asian trade, it fell further and broke below 155.50. While severely oversold, the risk is for further USD weakness. The level to watch is 154.50, followed by 153.95. On the upside, the ‘strong resistance’ level has moved lower to 158.50 from 160.00.”
The New Zealand Dollar (NZD) is likely to trade in a range between 0.6045 and 0.6100. Buildup in downward momentum is not sufficiently enough to suggest a sustained decline; NZD has to break clearly below 0.6030 before further weakness can be expected, UOB Group FX analysts Quek Ser Leang and Lee Sue Ann note.
Rangebound between 0.6045 and 0.6100
24-HOUR VIEW: “Yesterday, NZD traded between 0.6033 and 0.6097 vs our expected range of 0.6030/0.6090. The price action did not result in any increase in downward or upward momentum. Today, we continue to expect NZD to trade in a range, likely between 0.6045 and 0.6100.”
1-3 WEEKS VIEW: “Our update from yesterday (17 Jul, spot at 0.6070) is still valid. As highlighted, 'downward momentum is building, but not sufficiently enough to suggest the start of a sustained decline.' NZD has to break and stay below 0.6030 before further weakness can be expected. The likelihood of NZD breaking clearly below 0.6030 is not high for now, but it will remain intact as long as 0.6115 is not breached.”
The Australian Dollar (AUD) is likely to trade in a sideways range of 0.6710/0.6750. Upward momentum has faded; downward momentum has increased slightly, but AUD is unlikely to break 0.6680, UOB Group FX analysts Quek Ser Leang and Lee Sue Ann note.
Rangebound within 0.6710/0.6750 for now
24-HOUR VIEW: “Yesterday, we expected AUD to drop further to 0.6705. Our expectation did not materialise, as it dropped to 0.6722, closing at 0.6729 (- 0.07%). In Asian trade today, AUD dropped briefly to 0.6715 before rebounding. The price movements did not result in any increase in momentum, and AUD is unlikely to weaken much further. Today, we expect it to trade sideways between 0.6710 and 0.6750.”
1-3 WEEKS VIEW: “Our update from yesterday (17 Jul, spot at 0.6730) is still valid. As highlighted, not only has the recent upward momentum faded, but downward momentum has also increased slightly. AUD is likely to trade with a downward bias, but at this time, it does not appear to have enough momentum to break the major support at 0.6680. On the upside, a breach of 0.6775 (no change in ‘strong resistance’ level from yesterday) would indicate that the current modest downward momentum has eased.”
There is no significant increase in momentum. The Pound Sterling (GBP) is likely to trade sideways between 1.2970 and 1.3045. Upside risk in GBP remains intact; overbought conditions suggest it might not reach 1.3100 this time around, UOB Group FX analysts Quek Ser Leang and Lee Sue Ann note.
Overbought conditions suggest GBP might not reach 1.3100
24-HOUR VIEW: “We expected GBP to trade in a range of 1.2940/1.2995 yesterday. Our expectation was incorrect, as GBP soared to a high of 1.3043, and then pulled back, closing at 1.3008 (+0.27%). Despite the advance, there is no significant increase in upward momentum, and GBP is unlikely to rise much further. Today, GBP is more likely to trade sideways between 1.2970 and 1.3045.”
1-3 WEEKS VIEW: “Two weeks ago, on 04 Jul, when GBP was trading at 1.2745, we pointed out that ‘the risk for GBP has shifted to the upside’ (see chart below). As GBP rose, we have been providing frequent guidance, and in our latest narrative from two days ago (16 Jul, spot at 1.2970), we indicated that GBP ‘must break above 1.3000 before further advance can be expected.’ We also highlighted that ‘the next level to watch above 1.3000 is at 1.3045.’ After trading below 1.3000 for a couple of days, GBP surged above this level yesterday, and came close to reaching 1.3045 (high of 1.3043). While the outlook remains positive, conditions are severely overbought, and GBP might not reach 1.3100 this time around. All in all, only a breach of 1.2940 (‘strong support’ level previously at 1.2900) would mean that GBP is not rising further.”
- USD/MXN gains ground due to increased risk aversion despite the dovish Fed.
- The US Dollar may limit its upside due to rising speculation of the Fed deducting rates in September.
- IMF has revised Mexico’s GDP growth expectations for 2024 from 2.4% to 2.2%.
USD/MXN extends gains for the second successive session, trading around 17.70 during early European hours on Thursday. The US Dollar (USD) rebounds amid increased risk aversion, driven by improved US Treasury yields, underpinning the USD/MXN pair.
The US Dollar Index (DXY), which measures the value of the US Dollar (USD) against the six other major currencies, trades around 103.80, with yields on 2-year and 10-year US Treasury bonds standing at 4.45% and 4.17%, respectively, at the time of writing.
However, the US Dollar may limit its upside due to the high likelihood of a rate-cut decision by the Federal Reserve (Fed) in its September policy meeting. According to CME Group’s FedWatch Tool, markets now indicate a 93.5% probability of a 25-basis point rate cut at the September Fed meeting, up from 69.7% a week earlier.
On Wednesday, Fed Governor Christopher Waller said that the US central bank is ‘getting closer’ to an interest rate cut. Meanwhile, Richmond Fed President Thomas Barkin stated that easing in inflation had begun to broaden and he would like to see it continue,” per Reuters.
On the MXN front, the International Monetary Fund (IMF) has adjusted Mexico’s Gross Domestic Product (GDP) growth expectations for 2024 from 2.4% to 2.2%. This revision reflects Mexico’s ongoing economic slowdown, driven by a contraction in manufacturing observed in the first quarter of 2024, attributed to a deceleration in the US economy.
Additionally, inflation remains high, prompting the Bank of Mexico (Banxico) to maintain a cautious monetary stance. Investors are focused on Banxico's interest rate discussions, with recent comments from Deputy Governor Omar Mejia Castelazo emphasizing the need for gradual rate adjustments.
Mexican Peso FAQs
The Mexican Peso (MXN) is the most traded currency among its Latin American peers. Its value is broadly determined by the performance of the Mexican economy, the country’s central bank’s policy, the amount of foreign investment in the country and even the levels of remittances sent by Mexicans who live abroad, particularly in the United States. Geopolitical trends can also move MXN: for example, the process of nearshoring – or the decision by some firms to relocate manufacturing capacity and supply chains closer to their home countries – is also seen as a catalyst for the Mexican currency as the country is considered a key manufacturing hub in the American continent. Another catalyst for MXN is Oil prices as Mexico is a key exporter of the commodity.
The main objective of Mexico’s central bank, also known as Banxico, is to maintain inflation at low and stable levels (at or close to its target of 3%, the midpoint in a tolerance band of between 2% and 4%). To this end, the bank sets an appropriate level of interest rates. When inflation is too high, Banxico will attempt to tame it by raising interest rates, making it more expensive for households and businesses to borrow money, thus cooling demand and the overall economy. Higher interest rates are generally positive for the Mexican Peso (MXN) as they lead to higher yields, making the country a more attractive place for investors. On the contrary, lower interest rates tend to weaken MXN.
Macroeconomic data releases are key to assess the state of the economy and can have an impact on the Mexican Peso (MXN) valuation. A strong Mexican economy, based on high economic growth, low unemployment and high confidence is good for MXN. Not only does it attract more foreign investment but it may encourage the Bank of Mexico (Banxico) to increase interest rates, particularly if this strength comes together with elevated inflation. However, if economic data is weak, MXN is likely to depreciate.
As an emerging-market currency, the Mexican Peso (MXN) tends to strive during risk-on periods, or when investors perceive that broader market risks are low and thus are eager to engage with investments that carry a higher risk. Conversely, MXN tends to weaken at times of market turbulence or economic uncertainty as investors tend to sell higher-risk assets and flee to the more-stable safe havens.
The Chinese Communist Party (CCP) central committee published its Third Plenum communique on Thursday, stating that they “will adopt a resolution on further deepening reform comprehensively.”
Additional takeaways
Must consciously place reform in a more prominent position.
Reform tasks set out in this decision to be completed by 2029.
Will implement measures to prevent, defuse risks in key areas such as real estate, local government debt, and small and medium-sized financial institutions.
Will raise the level of party's leadership in further deepening reforms across the board and promoting Chinese-style modernisation.
To further coordinate reforms in key areas such as finance and taxation.
To deepen the reform of foreign trade system.
To carry out social security risk prevention and control network, effectively maintain social stability.
To deepen the reform of management system for foreign, outbound investments.
Will deepen supply-side structural reform, establish and development new growth drivers.
Market reaction
AUD/USD is little impressed by these resolutions, keeping its range at around 0.6740, up 0.13% so far.
Rejuvenated momentum suggests further Euro (EUR) strength. EUR could test but is unlikely to break clearly above the significant resistance zone between 1.0970 and 1.0980, UOB Group FX analysts Quek Ser Leang and Lee Sue Ann note.
Upwards momentum suggests further EUR strength
24-HOUR VIEW: “Our view of EUR trading in a range yesterday was incorrect. Instead of trading in a range, EUR surged, reaching a high of 1.0947 before closing at 1.0937 (+0.37%). Not surprisingly, the sharp advance is overbought. However, as long as 1.0910 (with minor support at 1.0925) is not breached, EUR could test but is unlikely to break clearly above the significant resistance zone between 1.0970 and 1.0980.”
1-3 WEEKS VIEW: “In our most recent narrative from two days ago (16 Jul, spot at 1.0895), we highlighted that ‘while there is still scope for EUR to rise further, upward momentum is slowing, and it remains to be seen if any further advance can reach 1.0940.’ We also highlighted that ‘a breach of 1.0850 (no change in ‘strong support’ level) would mean that the EUR strength from early this month (as annotated in the chart below) has run its course.’ Yesterday, EUR took off and broke above 1.0940, reaching a high of 1.0947. The rejuvenated upward momentum suggests further EUR strength, even though the 1.0970/1.0980 zone is expected to pose significant resistance. On the downside, the ‘strong support’ level has moved higher to 1.0885 from 1.0850.”
- Silver price gains to near $30.50 with a focus on China’s third Plenum outcome on Friday.
- The Fed is widely anticipated to begin reducing interest rates in September.
- US annual core inflation decelerated for the third month in a row.
Silver price (XAG/USD) moves higher to near $30.50 in Thursday’s European session. The white metal recovers ahead of China’s third plenum meeting outcome on Friday. Investors expect that China’s Communist Party will take measures to boost economic growth through fiscal and monetary policy expansion.
The World’s second-largest economy, which is a major consumer of Silver, which has applications in various sectors, is battling weak Gross Domestic Product (GDP) growth. The Chinese economy expanded at a slower pace of 0.7%, from the estimates of 1.1% and the former release of 1.5%, downwardly revised from 1.6%.
Meanwhile, firm expectations for the Federal Reserve (Fed) to begin reducing interest rates from the September meeting have kept the US Dollar (USD) and bond yields on the back foot. Lower yields on interest-bearing assets reduce the opportunity cost of holding an investment in non-yielding assets, such as Silver.
Contrarily, the US Dollar Index (DXY) edges up to 103.80 and 10-year US Treasury yields rise to 4.17% but remain close to multi-month lows.
Higher speculation for Fed rate cuts in September was prompted by easing inflationary pressures and cooling labor market conditions. The United States (US) annual core inflation, which excludes volatile food and energy prices, decelerated for straight third month in June. In the same month, monthly headline inflation deflated for the first time in more than four years.
Silver technical analysis
Silver price turns sideways in a range between $30.40-$30.80 for more than one week. The near-term outlook of the Silver price remains firm as the asset holds the breakout of the Falling Channel formation on a four-hour timeframe.
The 100-period Exponential Moving Average (EMA) near $30.50 continues to provide support to the Silver price bulls.
The 14-period Relative Strength Index (RSI) oscillates inside the 40.00-60.00 range, exhibiting indecisiveness among market participants.
Silver four-hour chart
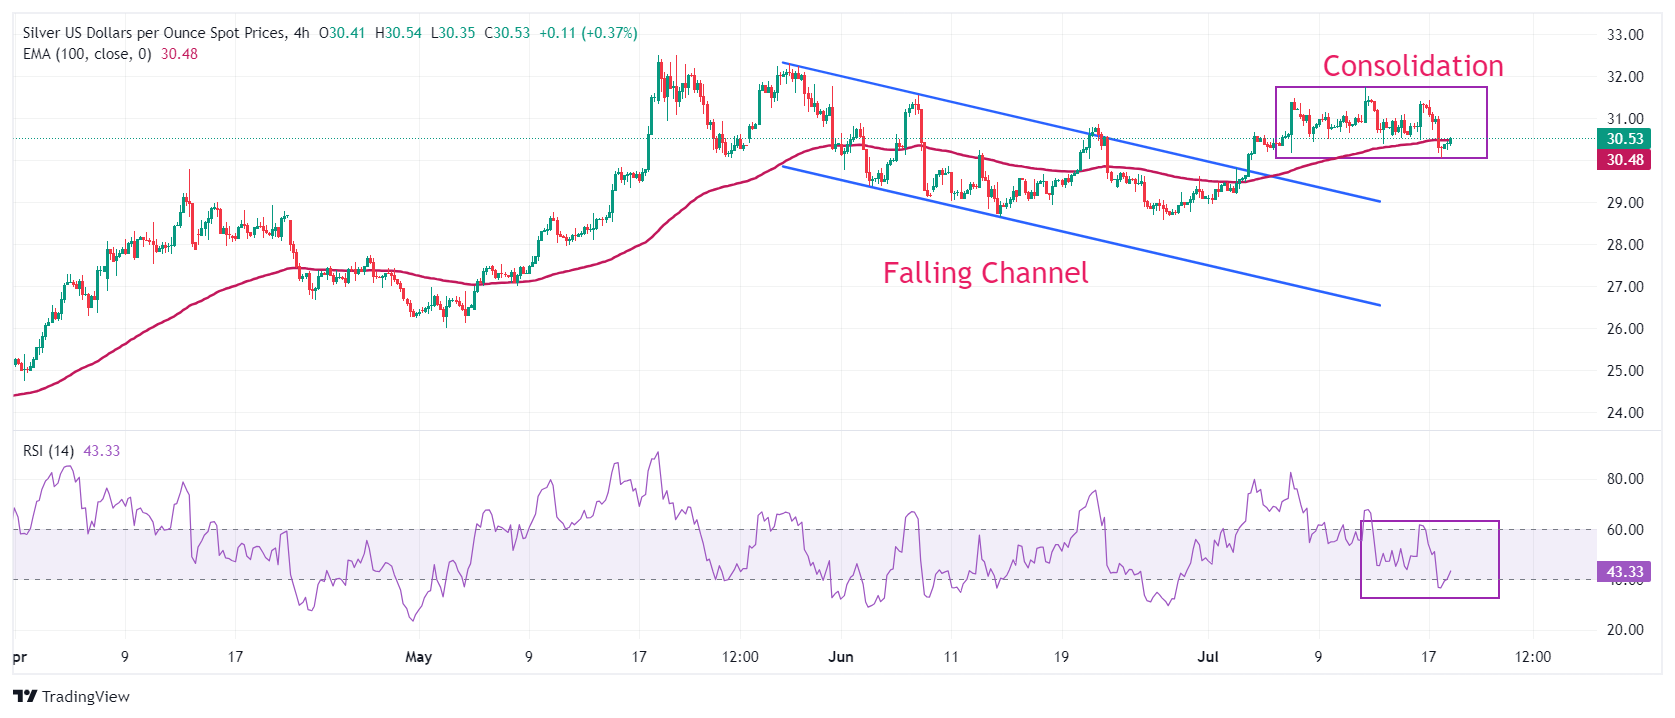
Silver FAQs
Silver is a precious metal highly traded among investors. It has been historically used as a store of value and a medium of exchange. Although less popular than Gold, traders may turn to Silver to diversify their investment portfolio, for its intrinsic value or as a potential hedge during high-inflation periods. Investors can buy physical Silver, in coins or in bars, or trade it through vehicles such as Exchange Traded Funds, which track its price on international markets.
Silver prices can move due to a wide range of factors. Geopolitical instability or fears of a deep recession can make Silver price escalate due to its safe-haven status, although to a lesser extent than Gold's. As a yieldless asset, Silver tends to rise with lower interest rates. Its moves also depend on how the US Dollar (USD) behaves as the asset is priced in dollars (XAG/USD). A strong Dollar tends to keep the price of Silver at bay, whereas a weaker Dollar is likely to propel prices up. Other factors such as investment demand, mining supply – Silver is much more abundant than Gold – and recycling rates can also affect prices.
Silver is widely used in industry, particularly in sectors such as electronics or solar energy, as it has one of the highest electric conductivity of all metals – more than Copper and Gold. A surge in demand can increase prices, while a decline tends to lower them. Dynamics in the US, Chinese and Indian economies can also contribute to price swings: for the US and particularly China, their big industrial sectors use Silver in various processes; in India, consumers’ demand for the precious metal for jewellery also plays a key role in setting prices.
Silver prices tend to follow Gold's moves. When Gold prices rise, Silver typically follows suit, as their status as safe-haven assets is similar. The Gold/Silver ratio, which shows the number of ounces of Silver needed to equal the value of one ounce of Gold, may help to determine the relative valuation between both metals. Some investors may consider a high ratio as an indicator that Silver is undervalued, or Gold is overvalued. On the contrary, a low ratio might suggest that Gold is undervalued relative to Silver.
- The Pound Sterling slides below 1.3000 against the US Dollar as UK Average Earnings decelerated in the three months ending in May.
- UK labor market reports the addition of fresh payrolls against a severe drawdown in the three months ending in April.
- Rising expectations for Fed rate cuts in September have weighed on the US Dollar.
The Pound Sterling (GBP) exhibits a subdued performance against its major peers in Thursday’s London session. The British currency drops as United Kingdom (UK) Average Earnings data, a key measure of wage growth that fuels inflation in the service sector and has been a major barrier to the Bank of England’s (BoE) confidence for interest rate cuts, decelerated as expectedly.
Annual Average Earnings (Including and Excluding bonuses) rose by 5.7% in the three months ending in May, below the 5.9% and 6%, respectively, from the previous month. Though the wage growth momentum slowed, it is still higher than what is needed to be consistent for achieving price stability.
Meanwhile, the Office for National Statistics (ONS) reported that employers hired 19K job-seekers in the three months ending in May, against a drawdown of 140K employees in the previous reading. In the same period, the ILO Unemployment Rate was recorded at 4.4%, remaining in line with estimates and the former release.
Expectations for the BoE to begin reducing interest rates from the August meeting have already diminished due to sticky core Consumer Price Index (CPI) data for June. UK’s core CPI grew steadily by 3.5% due to sticky service inflation data.
Daily digest market movers: Pound Sterling declines moderately against US Dollar
- The Pound Sterling edges lower near the psychological support of 1.3000 against the US Dollar (USD) in Thursday’s European session. The broader appeal of the GBP/USD pair remains firm as the Federal Reserve (Fed) is widely expected to start lowering its key borrowing rates from the September meeting.
- The scenario of higher expectations for Fed rate cuts is unfavorable for the US Dollar (USD). The US Dollar Index (DXY), which tracks the Greenback’s value against six major currencies, hovers near an almost four-month low at around 103.70.
- Firm speculation for Fed rate cuts has been prompted by meaningful signs from June’s Consumer Price Index (CPI) report that the disinflation process has resumed after stalling in the first quarter of the year. Annual headline and core CPI, which excludes volatile food and energy prices, decelerated at a faster-than-expected pace.
- Cooling inflationary pressures have also improved Fed officials’ confidence that price pressures are on track to return to the central bank’s target of 2%. On Wednesday, Richmond Fed Bank President Thomas Barkin cited broadening disinflation as “very encouraged.” Barkin added he is sure policymakers will debate at the July policy meeting whether it is still appropriate to describe inflation as elevated, Reuters reported.
Technical Analysis: Pound Sterling trades above all short-to-long-term EMAs
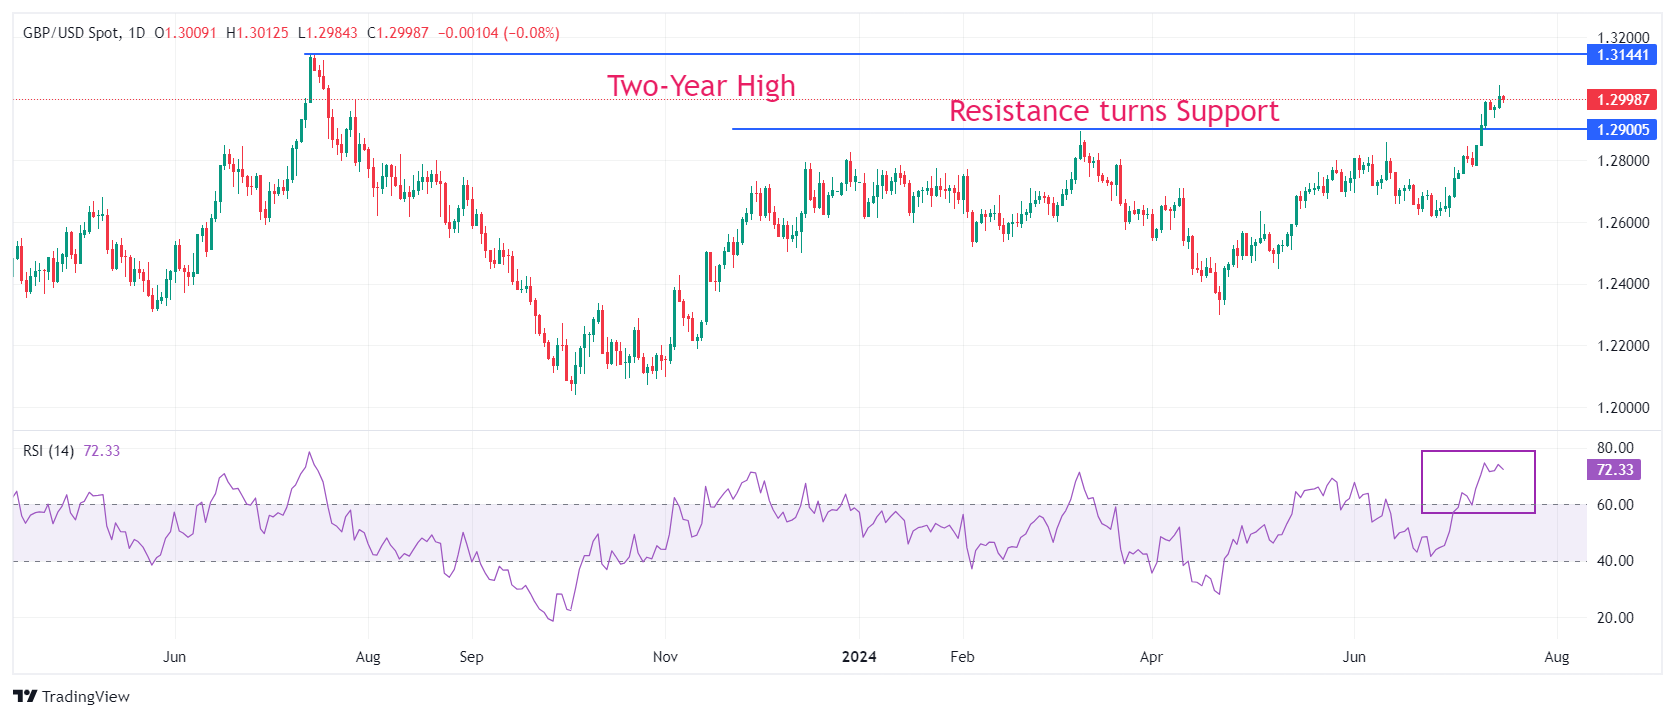
The Pound Sterling drops to near 1.3000 against the US Dollar on a steady decline in the UK wage growth measure. However, the overall trend remains firm as the GBP/USD pair trades close to a fresh two-year high of 1.3044 recorded on Wednesday.
All short-to-long-term Exponential Moving Averages (EMAs) are sloping higher, suggesting a strong bullish trend.
The 14-period Relative Strength Index (RSI) jumps to near 70.00 for the first time in more than a year, indicating strong momentum towards the upside.
The major is expected to extend its upside towards the two-year high near 1.3140. If the GBP/USD pair faces selling pressure after UK data, the March 8 high near 1.2900 will be a key support for the Pound Sterling bulls.
Pound Sterling FAQs
The Pound Sterling (GBP) is the oldest currency in the world (886 AD) and the official currency of the United Kingdom. It is the fourth most traded unit for foreign exchange (FX) in the world, accounting for 12% of all transactions, averaging $630 billion a day, according to 2022 data. Its key trading pairs are GBP/USD, aka ‘Cable’, which accounts for 11% of FX, GBP/JPY, or the ‘Dragon’ as it is known by traders (3%), and EUR/GBP (2%). The Pound Sterling is issued by the Bank of England (BoE).
The single most important factor influencing the value of the Pound Sterling is monetary policy decided by the Bank of England. The BoE bases its decisions on whether it has achieved its primary goal of “price stability” – a steady inflation rate of around 2%. Its primary tool for achieving this is the adjustment of interest rates. When inflation is too high, the BoE will try to rein it in by raising interest rates, making it more expensive for people and businesses to access credit. This is generally positive for GBP, as higher interest rates make the UK a more attractive place for global investors to park their money. When inflation falls too low it is a sign economic growth is slowing. In this scenario, the BoE will consider lowering interest rates to cheapen credit so businesses will borrow more to invest in growth-generating projects.
Data releases gauge the health of the economy and can impact the value of the Pound Sterling. Indicators such as GDP, Manufacturing and Services PMIs, and employment can all influence the direction of the GBP. A strong economy is good for Sterling. Not only does it attract more foreign investment but it may encourage the BoE to put up interest rates, which will directly strengthen GBP. Otherwise, if economic data is weak, the Pound Sterling is likely to fall.
Another significant data release for the Pound Sterling is the Trade Balance. This indicator measures the difference between what a country earns from its exports and what it spends on imports over a given period. If a country produces highly sought-after exports, its currency will benefit purely from the extra demand created from foreign buyers seeking to purchase these goods. Therefore, a positive net Trade Balance strengthens a currency and vice versa for a negative balance.
Here is what you need to know on Thursday, July 18:
The action in foreign exchange markets remain choppy in the early European session on Thursday as markets participants gear up for key events. The European Central Bank (ECB) will announce monetary policy decisions and ECB President Christine Lagarde will speak on the policy outlook in the post-meeting press conference. The US economic docket will feature Philadelphia Fed Manufacturing Survey and weekly Initial Jobless Claims data. Investors will also pay close attention to comments from Federal Reserve (Fed) officials.
US Dollar PRICE This week
The table below shows the percentage change of US Dollar (USD) against listed major currencies this week. US Dollar was the weakest against the Japanese Yen.
| USD | EUR | GBP | JPY | CAD | AUD | NZD | CHF | |
|---|---|---|---|---|---|---|---|---|
| USD | -0.20% | -0.08% | -1.30% | 0.22% | 0.68% | 0.61% | -1.24% | |
| EUR | 0.20% | 0.15% | -0.92% | 0.62% | 0.92% | 1.01% | -0.84% | |
| GBP | 0.08% | -0.15% | -0.97% | 0.46% | 0.76% | 0.81% | -0.99% | |
| JPY | 1.30% | 0.92% | 0.97% | 1.52% | 1.76% | 1.88% | -0.14% | |
| CAD | -0.22% | -0.62% | -0.46% | -1.52% | 0.39% | 0.39% | -1.46% | |
| AUD | -0.68% | -0.92% | -0.76% | -1.76% | -0.39% | 0.09% | -1.74% | |
| NZD | -0.61% | -1.01% | -0.81% | -1.88% | -0.39% | -0.09% | -1.85% | |
| CHF | 1.24% | 0.84% | 0.99% | 0.14% | 1.46% | 1.74% | 1.85% |
The heat map shows percentage changes of major currencies against each other. The base currency is picked from the left column, while the quote currency is picked from the top row. For example, if you pick the US Dollar from the left column and move along the horizontal line to the Japanese Yen, the percentage change displayed in the box will represent USD (base)/JPY (quote).
The US Dollar (USD) came under renewed selling pressure midweek following dovish comments from Fed policymakers. The USD Index lost nearly 0.5% and registered its lowest daily close since late March on Wednesday. Early Thursday, the index holds its ground and fluctuates in a narrow channel above 103.50. The benchmark 10-year US Treasury bond yield stays below 4.2% and US stock index futures trade modestly higher on the day.
During the Asian trading hours, the data from Australia showed that the Unemployment Rate ticked up to 4.1% in June from 4% in May. The Employment Change came in at +50.2K in the same period, with Full-Time Employment rising 43.3K. AUD/USD edged slightly higher following the labor market data and was last seen trading in positive territory near 0.6740.
The UK's Office for National Statistics reported early Thursday that the ILO Unemployment Rate held steady at 4.4% in the three months to May. In the same period, annual wage inflation, as measured by the change in Average Earnings Including Bonus, declined to 5.7% from 6%. After touching a fresh 2024-high of 1.3045 on Wednesday, GBP/USD stays in a consolidation phase and fluctuates at around 1.3000 in the European morning.
USD/JPY fell more than 1% on Wednesday and continued to push lower in the Asian session on Thursday. After touching its weakest level since early June at 155.35, the pair staged a rebound and was last seen trading flat on the day above 156.00. Kazushige Kamiyama, a senior Bank of Japan (BoJ) official and the central bank’s Osaka branch manager, said on Thursday that the BoJ wants to maintain an accommodative monetary environment as much as possible, per Jiji News Agency. Early Friday, National Consumer Price Index data from Japan will be looked upon for fresh impetus.
EUR/USD extended its weekly rally and reached its highest level since mid-March near 1.0950 on Wednesday. The pair stages a downward correction on Thursday and trades modestly lower on the day at around 1.0930. The ECB is widely expected to leave monetary policy settings unchanged following the July meeting.
Gold turned south and closed the day in negative territory on Wednesday after setting a new all-time-high above $2,380. XAU/USD regained its traction early Thursday and climbed above $2,470.
ECB FAQs
The European Central Bank (ECB) in Frankfurt, Germany, is the reserve bank for the Eurozone. The ECB sets interest rates and manages monetary policy for the region. The ECB primary mandate is to maintain price stability, which means keeping inflation at around 2%. Its primary tool for achieving this is by raising or lowering interest rates. Relatively high interest rates will usually result in a stronger Euro and vice versa. The ECB Governing Council makes monetary policy decisions at meetings held eight times a year. Decisions are made by heads of the Eurozone national banks and six permanent members, including the President of the ECB, Christine Lagarde.
In extreme situations, the European Central Bank can enact a policy tool called Quantitative Easing. QE is the process by which the ECB prints Euros and uses them to buy assets – usually government or corporate bonds – from banks and other financial institutions. QE usually results in a weaker Euro. QE is a last resort when simply lowering interest rates is unlikely to achieve the objective of price stability. The ECB used it during the Great Financial Crisis in 2009-11, in 2015 when inflation remained stubbornly low, as well as during the covid pandemic.
Quantitative tightening (QT) is the reverse of QE. It is undertaken after QE when an economic recovery is underway and inflation starts rising. Whilst in QE the European Central Bank (ECB) purchases government and corporate bonds from financial institutions to provide them with liquidity, in QT the ECB stops buying more bonds, and stops reinvesting the principal maturing on the bonds it already holds. It is usually positive (or bullish) for the Euro.
Japan Chief Cabinet Secretary Yoshimasa Hayashi declined to comment on the forex (FX) moves.
Additional comments
Specifics of monetary policy are up to the BoJ to decide.
BoJ monetary policy is not aimed at guiding FX levels.
Closely monitoring FX market.
Market reaction
At the time of writing, USD/JPY is trading just above 156.00, reversing the recovery from the 155.38 lows reached in early Asian hours.
Japanese Yen PRICE Today
The table below shows the percentage change of Japanese Yen (JPY) against listed major currencies today. Japanese Yen was the strongest against the New Zealand Dollar.
| USD | EUR | GBP | JPY | CAD | AUD | NZD | CHF | |
|---|---|---|---|---|---|---|---|---|
| USD | 0.06% | 0.08% | -0.05% | -0.08% | -0.17% | 0.17% | -0.00% | |
| EUR | -0.06% | 0.03% | -0.10% | -0.13% | -0.23% | 0.12% | -0.06% | |
| GBP | -0.08% | -0.03% | -0.14% | -0.16% | -0.26% | 0.10% | -0.08% | |
| JPY | 0.05% | 0.10% | 0.14% | -0.05% | -0.12% | 0.19% | 0.05% | |
| CAD | 0.08% | 0.13% | 0.16% | 0.05% | -0.09% | 0.25% | 0.08% | |
| AUD | 0.17% | 0.23% | 0.26% | 0.12% | 0.09% | 0.35% | 0.20% | |
| NZD | -0.17% | -0.12% | -0.10% | -0.19% | -0.25% | -0.35% | -0.17% | |
| CHF | 0.00% | 0.06% | 0.08% | -0.05% | -0.08% | -0.20% | 0.17% |
The heat map shows percentage changes of major currencies against each other. The base currency is picked from the left column, while the quote currency is picked from the top row. For example, if you pick the Japanese Yen from the left column and move along the horizontal line to the US Dollar, the percentage change displayed in the box will represent JPY (base)/USD (quote).
- The European Central Bank is set to leave key rates unchanged after July policy meeting.
- ECB President Christine Lagarde will be questioned about the possibility of a rate cut in September.
- EUR/USD closes in on fresh 2024 highs ahead of the ECB’s policy announcements.
The European Central Bank (ECB) will announce its monetary policy decisions following the July meeting on Thursday at 12:15 GMT. ECB President Christine Lagarde will deliver a prepared statement on monetary policy and respond to questions at a press conference starting at 12:45 GMT.
What to expect from the European Central Bank interest rate decision?
The ECB lowered key rates by 25 basis points (bp) following the June policy meeting, as expected. With this decision, the interest rate on the main refinancing operations and the interest rates on the marginal lending facility and the deposit facility came down to 4.25%, 4.5%, and 3.75%, respectively. Rates are widely forecast to remain unchanged following the July policy meeting.
In June’s policy statement, the ECB reiterated that it will continue to follow a data-dependent and meeting-by-meeting approach in determining the appropriate level and duration of monetary restriction. The accounts of the meeting showed that some policymakers felt that the data available since the last meeting had not increased their confidence that inflation would converge to the 2% central bank’s target.
Previewing the ECB meeting, Deutsche Bank macro analysts said they expect the Governing Council to leave the policy settings unchanged and explained:
“Our baseline remains two more 25bp cuts in 2024, in September and December. A cut in September is not a done deal. Recent data suggest the ECB staff need to revise the near-term inflation outlook higher.”
Meanwhile, analysts at TD Securities note that markets will focus on whether the ECB softens its tone ahead of an increasingly likely September cut, adding they expect ECB President Lagarde to remain “vague and noncommittal.”
How could the ECB meeting impact EUR/USD?
Heading into the ECB showdown, the Euro preserves its strength, with EUR/USD trading at its highest level since March above 1.0900. The bullish action seen in EUR/USD, however, also seems to be fuelled by the broad-based selling pressure surrounding the US Dollar (USD) following the soft June inflation data, which fed into expectations for a Federal Reserve (Fed) rate cut in September.
ECB President Christine Lagarde is likely to avoid providing a clear response if she is asked about the possibility of another rate cut in September. Unless the policy statement, or Lagarde, pushes back against this expectation, the market positioning suggests that EUR/USD could have a hard time gathering bullish momentum, with investors already fully pricing in a Fed rate cut in September.
On the other hand, the Euro could come under bearish pressure if Lagarde adopts an optimistic tone on the inflation outlook and/or voices concerns over the slowdown in the Eurozone’s economic activity. Markets could see that as a sign pointing to another rate reduction in September and cause EUR/USD to correct lower.
Eren Sengezer, European Session Lead Analyst at FXStreet, offers a brief technical outlook for EUR/USD:
“EUR/USD remains technically bullish in the near term, with the Relative Strength Index (RSI) indicator on the daily chart holding comfortably above 60. On the upside, 1.1000 (psychological level, static level) aligns as the next resistance. In case the pair manages to flip this level into support, it could stretch higher toward 1.1100 and touch a new 2024-high in the process.”
“If EUR/USD retreats below 1.0900 and starts using this level as resistance, technical sellers could show interest. In this scenario, an extended correction toward 1.0800 (100-day, 200-day Simple Moving Averages) could be seen. If this support stays intact, however, buyers could see this retreat as an opportunity to get back into action.”
Interest rates FAQs
Interest rates are charged by financial institutions on loans to borrowers and are paid as interest to savers and depositors. They are influenced by base lending rates, which are set by central banks in response to changes in the economy. Central banks normally have a mandate to ensure price stability, which in most cases means targeting a core inflation rate of around 2%. If inflation falls below target the central bank may cut base lending rates, with a view to stimulating lending and boosting the economy. If inflation rises substantially above 2% it normally results in the central bank raising base lending rates in an attempt to lower inflation.
Higher interest rates generally help strengthen a country’s currency as they make it a more attractive place for global investors to park their money.
Higher interest rates overall weigh on the price of Gold because they increase the opportunity cost of holding Gold instead of investing in an interest-bearing asset or placing cash in the bank. If interest rates are high that usually pushes up the price of the US Dollar (USD), and since Gold is priced in Dollars, this has the effect of lowering the price of Gold.
The Fed funds rate is the overnight rate at which US banks lend to each other. It is the oft-quoted headline rate set by the Federal Reserve at its FOMC meetings. It is set as a range, for example 4.75%-5.00%, though the upper limit (in that case 5.00%) is the quoted figure. Market expectations for future Fed funds rate are tracked by the CME FedWatch tool, which shapes how many financial markets behave in anticipation of future Federal Reserve monetary policy decisions.
- USD/CHF holds positive ground near 0.8840 in Thursday’s early European session.
- Fed’s Waller said that central bank is nearing rate cuts if there are no major surprises in inflation, employment data.
- The rate cuts expectation by the SNB might drag the US Dollar lower.
The USD/CHF pair trades on a positive note around 0.8840, snapping the two-day losing streak on Thursday during the early European trading hours. The modest rebound of the US Dollar (USD) provides some support to the pair. Looking ahead, traders will take more cues from the weekly Initial Jobless Claims and Philly Fed Manufacturing Index.
The recent dovish comments from Federal Reserve (Fed) officials boost bets of a US interest rate cut in September and might cap the upside for Greenback in the near term. Markets are fully pricing in a rate cut of at least 25 basis points (bps) by the Fed in September, according to CME's FedWatch Tool. Fed Governor Christopher Waller said that the US central bank is nearing an interest rate cut as long as there are no major surprises in inflation and employment data. Meanwhile, Richmond Fed President Thomas Barkin stated that easing in inflation has begun to broaden and he would like to see it continue.
Earlier this week, Fed Chair Jerome Powell said recent inflation readings "add somewhat to confidence" that the pace of price increases is on track to meet the Fed's target in a sustainable manner, suggesting a shift to rate cuts is on the horizon.
On the Swiss front, the safe-haven flows amid the political uncertainty and geopolitical tensions might lift the Swiss Franc (CHF) and create a headwind for USD/CHF. However, the expectation that the Swiss National Bank (SNB) could cut further interest rates might weigh on the CHF. Kyle Chapman, FX markets analyst at Ballinger Group said, "I expect the SNB to follow up with a third cut next quarter, and there is potential for a fourth in December if there is still high conviction in the restrictive level of monetary policy. The dovish outlook puts the Franc in a vulnerable position over the coming quarters and could hinder any further recovery, particularly if the ECB takes its time in bringing rates down.”
Swiss Franc FAQs
The Swiss Franc (CHF) is Switzerland’s official currency. It is among the top ten most traded currencies globally, reaching volumes that well exceed the size of the Swiss economy. Its value is determined by the broad market sentiment, the country’s economic health or action taken by the Swiss National Bank (SNB), among other factors. Between 2011 and 2015, the Swiss Franc was pegged to the Euro (EUR). The peg was abruptly removed, resulting in a more than 20% increase in the Franc’s value, causing a turmoil in markets. Even though the peg isn’t in force anymore, CHF fortunes tend to be highly correlated with the Euro ones due to the high dependency of the Swiss economy on the neighboring Eurozone.
The Swiss Franc (CHF) is considered a safe-haven asset, or a currency that investors tend to buy in times of market stress. This is due to the perceived status of Switzerland in the world: a stable economy, a strong export sector, big central bank reserves or a longstanding political stance towards neutrality in global conflicts make the country’s currency a good choice for investors fleeing from risks. Turbulent times are likely to strengthen CHF value against other currencies that are seen as more risky to invest in.
The Swiss National Bank (SNB) meets four times a year – once every quarter, less than other major central banks – to decide on monetary policy. The bank aims for an annual inflation rate of less than 2%. When inflation is above target or forecasted to be above target in the foreseeable future, the bank will attempt to tame price growth by raising its policy rate. Higher interest rates are generally positive for the Swiss Franc (CHF) as they lead to higher yields, making the country a more attractive place for investors. On the contrary, lower interest rates tend to weaken CHF.
Macroeconomic data releases in Switzerland are key to assessing the state of the economy and can impact the Swiss Franc’s (CHF) valuation. The Swiss economy is broadly stable, but any sudden change in economic growth, inflation, current account or the central bank’s currency reserves have the potential to trigger moves in CHF. Generally, high economic growth, low unemployment and high confidence are good for CHF. Conversely, if economic data points to weakening momentum, CHF is likely to depreciate.
As a small and open economy, Switzerland is heavily dependent on the health of the neighboring Eurozone economies. The broader European Union is Switzerland’s main economic partner and a key political ally, so macroeconomic and monetary policy stability in the Eurozone is essential for Switzerland and, thus, for the Swiss Franc (CHF). With such dependency, some models suggest that the correlation between the fortunes of the Euro (EUR) and the CHF is more than 90%, or close to perfect.
- EUR/GBP holds losses after the release of UK employment data on Thursday.
- UK Claimant Count Change, claiming jobless benefits, rose to 32.3K in June, surpassing market expectations of 23.4K.
- ECB could maintain its main refinancing rate at 4.25% at the July meeting scheduled later in the day.
EUR/GBP holds mild losses after following mixed employment figures from the United Kingdom (UK) released on Thursday. The EUR/GBP cross trades around 0.8410 during the Asian session on Thursday.
The UK Claimant Count Change, which measures the number of people claiming jobless benefits, rose to 32.3K in June, surpassing market expectations of 23.4K. The previous month's figure was revised from 50.4K to 51.9K.
The ILO Unemployment Rate held steady at 4.4% in the three months to May, matching the previous period's rate. The market consensus was also for a 4.4% reading.
Meanwhile, the Office for National Statistics reported an Employment Change of 19.0K for the three months to May, indicating an increase in the number of employed persons. The previous reading had shown a decrease of 140K.
On Wednesday, the final UK Consumer Price Index (CPI) inflation figures met expectations, but a larger-than-anticipated decline in UK Producer Price Index (PPI) inflation briefly pushed down the British Pound.
Traders shift their focus on the European Central Bank's (ECB) monetary policy meeting scheduled for later on Thursday. The ECB is expected to maintain its main refinancing rate at 4.25% at July’s meeting scheduled on Thursday.
In June, the central bank cut interest rates for the first time since 2019, following nine months of unchanged rates. Analysts foresee two additional rate cuts later this year, potentially in September and December.
ECB President Christine Lagarde is unlikely to outline a specific path for rate cuts. Instead, Lagarde is expected to highlight the need for more data to ensure confidence in the disinflation process before considering further policy easing.
Economic Indicator
ECB Main Refinancing Operations Rate
One of the three key interest rates set by the European Central Bank (ECB), the main refinancing operations rate is the interest rate the ECB charges to banks for one-week long loans. It is announced by the European Central Bank at its eight scheduled annual meetings. If the ECB expects inflation to rise, it will increase its interest rates to bring it back down to its 2% target. This tends to be bullish for the Euro (EUR), since it attracts more foreign capital inflows. Likewise, if the ECB sees inflation falling it may cut the main refinancing operations rate to encourage banks to borrow and lend more, in the hope of driving economic growth. This tends to weaken the Euro as it reduces its attractiveness as a place for investors to park capital.
Read more.Next release: Thu Jul 18, 2024 12:15
Frequency: Irregular
Consensus: 4.25%
Previous: 4.25%
Source: European Central Bank
Kazushige Kamiyama, a senior Bank of Japan (BoJ) official and the central bank’s Osaka branch manager, said on Thursday that the BoJ wants to maintain an accommodative monetary environment as much as possible, per Jiji News.
The central bank's next policy meeting will be a "very important" one, Kamiyama added.
On Wednesday, Japan's Digital Minister Taro Kono said in an interview with Bloomberg that the BoJ needs to raise rates to support the Japanese Yen, raising fresh caution about the chance of a July rate hike.
Market reaction
The Japanese Yen pays little heed to these above dovish comments, leaving USD/JPY gyrating at around 156.30, as of writing. The pair is adding 0.07% on the day.
Japanese Yen FAQs
The Japanese Yen (JPY) is one of the world’s most traded currencies. Its value is broadly determined by the performance of the Japanese economy, but more specifically by the Bank of Japan’s policy, the differential between Japanese and US bond yields, or risk sentiment among traders, among other factors.
One of the Bank of Japan’s mandates is currency control, so its moves are key for the Yen. The BoJ has directly intervened in currency markets sometimes, generally to lower the value of the Yen, although it refrains from doing it often due to political concerns of its main trading partners. The current BoJ ultra-loose monetary policy, based on massive stimulus to the economy, has caused the Yen to depreciate against its main currency peers. This process has exacerbated more recently due to an increasing policy divergence between the Bank of Japan and other main central banks, which have opted to increase interest rates sharply to fight decades-high levels of inflation.
The BoJ’s stance of sticking to ultra-loose monetary policy has led to a widening policy divergence with other central banks, particularly with the US Federal Reserve. This supports a widening of the differential between the 10-year US and Japanese bonds, which favors the US Dollar against the Japanese Yen.
The Japanese Yen is often seen as a safe-haven investment. This means that in times of market stress, investors are more likely to put their money in the Japanese currency due to its supposed reliability and stability. Turbulent times are likely to strengthen the Yen’s value against other currencies seen as more risky to invest in.
- The UK Unemployment Rate held steady at 4.4% in three months to May.
- The Claimant Count Change for Britain arrived at 32.3K in June.
- GBP/USD trades near 1.3000 after mixed UK employment data.
The United Kingdom’s (UK) ILO Unemployment Rate held steady at 4.4% in the three months to May after reporting 4.4% in the previous period, according to data published by the Office for National Statistics (ONS) on Thursday. The market consensus was for a 4.4% reading.
Additional details of the report showed that the number of people claiming jobless benefits increased by 32.3K in June, compared with a revised gain of 51.9K in May, missing the expected 23.4K print.
The Employment Change data for May came in at 19K, compared to April’s -140K.
Meanwhile, Average Earnings excluding Bonus in the UK rose 5.7% 3M YoY in May versus a 6.0 % growth registered in April. The reading matched the expectations of a 5.7% increment.
Another measure of wage inflation, Average Earnings including Bonus also increased by 5.7% in the same period, having accelerated 5.9% quarter through April and aligned with the expected raise of 5.7%.
GBP/USD reaction to the UK employment report
GBP/USD sees a little reaction to the mixed UK employment data. The pair is trading flat on the day at 1.3000, as of writing.
British Pound PRICE Today
The table below shows the percentage change of British Pound (GBP) against listed major currencies today. British Pound was the strongest against the New Zealand Dollar.
| USD | EUR | GBP | JPY | CAD | AUD | NZD | CHF | |
|---|---|---|---|---|---|---|---|---|
| USD | 0.03% | 0.00% | -0.05% | -0.01% | -0.10% | 0.17% | 0.09% | |
| EUR | -0.03% | -0.03% | -0.09% | -0.05% | -0.14% | 0.12% | 0.02% | |
| GBP | -0.01% | 0.03% | -0.06% | -0.05% | -0.11% | 0.16% | 0.07% | |
| JPY | 0.05% | 0.09% | 0.06% | 0.02% | -0.05% | 0.18% | 0.12% | |
| CAD | 0.01% | 0.05% | 0.05% | -0.02% | -0.08% | 0.17% | 0.09% | |
| AUD | 0.10% | 0.14% | 0.11% | 0.05% | 0.08% | 0.27% | 0.20% | |
| NZD | -0.17% | -0.12% | -0.16% | -0.18% | -0.17% | -0.27% | -0.09% | |
| CHF | -0.09% | -0.02% | -0.07% | -0.12% | -0.09% | -0.20% | 0.09% |
The heat map shows percentage changes of major currencies against each other. The base currency is picked from the left column, while the quote currency is picked from the top row. For example, if you pick the British Pound from the left column and move along the horizontal line to the US Dollar, the percentage change displayed in the box will represent GBP (base)/USD (quote).
- EUR/USD trades in a tight range around 1.0950 with ECB policy meeting in focus.
- The ECB may not announce subsequent rate cuts.
- Firm Fed rate-cut prospects have weighed on the US Dollar.
EUR/USD turns sideways in Thursday’s European session after rallying to a fresh four-month high at around 1.0950 on Wednesday. The major currency pair is expected to remain quiet as investors shift to the sidelines ahead of the European Central Bank (ECB) policy meeting, which will be announced at 12:15 GMT.
The ECB is expected to leave its key rates unchanged this time as officials have been refraining from committing a pre-defined rate-cut path amid concerns over sticky inflation in the service sector, which could reverse the disinflation process. Therefore, investors will look for cues about when the ECB cuts interest rates further.
ECB President Christine Lagarde may not provide a specified rate-cut path and will emphasize the need for more data to gain confidence that the disinflation process will not stall before loosening policy further.
The ECB delivered its first rate cut in June after maintaining a restrictive interest rate framework for two years to tame hot inflationary pressures driven by coronavirus-pandemic-led stimulus. The reasoning behind unwinding the tight policy stance was the firm confidence of officials that risks to inflation and the economy are finely balanced and price pressures will return to the desired rate of 2%.
Currently, financial markets expect that the ECB will deliver two more rate cuts this year. The ECB is also expected to deliver its next rate-cut move in September.
Daily Digest Marlet Movers: EUR/USD juggles while US Dollar remains on back foot
- EUR/USD consolidates around 1.0950 ahead of the ECB policy outcome. The near-term outlook of the shared currency pair remains firm as the US Dollar (USD) remains vulnerable. The US Dollar Index (DXY), which tracks the Greenback’s value against six major currencies, seems fragile near a more than three-month low at 103.70.
- The US Dollar could see more downside amid firm speculation that the Federal Reserve (Fed) will start reducing interest rates from the September meeting. Upbeat expectations for Fed rate cuts have been prompted by easing price pressures and cooling labor market conditions. June’s Consumer Price Index (CPI) report showed that annual headline and core inflationary pressures decelerated at a faster-than-expected pace.
- Fed’s Beige Book, released on Wednesday, showed that firms witnessed moderate growth and slower labor demand from late May through early July. Recent employment data also showed that the Unemployment Rate rose to 4.1%, the highest since December 2021.
- Meanwhile, recent inflation figures have also boosted confidence of policymakers that inflation will return to the path of 2% target. On Wednesday, Fed Governor Christopher Waller communicated confidence over moderation in job market and inflation. When asked about rate cuts, Waller said, “I do believe we are getting closer to the time when a cut in the policy rate is warranted," Reuters reported.
Technical Analysis: EUR/USD stays inside Wednesday’s trading range
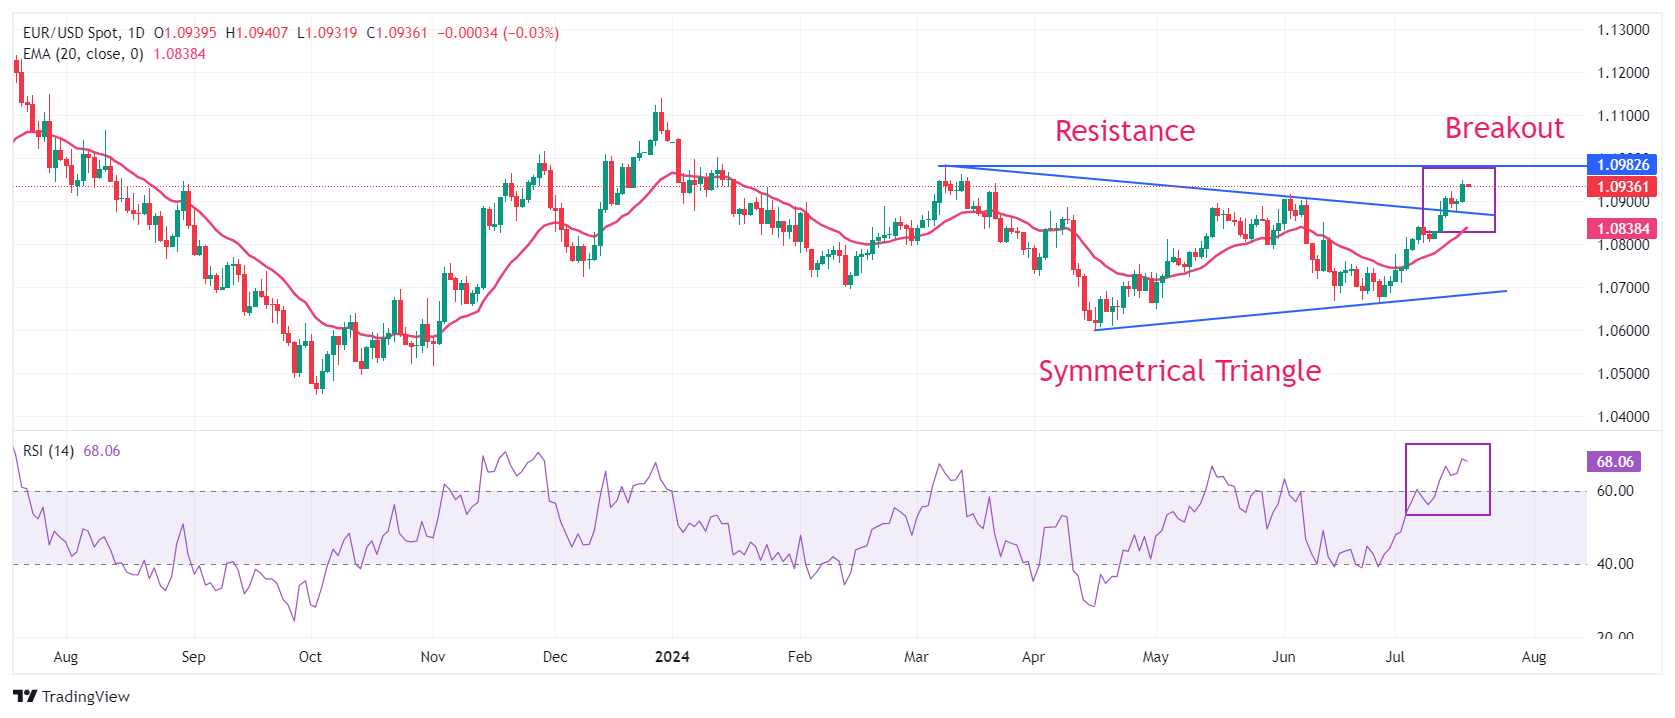
EUR/USD trades sideways around 1.0950, inside Wednesday’s trading range ahead of the ECB policy meeting. The major currency pair remains firm after a breakout of the Symmetrical Triangle formation on a daily timeframe. A breakout of the above-mentioned chart pattern results in wider ticks and heavy volume.
The near-term outlook of the major currency pair is bullish as the 20-day Exponential Moving Average (EMA) near 1.0816 is sloping higher.
The 14-day Relative Strength Index (RSI) shifts into the bullish range of 60.00-80.00, suggesting a strong upside momentum.
The shared currency pair is expected to extend its upside towards March 8 high near 1.0980. On the contrary, a downside move below the round-level support of 1.0800 could weaken the pair.
Euro FAQs
The Euro is the currency for the 20 European Union countries that belong to the Eurozone. It is the second most heavily traded currency in the world behind the US Dollar. In 2022, it accounted for 31% of all foreign exchange transactions, with an average daily turnover of over $2.2 trillion a day. EUR/USD is the most heavily traded currency pair in the world, accounting for an estimated 30% off all transactions, followed by EUR/JPY (4%), EUR/GBP (3%) and EUR/AUD (2%).
The European Central Bank (ECB) in Frankfurt, Germany, is the reserve bank for the Eurozone. The ECB sets interest rates and manages monetary policy. The ECB’s primary mandate is to maintain price stability, which means either controlling inflation or stimulating growth. Its primary tool is the raising or lowering of interest rates. Relatively high interest rates – or the expectation of higher rates – will usually benefit the Euro and vice versa. The ECB Governing Council makes monetary policy decisions at meetings held eight times a year. Decisions are made by heads of the Eurozone national banks and six permanent members, including the President of the ECB, Christine Lagarde.
Eurozone inflation data, measured by the Harmonized Index of Consumer Prices (HICP), is an important econometric for the Euro. If inflation rises more than expected, especially if above the ECB’s 2% target, it obliges the ECB to raise interest rates to bring it back under control. Relatively high interest rates compared to its counterparts will usually benefit the Euro, as it makes the region more attractive as a place for global investors to park their money.
Data releases gauge the health of the economy and can impact on the Euro. Indicators such as GDP, Manufacturing and Services PMIs, employment, and consumer sentiment surveys can all influence the direction of the single currency. A strong economy is good for the Euro. Not only does it attract more foreign investment but it may encourage the ECB to put up interest rates, which will directly strengthen the Euro. Otherwise, if economic data is weak, the Euro is likely to fall. Economic data for the four largest economies in the euro area (Germany, France, Italy and Spain) are especially significant, as they account for 75% of the Eurozone’s economy.
Another significant data release for the Euro is the Trade Balance. This indicator measures the difference between what a country earns from its exports and what it spends on imports over a given period. If a country produces highly sought after exports then its currency will gain in value purely from the extra demand created from foreign buyers seeking to purchase these goods. Therefore, a positive net Trade Balance strengthens a currency and vice versa for a negative balance.
Gold prices rose in India on Thursday, according to data compiled by FXStreet.
The price for Gold stood at 6,636.30 Indian Rupees (INR) per gram, up compared with the INR 6,608.96 it cost on Wednesday.
The price for Gold increased to INR 77,404.45 per tola from INR 77,085.63 per tola a day earlier.
| Unit measure | Gold Price in INR |
|---|---|
| 1 Gram | 6,636.30 |
| 10 Grams | 66,362.95 |
| Tola | 77,404.45 |
| Troy Ounce | 206,412.00 |
FXStreet calculates Gold prices in India by adapting international prices (USD/INR) to the local currency and measurement units. Prices are updated daily based on the market rates taken at the time of publication. Prices are just for reference and local rates could diverge slightly.
Gold FAQs
Gold has played a key role in human’s history as it has been widely used as a store of value and medium of exchange. Currently, apart from its shine and usage for jewelry, the precious metal is widely seen as a safe-haven asset, meaning that it is considered a good investment during turbulent times. Gold is also widely seen as a hedge against inflation and against depreciating currencies as it doesn’t rely on any specific issuer or government.
Central banks are the biggest Gold holders. In their aim to support their currencies in turbulent times, central banks tend to diversify their reserves and buy Gold to improve the perceived strength of the economy and the currency. High Gold reserves can be a source of trust for a country’s solvency. Central banks added 1,136 tonnes of Gold worth around $70 billion to their reserves in 2022, according to data from the World Gold Council. This is the highest yearly purchase since records began. Central banks from emerging economies such as China, India and Turkey are quickly increasing their Gold reserves.
Gold has an inverse correlation with the US Dollar and US Treasuries, which are both major reserve and safe-haven assets. When the Dollar depreciates, Gold tends to rise, enabling investors and central banks to diversify their assets in turbulent times. Gold is also inversely correlated with risk assets. A rally in the stock market tends to weaken Gold price, while sell-offs in riskier markets tend to favor the precious metal.
The price can move due to a wide range of factors. Geopolitical instability or fears of a deep recession can quickly make Gold price escalate due to its safe-haven status. As a yield-less asset, Gold tends to rise with lower interest rates, while higher cost of money usually weighs down on the yellow metal. Still, most moves depend on how the US Dollar (USD) behaves as the asset is priced in dollars (XAU/USD). A strong Dollar tends to keep the price of Gold controlled, whereas a weaker Dollar is likely to push Gold prices up.
(An automation tool was used in creating this post.)
FX option expiries for July 18 NY cut at 10:00 Eastern Time, via DTCC, can be found below.
EUR/USD: EUR amounts
- 1.0775 614m
- 1.0800 716m
- 1.0880 1.4b
- 1.0895 1.8b
- 1.0900 1b
- 1.0915 1b
- 1.0920 524m
- 1.0925 865m
- 1.0950 999m
- 1.1000 751m
GBP/USD: GBP amounts
- 1.2925 575m
- 1.2975 925m
- 1.2980 616m
- 1.3000 403m
USD/JPY: USD amounts
- 156.95 1b
- 157.00 884m
- 158.00 3.7b
- 158.35 650m
- 158.50 539m
- 159.00 1.1b
- 159.30 510m
- 159.50 854m
AUD/USD: AUD amounts
- 0.6654 520m
- 0.6735 428m
- 0.6800 1.1b
USD/CAD: USD amounts
- 1.3550 1.1b
- 1.3730 514m
NZD/USD: NZD amounts
- 0.6040 500m
EUR/GBP: EUR amounts
- 0.8375 936m
- 0.8400 510m
- EUR/JPY resists at 171.00 level followed by the 23.6% Fibonacci retracement at 171.29 level.
- The cross lies below 9-day EMA, indicating to refrain from buying until the trend shows signs of reversal.
- A break below the 170.00 level could lead the cross to revisit June’s low at 167.52 level.
EUR/JPY edges higher to near 170.90 during the Asian session on Thursday. The daily chart analysis shows that the pair lies below its 9-day Exponential Moving Average (EMA), suggesting downward momentum in the short term. This signals that it may be prudent to hold off on buying until the trend shows signs of reversal.
Moreover, the 14-day Relative Strength Index (RSI), a momentum indicator, is below the 50 level, suggesting a confirmation of a bearish bias for the EUR/JPY cross.
The EUR/JPY cross is likely to test the immediate resistance at the psychological level of 171.00, followed by the 23.6% Fibonacci retracement level at 171.29, positioned between the coordinates of 175.43 and 170.01 levels.
Further barrier appears at the 14-day Exponential Moving Average (EMA) at 172.36 level. A breakthrough above this level could lead the EUR/JPY cross to approach the record high of 175.43 level recorded on July 11.
On the downside, the psychological level of 170.00 could act as immediate support. A break below this level could exert downward pressure on the EUR/JPY cross to navigate the area around June’s low at 167.52 level.
EUR/JPY: Daily Chart
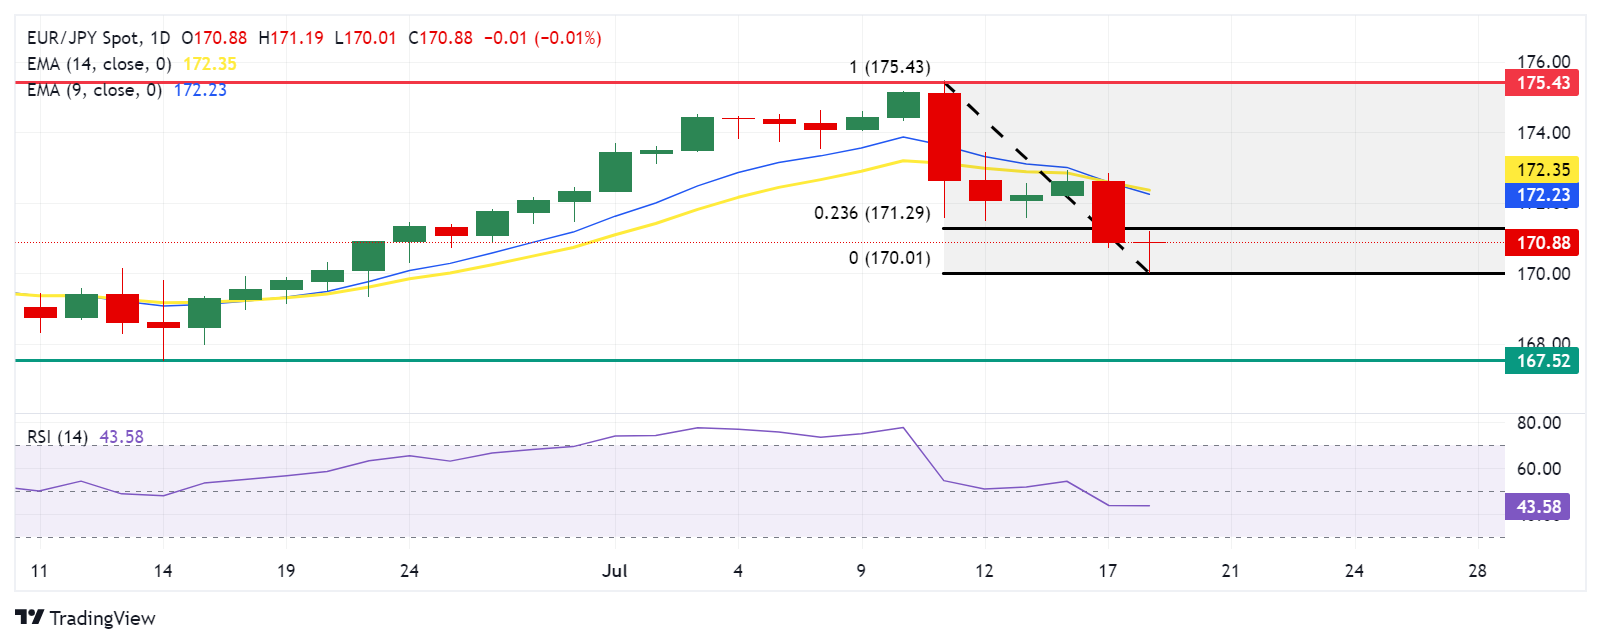
Euro PRICE Today
The table below shows the percentage change of Euro (EUR) against listed major currencies today. Euro was the strongest against the Swiss Franc.
| USD | EUR | GBP | JPY | CAD | AUD | NZD | CHF | |
|---|---|---|---|---|---|---|---|---|
| USD | 0.04% | 0.02% | 0.06% | -0.02% | -0.13% | 0.11% | 0.12% | |
| EUR | -0.04% | -0.02% | 0.02% | -0.06% | -0.18% | 0.07% | 0.08% | |
| GBP | -0.02% | 0.02% | 0.04% | -0.05% | -0.14% | 0.11% | 0.10% | |
| JPY | -0.06% | -0.02% | -0.04% | -0.09% | -0.19% | 0.03% | 0.06% | |
| CAD | 0.02% | 0.06% | 0.05% | 0.09% | -0.11% | 0.14% | 0.14% | |
| AUD | 0.13% | 0.18% | 0.14% | 0.19% | 0.11% | 0.26% | 0.28% | |
| NZD | -0.11% | -0.07% | -0.11% | -0.03% | -0.14% | -0.26% | -0.00% | |
| CHF | -0.12% | -0.08% | -0.10% | -0.06% | -0.14% | -0.28% | 0.00% |
The heat map shows percentage changes of major currencies against each other. The base currency is picked from the left column, while the quote currency is picked from the top row. For example, if you pick the Euro from the left column and move along the horizontal line to the US Dollar, the percentage change displayed in the box will represent EUR (base)/USD (quote).
- EUR/USD weakens near 1.0935 in Thursday’s early European session.
- The ECB is anticipated to maintain rates steady at its July meeting on Thursday.
- Fed officials said the central bank is ‘getting closer’ to the first rate cut amid signs of cooling inflation.
The EUR/USD pair trades on a weaker note around 1.0935, snapping a two-day winning streak during the early European session on Thursday. The Greenback edges higher as traders turn cautious ahead of the European Central Bank's (ECB) monetary policy meeting later in the day. On the US docket, the weekly Initial Jobless Claims and Philly Fed Manufacturing Index will be released.
The ECB is expected to leave interest rates unchanged at its July meeting, awaiting further evidence of progress on inflation before adding to June’s initial cut. Market players see another rate cut in September, with futures markets showing nearly 80% odds of a rate cut. “President Lagarde’s remarks should leave the door open to a rate cut in September, albeit with softer signaling than that which preceded the June cut.” Said Bill Diviney, senior economist Eurozone at ABN Amro.
Across the pond, traders raise their bets for more aggressive rate cuts from the Fed amid signs that inflation is cooling toward the US central bank’s target. On Wednesday, Fed Governor Christopher Waller said that the central bank is ‘getting closer’ to an interest rate cut as inflation's improved trajectory and the labor market are in better balance. Meanwhile, Richmond Fed President Thomas noted that he is "very encouraged" that easing in inflation has begun to broaden and he would like to see it continue.” The dovish comments from Fed officials are likely to exert some selling pressure on the US Dollar (USD) and cap the pair’s downside.
Euro FAQs
The Euro is the currency for the 20 European Union countries that belong to the Eurozone. It is the second most heavily traded currency in the world behind the US Dollar. In 2022, it accounted for 31% of all foreign exchange transactions, with an average daily turnover of over $2.2 trillion a day. EUR/USD is the most heavily traded currency pair in the world, accounting for an estimated 30% off all transactions, followed by EUR/JPY (4%), EUR/GBP (3%) and EUR/AUD (2%).
The European Central Bank (ECB) in Frankfurt, Germany, is the reserve bank for the Eurozone. The ECB sets interest rates and manages monetary policy. The ECB’s primary mandate is to maintain price stability, which means either controlling inflation or stimulating growth. Its primary tool is the raising or lowering of interest rates. Relatively high interest rates – or the expectation of higher rates – will usually benefit the Euro and vice versa. The ECB Governing Council makes monetary policy decisions at meetings held eight times a year. Decisions are made by heads of the Eurozone national banks and six permanent members, including the President of the ECB, Christine Lagarde.
Eurozone inflation data, measured by the Harmonized Index of Consumer Prices (HICP), is an important econometric for the Euro. If inflation rises more than expected, especially if above the ECB’s 2% target, it obliges the ECB to raise interest rates to bring it back under control. Relatively high interest rates compared to its counterparts will usually benefit the Euro, as it makes the region more attractive as a place for global investors to park their money.
Data releases gauge the health of the economy and can impact on the Euro. Indicators such as GDP, Manufacturing and Services PMIs, employment, and consumer sentiment surveys can all influence the direction of the single currency. A strong economy is good for the Euro. Not only does it attract more foreign investment but it may encourage the ECB to put up interest rates, which will directly strengthen the Euro. Otherwise, if economic data is weak, the Euro is likely to fall. Economic data for the four largest economies in the euro area (Germany, France, Italy and Spain) are especially significant, as they account for 75% of the Eurozone’s economy.
Another significant data release for the Euro is the Trade Balance. This indicator measures the difference between what a country earns from its exports and what it spends on imports over a given period. If a country produces highly sought after exports then its currency will gain in value purely from the extra demand created from foreign buyers seeking to purchase these goods. Therefore, a positive net Trade Balance strengthens a currency and vice versa for a negative balance.
- GBP/JPY rebounds swiftly from over a three-week low touched earlier this Thursday.
- The emergence of fresh selling around the Japanese Yen lends support to the cross.
- Reduced BoE rate cut bets contribute to the intraday recovery of nearly 100 pips.
The GBP/JPY cross stages a solid intraday recovery from over a three-week low touched during the Asian session on Thursday and climbs back above the 203.00 round-figure mark in the last hour. Spot prices currently trade with modest intraday gains, around the 203.30-203.35 region and for now, seem to have stalled the recent pullback from the highest level since August 2008.
The initial market reaction to speculation that Japanese authorities might have stepped into the FX market to boost the domestic currency fades rather quickly in the absence of any concrete evidence of intervention. This, along with rather unimpressive trade balance data from Japan and the underlying bullish sentiment across the global equity markets, undermines the Japanese Yen (JPY) and prompts some short-covering around the GBP/JPY cross.
The official report showed that Japan's Trade Balance swung to a surplus of ¥224 billion as against the expected deficit of ¥240 billion and a ¥1.22 trillion deficit in the previous month. Additional details, however, revealed that Japan’s exports and imports grew less than expected in June as local economic activity remained subdued and overseas demand also turned sluggish. This might force the Bank of Japan (BoJ) to refrain from raising interest rates.
The British Pound (GBP), on the other hand, is underpinned by reduced bets for an interest rate cut by the Bank of England (BoE). The expectations were lifted by the UK consumer inflation figures released on Wednesday, which rose slightly more than expected, by a 2% YoY rate in June. This comes on the back of a better-than-expected GDP growth of 0.4% in May, which continues to benefit the GBP and provides an additional lift to the GBP/JPY cross.
It, however, remains to be seen if bulls can capitalize on the intraday move up amid speculations that Japanese authorities might intervene to prop up the JPY. Market participants might also prefer to wait for the release of the UK employment figures before placing directional bets. Hence, a strong follow-through buying is needed to support prospects for additional gains.
Economic Indicator
Employment Change (3M)
Employment Change released by the UK Office for National Statistics represents the change in the number of people who were employed in the UK in the three months to the release period. Generally, a healthy and consistent increase of this figure is seen as bullish for the Pound Sterling (GBP), while a decrease is seen as bearish.
Read more.Next release: Thu Jul 18, 2024 06:00
Frequency: Monthly
Consensus: -
Previous: -140K
Source: Office for National Statistics
- Gold price appreciates due to the high likelihood of a rate-cut decision by the Fed in September.
- Fed Governor Christopher Waller stated that the central bank is ‘getting closer’ to an interest rate cut.
- Gold may limit its upside as US Treasury yields rebound.
Gold price (XAU/USD) edges higher to near $2,470 per troy ounce on Thursday, remaining close to record highs amid growing optimism that the Federal Reserve (Fed) will reduce rates in September. Lower interest rates make non-yielding assets like Gold more attractive to investors.
Federal Reserve officials have expressed increasing confidence that the pace of price increases is now more consistently aligning with policymakers' goals. On Wednesday, Fed Governor Christopher Waller said that the US central bank is ‘getting closer’ to an interest rate cut. Meanwhile, Richmond Fed President Thomas Barkin stated that easing in inflation had begun to broaden and he would like to see it continue,” per Reuters.
According to CME Group’s FedWatch Tool, markets now indicate a 93.5% probability of a 25-basis point rate cut at the September Fed meeting, up from 69.7% a week earlier.
The US Dollar Index (DXY), which measures the value of the US Dollar (USD) against the six other major currencies, rebounds due to improved US Treasury yields. The DXY trades around 103.80, with yields on 2-year and 10-year US Treasury bonds standing at 4.45% and 4.17%, respectively, at the time of writing. This scenario may limit the upside of the Gold prices.
Daily Digest Market Movers: Gold edges higher due to dovish sentiment surrounding the Fed
- The New York Times reported on Wednesday that former President Donald Trump, in a meeting with House Republicans last month, expressed support for tax reductions, lower interest rates, and increased tariffs. These measures could potentially be inflationary for the economy and weaken the Greenback, which may, in turn, boost the demand for dollar-denominated Gold.
- During an interview with Bloomberg News on Tuesday, Donald Trump cautioned Fed Chair Jerome Powell against cutting US interest rates before November’s presidential vote. However, Trump also indicated that if re-elected, he would allow Powell to complete his term if he continued to "do the right thing" at the Federal Reserve.
- On Tuesday, Federal Reserve (Fed) Board of Governors member Dr. Adriana Kugler acknowledged that inflationary pressures have eased but emphasized that the Fed still needs additional data to justify a rate cut. Kugler indicated that if upcoming data does not confirm that inflation is moving toward the 2% target, it may be appropriate to maintain current rates for a while longer, per Reuters.
- The US Retail Sales for June stayed mostly in line with expectations. Retail Sales in the United States held steady at $704.3 billion in June, after a 0.3% gain (revised from 0.1%) in May, and are in line with market expectations.
- Fed Chair Jerome Powell mentioned on Monday that the three US inflation readings of this year "add somewhat to confidence" that inflation is on course to meet the Fed’s target sustainably, suggesting that a shift to interest rate cuts may not be far off.
Technical Analysis: XAU/USD aspires toward $2,500
Gold price trades around $2,470 on Thursday. The daily chart analysis shows that the XAU/USD pair consolidates within an ascending channel, indicating a bullish bias. However, the 14-day Relative Strength Index (RSI) is positioned slightly below the 70 level, suggesting a confirmation of a bullish trend but also indicating an overbought situation of the asset. A correction can be expected in the short term.
The XAU/USD pair tests the upper boundary of the ascending channel around the $2,470 level. A breakthrough above this level could lead the pair to test the psychological level of $2,500.
On the downside, the nine-day Exponential Moving Average (EMA) at the $2,424 level could act as immediate support, followed by the lower boundary of the ascending channel at the $2,410 level. A break below the latter could exert downward pressure on the XAU/USD pair to navigate the area around the throwback support of the $2,290 level.
XAU/USD: Daily Chart
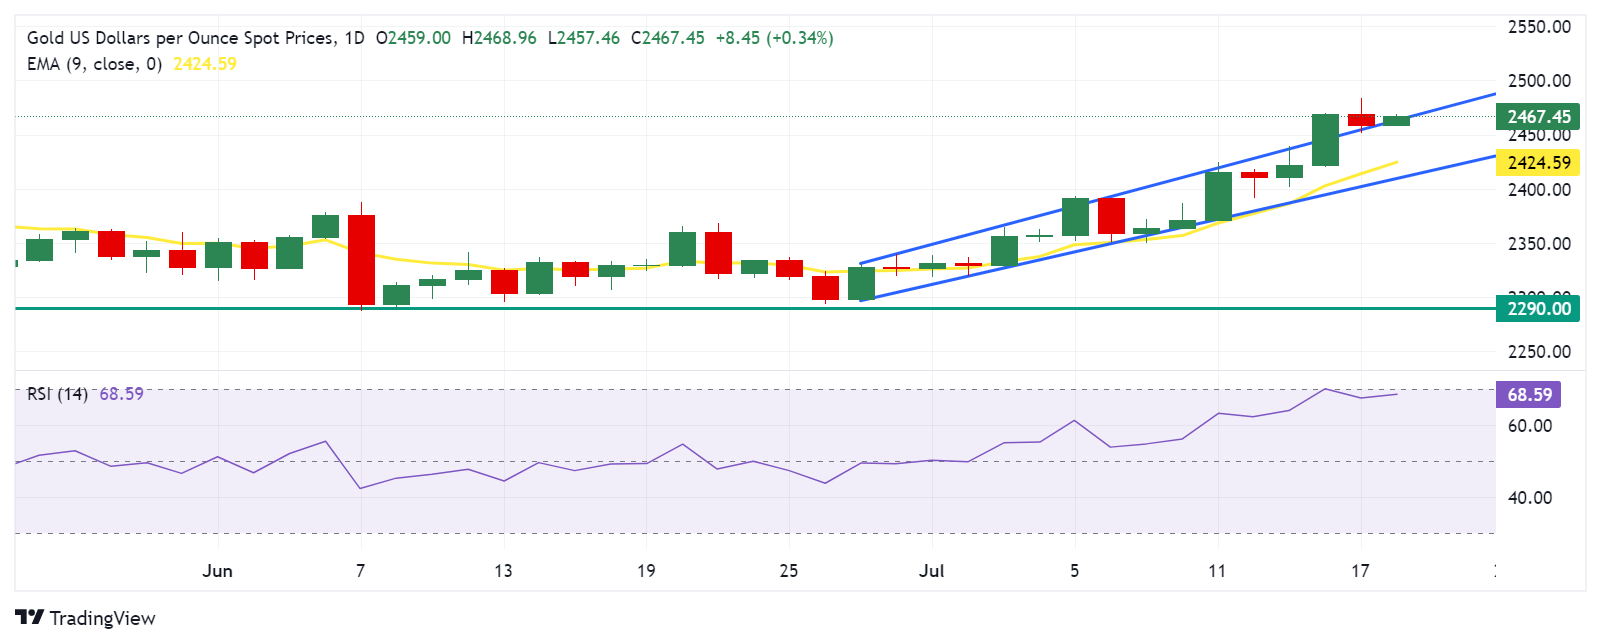
Gold FAQs
Gold has played a key role in human’s history as it has been widely used as a store of value and medium of exchange. Currently, apart from its shine and usage for jewelry, the precious metal is widely seen as a safe-haven asset, meaning that it is considered a good investment during turbulent times. Gold is also widely seen as a hedge against inflation and against depreciating currencies as it doesn’t rely on any specific issuer or government.
Central banks are the biggest Gold holders. In their aim to support their currencies in turbulent times, central banks tend to diversify their reserves and buy Gold to improve the perceived strength of the economy and the currency. High Gold reserves can be a source of trust for a country’s solvency. Central banks added 1,136 tonnes of Gold worth around $70 billion to their reserves in 2022, according to data from the World Gold Council. This is the highest yearly purchase since records began. Central banks from emerging economies such as China, India and Turkey are quickly increasing their Gold reserves.
Gold has an inverse correlation with the US Dollar and US Treasuries, which are both major reserve and safe-haven assets. When the Dollar depreciates, Gold tends to rise, enabling investors and central banks to diversify their assets in turbulent times. Gold is also inversely correlated with risk assets. A rally in the stock market tends to weaken Gold price, while sell-offs in riskier markets tend to favor the precious metal.
The price can move due to a wide range of factors. Geopolitical instability or fears of a deep recession can quickly make Gold price escalate due to its safe-haven status. As a yield-less asset, Gold tends to rise with lower interest rates, while higher cost of money usually weighs down on the yellow metal. Still, most moves depend on how the US Dollar (USD) behaves as the asset is priced in dollars (XAU/USD). A strong Dollar tends to keep the price of Gold controlled, whereas a weaker Dollar is likely to push Gold prices up.
- Silver attracts some buyers during the Asian session on Thursday, albeit lacks follow-through.
- The overnight sustained breakdown through a short-term trading range favors bearish traders.
- Any subsequent move-up could attract fresh sellers and remain capped near the $31.00 mark.
Silver (XAG/USD) ticks higher during the Asian session on Thursday and moves away from a two-week low, around the $30.00 psychological mark touched the previous day. The white metal currently trades around the $30.40 region, up nearly 0.35% for the day, though lacks bullish conviction.
From a technical perspective, the recent failure to build on the momentum beyond the $31.40 supply zone and the overnight breakdown through a short-term trading range support could be seen as a fresh trigger for bearish traders. That said, neutral oscillators on the daily chart warrant caution and make it prudent to wait for some follow-through selling below the $30.00 mark before positioning for any further depreciating move.
The XAG/USD might then weaken further below the $29.70 horizontal zone and test the next relevant support near the $29.15 region. This is closely followed by the $29.00 mark, which if broken decisively will expose the June monthly swing low, around the $28.60-$28.55 area. The white metal could eventually drop to the 100-day Simple Moving Average (SMA), currently pegged near the $28.00 round-figure mark.
On the flip side, any subsequent move up is likely to confront stiff resistance ahead of the $31.00 mark. A sustained strength beyond has the potential to lift the XAG/USD back towards the $31.40 supply zone. Some follow-through buying, leading to a subsequent move beyond the monthly peak, around the $31.80 area, should allow bulls to retake the $32.00 mark and challenge the YTD peak, near the mid-$32.00s touched in May.
Silver 4-hour chart
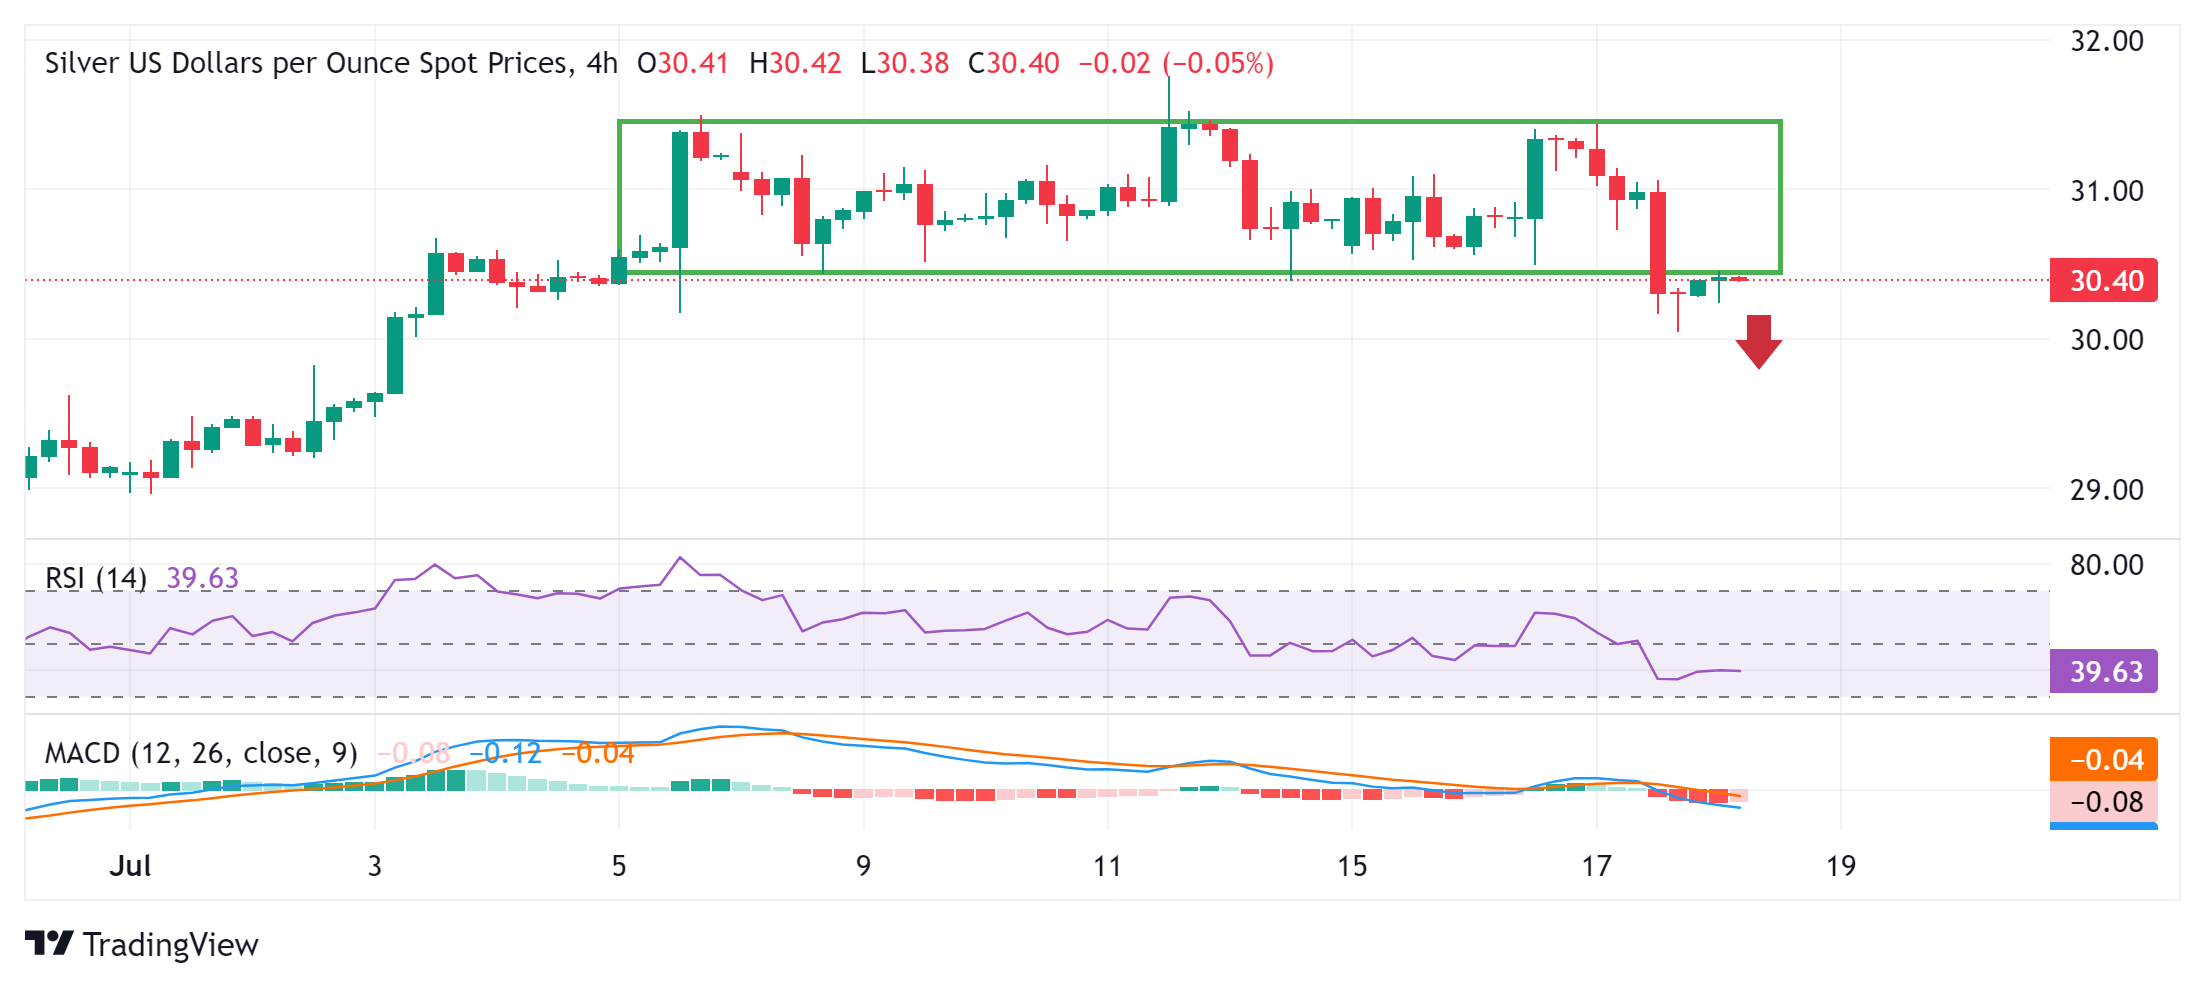
Silver FAQs
Silver is a precious metal highly traded among investors. It has been historically used as a store of value and a medium of exchange. Although less popular than Gold, traders may turn to Silver to diversify their investment portfolio, for its intrinsic value or as a potential hedge during high-inflation periods. Investors can buy physical Silver, in coins or in bars, or trade it through vehicles such as Exchange Traded Funds, which track its price on international markets.
Silver prices can move due to a wide range of factors. Geopolitical instability or fears of a deep recession can make Silver price escalate due to its safe-haven status, although to a lesser extent than Gold's. As a yieldless asset, Silver tends to rise with lower interest rates. Its moves also depend on how the US Dollar (USD) behaves as the asset is priced in dollars (XAG/USD). A strong Dollar tends to keep the price of Silver at bay, whereas a weaker Dollar is likely to propel prices up. Other factors such as investment demand, mining supply – Silver is much more abundant than Gold – and recycling rates can also affect prices.
Silver is widely used in industry, particularly in sectors such as electronics or solar energy, as it has one of the highest electric conductivity of all metals – more than Copper and Gold. A surge in demand can increase prices, while a decline tends to lower them. Dynamics in the US, Chinese and Indian economies can also contribute to price swings: for the US and particularly China, their big industrial sectors use Silver in various processes; in India, consumers’ demand for the precious metal for jewellery also plays a key role in setting prices.
Silver prices tend to follow Gold's moves. When Gold prices rise, Silver typically follows suit, as their status as safe-haven assets is similar. The Gold/Silver ratio, which shows the number of ounces of Silver needed to equal the value of one ounce of Gold, may help to determine the relative valuation between both metals. Some investors may consider a high ratio as an indicator that Silver is undervalued, or Gold is overvalued. On the contrary, a low ratio might suggest that Gold is undervalued relative to Silver.
- GBP/USD edges lower on Thursday amid the emergence of some USD buying.
- A slightly overbought RSI is seen holding back bulls from placing fresh bets.
- The technical setup suggests that the path of least resistance is to the upside.
The GBP/USD pair trades with a mild negative bias during the Asian session on Thursday, albeit lacks follow-through selling and remains well within the striking distance of the one-year peak touched the previous day. Spot prices currently hover around the 1.3000 psychological mark and seem poised to prolong the recent uptrend witnessed over the past three weeks or so.
A modest pickup in the US Treasury bond yields assists the US Dollar (USD) in recovering a part of the previous day's heavy losses to a nearly four-month low, which, in turn, is seen acting as a headwind for the GBP/USD pair. That said, growing acceptance that the Federal Reserve (Fed) will start the rate-cutting cycle in September, along with the underlying strong bullish tone across the global equity markets, might cap the upside for the safe-haven Greenback.
Meanwhile, data published on Wednesday showed that UK inflation rose slightly more than expected, coming in at a 2% YoY rate for June. This comes on the back of a better-than-expected GDP growth of 0.4% in May and dampens chances of an interest rate cut by the Bank of England (BoE) in August. This might continue to underpin the British Pound and further contribute to limiting the downside for the GBP/USD pair, warranting some caution for bearish traders.
From a technical perspective, the recent breakout through the previous YTD peak, around the 1.2895 region, was seen as a fresh trigger for bullish traders. That said, the Relative Strength Index (RSI) on the daily chart is flashing overbought conditions and makes it prudent to wait for some near-term consolidation or a modest pullback before the next leg up. Any meaningful slide, however, is likely to attract fresh buyers near the 1.2965 area and remain limited.
The latter is closely followed by the weekly low, around the 1.2940-1.2935 region touched on Tuesday, which if broken decisively could pave the way for a slide back towards the 1.2900 mark. The said handle should now act as a key pivotal point, below which the GBP/USD pair could extend the corrective decline towards intermediate support near the 1.2855 zone en route to the 1.2820-1.2815 region and the 1.2800 round-figure mark.
On the flip side, momentum beyond the YTD peak, around the 1.3045 area set on Wednesday, should allow bulls to reclaim the 1.3100 mark. The subsequent move up has the potential to lift the GBP/USD pair towards the 1.3140 region, or the July 2023 swing high.
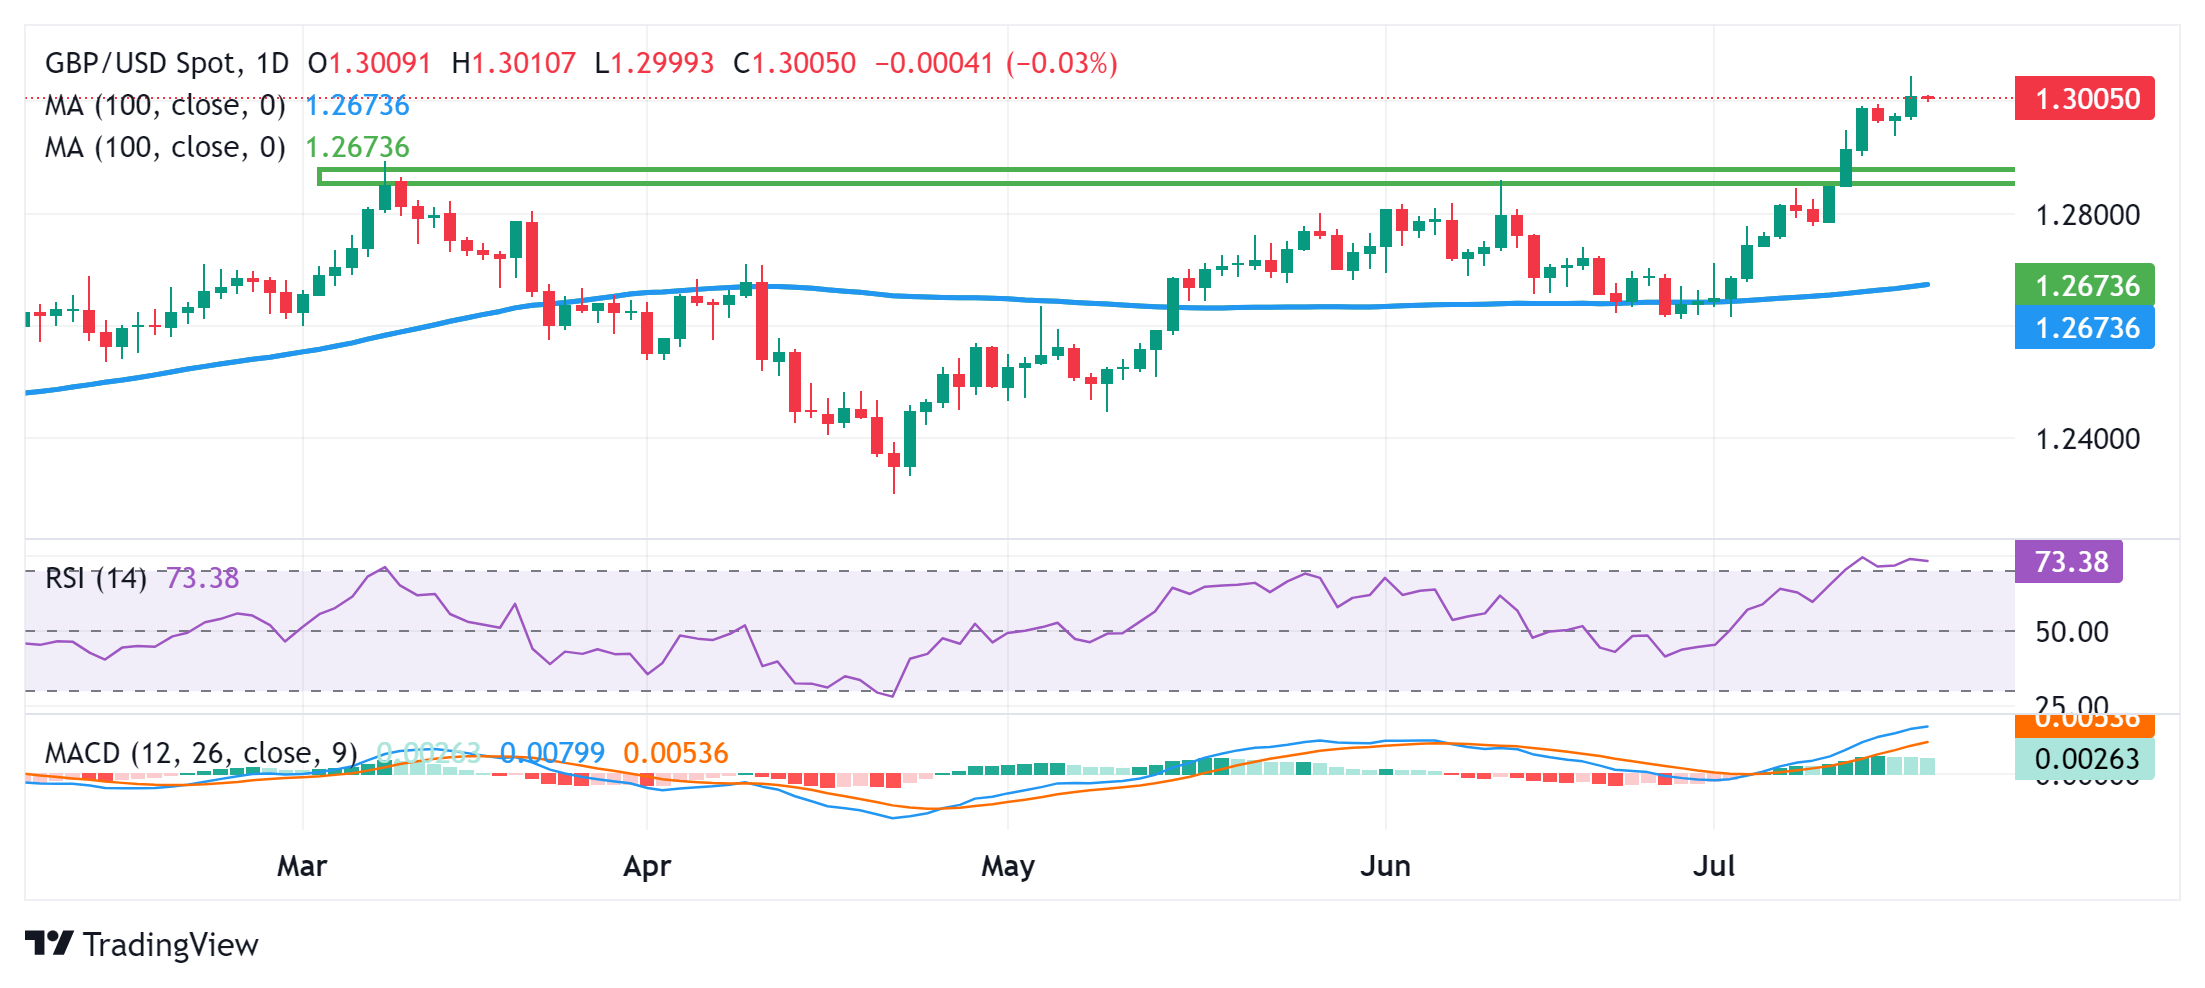
Pound Sterling FAQs
The Pound Sterling (GBP) is the oldest currency in the world (886 AD) and the official currency of the United Kingdom. It is the fourth most traded unit for foreign exchange (FX) in the world, accounting for 12% of all transactions, averaging $630 billion a day, according to 2022 data. Its key trading pairs are GBP/USD, aka ‘Cable’, which accounts for 11% of FX, GBP/JPY, or the ‘Dragon’ as it is known by traders (3%), and EUR/GBP (2%). The Pound Sterling is issued by the Bank of England (BoE).
The single most important factor influencing the value of the Pound Sterling is monetary policy decided by the Bank of England. The BoE bases its decisions on whether it has achieved its primary goal of “price stability” – a steady inflation rate of around 2%. Its primary tool for achieving this is the adjustment of interest rates. When inflation is too high, the BoE will try to rein it in by raising interest rates, making it more expensive for people and businesses to access credit. This is generally positive for GBP, as higher interest rates make the UK a more attractive place for global investors to park their money. When inflation falls too low it is a sign economic growth is slowing. In this scenario, the BoE will consider lowering interest rates to cheapen credit so businesses will borrow more to invest in growth-generating projects.
Data releases gauge the health of the economy and can impact the value of the Pound Sterling. Indicators such as GDP, Manufacturing and Services PMIs, and employment can all influence the direction of the GBP. A strong economy is good for Sterling. Not only does it attract more foreign investment but it may encourage the BoE to put up interest rates, which will directly strengthen GBP. Otherwise, if economic data is weak, the Pound Sterling is likely to fall.
Another significant data release for the Pound Sterling is the Trade Balance. This indicator measures the difference between what a country earns from its exports and what it spends on imports over a given period. If a country produces highly sought-after exports, its currency will benefit purely from the extra demand created from foreign buyers seeking to purchase these goods. Therefore, a positive net Trade Balance strengthens a currency and vice versa for a negative balance.
- The Japanese Yen inches lower as the US Dollar rebounds.
- The JPY could limit its downside as traders expect further intervention by Japanese authorities.
- The greenback may limit its upside due to the rising expectations of the Fed reducing rates in September.
The Japanese Yen (JPY) retraces its recent gains on Thursday. However, the JPY had strengthened against the US Dollar (USD) after suspected intervention by Japanese authorities drove the USD/JPY pair to a one-month low of 155.36. Traders remain alert to the possibility of further interventions.
Reuters cited Kyodo News, reporting that Japan's top currency diplomat Masato Kanda said on Wednesday he would have to respond if speculators cause "excessive" moves in the currency market and that there was no limit to how often authorities could intervene.
The US Dollar receives support from a slight improvement in US Treasury yields. However, the greenback may limit its upside due to the high likelihood of a rate-cut decision by the Federal Reserve (Fed) in its September policy meeting.
Fed Governor Christopher Waller said on Wednesday that the US central bank is ‘getting closer’ to an interest rate cut. Meanwhile, Richmond Fed President Thomas Barkin stated that easing in inflation had begun to broaden and he would like to see it continue,” per Reuters.
According to CME Group’s FedWatch Tool, markets now indicate a 93.5% probability of a 25-basis point rate cut at the September Fed meeting, up from 69.7% a week earlier.
Daily Digest Market Movers: Japanese Yen inches lower as US Dollar recovers
- Japan's Merchandise Trade Balance Total for the year ended in June climbed to a surplus of ¥224 billion against the expected deficit of ¥240 billion and ¥-1,220.1 billion prior.
- Japan's YoY Exports in June grew by 5.4%, below the forecast 6.4% and a steeper decline from the previous period's 13.5% upsurge. Meanwhile, Imports growth collapsed to 3.2%, well below the forecast 9.3% compared to the last 9.5%.
- During an interview with Bloomberg News on Tuesday, Donald Trump cautioned Fed Chair Jerome Powell against cutting US interest rates before November’s presidential vote. However, Trump also indicated that if re-elected, he would allow Powell to complete his term if he continued to "do the right thing" at the Federal Reserve.
- Data released on Tuesday showed that the Bank of Japan (BoJ) entered the foreign exchange market on consecutive trading days last Thursday and Friday. The current account balance data from the BoJ, released on Tuesday, indicates an anticipated liquidity drain of approximately ¥2.74 trillion ($17.3 billion) from the financial system on Wednesday due to various government sector transactions, according to Nikkei Asia.
- On Tuesday, Federal Reserve (Fed) Board of Governors member Dr. Adriana Kugler acknowledged that inflationary pressures have eased but emphasized that the Fed still needs additional data to justify a rate cut. Kugler indicated that if upcoming data does not confirm that inflation is moving toward the 2% target, it may be appropriate to maintain current rates for a while longer, per Reuters.
- The US Retail Sales for June stayed mostly in line with expectations. Retail Sales in the United States held steady at $704.3 billion in June, after a 0.3% gain (revised from 0.1%) in May, and are in line with market expectations.
- Fed Chair Jerome Powell mentioned on Monday that the three US inflation readings of this year "add somewhat to confidence" that inflation is on course to meet the Fed’s target sustainably, suggesting that a shift to interest rate cuts may not be far off.
Technical Analysis: USD/JPY holds ground above 156.00
USD/JPY trades around 156.30 on Thursday. The daily chart analysis shows that the pair lies below its 9-day Exponential Moving Average (EMA), suggesting downward momentum in the short term. This signals that it may be prudent to hold off on buying until the trend shows signs of reversal. Additionally, the momentum indicator, the 14-day Relative Strength Index (RSI), is below the 50 level, suggesting a confirmation of a bearish bias.
The USD/JPY pair could find key support around June's low at 154.55. A break below this level could exert pressure on the pair to navigate the region around May’s low at 151.86.
On the upside, immediate resistance is observed around the nine-day Exponential Moving Average (EMA) at 158.27. A breakthrough above this level could lead the USD/JPY pair to revisit the pullback resistance around the psychological level of 162.00.
USD/JPY: Daily Chart
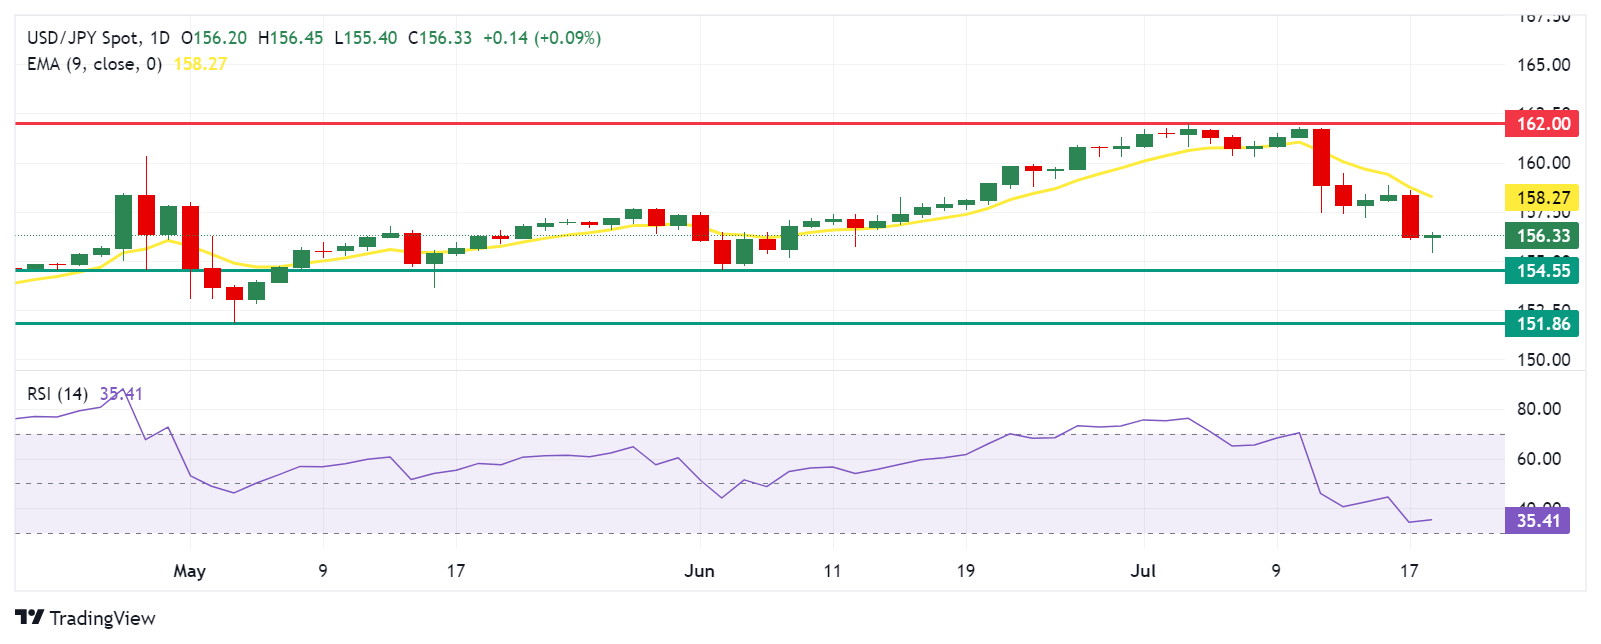
Japanese Yen PRICE Today
The table below shows the percentage change of Japanese Yen (JPY) against listed major currencies today. Japanese Yen was the weakest against the Australian Dollar.
| USD | EUR | GBP | JPY | CAD | AUD | NZD | CHF | |
|---|---|---|---|---|---|---|---|---|
| USD | 0.04% | 0.04% | 0.11% | -0.02% | -0.10% | 0.08% | 0.11% | |
| EUR | -0.04% | 0.00% | 0.05% | -0.05% | -0.15% | 0.04% | 0.07% | |
| GBP | -0.04% | -0.00% | 0.06% | -0.07% | -0.15% | 0.05% | 0.08% | |
| JPY | -0.11% | -0.05% | -0.06% | -0.13% | -0.21% | -0.05% | 0.02% | |
| CAD | 0.02% | 0.05% | 0.07% | 0.13% | -0.09% | 0.10% | 0.13% | |
| AUD | 0.10% | 0.15% | 0.15% | 0.21% | 0.09% | 0.19% | 0.25% | |
| NZD | -0.08% | -0.04% | -0.05% | 0.05% | -0.10% | -0.19% | 0.03% | |
| CHF | -0.11% | -0.07% | -0.08% | -0.02% | -0.13% | -0.25% | -0.03% |
The heat map shows percentage changes of major currencies against each other. The base currency is picked from the left column, while the quote currency is picked from the top row. For example, if you pick the Japanese Yen from the left column and move along the horizontal line to the US Dollar, the percentage change displayed in the box will represent JPY (base)/USD (quote).
Japanese Yen FAQs
The Japanese Yen (JPY) is one of the world’s most traded currencies. Its value is broadly determined by the performance of the Japanese economy, but more specifically by the Bank of Japan’s policy, the differential between Japanese and US bond yields, or risk sentiment among traders, among other factors.
One of the Bank of Japan’s mandates is currency control, so its moves are key for the Yen. The BoJ has directly intervened in currency markets sometimes, generally to lower the value of the Yen, although it refrains from doing it often due to political concerns of its main trading partners. The current BoJ ultra-loose monetary policy, based on massive stimulus to the economy, has caused the Yen to depreciate against its main currency peers. This process has exacerbated more recently due to an increasing policy divergence between the Bank of Japan and other main central banks, which have opted to increase interest rates sharply to fight decades-high levels of inflation.
The BoJ’s stance of sticking to ultra-loose monetary policy has led to a widening policy divergence with other central banks, particularly with the US Federal Reserve. This supports a widening of the differential between the 10-year US and Japanese bonds, which favors the US Dollar against the Japanese Yen.
The Japanese Yen is often seen as a safe-haven investment. This means that in times of market stress, investors are more likely to put their money in the Japanese currency due to its supposed reliability and stability. Turbulent times are likely to strengthen the Yen’s value against other currencies seen as more risky to invest in.
- The Indian Rupee weakens in Thursday’s Asian session.
- Higher crude oil prices weigh on the INR; rising US rate cut bets and Fed’s dovish view might cap the downside.
- Investors await the US weekly Initial Jobless Claims and Philly Fed Manufacturing Index, which are due on Thursday.
The Indian Rupee (INR) attracts some sellers on Thursday despite the weaker US Dollar (USD). The extended recovery in crude oil prices exerts some pressure on the INR as India is the world’s third-largest oil consumer. However, the downside for the local currency might be limited as rising odds of a September rate cut by the US Federal Reserve (Fed) could weigh on the Greenback and pressure US bond yields to come down.
Later on Thursday, investors will monitor the weekly Initial Jobless Claims and the Philly Fed Manufacturing Index. Also, the Fed’s Lorie Logan is scheduled to speak. The dovish comments from the Fed officials might continue to undermine the USD in the near term.
Daily Digest Market Movers: Indian Rupee extends decline amid global factors
- The International Monetary Fund (IMF) on Tuesday raised its economic forecasts this year for China, India, and Europe. India’s economy is estimated to grow 7% from the 6.8% the IMF had projected in April, owing to stronger consumer spending in rural areas.
- Fed Governor Christopher Waller said on Wednesday that the US central bank is ‘getting closer’ to an interest rate cut as inflation's improved trajectory and a labor market in better balance.
- Richmond Fed President Thomas Barkin said he is "very encouraged" that easing in inflation has begun to broaden and he would like to see it continue.
- The US Building Permits increased by 3.4% to 1.446 million in June from 1.399 million in May, while Housing Starts for the same period rose by 3.0% to 1.353 million from 1.314 million.
- US Industrial Production climbed 0.6% MoM in June from the previous reading of 1.0%, beating the estimation of a 0.3% increase.
Technical analysis: USD/INR remains in consolidative mode in the near term
The Indian Rupee trades on a softer note on the day. The trend of the USD/INR pair appears to be bullish as the pair makes higher highs and higher lows. Additionally, USD/INR holds above the key 100-day Exponential Moving Average (EMA) on the daily chart. The 14-day Relative Strength Index (RSI) points higher above 57.35, suggesting that further upside could be on the horizon.
In the shorter term, the pair has remained confined within its month-long trading range since March 21.
A decisive break above the upper boundary of the trading range at 83.65 will pave the way to the all-time high of 83.75. Further north, the next hurdle to watch is the 84.00 psychological level.
On the other hand, the initial downside target will emerge near the 100-day EMA at 83.38. Extended losses will see a drop to the lower limit of the trading range and round figure at 83.00, followed by 82.82, a low of January 12.
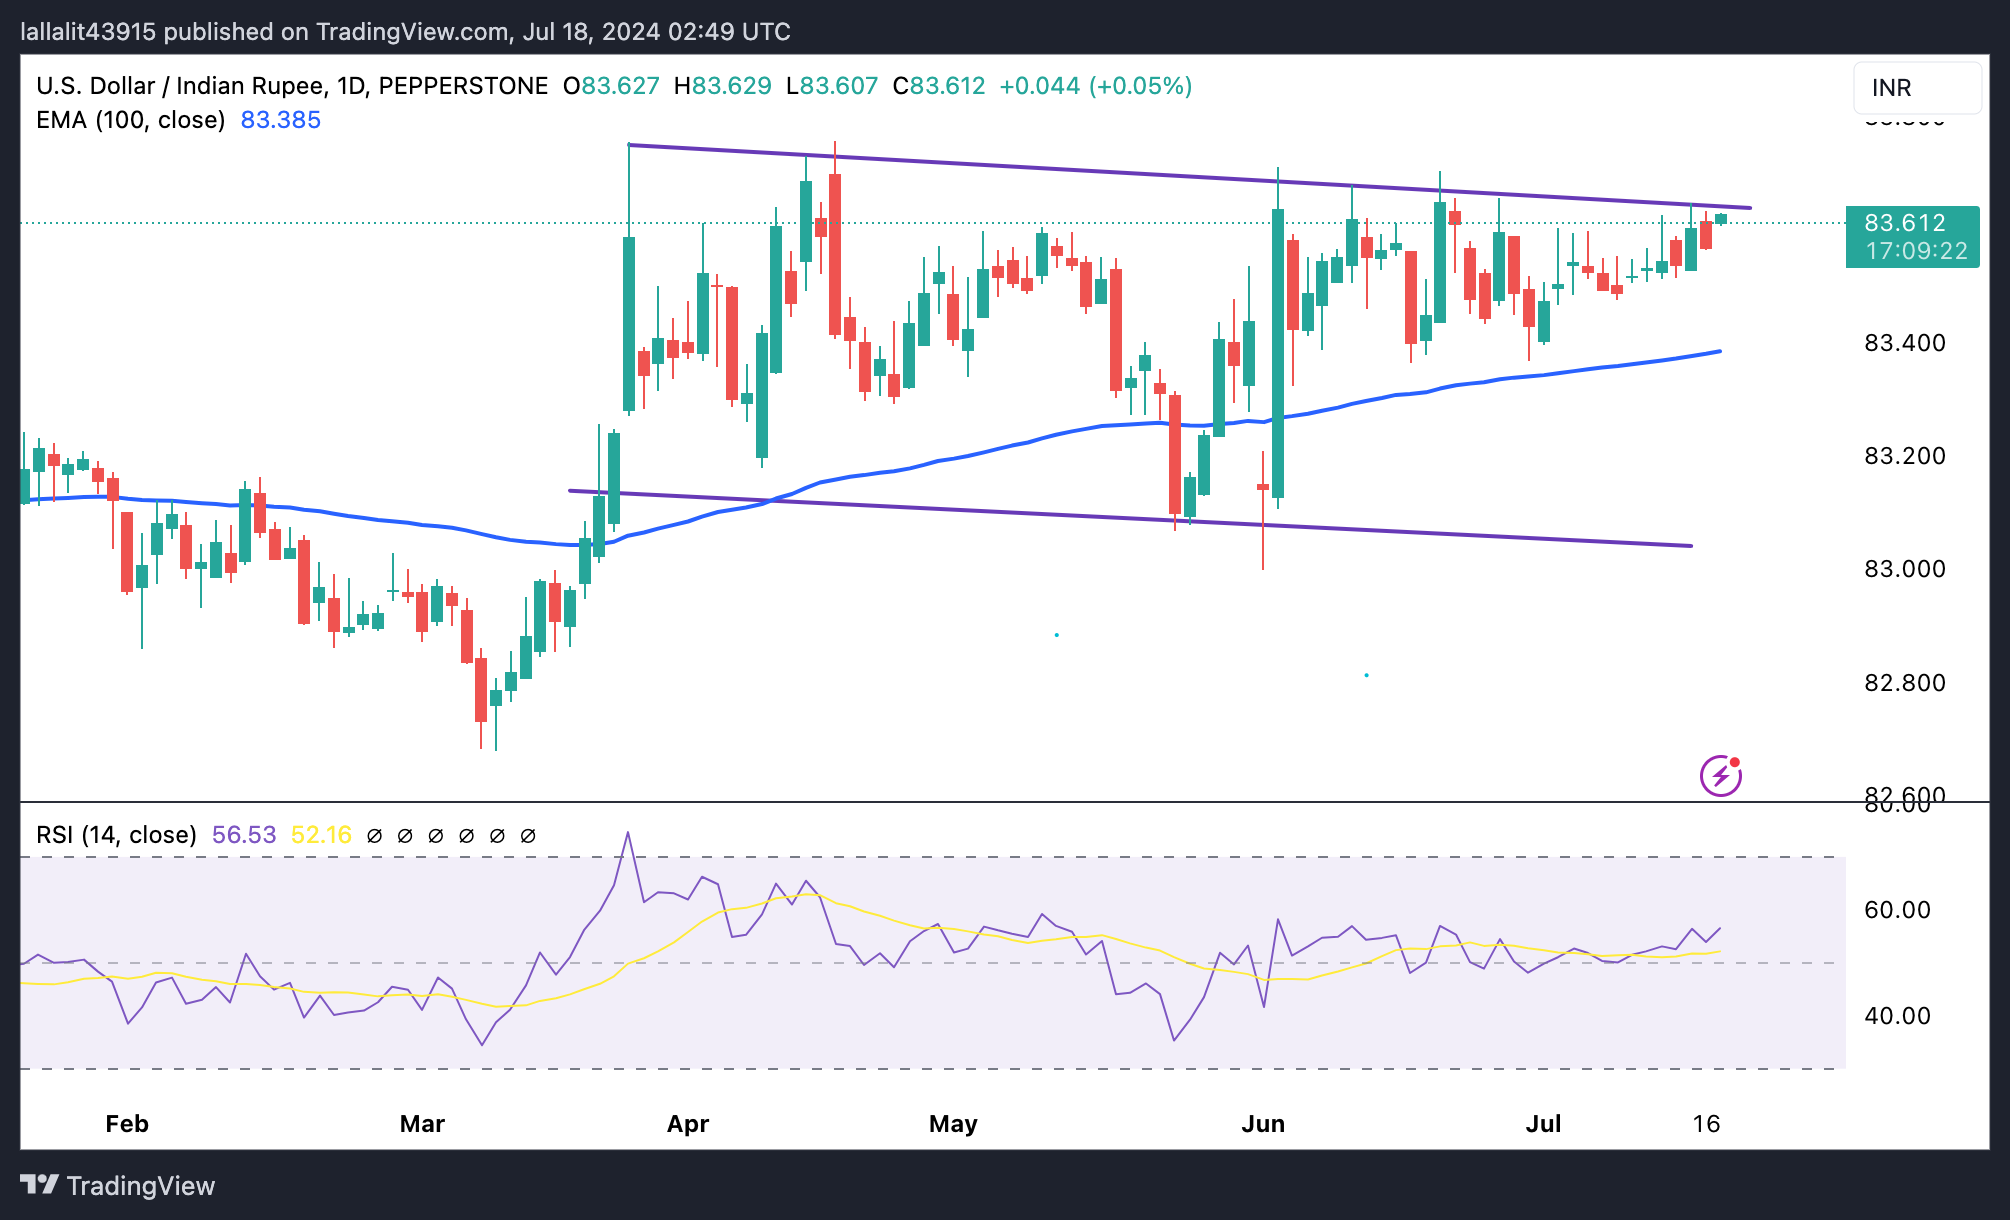
US Dollar price today
The table below shows the percentage change of US Dollar (USD) against listed major currencies today. US Dollar was the strongest against the Japanese Yen.
| USD | EUR | GBP | CAD | AUD | JPY | NZD | CHF | |
| USD | 0.04% | 0.03% | 0.00% | -0.12% | 0.40% | 0.00% | 0.22% | |
| EUR | -0.03% | -0.01% | -0.03% | -0.16% | 0.38% | -0.04% | 0.17% | |
| GBP | -0.02% | 0.01% | -0.02% | -0.15% | 0.37% | -0.02% | 0.20% | |
| CAD | 0.00% | 0.04% | 0.03% | -0.13% | 0.39% | 0.00% | 0.22% | |
| AUD | 0.14% | 0.17% | 0.15% | 0.13% | 0.54% | 0.12% | 0.34% | |
| JPY | -0.39% | -0.37% | -0.40% | -0.41% | -0.53% | -0.43% | -0.19% | |
| NZD | 0.00% | 0.04% | 0.03% | 0.01% | -0.12% | 0.42% | 0.21% | |
| CHF | -0.23% | -0.17% | -0.18% | -0.21% | -0.34% | 0.20% | -0.21% |
The heat map shows percentage changes of major currencies against each other. The base currency is picked from the left column, while the quote currency is picked from the top row. For example, if you pick the Euro from the left column and move along the horizontal line to the Japanese Yen, the percentage change displayed in the box will represent EUR (base)/JPY (quote).
Indian Rupee FAQs
The Indian Rupee (INR) is one of the most sensitive currencies to external factors. The price of Crude Oil (the country is highly dependent on imported Oil), the value of the US Dollar – most trade is conducted in USD – and the level of foreign investment, are all influential. Direct intervention by the Reserve Bank of India (RBI) in FX markets to keep the exchange rate stable, as well as the level of interest rates set by the RBI, are further major influencing factors on the Rupee.
The Reserve Bank of India (RBI) actively intervenes in forex markets to maintain a stable exchange rate, to help facilitate trade. In addition, the RBI tries to maintain the inflation rate at its 4% target by adjusting interest rates. Higher interest rates usually strengthen the Rupee. This is due to the role of the ‘carry trade’ in which investors borrow in countries with lower interest rates so as to place their money in countries’ offering relatively higher interest rates and profit from the difference.
Macroeconomic factors that influence the value of the Rupee include inflation, interest rates, the economic growth rate (GDP), the balance of trade, and inflows from foreign investment. A higher growth rate can lead to more overseas investment, pushing up demand for the Rupee. A less negative balance of trade will eventually lead to a stronger Rupee. Higher interest rates, especially real rates (interest rates less inflation) are also positive for the Rupee. A risk-on environment can lead to greater inflows of Foreign Direct and Indirect Investment (FDI and FII), which also benefit the Rupee.
Higher inflation, particularly, if it is comparatively higher than India’s peers, is generally negative for the currency as it reflects devaluation through oversupply. Inflation also increases the cost of exports, leading to more Rupees being sold to purchase foreign imports, which is Rupee-negative. At the same time, higher inflation usually leads to the Reserve Bank of India (RBI) raising interest rates and this can be positive for the Rupee, due to increased demand from international investors. The opposite effect is true of lower inflation.
- WTI lacks bullish conviction and is influenced by a combination of factors.
- A modest USD recovery and China’s economic woes act as a headwind.
- The mixed setup warrants some caution before placing directional bets.
West Texas Intermediate (WTI) US crude Oil prices build on the previous day's solid rebound from the 50-day Simple Moving Average (SMA) support and climb to a fresh weekly peak during the Asian session on Thursday. The commodity, however, struggles to capitalize on the move and currently trades around the $81.65 region, nearly unchanged for the day.
The US Dollar (USD) attracts some buyers and reverses a part of the previous day's slump to a nearly four-month low, which, in turn, is seen as a key factor acting as a headwind for the USD-denominated Crude Oil prices. Apart from this, signs of slowing economic growth in China – the world's top oil importer – contribute to capping the black liquid. The downside, however, remains cushioned in the wake of a bigger-than-expected weekly drop in US crude stockpiles.
Data published by the Energy Information Administration (EIA) on Wednesday showed a third straight weekly decline in US crude inventories, by 4.9 million barrels compared to a 4.4 million drop reported by the American Petroleum Institute. Moreover, the attempted USD recovery runs the risk of fizzling out rather quickly amid bets that the Federal Reserve (Fed) will cut rates in September. This, in turn, supports prospects for some meaningful upside for Crude Oil prices.
Even from a technical perspective, failure to find acceptance below the 100-day SMA and the overnight bounce from the 50-day SMA pivotal support suggests that the path of least resistance for the commodity is to the upside. That said, mixed oscillators on the daily chart warrant some caution before confirming that the recent retracement slide from the vicinity of the $84.00 mark, or over a two-month peak touched on July 5 has run its course and positioning for any further gains.
WTI Oil FAQs
WTI Oil is a type of Crude Oil sold on international markets. The WTI stands for West Texas Intermediate, one of three major types including Brent and Dubai Crude. WTI is also referred to as “light” and “sweet” because of its relatively low gravity and sulfur content respectively. It is considered a high quality Oil that is easily refined. It is sourced in the United States and distributed via the Cushing hub, which is considered “The Pipeline Crossroads of the World”. It is a benchmark for the Oil market and WTI price is frequently quoted in the media.
Like all assets, supply and demand are the key drivers of WTI Oil price. As such, global growth can be a driver of increased demand and vice versa for weak global growth. Political instability, wars, and sanctions can disrupt supply and impact prices. The decisions of OPEC, a group of major Oil-producing countries, is another key driver of price. The value of the US Dollar influences the price of WTI Crude Oil, since Oil is predominantly traded in US Dollars, thus a weaker US Dollar can make Oil more affordable and vice versa.
The weekly Oil inventory reports published by the American Petroleum Institute (API) and the Energy Information Agency (EIA) impact the price of WTI Oil. Changes in inventories reflect fluctuating supply and demand. If the data shows a drop in inventories it can indicate increased demand, pushing up Oil price. Higher inventories can reflect increased supply, pushing down prices. API’s report is published every Tuesday and EIA’s the day after. Their results are usually similar, falling within 1% of each other 75% of the time. The EIA data is considered more reliable, since it is a government agency.
OPEC (Organization of the Petroleum Exporting Countries) is a group of 13 Oil-producing nations who collectively decide production quotas for member countries at twice-yearly meetings. Their decisions often impact WTI Oil prices. When OPEC decides to lower quotas, it can tighten supply, pushing up Oil prices. When OPEC increases production, it has the opposite effect. OPEC+ refers to an expanded group that includes ten extra non-OPEC members, the most notable of which is Russia.
| Raw materials | Closed | Change, % |
|---|---|---|
| Silver | 30.322 | -2.93 |
| Gold | 245.92 | -0.34 |
| Palladium | 952.08 | -0.66 |
- Gold price attracts some dip-buying following the overnight pullback from the record high.
- Bets that the Fed will begin its rate-cutting cycle in September continue to act as a tailwind.
- A modest USD uptick, along with the risk-on environment, might cap further intraday gains.
Gold price (XAU/USD) ticks higher during the Asian session on Thursday and for now, seems to have stalled its retracement slide from a fresh record high touched the previous day. The precious metal currently trades just above the $2,460 level, though a combination of factors might keep a lid on any meaningful intraday appreciating move.
The US Dollar (USD) attracts some buyers and reverses a part of the previous day's heavy losses to a nearly four-month low in the wake of a modest uptick in the US Treasury bond yields. This, along with the prevalent strong bullish sentiment across the global equity markets, could act as a headwind for the safe-haven Gold price. The near-term bias, however, seems tilted firmly in favor of bullish traders.
Investors now seem to have fully priced in a 25-basis point (bps) interest rate cut by the Federal Reserve (Fed) in September. Moreover, market participants expect the US central bank to lower borrowing costs again in December in the wake of cooling inflationary pressures. This should cap the upside for the US bond yields and the USD, which, in turn, might continue to benefit the non-yielding Gold price.
Gold FAQs
Gold has played a key role in human’s history as it has been widely used as a store of value and medium of exchange. Currently, apart from its shine and usage for jewelry, the precious metal is widely seen as a safe-haven asset, meaning that it is considered a good investment during turbulent times. Gold is also widely seen as a hedge against inflation and against depreciating currencies as it doesn’t rely on any specific issuer or government.
Central banks are the biggest Gold holders. In their aim to support their currencies in turbulent times, central banks tend to diversify their reserves and buy Gold to improve the perceived strength of the economy and the currency. High Gold reserves can be a source of trust for a country’s solvency. Central banks added 1,136 tonnes of Gold worth around $70 billion to their reserves in 2022, according to data from the World Gold Council. This is the highest yearly purchase since records began. Central banks from emerging economies such as China, India and Turkey are quickly increasing their Gold reserves.
Gold has an inverse correlation with the US Dollar and US Treasuries, which are both major reserve and safe-haven assets. When the Dollar depreciates, Gold tends to rise, enabling investors and central banks to diversify their assets in turbulent times. Gold is also inversely correlated with risk assets. A rally in the stock market tends to weaken Gold price, while sell-offs in riskier markets tend to favor the precious metal.
The price can move due to a wide range of factors. Geopolitical instability or fears of a deep recession can quickly make Gold price escalate due to its safe-haven status. As a yield-less asset, Gold tends to rise with lower interest rates, while higher cost of money usually weighs down on the yellow metal. Still, most moves depend on how the US Dollar (USD) behaves as the asset is priced in dollars (XAU/USD). A strong Dollar tends to keep the price of Gold controlled, whereas a weaker Dollar is likely to push Gold prices up.
- The Australian Dollar gets a minor lift from the mixed Australian employment data on Thursday.
- The number of employed people rose by 50.2K, while the Unemployment Rate ticks higher to 4.1%.
- The emergence of some USD buying keeps a lid on any meaningful upside for the AUD/USD pair.
The Australian Dollar (AUD) has been trending lower over the past week or so amid rising economic headwinds in China. Apart from this, falling copper prices turned out to be another factor denting demand for the resources-linked currency Aussie, though the recent US Dollar (USD) slump helped limit losses for the AUD/USD pair. In fact, the USD Index (DXY), which tracks the Greenback against a basket of currencies, dived to a nearly four-month low on Wednesday amid dovish Federal Reserve (Fed) expectations.
Market participants seem convinced that the US central bank will start cutting interest rates in September and lower borrowing costs again in December. This keeps the US Treasury bond yields depressed near a multi-month low, which, along with the prevalent risk-on environment, continues to undermine the safe-haven buck. Furthermore, the release of monthly employment details from Australia assists the AUD/USD pair in staging a modest recovery from a two-week low retested during the Asian session.
Daily Digest Market Movers: Australian Dollar struggles to lure buyers after mixed domestic jobs data
- The official data published by the Australian Bureau of Statistics (ABS) this Thursday showed that the Unemployment Rate rose to 4.1% in June as compared to expectations and the previous figure of 4.0%.
- A slight disappointment, however, was offset by an unexpected rise in the number of employed people, from 39.7K in May to 50.2K in June, well above consensus estimates pointing to a reading of 20.0K.
- The mixed data, however, does little to influence expectations about the Reserve Bank of Australia's next policy move, albeit provides a modest lift to the Australian Dollar and the AUD/USD pair.
- The US Dollar, on the other hand, attracts some buyers and reverses a part of the previous day's heavy losses to a nearly four-month trough, which keeps a lid on any meaningful gains for the major.
- Meanwhile, a September interest rate cut by the Federal Reserve is fully priced in and investors are betting on the possibility of two rate cuts by year-end, which should cap the upside for the USD.
Technical Analysis: AUD/USD manages to defend ascending trend-line support, ahead of 0.6400 mark
From a technical perspective, the AUD/USD pair bounces off support marked by an upward-sloping trend line. This, along with another ascending trend line, constitutes the formation of an ascending wedge – a pattern with a bearish tendency. Moreover, oscillators on the said daily chart have just started drifting in the negative territory and suggest that the attempted recovery runs the risk of fizzling out rather quickly.
Hence, any subsequent move up is more likely to attract some sellers near the mid-0.6700s and remain capped. Some follow-through buying, however, has the potential to lift spot prices back towards the 0.6800 mark, or a multi-month peak touched last week. A sustained strength beyond the latter will negate the near-term negative outlook and pave the way for the resumption of the prior well-established uptrend.
On the flip side, the aforementioned trend-line support, currently pegged near the 0.6700 round figure, could act as immediate support. This is followed by the 50-day Simple Moving Average (SMA), around the 0.6665 region, which if broken decisively will be seen as a fresh trigger for bearish traders. The AUD/USD pair might then accelerate the fall towards the 100-day SMA support near the 0.6600 mark.
Australian Dollar FAQs
One of the most significant factors for the Australian Dollar (AUD) is the level of interest rates set by the Reserve Bank of Australia (RBA). Because Australia is a resource-rich country another key driver is the price of its biggest export, Iron Ore. The health of the Chinese economy, its largest trading partner, is a factor, as well as inflation in Australia, its growth rate and Trade Balance. Market sentiment – whether investors are taking on more risky assets (risk-on) or seeking safe-havens (risk-off) – is also a factor, with risk-on positive for AUD.
The Reserve Bank of Australia (RBA) influences the Australian Dollar (AUD) by setting the level of interest rates that Australian banks can lend to each other. This influences the level of interest rates in the economy as a whole. The main goal of the RBA is to maintain a stable inflation rate of 2-3% by adjusting interest rates up or down. Relatively high interest rates compared to other major central banks support the AUD, and the opposite for relatively low. The RBA can also use quantitative easing and tightening to influence credit conditions, with the former AUD-negative and the latter AUD-positive.
China is Australia’s largest trading partner so the health of the Chinese economy is a major influence on the value of the Australian Dollar (AUD). When the Chinese economy is doing well it purchases more raw materials, goods and services from Australia, lifting demand for the AUD, and pushing up its value. The opposite is the case when the Chinese economy is not growing as fast as expected. Positive or negative surprises in Chinese growth data, therefore, often have a direct impact on the Australian Dollar and its pairs.
Iron Ore is Australia’s largest export, accounting for $118 billion a year according to data from 2021, with China as its primary destination. The price of Iron Ore, therefore, can be a driver of the Australian Dollar. Generally, if the price of Iron Ore rises, AUD also goes up, as aggregate demand for the currency increases. The opposite is the case if the price of Iron Ore falls. Higher Iron Ore prices also tend to result in a greater likelihood of a positive Trade Balance for Australia, which is also positive of the AUD.
The Trade Balance, which is the difference between what a country earns from its exports versus what it pays for its imports, is another factor that can influence the value of the Australian Dollar. If Australia produces highly sought after exports, then its currency will gain in value purely from the surplus demand created from foreign buyers seeking to purchase its exports versus what it spends to purchase imports. Therefore, a positive net Trade Balance strengthens the AUD, with the opposite effect if the Trade Balance is negative.
The People’s Bank of China (PBOC) set the USD/CNY central rate on Thursday at 7.1285, as against the previous day's fix of 7.1318 and 7.2587 Reuters estimates.
- USD/JPY loses momentum around 155.75i in Thursday’s early Asian session, down 0.30% on the day.
- Japan's exports rose for a seventh consecutive month in June.
- Rising odds of US rate cuts and the Fed’s dovish messages are likely to cap the pair’s upside.
The USD/JPY pair attracts some sellers near 155.75 on Thursday during the early Asian trading hours. The pair edges lower on the weaker US Dollar (USD) broadly and speculation of the Bank of Japan (BoJ) intervention. The US weekly Initial Jobless Claims and the Philly Fed Manufacturing Index are due on Thursday, along with the Fed’s Lorie Logan speech.
Traders suspect another foreign exchange (FX) intervention from the Japanese authorities to support the Japanese Yen (JPY) from multi-decade lows. This, in turn, might underpin the JPY in the near term and cap the upside for the pair.
Data released by the Ministry of Finance on Thursday showed that Japan's Trade Balance for the year ended in June climbed to ¥224B versus ¥-1,220.1B prior, better than the estimated. Meanwhile, the country’s Exports grew by 5.4% YoY in June from a rise of 13.5% in May, below the forecast of 6.4%. Imports increased 3.2%, compared to the previous 9.5%, below the market consensus of 9.3%.
On the USD’s front, the markets see a small chance for a rate cut of at least 25 basis points (bps) at the Fed's July meeting, but pricing in 100% odds of a September reduction, according to the CME FedWatch Tool. The rising bets on the Fed rate cut exert some selling pressure on the Greenback against the JPY.
Furthermore, dovish bets on the Fed continue to undermine the USD in the near term. Fed Governor Christopher Waller said on Wednesday that the US central bank is ‘getting closer’ to an interest rate cut. Meanwhile, Richmond Fed President Thomas Barkin stated that easing in inflation had begun to broaden and he would like to see it continue.”
Japanese Yen FAQs
The Japanese Yen (JPY) is one of the world’s most traded currencies. Its value is broadly determined by the performance of the Japanese economy, but more specifically by the Bank of Japan’s policy, the differential between Japanese and US bond yields, or risk sentiment among traders, among other factors.
One of the Bank of Japan’s mandates is currency control, so its moves are key for the Yen. The BoJ has directly intervened in currency markets sometimes, generally to lower the value of the Yen, although it refrains from doing it often due to political concerns of its main trading partners. The current BoJ ultra-loose monetary policy, based on massive stimulus to the economy, has caused the Yen to depreciate against its main currency peers. This process has exacerbated more recently due to an increasing policy divergence between the Bank of Japan and other main central banks, which have opted to increase interest rates sharply to fight decades-high levels of inflation.
The BoJ’s stance of sticking to ultra-loose monetary policy has led to a widening policy divergence with other central banks, particularly with the US Federal Reserve. This supports a widening of the differential between the 10-year US and Japanese bonds, which favors the US Dollar against the Japanese Yen.
The Japanese Yen is often seen as a safe-haven investment. This means that in times of market stress, investors are more likely to put their money in the Japanese currency due to its supposed reliability and stability. Turbulent times are likely to strengthen the Yen’s value against other currencies seen as more risky to invest in.
| Index | Change, points | Closed | Change, % |
|---|---|---|---|
| NIKKEI 225 | -177.39 | 41097.69 | -0.43 |
| Hang Seng | 11.43 | 17739.41 | 0.06 |
| KOSPI | -22.8 | 2843.29 | -0.8 |
| ASX 200 | 58.6 | 8057.9 | 0.73 |
| DAX | -80.73 | 18437.3 | -0.44 |
| CAC 40 | -9.22 | 7570.81 | -0.12 |
| Dow Jones | 243.6 | 41198.08 | 0.59 |
| S&P 500 | -78.93 | 5588.27 | -1.39 |
| NASDAQ Composite | -512.42 | 17996.92 | -2.77 |
| Pare | Closed | Change, % |
|---|---|---|
| AUDUSD | 0.67281 | -0.06 |
| EURJPY | 170.839 | -1 |
| EURUSD | 1.09377 | 0.36 |
| GBPJPY | 203.155 | -1.09 |
| GBPUSD | 1.30065 | 0.27 |
| NZDUSD | 0.60791 | 0.49 |
| USDCAD | 1.36828 | 0.08 |
| USDCHF | 0.88309 | -1.21 |
| USDJPY | 156.183 | -1.36 |
Japan's Trade Balance for the year ended in June surged to nearly a quarter of a trillion Yen surplus of ¥224B after a steeper-than-expected decline in Imports washed out a slightly-better decline in Export figures.
Japan's YoY Exports in June grew by 5.4%, below the forecast 6.4% and a steeper decline from the previous period's 13.5% upsurge. Despite the decline in Exports growth, Imports growth collapsed back to 3.2%, well below the forecast 9.3% compared to the previous 9.5%.
Looking further into the data, Japan's Exports to the EU declined sharply, falling -13.4% which failed to get offset by an 11.0% YoY increase in Exports to the US.
Market reaction
USD/JPY is testing lower in the early Thursday Pacific market session, testing down into 155.50 as the Yen sees a brief resurgence in strength after months of declines.
USD/JPY hourly chart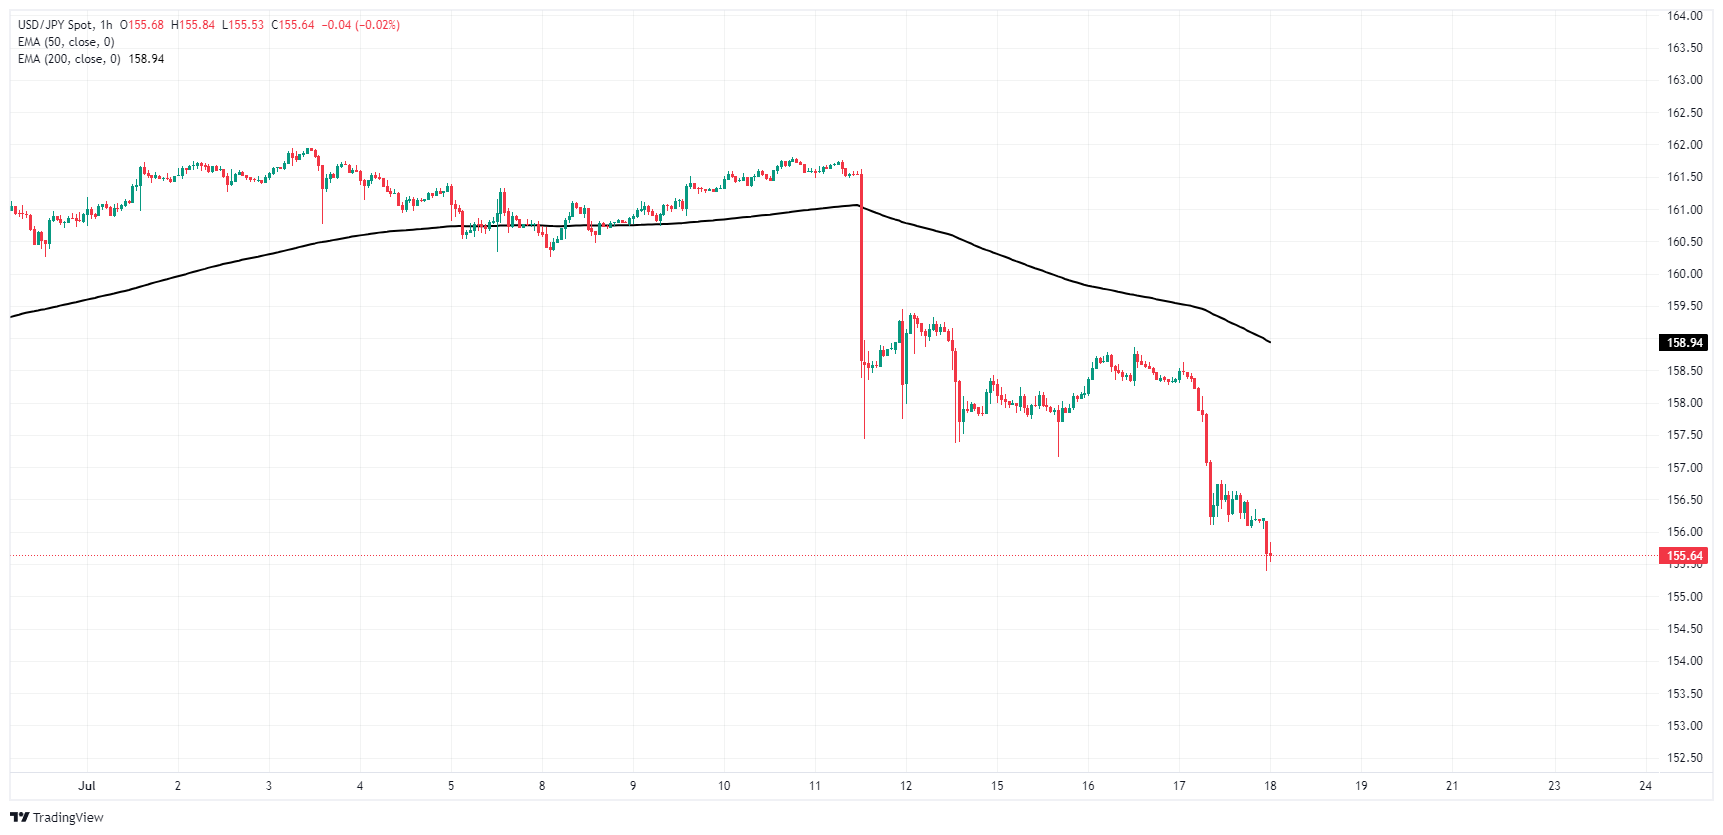
Japanese Yen FAQs
The Japanese Yen (JPY) is one of the world’s most traded currencies. Its value is broadly determined by the performance of the Japanese economy, but more specifically by the Bank of Japan’s policy, the differential between Japanese and US bond yields, or risk sentiment among traders, among other factors.
One of the Bank of Japan’s mandates is currency control, so its moves are key for the Yen. The BoJ has directly intervened in currency markets sometimes, generally to lower the value of the Yen, although it refrains from doing it often due to political concerns of its main trading partners. The current BoJ ultra-loose monetary policy, based on massive stimulus to the economy, has caused the Yen to depreciate against its main currency peers. This process has exacerbated more recently due to an increasing policy divergence between the Bank of Japan and other main central banks, which have opted to increase interest rates sharply to fight decades-high levels of inflation.
The BoJ’s stance of sticking to ultra-loose monetary policy has led to a widening policy divergence with other central banks, particularly with the US Federal Reserve. This supports a widening of the differential between the 10-year US and Japanese bonds, which favors the US Dollar against the Japanese Yen.
The Japanese Yen is often seen as a safe-haven investment. This means that in times of market stress, investors are more likely to put their money in the Japanese currency due to its supposed reliability and stability. Turbulent times are likely to strengthen the Yen’s value against other currencies seen as more risky to invest in.


© 2000-2026. Bản quyền Teletrade.
Trang web này được quản lý bởi Teletrade D.J. LLC 2351 LLC 2022 (Euro House, Richmond Hill Road, Kingstown, VC0100, St. Vincent and the Grenadines).
Thông tin trên trang web không phải là cơ sở để đưa ra quyết định đầu tư và chỉ được cung cấp cho mục đích làm quen.
Giao dịch trên thị trường tài chính (đặc biệt là giao dịch sử dụng các công cụ biên) mở ra những cơ hội lớn và tạo điều kiện cho các nhà đầu tư sẵn sàng mạo hiểm để thu lợi nhuận, tuy nhiên nó mang trong mình nguy cơ rủi ro khá cao. Chính vì vậy trước khi tiến hành giao dịch cần phải xem xét mọi mặt vấn đề chấp nhận tiến hành giao dịch cụ thể xét theo quan điểm của nguồn lực tài chính sẵn có và mức độ am hiểu thị trường tài chính.
Sử dụng thông tin: sử dụng toàn bộ hay riêng biệt các dữ liệu trên trang web của công ty TeleTrade như một nguồn cung cấp thông tin nhất định. Việc sử dụng tư liệu từ trang web cần kèm theo liên kết đến trang teletrade.vn. Việc tự động thu thập số liệu cũng như thông tin từ trang web TeleTrade đều không được phép.
Xin vui lòng liên hệ với pr@teletrade.global nếu có câu hỏi.
ngân hàng