LƯU Ý: Tài liệu trong nguồn cấp dữ liệu tin tức và phân tích được cập nhật tự động, tải lại trang có thể làm chậm quá trình xuất hiện tài liệu mới. Để nhận được tài liệu nhanh chóng, chúng tôi khuyên bạn nên luôn mở nguồn cấp tin tức.
Sort by topic
tất cả tin tức
Sắp xếp theo cặp tiền tệ
18.02.2025
23:51
Japan Adjusted Merchandise Trade Balance fell from previous ¥-33B to ¥-856.6B in January
23:51
Japan Machinery Orders (MoM) came in at -1.2% below forecasts (0.1%) in December
23:51
Japan Machinery Orders (YoY) came in at 4.3% below forecasts (6.9%) in December
23:51
Japan Merchandise Trade Balance Total below forecasts (¥-2100B) in January: Actual (¥-2758.8B)
23:50
Japan Merchandise Trade Balance Total came in at ¥-2B, above forecasts (¥-2100B) in January
23:50
Japan Exports (YoY) below expectations (7.9%) in January: Actual (7.2%)
23:50
Japan Imports (YoY) above expectations (9.7%) in January: Actual (16.7%)
23:45
Australia Westpac Leading Index (MoM): 0.1% (January) vs -0.02%
US President Donald Trump said late Tuesday that he would likely impose tariffs of around 25% on foreign cars, while semiconductor chips and drugs are set to face higher duties, per Bloomberg. Trump added that an announcement will come as soon as April 2.
Key quotes
I probably will tell you that on April 2, but it’ll be in the neighborhood of 25%.
When they come into the United States and they have their plant or factory here there is no tariff, so we want to give them a little bit of a chance.
Market reaction
At the time of writing, the US dollar Index (DXY) is trading 0.01% lower on the day to trade at 107.05.
Tariffs FAQs
Tariffs are customs duties levied on certain merchandise imports or a category of products. Tariffs are designed to help local producers and manufacturers be more competitive in the market by providing a price advantage over similar goods that can be imported. Tariffs are widely used as tools of protectionism, along with trade barriers and import quotas.
Although tariffs and taxes both generate government revenue to fund public goods and services, they have several distinctions. Tariffs are prepaid at the port of entry, while taxes are paid at the time of purchase. Taxes are imposed on individual taxpayers and businesses, while tariffs are paid by importers.
There are two schools of thought among economists regarding the usage of tariffs. While some argue that tariffs are necessary to protect domestic industries and address trade imbalances, others see them as a harmful tool that could potentially drive prices higher over the long term and lead to a damaging trade war by encouraging tit-for-tat tariffs.
During the run-up to the presidential election in November 2024, Donald Trump made it clear that he intends to use tariffs to support the US economy and American producers. In 2024, Mexico, China and Canada accounted for 42% of total US imports. In this period, Mexico stood out as the top exporter with $466.6 billion, according to the US Census Bureau. Hence, Trump wants to focus on these three nations when imposing tariffs. He also plans to use the revenue generated through tariffs to lower personal income taxes.
USD/CAD gains ground to around 1.4195 in Tuesday’s late American session.
Canada's annual CPI inflation rate rose to 1.9% in January.
Fed’s Daly said the policy should stay restrictive until more inflation progresses.
The USD/CAD pair trades on a positive note around 1.4195 during the late American session on Tuesday. The hawkish remarks from Federal Reserve (Fed) officials underpin the US Dollar (USD). Investors brace for the FOMC Minutes, which will be released on Wednesday.
Data released by Statistics Canada on Tuesday showed that Canada’s Consumer Price Index (CPI) rose by 1.9% YoY in January, compared to 1.8% in December, matching analysts’ expectations. On a monthly basis, the CPI rose 0.1% versus -0.4% prior. Meanwhile, the Bank of Canada’s Core CPI inflation, which strips out volatile categories like food and energy, climbed to 2.1% YoY in January from 1.8% in December.
Traders reduce their bets for an interest rate cut from the Bank of Canada (BoC) in March after the CPI inflation data. The markets are now pricing in a nearly 63% chance that the BoC will hold rates steady at the March meeting, compared to 56% before the data was released.
On the USD’s front, San Francisco Fed President Mary Daly said on Tuesday that prospects of further rate cuts in 2025 remain uncertain despite an overall positive lean to US economic factors. Philadelphia Fed President Patrick Harker emphasized support for maintaining a steady interest rate policy, noting that inflation has remained elevated and persistent in recent months.
Investors await remarks by Fed officials this week to gather more clues about the path ahead for US interest rates. Any hawkish comments from Fed policymakers could boost the Greenback in the near term.
Canadian Dollar FAQs
The key factors driving the Canadian Dollar (CAD) are the level of interest rates set by the Bank of Canada (BoC), the price of Oil, Canada’s largest export, the health of its economy, inflation and the Trade Balance, which is the difference between the value of Canada’s exports versus its imports. Other factors include market sentiment – whether investors are taking on more risky assets (risk-on) or seeking safe-havens (risk-off) – with risk-on being CAD-positive. As its largest trading partner, the health of the US economy is also a key factor influencing the Canadian Dollar.
The Bank of Canada (BoC) has a significant influence on the Canadian Dollar by setting the level of interest rates that banks can lend to one another. This influences the level of interest rates for everyone. The main goal of the BoC is to maintain inflation at 1-3% by adjusting interest rates up or down. Relatively higher interest rates tend to be positive for the CAD. The Bank of Canada can also use quantitative easing and tightening to influence credit conditions, with the former CAD-negative and the latter CAD-positive.
The price of Oil is a key factor impacting the value of the Canadian Dollar. Petroleum is Canada’s biggest export, so Oil price tends to have an immediate impact on the CAD value. Generally, if Oil price rises CAD also goes up, as aggregate demand for the currency increases. The opposite is the case if the price of Oil falls. Higher Oil prices also tend to result in a greater likelihood of a positive Trade Balance, which is also supportive of the CAD.
While inflation had always traditionally been thought of as a negative factor for a currency since it lowers the value of money, the opposite has actually been the case in modern times with the relaxation of cross-border capital controls. Higher inflation tends to lead central banks to put up interest rates which attracts more capital inflows from global investors seeking a lucrative place to keep their money. This increases demand for the local currency, which in Canada’s case is the Canadian Dollar.
Macroeconomic data releases gauge the health of the economy and can have an impact on the Canadian Dollar. Indicators such as GDP, Manufacturing and Services PMIs, employment, and consumer sentiment surveys can all influence the direction of the CAD. A strong economy is good for the Canadian Dollar. Not only does it attract more foreign investment but it may encourage the Bank of Canada to put up interest rates, leading to a stronger currency. If economic data is weak, however, the CAD is likely to fall.
Trump confirms 25% auto tariffs, adding trade policy uncertainty.
Eurozone sentiment improves, but ECB’s Holzmann signals possible March rate cut.
The Euro is set to end Tuesday’s session with more than 0.30% losses against the Greenback as the S&P 500 notches a record high during the North American session. At the time of writing, the EUR/USD trades at 1.0445 below its opening price.
Euro weakens despite improved Eurozone sentiment, ECB rate cut chatter
Risk appetite has improved, yet US President Donald Trump reiterated that he will be applying 25% tariffs on imported automobiles. He added that he will announce large companies that are getting back into the United States (US), related to chips and cars.
The EUR/USD recovered during the last couple of weeks amid the progress of peace talks linked to the Ukraine–Russia conflict.
Earlier, a high-level meeting between high-level US officials and Russia’s policymakers met for the first time, in a meeting that excluded Ukraine from initial discussions. Consequently, Ukraine’s President Volodymyr Zelenskiy postponed its visit to Saudi Arabia planned for Wednesday until the next month, with sources saying the decision was made to avoid giving “legitimacy” to Russia–US talks.
In February, the US NY Fed Empire State Manufacturing Index surged from -12.6 to 5.7. Oliver Allen, Senior US Economist at Pantheon Macroeconomics, said, “The general improvement in the Empire survey in recent months has mirrored the upturn in the headline ISM manufacturing index.”
Other data showed the NAHB Housing Market Index sliding 5 points from 47 to 42 due to elevated mortgage rates and strained inventory of existing homes.
Across the pond, the Eurozone (EU) ZEW Economic Sentiment Index in February improved from 18 to 24.2, suggesting that consecutive rate cuts by the European Central Bank (ECB) have improved the economic outlook.
In the meantime, ECB’s Holzmann said there’s a probability of a March rate cut, though he said that decisions in favor of additional easing are becoming more demanding, according to Bloomberg.
On Wednesday, the EU’s economic docket Is absent. In the US, the latest FOMC meeting minutes, Housing Starts and Building Permits for January.
Euro PRICE Today
The table below shows the percentage change of Euro (EUR) against listed major currencies today. Euro was the strongest against the Japanese Yen.
USD
EUR
GBP
JPY
CAD
AUD
NZD
CHF
USD
-0.02%
-0.21%
0.02%
0.04%
-0.01%
-0.00%
0.02%
EUR
0.02%
-0.20%
0.06%
0.06%
0.00%
0.03%
0.04%
GBP
0.21%
0.20%
0.23%
0.26%
0.20%
0.22%
0.24%
JPY
-0.02%
-0.06%
-0.23%
0.01%
-0.05%
-0.04%
-0.01%
CAD
-0.04%
-0.06%
-0.26%
-0.01%
-0.06%
-0.04%
-0.05%
AUD
0.01%
-0.01%
-0.20%
0.05%
0.06%
0.02%
0.04%
NZD
0.00%
-0.03%
-0.22%
0.04%
0.04%
-0.02%
0.02%
CHF
-0.02%
-0.04%
-0.24%
0.00%
0.05%
-0.04%
-0.02%
The heat map shows percentage changes of major currencies against each other. The base currency is picked from the left column, while the quote currency is picked from the top row. For example, if you pick the Euro from the left column and move along the horizontal line to the US Dollar, the percentage change displayed in the box will represent EUR (base)/USD (quote).
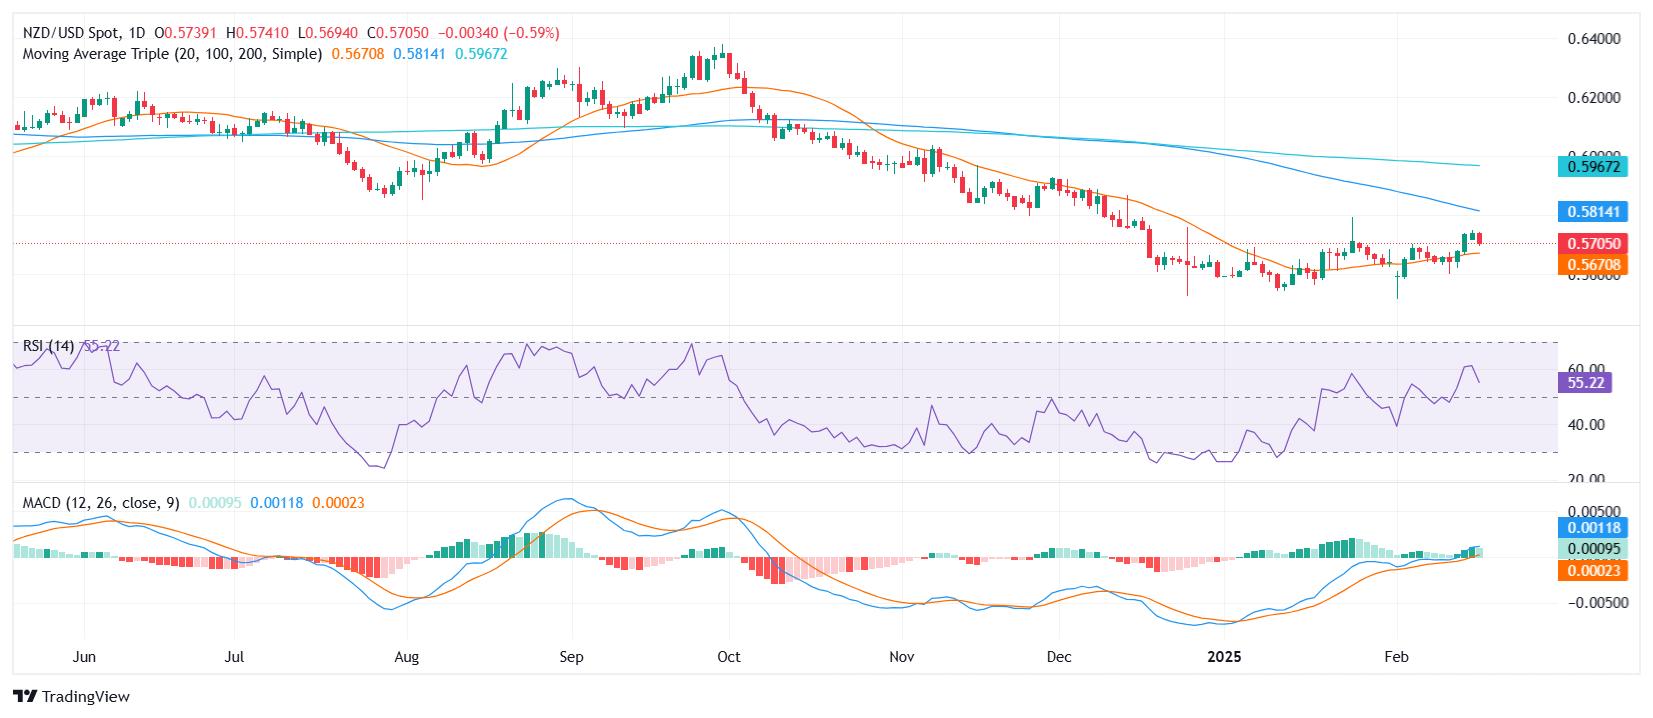
NZD/USD declines to 0.5700 on Tuesday after hitting its highest level since late January last week.
Bulls remain in control as long as the pair holds above the 20-day SMA, with the RBNZ decision set to drive the next move.
The New Zealand dollar faced selling pressure on Tuesday, dropping 0.58% agains the US Dollar to 0.5700 after last week’s rally saw the pair climb to its highest levels since late January above 0.5730. Despite the pullback, the broader outlook remains positive, with the 100-day Simple Moving Average (SMA) at 0.5825 still in focus.
Looking ahead, market participants are gearing up for the Reserve Bank of New Zealand’s (RBNZ) policy decision during the Asian session. The central bank’s guidance will likely dictate the pair’s next major move, with a hawkish tone potentially reigniting the upside momentum, while a dovish stance could extend the ongoing pullback.
In the meantime,technical indicators point to a natural correction rather than a shift in trend. The Relative Strength Index (RSI) declined sharply to 56 but remains in positive territory, suggesting that buyers are still in control. Meanwhile, the Moving Average Convergence Divergence (MACD) histogram prints rising green bars, indicating that bullish momentum has not been completely exhausted. A break below the 20-day SMA, however, could tilt the balance in favor of the bears.
NZD/USD daily chart
21:45
New Zealand Producer Price Index - Input (QoQ) down to -0.9% in 4Q from previous 1.9%
21:45
New Zealand Producer Price Index - Output (QoQ) fell from previous 1.5% to -0.1% in 4Q
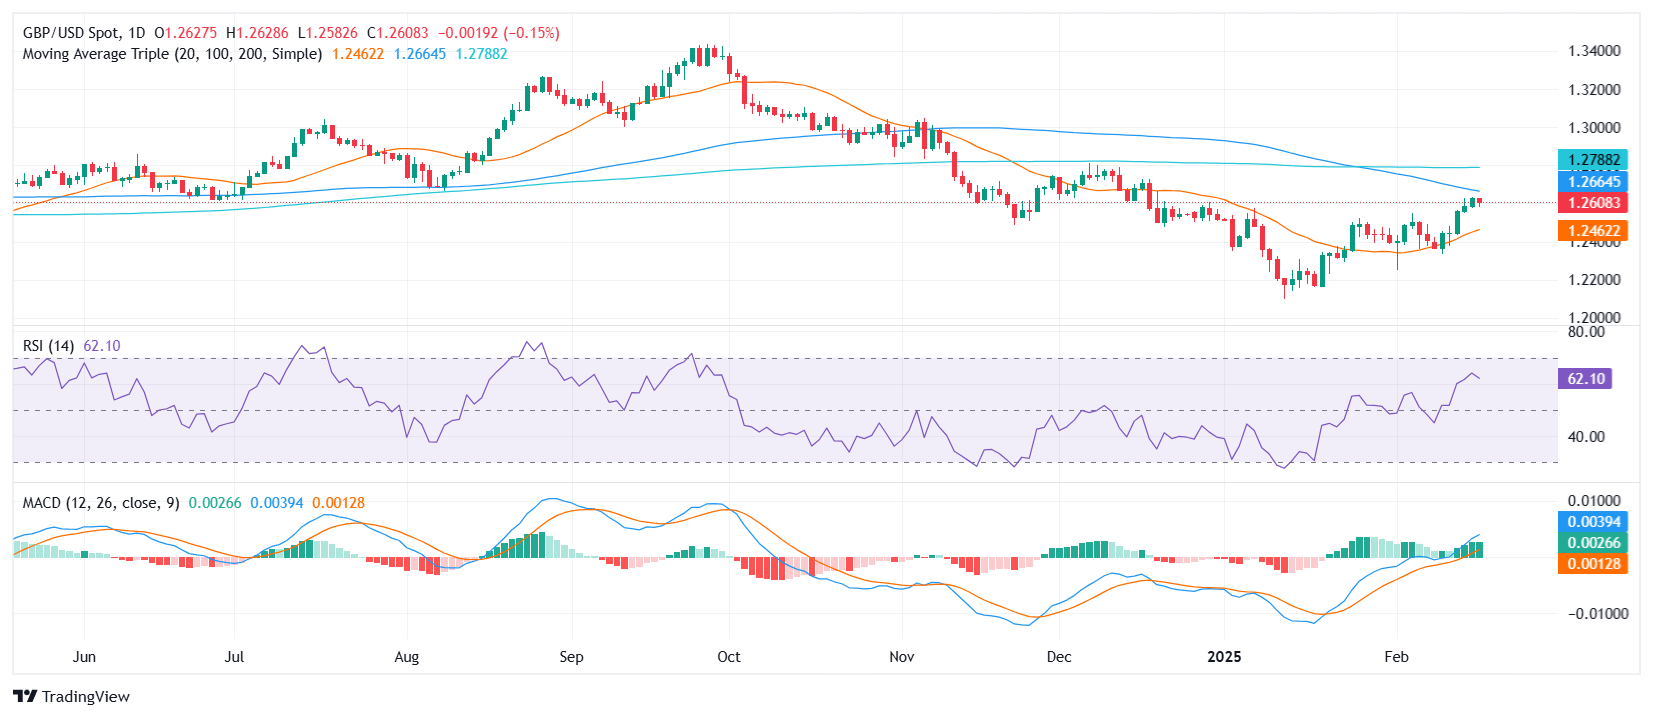
GBP/USD dips 0.16% to 1.2605 on Tuesday after reaching its highest level since mid-January.
RSI declines to 62, indicating a slowdown in bullish momentum, while MACD remains flat with green bars.
The pair eyes the 100-day SMA at 1.2660, with UK inflation and Retail Sales data set to provide direction.
GBP/USD retreated slightly on Tuesday, edging down 0.16% to 1.2605 after an extended rally that propelled it to its highest level since mid-January. Despite this mild pullback, the broader outlook remains constructive, as the pair continues to set its sights on the 100-day Simple Moving Average (SMA) at 1.2660.
Momentum indicators suggest a temporary cooling-off period rather than a structural shift. The Relative Strength Index (RSI) has dipped to 62, signaling a slowdown in buying pressure but still holding in positive territory. Meanwhile, the Moving Average Convergence Divergence (MACD) histogram remains flat with green bars, reinforcing the notion that the latest price action is more of a technical correction than a bearish reversal.
Looking ahead, GBP/USD could receive fresh volatility on Wednesday as the UK is set to release key economic data, including inflation figures and retail sales numbers. These reports will be crucial in shaping expectations for Bank of England policy and could provide the fundamental push needed for the pair to either resume its upward trajectory or extend its consolidation phase.
GBP/USD daily chart
21:00
United States Net Long-Term TIC Flows below expectations ($149.1B) in December: Actual ($72B)
21:00
United States Total Net TIC Flows down to $87.1B in December from previous $159.9B
Aussie slips to 0.6345 amid a stronger US Dollar and negative market mood.
RBA delivers a cautious 25bps rate cut to 4.10%.
Tariff threats and trade tensions linger and limit the upside.
The AUD/USD pair halted its three-day recovery on the back of the firmer US Dollar (USD) and despite the Reserve Bank of Australia’s (RBA) hawkish cut although it managed to keep the trade above the 0.6300 barrier. Market participants remain vigilant about potential United States (US) tariff actions while digesting the RBA’s stance and waiting on further economic data.
Daily digest market movers: Aussie contends with trade and policy uncertainties and awaited RBA cut
The RBA delivered a hawkish 25bps rate cut to 4.10%, in line with many forecasts, emphasizing that this move did not mark the start of an extended easing cycle.
Uncertainty lingers over inflation trends and labor-market tightness which gave the statement a hawkish tone.
Market watchers expect only one additional 25bps cut in Q3-2025, citing suboptimal productivity growth and enduring price pressures. However, if trimmed-mean Consumer Price Index (CPI) decelerates faster, the RBA may adopt a more accommodative stance.
In addition, US President Donald Trump’s extended tariff threats on Chinese imports raise the possibility of countermeasures, threatening global sentiment and capping the pair’s upside.
The US Dollar gained momentum after the Dollar Index (DXY) recaptured the 107.00 zone, fueled by recovering US yields, concerns over trade policies and a negative market mood due to the stalled negotiations between the US and Russia over Ukraine.
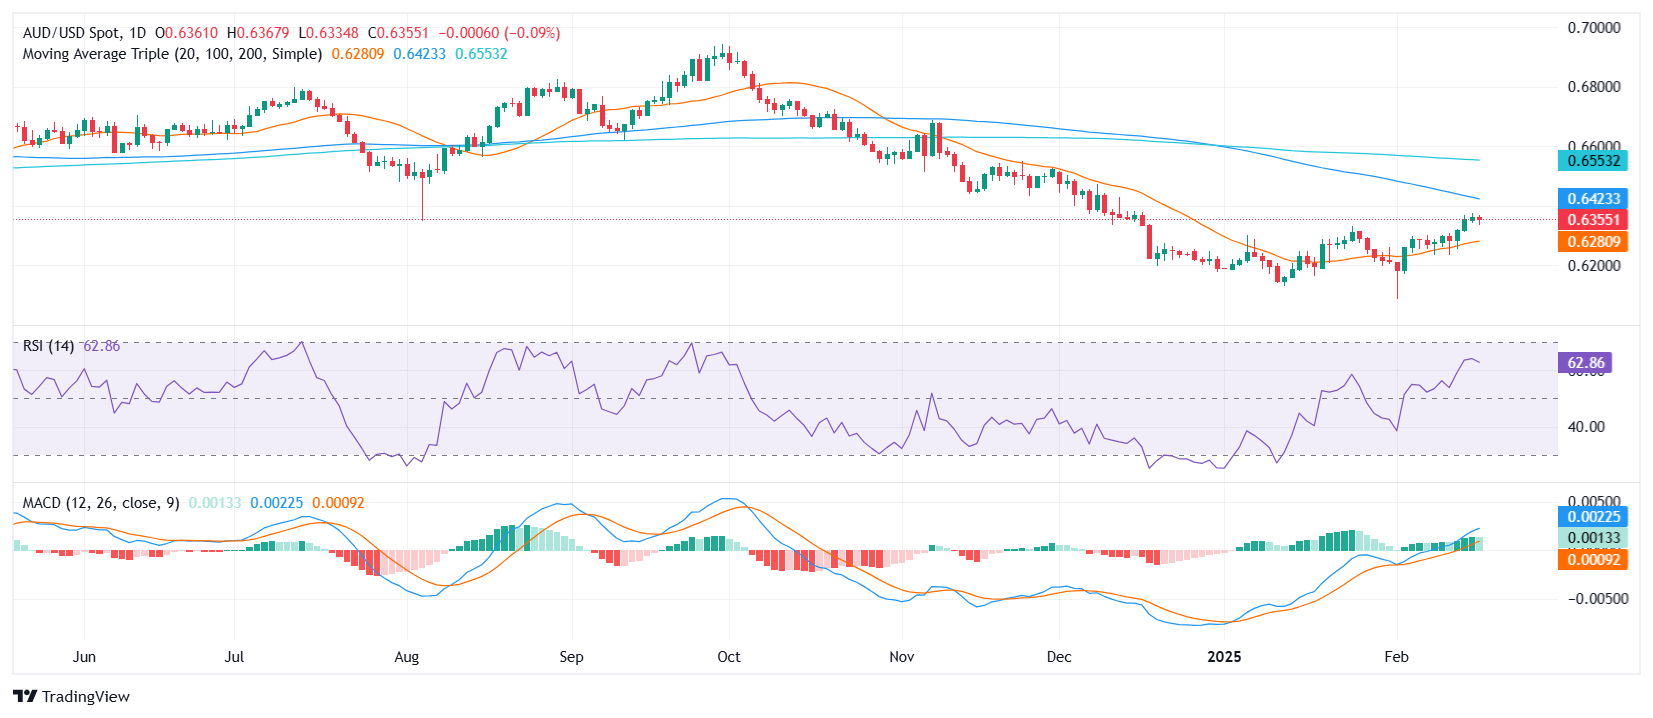
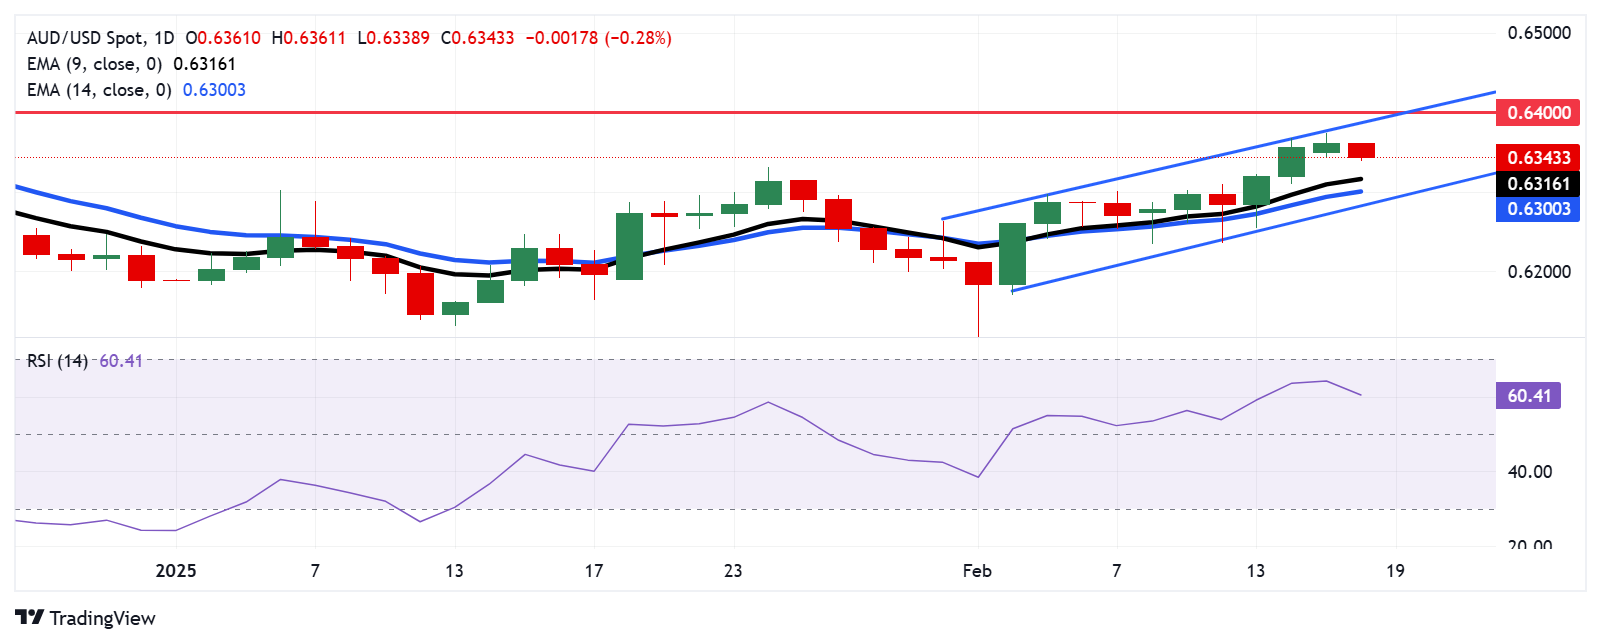
AUD/USD technical outlook: Pair remains above 20-day SMA as momentum stabilizes
The AUD/USD pair slipped 0.16% to 0.6345 on Tuesday, retreating from a multi-day upswing yet still trading near December highs. The Relative Strength Index (RSI) stands at 63, in positive territory but declining sharply, hinting that buying enthusiasm has eased slightly. Meanwhile, the Moving Average Convergence Divergence (MACD) indicator prints rising green bars, reflecting a gradual uptrend as the pair holds above its 20-day Simple Moving Average.
Despite modest losses, the Aussie retains a supportive tone, though a breach below 0.6300 could test bullish commitments. The next major upside target sits around the 100-day Simple Moving Average near 0.6670.
Australian Dollar FAQs
One of the most significant factors for the Australian Dollar (AUD) is the level of interest rates set by the Reserve Bank of Australia (RBA). Because Australia is a resource-rich country another key driver is the price of its biggest export, Iron Ore. The health of the Chinese economy, its largest trading partner, is a factor, as well as inflation in Australia, its growth rate and Trade Balance. Market sentiment – whether investors are taking on more risky assets (risk-on) or seeking safe-havens (risk-off) – is also a factor, with risk-on positive for AUD.
The Reserve Bank of Australia (RBA) influences the Australian Dollar (AUD) by setting the level of interest rates that Australian banks can lend to each other. This influences the level of interest rates in the economy as a whole. The main goal of the RBA is to maintain a stable inflation rate of 2-3% by adjusting interest rates up or down. Relatively high interest rates compared to other major central banks support the AUD, and the opposite for relatively low. The RBA can also use quantitative easing and tightening to influence credit conditions, with the former AUD-negative and the latter AUD-positive.
China is Australia’s largest trading partner so the health of the Chinese economy is a major influence on the value of the Australian Dollar (AUD). When the Chinese economy is doing well it purchases more raw materials, goods and services from Australia, lifting demand for the AUD, and pushing up its value. The opposite is the case when the Chinese economy is not growing as fast as expected. Positive or negative surprises in Chinese growth data, therefore, often have a direct impact on the Australian Dollar and its pairs.
Iron Ore is Australia’s largest export, accounting for $118 billion a year according to data from 2021, with China as its primary destination. The price of Iron Ore, therefore, can be a driver of the Australian Dollar. Generally, if the price of Iron Ore rises, AUD also goes up, as aggregate demand for the currency increases. The opposite is the case if the price of Iron Ore falls. Higher Iron Ore prices also tend to result in a greater likelihood of a positive Trade Balance for Australia, which is also positive of the AUD.
The Trade Balance, which is the difference between what a country earns from its exports versus what it pays for its imports, is another factor that can influence the value of the Australian Dollar. If Australia produces highly sought after exports, then its currency will gain in value purely from the surplus demand created from foreign buyers seeking to purchase its exports versus what it spends to purchase imports. Therefore, a positive net Trade Balance strengthens the AUD, with the opposite effect if the Trade Balance is negative.
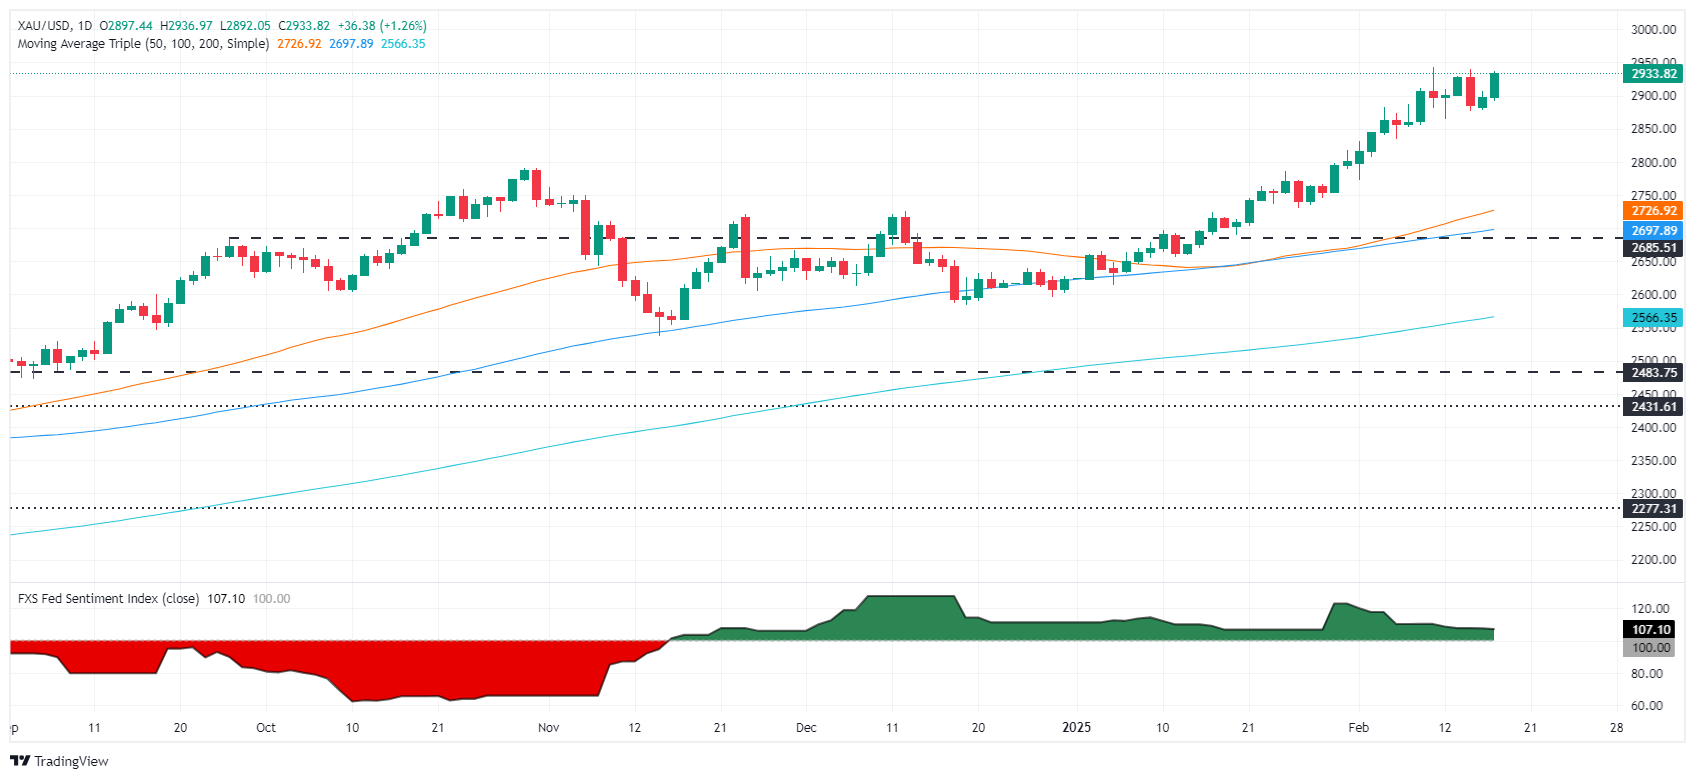
Fed officials remain cautious on inflation, FOMC Minutes in focus this week.
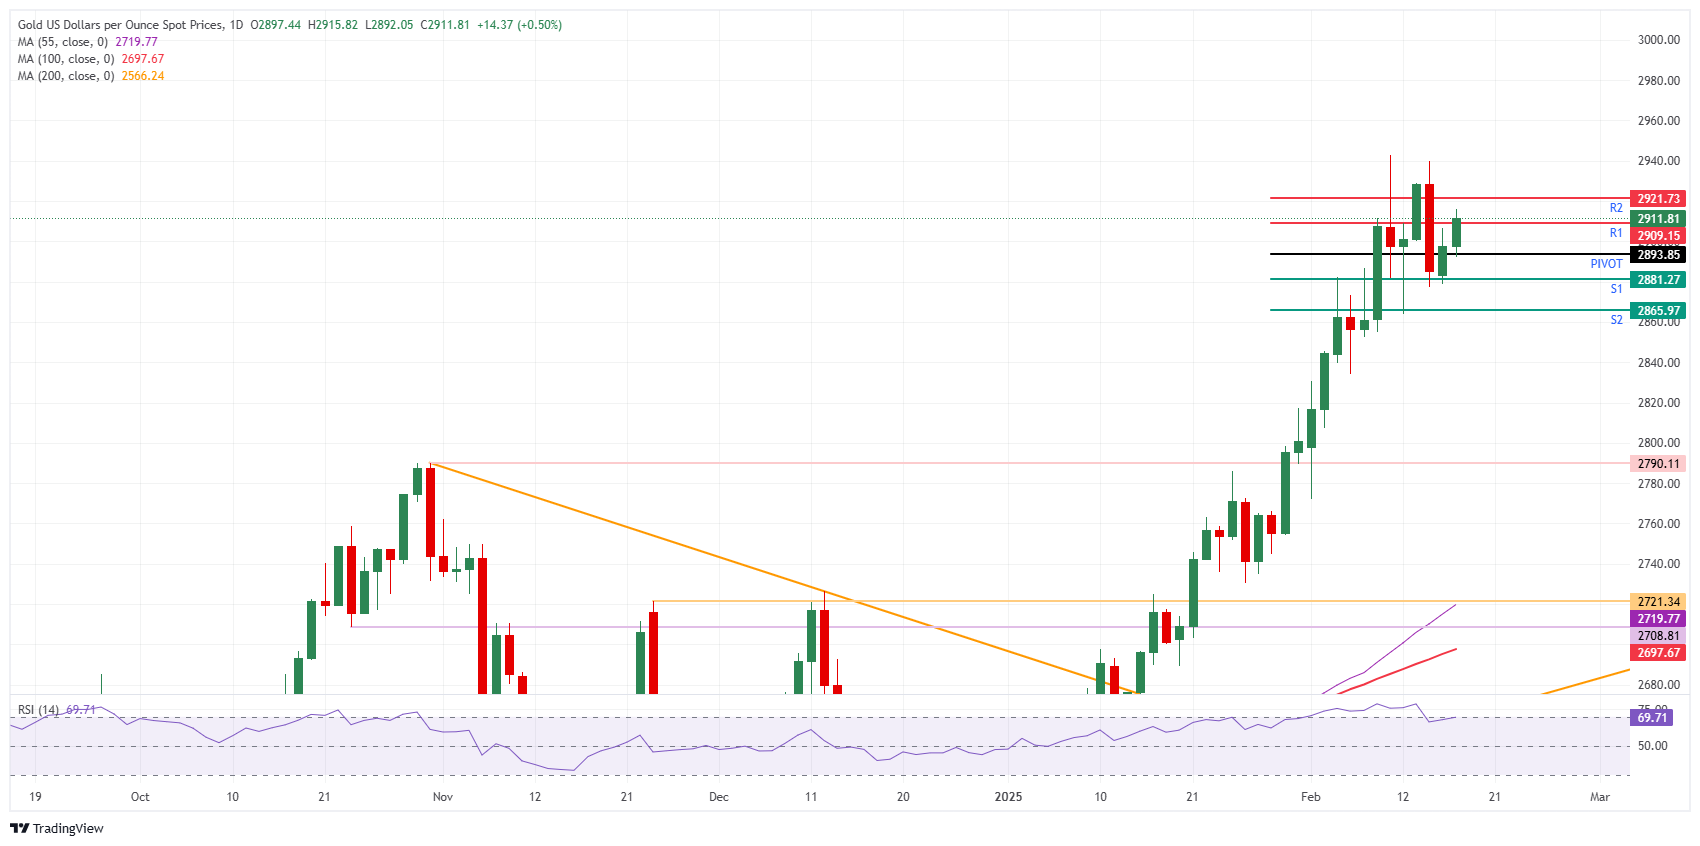
Gold price surged more than 1% on Tuesday due to safe-haven demand amid uncertainty over controversial trade policies proposed by US President Donald Trump. The XAU/USD trades at $2,933 after bouncing off daily lows of $2,892.
The financial markets remain rattled following last week’s US Trump imposition of tariffs on steel and aluminum imports and plans for applying reciprocal duties. Therefore, Bullion prices remain poised to challenge record highs after hitting $2,942 on February 11.
Goldman Sachs upward revised XAU/USD price to $3,100 by year’s end as the investment bank said “structurally higher" central bank demand will add 9% to the price of the non-yielding metal.
After Trump’s victory on November 6, Gold dipped to $2,534 before rallying over 15.90% due to haven and global central bank buying. The World Gold Council (WGC) revealed that central banks purchased more than 54% YoY to 333 tonnes following Trump’s victory, according to its data.
Gold traders should be warned that Federal Reserve (Fed) officials turned slightly skeptical about getting the job done on inflation after the Consumer Price Index (CPI) had risen for five straight months. San Francisco Fed President Mary Daly said, “Policy needs to remain restrictive until…I see that we are really continuing to make progress on inflation.”
Market participants will watch the release of January’s Federal Open Market Committee (FOMC) monetary policy decision, along with housing data, Initial Jobless Claims for the last week, and S&P Global Flash PMIs.
Daily digest market movers: Gold price benefits from safe-haven demand
The US 10-year Treasury bond yield climbs seven basis points (bps), yields 4.55%.
US real yields, which correlate inversely to Bullion prices, rise four-and-a-half basis points to 2.086%, a headwind for Bullion prices.
Fed Governor Christopher Waller stated that his "baseline" expectation is that President Donald Trump's new trade restrictions will have only a limited impact on prices.
Meanwhile, Philadelphia Fed President Patrick Harker reaffirmed support for maintaining a steady interest rate policy, acknowledging that inflation has remained elevated and persistent in recent months.
US Housing Starts for January is expected to decrease from 1.499 million to 1.4 million. At the same time, Building Permits for the same period are expected to drop from 1.482 million to 1.46 million.
Money market fed funds rate futures are pricing in 39 basis points of easing by the Fed in 2025.
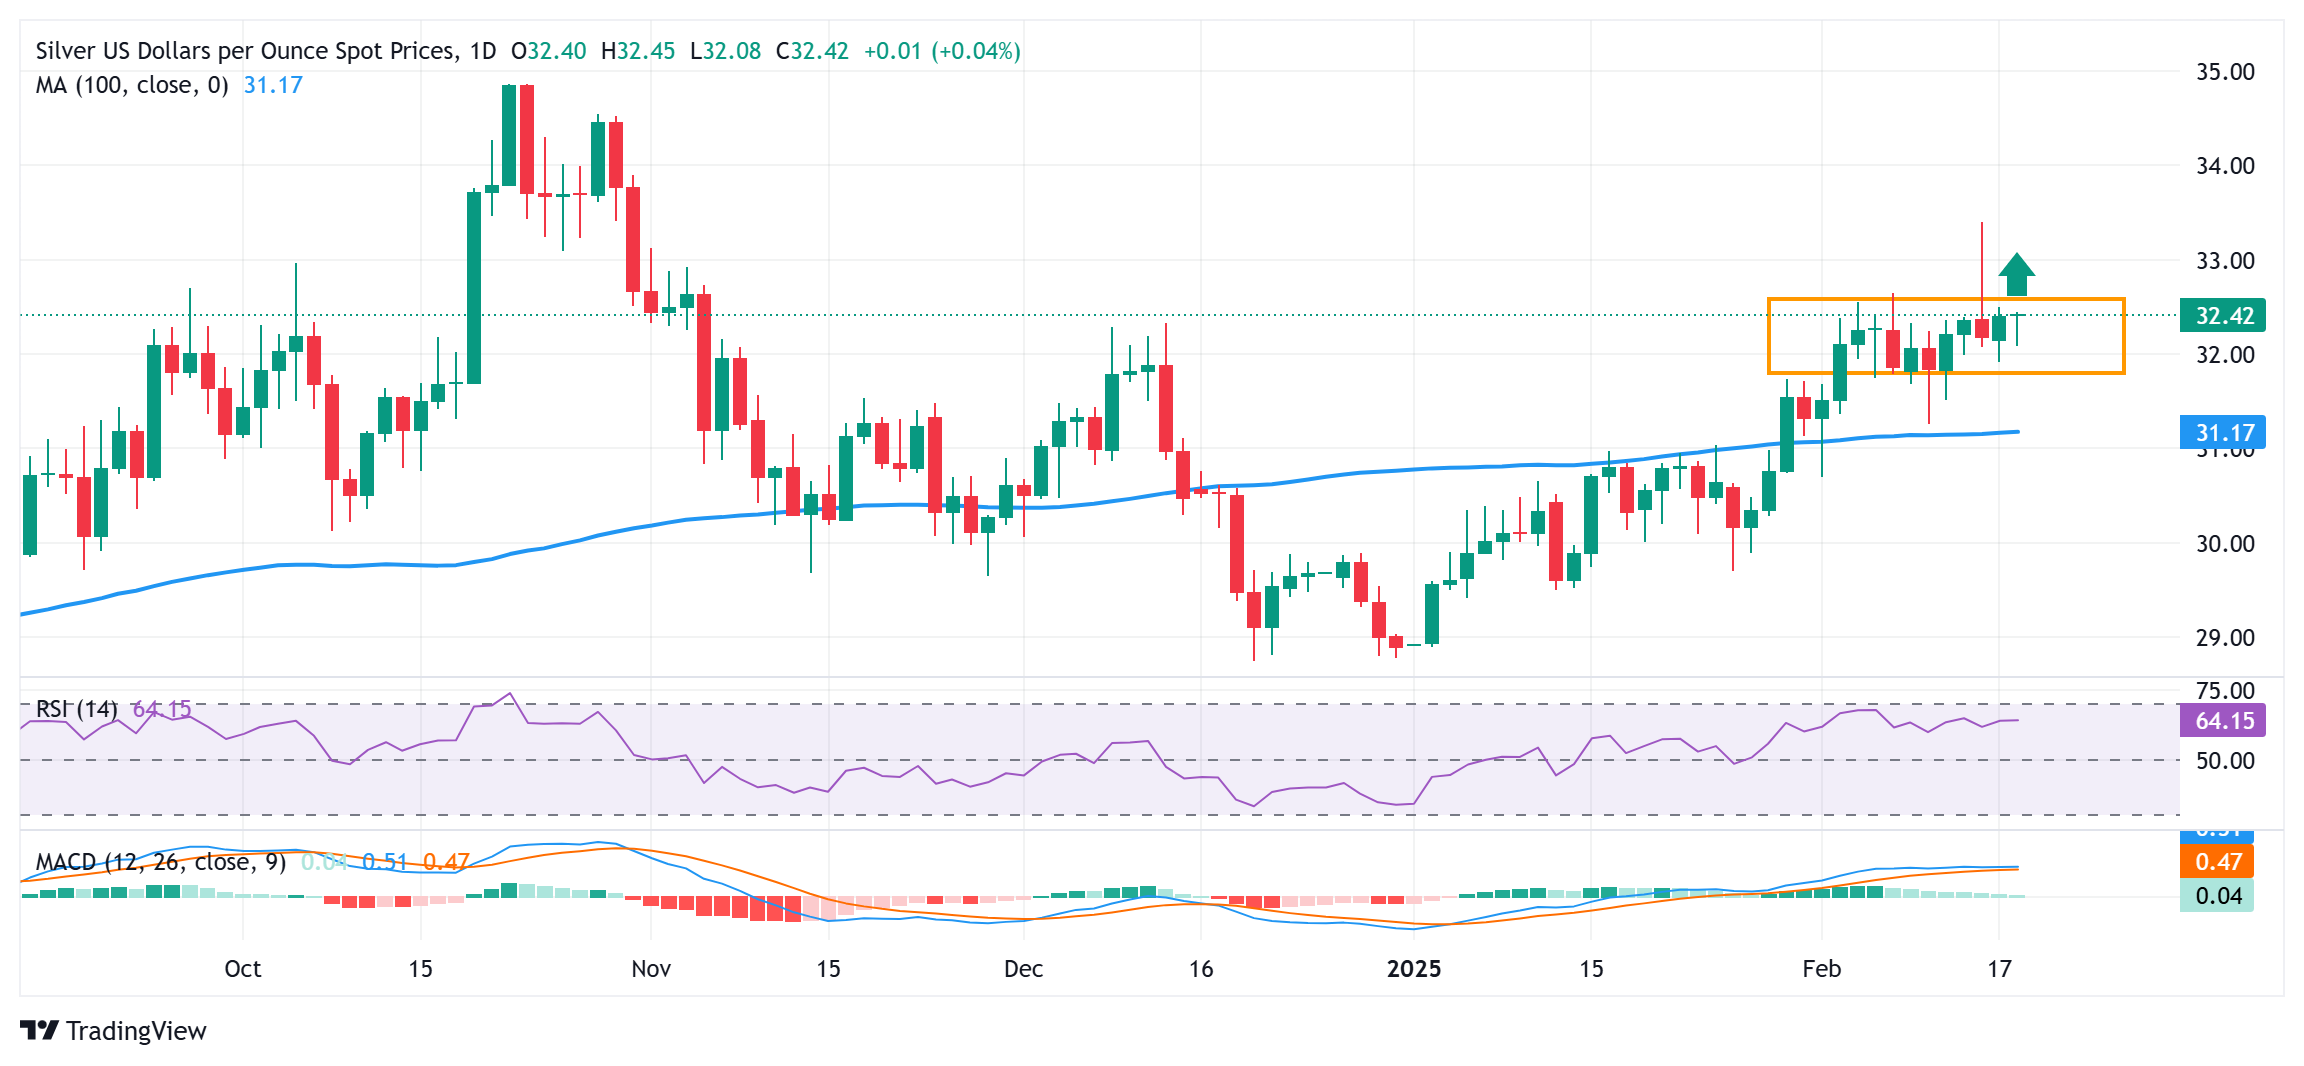
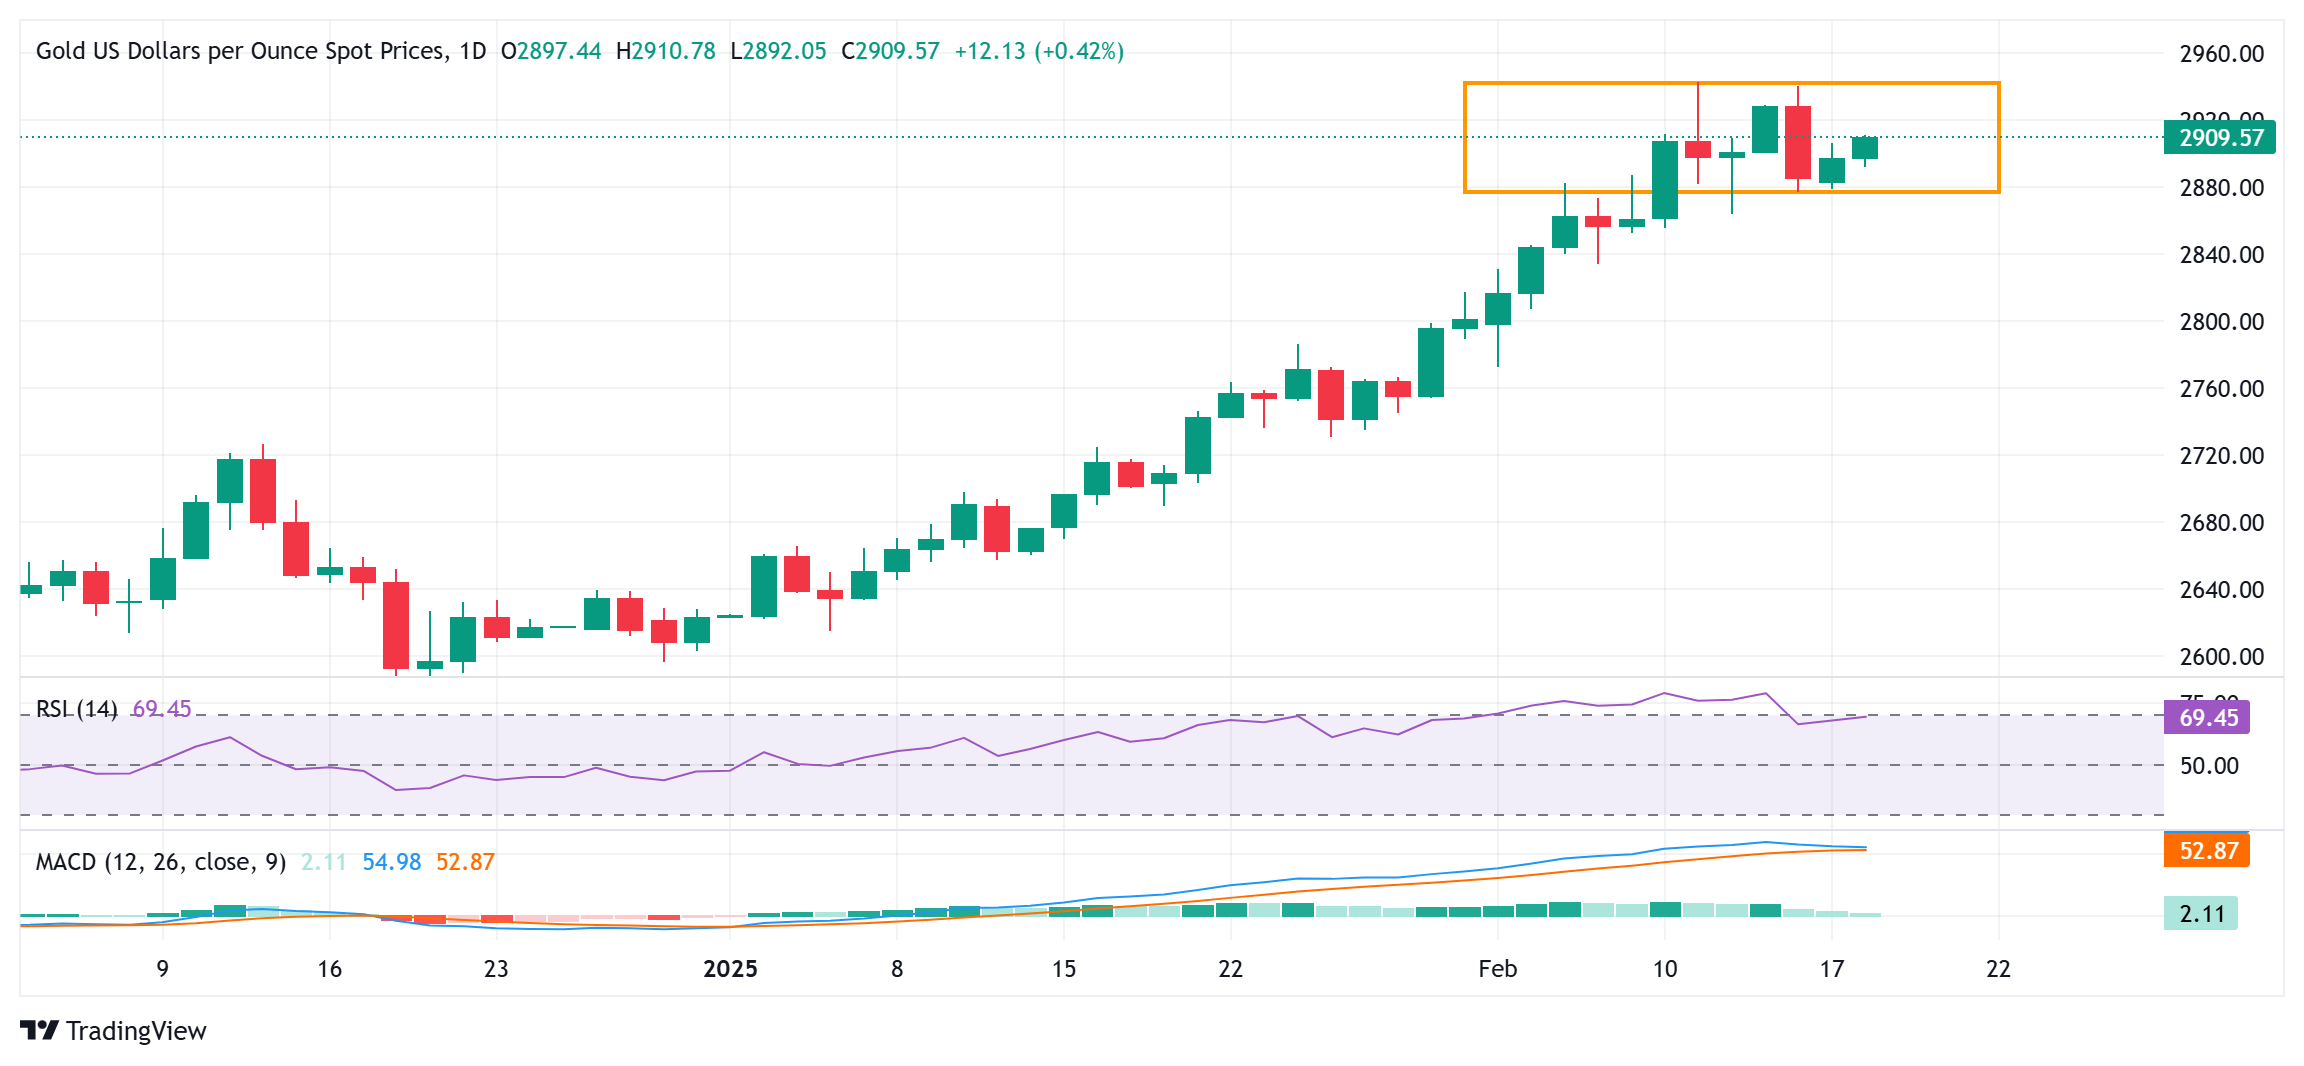
XAU/USD technical outlook: Gold price skyrockets past $2,900
Gold price trend remains up with buyers setting their sights on clearing the all-time high of $2,942. Further key resistance levels lie at $2,950 and the $3,000 mark. It should be said that if those levels are cleared, Goldman Sachs estimated XAU/USD to hit $3,100 by year’s end.
For a bearish continuation, sellers must push the Gold spot price below $2,900. In that outcome, key support levels will be exposed, like the February 14 swing low of $2,877, followed by the February 12 low of $2,864. On further weakness, Gold could fall to test the October 31 swing high at $2,790.
Gold FAQs
Gold has played a key role in human’s history as it has been widely used as a store of value and medium of exchange. Currently, apart from its shine and usage for jewelry, the precious metal is widely seen as a safe-haven asset, meaning that it is considered a good investment during turbulent times. Gold is also widely seen as a hedge against inflation and against depreciating currencies as it doesn’t rely on any specific issuer or government.
Central banks are the biggest Gold holders. In their aim to support their currencies in turbulent times, central banks tend to diversify their reserves and buy Gold to improve the perceived strength of the economy and the currency. High Gold reserves can be a source of trust for a country’s solvency. Central banks added 1,136 tonnes of Gold worth around $70 billion to their reserves in 2022, according to data from the World Gold Council. This is the highest yearly purchase since records began. Central banks from emerging economies such as China, India and Turkey are quickly increasing their Gold reserves.
Gold has an inverse correlation with the US Dollar and US Treasuries, which are both major reserve and safe-haven assets. When the Dollar depreciates, Gold tends to rise, enabling investors and central banks to diversify their assets in turbulent times. Gold is also inversely correlated with risk assets. A rally in the stock market tends to weaken Gold price, while sell-offs in riskier markets tend to favor the precious metal.
The price can move due to a wide range of factors. Geopolitical instability or fears of a deep recession can quickly make Gold price escalate due to its safe-haven status. As a yield-less asset, Gold tends to rise with lower interest rates, while higher cost of money usually weighs down on the yellow metal. Still, most moves depend on how the US Dollar (USD) behaves as the asset is priced in dollars (XAU/USD). A strong Dollar tends to keep the price of Gold controlled, whereas a weaker Dollar is likely to push Gold prices up.
The Reserve Bank of New Zealand is expected to cut its key interest rate by 50 bps to 3.75% on Wednesday.
The RBNZ’s updated forecasts and Governor Orr’s words are likely to offer clues on the policy outlook.
The New Zealand Dollar is set to rock on the RBNZ policy announcements.
The Reserve Bank of New Zealand (RBNZ) is widely expected to lower the Official Cash Rate (OCR) by another 50 basis points (bps) from 4.25% to 3.75% when it announces its interest rate decision on Wednesday at 01:00 GMT.
Most economists polled by Reuters predicted a 50 bps rate reduction at the February policy meeting. The RBNZ has delivered a cumulative 125 bps of cuts since August last year. Therefore, the central bank’s hints on future rate cuts could trigger a big reaction in the New Zealand Dollar (NZD).
What to expect from the RBNZ interest rate decision?
At its November meeting, RBNZ Governor Adrian Orr explicitly anticipated a 50 bps cut this month, noting that “if economic conditions continue to evolve as projected, the committee expects to be able to lower the OCR further early next year.”
Orr added that he was “confident domestic inflation pressures will continue to ease.”
The decision was backed by concerns over the economic slowdown and inflation returning to the central bank’s target range between 1% and 3%. New Zealand’s annual Consumer Price Index (CPI) rose 2.2% in the third quarter (Q3) of 2024, aligning with market forecasts and marking a sharp slowdown from the 3.3% growth in the prior quarter.
Since then, New Zealand’s economy entered a recession in Q3, with Gross Domestic Product (GDP) declining 1% from the previous quarter’s revised 1.1% contraction. Economists expected a 0.4% decrease in the reported period.
Despite its move front-load policy easing in November, the RBNZ maintained that the “economic activity in New Zealand is subdued,” leaving room for additional rate cuts this year.
“The swaps market agrees and sees the policy bottoming near 3.25% over the next 12 months,” according to the BBH analysts. This outpaces the Bank’s projection of peak OCR in December 2025 at 3.55%.
Against this backdrop, the language of the Monetary Policy Statement (MPS) and the updated economic projections will be key to gauging the scope and timing of future rate reductions.
How will the RBNZ interest decision impact the New Zealand Dollar?
In the lead-up to the RBNZ showdown, the NZD/USD pair is at its highest in four weeks at 0.5750, helped by easing tensions surrounding United States (US) President Donald Trump’s tariffs and a broad-based US Dollar (USD) downtrend.
The New Zealand Dollar could reverse sharply from near the monthly peak against the USD if the RBNZ fans further rate cut expectations. Another downward revision to the OCR forecasts could also smash the NZD/USD pair.
In case the RBNZ hints at slowing its pace of easing or maintains the OCR projections, the NZD could see a fresh upside across the board.
Dhwani Mehta, FXStreet’s Senior Analyst, offers a brief technical outlook for trading the New Zealand Dollar on the RBNZ policy announcements: “The upside risks remain intact for the NZD/USD after a Bull Cross was confirmed on the daily chart last Friday. Adding credence to the bearishness, the 14-day Relative Strength Index (RSI) holds well above the 50 level, despite the latest downturn.”
“If buyers regain control, the initial resistance is seen at the 21-day Simple Moving Average (SMA) at 0.5814, above which the November 29 2024 high of 0.5930 will be challenged. Further up, the 0.6000 round level will offer stiff resistance. Conversely, strong support is seen near 0.5660, where the 21-day SMA and 50-day SMA hang around. Failure to defend the confluence support could trigger a fresh downside toward the February 3 low of 0.5516,” Dhwani adds.
Economic Indicator
RBNZ Interest Rate Decision
The Reserve Bank of New Zealand (RBNZ) announces its interest rate decision after its seven scheduled annual policy meetings. If the RBNZ is hawkish and sees inflationary pressures rising, it raises the Official Cash Rate (OCR) to bring inflation down. This is positive for the New Zealand Dollar (NZD) since higher interest rates attract more capital inflows. Likewise, if it reaches the view that inflation is too low it lowers the OCR, which tends to weaken NZD.
The Reserve Bank of New Zealand (RBNZ) holds monetary policy meetings seven times a year, announcing their decision on interest rates and the economic assessments that influenced their decision. The central bank offers clues on the economic outlook and future policy path, which are of high relevance for the NZD valuation. Positive economic developments and upbeat outlook could lead the RBNZ to tighten the policy by hiking interest rates, which tends to be NZD bullish. The policy announcements are usually followed by Governor Adrian Orr’s press conference.
Central banks FAQs
Central Banks have a key mandate which is making sure that there is price stability in a country or region. Economies are constantly facing inflation or deflation when prices for certain goods and services are fluctuating. Constant rising prices for the same goods means inflation, constant lowered prices for the same goods means deflation. It is the task of the central bank to keep the demand in line by tweaking its policy rate. For the biggest central banks like the US Federal Reserve (Fed), the European Central Bank (ECB) or the Bank of England (BoE), the mandate is to keep inflation close to 2%.
A central bank has one important tool at its disposal to get inflation higher or lower, and that is by tweaking its benchmark policy rate, commonly known as interest rate. On pre-communicated moments, the central bank will issue a statement with its policy rate and provide additional reasoning on why it is either remaining or changing (cutting or hiking) it. Local banks will adjust their savings and lending rates accordingly, which in turn will make it either harder or easier for people to earn on their savings or for companies to take out loans and make investments in their businesses. When the central bank hikes interest rates substantially, this is called monetary tightening. When it is cutting its benchmark rate, it is called monetary easing.
A central bank is often politically independent. Members of the central bank policy board are passing through a series of panels and hearings before being appointed to a policy board seat. Each member in that board often has a certain conviction on how the central bank should control inflation and the subsequent monetary policy. Members that want a very loose monetary policy, with low rates and cheap lending, to boost the economy substantially while being content to see inflation slightly above 2%, are called ‘doves’. Members that rather want to see higher rates to reward savings and want to keep a lit on inflation at all time are called ‘hawks’ and will not rest until inflation is at or just below 2%.
Normally, there is a chairman or president who leads each meeting, needs to create a consensus between the hawks or doves and has his or her final say when it would come down to a vote split to avoid a 50-50 tie on whether the current policy should be adjusted. The chairman will deliver speeches which often can be followed live, where the current monetary stance and outlook is being communicated. A central bank will try to push forward its monetary policy without triggering violent swings in rates, equities, or its currency. All members of the central bank will channel their stance toward the markets in advance of a policy meeting event. A few days before a policy meeting takes place until the new policy has been communicated, members are forbidden to talk publicly. This is called the blackout period.
The US Dollar managed to regain some balance and stage a tepid rebound helped by the resumption of concerns over US tariffs, as well as a widespread selling pressure in the risk-linked universe.
Here is what you need to know on Wednesday, February 19:
The US Dollar Index (DXY) regained the smile and reversed a multi-day bearish move, briefly trespassing the key 107.00 hurdle on Tuesday. The usual MBA Mortgage Applications are due seconded by Building Permits, Housing Starts, the FOMC Minutes and the API’s weekly report on US crude oil inventories. In addition, the Fed’s Jefferson is expected to speak.
EUR/USD added to Monday’s rejection from recent yearly peaks north of the 1.0500 barrier. The Current Account results in the euro area will be published, followed by the European Commission’s Winter Forecasts.
GBP/USD’s three-day advance met some resistance past 1.2600 the figure, giving away part of the recent strong gains. The publication of UK inflation figures will take centre stage.
Renewed depreciation of the Japanese yen encouraged USD/JPY to reverse the recent bearish move and end the day with humble gains. The Balance of Trade readings and Machinery Orders are due on the Japanese calendar.
AUD/USD struggled to maintain its bullish bias, although it managed well to keep business well above the key 0.6300 level. The Westpac Leading Index and the quarterly Wage Price Index will be released in Oz.
WTI prices added to the optimism seen at the beginning of the week and retested the key $72.00 mark per barrel following renewed supply concerns.
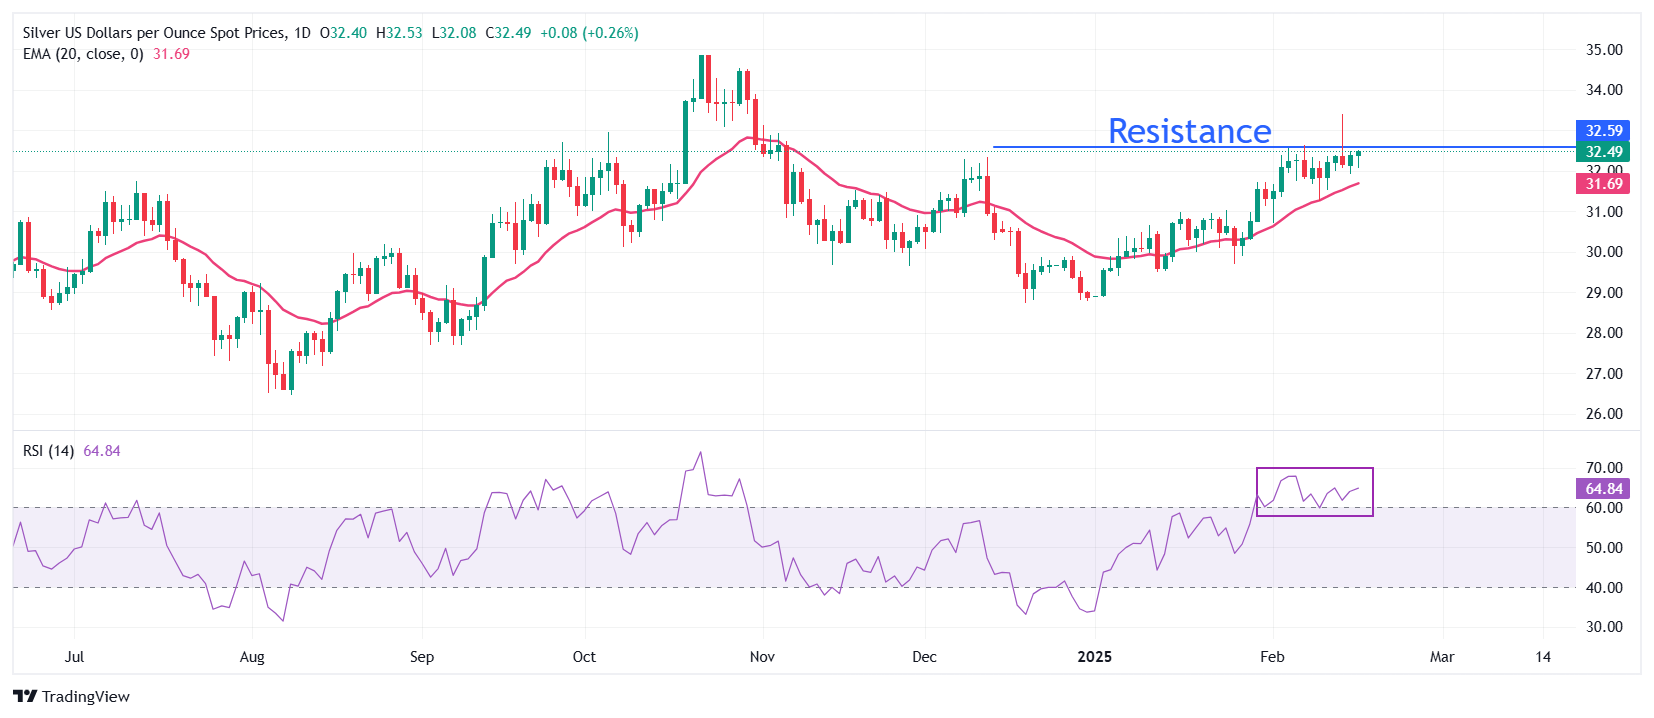
Gold prices extended the auspicious start to the week and climbed further north of the $2,900 mark per ounce troy following the resurgence of the tariff narrative and safe haven demand. Silver prices rallied past the $32.00 mark per ounce to clock weekly peaks.
18:59
Argentina Trade Balance (MoM) registered at $142M, below expectations ($800M) in January
The Canadian Dollar covered little ground on Tuesday, holding flat against the Greenback.
Canadian CPI inflation rose in January, with core CPI metrics climbing more than expected.
The Loonie remains hampered near key technical levels as bullish momentum evaporates.
The Canadian Dollar (CAD) traded blows with the US Dollar (USD) on Tuesday, keeping USD/CAD stead near the 1.4200 handle as Loonie traders try to hang onto their recent gains. Canadian Consumer Price Index (CPI) inflation figures came in as-expected, though there was an acceleration in Bank of Canada (BoC) core CPI metrics.
Canadian headline CPI inflation rose slightly in January, matching median market forecasts but not rising significantly enough to threaten the BoC’s current stance on rate cuts. However, core CPI inflation as tracked by the BoC also accelerated to an 11-month high, which could put pressure on the Canadian central bank to slow its pace of rate cutting through the remainder of the year.
Daily digest market movers: Canadian Dollar flatlines on mixed inflation prints
Canada’s headline CPI inflation print rose to 1.9% YoY, matching forecasts and ticking up from the previous print of 1.8%.
Core BoC CPI inflation accelerated to 2.1% YoY, climbing from the previous 1.8% as core prices accelerated at their fastest pace in nearly a year.
Core BoC CPI inflation growth was almost entirely front-loaded, with January’s MoM figure rising to 0.4% from the previous -0.3% contraction.
Rate differentials continue to matter heavily for USD/CAD, and traders will be watching for the latest Meeting Minutes from the Federal Reserve (Fed), due on Wednesday.
Loonie markets are largely huddled around possible tariffs looming ahead. US President Donald Trump’s plans for sweeping tariffs against all of the US’ key trading allies have been kicked down the road to April, but the looming threat has hampered trending activity in currency markets.
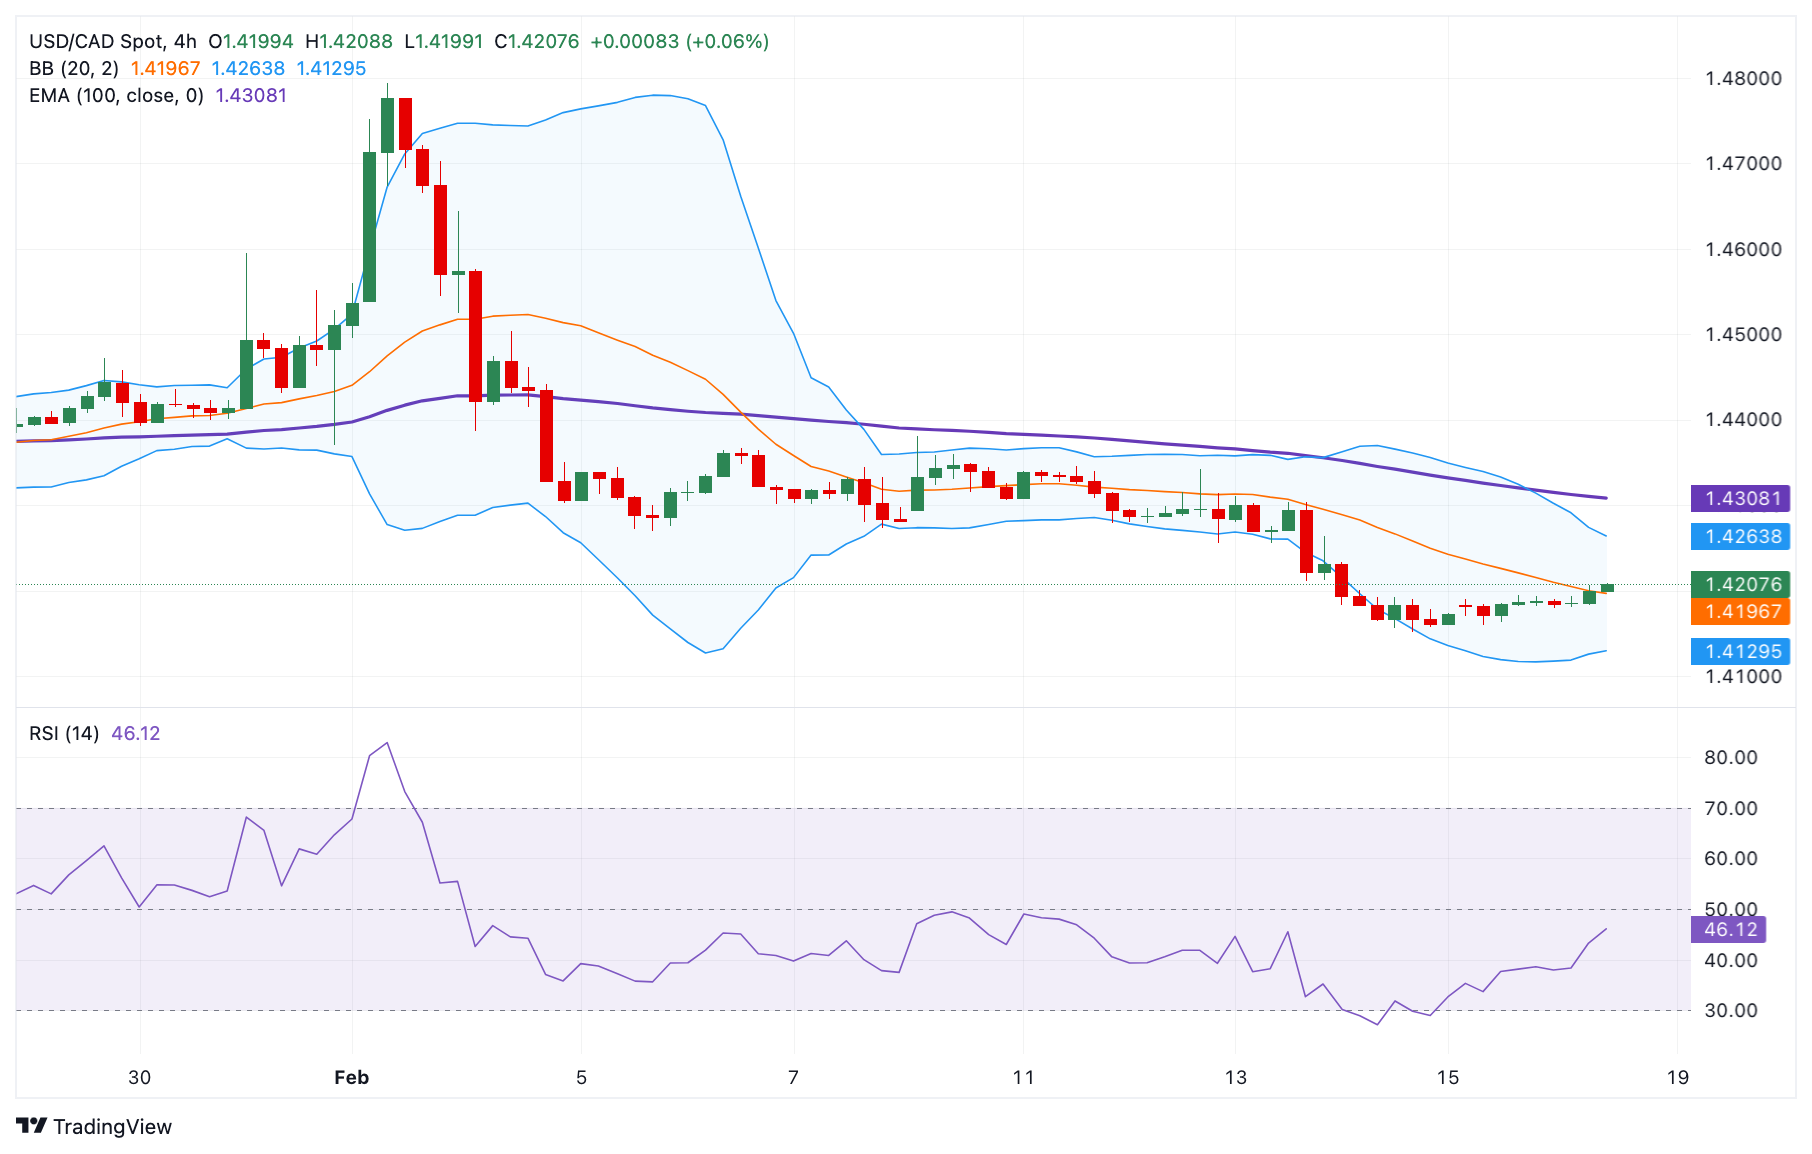
Canadian Dollar price forecast
The Canadian Dollar continues to hang onto recently-gained ground, keeping USD/CAD pressed into neutral-to-bearish territory at the 1.4200 handle. Price action remains trapped below the 50-day Exponential Moving Average (EMA) near 1.4280, but further downside remains hampered by a general lack of bullish momentum behind the Loonie.
USD/CAD daily chart
Canadian Dollar FAQs
The key factors driving the Canadian Dollar (CAD) are the level of interest rates set by the Bank of Canada (BoC), the price of Oil, Canada’s largest export, the health of its economy, inflation and the Trade Balance, which is the difference between the value of Canada’s exports versus its imports. Other factors include market sentiment – whether investors are taking on more risky assets (risk-on) or seeking safe-havens (risk-off) – with risk-on being CAD-positive. As its largest trading partner, the health of the US economy is also a key factor influencing the Canadian Dollar.
The Bank of Canada (BoC) has a significant influence on the Canadian Dollar by setting the level of interest rates that banks can lend to one another. This influences the level of interest rates for everyone. The main goal of the BoC is to maintain inflation at 1-3% by adjusting interest rates up or down. Relatively higher interest rates tend to be positive for the CAD. The Bank of Canada can also use quantitative easing and tightening to influence credit conditions, with the former CAD-negative and the latter CAD-positive.
The price of Oil is a key factor impacting the value of the Canadian Dollar. Petroleum is Canada’s biggest export, so Oil price tends to have an immediate impact on the CAD value. Generally, if Oil price rises CAD also goes up, as aggregate demand for the currency increases. The opposite is the case if the price of Oil falls. Higher Oil prices also tend to result in a greater likelihood of a positive Trade Balance, which is also supportive of the CAD.
While inflation had always traditionally been thought of as a negative factor for a currency since it lowers the value of money, the opposite has actually been the case in modern times with the relaxation of cross-border capital controls. Higher inflation tends to lead central banks to put up interest rates which attracts more capital inflows from global investors seeking a lucrative place to keep their money. This increases demand for the local currency, which in Canada’s case is the Canadian Dollar.
Macroeconomic data releases gauge the health of the economy and can have an impact on the Canadian Dollar. Indicators such as GDP, Manufacturing and Services PMIs, employment, and consumer sentiment surveys can all influence the direction of the CAD. A strong economy is good for the Canadian Dollar. Not only does it attract more foreign investment but it may encourage the Bank of Canada to put up interest rates, leading to a stronger currency. If economic data is weak, however, the CAD is likely to fall.
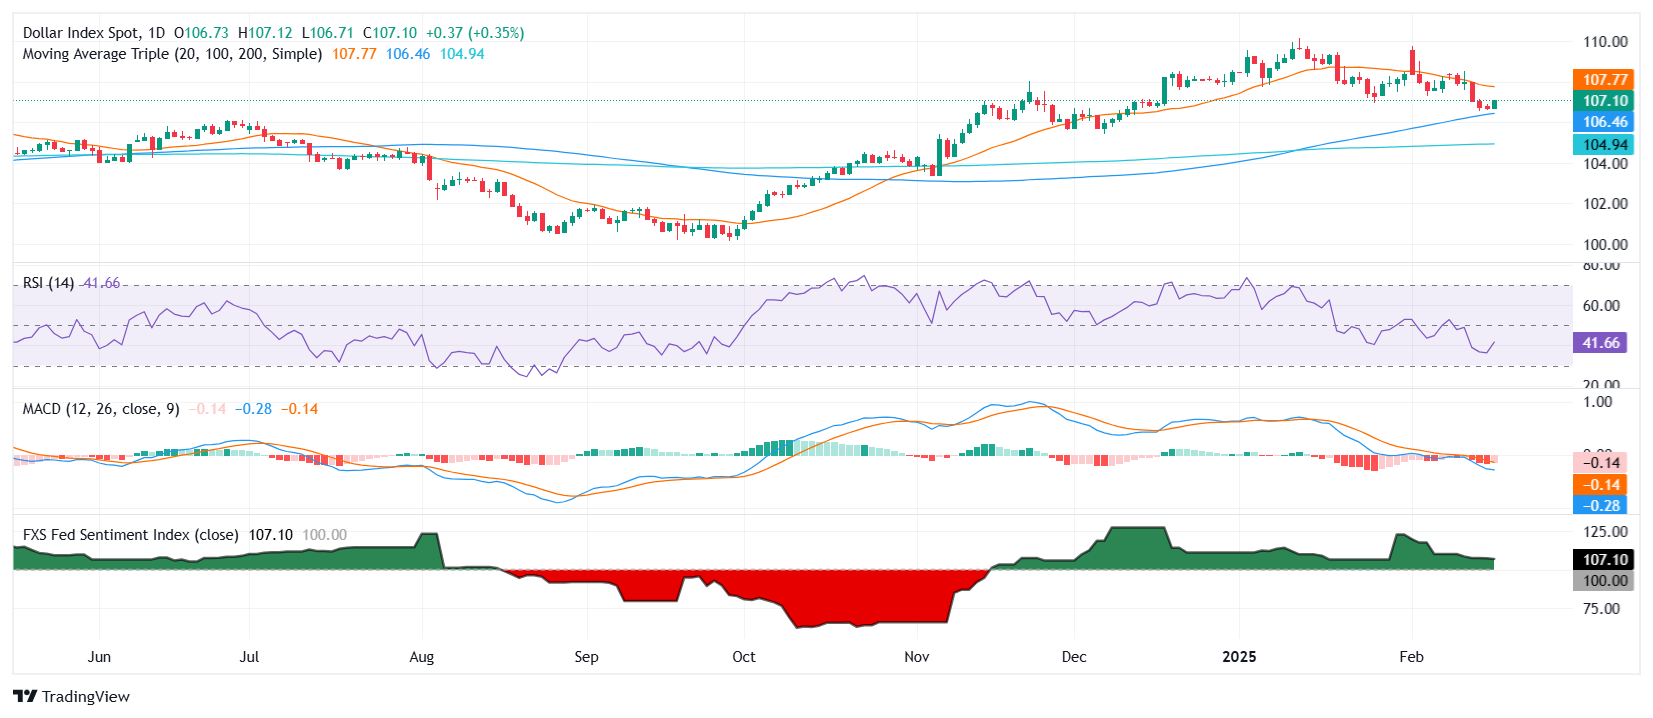
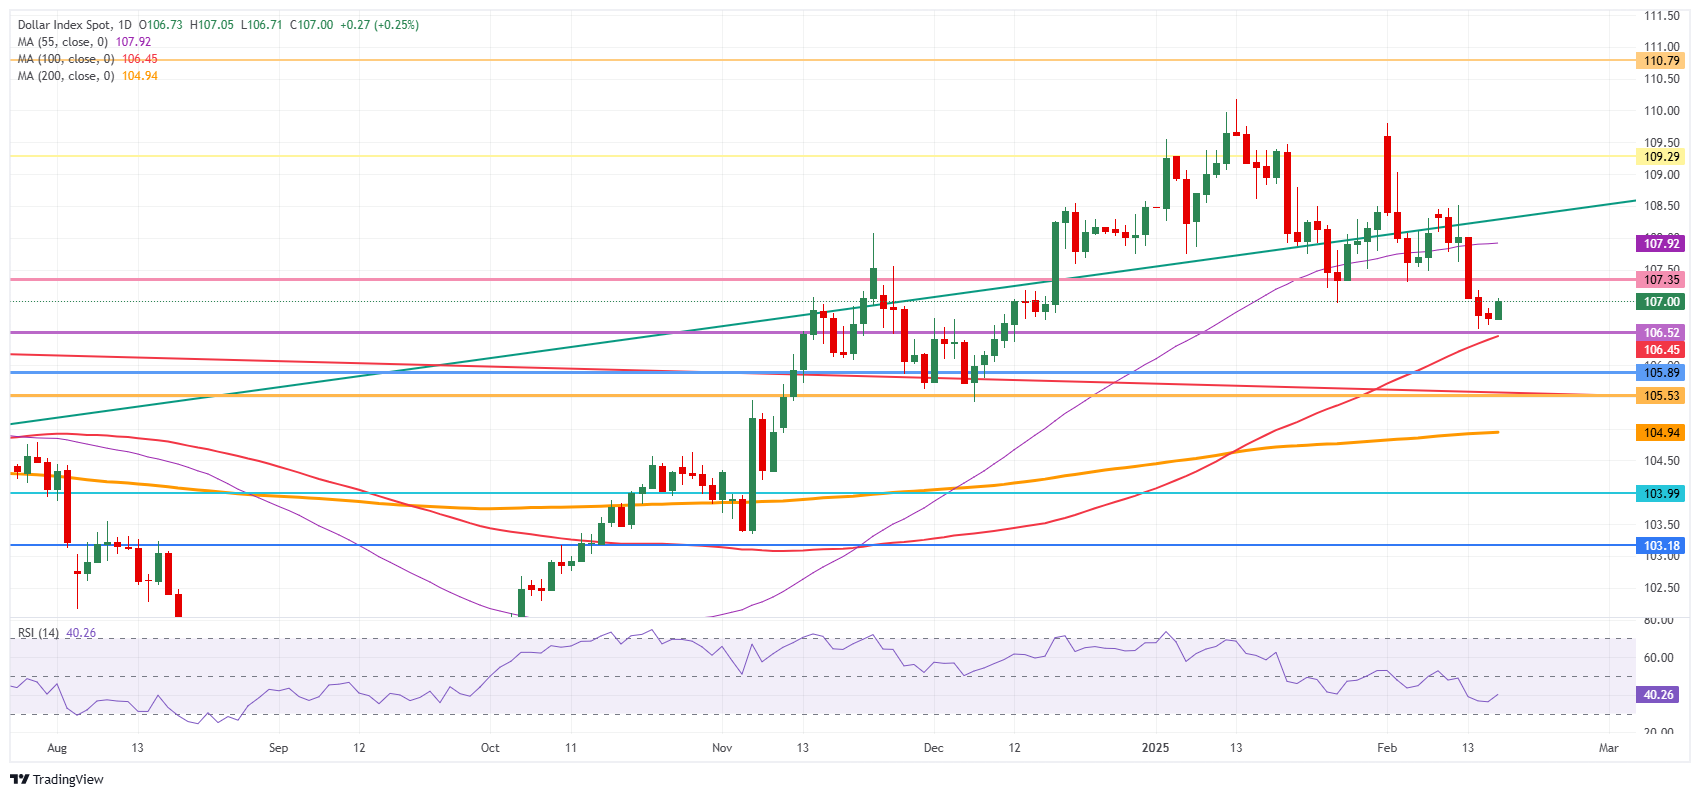
The DXY climbs above 107.00 amid geopolitical tensions.
Russia sees no reason for a Trump-Putin meeting as demands remain unresolved.
Empire State Manufacturing Index surprises with a return to positive territory.
The US Dollar Index (DXY), which tracks the US Dollar's (USD) performance against six major currencies, rises on Tuesday as traders react to discouraging headlines from the United States (US)-Russia talks in Riyadh. Despite efforts to negotiate a ceasefire or peace deal for Ukraine, Russia has dismissed the need for a Trump-Putin meeting this month, citing ongoing demands. At the time of writing, the DXY hovers above 107.00, fueled by geopolitical uncertainties.
Daily digest market movers: US Dollar rises as Russia dismisses Trump-Putin meeting
Geopolitical risks support the US Dollar as US-Russia talks in Riyadh show no progress.
Russia states that a Trump-Putin meeting is unnecessary due to unresolved demands and the previous sparks of hope of a hypothetical ceasefire seem to be fading away.
On the Ukrainian side, President Volodymyr Zelensky commented that “fair” negotiations to end the war with Russia must involve Ukraine and Europe, also contributing to a negative market environment.
On the data front, the New York Empire State Manufacturing Index for February jumped to positive territory after months of contraction but had little impact on the USD.
Federal Reserve officials continue to assess the impact of holding interest rates steady and maintain a cautious stance. In fact, the Fed’s sentiment index on the daily chart continues to be stuck in hawkish terrain.
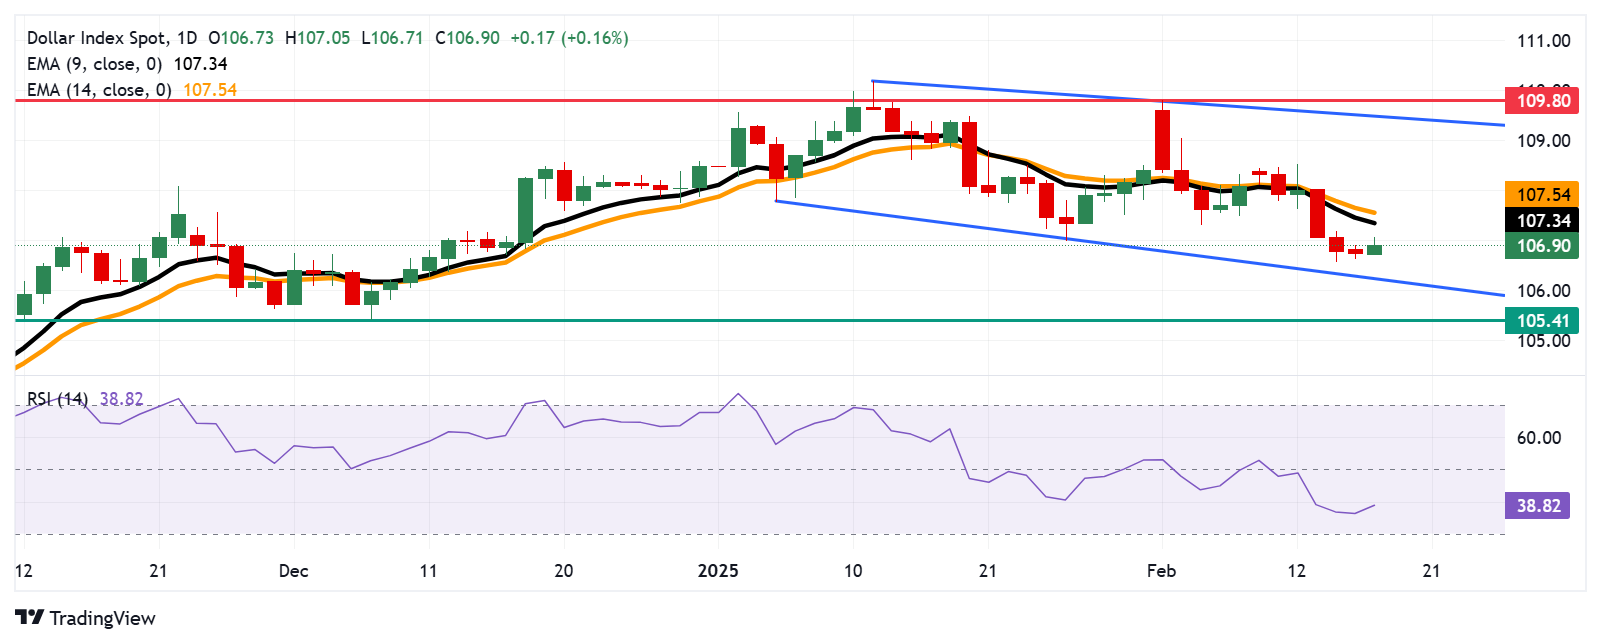
DXY technical outlook: Key resistance at 107.50, but downside risks persist
The US Dollar Index struggles to sustain gains after reclaiming the 107.00 level. Despite this mild rebound, the 20-day Simple Moving Average (SMA) remains a key resistance after being lost last week. The Relative Strength Index (RSI) is entrenched in negative territory, while the Moving Average Convergence Divergence (MACD) signals steady bearish momentum. Immediate support is seen at the 100-day SMA at 106.30, and a break below this level could confirm a short-term bearish outlook. Bulls need stronger momentum to challenge 107.50.
US Dollar FAQs
The US Dollar (USD) is the official currency of the United States of America, and the ‘de facto’ currency of a significant number of other countries where it is found in circulation alongside local notes. It is the most heavily traded currency in the world, accounting for over 88% of all global foreign exchange turnover, or an average of $6.6 trillion in transactions per day, according to data from 2022. Following the second world war, the USD took over from the British Pound as the world’s reserve currency. For most of its history, the US Dollar was backed by Gold, until the Bretton Woods Agreement in 1971 when the Gold Standard went away.
The most important single factor impacting on the value of the US Dollar is monetary policy, which is shaped by the Federal Reserve (Fed). The Fed has two mandates: to achieve price stability (control inflation) and foster full employment. Its primary tool to achieve these two goals is by adjusting interest rates. When prices are rising too quickly and inflation is above the Fed’s 2% target, the Fed will raise rates, which helps the USD value. When inflation falls below 2% or the Unemployment Rate is too high, the Fed may lower interest rates, which weighs on the Greenback.
In extreme situations, the Federal Reserve can also print more Dollars and enact quantitative easing (QE). QE is the process by which the Fed substantially increases the flow of credit in a stuck financial system. It is a non-standard policy measure used when credit has dried up because banks will not lend to each other (out of the fear of counterparty default). It is a last resort when simply lowering interest rates is unlikely to achieve the necessary result. It was the Fed’s weapon of choice to combat the credit crunch that occurred during the Great Financial Crisis in 2008. It involves the Fed printing more Dollars and using them to buy US government bonds predominantly from financial institutions. QE usually leads to a weaker US Dollar.
Quantitative tightening (QT) is the reverse process whereby the Federal Reserve stops buying bonds from financial institutions and does not reinvest the principal from the bonds it holds maturing in new purchases. It is usually positive for the US Dollar.
Mexican Peso strengthens despite Fed officials warning of stalled disinflation.
Mexico’s Retail Sales and Q4 GDP are expected to show an economic slowdown.
Banxico minutes could offer clues on potential 50 bps rate cuts.
The Mexican Peso (MXN) rallied for the sixth consecutive day amid an upbeat market mood, which keeps risk-sensitive currencies appreciating despite some Federal Reserve (Fed) officials turning slightly hawkish. At the time of writing, USD/MXN trades at 20.22, down 0.27%.
Mexico’s economic docket remained absent earlier in the week, though Retail Sales data and Banco de Mexico (Banxico) minutes of its last meeting could drive price action on Thursday. Towards the end of the week, Gross Domestic Product (GDP) figures would be of interest to USD/MXN traders.
Retail Sales in December are expected to show Mexico’s economy slowdown. The final GDP reading for Q4 2024 is expected to show a contraction on a quarterly basis and is foreseen to expand annually.
Meanwhile, investors await Banxico’s minutes, which will help them gather clues about the intention of reducing rates at a 50 basis point (bps) pace during the year.
In other news, Marcelo Ebrard, Mexico’s Secretary of Economy, revealed that he would meet this Thursday with his counterparts from the United States (US) government in Washington to discuss matters regarding tariffs and bilateral economic integration.
In the US, Federal Reserve officials turned cautious after the disinflation process stalled, as the Consumer Price Index (CPI) had risen for five straight months. San Francisco Fed President Mary Daly said during a conference in Arizona: “Policy needs to remain restrictive until… I see that we are really continuing to make progress on inflation.”
Monetary policy divergence between Banxico and the Fed favors further USD/MXN upside. The Fed is expected to keep rates steady, while Banxico is foreseen to cut rates again by 50 basis points in the next meeting.
Fed Governor Christopher Waller said that his "baseline" view was that US President Donald Trump's new trade restrictions would have only a modest impact on prices. Philadelphia Fed President Patrick Harker supported a steady interest-rate policy stance as he acknowledged that inflation has remained elevated and persistent in recent months.
The US Dollar Index (DXY), which tracks the buck's performance against a basket of currencies, edges up 0.29%, at 107.04, usually a tailwind for USD/MXN.
According to the December 2025 fed funds interest rate futures contract, the swaps market suggests that the Fed will reduce rates by 39 basis points towards year-end.
Trade disputes between the US and Mexico remain in the boiler room. Although the countries found common ground previously, USD/MXN traders should know that there is a 30-day pause and that tensions could arise toward the end of February.
USD/MXN technical outlook: Mexican Peso is steady as USD/MXN is below 50-day SMA
At the time of writing, the USD/MXN pair is testing the 100-day Simple Moving Average (SMA) at 20.24, which, if decisively broken with a daily close below the latter, could pave the way to challenge the 20.00 psychological figure. Although the Relative Strength Index (RSI) remains bearish, its slope is flat, meaning that neither sellers nor buyers are in control.
On the other hand, if USD/MXN climbs past the 50-day SMA at 20.45, the exotic pair could rally to 20.50, followed by the January 17 daily high at 20.93.
Mexican Peso FAQs
The Mexican Peso (MXN) is the most traded currency among its Latin American peers. Its value is broadly determined by the performance of the Mexican economy, the country’s central bank’s policy, the amount of foreign investment in the country and even the levels of remittances sent by Mexicans who live abroad, particularly in the United States. Geopolitical trends can also move MXN: for example, the process of nearshoring – or the decision by some firms to relocate manufacturing capacity and supply chains closer to their home countries – is also seen as a catalyst for the Mexican currency as the country is considered a key manufacturing hub in the American continent. Another catalyst for MXN is Oil prices as Mexico is a key exporter of the commodity.
The main objective of Mexico’s central bank, also known as Banxico, is to maintain inflation at low and stable levels (at or close to its target of 3%, the midpoint in a tolerance band of between 2% and 4%). To this end, the bank sets an appropriate level of interest rates. When inflation is too high, Banxico will attempt to tame it by raising interest rates, making it more expensive for households and businesses to borrow money, thus cooling demand and the overall economy. Higher interest rates are generally positive for the Mexican Peso (MXN) as they lead to higher yields, making the country a more attractive place for investors. On the contrary, lower interest rates tend to weaken MXN.
Macroeconomic data releases are key to assess the state of the economy and can have an impact on the Mexican Peso (MXN) valuation. A strong Mexican economy, based on high economic growth, low unemployment and high confidence is good for MXN. Not only does it attract more foreign investment but it may encourage the Bank of Mexico (Banxico) to increase interest rates, particularly if this strength comes together with elevated inflation. However, if economic data is weak, MXN is likely to depreciate.
As an emerging-market currency, the Mexican Peso (MXN) tends to strive during risk-on periods, or when investors perceive that broader market risks are low and thus are eager to engage with investments that carry a higher risk. Conversely, MXN tends to weaken at times of market turbulence or economic uncertainty as investors tend to sell higher-risk assets and flee to the more-stable safe havens.
18:06
United States 52-Week Bill Auction climbed from previous 4.025% to 4.05%
The Dow Jones backslid around 300 points early Tuesday following a long weekend.
Equities recovered their footing, pushing back to flat amid a lack of meaningful data.
Latest Fed Meeting Minutes are due on Wednesday as markets watch for signs of rate cuts.
The Dow Jones Industrial Average (DJIA) stumbled out of the gate on Tuesday, declining around 300 points at its lowest following an extended weekend break. Equities somewhat recovered their stance through the US market session, but the Dow Jones remains down around 100 points near 44,450. Stock traders piled back into markets following the President’s Day holiday on Monday, rushing to price in headlines before realizing there wasn’t much to price in.
Another Federal Reserve (Fed) policymaker noted on Tuesday that a murky policy outlook from the Trump administration makes it difficult to nail down a timeline for when the Fed might deliver another rate cut. The Fed’s latest Meeting Minutes are slated for release on Wednesday, but the report is unlikely to sharpen guidance any further. According to the CME’s FedWatch Tool, rate markets are pricing in better-than-even odds that the Fed’s next rate trim will be a 25 bps cut on July 30.
Looking ahead, the next key data print for US markets will be Friday’s upcoming global Purchasing Managers Index (PMI) prints. US PMI survey results are expected to tick slightly higher for both the Manufacturing and Services components.
Dow Jones news
Despite heavy losses in key contributing equities, the Dow Jones was overall tilted into the bullish side on Tuesday. Around two-thirds of the major equity index found room in the green, but sharp contractions in UnitedHealth (UNH) and Home Depot (HD) kept the DJIA on the bearish side.
UNH tumbled 17% on Tuesday, falling below $507 per share after the company resisted calls from shareholders to investigate the true costs of the health company’s logbook of denied and delayed healthcare claims. Shareholders submitted a proposal to do a more accurate cost accounting of UNH’s denial practices, citing “public health-related costs and macroeconomic risks created by the company’s practices that limit or delay access to healthcare”.
Home Depot also shed around 7%, falling below $403 per share after investors balked at underperforming US home sales and a general lack of confidence in price stability in the face of looming tariff action from the US government.
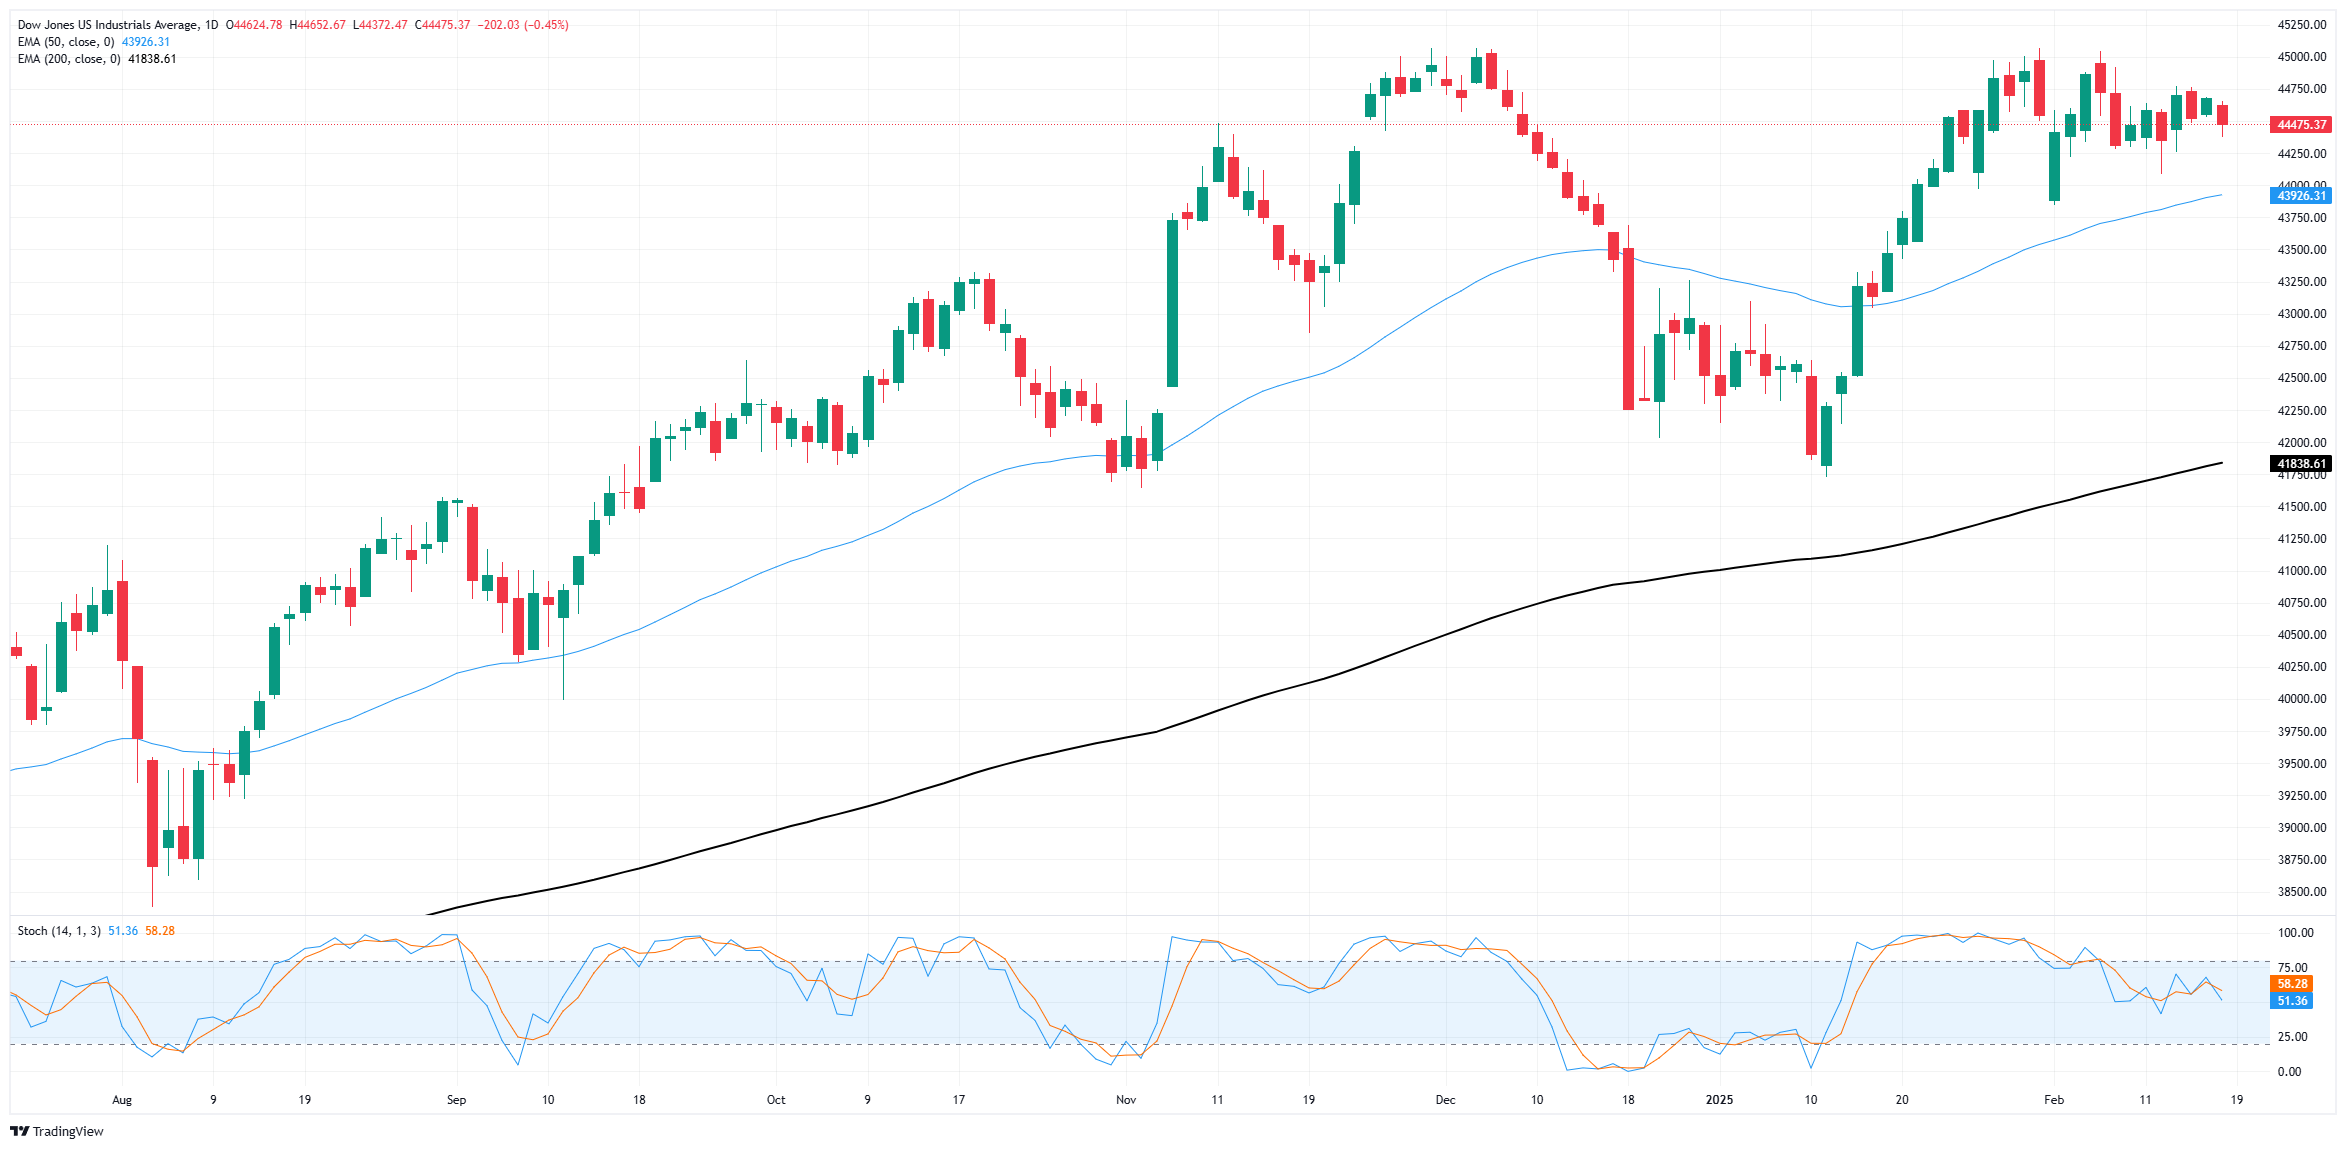
Dow Jones price forecast
Congestion continues to plague the Dow Jones Industrial Average as the major equity index battles near-term consolidation around the 44,500 region. Price action is getting squeezed into a chopping midrange, with a technical ceiling priced in around 44,800 and an immediate floor near the 50-day Exponential Moving Average (EMA) just south of the 44,000 major price handle.
Long-term, the DJIA is holding close enough to all-time highs to keep short interest nervous. The Dow Jones has trended above the 200-day EMA for 15 consecutive months, and is still holding onto gains of 4.7% from the start of the year.
Dow Jones daily chart
Dow Jones FAQs
The Dow Jones Industrial Average, one of the oldest stock market indices in the world, is compiled of the 30 most traded stocks in the US. The index is price-weighted rather than weighted by capitalization. It is calculated by summing the prices of the constituent stocks and dividing them by a factor, currently 0.152. The index was founded by Charles Dow, who also founded the Wall Street Journal. In later years it has been criticized for not being broadly representative enough because it only tracks 30 conglomerates, unlike broader indices such as the S&P 500.
Many different factors drive the Dow Jones Industrial Average (DJIA). The aggregate performance of the component companies revealed in quarterly company earnings reports is the main one. US and global macroeconomic data also contributes as it impacts on investor sentiment. The level of interest rates, set by the Federal Reserve (Fed), also influences the DJIA as it affects the cost of credit, on which many corporations are heavily reliant. Therefore, inflation can be a major driver as well as other metrics which impact the Fed decisions.
Dow Theory is a method for identifying the primary trend of the stock market developed by Charles Dow. A key step is to compare the direction of the Dow Jones Industrial Average (DJIA) and the Dow Jones Transportation Average (DJTA) and only follow trends where both are moving in the same direction. Volume is a confirmatory criteria. The theory uses elements of peak and trough analysis. Dow’s theory posits three trend phases: accumulation, when smart money starts buying or selling; public participation, when the wider public joins in; and distribution, when the smart money exits.
There are a number of ways to trade the DJIA. One is to use ETFs which allow investors to trade the DJIA as a single security, rather than having to buy shares in all 30 constituent companies. A leading example is the SPDR Dow Jones Industrial Average ETF (DIA). DJIA futures contracts enable traders to speculate on the future value of the index and Options provide the right, but not the obligation, to buy or sell the index at a predetermined price in the future. Mutual funds enable investors to buy a share of a diversified portfolio of DJIA stocks thus providing exposure to the overall index.
Federal Reserve (Fed) Bank of San Franciso President Mary Daly noted on Tuesday that prospects of further rate cuts this year remain murky in the face of policy uncertainty despite an overall positive lean to US economic factors.
Key highlights
The US economy is in a good place.
GDP growth and the labor market are solid.
The world is uncertain.
No reason to be discouraged about inflation progress, but taking longer than anyone wants.
We want to be careful before we make the next adjustment that there's enough pressure on inflation. Also, I don't want to shortchange the labor market.
We need more information. I don't want to urgently get to an answer that we would regret.
We don't know the scope, magnitude, or timing of the new administration's policies.
Policy is in a very good place, we can easily move when needed.
We can't preemptively make decisions based on policy guesses.
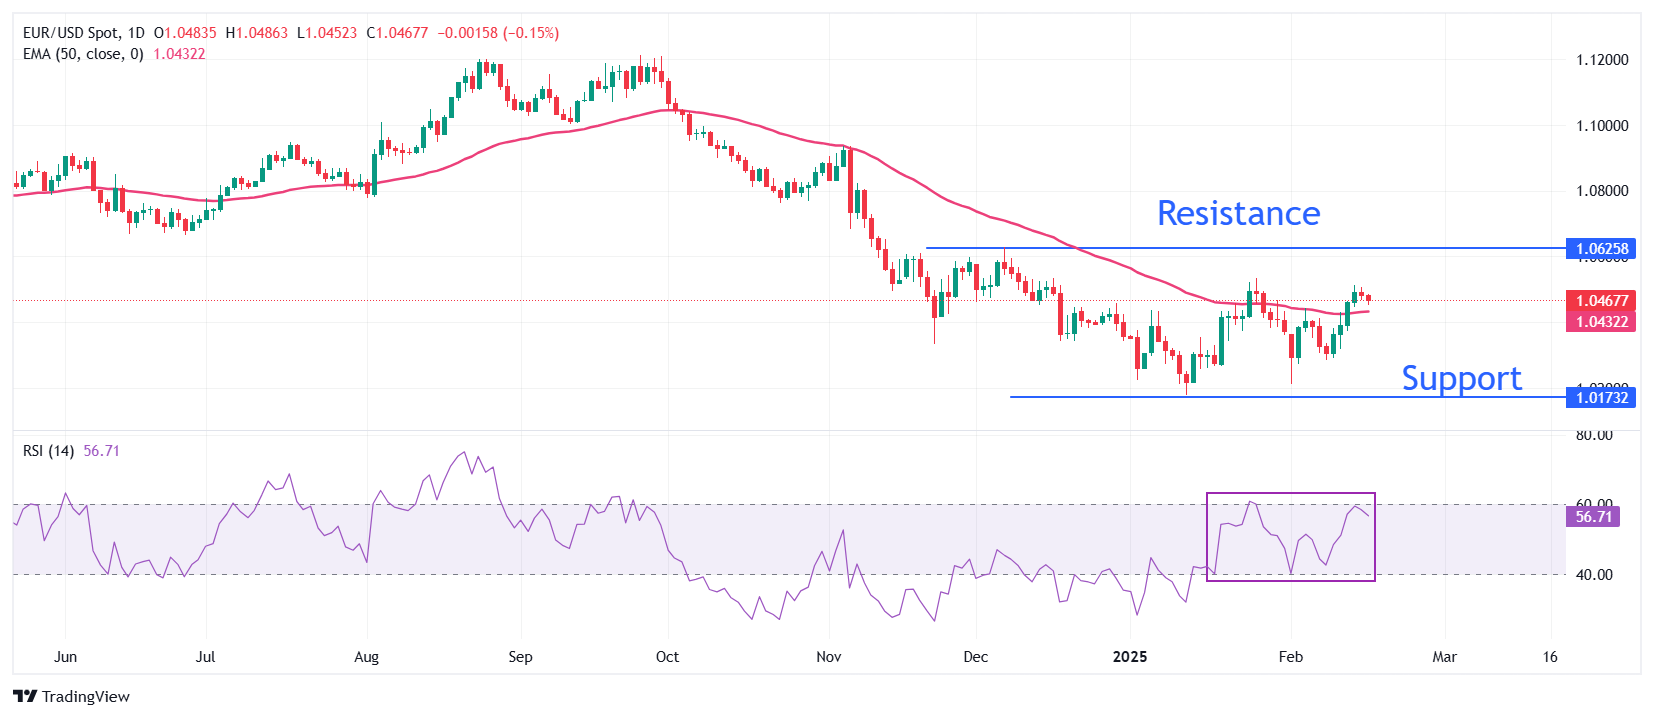
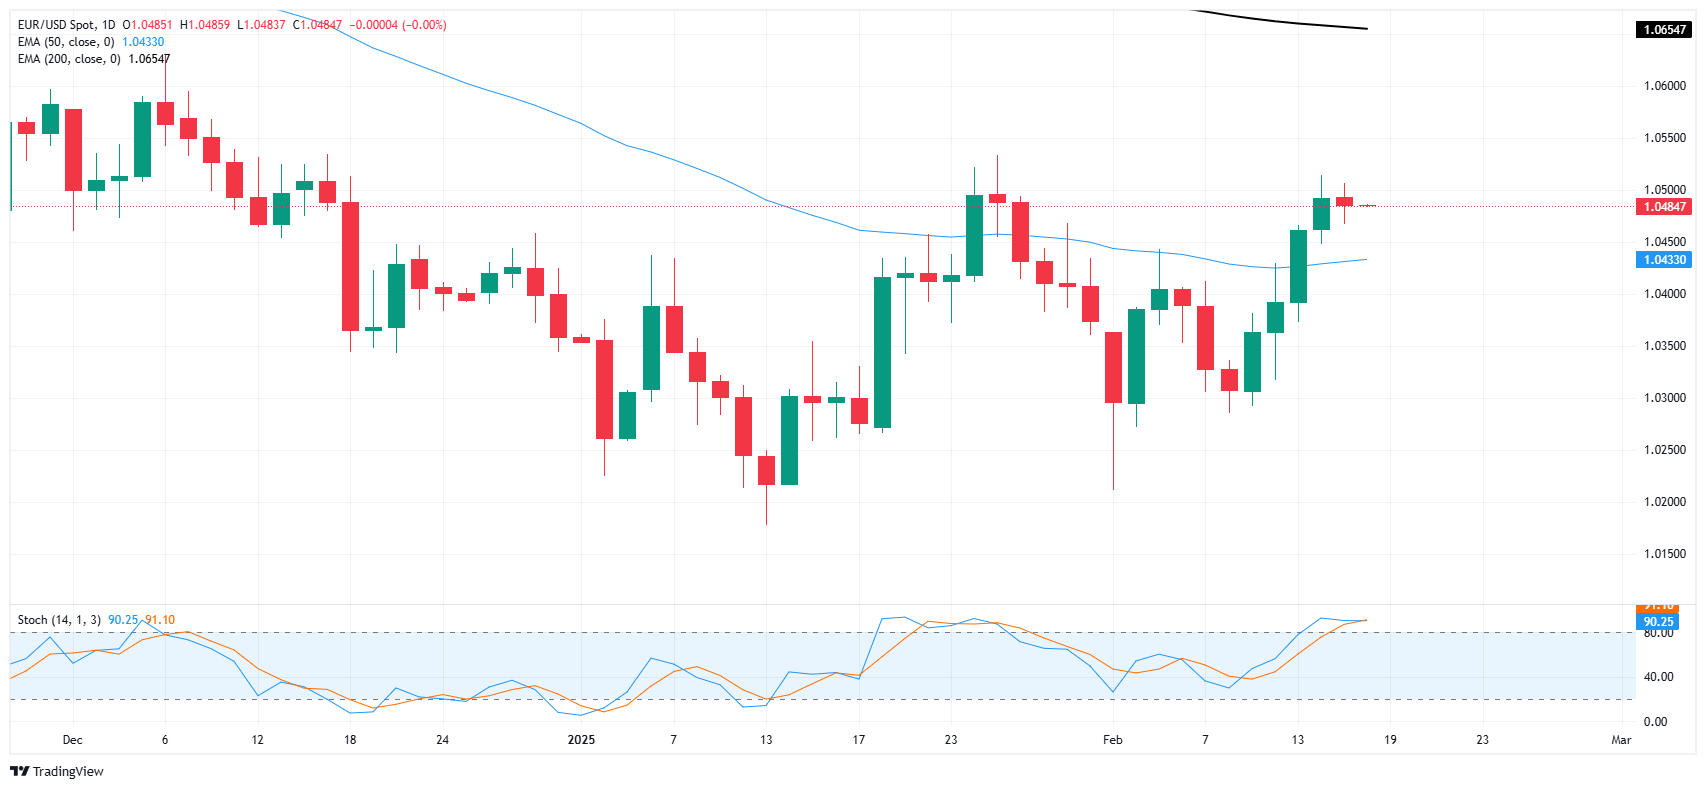
EUR/USD slips to 1.0450 on Tuesday, cooling off after last week's strong rally.
RSI declines sharply to 55, signaling waning bullish momentum while MACD remains flat with green bars.
The 20-day and 100-day SMAs are converging near 1.0450, raising concerns over a potential bearish crossover.
EUR/USD took a step back on Tuesday, shedding 0.32% to trade near 1.0450 as bulls lost some ground after last week’s impressive rally. The pair remains above the 20-day Simple Moving Average (SMA), keeping the broader outlook constructive for now. However, the latest price action suggests that buying momentum is fading.
Technical indicators reflect this shift. The Relative Strength Index (RSI) has sharply declined to 55, showing weakening bullish traction, while the Moving Average Convergence Divergence (MACD) histogram remains flat with green bars, highlighting hesitation among buyers. A key technical factor to watch is the 20-day and 100-day SMA convergence around 1.0450. If a bearish crossover materializes, it could invalidate recent gains and reinforce a downside bias.
For now, as long as EUR/USD holds above the 20-day SMA, buyers still have a chance to push higher. However, a sustained break below this level would expose the pair to further losses, with immediate support at 1.0420 and deeper downside risks toward 1.0380.
RBA delivered a hawkish cut and pushed back against market pricing of c.50bps more cuts in 2025. We now expect only one more 25bps cut in Q3-2025 (vs a 25bps cut in Q2 and 50bps of cuts in Q3 prior). Our end-2025 cash rate forecast moves to 3.85% (previously 3.35%) amid a secularly tight labour market. RBA may cut more than we expect if trimmed mean CPI eases at a faster-than-anticipated pace, Standard Chartered's FX and Macro Strategist Nicholas Chia notes.
Rate cut was no ‘lay-down misère’
"The Reserve Bank of Australia (RBA) delivered a hawkish 25bps cut to the cash rate to 4.10%, in line with our and consensus expectations. Q4 trimmed mean CPI (3.2%) eased more than the RBA had expected (3.4%), increasing its confidence that CPI inflation is moving lower sustainably."
"We think Governor Bullock’s subsequent press conference was slightly more hawkish than the RBA statement. Bullock pushed back against market pricing of RBA rate cuts and suggested there 'may not be quite as much room to go' in further rate reductions compared to its DM peers. Bullock emphasised that the 25bps cut was aimed at removing the cautionary rate hike in November 2023 rather than signalling the start of a full-fledged easing cycle, and that policy is still restrictive."
"We now expect the RBA to cut just once more in Q3-2025 as we think back-to-back quarterly cuts are unlikely, and poor productivity growth may persist, keeping unit labour costs well-supported. Our end-2025 terminal rate projection, therefore, moves to 3.85% (vs 3.35% previously). With the pre-election budget due in late-March, the RBA may be keen to monitor the impact of any further cost-of-living assistance measures on the disinflation process. The RBA may cut more than we expect if trimmed mean CPI eases at a faster pace than anticipated, or if the labour market weakens more substantially."
GBP/USD falls 0.19% as DXY reclaims 107.00 amid Fed hawkishness.
UK adds 107K jobs, wage growth jumps 5.9%, but fails to lift Sterling.
Markets await UK inflation, US housing data, and FOMC minutes for direction.
The Pond Sterling retreated after rallying three consecutive days, dropping some 0.19% even though the UK’s jobs data was solid. Meanwhile, a hawkish tilt by Fed officials and US President Donald Trump's tariffs policies add to uncertainty, underpinning the Greenback. The GBP/USD trades at 1.2602.
Pound retreats despite upbear UK jobs data; traders await inflation data
In the UK, the economy added 107K people to the workforce, exceeding estimates of 50 K. Consequently, the Unemployment Rate in the fourth quarter stood steady at 4.4%, while pay growth, as revealed by Average weekly earnings before bonuses, jumped 5.9%.
Meanwhile, Fed Governor Christopher Waller crossed the wires on Monday, saying that Trump’s tariffs would have a modest impact on prices. His colleague Philadelphia Fed Patrick Harker said he doesn’t see a reason for an imminent change in interest-rate policy.
Harker’s view is closer to the hawkish comments revealed by Fed Chair Jerome Powell's semi-annual testimony to the US Congress, in which he reiterated that the Central Bank is in no rush to ease policy.
Traders currently see a 25-basis-point rate cut by July, though the odds for a December cut are at 80%, revealed Prime Market Terminal data.
In the meantime, the GBP/USD extended its losses as the US Dollar Index (DXY) gains 0.26% and reclaims the 107.00 mark.
Ahead of the day, Fed officials will continue to grab the headlines, though traders are awaiting the UK’s inflation data on February 19, US housing data, and the latest Federal Open Market Committee (FOMC) minutes.
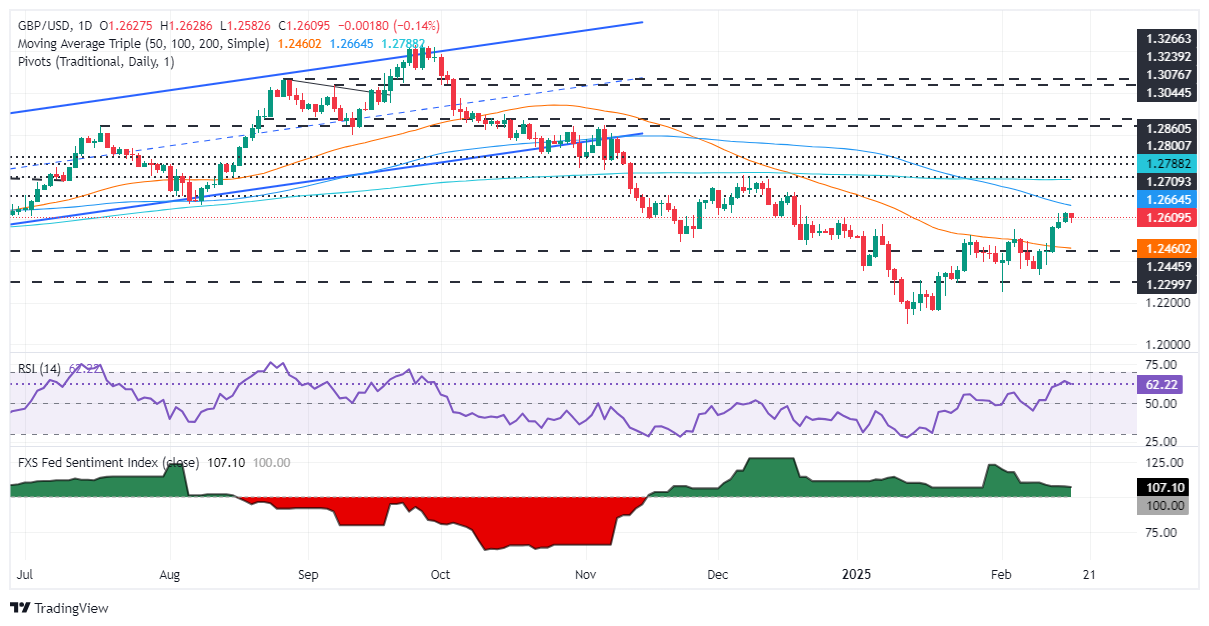
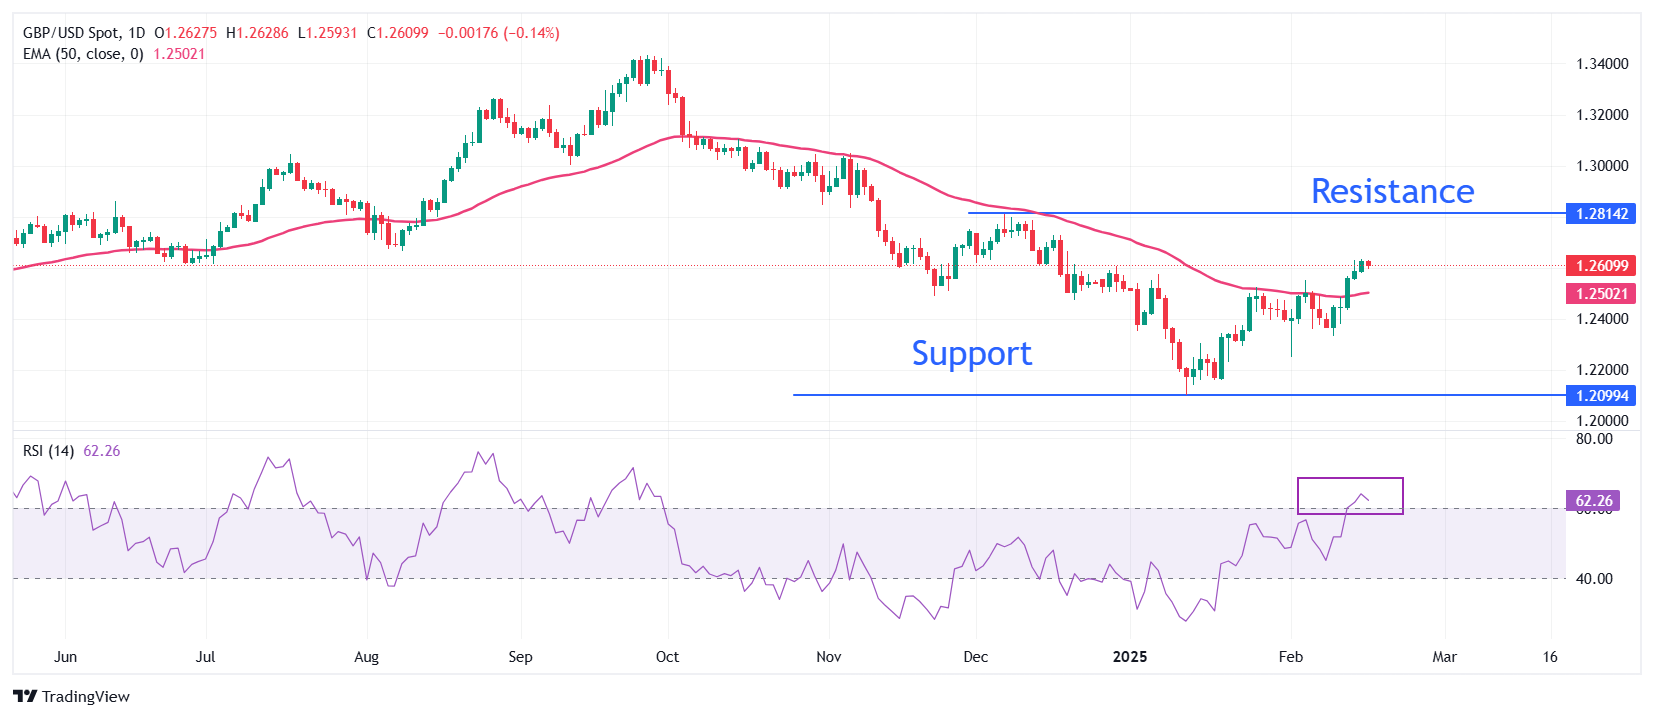
GBP/USD Price Forecast: Technical outlook
The GBP/USD is forming a ‘bearish harami’ two-candle chart pattern, which indicates that sellers could drive the exchange rate lower, setting t
heir sights below 1.2600. The Relative Strength Index (RSI) is bullish, though aiming slightly lower, indicating that the downside risks remain.
If GBP/USD tumbles below the February 17 low of 1.2577, look for a test of the February 5 high turned support at 1.2549, followed by the 50-day Simple Moving Average (SMA) at 1.2467. On the other hand, buyers need to drive the exchange rate past 1.2634 so they can challenge the 100-day SMA at 1.2678.
British Pound PRICE Today
The table below shows the percentage change of British Pound (GBP) against listed major currencies today. British Pound was the strongest against the New Zealand Dollar.
USD
EUR
GBP
JPY
CAD
AUD
NZD
CHF
USD
0.29%
0.16%
0.20%
0.07%
0.16%
0.66%
0.12%
EUR
-0.29%
-0.14%
-0.10%
-0.22%
-0.13%
0.37%
-0.17%
GBP
-0.16%
0.14%
0.06%
-0.09%
0.00%
0.50%
-0.04%
JPY
-0.20%
0.10%
-0.06%
-0.14%
-0.05%
0.43%
-0.09%
CAD
-0.07%
0.22%
0.09%
0.14%
0.09%
0.59%
0.05%
AUD
-0.16%
0.13%
-0.00%
0.05%
-0.09%
0.50%
-0.05%
NZD
-0.66%
-0.37%
-0.50%
-0.43%
-0.59%
-0.50%
-0.53%
CHF
-0.12%
0.17%
0.04%
0.09%
-0.05%
0.05%
0.53%
The heat map shows percentage changes of major currencies against each other. The base currency is picked from the left column, while the quote currency is picked from the top row. For example, if you pick the British Pound from the left column and move along the horizontal line to the US Dollar, the percentage change displayed in the box will represent GBP (base)/USD (quote).
15:00
United States NAHB Housing Market Index below forecasts (47) in February: Actual (42)
So far, February has been a choppy period for USD/JPY. Having rallied since the start of the year, the Japanese Yen (JPY) succumbed to profit taking earlier this month only to rebound in recent sessions, Rabobank's FX analyst Jane Foley notes.
USD/JPY is on course to the December low in the 148.65 area
"Yesterday USD/JPY pushed lower, encouraged by the release of the better-than-expected Q4 Japanese GDP report. That said, as the month’s low around the 151.00 level neared, JPY bulls lost their nerve this morning and the currency pair ticked higher. In our view the JPY is likely to continue gaining ground in the coming months."
"We retain a year-end target of USD/JPY145.00 with downside risk. The JPY is the best performing G10 currency in the year to date. A clear break below the USD/JPY151 level could put the currency pair on course to the December low in the 148.65 area."
AUD/USD falls slightly below 0.6350 as the US Dollar performs strongly on the Fed’s ‘higher for longer’ interest rate stance.
The RBA cut its OCR by 25 bps to 4.10%, as expected, but guided a cautious interest rate cut stance.
RBA Bullock said that the battle against inflation is far from over.
The AUD/USD pair is down a little over 0.1% below 0.6350 in Tuesday’s North American session. The Aussie pair faces pressure as the US Dollar (USD) holds onto intraday gains driven by firm expectations that the Federal Reserve (Fed) will keep interest rates in the current range of 4.25%-4.50% for a longer period.
The US Dollar Index (DXY), which tracks the Greenback’s value against six major currencies, rises to near 107.00.
Fed officials have guided that interest rates should remain at their current levels, given that inflation is still elevated, labor demand is balanced and the United States (US) economic growth is resilient. For more cues on the monetary policy outlook, investors will focus on the Federal Open Market Committee (FOMC) minutes, which will be released on Wednesday.
Meanwhile, the Australian Dollar (AUD) underperforms after the Reserve Bank of Australia’s (RBA) monetary policy outcome, in which the central bank announced its first interest rate cut decision since November 2020. The RBA cut its Official Cash Rate (OCR) by 25 basis points (bps) to 4.10%, as expected.
Investors had already anticipated a 25-bps interest rate reduction as inflationary pressures in the Australian economy have been easing. RBA Governor Michele Bullock guided that the central bank will remain cautious on interest rate cuts as it is too early to declare victory over inflation.
Australian Dollar FAQs
One of the most significant factors for the Australian Dollar (AUD) is the level of interest rates set by the Reserve Bank of Australia (RBA). Because Australia is a resource-rich country another key driver is the price of its biggest export, Iron Ore. The health of the Chinese economy, its largest trading partner, is a factor, as well as inflation in Australia, its growth rate and Trade Balance. Market sentiment – whether investors are taking on more risky assets (risk-on) or seeking safe-havens (risk-off) – is also a factor, with risk-on positive for AUD.
The Reserve Bank of Australia (RBA) influences the Australian Dollar (AUD) by setting the level of interest rates that Australian banks can lend to each other. This influences the level of interest rates in the economy as a whole. The main goal of the RBA is to maintain a stable inflation rate of 2-3% by adjusting interest rates up or down. Relatively high interest rates compared to other major central banks support the AUD, and the opposite for relatively low. The RBA can also use quantitative easing and tightening to influence credit conditions, with the former AUD-negative and the latter AUD-positive.
China is Australia’s largest trading partner so the health of the Chinese economy is a major influence on the value of the Australian Dollar (AUD). When the Chinese economy is doing well it purchases more raw materials, goods and services from Australia, lifting demand for the AUD, and pushing up its value. The opposite is the case when the Chinese economy is not growing as fast as expected. Positive or negative surprises in Chinese growth data, therefore, often have a direct impact on the Australian Dollar and its pairs.
Iron Ore is Australia’s largest export, accounting for $118 billion a year according to data from 2021, with China as its primary destination. The price of Iron Ore, therefore, can be a driver of the Australian Dollar. Generally, if the price of Iron Ore rises, AUD also goes up, as aggregate demand for the currency increases. The opposite is the case if the price of Iron Ore falls. Higher Iron Ore prices also tend to result in a greater likelihood of a positive Trade Balance for Australia, which is also positive of the AUD.
The Trade Balance, which is the difference between what a country earns from its exports versus what it pays for its imports, is another factor that can influence the value of the Australian Dollar. If Australia produces highly sought after exports, then its currency will gain in value purely from the surplus demand created from foreign buyers seeking to purchase its exports versus what it spends to purchase imports. Therefore, a positive net Trade Balance strengthens the AUD, with the opposite effect if the Trade Balance is negative.
14:29
New Zealand GDT Price Index down to -0.6% from previous 3.7%
USD/CAD drops as the Canadian Dollar attracts some bids after the release of the Canadian inflation report for January.
Canadian CPI accelerated in January but remained below the 2% target.
Investors await the FOMC minutes, which will be released on Wednesday.
The USD/CAD pair attracts offers near the intraday high of 1.4200 in Tuesday’s North American session. The Loonie pair faces pressure as the Canadian Dollar (CAD) discovers buying interest after the release of the Canadian Consumer Price Index (CPI) data for January, which showed that price pressures accelerated.
On year, the CPI data rose by 1.9%, as expected, faster than 1.8% growth in December. Month-on-month inflation grew by 0.1%, in line with estimates, after deflating by 0.4% last month. An expected increase in the inflation data is unlikely to offer relief to Bank of Canada (BoC) policymakers as price pressures are still below the central bank’s target of 2%. Persistently lower inflationary pressures would force the BoC to continue reducing interest rates.
The BoC has already cut its key borrowing rates by 200 basis points (bps) to 3% since June 2024, and expectations of further reduction in the March meeting remain firm.
Meanwhile, the US Dollar (USD) trades firm in the North American session, with United States (US) markets opening after a long weekend. The US Dollar Index (DXY), which tracks the Greenback’s value against six major currencies, bounces back to near 107.00, at the press time, after recovering from the two-month low of 106.50, which it posted on Friday.
The Greenback gains ahead of the Federal Open Market Committee (FOMC) minutes of the January policy meeting, which will be released on Wednesday. Investors will look for cues about how long the Fed will keep interest rates in the range of 4.25%-4.50%.
On Monday, a slew of Fed officials guided that the current monetary policy stance is optimal, given resilient United States (US) economic growth, a balanced labor market, and still-elevated inflation.
The Pound Sterling (GBP) is a relatively weak performer on the session vs US Dollar (USD), down a little more than 0.2% on the generally strong USD, Scotiabank's Chief FX Strategist Shaun Osborne notes.
GBP struggles to hold gains despite strong wage, jobs data
"UK data showed stronger-than-expected growth in wages (6.0% for average weekly earnings in the 3 months through December) while employment growth was stronger than expected. The data pared market expectations for BoE easing moving forward, endorsing messaging from the BoE leadership that rate cuts will proceed cautiously."
"GBP's' solid rise last week has struggled to extend through the low 1.26—where the 38.2% retracement of the 1.34/1.21 drop seen between September and January sits (1.2610)."
"GBP has spent the past two trading sessions pivoting around the 1.26 point, leaving GBP gains looking stalled. Loss of support at 1.2580 will drive the pound back to 1.2525/30."
Germany’s February ZEW Investor Survey reflected a stronger than expected rise in the Expectations index (26, versus 20 expected and 19.3 in January), Scotiabank's Chief FX Strategist Shaun Osborne notes.
Germany’s ZEW survey jumps
"The improvement likely reflects hopes that the Federal election will produce a pro-growth, market friendly government. Challenges around the outlook remain. A peace deal for Ukraine would be a positive for Europe but the flipside is that more defence spending will surely entail more government borrowing ahead."
"Minor Euro (EUR) losses vs US Dollar (USD) yesterday and (so far) today suggest recent EUR gains have stalled. The fact that the EUR rebound has (again, so far) failed to retest the late January peak at 1.0533 keeps the broader outlook for the single currency somewhat negative, despite recent gains."
"Regaining 1.0490/00 in the next day or so is needed to reinvigorate the near-term move higher. Support is 1.0445/50 and 1.0375/80."
The Canadian Dollar (CAD) is little changed in quiet trade. Spot based near 1.4150 late last week and may struggle to improve much further while tariff risks remain unclear. The CAD continues to trade above estimated fair value (1.4261) which also suggests limited scope for additional progress in the short run, Scotiabank's Chief FX Strategist Shaun Osborne notes.
CAD is little changed in quiet trade
"Canadian CPI is expected to post no gains in the January month, keeping the Y/Y pace of inflation steady at 1.8%. Scotia is a little above the consensus at +0.1% M/M and 1.9% for the year. The core Median rate of inflation is expected to hold steady at 2.4% in the year while the Trim measure may edge up to 2.6% (from 2.5% in December)."
"USD-negative signals on the longer-term charts and spot’s push below key support at 1.4250/60 (recent USD lows and the 38.2% retracement of the USD’s Sep/Jan rally) last week tilt broader risks towards a further USD drop to the 1.40/1.41 area to tick off the next retracement targets in the weeks ahead."
"Short-term trends suggest some consolidation in price action may develop in the next few days, however. Resistance is 1.4265/75 now and 1.4335/55."
North American markets return from their respective long weekends with the Dollar Index (DXY) trading a little above the two-month low reached in quiet trade yesterday, breaking a streak of six consecutive daily losses for the index, Scotiabank's Chief FX Strategist Shaun Osborne notes.
USD steadies after recent losses
"Markets have little news to go on, however; US yields are tracking a little higher and comments from key Fed policymakers (Waller) indicate that policy will remain on hold until the inflation 'bump' (In Waller’s words) fades. Yield spreads may offer the USD a little support in general terms in the short run as markets continue to consider tariff risks and their consequences."
"Broader trends in FX may remain flat until more clarity on the tariff situation develops. The MXN is a moderate outperformer on the session, with the AUD not so far behind. The RBA—finally—joined the global central bank easing movement with a 25bps cut (its first since the pandemic) in the cash rate to 4.10%. However, Governor Bullock cautioned that the move should not be interpreted as an endorsement of market pricing for further cuts ahead."
"The RBNZ is expected to deliver a 50bps cut in its key rate this evening (20ET). US data reports today include the February Empire Survey and the NAHB Housing Market Index. The Fed’s Daly and Barr speak later in the session."
The US Dollar is bearing minor gains and losses against most major currencies.
Traders are on edge over any possible headlines on US-Russia talks that might come out of Saudi Arabia this Tuesday.
The US Dollar Index (DXY) resides and looks for a direction in the 106.50-107.00 region.
The US Dollar Index (DXY), which tracks the performance of the US Dollar (USD) against six major currencies, is bracing for a possible pivotal outcome and trades slightly below 107.00 at the time of writing on Tuesday. Several United States (US) officials are meeting Russian counterparts this Tuesday in Riyadh, Saudi Arabia, to work out a ceasefire or peace deal for Ukraine. European leaders also met on Monday night to discuss a united peace force and boost military spending in the region.
The economic calendar is again rather calm on Tuesday. The main event that could move markets is the New York Empire State Manufacturing Index data for February. Expectations are that manufacturing sector business activity declined in New York but at a slower pace than in January.
Daily digest market movers: Keep your ear on the squawk
Traders will need to be vigilant for any headlines coming out of Riyadh, where US and Russian officials are meeting for talks in the runup to the first meeting between US President Donald Trump and Russian President Vladimir Putin to agree on a deal to end the war.
At 13:30 GMT, the New York Empire State Manufacturing Index for February is expected to come in still in contraction but at a slower pace than in January, falling to -1 compared to the previous -12.60.
At 15:00 GMT, the National Association of Home Builders (NAHB) will release its Housing Market Index for February, which is expected to rise steadily by 47, from 47 in January.
Federal Reserve Bank of San Francisco President Mary Daly and Federal Reserve Vice Chair for Supervision Michael Barr will speak later this Tuesday at 15:20 GMT and 18:00 GMT, respectively.
Equities are mixed going into this Tuesday. European ones are struggling while US futures are in the green.
The CME FedWatch tool shows a 49.8% chance that interest rates will remain unchanged at current levels in June.
The US 10-year yield is trading around 4.51% and will remain closed for trading this Monday.
US Dollar Index Technical Analysis: Uncertainty across
The US Dollar Index (DXY) is facing too many loose ends to choose a surefooted direction. Plenty of catalysts and headlines are still expected, ranging from headlines on Ukraine and Europe to more details on US President Trump’s reciprocal tariffs, all ahead of this weekend’s German election. The US Dollar could start to outperform if a peace deal is brokered without Europe, missing the opportunity to play an important role in the new world order.
On the upside, the previous support at 107.35 has now turned into a firm resistance. Further up, the 55-day SMA at 107.92 must be regained before reclaiming 108.00.
On the downside, look for 106.52 (April 16, 2024, high), 106.45 (100-day SMA), or even 105.89 (resistance in June 2024) as support levels. As the Relative Strength Index (RSI) momentum indicator in the daily chart shows room for more downside, the 200-day SMA at 104.94 could be a possible outcome.
US Dollar Index: Daily Chart
US Dollar FAQs
The US Dollar (USD) is the official currency of the United States of America, and the ‘de facto’ currency of a significant number of other countries where it is found in circulation alongside local notes. It is the most heavily traded currency in the world, accounting for over 88% of all global foreign exchange turnover, or an average of $6.6 trillion in transactions per day, according to data from 2022. Following the second world war, the USD took over from the British Pound as the world’s reserve currency. For most of its history, the US Dollar was backed by Gold, until the Bretton Woods Agreement in 1971 when the Gold Standard went away.
The most important single factor impacting on the value of the US Dollar is monetary policy, which is shaped by the Federal Reserve (Fed). The Fed has two mandates: to achieve price stability (control inflation) and foster full employment. Its primary tool to achieve these two goals is by adjusting interest rates. When prices are rising too quickly and inflation is above the Fed’s 2% target, the Fed will raise rates, which helps the USD value. When inflation falls below 2% or the Unemployment Rate is too high, the Fed may lower interest rates, which weighs on the Greenback.
In extreme situations, the Federal Reserve can also print more Dollars and enact quantitative easing (QE). QE is the process by which the Fed substantially increases the flow of credit in a stuck financial system. It is a non-standard policy measure used when credit has dried up because banks will not lend to each other (out of the fear of counterparty default). It is a last resort when simply lowering interest rates is unlikely to achieve the necessary result. It was the Fed’s weapon of choice to combat the credit crunch that occurred during the Great Financial Crisis in 2008. It involves the Fed printing more Dollars and using them to buy US government bonds predominantly from financial institutions. QE usually leads to a weaker US Dollar.
Quantitative tightening (QT) is the reverse process whereby the Federal Reserve stops buying bonds from financial institutions and does not reinvest the principal from the bonds it holds maturing in new purchases. It is usually positive for the US Dollar.
Fed officials have guided that interest rates should remain in the current range for now.
Trump’s tariff fears have eased and hopes for Russia-Ukraine peace have increased.
Silver price (XAG/USD) bounces back strongly to near $32.50 in Tuesday’s European session. The white metal recovers its intraday losses and turns positive despite multiple headwinds, such as firm expectations for the Federal Reserve’s (Fed) ‘higher for longer’ interest rate stance, growing optimism over Russia-Ukraine peace, and easing United States (US) President Donald Trump’s tariff fears.
On Monday, a slew of Fed officials stated that current monetary policy conditions are in great shape, given resilient US economic growth, still-elevated inflationary pressures, and a balanced labor market. Fed Governor Michelle Bowman said she would like to gain “greater confidence” that progress in lowering inflation will “continue” before considering any monetary policy adjustment.
Technically, increasing hopes that the Fed will keep interest rates steady for longer bode poorly for precious metals, such as Silver.
Meanwhile, growing optimism about peace between Russia and Ukraine is expected to keep a lid on Silver’s upside. Last week, Donald Trump confirmed that both leaders of Russia and Ukraine have agreed to peace negotiations and ordered his team to begin truce talks.
Historically, the scenario of improving geopolitical tensions diminishes the appeal of precious metals, such as Silver.
Over that, investors expect Trump’s reciprocal tariffs won’t be as fearful as previously anticipated. Trump didn’t reveal a detailed reciprocal tariff plan on Thursday, while he was expected to do so. The tariff plan is unlikely to come into effect before April as Trump nominated Commerce Secretary Howard Lutnick said on Thursday that the President will be ready to move on reciprocal tariffs by April 1.
Market participants expect US trading partners would have enough time to negotiate with Trump on reciprocity.
Silver technical analysis
Silver price struggles to break above the key resistance of $32.55, which is plotted from the February 5 high. The outlook of the white metal was already bullish as the 20-day Exponential Moving Average (EMA) has been sloping higher, which trades around $31.70.
The 14-day Relative Strength Index (RSI) oscillates in the 60.00-80.00 range, suggesting that the momentum is strongly bullish.
Looking down, the February 11 low of $31.26 will be the key support for the Silver price. While, the October 31 high of $33.90 will be the key barrier.
Silver daily chart
Silver FAQs
Silver is a precious metal highly traded among investors. It has been historically used as a store of value and a medium of exchange. Although less popular than Gold, traders may turn to Silver to diversify their investment portfolio, for its intrinsic value or as a potential hedge during high-inflation periods. Investors can buy physical Silver, in coins or in bars, or trade it through vehicles such as Exchange Traded Funds, which track its price on international markets.
Silver prices can move due to a wide range of factors. Geopolitical instability or fears of a deep recession can make Silver price escalate due to its safe-haven status, although to a lesser extent than Gold's. As a yieldless asset, Silver tends to rise with lower interest rates. Its moves also depend on how the US Dollar (USD) behaves as the asset is priced in dollars (XAG/USD). A strong Dollar tends to keep the price of Silver at bay, whereas a weaker Dollar is likely to propel prices up. Other factors such as investment demand, mining supply – Silver is much more abundant than Gold – and recycling rates can also affect prices.
Silver is widely used in industry, particularly in sectors such as electronics or solar energy, as it has one of the highest electric conductivity of all metals – more than Copper and Gold. A surge in demand can increase prices, while a decline tends to lower them. Dynamics in the US, Chinese and Indian economies can also contribute to price swings: for the US and particularly China, their big industrial sectors use Silver in various processes; in India, consumers’ demand for the precious metal for jewellery also plays a key role in setting prices.
Silver prices tend to follow Gold's moves. When Gold prices rise, Silver typically follows suit, as their status as safe-haven assets is similar. The Gold/Silver ratio, which shows the number of ounces of Silver needed to equal the value of one ounce of Gold, may help to determine the relative valuation between both metals. Some investors may consider a high ratio as an indicator that Silver is undervalued, or Gold is overvalued. On the contrary, a low ratio might suggest that Gold is undervalued relative to Silver.
USD/CHF gives up intraday gains and falls back to near 0.9000 as the US Dollar struggles to hold recovery.
Fed officials expect that the current monetary policy is in the right place.
The SNB could opt for negative interest rates to avoid risks of inflation remaining persistently lower.
The USD/CHF pair surrenders its intraday gains and falls back to near the psychological level of 0.9000 in European trading hours on Tuesday. The Swiss Franc pair gives up gains as the US Dollar (USD) corrects from the intraday high but still holds some gains. The US Dollar Index (DXY), which gauges the Greenback’s value against six major currencies, struggles to hold above the key level of 107.00.
Earlier in the day, the USD Index rebounded on firm expectations that the Federal Reserve (Fed) will keep interest rates steady in the current range of 4.25%-4.50% for a longer period. On Monday, a string of Fed officials stated that there is no need for a monetary policy adjustment amid resilient United States (US) economic growth, still-elevated inflation, and a balanced labor market.
The upside in the US Dollar has been capped by faded fears of the immediate imposition of reciprocal tariffs by US President Donald Trump. Trump said on Thursday that he has asked his team to work on reciprocity, while market participants anticipated that the President could unveil a detailed reciprocal tariff plan immediately.
Meanwhile, the Swiss Franc (CHF) is expected to remain on the backfoot as soft Consumer Price Index (CPI) data for January has boosted expectations that the Swiss National Bank (SNB) could push interest rates into the negative territory. Year-on-year Swiss CPI decelerated to 0.4%, as expected, from 0.6% in December, undershooting SNB’s target of 0%-2%.
USD/CHF struggles to revisit its 15-month high, of around 0.9200. However, the outlook for the Swiss Franc pair remains firm, as the 20-week Exponential Moving Average (EMA) near 0.8947 is sloping higher.
The 14-week Relative Strength Index (RSI) falls into the 40.00-60.00 from the bullish range of 60.00-80.00, suggesting that the upside momentum has faded. However, the upside bias is intact.
For a fresh upside toward the round-level resistance of 0.9300 and the 16 March 2023 high of 0.9342, the asset needs to break decisively above the October 2023 high of 0.9244.
On the flip side, a downside move below the psychological support of 0.9000 would drag the asset towards the November 22 high of 0.8958, followed by the December 16 low of 0.8900.
USD/CHF weekly chart
Economic Indicator
Consumer Price Index (YoY)
The Consumer Price Index (CPI), released by the Swiss Federal Statistical Office on a monthly basis, measures the change in prices of goods and services which are representative of the private households’ consumption in Switzerland. The CPI is the main indicator to measure inflation and changes in purchasing trends. The YoY reading compares prices in the reference month to the same month a year earlier. Generally, a high reading is seen as bullish for the Swiss Franc (CHF), while a low reading is seen as bearish.
US Dollar (USD) is likely to trade in a range between 7.2500 and 7.2780 vs the Chinese Yuan (CNH). In the longer run, increase in momentum suggests USD could decline to the major support at 7.2300, UOB Group’s FX analysts Quek Ser Leang and Peter Chia note.
Above 7.2960, USD/CNH to stop targeting the downside
24-HOUR VIEW: "Yesterday, when USD was at 7.2600, we highlighted the followings: 'As long as USD remains below 7.2800 (minor resistance is at 7.2710), it could dip below 7.2500 before stabilisation is likely. This time around, the major support at 7.2300 is unlikely to come into view.' Our view was not wrong, as USD fell to 7.2428, rebounded to 7.2677 and then closed largely unchanged at 7.2648 (+0.09%). USD has likely entered a range trading phase. Today, we expect it to trade between 7.2500 and 7.2780."
1-3 WEEKS VIEW: "Our update from yesterday (17 Feb, spot at 7.2600) is still valid. As highlighted, 'the increase in downward momentum suggests USD could decline the major support level at 7.2300.' A breach of 7.2960 (no change in ‘strong resistance’ level) will invalidate our view.”
Germany’s ZEW Economic Sentiment Index climbed to 26 in February.
EUR/USD holds losses above 1.0450 after German and Eurozone ZEW surveys.
The headline German ZEW Economic Sentiment Index jumped to 26 in February from 10.3 in January, beating the market forecast of 15.5 by a wide margin.
The Current Situation Index improved to -88.5 in the same period, compared with January’s -90.4. Data beat the estimated -90 print.
The Eurozone ZEW Economic Sentiment Index came in at 24.2 in February versus 18 in January. The market expectations was for a 24.3 figure.
Key points
Rising optimism is probably due to hopes for a new German government capable of action.
After a period of absent demand, private consumption can be expected to gain momentum in the next six months.
The recent move by the ECB to cut interest rates in response to sluggish economic activity in the monetary union is likely to have contributed to the better outlook for the construction industry.
Market reaction
The EUR/USD pair remains under selling pressure after the mixed German and Eurozone ZEW surveys. The pair is losing 0.16% on the day to trade near 1.0460, as of writing.
10:01
Eurozone ZEW Survey – Economic Sentiment below forecasts (24.3) in February: Actual (24.2)
10:00
Germany ZEW Survey – Economic Sentiment registered at 26 above expectations (15.5) in February
10:00
Germany ZEW Survey – Current Situation came in at -88.5, above expectations (-90) in February
USD/JPY rebounded today, tracking USD’s modest bounce after back-to-back session of declines. USD/JPY was last at 151.87 levels, Danske Bank's FX analyst Mohamad Al-Saraf reports.
Consolidation likely in the interim
"Daily momentum is flat while RSI rose slightly. Consolidation likely in the interim. Resistance at 152.70 (200 DMA), 153.50/85 levels (21, 100 DMAs) and 154.30 levels. Support at 151.50 (38.2% fibo retracement of Sep low to Jan high), 150 levels."
"Elsewhere, tariff concerns remain to some extent as reciprocal tariffs may affect Japan. This can prove tricky for JPY’s near-term outlook though we also noted that Japan is attempting to seek exemptions with regards to Trump’s proposed reciprocal tariffs."
"Ministry of Foreign Affairs Takeshi Iwaya also raised the issue of automobile tariffs and sought exclusion from the 25% tariff on imported steel and aluminium products at the Munich Security Conference last Friday."
US Dollar (USD) could edge below 151.00 vs Japanese Yen (JPY), but it remains to be seen if it can maintain a foothold below this level. In the longer run, there has been a tentative buildup in downward momentum; USD must break and remain below 151.00 before further weakness is likely, UOB Group’s FX analysts Quek Ser Leang and Peter Chia note.
Downward momentum builds up
24-HOUR VIEW: "The following are the excerpts from our update yesterday: 'There has been a tentative buildup in downward momentum. Today, USD is likely to edge lower, but it is unlikely to reach the major support at 151.00 (there is another support level at 151.60). Resistance is at 152.50; a breach of 152.85 would indicate that the buildup in momentum has faded.' USD then fell to a low of 151.32, closing on a soft note at 151.50 (-0.54%). There has been a tentative buildup in downward momentum, and USD is likely to continue to edge lower today. While it could break below 151.00, it remains to be seen if it can maintain a foothold below this level. On the upside, a breach of 152.15 (minor resistance is at 151.85) would mean that the buildup in momentum has faded."
1-3 WEEKS VIEW: "Last Friday (14 Feb, spot at 152.70), we noted that the recent 'upward momentum has largely faded.' We indicated that USD 'is likely to trade in a 151.00/155.00 range for the time being.' Yesterday, USD fell to a low of 151.32, and there has been a tentative buildup in downward momentum. That said, USD must break and remain below 151.00 before further weakness can be expected. The likelihood of USD breaking clearly below 151.00 will remain intact, provided that 152.75 is not breached."
Gold sets forth rally and pops above $2,900 at the start of the European trading session on Tuesday.
Markets brace for headlines to come in from Saudi Arabia where US and Russian officials are meeting.
A daily close above $2,910 could put Gold on track for a new all-time high this week.
Gold’s price (XAU/USD) is rallying near 0.50% this Tuesday at the start of the European trading session, with the precious metal trading around $2,910 at the time of writing. US yields are catching up on events after the US President’s Day holiday on Monday. Still, Gold is in favor of traders as a safe haven for tariffs and geopolitical uncertainty.
Meanwhile, Federal Reserve Bank (Fed) President of Philadelphia Patrick Harker advocated on Monday night for the central bank to keep interest rates unchanged. He pointed out that recent inflation reports and gauges are not tracking economic changes that are currently taking place. Federal Reserve Bank of San Francisco President Mary Daly and Federal Reserve Vice Chair for Supervision Michael Barr will speak later this Tuesday at 15:20 GMT and 18:00 GMT, respectively.
Daily digest market movers: Geopolitics take over
Goldman Sachs raised its year-end gold target to $3,100 an ounce due to central bank buying and inflows into bullion-backed exchange-traded funds, Reuters reports.
Gold shipments from Singapore to the US climbed to the highest level in almost three years in January, a further sign of the ructions in bullion trading after pricing disparities opened up in key markets. Gold shipments from Singapore to the US reached 11 tons in January, up 27% from December, Bloomberg reports.
The US administration has asked European nations to explain what security guarantees they’re willing to provide to Ukraine as part of a peace deal. The move followed United States (US) President Donald Trump’s push to begin talks with Russian President Vladimir Putin.
Investors are still analyzing more details of the US reciprocal tariff plans, which could take months to implement due to their complexity. Trump’s trade policies have become increasingly muddled due to delays and exclusions, with concerns about the impact on the global economy aiding bullion’s role as a store of value.
Technical Analysis: RSI at boiling point
Gold is climbing the ladder again this week, that stairway to new all-time highs. However, the Relative Strength Index (RSI) indicator in the daily chart is starting to flash overbought signals again, warning that the price action is overheating. With these elevated levels in RSI, buyers could be reluctant to buy more and wait for the Gold price to cool down to better levels before buying.
After Monday’s not-so-big move, the daily pivots have been reshuffled and are moving closer together. The first support is seen at $2,893, which is the daily Pivot Point. It has already served as support during the Asian trading session. Should this level come under threat again on Tuesday, the S1 support at $2,881 could do its duty.
On the upside, the R1 resistance at $2,909 is being reclaimed at the time of writing. A daily close above this level would be a healthy bullish signal for more upside into Wednesday. The R2 resistance at $2,921 is the next level to be recovered before considering a fresh all-time high, currently at $2,942.
XAU/USD: Daily Chart
Gold FAQs
Gold has played a key role in human’s history as it has been widely used as a store of value and medium of exchange. Currently, apart from its shine and usage for jewelry, the precious metal is widely seen as a safe-haven asset, meaning that it is considered a good investment during turbulent times. Gold is also widely seen as a hedge against inflation and against depreciating currencies as it doesn’t rely on any specific issuer or government.
Central banks are the biggest Gold holders. In their aim to support their currencies in turbulent times, central banks tend to diversify their reserves and buy Gold to improve the perceived strength of the economy and the currency. High Gold reserves can be a source of trust for a country’s solvency. Central banks added 1,136 tonnes of Gold worth around $70 billion to their reserves in 2022, according to data from the World Gold Council. This is the highest yearly purchase since records began. Central banks from emerging economies such as China, India and Turkey are quickly increasing their Gold reserves.
Gold has an inverse correlation with the US Dollar and US Treasuries, which are both major reserve and safe-haven assets. When the Dollar depreciates, Gold tends to rise, enabling investors and central banks to diversify their assets in turbulent times. Gold is also inversely correlated with risk assets. A rally in the stock market tends to weaken Gold price, while sell-offs in riskier markets tend to favor the precious metal.
The price can move due to a wide range of factors. Geopolitical instability or fears of a deep recession can quickly make Gold price escalate due to its safe-haven status. As a yield-less asset, Gold tends to rise with lower interest rates, while higher cost of money usually weighs down on the yellow metal. Still, most moves depend on how the US Dollar (USD) behaves as the asset is priced in dollars (XAU/USD). A strong Dollar tends to keep the price of Gold controlled, whereas a weaker Dollar is likely to push Gold prices up.
Today focus in CAD FX turns to the January inflation figures at 14:30 CET , Danske Bank's FX analyst Mohamad Al-Saraf reports.
USD/CAD to climb higher towards 1.45
"January is the only full month during which the temporary general sales tax break is in effect. While the effect was only partial in December, headline inflation was somewhat weaker than expected at 1.8% y/y (cons: 1.9%)."
"Hence, risks are tilted to the downside, though consensus expects a slight uptick in the headline figure to 1.9% y/y. The market reaction is likely to be muted, as tariffs continue to be the main driver of USD/CAD."
"Looking ahead, we continue to believe that tariffs will be the overarching trigger of any moves in the near-term - however on a 12M horizon, we project the cross to climb higher towards 1.45 amid our bullish outlook on the USD."
Bank of England (BoE) Governor Andrew Bailey participated in a panel discussion titled "Preserving and enhancing open financial markets" at an event hosted by Bruegel, in Brussels, on Tuesday.
Key quotes
We are in a period of heightened uncertainty.
We are facing a weak growth environment in the UK.
"Careful" language was chosen to highlight increased uncertainty.
Market reaction
At the press time, GBP/USD is trading 0.16% lower on the day, easing to test 1.2600.
British Pound PRICE Today
The table below shows the percentage change of British Pound (GBP) against listed major currencies today. British Pound was the weakest against the Swiss Franc.
USD
EUR
GBP
JPY
CAD
AUD
NZD
CHF
USD
0.22%
0.17%
0.27%
0.05%
0.01%
0.51%
-0.04%
EUR
-0.22%
-0.06%
0.05%
-0.17%
-0.21%
0.28%
-0.26%
GBP
-0.17%
0.06%
0.13%
-0.12%
-0.15%
0.34%
-0.20%
JPY
-0.27%
-0.05%
-0.13%
-0.24%
-0.27%
0.20%
-0.33%
CAD
-0.05%
0.17%
0.12%
0.24%
-0.04%
0.46%
-0.09%
AUD
-0.01%
0.21%
0.15%
0.27%
0.04%
0.49%
-0.06%
NZD
-0.51%
-0.28%
-0.34%
-0.20%
-0.46%
-0.49%
-0.54%
CHF
0.04%
0.26%
0.20%
0.33%
0.09%
0.06%
0.54%
The heat map shows percentage changes of major currencies against each other. The base currency is picked from the left column, while the quote currency is picked from the top row. For example, if you pick the British Pound from the left column and move along the horizontal line to the US Dollar, the percentage change displayed in the box will represent GBP (base)/USD (quote).
US Dollar (USD) firmed overnight on comments from Fed’s Waller. He spoke about preferring to keep rates on hold for now until it is clear that inflation is fading (like it did in 2024). DXY rebounded modestly; last at 106.96, OCBC's FX analysts Frances Cheung and Christopher Wong note.
Near term rebound risks not ruled out
"But Waller did question if Jan CPI figures had been properly adjusted for seasonal factors as there were some patterns over the past few years of higher inflation readings at the start of the year. He went on to emphasise that Fed’s favoured gauge of inflation is still the PCE price index – and that was less alarming. Next release of Jan core PCE price index is on 28 Feb."
"Waller acknowledged that the new Trump administration’s policies had introduced a degree of uncertainty but cautioned against allowing that to delay the Fed’s response to economic data. He also reiterated that tariffs imposed by Trump administration would ‘only modestly increase prices in a non-persistent manner'."
"Daily momentum is bearish while RSI shows signs of turning higher from near oversold conditions. Near term rebound risks not ruled out. Resistance at 107.30, 107.80 (23.6% fibo, 21 DMA) and 108.50 levels. Support at 106.20/40 levels (100 DMA, 38.2% fibo retracement of Oct low to Jan high)."
09:30
South Africa Unemployment Rate (%) down to 31.9% in 4Q from previous 32.1%
09:30
South Africa Unemployment Total : 7.991M (4Q) vs previous 8.011M
Silver prices (XAG/USD) rose on Tuesday, according to FXStreet data. Silver trades at $32.51 per troy ounce, up 0.32% from the $32.40 it cost on Monday.
Silver prices have increased by 12.50% since the beginning of the year.
Unit measure
Silver Price Today in USD
Troy Ounce
32.51
1 Gram
1.05
The Gold/Silver ratio, which shows the number of ounces of Silver needed to equal the value of one ounce of Gold, stood at 89.60 on Tuesday, up from 89.42 on Monday.
Silver FAQs
Silver is a precious metal highly traded among investors. It has been historically used as a store of value and a medium of exchange. Although less popular than Gold, traders may turn to Silver to diversify their investment portfolio, for its intrinsic value or as a potential hedge during high-inflation periods. Investors can buy physical Silver, in coins or in bars, or trade it through vehicles such as Exchange Traded Funds, which track its price on international markets.
Silver prices can move due to a wide range of factors. Geopolitical instability or fears of a deep recession can make Silver price escalate due to its safe-haven status, although to a lesser extent than Gold's. As a yieldless asset, Silver tends to rise with lower interest rates. Its moves also depend on how the US Dollar (USD) behaves as the asset is priced in dollars (XAG/USD). A strong Dollar tends to keep the price of Silver at bay, whereas a weaker Dollar is likely to propel prices up. Other factors such as investment demand, mining supply – Silver is much more abundant than Gold – and recycling rates can also affect prices.
Silver is widely used in industry, particularly in sectors such as electronics or solar energy, as it has one of the highest electric conductivity of all metals – more than Copper and Gold. A surge in demand can increase prices, while a decline tends to lower them. Dynamics in the US, Chinese and Indian economies can also contribute to price swings: for the US and particularly China, their big industrial sectors use Silver in various processes; in India, consumers’ demand for the precious metal for jewellery also plays a key role in setting prices.
Silver prices tend to follow Gold's moves. When Gold prices rise, Silver typically follows suit, as their status as safe-haven assets is similar. The Gold/Silver ratio, which shows the number of ounces of Silver needed to equal the value of one ounce of Gold, may help to determine the relative valuation between both metals. Some investors may consider a high ratio as an indicator that Silver is undervalued, or Gold is overvalued. On the contrary, a low ratio might suggest that Gold is undervalued relative to Silver.
(An automation tool was used in creating this post.)
EUR/USD falls to near 1.0450 as the US Dollar rebounds after Fed officials guided that there is no need to make policy adjustments at least for now.
ECB’s Nagel warned that President Trump’s tariffs will be more vulnerable for Germany.
Investors await FOMC minutes, which will be released on Wednesday.
EUR/USD declines to near 1.0450 in Tuesday’s European session after failing to hold above the psychological resistance of 1.0500 in the last two trading days. The major currency pair slumps as the US Dollar Index (DXY), which tracks the Greenback’s value against six major currencies, rebounds after attracting bids near a two-month low and recovers to near 107.00 at the press time.
The Greenback discovers buying interest as investors weigh in expectations that the Federal Reserve (Fed) will keep interest rates in the current range of 4.25%-4.50% for a longer period. On Monday, a slew of Fed officials stated that the monetary policy does not need to be adjusted in the current scenario.
Meanwhile, Philadelphia Fed Bank President Patrick Harker said there are “reasons” enough to hold the “policy rate steady right now,” such as resilient economic growth, a balanced labor market, and still-elevated inflationary pressures. Harker didn’t commit to a timeframe but was optimistic that inflation would ease over time.
For more cues about the monetary policy outlook, investors will focus on the Federal Open Market Committee (FOMC) minutes of the January policy meeting, which will be released on Wednesday. In the policy meeting, the Fed announced a pause in the monetary easing cycle, which started in September. Fed Chair Jerome Powell guided that monetary policy adjustments would be appropriate only when officials would see “real progress in inflation or at least some weakness in the labor market”.
Daily digest market movers: EUR/USD slumps as US Dollar bounces back
The corrective move in the EUR/USD pair is also driven by some weakness in the Euro (EUR). The outlook for the shared currency is uncertain, as European Central Bank (ECB) policymaker and Bundesbank President Joachim Nagel has warned that US tariffs could weigh on the German economic outlook, which has already suffered from economic contraction for the last two years.
"Our strong export orientation makes us particularly vulnerable," Nagel said in his speech at the Speaker's Luncheon of the Union International Club on Monday. He added that the economic output in 2027 would be almost 1.5% lower than their prior forecast. Currently, the Bundesbank sees the German economy growing by 0.2% this year and 0.8% in 2026.
Fears of US tariffs on Germany escalated after US President Donald Trump announced during the weekend that he plans to impose tariffs on imported cars starting around April 2. According to data from OEC, the German economy exported $24.3 billion worth of cars to the US in 2023.
Meanwhile, firm expectations that the ECB will cut interest rates three times more this year have also capped the Euro’s upside. ECB dovish bets are based on growing risks of inflation undershooting the central bank’s target of 2%.
Technical Analysis: EUR/USD drops from 1.0500
EUR/USD falls after facing resistance near the psychological hurdle of 1.0500. However, the outlook for the major currency pair is still bullish as it holds above the 50-day Exponential Moving Average (EMA), which stands at around 1.0430.
The 14-day Relative Strength Index (RSI) struggles to break above 60.00. A bullish momentum would activate if the RSI (14) manages to sustain above that level.
Looking down, the February 10 low of 1.0285 will act as the major support zone for the pair. Conversely, the December 6 high of 1.0630 will be the key barrier for the Euro bulls.
Euro FAQs
The Euro is the currency for the 19 European Union countries that belong to the Eurozone. It is the second most heavily traded currency in the world behind the US Dollar. In 2022, it accounted for 31% of all foreign exchange transactions, with an average daily turnover of over $2.2 trillion a day. EUR/USD is the most heavily traded currency pair in the world, accounting for an estimated 30% off all transactions, followed by EUR/JPY (4%), EUR/GBP (3%) and EUR/AUD (2%).
The European Central Bank (ECB) in Frankfurt, Germany, is the reserve bank for the Eurozone. The ECB sets interest rates and manages monetary policy. The ECB’s primary mandate is to maintain price stability, which means either controlling inflation or stimulating growth. Its primary tool is the raising or lowering of interest rates. Relatively high interest rates – or the expectation of higher rates – will usually benefit the Euro and vice versa. The ECB Governing Council makes monetary policy decisions at meetings held eight times a year. Decisions are made by heads of the Eurozone national banks and six permanent members, including the President of the ECB, Christine Lagarde.
Eurozone inflation data, measured by the Harmonized Index of Consumer Prices (HICP), is an important econometric for the Euro. If inflation rises more than expected, especially if above the ECB’s 2% target, it obliges the ECB to raise interest rates to bring it back under control. Relatively high interest rates compared to its counterparts will usually benefit the Euro, as it makes the region more attractive as a place for global investors to park their money.
Data releases gauge the health of the economy and can impact on the Euro. Indicators such as GDP, Manufacturing and Services PMIs, employment, and consumer sentiment surveys can all influence the direction of the single currency. A strong economy is good for the Euro. Not only does it attract more foreign investment but it may encourage the ECB to put up interest rates, which will directly strengthen the Euro. Otherwise, if economic data is weak, the Euro is likely to fall. Economic data for the four largest economies in the euro area (Germany, France, Italy and Spain) are especially significant, as they account for 75% of the Eurozone’s economy.
Another significant data release for the Euro is the Trade Balance. This indicator measures the difference between what a country earns from its exports and what it spends on imports over a given period. If a country produces highly sought after exports then its currency will gain in value purely from the extra demand created from foreign buyers seeking to purchase these goods. Therefore, a positive net Trade Balance strengthens a currency and vice versa for a negative balance.
New Zealand Dollar (NZD) is likely to trade between 0.5710 and 0.5745 vs US Dollar (USD). In the longer run, price action suggests further NZD strength, potentially to 0.5790, UOB Group’s FX analysts Quek Ser Leang and Peter Chia note.
Price action suggests further NZD strength
24-HOUR VIEW: "When NZD was at 0.5730 yesterday, we highlighted that it 'could test 0.5755 before levelling off.' We also highlighted that 'the major resistance at 0.5790 is unlikely to come under threat.' NZD rose less than expected to 0.5750 before easing off to close at 0.5738 (+0.09%). NZD has likely entered a range trading phase and is likely to trade between 0.5710 and 0.5745 today."
1-3 WEEKS VIEW: "We turned positive in NZD yesterday (17 Feb, spot at 0.5730), indicating that 'the price action suggests further NZD strength, potentially to 0.5790.' There is no change in our view. To sustain the buildup in momentum, NZD must remain above 0.5675 (‘strong support’ level was at 0.5665 yesterday). Meanwhile, it could trade in a range for a couple of days."
LME copper retreated from over three-month highs on Monday, while the benchmark cash-to-three-month spread – having moved into backwardation for the first time since June 2023 on Friday – has now eased back to contango. Short-covering on the LME ahead of contract expiry amid expectations of US tariffs on copper triggered a sharp move in the key copper spread last week, ING’s commodity analysts Warren Patterson and Ewa Manthey notes.
LME spread eases back to contango
"US President Donald Trump has threatened to slap tariffs on copper but said it will take a little longer to implement than those on aluminium and steel announced last week. The threat of tariffs has led to expectations of temporary tightness in the US copper market, with traders shifting metal from the global LME warehouses to the US to take advantage of the arbitrage."
"The premium for US Comex copper futures over the LME contract surged to a record high last week, reaching as high as $1,200/t during Friday’s trading session – more than 10% of the LME price. That spread came off that record to above $900 yesterday."
"The US is reliant on around 45% of copper imports for its domestic consumption. Chile is the country's biggest supplier at 35%, followed by Canada at 26%. If implemented, tariffs would be bearish for copper and other industrial metals in the context of slowing global growth and keeping inflation higher for longer. With growth in the US likely to slow on the back of tariffs and China already struggling to revive its economy, demand for copper and other industrial metals is likely to weaken."
WTI appreciates following a Ukrainian drone attack on a pipeline responsible for transporting approximately 1% of the global crude supply.
The Ukrainian attack has led to reduced crude shipments from Kazakhstan, affecting Western firms such as Chevron and ExxonMobil.
Traders closely watch developments in the ongoing Russia-Ukraine peace talks in Saudi Arabia.
West Texas Intermediate (WTI) crude Oil price continues its upward momentum for the second consecutive day, trading around $71.70 per barrel during European hours on Tuesday. The gains follow an attack by Ukrainian drones on a major pumping station of a pipeline in southern Russia, disrupting crude Oil flows from Kazakhstan.
According to Reuters, a senior Russian official confirmed on Tuesday that Ukrainian drones targeted a pipeline responsible for transporting approximately 1% of the global crude supply. He warned that the attack could impact global markets and affect US companies. The disruption has led to reduced crude shipments from Kazakhstan, affecting Western firms such as Chevron and ExxonMobil. The Caspian Pipeline Consortium (CPC) reported on Monday that the Kropotkinskaya station, a key crude Oil transportation facility in Russia’s southern Krasnodar region, was hit by multiple drones.
Traders are also closely watching developments in the Russia-Ukraine peace talks on Tuesday. US and Russian officials are meeting in Saudi Arabia to discuss potential resolutions to the three-year-long conflict in Ukraine and the possibility of restoring US-Russia relations. However, Ukraine, which is not participating in the talks, has made it clear that no agreement can be reached without its involvement. "As a sovereign nation, we simply cannot accept any agreements made without us," President Volodymyr Zelensky said last week.
Meanwhile, reports suggest that OPEC+ producers are not considering postponing the planned series of monthly oil supply increases set to begin in April. However, concerns over a potential global trade war—fueled by US President Donald Trump’s reciprocal tariffs—have limited further gains in Oil prices.
WTI Oil FAQs
WTI Oil is a type of Crude Oil sold on international markets. The WTI stands for West Texas Intermediate, one of three major types including Brent and Dubai Crude. WTI is also referred to as “light” and “sweet” because of its relatively low gravity and sulfur content respectively. It is considered a high quality Oil that is easily refined. It is sourced in the United States and distributed via the Cushing hub, which is considered “The Pipeline Crossroads of the World”. It is a benchmark for the Oil market and WTI price is frequently quoted in the media.
Like all assets, supply and demand are the key drivers of WTI Oil price. As such, global growth can be a driver of increased demand and vice versa for weak global growth. Political instability, wars, and sanctions can disrupt supply and impact prices. The decisions of OPEC, a group of major Oil-producing countries, is another key driver of price. The value of the US Dollar influences the price of WTI Crude Oil, since Oil is predominantly traded in US Dollars, thus a weaker US Dollar can make Oil more affordable and vice versa.
The weekly Oil inventory reports published by the American Petroleum Institute (API) and the Energy Information Agency (EIA) impact the price of WTI Oil. Changes in inventories reflect fluctuating supply and demand. If the data shows a drop in inventories it can indicate increased demand, pushing up Oil price. Higher inventories can reflect increased supply, pushing down prices. API’s report is published every Tuesday and EIA’s the day after. Their results are usually similar, falling within 1% of each other 75% of the time. The EIA data is considered more reliable, since it is a government agency.
OPEC (Organization of the Petroleum Exporting Countries) is a group of 12 Oil-producing nations who collectively decide production quotas for member countries at twice-yearly meetings. Their decisions often impact WTI Oil prices. When OPEC decides to lower quotas, it can tighten supply, pushing up Oil prices. When OPEC increases production, it has the opposite effect. OPEC+ refers to an expanded group that includes ten extra non-OPEC members, the most notable of which is Russia.
As expected, the Reserve Bank of Australia (RBA) decided to lower the cash rate target by 25bps to 4.10% and the interest rate paid on Exchange Settlement balances to 4.00%. This is the first interest rate cut in more than four years, with the RBA citing some progress towards bringing down inflation. The central bank kept the policy rate steady since Nov 2023, following an extended period of 13 rate hikes to tame domestic inflation, UOB Group's Economist Lee Sue Ann notes.
RBA decides to lower rate targets
"As expected, the Reserve Bank of Australia (RBA) cut interest rates for the first time in more than four years, citing some progress towards bringing down inflation. The central bank kept the policy rate steady since Nov 2023, following an extended period of 13 rate hikes to tame domestic inflation."
"Nonetheless, today’s decision was a cautious one. The RBA warned that further monetary easing still hinged on more downside in inflation, and that if monetary policy is eased too much too soon, disinflation could stall, and inflation would settle above the midpoint of the target range. A tight labour market is also holding the RBA’s hand."
"All eyes will now turn to 4Q24 wage data on 19 Feb, followed by Jan’s employment figures on 20 Feb. We currently pencil in a total of 100bps of easing in 2025 (including today’s 25bps cut), taking the cash rate target to a terminal level of 3.35%. Note that there will be no meeting in Mar, and the next RBA meeting will be on 1 Apr, where we are expecting a pause."
Australian Dollar (AUD) is expected to trade in a 0.6335/0.6370 range vs the US Dollar (USD). In the longer run, momentum remains strong; AUD could continue to advance, potentially to 0.6410, UOB Group’s FX analysts Quek Ser Leang and Peter Chia note.
AUD can continue to advance
24-HOUR VIEW: "Following AUD sharp rise last Friday, we pointed out yesterday that 'the rally appears to be overdone, and AUD is unlikely to rise much further.' We expected AUD to 'trade in a 0.6325/0.6375 range.' AUD subsequently traded in a narrower range than expected (0.6346/0.6374), closing largely unchanged at 0.6357 (+0.06%). We continue to expect range trading today, but the softened underlying tone suggests a lower range of 0.6335/0.6370."
1-3 WEEKS VIEW: "Our update from yesterday (17 Feb, spot at 0.6355) remains valid. As highlighted, 'momentum remains strong, and we continue to expect AUD to advance, potentially to 0.6410.' On the downside, should AUD break below 0.6290 (no change in ‘strong support’ level from yesterday), it would mean that 0.6410 is out of reach for now."
The Reserve Bank of Australia cut rates for the first time in four years this morning, matching consensus and market expectations. The 25bp reduction was accompanied by some rather hawkish remarks by Governor Michele Bullock, both in the statement and in the press conference, ING’s FX analysts Francesco Pesole notes.
AUD/USD to return to 0.62 by the end of March
"Bullock seemed to focus on pushing back against the dovish repricing in the AUD curve, reiterating that the focus remains firmly on inflation risk. That approach is in contrast with those of other developed central banks which have shifted towards growth concerns."
"Markets are pricing just under two cuts in Australia by the end of 2025, while we have a slightly more dovish forecast with one cut per quarter. Bullock’s cautious tone on further easing has allowed AUD to counter the USD rebound this morning. That said, we doubt markets are ready to shift expectations to only one RBA cut this year, and AUD’s high exposure to the trade story and risk sentiment may quickly overcome any short-term benefits from the RBA’s tone today."
"We still think a return to 0.62 in AUD/USD is warranted by the end of March, with further downside risks in the second and third quarters when US protectionism may intensify."
The Canadian Consumer Price Index is seen increasing 1.8% YoY in January.
The Bank of Canada reduced its interest rate by 25 basis points in January.
The Canadian Dollar maintains the area of yearly highs vs. the US Dollar.
This Tuesday, Statistics Canada will unveil its latest inflation report for January, based on data from the Consumer Price Index (CPI). Early forecasts suggest that headline inflation held steady at 1.8% compared with January of last year.
In addition, the Bank of Canada (BoC) is also stepping into the spotlight with its core CPI data, which cuts out the more unpredictable items like food and energy. For a bit of context: December’s core CPI dipped by 0.3% from the previous month, though it still marked a 1.8% rise from a year earlier, while headline inflation was up by 1.8% annually and dropped 0.4% on a monthly basis.
These numbers carry the potential to impact the Canadian Dollar (CAD). The BoC's approach to interest rates is key here. Since easing began in June 2024, the central bank has slashed its policy rate by 200 basis points, lowering it to 3.00% as of January 29.
Meanwhile, the CAD has been on a positive ride, steadily regaining value in the last couple of weeks. In fact, USD/CAD has dropped to two-month lows during last week, revisiting the 1.4150 region and extending its rejection from yearly peaks around the 1.4800 barrier recorded at the beginning of the month.
What can we expect from Canada’s inflation rate?
According to the meeting Minutes published on February 12, the rate cut of 25 basis points was driven by both concerns over tariff threats and a desire to bolster growth. Last month, the Bank of Canada noted that the persistent threat of tariffs was obscuring its forecasts with members admitting that predicting US trade policy was impossible.
Following the latest BoC gathering on January 29, Governor Tiff Macklem said that a significant increase in tariffs would initially push prices — and consequently inflation — up, noting that the lags in monetary policy meant there was little that could be done about that immediate effect. He explained that the key concern was to prevent that initial price surge from spreading to other prices and wages, which could lead to persistent inflation. He emphasised that while inflation was expected to rise, the focus would be on ensuring it eventually returned to 2%, as allowing a sustained increase would not be good for Canadians.
Previewing the data release, analysts at BBH note: “Canada highlight will be January CPI data Tuesday. Headline is expected at 1.9% y/y vs. 1.8% in December, core median is expected to remain steady at 2.4% y/y, and core trim is expected at 2.6% y/y vs. 2.5% in December. The GST/HST holiday (from December 14, 2024 to February 15, 2025) will pull down inflation in January, particularly in categories such as food services and semi-durable goods. The Bank of Canada projects headline and core CPI inflation to average 2.1% and 2.5% over Q1, respectively. The BoC has room to ease further, though at a more gradual pace because inflation has been around 2% since August. The market is pricing in 50 bp of easing over the next 12 months that would see the policy rate bottom at 2.50%”.
When is the Canada CPI data due and how could it affect USD/CAD?
Canada's January inflation report will be published on Tuesday at 13:30 GMT, and all eyes will be on whether the data throws any curveballs. If the numbers stick to expectations, the Bank of Canada’s current rate outlook will likely stay on track.
Meanwhile, USD/CAD has been trading in a bearish trend since the beginning of the month, dropping as low as the 1.4150 zone on February 14 — the lowest level in the last couple of months. In addition, the pair retreated for the second week in a row, shedding nearly 7 cents from year-to-date highs of around 1.4800 recorded earlier in the month.
Pablo Piovano, Senior Analyst at FXStreet, believes that despite the ongoing recovery, the Canadian Dollar should remain under pressure from US Dollar dynamics and the tariffs narrative in the medium term.
“Bullish attempts should lead USD/CAD to a potential visit to the interim 55-day SMA at 1.4305, prior to the 2025 high of 1.4792 reached on February 3,” Piovano explains.
On the downside, there’s initial support around the 2025 bottom of 1.4150 (recorded on February 14), followed by the provisional 100-day SMA at 1.4090 and the key psychological threshold of 1.4000. A breach of the latter could trigger additional selling pressure. Targets would move toward the significant 200-day SMA at 1.3816, then the November low of 1.3823, and finally the September low of 1.3418, according to Piovano.
Economic Indicator
BoC Consumer Price Index Core (MoM)
The BoC Consumer Price Index Core, released by the Bank of Canada (BoC) on a monthly basis, represents changes in prices for Canadian consumers by comparing the cost of a fixed basket of goods and services. It is considered a measure of underlying inflation as it excludes eight of the most-volatile components: fruits, vegetables, gasoline, fuel oil, natural gas, mortgage interest, intercity transportation and tobacco products. The MoM figure compares the prices of goods in the reference month to the previous month. Generally, a high reading is seen as bullish for the Canadian Dollar (CAD), while a low reading is seen as bearish.
Inflation measures the rise in the price of a representative basket of goods and services. Headline inflation is usually expressed as a percentage change on a month-on-month (MoM) and year-on-year (YoY) basis. Core inflation excludes more volatile elements such as food and fuel which can fluctuate because of geopolitical and seasonal factors. Core inflation is the figure economists focus on and is the level targeted by central banks, which are mandated to keep inflation at a manageable level, usually around 2%.
The Consumer Price Index (CPI) measures the change in prices of a basket of goods and services over a period of time. It is usually expressed as a percentage change on a month-on-month (MoM) and year-on-year (YoY) basis. Core CPI is the figure targeted by central banks as it excludes volatile food and fuel inputs. When Core CPI rises above 2% it usually results in higher interest rates and vice versa when it falls below 2%. Since higher interest rates are positive for a currency, higher inflation usually results in a stronger currency. The opposite is true when inflation falls.
Although it may seem counter-intuitive, high inflation in a country pushes up the value of its currency and vice versa for lower inflation. This is because the central bank will normally raise interest rates to combat the higher inflation, which attract more global capital inflows from investors looking for a lucrative place to park their money.
Formerly, Gold was the asset investors turned to in times of high inflation because it preserved its value, and whilst investors will often still buy Gold for its safe-haven properties in times of extreme market turmoil, this is not the case most of the time. This is because when inflation is high, central banks will put up interest rates to combat it. Higher interest rates are negative for Gold because they increase the opportunity-cost of holding Gold vis-a-vis an interest-bearing asset or placing the money in a cash deposit account. On the flipside, lower inflation tends to be positive for Gold as it brings interest rates down, making the bright metal a more viable investment alternative.
Scope for Pound Sterling (GBP) to edge higher vs US Dollar (USD), but any advance is likely part of a higher trading range of 1.2580/1.2655. Further GBP strength appears likely; the focus is at 1.2655, UOB Group’s FX analysts Quek Ser Leang and Peter Chia note.
Further GBP strength appears likely
24-HOUR VIEW: "After GBP rose to 1.2631 last Friday and then pulled back, we indicated yesterday that 'the pullback in overbought conditions suggests that GBP is unlikely to rise much further.' We expected GBP to 'trade in a range between 1.2540 and 1.2620.' However, GBP edged to a high of 1.2635 before closing at 1.2626 (+0.33%). While there is scope for GBP to continue to edge higher, any advance is likely part of a higher trading range of 1.2580/1.2655. In other words, GBP is unlikely to break clearly above 1.2655."
1-3 WEEKS VIEW: "There is not much to add to our update from yesterday (17 Feb, spot at 1.2580). As highlighted, 'further GBP strength appears likely, and the focus now is at 1.2655.' On the downside, a breach of 1.2525 (‘strong support’ level was at 1.2480 yesterday) would suggest that GBP is not strengthening further."
Our baseline view for this week has been that the dollar correction has run its course, and we still favour chasing a USD rebound against other G10 currencies. There is admittedly some residual room for a risk-on/dollar-off move once a potential Russia-Ukraine peace deal is agreed, but markets are largely pricing it in at this stage and there are no guarantees for now that it will allow to price out longer-run geopolitical risk, ING’s FX analysts Francesco Pesole notes.
"Today, markets will remain focused on any developments on the US-Russia bilateral talks on Ukraine, but barring a major breakthrough, the optimistic push and relative upbeat risk sentiment may stall or fade in the next couple of days and the dollar can continue to recover some ground."
"Also on the positioning side, there is some evidence that the dollar longs are slightly less stretched. CFTC USD positioning versus G10 currencies excluding SEK and NOK (which are not reported) has inched back lower to a seven-week low, albeit remaining above +20% of open interest."
"Macro developments will likely play a secondary role this week, with the exception of tomorrow’s FOMC minutes. Today’s Empire Manufacturing index and TIC flows out of the US should have limited market impact."
Euro (EUR) is expected to consolidate vs the US Dollar (USD) in a 1.0455/1.0505 range. In the longer run, outlook for EUR is positive, with a technical target of 1.0530, UOB Group’s FX analysts Quek Ser Leang and Peter Chia note.
Outlook for EUR looks positive
24-HOUR VIEW: "We indicated yesterday that 'the combination of slowing momentum and overbought conditions suggests that instead of continuing to rise, EUR is more likely to consolidate within a 1.0455/1.0515 range.' Our view of consolidation was not wrong, even though EUR traded in a narrower range than expected (1.0466/1.0506). The price movements did not result in an increase in either downward or upward momentum, and we continue to expect EUR to consolidate. Expected range for today: 1.0455/1.0505."
1-3 WEEKS VIEW: "Our update from last Friday (14 Feb, spot at 1.0460) remains valid. As highlighted, 'the outlook for EUR is positive, with a technical target of 1.0530.' Overall, only a breach of 1.0415 (‘strong support’ level was at 1.0400 yesterday) would indicate that the current upward pressure has faded."
Here is what you need to know on Tuesday, February 18:
The trading action in foreign exchange markets remains choppy early Tuesday as investors' search for the next catalyst continues. The European economic calendar will feature February ZEW Survey - Economic Sentiment for Germany and the Eurozone. Later in the day, January Consumer Price Index (CPI) data from Canada will be watched closely by market participants.
Following a three-day weekend, bond markets in the US reopened and the yield on the 10-year reference recovered above 4.5% early Tuesday, supporting the US Dollar (USD). After ending the first day of the week virtually unchanged, the USD Index clings to modest daily gains near 107.00 early Tuesday. Several Federal Reserve (Fed) policymakers will be delivering speeches later in the American session.
US Dollar PRICE This week
The table below shows the percentage change of US Dollar (USD) against listed major currencies this week. US Dollar was the strongest against the Euro.
USD
EUR
GBP
JPY
CAD
AUD
NZD
CHF
USD
0.26%
-0.23%
-0.18%
0.07%
-0.11%
0.16%
0.06%
EUR
-0.26%
-0.34%
-0.48%
-0.10%
-0.29%
-0.00%
-0.10%
GBP
0.23%
0.34%
-0.06%
0.25%
0.11%
0.34%
0.24%
JPY
0.18%
0.48%
0.06%
0.25%
0.11%
0.55%
0.22%
CAD
-0.07%
0.10%
-0.25%
-0.25%
-0.16%
0.09%
-0.01%
AUD
0.11%
0.29%
-0.11%
-0.11%
0.16%
0.28%
0.19%
NZD
-0.16%
0.00%
-0.34%
-0.55%
-0.09%
-0.28%
-0.10%
CHF
-0.06%
0.10%
-0.24%
-0.22%
0.00%
-0.19%
0.10%
The heat map shows percentage changes of major currencies against each other. The base currency is picked from the left column, while the quote currency is picked from the top row. For example, if you pick the US Dollar from the left column and move along the horizontal line to the Japanese Yen, the percentage change displayed in the box will represent USD (base)/JPY (quote).
The Reserve Bank of Australia (RBA) announced early Tuesday that it lowered the policy rate by 25 basis points (bps) to 4.1% from 4.35%. This decision came in line with the market expectation. Based on its revised projections, the RBA said that disinflation could stall and inflation would settle above the midpoint of the target range if monetary policy were to be eased too much too soon. In the post-meeting press conference, Governor Michele Bullock noted that further rate cuts implied by the market are not guaranteed. AUD/USD showed no immediate reaction to the RBA event and was last seen trading flat on the day at around 0.6350.
The UK's Office for National Statistics reported early Tuesday that the ILO Unemployment Rate held steady at 4.4% in the three months to December. This reading came in better than the market expectation of 4.5%. Other details of the report showed that the Employment Change was 107,000 in the same period, up sharply from the 35,000 recorded for the previous month. GBP/USD edges slightly higher following the labor market data and trades little changed on the day above 1.2600.
After losing nearly 0.8% last week, USD/CAD stays in a consolidation phase slightly below 1.4200 this week. The CPI in Canada is forecast to rise 1.8% on a yearly basis in January, matching December's increase.
EUR/USD stays under modest bearish pressure but manages to hold above 1.0450 in the European morning on Tuesday.
Gold holds its ground and trades in positive territory above $2,900 after posting modest gains on Monday.
Central banks FAQs
Central Banks have a key mandate which is making sure that there is price stability in a country or region. Economies are constantly facing inflation or deflation when prices for certain goods and services are fluctuating. Constant rising prices for the same goods means inflation, constant lowered prices for the same goods means deflation. It is the task of the central bank to keep the demand in line by tweaking its policy rate. For the biggest central banks like the US Federal Reserve (Fed), the European Central Bank (ECB) or the Bank of England (BoE), the mandate is to keep inflation close to 2%.
A central bank has one important tool at its disposal to get inflation higher or lower, and that is by tweaking its benchmark policy rate, commonly known as interest rate. On pre-communicated moments, the central bank will issue a statement with its policy rate and provide additional reasoning on why it is either remaining or changing (cutting or hiking) it. Local banks will adjust their savings and lending rates accordingly, which in turn will make it either harder or easier for people to earn on their savings or for companies to take out loans and make investments in their businesses. When the central bank hikes interest rates substantially, this is called monetary tightening. When it is cutting its benchmark rate, it is called monetary easing.
A central bank is often politically independent. Members of the central bank policy board are passing through a series of panels and hearings before being appointed to a policy board seat. Each member in that board often has a certain conviction on how the central bank should control inflation and the subsequent monetary policy. Members that want a very loose monetary policy, with low rates and cheap lending, to boost the economy substantially while being content to see inflation slightly above 2%, are called ‘doves’. Members that rather want to see higher rates to reward savings and want to keep a lit on inflation at all time are called ‘hawks’ and will not rest until inflation is at or just below 2%.
Normally, there is a chairman or president who leads each meeting, needs to create a consensus between the hawks or doves and has his or her final say when it would come down to a vote split to avoid a 50-50 tie on whether the current policy should be adjusted. The chairman will deliver speeches which often can be followed live, where the current monetary stance and outlook is being communicated. A central bank will try to push forward its monetary policy without triggering violent swings in rates, equities, or its currency. All members of the central bank will channel their stance toward the markets in advance of a policy meeting event. A few days before a policy meeting takes place until the new policy has been communicated, members are forbidden to talk publicly. This is called the blackout period.
The US Dollar Index may face challenges as the 14-day RSI remains below 50, signaling increased bearish bias.
The primary key support appears around the descending channel’s lower boundary at 106.30.
The DXY may target its primary resistance at the nine-day EMA of 107.34
The US Dollar Index (DXY) ticks higher on Tuesday, hovering around 107.00 during European trading hours after three consecutive sessions of losses. The daily chart indicates a prevailing bearish bias as the index remains confined within a descending channel.
The 14-day Relative Strength Index (RSI) sits below the 50 mark, signaling strengthening bearish momentum. Additionally, the DXY remains below the nine- and 14-day Exponential Moving Averages (EMAs), reinforcing weak short-term price momentum.
On the downside, the US Dollar Index may test the lower boundary of the descending channel at 106.30, followed by psychological support at 106.00. A break below this level could deepen the bearish trend, potentially pushing the index toward the three-month low of 105.41, recorded on December 6.
Conversely, immediate resistance lies at the nine-day EMA of 107.34, followed by the 14-day EMA at 107.54. A decisive break above these levels could improve short-term momentum, opening the door for a move toward the upper boundary of the descending channel at 109.50, with further upside potential toward the five-week high of 109.80, last tested on February 3.
US Dollar Index: Daily Chart
US Dollar PRICE Today
The table below shows the percentage change of US Dollar (USD) against listed major currencies today. US Dollar was the strongest against the New Zealand Dollar.
USD
EUR
GBP
JPY
CAD
AUD
NZD
CHF
USD
0.17%
0.06%
0.35%
0.04%
0.07%
0.48%
-0.04%
EUR
-0.17%
-0.11%
0.21%
-0.13%
-0.11%
0.31%
-0.21%
GBP
-0.06%
0.11%
0.31%
-0.02%
-0.00%
0.41%
-0.11%
JPY
-0.35%
-0.21%
-0.31%
-0.32%
-0.30%
0.10%
-0.41%
CAD
-0.04%
0.13%
0.02%
0.32%
0.02%
0.44%
-0.09%
AUD
-0.07%
0.11%
0.00%
0.30%
-0.02%
0.42%
-0.14%
NZD
-0.48%
-0.31%
-0.41%
-0.10%
-0.44%
-0.42%
-0.52%
CHF
0.04%
0.21%
0.11%
0.41%
0.09%
0.14%
0.52%
The heat map shows percentage changes of major currencies against each other. The base currency is picked from the left column, while the quote currency is picked from the top row. For example, if you pick the US Dollar from the left column and move along the horizontal line to the Japanese Yen, the percentage change displayed in the box will represent USD (base)/JPY (quote).
The ongoing discussion among EU leaders for a joint fund for defence spending is unlikely to drive much support for European currencies. That’s because the trigger is US President Donald Trump’s threat to scale back military support for NATO borders in Europe, which is hardly a net-positive development for local currencies, ING’s FX analysts Francesco Pesole notes.
EUR/USD to trade 1.02 in the end of the quarter
"It is equally far-fetched to hope any such EU coordination on common spending will be replicated on the fiscal side to counter US protectionism. The eurozone’s structural unpreparedness to face the economic consequences of Trump’s tariffs continues to form the basis of our bearish EUR view. Market pricing on the European Central Bank is around -75bp for year-end, but we think four more cuts this year (to 1.75%) will be warranted."
"EUR/USD has obliterated the negative risk premium related to US tariffs. Remember in mid-January that amounted to 3% of undervaluation, according to our short-term fair value model. It seems that the Ukraine-Russia peace negotiations have offset the tariff threat in FX."
"However, the latter likely have more tangible implications for the ECB, the economy, and by extension the euro, and we therefore favour a lower EUR/USD. Our forecast for the end of this quarter is 1.02."
The Pound Sterling recovers sharply against its major peers after upbeat UK employment data for the three months ending December.
The UK economy added 107K workers and the jobless rate remained steady at 4.4%, lower than estimates of 4.5%.
Investors await the UK CPI data and the FOMC minutes on Wednesday.
The Pound Sterling (GBP) bounces back against its major peers on Tuesday after the release of upbeat United Kingdom (UK) labor market data for the three months ending December. The Office for National Statistics (ONS) reported that the economy added 107K workers, significantly higher than the 35K seen in the September-November period.
The ILO Unemployment Rate remained steady at 4.4%, while it was anticipated to have accelerated to 4.5%. Investors were worried about the employment data as business owners had been disappointed with Chancellor of the Exchequer Rachel Reeves’s announcement of raising employers’ contribution to National Insurance (NI). In the Autumn Budget, Reeves increased employers' social security contributions by 1.2% to 15%, which will come into effect from April.
The employment data also seems to be contradictory to Bank of England (BoE) Governor Andrew Bailey’s warning that he sees some softness in the labor market, as he said in an interview with BusinessLive on Monday. In the interview, Bailey also said that the economic outlook sluggish and surprisingly upbeat Q4 Gross Domestic Product (GDP) data had not changed the “bigger picture”. In February’s monetary policy statement, the BoE halved its growth forecasts for the year to 0.75%.
In addition to strong employment figures, Average Earnings data, a key measure of wage growth, accelerated in the three months ending December. Average Earnings Excluding bonuses accelerated to 5.9%, as expected, from the prior reading of 5.6%. Meanwhile, Average Earnings, Including bonuses, rose by 6%, faster than estimates of 5.9% and the former release of 5.6%.
High wage growth momentum would prompt inflation expectations and force the BoE to hold interest rates at 4.5%.
Going forward, investors will focus on the UK Consumer Price Index (CPI) data for January, which will be released on Wednesday.
Daily digest market movers: Pound Sterling recovers significant intraday losses against US Dollar
The Pound Sterling recovers most of its intraday losses against the US Dollar (USD) after better-than-expected UK labor market data. Earlier in the day, the GBP/USD pair declined as the US Dollar rebounded.
The US Dollar Index (DXY), which tracks the Greenback’s value against six major currencies, rebounds to near 107.00 from the two-month low of 106.50, which it posted on Friday. The Greenback bounces back as investors expect inflationary pressures stemming from United States (US) President Donald Trump’s economic agenda will be persistent.
President Trump has announced 25% tariffs on steel and aluminum imports from all nations and 10% on China. However, Trump’s reciprocal tariff plan is delayed and unlikely to come into effect before April. President Trump's nominated Commerce Secretary, Howard Lutnick, said on Thursday that the President will be ready to move on reciprocal tariffs by April 1.
Meanwhile, firm expectations that the Federal Reserve (Fed) will keep interest rates at their current levels for longer have also offered support to the US Dollar. Fed Governor Michelle Bowman said in her prepared remarks at the American Bankers Association conference on Monday that the benchmark interest rate "is now in a good place”, allowing the Committee to be patient and pay closer attention to the inflation data as it evolves. Bowman added that she wants to gain “greater confidence” that progress in lowering inflation will “continue” before supporting monetary policy adjustments.
Going forward, the Federal Open Market Committee (FOMC) minutes for the January meeting, which will be released on Wednesday, will be a major trigger for the US Dollar. Investors will look for cues about how long the Fed will keep interest rates in the current range of 4.25%-4.50%.
Technical Analysis: Pound Sterling aims to stabilize above 1.2600
The Pound Sterling strives to hold above the key level of 1.2600 against the US Dollar in European trading hours on Tuesday. The near-term outlook of the GBP/USD pair has turned bullish, as it holds above the 50-day Exponential Moving Average (EMA), which stands at around 1.2500.
The 14-day Relative Strength Index (RSI) holds above 60.00. A bullish momentum would activate if the RSI (14) sustains above that level.
Looking down, the February 3 low of 1.2250 will act as a key support zone for the pair. On the upside, the December 6 high of 1.2810 will act as a key resistance zone.
Pound Sterling FAQs
The Pound Sterling (GBP) is the oldest currency in the world (886 AD) and the official currency of the United Kingdom. It is the fourth most traded unit for foreign exchange (FX) in the world, accounting for 12% of all transactions, averaging $630 billion a day, according to 2022 data. Its key trading pairs are GBP/USD, also known as ‘Cable’, which accounts for 11% of FX, GBP/JPY, or the ‘Dragon’ as it is known by traders (3%), and EUR/GBP (2%). The Pound Sterling is issued by the Bank of England (BoE).
The single most important factor influencing the value of the Pound Sterling is monetary policy decided by the Bank of England. The BoE bases its decisions on whether it has achieved its primary goal of “price stability” – a steady inflation rate of around 2%. Its primary tool for achieving this is the adjustment of interest rates. When inflation is too high, the BoE will try to rein it in by raising interest rates, making it more expensive for people and businesses to access credit. This is generally positive for GBP, as higher interest rates make the UK a more attractive place for global investors to park their money. When inflation falls too low it is a sign economic growth is slowing. In this scenario, the BoE will consider lowering interest rates to cheapen credit so businesses will borrow more to invest in growth-generating projects.
Data releases gauge the health of the economy and can impact the value of the Pound Sterling. Indicators such as GDP, Manufacturing and Services PMIs, and employment can all influence the direction of the GBP. A strong economy is good for Sterling. Not only does it attract more foreign investment but it may encourage the BoE to put up interest rates, which will directly strengthen GBP. Otherwise, if economic data is weak, the Pound Sterling is likely to fall.
Another significant data release for the Pound Sterling is the Trade Balance. This indicator measures the difference between what a country earns from its exports and what it spends on imports over a given period. If a country produces highly sought-after exports, its currency will benefit purely from the extra demand created from foreign buyers seeking to purchase these goods. Therefore, a positive net Trade Balance strengthens a currency and vice versa for a negative balance.
NZD/USD faces challenges as the US Dollar strengthens amid rising Treasury yields.
Fed Governor Michelle Bowman warned that upside inflation risks persist, stressing the need for more clarity before considering rate cuts.
The RBNZ is expected to cut its Official Cash Rate by 50 basis points, bringing it down to 3.75%, at Wednesday's meeting.
NZD/USD retreats after three consecutive days of gains, trading around 0.5710 during European hours on Tuesday. The decline is driven by a stronger US Dollar as Treasury yields rise.
The US Dollar Index (DXY), which measures the USD against six major currencies, edges higher to 106.90 after three days of losses. Meanwhile, US Treasury yields stand at 4.27% for the 2-year note and 4.50% for the 10-year note.
On Monday, Federal Reserve Governor Michelle Bowman cautioned about persistent upside risks and emphasized the need for more certainty before considering rate cuts. Fed Governor Christopher Waller acknowledged inflation improvements but noted the slow progress, stressing the importance of data-driven decisions amid policy uncertainty.
However, the NZD/USD pair found some support following US President Donald Trump’s decision to delay reciprocal tariffs. Additionally, a US retail sales report fueled speculation that the Federal Reserve might cut interest rates later this year despite ongoing inflation concerns.
The New Zealand Dollar (NZD) remains under pressure as expectations grow for a significant rate cut by the Reserve Bank of New Zealand (RBNZ) at its Wednesday meeting. The RBNZ is anticipated to slash the Official Cash Rate (OCR) by 50 basis points to 3.75%.
Traders will closely watch RBNZ Governor Adrian Orr’s press conference after the rate decision for insights into the central bank’s future policy stance. Any dovish signals could add to selling pressure on the Kiwi Dollar.
New Zealand Dollar FAQs
The New Zealand Dollar (NZD), also known as the Kiwi, is a well-known traded currency among investors. Its value is broadly determined by the health of the New Zealand economy and the country’s central bank policy. Still, there are some unique particularities that also can make NZD move. The performance of the Chinese economy tends to move the Kiwi because China is New Zealand’s biggest trading partner. Bad news for the Chinese economy likely means less New Zealand exports to the country, hitting the economy and thus its currency. Another factor moving NZD is dairy prices as the dairy industry is New Zealand’s main export. High dairy prices boost export income, contributing positively to the economy and thus to the NZD.
The Reserve Bank of New Zealand (RBNZ) aims to achieve and maintain an inflation rate between 1% and 3% over the medium term, with a focus to keep it near the 2% mid-point. To this end, the bank sets an appropriate level of interest rates. When inflation is too high, the RBNZ will increase interest rates to cool the economy, but the move will also make bond yields higher, increasing investors’ appeal to invest in the country and thus boosting NZD. On the contrary, lower interest rates tend to weaken NZD. The so-called rate differential, or how rates in New Zealand are or are expected to be compared to the ones set by the US Federal Reserve, can also play a key role in moving the NZD/USD pair.
Macroeconomic data releases in New Zealand are key to assess the state of the economy and can impact the New Zealand Dollar’s (NZD) valuation. A strong economy, based on high economic growth, low unemployment and high confidence is good for NZD. High economic growth attracts foreign investment and may encourage the Reserve Bank of New Zealand to increase interest rates, if this economic strength comes together with elevated inflation. Conversely, if economic data is weak, NZD is likely to depreciate.
The New Zealand Dollar (NZD) tends to strengthen during risk-on periods, or when investors perceive that broader market risks are low and are optimistic about growth. This tends to lead to a more favorable outlook for commodities and so-called ‘commodity currencies’ such as the Kiwi. Conversely, NZD tends to weaken at times of market turbulence or economic uncertainty as investors tend to sell higher-risk assets and flee to the more-stable safe havens.
07:45
France Consumer Price Index (EU norm) (YoY) meets forecasts (1.8%) in January
07:45
France Inflation ex-tobacco (MoM): 0.1% (January) vs previous 0.2%
07:45
France Consumer Price Index (EU norm) (MoM) in line with expectations (-0.2%) in January
GBP/JPY strengthens following the release of the UK employment data.
The ILO Unemployment Rate remained unchanged at 4.4% in the three months ending in December.
Japanese Yen depreciates due to increased market optimism following the postponement of Trump's reciprocal tariffs.
GBP/JPY halts its three-day losing streak, trading around 191.50 during the early European hours on Tuesday. The currency cross finds fresh demand on the release of the employment data from the United Kingdom (UK).
The Office for National Statistics (ONS) reported on Tuesday that the ILO Unemployment Rate held steady at 4.4% in the three months leading up to December, aligning with previous figures. Market expectations had anticipated a slight increase to 4.5%.
Claimant Count Change, showing that the number of people claiming jobless benefits, climbed by 22K in January, compared with a revised drop of 15.1K in December, missing the estimated 10K figure. The Employment Change data for December came in at 107K versus November’s 35K.
The GBP/JPY cross also appreciates as the Japanese Yen (JPY) loses ground amid increased market optimism due to the postponement of the implementation of US President Donald Trump's reciprocal tariffs.
However, the Japanese Yen may regain its ground amid increased hawkish sentiment surrounding the Bank of Japan’s (BoE) policy outlook, driven by a robust Japan’s Gross Domestic Product (GDP) report that exceeded expectations.
Markets are now pricing-in an additional 37 basis points rate increase by the Bank of Japan in 2025, driving the yield on the benchmark 10-year Japanese government bond to its highest level since April 2010.
Economic Indicator
ILO Unemployment Rate (3M)
The ILO Unemployment Rate released by the UK Office for National Statistics is the number of unemployed workers divided by the total civilian labor force. It is a leading indicator for the UK Economy. If the rate goes up, it indicates a lack of expansion within the UK labor market. As a result, a rise leads to a weakening of the UK economy. Generally, a decrease of the figure is seen as bullish for the Pound Sterling (GBP), while an increase is seen as bearish.
The Unemployment Rate is the broadest indicator of Britain’s labor market. The figure is highlighted by the broad media, beyond the financial sector, giving the publication a more significant impact despite its late publication. It is released around six weeks after the month ends. While the Bank of England is tasked with maintaining price stability, there is a substantial inverse correlation between unemployment and inflation. A higher than expected figure tends to be GBP-bearish.
07:30
Switzerland Industrial Production (YoY): 2.3% (4Q) vs previous 3.5%
EUR/GBP softens to around 0.8295 in Tuesday’s early European session.
UK Unemployment Rate held steady at 4.4% in three months to December; Claimant Count Change came in at 22K in January.
The dovish mood surrounding the ECB could weigh on the Euro.
The EUR/GBP cross edges lower to near 0.8295 during the early European trading hours on Tuesday. The Pound Sterling (GBP) strengthens after the UK employment report. Later on Tuesday, investors will keep an eye on the Bank of England’s (BOE) Governor Andrew Bailey speech and Germany’s ZEW Survey for February.
Data released by the UK Office for National Statistics on Tuesday showed that the country’s ILO Unemployment Rate remained steady at 4.4% in the three months to December. This figure beated the expectations of 4.5% during the reported period. Meanwhile, the Claimant Count Change increased by 22K in January versus -15.1K prior (revised from 0.7K), missing the estimated 10K figure. The GBP remains firm in an immediate reaction to the mixed UK employment report.
Earlier this month, the BoE cut its benchmark interest rate to 4.50% from 4.75%. The UK central bank policymakers said inflation was likely to hit 3.7% later this year, almost double the BoE's 2% target. This might trigger the BoE to add the word "careful" to its message about a likely "gradual" further reduction in borrowing costs.
On the Euro front, the dovish stance from the European Central Bank (ECB) might drag the Euro (EUR) lower against the GBP. The ECB policymakers remain comfortable with the outlook for three more rate cuts this year, following a 25 basis points (bps) reduction to 2.75% last month.
Pound Sterling FAQs
The Pound Sterling (GBP) is the oldest currency in the world (886 AD) and the official currency of the United Kingdom. It is the fourth most traded unit for foreign exchange (FX) in the world, accounting for 12% of all transactions, averaging $630 billion a day, according to 2022 data. Its key trading pairs are GBP/USD, also known as ‘Cable’, which accounts for 11% of FX, GBP/JPY, or the ‘Dragon’ as it is known by traders (3%), and EUR/GBP (2%). The Pound Sterling is issued by the Bank of England (BoE).
The single most important factor influencing the value of the Pound Sterling is monetary policy decided by the Bank of England. The BoE bases its decisions on whether it has achieved its primary goal of “price stability” – a steady inflation rate of around 2%. Its primary tool for achieving this is the adjustment of interest rates. When inflation is too high, the BoE will try to rein it in by raising interest rates, making it more expensive for people and businesses to access credit. This is generally positive for GBP, as higher interest rates make the UK a more attractive place for global investors to park their money. When inflation falls too low it is a sign economic growth is slowing. In this scenario, the BoE will consider lowering interest rates to cheapen credit so businesses will borrow more to invest in growth-generating projects.
Data releases gauge the health of the economy and can impact the value of the Pound Sterling. Indicators such as GDP, Manufacturing and Services PMIs, and employment can all influence the direction of the GBP. A strong economy is good for Sterling. Not only does it attract more foreign investment but it may encourage the BoE to put up interest rates, which will directly strengthen GBP. Otherwise, if economic data is weak, the Pound Sterling is likely to fall.
Another significant data release for the Pound Sterling is the Trade Balance. This indicator measures the difference between what a country earns from its exports and what it spends on imports over a given period. If a country produces highly sought-after exports, its currency will benefit purely from the extra demand created from foreign buyers seeking to purchase these goods. Therefore, a positive net Trade Balance strengthens a currency and vice versa for a negative balance.
West Texas Intermediate (WTI) Oil price advances on Tuesday, according to FXStreet data. WTI trades at $71.47 per barrel, up from Monday’s close at $71.30.
Brent Oil Exchange Rate (Brent crude) is also up, advancing from the $75.08 price posted on Monday, and trading at $75.23.
WTI Oil FAQs
WTI Oil is a type of Crude Oil sold on international markets. The WTI stands for West Texas Intermediate, one of three major types including Brent and Dubai Crude. WTI is also referred to as “light” and “sweet” because of its relatively low gravity and sulfur content respectively. It is considered a high quality Oil that is easily refined. It is sourced in the United States and distributed via the Cushing hub, which is considered “The Pipeline Crossroads of the World”. It is a benchmark for the Oil market and WTI price is frequently quoted in the media.
Like all assets, supply and demand are the key drivers of WTI Oil price. As such, global growth can be a driver of increased demand and vice versa for weak global growth. Political instability, wars, and sanctions can disrupt supply and impact prices. The decisions of OPEC, a group of major Oil-producing countries, is another key driver of price. The value of the US Dollar influences the price of WTI Crude Oil, since Oil is predominantly traded in US Dollars, thus a weaker US Dollar can make Oil more affordable and vice versa.
The weekly Oil inventory reports published by the American Petroleum Institute (API) and the Energy Information Agency (EIA) impact the price of WTI Oil. Changes in inventories reflect fluctuating supply and demand. If the data shows a drop in inventories it can indicate increased demand, pushing up Oil price. Higher inventories can reflect increased supply, pushing down prices. API’s report is published every Tuesday and EIA’s the day after. Their results are usually similar, falling within 1% of each other 75% of the time. The EIA data is considered more reliable, since it is a government agency.
OPEC (Organization of the Petroleum Exporting Countries) is a group of 12 Oil-producing nations who collectively decide production quotas for member countries at twice-yearly meetings. Their decisions often impact WTI Oil prices. When OPEC decides to lower quotas, it can tighten supply, pushing up Oil prices. When OPEC increases production, it has the opposite effect. OPEC+ refers to an expanded group that includes ten extra non-OPEC members, the most notable of which is Russia.
(An automation tool was used in creating this post.)
Bank of Japan (BoJ) Governor Kazuo Ueda said on Tuesday, “we are aware of views we had not been clear enough in our policy guidance.”
“Last summer's volatility was mainly caused by market concern over weak US jobs data, US economic slowdown,” he added.
Market reaction
At the time of writing, USD/JPY is up 0.22% on the day at 151.84, having pared some of the intraday gains.
Japanese Yen PRICE Today
The table below shows the percentage change of Japanese Yen (JPY) against listed major currencies today. Japanese Yen was the weakest against the Australian Dollar.
USD
EUR
GBP
JPY
CAD
AUD
NZD
CHF
USD
0.15%
0.05%
0.27%
0.00%
-0.05%
0.37%
0.09%
EUR
-0.15%
-0.10%
0.11%
-0.14%
-0.20%
0.20%
-0.06%
GBP
-0.05%
0.10%
0.23%
-0.04%
-0.10%
0.31%
0.04%
JPY
-0.27%
-0.11%
-0.23%
-0.28%
-0.33%
0.06%
-0.19%
CAD
-0.01%
0.14%
0.04%
0.28%
-0.05%
0.36%
0.09%
AUD
0.05%
0.20%
0.10%
0.33%
0.05%
0.41%
0.14%
NZD
-0.37%
-0.20%
-0.31%
-0.06%
-0.36%
-0.41%
-0.26%
CHF
-0.09%
0.06%
-0.04%
0.19%
-0.09%
-0.14%
0.26%
The heat map shows percentage changes of major currencies against each other. The base currency is picked from the left column, while the quote currency is picked from the top row. For example, if you pick the Japanese Yen from the left column and move along the horizontal line to the US Dollar, the percentage change displayed in the box will represent JPY (base)/USD (quote).
07:06
United Kingdom Claimant Count Rate: 4.6% (January)
The UK Unemployment Rate held steady at 4.4% in three months to December.
The Claimant Count Change for Britain came in at 22K in January.
GBP/USD trims losses to regain 1.2600 after mixed UK employment data
The United Kingdom’s (UK) ILO Unemployment Rate remained at 4.4% in the three months to December, the data published by the Office for National Statistics (ONS) showed on Tuesday. The market forecast was for a 4.5% print in the reported period.
Additional details of the report showed that the number of people claiming jobless benefits climbed by 22K in January, compared with a revised drop of 15.1K in December, missing the estimated 10K figure.
The Employment Change data for December came in at 107K versus November’s 35K.
Meanwhile, Average Earnings, excluding Bonus, in the UK increased by 5.9% three months year-on-year (3M YoY) in December versus a 5.6% growth booked previously. Markets expected a 5.9% reading.
Another measure of wage inflation, Average Earnings, including Bonus, rose 5.9% in the same period after accelerating by 5.6% in the quarter through November. The data surpassed the market consensus of 5.9%.
GBP/USD reaction to the UK employment report
GBP/USD finds fresh demand and trims losses on the release of the UK employment data. The pair is trading 0.09% lower on the day at 1.2613, as of writing.
British Pound PRICE Today
The table below shows the percentage change of British Pound (GBP) against listed major currencies today. British Pound was the weakest against the US Dollar.
USD
EUR
GBP
JPY
CAD
AUD
NZD
CHF
USD
0.18%
0.10%
0.30%
0.05%
0.00%
0.42%
0.13%
EUR
-0.18%
-0.08%
0.11%
-0.13%
-0.17%
0.23%
-0.05%
GBP
-0.10%
0.08%
0.23%
-0.05%
-0.10%
0.31%
0.03%
JPY
-0.30%
-0.11%
-0.23%
-0.26%
-0.31%
0.08%
-0.19%
CAD
-0.05%
0.13%
0.05%
0.26%
-0.05%
0.36%
0.09%
AUD
-0.01%
0.17%
0.10%
0.31%
0.05%
0.40%
0.10%
NZD
-0.42%
-0.23%
-0.31%
-0.08%
-0.36%
-0.40%
-0.28%
CHF
-0.13%
0.05%
-0.03%
0.19%
-0.09%
-0.10%
0.28%
The heat map shows percentage changes of major currencies against each other. The base currency is picked from the left column, while the quote currency is picked from the top row. For example, if you pick the British Pound from the left column and move along the horizontal line to the US Dollar, the percentage change displayed in the box will represent GBP (base)/USD (quote).
07:01
United Kingdom Average Earnings Excluding Bonus (3Mo/Yr) meets forecasts (5.9%) in December
07:00
United Kingdom Employment Change (3M) climbed from previous 35K to 107K in December
07:00
United Kingdom ILO Unemployment Rate (3M) below forecasts (4.5%) in December: Actual (4.4%)
07:00
United Kingdom Average Earnings Including Bonus (3Mo/Yr) came in at 6%, above forecasts (5.9%) in December
07:00
United Kingdom Claimant Count Change registered at 22K above expectations (10K) in January
USD/CAD gathers strength to around 1.4205 in Tuesday’s early European session.
The pair keeps the negative view below the 100-period EMA with the bearish RSI indicator.
The first downside target to watch is 1.4151; the immediate resistance level emerges near 1.4265.
The USD/CAD pair trades in positive territory near 1.4205 during the early European session on Tuesday, supported by the firmer Greenback. The Canadian Consumer Price Index (CPI) inflation data for January will be the highlight later on Tuesday.
The headline CPI is estimated to show an increase of 1.8% YoY in January. On a monthly basis, the CPI inflation is projected to rise to 0.1% in January from a decline of 0.4% in December.
According to the 4-hour chart, the bearish outlook of USD/CAD prevails as the pair is below the key 100-period Exponential Moving Average (EMA). The downward momentum is reinforced by the Relative Strength Index (RSI), which stands below the midline near 46.25, supporting the sellers in the near term.
The initial support level for the cross is seen at 1.4151, the low of February 14. Any follow-through selling below the mentioned level could see a drop to 1.4130, the lower limit of the Bollinger Band. Further south, the next contention level to watch is the 1.4100 psychological level.
The first upside barrier for the pair emerges near 1.4265, the upper boundary of the Bollinger Band. A decisive break above this level could pave the way to 1.4310, the 100-period EMA. Extended gains could see a rally to the next hurdle at 1.4380, the high of February 10.
USD/CAD 4-hour chart
Canadian Dollar FAQs
The key factors driving the Canadian Dollar (CAD) are the level of interest rates set by the Bank of Canada (BoC), the price of Oil, Canada’s largest export, the health of its economy, inflation and the Trade Balance, which is the difference between the value of Canada’s exports versus its imports. Other factors include market sentiment – whether investors are taking on more risky assets (risk-on) or seeking safe-havens (risk-off) – with risk-on being CAD-positive. As its largest trading partner, the health of the US economy is also a key factor influencing the Canadian Dollar.
The Bank of Canada (BoC) has a significant influence on the Canadian Dollar by setting the level of interest rates that banks can lend to one another. This influences the level of interest rates for everyone. The main goal of the BoC is to maintain inflation at 1-3% by adjusting interest rates up or down. Relatively higher interest rates tend to be positive for the CAD. The Bank of Canada can also use quantitative easing and tightening to influence credit conditions, with the former CAD-negative and the latter CAD-positive.
The price of Oil is a key factor impacting the value of the Canadian Dollar. Petroleum is Canada’s biggest export, so Oil price tends to have an immediate impact on the CAD value. Generally, if Oil price rises CAD also goes up, as aggregate demand for the currency increases. The opposite is the case if the price of Oil falls. Higher Oil prices also tend to result in a greater likelihood of a positive Trade Balance, which is also supportive of the CAD.
While inflation had always traditionally been thought of as a negative factor for a currency since it lowers the value of money, the opposite has actually been the case in modern times with the relaxation of cross-border capital controls. Higher inflation tends to lead central banks to put up interest rates which attracts more capital inflows from global investors seeking a lucrative place to keep their money. This increases demand for the local currency, which in Canada’s case is the Canadian Dollar.
Macroeconomic data releases gauge the health of the economy and can have an impact on the Canadian Dollar. Indicators such as GDP, Manufacturing and Services PMIs, employment, and consumer sentiment surveys can all influence the direction of the CAD. A strong economy is good for the Canadian Dollar. Not only does it attract more foreign investment but it may encourage the Bank of Canada to put up interest rates, leading to a stronger currency. If economic data is weak, however, the CAD is likely to fall.
EUR/JPY strengthens as the Japanese Yen depreciates due to increased market optimism following postponement of Trump's reciprocal tariffs.
The JPY could find support due to the rising hawkish tone surrounding the Bank of Japan’s policy outlook.
The Euro could face challenges as ECB officials remain confident in the outlook for three more rate cuts this year.
EUR/JPY retraces its recent losses, trading around 159.10 during the Asian hours on Tuesday. The EUR/JPY cross appreciates as the Japanese Yen (JPY) loses ground amid increased market optimism due to the postponement of the implementation of US President Donald Trump's reciprocal tariffs.
However, the upside of the EUR/JPY cross could be limited as the Japanese Yen may regain its ground amid increased hawkish sentiment surrounding the Bank of Japan’s (BoE) policy outlook, driven by a robust Japan’s Gross Domestic Product (GDP) report that exceeded expectations.
Markets are now pricing-in an additional 37 basis points rate increase by the Bank of Japan in 2025, driving the yield on the benchmark 10-year Japanese government bond to its highest level since April 2010.
The Euro could face downward pressure as several European Central Bank (ECB) officials remain comfortable with the outlook for three more rate cuts this year, following a 25 basis point reduction to 2.75% last month.
However, the Euro could gain support if a ceasefire in Ukraine is reached and gas supplies resume. A JP Morgan note suggests that the EUR/USD pair could appreciate by up to 5% under such circumstances.
Reports indicate that US President Donald Trump and Russian President Vladimir Putin have agreed to initiate negotiations to end the conflict. Officials from the Trump administration are scheduled to meet with their Russian counterparts in Saudi Arabia on Tuesday to discuss a potential peace agreement.
Interest rates FAQs
Interest rates are charged by financial institutions on loans to borrowers and are paid as interest to savers and depositors. They are influenced by base lending rates, which are set by central banks in response to changes in the economy. Central banks normally have a mandate to ensure price stability, which in most cases means targeting a core inflation rate of around 2%. If inflation falls below target the central bank may cut base lending rates, with a view to stimulating lending and boosting the economy. If inflation rises substantially above 2% it normally results in the central bank raising base lending rates in an attempt to lower inflation.
Higher interest rates generally help strengthen a country’s currency as they make it a more attractive place for global investors to park their money.
Higher interest rates overall weigh on the price of Gold because they increase the opportunity cost of holding Gold instead of investing in an interest-bearing asset or placing cash in the bank. If interest rates are high that usually pushes up the price of the US Dollar (USD), and since Gold is priced in Dollars, this has the effect of lowering the price of Gold.
The Fed funds rate is the overnight rate at which US banks lend to each other. It is the oft-quoted headline rate set by the Federal Reserve at its FOMC meetings. It is set as a range, for example 4.75%-5.00%, though the upper limit (in that case 5.00%) is the quoted figure. Market expectations for future Fed funds rate are tracked by the CME FedWatch tool, which shapes how many financial markets behave in anticipation of future Federal Reserve monetary policy decisions.
Silver attracts some dip-buyers on Tuesday, though it lacks follow-through.
The technical setup favors bulls and supports prospects for further gains.
Any corrective slide below $32.00 could be seen as a buying opportunity.
Silver (XAG/USD) reverses an Asian session dip to the $32.00 neighborhood and climbs to the top end of its intraday trading range in the last hour. The white metal currently trades around the $32.35-$32.40 region, nearly unchanged for the day, though it remains well below the highest level since late October touched last Friday.
Looking at the broader picture, the XAG/USD – barring a couple of knee-jerk spikes – has been oscillating in a familiar range over the past two weeks or so. Against the backdrop of the year-to-date strong move up, this might still be categorized as a bullish consolidation phase. Adding to this, positive oscillators on the daily chart suggest that the path of least resistance for the commodity is to the upside.
That said, it will still be prudent to wait for some follow-through strength beyond the $32.55 horizontal barrier before positioning for a move toward the $33.00 mark. The XAG/USD might then climb further towards last Friday's swing high, around the $33.35-$33.40 zone en route to the $34.00 round figure, the $34.45 intermediate hurdle, and the $35.00 neighborhood, or the multi-year peak touched in October.
On the flip side, weakness below the $32.00-$31.90 region now seems to have emerged as an immediate strong support. This is followed by the lower boundary of the short-term trading range, around the $31.75-$31.70 region, below which the XAG/USD could slide toward retesting the 100-day Simple Moving Average (SMA), currently pegged near the $31.20 area, before dropping to the $31.00 round figure mark.
Some follow-through selling below the latter might shift the near-term bias in favor of bearish traders and pave deeper losses. The subsequent fall has the potential to drag the XAG/USD towards the next relevant support near the $30.25 region en route to the $30.00 psychological mark and the $29.55-$29.50 horizontal zone.
Silver daily chart
Silver FAQs
Silver is a precious metal highly traded among investors. It has been historically used as a store of value and a medium of exchange. Although less popular than Gold, traders may turn to Silver to diversify their investment portfolio, for its intrinsic value or as a potential hedge during high-inflation periods. Investors can buy physical Silver, in coins or in bars, or trade it through vehicles such as Exchange Traded Funds, which track its price on international markets.
Silver prices can move due to a wide range of factors. Geopolitical instability or fears of a deep recession can make Silver price escalate due to its safe-haven status, although to a lesser extent than Gold's. As a yieldless asset, Silver tends to rise with lower interest rates. Its moves also depend on how the US Dollar (USD) behaves as the asset is priced in dollars (XAG/USD). A strong Dollar tends to keep the price of Silver at bay, whereas a weaker Dollar is likely to propel prices up. Other factors such as investment demand, mining supply – Silver is much more abundant than Gold – and recycling rates can also affect prices.
Silver is widely used in industry, particularly in sectors such as electronics or solar energy, as it has one of the highest electric conductivity of all metals – more than Copper and Gold. A surge in demand can increase prices, while a decline tends to lower them. Dynamics in the US, Chinese and Indian economies can also contribute to price swings: for the US and particularly China, their big industrial sectors use Silver in various processes; in India, consumers’ demand for the precious metal for jewellery also plays a key role in setting prices.
Silver prices tend to follow Gold's moves. When Gold prices rise, Silver typically follows suit, as their status as safe-haven assets is similar. The Gold/Silver ratio, which shows the number of ounces of Silver needed to equal the value of one ounce of Gold, may help to determine the relative valuation between both metals. Some investors may consider a high ratio as an indicator that Silver is undervalued, or Gold is overvalued. On the contrary, a low ratio might suggest that Gold is undervalued relative to Silver.
USD/CHF gains ground to near 0.9030 in Tuesday’s early European session.
Fed hawkish expectations lift the US Dollar.
Rising geopolitical risks might boost the safe-haven flows, benefiting the Swiss Franc.
The USD/CHF pair extends its recovery to around 0.9030 during the early European session on Tuesday, bolstered by a firmer US Dollar (USD). Investors brace for the release of the NY Empire State Manufacturing Index for February, which will be published later on Tuesday. Also, the Federal Reserve's (Fed) Mary Daly is scheduled to speak later in the day.
Last week's data showed U.S. consumer prices climbed at the highest pace in almost 18 months in January, highlighting the Fed's message that it was not in a hurry to continue reducing rates despite rising economic uncertainties. This, in turn, continues to underpin the Greenback in the near term. "An extended pause during the first half of this year looks justified and will give the Fed time to assess the impact of trade measures on inflation,” said ANZ strategists.
Israeli warplanes launched airstrikes on the villages of Tayr Harfa and Aaichiyehin in the Jezzine district on Monday night, as well as two explosions in the border town of Odaisseh in the Marjayoun district, breaking the ceasefire in southern Lebanon just before it is due to leave the area, according to Anadolu Agency.
Investors will closely monitor the development surrounding geopolitical tensions in the Middle East. Any signs of escalation in the region could boost the safe-haven currency like the Swiss Franc (CHF) and create a headwind for the pair.
Swiss Franc FAQs
The Swiss Franc (CHF) is Switzerland’s official currency. It is among the top ten most traded currencies globally, reaching volumes that well exceed the size of the Swiss economy. Its value is determined by the broad market sentiment, the country’s economic health or action taken by the Swiss National Bank (SNB), among other factors. Between 2011 and 2015, the Swiss Franc was pegged to the Euro (EUR). The peg was abruptly removed, resulting in a more than 20% increase in the Franc’s value, causing a turmoil in markets. Even though the peg isn’t in force anymore, CHF fortunes tend to be highly correlated with the Euro ones due to the high dependency of the Swiss economy on the neighboring Eurozone.
The Swiss Franc (CHF) is considered a safe-haven asset, or a currency that investors tend to buy in times of market stress. This is due to the perceived status of Switzerland in the world: a stable economy, a strong export sector, big central bank reserves or a longstanding political stance towards neutrality in global conflicts make the country’s currency a good choice for investors fleeing from risks. Turbulent times are likely to strengthen CHF value against other currencies that are seen as more risky to invest in.
The Swiss National Bank (SNB) meets four times a year – once every quarter, less than other major central banks – to decide on monetary policy. The bank aims for an annual inflation rate of less than 2%. When inflation is above target or forecasted to be above target in the foreseeable future, the bank will attempt to tame price growth by raising its policy rate. Higher interest rates are generally positive for the Swiss Franc (CHF) as they lead to higher yields, making the country a more attractive place for investors. On the contrary, lower interest rates tend to weaken CHF.
Macroeconomic data releases in Switzerland are key to assessing the state of the economy and can impact the Swiss Franc’s (CHF) valuation. The Swiss economy is broadly stable, but any sudden change in economic growth, inflation, current account or the central bank’s currency reserves have the potential to trigger moves in CHF. Generally, high economic growth, low unemployment and high confidence are good for CHF. Conversely, if economic data points to weakening momentum, CHF is likely to depreciate.
As a small and open economy, Switzerland is heavily dependent on the health of the neighboring Eurozone economies. The broader European Union is Switzerland’s main economic partner and a key political ally, so macroeconomic and monetary policy stability in the Eurozone is essential for Switzerland and, thus, for the Swiss Franc (CHF). With such dependency, some models suggest that the correlation between the fortunes of the Euro (EUR) and the CHF is more than 90%, or close to perfect.
Gold attracts buyers for the second straight day amid concerns about a global trade war.
Bets that the Fed would cut rates further lend support to the non-yielding yellow metal.
A modest USD uptick might cap gains, though the bias remains tilted in favor of bulls.
Gold price (XAU/USD) trades with a mild positive bias above the $2,900 mark during the Asian session on Tuesday, though it lacks bullish conviction and remains confined in a familiar range that has held over the past week or so. Investors remain worried that US President Donald Trump's threat of reciprocal tariffs would trigger a global trade war. This turns out to be a key factor that continues to underpin demand for the safe-haven bullion.
Adding to this, expectations that the Federal Reserve (Fed) might cut interest rates further this year, bolstered by the unforeseen drop in US Retail Sales, offers support to the non-yielding Gold price. That said, a goodish bounce in the US Treasury bond yields and a modest US Dollar (USD) uptick hold back the XAU/USD bulls from placing fresh bets. Nevertheless, the uncertainty over Trump's trade policies should act as a tailwind for the commodity.
Gold price continues to attract haven flows amid worries about Trump’s trade policies
US President Donald Trump threatened on Friday, saying that levies on automobiles would be coming as soon as April 2. This comes on top of Trump's reciprocal tariff plans on countries that charge duties on US imports and continues to underpin the safe-haven Gold price.
The disappointing release of US Retail Sales figures on Friday, along with mixed signals on inflation, suggests that the Federal Reserve could possibly cut rates at the September or October policy meeting. Fed Funds Futures see the possibility of a 40 basis point rate cut in 2025.
Philadelphia Fed President Patrick Harker said on Monday that the labor market is largely in balance and the current economy argues for a steady policy as inflation has been sticky over recent months. Future Fed rate policy choices will be data-driven, Harker added further.
Fed Board of Governors member Michelle Bowman noted that high asset prices may have impeded progress on inflation and more certainty is needed on declining inflation before reducing rates. Bowman added that wage growth above level is consistent with the Fed inflation target.
Fed Board of Governors member Christopher Waller said that inflation progress last year has been excruciatingly slow and that rate cuts would be appropriate in 2025 if inflation repeats the 2024 pattern. Waller expects disinflation and interest rate cuts to resume year on year.
The US Dollar attracts some buyers and for now, seems to have snapped a three-day losing streak to its lowest level since December 17. This might hold back traders from placing aggressive bullish bets around the XAU/USD and keep a lid on any further appreciating move.
Traders look to the release of the Empire State Manufacturing Index from the US for some impetus later during the North American session. Apart from this, speeches by influential FOMC members would drive the USD demand and produce short-term trading opportunities.
Gold price might confront some resistance near $2,925 before testing all-time peak
From a technical perspective, the range-bound price action witnessed over the past week or so could be categorized as a bullish consolidation phase against the backdrop of the recent rally to a record high. Moreover, oscillators on the daily chart are holding comfortably in the positive territory and suggest that the path of least resistance for the Gold price remains to the upside. That said, the daily Relative Strength Index (RSI) remains close to overbought territory. Hence, any subsequent move up is more likely to confront stiff resistance near the $2,925 horizontal zone. This is followed by the $2,942-2,943 area, or the all-time peak, which if cleared decisively will mark a fresh breakout and pave the way for an extension of a two-month-old uptrend.
On the flip side, weakness below the $2,900 mark now seems to find decent support near the $2,878-2,876 region. Any further decline towards the $2,860-2,855 area could be seen as a buying opportunity, which should help limit the downside for the Gold price near the $2,834 zone. A convincing break below the latter, however, might prompt some technical selling and drag the XAU/USD towards the $2,815 region en route to the $2,800 mark and the $2,785-2,784 support.
Gold FAQs
Gold has played a key role in human’s history as it has been widely used as a store of value and medium of exchange. Currently, apart from its shine and usage for jewelry, the precious metal is widely seen as a safe-haven asset, meaning that it is considered a good investment during turbulent times. Gold is also widely seen as a hedge against inflation and against depreciating currencies as it doesn’t rely on any specific issuer or government.
Central banks are the biggest Gold holders. In their aim to support their currencies in turbulent times, central banks tend to diversify their reserves and buy Gold to improve the perceived strength of the economy and the currency. High Gold reserves can be a source of trust for a country’s solvency. Central banks added 1,136 tonnes of Gold worth around $70 billion to their reserves in 2022, according to data from the World Gold Council. This is the highest yearly purchase since records began. Central banks from emerging economies such as China, India and Turkey are quickly increasing their Gold reserves.
Gold has an inverse correlation with the US Dollar and US Treasuries, which are both major reserve and safe-haven assets. When the Dollar depreciates, Gold tends to rise, enabling investors and central banks to diversify their assets in turbulent times. Gold is also inversely correlated with risk assets. A rally in the stock market tends to weaken Gold price, while sell-offs in riskier markets tend to favor the precious metal.
The price can move due to a wide range of factors. Geopolitical instability or fears of a deep recession can quickly make Gold price escalate due to its safe-haven status. As a yield-less asset, Gold tends to rise with lower interest rates, while higher cost of money usually weighs down on the yellow metal. Still, most moves depend on how the US Dollar (USD) behaves as the asset is priced in dollars (XAU/USD). A strong Dollar tends to keep the price of Gold controlled, whereas a weaker Dollar is likely to push Gold prices up.
Tariffs FAQs
Tariffs are customs duties levied on certain merchandise imports or a category of products. Tariffs are designed to help local producers and manufacturers be more competitive in the market by providing a price advantage over similar goods that can be imported. Tariffs are widely used as tools of protectionism, along with trade barriers and import quotas.
Although tariffs and taxes both generate government revenue to fund public goods and services, they have several distinctions. Tariffs are prepaid at the port of entry, while taxes are paid at the time of purchase. Taxes are imposed on individual taxpayers and businesses, while tariffs are paid by importers.
There are two schools of thought among economists regarding the usage of tariffs. While some argue that tariffs are necessary to protect domestic industries and address trade imbalances, others see them as a harmful tool that could potentially drive prices higher over the long term and lead to a damaging trade war by encouraging tit-for-tat tariffs.
During the run-up to the presidential election in November 2024, Donald Trump made it clear that he intends to use tariffs to support the US economy and American producers. In 2024, Mexico, China and Canada accounted for 42% of total US imports. In this period, Mexico stood out as the top exporter with $466.6 billion, according to the US Census Bureau. Hence, Trump wants to focus on these three nations when imposing tariffs. He also plans to use the revenue generated through tariffs to lower personal income taxes.
Reserve Bank of Australia (RBA) Governor Michele Bullock is speaking at the press conference, following the announcement of the February monetary policy decision on Tuesday.
Earlier this Tuesday, the RBA lowered the benchmark interest rate to 4.1% as widely expected.
Key quotes
Clear that high rates have worked.
Cannot declare victory on inflation yet.
Strength of jobs market has been surprising.
Further rate cuts implied by market not guaranteed.
Cannot get too ahead of ourselves on rates.
Rate cut was a difficult decision.
Further cuts will depend on data.
Need to see upside risks to inflation abate a bit, including wage costs.
Would be good to see some recovery in supply side of economy.
Tariff threats are unpredictable, would be bad for economic activity.
developing story ....
Market reaction
AUD/USD is back above 0.6350 on the above comments, still losing 0.06% on the day, as of writing.
RBA FAQs
The Reserve Bank of Australia (RBA) sets interest rates and manages monetary policy for Australia. Decisions are made by a board of governors at 11 meetings a year and ad hoc emergency meetings as required. The RBA’s primary mandate is to maintain price stability, which means an inflation rate of 2-3%, but also “..to contribute to the stability of the currency, full employment, and the economic prosperity and welfare of the Australian people.” Its main tool for achieving this is by raising or lowering interest rates. Relatively high interest rates will strengthen the Australian Dollar (AUD) and vice versa. Other RBA tools include quantitative easing and tightening.
While inflation had always traditionally been thought of as a negative factor for currencies since it lowers the value of money in general, the opposite has actually been the case in modern times with the relaxation of cross-border capital controls. Moderately higher inflation now tends to lead central banks to put up their interest rates, which in turn has the effect of attracting more capital inflows from global investors seeking a lucrative place to keep their money. This increases demand for the local currency, which in the case of Australia is the Aussie Dollar.
Macroeconomic data gauges the health of an economy and can have an impact on the value of its currency. Investors prefer to invest their capital in economies that are safe and growing rather than precarious and shrinking. Greater capital inflows increase the aggregate demand and value of the domestic currency. Classic indicators, such as GDP, Manufacturing and Services PMIs, employment, and consumer sentiment surveys can influence AUD. A strong economy may encourage the Reserve Bank of Australia to put up interest rates, also supporting AUD.
Quantitative Easing (QE) is a tool used in extreme situations when lowering interest rates is not enough to restore the flow of credit in the economy. QE is the process by which the Reserve Bank of Australia (RBA) prints Australian Dollars (AUD) for the purpose of buying assets – usually government or corporate bonds – from financial institutions, thereby providing them with much-needed liquidity. QE usually results in a weaker AUD.
Quantitative tightening (QT) is the reverse of QE. It is undertaken after QE when an economic recovery is underway and inflation starts rising. Whilst in QE the Reserve Bank of Australia (RBA) purchases government and corporate bonds from financial institutions to provide them with liquidity, in QT the RBA stops buying more assets, and stops reinvesting the principal maturing on the bonds it already holds. It would be positive (or bullish) for the Australian Dollar.
Gold prices rose in India on Tuesday, according to data compiled by FXStreet.
The price for Gold stood at 8,126.38 Indian Rupees (INR) per gram, up compared with the INR 8,096.88 it cost on Monday.
The price for Gold increased to INR 94,784.55 per tola from INR 94,440.36 per tola a day earlier.
Unit measure
Gold Price in INR
1 Gram
8,126.38
10 Grams
81,263.85
Tola
94,784.55
Troy Ounce
252,740.80
FXStreet calculates Gold prices in India by adapting international prices (USD/INR) to the local currency and measurement units. Prices are updated daily based on the market rates taken at the time of publication. Prices are just for reference and local rates could diverge slightly.
Gold has played a key role in human’s history as it has been widely used as a store of value and medium of exchange. Currently, apart from its shine and usage for jewelry, the precious metal is widely seen as a safe-haven asset, meaning that it is considered a good investment during turbulent times. Gold is also widely seen as a hedge against inflation and against depreciating currencies as it doesn’t rely on any specific issuer or government.
Central banks are the biggest Gold holders. In their aim to support their currencies in turbulent times, central banks tend to diversify their reserves and buy Gold to improve the perceived strength of the economy and the currency. High Gold reserves can be a source of trust for a country’s solvency. Central banks added 1,136 tonnes of Gold worth around $70 billion to their reserves in 2022, according to data from the World Gold Council. This is the highest yearly purchase since records began. Central banks from emerging economies such as China, India and Turkey are quickly increasing their Gold reserves.
Gold has an inverse correlation with the US Dollar and US Treasuries, which are both major reserve and safe-haven assets. When the Dollar depreciates, Gold tends to rise, enabling investors and central banks to diversify their assets in turbulent times. Gold is also inversely correlated with risk assets. A rally in the stock market tends to weaken Gold price, while sell-offs in riskier markets tend to favor the precious metal.
The price can move due to a wide range of factors. Geopolitical instability or fears of a deep recession can quickly make Gold price escalate due to its safe-haven status. As a yield-less asset, Gold tends to rise with lower interest rates, while higher cost of money usually weighs down on the yellow metal. Still, most moves depend on how the US Dollar (USD) behaves as the asset is priced in dollars (XAU/USD). A strong Dollar tends to keep the price of Gold controlled, whereas a weaker Dollar is likely to push Gold prices up.
(An automation tool was used in creating this post.)
GBP/USD declines ahead of UK labor data set to be released on Tuesday.
UK PM Starmer said that any peace agreement for Ukraine would need a "US backstop" to deter further Russian attacks.
Fed Governor Michelle Bowman warned that upside inflation risks persist, stressing the need for more clarity before considering rate cuts.
GBP/USD breaks its five-day winning streak, trading around 1.2600 during Tuesday's Asian session. Traders are awaiting UK employment data set to be released later in the day. The Claimant Count Change for January is expected to rise to 10K new unemployment benefit claimants, up from the previous 0.7K. The ILO Unemployment Rate is also forecast to increase to 4.5% from 4.4%.
British Prime Minister Keir Starmer stated on Monday that any peace deal for Ukraine would require a "US backstop" to prevent Russia from attacking again, according to Reuters. Starmer emphasized that Ukraine's future is a crucial issue for Europe, and it is urgent for Europe to share the responsibility in addressing the situation.
The downside risk for the GBP/USD pair could be linked to the strengthening US Dollar as Treasury yields rise. The US Dollar Index (DXY), which tracks the USD against six major currencies, edges higher after losing ground in the previous three sessions, trading around 106.90. At the same time, 2-year and 10-year US Treasury yields stand at 4.27% and 4.51%, respectively.
Federal Reserve Governor Michelle Bowman remarked on Monday that rising asset prices may have slowed the Fed's progress on inflation. While she expects inflation to decline, she warned that upside risks persist and stressed the need for more certainty before considering rate cuts.
Meanwhile, Fed Governor Christopher Waller acknowledged on Monday that while inflation has improved, progress has been “excruciatingly” slow. Waller emphasized the importance of not letting policy uncertainty hinder data-driven decisions.
Pound Sterling FAQs
The Pound Sterling (GBP) is the oldest currency in the world (886 AD) and the official currency of the United Kingdom. It is the fourth most traded unit for foreign exchange (FX) in the world, accounting for 12% of all transactions, averaging $630 billion a day, according to 2022 data. Its key trading pairs are GBP/USD, also known as ‘Cable’, which accounts for 11% of FX, GBP/JPY, or the ‘Dragon’ as it is known by traders (3%), and EUR/GBP (2%). The Pound Sterling is issued by the Bank of England (BoE).
The single most important factor influencing the value of the Pound Sterling is monetary policy decided by the Bank of England. The BoE bases its decisions on whether it has achieved its primary goal of “price stability” – a steady inflation rate of around 2%. Its primary tool for achieving this is the adjustment of interest rates. When inflation is too high, the BoE will try to rein it in by raising interest rates, making it more expensive for people and businesses to access credit. This is generally positive for GBP, as higher interest rates make the UK a more attractive place for global investors to park their money. When inflation falls too low it is a sign economic growth is slowing. In this scenario, the BoE will consider lowering interest rates to cheapen credit so businesses will borrow more to invest in growth-generating projects.
Data releases gauge the health of the economy and can impact the value of the Pound Sterling. Indicators such as GDP, Manufacturing and Services PMIs, and employment can all influence the direction of the GBP. A strong economy is good for Sterling. Not only does it attract more foreign investment but it may encourage the BoE to put up interest rates, which will directly strengthen GBP. Otherwise, if economic data is weak, the Pound Sterling is likely to fall.
Another significant data release for the Pound Sterling is the Trade Balance. This indicator measures the difference between what a country earns from its exports and what it spends on imports over a given period. If a country produces highly sought-after exports, its currency will benefit purely from the extra demand created from foreign buyers seeking to purchase these goods. Therefore, a positive net Trade Balance strengthens a currency and vice versa for a negative balance.
AUD/JPY gains traction to near 96.55 in Tuesday’s Asian session.
The RBA cut its OCR by 25 bps to 4.10% at the February meeting.
Rising expectations for further BoJ rate rise might help limit the JPY’s losses.
The AUD/JPY cross attracts some buyers to around 96.55 during the early Asian session on Tuesday. The Australian Dollar (AUD) attracts some buyers after the Reserve Bank of Australia (RBA) interest rate decision.
As widely expected, the RBA board members decided to lower the Official Cash Rate (OCR) by 25 basis points (bps) from 4.35% to 4.10% at its February policy meeting on Tuesday. This marks the first rate cut in four years. In the absence of fresh dovish remarks, the Aussie strengthens against the Japanese Yen (JPY).
Additionally, US President Donald Trump's decision to delay the implementation of reciprocal tariffs contributes to the AUD’s upside. The process of Trump's ultimate tariff policies might take longer than many analysts had expected. Westpac analysts are leaning toward further gains in the AUD in the near term.
On the JPY’s front, the rising bets for more interest rate hikes by the Bank of Japan (BoJ) could lift the Japanese Yen (JPY) and create a headwind for AUD/JPY. Former BoJ official Nobuyasu Atago sees the chance of a hike at the April 30-May 1 meeting, given the BOJ's rising attention to the risk of an inflation overshoot.
Australian Dollar FAQs
One of the most significant factors for the Australian Dollar (AUD) is the level of interest rates set by the Reserve Bank of Australia (RBA). Because Australia is a resource-rich country another key driver is the price of its biggest export, Iron Ore. The health of the Chinese economy, its largest trading partner, is a factor, as well as inflation in Australia, its growth rate and Trade Balance. Market sentiment – whether investors are taking on more risky assets (risk-on) or seeking safe-havens (risk-off) – is also a factor, with risk-on positive for AUD.
The Reserve Bank of Australia (RBA) influences the Australian Dollar (AUD) by setting the level of interest rates that Australian banks can lend to each other. This influences the level of interest rates in the economy as a whole. The main goal of the RBA is to maintain a stable inflation rate of 2-3% by adjusting interest rates up or down. Relatively high interest rates compared to other major central banks support the AUD, and the opposite for relatively low. The RBA can also use quantitative easing and tightening to influence credit conditions, with the former AUD-negative and the latter AUD-positive.
China is Australia’s largest trading partner so the health of the Chinese economy is a major influence on the value of the Australian Dollar (AUD). When the Chinese economy is doing well it purchases more raw materials, goods and services from Australia, lifting demand for the AUD, and pushing up its value. The opposite is the case when the Chinese economy is not growing as fast as expected. Positive or negative surprises in Chinese growth data, therefore, often have a direct impact on the Australian Dollar and its pairs.
Iron Ore is Australia’s largest export, accounting for $118 billion a year according to data from 2021, with China as its primary destination. The price of Iron Ore, therefore, can be a driver of the Australian Dollar. Generally, if the price of Iron Ore rises, AUD also goes up, as aggregate demand for the currency increases. The opposite is the case if the price of Iron Ore falls. Higher Iron Ore prices also tend to result in a greater likelihood of a positive Trade Balance for Australia, which is also positive of the AUD.
The Trade Balance, which is the difference between what a country earns from its exports versus what it pays for its imports, is another factor that can influence the value of the Australian Dollar. If Australia produces highly sought after exports, then its currency will gain in value purely from the surplus demand created from foreign buyers seeking to purchase its exports versus what it spends to purchase imports. Therefore, a positive net Trade Balance strengthens the AUD, with the opposite effect if the Trade Balance is negative.
EUR/USD declines as the US Dollar strengthens following three consecutive sessions of losses.
Fed Governor Michelle Bowman warned that upside inflation risks persist, stressing the need for more clarity before considering rate cuts.
The Euro faces downward pressure from the ECB's forecast of three additional rate cuts this year.
EUR/USD extends its losses for the second successive session, trading near 1.0460 during the Asian hours on Tuesday. This downside could be attributed to the improved US Dollar (USD) amid rising Treasury yields.
The US Dollar Index (DXY), which tracks the US Dollar's performance against six major currencies, edges higher after registering losses in the previous three successive sessions and trades around 106.90, while yields on 2-year and 10-year US Treasury bonds stand at 4.27% and 4.51%, respectively, at the time of writing.
Federal Reserve Governor Michelle Bowman stated on Monday that rising asset prices may have slowed the Fed’s recent progress on inflation. While Bowman expects inflation to decline, she cautioned that upside risks remain and emphasized the need for more certainty before considering rate cuts.
Meanwhile, Fed Governor Christopher Waller acknowledged late Monday that while inflation has improved, progress has been “excruciatingly” slow. Waller stressed that the Fed must not allow policy uncertainty to hinder data-driven decision-making.
The Euro faces downward pressure as several European Central Bank (ECB) officials remain comfortable with the outlook for three more rate cuts this year, following a 25 basis point reduction to 2.75% last month.
However, the Euro could gain support if a ceasefire in Ukraine is reached and gas supplies resume. A JP Morgan note suggests that the EUR/USD pair could appreciate by up to 5% under such circumstances.
Reports indicate that US President Donald Trump and Russian President Vladimir Putin have agreed to initiate negotiations to end the conflict. Officials from the Trump administration are scheduled to meet with their Russian counterparts in Saudi Arabia on Tuesday to discuss a potential peace agreement.
Euro FAQs
The Euro is the currency for the 19 European Union countries that belong to the Eurozone. It is the second most heavily traded currency in the world behind the US Dollar. In 2022, it accounted for 31% of all foreign exchange transactions, with an average daily turnover of over $2.2 trillion a day. EUR/USD is the most heavily traded currency pair in the world, accounting for an estimated 30% off all transactions, followed by EUR/JPY (4%), EUR/GBP (3%) and EUR/AUD (2%).
The European Central Bank (ECB) in Frankfurt, Germany, is the reserve bank for the Eurozone. The ECB sets interest rates and manages monetary policy. The ECB’s primary mandate is to maintain price stability, which means either controlling inflation or stimulating growth. Its primary tool is the raising or lowering of interest rates. Relatively high interest rates – or the expectation of higher rates – will usually benefit the Euro and vice versa. The ECB Governing Council makes monetary policy decisions at meetings held eight times a year. Decisions are made by heads of the Eurozone national banks and six permanent members, including the President of the ECB, Christine Lagarde.
Eurozone inflation data, measured by the Harmonized Index of Consumer Prices (HICP), is an important econometric for the Euro. If inflation rises more than expected, especially if above the ECB’s 2% target, it obliges the ECB to raise interest rates to bring it back under control. Relatively high interest rates compared to its counterparts will usually benefit the Euro, as it makes the region more attractive as a place for global investors to park their money.
Data releases gauge the health of the economy and can impact on the Euro. Indicators such as GDP, Manufacturing and Services PMIs, employment, and consumer sentiment surveys can all influence the direction of the single currency. A strong economy is good for the Euro. Not only does it attract more foreign investment but it may encourage the ECB to put up interest rates, which will directly strengthen the Euro. Otherwise, if economic data is weak, the Euro is likely to fall. Economic data for the four largest economies in the euro area (Germany, France, Italy and Spain) are especially significant, as they account for 75% of the Eurozone’s economy.
Another significant data release for the Euro is the Trade Balance. This indicator measures the difference between what a country earns from its exports and what it spends on imports over a given period. If a country produces highly sought after exports then its currency will gain in value purely from the extra demand created from foreign buyers seeking to purchase these goods. Therefore, a positive net Trade Balance strengthens a currency and vice versa for a negative balance.
AUD/NZD rebounds swiftly from over a one-week low touched earlier this Tuesday.
The move up picks up pace after the RBA’s widely expected 25 bps interest rate cut.
Traders now look forward to the post-meeting press conference for a fresh impetus.
The AUD/NZD cross stages a goodish rebound from over a one-week low, around the 1.1075 region touched during the Asian session on Tuesday, and gains follow-through traction after the Reserve Bank of Australia (RBA) announced its policy decision. Spot prices currently trade around the 1.1130 area, up nearly 0.50% for the day, and remain close to a multi-month peak touched last week.
The RBA board members decided to lower the Official Cash Rate (OCR) by 25 basis points (bps) from 4.35% to 4.1% at the end of the February policy meeting. This was the first RBA rate cut since November 2020 and was fully priced in the market. In the absence of fresh dovish signals, the Australian Dollar (AUD) strengthens across the board and turns out to be a key factor that provides a goodish lift to the AUD/NZD cross.
The New Zealand Dollar (NZD), on the other hand, continues with its relative underperformance amid rising bets that the Reserve Bank of New Zealand (RBNZ) will deliver a third supersized rate cut later this month. This further contributes to the strong bid tone surrounding the AUD/NZD cross. Traders now look to the RBA's post-meeting presser, where comments from RBA Governor Michele Bullock might influence the AUD.
Economic Indicator
RBA Interest Rate Decision
The Reserve Bank of Australia (RBA) announces its interest rate decision at the end of its eight scheduled meetings per year. If the RBA is hawkish about the inflationary outlook of the economy and raises interest rates it is usually bullish for the Australian Dollar (AUD). Likewise, if the RBA has a dovish view on the Australian economy and keeps interest rates unchanged, or cuts them, it is seen as bearish for AUD.
AUD/JPY tests the immediate support at the nine-day EMA of 96.34.
The 14-day RSI remains just below the 50 mark, reinforcing the prevailing bearish momentum.
The primary barrier appears around the descending channel’s upper boundary at the 97.00 level.
AUD/JPY remains attempts to recover its recent losses registered in the previous session, hovering around 96.40 during Tuesday’s Asian hours. Traders await the Reserve Bank of Australia’s (RBA) policy decision later in the day. The central bank is widely expected to lower its Official Cash Rate (OCR) by 25 basis points (bps) to 4.10%, marking the first rate cut in four years.
A review of the daily chart shows the currency cross trading sideways within a descending channel pattern, indicating a prevailing bearish bias. The 14-day Relative Strength Index (RSI) remains slightly below the 50 level, reinforcing bearish momentum.
However, the AUD/JPY cross continues to trade around the nine-day Exponential Moving Average (EMA), indicating that short-term price momentum is neutral. Further movement will offer a clear understanding of the directional price movement.
The immediate support level for the AUD/JPY cross is at the nine-day EMA of 96.34. A decisive break below this level could lead the currency cross to navigate the region around the five-month low of 94.37, recorded on February 10. Further support appears at the six-month low of 93.59, recorded on September 11, followed by the lower boundary of the descending channel around 93.50.
On the upside, the AUD/JPY cross could approach the upper boundary of the descending channel at the psychological level of 97.00, followed by the 50-day EMA at 97.18. A break above this critical resistance zone could cause the emergence of the bullish bias and support the currency cross to test the six-week high at 98.77 level, which was recorded on January 24.
AUD/JPY: Daily Chart
Australian Dollar PRICE Today
The table below shows the percentage change of Australian Dollar (AUD) against listed major currencies today. Australian Dollar was the strongest against the New Zealand Dollar.
USD
EUR
GBP
JPY
CAD
AUD
NZD
CHF
USD
0.15%
0.17%
0.26%
0.07%
0.24%
0.47%
0.09%
EUR
-0.15%
0.02%
0.11%
-0.08%
0.10%
0.32%
-0.06%
GBP
-0.17%
-0.02%
0.10%
-0.10%
0.08%
0.30%
-0.08%
JPY
-0.26%
-0.11%
-0.10%
-0.19%
-0.02%
0.19%
-0.18%
CAD
-0.07%
0.08%
0.10%
0.19%
0.17%
0.40%
0.02%
AUD
-0.24%
-0.10%
-0.08%
0.02%
-0.17%
0.22%
-0.16%
NZD
-0.47%
-0.32%
-0.30%
-0.19%
-0.40%
-0.22%
-0.37%
CHF
-0.09%
0.06%
0.08%
0.18%
-0.02%
0.16%
0.37%
The heat map shows percentage changes of major currencies against each other. The base currency is picked from the left column, while the quote currency is picked from the top row. For example, if you pick the Australian Dollar from the left column and move along the horizontal line to the US Dollar, the percentage change displayed in the box will represent AUD (base)/USD (quote).
The National Development and Reform Commission (NDRC), China’s state planner, said in a statement on Tuesday that “precise' policies to be implemented to help ease difficulties faced by private companies.”
Additional takeaways
'Current' political, economic and social environment very conducive to development of private economy.
China will further break down barriers to market access, revise and introduce a new version of the negative list for market access as soon as possible.
Will continue to solve difficulties and high-cost of financing for private enterprises.
To speed up preparations for implementation of private economy promotion law.
Will resolutely crack down on smearing and defaming the image and reputation of enterprises.
To promote fair opening of competitive areas of infrastructure and major national research infrastructure to private enterprises.
The Japanese Yen retreats after touching a one-week high against its American counterpart.
Rising bets for an imminent BoJ rate rise this year should limit any deeper losses for the JPY.
The narrowing US-Japan yield differential might also lend support to the lower-yielding JPY.
The Japanese Yen (JPY) attracts some sellers during the Asian session on Tuesday, which, along with a modest US Dollar (USD) uptick, assists the USD/JPY pair in staging a modest recovery from the 151.25 area or over a one-week low. Investors cheered a delay in the implementation of US President Donald Trump's reciprocal tariffs. This, in turn, is seen as a key factor undermining the safe-haven JPY. Any meaningful JPY depreciation, however, still seems elusive in the wake of rising bets for more interest rate hikes by the Bank of Japan (BoJ), bolstered by the release of robust Q4 GDP print from Japan on Monday.
Meanwhile, hawkish BoJ expectations led to a significant rise in Japanese government bond yields, to a multi-year high. Adding to this, the recent decline in the US Treasury bond yields, backed by expectations that the Federal Reserve (Fed) would cut interest rates further, has resulted in a narrowing of the US-Japan rate differential. This might further hold back traders from placing aggressive bearish bets around the lower-yielding JPY. Hence, it will be prudent to wait for strong follow-through buying before confirming that the USD/JPY pair has bottomed out and positioning for any further recovery.
Japanese Yen bulls have the upper hand amid hawkish BoJ expectations
US President Donald Trump said on Thursday that he plans to unveil reciprocal tariffs, which would aim at every country that charges duties on US imports, though he stopped short of giving any details.
Furthermore, the optimism over talks between the US and Russia aimed at ending the war in Ukraine boosted investors' confidence and undermined demand for the safe-haven Japanese Yen on Tuesday.
Against the backdrop of strong inflation figures from Japan, the solid Q4 Gross Domestic Product (GDP) released on Monday cemented the case for imminent rate hikes from the Bank of Japan this year.
Markets are now pricing in roughly another 37 basis points worth of increases by December, pushing the yield on the benchmark 10-year Japanese government bond to its highest level since April 2010.
Meanwhile, a surprise drop in US Retail Sales, along with mixed signals on inflation, suggests that the Federal Reserve could possibly cut interest rates at the September or October policy meeting.
Philadelphia Fed President Patrick Harker said on Monday that the labor market is largely in balance and the current economy argues for a steady policy as inflation has been sticky over recent months.
Fed Board of Governors member Michelle Bowman noted that high asset prices may have impeded progress on inflation and more certainty is needed on declining inflation before reducing rates.
Fed Board of Governors member Christopher Waller said that inflation progress last year has been excruciatingly slow and that rate cuts would be appropriate in 2025 if inflation repeats the 2024 pattern.
Nevertheless, Fed Funds Futures see a 40 basis point Fed rate cut in 2025, causing the recent decline in the US Treasury bond yields and contributing to the narrowing of the US-Japan rate differential.
Traders look to the release of the Empire State Manufacturing Index from the US, which, along with speeches by influential FOMC members, would drive the US Dollar and the USD/JPY pair.
USD/JPY might struggle to build on intraday recovery beyond the 152.00 mark
From a technical perspective, last week's failure near the 50% retracement level of the January-February down leg and the subsequent slide below the very important 200-day Simple Moving Average (SMA) favors bearish traders. Moreover, oscillators on the daily chart are holding in negative territory and suggest that the path of least resistance for the USD/JPY pair is to the downside. Hence, any further move up towards the 152.00 mark could be seen as a selling opportunity, which should cap spot prices near the 152.65 region (200-day SMA). This is followed by the 100-day SMA, currently pegged near the 153.15 region, which if cleared could trigger a short-covering rally beyond the 154.00 mark, towards the 154.45-154.50 supply zone en route to last week's swing high, around the 154.75-154.80 region.
On the flip side, the 151.25 area, or the Asian session low, now seems to act as immediate support ahead of the 151.00-150.90 zone, or the year-to-date trough touched earlier this month. A convincing break below the latter would expose the 150.00 psychological mark. Some follow-through selling should pave the way for a fall toward the 149.60-149.55 region en route to the 149.00 round figure and the December 2024 swing low, around the 148.65 region.
Japanese Yen FAQs
The Japanese Yen (JPY) is one of the world’s most traded currencies. Its value is broadly determined by the performance of the Japanese economy, but more specifically by the Bank of Japan’s policy, the differential between Japanese and US bond yields, or risk sentiment among traders, among other factors.
One of the Bank of Japan’s mandates is currency control, so its moves are key for the Yen. The BoJ has directly intervened in currency markets sometimes, generally to lower the value of the Yen, although it refrains from doing it often due to political concerns of its main trading partners. The BoJ ultra-loose monetary policy between 2013 and 2024 caused the Yen to depreciate against its main currency peers due to an increasing policy divergence between the Bank of Japan and other main central banks. More recently, the gradually unwinding of this ultra-loose policy has given some support to the Yen.
Over the last decade, the BoJ’s stance of sticking to ultra-loose monetary policy has led to a widening policy divergence with other central banks, particularly with the US Federal Reserve. This supported a widening of the differential between the 10-year US and Japanese bonds, which favored the US Dollar against the Japanese Yen. The BoJ decision in 2024 to gradually abandon the ultra-loose policy, coupled with interest-rate cuts in other major central banks, is narrowing this differential.
The Japanese Yen is often seen as a safe-haven investment. This means that in times of market stress, investors are more likely to put their money in the Japanese currency due to its supposed reliability and stability. Turbulent times are likely to strengthen the Yen’s value against other currencies seen as more risky to invest in.
Tariffs FAQs
Tariffs are customs duties levied on certain merchandise imports or a category of products. Tariffs are designed to help local producers and manufacturers be more competitive in the market by providing a price advantage over similar goods that can be imported. Tariffs are widely used as tools of protectionism, along with trade barriers and import quotas.
Although tariffs and taxes both generate government revenue to fund public goods and services, they have several distinctions. Tariffs are prepaid at the port of entry, while taxes are paid at the time of purchase. Taxes are imposed on individual taxpayers and businesses, while tariffs are paid by importers.
There are two schools of thought among economists regarding the usage of tariffs. While some argue that tariffs are necessary to protect domestic industries and address trade imbalances, others see them as a harmful tool that could potentially drive prices higher over the long term and lead to a damaging trade war by encouraging tit-for-tat tariffs.
During the run-up to the presidential election in November 2024, Donald Trump made it clear that he intends to use tariffs to support the US economy and American producers. In 2024, Mexico, China and Canada accounted for 42% of total US imports. In this period, Mexico stood out as the top exporter with $466.6 billion, according to the US Census Bureau. Hence, Trump wants to focus on these three nations when imposing tariffs. He also plans to use the revenue generated through tariffs to lower personal income taxes.
NZD/USD remains under pressure near 0.5710 in Tuesday’s Asian session.
RBNZ is set to lower its OCR by 50 bps to 3.75% on Wednesday.
The escalating trade war might boost the US Dollar.
The NZD/USD pair attracts some sellers to around 0.5710 during the early Asian session on Tuesday. The rising expectation that the Reserve Bank of New Zealand (RBNZ) will deliver a jumbo-sized rate cut at the February meeting on Wednesday weighs on the New Zealand Dollar (NZD).
The RBNZ is expected to slash the Official Cash Rate (OCR) by 50 basis points (bps) on Wednesday, bringing the rate down to 3.75%. Our base case is the RBNZ will cut by 25bp at each of the following two meetings, in April and May," said ASB chief economist Nick Tuffley.
RBNZ Governor Adrian Orr will hold a press conference after the rate decision, which might offer some hints about the interest rate path in New Zealand. Any dovish remarks from the RBNZ policymakers could exert some selling pressure on the Kiwi.
The concerns of tariffs and trade war might boost the safe-haven flows, benefiting the Greenback. US President Donald Trump on Friday maintained his drumbeat of tariff threats, stating that taxes on autos will begin as soon as April 2. This was the latest action in a series of trade measures he has announced since taking office for the second term. Meanwhile, the prospect that the US Federal Reserve (Fed) would stick to its hawkish stance amid elevated inflation might act as a tailwind for the pair in the near term.
RBNZ FAQs
The Reserve Bank of New Zealand (RBNZ) is the country’s central bank. Its economic objectives are achieving and maintaining price stability – achieved when inflation, measured by the Consumer Price Index (CPI), falls within the band of between 1% and 3% – and supporting maximum sustainable employment.
The Reserve Bank of New Zealand’s (RBNZ) Monetary Policy Committee (MPC) decides the appropriate level of the Official Cash Rate (OCR) according to its objectives. When inflation is above target, the bank will attempt to tame it by raising its key OCR, making it more expensive for households and businesses to borrow money and thus cooling the economy. Higher interest rates are generally positive for the New Zealand Dollar (NZD) as they lead to higher yields, making the country a more attractive place for investors. On the contrary, lower interest rates tend to weaken NZD.
Employment is important for the Reserve Bank of New Zealand (RBNZ) because a tight labor market can fuel inflation. The RBNZ’s goal of “maximum sustainable employment” is defined as the highest use of labor resources that can be sustained over time without creating an acceleration in inflation. “When employment is at its maximum sustainable level, there will be low and stable inflation. However, if employment is above the maximum sustainable level for too long, it will eventually cause prices to rise more and more quickly, requiring the MPC to raise interest rates to keep inflation under control,” the bank says.
In extreme situations, the Reserve Bank of New Zealand (RBNZ) can enact a monetary policy tool called Quantitative Easing. QE is the process by which the RBNZ prints local currency and uses it to buy assets – usually government or corporate bonds – from banks and other financial institutions with the aim to increase the domestic money supply and spur economic activity. QE usually results in a weaker New Zealand Dollar (NZD). QE is a last resort when simply lowering interest rates is unlikely to achieve the objectives of the central bank. The RBNZ used it during the Covid-19 pandemic.
The Australian Dollar weakens as traders adopt caution ahead of the RBA’s policy decision on Tuesday.
The RBA is expected to lower its Official Cash Rate by 25 basis points to 4.10%.
The US Dollar gains ground due to improved Treasury yields.
The Australian Dollar (AUD) pauses its three-day winning streak against the US Dollar (USD) as traders await the Reserve Bank of Australia’s (RBA) policy decision on Tuesday. The central bank is widely expected to lower its Official Cash Rate (OCR) by 25 basis points (bps) to 4.10%, marking the first rate cut in four years. However, policymakers may adopt a cautious stance, as trimmed mean inflation remains above the RBA’s 2%-3% target range.
Signs of easing inflation in Australia have increased expectations for a rate cut in February. December data indicated slowing price pressures, with the latest quarterly Consumer Price Index (CPI) rising less than forecast in the final quarter of 2024. The RBA’s preferred inflation measure, the Trimmed Mean CPI, climbed 0.5% for the quarter—below the expected 0.6%—while the annualized rate declined to 3.2% from 3.5%.
The AUD/USD pair found support following US President Donald Trump's decision to delay the implementation of reciprocal tariffs. Additionally, the US Dollar (USD) weakened as a disappointing US retail sales report fueled speculation that the Federal Reserve (Fed) might cut interest rates later this year, despite lingering inflation concerns.
Australian Dollar declines as US Dollar gains ground on improved Treasury yields
The US Dollar Index (DXY), which tracks the US Dollar's performance against six major currencies, edges higher after registering losses in the previous three successive sessions due to improved US Treasury yields. The DXY trades around 106.80, while yields on 2-year and 10-year US Treasury bonds stand at 4.26% and 4.50%, respectively.
Federal Reserve Governor Michelle Bowman stated on Monday that rising asset prices may have slowed the Fed’s recent progress on inflation. While Bowman expects inflation to decline, she cautioned that upside risks remain and emphasized the need for more certainty before considering rate cuts.
Meanwhile, Fed Governor Christopher Waller acknowledged late Monday that while inflation has improved, progress has been “excruciatingly” slow. Waller stressed that the Fed must not allow policy uncertainty to hinder data-driven decision-making.
US Census Bureau reported on Friday that Retail Sales fell by 0.9% in January, following a revised 0.7% increase in December (previously reported as 0.4%). This decline was sharper than the market’s expectation of a 0.1% drop.
Fed Chair Jerome Powell said in his semi-annual report to Congress that the board officials “do not need to be in a hurry" to cut interest rates due to strength in the job market and solid economic growth. He added that US President Donald Trump's tariff policies could put more upward pressure on prices, making it harder for the central bank to lower rates.
On Monday, Chinese President Xi Jinping led a meeting with Alibaba co-founder Jack Ma and other prominent entrepreneurs, signaling Beijing’s renewed support for the private sector, which is now seen as crucial to economic recovery, according to Bloomberg. Xi emphasized the need to eliminate barriers that hinder equal access to production resources and fair market competition.
Australian Dollar moves below 0.6350; support appears at nine-day EMA
AUD/USD trades near 0.6340 on Tuesday, trending upward within an ascending channel pattern, indicating a bullish market bias. The 14-day Relative Strength Index (RSI) remains above the 50 level, further supporting the bullish outlook.
On the upside, the AUD/USD pair may challenge the upper boundary of the ascending channel at 0.6390, followed by the key psychological resistance at 0.6400.
Support levels include the nine-day EMA at 0.6316, followed by the 14-day EMA at 0.6300. A stronger support zone lies near the lower boundary of the ascending channel at 0.6280.
AUD/USD: Daily Chart
Australian Dollar PRICE Today
The table below shows the percentage change of Australian Dollar (AUD) against listed major currencies today. Australian Dollar was the weakest against the US Dollar.
USD
EUR
GBP
JPY
CAD
AUD
NZD
CHF
USD
0.18%
0.20%
0.24%
0.13%
0.29%
0.39%
0.12%
EUR
-0.18%
0.03%
0.05%
-0.05%
0.11%
0.21%
-0.06%
GBP
-0.20%
-0.03%
0.06%
-0.07%
0.09%
0.19%
-0.08%
JPY
-0.24%
-0.05%
-0.06%
-0.09%
0.06%
0.15%
-0.11%
CAD
-0.13%
0.05%
0.07%
0.09%
0.16%
0.26%
-0.01%
AUD
-0.29%
-0.11%
-0.09%
-0.06%
-0.16%
0.10%
-0.18%
NZD
-0.39%
-0.21%
-0.19%
-0.15%
-0.26%
-0.10%
-0.27%
CHF
-0.12%
0.06%
0.08%
0.11%
0.00%
0.18%
0.27%
The heat map shows percentage changes of major currencies against each other. The base currency is picked from the left column, while the quote currency is picked from the top row. For example, if you pick the Australian Dollar from the left column and move along the horizontal line to the US Dollar, the percentage change displayed in the box will represent AUD (base)/USD (quote).
Australian Dollar FAQs
One of the most significant factors for the Australian Dollar (AUD) is the level of interest rates set by the Reserve Bank of Australia (RBA). Because Australia is a resource-rich country another key driver is the price of its biggest export, Iron Ore. The health of the Chinese economy, its largest trading partner, is a factor, as well as inflation in Australia, its growth rate and Trade Balance. Market sentiment – whether investors are taking on more risky assets (risk-on) or seeking safe-havens (risk-off) – is also a factor, with risk-on positive for AUD.
The Reserve Bank of Australia (RBA) influences the Australian Dollar (AUD) by setting the level of interest rates that Australian banks can lend to each other. This influences the level of interest rates in the economy as a whole. The main goal of the RBA is to maintain a stable inflation rate of 2-3% by adjusting interest rates up or down. Relatively high interest rates compared to other major central banks support the AUD, and the opposite for relatively low. The RBA can also use quantitative easing and tightening to influence credit conditions, with the former AUD-negative and the latter AUD-positive.
China is Australia’s largest trading partner so the health of the Chinese economy is a major influence on the value of the Australian Dollar (AUD). When the Chinese economy is doing well it purchases more raw materials, goods and services from Australia, lifting demand for the AUD, and pushing up its value. The opposite is the case when the Chinese economy is not growing as fast as expected. Positive or negative surprises in Chinese growth data, therefore, often have a direct impact on the Australian Dollar and its pairs.
Iron Ore is Australia’s largest export, accounting for $118 billion a year according to data from 2021, with China as its primary destination. The price of Iron Ore, therefore, can be a driver of the Australian Dollar. Generally, if the price of Iron Ore rises, AUD also goes up, as aggregate demand for the currency increases. The opposite is the case if the price of Iron Ore falls. Higher Iron Ore prices also tend to result in a greater likelihood of a positive Trade Balance for Australia, which is also positive of the AUD.
The Trade Balance, which is the difference between what a country earns from its exports versus what it pays for its imports, is another factor that can influence the value of the Australian Dollar. If Australia produces highly sought after exports, then its currency will gain in value purely from the surplus demand created from foreign buyers seeking to purchase its exports versus what it spends to purchase imports. Therefore, a positive net Trade Balance strengthens the AUD, with the opposite effect if the Trade Balance is negative.
The Indian Rupee weakens in Tuesday’s Asian session.
Significant foreign fund outflows and strength in the US Dollar weigh on the INR.
The RBI intervention might help limit the INR’s losses.
The Indian Rupee (INR) depreciates on Tuesday. Analysts expect the local currency to trade with negative bias amid weakness in the domestic equities and Foreign Institutional Investors (FII) outflows. A recovery in the US Dollar (USD) and fears of a global trade war in response to Trump's tariff measures might contribute to the INR’s downside.
Nonetheless, any significant decline in the INR might be capped amid further intervention by the Reserve Bank of India (RBI). Investors await the release of the NY Empire State Manufacturing Index for February, which will be released later on Tuesday. Also, the Federal Reserve's (Fed) Mary Daly is set to speak.
Indian Rupee remains vulnerable amid FII outflows
India's trade deficit widened to $22.99 billion in January from December's $21.94 billion, according to government data on Monday.
India’s Exports stood at $36.43 billion in January, while Imports rose to $59.4 billion during the same reported period, said the government data.
The narrowing of the trade deficit was likely influenced by a decline in gold imports, as higher global prices reduced demand, according to a Union Bank of India report.
"The Indian rupee declined today on a weak tone in the domestic markets and a recovery in the US dollar index from intraday lows. However, a weak tone in crude oil prices and a decline in US Treasury yields cushioned the downside," said Anuj Choudhary, Research Analyst at Mirae Asset Sharekhan.
On Friday, US President Donald Trump maintained his drumbeat of tariff threats, stating that taxes on autos will begin as soon as April 2. It was the latest in a series of trade measures he has announced since taking office for the second time.
USD/INR’s broader trend remains constructive
The Indian Rupee trades on a softer note on the day. According to the daily chart, the USD/INR pair keeps the bullish vibe as the price is above the key 100-day Exponential Moving Average (EMA). Furthermore, upward momentum is supported by the 14-day Relative Strength Index (RSI), which stands above the midline near 55.0, hinting that the path of least resistance is to the upside.
The first upside barrier for USD/INR emerges at the 87.00 psychological level. A decisive break above this level, the pair could set its sights back up on an all-time high near 88.00, en route to 88.50.
In the bearish event, the initial support level is located at 86.35, the low of February 12. A breach of the mentioned level could set off a drop to 86.14, the low of January 27.
Indian Rupee FAQs
The Indian Rupee (INR) is one of the most sensitive currencies to external factors. The price of Crude Oil (the country is highly dependent on imported Oil), the value of the US Dollar – most trade is conducted in USD – and the level of foreign investment, are all influential. Direct intervention by the Reserve Bank of India (RBI) in FX markets to keep the exchange rate stable, as well as the level of interest rates set by the RBI, are further major influencing factors on the Rupee.
The Reserve Bank of India (RBI) actively intervenes in forex markets to maintain a stable exchange rate, to help facilitate trade. In addition, the RBI tries to maintain the inflation rate at its 4% target by adjusting interest rates. Higher interest rates usually strengthen the Rupee. This is due to the role of the ‘carry trade’ in which investors borrow in countries with lower interest rates so as to place their money in countries’ offering relatively higher interest rates and profit from the difference.
Macroeconomic factors that influence the value of the Rupee include inflation, interest rates, the economic growth rate (GDP), the balance of trade, and inflows from foreign investment. A higher growth rate can lead to more overseas investment, pushing up demand for the Rupee. A less negative balance of trade will eventually lead to a stronger Rupee. Higher interest rates, especially real rates (interest rates less inflation) are also positive for the Rupee. A risk-on environment can lead to greater inflows of Foreign Direct and Indirect Investment (FDI and FII), which also benefit the Rupee.
Higher inflation, particularly, if it is comparatively higher than India’s peers, is generally negative for the currency as it reflects devaluation through oversupply. Inflation also increases the cost of exports, leading to more Rupees being sold to purchase foreign imports, which is Rupee-negative. At the same time, higher inflation usually leads to the Reserve Bank of India (RBI) raising interest rates and this can be positive for the Rupee, due to increased demand from international investors. The opposite effect is true of lower inflation.
The People’s Bank of China (PBOC) set the USD/CNY central rate for the trading session ahead on Tuesday at 7.1697 as compared to the previous day's fix of 7.1702 and 7.2538 Reuters estimates.
PBOC FAQs
The primary monetary policy objectives of the People's Bank of China (PBoC) are to safeguard price stability, including exchange rate stability, and promote economic growth. China’s central bank also aims to implement financial reforms, such as opening and developing the financial market.
The PBoC is owned by the state of the People's Republic of China (PRC), so it is not considered an autonomous institution. The Chinese Communist Party (CCP) Committee Secretary, nominated by the Chairman of the State Council, has a key influence on the PBoC’s management and direction, not the governor. However, Mr. Pan Gongsheng currently holds both of these posts.
Unlike the Western economies, the PBoC uses a broader set of monetary policy instruments to achieve its objectives. The primary tools include a seven-day Reverse Repo Rate (RRR), Medium-term Lending Facility (MLF), foreign exchange interventions and Reserve Requirement Ratio (RRR). However, The Loan Prime Rate (LPR) is China’s benchmark interest rate. Changes to the LPR directly influence the rates that need to be paid in the market for loans and mortgages and the interest paid on savings. By changing the LPR, China’s central bank can also influence the exchange rates of the Chinese Renminbi.
Yes, China has 19 private banks – a small fraction of the financial system. The largest private banks are digital lenders WeBank and MYbank, which are backed by tech giants Tencent and Ant Group, per The Straits Times. In 2014, China allowed domestic lenders fully capitalized by private funds to operate in the state-dominated financial sector.
On Monday, Chinese President Xi Jinping presided over a meeting with Alibaba co-founder Jack Ma and other prominent entrepreneurs, signaling Beijing’s support for a long-marginalized private sector now considered key to reviving the economy, per Bloomberg.
Key quotes
It is necessary to resolutely remove all kinds of obstacles to the equal use of production factors and fair participation in market competition.
Continue to promote the fair opening of the competitive field of infrastructure to all kinds of business entities, and continue to make great efforts to solve the problem of difficult and expensive financing for private enterprises.
Market reaction
At the press time, AUD/USD is down 0.15% on the day to trade at 0.6351.
Australian Dollar FAQs
One of the most significant factors for the Australian Dollar (AUD) is the level of interest rates set by the Reserve Bank of Australia (RBA). Because Australia is a resource-rich country another key driver is the price of its biggest export, Iron Ore. The health of the Chinese economy, its largest trading partner, is a factor, as well as inflation in Australia, its growth rate and Trade Balance. Market sentiment – whether investors are taking on more risky assets (risk-on) or seeking safe-havens (risk-off) – is also a factor, with risk-on positive for AUD.
The Reserve Bank of Australia (RBA) influences the Australian Dollar (AUD) by setting the level of interest rates that Australian banks can lend to each other. This influences the level of interest rates in the economy as a whole. The main goal of the RBA is to maintain a stable inflation rate of 2-3% by adjusting interest rates up or down. Relatively high interest rates compared to other major central banks support the AUD, and the opposite for relatively low. The RBA can also use quantitative easing and tightening to influence credit conditions, with the former AUD-negative and the latter AUD-positive.
China is Australia’s largest trading partner so the health of the Chinese economy is a major influence on the value of the Australian Dollar (AUD). When the Chinese economy is doing well it purchases more raw materials, goods and services from Australia, lifting demand for the AUD, and pushing up its value. The opposite is the case when the Chinese economy is not growing as fast as expected. Positive or negative surprises in Chinese growth data, therefore, often have a direct impact on the Australian Dollar and its pairs.
Iron Ore is Australia’s largest export, accounting for $118 billion a year according to data from 2021, with China as its primary destination. The price of Iron Ore, therefore, can be a driver of the Australian Dollar. Generally, if the price of Iron Ore rises, AUD also goes up, as aggregate demand for the currency increases. The opposite is the case if the price of Iron Ore falls. Higher Iron Ore prices also tend to result in a greater likelihood of a positive Trade Balance for Australia, which is also positive of the AUD.
The Trade Balance, which is the difference between what a country earns from its exports versus what it pays for its imports, is another factor that can influence the value of the Australian Dollar. If Australia produces highly sought after exports, then its currency will gain in value purely from the surplus demand created from foreign buyers seeking to purchase its exports versus what it spends to purchase imports. Therefore, a positive net Trade Balance strengthens the AUD, with the opposite effect if the Trade Balance is negative.
British Prime Minister Keir Starmer said late Monday that any Ukraine peace deal would require a "US backstop" to deter Russia from attacking its neighbor again, per Reuters.
Key quotes
A US security guarantee was the only way to effectively deter Russia.
The future of Ukraine is an existential issue for Europe.
It is pressing that they now share the burden.
Europe must play its role.
There must be a US backstop.
Market reaction
At the press time, the Gold price is up 0.07% on the day to trade at $2,899.
Risk sentiment FAQs
In the world of financial jargon the two widely used terms “risk-on” and “risk off'' refer to the level of risk that investors are willing to stomach during the period referenced. In a “risk-on” market, investors are optimistic about the future and more willing to buy risky assets. In a “risk-off” market investors start to ‘play it safe’ because they are worried about the future, and therefore buy less risky assets that are more certain of bringing a return, even if it is relatively modest.
Typically, during periods of “risk-on”, stock markets will rise, most commodities – except Gold – will also gain in value, since they benefit from a positive growth outlook. The currencies of nations that are heavy commodity exporters strengthen because of increased demand, and Cryptocurrencies rise. In a “risk-off” market, Bonds go up – especially major government Bonds – Gold shines, and safe-haven currencies such as the Japanese Yen, Swiss Franc and US Dollar all benefit.
The Australian Dollar (AUD), the Canadian Dollar (CAD), the New Zealand Dollar (NZD) and minor FX like the Ruble (RUB) and the South African Rand (ZAR), all tend to rise in markets that are “risk-on”. This is because the economies of these currencies are heavily reliant on commodity exports for growth, and commodities tend to rise in price during risk-on periods. This is because investors foresee greater demand for raw materials in the future due to heightened economic activity.
The major currencies that tend to rise during periods of “risk-off” are the US Dollar (USD), the Japanese Yen (JPY) and the Swiss Franc (CHF). The US Dollar, because it is the world’s reserve currency, and because in times of crisis investors buy US government debt, which is seen as safe because the largest economy in the world is unlikely to default. The Yen, from increased demand for Japanese government bonds, because a high proportion are held by domestic investors who are unlikely to dump them – even in a crisis. The Swiss Franc, because strict Swiss banking laws offer investors enhanced capital protection.
EUR/USD churned close to flat near the 1.0500 handle.
European data remains mostly tepid this week, Fed minutes loom ahead.
US PMI activity results are also due this week, but not until Friday.
EUR/USD swamped out at the 1.0500 handle on Monday, snapping a four-day win streak as Fiber bulls re-think their position. Money markets were constrained by a notable lack of order flow during the US market session, with most major US exchanges dark for the President’s Day holiday. FX markets will return to the fold in force on Tuesday, but Euro bidders may not find much momentum with a thin data docket.
European economic sentiment survey results for both Germany and the wider European region are due early Tuesday, but consumers tend to be reactionary and behind the curve on economic factors, so market impact will likely remain limited. Regardless, the February’s figures are expected to improve from January’s print.
The key US data print this week will be the upcoming Meeting Minutes from the Federal Reserve’s (Fed) latest rate call, due on Wednesday. US Purchasing Managers Index (PMI) survey results are also due this week, but not until Friday.
EUR/USD price forecast
EUR/USD failed to climb over 1.0500 again on Monday, churning just beneath the key technical level as bidders risk running out of gas. Technical oscillators including the Stochastic indicator are flashing warning signs of an overbought technical stance, though confirmation of a turnaround into the low side have yet to materialize.
The pair is trading just north of the 50-day Exponential Moving Average (EMA) at 1.0432, and a firm technical floor appears to be priced in near 1.0300.
EUR/USD daily chart
Euro FAQs
The Euro is the currency for the 19 European Union countries that belong to the Eurozone. It is the second most heavily traded currency in the world behind the US Dollar. In 2022, it accounted for 31% of all foreign exchange transactions, with an average daily turnover of over $2.2 trillion a day. EUR/USD is the most heavily traded currency pair in the world, accounting for an estimated 30% off all transactions, followed by EUR/JPY (4%), EUR/GBP (3%) and EUR/AUD (2%).
The European Central Bank (ECB) in Frankfurt, Germany, is the reserve bank for the Eurozone. The ECB sets interest rates and manages monetary policy. The ECB’s primary mandate is to maintain price stability, which means either controlling inflation or stimulating growth. Its primary tool is the raising or lowering of interest rates. Relatively high interest rates – or the expectation of higher rates – will usually benefit the Euro and vice versa. The ECB Governing Council makes monetary policy decisions at meetings held eight times a year. Decisions are made by heads of the Eurozone national banks and six permanent members, including the President of the ECB, Christine Lagarde.
Eurozone inflation data, measured by the Harmonized Index of Consumer Prices (HICP), is an important econometric for the Euro. If inflation rises more than expected, especially if above the ECB’s 2% target, it obliges the ECB to raise interest rates to bring it back under control. Relatively high interest rates compared to its counterparts will usually benefit the Euro, as it makes the region more attractive as a place for global investors to park their money.
Data releases gauge the health of the economy and can impact on the Euro. Indicators such as GDP, Manufacturing and Services PMIs, employment, and consumer sentiment surveys can all influence the direction of the single currency. A strong economy is good for the Euro. Not only does it attract more foreign investment but it may encourage the ECB to put up interest rates, which will directly strengthen the Euro. Otherwise, if economic data is weak, the Euro is likely to fall. Economic data for the four largest economies in the euro area (Germany, France, Italy and Spain) are especially significant, as they account for 75% of the Eurozone’s economy.
Another significant data release for the Euro is the Trade Balance. This indicator measures the difference between what a country earns from its exports and what it spends on imports over a given period. If a country produces highly sought after exports then its currency will gain in value purely from the extra demand created from foreign buyers seeking to purchase these goods. Therefore, a positive net Trade Balance strengthens a currency and vice versa for a negative balance.
Giao dịch trên thị trường tài chính (đặc biệt là giao dịch sử dụng các công cụ biên) mở ra những cơ hội lớn và tạo điều kiện cho các nhà đầu tư sẵn sàng mạo hiểm để thu lợi nhuận, tuy nhiên nó mang trong mình nguy cơ rủi ro khá cao. Chính vì vậy trước khi tiến hành giao dịch cần phải xem xét mọi mặt vấn đề chấp nhận tiến hành giao dịch cụ thể xét theo quan điểm của nguồn lực tài chính sẵn có và mức độ am hiểu thị trường tài chính.
Sử dụng thông tin: sử dụng toàn bộ hay riêng biệt các dữ liệu trên trang web của công ty TeleTrade như một nguồn cung cấp thông tin nhất định. Việc sử dụng tư liệu từ trang web cần kèm theo liên kết đến trang teletrade.vn. Việc tự động thu thập số liệu cũng như thông tin từ trang web TeleTrade đều không được phép.
Nhấn nút "Đăng ký" để nhận thông báo về chương trình khuyến mãi và Bonus
Cảm ơn bạn đã ghé thăm teletrade.org!
Thông tin trên trang web này có thể không tuân thủ luật pháp của quốc gia nơi bạn sống.
Vẫn xem thông tin.
Tôi xác nhận rằng các tài liệu trên trang web này không dành cho cư dân EU và tôi có thể không có quyền đăng ký tài khoản bên teletrade.org, nhưng tôi vẫn muốn tiếp tục.