- Phân tích
- Tin tức và các công cụ
- Tin tức thị trường
Tin tức thì trường
(raw materials / closing price /% change)
Oil 55.26 -0.13%
Gold 1,278.50 +0.06%
(index / closing price / change items /% change)
Nikkei +322.80 22351.12 +1.47%
TOPIX +17.70 1761.71 +1.01%
Hang Seng +167.07 29018.76 +0.58%
CSI 300 +31.34 4105.01 +0.77%
Euro Stoxx 50 +19.08 3564.80 +0.54%
FTSE 100 +14.33 7386.94 +0.19%
DAX +70.85 13047.22 +0.55%
CAC 40 +35.14 5336.39 +0.66%
DJIA +187.08 23458.36 +0.80%
S&P 500 +21.02 2585.64 +0.82%
NASDAQ +87.09 6793.29 +1.30%
S&P/TSX +56.89 15935.37 +0.36%
(pare/closed(GMT +3)/change, %)
EUR/USD $1,1769 -0,18%
GBP/USD $1,3193 +0,19%
USD/CHF Chf0,99381 +0,58%
USD/JPY Y113,04 +0,15%
EUR/JPY Y133,02 -0,04%
GBP/JPY Y149,141 +0,34%
AUD/USD $0,7587 -0,01%
NZD/USD $0,6849 -0,34%
USD/CAD C$1,27557 -0,05%
00:30 Australia New Motor Vehicle Sales (YoY) October -0.8%
00:30 Australia New Motor Vehicle Sales (MoM) October -0.5%
08:30 Eurozone ECB President Mario Draghi Speaks
09:00 Eurozone Current account, unadjusted, bln September 29.6 30.2
10:00 Eurozone Construction Output, y/y September 1.6%
13:30 Canada Bank of Canada Consumer Price Index Core, y/y October 0.8%
13:30 Canada Consumer price index, y/y October 1.6% 1.4%
13:30 Canada Consumer Price Index m / m October 0.2% 0.1%
13:30 U.S. Housing Starts October 1127 1180
13:30 U.S. Building Permits October 1225 1240
18:00 U.S. Baker Hughes Oil Rig Count November 738
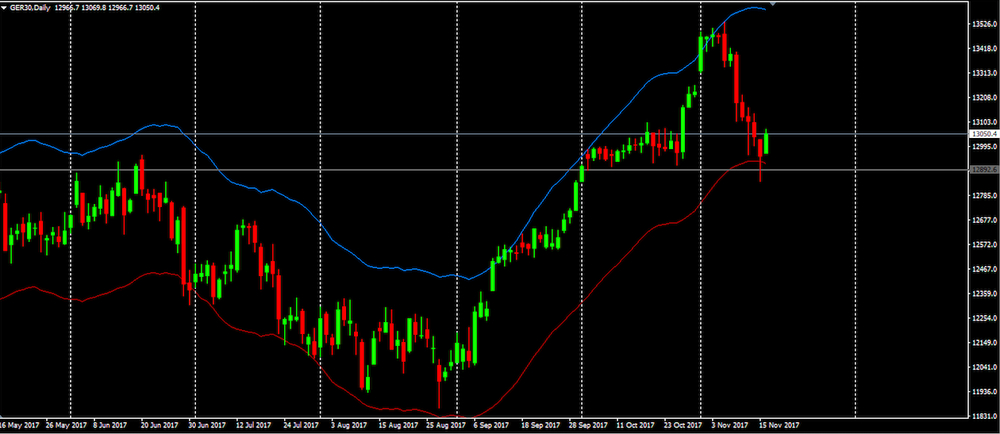
As we can see on daily chart, DAX has been correcting its price since it reached new highs at 13511.
On the previous day, we watched the rejection of the price in the support level (12892.6).
If that rejections confirms, then we might expect an appreciation of DAX until the last high or even a formation of a new higher high.
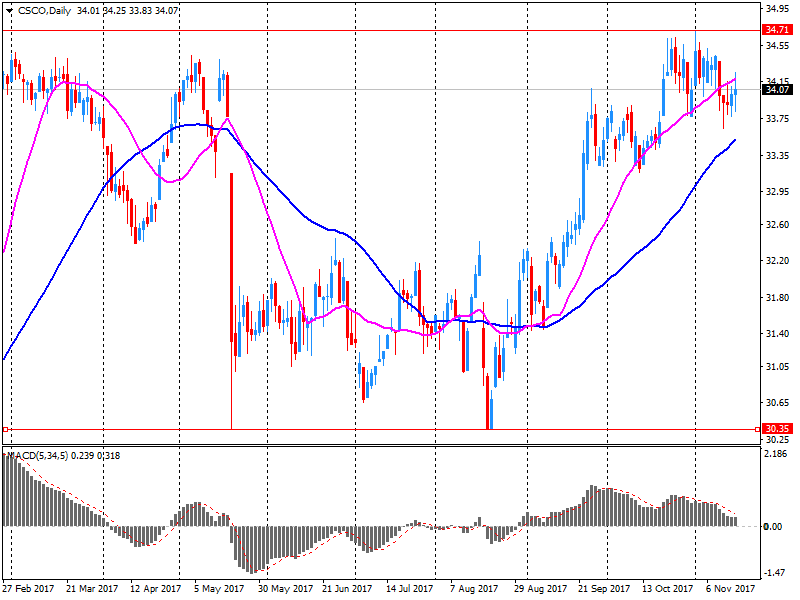
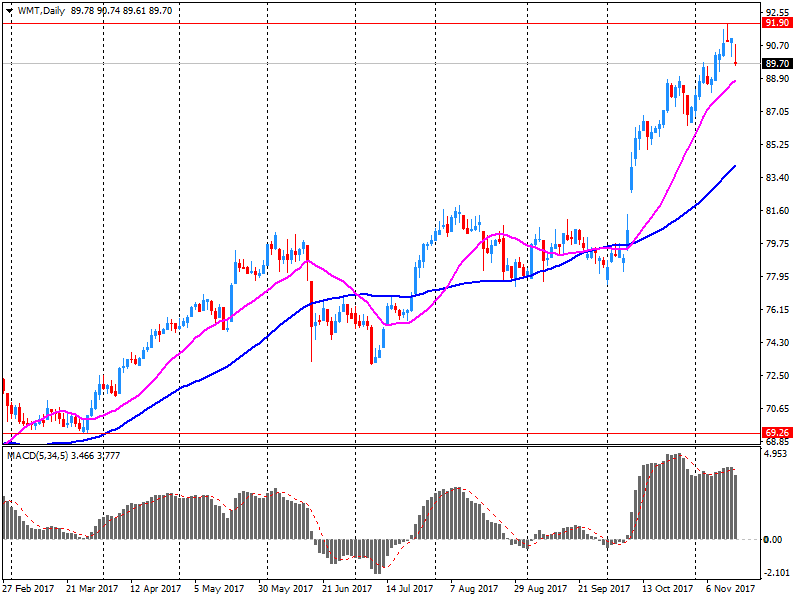
U.S. stock-index futures were higher on Thursday, rebounding after two straight days of losses on the back of strong earnings from Cisco (CSCO) and Wal-Mart (WMT), while investors awaited a House vote on tax reform and analyzed another large batch of economic data
Global Stocks:
Nikkei 22,351.12 +322.80 +1.47%
Hang Seng 29,018.76 +167.07 +0.58%
Shanghai 3,399.86 -2.66 -0.08%
S&P/ASX 5,943.51 +9.28 +0.16%
FTSE 7,378.44 +5.83 +0.08%
CAC 5,334.90 +33.65 +0.63%
DAX 13,042.97 +66.60 +0.51%
Crude $55.21 (-0.22%)
Gold $1,279.50 (+0.14%)
Manufacturing sales rose 0.5% to $53.7 billion in September, reflecting higher sales in the petroleum and coal product industry.
Overall, sales were up in 7 of 21 industries, representing 28.9% of the Canadian manufacturing sector. Sales of non-durable goods rose 1.7% to $25.4 billion, while sales of durable goods decreased 0.5% to $28.4 billion.
In constant dollars, sales increased 0.7%, indicating that higher volumes of manufactured goods were sold in September.
The index for utilities rose 2.0 percent, but mining output fell 1.3 percent, as Hurricane Nate caused a sharp but short-lived decline in oil and gas drilling and extraction. Even so, industrial activity was boosted in October by a return to normal operations after Hurricanes Harvey and Irma suppressed production in August and September.
Excluding the effects of the hurricanes, the index for total output advanced about 0.3 percent in October, and the index for manufacturing advanced about 0.2 percent.
With modest upward revisions for July through September, industrial production is now estimated to have only edged down 0.3 percent at an annual rate in the third quarter; the previously published estimate showed a decrease of 1.5 percent.
Total industrial production has risen 2.9 percent over the past 12 months; output in October was 106.1 percent of its 2012 average. Capacity utilization for the industrial sector was 77.0 percent, a rate that is 2.9 percentage points below its long-run (1972-2016) average.
In the week ending November 11, the advance figure for seasonally adjusted initial claims was 249,000, an increase of 10,000 from the previous week's unrevised level of 239,000. The 4-week moving average was 237,750, an increase of 6,500 from the previous week's unrevised average of 231,250.
(company / ticker / price / change ($/%) / volume)
| ALCOA INC. | AA | 42.6 | 0.39(0.92%) | 17415 |
| ALTRIA GROUP INC. | MO | 65.78 | 0.52(0.80%) | 205 |
| Amazon.com Inc., NASDAQ | AMZN | 1,131.50 | 4.81(0.43%) | 24596 |
| Apple Inc. | AAPL | 170.7 | 1.62(0.96%) | 289058 |
| AT&T Inc | T | 33.93 | 0.12(0.35%) | 18846 |
| Barrick Gold Corporation, NYSE | ABX | 13.97 | 0.02(0.14%) | 7750 |
| Boeing Co | BA | 264.2 | 1.34(0.51%) | 1362 |
| Caterpillar Inc | CAT | 135 | 0.90(0.67%) | 2186 |
| Chevron Corp | CVX | 115.01 | -0.36(-0.31%) | 21620 |
| Cisco Systems Inc | CSCO | 36.32 | 2.21(6.48%) | 853289 |
| Citigroup Inc., NYSE | C | 72.24 | 0.51(0.71%) | 29677 |
| Deere & Company, NYSE | DE | 132.68 | 0.41(0.31%) | 200 |
| Exxon Mobil Corp | XOM | 80.88 | -0.33(-0.41%) | 6781 |
| Facebook, Inc. | FB | 179.25 | 1.30(0.73%) | 61544 |
| Ford Motor Co. | F | 12.01 | 0.01(0.08%) | 20530 |
| Freeport-McMoRan Copper & Gold Inc., NYSE | FCX | 13.8 | 0.17(1.25%) | 22586 |
| General Electric Co | GE | 18.38 | 0.12(0.66%) | 436517 |
| Goldman Sachs | GS | 238.75 | 1.14(0.48%) | 446 |
| Google Inc. | GOOG | 1,024.35 | 3.44(0.34%) | 3122 |
| Home Depot Inc | HD | 166.7 | 1.23(0.74%) | 3394 |
| HONEYWELL INTERNATIONAL INC. | HON | 146.5 | 0.88(0.60%) | 870 |
| Intel Corp | INTC | 45.66 | 0.20(0.44%) | 31292 |
| International Business Machines Co... | IBM | 148.23 | 1.13(0.77%) | 2531 |
| Johnson & Johnson | JNJ | 140.05 | 0.95(0.68%) | 350 |
| JPMorgan Chase and Co | JPM | 98.95 | 0.76(0.77%) | 9395 |
| McDonald's Corp | MCD | 168 | 0.68(0.41%) | 515 |
| Merck & Co Inc | MRK | 54.97 | 0.17(0.31%) | 771 |
| Microsoft Corp | MSFT | 83.34 | 0.36(0.43%) | 54068 |
| Pfizer Inc | PFE | 35.33 | -0.03(-0.08%) | 264 |
| Procter & Gamble Co | PG | 89.55 | 1.32(1.50%) | 20269 |
| Starbucks Corporation, NASDAQ | SBUX | 56.64 | -0.06(-0.11%) | 3388 |
| Tesla Motors, Inc., NASDAQ | TSLA | 314.6 | 3.30(1.06%) | 52739 |
| Twitter, Inc., NYSE | TWTR | 20.07 | 0.16(0.80%) | 10801 |
| Verizon Communications Inc | VZ | 44.3 | 0.19(0.43%) | 7905 |
| Visa | V | 110.6 | 0.55(0.50%) | 5388 |
| Wal-Mart Stores Inc | WMT | 94.2 | 4.37(4.86%) | 810593 |
| Yandex N.V., NASDAQ | YNDX | 31.32 | 0.08(0.26%) | 6496 |
Cisco System (CSCO) target raised to $33 from $29 at Nomura; Neutral
Cisco System (CSCO) target raised to $39 from $33 at KeyBanc Capital Mkts; Overweight
Cisco System (CSCO) target raised to $40 from $37 at Jefferies; Buy
Cisco System (CSCO) target raised to $45 from $40 at Deutsche Bank; Buy
Cisco System (CSCO) target raised to 37 from $34 at Barclays; Overweight
Cisco System (CSCO) target raised to $40 from $36 at Oppenheimer; Outperform
Cisco System (CSCO) target raised to $40 from $36 at Citigroup; Buy
Cisco System (CSCO) target raised to $39 from $37 at UBS; Buy
Exxon Mobil (XOM) target lowered to $85 at RBC Capital Mkts
EURUSD: 1.1600 (EUR 1.03bln) 1.1660 (1.12bln) 1.1700 (940m) 1.1775-80 (590m) 1.1795-00(915m) 1.1815-25 (4.8bln) 1.1900 (730m)
USDJPY: 111.50 (915m) 112.00 (890m) 112.15 (360m) 112.25 (330m) 112.45-50(1.1bln) 112.95-00 ($580m) 113.10 ($405m) 113.50 (1.27bln) 113.90-00 (1.5bln)
GBPUSD: 1.3195 (GBP 395m)
USDCHF: 0.9800 (USD 400m) 0.9975 (305m) 1.0000 (605m)
AUDUSD:0.7625-30 (AUD 600m)
NZDUSD: 0.6900 (NZD 365m)
Cisco Systems (CSCO) reported Q1 FY 2018 earnings of $0.61 per share (versus $0.61 in Q1 FY 2017), beating analysts' consensus estimate of $0.60.
The company's quarterly revenues amounted to $12.136 bln (-1.7% y/y), generally in-line with analysts' consensus estimate of $12.111 bln.
The company also issued upside guidance for Q2 FY2018, projecting EPS of $0.58-0.60 (versus analysts' consensus estimate of $0.58) and revenues of ~$11.70-11.93 bln (+1-3%; versus analysts' consensus estimate of $11.69 bln).
CSCO rose to $36.24 (+6.24%) in pre-market trading.
Wal-Mart (WMT) reported Q3 FY 2018 earnings of $1.00 per share (versus $0.98 in Q3 FY 2017), beating analysts' consensus estimate of $0.97.
The company's quarterly revenues amounted to $122.236 bln (+4.2% y/y), beating analysts' consensus estimate of $120.233 bln.
The company also issued upside guidance for FY2018, projecting EPS of $4.38-4.46 (up from $4.30-4.40) versus analysts' consensus estimate of $4.38.
WMT rose to $94.27 (+4.94%) in pre-market trading.
-
There still appears to be a disconnect between growth and inflation
-
Could raise growth forecast in dec
-
Would not be right for market to expect increase in asset buys
-
Need to minimise market distortions
-
Toolbox not limited to asset buys
-
Normlisation will be gradual
Euro area annual inflation was 1.4% in October 2017, down from 1.5% in September. In October 2016, the rate was 0.5%. European Union annual inflation was 1.7% in October 2017, down from 1.8% in September. A year earlier the rate was 0.5%. These figures come from Eurostat, the statistical office of the European Union. The lowest annual rates were registered in Cyprus (0.4%), Ireland, Greece and Finland (all 0.5%). The highest annual rates were recorded in Lithuania (4.2%), Estonia (4.0%) and the United Kingdom (3.0%). Compared with September 2017, annual inflation fell in fourteen Member States, remained stable in five and rose in nine.
The largest upward impacts to the euro area annual inflation came from fuels for transport (+0.10 percentage points), accommodation services (+0.08 pp) and milk, cheese & eggs (+0.06 pp), while telecommunication (-0.11 pp), garments (-0.07 pp) and social protection (-0.04 pp) had the biggest downward impacts.
The underlying pattern in the retail industry in October 2017, as suggested by the three-month on three-month measure is one of growth, with the quantity bought increasing by 0.9%.
The quantity bought in October 2017 increased by 0.3% compared with September 2017; non-food stores, in particular second-hand goods stores (charity shops, auction houses, antiques and fine art dealers) provided the largest contribution to this growth.
The longer-term picture as shown by the year-on-year growth rate shows the quantity bought fell by 0.3% in comparison with a strong October 2016; food stores provided the largest contribution to this fall.
Average store prices increased by 3.1% compared with October 2016, with the largest contribution from food stores where average prices rose by 3.5%, the largest year-on-year price increase since September 2013.
Online sales values increased year-on-year by 10.7%, accounting for approximately 16.9% of all retail spending.
EUR/USD: 1.1600(1.03 b), 1.1659(1.12 b), 1.1700(938 m) 1.1775-80(589 m), 1.1795-00(914 m), 1.1815-25(4.8 b), 1.1900(726 m)
GBP/USD: 1.3195(394 m)
USD/JPY: 111.50(911 m), 112.00(890 m), 112.15(360 m), 112.25(330 m) 112.45-50(1.09 b), 112.95-00(578 m), Y113.10(401 m), 113.50(1.27 b) 113.90-00(1.5 b)
USD/CHF: 0.9800(400 m), 0.9975(305 m), 1.0000(604 m)
AUD/USD: 0.7625-30(596 m)
NZD/USD: 0.6900-10(365 m)
EUR/JPY: 133.00(940 m)
AUD/NZD: 1.1100(2.34 b)
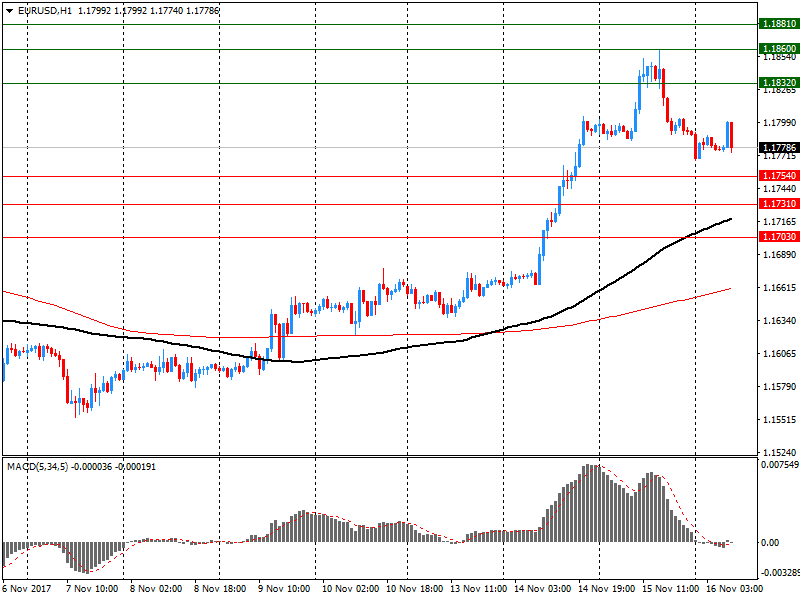
EUR/USD
Resistance levels (open interest**, contracts)
$1.1881 (7231)
$1.1860 (3157)
$1.1832 (3833)
Price at time of writing this review: $1.1778
Support levels (open interest**, contracts):
$1.1754 (1610)
$1.1731 (1868)
$1.1703 (3060)
Comments:
- Overall open interest on the CALL options and PUT options with the expiration date December, 8 is 155265 contracts (according to data from November, 15) with the maximum number of contracts with strike price $1,1500 (8467);
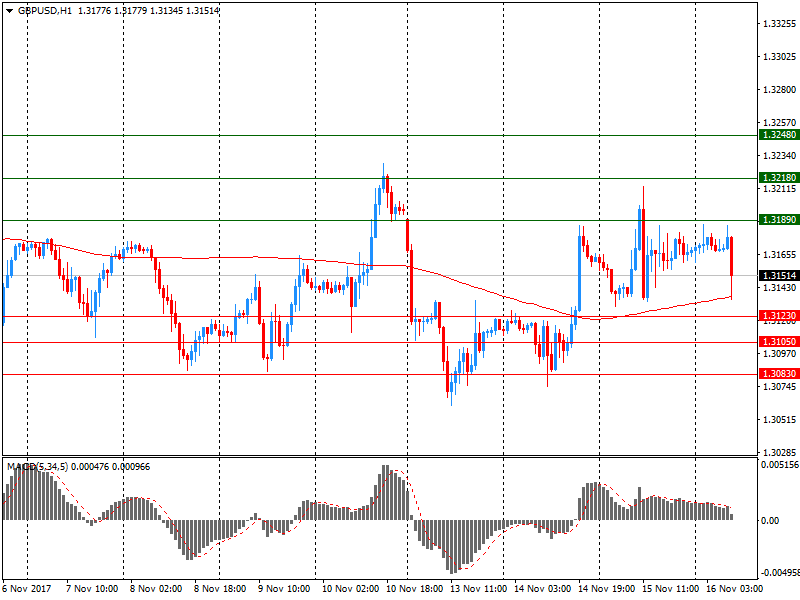
GBP/USD
Resistance levels (open interest**, contracts)
$1.3248 (1376)
$1.3218 (782)
$1.3189 (616)
Price at time of writing this review: $1.3151
Support levels (open interest**, contracts):
$1.3123 (1145)
$1.3105 (1134)
$1.3083 (1348)
Comments:
- Overall open interest on the CALL options with the expiration date December, 8 is 40893 contracts, with the maximum number of contracts with strike price $1,3200 (3141);
- Overall open interest on the PUT options with the expiration date December, 8 is 40647 contracts, with the maximum number of contracts with strike price $1,3000 (4713);
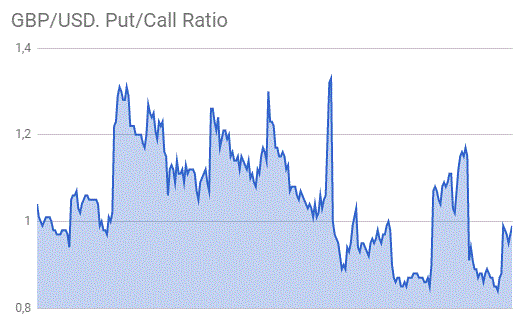
- The ratio of PUT/CALL was 0.99 versus 0.99 from the previous trading day according to data from November, 15
* - The Chicago Mercantile Exchange bulletin (CME) is used for the calculation.
** - Open interest takes into account the total number of option contracts that are open at the moment.
-
Government, businesses recognise important to have at least Brexit transition
Trend estimates (monthly change):
-
Employment increased 20,000 to 12,301,200.
-
Unemployment decreased 3,000 to 709,400.
-
Unemployment rate remained steady at 5.5%.
-
Participation rate remained steady at 65.2%.
-
Monthly hours worked in all jobs increased 3.5 million hours (0.2%) to 1,720.3 million hours.
Seasonally adjusted estimates (monthly change):
-
Employment increased 3,700 to 12,297,100. Full-time employment increased 24,300 to 8,425,400 and part-time employment decreased 20,700 to 3,871,700.
-
Unemployment decreased 8,100 to 701,500. The number of unemployed persons looking for full-time work remained steady at 485,900 and the number of unemployed persons only looking for part-time work decreased 8,100 to 215,600.
-
Unemployment rate decreased 0.1 pts to 5.4%.
-
Participation rate decreased 0.1 pts to 65.1%.
-
Monthly hours worked in all jobs increased 4.6 million hours (0.3%) to 1,723.7 million hours.
European stocks closed lower on Wednesday, as strength in the euro and a drop in commodity shares drew the regional benchmark near a two-month low. Equities in Europe fell alongside a slide for U.S. stocks, pulled lower in part by jitters over the prospects of success for the U.S. tax overhaul in Washington.
U.S. stocks closed lower Wednesday, with both the Dow and the S&P 500 suffering their biggest one-day percentage drops since September as falling oil prices and worries over the progress of a U.S. tax overhaul left investors increasingly averse to putting more money into assets seen as risky.
Global stock markets stabilized somewhat in Asia on Thursday, following broad weakness since the end of last week, with shares in Japan gaining after six straight sessions in the red. The Nikkei Stock Average NIK, +1.23% was up 0.8%, recovering from Wednesday's 1.6% decline, though the index was still off 3.5% since closing at a 25-year high on Tuesday last week.
© 2000-2026. Bản quyền Teletrade.
Trang web này được quản lý bởi Teletrade D.J. LLC 2351 LLC 2022 (Euro House, Richmond Hill Road, Kingstown, VC0100, St. Vincent and the Grenadines).
Thông tin trên trang web không phải là cơ sở để đưa ra quyết định đầu tư và chỉ được cung cấp cho mục đích làm quen.
Giao dịch trên thị trường tài chính (đặc biệt là giao dịch sử dụng các công cụ biên) mở ra những cơ hội lớn và tạo điều kiện cho các nhà đầu tư sẵn sàng mạo hiểm để thu lợi nhuận, tuy nhiên nó mang trong mình nguy cơ rủi ro khá cao. Chính vì vậy trước khi tiến hành giao dịch cần phải xem xét mọi mặt vấn đề chấp nhận tiến hành giao dịch cụ thể xét theo quan điểm của nguồn lực tài chính sẵn có và mức độ am hiểu thị trường tài chính.
Sử dụng thông tin: sử dụng toàn bộ hay riêng biệt các dữ liệu trên trang web của công ty TeleTrade như một nguồn cung cấp thông tin nhất định. Việc sử dụng tư liệu từ trang web cần kèm theo liên kết đến trang teletrade.vn. Việc tự động thu thập số liệu cũng như thông tin từ trang web TeleTrade đều không được phép.
Xin vui lòng liên hệ với pr@teletrade.global nếu có câu hỏi.
