- Phân tích
- Tin tức và các công cụ
- Tin tức thị trường
Tin tức thì trường
- NZD/USD trades on a softer note around 0.6075 in Tuesday’s early Asian session.
- New Zealand inflation data is expected to slow more than central bank expects in Q2, paving the way for rate cuts.
- Traders raise their bets on Fed rate cuts in September.
The NZD/USD pair remains on the defensive near 0.6075 during the early Asian session on Monday. The weaker Chinese economic data and modest rebound of the US Dollar (USD) continue to undermine the pair. The US Retail Sales for June will be in the spotlight on Tuesday. The attention will shift to the New Zealand Consumer Price Index (CPI) inflation data, which is due on Wednesday.
New Zealand CPI inflation data is expected to slow more than the Reserve Bank of New Zealand (RBNZ) expects in the second quarter, paving the way for interest-rate cuts. The annual CPI is estimated to show an increase of 3.5% in Q2, compared to the previous reading of 4.0%. On a quarterly basis, the CPI is forecast to rise 0.6% QoQ in Q2. “For easing to begin in August, we would likely need to have seen a significant broad-based downside surprise in the Q2 CPI on 17 July,” Kelly Eckhold, Westpac’s chief economist, said.
Elsewhere, weaker-than-expected Chinese Gross Domestic Product (GDP) data on Monday exerted some mild bearish pressure on the Kiwi. The performance of the Chinese economy tends to influence the Kiwi as China is New Zealand's major trade partner. China’s economy expanded 4.7% YoY in the second quarter (Q2), compared to a 5.3% expansion in the first quarter, according to the National Bureau of Statistics (NBS) on Monday.
On the USD’s front, market players expect the US Federal Reserve (Fed) to start its easy cycle in September. Powell avoided sending a clear signal about when the Fed would begin to cut interest rates, despite a recent cool-down in inflation. Financial markets are now pricing in a September rate cut, with 100% odds of at least 25 basis points (bps) in the fed funds rate when the Federal Open Market Committee (FOMC) meets on September 18.
New Zealand Dollar FAQs
The New Zealand Dollar (NZD), also known as the Kiwi, is a well-known traded currency among investors. Its value is broadly determined by the health of the New Zealand economy and the country’s central bank policy. Still, there are some unique particularities that also can make NZD move. The performance of the Chinese economy tends to move the Kiwi because China is New Zealand’s biggest trading partner. Bad news for the Chinese economy likely means less New Zealand exports to the country, hitting the economy and thus its currency. Another factor moving NZD is dairy prices as the dairy industry is New Zealand’s main export. High dairy prices boost export income, contributing positively to the economy and thus to the NZD.
The Reserve Bank of New Zealand (RBNZ) aims to achieve and maintain an inflation rate between 1% and 3% over the medium term, with a focus to keep it near the 2% mid-point. To this end, the bank sets an appropriate level of interest rates. When inflation is too high, the RBNZ will increase interest rates to cool the economy, but the move will also make bond yields higher, increasing investors’ appeal to invest in the country and thus boosting NZD. On the contrary, lower interest rates tend to weaken NZD. The so-called rate differential, or how rates in New Zealand are or are expected to be compared to the ones set by the US Federal Reserve, can also play a key role in moving the NZD/USD pair.
Macroeconomic data releases in New Zealand are key to assess the state of the economy and can impact the New Zealand Dollar’s (NZD) valuation. A strong economy, based on high economic growth, low unemployment and high confidence is good for NZD. High economic growth attracts foreign investment and may encourage the Reserve Bank of New Zealand to increase interest rates, if this economic strength comes together with elevated inflation. Conversely, if economic data is weak, NZD is likely to depreciate.
The New Zealand Dollar (NZD) tends to strengthen during risk-on periods, or when investors perceive that broader market risks are low and are optimistic about growth. This tends to lead to a more favorable outlook for commodities and so-called ‘commodity currencies’ such as the Kiwi. Conversely, NZD tends to weaken at times of market turbulence or economic uncertainty as investors tend to sell higher-risk assets and flee to the more-stable safe havens.
- EUR/USD bidders failed to make a clean break of 1.0900 on Monday.
- Fiber’s near-term bull run set to end as technicals weigh heavily on buyers.
- ECB rate call due in the back half of the week to constrain Euro bids.
EUR/USD fell short of recent bullish momentum, pulling back sharply after a brief jump above 1.0900 to kick off the new trading week and keeping price action strung out along the top end of a descending price channel. Traders are weighing their stance on the Greenback as Fedspeak dominated investor sentiment with appearances from key policymakers on Monday.
Forex Today: Markets’ attention shifts to data and Fedspeak
Federal Reserve Chairman Jerome Powell acknowledged the recent progress on inflation on Monday. He was followed by a less important statement from San Francisco Fed President Mary Daly. Both key Fed policymakers emphasized that there is no fixed guidance on when Fed rate cuts will happen and that decisions will be made on a meeting-by-meeting basis.
Read more:
Fed's Powell: Decisions to be made on a meeting-by-meeting basis
Fed's Daly: Confidence is growing that inflation is heading lower
According to the CME’s FedWatch Tool, the market is expecting a rate cut in September. Rate traders are now pricing in a 100% chance that the Fed funds rate will decline by at least 25 basis points when the Federal Open Market Committee (FOMC) meets on September 18.
The upcoming US Retail Sales data release on Tuesday will conclude the recent series of important US economic data releases. It is anticipated that there will be a continued slowdown in US economic activity, with US Retail Sales expected to remain unchanged at 0.0% month-over-month in June.
Euro traders will be buckling down for the wait to Thursday’s latest rate call from the European Central Bank (ECB). A follow-up rate cut to June’s quarter-point trim is anticipated, but not expected until September with a third 2024 rate cut penciled in for December. As noted by Pimco Executive Vice President and Portfolio Manager, Konstantin Veit pointed out that “the ECB has clearly signalled its preference to make interest rate decisions at forecast meetings, i.e. in September and December, and not in July, October or January".
EUR/USD technical outlook
Despite tipping into a fresh 16-week high on Monday, EUR/USD flubbed a challenge of the 1.0900 handle, easing back and leaving daily candlesticks mired in technical consolidation at the top end of a rough descending channel. Fiber ended a three-day winning streak, and is poised to tumble out of a bullish stance that dragged bids into the green for all but two of the last 12 consecutive trading days.
EUR/USD daily chart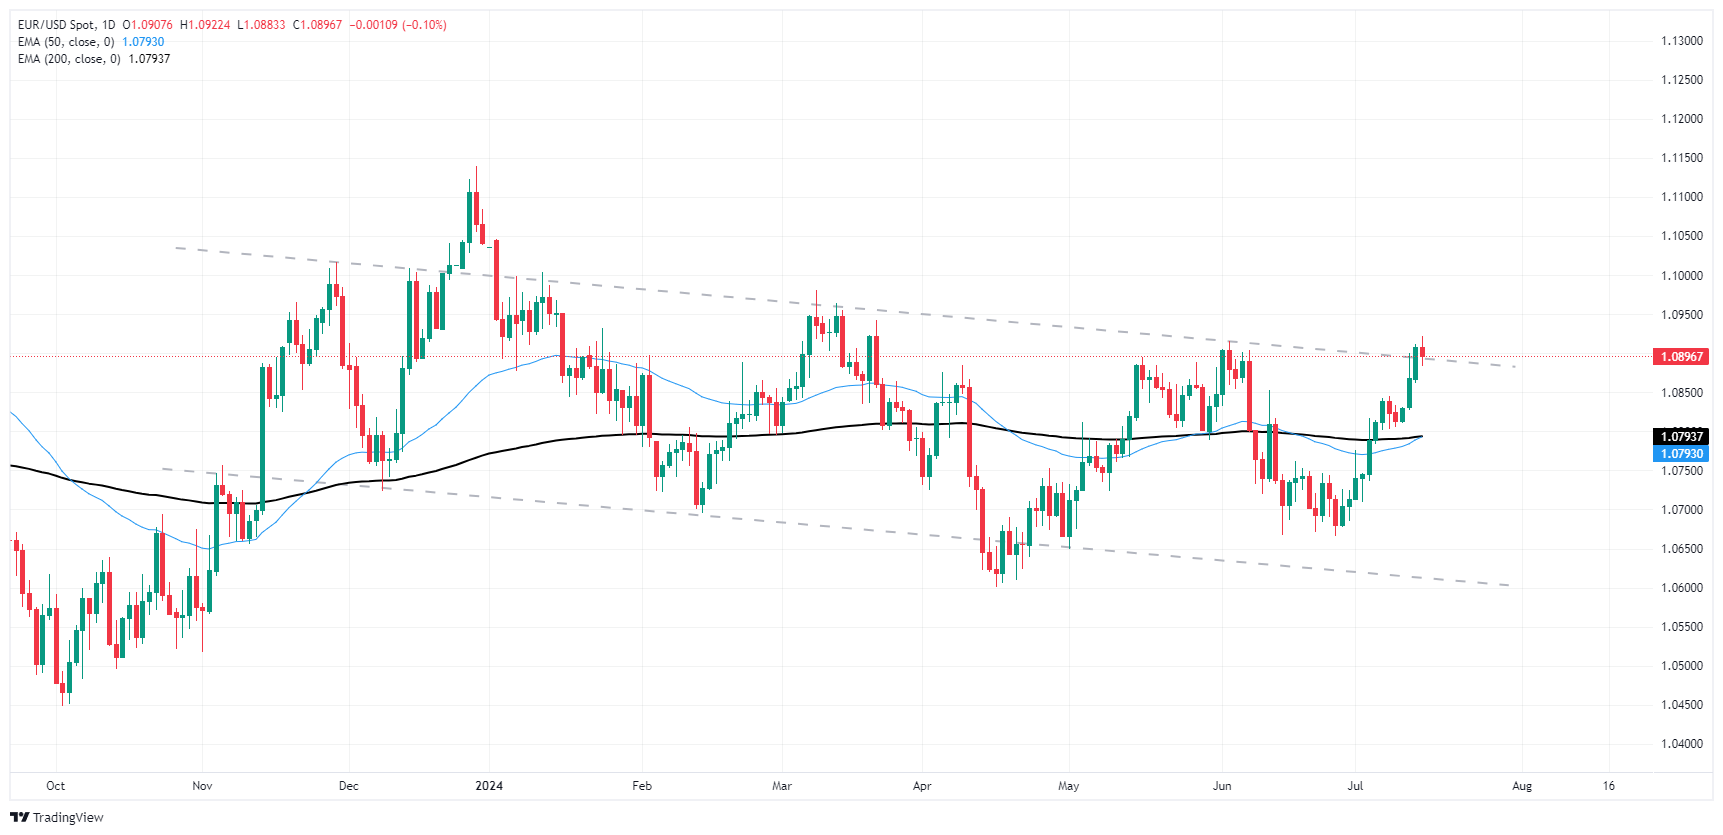
Euro FAQs
The Euro is the currency for the 20 European Union countries that belong to the Eurozone. It is the second most heavily traded currency in the world behind the US Dollar. In 2022, it accounted for 31% of all foreign exchange transactions, with an average daily turnover of over $2.2 trillion a day. EUR/USD is the most heavily traded currency pair in the world, accounting for an estimated 30% off all transactions, followed by EUR/JPY (4%), EUR/GBP (3%) and EUR/AUD (2%).
The European Central Bank (ECB) in Frankfurt, Germany, is the reserve bank for the Eurozone. The ECB sets interest rates and manages monetary policy. The ECB’s primary mandate is to maintain price stability, which means either controlling inflation or stimulating growth. Its primary tool is the raising or lowering of interest rates. Relatively high interest rates – or the expectation of higher rates – will usually benefit the Euro and vice versa. The ECB Governing Council makes monetary policy decisions at meetings held eight times a year. Decisions are made by heads of the Eurozone national banks and six permanent members, including the President of the ECB, Christine Lagarde.
Eurozone inflation data, measured by the Harmonized Index of Consumer Prices (HICP), is an important econometric for the Euro. If inflation rises more than expected, especially if above the ECB’s 2% target, it obliges the ECB to raise interest rates to bring it back under control. Relatively high interest rates compared to its counterparts will usually benefit the Euro, as it makes the region more attractive as a place for global investors to park their money.
Data releases gauge the health of the economy and can impact on the Euro. Indicators such as GDP, Manufacturing and Services PMIs, employment, and consumer sentiment surveys can all influence the direction of the single currency. A strong economy is good for the Euro. Not only does it attract more foreign investment but it may encourage the ECB to put up interest rates, which will directly strengthen the Euro. Otherwise, if economic data is weak, the Euro is likely to fall. Economic data for the four largest economies in the euro area (Germany, France, Italy and Spain) are especially significant, as they account for 75% of the Eurozone’s economy.
Another significant data release for the Euro is the Trade Balance. This indicator measures the difference between what a country earns from its exports and what it spends on imports over a given period. If a country produces highly sought after exports then its currency will gain in value purely from the extra demand created from foreign buyers seeking to purchase these goods. Therefore, a positive net Trade Balance strengthens a currency and vice versa for a negative balance.
- GBP/USD chilled a three-day win streak, kicks off new week with a cautious tone.
- Fedspeak drives broader market sentiment as investors hope for rate cuts.
- US Retail Sales, UK CPI inflation round the corner into the midweek.
GBP/USD took a breather from bullish momentum on Monday, pulling back just shy of the 1.3000 handle after FX markets took a break from Greenback selling to reconsider recent moves and re-weigh odds of a September rate cut from the US Federal Reserve (Fed).
Forex Today: Markets’ attention shifts to data and Fedspeak
Fedspeak dominated market focus to kick off the new trading week, with Fed Chairman Jerome Powell giving a nod of the head to recent progress on inflation. Fed Chair Powell was followed up by a low-impact appearance from San Francisco Fed President Mary Daly, and both key Fed policymakers reiterated a lack of forward guidance on the timing of Fed rate cuts, doubling down on how decisions would be made on a meeting-by-meeting basis.
Read more:
Fed's Powell: Decisions to be made on a meeting-by-meeting basis
Fed's Daly: Confidence is growing that inflation is heading lower
According to the CME’s FedWatch Tool, rate markets are pinning all of their hopes on a September rate cut. Rate markets have fully priced in a September rate trim, with 100% odds of at least a 25 basis point decline in the fed funds rate when the Federal Open Market Committee (FOMC) meets on September 18.
US Retail Sales on Tuesday will wrap up the recent bout of US key data releases from the past week, and markets are expecting a continued cooling in US activity data. US Retail Sales are forecast to flatten to 0.0.% MoM in June.
Early Wednesday will bring the latest iteration of UK Consumer Price Index (CPI) inflation, with MoM headline CPI inflation in June expected to tick down to 0.1% from 0.3%. After that will be UK labor and wages figures on Thursday, and Friday will wrap up the GBP’s representation on the economic data docket with UK Retail Sales.
GBP/USD technical outlook
Cable bidding took a break on Monday, snapping a three-day winning streak and etching in a thin bearish candle after the pair closed in the green for all but two of the previous 12 consecutive trading days. GBP/USD’s swing low towards 1.2600 in late June failed to pierce the major price handle, sending bullish bids higher, and Monday trading managed to eke out a fresh 12-month high at 1.29949 before pulling back and rotating lower just shy of the 1.3000 key price level.
GBP/USD daily chart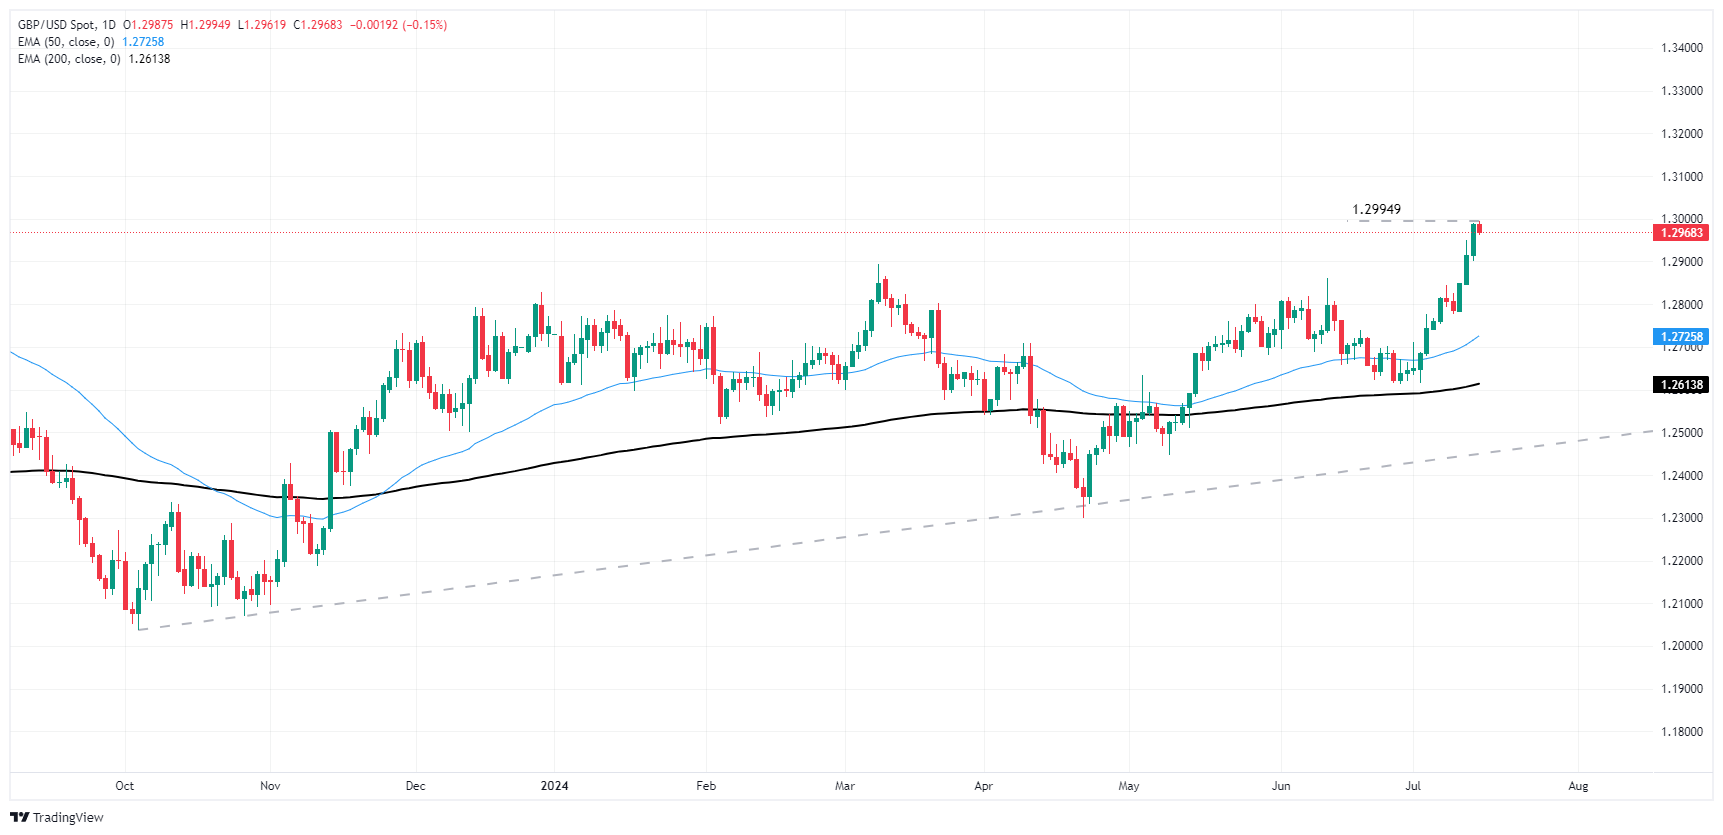
Pound Sterling FAQs
The Pound Sterling (GBP) is the oldest currency in the world (886 AD) and the official currency of the United Kingdom. It is the fourth most traded unit for foreign exchange (FX) in the world, accounting for 12% of all transactions, averaging $630 billion a day, according to 2022 data. Its key trading pairs are GBP/USD, aka ‘Cable’, which accounts for 11% of FX, GBP/JPY, or the ‘Dragon’ as it is known by traders (3%), and EUR/GBP (2%). The Pound Sterling is issued by the Bank of England (BoE).
The single most important factor influencing the value of the Pound Sterling is monetary policy decided by the Bank of England. The BoE bases its decisions on whether it has achieved its primary goal of “price stability” – a steady inflation rate of around 2%. Its primary tool for achieving this is the adjustment of interest rates. When inflation is too high, the BoE will try to rein it in by raising interest rates, making it more expensive for people and businesses to access credit. This is generally positive for GBP, as higher interest rates make the UK a more attractive place for global investors to park their money. When inflation falls too low it is a sign economic growth is slowing. In this scenario, the BoE will consider lowering interest rates to cheapen credit so businesses will borrow more to invest in growth-generating projects.
Data releases gauge the health of the economy and can impact the value of the Pound Sterling. Indicators such as GDP, Manufacturing and Services PMIs, and employment can all influence the direction of the GBP. A strong economy is good for Sterling. Not only does it attract more foreign investment but it may encourage the BoE to put up interest rates, which will directly strengthen GBP. Otherwise, if economic data is weak, the Pound Sterling is likely to fall.
Another significant data release for the Pound Sterling is the Trade Balance. This indicator measures the difference between what a country earns from its exports and what it spends on imports over a given period. If a country produces highly sought-after exports, its currency will benefit purely from the extra demand created from foreign buyers seeking to purchase these goods. Therefore, a positive net Trade Balance strengthens a currency and vice versa for a negative balance.
- USD/CAD trades flat with mild losses near 1.3680 in Tuesday’s early Asian session.
- Fed’s Powell said the central bank will not wait until inflation hits 2% to cut interest rates.
- Lower crude oil prices weigh on the commodity-link CAD.
The USD/CAD pair consolidates its gains around 1.3680 during the early Asian session on Tuesday. The Greenback recovers some lost ground as traders await the Canadian Consumer Price Index (CPI) inflation data and US Retail Sales on Tuesday for fresh impetus. Also, Federal Reserve’s (Fed) Adriana Kugler is set to speak.
Fed Chair Jerome Powell said on Monday that the US has performed remarkably well in recent years, adding that the central bank won't be waiting until inflation reaches the 2% annual target. Meanwhile, Fed Bank of San Francisco President Mary Daly did not provide time-based rate cut guidance, but acknowledged significant progress on inflation.
The odds for Fed rate cuts in September increase after the cooler US inflation data last week, which might weigh on the US Dollar (USD). Traders continue to anticipate a September rate cut followed by further cuts in November and December, bringing the policy rate down to 4.5%-4.75% by year-end.
On the other hand, the Bank of Canada (BoC) Business Outlook Survey on Monday showed that business and consumer expectations for inflation are subdued. “By in large, all of the data or most of the data that is included in that report could be used by Bank of Canada later this month in order to cut rates by a further 25 basis points,” David Doyle, managing director and head of economics at Macquarie Group, said. Meanwhile, the fall of crude oil prices might drag the commodity-linked Canadian Dollar (CAD) lower and cap the pair’s downside as Canada is the major crude oil exporter to the United States.
Canadian Dollar FAQs
The key factors driving the Canadian Dollar (CAD) are the level of interest rates set by the Bank of Canada (BoC), the price of Oil, Canada’s largest export, the health of its economy, inflation and the Trade Balance, which is the difference between the value of Canada’s exports versus its imports. Other factors include market sentiment – whether investors are taking on more risky assets (risk-on) or seeking safe-havens (risk-off) – with risk-on being CAD-positive. As its largest trading partner, the health of the US economy is also a key factor influencing the Canadian Dollar.
The Bank of Canada (BoC) has a significant influence on the Canadian Dollar by setting the level of interest rates that banks can lend to one another. This influences the level of interest rates for everyone. The main goal of the BoC is to maintain inflation at 1-3% by adjusting interest rates up or down. Relatively higher interest rates tend to be positive for the CAD. The Bank of Canada can also use quantitative easing and tightening to influence credit conditions, with the former CAD-negative and the latter CAD-positive.
The price of Oil is a key factor impacting the value of the Canadian Dollar. Petroleum is Canada’s biggest export, so Oil price tends to have an immediate impact on the CAD value. Generally, if Oil price rises CAD also goes up, as aggregate demand for the currency increases. The opposite is the case if the price of Oil falls. Higher Oil prices also tend to result in a greater likelihood of a positive Trade Balance, which is also supportive of the CAD.
While inflation had always traditionally been thought of as a negative factor for a currency since it lowers the value of money, the opposite has actually been the case in modern times with the relaxation of cross-border capital controls. Higher inflation tends to lead central banks to put up interest rates which attracts more capital inflows from global investors seeking a lucrative place to keep their money. This increases demand for the local currency, which in Canada’s case is the Canadian Dollar.
Macroeconomic data releases gauge the health of the economy and can have an impact on the Canadian Dollar. Indicators such as GDP, Manufacturing and Services PMIs, employment, and consumer sentiment surveys can all influence the direction of the CAD. A strong economy is good for the Canadian Dollar. Not only does it attract more foreign investment but it may encourage the Bank of Canada to put up interest rates, leading to a stronger currency. If economic data is weak, however, the CAD is likely to fall.
Federal Reserve (Fed) Bank of San Francisco President Mary Daly refused to give time-based guidance on the Fed's likely pace of rate cuts but acknowledged that significant progress has been on inflation.
Key highlights
Sees growing confidence in nearing 2% inflation goal.
More information needed before making rate decision.
Not going to provide time-based rate cut guidance.
Sees progress towards goals, but not yet achieved.
- WTI tested back underneath $81.00 as Crude Oil markets wobble.
- Forecasts of Chinese Crude Oil demand have flipped from hopeful to fearful.
- OPEC+ production cuts set to begin ending at the end of September.
West Texas Intermediate (WTI) Crude Oil tested into the south end of the $81.00 handle on Monday as Crude Oil’s bullish break out of recent consolidation fizzles out. Barrel bids have been left within near-term consolidation levels, and global energy markets are running out of far-flung reasons to keep Crude Oil prices on the high end.
China reported a slowdown in quarterly Gross Domestic Product (GDP) growth recently, sparking fears that an upswing in Chinese Crude Oil demand, which has helped bolster Crude Oil prices through most of 2024, has given way to a feared slump in Chinese Crude Oil demand. WTI prices stopped just short of $84.00 per barrel in July before reversing direction and easing lower after it became clear that the uptick in Chinese fossil field demand markets spent over six months waiting for failed to materialize. Energy markets are now concerned that a steep decline in growth in China could cause barrel demand to fall even further.
The Organization of the Petroleum Exporting Countries (OPEC) and its extended non-member ally network, OPEC+, is still on pace to begin ending long-standing voluntary production cuts at the end of September. The production cuts, meant to prop up floundering Crude Oil prices, are facing increasingly stiff opposition within OPEC+ as the small-scale countries shouldering the burden of voluntarily pumping less Crude Oil than possible rely on market participation to balance government budgets.
WTI technical outlook
WTI US Crude Oil is back to batting the $81.00 price handle, a key inflection point, after a failed bullish break out of recent consolidation. Price action holds above the 200-day Exponential Moving Average (EMA) near $79.27, and short pressure could see an extended backslide towards early June’s bottom bids near $72.45.
WTI daily chart
WTI Oil FAQs
WTI Oil is a type of Crude Oil sold on international markets. The WTI stands for West Texas Intermediate, one of three major types including Brent and Dubai Crude. WTI is also referred to as “light” and “sweet” because of its relatively low gravity and sulfur content respectively. It is considered a high quality Oil that is easily refined. It is sourced in the United States and distributed via the Cushing hub, which is considered “The Pipeline Crossroads of the World”. It is a benchmark for the Oil market and WTI price is frequently quoted in the media.
Like all assets, supply and demand are the key drivers of WTI Oil price. As such, global growth can be a driver of increased demand and vice versa for weak global growth. Political instability, wars, and sanctions can disrupt supply and impact prices. The decisions of OPEC, a group of major Oil-producing countries, is another key driver of price. The value of the US Dollar influences the price of WTI Crude Oil, since Oil is predominantly traded in US Dollars, thus a weaker US Dollar can make Oil more affordable and vice versa.
The weekly Oil inventory reports published by the American Petroleum Institute (API) and the Energy Information Agency (EIA) impact the price of WTI Oil. Changes in inventories reflect fluctuating supply and demand. If the data shows a drop in inventories it can indicate increased demand, pushing up Oil price. Higher inventories can reflect increased supply, pushing down prices. API’s report is published every Tuesday and EIA’s the day after. Their results are usually similar, falling within 1% of each other 75% of the time. The EIA data is considered more reliable, since it is a government agency.
OPEC (Organization of the Petroleum Exporting Countries) is a group of 13 Oil-producing nations who collectively decide production quotas for member countries at twice-yearly meetings. Their decisions often impact WTI Oil prices. When OPEC decides to lower quotas, it can tighten supply, pushing up Oil prices. When OPEC increases production, it has the opposite effect. OPEC+ refers to an expanded group that includes ten extra non-OPEC members, the most notable of which is Russia.
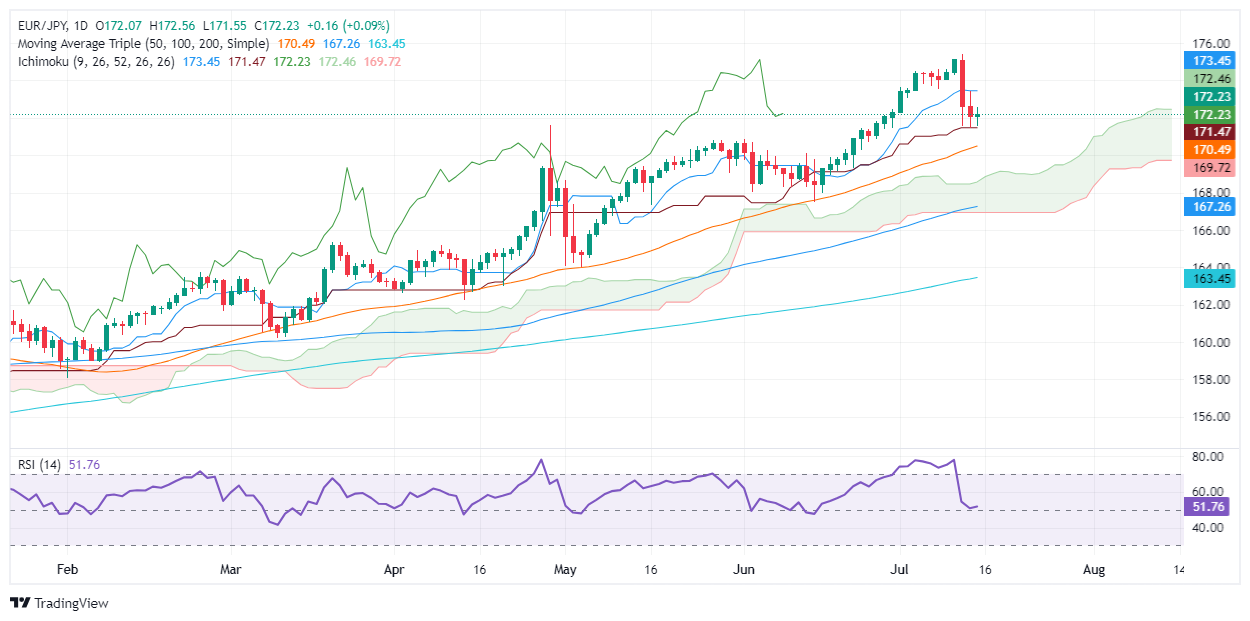
- EUR/JPY edges down 0.03%, pressured by suspected last week FX intervention.
- Technical outlook remains upward as price action stays above the Ichimoku Cloud.
- Key supports at 172.00, 171.58, and 170.56; resistance levels at 172.45 and 173.43.
The EUR/JPY remains under pressure for the third straight day after Japanese authorities intervened in the FX space last Thursday, although policymakers have not confirmed this. The cross-pair trades at 172.12, down 0.03%.
EUR/JPY Price Analysis: Technical outlook
From a daily chart perspective, the pair is upward biased as price action stills above the Ichimoku Cloud (Kumo) and a series of successive higher highs and lows, which could pave the way for further upside.
As measured by the Relative Strength Index (RSI), the momentum suggests that sellers had stepped in firmly, as the RSI hovers around the 50-neutral line, following a steep fall.
Given the backdrop, the EUR/JPY could consolidate in the short term. If the pair falls below 172.00, that can pave the way for further loss. The following support would be Kijun-Sen at 171.58, ahead of the 50-day moving average (DMA) at 170.56, ahead of the psychological 170.00 figure, ahead of the Senkou Span B at 169.92.
On further strength, the EUR/JPY first resistance would be the Senkou Span A at 172.45 before testing the Tenkan-Sen at 173.43.
EUR/JPY Price Action – Daily Chart
Euro FAQs
The Euro is the currency for the 20 European Union countries that belong to the Eurozone. It is the second most heavily traded currency in the world behind the US Dollar. In 2022, it accounted for 31% of all foreign exchange transactions, with an average daily turnover of over $2.2 trillion a day. EUR/USD is the most heavily traded currency pair in the world, accounting for an estimated 30% off all transactions, followed by EUR/JPY (4%), EUR/GBP (3%) and EUR/AUD (2%).
The European Central Bank (ECB) in Frankfurt, Germany, is the reserve bank for the Eurozone. The ECB sets interest rates and manages monetary policy. The ECB’s primary mandate is to maintain price stability, which means either controlling inflation or stimulating growth. Its primary tool is the raising or lowering of interest rates. Relatively high interest rates – or the expectation of higher rates – will usually benefit the Euro and vice versa. The ECB Governing Council makes monetary policy decisions at meetings held eight times a year. Decisions are made by heads of the Eurozone national banks and six permanent members, including the President of the ECB, Christine Lagarde.
Eurozone inflation data, measured by the Harmonized Index of Consumer Prices (HICP), is an important econometric for the Euro. If inflation rises more than expected, especially if above the ECB’s 2% target, it obliges the ECB to raise interest rates to bring it back under control. Relatively high interest rates compared to its counterparts will usually benefit the Euro, as it makes the region more attractive as a place for global investors to park their money.
Data releases gauge the health of the economy and can impact on the Euro. Indicators such as GDP, Manufacturing and Services PMIs, employment, and consumer sentiment surveys can all influence the direction of the single currency. A strong economy is good for the Euro. Not only does it attract more foreign investment but it may encourage the ECB to put up interest rates, which will directly strengthen the Euro. Otherwise, if economic data is weak, the Euro is likely to fall. Economic data for the four largest economies in the euro area (Germany, France, Italy and Spain) are especially significant, as they account for 75% of the Eurozone’s economy.
Another significant data release for the Euro is the Trade Balance. This indicator measures the difference between what a country earns from its exports and what it spends on imports over a given period. If a country produces highly sought after exports then its currency will gain in value purely from the extra demand created from foreign buyers seeking to purchase these goods. Therefore, a positive net Trade Balance strengthens a currency and vice versa for a negative balance.
- Monday's session saw a further 0.45% decline in the NZD/JPY pair, reinforcing the bearish momentum.
- The cross extends its losses, marking a four-day bearish streak with a cumulative drop of more than 2.50% since last week.
- Indicators increasingly burrow into the negative zone, edging dangerously close to oversold conditions.
On Monday, the NZD/JPY registered a substantial decline of 0.45% to end at 96.15. This led the cross to culminate a quadruple daily loss, sparking off from last week. The net plummet has thus far exceeded 2.50%.
The daily technical signals continue to display unabated negative conditions. The Relative Strength Index (RSI), currently at 36, has tanked further and the Moving Average Convergence Divergence (MACD) concurs with this scenario by demonstrating growing selling activity with the printing of ascending red bars.
NZD/JPY daily chart
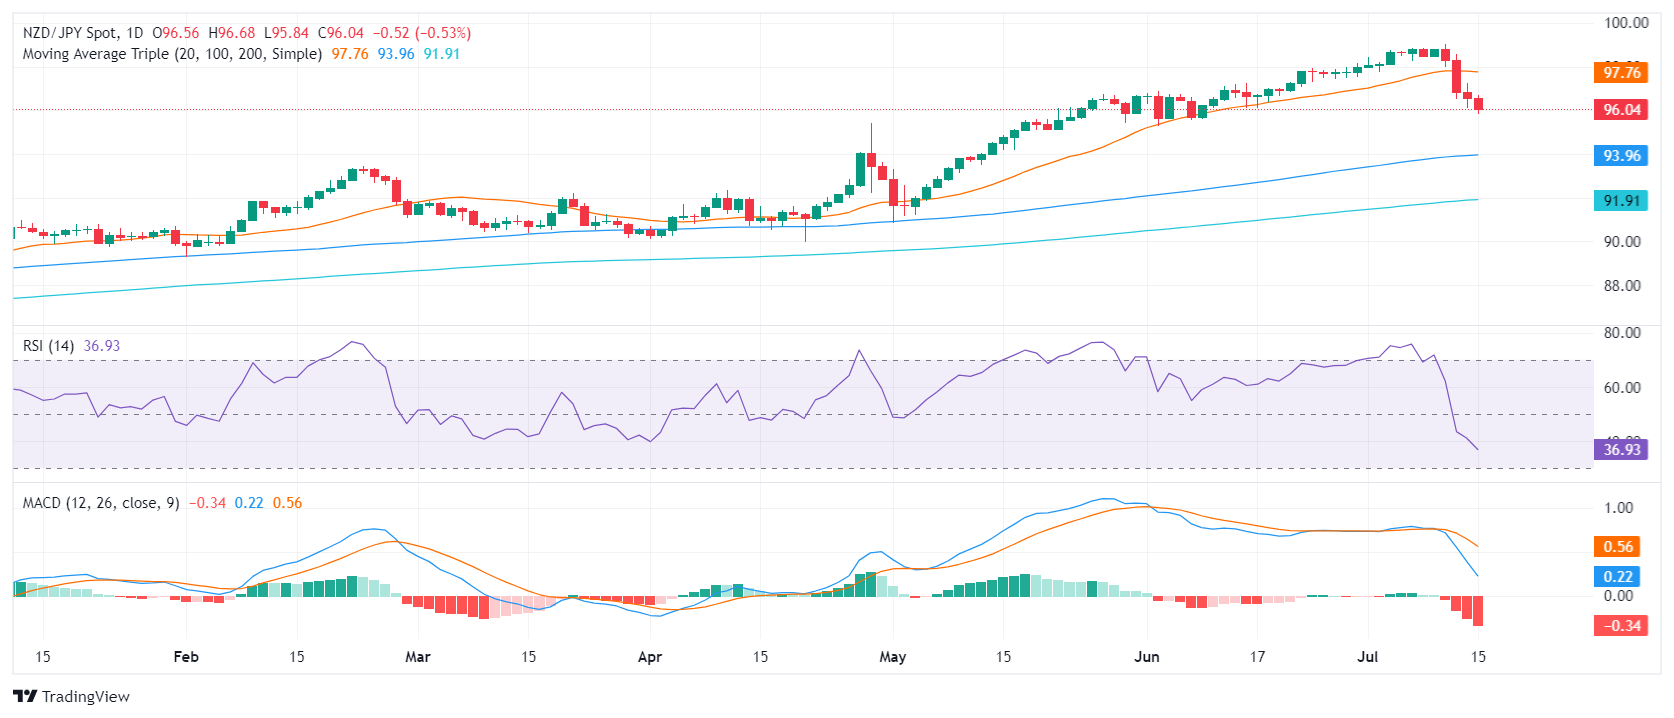
Given the intensified bearish conditions, immediate support levels are found at 96.00 and 95.50. A breach below these levels, especially the potent support at 95.50, would further validate and confirm the bearish perspective. Conversely, levels of resistance are now situated at the former support thresholds of 97.00, the 20-day Simple Moving Average (SMA) at 97.70, and the critical level of 98.00.
- AUD/JPY slips towards 106.90, breaching the 20-day SMA support.
- A bearish sentiment is projected for the next few session, continuing the downtrend from last week.
In Monday's trading session, the AUD/JPY pair noted a further decline of 0.15% to fall to 106.90. This continues the observable trend from last week Thursday's session which saw a significant drop from above 109.00. The present conditions point towards a bearish outlook for the forthcoming sessions as sellers appear to continue their dominance.
The daily Relative Strength Index (RSI) for the AUD/JPY pair currently reads 53, showing a marginal plunge from last week’s high of 80, slowly pushing toward the bearish zone. Despite this shift, the market seems to retain its neutral stance as it remains in positive territory. Complementing this, the daily Moving Average Convergence Divergence (MACD) shows rising red bars, indicating potential weakness.
AUD/JPY daily chart
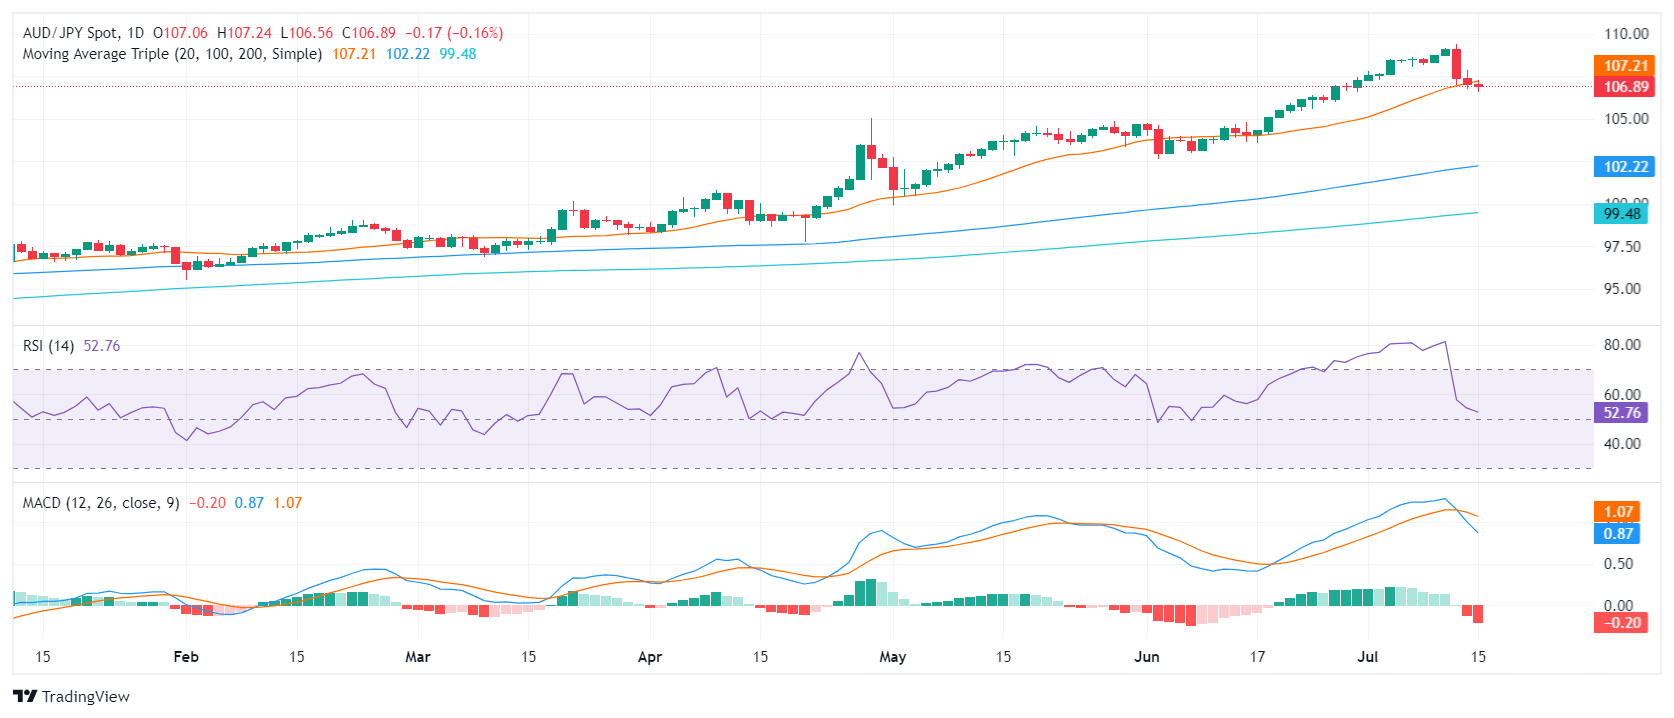
From a broader viewpoint, the AUD/JPY pair hints at a bearish sentiment, especially considering its position below the 20-day SMA support. Should further downward movement occur, the immediate support levels at 106.50 and 106.00 are pivotal marks to consider. Conversely, to mitigate further potential losses, buyers must aim to surpass the 107.00 level (20-day SMA) and aim towards the 108.00 barrier to signal recovery.
- Silver holds near familiar levels, trading at $30.69 with minimal losses of 0.28%.
- Technical analysis suggests possible pullback below $30.50 before resuming the uptrend.
- Key resistance levels at $31.00 and $31.75, with potential to reach YTD high of $32.51.
Silver prices remained at familiar levels on Monday, printing minimal losses of 0.28% as US Treasury bond yields from the belly and long-end curve edged higher. At the time of writing, the XAG/USD traded at $30.69 after hitting daily highs of $31.08 a troy ounce.
XAG/USD Price Analysis: Technical outlook
Silver consolidates beneath $31.00, though hovering around the ‘double bottom’ chart pattern neckline.
Momentum remains flat as measured by the Relative Strength Index (RSI), which aimed lower but stood in bullish territory. Hence, XAG/USD could be headed for a pullback before the uptrend continues.
If XAG/USD drops below the psychological $30.50 level, it could drive the spot price toward $30.00. Once cleared, the next target would be the confluence of the April 12 high and the 50-day moving average (DMA) at $29.82/79.
On the flip side, the first resistance for XAG/USD would be at $31.00. Once this is cleared, the next resistance would be at $31.75, followed by the $32.00 psychological level. Surpassing this, the May 29 peak of $32.15 comes into focus, ahead of the year-to-date (YTD) high of $32.51. Further gains are anticipated above this level.
XAG/USD Price Action – Daily Chart

Silver FAQs
Silver is a precious metal highly traded among investors. It has been historically used as a store of value and a medium of exchange. Although less popular than Gold, traders may turn to Silver to diversify their investment portfolio, for its intrinsic value or as a potential hedge during high-inflation periods. Investors can buy physical Silver, in coins or in bars, or trade it through vehicles such as Exchange Traded Funds, which track its price on international markets.
Silver prices can move due to a wide range of factors. Geopolitical instability or fears of a deep recession can make Silver price escalate due to its safe-haven status, although to a lesser extent than Gold's. As a yieldless asset, Silver tends to rise with lower interest rates. Its moves also depend on how the US Dollar (USD) behaves as the asset is priced in dollars (XAG/USD). A strong Dollar tends to keep the price of Silver at bay, whereas a weaker Dollar is likely to propel prices up. Other factors such as investment demand, mining supply – Silver is much more abundant than Gold – and recycling rates can also affect prices.
Silver is widely used in industry, particularly in sectors such as electronics or solar energy, as it has one of the highest electric conductivity of all metals – more than Copper and Gold. A surge in demand can increase prices, while a decline tends to lower them. Dynamics in the US, Chinese and Indian economies can also contribute to price swings: for the US and particularly China, their big industrial sectors use Silver in various processes; in India, consumers’ demand for the precious metal for jewellery also plays a key role in setting prices.
Silver prices tend to follow Gold's moves. When Gold prices rise, Silver typically follows suit, as their status as safe-haven assets is similar. The Gold/Silver ratio, which shows the number of ounces of Silver needed to equal the value of one ounce of Gold, may help to determine the relative valuation between both metals. Some investors may consider a high ratio as an indicator that Silver is undervalued, or Gold is overvalued. On the contrary, a low ratio might suggest that Gold is undervalued relative to Silver.
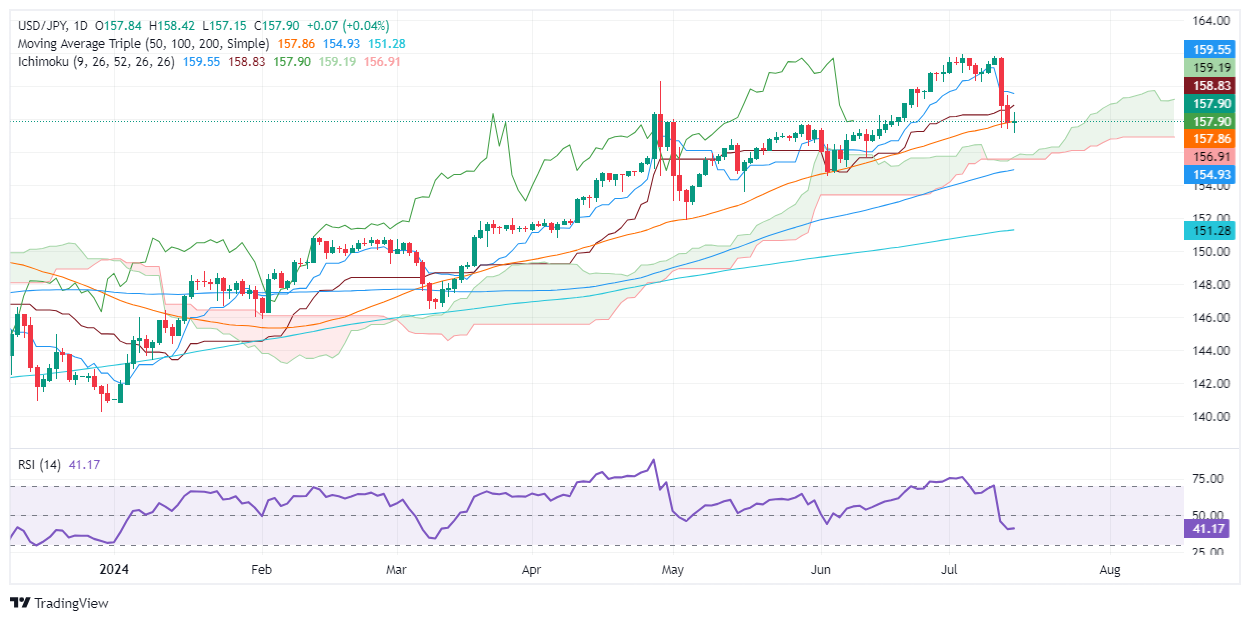
- USD/JPY minimal losses of 0.02% but holds below key 158.00 level.
- Momentum shifts to sellers, with RSI indicating a neutral to bearish bias.
- Key support levels at 157.14 and 156.91 could lead to further declines below 155.60.
The USD/JPY trades had minimal losses of 0.02%, yet they recovered some ground late in the North American session. The major exchanges hands at 157.94, below the 158.00 figure, following last week’s intervention that dragged the pair from around 161.90 toward 157.50.
USD/JPY Price Analysis: Technical outlook
Although the USD/JPY price action remains above the Ichimoku Cloud (Kumo), indicating that the uptrend remains intact, the pair trades below the Tenkan and Kijun-Sen, breaching the Senkou Span A previous support turning resistance.
Momentum has shifted in the seller's favor, as depicted by the Relative Strength Index (RSI), hinting that the pair is neutral to bearishly biased.
Given the backdrop, the USD/JPY path of least resistance is downwards. Therefore, the USD/JPY's first support would be the July 15 low of 157.14. Once surpassed, the next support would be the Senkou Span B at 156.91, before cracking the Kumo, pushing the exchange rate below 155.60.
Conversely, if USD/JPY climbs past the 158.00 mark and extends its rally above the July 12 high of 159.45, that would pave the way for a challenge of 160.00.
USD/JPY Price Action – Daily Chart
Japanese Yen FAQs
The Japanese Yen (JPY) is one of the world’s most traded currencies. Its value is broadly determined by the performance of the Japanese economy, but more specifically by the Bank of Japan’s policy, the differential between Japanese and US bond yields, or risk sentiment among traders, among other factors.
One of the Bank of Japan’s mandates is currency control, so its moves are key for the Yen. The BoJ has directly intervened in currency markets sometimes, generally to lower the value of the Yen, although it refrains from doing it often due to political concerns of its main trading partners. The current BoJ ultra-loose monetary policy, based on massive stimulus to the economy, has caused the Yen to depreciate against its main currency peers. This process has exacerbated more recently due to an increasing policy divergence between the Bank of Japan and other main central banks, which have opted to increase interest rates sharply to fight decades-high levels of inflation.
The BoJ’s stance of sticking to ultra-loose monetary policy has led to a widening policy divergence with other central banks, particularly with the US Federal Reserve. This supports a widening of the differential between the 10-year US and Japanese bonds, which favors the US Dollar against the Japanese Yen.
The Japanese Yen is often seen as a safe-haven investment. This means that in times of market stress, investors are more likely to put their money in the Japanese currency due to its supposed reliability and stability. Turbulent times are likely to strengthen the Yen’s value against other currencies seen as more risky to invest in.
- NZD/USD loses momentum, gets rejected by the 20-day SMA.
- Bulls struggle to claim control and get stuck in the 0.6070-0.6100 channel.
- Indicators paint a neutral to bearish picture on the daily chart.
In Monday's trading session, the NZD/USD showed weakened momentum, declining by 0.60% to 0.6080. Buyers found the 20-day Simple Moving Average (SMA) at around 0.6100, a strong resistance that quickly rejected the bullish force.
Daily technical indicators reflect a cautionary scenario for bullish traders. The Relative Strength Index (RSI) is currently at 46, a decrease from above 50 levels and now placing it in negative zone. This dip represents a decrease in buying pressure. On the contrary, the Moving Average Convergence Divergence (MACD) presents flat red bars, suggesting a somewhat stagnant bearish momentum.
NZD/USD daily chart
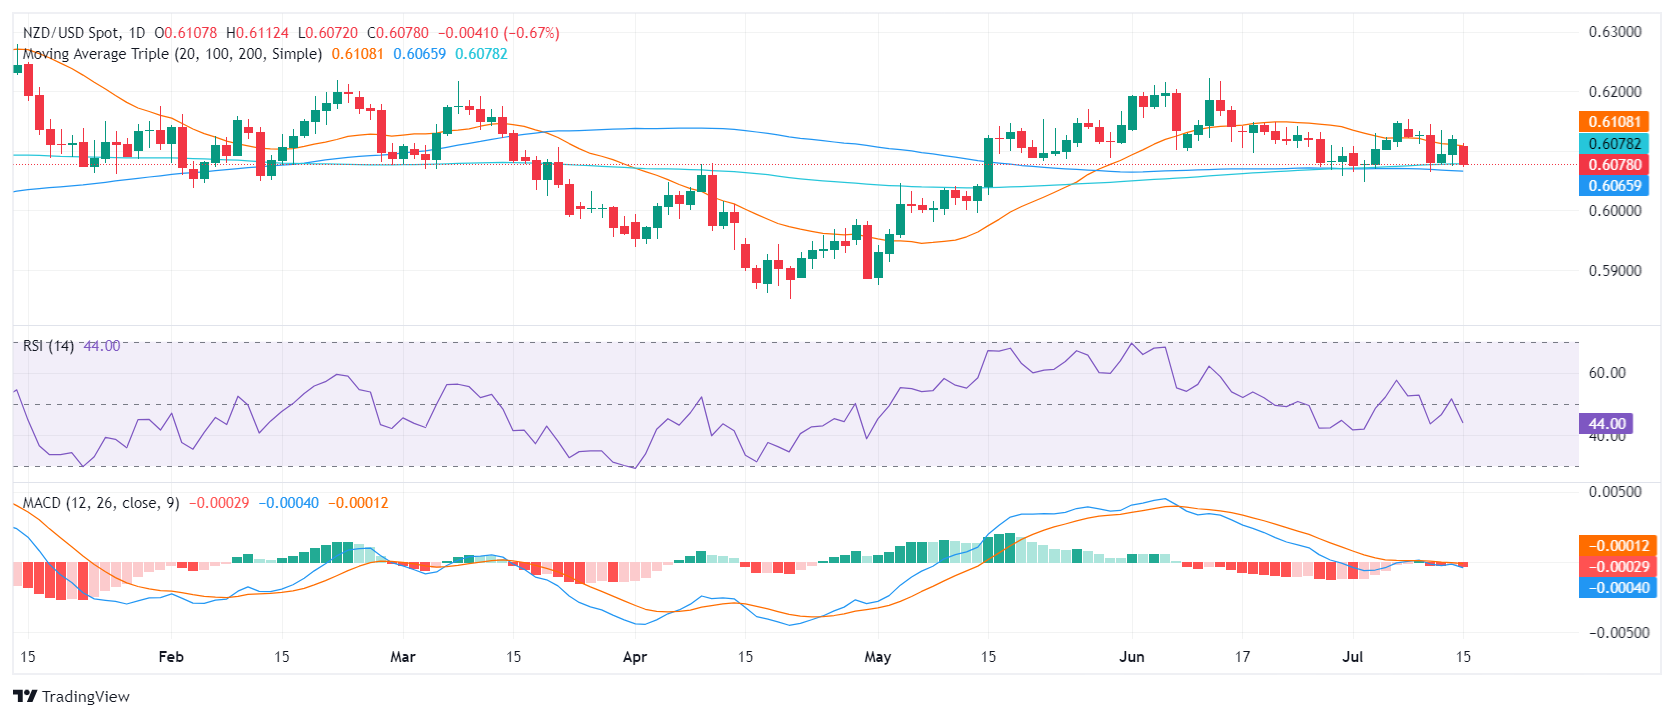
The bulls have got their work cut out as they face resistance at 0.6100 around the 20-day SMA, followed by the higher barriers at 0.6150 and 0.6200. A convincing close above these levels would be necessary to enforce bullish control and steer the focus northwards.
On the flip side, the 0.6070 mark acts as a staunch support, holding the line in the face of downward pressure, being closely trailed by further support lines at 0.6050 and 0.6030. A decisive plunge below these levels would indicate a shift back to a bearish perspective, potentially paving the way for a correction toward even lower levels.
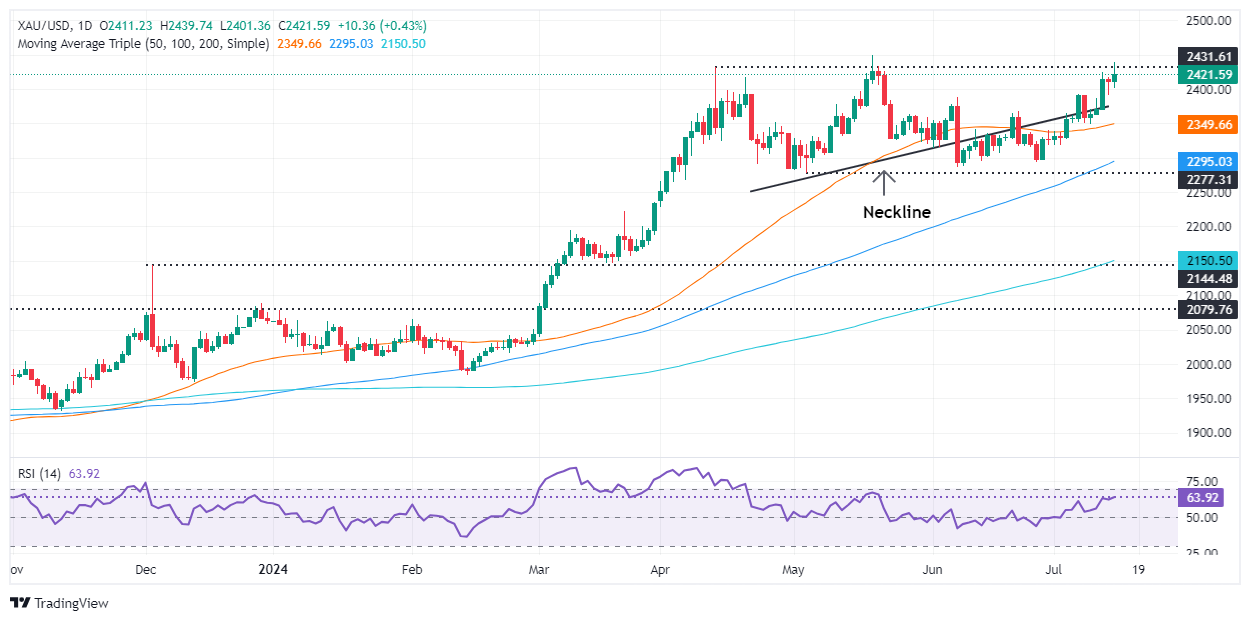
- Gold extends gains for a third week, rising 0.51% to $2,422.
- Fed Chair Powell's cautious comments on inflation and rate cuts subtly influence market sentiment.
- US Treasury yields increase, with the 10-year note up four basis points to 4.227%, amid expectations for a September rate cut.
Gold price advanced on Monday after achieving three weeks of consecutive gains, yet exchanges hands off daily high after the Federal Reserve Chairman Jerome Powell stuck to its rhetoric, failing to provide forward guidance. The XAU/USD trades at $2,422, up by 0.51%.
The yellow metal opened Monday’s session slightly lower following Trump’s assassination attack over the weekend, which bolstered his chances of winning November’s election. This boosted the Greenback, though worries faded, and the XAU/USD resumed its bullish trend, lifting Gold prices towards a multi-week high of $2,439.
In the meantime, Fed Chair Jerome Powell's appearance at The Economic Club of Economic Club was uneventful. He said the economy has performed “remarkably well” and added the labor market isn’t as tight as in the pandemic.
Powell added that the Fed will not wait until inflation reaches 2% to cut rates, though policymakers want to be confident that inflation is moving down.
Following Powell’s remarks, US Treasury bond yields edged higher in the belly and the long end of the curve. The US 10-year Treasury note is up four basis points (bps) at 4.227%.
According to the CME FedWatch Tool, traders are pricing a 98% chance that the Fed might cut rates a quarter of a percentage point in September.
Daily digest market movers: Gold price consolidates above $2,400
- Weaker than expected US Consumer Price Index (CPI) data, sponsored Gold’s leg-up above $2,400 as odds for Fed rate cuts increase as reflected by falling US Treasury bond yields.
- The US economic docket will feature Retail Sales, housing data, Initial Jobless Claims, and further Federal Reserve speakers.
- Meanwhile, the US Dollar Index (DXY), which tracks the Greenback against a basket of six currencies, is up more than 0.13% to 104.21.
- December 2024 fed funds rate futures contract implies that the Fed will ease policy by 53 basis points (bps) toward the end of the year, up from 50 last Friday.
- Bullion prices retreated slightly due to the People's Bank of China (PBoC) decision to halt gold purchases in June, as it did in May. By the end of June, China held 72.80 million troy ounces of the precious metal.
Technical analysis: Gold price remains bullish, despite buyers taking a respite
Gold price remains above $2,400, posting gains of a half-percent yet failing to remain near daily highs of $2,439. Momentum remains bullish, but near-term hints that buyers are taking a breather, as depicted by the Relative Strength Index (RSI) standing flat but bullish.
If XAU/USD edges above $2,439, that would pave the way to test the year-to-date (YTD) high of $2,450. Further gains are seen once cleared, with the $2,500 figure up next. Otherwise, if XAU/USD slumps below $2,400, the next floor will be the July 5 high at $2,392. If cleared, XAU/USD would continue to $2,350.
Gold FAQs
Gold has played a key role in human’s history as it has been widely used as a store of value and medium of exchange. Currently, apart from its shine and usage for jewelry, the precious metal is widely seen as a safe-haven asset, meaning that it is considered a good investment during turbulent times. Gold is also widely seen as a hedge against inflation and against depreciating currencies as it doesn’t rely on any specific issuer or government.
Central banks are the biggest Gold holders. In their aim to support their currencies in turbulent times, central banks tend to diversify their reserves and buy Gold to improve the perceived strength of the economy and the currency. High Gold reserves can be a source of trust for a country’s solvency. Central banks added 1,136 tonnes of Gold worth around $70 billion to their reserves in 2022, according to data from the World Gold Council. This is the highest yearly purchase since records began. Central banks from emerging economies such as China, India and Turkey are quickly increasing their Gold reserves.
Gold has an inverse correlation with the US Dollar and US Treasuries, which are both major reserve and safe-haven assets. When the Dollar depreciates, Gold tends to rise, enabling investors and central banks to diversify their assets in turbulent times. Gold is also inversely correlated with risk assets. A rally in the stock market tends to weaken Gold price, while sell-offs in riskier markets tend to favor the precious metal.
The price can move due to a wide range of factors. Geopolitical instability or fears of a deep recession can quickly make Gold price escalate due to its safe-haven status. As a yield-less asset, Gold tends to rise with lower interest rates, while higher cost of money usually weighs down on the yellow metal. Still, most moves depend on how the US Dollar (USD) behaves as the asset is priced in dollars (XAU/USD). A strong Dollar tends to keep the price of Gold controlled, whereas a weaker Dollar is likely to push Gold prices up.
The Greenback managed to regain some balance amidst the broad-based small pullback in the risk complex, as investors started to gear up for US data and the ECB interest rate decision.
Here is what you need to know on Tuesday, July 16:
The USD Index (DXY) reclaimed some ground lost and printed humble gains around the low-104.00s. The release of Retail Sales for the month of June will take centre stage on July 16 ahead of Business Inventories and the NAHB Housing Market Index. In addition, the Fed’s Kugler is due to speak.
EUR/USD came under some selling pressure soon after rising to fresh monthly highs around 1.0920. On July 16, the ECB will publish its Bank Lending Survey, seconded by the release of the Economic Sentiment tracked by the ZEW institute in the euro area and Germany.
GBP/USD gave away part of the recent strong gains, although a test of 1.3000 appears just around the corner. The UK docket is empty on July 16.
USD/JPY traded in an inconclusive fashion amidst modest gains in the greenback and mixed US yields. The Tertiary Industry Index is expected on July 16.
AUD/USD failed to retest the 0.6800 mark and retreated for the first time after four consecutive daily gains. There are no data releases scheduled in Oz on July 12.
Small gains in the greenback in combination with poor GDP data from China weighed on traders and dragged WTI prices below the $82.00 mark per barrel, or three-day lows.
Gold prices extended its march north and approached the area of record highs near $2,440 per ounce troy. Silver, on the other hand, added to Friday’s losses and retreated modestly to the vicinity of the $30.00 zone per ounce.
- AUD/USD shows a slight decrease on Monday but retains January highs near 0.6800.
- RBA's hawkish stance and potential rate hike add momentum to AUD.
- Australian labor data will dictate the short-term dynamics.
The Australian Dollar (AUD) experienced a mild correction against the USD in Monday's session, declining to 0.6760. After a four-day winning streak, the AUD adjusted its gains albeit the underlying fundamental factors hint at a possible continuation in the upward trend.
The Reserve Bank of Australia (RBA) despite several signs of economic weakness in the Australian economy, is viewed to be among the last G10 nations' central banks to initiate rate cuts due to stubbornly high inflation, a factor that might limit AUD's downside and extend its gains.
Daily market movers: AUD may gain as labor data may justify the RBA’s hawkish stance
- On the economic data front, investors are focusing on the Australian Employment data for June, which is due for publication on Thursday.
- The report is expected to show that 20K job-seekers were hired against 39.7K onboarded in May.
- The unemployment rate will be on the look and if it remains steady at 4.0%, it would indicate a strong labor market, hence, fuelling expectations of further policy-tightening by the Reserve Bank of Australia (RBA).
- According to recent market speculations, there is nearly a 50% chance of a rate hike in either September or November on the RBA's side.
- On the other hand, the market sees more than 80% odds of a September cut by the Federal Reserve, dependent of course on the incoming data. Key speeches by Powell on Monday, and other officials this week will provide more clarity.
Technical Analysis: AUD/USD sustains highs, overbought indicators hint at looming correction
Despite the mild correction on Monday, the AUD/USD maintains a bullish stance, retaining the heights seen since January. Parallelly, the pair climbed by more than 1.5% in July, suggesting a strong upward move. However, the Relative Strength Index (RSI) and the Moving Average Convergence Divergence (MACD) indicate nearing overbought territory and some exhaustion, suggesting a possible correction is on the horizon.
Buyers' target remains to maintain the 0.6760-0.6780 range and possibly surpass the 0.6800 area. Conversely, the 0.6730, 0.6700, and 0.6650 levels are set as the support ranges in case of a correction.
Australian Dollar FAQs
One of the most significant factors for the Australian Dollar (AUD) is the level of interest rates set by the Reserve Bank of Australia (RBA). Because Australia is a resource-rich country another key driver is the price of its biggest export, Iron Ore. The health of the Chinese economy, its largest trading partner, is a factor, as well as inflation in Australia, its growth rate and Trade Balance. Market sentiment – whether investors are taking on more risky assets (risk-on) or seeking safe-havens (risk-off) – is also a factor, with risk-on positive for AUD.
The Reserve Bank of Australia (RBA) influences the Australian Dollar (AUD) by setting the level of interest rates that Australian banks can lend to each other. This influences the level of interest rates in the economy as a whole. The main goal of the RBA is to maintain a stable inflation rate of 2-3% by adjusting interest rates up or down. Relatively high interest rates compared to other major central banks support the AUD, and the opposite for relatively low. The RBA can also use quantitative easing and tightening to influence credit conditions, with the former AUD-negative and the latter AUD-positive.
China is Australia’s largest trading partner so the health of the Chinese economy is a major influence on the value of the Australian Dollar (AUD). When the Chinese economy is doing well it purchases more raw materials, goods and services from Australia, lifting demand for the AUD, and pushing up its value. The opposite is the case when the Chinese economy is not growing as fast as expected. Positive or negative surprises in Chinese growth data, therefore, often have a direct impact on the Australian Dollar and its pairs.
Iron Ore is Australia’s largest export, accounting for $118 billion a year according to data from 2021, with China as its primary destination. The price of Iron Ore, therefore, can be a driver of the Australian Dollar. Generally, if the price of Iron Ore rises, AUD also goes up, as aggregate demand for the currency increases. The opposite is the case if the price of Iron Ore falls. Higher Iron Ore prices also tend to result in a greater likelihood of a positive Trade Balance for Australia, which is also positive of the AUD.
The Trade Balance, which is the difference between what a country earns from its exports versus what it pays for its imports, is another factor that can influence the value of the Australian Dollar. If Australia produces highly sought after exports, then its currency will gain in value purely from the surplus demand created from foreign buyers seeking to purchase its exports versus what it spends to purchase imports. Therefore, a positive net Trade Balance strengthens the AUD, with the opposite effect if the Trade Balance is negative.
- Dow Jones breached into a new all-time high of 40,346.22 on Monday.
- Fedspeak continues to dominate market attention as traders await cuts.
- Rate markets see 98% chance of September rate cut according to CME’s FedWatch.
The Dow Jones Industrial Average (DJIA) rallied into a new all-time peak on Monday, clipping into 40,346.22 before settling back into the day’s opening range near 40,200.00 as markets continue to weigh the odds of a future rate cut from the Federal Reserve (Fed). Fed Chairman Jerome Powell gave a nod of the head on Monday at recent progress on inflation data, helping to spark further hope for a September rate cut and prompting broad-market considerations of an even earlier cut in July.
Fed's Powell: Decisions to be made on a meeting-by-meeting basis
According to the CME’s FedWatch Tool, rate markets are pricing in 98% odds of at least a quarter-point rate trim to the fed funds rate when the Federal Open Market Committee (FOMC) meets on September 18. Interest rate traders broadly see the Fed holding steady when the FOMC meets later this month on July 31. Still, a few particularly rate-cut-hungry market participants are pricing in around 7% odds of an early quarter-point rate trim.
After a steep deceleration in Consumer Price Index (CPI) inflation last week which sparked a fresh rally in rate cut hopes, markets are shrugging off a concerning uptick in Producer Price Index (PPI) wholesale inflation. The next bout of US economic data to watch will be Tuesday’s US Retail Sales, which markets expect to flatten to 0.0% MoM in June compared to the previous month’s 0.1%.
Dow Jones news
The Dow Jones is one of the better-performing major equity indexes on Monday, climbing over 200 points bottom-to-top in Monday’s early surge before settling back into the day’s opening range near 40,200.00. Roughly half of the DJIA’s constituent securities are in the green for the day, with Caterpillar Inc. (CAT) climbing nearly 3% to $345.41 per share and is up a stellar 54% from its 52-week low of $223.76 set in November of last year.
Nike Inc. (NKE) is leading the losers to the bottom of the Dow Jones index, slumping -2.2% to $71.80 per share on Monday. Nike Inc. continues to bled investor interest after the company revised forward guidance sharply lower at the shoe manufacturer’s latest earnings reporting. Nike shares have tumbled -41% from last December’s peak of $123.39 per share, and has fallen below $72.00 per share for the first time since 2018.
Dow Jones technical outlook
The Dow Jones is holding close to the 40,200.00 handle on Monday after setting a fresh record high, and bidders are trying to keep price action propped up above the 40,000.00 major handle. Daily candlesticks continue to hold on the high side of the 200-day Exponential Moving Average (EMA) rising towards 38,000.00.
The Dow Jones has held on the bullish side of the long-term moving average since breaking north of the 200-day EMA back in early November, and the major equity index is up nearly 20% from last October’s bottom near 32,313.50.
Dow Jones five minute chart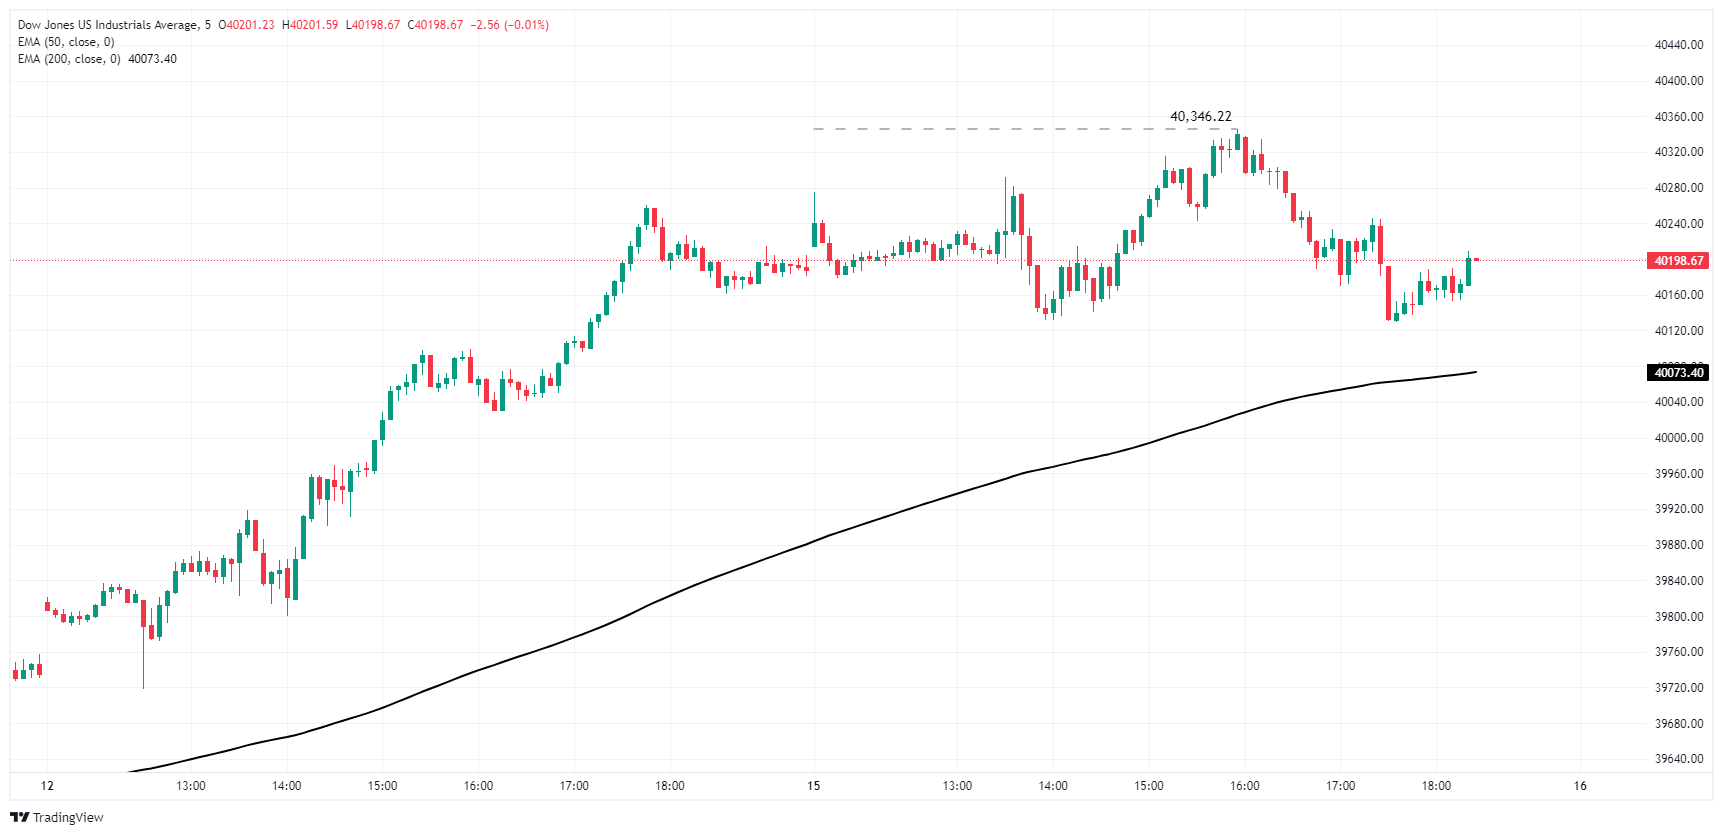
Dow Jones daily chart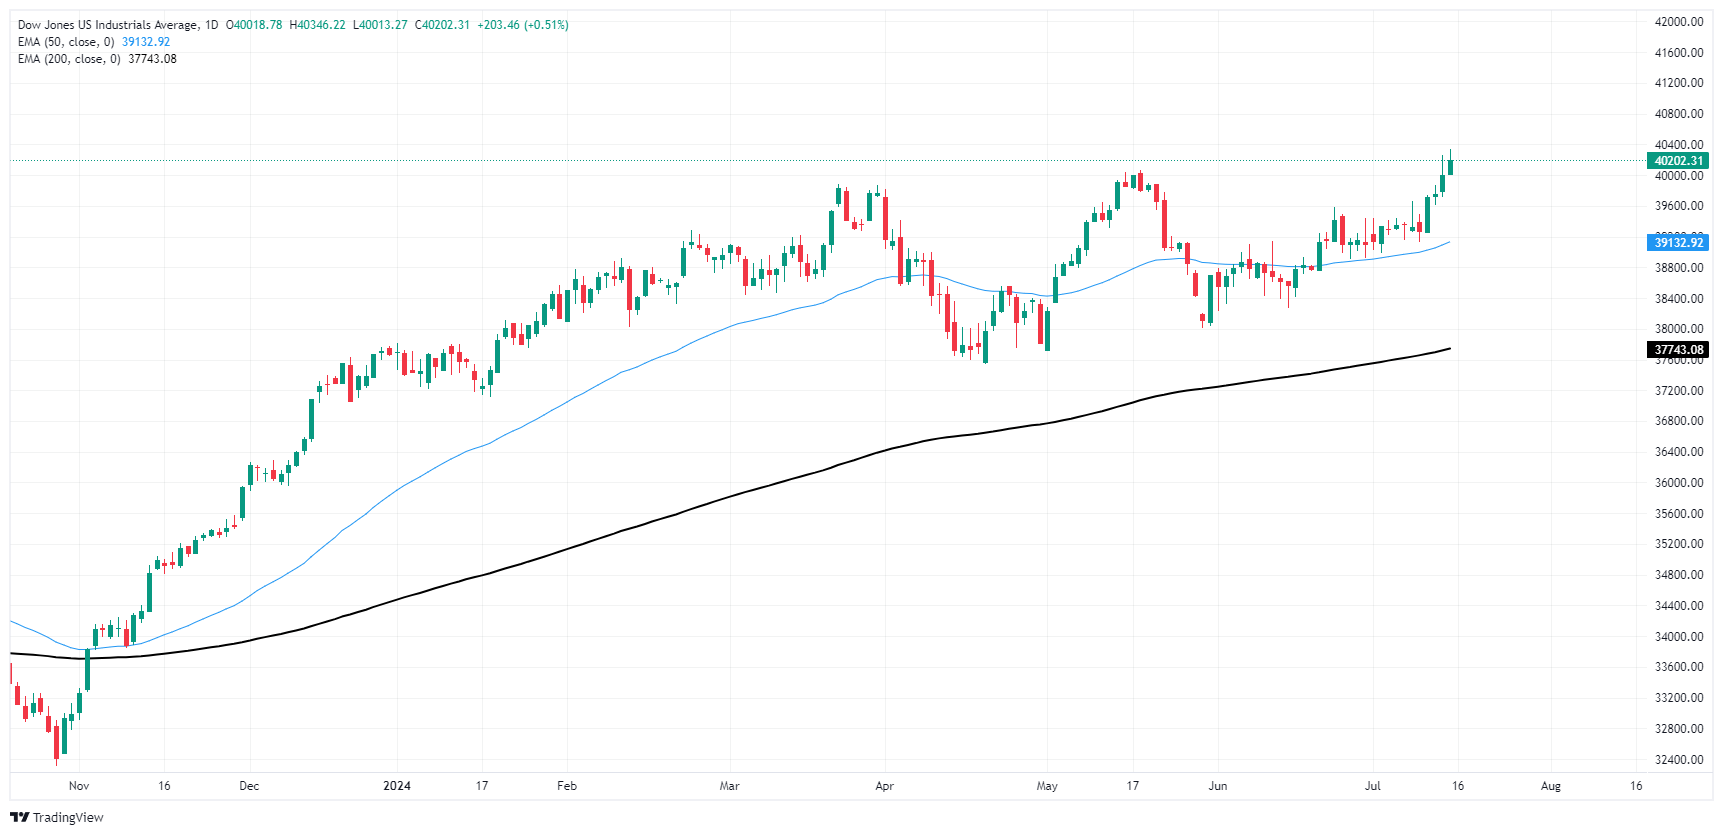
Dow Jones FAQs
The Dow Jones Industrial Average, one of the oldest stock market indices in the world, is compiled of the 30 most traded stocks in the US. The index is price-weighted rather than weighted by capitalization. It is calculated by summing the prices of the constituent stocks and dividing them by a factor, currently 0.152. The index was founded by Charles Dow, who also founded the Wall Street Journal. In later years it has been criticized for not being broadly representative enough because it only tracks 30 conglomerates, unlike broader indices such as the S&P 500.
Many different factors drive the Dow Jones Industrial Average (DJIA). The aggregate performance of the component companies revealed in quarterly company earnings reports is the main one. US and global macroeconomic data also contributes as it impacts on investor sentiment. The level of interest rates, set by the Federal Reserve (Fed), also influences the DJIA as it affects the cost of credit, on which many corporations are heavily reliant. Therefore, inflation can be a major driver as well as other metrics which impact the Fed decisions.
Dow Theory is a method for identifying the primary trend of the stock market developed by Charles Dow. A key step is to compare the direction of the Dow Jones Industrial Average (DJIA) and the Dow Jones Transportation Average (DJTA) and only follow trends where both are moving in the same direction. Volume is a confirmatory criteria. The theory uses elements of peak and trough analysis. Dow’s theory posits three trend phases: accumulation, when smart money starts buying or selling; public participation, when the wider public joins in; and distribution, when the smart money exits.
There are a number of ways to trade the DJIA. One is to use ETFs which allow investors to trade the DJIA as a single security, rather than having to buy shares in all 30 constituent companies. A leading example is the SPDR Dow Jones Industrial Average ETF (DIA). DJIA futures contracts enable traders to speculate on the future value of the index and Options provide the right, but not the obligation, to buy or sell the index at a predetermined price in the future. Mutual funds enable investors to buy a share of a diversified portfolio of DJIA stocks thus providing exposure to the overall index.
- Mexican Peso drops more than 1% after Trump assassination attempt news shakes markets.
- US Dollar Index climbs to 104.18, reflecting increased demand for safe-haven assets.
- Banxico's interest rate discussions in focus as political developments heighten market volatility.
The Mexican Peso begins the week on the back foot, losing more than 1% in early trading on Monday amid risk aversion following an assassination attempt on former US President Donald Trump during a rally in Pennsylvania. Therefore, the USD/MXN advances steadily and trades at 17.80 after bouncing off last week’s lows of 17.60.
Over the weekend, political developments in the United States (US) grabbed the headlines. After Trump’s attack, his odds of getting back to the White House increased, spurring flows to safety and underpinning the Greenback. The US Dollar Index (DXY), which tracks the buck's performance against the other six currencies, rose 0.10% to 104.18.
Mexico’s economic docket will be absent during the week, resuming on July 22, when the National Statistics Agency (INEGI) reveals growth figures for the month of May. Nevertheless, Bank of Mexico (Banxico) policymakers and political developments could rock the boat.
Banxico’s Deputy Governor Omar Mejia Castelazo's recent comments on interest rates have sparked significant interest in the financial markets. Mejia, who was the sole dissenter in Banxico’s June 27 monetary policy decision, advocating for a quarter of a percentage rate cut, emphasized the need for any rate adjustments to be gradual and not continuous.
Mejia added that further easing would not imply the beginning of a cycle of interest rate cuts.
Last week’s data witnessed Mexico’s Industrial Production resilience, recovering in May following April’s plunge in monthly figures. Meanwhile, the latest Bank of Mexico (Banxico) minutes revealed that the disinflation process has evolved, which may spark discussions to adjust interest rates at upcoming meetings.
Daily digest market movers: Mexican Peso hurt by Banxico’s comments, risk-aversion
- Banxico board members project growth to be lower than expected, as Mexico’s economic activity has been weak since the end of 2023. Most policymakers mentioned that inflation will converge toward the target in the last quarter 2025.
- They added that services inflation does not show a clear downward trend, which was one of the reasons for keeping rates unchanged at the June meeting.
- Mexico’s June inflation figures were higher than expected due to a rise in food prices when most economists expect Banxico to resume lowering interest rates.
- June consumer inflation figures were lower than expected in the United States, increasing the chances that the Federal Reserve would lower borrowing costs in 2024 by at least 54 basis points, according to the December 2024 fed funds rate futures contract.
- According to the CME FedWatch Tool data, the odds for a September cut are 98%, up from 95% on Friday.
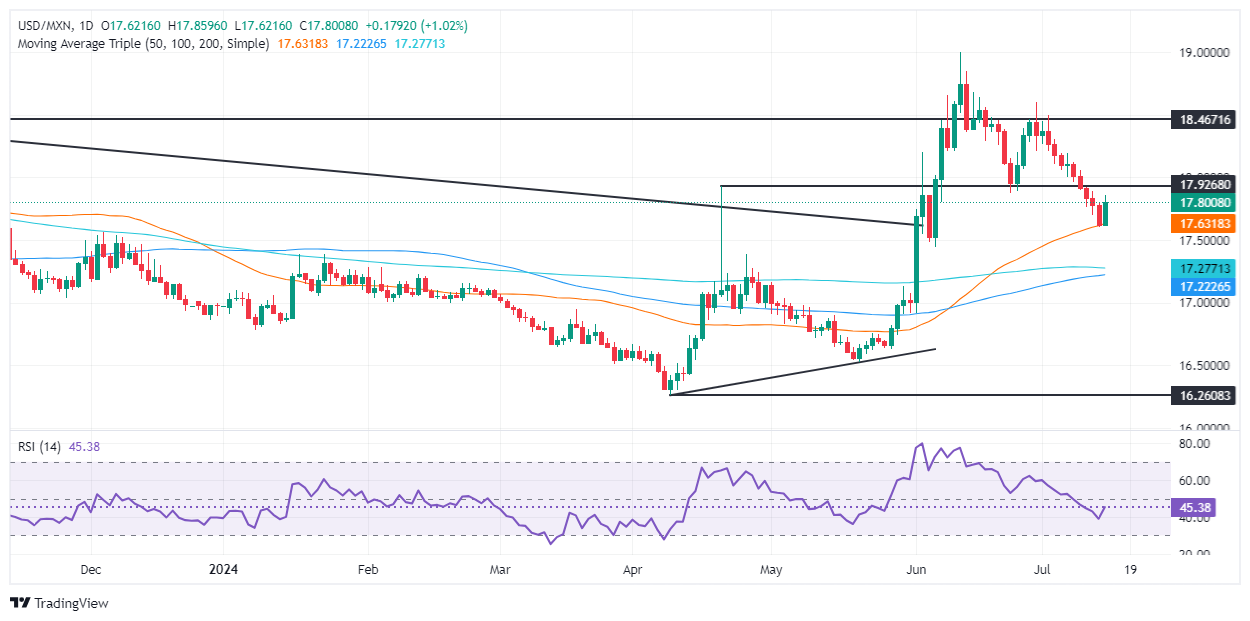
Technical analysis: Mexican Peso slides as USD/MXN climbs above 17.80
The USD/MXN made a U-turn on Monday and rose above last Friday’s high of 17.80, which opened the door to challenging the 17.90 figure. However, buyers had fallen shy, hitting a peak at 17.95. Momentum remains bullish despite the fact that the exotic pair printed a leg-up, though short-term has shifted upwards.
If USD/MXN continued to aim up, the next resistance would be the June 24 low turned resistance at 17.87, followed by the 18.00 figure. Further upside potential is seen above the July 5 high at 18.19, followed by the June 28 high of 18.59, allowing buyers to aim for the YTD high of 18.99.
Conversely, if USD/MXN slumps below 17.60, the next support would be the confluence of the December 5 high and the 50-day Simple Moving Average (SMA) near 17.56/60, followed by the 200-day SMA at 17.28. Further losses would test the 100-day SMA at 17.20.
Mexican Peso FAQs
The Mexican Peso (MXN) is the most traded currency among its Latin American peers. Its value is broadly determined by the performance of the Mexican economy, the country’s central bank’s policy, the amount of foreign investment in the country and even the levels of remittances sent by Mexicans who live abroad, particularly in the United States. Geopolitical trends can also move MXN: for example, the process of nearshoring – or the decision by some firms to relocate manufacturing capacity and supply chains closer to their home countries – is also seen as a catalyst for the Mexican currency as the country is considered a key manufacturing hub in the American continent. Another catalyst for MXN is Oil prices as Mexico is a key exporter of the commodity.
The main objective of Mexico’s central bank, also known as Banxico, is to maintain inflation at low and stable levels (at or close to its target of 3%, the midpoint in a tolerance band of between 2% and 4%). To this end, the bank sets an appropriate level of interest rates. When inflation is too high, Banxico will attempt to tame it by raising interest rates, making it more expensive for households and businesses to borrow money, thus cooling demand and the overall economy. Higher interest rates are generally positive for the Mexican Peso (MXN) as they lead to higher yields, making the country a more attractive place for investors. On the contrary, lower interest rates tend to weaken MXN.
Macroeconomic data releases are key to assess the state of the economy and can have an impact on the Mexican Peso (MXN) valuation. A strong Mexican economy, based on high economic growth, low unemployment and high confidence is good for MXN. Not only does it attract more foreign investment but it may encourage the Bank of Mexico (Banxico) to increase interest rates, particularly if this strength comes together with elevated inflation. However, if economic data is weak, MXN is likely to depreciate.
As an emerging-market currency, the Mexican Peso (MXN) tends to strive during risk-on periods, or when investors perceive that broader market risks are low and thus are eager to engage with investments that carry a higher risk. Conversely, MXN tends to weaken at times of market turbulence or economic uncertainty as investors tend to sell higher-risk assets and flee to the more-stable safe havens.
Federal Reserve (Fed) Chairman Jerome Powell noted that the US economy has performed remarkably well in recent years while giving a nod of the head to recent inflation readings. The head of the Fed also reaffirmed that the Fed won't be waiting until inflation reaches the 2% annual target.
Key highlights
Economy performed remarkably well last couple of years.
This year expected economy to slow and inflation to continue to make progress; something like that is happening.
Labor market no tighter than before the pandemic.
Second quarter of inflation does represent progress with three better readings.
The three readings in second quarter to add to confidence in inflation falling.
Now that inflation has come down will look at both mandates.
If we were to see unexpected weakening in labor market, that would merit reaction from us.
Not going to send any signal on any particular meeting.
Will make decisions meeting by meeting.
Will make decisions based on evolving data and outlook.
The Fed's undertaking is to make decisions on data, and only on data, not politics.
If the Fed waits for inflation to get to 2% to cut it has waited too long.
The test is that officials want to be confident it is moving down; more good data will add to confidence and lately the Fed has been getting that.
- The Canadian Dollar broadly weakened on Monday as markets look elsewhere.
- Canada caught in a trap of low expectations feeding even lower expectations.
- Canadian CPI inflation due on Tuesday, could help or hinder CAD.
The Canadian Dollar (CAD) broadly softened on Monday as markets got the new trading week underway. CAD flows fully reversed direction in a follow-through of last Friday’s pullback, sending the Canadian Dollar to an eight-trading-day low against the Greenback.
Canada is set to print the latest iteration of Canadian Consumer Price Index (CPI) inflation on Tuesday, and markets are hoping for a steep drag on headline monthly CPI inflation to help push the Bank of Canada (BoC) into another rate cut after the Canadian central bank delivered a quarter-point trim in June. Canadian Retail Sales and Raw Materials Price Index inflation also loom over the horizon later in the week.
Daily digest market movers: Canadian Dollar stumbles as BoC highlights pessimistic firms
- The BoC’s latest Business Outlook Survey showed many Canadian firms have had weak sales expectations for several quarters, citing still-high equipment costs as a reason to avoid investment spending.
- A notable lack of investment in productivity improvements means Canadian firms are caught in an efficiency trap where firms avoid productivity investment because of a middling economy lacking productivity investment.
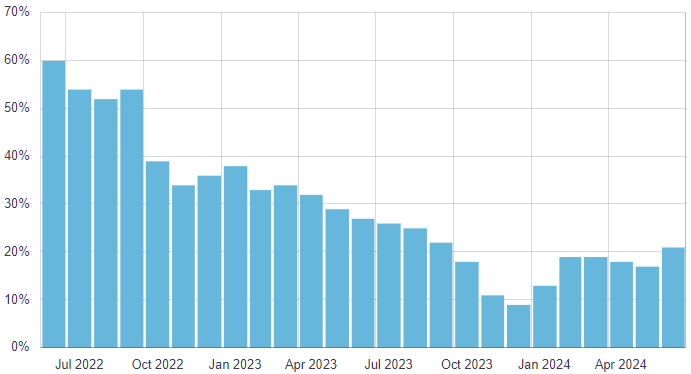
- Despite weak demand and ongoing high costs, the proportion of firms expecting a recession in the coming 12 months continues to decline, down from a high of 45% in Q1 2023 to just 20% in Q2 2024.
- US Retail Sales on Tuesday could complicate things as rate-cut-hungry markets hope for a continued decline in US activity indicators.
- BoC’s Business Leaders’ Pulse, percentage of firms reporting positive sentiment minus the percentage reporting negative sentiment:
Technical analysis: Belly-up CAD finds fresh lows, sends USD/CAD higher after clean 200 EMA bounce
The Canadian Dollar (CAD) has flattened across the board on Monday, declining against all of its major currency peers as the new trading week gets underway. The CAD fell four-tenths of one percent against the Japanese Yen (JPY) and the Swiss Franc (CHF). and shed roughly one-fifth of one percent against the US Dollar (USD).
USD/CAD rallied to af resh eight-day high on CAD weakness on Monday, jumping back above 1.3660 after the pair formed a clean bounce from the 200-day Exponential Moving Average (EMA) at 1.3590. Near-term technical consolidation remains likely as bids challenge the 50–day EMA at 1.3666, and a rough supply zone priced in above the 1.3700 handle could get any bullish extensions stuck in the muck.
USD/CAD hourly chart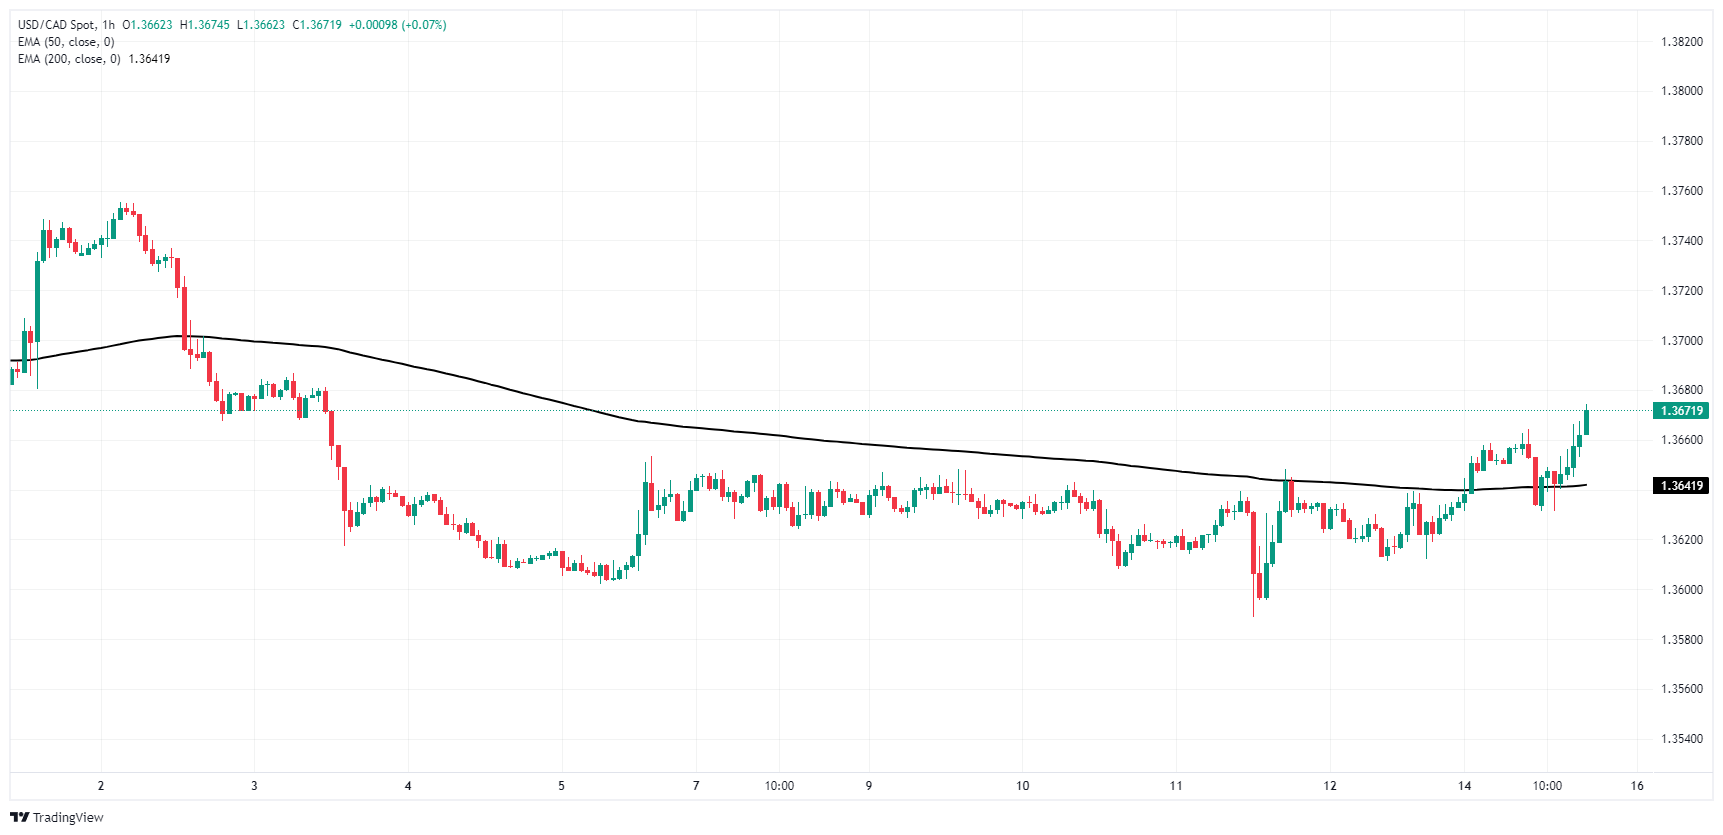
USD/CAD daily chart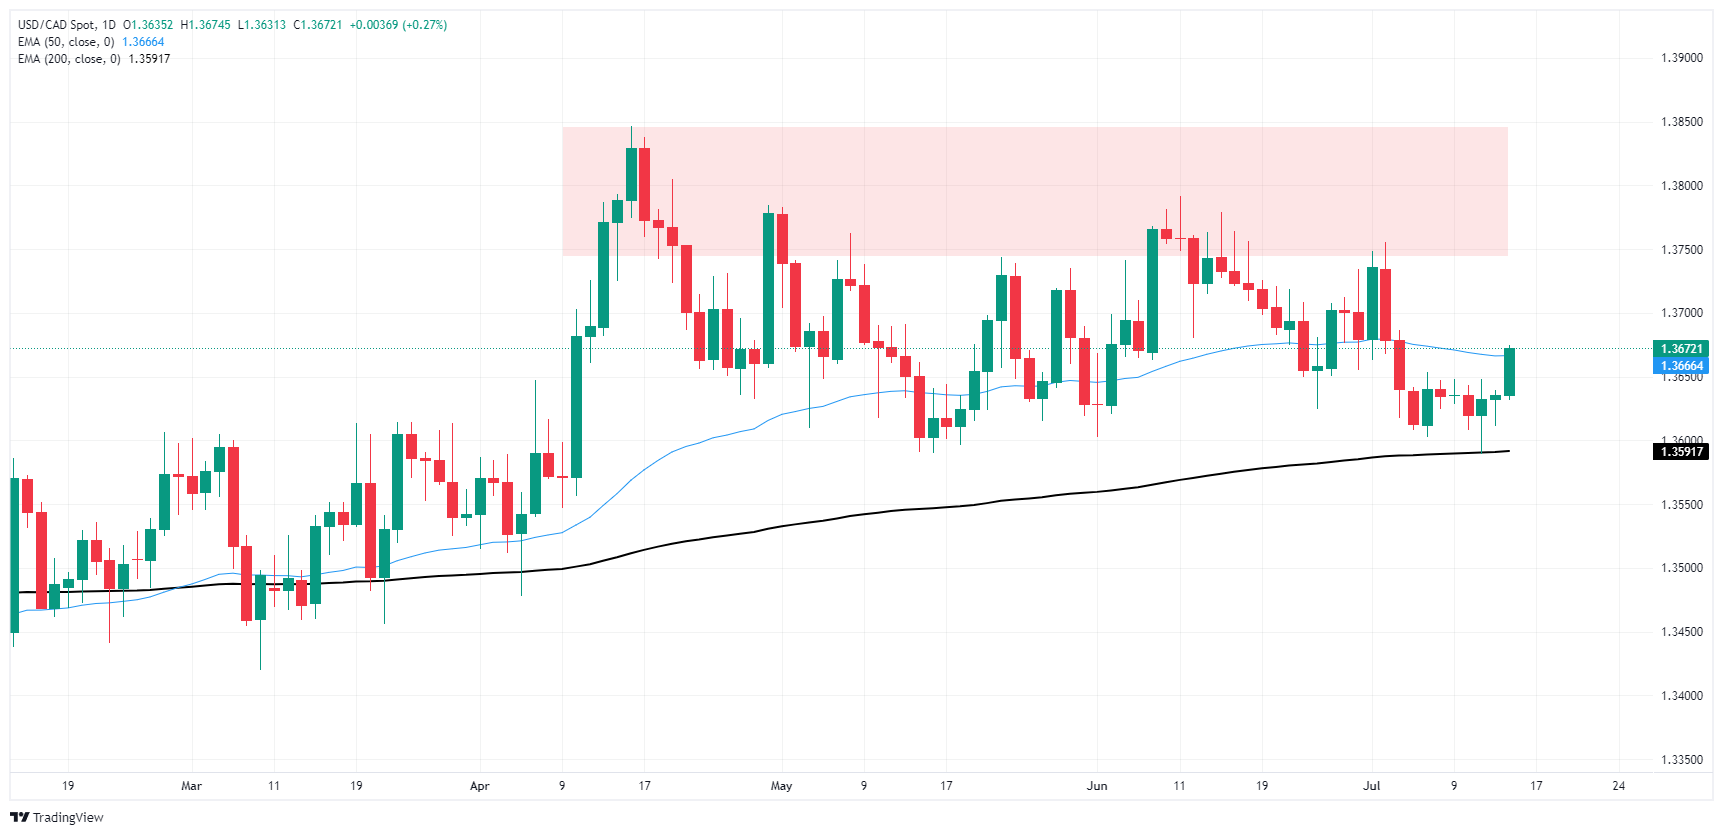
Canadian Dollar FAQs
The key factors driving the Canadian Dollar (CAD) are the level of interest rates set by the Bank of Canada (BoC), the price of Oil, Canada’s largest export, the health of its economy, inflation and the Trade Balance, which is the difference between the value of Canada’s exports versus its imports. Other factors include market sentiment – whether investors are taking on more risky assets (risk-on) or seeking safe-havens (risk-off) – with risk-on being CAD-positive. As its largest trading partner, the health of the US economy is also a key factor influencing the Canadian Dollar.
The Bank of Canada (BoC) has a significant influence on the Canadian Dollar by setting the level of interest rates that banks can lend to one another. This influences the level of interest rates for everyone. The main goal of the BoC is to maintain inflation at 1-3% by adjusting interest rates up or down. Relatively higher interest rates tend to be positive for the CAD. The Bank of Canada can also use quantitative easing and tightening to influence credit conditions, with the former CAD-negative and the latter CAD-positive.
The price of Oil is a key factor impacting the value of the Canadian Dollar. Petroleum is Canada’s biggest export, so Oil price tends to have an immediate impact on the CAD value. Generally, if Oil price rises CAD also goes up, as aggregate demand for the currency increases. The opposite is the case if the price of Oil falls. Higher Oil prices also tend to result in a greater likelihood of a positive Trade Balance, which is also supportive of the CAD.
While inflation had always traditionally been thought of as a negative factor for a currency since it lowers the value of money, the opposite has actually been the case in modern times with the relaxation of cross-border capital controls. Higher inflation tends to lead central banks to put up interest rates which attracts more capital inflows from global investors seeking a lucrative place to keep their money. This increases demand for the local currency, which in Canada’s case is the Canadian Dollar.
Macroeconomic data releases gauge the health of the economy and can have an impact on the Canadian Dollar. Indicators such as GDP, Manufacturing and Services PMIs, employment, and consumer sentiment surveys can all influence the direction of the CAD. A strong economy is good for the Canadian Dollar. Not only does it attract more foreign investment but it may encourage the Bank of Canada to put up interest rates, leading to a stronger currency. If economic data is weak, however, the CAD is likely to fall.
- US Dollar is showing additional losses, DXY index finds support at the 104.00 area.
- Markets are increasingly confident about a September rate cut.
- Jerome Powell's upcoming speech may potentially influence the USD.
The US Dollar measured by the DXY maintains its bearish trajectory, hitting lows from April around 104.00. The downturn is largely attributed to signs of disinflation in the US economy, which is fostering confidence in the markets for a potential Federal Reserve (Fed) rate cut in September.
Despite boosting market certainty of a rate cut, Fed officials are adopting a cautious stance by emphasizing that their decision remains highly reliant on data.
Daily digest market movers: USD under pressure due to weak inflation numbers, eyes on Powell
- Concerning the data releases, last week's low inflation numbers have put the USD under significant pressure, amplifying the possibility of a September rate cut.
- Federal Reserve Chairman Jerome Powell is scheduled to speak at the Economic Club of Washington DC later in the sessions, with markets keenly awaiting any hints regarding future monetary policy actions.
- This week will also see significant commentary from other US policymakers in the run-up to the monetary policy meeting on July 31.
- The CME FedWatch Tool continues to show a high probability of a rate cut in September, currently standing at around 86% for a 25 bps cut.
- The US 10-year benchmark rate is currently at its lowest since April, at 4.20%.
DXY Technical Outlook: Bearish sentiment continues as DXY remains below the 200-day SMA
The outlook is negative for the USD with daily indicators, including the Relative Strength Index (RSI) and Moving Average Convergence Divergence (MACD), deeply below the 50 mark, nearing the oversold threshold. In addition, the DXY index is trading at its lowest level since April, having lost the 200-day Simple Moving Average (SMA) support.
While it has lost more than 0.80% since the end of last week, a mild upward correction may be possible with the mentioned SMA at 104.40 as the main resistance to target.
US Dollar FAQs
The US Dollar (USD) is the official currency of the United States of America, and the ‘de facto’ currency of a significant number of other countries where it is found in circulation alongside local notes. It is the most heavily traded currency in the world, accounting for over 88% of all global foreign exchange turnover, or an average of $6.6 trillion in transactions per day, according to data from 2022. Following the second world war, the USD took over from the British Pound as the world’s reserve currency. For most of its history, the US Dollar was backed by Gold, until the Bretton Woods Agreement in 1971 when the Gold Standard went away.
The most important single factor impacting on the value of the US Dollar is monetary policy, which is shaped by the Federal Reserve (Fed). The Fed has two mandates: to achieve price stability (control inflation) and foster full employment. Its primary tool to achieve these two goals is by adjusting interest rates. When prices are rising too quickly and inflation is above the Fed’s 2% target, the Fed will raise rates, which helps the USD value. When inflation falls below 2% or the Unemployment Rate is too high, the Fed may lower interest rates, which weighs on the Greenback.
In extreme situations, the Federal Reserve can also print more Dollars and enact quantitative easing (QE). QE is the process by which the Fed substantially increases the flow of credit in a stuck financial system. It is a non-standard policy measure used when credit has dried up because banks will not lend to each other (out of the fear of counterparty default). It is a last resort when simply lowering interest rates is unlikely to achieve the necessary result. It was the Fed’s weapon of choice to combat the credit crunch that occurred during the Great Financial Crisis in 2008. It involves the Fed printing more Dollars and using them to buy US government bonds predominantly from financial institutions. QE usually leads to a weaker US Dollar.
Quantitative tightening (QT) is the reverse process whereby the Federal Reserve stops buying bonds from financial institutions and does not reinvest the principal from the bonds it holds maturing in new purchases. It is usually positive for the US Dollar.
We have lifted our end-2024 target for USD/CNY to 7.21 from 7.12. The People’s Bank of China (PBoC) is studying how to carry out government bond trading in the secondary market with the finance ministry without being seen as adopting quantitative easing, DBS senior FX strategist Philip Wee.
PBoC raises the daily fixing from to 7.1315 last Friday
“We have lifted our end-2024 target for USD/CNY to 7.21 from 7.12. PBoC raised the daily fixing from 7.0950 at the end of 1Q24 to 7.1315 last Friday.”
“The central bank is gradually shifting monetary policy from quantitative targets towards interest rates. The PBOC is studying how to carry out government bond trading in the secondary market with the finance ministry without being seen as adopting quantitative easing.”
“Year-to-date, the 10Y bond yield declined by 30 bps in China vs. a 30 bps increase in the US, while the SPX 500 rallied 17.7% vs. a slight 1.2% gain in the CSI 300 Index. However, we expect the US Dollar (USD) to decline against the Chinese Yuan (CNY) when the Federal Reserve cut cycle begins.”
The Dollar Index (DXY) depreciated 1.7% in the first fortnight of July to 104.09. Fed officials have become more confident about US inflation resuming its decline, DBS senior FX strategist Philip Wee.
DXY depreciates 1.7% in the first two weeks of July
“DXY depreciated 1.7% in the first fortnight of July to 104.09, back to early June lows. The Greenback is under pressure from the futures market, increasing the probability that the Federal Reserve (Fed) will start lowering rates in September to 94.5% vs. 56.5% at the last FOMC meeting on June 12.”
“Fed officials have become more confident about US inflation resuming its decline after a sticky first quarter. CPI inflation fell a third month and posted its first negative month-on-month reading since May 2020. The Fed’s favourite inflation gauges, the PCE deflators, should mirror the softer CPI readings.”
“PCE inflation fell to 2.6% YoY in May, hitting the Fed’s forecast for 4Q24. Core inflation was more impressive by declining to 2.6%, below the Fed’s 2.8% forecast.”
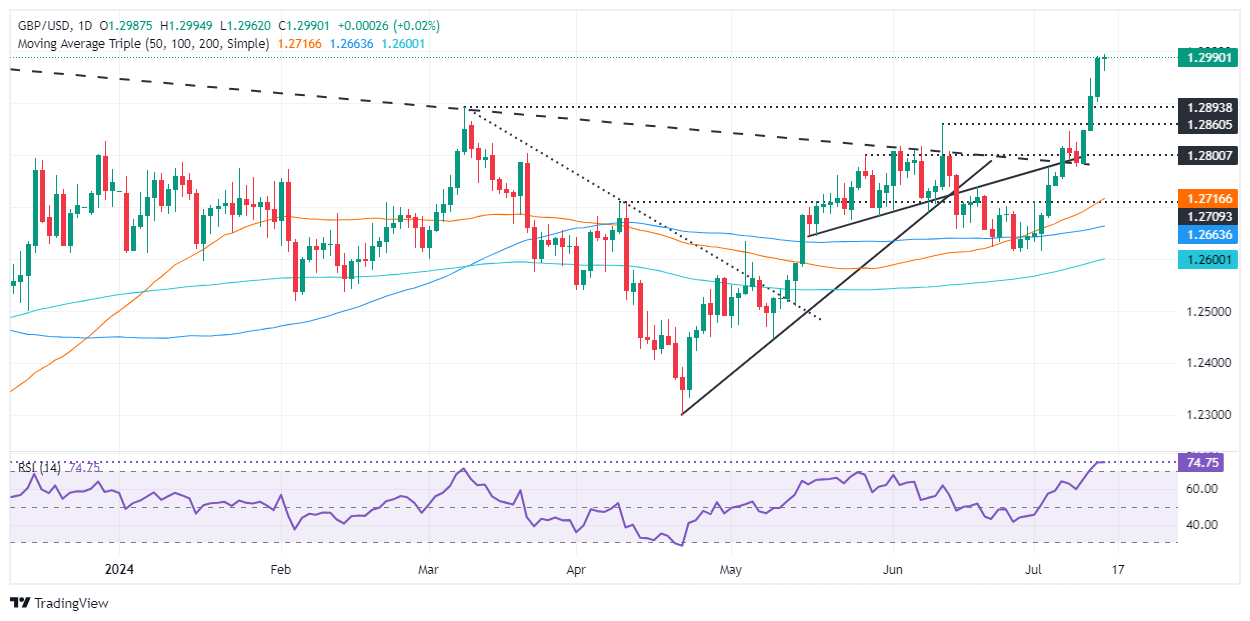
- GBP/USD approaches 1.2985, close to a 12-month high of 1.2995, propelled by strong bullish momentum.
- Resistance levels identified at 1.2995-1.3000, 1.3041 (July 19 high), and 1.3126 (July 18 peak).
- Support levels to monitor for potential reversals: 1.2901 (July 12 low), 1.2860 (June 12 peak), 1.2779 (July 10 low).
The Pound Sterling resumes its rally as the North American session begins. It faded earlier US Dollar strength, spurred by a shooting at former US President Donald Trump's rally in Pennsylvania, which triggered a flight to safety. The GBP/USD trades at 1.2985 and gains 0.24%.
GBP/USD Price Analysis: Technical outlook
Following last week's three-day advance since Wednesday, the 1.3000 figure is up for grabs, with the GBP/USD trading near a 12-month high yet shy of the July 27, 2023, high of 1.2995.
Momentum remains bullish, though it has shifted overbought, but due to the strength of the uptrend, some traders see the 80 level as the most extreme.
Therefore, the GBP/USD next resistance would be 1.2995-1.3000. Once that level is cleared, the next stop would be July 19, 2023, high at 1.3041, before testing the July 18, 2023, peak of 1.3126. Up next would be last year's high at 1.3142.
Conversely, if GBP/USD sellers stepped in, they must push prices below the July 12 low of 1.2901. In the event of a reversal, the next stop would be the June 12 peak turned support at 1.2860 before slumping to the July 10 low of 1.2779.
GBP/USD Price Action – Daily Chart
Pound Sterling FAQs
The Pound Sterling (GBP) is the oldest currency in the world (886 AD) and the official currency of the United Kingdom. It is the fourth most traded unit for foreign exchange (FX) in the world, accounting for 12% of all transactions, averaging $630 billion a day, according to 2022 data. Its key trading pairs are GBP/USD, aka ‘Cable’, which accounts for 11% of FX, GBP/JPY, or the ‘Dragon’ as it is known by traders (3%), and EUR/GBP (2%). The Pound Sterling is issued by the Bank of England (BoE).
The single most important factor influencing the value of the Pound Sterling is monetary policy decided by the Bank of England. The BoE bases its decisions on whether it has achieved its primary goal of “price stability” – a steady inflation rate of around 2%. Its primary tool for achieving this is the adjustment of interest rates. When inflation is too high, the BoE will try to rein it in by raising interest rates, making it more expensive for people and businesses to access credit. This is generally positive for GBP, as higher interest rates make the UK a more attractive place for global investors to park their money. When inflation falls too low it is a sign economic growth is slowing. In this scenario, the BoE will consider lowering interest rates to cheapen credit so businesses will borrow more to invest in growth-generating projects.
Data releases gauge the health of the economy and can impact the value of the Pound Sterling. Indicators such as GDP, Manufacturing and Services PMIs, and employment can all influence the direction of the GBP. A strong economy is good for Sterling. Not only does it attract more foreign investment but it may encourage the BoE to put up interest rates, which will directly strengthen GBP. Otherwise, if economic data is weak, the Pound Sterling is likely to fall.
Another significant data release for the Pound Sterling is the Trade Balance. This indicator measures the difference between what a country earns from its exports and what it spends on imports over a given period. If a country produces highly sought-after exports, its currency will benefit purely from the extra demand created from foreign buyers seeking to purchase these goods. Therefore, a positive net Trade Balance strengthens a currency and vice versa for a negative balance.
Crude oil markets are also particularly vulnerable to a downtape, TD Securities senior commodity strategist Daniel Ghali notes.
Trend-followers to liquidate -40% of their positions
“While the downside in crude markets has remained relatively tame over the last weeks, a downtape could now force trend-followers to liquidate a massive -40% of their max size, suggesting the window for large-scale algorithmic liquidations is now open.”
“With our gauge of global commodity demand trending notably lower, we expect downside pressures to continue to build without an additional boost to supply risk.”
The gathering of top Chinese party officials amid the Third Plenum has kept base metals from weakening further, as traders await for signs of additional stimulus to turn the tide, TD Securities senior commodity strategist Daniel Ghali notes.
Third Plenum to provide information on structural reforms
“The Third Plenum promises to offer additional information on structural reforms. Traders will be watching for information regarding China's plan to tackle the downward spiral in real estate, alongside plans for local government finances, ‘new quality productive forces’ including the metal intensive new energy industries.”
“For the time being, our real-time gauge of global commodity demand continues to plummet, pointing to a hangover from stockpiling associated with the squeeze on Comex Copper in an otherwise deteriorating local demand environment.”
“Commodity Trading Advisors (CTAs) could still modestly add to their length in Copper markets. Our simulations suggest that algos are likely to buy back some length in nearly every scenario over the next week. Aluminium markets appear particularly vulnerable to additional algo liquidations.”
Discretionary traders are piling back into Gold (XAU/USD) markets, TD Securities senior commodity strategist Daniel Ghali notes.
CTAs to continue buying Gold
“Discretionary traders are piling back into Gold markets. With this cohort now having accumulated its largest position of this cycle, our proxy suggests macro trader positioning in Gold is now somewhat larger than would be expected given the number of Fed cuts priced into rates markets over the next year.”
“It still remains far below the highs marked in past Federal Reserve (Fed) cutting cycles, which points to some scope for additional gains should expectations for the upcoming rate cutting cycle continue to deepen. Discretionary trader longs have also been building over the last weeks, in line with the Trump trade which is also attracting interest into the Yellow Metal.”
“Gold technicals also screen among the strongest across our Global macro radar, underscoring the high bar for Commodity Trading Advisor (CTA) trend followers before they are forced to liquidate more length. While the recent downdraft in gold had catalyzed some liquidations, CTAs are now likely to return to the bid without a significant reversal south of $2370/oz.”
- Silver price trades in a tight range near $31 amid uncertainty over China’s third plenum outcome.
- Firm Fed rate-cut hopes keep the near-term outlook of the Silver price as bullish.
- Investors await Fed Powell’s speech for fresh guidance on interest rates.
Silver price (XAG/USD) consolidates in a tight range near $31.00 in Monday’s North American session. The white metal struggles for direction as investors await Federal Reserve (Fed) Chair Jerome Powell’s speech at the Economic Club of Washington scheduled at 16:30 GMT.
The commentary from Fed Powell will indicate about when the central bank will start reducing interest rates. Currently, financial markets are confident that the Fed will pivot to policy-normalization from September. Strong speculation for Fed rate cuts in September have weighed heavily on the US Dollar (USD) and bond yields.
The US Dollar Index (DXY), which tracks the Greenback’s value against six major currencies, sees more downside below the immediate support of 104.00. 10-year US Treasury yields rose to 4.22% but are close to near four-month low. Low interest rate environment is unfavorable for the US Dollar and bond yields.
Despite firm Fed rate cut prospects, the near-term outlook of the Silver price is uncertain due to the ongoing four-day China’s third plenum meeting, which is scheduled for next week. China’ Communist Party is expected to take measures to boost real estate and manufacturing sector.
Meanwhile, China’s weaker-than-expected Q2 Gross Domestic Product (GDP) growth has deepened uncertainty over Silver’s demand as a metal used in industry in manufacturing and automobile sectors.
Silver technical analysis
Silver price holds the breakout of the Falling Channel chart formation on a daily timeframe. Advancing 20-period Exponential Moving Average (EMA) near $30.30 continues to provide support to the Silver price bulls.
The 14-period Relative Strength Index (RSI) struggles to break above 60.00. A decisive break above the same would push the momentum toward the upside.
Silver four-hour chart
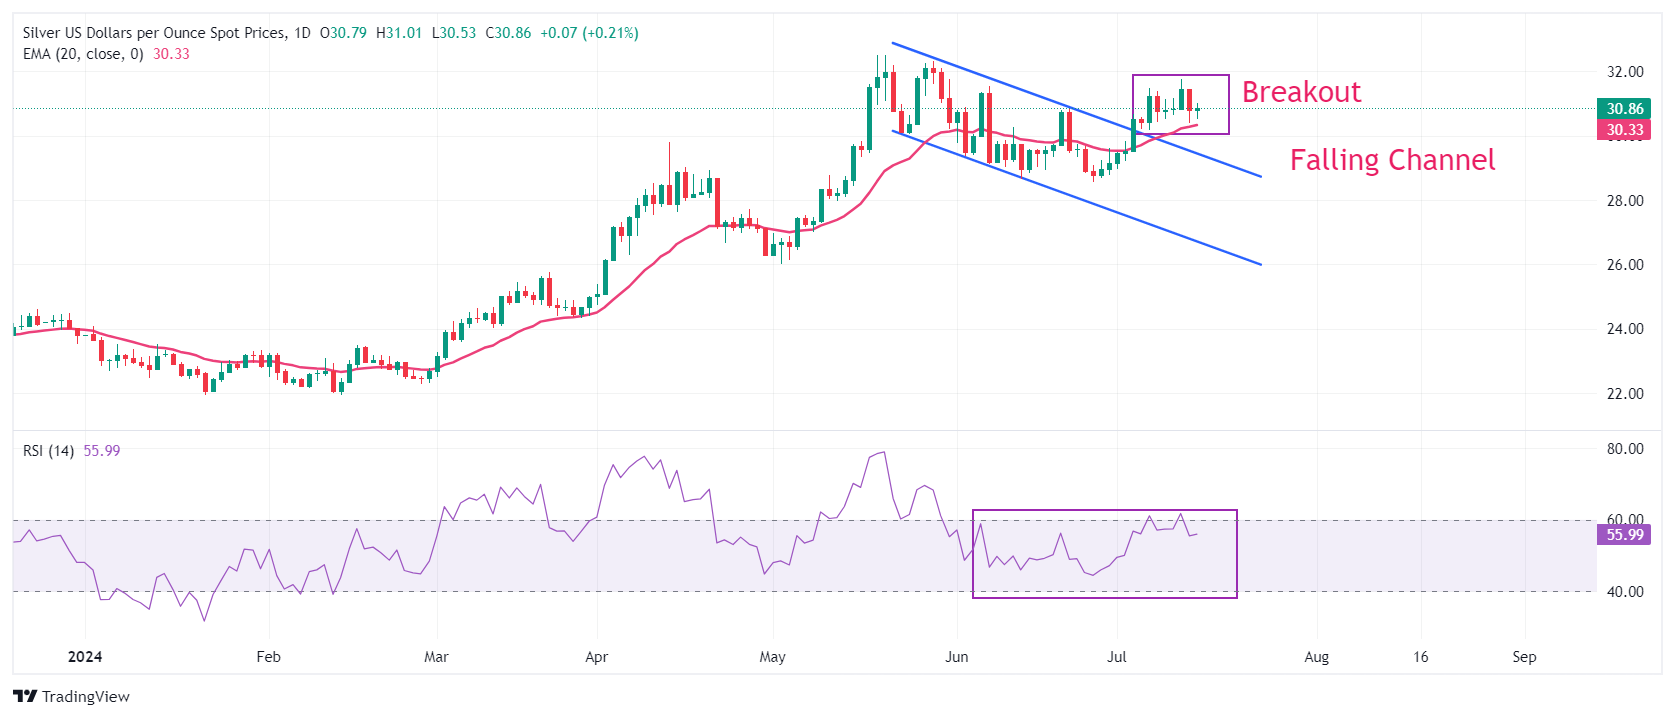
Silver FAQs
Silver is a precious metal highly traded among investors. It has been historically used as a store of value and a medium of exchange. Although less popular than Gold, traders may turn to Silver to diversify their investment portfolio, for its intrinsic value or as a potential hedge during high-inflation periods. Investors can buy physical Silver, in coins or in bars, or trade it through vehicles such as Exchange Traded Funds, which track its price on international markets.
Silver prices can move due to a wide range of factors. Geopolitical instability or fears of a deep recession can make Silver price escalate due to its safe-haven status, although to a lesser extent than Gold's. As a yieldless asset, Silver tends to rise with lower interest rates. Its moves also depend on how the US Dollar (USD) behaves as the asset is priced in dollars (XAG/USD). A strong Dollar tends to keep the price of Silver at bay, whereas a weaker Dollar is likely to propel prices up. Other factors such as investment demand, mining supply – Silver is much more abundant than Gold – and recycling rates can also affect prices.
Silver is widely used in industry, particularly in sectors such as electronics or solar energy, as it has one of the highest electric conductivity of all metals – more than Copper and Gold. A surge in demand can increase prices, while a decline tends to lower them. Dynamics in the US, Chinese and Indian economies can also contribute to price swings: for the US and particularly China, their big industrial sectors use Silver in various processes; in India, consumers’ demand for the precious metal for jewellery also plays a key role in setting prices.
Silver prices tend to follow Gold's moves. When Gold prices rise, Silver typically follows suit, as their status as safe-haven assets is similar. The Gold/Silver ratio, which shows the number of ounces of Silver needed to equal the value of one ounce of Gold, may help to determine the relative valuation between both metals. Some investors may consider a high ratio as an indicator that Silver is undervalued, or Gold is overvalued. On the contrary, a low ratio might suggest that Gold is undervalued relative to Silver.
The Pound Sterling (GBP) is holding little changed just below the 1.30 point. Focus in the UK falls squarely on Wednesday’s UK CPI report, Scotiabank’s chief FX strategist Shaun Osborne notes.
A retest of last July’s 1.3155 high may develop
“Headline price growth may dip under 2% for the first time since 2021 but markets will want to seen clear progress on sticky services inflation (expected to ease only a tenth to 5.6%) to bolster expectations of an August 1 rate cut (around 50% probability, according to market pricing currently).”
“GBP/USD is little changed on the session so far after consolidating solid gains over the past week just below 1.30. Spot gains are well-supported by intraday, daily and weekly DMI signals and Cable is making solid gains above long term (18Y) trend resistance (1.2645). A clear move above 1.30 suggests a retest of last July’s 1.3155 high may develop. Support is 1.2850/80.”
The Euro (EUR) retains a firm undertone. Minor dips to the upper 1.08s were well-supported in overnight trade and spot has regained the low 1.09 area fairly easily through European trade to trade to a marginal new, short-term high (highest since March), Scotiabank’s chief FX strategist Shaun Osborne notes.
Scope for additional leap higher towards 1.0950/80
“Significantly narrower EZ/US spreads—the 2Y gap has narrowed to –162bps, the narrowest since March—plus some normalization in OAT/Bund 10Y spreads explain the EUR’s strong performance over the past few weeks. Our fair value estimate suggests 1.10+ may be reachable in the short run. No change in rates is expected at Thursday’s ECB policy decision.”
“EUR has built up a fairly strong head of technical steam. Price is trading at a marginal new high for the move up this morning and spot gains are strongly backed by bullish-leaning trend strength indicators on the intraday, daily and weekly DMIs.”
“This should mean pressure for more gains and limited scope for EUR corrections, for now. Gains through the low 1.09s target additional strength towards 1.0950/80. Support is 1.0860/80.”
- AUD/USD consolidates below 0.6800 with Fed Powell’s speech in focus.
- Firm speculation for Fed rate cuts in September has resulted in cheerful market mood.
- Investors await the US Retail Sales and Aussie Employment for June.
The AUD/USD pair consolidates below the crucial resistance of 0.6800 in Monday’s American session. The Aussie asset struggles for a direction as investors await Federal Reserve (Fed) Chair Jerome Powell’s speech, which is scheduled at 16:30 GMT.
In his latest comments at semi-annual Congressional testimony on Tuesday-Wednesday last week, Powell admitted that the central bank has made some progress on inflation. However, he reiterated the need of soft inflation data for months to gain confidence for rate cuts. The commentary from Fed Powell is expected to be favoring early cuts as the Consumer Price Index (CPI) report for June, released on Thursday, showed that price pressures have softened further.
Meanwhile, firm market speculation for the Fed to begin reducing interest rates from September has improved appeal for risk-sensitive assets. Considering strong gains in overnight futures, the S&P 500 is expected to open on a strong bullish note. The US Dollar Index (DXY), which tracks the Greenback’s value against six major currencies, struggles to hold the immediate support of 104.00.
This week, investors will focus on the United States (US) Retail Sales data for June, which will be published on Tuesday. The Retail Sales data, a measure to consumer spending that drives consumer inflation, is estimated to have remained unchanged on month-on-month.
On the Aussie front, investors will focus on the Australian Employment data for June, which will be published on Thursday. The Employment report is expected to show that 20K job-seekers were hired against 39.7K onboarded in May. The Unemployment Rate is expected to remain steady at 4.0%. Signs of strong job demand would boost expectations of further policy-tightening by the Reserve Bank of Australia (RBA).
Australian Dollar FAQs
One of the most significant factors for the Australian Dollar (AUD) is the level of interest rates set by the Reserve Bank of Australia (RBA). Because Australia is a resource-rich country another key driver is the price of its biggest export, Iron Ore. The health of the Chinese economy, its largest trading partner, is a factor, as well as inflation in Australia, its growth rate and Trade Balance. Market sentiment – whether investors are taking on more risky assets (risk-on) or seeking safe-havens (risk-off) – is also a factor, with risk-on positive for AUD.
The Reserve Bank of Australia (RBA) influences the Australian Dollar (AUD) by setting the level of interest rates that Australian banks can lend to each other. This influences the level of interest rates in the economy as a whole. The main goal of the RBA is to maintain a stable inflation rate of 2-3% by adjusting interest rates up or down. Relatively high interest rates compared to other major central banks support the AUD, and the opposite for relatively low. The RBA can also use quantitative easing and tightening to influence credit conditions, with the former AUD-negative and the latter AUD-positive.
China is Australia’s largest trading partner so the health of the Chinese economy is a major influence on the value of the Australian Dollar (AUD). When the Chinese economy is doing well it purchases more raw materials, goods and services from Australia, lifting demand for the AUD, and pushing up its value. The opposite is the case when the Chinese economy is not growing as fast as expected. Positive or negative surprises in Chinese growth data, therefore, often have a direct impact on the Australian Dollar and its pairs.
Iron Ore is Australia’s largest export, accounting for $118 billion a year according to data from 2021, with China as its primary destination. The price of Iron Ore, therefore, can be a driver of the Australian Dollar. Generally, if the price of Iron Ore rises, AUD also goes up, as aggregate demand for the currency increases. The opposite is the case if the price of Iron Ore falls. Higher Iron Ore prices also tend to result in a greater likelihood of a positive Trade Balance for Australia, which is also positive of the AUD.
The Trade Balance, which is the difference between what a country earns from its exports versus what it pays for its imports, is another factor that can influence the value of the Australian Dollar. If Australia produces highly sought after exports, then its currency will gain in value purely from the surplus demand created from foreign buyers seeking to purchase its exports versus what it spends to purchase imports. Therefore, a positive net Trade Balance strengthens the AUD, with the opposite effect if the Trade Balance is negative.
The Canadian Dollar (CAD) eased in early Asian trade but has recovered to trade little changed on the day. It’s a busy week for Canadian data reports, Scotiabank’s chief FX strategist Shaun Osborne notes.
Busy week for Canadian data reports
“The BoC’s Q2 Business Outlook Survey is out today, along with (a bit earlier) Manufacturing and Wholesale Sales. But CPI tomorrow and Retail Sales at the end of the week will perhaps have more influence on CAD sentiment. Narrower US/Canada spreads over the past month have helped lift the CAD modestly but spot has held recent ranges.”
“The CAD looks fairly valued in the low 1.36s and that might be about the best we can expect for the CAD for now. The CAD is building up some positive technical momentum. Spot closed lower on the week Friday for a fifth week running. Intraday and daily DMI signals are tilting USD-bearish.”
“But major support sits at 1.3590/00 and Thursday’s strong intraday rebound suggests that the short-term base for the USD remains solid, for now. Resistance is 1.3650/55 and 1.3750/55. CAD-supportive DMIs (currently) suggest CAD losses should remain limited in the short run. A clear push under 1.3590 targets a drop in the USD to the 1.3450/00 range. Major trend support sits at 1.3460.”
- The US Dollar gaps at the Asian opening on Monday morning.
- Former US President Trump was injured in a shooting during a political rally.
- The US Dollar index jumps higher, it is on the way to fill the gap.
The US Dollar (USD) gaped up at the start of the week on pressure from Dollar bulls, who wanted to buy the Greenback as a safe haven after former US President Donald Trump was shot during an election rally. Trump was injured in the ear but is doing well, and he is set to give a speech later this Monday. The events made the bond market rally, with Trump’s popularity set to surge now, outpacing current US President Joe Biden.
On the economic front, expect this week that the different data points will be overshadowed by headlines from what happened over the weekend and with the rallies taking place, especially where Trump will attend. Besides that, it is a soft start for the week, where US Retail Sales data for June, scheduled on Tuesday, will play the leading role. US Federal Reserve (Fed) Chairman Jerome Powell will enter an interview with David Rubenstein on Bloomberg later on Monday.
Daily digest market movers: Market reacts to a shooting
- Markets are trying to price in the events that took place over the weekend. Bond markets are selling off with higher yields, a similar move we saw a few weeks ago when former US President Donald Trump took the lead in the polls. Bond markets are worried about Trump's spending plans, which could cause the US deficit to proportions never seen in US history. Investors are selling off their US debt in the idea that it might devalue or, in the worst case, might even never be paid back.
- At 12:30 GMT, the NY Empire State Manufacturing Index for July will be released. It is expected to remain unchanged from the previous reading of -6.
- At 20:35 GMT, Federal Reserve Bank of San Francisco President Mary Daly participates in the "Fortune Brainstorm Tech 2024" session "The Bull, the Bear, and the Banker" with Fortune's Emma Hinchliffe in Utah, United States.
- US Federal Reserve Chairman Jerome Powell will be interviewed by David Rubenstein at the Economic Club of Washington, DC.
- Equity markets are very binary on Monday. Both Asian and European equities are in negative territory, while US futures are in the green.
- The CME Fedwatch Tool is broadly backing a rate cut in September. The odds now stand at 89.9% for a 25-basis-point cut. A rate pause stands at a 5.7% chance, while a 50-basis-point rate cut has a very thin 4.4% possibility.
- The US 10-year benchmark rate trades at 4.21% after trading higher at the Asian opening. Bond markets dipping lower on the possibility of Trump winning the US Presidential elections.
US Dollar Index Technical Analysis: Trump triggers slight rebound
The US Dollar Index (DXY) is getting some support on the back of the events from this weekend. In the past, Trump’s presidency supported the Greenback. The big question, though, which is different this time against his previous term, is whether these spending packages are still supportive of a stronger and more expensive Dollar, seeing the possible deterioration of the US deficit and exponential rise in US debt.
The DXY is residing below all three major Simple Moving Averages (SMA) on Monday after its meltdown last week. The first barrier to regain control over is the 200-day SMA at 104.38. Next, the 100-day SMA resides near 104.81 while the declining 55-day SMA is trading at 105.07.
On the downside, the weak spot has been identified now at 103.99/104.00. Expect to see pressure mounting on that level with each test. Certainly, when the DXY bounces off that level each time, the bounces' highs would become smaller until the support gives way. A technical element to look out for could be that the 55-day SMA starts to break below the 100-day SMA and/or the 200-day SMA, risking a ‘death cross’ in technical terms, which is a catalyst for a substantially longer-term sell-off.
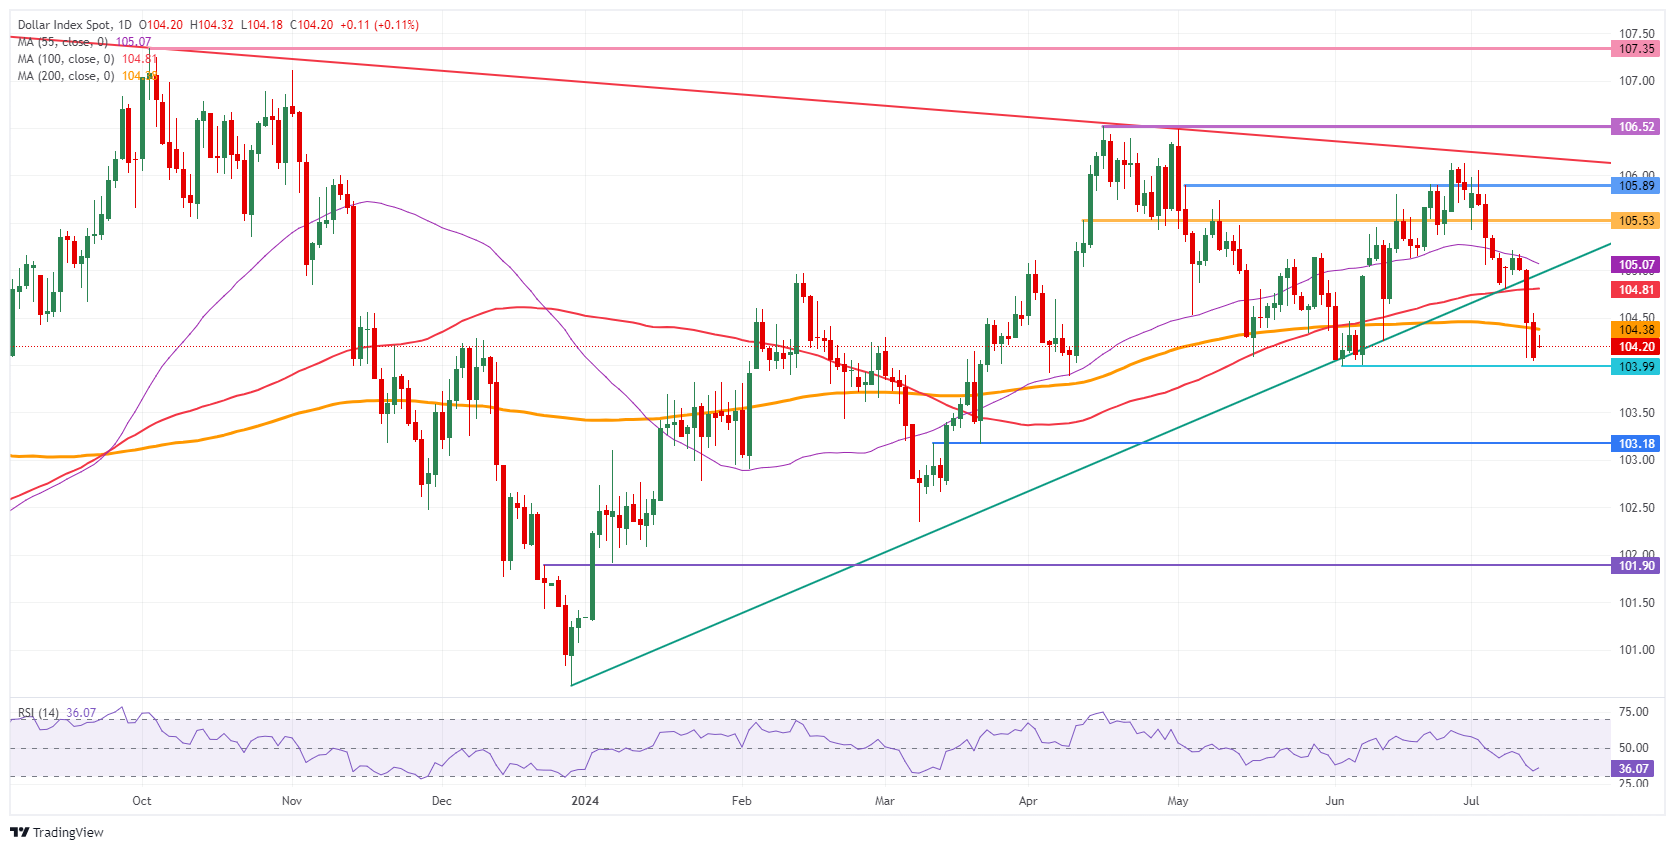
US Dollar Index: Daily Chart
US Dollar FAQs
The US Dollar (USD) is the official currency of the United States of America, and the ‘de facto’ currency of a significant number of other countries where it is found in circulation alongside local notes. It is the most heavily traded currency in the world, accounting for over 88% of all global foreign exchange turnover, or an average of $6.6 trillion in transactions per day, according to data from 2022. Following the second world war, the USD took over from the British Pound as the world’s reserve currency. For most of its history, the US Dollar was backed by Gold, until the Bretton Woods Agreement in 1971 when the Gold Standard went away.
The most important single factor impacting on the value of the US Dollar is monetary policy, which is shaped by the Federal Reserve (Fed). The Fed has two mandates: to achieve price stability (control inflation) and foster full employment. Its primary tool to achieve these two goals is by adjusting interest rates. When prices are rising too quickly and inflation is above the Fed’s 2% target, the Fed will raise rates, which helps the USD value. When inflation falls below 2% or the Unemployment Rate is too high, the Fed may lower interest rates, which weighs on the Greenback.
In extreme situations, the Federal Reserve can also print more Dollars and enact quantitative easing (QE). QE is the process by which the Fed substantially increases the flow of credit in a stuck financial system. It is a non-standard policy measure used when credit has dried up because banks will not lend to each other (out of the fear of counterparty default). It is a last resort when simply lowering interest rates is unlikely to achieve the necessary result. It was the Fed’s weapon of choice to combat the credit crunch that occurred during the Great Financial Crisis in 2008. It involves the Fed printing more Dollars and using them to buy US government bonds predominantly from financial institutions. QE usually leads to a weaker US Dollar.
Quantitative tightening (QT) is the reverse process whereby the Federal Reserve stops buying bonds from financial institutions and does not reinvest the principal from the bonds it holds maturing in new purchases. It is usually positive for the US Dollar.
GDP growth fell sharply to 0.7% q/q in Q2 from 1.5% in Q1, putting the annual growth target (5%) at risk. Supply continued to outperform domestic demand; export outlook is cloudy with rising trade tensions. With monetary policy constrained, fiscal and housing policies will likely need to do the heavy lifting. We expect measured rate and RRR cuts when Fed rate-cut prospects become clearer, Standard Chartered Economist Hunter Chan notes.
GDP growth decelerates in Q2
“GDP growth decelerated in Q2, confirming PMI and other data prints, to 4.7% y/y, versus consensus’ 5.1% and Q1 growth of 5.3%. Nominal GDP only expanded 4.0% y/y, with the deflator staying negative due to deflationary pressures. We maintain our 2024 GDP growth forecast of 4.8% on the assumptions of monetary easing and stronger fiscal support.”
“China’s growth drivers remain uneven. June industrial production (IP) growth remained robust at 5.3% y/y; retail sales and services production growth slowed to 2% y/y and 4.7% y/y, respectively; and property investment continued to contract by c.10% y/y. However, trade tensions are rising, with the US and EU imposing new tariffs on China EVs, and a likely new round of tariffs after the US elections in November.”
“We expect the Politburo, which is likely to convene in late July, to call for concrete measures to boost domestic demand. Ramping up fiscal spending by fully utilising bond issuance proceeds and reducing housing inventory are likely to top the policy agenda. We forecast a 10bps policy rate cut in both Q3 and Q4, and a 25bps cut in the reserve requirement ratio (RRR) in Q3.”
EUR/USD bounce has extended beyond 200-DMA. The pair is inching towards 1.0915/1.0980 (an important hurdle), Societe Generale FX strategists note.
EUR/USD to test the important hurdle at 1.0915/1.0980
“EUR/USD bounce has extended beyond 200-DMA; it is inching towards June peak of 1.0915/1.0980 which could be an important hurdle. Inability to cross can lead to a brief pullback; the MA at 1.0800 should cushion decline.
“Resistances are seen at 1.0915/1.0930, 1.0980 and 1.1010.”
“Supports are seen at 1.0840, 1.0800 and 1.0775.”
The EUR/GBP cross extends the phase of decline after struggling to overcome the crucial graphical hurdle of 0.8500. The cross can extend the down move towards next projections at 0.8340 and 0.8280, Societe Generale FX strategists note.
0.8500 is set to remain a key resistance
“EUR/GBP has extended its phase of decline after struggling to overcome the crucial graphical hurdle of 0.8500 representing the lower limit of previous consolidation zone.”
“It is gradually drifting towards a multi-month descending channel band near 0.8380/0.8370 which could be a potential support zone. An initial bounce can’t be ruled out but 0.8500 could remain a key resistance.”
“Inability to defend 0.8380/0.8370 can extend the down move towards next projections at 0.8340 and 0.8280.”
- Natural Gas edges lower at the start of the week on the EU Gas storage report.
- Traders see European Gas storages top 80%, despite Freeport delays.
- The US Dollar index trades choppy on the back of Trump’s shooting over the weekend.
Natural Gas price (XNG/USD) ticks down on Monday after European data showed Germany’s Gas storage facilities are near 85%, while overall Europe is doing great with 81%. Traders betting on higher Gas prices are facing substantial losses despite their bets on the delay in the reopening of the Texas Freeport plant. The Liquified Natural Gas (LNG) plant is still not producing, taking longer to start after it closed last week because Hurricane Beryl passed through the area.
Meanwhile, the US Dollar Index (DXY), which tracks the Greenback’s value against six major currencies, is trading very choppy, torn by other asset classes in reaction to the shooting of former US President Donald Trump. Equities are in the green while the bond market is selling off in the idea that this might be a pivotal point in the campaign that could put Trump on the front foot for another term in the White House. Bond markets are selling off, with yields higher, because of the concern that the current program that Trump wants to bring forward will widen the US deficit and see the US debt exponentially surge.
Natural Gas is trading at $2.26 per MMBtu at the time of writing.
Natural Gas news and market movers: Mixed headlines
- Bloomberg reports that the Freeport LNG plant in Texas still has not produced any flow worth mentioning since it reduced output for Hurricane Beryl last week.
- European Gas storage facilities are confirmed to be near 81% full, which is above the 71.3% 5-year average and sets the bloc up for passing the next fall and winter quite comfortably.
- Newsbase reports that Novatek is growing its foothold in China by offering cargo for late July in an attempt to penetrate China’s domestic Gas market further.
- China reported weak economic growth figures on Monday, which means the big LNG buyer might come out with sluggish demand, Reuters reports.
Natural Gas Technical Analysis: That very last drop
Natural Gas price is set to cover the last few cents in its decline or correction before touching base near the target of $2.13. The Relative Strength Index (RSI) indicator is near the line in the sand for being oversold, which should subsequently result in a bounce higher. The sluggish overall demand and European storage facilities being ahead of refilling schedules might be the elements that bring it to that level.
The 200-day SMA is the first force to reckon with on the upside, near $2.50, closely followed by the 55-day SMA at $2.63. Once back above, the pivotal level near $3.08 (March 6, 2023, high) remains key resistance after its false break in mid-June.
On the downside, there is not much in the way to $2.13. The only element slowing that move is the RSI, which is already very close to being oversold. So any move or drop will be very quick and short-lived, with buyers ready to buy the dip. In case a big bearish catalyst takes place, $1.53 could not be ruled out in the longer term.
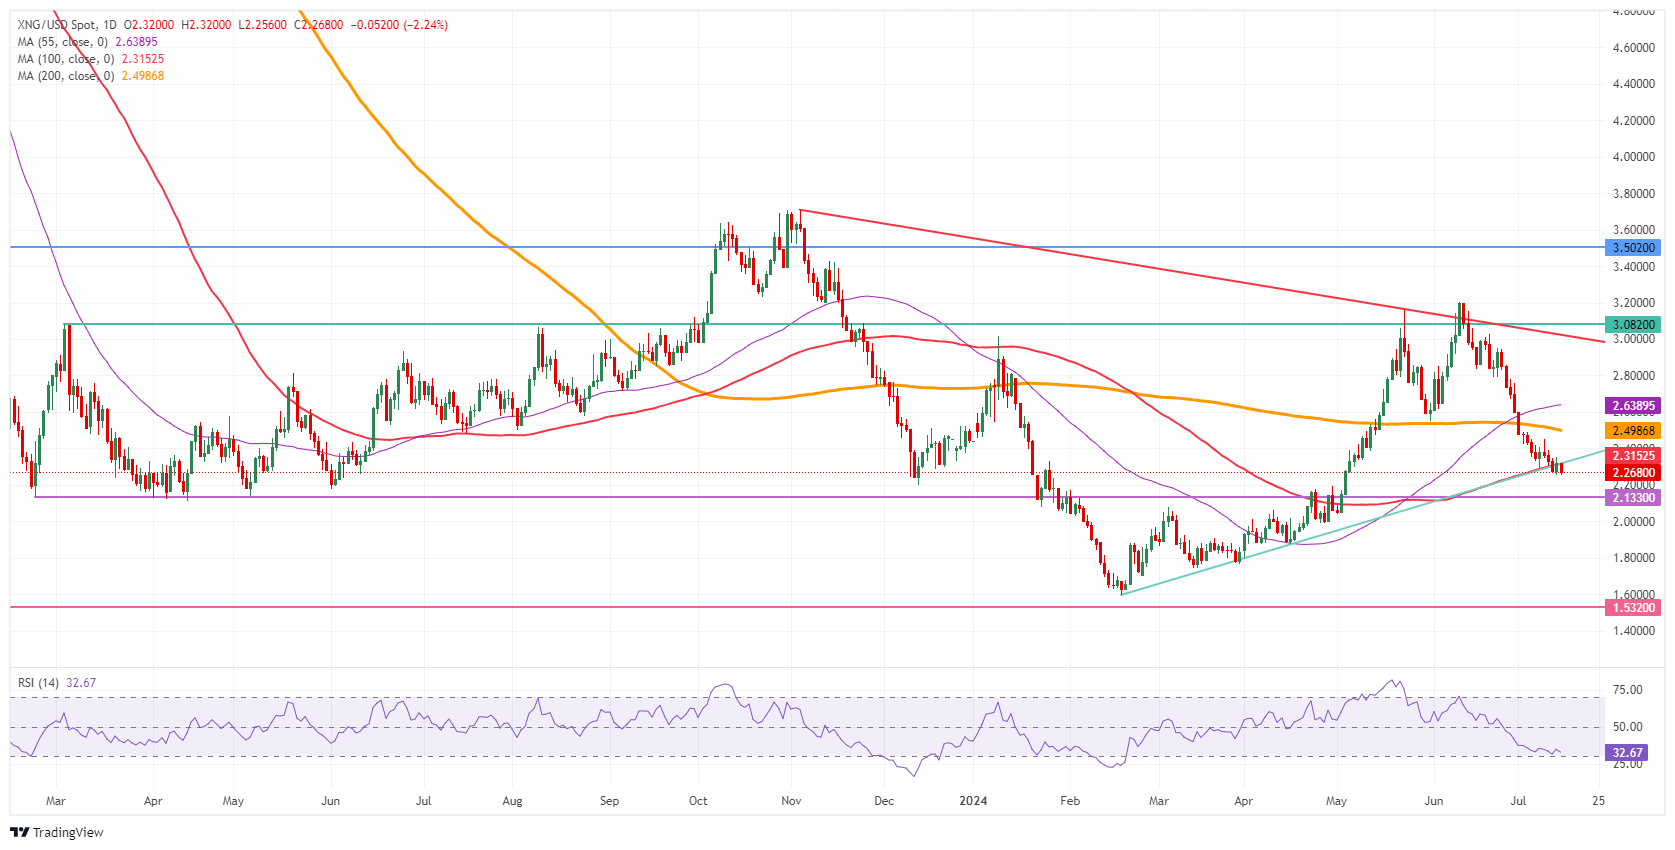
Natural Gas: Daily Chart
Natural Gas FAQs
Supply and demand dynamics are a key factor influencing Natural Gas prices, and are themselves influenced by global economic growth, industrial activity, population growth, production levels, and inventories. The weather impacts Natural Gas prices because more Gas is used during cold winters and hot summers for heating and cooling. Competition from other energy sources impacts prices as consumers may switch to cheaper sources. Geopolitical events are factors as exemplified by the war in Ukraine. Government policies relating to extraction, transportation, and environmental issues also impact prices.
The main economic release influencing Natural Gas prices is the weekly inventory bulletin from the Energy Information Administration (EIA), a US government agency that produces US gas market data. The EIA Gas bulletin usually comes out on Thursday at 14:30 GMT, a day after the EIA publishes its weekly Oil bulletin. Economic data from large consumers of Natural Gas can impact supply and demand, the largest of which include China, Germany and Japan. Natural Gas is primarily priced and traded in US Dollars, thus economic releases impacting the US Dollar are also factors.
The US Dollar is the world’s reserve currency and most commodities, including Natural Gas are priced and traded on international markets in US Dollars. As such, the value of the US Dollar is a factor in the price of Natural Gas, because if the Dollar strengthens it means less Dollars are required to buy the same volume of Gas (the price falls), and vice versa if USD strengthens.
GBP/USD recently broke out from a multi-month ascending triangle. The pair looks poised to inch higher towards next projections at 1.3015 and last year peak of 1.3140/1.3155, Societe Generale FX strategists note.
Cable upward momentum stalls ahead of 1.30
“GBP/USD recently broke out from a multi-month ascending triangle and has crossed above the upper end of the range since March, this points towards potential upside. Daily MACD has entered positive territory denoting regain of upward momentum.”
“The pair looks poised to inch higher towards next projections at 1.3015 and last year peak of 1.3140/1.3155. June high of 1.2860 should be a near term support.”
“GBP/USD: 1.2958 - 1.2984 overnight range. Cable upward momentum stalls ahead of 1.30. Option strike at 1.2970 (£380m). Support 1.2900, resistance 1.3015. CPI, wages in focus this week for BoE. EUR/GBP sub 0.8400, strikes 0.8400 (€585m), 0.8445-60 (€2.1bn).”
- EUR/USD prints a fresh three-week high above 1.0900 as Fed rate-cut bets for September surge.
- Cooling US inflationary pressures have boosted Fed rate-cut bets.
- Investors await Fed Powell’s speech and ECB policy meeting.
The EUR/USD pair refreshes a three-week high slightly above the round-level figure of 1.0900 in Monday’s European session. Sheer strength in the major currency pair is driven by strong possibility of the Federal Reserve (Fed) to begin reducing interest rates from the September meeting and improved appeal of the Euro ahead of the European Central Bank (ECB) policy meeting, which is scheduled for Thursday.
Market sentiment remains risk-on as the Fed is widely anticipated to cut interest rates in September. S&P 500 futures have posted significant gains in European trading hours. The US Dollar Index (DXY), which tracks the Greenback’s value against six major currencies, remains on the backfoot near 104.00.
The Fed rate-cut expectations have been fuelled by easing price pressures and cooling labor market conditions. The United States (US) Consumer Price Index (CPI) report for June showed that the disinflation process has resumed as inflationary pressures grew slower-than-expected for the second straight time.
Meanwhile, investors await Fed Chair Jerome Powell’s speech, which is scheduled for 16:30 GMT. The comments from Fed Powell will indicate when the central bank will start reducing interest rates.
On the other side of the Atlantic, the Euro will dance to the tunes of ECB monetary policy meeting. The ECB is widely anticipated to leave its key rates unchanged. Therefore, investors will majorly focus on the cues about when the ECB will take its second rate-cut decision. On June 6, the ECB lowered its interest rates for the first time since its policy-tightening cycle was initiated in July 2022.
Euro FAQs
The Euro is the currency for the 20 European Union countries that belong to the Eurozone. It is the second most heavily traded currency in the world behind the US Dollar. In 2022, it accounted for 31% of all foreign exchange transactions, with an average daily turnover of over $2.2 trillion a day. EUR/USD is the most heavily traded currency pair in the world, accounting for an estimated 30% off all transactions, followed by EUR/JPY (4%), EUR/GBP (3%) and EUR/AUD (2%).
The European Central Bank (ECB) in Frankfurt, Germany, is the reserve bank for the Eurozone. The ECB sets interest rates and manages monetary policy. The ECB’s primary mandate is to maintain price stability, which means either controlling inflation or stimulating growth. Its primary tool is the raising or lowering of interest rates. Relatively high interest rates – or the expectation of higher rates – will usually benefit the Euro and vice versa. The ECB Governing Council makes monetary policy decisions at meetings held eight times a year. Decisions are made by heads of the Eurozone national banks and six permanent members, including the President of the ECB, Christine Lagarde.
Eurozone inflation data, measured by the Harmonized Index of Consumer Prices (HICP), is an important econometric for the Euro. If inflation rises more than expected, especially if above the ECB’s 2% target, it obliges the ECB to raise interest rates to bring it back under control. Relatively high interest rates compared to its counterparts will usually benefit the Euro, as it makes the region more attractive as a place for global investors to park their money.
Data releases gauge the health of the economy and can impact on the Euro. Indicators such as GDP, Manufacturing and Services PMIs, employment, and consumer sentiment surveys can all influence the direction of the single currency. A strong economy is good for the Euro. Not only does it attract more foreign investment but it may encourage the ECB to put up interest rates, which will directly strengthen the Euro. Otherwise, if economic data is weak, the Euro is likely to fall. Economic data for the four largest economies in the euro area (Germany, France, Italy and Spain) are especially significant, as they account for 75% of the Eurozone’s economy.
Another significant data release for the Euro is the Trade Balance. This indicator measures the difference between what a country earns from its exports and what it spends on imports over a given period. If a country produces highly sought after exports then its currency will gain in value purely from the extra demand created from foreign buyers seeking to purchase these goods. Therefore, a positive net Trade Balance strengthens a currency and vice versa for a negative balance.
The shooting at former US President Trump’s election rally during the weekend has provoked only a limited market reaction. Markets are concerned about policy probabilities, and while individuals may condemn acts of violence against political candidates, they will not necessarily change their policy projections, UBS strategist Paul Donovan notes.
US polarization grows, China’s data lower than expected
“There is a popular perception that acts of violence against a candidate increase their support, but this is not necessarily true. Analysis is complicated by US polarization, and shorter news cycles from social media. This adds to uncertainty without necessarily changing policy probabilities.”
“China released economic data overnight which was generally weak in tone. Second quarter GDP showed less growth than expected, and the June retail sales data signals ongoing weakness in domestic demand. The international implications of China’s data focus on the likely policy response to support domestic growth. The policy mix may have a bearing on China’s demand for commodities.”
“Federal Reserve Chair Powell is giving an interview today, but in the wake of last week’s Congressional testimony markets are unlikely to be too interested. The NY Empire State manufacturing sentiment poll can likewise be overlooked.”
There is a lot to digest from the shocking assassination attempt on former President Trump over the weekend. US politics, which was already very divided, has now been marred with violence, Rabobank’s senior FX strategist Jane Foley notes.
France’s budget concerns to weigh on the Euro
“Market pricing can only respond in a binary manner and, for the markets, the complexities of the US political backdrop have been boiled down to the assumption that the weekend events will lead to an increased chance of Trump winning the November Presidential election. That said, market expectations of a September Fed rate cut have been growing over the past couple of weeks.”
“The recent focus of US politics though has been on the divisions within the Democrat party and specifically on the pressure on President Biden to drop his bid to retain the White House this year. The assassination attempt has triggered a round of accusations that the Democrat campaign has been too focused on criticising Trump. There is still plenty of time for the pressures on Biden to grow.”
“Despite the relief that the second round of France’s parliamentary elections last weekend saw the far right pushed into third place, a considerable amount of uncertainty about the country’s budget remains. We see risk that this will weigh on the Euro (EUR) medium-term. Since this could coincide with a fading of Fed rate cut hopes, we see scope for further dips in EUR/USD potentially to 1.05 on a 3-to-6-month view.”
- Gold price holds gains to near $2,400, driven by growing speculation for Fed rate cuts in September.
- Softer-than-expected US inflation for June indicated that price pressures are on course to return to 2%.
- Investors await Fed Powell’s speech and the US Retail Sales data for June.
Gold price (XAU/USD) rebounds to near $2,400 in Monday’s European session after a modest correction from seven-week high of $2,424 on Thursday. The precious metal edged lower as the US Dollar gained ground after an assassination attack on former United States (US) President Donald Trump improved the US Dollar’s appeal.
The sniper attack on Trump has increased his odds of winning the US Presidential elections later this year. This has led to investors pouring funds into the US Dollar, as Donald Trump is known for favoring protective trade policies, which is a favorable scenario for the Greenback. The US Dollar Index (DXY), which tracks the Greenback’s value against six major currencies, gains firm footing near 104.00.
The higher US Dollar makes the Gold price an expensive bet for investors. However, the near-term outlook of the US Dollar remains weak as the Federal Reserve (Fed) is widely anticipated to begin reducing interest rates from the September meeting.
Daily digest market movers: Gold price struggles to extend gains as US Dollar gains ground
- Gold price recovers after a hiatus in the uptrend near a seven-week high of $2,424, recorded on Thursday. However, the near-term outlook for the Gold price remains firm as US bond yields weaken. US Treasury yields fall as market expectations for the Fed to begin reducing interest rates from the September meeting have accelerated significantly.
- 10-year US Treasury yields edge higher to 4.20% but are close to an almost four-month low. Lower yields on interest-bearing assets reduce the opportunity cost of holding an investment in non-yielding assets, such as Gold.
- The bulging probability of Fed rate cuts is the outcome of easing US consumer inflation and cooling labor market strength. Last week, the US Consumer Price Index (CPI) report for June showed that price pressures decelerated at a faster pace than expected. Soft inflationary pressures boosted confidence that the disinflation process has resumed after a moderate reverse in the first quarter of this year. Also, the monthly headline CPI deflated for the first time in four years.
- This week, investors will majorly focus on the US Retail Sales data for June, which will be published on Tuesday. The Retail Sales report is expected to show that sales at retail stores remained unchanged after a meager growth of 0.1% in May.
- In Monday’s session, investors will focus on Fed Chair Jerome Powell’s speech at the Economic Club of Washington, scheduled at 16:30 GMT. In his latest comments at semi-annual Congressional testimony, Powell acknowledged some progress in inflation but reiterated that policymakers want to see inflation declining for months to gain confidence for interest rate cuts.
Technical Analysis: Gold price trades sideways near $2,400
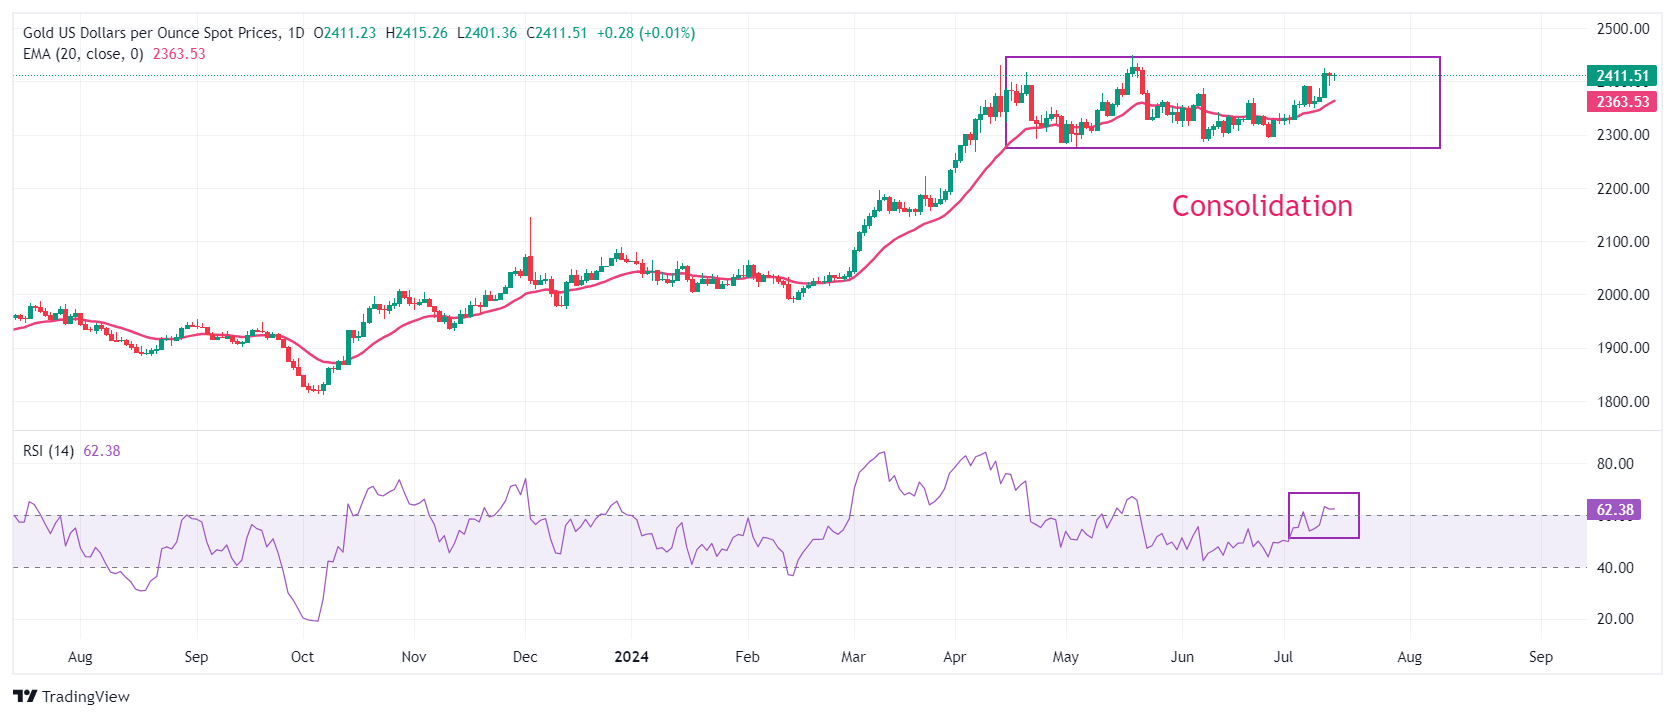
Gold price trades in a tight range, slightly above $2,400. The precious metal seeks more cues about when the Fed will start reducing interest rates. The yellow metal exhibits a consolidation move for the last three months, ranging between $2,277-2,450.
The upward-sloping 20-day Exponential Moving Average (EMA) near $2,363 suggests that the overall trend is bullish.
The 14-day Relative Strength Index (RSI) rises above 60.00 for the first time in more than a month, suggesting more upside ahead due to the absence of signals such as oversold and divergence.
Gold FAQs
Gold has played a key role in human’s history as it has been widely used as a store of value and medium of exchange. Currently, apart from its shine and usage for jewelry, the precious metal is widely seen as a safe-haven asset, meaning that it is considered a good investment during turbulent times. Gold is also widely seen as a hedge against inflation and against depreciating currencies as it doesn’t rely on any specific issuer or government.
Central banks are the biggest Gold holders. In their aim to support their currencies in turbulent times, central banks tend to diversify their reserves and buy Gold to improve the perceived strength of the economy and the currency. High Gold reserves can be a source of trust for a country’s solvency. Central banks added 1,136 tonnes of Gold worth around $70 billion to their reserves in 2022, according to data from the World Gold Council. This is the highest yearly purchase since records began. Central banks from emerging economies such as China, India and Turkey are quickly increasing their Gold reserves.
Gold has an inverse correlation with the US Dollar and US Treasuries, which are both major reserve and safe-haven assets. When the Dollar depreciates, Gold tends to rise, enabling investors and central banks to diversify their assets in turbulent times. Gold is also inversely correlated with risk assets. A rally in the stock market tends to weaken Gold price, while sell-offs in riskier markets tend to favor the precious metal.
The price can move due to a wide range of factors. Geopolitical instability or fears of a deep recession can quickly make Gold price escalate due to its safe-haven status. As a yield-less asset, Gold tends to rise with lower interest rates, while higher cost of money usually weighs down on the yellow metal. Still, most moves depend on how the US Dollar (USD) behaves as the asset is priced in dollars (XAU/USD). A strong Dollar tends to keep the price of Gold controlled, whereas a weaker Dollar is likely to push Gold prices up.
The US Dollar (USD) net long positions slipped further for the third week in a row. The Euro (EUR) positions popped back into positive ground, driven by a drop in short positions. The Pound Sterling (GBP) net long positions have jumped for a second week, Rabobank’s FX strategists Jane Foley and Molly Schwartz note.
GBP gains ground for a second week
“USD net long positions slipped further for the third week in a row, as both long and short positions dropped. The softening in US economic data has continued, resulting in a bolstered outlook for a Fed rate cut in September. That said, the assassination attempt on former President Trump has bolstered the USD in the spot market as betting odds point to an increased chance of him taking the White House.”
“EUR positions popped back into positive ground, driven by a drop in short positions. The market was relieved that the far-right was pushed into third place in the second round of the French parliamentary election. That said, plenty of uncertainty remains regarding the outlook for France’s budget. The ECB is widely expected to leave rates on hold this week.”
“GBP net long positions have jumped for a second week, driven by an increase in long positions. GBP overtook the USD as the best performing G7 currency in the year to date helped by hopes of post-UK-election political stability and some question marks over a BoE rate cut in August. UK CPI inflation data are in view in the week ahead.”
- USD/CAD surrenders its entire intraday gains and turns negative as the US Dollar falls back due to firm Fed rate-cut prospects.
- Intraday gains in the US Dollar were driven by an assassination attack on US former President Donald Trump.
- The Canadian Dollar will dance to the tunes of Canada’s inflation data for June.
The USD/CAD pair faces severe selling pressure in an attempt to extend recovery above 1.3660 and turns negative in Monday’s European session. The Loonie asset weakens as the US Dollar (USD) surrenders its gains, which were driven by improved speculation that Donald Trump will win the United States (US) Presidential elections later this year.
The assassination attempt on Donald Trump in Pennsylvania has increased the odds of him having an upper hand on the Joe Biden-led-Democratic Party.
The US Dollar Index (DXY), which tracks the Greenback’s value against six major currencies, retreats from intraday high of 104.32. The USD Index has dropped to near monthly low around 104.00 and is expected to see more weakens as investors see growing speculation for the Federal Reserve (Fed) to begin reducing interest rates from the September meeting as a done deal.
Meanwhile, the Canadian Dollar (CAD) exhibits strength against the US Dollar with a focus on Canada’s Consumer Price Index (CPI) report for June, which will be published on Tuesday. Canada’s month-on-month headline CPI is estimated to have grown at a slower pace of 0.1% from May’s reading of 0.6%.
USD/CAD demonstrates a sheer volatility contraction, trading in a limited range of 1.3600-1.3780 from more than two months. A volatility contraction suggests lower volume and small ticks, while a breakout in the same results in wider ticks and heavy volume.
The asset trades below the 20-day Exponential Moving Average (EMA) near 1.3663, suggesting that the near-term outlook is bearish.
The 14-period Relative Strength Index (RSI) oscillates inside the 40.00-60.00 range, indicating indecisiveness among market participants.
Going forward, a decisive breakdown below May 3 low around 1.3600 will expose the asset to April 9 low around 1.3547 and the psychological support of 1.3500.
On the flip side, a fresh buying opportunity would emerge if the asset breaks above June 11 high near 1.3800. This would drive the asset towards April 17 high at 1.3838, followed by 1 November 2023 high at 1.3900.
USD/CAD daily chart
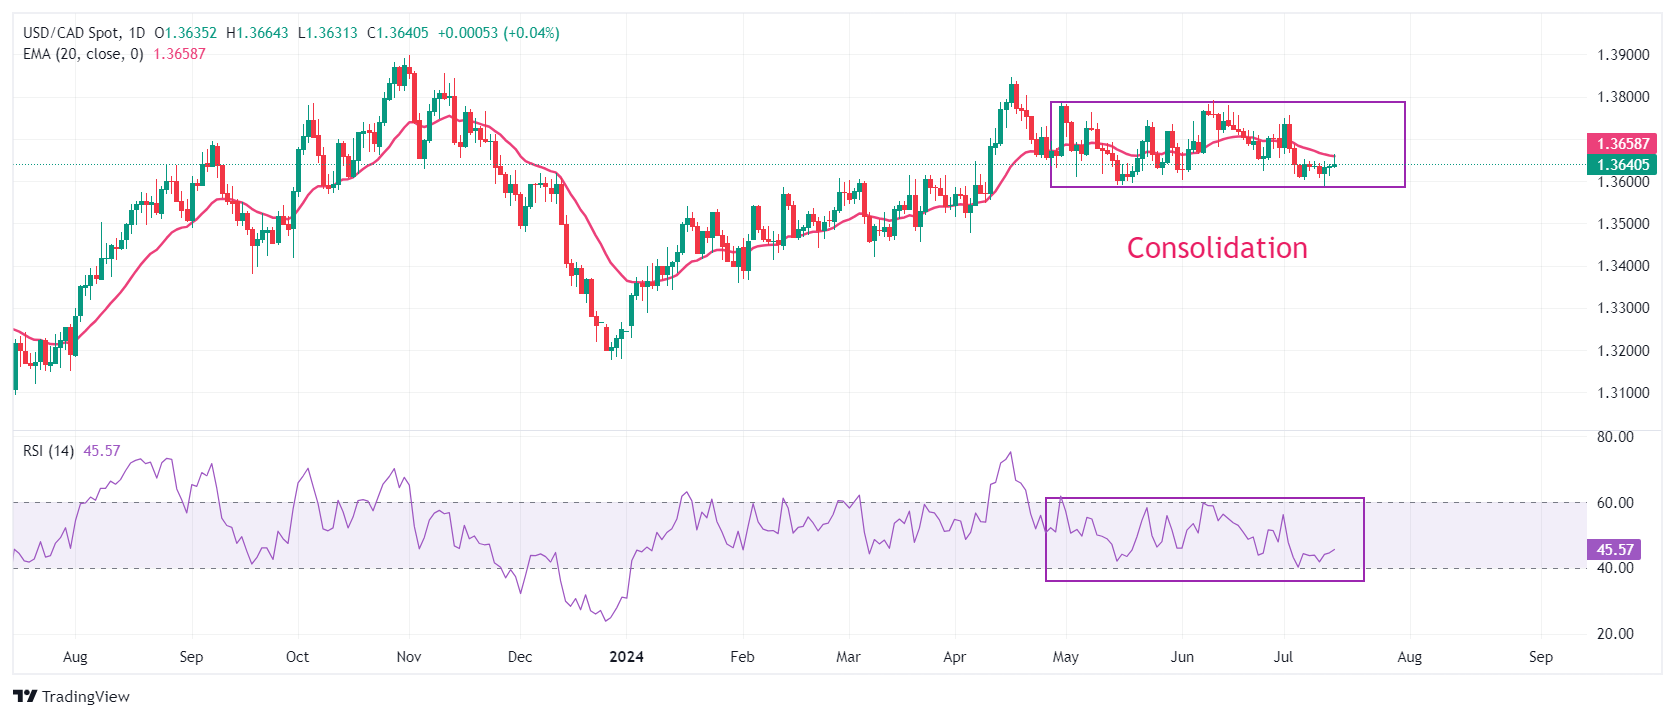
Economic Indicator
Consumer Price Index (MoM)
The Consumer Price Index (CPI), released by Statistics Canada on a monthly basis, represents changes in prices for Canadian consumers by comparing the cost of a fixed basket of goods and services. The MoM figure compares the prices of goods in the reference month to the previous month. Generally, a high reading is seen as bullish for the Canadian Dollar (CAD), while a low reading is seen as bearish.
Read more.Next release: Tue Jul 16, 2024 12:30
Frequency: Monthly
Consensus: 0.1%
Previous: 0.6%
Source: Statistics Canada
China’s exports rose for the third straight month in Jun but imports unexpectedly contracted. The low base effect will continue to support a strong headline export growth in 3Q24, UOB Group Economist Ho Woei Chen notes.
China’s exports rise, imports decline
“China’s exports rose for the third straight month in Jun but imports unexpectedly contracted. As a result, the trade surplus rose to a record high of US$99.05 bn.”
“The 2Q24 GDP due for release on Mon (15 Jul) is forecast to moderate after turning stronger in 1Q24. The sustained recovery in external demand as seen in the Jun exports, may help to offset a more lackluster domestic consumption and investment.”
“The low base effect will continue to support a strong headline export growth in 3Q24 while measures to increase domestic consumption and industrial modernization could help boost import demand ahead. We retain our forecast for China’s export and import growth in 2024 at 7.0% (2023: -4.6%) and 6.0% (2023: -5.5%) respectively.”
US Jun CPI surprised with a -0.1% m/m fall, the first decline since the start of the pandemic while core inflation rose by 0.1% the slowest m/m pace since Jan 2021, UOB Group FX analyst Alvin Liew note.
No change to the view for two 25 bps cuts in 2024
“The latest price outturn was seen as a further step in the right direction after the multiple upside price surprises in 1Q. Housing costs rose at a softer pace while back-to-back gasoline price falls led the energy index lower. Core services inflation also softened for the 2nd month in a row.”
“2024 US Inflation Outlook: We still expect headline CPI inflation to average 2.5% in 2024 (down from the 4.1% recorded in 2023), while core inflation may also ease but at an average of 2.8% in 2024, still a significant moderation from 4.8% in 2023, but above the Fed’s 2% objective.”
“We think the Federal Reserve (Fed) will keep its current Fed Funds Target Rate (FFTR) steady at 5.25-5.50% for the upcoming Jul FOMC, and it is now seen more likely to start to ease monetary policy in Sep. We reiterate our base case where we factor 50 bps of rate cuts for the remainder of 2024, i.e. two 25-bps cuts, one each in Sep 24 and Dec 24.”
Risk for is for the US Dollar (USD) rising, but any advance is expected to face strong resistance at 7.2910, UOB Group FX analysts Quek Ser Leang and Lee Sue Ann note.
USD to trade with a downward bias towards 7.2400
24-HOUR VIEW: “We highlighted last Friday that USD ‘could test 7.2550 first before stabilisation is likely.’ Our view did not materialise as USD traded between 7.2634 and 7.2784. While USD closed largely unchanged at 7.2710 (+0.05%), it opened and traded on a strong footing in Asia today. Upward momentum is improving, and the risk for USD rising today. However, any advance is expected to face strong resistance at 7.2910. On the downside, support levels are at 7.2750 and 7.2650.”
1-3 WEEKS VIEW: “Last Friday (12 Jul, spot at 7.2685), we were of the view that USD ‘is likely to trade with a downward bias towards 7.2400.’ We highlighted that ‘the downward bias is intact as long as USD remains below 7.2910.’ There is no chance in our view.”
The US Dollar (USD) is expected to trade in a 157.55/159.55 range. Scope for USD to continue to weaken; it is too early to determine if the significant support at 155.50 will come into view, UOB Group FX analysts Quek Ser Leang and Lee Sue Ann note.
Support at 155.50 seems unreachable for now
24-HOUR VIEW: “We indicated last Friday that USD 'could continue to trade in a volatile manner, probably between 157.30 and 160.00.' USD then fluctuated between 157.37 and 159.44, closing at 157.89 (-0.57%). The price action provides no fresh clues. Today, we expect USD to trade in a range of 157.55/159.55.”
1-3 WEEKS VIEW: “We continue to hold the same view as last Friday (12 Jul, spot at 159.00). As indicated, after the outsized drop last Thursday, there is scope for JPY to continue to weaken. However, it is too early to determine if the significant support level at 155.50 will come into view. All in all, the near-term bias is on the downside, as long as USD remains below 160.70 (‘strong resistance’ was at 161.00 last Friday).”
The New Zealand Dollar (NZD) is expected to trade in a 0.6070/0.6115, or, at least, in a broader range between 0.6045 and 0.6145, UOB Group FX analysts Quek Ser Leang and Lee Sue Ann note.
All eyes on 0.6115
24-HOUR VIEW: “Last Thursday, NZD popped to a high of 0.6134 and then pulled back. On Friday, when NZD was trading at 0.6090, we indicated that 'the brief advance did not result in any increase in momentum,' and we expected NZD to trade in a 0.6065/0.6130 range. Our view of range trading was not wrong, even though NZD traded in a narrower range than expected (0.6077/0.6126). Further range trading seems likely, but the slightly softened underlying tone suggests a lower range of 0.6070/0.6115.”
1-3 WEEKS VIEW: “Our update from last Friday (12 Jul, spot at 0.6090) still stands. As highlighted, the current price movements are likely part of a range trading phase, probably between 0.6045 and 0.6155.”
Silver prices (XAG/USD) fell on Monday, according to FXStreet data. Silver trades at $30.70 per troy ounce, down 0.29% from the $30.79 it cost on Friday.
Silver prices have increased by 29.03% since the beginning of the year.
| Unit measure | Silver Price Today in USD |
|---|---|
| Troy Ounce | 30.70 |
| 1 Gram | 0.99 |
The Gold/Silver ratio, which shows the number of ounces of Silver needed to equal the value of one ounce of Gold, stood at 78.52 on Monday, up from 78.30 on Friday.
Silver FAQs
Silver is a precious metal highly traded among investors. It has been historically used as a store of value and a medium of exchange. Although less popular than Gold, traders may turn to Silver to diversify their investment portfolio, for its intrinsic value or as a potential hedge during high-inflation periods. Investors can buy physical Silver, in coins or in bars, or trade it through vehicles such as Exchange Traded Funds, which track its price on international markets.
Silver prices can move due to a wide range of factors. Geopolitical instability or fears of a deep recession can make Silver price escalate due to its safe-haven status, although to a lesser extent than Gold's. As a yieldless asset, Silver tends to rise with lower interest rates. Its moves also depend on how the US Dollar (USD) behaves as the asset is priced in dollars (XAG/USD). A strong Dollar tends to keep the price of Silver at bay, whereas a weaker Dollar is likely to propel prices up. Other factors such as investment demand, mining supply – Silver is much more abundant than Gold – and recycling rates can also affect prices.
Silver is widely used in industry, particularly in sectors such as electronics or solar energy, as it has one of the highest electric conductivity of all metals – more than Copper and Gold. A surge in demand can increase prices, while a decline tends to lower them. Dynamics in the US, Chinese and Indian economies can also contribute to price swings: for the US and particularly China, their big industrial sectors use Silver in various processes; in India, consumers’ demand for the precious metal for jewellery also plays a key role in setting prices.
Silver prices tend to follow Gold's moves. When Gold prices rise, Silver typically follows suit, as their status as safe-haven assets is similar. The Gold/Silver ratio, which shows the number of ounces of Silver needed to equal the value of one ounce of Gold, may help to determine the relative valuation between both metals. Some investors may consider a high ratio as an indicator that Silver is undervalued, or Gold is overvalued. On the contrary, a low ratio might suggest that Gold is undervalued relative to Silver.
(An automation tool was used in creating this post.)
The Australian Dollar (AUD) is expected to trade in a range between 0.6745 and 0.6790. Room for AUD to continue to rise, but it has to surpass 0.6800 before further advance can be expected, UOB Group FX analysts Quek Ser Leang and Lee Sue Ann note.
AUD may reach 0.6800 if it breaks above 0.6790
24-HOUR VIEW: “Last Friday, we expected AUD to trade in a 0.6740/0.6785 range. AUD then traded in a higher range of 0.6755/0.6794. The price action did not result in any clear increase in momentum, and we continue to expect AUD to trade in a range, probably between 0.6745 and 0.6790.”
1-3 WEEKS VIEW: “Not much has changed since our update from last Friday (12 Jul, spot at 0.6765). As highlighted, while there is room for AUD to continue to rise, it has to surpass 0.6800 before further advance can be expected. Given the overbought conditions, it remains to be seen if AUD can break above 0.6800. Overall, only a breach of 0.6735 (‘strong support’ level was at 0.6725 last Friday) would indicate that the AUD strength from two weeks ago has come to an end.”
The Pound Sterling (GBP) could pullback, but any decline is unlikely to threaten the support at 1.2915. Risk remains on the upside; overbought conditions suggest 1.3000 might not come into view so soon, UOB Group FX analysts Quek Ser Leang and Lee Sue Ann note.
All eyes on 1.3000
24-HOUR VIEW: “After GBP rose sharply last Thursday, we indicated on Friday that ‘the overbought advance could extend to 1.2970 before a pullback can be expected.’ We also indicated that ‘the next major resistance at 1.3000 is unlikely to come into view.’ GBP then advanced more than expected, reaching a high of 1.2991. GBP closed at 1.2990 but opened lower today. The advance remains overbought, and GBP is unlikely to rise further. Today, it could pullback, but any decline is unlikely to threaten the support at 1.2915 (minor support is at 1.2940). Resistance levels are at 1.2985 and 1.3000.”
1-3 WEEKS VIEW: “We have held a positive view in GBP since early this month. Last Friday (12 Jul, spot at 1.2925), we pointed out that ‘the risk remains on the upside, but overbought conditions suggest 1.3000 might not come into view so soon.’ GBP subsequently rose to 1.2991. While overbought short-term conditions could lead to a slight pullback within these 1 to 2 days, as long as 1.2870 (‘strong support’ level was at 1.2855 last Friday) is not breached, there is still a chance for GBP to rise to 1.3000.”
- EUR/GBP rebounds from 0.8386, the lowest level since August 2022.
- ECB’s Lagarde suggested being mindful that the growth outlook remains uncertain.
- The British Pound could limit its losses as investors view UK markets more attractive investment destination.
EUR/GBP halts its losing streak, trading around 0.8400 during the European hours on Monday. The Euro may find support as expectations for further rate cuts by the European Central Bank (ECB) diminish. Investors foresee inflation pressures remaining steady through 2024.
ECB President Christine Lagarde highlighted a cautious stance this month, stating, “The strong labour market means that we can take time to gather new information, but we also need to be mindful of the fact that the growth outlook remains uncertain.”
On the other hand, the British Pound (GBP) could limit its losses as investors view the United Kingdom (UK) markets as a more attractive investment destination compared to the European Union, which faces political uncertainties. The decisive victory of Keir Starmer’s Labour Party has assured stable fiscal policies and smooth ministerial appointments.
The UK's new Chancellor, Rachel Reeves, has pledged to stimulate growth and investment, focusing on the supply side due to limited government spending capacity. This pledge comes amid deepening uncertainty over the timeframe for Bank of England (BoE) rate cuts, which has been a significant factor in GBP’s strength. Traders anticipate the BoE to start lowering interest rates at the August meeting.
Traders will assess Eurozone industrial production numbers for May on Monday, which can provide additional insights into European Central Bank policy. On the UK front, Office for National Statistics (ONS) will publish the inflation and employment data later in the week.
Interest rates FAQs
Interest rates are charged by financial institutions on loans to borrowers and are paid as interest to savers and depositors. They are influenced by base lending rates, which are set by central banks in response to changes in the economy. Central banks normally have a mandate to ensure price stability, which in most cases means targeting a core inflation rate of around 2%. If inflation falls below target the central bank may cut base lending rates, with a view to stimulating lending and boosting the economy. If inflation rises substantially above 2% it normally results in the central bank raising base lending rates in an attempt to lower inflation.
Higher interest rates generally help strengthen a country’s currency as they make it a more attractive place for global investors to park their money.
Higher interest rates overall weigh on the price of Gold because they increase the opportunity cost of holding Gold instead of investing in an interest-bearing asset or placing cash in the bank. If interest rates are high that usually pushes up the price of the US Dollar (USD), and since Gold is priced in Dollars, this has the effect of lowering the price of Gold.
The Fed funds rate is the overnight rate at which US banks lend to each other. It is the oft-quoted headline rate set by the Federal Reserve at its FOMC meetings. It is set as a range, for example 4.75%-5.00%, though the upper limit (in that case 5.00%) is the quoted figure. Market expectations for future Fed funds rate are tracked by the CME FedWatch tool, which shapes how many financial markets behave in anticipation of future Federal Reserve monetary policy decisions.
Here is what you need to know on Monday, July 15:
Markets have started the new week in a cautious manner following news of an assassination attempt on former President Donald Trump. The economic calendar will not feature any high-impact data releases on Monday. Later in the American session, Federal Reserve (Fed) Chairman Jerome Powell will be delivering a speech at the Economic Club of Washington.
US Dollar PRICE Last 7 days
The table below shows the percentage change of US Dollar (USD) against listed major currencies last 7 days. US Dollar was the weakest against the Japanese Yen.
| USD | EUR | GBP | JPY | CAD | AUD | NZD | CHF | |
|---|---|---|---|---|---|---|---|---|
| USD | -0.62% | -1.33% | -1.80% | -0.06% | -0.56% | 0.66% | -0.17% | |
| EUR | 0.62% | -0.51% | -0.88% | 0.88% | 0.22% | 1.63% | 0.79% | |
| GBP | 1.33% | 0.51% | -0.41% | 1.42% | 0.73% | 2.15% | 1.31% | |
| JPY | 1.80% | 0.88% | 0.41% | 1.78% | 1.28% | 2.67% | 1.72% | |
| CAD | 0.06% | -0.88% | -1.42% | -1.78% | -0.54% | 0.72% | -0.09% | |
| AUD | 0.56% | -0.22% | -0.73% | -1.28% | 0.54% | 1.41% | 0.57% | |
| NZD | -0.66% | -1.63% | -2.15% | -2.67% | -0.72% | -1.41% | -0.83% | |
| CHF | 0.17% | -0.79% | -1.31% | -1.72% | 0.09% | -0.57% | 0.83% |
The heat map shows percentage changes of major currencies against each other. The base currency is picked from the left column, while the quote currency is picked from the top row. For example, if you pick the US Dollar from the left column and move along the horizontal line to the Japanese Yen, the percentage change displayed in the box will represent USD (base)/JPY (quote).
Following the sharp decline seen in the second half of the previous week, the US Dollar Index stays in a consolidation phase above 104.00 in the early European session on Monday. The benchmark 10-year US Treasury bond yield fluctuates above 4.2% and US stock index futures trade modestly higher.
During the Asian trading hours, the data from China showed that the Gross Domestic Product (GDP) expanded at an annual pace of 4.7% in the second quarter. This reading followed the 5.3% growth recorded in the first quarter and came in worse than the market expectation for an expansion of 5.1%. Meanwhile, Retail Sales grew 2% on a yearly basis in June, falling short of analysts' estimate of 3.3%, and Industrial Production expanded 5.3%, down from 5.6% in May.
AUD/USD fluctuates in a tight channel slightly below 0.6800 following the disappointing Chinese data.
EUR/USD gained more than 0.6% last week and registered its highest weekly close since early March. The pair stays in a consolidation phase and trades at around 1.0900 in the European morning on Monday.
GBP/USD rose more than 1% for the second consecutive time last week and touched a yearly high. The pair currently trades in a tight channel slightly below 1.3000.
Following the upsurge seen on Thursday, Gold struggled to preserve its bullish momentum and registered small losses on Friday. Nevertheless, XAU/USD manages to hold steady above $2,400 at the beginning of the week.
After suffering heavy losses in the second half of the previous week, USD/JPY finds it difficult to stage a recovery. The pair was last seen trading modestly lower on the day below 158.00.
Risk sentiment FAQs
In the world of financial jargon the two widely used terms “risk-on” and “risk off'' refer to the level of risk that investors are willing to stomach during the period referenced. In a “risk-on” market, investors are optimistic about the future and more willing to buy risky assets. In a “risk-off” market investors start to ‘play it safe’ because they are worried about the future, and therefore buy less risky assets that are more certain of bringing a return, even if it is relatively modest.
Typically, during periods of “risk-on”, stock markets will rise, most commodities – except Gold – will also gain in value, since they benefit from a positive growth outlook. The currencies of nations that are heavy commodity exporters strengthen because of increased demand, and Cryptocurrencies rise. In a “risk-off” market, Bonds go up – especially major government Bonds – Gold shines, and safe-haven currencies such as the Japanese Yen, Swiss Franc and US Dollar all benefit.
The Australian Dollar (AUD), the Canadian Dollar (CAD), the New Zealand Dollar (NZD) and minor FX like the Ruble (RUB) and the South African Rand (ZAR), all tend to rise in markets that are “risk-on”. This is because the economies of these currencies are heavily reliant on commodity exports for growth, and commodities tend to rise in price during risk-on periods. This is because investors foresee greater demand for raw materials in the future due to heightened economic activity.
The major currencies that tend to rise during periods of “risk-off” are the US Dollar (USD), the Japanese Yen (JPY) and the Swiss Franc (CHF). The US Dollar, because it is the world’s reserve currency, and because in times of crisis investors buy US government debt, which is seen as safe because the largest economy in the world is unlikely to default. The Yen, from increased demand for Japanese government bonds, because a high proportion are held by domestic investors who are unlikely to dump them – even in a crisis. The Swiss Franc, because strict Swiss banking laws offer investors enhanced capital protection.
The Euro (EUR) is expected to trade in a range in the short run, likely between 1.0855 and 1.0905. In the longer run, EUR is expected to continue to rise, but it might take a while before 1.0915 comes into view, UOB Group FX analysts Quek Ser Leang and Lee Sue Ann note.
To likely trade between 1.0855 and 1.0905
24-HOUR VIEW: “Last Friday, we expected EUR to trade in a range between 1.0845 and 1.0900. Our expectations were incorrect. Instead of trading in a range, EUR rose to a high of 1.0911. While EUR closed at 1.0906 (+0.38%), it opened lower in early Sydney trade today. The strong rise over late last week appears to be overstretched, and we continue to expect EUR to trade in a range, likely between 1.0855 and 1.0905.”
1-3 WEEKS VIEW: “We highlighted last Friday (12 Jul, spot at 1.0865) that EUR ‘is expected to continue to rise.’ We also highlighted that ‘severely overbought conditions suggest it might take a couple of days before 1.0915 comes into view.’ EUR subsequently rose to a high of 1.0911. While upward momentum has slowed somewhat, there is still a chance for EUR to rise to 1.0915. Only a breach of 1.0835 (‘strong support’ level previously at 1.0825) would suggest that the EUR strength from more than a week ago has ended.”
- The Pound Sterling rises to near 1.3000 against the US Dollar as the Fed looks set to start reducing interest rates in September.
- Hot US PPI report fails to diminish Fed rate cut bets.
- Investors await the UK inflation and employment data for fresh guidance on BoE interest rates.
The Pound Sterling (GBP) clings to gains slightly below the psychological resistance of 1.3000 against the US Dollar (USD) in Monday’s London session. The GBP/USD pair remains firm amid swelling expectations that the Federal Reserve (Fed) will start reducing interest rates from the September meeting.
Investors’ confidence in the possibility of the Fed reducing interest rates in September remains firm even though the United States (US) Producer Price Index (PPI) data for June, released on Friday, grew at a faster pace than expected. Both headline and core producer inflation were higher than expected on a monthly as well as an annual basis due to a significant increase in the cost of services.
Market speculation for Fed rate cuts rose significantly on Thursday after the US Consumer Price Index (CPI) report for June indicated that the disinflation process has resumed after halting in the first quarter of this year. Inflationary pressures decelerated on headline as well as the core front. The probability of the Fed cutting its key interest rates also grew because of visible cracks in the labor market.
Meanwhile, the US Dollar Index (DXY), which tracks the Greenback’s value against six major currencies, gains ground near 104.00. The USD Index finds cushion as investors rush to safe-haven after an assassination attempt on former US President Donald Trump in Pennsylvania. The situation has resulted in increased odds of Trump winning the US Presidential elections this year.
However, the near-term appeal of the US Dollar remains bearish as investors see the Fed lowering borrowing rates in September as a done deal. This week, investors will keenly focus on the US monthly Retail Sales data for June, which will be published on Tuesday. Economists have estimated that Retail Sales remained unchanged after a meager growth of 0.1% in May.
Daily digest market movers: Pound Sterling strengthens ahead of UK inflation and employment data
- The Pound Sterling gains against its major peers on Monday. The British currency strengthens as investors see the United Kingdom (UK) markets as a better spot for investments. Unlike the European Union and the US economy battling political uncertainty, the outright victory of Keir Starmer’s Labour Party has assured stable fiscal policies and smooth ministry distribution.
- Apart from that, deepening uncertainty over the timeframe for Bank of England (BoE) rate cuts has been a major catalyst to Sterling’s strength. Currently, financial markets expect the BoE to begin lowering interest rates from the August meeting. On the contrary, BoE policymakers hesitate to favor rate cuts in August as they worry about high inflation in the service sector due to strong wage growth. The pace at which wages are growing is roughly double than what is needed to restore price stability.
- This week, the uncertainty over the BoE rate-cut timeframe will wane to some extent as the UK Office for National Statistics (ONS) will publish the inflation and employment data on Wednesday and Thursday, respectively. The core CPI, which excludes volatile food and energy prices, is expected to have decelerated to 3.4% from May’s reading of 3.5%. Annual Average Earnings Including Bonus for the three months ending in May are estimated to have softened to 5.7% from the former release of 5.9%.
Pound Sterling Price Today:
British Pound PRICE Today
The table below shows the percentage change of British Pound (GBP) against listed major currencies today. British Pound was the strongest against the New Zealand Dollar.
| GBP | EUR | USD | JPY | CAD | AUD | NZD | CHF | |
|---|---|---|---|---|---|---|---|---|
| GBP | 0.02% | 0.10% | 0.00% | 0.14% | 0.03% | 0.28% | 0.15% | |
| EUR | -0.02% | 0.05% | -0.10% | 0.15% | 0.00% | 0.31% | 0.12% | |
| USD | -0.10% | -0.05% | -0.16% | 0.09% | 0.11% | 0.25% | 0.07% | |
| JPY | 0.00% | 0.10% | 0.16% | 0.25% | 0.05% | 0.38% | 0.04% | |
| CAD | -0.14% | -0.15% | -0.09% | -0.25% | -0.05% | 0.17% | -0.02% | |
| AUD | -0.03% | -0.01% | -0.11% | -0.05% | 0.05% | 0.29% | 0.14% | |
| NZD | -0.28% | -0.31% | -0.25% | -0.38% | -0.17% | -0.29% | -0.19% | |
| CHF | -0.15% | -0.12% | -0.07% | -0.04% | 0.02% | -0.14% | 0.19% |
The heat map shows percentage changes of major currencies against each other. The base currency is picked from the left column, while the quote currency is picked from the top row. For example, if you pick the British Pound from the left column and move along the horizontal line to the US Dollar, the percentage change displayed in the box will represent GBP (base)/USD (quote).
Technical Analysis: Pound Sterling refreshes annual high at 1.3000
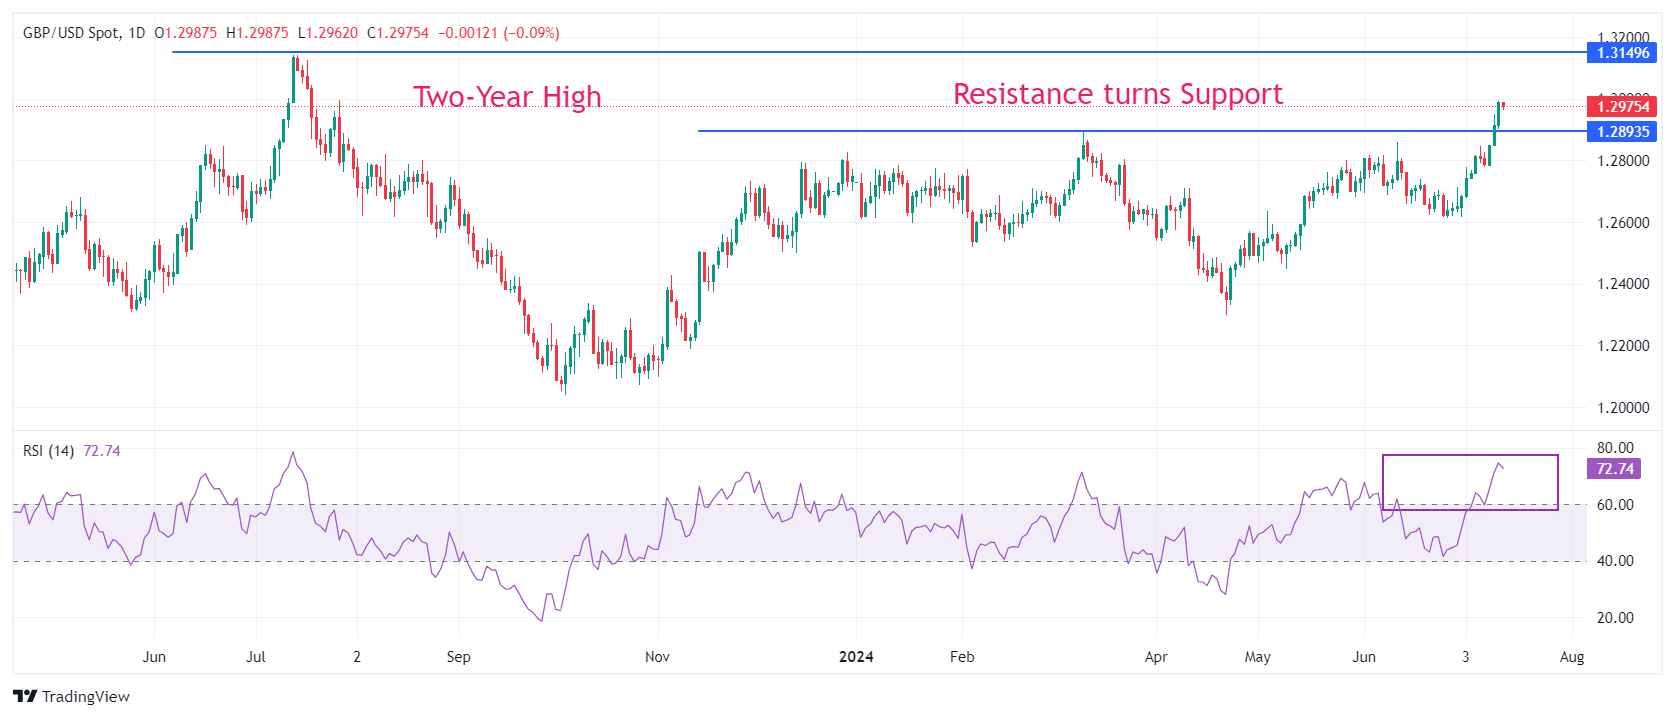
The Pound Sterling posted a fresh annual high at 1.3000 against the US Dollar on Friday. The near-term appeal of the GBP/USD pair has strengthened after a breakout above the March 8 high near 1.2900. The Cable is expected to extend its upside towards a two-year high near 1.3140.
All short-to-long-term Exponential Moving Averages (EMAs) are sloping higher, suggesting a strong bullish trend.
The 14-day Relative Strength Index (RSI) jumps to nearly 70.00 for the first time in more than a year, indicating a strong momentum towards the upside.
Pound Sterling FAQs
The Pound Sterling (GBP) is the oldest currency in the world (886 AD) and the official currency of the United Kingdom. It is the fourth most traded unit for foreign exchange (FX) in the world, accounting for 12% of all transactions, averaging $630 billion a day, according to 2022 data. Its key trading pairs are GBP/USD, aka ‘Cable’, which accounts for 11% of FX, GBP/JPY, or the ‘Dragon’ as it is known by traders (3%), and EUR/GBP (2%). The Pound Sterling is issued by the Bank of England (BoE).
The single most important factor influencing the value of the Pound Sterling is monetary policy decided by the Bank of England. The BoE bases its decisions on whether it has achieved its primary goal of “price stability” – a steady inflation rate of around 2%. Its primary tool for achieving this is the adjustment of interest rates. When inflation is too high, the BoE will try to rein it in by raising interest rates, making it more expensive for people and businesses to access credit. This is generally positive for GBP, as higher interest rates make the UK a more attractive place for global investors to park their money. When inflation falls too low it is a sign economic growth is slowing. In this scenario, the BoE will consider lowering interest rates to cheapen credit so businesses will borrow more to invest in growth-generating projects.
Data releases gauge the health of the economy and can impact the value of the Pound Sterling. Indicators such as GDP, Manufacturing and Services PMIs, and employment can all influence the direction of the GBP. A strong economy is good for Sterling. Not only does it attract more foreign investment but it may encourage the BoE to put up interest rates, which will directly strengthen GBP. Otherwise, if economic data is weak, the Pound Sterling is likely to fall.
Another significant data release for the Pound Sterling is the Trade Balance. This indicator measures the difference between what a country earns from its exports and what it spends on imports over a given period. If a country produces highly sought-after exports, its currency will benefit purely from the extra demand created from foreign buyers seeking to purchase these goods. Therefore, a positive net Trade Balance strengthens a currency and vice versa for a negative balance.
- Silver price loses ground following mixed data from China, the world's largest manufacturing hub.
- China's GDP (YoY) grew by 4.7% in Q2, down from the previous expansion of 5.3% and below the expected 5.1%.
- The higher US Dollar puts pressure on Silver as USD-denominated commodities become more expensive for foreign buyers.
Silver price (XAG/USD) extends losses for the second successive day, trading around $30.60 per troy ounce during the early European session on Monday. This downturn can be attributed to mixed economic data from China, applying mild pressure on the grey metal. Silver is essential in various industrial applications, such as electronics, solar panels, and automotive components. Given China's status as one of the world's largest manufacturing hubs, the country's industrial demand for Silver is significant.
China's Gross Domestic Product (GDP) grew 4.7% year-over-year in the second quarter, compared to a 5.3% expansion in the first quarter and an expected 5.1%. China's Retail Sales (YoY) increased by 2.0% in June, falling short of the expected 3.3% and below May's 3.7%. Meanwhile, the country's Industrial Production for the same period showed a growth rate of 5.3% year-over-year, surpassing estimates of 5.0%, albeit slightly lower than May's 5.6%.
The US Dollar (USD) improves due to improved risk aversion following the attempted assassination of former US President Donald Trump on Saturday. Analysts suggest that if this incident boosts Trump's election prospects, it could lead to so-called 'Trump-victory trades,' which may include a stronger US Dollar and a steeper US Treasury yield curve, according to Reuters. A strong US Dollar puts pressure on commodity prices like Silver. This is because commodities priced in dollars become more expensive for foreign buyers, reducing overall demand.
The non-yielding metals like Silver may find support due to rising expectations of a potential Federal Reserve (Fed) rate cut in September. This anticipation is driven by the softer-than-expected US Consumer Price Index (CPI) data in June. According to CME Group’s FedWatch Tool, markets now indicate an 88.1% probability of a 25-basis point rate cut at the September Fed meeting, up from 72.2% a week earlier.
Silver FAQs
Silver is a precious metal highly traded among investors. It has been historically used as a store of value and a medium of exchange. Although less popular than Gold, traders may turn to Silver to diversify their investment portfolio, for its intrinsic value or as a potential hedge during high-inflation periods. Investors can buy physical Silver, in coins or in bars, or trade it through vehicles such as Exchange Traded Funds, which track its price on international markets.
Silver prices can move due to a wide range of factors. Geopolitical instability or fears of a deep recession can make Silver price escalate due to its safe-haven status, although to a lesser extent than Gold's. As a yieldless asset, Silver tends to rise with lower interest rates. Its moves also depend on how the US Dollar (USD) behaves as the asset is priced in dollars (XAG/USD). A strong Dollar tends to keep the price of Silver at bay, whereas a weaker Dollar is likely to propel prices up. Other factors such as investment demand, mining supply – Silver is much more abundant than Gold – and recycling rates can also affect prices.
Silver is widely used in industry, particularly in sectors such as electronics or solar energy, as it has one of the highest electric conductivity of all metals – more than Copper and Gold. A surge in demand can increase prices, while a decline tends to lower them. Dynamics in the US, Chinese and Indian economies can also contribute to price swings: for the US and particularly China, their big industrial sectors use Silver in various processes; in India, consumers’ demand for the precious metal for jewellery also plays a key role in setting prices.
Silver prices tend to follow Gold's moves. When Gold prices rise, Silver typically follows suit, as their status as safe-haven assets is similar. The Gold/Silver ratio, which shows the number of ounces of Silver needed to equal the value of one ounce of Gold, may help to determine the relative valuation between both metals. Some investors may consider a high ratio as an indicator that Silver is undervalued, or Gold is overvalued. On the contrary, a low ratio might suggest that Gold is undervalued relative to Silver.
- USD/CHF rebounds near 0.8955 in Monday’s early European session.
- The hotter US PPI data on Friday did not change the Fed rate cut expectations in September.
- The political uncertainty underpins the Swiss Franc against the Greenback.
The USD/CHF pair edges higher to 0.8955, snapping the two-day losing streak during the early European session on Monday. The firmer US Dollar (USD) provides some support to the pair. Later in the day, market players will watch the Swiss Producer and Import Prices for June, the NY Empire State Manufacturing Index for July, and the Fed’s Mary Daly speech.
The US producer prices increased slightly more than forecast in June amid a rise in the cost of services, which lifted the Greenback against the CHF. The US Producer Price Index (PPI) rose to 2.6% YoY in June, compared to the previous reading of 2.4%, above the market consensus of 2.3%. The core PPI climbed 3.0% YoY, better than the market expectation of 2.5%. Furthermore, the University of Michigan's Consumer Sentiment Index survey dropped to 66.0 in July from 68.2 in June, the lowest in seven months, falling short of the expected increase to 68.5.
However, the hotter-than-expected wholesale inflation data did not change expectations that the US Federal Reserve (Fed) could start cutting interest rates in September. Financial market pricing indicates over a 90% chance that the Fed will start its rate-cutting cycle in September and the bets were lifted by another soft US consumer inflation report released last week.
On the other hand, an attempted assassination of former US President Donald Trump on Saturday might boost safe-haven flows, which benefit the Swiss Franc (CHF) against the USD. According to the BBC, Donald Trump was shot in the ear during his rally in Butler, Pennsylvania, in an assassination attempt. One spectator was killed in the attack, two others were critically injured and Trump was pictured with blood spilling from his ear.
Swiss Franc FAQs
The Swiss Franc (CHF) is Switzerland’s official currency. It is among the top ten most traded currencies globally, reaching volumes that well exceed the size of the Swiss economy. Its value is determined by the broad market sentiment, the country’s economic health or action taken by the Swiss National Bank (SNB), among other factors. Between 2011 and 2015, the Swiss Franc was pegged to the Euro (EUR). The peg was abruptly removed, resulting in a more than 20% increase in the Franc’s value, causing a turmoil in markets. Even though the peg isn’t in force anymore, CHF fortunes tend to be highly correlated with the Euro ones due to the high dependency of the Swiss economy on the neighboring Eurozone.
The Swiss Franc (CHF) is considered a safe-haven asset, or a currency that investors tend to buy in times of market stress. This is due to the perceived status of Switzerland in the world: a stable economy, a strong export sector, big central bank reserves or a longstanding political stance towards neutrality in global conflicts make the country’s currency a good choice for investors fleeing from risks. Turbulent times are likely to strengthen CHF value against other currencies that are seen as more risky to invest in.
The Swiss National Bank (SNB) meets four times a year – once every quarter, less than other major central banks – to decide on monetary policy. The bank aims for an annual inflation rate of less than 2%. When inflation is above target or forecasted to be above target in the foreseeable future, the bank will attempt to tame price growth by raising its policy rate. Higher interest rates are generally positive for the Swiss Franc (CHF) as they lead to higher yields, making the country a more attractive place for investors. On the contrary, lower interest rates tend to weaken CHF.
Macroeconomic data releases in Switzerland are key to assessing the state of the economy and can impact the Swiss Franc’s (CHF) valuation. The Swiss economy is broadly stable, but any sudden change in economic growth, inflation, current account or the central bank’s currency reserves have the potential to trigger moves in CHF. Generally, high economic growth, low unemployment and high confidence are good for CHF. Conversely, if economic data points to weakening momentum, CHF is likely to depreciate.
As a small and open economy, Switzerland is heavily dependent on the health of the neighboring Eurozone economies. The broader European Union is Switzerland’s main economic partner and a key political ally, so macroeconomic and monetary policy stability in the Eurozone is essential for Switzerland and, thus, for the Swiss Franc (CHF). With such dependency, some models suggest that the correlation between the fortunes of the Euro (EUR) and the CHF is more than 90%, or close to perfect.
FX option expiries for July 15 NY cut at 10:00 Eastern Time, via DTCC, can be found below.
EUR/USD: EUR amounts
- 1.0750 869m
- 1.0760 975m
- 1.0800 2.1b
- 1.0815 972m
- 1.0825 1.6b
- 1.0850 1.2b
- 1.0895 2b
- 1.0900 4.2b
- 1.0915 1.4b
- 1.0950 1.1b
USD/JPY: USD amounts
- 156.00 1.2b
- 156.45 590m
- 157.75 585m
- 158.00 1.2b
AUD/USD: AUD amounts
- 0.6700 553m
- 0.6750 954m
USD/CAD: USD amounts
- 1.3750 597m
EUR/GBP: EUR amounts
- 0.8400 707m
- 0.8460 964m
- 0.8545 771m
Gold prices remained broadly unchanged in India on Monday, according to data compiled by FXStreet.
The price for Gold stood at 6,480.71 Indian Rupees (INR) per gram, broadly stable compared with the INR 6,476.68 it cost on Friday.
The price for Gold was broadly steady at INR 75,590.66 per tola from INR 75,542.73 per tola on friday.
| Unit measure | Gold Price in INR |
|---|---|
| 1 Gram | 6,480.71 |
| 10 Grams | 64,807.63 |
| Tola | 75,590.66 |
| Troy Ounce | 201,564.40 |
FXStreet calculates Gold prices in India by adapting international prices (USD/INR) to the local currency and measurement units. Prices are updated daily based on the market rates taken at the time of publication. Prices are just for reference and local rates could diverge slightly.
Gold FAQs
Gold has played a key role in human’s history as it has been widely used as a store of value and medium of exchange. Currently, apart from its shine and usage for jewelry, the precious metal is widely seen as a safe-haven asset, meaning that it is considered a good investment during turbulent times. Gold is also widely seen as a hedge against inflation and against depreciating currencies as it doesn’t rely on any specific issuer or government.
Central banks are the biggest Gold holders. In their aim to support their currencies in turbulent times, central banks tend to diversify their reserves and buy Gold to improve the perceived strength of the economy and the currency. High Gold reserves can be a source of trust for a country’s solvency. Central banks added 1,136 tonnes of Gold worth around $70 billion to their reserves in 2022, according to data from the World Gold Council. This is the highest yearly purchase since records began. Central banks from emerging economies such as China, India and Turkey are quickly increasing their Gold reserves.
Gold has an inverse correlation with the US Dollar and US Treasuries, which are both major reserve and safe-haven assets. When the Dollar depreciates, Gold tends to rise, enabling investors and central banks to diversify their assets in turbulent times. Gold is also inversely correlated with risk assets. A rally in the stock market tends to weaken Gold price, while sell-offs in riskier markets tend to favor the precious metal.
The price can move due to a wide range of factors. Geopolitical instability or fears of a deep recession can quickly make Gold price escalate due to its safe-haven status. As a yield-less asset, Gold tends to rise with lower interest rates, while higher cost of money usually weighs down on the yellow metal. Still, most moves depend on how the US Dollar (USD) behaves as the asset is priced in dollars (XAU/USD). A strong Dollar tends to keep the price of Gold controlled, whereas a weaker Dollar is likely to push Gold prices up.
(An automation tool was used in creating this post.)
- EUR/USD pulls back from over a one-month peak amid a modest USD uptick on Monday.
- Dovish Fed expectations cap the USD and help limit losses ahead of the ECB on Thursday.
- The technical setup favors bullish traders and supports prospects for some near-term gains.
The EUR/USD pair attracts some sellers on the first day of a new week and for now, seems to have snapped a three-day winning streak to over a one-month peak, around the 1.0910 area touched on Friday. Spot prices currently trade below the 1.0900 mark amid a modest US Dollar (USD) uptick, though any meaningful corrective decline seems elusive.
From a technical perspective, the recent breakout through the 1.0800 confluence hurdle – comprising 50-day, 100-day and 200-day Simple Moving Averages (SMAs) – and a downward-sloping line favors bullish traders. Moreover, oscillators on the daily chart have been gaining positive traction and suggest that the path of least resistance for the EUR/USD pair is to the upside amid dovish Federal Reserve (Fed) expectations.
Some follow-through buying beyond the 1.0910-1.0915 area mark will reaffirm the constructive outlook and lift the EUR/USD pair to the next relevant resistance near the 1.0960-1.0965 region. The momentum could extend beyond the March peak, around the 1.0880 area, and allow spot prices to reclaim the 1.1000 psychological mark for the first time since January heading into the European Central Bank (ECB) meeting on Thursday.
On the flip side, any meaningful dip is likely to attract fresh buyers near the descending trend-line resistance breakpoint, near the 1.0870-1.0865 area. This should help limit the downside for the EUR/USD pair near the 1.0800 confluence support. The latter is followed by support near the 1.0755-1.0750 horizontal zone, which if broken could drag spot prices below the 1.0700 mark, towards the June swing low, around the 1.0665 region.
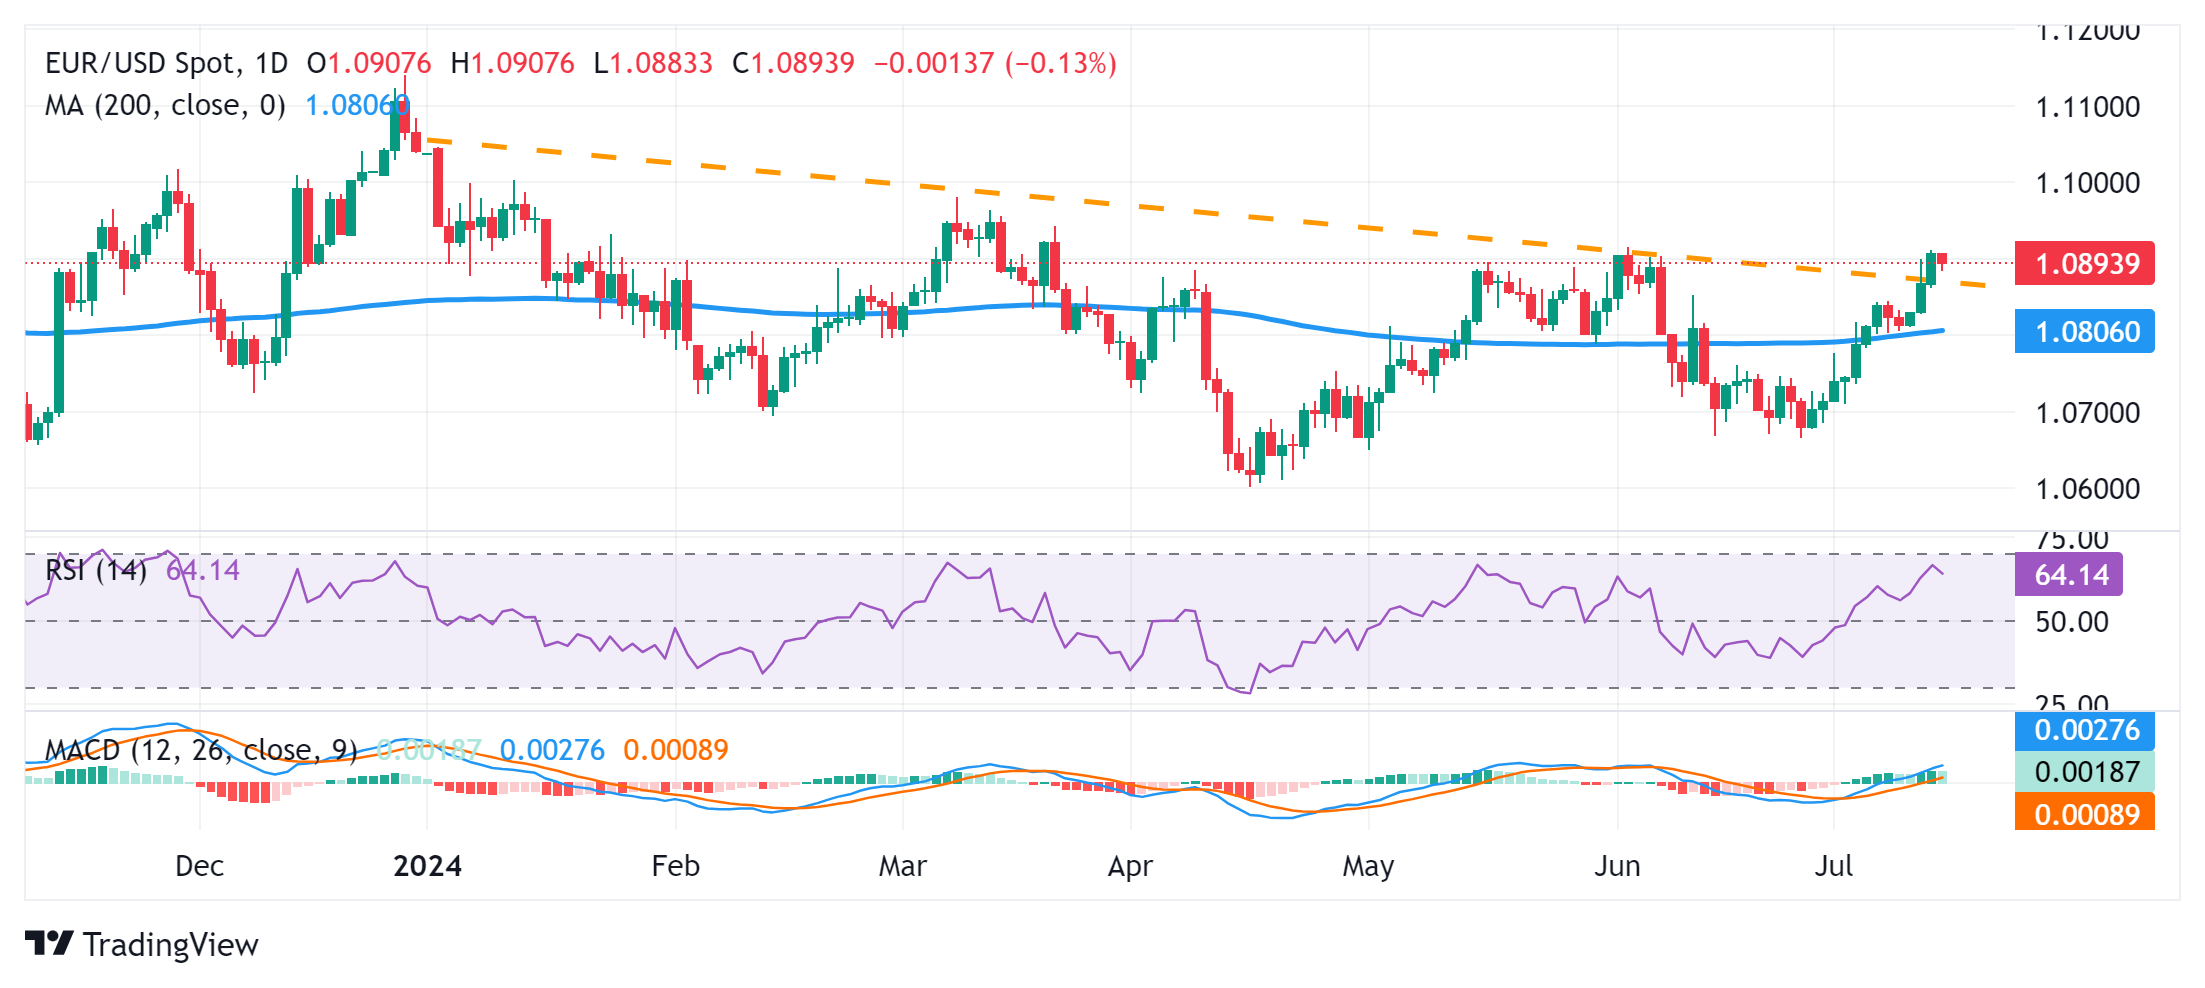
Economic Indicator
ECB Monetary Policy Statement
At each of the European Central Bank’s (ECB) eight governing council meetings, the ECB releases a short statement explaining its monetary policy decision, in light of its goal of meeting its inflation target. The statement may influence the volatility of the Euro (EUR) and determine a short-term positive or negative trend. A hawkish view is considered bullish for EUR, whereas a dovish view is considered bearish.
Read more.Next release: Thu Jul 18, 2024 12:15
Frequency: Irregular
Consensus: -
Previous: -
Source: European Central Bank
- GBP/USD could further lose ground as the 14-day RSI hints at an impending correction.
- The pair could test the psychological resistance at the 1.3000 level.
- The immediate support is anticipated near the upper boundary of the ascending channel, around the 1.2900 level.
GBP/USD declines slightly, hovering around 1.2970 in Monday's Asian session after retreating from Friday's peak of 1.2990, the highest since July 2023. The analysis of the daily chart shows a breakout above an ascending channel, signaling a bullish trend in the pair's price movements.
Moreover, the Moving Average Convergence Divergence (MACD) indicator reflects short-term bullish momentum, with the MACD line above the centerline and diverging positively from the signal line.
However, the 14-day Relative Strength Index (RSI) sits marginally above the 70 level, confirming the bullish trend while also suggesting potential overbought conditions. A potential decline could indicate a weakening bullish sentiment, possibly hinting at an impending correction.
In terms of resistance, the GBP/USD pair could test the psychological level of 1.3000. A breakthrough above this level could provide support for the pair to explore the region around the key level of 1.3100.
On the downside, the immediate support appears around the upper boundary of the ascending channel at the 1.2900 level. A return to the ascending channel could contribute support for the pair to reach the nine-day Exponential Moving Average (EMA) at 1.2863.
A break below the nine-day EMA could lead the GBP/USD pair to test the lower boundary of the ascending channel at the level of 1.2770. Further support could be found around the throwback support level of 1.2615.
GBP/USD: Daily Chart
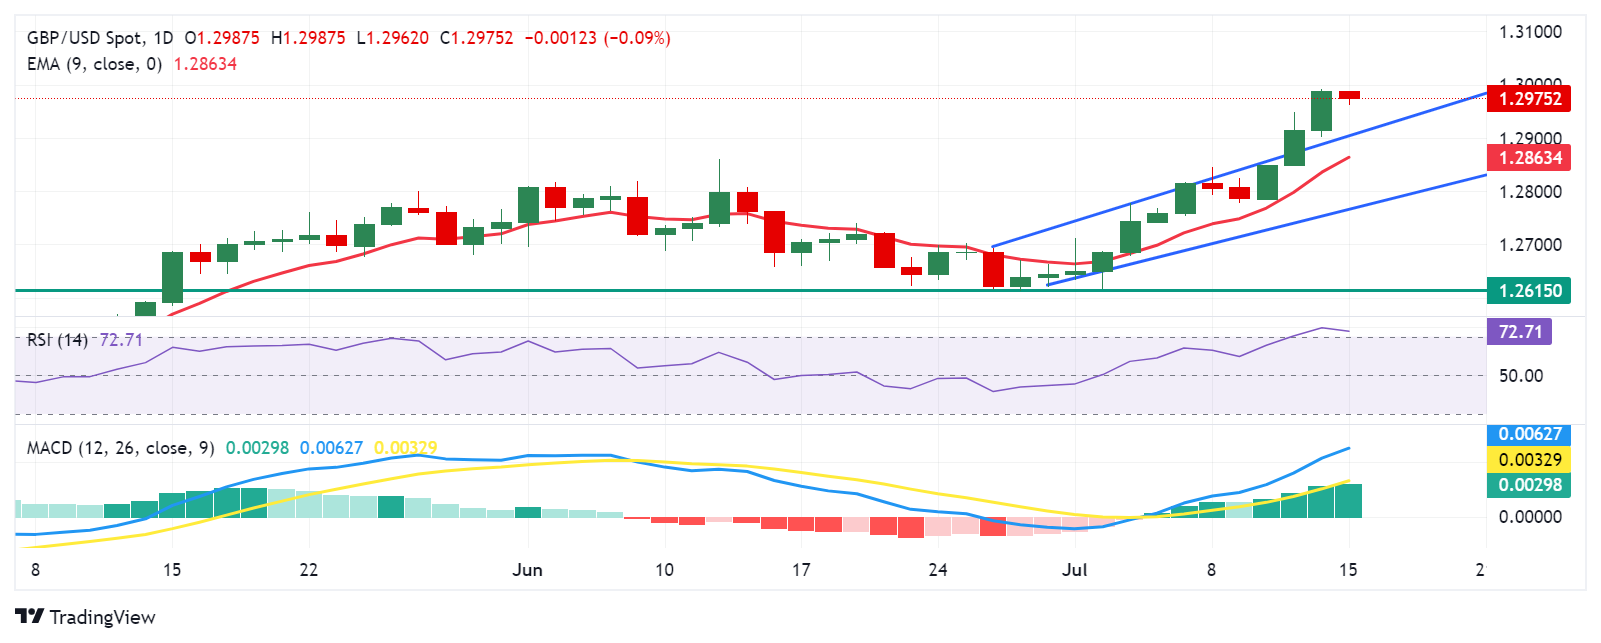
British Pound PRICE Today
The table below shows the percentage change of British Pound (GBP) against listed major currencies today. British Pound was the weakest against the US Dollar.
| USD | EUR | GBP | JPY | CAD | AUD | NZD | CHF | |
|---|---|---|---|---|---|---|---|---|
| USD | 0.12% | 0.09% | -0.11% | 0.09% | 0.15% | 0.14% | 0.14% | |
| EUR | -0.12% | 0.00% | -0.02% | 0.17% | 0.06% | 0.24% | 0.21% | |
| GBP | -0.09% | -0.01% | 0.06% | 0.17% | 0.05% | 0.17% | 0.20% | |
| JPY | 0.11% | 0.02% | -0.06% | 0.21% | 0.04% | 0.21% | 0.06% | |
| CAD | -0.09% | -0.17% | -0.17% | -0.21% | -0.02% | 0.03% | 0.03% | |
| AUD | -0.15% | -0.06% | -0.05% | -0.04% | 0.02% | 0.15% | 0.15% | |
| NZD | -0.14% | -0.24% | -0.17% | -0.21% | -0.03% | -0.15% | -0.01% | |
| CHF | -0.14% | -0.21% | -0.20% | -0.06% | -0.03% | -0.15% | 0.01% |
The heat map shows percentage changes of major currencies against each other. The base currency is picked from the left column, while the quote currency is picked from the top row. For example, if you pick the British Pound from the left column and move along the horizontal line to the US Dollar, the percentage change displayed in the box will represent GBP (base)/USD (quote).
- USD/CAD gains ground near 1.3655 in Monday’s Asian session.
- The political uncertainty boosts the safe-haven currency, benefitting the US Dollar.
- Prospects of more rate cuts by the BoC weigh on the Loonie, but higher crude oil prices might cap the downside.
The USD/CAD pair trades in positive territory for the third consecutive day around 1.3655 during the Asian trading hours on Monday. The uptick of the pair is bolstered by the firmer US Dollar (USD) amid risk-aversion. However, the upside of the pair might be capped due to growing speculation that the US Federal Reserve (Fed) would start cutting the interest rate in September.
The political uncertainty after the report about a failed assassination attempt on US Presidential candidate Donald Trump lifts the USD, a safe-haven currency. On Saturday, former president Donald Trump was shot in the ear during his rally in Butler, Pennsylvania in an assassination attempt. One spectator was killed in the attack, two others were critically injured and Trump was pictured with blood spilling from his ear, per BBC.
On the other hand, wholesale inflation in the United States rose faster than expected in June, the Bureau of Labor Statistics revealed on Friday. The US PPI rose to 2.6% YoY in June, compared to the previous reading of 2.4%, better than the estimated 2.3%. Meanwhile, the core PPI climbed 3.0% YoY, beating the expectation of 2.5%. On a monthly basis, the PPI increased 0.2% MoM in June, stronger than the forecast of 0.1%.
Despite the hotter inflation data, market players remain focused on the potential of Fed rate cuts, which might exert some selling pressure on the Greenback in the near term. According to the CME Fedwatch Tool, traders have priced in above 90% chance for 25 basis points (bps) cut in September, up from 85% last Friday. Looking ahead, traders will monitor the NY Empire State Manufacturing Index for July and the Fed’s Mary Daly speech later on Monday.
On the Loonie front, the expectation that the Bank of Canada (BoC) will further cut interest rates exerts some selling pressure on the Canadian Dollar (CAD). Meanwhile, the extended gains in crude oil prices might limit the CAD’s potential losses as Canada is the major crude oil exporter to the United States.
Canadian Dollar FAQs
The key factors driving the Canadian Dollar (CAD) are the level of interest rates set by the Bank of Canada (BoC), the price of Oil, Canada’s largest export, the health of its economy, inflation and the Trade Balance, which is the difference between the value of Canada’s exports versus its imports. Other factors include market sentiment – whether investors are taking on more risky assets (risk-on) or seeking safe-havens (risk-off) – with risk-on being CAD-positive. As its largest trading partner, the health of the US economy is also a key factor influencing the Canadian Dollar.
The Bank of Canada (BoC) has a significant influence on the Canadian Dollar by setting the level of interest rates that banks can lend to one another. This influences the level of interest rates for everyone. The main goal of the BoC is to maintain inflation at 1-3% by adjusting interest rates up or down. Relatively higher interest rates tend to be positive for the CAD. The Bank of Canada can also use quantitative easing and tightening to influence credit conditions, with the former CAD-negative and the latter CAD-positive.
The price of Oil is a key factor impacting the value of the Canadian Dollar. Petroleum is Canada’s biggest export, so Oil price tends to have an immediate impact on the CAD value. Generally, if Oil price rises CAD also goes up, as aggregate demand for the currency increases. The opposite is the case if the price of Oil falls. Higher Oil prices also tend to result in a greater likelihood of a positive Trade Balance, which is also supportive of the CAD.
While inflation had always traditionally been thought of as a negative factor for a currency since it lowers the value of money, the opposite has actually been the case in modern times with the relaxation of cross-border capital controls. Higher inflation tends to lead central banks to put up interest rates which attracts more capital inflows from global investors seeking a lucrative place to keep their money. This increases demand for the local currency, which in Canada’s case is the Canadian Dollar.
Macroeconomic data releases gauge the health of the economy and can have an impact on the Canadian Dollar. Indicators such as GDP, Manufacturing and Services PMIs, employment, and consumer sentiment surveys can all influence the direction of the CAD. A strong economy is good for the Canadian Dollar. Not only does it attract more foreign investment but it may encourage the Bank of Canada to put up interest rates, leading to a stronger currency. If economic data is weak, however, the CAD is likely to fall.
- The Japanese Yen declines as the US Dollar improves due to the failed assassination of former US President Donald Trump.
- The JPY may experience volatility amid speculation about potential intervention by Japanese authorities.
- Japanese authorities are estimated to have expended between ¥3.37 trillion to ¥3.57 trillion to curb the rapid depreciation of the JPY.
The Japanese Yen (JPY) edges lower on Monday as the US Dollar (USD) strengthens amid rising risk aversion triggered by the attempted assassination of former US President Donald Trump on Saturday. Analysts speculate that if this event boosts Trump's chances in the upcoming elections, it may drive 'Trump-victory trades,' potentially strengthening the US Dollar and steepening the US Treasury yield curve, as per a Reuters report.
The Japanese Yen (JPY) could face potential volatility amidst speculation of intervention by Japanese authorities. According to data released by the Bank of Japan (BoJ) on Friday, it's estimated that Japanese authorities may have spent between ¥3.37 trillion to ¥3.57 trillion on Thursday to stem the rapid depreciation of the JPY, as reported by Reuters.
The rally in the Japanese Yen, which had been hovering near 38-year lows, began on Thursday as the US Dollar (USD) weakened following data showing a moderation in US consumer prices for June. This development has increased expectations that the Federal Reserve could cut interest rates as early as September.
According to CME Group’s FedWatch Tool, markets now indicate an 88.1% probability of a 25-basis point rate cut at the September Fed meeting, up from 72.2% a week earlier.
Daily Digest Market Movers: Japanese Yen could experience volatility due to intervention threats
- ING’s FX analyst Francesco Pesole observes that Japan’s Ministry of Finance has adjusted its FX intervention strategy. Following the soft US CPI print on Friday, the USD/JPY pair declined approximately 2%, a larger drop compared to other USD pairs. The increase in JPY futures volumes appears to align with indications of FX intervention.
- UBS FX strategists observe that speculative investors hold near-record short positions on the Yen. They suggest that if US economic data continues to indicate a soft landing, USD/JPY could experience periods of pullbacks.
- BBH FX strategists highlight that recent softness in US data poses challenges to their perspective that the backdrop of sustained inflation and strong growth in the US largely remains intact. They note increasing concern among Federal Reserve officials regarding weaknesses in the labor market.
- Japanese Chief Cabinet Secretary Yoshimasa Hayashi stated his readiness to employ all available measures regarding forex. Hayashi noted that the Bank of Japan (BoJ) would determine the specifics of monetary policy. He expects the BoJ to implement appropriate measures to sustainably and steadily achieve the 2% price target, reported by Reuters on Friday.
- On Friday, Japanese Finance Minister Shunichi Suzuki emphasized that rapid foreign exchange (FX) movements are undesirable. Suzuki refrained from commenting on FX intervention and declined to address media reports regarding Japan's FX rate checks, as reported by Reuters.
- On Thursday, the data showed that the US Core Consumer Price Index (CPI), which excludes volatile food and energy prices, rose by 3.3% year-over-year in June, compared to May's increase of 3.4% and the same expectation. Meanwhile, the core CPI increased by 0.1% month-over-month, against the expected and prior reading of 0.2%.
- Federal Reserve Chairman Jerome Powell highlighted the urgent need to monitor the deteriorating labor market on Wednesday. Additionally, Powell expressed confidence in the downward trend of inflation, following his remarks on Tuesday that emphasized the necessity of further data to strengthen confidence in the inflation outlook.
Technical Analysis: USD/JPY holds position around 158.00
USD/JPY trades around 158.00 on Monday. The daily chart analysis indicates a weakening bullish trend as the pair has broken below the lower boundary of an ascending channel pattern. Additionally, the 14-day Relative Strength Index (RSI) is below the 50 level, signaling a decline in the pair's momentum.
Further downward movement could exert bearish pressure on USD/JPY, potentially testing support near June's low at 154.55.
On the upside, immediate resistance is observed around the 14-day Exponential Moving Average (EMA) at 159.75, followed by the lower boundary of the ascending channel around 160.20. A return to trading within the ascending channel would likely improve sentiment for the USD/JPY pair, with a potential target toward the upper boundary of the ascending channel near 163.50.
USD/JPY: Daily Chart
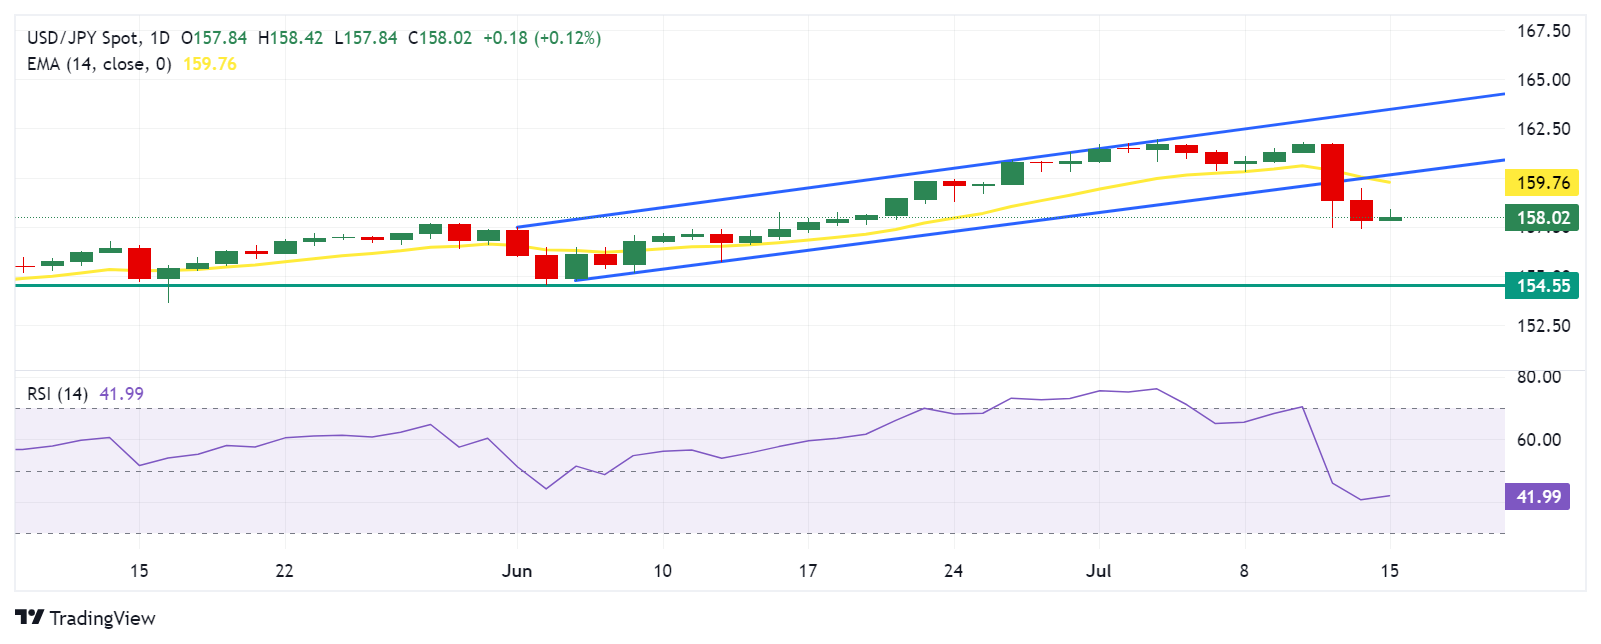
Japanese Yen PRICE Today
The table below shows the percentage change of Japanese Yen (JPY) against listed major currencies today. Japanese Yen was the weakest against the British Pound.
| USD | EUR | GBP | JPY | CAD | AUD | NZD | CHF | |
|---|---|---|---|---|---|---|---|---|
| USD | 0.13% | 0.11% | -0.08% | 0.06% | 0.14% | 0.15% | 0.15% | |
| EUR | -0.13% | 0.03% | 0.00% | 0.12% | 0.04% | 0.24% | 0.22% | |
| GBP | -0.11% | -0.03% | 0.06% | 0.10% | 0.02% | 0.15% | 0.20% | |
| JPY | 0.08% | 0.00% | -0.06% | 0.13% | -0.00% | 0.20% | 0.04% | |
| CAD | -0.06% | -0.12% | -0.10% | -0.13% | 0.01% | 0.10% | 0.09% | |
| AUD | -0.14% | -0.04% | -0.02% | 0.00% | -0.01% | 0.17% | 0.20% | |
| NZD | -0.15% | -0.24% | -0.15% | -0.20% | -0.10% | -0.17% | -0.01% | |
| CHF | -0.15% | -0.22% | -0.20% | -0.04% | -0.09% | -0.20% | 0.01% |
The heat map shows percentage changes of major currencies against each other. The base currency is picked from the left column, while the quote currency is picked from the top row. For example, if you pick the Japanese Yen from the left column and move along the horizontal line to the US Dollar, the percentage change displayed in the box will represent JPY (base)/USD (quote).
Japanese Yen FAQs
The Japanese Yen (JPY) is one of the world’s most traded currencies. Its value is broadly determined by the performance of the Japanese economy, but more specifically by the Bank of Japan’s policy, the differential between Japanese and US bond yields, or risk sentiment among traders, among other factors.
One of the Bank of Japan’s mandates is currency control, so its moves are key for the Yen. The BoJ has directly intervened in currency markets sometimes, generally to lower the value of the Yen, although it refrains from doing it often due to political concerns of its main trading partners. The current BoJ ultra-loose monetary policy, based on massive stimulus to the economy, has caused the Yen to depreciate against its main currency peers. This process has exacerbated more recently due to an increasing policy divergence between the Bank of Japan and other main central banks, which have opted to increase interest rates sharply to fight decades-high levels of inflation.
The BoJ’s stance of sticking to ultra-loose monetary policy has led to a widening policy divergence with other central banks, particularly with the US Federal Reserve. This supports a widening of the differential between the 10-year US and Japanese bonds, which favors the US Dollar against the Japanese Yen.
The Japanese Yen is often seen as a safe-haven investment. This means that in times of market stress, investors are more likely to put their money in the Japanese currency due to its supposed reliability and stability. Turbulent times are likely to strengthen the Yen’s value against other currencies seen as more risky to invest in.
- WTI bounces off a multi-day low touched on Monday, albeit it lacks follow-through buying.
- A modest USD strength acts as a headwind for the commodity amid China’s economic woes.
- Worries about supply disruption from the Middle East should help limit any meaningful slide.
West Texas Intermediate (WTI) US crude Oil prices attract some dip-buying in the vicinity of mid-$80.00s, or a multi-day low touched during the Asian session on Monday, albeit lack bullish conviction. The commodity currently trades around the $81.30 area, up less than 0.20% for the day and remains confined in a familiar range held over the past two weeks or so.
Concerns about supply disruptions stemming from the ongoing conflicts in the Middle East turn out to be another factor lending some support to Crude Oil prices. That said, the emergence of some US Dollar (USD) buying, bolstered by safe-haven demand in the wake of an assassination attempt on former US President Donald Trump, should cap any meaningful appreciating move for the black liquid. Apart from this, China's economic woes warrant some caution for bullish traders.
Market worries about waning fuel demand in China – the world's biggest Oil importer – resurfaced after the official data showed that the economy expanded by 4.7% over the year during the second quarter of 2024. Adding to this, China’s Retail Sales and Fixed Asset Investment missed consensus estimates. This further pointed to heightened economic uncertainty and overshadowed the slightly better-than-anticipated release of Industrial Production figures for June.
Meanwhile, softer US consumer inflation figures released last week reaffirmed market bets that the Federal Reserve (Fed) will begin cutting interest rates in September. This might hold back the USD bulls from placing aggressive bets and continue to act as a tailwind for Crude Oil prices. Hence, it will be prudent to wait for strong follow-through buying before positioning for the resumption of the recent strong move-up witnessed over the past week or so.
WTI Oil FAQs
WTI Oil is a type of Crude Oil sold on international markets. The WTI stands for West Texas Intermediate, one of three major types including Brent and Dubai Crude. WTI is also referred to as “light” and “sweet” because of its relatively low gravity and sulfur content respectively. It is considered a high quality Oil that is easily refined. It is sourced in the United States and distributed via the Cushing hub, which is considered “The Pipeline Crossroads of the World”. It is a benchmark for the Oil market and WTI price is frequently quoted in the media.
Like all assets, supply and demand are the key drivers of WTI Oil price. As such, global growth can be a driver of increased demand and vice versa for weak global growth. Political instability, wars, and sanctions can disrupt supply and impact prices. The decisions of OPEC, a group of major Oil-producing countries, is another key driver of price. The value of the US Dollar influences the price of WTI Crude Oil, since Oil is predominantly traded in US Dollars, thus a weaker US Dollar can make Oil more affordable and vice versa.
The weekly Oil inventory reports published by the American Petroleum Institute (API) and the Energy Information Agency (EIA) impact the price of WTI Oil. Changes in inventories reflect fluctuating supply and demand. If the data shows a drop in inventories it can indicate increased demand, pushing up Oil price. Higher inventories can reflect increased supply, pushing down prices. API’s report is published every Tuesday and EIA’s the day after. Their results are usually similar, falling within 1% of each other 75% of the time. The EIA data is considered more reliable, since it is a government agency.
OPEC (Organization of the Petroleum Exporting Countries) is a group of 13 Oil-producing nations who collectively decide production quotas for member countries at twice-yearly meetings. Their decisions often impact WTI Oil prices. When OPEC decides to lower quotas, it can tighten supply, pushing up Oil prices. When OPEC increases production, it has the opposite effect. OPEC+ refers to an expanded group that includes ten extra non-OPEC members, the most notable of which is Russia.
- AUD./JPY oscillates in a narrow trading band and is influenced by a combination of factors.
- Intervention fears, BoJ rate hike bets and US political jitters underpin the safe-haven JPY.
- The Chinese macro data does little to impress the AUD bulls or provide impetus to the cross.
The AUD/JPY cross struggles for a firm intraday direction on Monday and seesaws between tepid gains/minor losses during the Asian session. Spot prices hold steady around the 107.00 round-figure mark and react little to rather unimpressive Chinese macro data.
The National Bureau of Statistics (NBS) reported that China’s economy expanded by 4.7% over the year in the second quarter of 2024, compared to a 5.3% expansion in the first quarter. On a quarterly basis, the Chinese economy grew by 0.7% in Q2 2024 as compared to the 1.5% registered in the previous quarter. Meanwhile, China’s Retail Sales climbed 2.0% YoY in June vs. 3.1% expected and 3.7% prior, while the country’s Industrial Production came in at 5.3% YoY vs. 5.0% estimates and May’s 5.6%. Moreover, the Fixed Asset Investment increased by 3.9% YTD YoY in June vs 3.9% expected and 4.0% last. The data, however, does little to provide any meaningful impetus to the China-proxy Australian Dollar (AUD), though bets that the Reserve Bank of Australia (RBA) could possibly be raising interest rates again act as a tailwind for the AUD/JPY cross.
The Japanese Yen (JPY), on the other hand, draws some support from rising bets that the Bank of Japan (BoJ) may raise interest rates in response to a weakening domestic currency. Adding to this, speculation that Japanese authorities might step into the market to lift the domestic currency, along with the US political jitters in the wake of an alleged assassination attempt on former US President Donald Trump, lend support to the safe-haven JPY. This, in turn, is holding back traders from placing aggressive directional bets around the AUD/JPY cross and leading to subdued range-bound price action on the first day of a new week. Hence, it will be prudent to wait for strong follow-through selling before positioning for an extension of the recent pullback from the highest level since May 1991, around the 109.35 region touched last Thursday.
Economic Indicator
Gross Domestic Product (YoY)
The Gross Domestic Product (GDP), released by the National Bureau of Statistics of China on a monthly basis, is a measure of the total value of all goods and services produced in China during a given period. The GDP is considered as the main measure of China’s economic activity. The YoY reading compares economic activity in the reference quarter compared with the same quarter a year earlier. Generally speaking, a rise in this indicator is bullish for the Renminbi (CNY), while a low reading is seen as bearish.
Read more.
- The Australian Dollar could lose ground due to weaker-than-expected GDP data from China.
- China’s GDP (YoY) grew 4.7% in Q2, compared to the previous expansion of 5.3% and expected 5.1%.
- The US Dollar improves due to improved risk aversion following the attempted assassination of former US President Trump on Saturday.
The Australian Dollar (AUD) edges lower on Monday, trading around its six-month high of 0.6798 recorded on Thursday. In China, a close trade partner of Australia, Gross Domestic Product (GDP) grew 4.7% year-over-year in the second quarter, compared to a 5.3% expansion in the first quarter and an expected 5.1%. Weaker-than-expected China GDP data could exert mild pressure on the Aussie Dollar, undermining the AUD/USD pair.
The Australian Dollar may continue to rise as speculation grows that the Reserve Bank of Australia (RBA) might delay joining the global rate-cutting cycle or even raise interest rates again. Persistently high inflation in Australia prompts the RBA to maintain a hawkish stance.
The US Dollar (USD) strengthens due to increased risk aversion following an attempted assassination of former US President Donald Trump on Saturday. Analysts suggest that if this incident boosts Trump's election prospects, it could lead to so-called 'Trump-victory trades,' potentially resulting in a stronger US Dollar and a steeper US Treasury yield curve, per Reuters.
The AUD/USD pair may find support as the US Dollar (USD) could lose ground due to rising expectations of a potential Federal Reserve (Fed) rate cut in September. This anticipation is driven by the softer-than-expected US Consumer Price Index (CPI) data in June.
Daily Digest Market Movers: Australian Dollar declines due to risk aversion
- China's Retail Sales (YoY) increased by 2.0% in June, falling short of the expected 3.3% and below May's 3.7%. Meanwhile, the country's Industrial Production for the same period showed a growth rate of 5.3% year-over-year, surpassing estimates of 5.0%, albeit slightly lower than May's 5.6%.
- The US Core Producer Price Index (PPI) rose 3.0% year-over-year in June, exceeding the expected 2.5% and the previous reading of 2.6%. Moreover, the preliminary Michigan Consumer Sentiment Index fell short of expectations in July, registering at 66.0 compared to the forecasted 68.5 and the previous 68.2.
- On Friday, China’s Trade Balance data for June, showed a trade surplus of $99.05 billion, widening from the previous figure of $82.62 billion. China Exports (YoY) rose 8.6% vs. 8.0% expected and prior 7.6% reading. Meanwhile, Imports (YoY) declined by 2.3% compared to the previous rise of 2.8%.
- Federal Reserve Bank of Chicago President Austan Goolsbee said on Thursday that the US economy appears to be on track to achieve 2% inflation. This suggests Goolsbee is gaining confidence that the time for cutting interest rates may soon be approaching. He also stated "My view is, this is what the path to 2% looks like," according to Reuters.
- On Thursday, the data showed that the US Core Consumer Price Index (CPI), which excludes volatile food and energy prices, rose by 3.3% year-over-year in June, compared to May's increase of 3.4% and the same expectation. Meanwhile, the core CPI increased by 0.1% month-over-month, against the expected and prior reading of 0.2%.
- Federal Reserve Chairman Jerome Powell highlighted the urgent need to monitor the deteriorating labor market on Wednesday. Additionally, Powell expressed confidence in the downward trend of inflation, following his earlier remarks that emphasized the necessity of further data to strengthen confidence in the inflation outlook.
Technical Analysis: Australian Dollar holds position above 0.6750
The Australian Dollar trades around 0.6760 on Monday. The analysis of the daily chart shows that the AUD/USD pair consolidates within an ascending channel, indicating a bullish bias. Additionally, the 14-day Relative Strength Index (RSI) has retreated from the 70 level, suggesting a correction. However, it remains above 50, suggesting continued bullish momentum. A further decline could weaken this trend.
The AUD/USD pair may retest the upper boundary of the ascending channel near the psychological level of 0.6800.
On the downside, immediate support appears around the nine-day Exponential Moving Average (EMA) at 0.6643. Further support is seen near the lower boundary of the ascending channel at 0.6690. A break below this level could push the AUD/USD pair toward the throwback support at 0.6590.
AUD/USD: Daily Chart
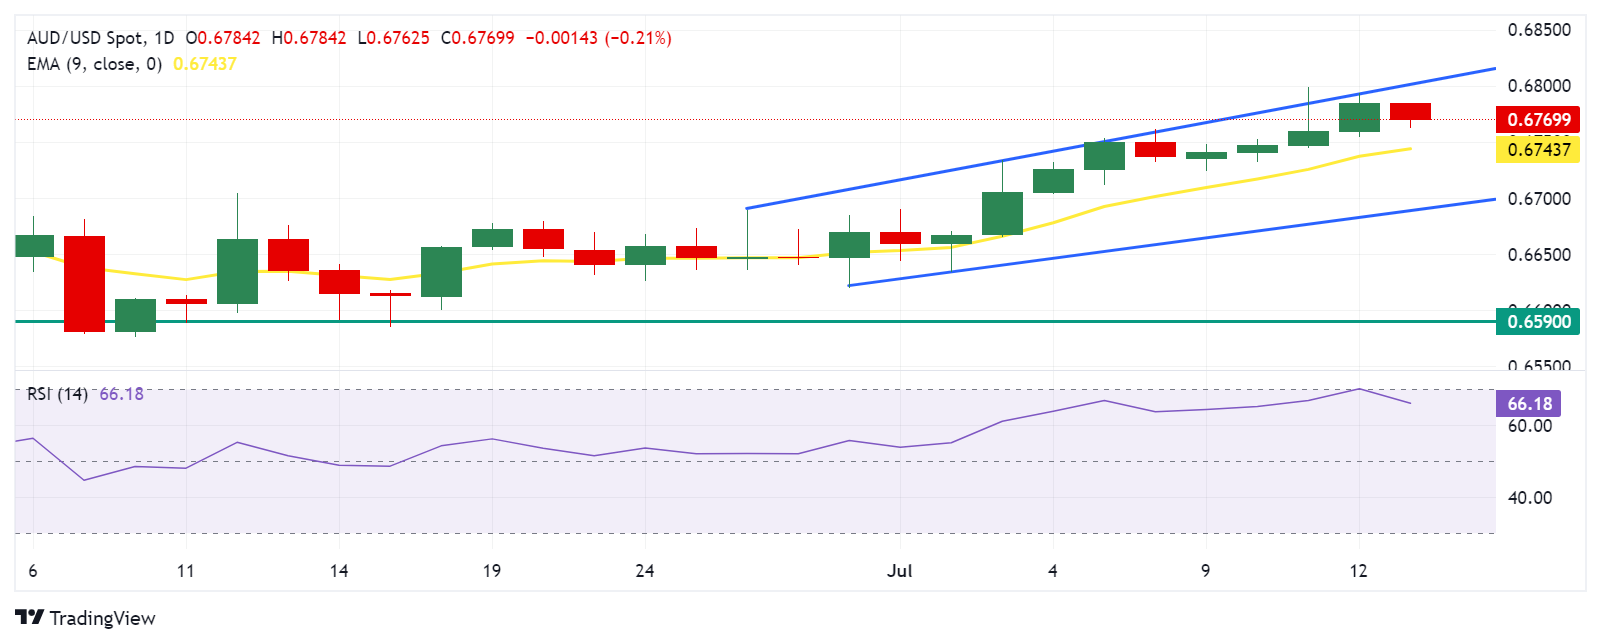
Australian Dollar PRICE Today
The table below shows the percentage change of Australian Dollar (AUD) against listed major currencies today. Australian Dollar was the weakest against the US Dollar.
| USD | EUR | GBP | JPY | CAD | AUD | NZD | CHF | |
|---|---|---|---|---|---|---|---|---|
| USD | 0.17% | 0.16% | -0.05% | 0.05% | 0.16% | 0.20% | 0.16% | |
| EUR | -0.17% | 0.03% | -0.02% | 0.09% | 0.03% | 0.23% | 0.19% | |
| GBP | -0.16% | -0.03% | 0.04% | 0.05% | -0.00% | 0.15% | 0.16% | |
| JPY | 0.05% | 0.02% | -0.04% | 0.10% | -0.01% | 0.22% | 0.03% | |
| CAD | -0.05% | -0.09% | -0.05% | -0.10% | 0.03% | 0.15% | 0.11% | |
| AUD | -0.16% | -0.03% | 0.00% | 0.01% | -0.03% | 0.21% | 0.17% | |
| NZD | -0.20% | -0.23% | -0.15% | -0.22% | -0.15% | -0.21% | -0.05% | |
| CHF | -0.16% | -0.19% | -0.16% | -0.03% | -0.11% | -0.17% | 0.05% |
The heat map shows percentage changes of major currencies against each other. The base currency is picked from the left column, while the quote currency is picked from the top row. For example, if you pick the Australian Dollar from the left column and move along the horizontal line to the US Dollar, the percentage change displayed in the box will represent AUD (base)/USD (quote).
Australian Dollar FAQs
One of the most significant factors for the Australian Dollar (AUD) is the level of interest rates set by the Reserve Bank of Australia (RBA). Because Australia is a resource-rich country another key driver is the price of its biggest export, Iron Ore. The health of the Chinese economy, its largest trading partner, is a factor, as well as inflation in Australia, its growth rate and Trade Balance. Market sentiment – whether investors are taking on more risky assets (risk-on) or seeking safe-havens (risk-off) – is also a factor, with risk-on positive for AUD.
The Reserve Bank of Australia (RBA) influences the Australian Dollar (AUD) by setting the level of interest rates that Australian banks can lend to each other. This influences the level of interest rates in the economy as a whole. The main goal of the RBA is to maintain a stable inflation rate of 2-3% by adjusting interest rates up or down. Relatively high interest rates compared to other major central banks support the AUD, and the opposite for relatively low. The RBA can also use quantitative easing and tightening to influence credit conditions, with the former AUD-negative and the latter AUD-positive.
China is Australia’s largest trading partner so the health of the Chinese economy is a major influence on the value of the Australian Dollar (AUD). When the Chinese economy is doing well it purchases more raw materials, goods and services from Australia, lifting demand for the AUD, and pushing up its value. The opposite is the case when the Chinese economy is not growing as fast as expected. Positive or negative surprises in Chinese growth data, therefore, often have a direct impact on the Australian Dollar and its pairs.
Iron Ore is Australia’s largest export, accounting for $118 billion a year according to data from 2021, with China as its primary destination. The price of Iron Ore, therefore, can be a driver of the Australian Dollar. Generally, if the price of Iron Ore rises, AUD also goes up, as aggregate demand for the currency increases. The opposite is the case if the price of Iron Ore falls. Higher Iron Ore prices also tend to result in a greater likelihood of a positive Trade Balance for Australia, which is also positive of the AUD.
The Trade Balance, which is the difference between what a country earns from its exports versus what it pays for its imports, is another factor that can influence the value of the Australian Dollar. If Australia produces highly sought after exports, then its currency will gain in value purely from the surplus demand created from foreign buyers seeking to purchase its exports versus what it spends to purchase imports. Therefore, a positive net Trade Balance strengthens the AUD, with the opposite effect if the Trade Balance is negative.
- The Indian Rupee trades sideways in Monday’s Asian session.
- Possible Fed rate cuts, lower US bond yields might support the local currency; firmer USD could weigh on the INR.
- Traders await India’s Wholesale Price Index (WPI) Inflation data on Monday for fresh impetus.
The Indian Rupee (INR) trades flat on Monday despite the recovery of the US Dollar (USD). The rising hopes of rate cuts by the Federal Reserve (Fed), lower US bond yields, and persistent India’s foreign inflows might lift the INR. Nonetheless, the extended gains in crude oil prices and the renewed Greenback demand from state-run banks and local importers limit the INR’s potential gains. The downside of the local currency might be limited amid the Reserve Bank of India’s (RBI) routine interventions, which might support the INR from depreciating to near multi-month lows.
Looking ahead, investors will keep an eye on India’s Wholesale Price Index (WPI) Inflation data on Monday, which is expected to rise to 3.50% YoY in June from 2.61% in May. Also, the Indian Trade Balance will be released. On the US docket, the NY Empire State Manufacturing Index for July will be published, while Fed’s Mary Daly is due to speak.
Daily Digest Market Movers: Indian Rupee flat lines despite stronger US Dollar
- Indian Consumer Price Index (CPI) rose to the highest in four months at 5.08% YoY in June on the back of higher food prices, according to official data released on Friday. This figure was above the market consensus and the previous reading of 4.80%.
- India’s Industrial Production increased 5.9% YoY in May as against 5.0% in April, beating the estimation of 4.9%.
- The US Producer Price Index (PPI) rose to 2.6% YoY in June from a revised up in the previous reading of 2.4%, above the consensus of 2.3%. The core PPI climbed 3.0% YoY, surpassing the expected 2.5%. On a monthly basis, the PPI rose 0.2% MoM in June, above the market consensus of 0.1%.
- The University of Michigan's Consumer Sentiment Index survey dropped to 66.0 in July from 68.2 in June, the lowest in seven months, falling short of the expected increase to 68.5. The UoM 5-year Consumer Inflation Expectations declined slightly in July to 2.9% from the previous reading of 3.0%.
- Financial markets are now pricing in above 90% odds for a 25 basis points (bps) cut in September, according to the CME Fedwatch Tool.
Technical analysis: USD/INR remains in consolidative mode in the near term
The Indian Rupee trades on a flat note on the day. The USD/INR pair stays bullish on the daily chart as it holds above the key 100-day Exponential Moving Average (EMA).
Nonetheless, in the shorter term, the pair has remained within its month-long range since March 21. The 14-day Relative Strength Index (RSI) hovers around the 50-midline, suggesting that further consolidation cannot be ruled out.
A decisive break above the upper boundary of the trading range at 83.65 might pave the way to the all-time high of 83.75. Further north, the next upside barrier will emerge at the 84.00 psychological level.
On the flip side, a breach of the 100-day EMA at 83.37 might drag the pair lower to the 83.00 round figure. Sustained trading below this level will expose 82.82, a low of January 12.
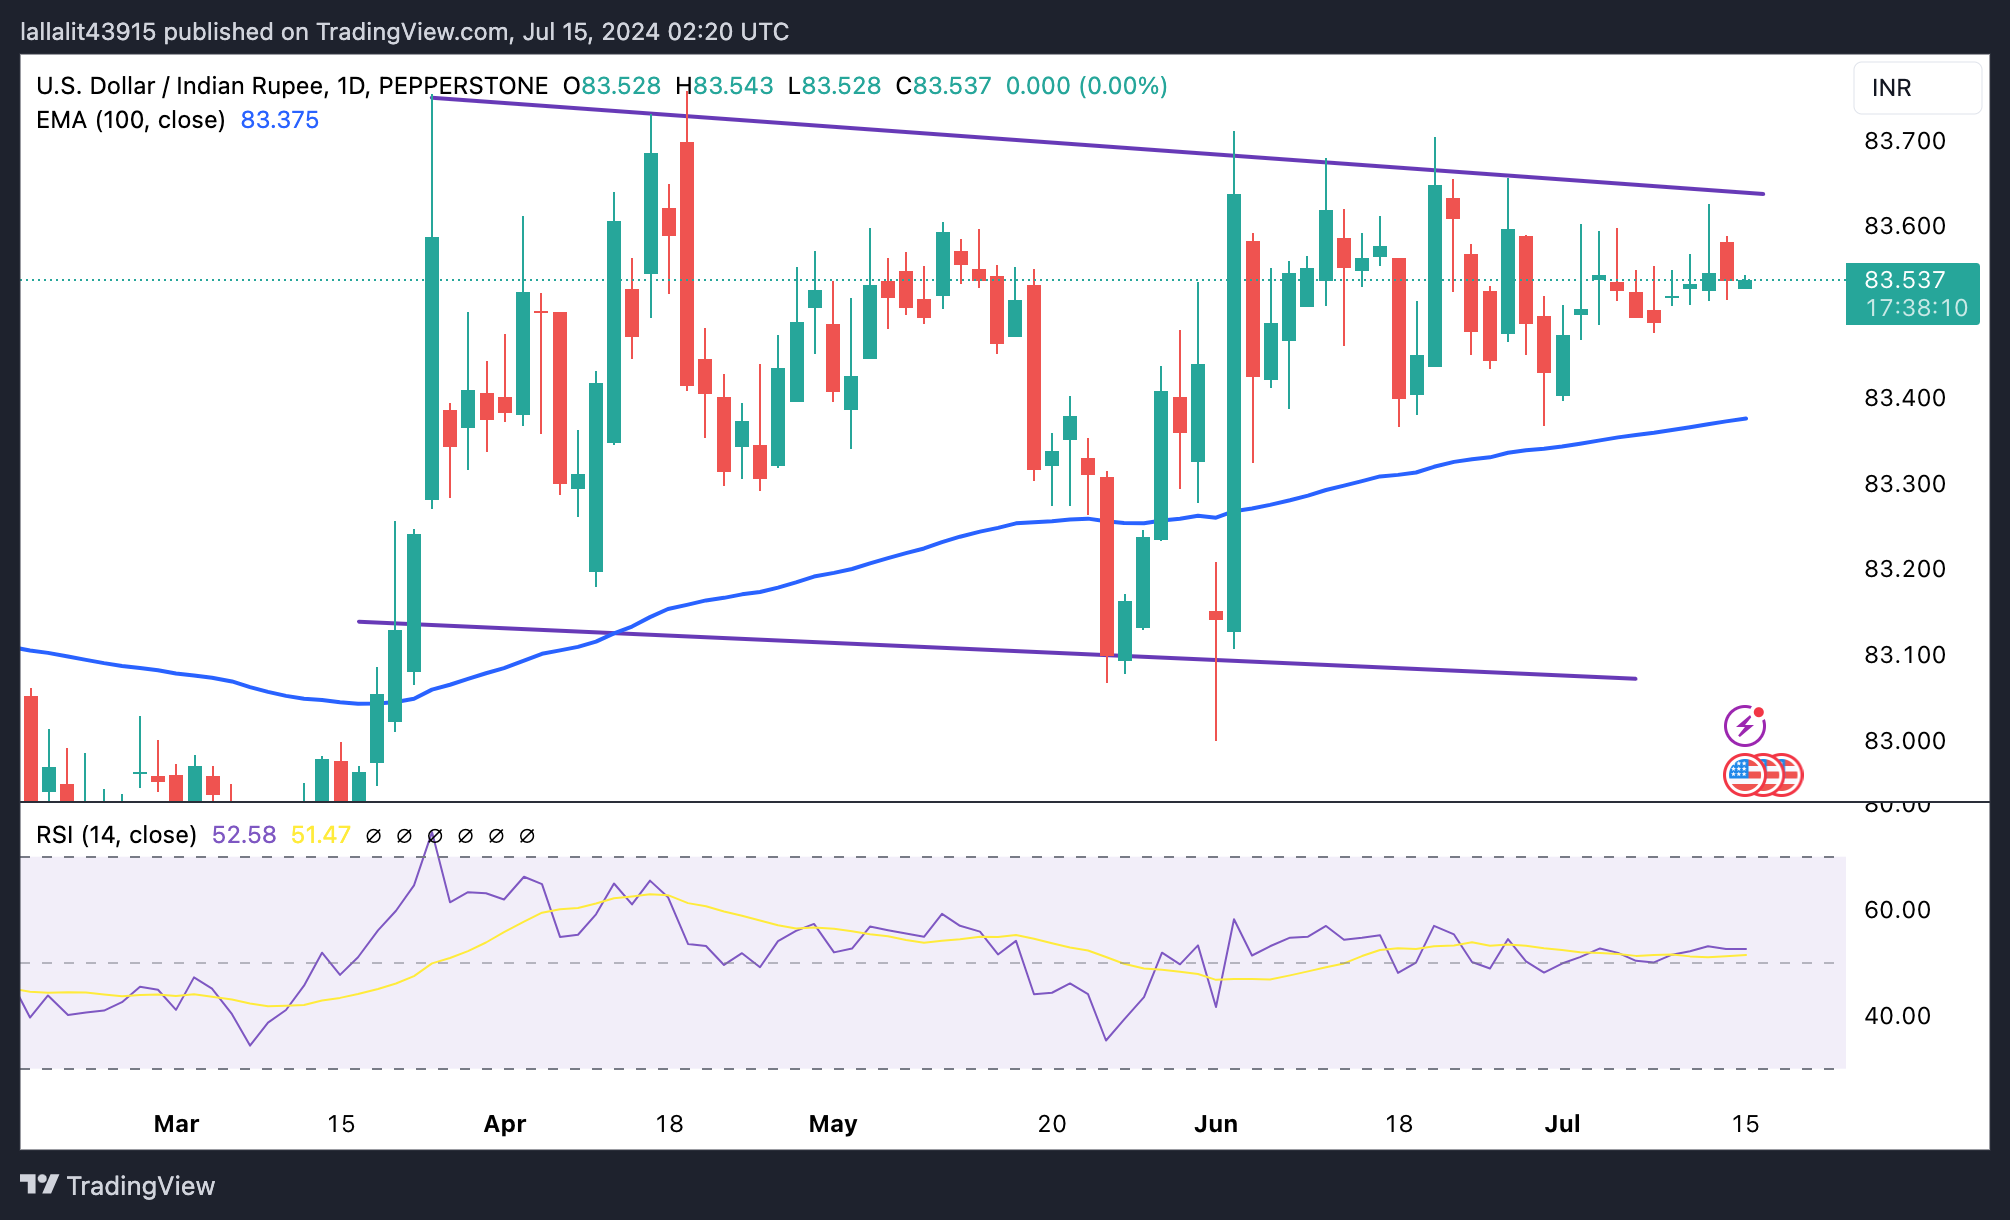
US Dollar price today
The table below shows the percentage change of US Dollar (USD) against listed major currencies today. US Dollar was the strongest against the New Zealand Dollar.
| USD | EUR | GBP | CAD | AUD | JPY | NZD | CHF | |
| USD | -0.02% | 0.01% | 0.03% | 0.00% | -0.13% | 0.06% | -0.10% | |
| EUR | 0.01% | 0.02% | 0.05% | 0.02% | -0.12% | 0.07% | -0.09% | |
| GBP | -0.02% | -0.03% | 0.02% | -0.01% | -0.13% | 0.03% | -0.12% | |
| CAD | -0.05% | -0.05% | -0.03% | -0.04% | -0.16% | -0.01% | -0.15% | |
| AUD | 0.00% | -0.02% | 0.00% | 0.03% | -0.15% | 0.05% | -0.12% | |
| JPY | 0.15% | 0.15% | 0.16% | 0.21% | 0.15% | 0.15% | 0.04% | |
| NZD | -0.04% | -0.07% | -0.05% | -0.02% | -0.06% | -0.16% | -0.16% | |
| CHF | 0.10% | 0.08% | 0.11% | 0.13% | 0.13% | -0.02% | 0.13% |
The heat map shows percentage changes of major currencies against each other. The base currency is picked from the left column, while the quote currency is picked from the top row. For example, if you pick the Euro from the left column and move along the horizontal line to the Japanese Yen, the percentage change displayed in the box will represent EUR (base)/JPY (quote).
Indian Rupee FAQs
The Indian Rupee (INR) is one of the most sensitive currencies to external factors. The price of Crude Oil (the country is highly dependent on imported Oil), the value of the US Dollar – most trade is conducted in USD – and the level of foreign investment, are all influential. Direct intervention by the Reserve Bank of India (RBI) in FX markets to keep the exchange rate stable, as well as the level of interest rates set by the RBI, are further major influencing factors on the Rupee.
The Reserve Bank of India (RBI) actively intervenes in forex markets to maintain a stable exchange rate, to help facilitate trade. In addition, the RBI tries to maintain the inflation rate at its 4% target by adjusting interest rates. Higher interest rates usually strengthen the Rupee. This is due to the role of the ‘carry trade’ in which investors borrow in countries with lower interest rates so as to place their money in countries’ offering relatively higher interest rates and profit from the difference.
Macroeconomic factors that influence the value of the Rupee include inflation, interest rates, the economic growth rate (GDP), the balance of trade, and inflows from foreign investment. A higher growth rate can lead to more overseas investment, pushing up demand for the Rupee. A less negative balance of trade will eventually lead to a stronger Rupee. Higher interest rates, especially real rates (interest rates less inflation) are also positive for the Rupee. A risk-on environment can lead to greater inflows of Foreign Direct and Indirect Investment (FDI and FII), which also benefit the Rupee.
Higher inflation, particularly, if it is comparatively higher than India’s peers, is generally negative for the currency as it reflects devaluation through oversupply. Inflation also increases the cost of exports, leading to more Rupees being sold to purchase foreign imports, which is Rupee-negative. At the same time, higher inflation usually leads to the Reserve Bank of India (RBI) raising interest rates and this can be positive for the Rupee, due to increased demand from international investors. The opposite effect is true of lower inflation.
| Raw materials | Closed | Change, % |
|---|---|---|
| Silver | 30.786 | -1.93 |
| Gold | 241.158 | -0.07 |
| Palladium | 962.76 | -3.16 |
- Gold price kicks off the new week on a weaker note amid the emergence of some USD buying.
- Bets that the Fed will cut rates in September should cap the USD gains and lend some support.
- The US political uncertainty after Trump's assassination attempt also warrants caution for bears.
Gold price (XAU/USD) struggles to capitalize on Friday's goodish rebound from the $2,391 area and kicks off the new week on a weaker note. This marks the second straight day of a downtick and is sponsored by a modest US Dollar (USD) strength, which tends to undermine demand for the USD-denominated commodity. The precious metal, however, remains close to its highest level since May 22 touched last Thursday and might continue to draw support from a combination of factors, warranting some caution for aggressive bearish traders.
Softer consumer inflation figures released from the US last week reaffirmed market bets that the Federal Reserve (Fed) will start cutting interest rates in September and lower borrowing costs again in December. This might hold back the USD bulls from placing aggressive bets and lend some support to the non-yielding Gold price. Furthermore, an alleged assassination attempt on former US President Donald Trump fuels political uncertainty and should further contribute to limiting any meaningful downside for the safe-haven XAU/USD.
Daily Digest Market Movers: Gold price is weighed down by a stronger USD, Fed rate cut bets to limit losses
- The US Dollar attracts some buyers on Monday and reverses a part of its recent losses to over a three-month low, which, in turn, is seen exerting some pressure on the Gold price for the second straight day.
- Data published by the US Bureau of Labor Statistics on Friday showed that the Producer Price Index (PPI) for final demand rose by 2.6% on a yearly basis in June, above consensus estimates for a reading of 2.3%.
- Adding to this, political uncertainty in the wake of a failed assassination attempt on US Presidential candidate Donald Trump benefits the Greenback, though dovish Federal Reserve expectations might cap gains.
- The current market pricing indicates over a 90% chance that the Fed will start its rate-cutting cycle in September and the bets were lifted by another tame US consumer inflation report released last Thursday.
- Furthermore, the US political situation should keep investors' appetite for riskier assets largely in check and lend some support to the safe-haven XAU/USD, warranting caution before positioning for deeper losses.
- Traders now look to the release of the Empire State Manufacturing Index from the US for short-term opportunities ahead of Fed Chair Jerome Powell's speech later during the North American session.
Technical Analysis: Gold price bulls have the upper hand, could aim to challenge the all-time peak touched in May
From a technical perspective, the emergence of some dip-buying on Friday reaffirmed strong support near the $2,390-2,388 resistance breakpoint. Moreover, oscillators on the daily chart are holding in positive territory and are still away from being in the overbought zone. This, in turn, suggests that the path of least resistance for the Gold price is to the upside. Hence, a slide back below the $2,400 mark might still be seen as a buying opportunity and remain limited.
Some follow-through selling, however, has the potential to drag the Gold price to the $2,358 region with some intermediate support near the $2,372-2,371 area. The subsequent fall might expose the 50-day Simple Moving Average (SMA) support, currently pegged near the $2,350 region.
On the flip side, last week's swing high, around the $2,425 region now seems to act as an immediate hurdle, above which the Gold price is more likely to aim back towards challenging the all-time peak, around the $2,450 region touched in May. A sustained strength beyond the latter will be seen as a fresh trigger for bullish traders and set the stage for an extension of the commodity's recent move-up witnessed over the past two weeks or so.
Gold FAQs
Gold has played a key role in human’s history as it has been widely used as a store of value and medium of exchange. Currently, apart from its shine and usage for jewelry, the precious metal is widely seen as a safe-haven asset, meaning that it is considered a good investment during turbulent times. Gold is also widely seen as a hedge against inflation and against depreciating currencies as it doesn’t rely on any specific issuer or government.
Central banks are the biggest Gold holders. In their aim to support their currencies in turbulent times, central banks tend to diversify their reserves and buy Gold to improve the perceived strength of the economy and the currency. High Gold reserves can be a source of trust for a country’s solvency. Central banks added 1,136 tonnes of Gold worth around $70 billion to their reserves in 2022, according to data from the World Gold Council. This is the highest yearly purchase since records began. Central banks from emerging economies such as China, India and Turkey are quickly increasing their Gold reserves.
Gold has an inverse correlation with the US Dollar and US Treasuries, which are both major reserve and safe-haven assets. When the Dollar depreciates, Gold tends to rise, enabling investors and central banks to diversify their assets in turbulent times. Gold is also inversely correlated with risk assets. A rally in the stock market tends to weaken Gold price, while sell-offs in riskier markets tend to favor the precious metal.
The price can move due to a wide range of factors. Geopolitical instability or fears of a deep recession can quickly make Gold price escalate due to its safe-haven status. As a yield-less asset, Gold tends to rise with lower interest rates, while higher cost of money usually weighs down on the yellow metal. Still, most moves depend on how the US Dollar (USD) behaves as the asset is priced in dollars (XAU/USD). A strong Dollar tends to keep the price of Gold controlled, whereas a weaker Dollar is likely to push Gold prices up.
Following the publication of the high-impact China’s growth and activity data for May, the National Bureau of Statistics (NBS) expressed its outlook on the economy during its press conference on Monday.
Key quotes (via Reuters)
China's economy operation generally steady in H1.
China H1 GDP +5.0% YoY.
External environment complex and external demand still not sufficient.
Economy recovery foundation still needs to be consolidated.
developing story ...
Market reaction
AUD/USD is holding losses near 0.6760, down 0.19% on the day, at the press time.
Australian Dollar PRICE Today
The table below shows the percentage change of Australian Dollar (AUD) against listed major currencies today. Australian Dollar was the weakest against the US Dollar.
| USD | EUR | GBP | JPY | CAD | AUD | NZD | CHF | |
|---|---|---|---|---|---|---|---|---|
| USD | 0.19% | 0.17% | -0.02% | 0.07% | 0.21% | 0.25% | 0.17% | |
| EUR | -0.19% | 0.02% | 0.00% | 0.07% | 0.05% | 0.24% | 0.18% | |
| GBP | -0.17% | -0.02% | 0.06% | 0.05% | 0.04% | 0.18% | 0.17% | |
| JPY | 0.02% | 0.00% | -0.06% | 0.09% | 0.00% | 0.23% | 0.01% | |
| CAD | -0.07% | -0.07% | -0.05% | -0.09% | 0.07% | 0.18% | 0.11% | |
| AUD | -0.21% | -0.05% | -0.04% | -0.01% | -0.07% | 0.19% | 0.13% | |
| NZD | -0.25% | -0.24% | -0.18% | -0.23% | -0.18% | -0.19% | -0.07% | |
| CHF | -0.17% | -0.18% | -0.17% | -0.01% | -0.11% | -0.13% | 0.07% |
The heat map shows percentage changes of major currencies against each other. The base currency is picked from the left column, while the quote currency is picked from the top row. For example, if you pick the Australian Dollar from the left column and move along the horizontal line to the US Dollar, the percentage change displayed in the box will represent AUD (base)/USD (quote).
China’s economy grew 4.7% over the year in the second quarter of 2024, compared to a 5.3% expansion in the first quarter, according to the official data published by the National Bureau of Statistics (NBS) on Monday. The data beat the market expectations of 5.1% in the reported period.
On a quarterly basis, the Chinese Gross Domestic Product (GDP) rate rose 0.7% in Q2 2024 vs. 1.5% registered in the previous quarter. The market forecast was for a 1.1% print.
China’s June Retail Sales YoY, climbed 2.0% vs. 3.1% expected and 3.7% prior while the country’s Industrial Production came in at 5.3% YoY vs. 5.0% estimates and May’s 5.6%.
Meanwhile, the Fixed Asset Investment increased by 3.9% YTD YoY in June vs 3.9% expected and 4.0% last.
AUD/USD reaction to China’s data dump
Weaker-than-expected China’s GDP data exerted mild bearish pressure on the Australian Dollar, reversing the AUD/USD pair toward 0.6750. At the time of writing, AUD/USD is down 0.19% on the day to trade at 0.6768.
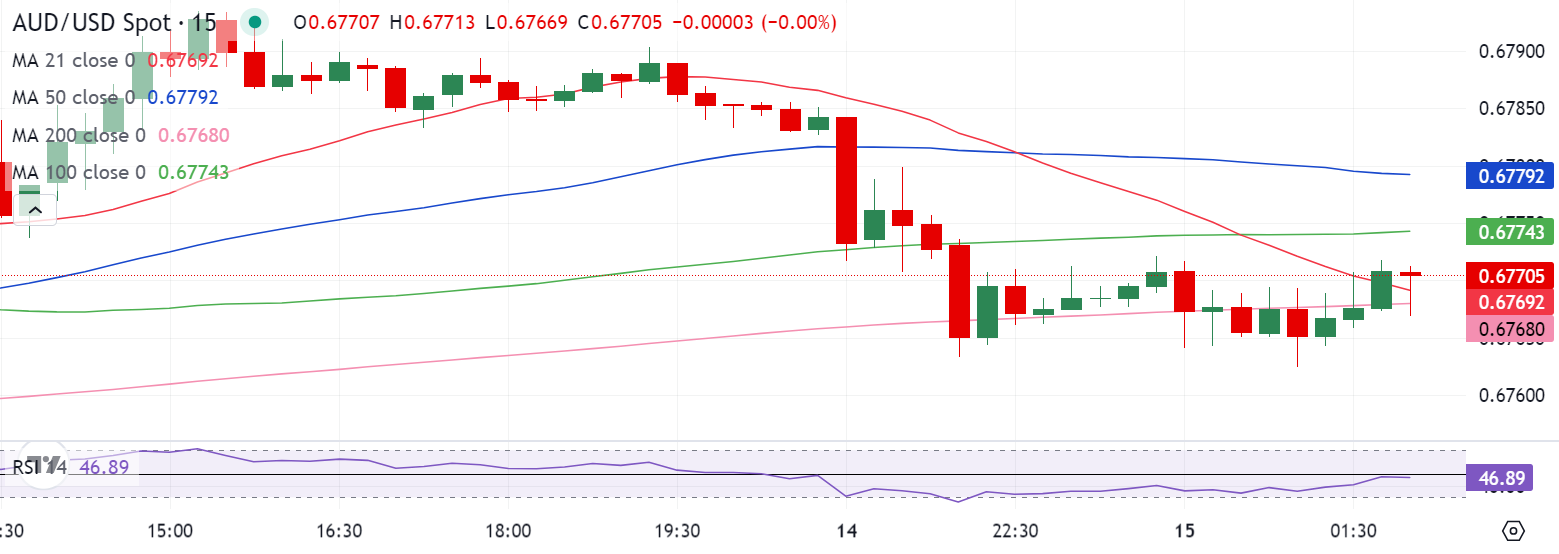
AUD/USD: 15-minutes chart
Australian Dollar FAQs
One of the most significant factors for the Australian Dollar (AUD) is the level of interest rates set by the Reserve Bank of Australia (RBA). Because Australia is a resource-rich country another key driver is the price of its biggest export, Iron Ore. The health of the Chinese economy, its largest trading partner, is a factor, as well as inflation in Australia, its growth rate and Trade Balance. Market sentiment – whether investors are taking on more risky assets (risk-on) or seeking safe-havens (risk-off) – is also a factor, with risk-on positive for AUD.
The Reserve Bank of Australia (RBA) influences the Australian Dollar (AUD) by setting the level of interest rates that Australian banks can lend to each other. This influences the level of interest rates in the economy as a whole. The main goal of the RBA is to maintain a stable inflation rate of 2-3% by adjusting interest rates up or down. Relatively high interest rates compared to other major central banks support the AUD, and the opposite for relatively low. The RBA can also use quantitative easing and tightening to influence credit conditions, with the former AUD-negative and the latter AUD-positive.
China is Australia’s largest trading partner so the health of the Chinese economy is a major influence on the value of the Australian Dollar (AUD). When the Chinese economy is doing well it purchases more raw materials, goods and services from Australia, lifting demand for the AUD, and pushing up its value. The opposite is the case when the Chinese economy is not growing as fast as expected. Positive or negative surprises in Chinese growth data, therefore, often have a direct impact on the Australian Dollar and its pairs.
Iron Ore is Australia’s largest export, accounting for $118 billion a year according to data from 2021, with China as its primary destination. The price of Iron Ore, therefore, can be a driver of the Australian Dollar. Generally, if the price of Iron Ore rises, AUD also goes up, as aggregate demand for the currency increases. The opposite is the case if the price of Iron Ore falls. Higher Iron Ore prices also tend to result in a greater likelihood of a positive Trade Balance for Australia, which is also positive of the AUD.
The Trade Balance, which is the difference between what a country earns from its exports versus what it pays for its imports, is another factor that can influence the value of the Australian Dollar. If Australia produces highly sought after exports, then its currency will gain in value purely from the surplus demand created from foreign buyers seeking to purchase its exports versus what it spends to purchase imports. Therefore, a positive net Trade Balance strengthens the AUD, with the opposite effect if the Trade Balance is negative.
The People’s Bank of China (PBOC) set the USD/CNY central rate on Monday at 7.1313, as against the previous day's fix of 7.1300 and 7.2548 Reuters estimates.
- NZD/USD edges lower as Business NZ PSI drops to 40.2 in June, marking its fourth consecutive monthly decrease.
- Kelly Eckhold, Chief Economist at Westpac, anticipates that the RBNZ will begin easing policy in February 2025.
- The US Dollar improves due to improved risk aversion following the attempted assassination of former US President Trump on Saturday.
NZD/USD depreciates to near 0.6100 during the Asian session on Monday. This decline can be linked to the Business NZ Performance of Services Index (PSI), which dropped to 40.2 in June, marking its fourth consecutive monthly decrease and the lowest activity level for a month without a COVID lockdown. The previous reading was 42.6.
Kelly Eckhold, Chief Economist at Westpac, noted in this week's analysis and forecasts that the Reserve Bank of New Zealand's (RBNZ) growth projections have been notably downgraded. More importantly, the RBNZ appears increasingly confident that annual inflation will soon fall below 3%. Eckhold expects the RBNZ to start easing policy in February next year, though an earlier move is possible and will depend on incoming data.
In China, New Zealand's top trading partner, Q2 GDP figures are expected later on Monday. Market forecasts indicate that the economy will slow down due to ongoing internal and external challenges. Meanwhile, the Communist Party of China will begin the Third Plenum today, a crucial meeting that could determine the country's long-term economic direction.
The US Dollar (USD) recovery is putting pressure on the NZD/USD pair. Risk aversion has intensified following the attempted assassination of former US President Donald Trump on Saturday. Analysts suggest that if this incident boosts Trump's election prospects, it could lead to so-called 'Trump-victory trades,' which may include a stronger US Dollar and a steeper US Treasury yield curve, per Reuters.
Despite hotter-than-expected US Producer Price Index (PPI) figures on Friday, the USD remained largely unaffected. The Core PPI rose 3.0% year-over-year in June, exceeding the expected 2.5% and the previous reading of 2.6%. Moreover, the preliminary Michigan Consumer Sentiment Index fell short of expectations in July, registering at 66.0 compared to the forecasted 68.5 and the previous 68.2.
New Zealand Dollar FAQs
The New Zealand Dollar (NZD), also known as the Kiwi, is a well-known traded currency among investors. Its value is broadly determined by the health of the New Zealand economy and the country’s central bank policy. Still, there are some unique particularities that also can make NZD move. The performance of the Chinese economy tends to move the Kiwi because China is New Zealand’s biggest trading partner. Bad news for the Chinese economy likely means less New Zealand exports to the country, hitting the economy and thus its currency. Another factor moving NZD is dairy prices as the dairy industry is New Zealand’s main export. High dairy prices boost export income, contributing positively to the economy and thus to the NZD.
The Reserve Bank of New Zealand (RBNZ) aims to achieve and maintain an inflation rate between 1% and 3% over the medium term, with a focus to keep it near the 2% mid-point. To this end, the bank sets an appropriate level of interest rates. When inflation is too high, the RBNZ will increase interest rates to cool the economy, but the move will also make bond yields higher, increasing investors’ appeal to invest in the country and thus boosting NZD. On the contrary, lower interest rates tend to weaken NZD. The so-called rate differential, or how rates in New Zealand are or are expected to be compared to the ones set by the US Federal Reserve, can also play a key role in moving the NZD/USD pair.
Macroeconomic data releases in New Zealand are key to assess the state of the economy and can impact the New Zealand Dollar’s (NZD) valuation. A strong economy, based on high economic growth, low unemployment and high confidence is good for NZD. High economic growth attracts foreign investment and may encourage the Reserve Bank of New Zealand to increase interest rates, if this economic strength comes together with elevated inflation. Conversely, if economic data is weak, NZD is likely to depreciate.
The New Zealand Dollar (NZD) tends to strengthen during risk-on periods, or when investors perceive that broader market risks are low and are optimistic about growth. This tends to lead to a more favorable outlook for commodities and so-called ‘commodity currencies’ such as the Kiwi. Conversely, NZD tends to weaken at times of market turbulence or economic uncertainty as investors tend to sell higher-risk assets and flee to the more-stable safe havens.
US President Joe Biden on Monday addressed the nation from the White House, where he condemned all political violence and called for unity, per CNBC.
Biden further stated that “it’s time to cool it down” and noted not just the weekend attack on Trump but also the possibility of election-year violence on multiple fronts.
On Saturday, former president Donald Trump was shot in the ear during his rally in Butler, Pennsylvania, in an assassination attempt. One spectator was killed in the attack, two others were critically injured and Trump was pictured with blood spilling from his ear.
Market reaction
The Greenback edges higher amid risk aversion. At the time of writing, the USD Index (DXY) is trading at 104.28, adding 0.19% on the day.
Risk sentiment FAQs
In the world of financial jargon the two widely used terms “risk-on” and “risk off'' refer to the level of risk that investors are willing to stomach during the period referenced. In a “risk-on” market, investors are optimistic about the future and more willing to buy risky assets. In a “risk-off” market investors start to ‘play it safe’ because they are worried about the future, and therefore buy less risky assets that are more certain of bringing a return, even if it is relatively modest.
Typically, during periods of “risk-on”, stock markets will rise, most commodities – except Gold – will also gain in value, since they benefit from a positive growth outlook. The currencies of nations that are heavy commodity exporters strengthen because of increased demand, and Cryptocurrencies rise. In a “risk-off” market, Bonds go up – especially major government Bonds – Gold shines, and safe-haven currencies such as the Japanese Yen, Swiss Franc and US Dollar all benefit.
The Australian Dollar (AUD), the Canadian Dollar (CAD), the New Zealand Dollar (NZD) and minor FX like the Ruble (RUB) and the South African Rand (ZAR), all tend to rise in markets that are “risk-on”. This is because the economies of these currencies are heavily reliant on commodity exports for growth, and commodities tend to rise in price during risk-on periods. This is because investors foresee greater demand for raw materials in the future due to heightened economic activity.
The major currencies that tend to rise during periods of “risk-off” are the US Dollar (USD), the Japanese Yen (JPY) and the Swiss Franc (CHF). The US Dollar, because it is the world’s reserve currency, and because in times of crisis investors buy US government debt, which is seen as safe because the largest economy in the world is unlikely to default. The Yen, from increased demand for Japanese government bonds, because a high proportion are held by domestic investors who are unlikely to dump them – even in a crisis. The Swiss Franc, because strict Swiss banking laws offer investors enhanced capital protection.
Bank of England Monetary Policy Committee member Swati Dhingra said on Monday that inflation in the United Kingdom was unlikely to rise sharply again and the UK central bank should bring down borrowing costs.
Key quotes
Now is the time to start normalising (interest rates) so we can then finally stop squeezing living standards the way we have been to try and get inflation down.
I don't see some kind of consumption boom and if we're going to start moderating from the very high level of interest rate that we are at now...it is going to take some time for that to happen, for us to moderate it as well as for that to then feed into the real economy.
Demand is too soft for inflation to rise sharply.
Now is the time to start normalising interest rates so we can finally stop squeezing living standards.
Market reaction
At the time of writing, GBP/USD is trading at 1.2965, losing 0.17% on the day.
BoE FAQs
The Bank of England (BoE) decides monetary policy for the United Kingdom. Its primary goal is to achieve ‘price stability’, or a steady inflation rate of 2%. Its tool for achieving this is via the adjustment of base lending rates. The BoE sets the rate at which it lends to commercial banks and banks lend to each other, determining the level of interest rates in the economy overall. This also impacts the value of the Pound Sterling (GBP).
When inflation is above the Bank of England’s target it responds by raising interest rates, making it more expensive for people and businesses to access credit. This is positive for the Pound Sterling because higher interest rates make the UK a more attractive place for global investors to park their money. When inflation falls below target, it is a sign economic growth is slowing, and the BoE will consider lowering interest rates to cheapen credit in the hope businesses will borrow to invest in growth-generating projects – a negative for the Pound Sterling.
In extreme situations, the Bank of England can enact a policy called Quantitative Easing (QE). QE is the process by which the BoE substantially increases the flow of credit in a stuck financial system. QE is a last resort policy when lowering interest rates will not achieve the necessary result. The process of QE involves the BoE printing money to buy assets – usually government or AAA-rated corporate bonds – from banks and other financial institutions. QE usually results in a weaker Pound Sterling.
Quantitative tightening (QT) is the reverse of QE, enacted when the economy is strengthening and inflation starts rising. Whilst in QE the Bank of England (BoE) purchases government and corporate bonds from financial institutions to encourage them to lend; in QT, the BoE stops buying more bonds, and stops reinvesting the principal maturing on the bonds it already holds. It is usually positive for the Pound Sterling.
- EUR/USD trades with a bearish bias near 1.0885 in Monday’s early Asian session.
- The US PPI inflation rose faster than expected in June.
- US political violence over the weekend lifts the Greenback, a safe-haven currency.
The EUR/USD pair attracts some sellers around 1.0885 during the early Asian session on Monday. The major pair edges lower amid risk aversion, triggering a fresh bid of the US Dollar (USD). The Eurozone May Industrial Production, July NY Empire State Manufacturing Index will be released on Monday, along with the Federal Reserve's (Fed) Mary Daly speech.
The wholesale inflation in the US, as measured by the Producer Price Index (PPI) rose to 2.6% YoY in June from a revised reading of 2.4% in the previous reading, above the consensus of 2.3%. The core PPI climbed 3.0% YoY, surpassing the expected 2.5%. However, the attention remains on the recent cooler Consumer Price Index (CPI) inflation, which raised expectations for a rate cut.
Additionally, the University of Michigan's Consumer Sentiment Index survey dropped to 66.0 in July from 68.2 in June, the lowest in seven months, falling short of the expected increase to 68.5. The UoM 5-year Consumer Inflation Expectations declined slightly in July to 2.9% from the previous reading of 3.0%.
Fitch analysts said that the Federal Open Market Committee (FOMC) might cut interest rates sooner than later, citing potential concern at the Federal Reserve over the labour market. The Fed will be worried about additional weakness in the labour market down the road.
The US political violence over the weekend has boosted a safe-haven currency like the Greenback and created a headwind for EUR/USD. During the rally in Butler, Pennsylvania on Saturday, former President Donald Trump was injured in an assassination attempt. One spectator was killed in the attack, two others were critically injured, and Trump was pictured with blood spilling from his ear, per BBC.
On the Euro front, officials anticipate pricing pressures to remain close to their current levels for the entire year, lowering expectations for the European Central Bank's (ECB) further rate cuts. The ECB president Christine Lagarde emphasized its cautious approach this month, saying, “The strong labour market means that we can take time to gather new information, but we also need to be mindful of the fact that the growth outlook remains uncertain.”
Euro FAQs
The Euro is the currency for the 20 European Union countries that belong to the Eurozone. It is the second most heavily traded currency in the world behind the US Dollar. In 2022, it accounted for 31% of all foreign exchange transactions, with an average daily turnover of over $2.2 trillion a day. EUR/USD is the most heavily traded currency pair in the world, accounting for an estimated 30% off all transactions, followed by EUR/JPY (4%), EUR/GBP (3%) and EUR/AUD (2%).
The European Central Bank (ECB) in Frankfurt, Germany, is the reserve bank for the Eurozone. The ECB sets interest rates and manages monetary policy. The ECB’s primary mandate is to maintain price stability, which means either controlling inflation or stimulating growth. Its primary tool is the raising or lowering of interest rates. Relatively high interest rates – or the expectation of higher rates – will usually benefit the Euro and vice versa. The ECB Governing Council makes monetary policy decisions at meetings held eight times a year. Decisions are made by heads of the Eurozone national banks and six permanent members, including the President of the ECB, Christine Lagarde.
Eurozone inflation data, measured by the Harmonized Index of Consumer Prices (HICP), is an important econometric for the Euro. If inflation rises more than expected, especially if above the ECB’s 2% target, it obliges the ECB to raise interest rates to bring it back under control. Relatively high interest rates compared to its counterparts will usually benefit the Euro, as it makes the region more attractive as a place for global investors to park their money.
Data releases gauge the health of the economy and can impact on the Euro. Indicators such as GDP, Manufacturing and Services PMIs, employment, and consumer sentiment surveys can all influence the direction of the single currency. A strong economy is good for the Euro. Not only does it attract more foreign investment but it may encourage the ECB to put up interest rates, which will directly strengthen the Euro. Otherwise, if economic data is weak, the Euro is likely to fall. Economic data for the four largest economies in the euro area (Germany, France, Italy and Spain) are especially significant, as they account for 75% of the Eurozone’s economy.
Another significant data release for the Euro is the Trade Balance. This indicator measures the difference between what a country earns from its exports and what it spends on imports over a given period. If a country produces highly sought after exports then its currency will gain in value purely from the extra demand created from foreign buyers seeking to purchase these goods. Therefore, a positive net Trade Balance strengthens a currency and vice versa for a negative balance.
- GBP/USD kicks off the new week on a weaker note amid the emergence of some USD buying.
- September Fed rate cut bets should cap gains for the USD and lend some support to the pair.
- Diminishing odds for an August BoE rate cut also warrant caution before placing bearish bets.
The GBP/USD pair attracts some selling during the Asian session on Monday and for now, seems to have snapped a three-day winning streak to the 1.3000 neighborhood, or its highest level since July 2023. Spot prices currently trade around the 1.2965 area, down just over 0.15% for the day amid a modest US Dollar (USD) strength, though any meaningful depreciating move seems elusive.
The attack on US Presidential candidate Donald Trump on Sunday raises the level of political uncertainty and drives some haven flows, allowing the USD to recover a part of Friday's slump to over a three-month low. That said, growing acceptance that the Federal Reserve (Fed) will soon begin its rate-cutting cycle should continue to act as a headwind for the Greenback and lend some support to the GBP/USD pair.
In fact, the CME Group's FedWatch tool points to over a 90% chance that the Fed will lower borrowing costs by 25 basis points (bps) in September. Moreover, the markets are pricing in the possibility of another interest rate cut in December and the bets were lifted by the softer-than-expected US consumer inflation figures released last week. This might hold back traders from placing fresh bullish bets around the USD.
The British Pound (GBP), on the other hand, draws support from diminishing odds of a rate cut by the Bank of England (BoE) in August, especially after data released last week showed that Britain's economy grew more quickly than expected, by 0.4% in May. This, in turn, warrants some caution before confirming that the GBP/USD pair might have formed a near-term top and positioning for any meaningful downfall.
Market participants now look to the release of the Empire State Manufacturing Index from the US. The focus, however, will remain on Fed Chair Jerome Powell's speech, which, along with the US Treasury bond yields and the broader risk sentiment, will influence the USD. Nevertheless, the aforementioned fundamental backdrop supports prospects for the emergence of some dip-buying around the GBP/USD pair.
Pound Sterling FAQs
The Pound Sterling (GBP) is the oldest currency in the world (886 AD) and the official currency of the United Kingdom. It is the fourth most traded unit for foreign exchange (FX) in the world, accounting for 12% of all transactions, averaging $630 billion a day, according to 2022 data. Its key trading pairs are GBP/USD, aka ‘Cable’, which accounts for 11% of FX, GBP/JPY, or the ‘Dragon’ as it is known by traders (3%), and EUR/GBP (2%). The Pound Sterling is issued by the Bank of England (BoE).
The single most important factor influencing the value of the Pound Sterling is monetary policy decided by the Bank of England. The BoE bases its decisions on whether it has achieved its primary goal of “price stability” – a steady inflation rate of around 2%. Its primary tool for achieving this is the adjustment of interest rates. When inflation is too high, the BoE will try to rein it in by raising interest rates, making it more expensive for people and businesses to access credit. This is generally positive for GBP, as higher interest rates make the UK a more attractive place for global investors to park their money. When inflation falls too low it is a sign economic growth is slowing. In this scenario, the BoE will consider lowering interest rates to cheapen credit so businesses will borrow more to invest in growth-generating projects.
Data releases gauge the health of the economy and can impact the value of the Pound Sterling. Indicators such as GDP, Manufacturing and Services PMIs, and employment can all influence the direction of the GBP. A strong economy is good for Sterling. Not only does it attract more foreign investment but it may encourage the BoE to put up interest rates, which will directly strengthen GBP. Otherwise, if economic data is weak, the Pound Sterling is likely to fall.
Another significant data release for the Pound Sterling is the Trade Balance. This indicator measures the difference between what a country earns from its exports and what it spends on imports over a given period. If a country produces highly sought-after exports, its currency will benefit purely from the extra demand created from foreign buyers seeking to purchase these goods. Therefore, a positive net Trade Balance strengthens a currency and vice versa for a negative balance.
| Index | Change, points | Closed | Change, % |
|---|---|---|---|
| NIKKEI 225 | -1033.34 | 41190.68 | -2.45 |
| Hang Seng | 461.05 | 18293.38 | 2.59 |
| KOSPI | -34.35 | 2857 | -1.19 |
| ASX 200 | 69.7 | 7959.3 | 0.88 |
| DAX | 213.62 | 18748.18 | 1.15 |
| CAC 40 | 97.19 | 7724.32 | 1.27 |
| Dow Jones | 247.15 | 40000.9 | 0.62 |
| S&P 500 | 30.81 | 5615.35 | 0.55 |
| NASDAQ Composite | 115.04 | 18398.45 | 0.63 |
| Pare | Closed | Change, % |
|---|---|---|
| AUDUSD | 0.67832 | 0.39 |
| EURJPY | 172.182 | -0.4 |
| EURUSD | 1.09045 | 0.37 |
| GBPJPY | 205.028 | -0.19 |
| GBPUSD | 1.29865 | 0.59 |
| NZDUSD | 0.61175 | 0.42 |
| USDCAD | 1.36339 | 0.01 |
| USDCHF | 0.89441 | -0.25 |
| USDJPY | 157.87 | -0.78 |


© 2000-2026. Bản quyền Teletrade.
Trang web này được quản lý bởi Teletrade D.J. LLC 2351 LLC 2022 (Euro House, Richmond Hill Road, Kingstown, VC0100, St. Vincent and the Grenadines).
Thông tin trên trang web không phải là cơ sở để đưa ra quyết định đầu tư và chỉ được cung cấp cho mục đích làm quen.
Giao dịch trên thị trường tài chính (đặc biệt là giao dịch sử dụng các công cụ biên) mở ra những cơ hội lớn và tạo điều kiện cho các nhà đầu tư sẵn sàng mạo hiểm để thu lợi nhuận, tuy nhiên nó mang trong mình nguy cơ rủi ro khá cao. Chính vì vậy trước khi tiến hành giao dịch cần phải xem xét mọi mặt vấn đề chấp nhận tiến hành giao dịch cụ thể xét theo quan điểm của nguồn lực tài chính sẵn có và mức độ am hiểu thị trường tài chính.
Sử dụng thông tin: sử dụng toàn bộ hay riêng biệt các dữ liệu trên trang web của công ty TeleTrade như một nguồn cung cấp thông tin nhất định. Việc sử dụng tư liệu từ trang web cần kèm theo liên kết đến trang teletrade.vn. Việc tự động thu thập số liệu cũng như thông tin từ trang web TeleTrade đều không được phép.
Xin vui lòng liên hệ với pr@teletrade.global nếu có câu hỏi.
ngân hàng