- Phân tích
- Tin tức và các công cụ
- Tin tức thị trường
Tin tức thì trường
Federal Reserve Bank of Chicago President Austan Goolsbee said on Wednesday that he becomes more worried about the labor market than inflation, citing recent progress on price pressures and weak jobs data, per Bloomberg
Key quotes
It's important that we not assume that if the labor market were to deteriorate past normal, that we could react and fix that, once it's already broken.
Inflation, it’s clear, has been coming down for some time, and we’re quite restrictive.
Economic conditions will warrant the size of rate cuts
Market reaction
The US Dollar Index (DXY) is trading 0.01% higher on the day at 102.60, as of writing.
Fed FAQs
Monetary policy in the US is shaped by the Federal Reserve (Fed). The Fed has two mandates: to achieve price stability and foster full employment. Its primary tool to achieve these goals is by adjusting interest rates. When prices are rising too quickly and inflation is above the Fed’s 2% target, it raises interest rates, increasing borrowing costs throughout the economy. This results in a stronger US Dollar (USD) as it makes the US a more attractive place for international investors to park their money. When inflation falls below 2% or the Unemployment Rate is too high, the Fed may lower interest rates to encourage borrowing, which weighs on the Greenback.
The Federal Reserve (Fed) holds eight policy meetings a year, where the Federal Open Market Committee (FOMC) assesses economic conditions and makes monetary policy decisions. The FOMC is attended by twelve Fed officials – the seven members of the Board of Governors, the president of the Federal Reserve Bank of New York, and four of the remaining eleven regional Reserve Bank presidents, who serve one-year terms on a rotating basis.
In extreme situations, the Federal Reserve may resort to a policy named Quantitative Easing (QE). QE is the process by which the Fed substantially increases the flow of credit in a stuck financial system. It is a non-standard policy measure used during crises or when inflation is extremely low. It was the Fed’s weapon of choice during the Great Financial Crisis in 2008. It involves the Fed printing more Dollars and using them to buy high grade bonds from financial institutions. QE usually weakens the US Dollar.
Quantitative tightening (QT) is the reverse process of QE, whereby the Federal Reserve stops buying bonds from financial institutions and does not reinvest the principal from the bonds it holds maturing, to purchase new bonds. It is usually positive for the value of the US Dollar.
- The New Zealand Dollar weakens in Thursday’s early Asian session.
- RBNZ’s dovish stance continues to undermine the Kiwi.
- Investors await the US data for fresh impetus, including Retail Sales, Initial Jobless Claims and Philly Fed Manufacturing Index.
The New Zealand Dollar (NZD) remains on the defensive on Thursday. The dovish stance of the Reserve Bank of New Zealand (RBNZ) after a surprise rate cut on Wednesday has exerted selling pressure on the Kiwi as the easing cycle came much sooner than expected.
Nonetheless, further confirmation of the downward path of US inflation has triggered the expectation of a Federal Reserve (Fed) interest rate cut in September. This, in turn, might drag the US Dollar (USD) lower and cap the downside for NZD/USD. Later on Thursday, traders will keep an eye on US Retail Sales, weekly Initial Jobless Claims, the Philly Fed Manufacturing Index and Industrial Production.
Daily Digest Market Movers: New Zealand Dollar remains vulnerable after the RBNZ’s dovish move
- RBNZ Governor Adrian Orr said early Thursday that the central bank is maintaining a suitably restrictive policy stance and is likely looking at gauging when to enact future rate reductions.
- RBNZ board members decided to cut its Official Cash Rate (OCR) by 25 basis points (bps) from 5.50% to 5.25%. The market participants expected a rates-on-hold decision.
- Board members agreed that policy will need to remain restrictive for some time to ensure that domestic inflationary pressures continue to decline, according to the minutes of the RBNZ interest rate meeting.
- During the press conference, RBNZ’s Orr said that he is confident inflation back in its target band can commence re-normalising rates. Orr further stated that the central bank considered a range of moves; the consensus was for 25 bps.
- The US headline Consumer Price Index (CPI) increased 2.9% YoY in July, compared to a rise of 3% in June, below the market consensus. The Core CPI climbed 3.2% YoY following a rise of 3.3% seen in July, in line with the market forecast.
Technical Analysis: New Zealand Dollar maintains a negative outlook
The New Zealand Dollar trades in negative territory on the day. The bearish outlook of the NZD/USD pair remains intact as the pair faces rejection around the key 100-day Exponential Moving Average (EMA) and the descending trendline around 0.6050 on the daily chart. The 14-day Relative Strength Index (RSI) points lower below the 50-midline, suggesting lingering bearish pressure.
The crucial resistance level for NZD/USD appears at 0.6050, the key 100-day EMA and the descending trendline. If the price manages to break above this level, it would indicate the possibility of further upside to 0.6077, the upper boundary of the Bollinger Band. Further north, the next barrier emerges at 0.6154, the high of July 8.
On the downside, a breach of the 0.6000 psychological level would see a drop to 0.5930, a low of August 2. Extended losses will see the next contention level around 0.5857, the lower limit of the Bollinger Band and a low of July 29.
New Zealand Dollar FAQs
The New Zealand Dollar (NZD), also known as the Kiwi, is a well-known traded currency among investors. Its value is broadly determined by the health of the New Zealand economy and the country’s central bank policy. Still, there are some unique particularities that also can make NZD move. The performance of the Chinese economy tends to move the Kiwi because China is New Zealand’s biggest trading partner. Bad news for the Chinese economy likely means less New Zealand exports to the country, hitting the economy and thus its currency. Another factor moving NZD is dairy prices as the dairy industry is New Zealand’s main export. High dairy prices boost export income, contributing positively to the economy and thus to the NZD.
The Reserve Bank of New Zealand (RBNZ) aims to achieve and maintain an inflation rate between 1% and 3% over the medium term, with a focus to keep it near the 2% mid-point. To this end, the bank sets an appropriate level of interest rates. When inflation is too high, the RBNZ will increase interest rates to cool the economy, but the move will also make bond yields higher, increasing investors’ appeal to invest in the country and thus boosting NZD. On the contrary, lower interest rates tend to weaken NZD. The so-called rate differential, or how rates in New Zealand are or are expected to be compared to the ones set by the US Federal Reserve, can also play a key role in moving the NZD/USD pair.
Macroeconomic data releases in New Zealand are key to assess the state of the economy and can impact the New Zealand Dollar’s (NZD) valuation. A strong economy, based on high economic growth, low unemployment and high confidence is good for NZD. High economic growth attracts foreign investment and may encourage the Reserve Bank of New Zealand to increase interest rates, if this economic strength comes together with elevated inflation. Conversely, if economic data is weak, NZD is likely to depreciate.
The New Zealand Dollar (NZD) tends to strengthen during risk-on periods, or when investors perceive that broader market risks are low and are optimistic about growth. This tends to lead to a more favorable outlook for commodities and so-called ‘commodity currencies’ such as the Kiwi. Conversely, NZD tends to weaken at times of market turbulence or economic uncertainty as investors tend to sell higher-risk assets and flee to the more-stable safe havens.
- EUR/USD rose to a fresh seven-month high on Wednesday before falling back.
- EU GDP growth landed exactly where markets expected, and US CPI inflation cooled.
- US Retail Sales figures still in the barrel for Thursday.
EUR/USD caught a brief rally into a fresh seven-month peak bid before easing back toward the 1.1000 handle on Wednesday. Fiber caught a run over 1.1000 and into the 1.1050 level after pan-EU Gross Domestic Product (GDP) growth figure printed exactly as expected. Meanwhile, EU Industrial Production remains crimped and US Consumer Price Index (CPI) inflation figures met forecasts but still disappointed markets.
Forex Today: Soft or hard landing? Upcoming US data will have a say
Coming up on Thursday, US Retail Sales in July are expected to rebound to 0.3% after the previous month’s 0.0% flat hold. A fresh print of the University of Michigan’s Consumer Sentiment Index for August is also on the cards for later in the week, forecast to improve to 66.9 from 66.4.
Headline US CPI inflation printed at 2.9% YoY in July, slightly below the forecast hold at 3.0%, with core CPI inflation ticking down to 3.2% on an annualized basis from the previous 3.0% as markets had expected. Monthly CPI figures, both headline and core, rose 0.2% MoM in July, but even this figure was a round-up print from the data rates of 0.15% and 0.17% for headline and core CPI, respectively.
Despite easing consumer-level inflation figures, investors had been hoping for prints further below forecasts after this week’s US Producer Price Index (PPI) inflation showed steeper-than-expected drops in producer-level price pressures. However, easing price pressures don’t appear to be passing onto consumers on a one-to-one basis. According to the CME’s FedWatch Tool, rate markets are now pricing in only 40% odds of a double-cut from the Federal Reserve (Fed) on September 18, down from 50% earlier this week and 70% the week previous.
EUR/USD price forecast
EUR/USD chalked in a third straight gainer on Wednesday, mounting back over the 1.1000 handle and extending a near-term bullish tilt into a fresh seven-month peak near 1.1050. Bullish EUR/USD moves are threatening to run out of gas as the pair overextended too quickly from a technical rejection off of the 200-day Exponential Moving Average (EMA) at 1.0829.
EUR/USD daily chart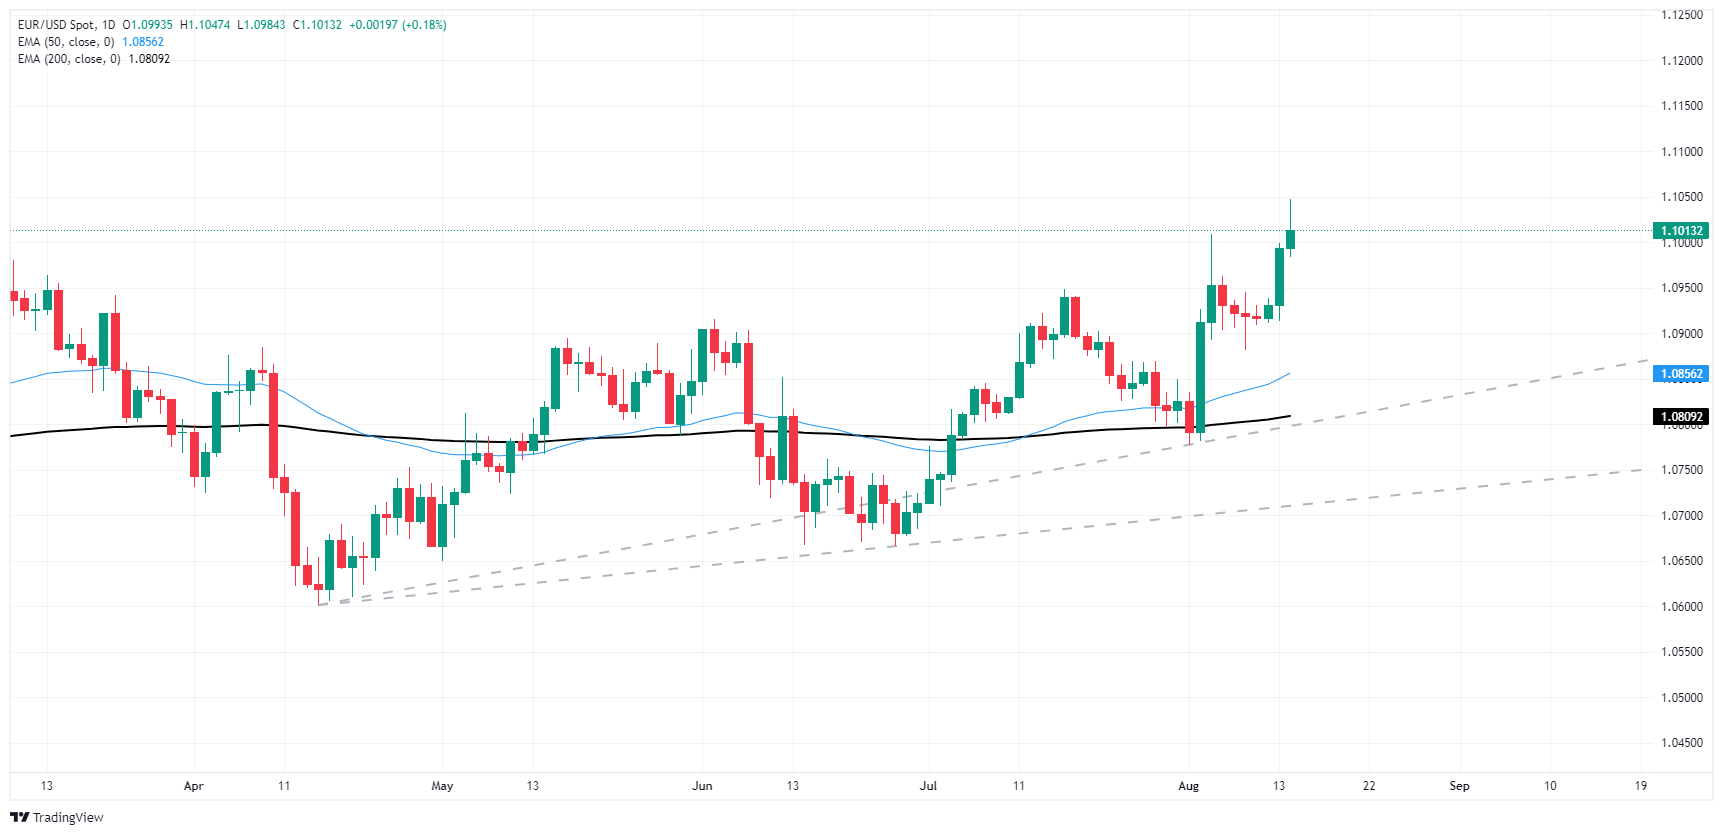
Euro FAQs
The Euro is the currency for the 20 European Union countries that belong to the Eurozone. It is the second most heavily traded currency in the world behind the US Dollar. In 2022, it accounted for 31% of all foreign exchange transactions, with an average daily turnover of over $2.2 trillion a day. EUR/USD is the most heavily traded currency pair in the world, accounting for an estimated 30% off all transactions, followed by EUR/JPY (4%), EUR/GBP (3%) and EUR/AUD (2%).
The European Central Bank (ECB) in Frankfurt, Germany, is the reserve bank for the Eurozone. The ECB sets interest rates and manages monetary policy. The ECB’s primary mandate is to maintain price stability, which means either controlling inflation or stimulating growth. Its primary tool is the raising or lowering of interest rates. Relatively high interest rates – or the expectation of higher rates – will usually benefit the Euro and vice versa. The ECB Governing Council makes monetary policy decisions at meetings held eight times a year. Decisions are made by heads of the Eurozone national banks and six permanent members, including the President of the ECB, Christine Lagarde.
Eurozone inflation data, measured by the Harmonized Index of Consumer Prices (HICP), is an important econometric for the Euro. If inflation rises more than expected, especially if above the ECB’s 2% target, it obliges the ECB to raise interest rates to bring it back under control. Relatively high interest rates compared to its counterparts will usually benefit the Euro, as it makes the region more attractive as a place for global investors to park their money.
Data releases gauge the health of the economy and can impact on the Euro. Indicators such as GDP, Manufacturing and Services PMIs, employment, and consumer sentiment surveys can all influence the direction of the single currency. A strong economy is good for the Euro. Not only does it attract more foreign investment but it may encourage the ECB to put up interest rates, which will directly strengthen the Euro. Otherwise, if economic data is weak, the Euro is likely to fall. Economic data for the four largest economies in the euro area (Germany, France, Italy and Spain) are especially significant, as they account for 75% of the Eurozone’s economy.
Another significant data release for the Euro is the Trade Balance. This indicator measures the difference between what a country earns from its exports and what it spends on imports over a given period. If a country produces highly sought after exports then its currency will gain in value purely from the extra demand created from foreign buyers seeking to purchase these goods. Therefore, a positive net Trade Balance strengthens a currency and vice versa for a negative balance.
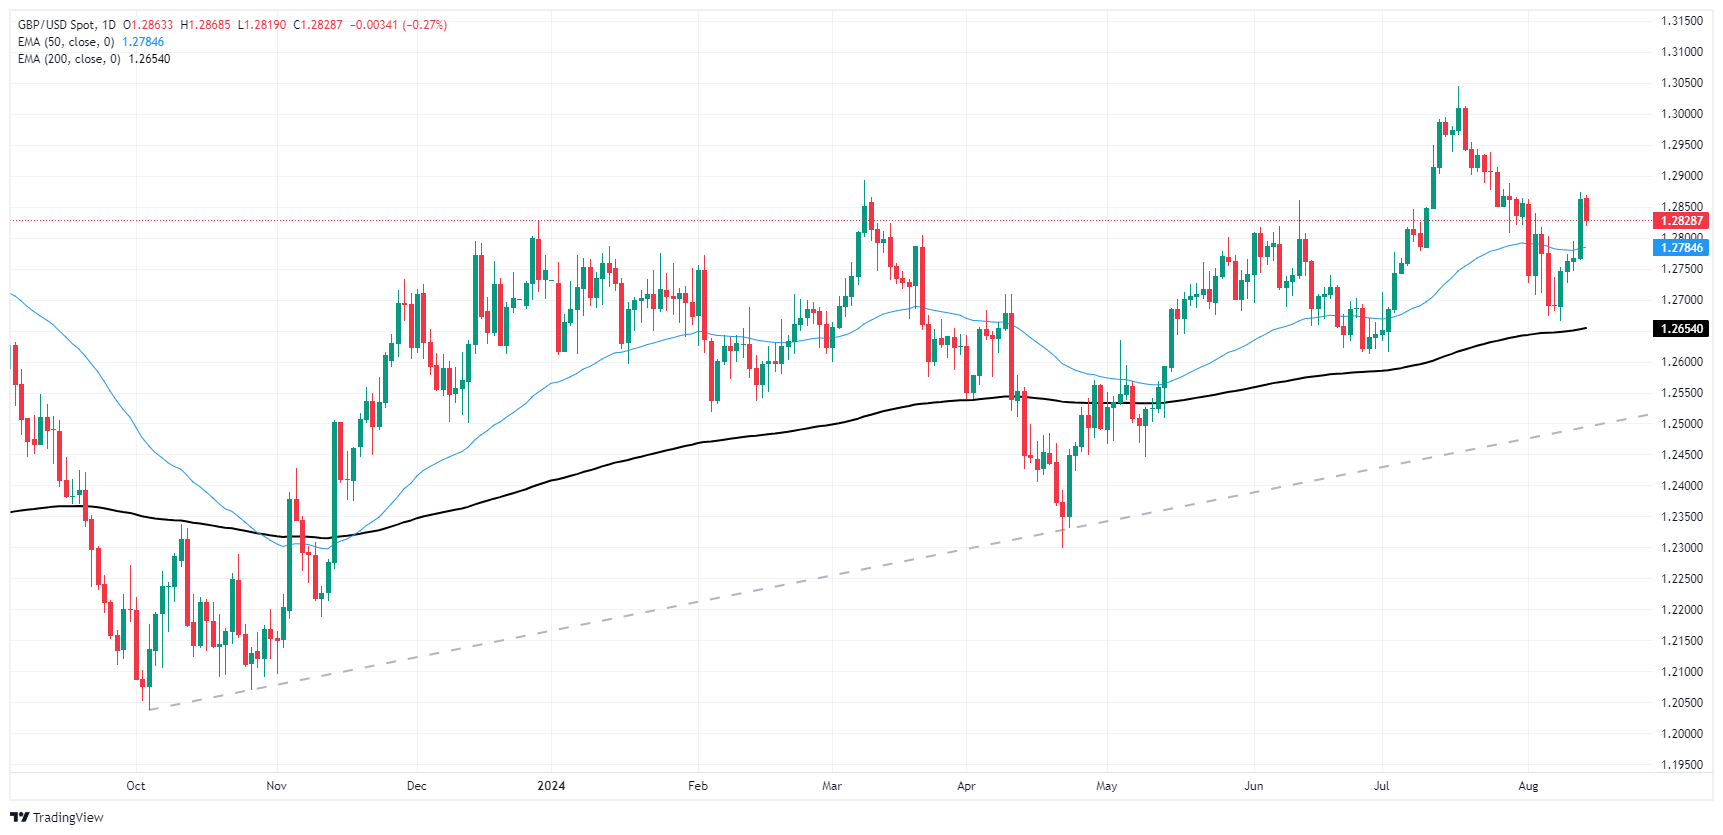
- GBP/USD snapped a four-day gain streak after pulling back on Wednesday.
- The pair fail back below 1.2850 after CPI inflation eased lower on both continents.
- UK GDP growth, US Retail Sales slated for Thursday.
GBP/USD pulled back and declined below 1.28500 on Wednesday after Consumer Price Index (CPI) inflation eased lower on both sides of the Atlantic. Cable has snapped a four-day win streak, and heads into the back half of the trading week on the backfoot with UK Gross Domestic Product (GDP) growth figures and US Retail Sales on the docket.
Forex Today: Soft or hard landing? Upcoming US data will have a say
UK QoQ GDP growth is expected to tick down to 0.6% from the previous 0.7%, while annualized UK GDP is expected to rebound to 0.9% from the previous 0.3%. On the US side, MoM Retail Sales are expected to rebound to 0.3% after a flat 0.0% in June.
The US CPI inflation rate came in at 2.9% YoY in July, slightly below the anticipated 3.0%. Core CPI inflation also decreased to 3.2% annually, from the previous 3.0%. Both headline and core monthly CPI figures rose by 0.2% MoM in July, exceeding the rates of 0.15% and 0.17% for headline and core CPI, respectively.
Despite the drop in consumer-level inflation, investors had expected even lower figures following this week's US Producer Price Index (PPI) inflation, which revealed more significant drops in producer-level price pressures. However, it appears that the decline in price pressures is not being directly transferred to consumers. According to the CME's FedWatch Tool, rate markets are now pricing in only a 40% chance of a double-cut from the Federal Reserve (Fed) on September 18, down from 50% earlier this week and 70% the previous week.
UK CPI rose YoY in July, but failed to meet median market forecasts, printing at 2.2% versus the expected 2.3%. The figure is still higher than the previous 2.0%, while core CPI inflation figures eased to 3.3% from the previous 3.5%.
GBP/USD price forecast
GBP/USD has ended a four-day recovery rally after a technical bounce from the 200-day Exponential Moving Average (EMA) last week near 1.2675. Bulls remain in control of the technical charts, but Cable has yet to pierce and recover the 1.2900 handle that was lost in mid-July.
The long-term trend favors bidders as weakness in the Greenback sends the Pound Sterling higher, and a long-run technical pattern of higher lows is keeping bullish momentum on the high side.
GBP/USD daily chart
Pound Sterling FAQs
The Pound Sterling (GBP) is the oldest currency in the world (886 AD) and the official currency of the United Kingdom. It is the fourth most traded unit for foreign exchange (FX) in the world, accounting for 12% of all transactions, averaging $630 billion a day, according to 2022 data. Its key trading pairs are GBP/USD, aka ‘Cable’, which accounts for 11% of FX, GBP/JPY, or the ‘Dragon’ as it is known by traders (3%), and EUR/GBP (2%). The Pound Sterling is issued by the Bank of England (BoE).
The single most important factor influencing the value of the Pound Sterling is monetary policy decided by the Bank of England. The BoE bases its decisions on whether it has achieved its primary goal of “price stability” – a steady inflation rate of around 2%. Its primary tool for achieving this is the adjustment of interest rates. When inflation is too high, the BoE will try to rein it in by raising interest rates, making it more expensive for people and businesses to access credit. This is generally positive for GBP, as higher interest rates make the UK a more attractive place for global investors to park their money. When inflation falls too low it is a sign economic growth is slowing. In this scenario, the BoE will consider lowering interest rates to cheapen credit so businesses will borrow more to invest in growth-generating projects.
Data releases gauge the health of the economy and can impact the value of the Pound Sterling. Indicators such as GDP, Manufacturing and Services PMIs, and employment can all influence the direction of the GBP. A strong economy is good for Sterling. Not only does it attract more foreign investment but it may encourage the BoE to put up interest rates, which will directly strengthen GBP. Otherwise, if economic data is weak, the Pound Sterling is likely to fall.
Another significant data release for the Pound Sterling is the Trade Balance. This indicator measures the difference between what a country earns from its exports and what it spends on imports over a given period. If a country produces highly sought-after exports, its currency will benefit purely from the extra demand created from foreign buyers seeking to purchase these goods. Therefore, a positive net Trade Balance strengthens a currency and vice versa for a negative balance.
Reserve Bank of New Zealand (RBNZ) Governor Adrian Orr addressed a New Zealand Parliament committee early Thursday, stating that the New Zealand central bank is maintaining a suitably-restrictive policy stance and the RBNZ is likely looking at gauging when to enact further cuts.
Key highlights
CPI returning sustainably to target band of 1-3%
Current economic conditions are poor
New Zealand needs to enhance its potential growth rate
Fiscal policy should enhance potential growth
Staying on hold for a longer duration was unnecessary.
Policymakers aim to reduce output fluctuations
Policy discussions in the future will focus on whether to maintain or reduce rates.
Believes sufficient measures taken to control inflation
CPI requires more frequent re-weighting
Using High-Frequency Data to Improve CPI and GDP Estimations
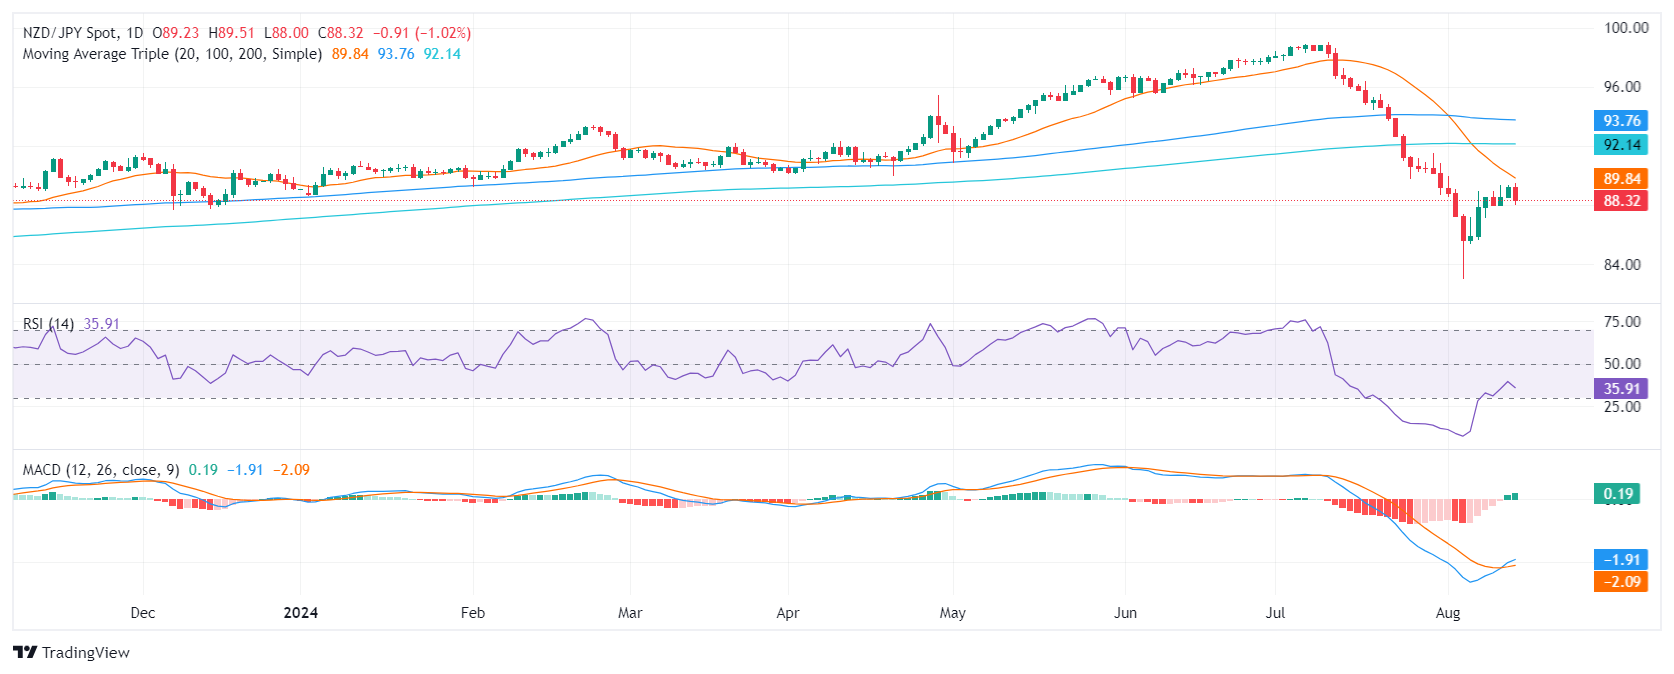
- NZD/JPY declined by 0.90% on Wednesday and resumes de losses.
- The RSI remains near 30 suggesting intense selling pressure.
- The MACD prints flat green bars, indicating that the bearish momentum is neutral.
The NZD/JPY pair extended its losses on Wednesday, declining to 88.35. The pair has been in a downtrend since the beginning of the month, and technical indicators continue to suggest that the bears are in control. A short period of recovery was seen in the last sessions but the overall outlook remains bearish.
The Relative Strength Index (RSI) is near 30, indicating that the pair is nearing oversold territory. Additionally, the Moving Average Convergence Divergence (MACD) prints flat green bars, indicating that the momentum is neutral.
The NZD/JPY pair has broken below the support level of 88.50 and is currently trading around 88.35. If the pair continues to decline, it could find support at 88.00 and 87.50. On the upside, resistance can be found at 89.00 and 89.50. A sustained break above 89.50 could signal a reversal of the downtrend. The volume has been declining during the last sessions, which is another sign of weakness.
NZD/JPY daily chart
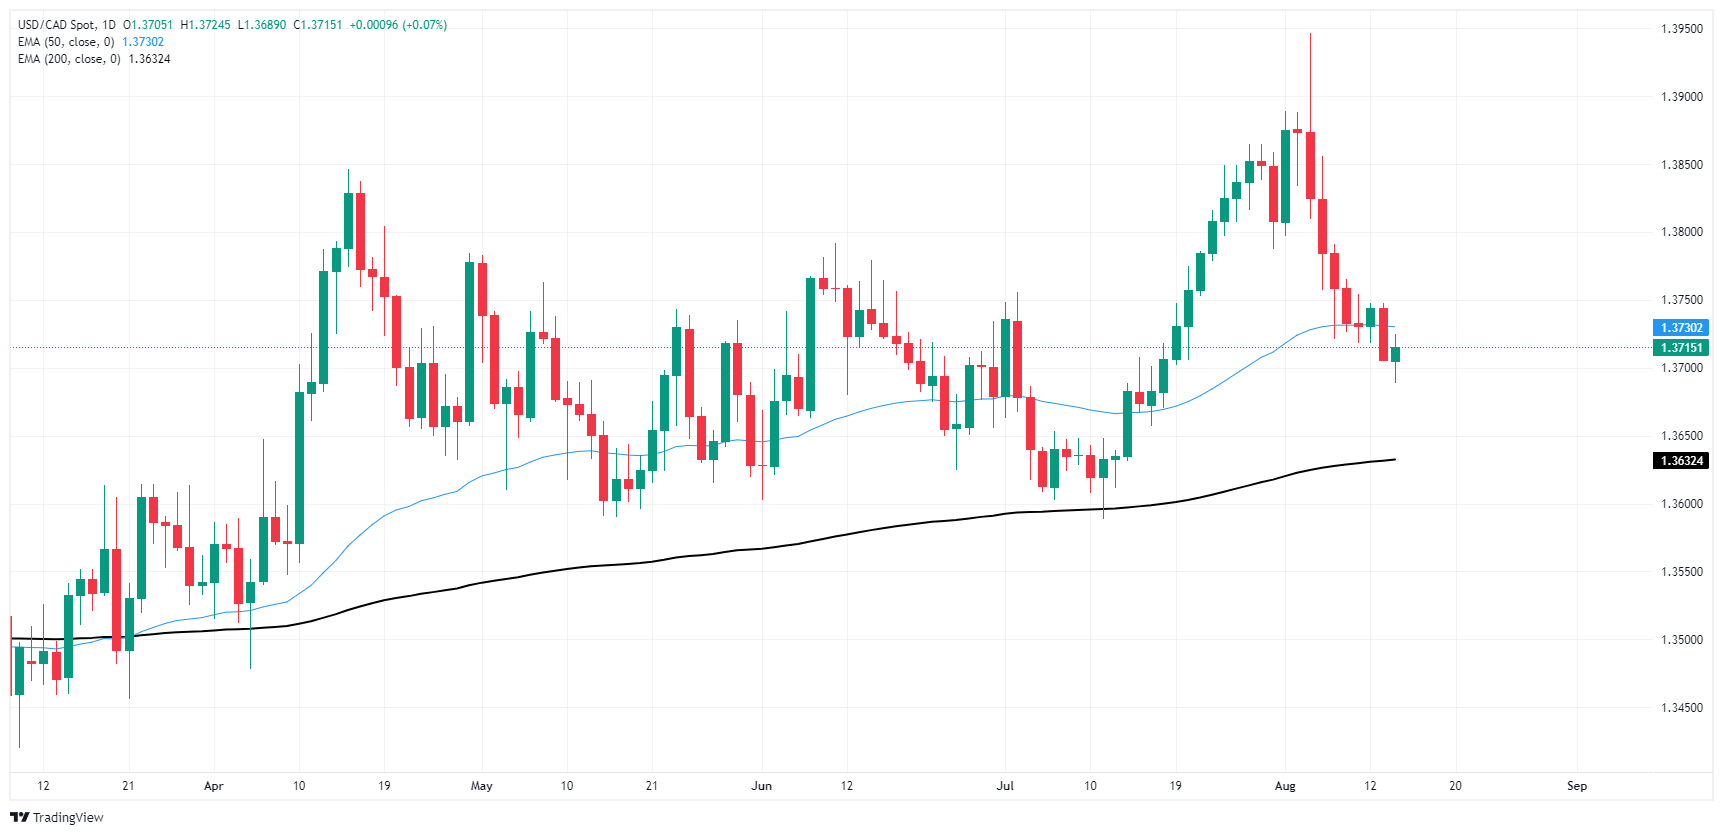
- The Canadian Dollar recovered some ground on Wednesday.
- Canada remains absent from the economic calendar, strictly low-tier data on offer.
- The CAD shed some weight against the Greenback post-US CPI.
The Canadian Dollar (CAD) pared back some recent losses across the currency board on Wednesday, but a lopsided performance for the CAD still sees some red spots after the Greenback caught a bounce on a US Consumer Price Index (CPI) inflation print that met model forecasts but not investor expectations.
Canada continues its trend of delivering only low-tier economic data releases this week, leaving the CAD at the mercy of overall market flows. A recent recovery streak for the Canadian Dollar looks set to end, with CAD traders left to wait until next week’s Bank of Canada (BoC) CPI inflation print.
Daily digest market movers: US CPI dominates headlines as price pressures cool
- Canadian Dollar traded down against the Greenback, but stuck within one-tenth of one percent.
- US CPI inflation figures cooled in-line with median market forecasts.
- However, investors had set themselves up for further declines after this week’s tumble in US PPI inflation figures.
- US CPI inflation broadly printed as markets expected, with core CPI inflation ticking down to 3.2% YoY from the previous 3.3%.
- Both headline and core CPI ticked up to 0.2% MoM, also as-expected.
- Annualized CPI also shifted lower to 2.9% in July, below the forecasted hold at 3.0%.
Canadian Dollar price forecast: CAD win streak poised to falter near 1.3700
The Canadian Dollar (CAD) found thin gains around the major currency board on Wednesday, but remains hobbled by the US Dollar. CAD losses against the Greenback remain constrained, trading within 0.1% during the midweek market session.
USD/CAD has pumped the brakes on a Canadian Dollar recovery, at least in the near term. The pair is trading south of the 50-day Exponential Moving Average (EMA), but Greenback sellers were unable to extend the CAD’s recovery and drive USD/CAD bids all the way down to the 200-day EMA at 1.3632.
USD/CAD daily chart
Canadian Dollar FAQs
The key factors driving the Canadian Dollar (CAD) are the level of interest rates set by the Bank of Canada (BoC), the price of Oil, Canada’s largest export, the health of its economy, inflation and the Trade Balance, which is the difference between the value of Canada’s exports versus its imports. Other factors include market sentiment – whether investors are taking on more risky assets (risk-on) or seeking safe-havens (risk-off) – with risk-on being CAD-positive. As its largest trading partner, the health of the US economy is also a key factor influencing the Canadian Dollar.
The Bank of Canada (BoC) has a significant influence on the Canadian Dollar by setting the level of interest rates that banks can lend to one another. This influences the level of interest rates for everyone. The main goal of the BoC is to maintain inflation at 1-3% by adjusting interest rates up or down. Relatively higher interest rates tend to be positive for the CAD. The Bank of Canada can also use quantitative easing and tightening to influence credit conditions, with the former CAD-negative and the latter CAD-positive.
The price of Oil is a key factor impacting the value of the Canadian Dollar. Petroleum is Canada’s biggest export, so Oil price tends to have an immediate impact on the CAD value. Generally, if Oil price rises CAD also goes up, as aggregate demand for the currency increases. The opposite is the case if the price of Oil falls. Higher Oil prices also tend to result in a greater likelihood of a positive Trade Balance, which is also supportive of the CAD.
While inflation had always traditionally been thought of as a negative factor for a currency since it lowers the value of money, the opposite has actually been the case in modern times with the relaxation of cross-border capital controls. Higher inflation tends to lead central banks to put up interest rates which attracts more capital inflows from global investors seeking a lucrative place to keep their money. This increases demand for the local currency, which in Canada’s case is the Canadian Dollar.
Macroeconomic data releases gauge the health of the economy and can have an impact on the Canadian Dollar. Indicators such as GDP, Manufacturing and Services PMIs, employment, and consumer sentiment surveys can all influence the direction of the CAD. A strong economy is good for the Canadian Dollar. Not only does it attract more foreign investment but it may encourage the Bank of Canada to put up interest rates, leading to a stronger currency. If economic data is weak, however, the CAD is likely to fall.
- NZD/USD declines over 1%, and bullish momentum fades after RBNZ’s dovish outlook.
- RBNZ’s Orr was on the wires after the decision but didn't provide new insights.
- The fact that the bank considered a 50 bps cut earlier in the session made the NZD lose interest.
In Wednesday's session, the NZD/USD pair declined by 1.30% just below 0.6000 after the Reserve Bank of New Zealand’s decision during the Asian session. Governor Orr was on the wires entering Thursday’s Asian session but didn’t provide any new insights.
In Wednesday’s Asian session, the Reserve Bank of New Zealand (RBNZ) surprised the markets by not only cutting interest rates by 25 basis points but also revealing that a 50 basis point cut was seriously considered. The RBNZ explained that the economy had slowed more than anticipated and that their inflation assessment was largely based on expectations, which had already fallen back to the 1-3% target range.
NZD/USD technical analysis
The Relative Strength Index (RSI) is currently around 50, indicating that the market is in a neutral zone. The Moving Average Convergence Divergence (MACD) is showing decreasing green bars, signaling decreasing bullish momentum. This suggests that the selling pressure is increasing and a potential reversal could be on the horizon.
NZD/USD daily chart
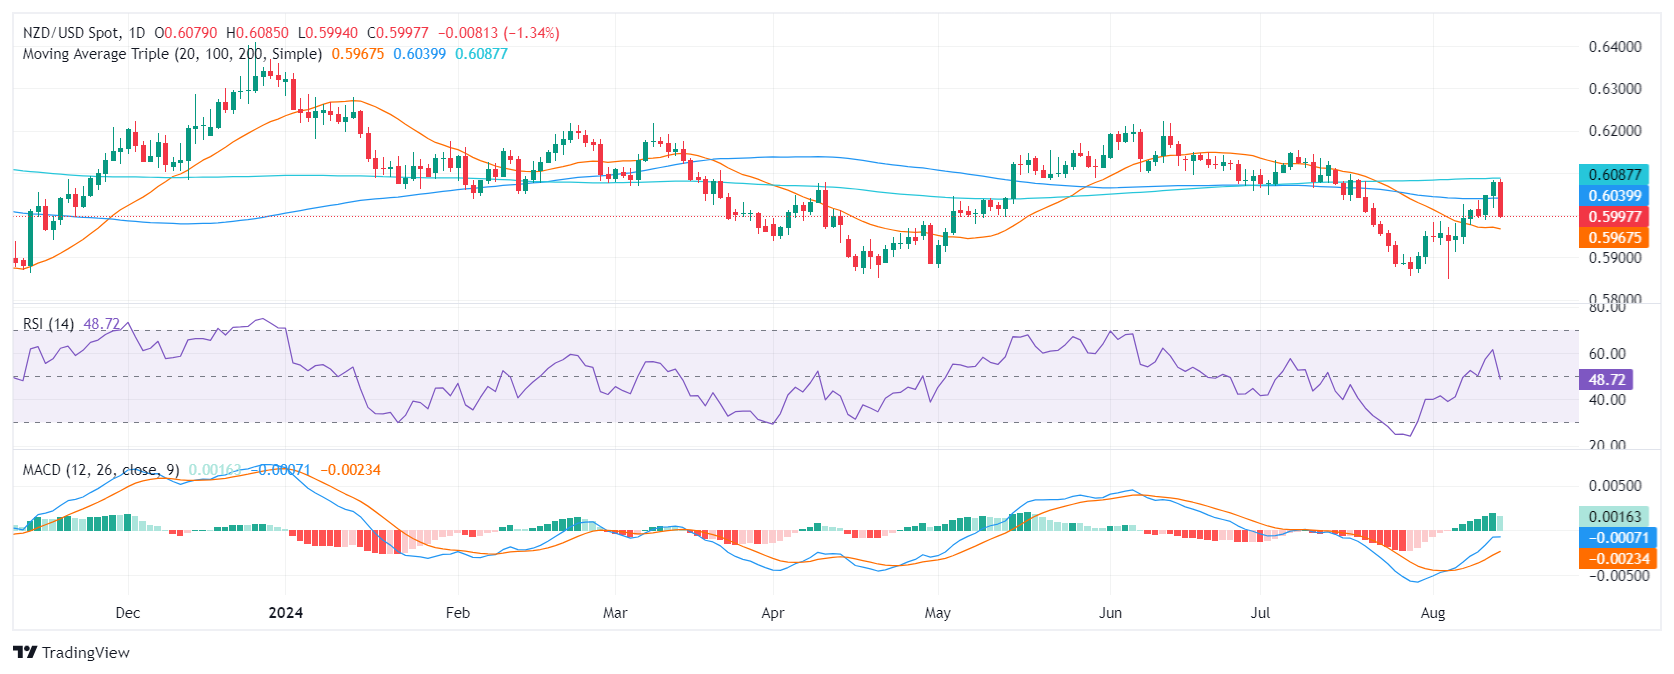
On the daily chart, the NZD/USD pair is facing immediate support at 0.6000. A break below this level could open the door for a deeper correction towards 0.5970 and 0.5930. On the upside, resistance lies at 0.6040 and 0.6090 at the 100 and 200-day SMAs.
In the near term, the NZD/USD pair is expected to remain under bearish pressure. The technical indicators suggest that the bears are gaining the upper hand and could push the pair lower in the coming sessions. Any fundamental reasons that may fuel dovish bets on the RBNZ could trigger another downwards leg.
- AUD/USD shows a decrease, dropping to 0.6615.
- RBA maintains its hawkish position, potentially balancing the downside.
- RBNZ’s dovish posture dragged down the Aussie as well as the Kiwi on Wednesday.
The AUD/USD pair experienced a decrease of 0.30% during Wednesday's session, settling near 0.6615, after the dovish Reserve Bank of New Zealand (RBNZ) decision. In addition, potential decline in demand for Australian exports due to the slowdown in the Chinese may negatively impact the AUD. However, the hawkish stance of the Reserve Bank of Australia (RBA), paired with mixed Australian economic data, can potentially temper the downside.
Despite the mixed Australian economic outlook and high inflation, the RBA's consistent hawkish position only strengthens predictions for 25 bps of easing for 2024.
Daily digest market movers: Aussie under some pressure amid RBNZ decision, China's concerns
- The pair's descent on Wednesday came despite further US Dollar losses, as a result of falling copper and iron ore futures. Worsening credit data from China, coupled with the country's weakened demand and substantial commodity supply, has negatively impacted markets.
- In addition, the RBNZ unexpectedly cut interest rates by 25 basis points this morning and also revealed that a 50-basis-point cut had been seriously considered, which dragged down both the Kiwi and the Aussie.
- However, investor confidence in the Australian Dollar was recently bolstered by the RBA's decision to maintain the official cash rate (OCR) at 4.35%. Its cautious view, along with predictions of sustained domestic inflation, suggests that both trimmed-mean and headline CPI inflation are now expected to meet the mid-point of the 2-3% range by late 2026, later than the earlier prediction of June 2026.
- In that sense, among the G10 central banks, RBA is anticipated to be the last to initiate interest rate cuts. In contrast, the Federal Reserve (Fed) is expected to facilitate easing in the near future, and this contrast may support AUD/USD in the coming months.
AUD/USD technical outlook: AUD/USD buyers breathe, outlook still promising
The AUD/USD pair currently displays a moderate bullish sentiment, with the Relative Strength Index (RSI) remaining fairly neutral around the 50 region, while the Moving Average Convergence Divergence (MACD) shows green bars.
Key support lies at 0.6600 and 0.6580, while resistance is observed around the 0.6640 area. Testing of these key levels is crucial for determining the pair's future direction.
Australian Dollar FAQs
One of the most significant factors for the Australian Dollar (AUD) is the level of interest rates set by the Reserve Bank of Australia (RBA). Because Australia is a resource-rich country another key driver is the price of its biggest export, Iron Ore. The health of the Chinese economy, its largest trading partner, is a factor, as well as inflation in Australia, its growth rate and Trade Balance. Market sentiment – whether investors are taking on more risky assets (risk-on) or seeking safe-havens (risk-off) – is also a factor, with risk-on positive for AUD.
The Reserve Bank of Australia (RBA) influences the Australian Dollar (AUD) by setting the level of interest rates that Australian banks can lend to each other. This influences the level of interest rates in the economy as a whole. The main goal of the RBA is to maintain a stable inflation rate of 2-3% by adjusting interest rates up or down. Relatively high interest rates compared to other major central banks support the AUD, and the opposite for relatively low. The RBA can also use quantitative easing and tightening to influence credit conditions, with the former AUD-negative and the latter AUD-positive.
China is Australia’s largest trading partner so the health of the Chinese economy is a major influence on the value of the Australian Dollar (AUD). When the Chinese economy is doing well it purchases more raw materials, goods and services from Australia, lifting demand for the AUD, and pushing up its value. The opposite is the case when the Chinese economy is not growing as fast as expected. Positive or negative surprises in Chinese growth data, therefore, often have a direct impact on the Australian Dollar and its pairs.
Iron Ore is Australia’s largest export, accounting for $118 billion a year according to data from 2021, with China as its primary destination. The price of Iron Ore, therefore, can be a driver of the Australian Dollar. Generally, if the price of Iron Ore rises, AUD also goes up, as aggregate demand for the currency increases. The opposite is the case if the price of Iron Ore falls. Higher Iron Ore prices also tend to result in a greater likelihood of a positive Trade Balance for Australia, which is also positive of the AUD.
The Trade Balance, which is the difference between what a country earns from its exports versus what it pays for its imports, is another factor that can influence the value of the Australian Dollar. If Australia produces highly sought after exports, then its currency will gain in value purely from the surplus demand created from foreign buyers seeking to purchase its exports versus what it spends to purchase imports. Therefore, a positive net Trade Balance strengthens the AUD, with the opposite effect if the Trade Balance is negative.
A persistent selling bias kept the Greenback’s price action subdued for yet another session, a view that was bolstered by further confirmation of the downward path of US inflation, as per July’s CPI data.
Here is what you need to know on Thursday, August 15:
The USD Index (DXY) dropped to multi-day lows near 102.30 on the back of persevering US disinflationary pressures. A busy US calendar on August 15 will feature Retail Sales, the Philly Fed Manufacturing Index, usual weekly Initial Jobless Claims, Industrial Production, the NAHB Housing Market Index and Net Long-term TIC Flows. In addition, the Fed’s Musalem and Harker are due to speak.
EUR/USD rose further and hit new 2024 tops around 1.1050 on the back of further weakness in the Greenback. There will be no data releases on the euro docket on August 15.
GBP/USD came under pressure as market participants started to pencil in around 50 bps of easing by the BoE following the UK CPI readings. The GDP Growth Rate, Balance of Trade results, Construction Output, Industrial Production, Manufacturing Production, and the NIESR Monthly GDP Tracker are all due on August 15.
USD/JPY alternated gains with losses near the 147.00 region amidst the broader consolidative range. The GDP Growth Rate takes centre stage on August 15, seconded by weekly Foreign Bond Investment, and final Industrial Production.
AUD/USD gave way some gains and set aside two consecutive daily advances aoon after hitting tops near 0.6650. The Consumer Inflation Expectations, and the publication of the jobs report are all due on August 15.
WTI prices broke below the $78.00 mark per barrel to clinch their second straight day of losses on the back of easing geopolitical jitters and demand concerns.
Prices of Gold receded to two-day lows near $2,440 per ounce troy as investors reassessed the Fed’s rate path. Silver prices retreated to four-day lows near $27.20 per ounce following the broad-based weakness in the commodity complex and Chinese concerns.
- USD marks a slight decline as lower US inflation further dulls its attractiveness.
- Softer but in-line CPI figures give markets reason to feed on dovish narrative.
- Markets still anticipate the first rate cut in September.
The US Dollar (USD), gauged by the US Dollar Index (DXY), showed a slight downtrend below the 103.00 threshold during Wednesday's trading session. This decrease follows the confirmation of cooler-than-expected inflation in the US, which somewhat overshadowed the stable outlook of the country's labor market.
While the market expectations regarding the upcoming decisions on monetary policy didn't change substantially, the projection of the US economic trend still points toward a growth rate above the trend. This pattern suggests that the market might again be overpricing the need for aggressive monetary easing in the future.
Daily digest market movers: Lower US inflation dampens US Dollar's appeal
- The decrease in US inflation, as gauged by the Consumer Price Index (CPI), was a main decider of the day's market dynamics.
- Headline CPI decelerated to 2.9% on a YoY basis in July from June's level of 3%, slightly below the market expectations.
- Core CPI (which excludes the fluctuating food and energy prices) stood at 3.2% YoY, an increase from 3.3% seen in July, aligning with the market predictions.
- The possibility of a cut by the Federal Reserve (Fed) in September stands at around 80%.
- These future easing probabilities will be highly dependent on other economic indicators.
DXY technical outlook: Bearish outlook steady, indicators deep in negative terrain
The technical indicators of DXY point to a persisting bearish market situation with buyers failing to generate a significant uptick. The index continues to anchor below the 20,100 and 200-day Simple Moving Averages (SMA), reinforcing the dominant bearish sentiment.
The Relative Strength Index (RSI), remains near 30, indicating steady selling pressure. On the other hand, the Moving Average Convergence Divergence (MACD) stabilizes, all the while remaining in negative territory with low, red bars.
Support Levels: 102.40, 102.20, 102.00
Resistance Levels: 103.00, 103.50, 104.00
US Dollar FAQs
The US Dollar (USD) is the official currency of the United States of America, and the ‘de facto’ currency of a significant number of other countries where it is found in circulation alongside local notes. It is the most heavily traded currency in the world, accounting for over 88% of all global foreign exchange turnover, or an average of $6.6 trillion in transactions per day, according to data from 2022. Following the second world war, the USD took over from the British Pound as the world’s reserve currency. For most of its history, the US Dollar was backed by Gold, until the Bretton Woods Agreement in 1971 when the Gold Standard went away.
The most important single factor impacting on the value of the US Dollar is monetary policy, which is shaped by the Federal Reserve (Fed). The Fed has two mandates: to achieve price stability (control inflation) and foster full employment. Its primary tool to achieve these two goals is by adjusting interest rates. When prices are rising too quickly and inflation is above the Fed’s 2% target, the Fed will raise rates, which helps the USD value. When inflation falls below 2% or the Unemployment Rate is too high, the Fed may lower interest rates, which weighs on the Greenback.
In extreme situations, the Federal Reserve can also print more Dollars and enact quantitative easing (QE). QE is the process by which the Fed substantially increases the flow of credit in a stuck financial system. It is a non-standard policy measure used when credit has dried up because banks will not lend to each other (out of the fear of counterparty default). It is a last resort when simply lowering interest rates is unlikely to achieve the necessary result. It was the Fed’s weapon of choice to combat the credit crunch that occurred during the Great Financial Crisis in 2008. It involves the Fed printing more Dollars and using them to buy US government bonds predominantly from financial institutions. QE usually leads to a weaker US Dollar.
Quantitative tightening (QT) is the reverse process whereby the Federal Reserve stops buying bonds from financial institutions and does not reinvest the principal from the bonds it holds maturing in new purchases. It is usually positive for the US Dollar.
- The Dow Jones climbed 260 points on Wednesday post-CPI inflation print.
- US consumer-level inflation eased as expected in July.
- Market bets of a September rate cut remain high, but markets were hoping for more.
The Dow Jones Industrial Average (DJIA) gained 260 points on Wednesday after US Consumer Price Index (CPI) inflation ticked lower on an annualized basis, as markets had broadly hoped. However, some investors had higher expectations for this round of US CPI inflation after US producer-level inflation dropped faster than expected earlier this week.
Headline US CPI inflation printed at 2.9% YoY in July, slightly below the forecast hold at 3.0%, with core CPI inflation ticking down to 3.2% on an annualized basis from the previous 3.0% as markets had expected. Monthly CPI figures, both headline and core, rose 0.2% MoM in July, but even this figure was a round-up print from the data rates of 0.15% and 0.17% for headline and core CPI, respectively.
Despite easing consumer-level inflation figures, investors had been hoping for prints further below forecasts after this week’s US Producer Price Index (PPI) inflation showed steeper-than-expected drops in producer-level price pressures. However, easing price pressures don’t appear to be passing onto consumers on a one-to-one basis. According to the CME’s FedWatch Tool, rate markets are now pricing in only 40% odds of a double-cut from the Federal Reserve (Fed) on September 18, down from 50% earlier this week and 70% the week previous.
Dow Jones news
Most of the Dow Jones index is in the green on Wednesday with four-fifths of the equity board climbing post-US CPI. Losses were contained in a core group of recent straggles, with Intel Inc. (INTC) leading the charge lower, falling -2% on the day to $20.00 per share. Home Depot Inc. (HD) claimed the top of the Dow Jones on Wednesday, rising 2.5% and testing $360.00 per share.
Dow Jones price forecast
A second straight day of gains has the Dow Jones index retesting the 40,000.00 major price handle, but bidders will need to put in more work to shove intraday price action north of the key technical level after running out of gas and falling back from 40,040.00.
Wednesday’s gains put the Dow Jones back on the north side of the 50-day Exponential Moving Average (EMA) at 39,593.00. The index is also up 4.3% from a recent bottom near 38,383.00, and buyers have their eyes set on reclaiming all-time highs above 41,200.00 set in July.
Dow Jones five minute chart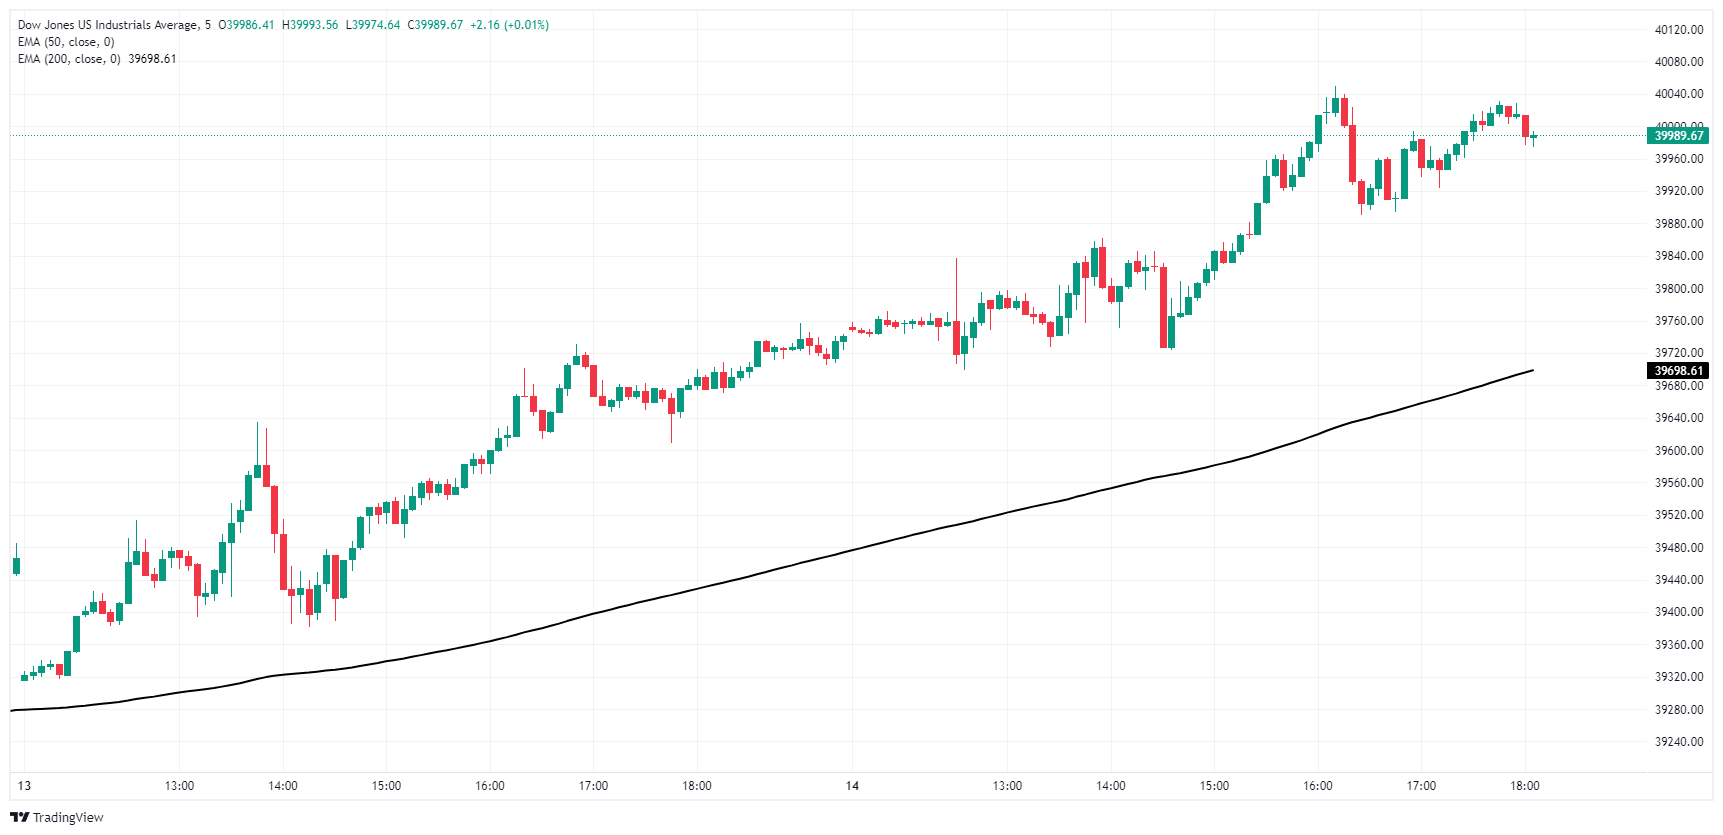
Dow Jones daily chart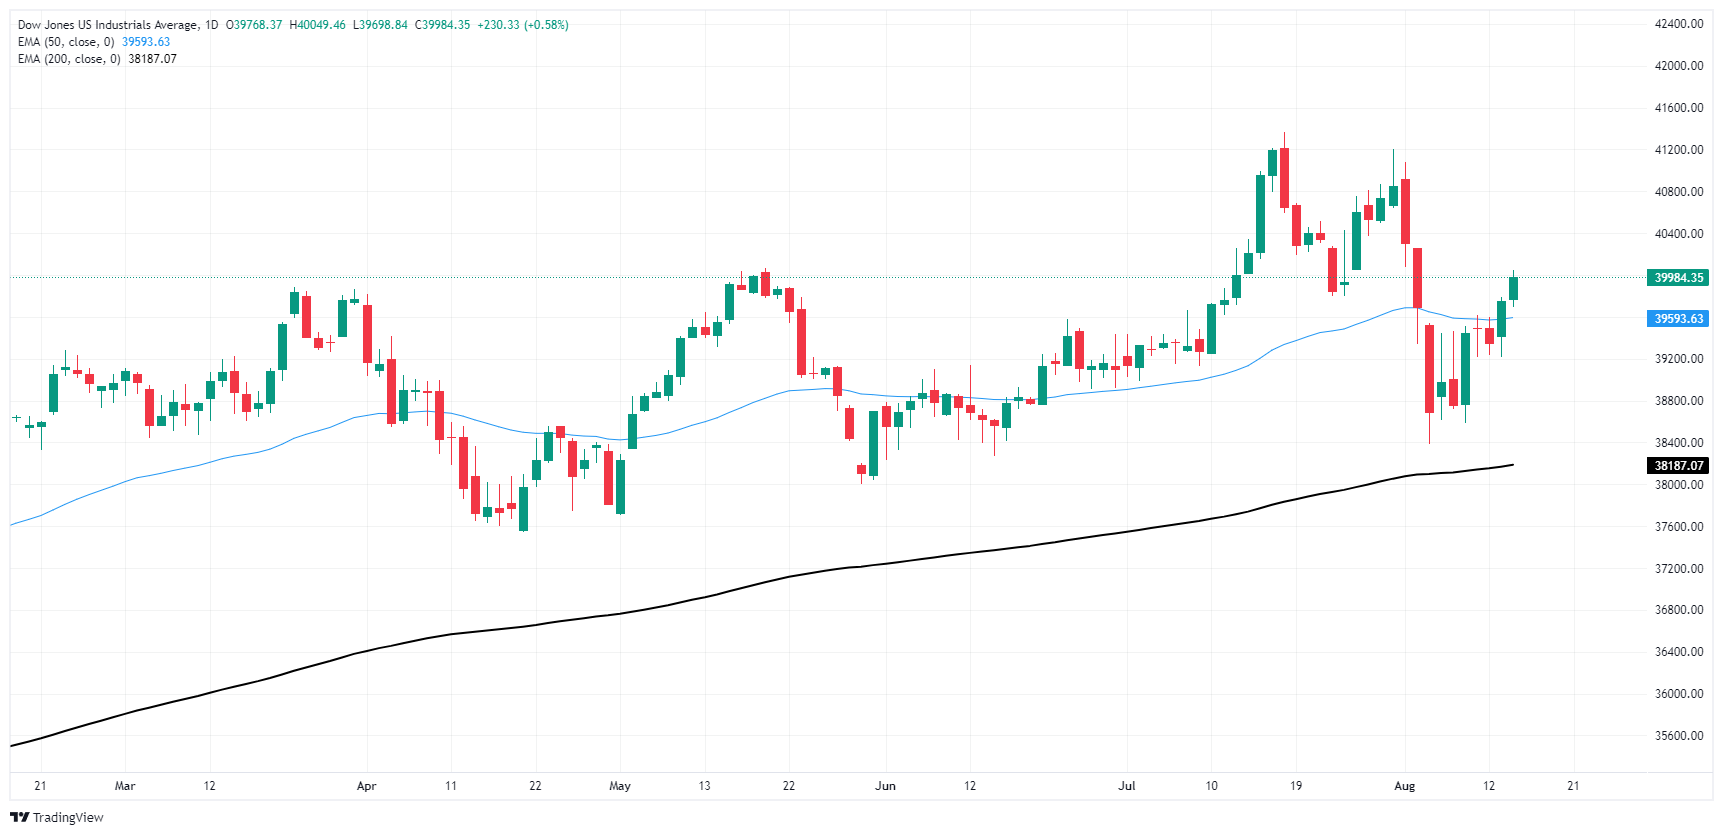
Dow Jones FAQs
The Dow Jones Industrial Average, one of the oldest stock market indices in the world, is compiled of the 30 most traded stocks in the US. The index is price-weighted rather than weighted by capitalization. It is calculated by summing the prices of the constituent stocks and dividing them by a factor, currently 0.152. The index was founded by Charles Dow, who also founded the Wall Street Journal. In later years it has been criticized for not being broadly representative enough because it only tracks 30 conglomerates, unlike broader indices such as the S&P 500.
Many different factors drive the Dow Jones Industrial Average (DJIA). The aggregate performance of the component companies revealed in quarterly company earnings reports is the main one. US and global macroeconomic data also contributes as it impacts on investor sentiment. The level of interest rates, set by the Federal Reserve (Fed), also influences the DJIA as it affects the cost of credit, on which many corporations are heavily reliant. Therefore, inflation can be a major driver as well as other metrics which impact the Fed decisions.
Dow Theory is a method for identifying the primary trend of the stock market developed by Charles Dow. A key step is to compare the direction of the Dow Jones Industrial Average (DJIA) and the Dow Jones Transportation Average (DJTA) and only follow trends where both are moving in the same direction. Volume is a confirmatory criteria. The theory uses elements of peak and trough analysis. Dow’s theory posits three trend phases: accumulation, when smart money starts buying or selling; public participation, when the wider public joins in; and distribution, when the smart money exits.
There are a number of ways to trade the DJIA. One is to use ETFs which allow investors to trade the DJIA as a single security, rather than having to buy shares in all 30 constituent companies. A leading example is the SPDR Dow Jones Industrial Average ETF (DIA). DJIA futures contracts enable traders to speculate on the future value of the index and Options provide the right, but not the obligation, to buy or sell the index at a predetermined price in the future. Mutual funds enable investors to buy a share of a diversified portfolio of DJIA stocks thus providing exposure to the overall index.
- The Mexican Peso chalked in a second day of gains against the Greenback on Wednesday.
- Mexico’s recent rate cut despite an uptick in inflation has left Peso markets in a bind.
- US CPI figures cooled to expected levels, but investors were hoping for more post-PPI.
The Mexican Peso (MXN) found extra room on the high side on Wednesday, bolstered by a lopsided US Dollar (USD) after US Consumer Price Index (CPI) inflation figures cooled to the expected levels. However, markets were hoping for firmer signs of easing inflation pressure after this week’s US Producer Price Index (PPI) showed a steeper-than-expected decline in business-level price growth.
Mexico continues to grapple with inflation pressure of its own, but the Mexican Central Bank (Banxico) delivered a recent rate cut anyway. Banxico Governor Victoria Rodriguez Ceja cited an 18-straight month decline in core price inflation as an impetus for the quarter-point rate cut earlier this week, stating that an uptick in headline inflation to nearly 5.6% should get smoothed out “at the end of 2025”.
Daily digest market movers: Odd expectations deliver odd market flows post-US CPI
- US CPI inflation broadly printed as markets expected, with core CPI inflation ticking down to 3.2% YoY from the previous 3.3%.
- Both headline and core CPI ticked up to 0.2% MoM, also as-expected.
- Annualized CPI also shifted lower to 2.9% in July, below the forecasted hold at 3.0%.
- Despite continued easing in YoY CPI inflation figures, investors were broadly expecting a more significant decline after this week’s US PPI inflation print showed a steeper decline in upstream cost growth. However, declining cost pressures don’t appear to be getting passed onto consumers as fast as many had hoped.
Mexican Peso price forecast: Peso still struggling to find a recovery despite near-term reprieve
The Mexican Peso (MXN) clawed back roughly nine-tenths of one percent against the Greenback on Wednesday, dragging USD/MXN below 19.00 before running into a technical floor near 18.80. The Peso has recovered over 6% after hitting a 22-month low against the US Dollar that sent USD/MXN above the 20.00 handle earlier this month.
Despite a near-term recovery in Peso bids, USD/MXN still leans heavily in favor of Greenback buyers as the pair trades well north of the 200-day Exponential Moving Average (EMA) at 17.59. The pair is also still up nearly 16% from the year’s bottom bids of 16.26.
USD/MXN daily chart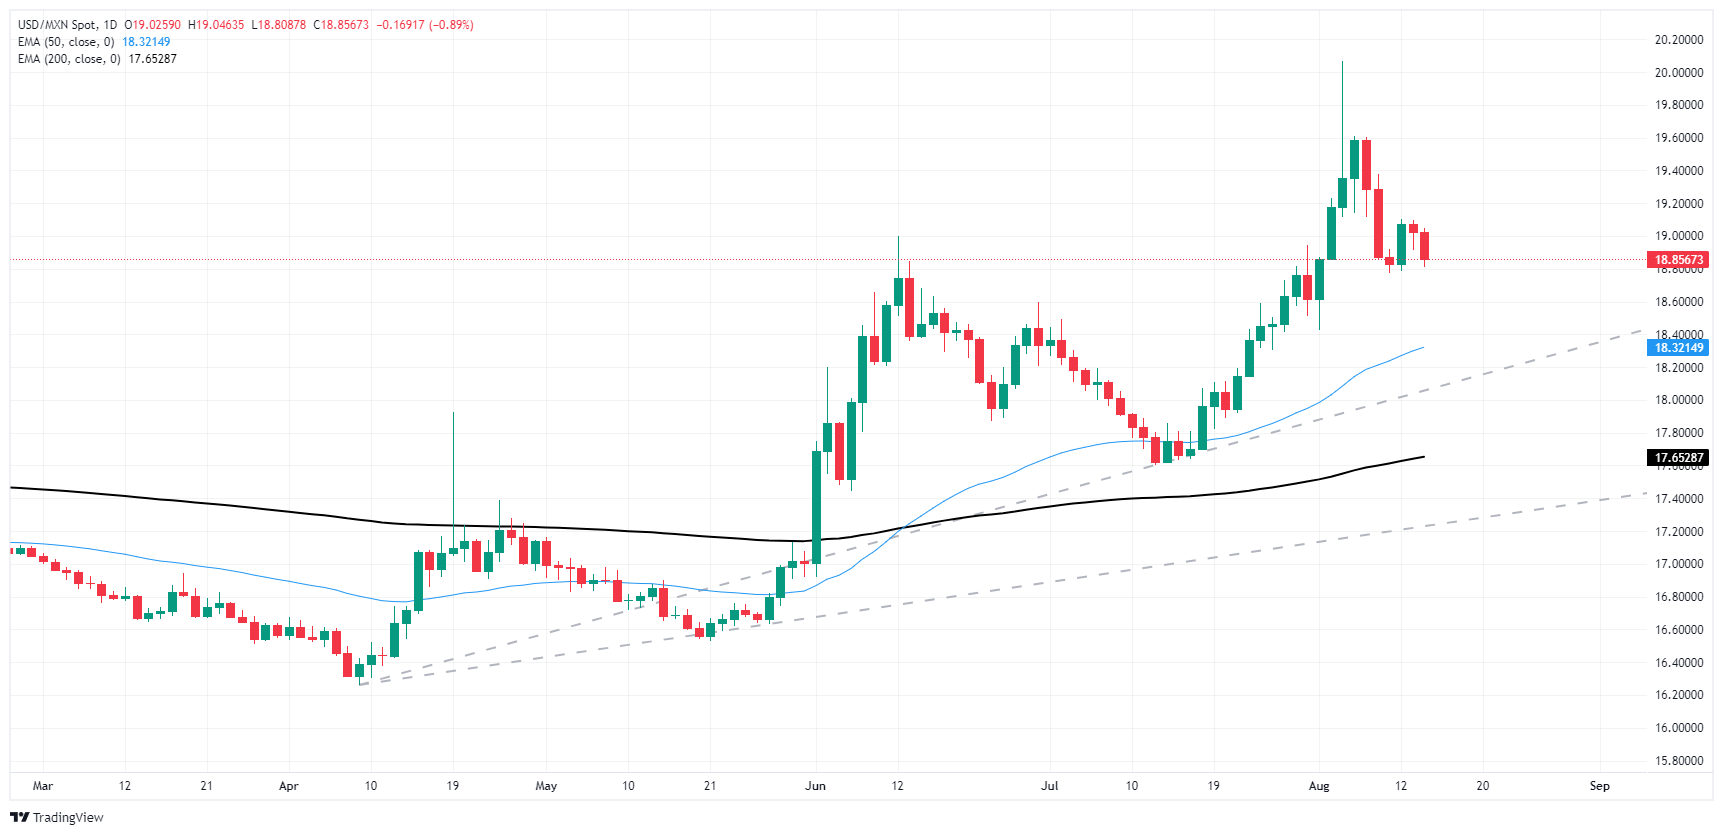
Mexican Peso FAQs
The Mexican Peso (MXN) is the most traded currency among its Latin American peers. Its value is broadly determined by the performance of the Mexican economy, the country’s central bank’s policy, the amount of foreign investment in the country and even the levels of remittances sent by Mexicans who live abroad, particularly in the United States. Geopolitical trends can also move MXN: for example, the process of nearshoring – or the decision by some firms to relocate manufacturing capacity and supply chains closer to their home countries – is also seen as a catalyst for the Mexican currency as the country is considered a key manufacturing hub in the American continent. Another catalyst for MXN is Oil prices as Mexico is a key exporter of the commodity.
The main objective of Mexico’s central bank, also known as Banxico, is to maintain inflation at low and stable levels (at or close to its target of 3%, the midpoint in a tolerance band of between 2% and 4%). To this end, the bank sets an appropriate level of interest rates. When inflation is too high, Banxico will attempt to tame it by raising interest rates, making it more expensive for households and businesses to borrow money, thus cooling demand and the overall economy. Higher interest rates are generally positive for the Mexican Peso (MXN) as they lead to higher yields, making the country a more attractive place for investors. On the contrary, lower interest rates tend to weaken MXN.
Macroeconomic data releases are key to assess the state of the economy and can have an impact on the Mexican Peso (MXN) valuation. A strong Mexican economy, based on high economic growth, low unemployment and high confidence is good for MXN. Not only does it attract more foreign investment but it may encourage the Bank of Mexico (Banxico) to increase interest rates, particularly if this strength comes together with elevated inflation. However, if economic data is weak, MXN is likely to depreciate.
As an emerging-market currency, the Mexican Peso (MXN) tends to strive during risk-on periods, or when investors perceive that broader market risks are low and thus are eager to engage with investments that carry a higher risk. Conversely, MXN tends to weaken at times of market turbulence or economic uncertainty as investors tend to sell higher-risk assets and flee to the more-stable safe havens.
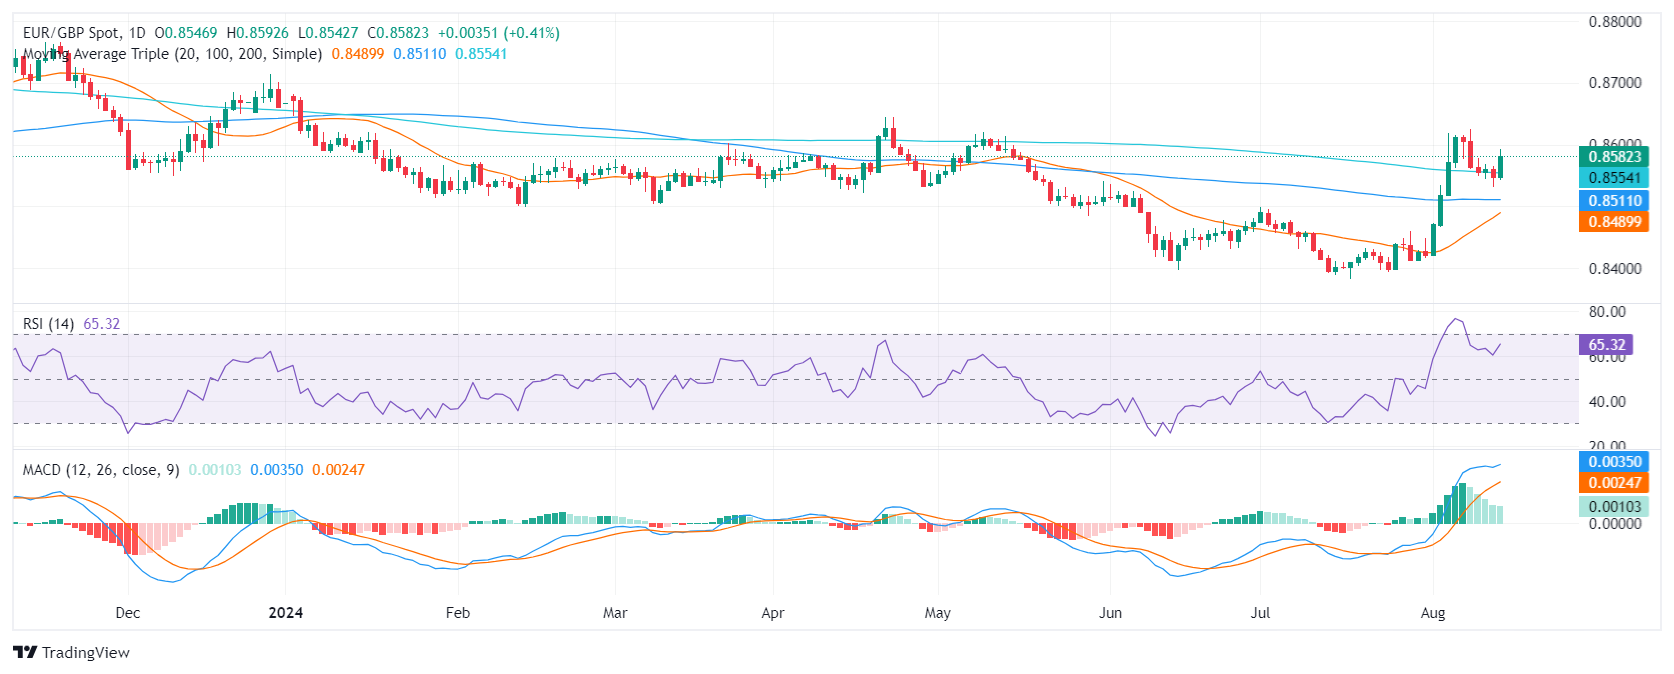
- EUR/GBP rose to 0.8580, overcoming a key resistance level.
- Softer UK inflation data suppressed Pound Sterling during Wednesday's session.
- Markets are strongly considering a cut in September by the BoE.
Wednesday saw the EUR/GBP pair rise towards 0.8580, with softer-than-expected inflation data from the UK weighing on Pound Sterling. This contrasts Tuesday's movements, when the strength of the Pound was elevated by more positive UK employment data as lower inflation figures might prompt a more dovish Bank of England (BoE).
The UK's Office for National Statistics reported that inflation in the UK, measured by the Consumer Price Index (CPI), rose to a yearly 2.2% in July from 2% in June, below the market expectation of 2.3%. Similarly, the core CPI growth decreased to 3.3% down from 3.5% recorded in June. The initial market reaction to these figures resulted in diminished interest in Pound Sterling.
The next policy meeting from the BoE is on September 19, and the market currently estimates nearly a 45% chance of a rate cut.
EUR/GBP technical analysis
The EUR/GBP has shown a general bullish trend in recent sessions. The Relative Strength Index (RSI) of the EUR/GBP pair fluctuates around mid-range values, indicating the bulls are gathering strength and have more way to go. The highest RSI was around 62, hinting toward a slight overbuying presence. The Moving Average Convergence Divergence (MACD) shows steady green bars, confirming the presence of the buyers.
EUR/GBP daily chart
LME Zinc inventories grow, Copper inventories go down by quite a bit, ING’s commodity strategists Ewa Manthey and Warren Patterson note.
The lowest net longs for Copper in more than half a year
“LME Zinc inventories increased by 23,625 tonnes (the biggest daily addition since 22 November 2023) to 263,150 tonnes yesterday - the highest since 3 April 2024. The majority of the inflows were reported from warehouses in Singapore. On-warrant stocks reported gains after falling for four consecutive sessions, rising by 23,675 tonnes to 238,475 tonnes yesterday.”
“In Copper, recent statements from BHP suggest that the main union at the Escondida Copper mine in Chile declined to resume talks following a new company invitation to reach an agreement. The company said it initiated the demobilization of striking workers and activated contingency plans. Meanwhile, the mine workers who are not part of the negotiation are able to continue working.”
“The latest LME COTR report shows that investors decreased their net bullish position for Copper by 6,681 lots to 59,385 lots for the week ending 9 August 2024. This is the lowest net longs for Copper since the week ending 26 January 2024, following a weak demand outlook. A similar move has been seen in aluminium, with speculators decreasing their net bullish bets by 1,960 lots for a sixth consecutive week to 96,543 lots over the last reporting week.”
Sterling is dropping this morning after the release of the UK July inflation report, which showed below-expectation prints across the board. Headline CPI re-accelerated less than expected to 2.2%, but the biggest news was the larger drop in services inflation from 5.7% to 5.2% (consensus was 5.5%, Bank of England forecast 5.6%). Core inflation also decelerated meaningfully from 3.5% to 3.3%, ING’s FX strategist Francesco Pesole notes.
USD softness can still offer support
“Whether this changes the picture for the BoE is an open question. Remember that the BoE overlooked some volatile components like this one when they cut rates earlier this month, and a core services inflation measure (stripped out of those components) was actually unchanged in July. There is therefore a chance that the MPC may not put great emphasis on this downside surprise.”
“But until policymakers actually comment on this and perhaps tame any enthusiasm for larger easing, markets may be inclined to price in more cuts into the Sonia curve, also given the external pressure from the dovish repricing in Fed expectations.”
“All in all, this morning’s inflation figures still help our EUR/GBP bullish call, and we continue to see the pair as a preferable channel to play BoE-related GBP weakness as opposed to GBP/USD, where some USD softness can still offer support. A return above 0.860 in EUR/GBP looks warranted.”
Markets see the uptick in EUR/USD into the upper half of the 1.09-1.10 range as the start of a longer-lasting upward trend. The target is a move to 1.12 in the near term on the back of a tighter rate spread and stabilising risk sentiment, ING’s FX strategist Francesco Pesole notes.
A break higher is imminent
“Today’s US CPI could prompt EUR/USD to make a decisive break above 1.100. Last week, the pair printed very briefly above 1.10 before rapidly dropping back to 1.0950. That might have been due to markets being reluctant to short the dollar aggressively before the July PPI and CPI reports. We expect the CPI hurdle to be cleared without losses today.”
Interestingly, the Euro wasn’t held back by the dismal ZEW survey for Germany on Tuesday, another signal that soft eurozone activity is probably priced in. Incidentally, sticky inflation in the eurozone does not really allow markets to price in more than 75bp of cuts by the European Central Bank by year-end. Arguably, even 75bp looks too dovish given the latest data.
In the rest of Europe, Sweden released inflation figures for July this morning. Core CPIF inflation slowed from 2.3% to 2.2% YoY versus expectations for 2.1%, but that shouldn’t prevent the Riksbank from cutting rates by another 25bp next week. Our call for the remainder of the year is 75bp of easing including next week’s cut, but risks are unarguably skewed to 100bp, which is what the market is pricing in.
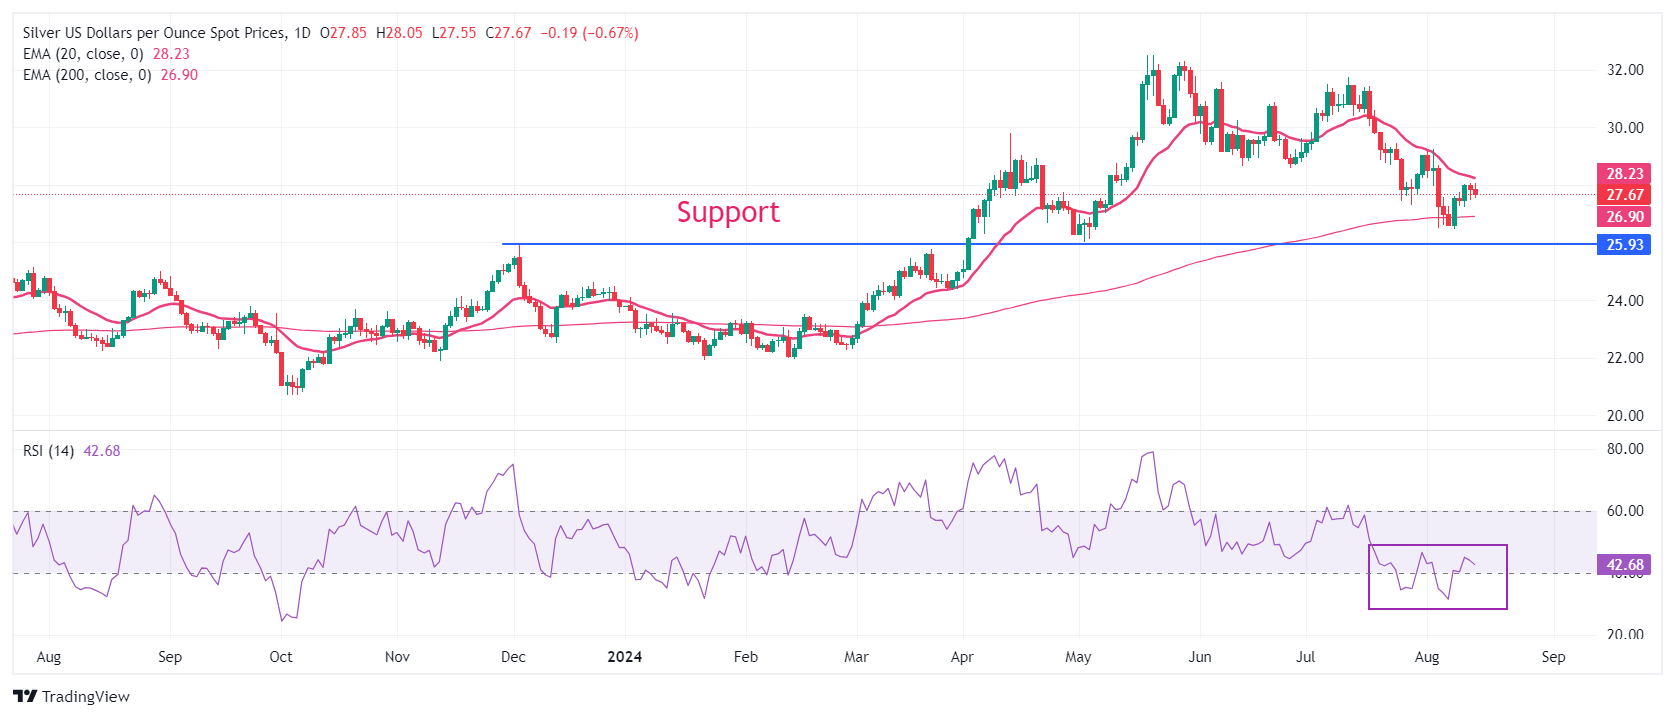
- Silver price remains below $28.00 as expectations for Fed big interest-rate cut diminishes.
- US headline and core inflation decelerated one-tenth to 2.9% and 3.2%, respectively, in July.
- The next trigger for the Silver price will be the monthly US Retail Sales, scheduled for Thursday.
Silver price (XAG/USD) exhibits a subdued performance near $28.00 in Wednesday’s New York session. The white metal faces pressure as market expectations for the Federal Reserve (Fed) big interest-rate cut announcement in September have waned after the release of the United States (US) Consumer Price Index (CPI) report for July.
According to the CME FedWatch tool, the probability for reduction in key borrowing rates by 50 basis points (bps) has declined to 41.5% from 54% in September after the release of the inflation report. However, the data gives a clear signal that the Fed will cut interest rates next month.
The CPI report showed that annual headline and core inflation, which excludes volatile items such as food and energy, decelerated by one-tenth to 2.9% and 3.2%, respectively. The decline in price pressures was broadly in line with market consensus. The month-on-month headline and core inflation also rose by 0.2%, as expected.
Meanwhile, the US Dollar (USD) has dropped further as the inflation data has boosted investors’ confidence that price pressures on track to return to the desired rate of 2%. The US Dollar Index (DXY), which tracks the Greenback’s value against six major currencies, posts fresh weekly low at 103.30.
Going forward, the next trigger for the Silver price will be the US monthly Retail Sales data for July, which will be published on Thursday.
Silver technical forecast
Silver price continues to remain below the 20-day Exponential Moving Average (EMA) near $28.20, suggesting that near-term trend is bearish. While the 200-day EMA near $26.90 continues to provide support to the Silver price bulls.
The major cushion for the Silver price will be the horizontal support plotted from May 5 high at $26.14.
The 14-day Relative Strength Index (RSI) hovers near 40.00. A decisive break below the same will trigger a bearish momentum.
Silver daily chart
Silver FAQs
Silver is a precious metal highly traded among investors. It has been historically used as a store of value and a medium of exchange. Although less popular than Gold, traders may turn to Silver to diversify their investment portfolio, for its intrinsic value or as a potential hedge during high-inflation periods. Investors can buy physical Silver, in coins or in bars, or trade it through vehicles such as Exchange Traded Funds, which track its price on international markets.
Silver prices can move due to a wide range of factors. Geopolitical instability or fears of a deep recession can make Silver price escalate due to its safe-haven status, although to a lesser extent than Gold's. As a yieldless asset, Silver tends to rise with lower interest rates. Its moves also depend on how the US Dollar (USD) behaves as the asset is priced in dollars (XAG/USD). A strong Dollar tends to keep the price of Silver at bay, whereas a weaker Dollar is likely to propel prices up. Other factors such as investment demand, mining supply – Silver is much more abundant than Gold – and recycling rates can also affect prices.
Silver is widely used in industry, particularly in sectors such as electronics or solar energy, as it has one of the highest electric conductivity of all metals – more than Copper and Gold. A surge in demand can increase prices, while a decline tends to lower them. Dynamics in the US, Chinese and Indian economies can also contribute to price swings: for the US and particularly China, their big industrial sectors use Silver in various processes; in India, consumers’ demand for the precious metal for jewellery also plays a key role in setting prices.
Silver prices tend to follow Gold's moves. When Gold prices rise, Silver typically follows suit, as their status as safe-haven assets is similar. The Gold/Silver ratio, which shows the number of ounces of Silver needed to equal the value of one ounce of Gold, may help to determine the relative valuation between both metals. Some investors may consider a high ratio as an indicator that Silver is undervalued, or Gold is overvalued. On the contrary, a low ratio might suggest that Gold is undervalued relative to Silver.
Global markets are pricing a shift away from normalization cuts towards aggressive Fed easing, which is part of the story on the extraordinarily high correlations across markets over the last sessions, TDS senior commodity strategist Daniel Ghali notes.
Gold positioning becomes tactically bearish
“The positioning set-up in Gold markets is becoming tactically bearish. Macro fund positioning is not only bloated. CTAs remain 'max long', and while our simulations of future prices don't point to imminent risks of large-scale liquidations, the threshold for liquidations to kick off is inching closer to market prices by the day, given that price action has remained largely range-bound over the last several months.”
“Shanghai positions remain bloated, but the underlying driver of these positions has diminished as strengthening Asian currencies grinds the demand for currency-depreciation hedges to a halt. Physical markets are nothing to write home about, with no signs of a notable recovery from Asia thus far. Sentiment appears exceptionally strong despite a substantial change in the set-up for flows.”
“A repricing in Fed expectations could be the catalyst to shake-out some complacent length, potentially catalyzing subsequent liquidations with several major cohorts simultaneously vulnerable. Jackson Hole is the next potential catalyst, but non-farm data on the following week will be key.”
Oil prices rebounded in the early trading session today, with the ICE Brent front-month contract trading above $81/bbl following a larger-than-expected oil inventory withdrawal reported by API. If confirmed by the Energy Information Administration (EIA), this would be the seventh weekly decline in a row. Geopolitical risks in the Middle East remain elevated, with the market allocating an increased risk premium for oil because of uncertainty over any Iranian response to Israel, ING’s commodity strategists Ewa Manthey and Warren Patterson note.
Global supply to increase by 730k b/d in 2024
“The API reports that US crude oil inventories fell significantly by 5.2m barrels last week, compared to the market expectations for a draw of just 0.9m barrels. Crude stockpiles at Cushing decreased by 2.3m barrels. Product inventories remained mixed, with gasoline stocks falling by 3.7m barrels while distillate inventories rose by 612k barrels. The more widely followed EIA inventory report will be released later today.”
“The IEA's monthly oil market report was somewhat bearish, with the agency slightly revising down its demand growth forecasts for next year. It now expects global oil demand to grow by 950k b/d in 2025, down 30k b/d from their previous estimates. This revision lower is largely due to the impact of weaker Chinese consumption. However, the IEA left the demand estimates unchanged at 970k b/d for 2024.”
“Earlier, OPEC also lowered its forecasts for global oil demand for both this year and next; however, the difference in demand growth numbers between the IEA and OPEC continues to stand out. On the supply side, the IEA estimates global supply to increase by 730k b/d in 2024 and 1.9m b/d in 2025 as OPEC+ supply gradually returns to the market. Non-OPEC+ production is seen increasing by 1.5m b/d for both this year and next.”
- USD/CAD changes little near 1.3700 after the release of the US CPI report for July.
- The inflation data showed that year-on-year price pressures decelerated expectedly.
- The BoC is expected to cut interest rates for the third time in a row.
The USD/CAD pair hovers near the round-level support of 1.3700 in Wednesday’s New York session. The Loonie asset changes little after the release of the United States (US) Consumer Price Index (CPI) report, which shows that price pressures slowed expectedly in July.
The CPI report showed that annual headline and core inflation, which doesn’t include volatile items such as food and energy, decelerated by one-tenth to 2.9% and 3.2%, respectively. Monthly headline and core inflation rose by 0.2%.
An expected decline in the US inflation has offered cushion to the US Dollar (USD), which was on track to revisit seven-month low. The US Dollar Index (DXY), which tracks the Greenback’s value against six major currencies, finds support after posting an intraday low at 102.36.
The inflation report has boosted confidence that price pressures are on track to return to the desired rate of 2%. However, expectations of a Federal Reserve (Fed) big interest-rate cut announcement have eased. The CME FedWatch tool shows that the likelihood of a 50-basis point (bp) interest-rate reduction has eased to 41.5% from 54.5% after the release of the July’s inflation report.
Meanwhile, the Canadian Dollar (CAD) has faced mild selling pressure as Oil prices have corrected gradually after a one-way rally. The Oil prices have dropped as investors look for fresh developments on conflicts between Iran and Israel in the Middle East. It is worth noting that Canada is the leading exporter of Oil to the US and lower prices of black gold weighs on the Canadian Dollar.
This week, the Loonie will be majorly guided by the market speculation for Bank of Canada (BoC) rate cuts amid absence of top-tier economic data. Investors expect that the BoC could extend its policy-easing cycle in September to prevent labor market from worsening further.
Economic Indicator
Consumer Price Index ex Food & Energy (YoY)
Inflationary or deflationary tendencies are measured by periodically summing the prices of a basket of representative goods and services and presenting the data as the Consumer Price Index (CPI). CPI data is compiled on a monthly basis and released by the US Department of Labor Statistics. The YoY reading compares the prices of goods in the reference month to the same month a year earlier. The CPI Ex Food & Energy excludes the so-called more volatile food and energy components to give a more accurate measurement of price pressures. Generally speaking, a high reading is bullish for the US Dollar (USD), while a low reading is seen as bearish.
Read more.Last release: Wed Aug 14, 2024 12:30
Frequency: Monthly
Actual: 3.2%
Consensus: 3.2%
Previous: 3.3%
Source: US Bureau of Labor Statistics
The US Federal Reserve has a dual mandate of maintaining price stability and maximum employment. According to such mandate, inflation should be at around 2% YoY and has become the weakest pillar of the central bank’s directive ever since the world suffered a pandemic, which extends to these days. Price pressures keep rising amid supply-chain issues and bottlenecks, with the Consumer Price Index (CPI) hanging at multi-decade highs. The Fed has already taken measures to tame inflation and is expected to maintain an aggressive stance in the foreseeable future.
Inflationary pressure continues to ease in the US. Consumer prices rose by 0.2% in July from June, both overall and excluding energy and food (core rate). While service prices rose slightly more than expected, goods prices fell more sharply. The data support our forecast of a first Fed rate cut in September, Commerzbank’s economists Bernd Weidensteiner and Dr. Christoph Balz note.
First Fed rate cut set for September
“US consumer prices rose by 0.2% in July compared to the previous month. The year-on-year rate fell from 3.0% to 2.9%. The more important core rate, which excludes the volatile prices for energy and food, printed 0.2%, too. The year-on-year rate fell here from 3.3% to 3.2%. The report was therefore in line with consensus expectations and our forecast.”
“In our preview, we pointed out that although the general expectation of a month-on-month rate of 0.2% was realistic, the data would probably only just round higher to 0.2%. In fact, the month-on-month rates were 0.15% (headline) and 0.17% (core rate). This continues the string of favorable inflation reports. Over the last three months, consumer prices have risen at an annual rate of only 0.4%, excluding energy and food by 1.6%.”
“The only weak point in the report is that the typically highly volatile (and therefore uninformative) prices, such as those for used cars and airline tickets, have significantly dampened price increases, while rent increases, which are actually quite stable, have again contributed somewhat more to inflation. However, rental inflation remains on a downward trend. Inflationary pressure should therefore tend to decrease further in the coming months.”
- AUD/CAD extends its sequence of rising peaks and troughs in a short-term uptrend.
- Given the bias for trends to extend the pair will likely rise towards the next target subject to a break above the 200-period SMA.
AUD/CAD has established a sequence of rising peaks and troughs since it found a floor and reversed course on August 5.
It is now probably in a short-term uptrend which given “the trend is your friend” is more likely to continue rising than not.
AUD/CAD 4-hour Chart
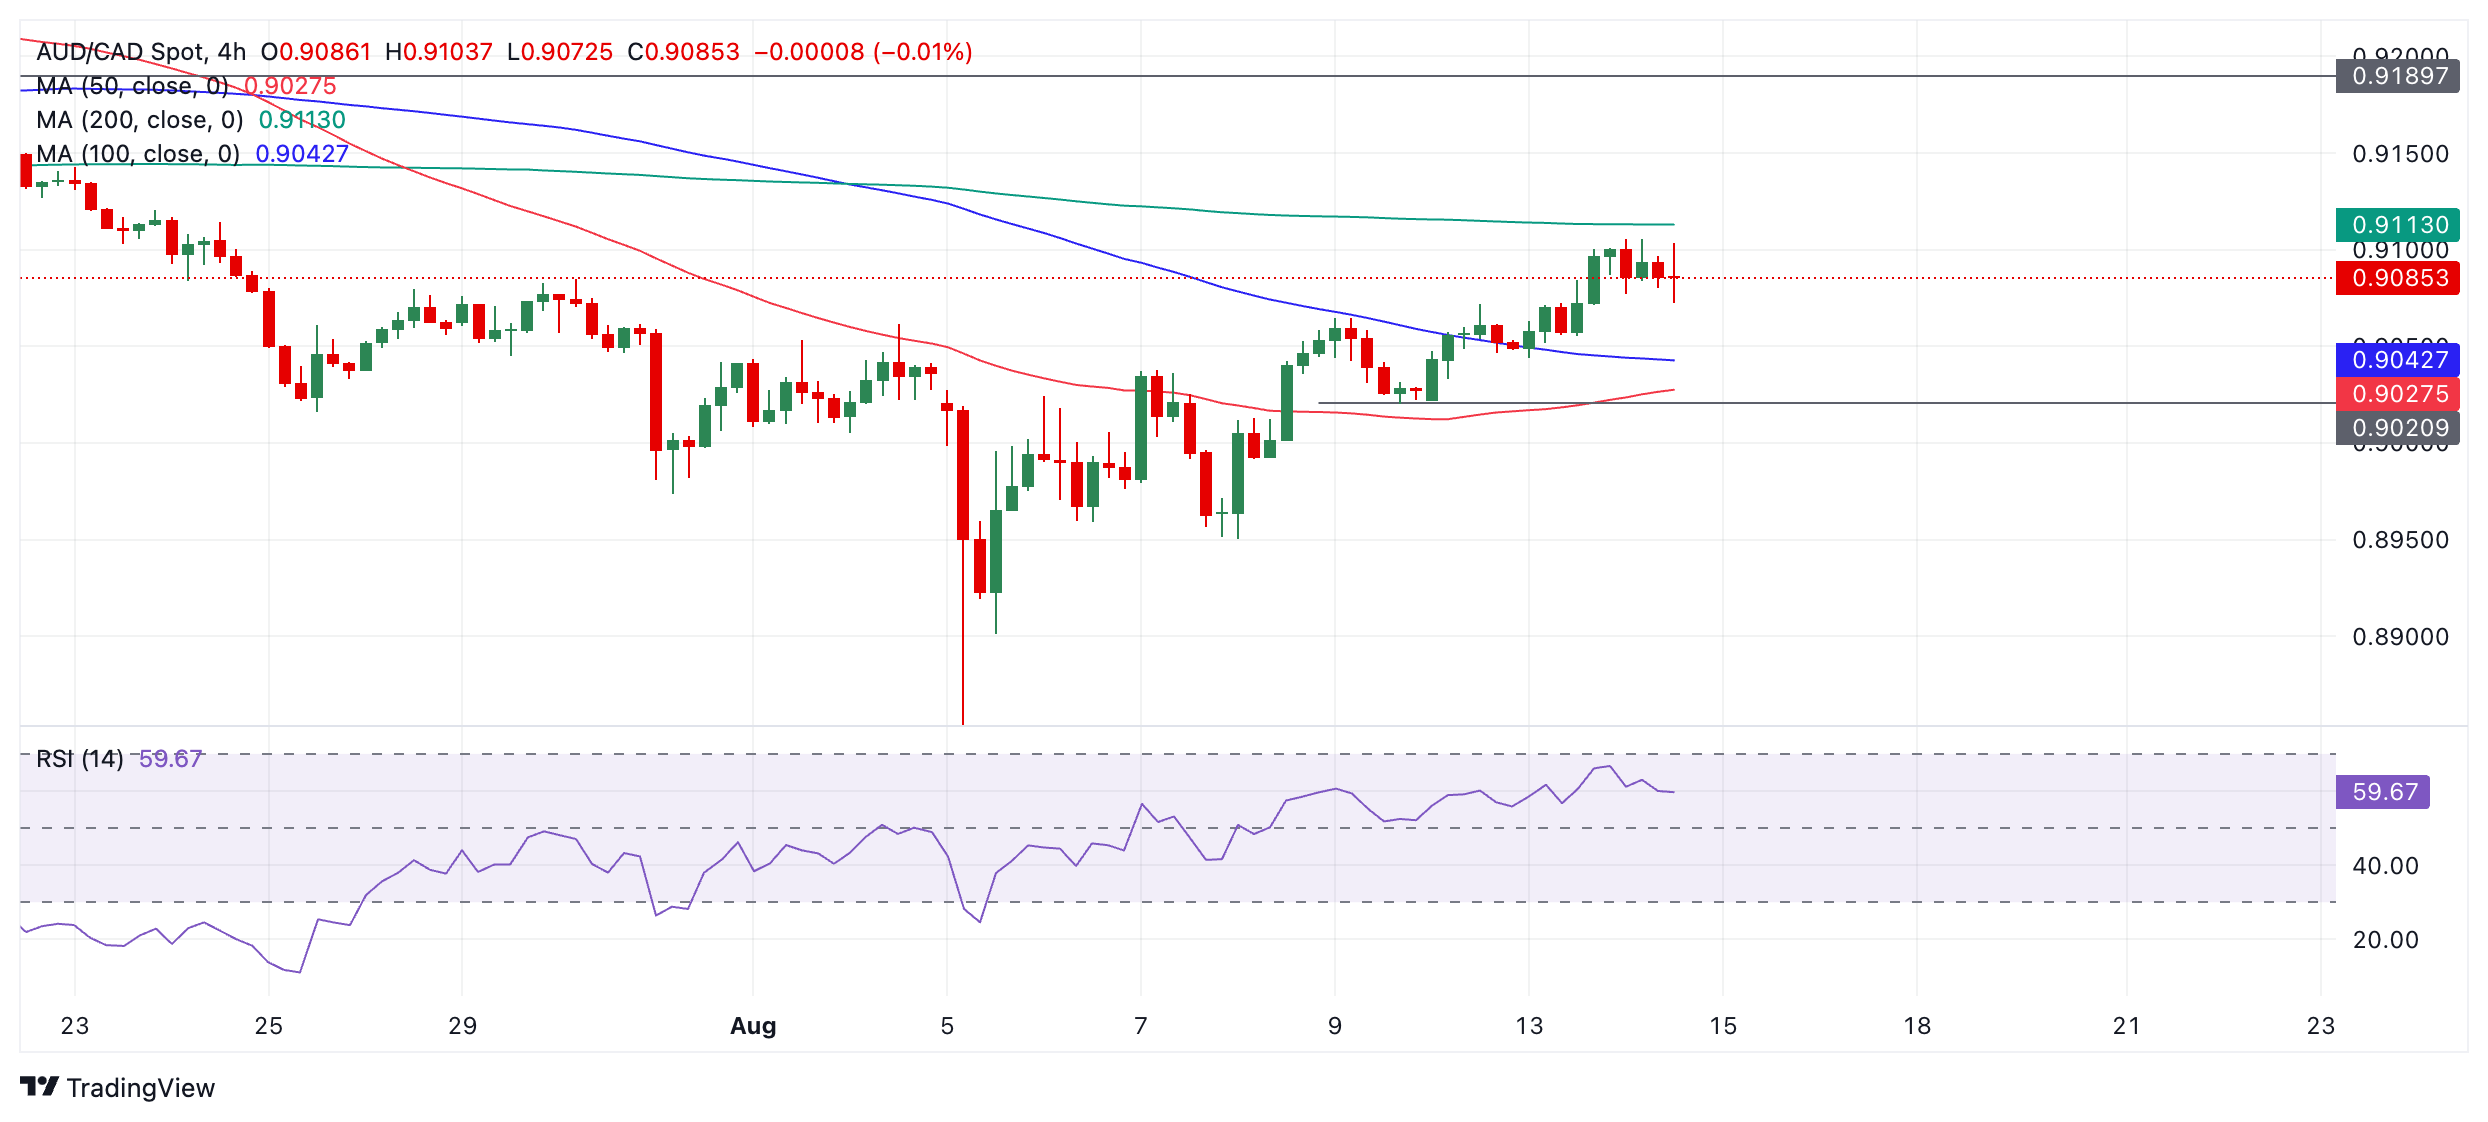
The 200-period Simple Moving Average (green) lies above the current market level and appears to be acting as a resistance level. A break and close above the 200 SMA would provide confirmation of a continuation of the short-term uptrend. Such a break would also constitute an important milestone overcome, as it is the last significant SMA on the way up.
The next target higher is resistance at 0.9190 from legacy lows.
The Relative Strength Index (RSI) momentum indicator has not risen into overbought territory yet suggesting the market is not at risk of a pull back.
A break below 0.9020 would bring into doubt the short-term uptrend and might indicate a change to a more bearish environment.
The Reserve Bank of New Zealand (RBNZ) decided to reduce the official cash rate (OCR) by 25 bps to 5.25%, embarking on an easing cycle much sooner than expected, almost a year ahead of the RBNZ’s own projections, UOB Group
RBNZ to continue steadily cutting the OCR
“The Reserve Bank of New Zealand (RBNZ) lowered its official cash rate (OCR) by 25 bps to 5.25% earlier today (14 Aug). The move came as a surprise as it embarked on an easing cycle much sooner than expected.”
“The RBNZ’s updated forecasts show the average OCR at 4.62% early next year and at 3.85% by the end of 2025. Growth forecasts have been revised down significantly, incorporating negative growth in both 2Q24 and 3Q24. The RBNZ now sees inflation dropping to 2.3% in the current quarter but will not return to the 2% midpoint until mid-2026.”
“Given how a faster-than-expected contraction in the economy has shifted the balance of risks, we now expect the RBNZ to continue steadily cutting the OCR by 25 bps in every meeting for the rest of this year to bring the OCR to 4.75% by year end.”
UK inflation data for July came in lower than expected. Headline prices fell 0.2% m/m, leaving inflation at 2.2% over the year. Core prices rose 3.3% in the July year, versus 3.4% expected and 3.5% in June. Even sticky Services inflation eased a bit more than forecast—but remains elevated at 5.2% y/y, Scotiabank’s chief FX strategist Shaun Osborne notes.
Minor dips to the 1.28 area remain well-supported
“Markets are still pricing in less than 50% risk of a BoE rate cut in September but continue to anticipate 50bps of additional easing by year-end. That’s not much different from earlier in the week.”
“Sterling’s rebound from last week’s low has stumbled a little this morning but losses are not too significant from a technical perspective and may already be stabilizing. Broader trends in GBP/USD remain constructive following last week’s strong—bullish—reversal. Minor dips to the 1.28 area should remain well-supported.”
The Reserve Bank of New Zealand (RBNZ) surprised markets this morning by not only cutting interest rates by 25 basis points, but also reporting that a 50 basis point cut was under serious discussion. The RBNZ justified the move by saying that the economy had cooled more than expected recently and that it was basing its assessment of inflation more on expectations, which had already returned to the middle of the target range of 1-3%, Commerzbank FX strategist Volkmar Baur notes.
RBNZ decision to support the Kiwi in the medium term
“Inflation itself is still too high, but also on the right track. The central bank compared the situation of a weaker economy and falling inflation with other G10 countries, saying that New Zealand was more comparable to countries that had already started to cut interest rates.”
“As noted yesterday, the market had been expecting a cut, while analysts generally tended to believe that the central bank would wait. What surprised the market so much that the Kiwi lost about 1% against the US dollar this morning is that the central bank seems to be seriously considering a 50 basis point move. However, it appears to me that this statement is more about telling the market that anything is possible at any time.”
“And it should not be interpreted as an announcement of an imminent faster cut. The data does not support such a move at the moment. Unlike the Australian dollar, for example, the market is already pricing in a significant cycle of rate cuts by the RBNZ. This should support the Kiwi in the medium term.”
The Euro (EUR) is trading at its highest since January as markets anticipate US CPI data coming in soft enough to prompt the Fed to make rapid rate cuts in the coming months, Scotiabank’s chief FX strategist Shaun Osborne notes.
Resistance ahead of the December high at 1.1140
“Real and nominal EZ/US yield spreads are compressing, supporting EUR gains. We estimate spot fair value at 1.1054 currently, so the EUR looks good for these gains and should remain supported on minor dips in the event of any short-term setback.”
“Solid gains in the EUR are backed by a bullish alignment of trend strength oscillators across the short-, medium– and long-term DMIs. That suggests EUR gains can stretch to the upper 1.10s (200-week MA at 1.1068) at least in the short run. There is little in terms of clear resistance ahead of the December high at 1.1140. Support is 1.0950/75.”
Shortly before the Riksbank's rate meeting next week, the latest inflation data for July will be published today. They will shed some more light on whether the Riksbank will stick to its dovish stance. After all, in June it held out the possibility of three more rate cuts this year – with four meetings remaining, Commerzbank’s FX analyst Antje Praefcke notes.
Price pressure has eased significantly in recent months
“Now that the wave of risk aversion in the market is over and the krona has recovered somewhat, the Riksbank should be a little less concerned about exchange rate-induced inflationary pressures. In addition, price pressure has eased significantly in recent months, with the headline rate even falling below the inflation target, and the core rate is also on its way to the inflation target, as indicated by the seasonally adjusted monthly rates of change.”
“Although the overall rate is likely to rise again slightly in July from the low 1.3% in June for technical reasons, the core rate (2,3% in June) is likely to move even closer to the inflation target of 2%. The market is confident that the Riksbank will cut next week and even sees the possibility of 50 basis points. It expects 100 basis points by the end of the year, which means that it is even more dovish than the Riksbank itself.”
“If today's figures seem to justify market expectations, the SEK should therefore only lose a little ground. I would expect the greater movement in the SEK if the price and economic data in the coming weeks are stronger than expected and cause the market to revise its expectations. Or if next week the Riksbank tries to dampen the interest rate cut expectations somewhat since they have gone quite far.”
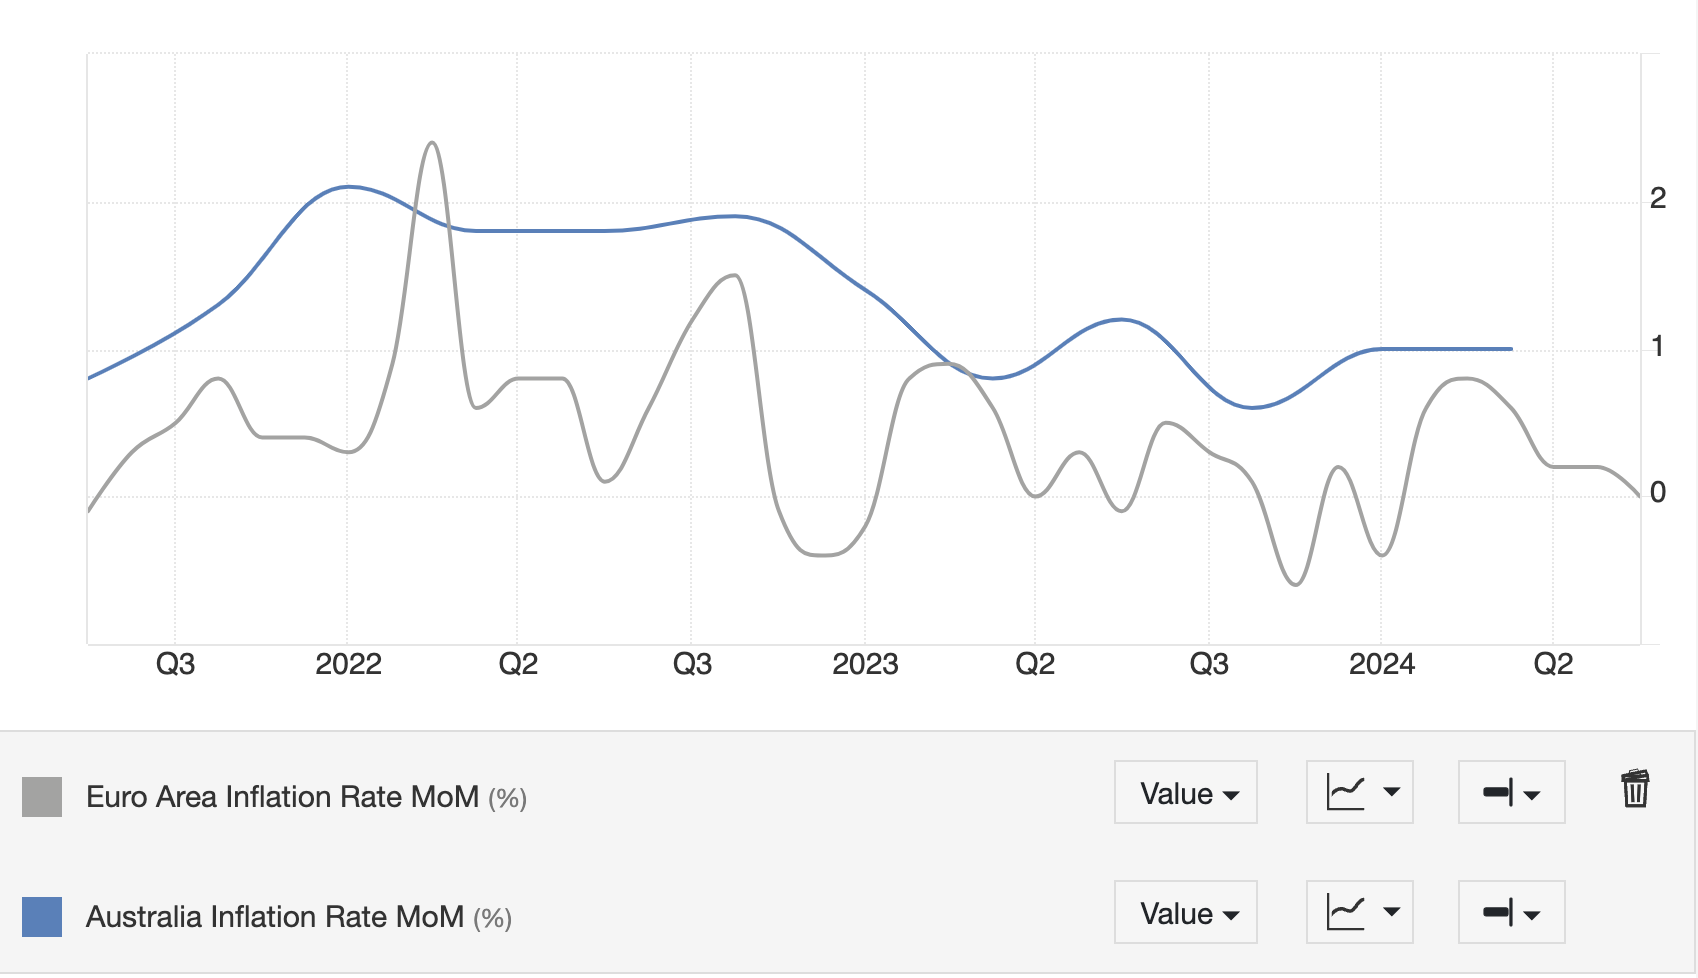
- EUR/AUD is rising despite a run of weak data from the Eurozone and lower inflation expectations.
- In comparison data from Australia has been relatively robust of late, particularly sentiment and wage data.
- Monetary policy is diverging with the ECB likely to cut interest rates further, leading to a bearish backdrop for EUR/AUD.
EUR/AUD is exchanging hands in the 1.6630s on Wednesday, up a third of a percent on the day. The pair has fallen about 3.3% in just over a week since the 1.7186 high reached on August 5. Despite the current uptick, the short-term trend is bearish and since “the trend is your friend” the pair is vulnerable to more downside.
EUR/AUD has weakened primarily due to an ebbing away of US recession fears which temporarily weakened the Australian Dollar (AUD) due to its sensitivity to negative risk sentiment. The differing outlooks for monetary policy of the two currencies and comparably resilient recent Australian macroeconomic data are further drivers of the pair’s decline since the August 5 high.
On Wednesday Eurostat released the latest Gross Domestic Product (GDP), Employment Change and Industrial Production for the Eurozone. The GDP was a second estimate for Q2 and showed no change from the preliminary reading, Employment Change for Q2 was likewise unchanged. Industrial Production in June, however, fell below expectations.
The future course of rates
Interest rates are a key driver of FX markets since international investors like to park their money where it can earn the highest return. This increases demand for currencies where interest rates are high. The difference marginally benefits the AUD since the Reserve Bank of Australia (RBA) has set a slightly higher policy rate of 4.35% compared to the 4.25% set by the European Central Bank (ECB). The difference is marginal, however, and more important perhaps is the expected trajectory of interest rates in the future.
The ECB cut interest rates for the first time in several years in June 2024, prior to that they stood at 4.50%. The bank has adopted a “wait-and-see” approach to interest rates based on how the Eurozone economy evolves and the inflation rate. If inflation continues to ease it will continue cutting interest rates to benefit commerce; if inflation remains stubbornly high it will keep interest rates unchanged until inflation comes down.
In Australia the position of the RBA is slightly different. The RBA is one of the few central banks (including the Federal Reserve) not to have begun cutting interest rates since the post Covid spike in inflation started to fall. It is also the only major central bank remaining that is threatening to actually raise interest rates (except the BoJ which is in a unique position) in the event that inflation continues creeping higher.
The difference in the monetary policy stances of the two banks is a backwind for the Aussie Dollar and a negative background factor for EUR/AUD.
Price trends
The stronger trend of decreasing inflation in the Eurozone also suggests that the ECB is more likely to cut interest rates again – possibly before the RBA even begins. Such a move would be bearish for EUR/AUD.
This is most clearly seen in a comparison of the inflation rate on a month-over-month basis, which shows Australian inflation recovering at the same time as Eurozone inflation has fallen to zero.
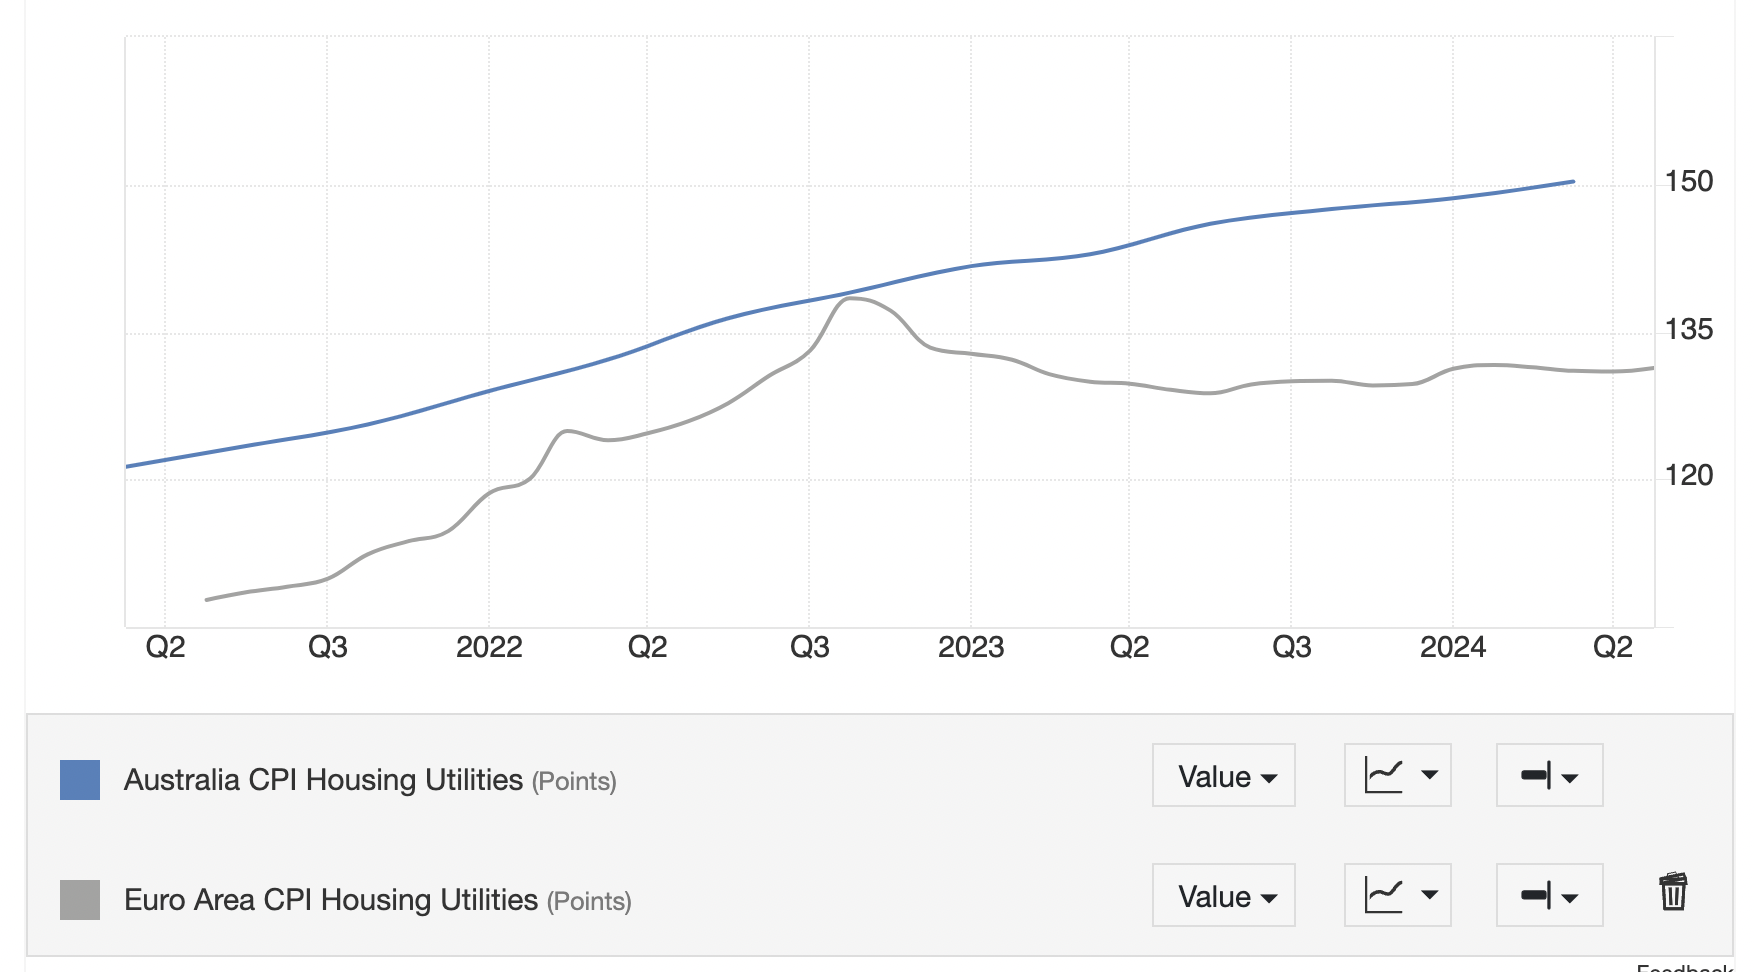
The Consumer Price Index (CPI) for Housing and Utilities is another metric that is showing a wide divergence between the Eurozone and Australia. In the former, the metric began falling in Q3 of 2022 whilst in Australia it continues to rise.
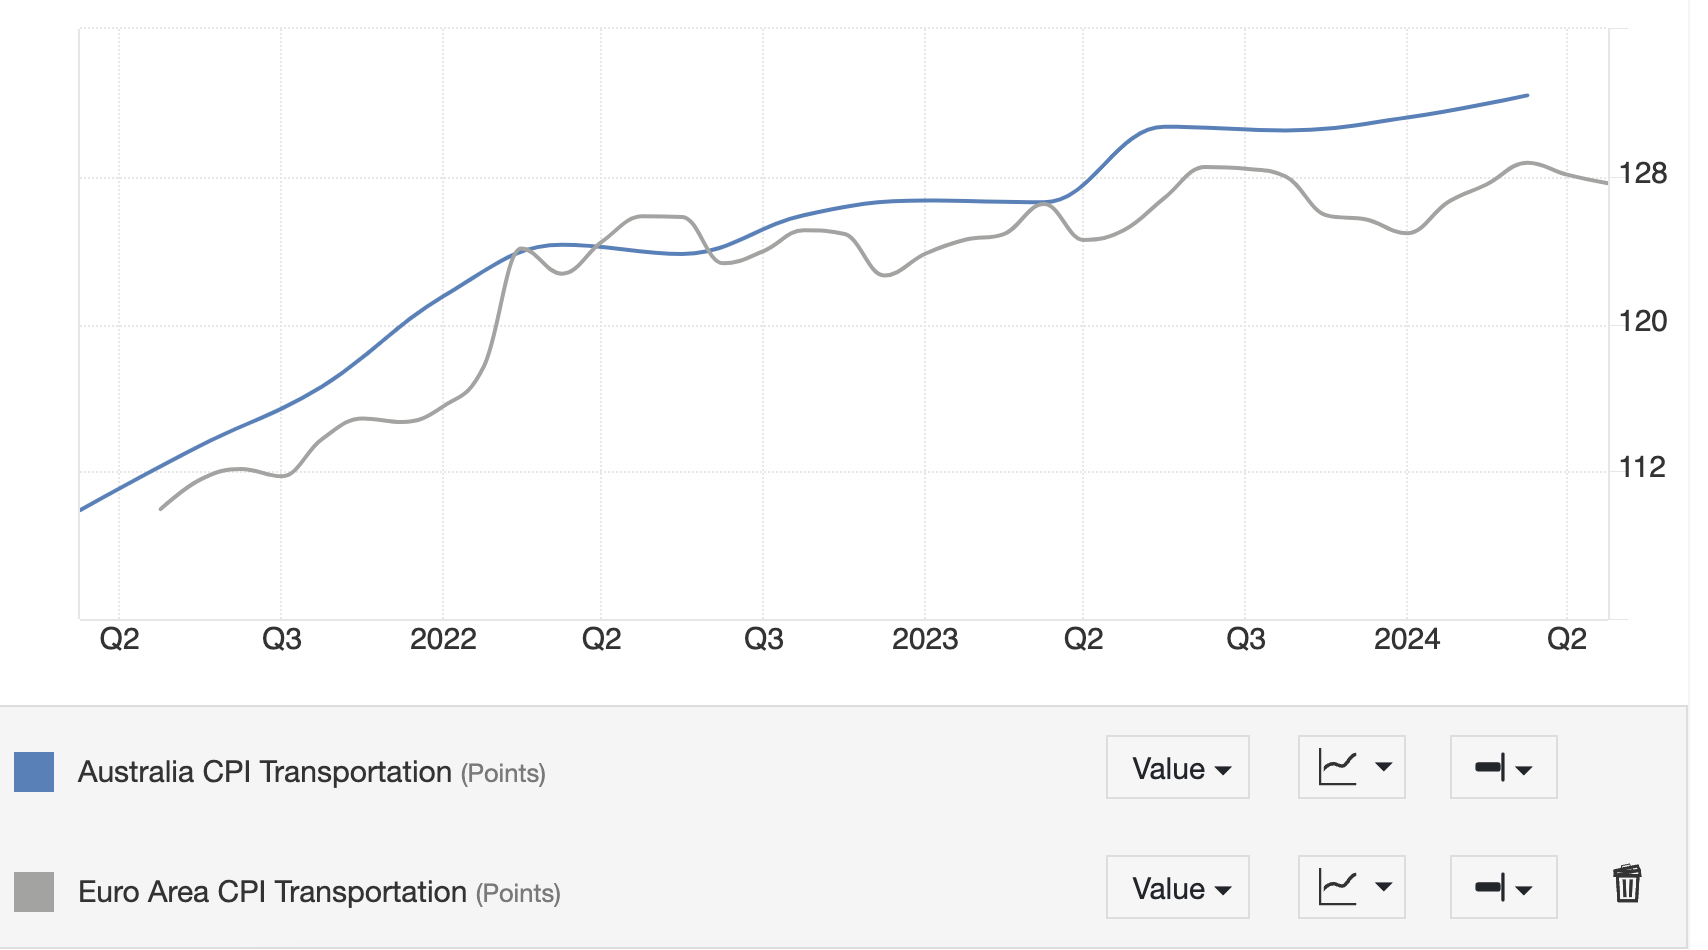
Australian Transportation CPI continues to steadily rise whilst it is plateauing in the Eurozone.
A difference in sentiment
Recent sentiment data has also highlighted a divergence between the two economies. In Australia recent economic sentiment data in the form of the NAB Business Sentiment index and the Westpac-Melbourne Consumer Sentiment Index showed families and businesses remained relatively optimistic about the outlook.
The Westpac-Melbourne index showed that the “family finances vs a year ago” sub-index surged 11.7% to a two-year top of 70.9. The NAB confidence data showed an improvement in the employment situation.
“We were concerned about the sharp decline in the employment index, but it jumped back to an above-average level this month, suggesting the robust jobs growth is continuing for now," said NAB Chief Economist Alan Oster.
The German ZEW Economic Sentiment indicator, conversely, showed the opposite – that sentiment was “breaking down”.
The headline German ZEW Index dropped sharply to 19.2 in August from 41.8 in July, and missed the market consensus of 38.0.
The Current Situation Index worsened from -68.9 in July to -77.3 in the eighth month of the year.
The Eurozone ZEW Economic Sentiment Index came in at 17.9 in August, sharply lower than the July reading of 43.7. The data fell short of the market expectation of 35.4.
Overall the much worsening sentiment in the Eurozone compared to Australia is another bearish factor for EUR/AUD.
Australian outlook according to ANZ bank
The overall positive outlook for the Australian economy has led ANZ bank, a major New Zealand lender to revise up most of its forecasts for key macroeconomic indicators in Australia.
“Our broad outlook remains that real household disposable incomes will get a significant boost from tax cuts and cost‑of‑living relief measures from H2 2024,” says Adam Boyton, Economist for ANZ.
A rise in consumer spending, business investment and GDP along with a fall in population growth should boost GDP and consumption per capita, says the bank.
Despite foreseeing marginally higher unemployment, ANZ also sees the Wage Price Index (WPI) remaining elevated, in part due to “the announced 15% wage increase for childcare workers”.
Regarding inflation, ANZ expects headline inflation to slow sharply in Q3 to 2.7% YoY, reflecting the temporary effects of cost-of-living relief measures. But it is likely to rebound to above 3.0% in H2 2025.
ANZ expects the RBA to begin cutting rates in February 2025 with the cash rate to end 2025 at 3.60%.
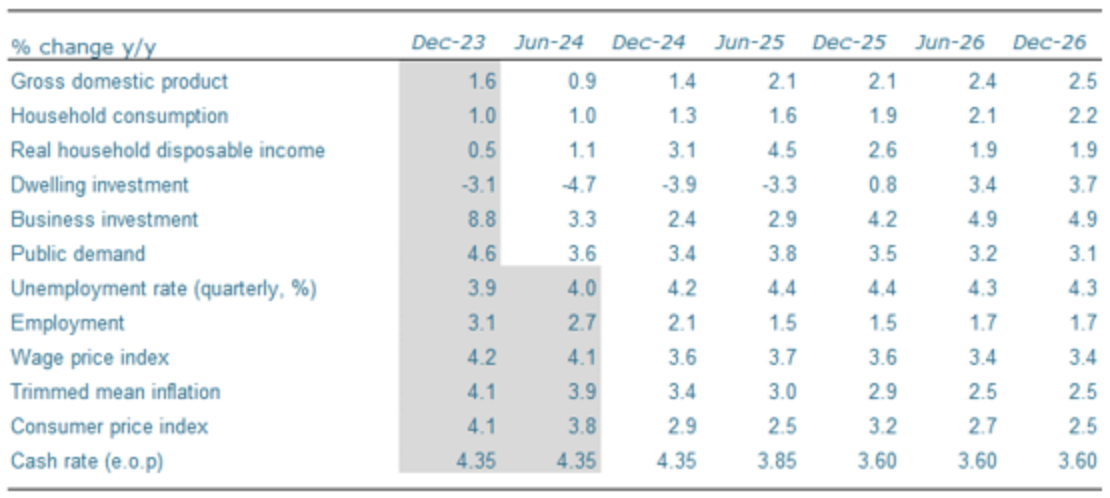
The Canadian Dollar (CAD) is little changed overnight but the softer US Dollar (USD) tone is helping the CAD hold gains below the recent short-term range low, suggesting a bit more strength may develop in the short run, Scotiabank’s chief FX strategist Shaun Osborne notes.
Bears set to test the 1.3675 support
“Spot remains above our short-term fair value estimate (which has fallen to 1.3626 this morning, from 1.3650 yesterday). Factors (risk appetite, for example) continue to shift favourably for the CAD, which should keep scope for USD gains limited. CAD gains will put incremental pressure on the record mass of CAD short positions that have accumulated in recent weeks.”
“Spot losses are showing some signs of stalling around the figure in early trade but USDCAD’s drop through support at 1.3725 (retracement and 40-day MA—now initial resistance) imply further downside pressure on the USD towards 1.3675 (minor retracement support) and, potentially, 1.36.”
Silver prices (XAG/USD) rose on Wednesday, according to FXStreet data. Silver trades at $27.91 per troy ounce, up 0.20% from the $27.85 it cost on Tuesday.
Silver prices have increased by 17.29% since the beginning of the year.
| Unit measure | Silver Price Today in USD |
|---|---|
| Troy Ounce | 27.91 |
| 1 Gram | 0.90 |
The Gold/Silver ratio, which shows the number of ounces of Silver needed to equal the value of one ounce of Gold, stood at 88.62 on Wednesday, up from 88.50 on Tuesday.
Silver FAQs
Silver is a precious metal highly traded among investors. It has been historically used as a store of value and a medium of exchange. Although less popular than Gold, traders may turn to Silver to diversify their investment portfolio, for its intrinsic value or as a potential hedge during high-inflation periods. Investors can buy physical Silver, in coins or in bars, or trade it through vehicles such as Exchange Traded Funds, which track its price on international markets.
Silver prices can move due to a wide range of factors. Geopolitical instability or fears of a deep recession can make Silver price escalate due to its safe-haven status, although to a lesser extent than Gold's. As a yieldless asset, Silver tends to rise with lower interest rates. Its moves also depend on how the US Dollar (USD) behaves as the asset is priced in dollars (XAG/USD). A strong Dollar tends to keep the price of Silver at bay, whereas a weaker Dollar is likely to propel prices up. Other factors such as investment demand, mining supply – Silver is much more abundant than Gold – and recycling rates can also affect prices.
Silver is widely used in industry, particularly in sectors such as electronics or solar energy, as it has one of the highest electric conductivity of all metals – more than Copper and Gold. A surge in demand can increase prices, while a decline tends to lower them. Dynamics in the US, Chinese and Indian economies can also contribute to price swings: for the US and particularly China, their big industrial sectors use Silver in various processes; in India, consumers’ demand for the precious metal for jewellery also plays a key role in setting prices.
Silver prices tend to follow Gold's moves. When Gold prices rise, Silver typically follows suit, as their status as safe-haven assets is similar. The Gold/Silver ratio, which shows the number of ounces of Silver needed to equal the value of one ounce of Gold, may help to determine the relative valuation between both metals. Some investors may consider a high ratio as an indicator that Silver is undervalued, or Gold is overvalued. On the contrary, a low ratio might suggest that Gold is undervalued relative to Silver.
(An automation tool was used in creating this post.)
It may be useful to look at the big picture when assessing the current movements in the Swiss Franc (CHF). Since the beginning of 2020, the CHF has appreciated by almost 15% against the Euro and by more than 18% against Switzerland's trading partners, Commerzbank’s Head of FX and Commodity Research Ulrich Leuchtmann notes.
No evidence of excessive CHF strength
“18% appreciation does not burden Swiss exporters or those Swiss companies that compete with imports. At least not significantly. This is because the CHF's performance is hardly more than an expression of the fact that Switzerland was almost the only economy to largely escape the global inflation shock.”
“Yes, inflation in Switzerland also rose somewhat as a result of the pandemic. At its peak, the Federal Statistical Office recorded a price increase of 3.5% (compared to the previous year, in August 2022). But that was nothing compared to what was recorded elsewhere: 9.1% in the USA, 10.6% in the eurozone, 11.1% in the UK, etc.”
“But if the internal purchasing power of other currencies eroded faster, it is only logical that their purchasing power on the foreign exchange market also eroded against the franc. Adjusted for these inflation differences, the NEER becomes the real effective exchange rate (REER). In the same period, it increased by only 4.6% – almost exactly the same as the REER of the Euro. This means that, apart from the fact that Switzerland has largely escaped the post-pandemic inflation shock, there is no evidence of excessive CHF strength.”
Yesterday's UK labour market data should play into the Bank of England's hands as the unemployment rate surprisingly fell and wage pressures eased at the same time. The Pound Sterling (GBP) initially benefited from these figures, but was unable to hold on to all of its gains against the Euro. This should come as no surprise, as the inflation figures are likely to be more important for the GBP this week, starting with July's inflation figures today, Commerzbank’s FX strategist Michael Pfister notes.
Inflation may be a positive signal for the GBP
“The Bloomberg consensus expected the core rate to fall slightly year-on-year, and so it happened, but this was likely due to a base effect as a sharp rise in July last year is no longer included in the calculation.”
“And there were good reasons for this view. For example, house prices have recently risen more strongly than before and the real economy appears to be continuing its slow recovery, which argues for stronger inflationary pressures. Moreover, most of the recent disinflation in the core rate has come from durable goods, and the trend there has reversed in recent months. We see similar trends in other countries.”
“In short, today's figures support those who (like us) expect interest rates to remain unchanged in September and would be another positive signal for the GBP.”
- AUD/USD refreshes a three-week high at 0.6640 with US Inflation and Aussie Employment in focus.
- Traders remain split over the size of the Fed interest-rate reduction in September.
- The RBA is expected to keep its OCR steady at 4.35% by the year-end.
The AUD/USD pair hovers near a fresh three-week high at 0.6640 in Wednesday’s European session. The Aussie asset clings to gains as the US Dollar (USD) dips ahead of the United States (US) Consumer Price Index (CPI) data for July, which will be released at 12:30 GMT.
Investors will keenly focus on the US inflation data as it will influence market speculation for the size of interest-rate cuts by the Federal Reserve (Fed) in the September meeting. The CME FedWatch tool shows that traders price in a 54.5% chance for a 50 basis point (bp) rate reduction in September.
The US CPI report is expected to show that monthly headline and core inflation rose by 0.2%. Annual headline and core CPI are estimated to have decelerated by one-tenth to 2.9% and 3.2%, respectively.
Meanwhile, the market sentiment remains steady ahead of the US inflation data release. S&P 500 futures have posted nominal gains in European trading hours. The US Dollar Index (DXY), which tracks the Greenback’s value against six major currencies, slides further below 102.50. 10-year US Treasury yields slump to near 3.84%.
The Australian Dollar (AUD) remains on sidelines as investors await the Aussie Employment data for July, which will be published on Thursday. Economists expect that labor demand remain slowed in July as fresh payrolls are seen at 26.5K payrolls, lower than June’s reading of 50.2K. The Unemployment Rate is seen steady at 4.1%.
The labor market data will influence expectations for the Reserve Bank of Australia’s (RBA) interest rate path. Currently, the RBA is expected to leave its Official Cash Rate (OCR) unchanged at 4.35% for the entire year.
Australian Dollar FAQs
One of the most significant factors for the Australian Dollar (AUD) is the level of interest rates set by the Reserve Bank of Australia (RBA). Because Australia is a resource-rich country another key driver is the price of its biggest export, Iron Ore. The health of the Chinese economy, its largest trading partner, is a factor, as well as inflation in Australia, its growth rate and Trade Balance. Market sentiment – whether investors are taking on more risky assets (risk-on) or seeking safe-havens (risk-off) – is also a factor, with risk-on positive for AUD.
The Reserve Bank of Australia (RBA) influences the Australian Dollar (AUD) by setting the level of interest rates that Australian banks can lend to each other. This influences the level of interest rates in the economy as a whole. The main goal of the RBA is to maintain a stable inflation rate of 2-3% by adjusting interest rates up or down. Relatively high interest rates compared to other major central banks support the AUD, and the opposite for relatively low. The RBA can also use quantitative easing and tightening to influence credit conditions, with the former AUD-negative and the latter AUD-positive.
China is Australia’s largest trading partner so the health of the Chinese economy is a major influence on the value of the Australian Dollar (AUD). When the Chinese economy is doing well it purchases more raw materials, goods and services from Australia, lifting demand for the AUD, and pushing up its value. The opposite is the case when the Chinese economy is not growing as fast as expected. Positive or negative surprises in Chinese growth data, therefore, often have a direct impact on the Australian Dollar and its pairs.
Iron Ore is Australia’s largest export, accounting for $118 billion a year according to data from 2021, with China as its primary destination. The price of Iron Ore, therefore, can be a driver of the Australian Dollar. Generally, if the price of Iron Ore rises, AUD also goes up, as aggregate demand for the currency increases. The opposite is the case if the price of Iron Ore falls. Higher Iron Ore prices also tend to result in a greater likelihood of a positive Trade Balance for Australia, which is also positive of the AUD.
The Trade Balance, which is the difference between what a country earns from its exports versus what it pays for its imports, is another factor that can influence the value of the Australian Dollar. If Australia produces highly sought after exports, then its currency will gain in value purely from the surplus demand created from foreign buyers seeking to purchase its exports versus what it spends to purchase imports. Therefore, a positive net Trade Balance strengthens the AUD, with the opposite effect if the Trade Balance is negative.
- Oil price ticks up slightly after snapping a four-day winning streak on Tuesday.
- Traders saw a chunky overnight drawdown of 5.2 million barrels from the US American Petroleum Institute.
- The US Dollar Index weakens ahead of the US CPI release.
Oil clings onto small gains on Wednesday, though pressure is building on the chart for more downside in crude prices after Tuesday’s slide. The chunky drawdown of 5.2 million barrels reported by the American Petroleum Institute (API) was able to give some counterweight to the selling pressure from Tuesday. The sell-off took place after the release of the Producer Price Index (PPI), which came in substantially softer than markets expected, jacking up expectations of another soft reading for the US Consumer Price Index (CPI) later today.
The US Dollar Index (DXY), which tracks the performance of the US Dollar against six major currencies, faces selling pressure as well. The US CPI release for July is likely the most important data release for the week. Analysts expect the disinflationary path to continue, and this scenario might bring more weakness for the US Dollar (USD).
At the time of writing, Crude Oil (WTI) trades at $77.35 and Brent Crude at $80.68.
Oil news and market movers: All eyes on EIA for near-term moves
- The overnight US crude stock change number reported by the American Petroleum Institute (API) came in at a chunky 5.2 million barrels drawdown. This more than doubles the 2 million drawdown expected by analysts.
- The Energy Information Administration (EIA) will publish its stock change data at 14:30 GMT. Analysts expect to see a much smaller draw of 2 million barrels compared to the prior’s weeks drawdown of 3.728 million barrels.
- Bloomberg reported that the US has allowed the sale of missiles to Saudi Arabia, another step of escalation in the Middle Eastern region.
- Meanwhile, retaliation from Iran against Israel is not taking place , creating a moment of easing tensions in the Gaza region as the main parties try to restart ceasefire talks.
Oil Technical Analysis: Risk of rejection remains
Oil price has been shooting for the stars since Monday. The fact that both OPEC and the IEA are seeing substantial supply surplus has traders doubling down on changes from OPEC output, away from its commitment to reduce production limitations. The risk to that could be the big US drawdown numbers, leading to very brief rallies. Still, the broader trend seems to be to the downside.
On the upside, the trifecta of moving averages are the main levels to watch. First up is the 200-day Simple Moving Averages (SMA) at $77.68. From there, the 55-day SMA comes into focus at $78.50. The last one comes in at $79.78, just ahead of $80.00, with the 100-day SMA, all residing in a very tight range.
On the downside, a bigger movement could play out. First support comes in at $75.27, but that has been chopped up in July and August so it might have become less relevant. The low from August at $71.17 is the best level for a bounce.
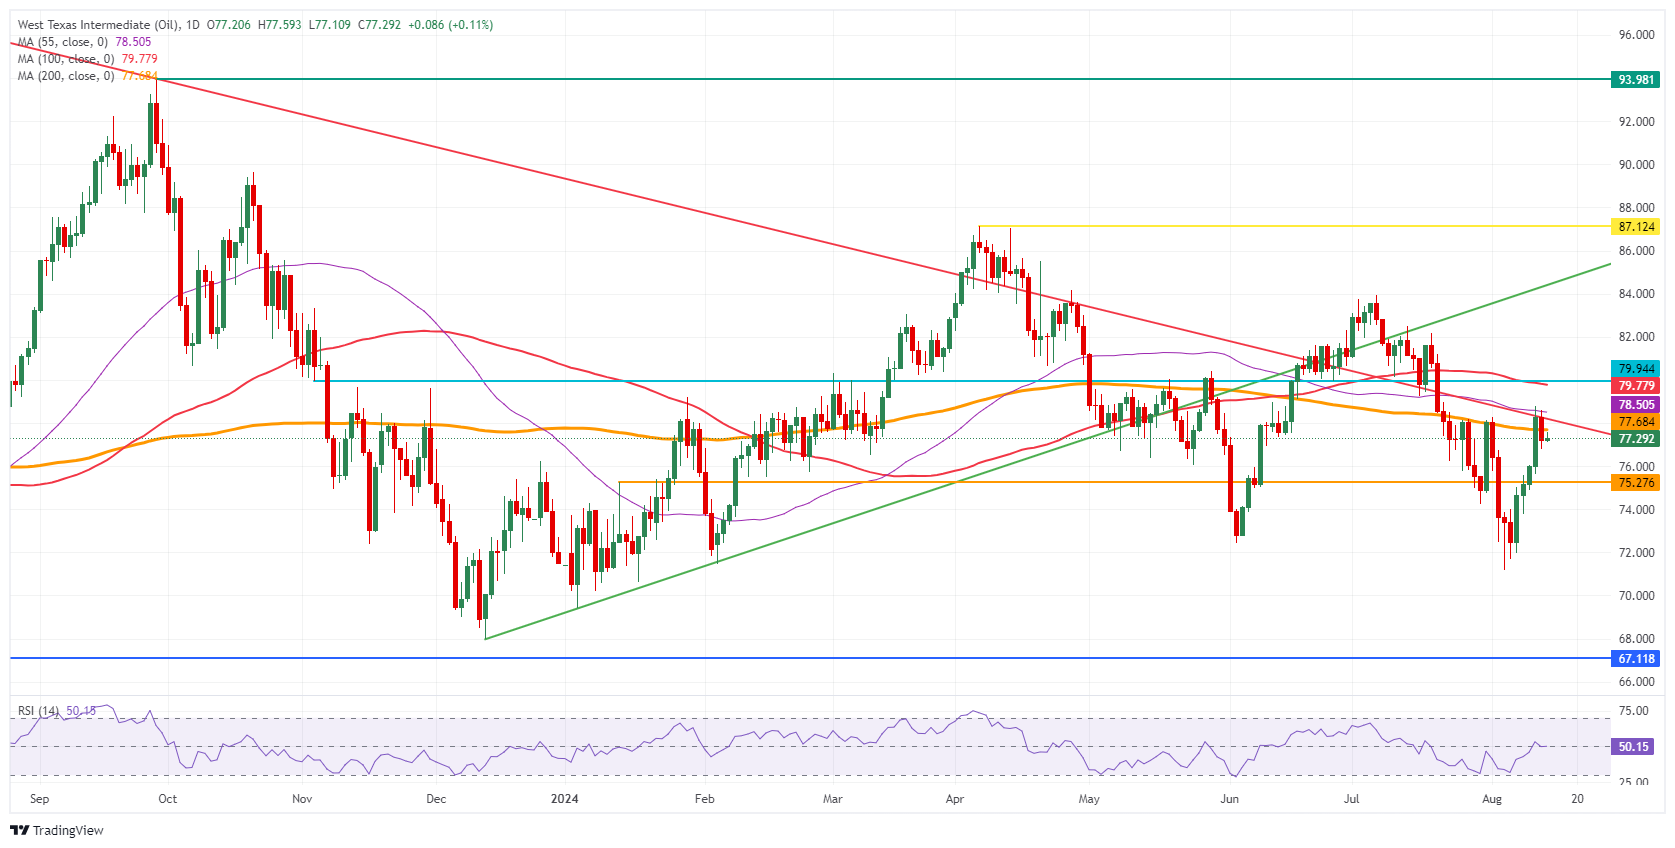
US WTI Crude Oil: Daily Chart
WTI Oil FAQs
WTI Oil is a type of Crude Oil sold on international markets. The WTI stands for West Texas Intermediate, one of three major types including Brent and Dubai Crude. WTI is also referred to as “light” and “sweet” because of its relatively low gravity and sulfur content respectively. It is considered a high quality Oil that is easily refined. It is sourced in the United States and distributed via the Cushing hub, which is considered “The Pipeline Crossroads of the World”. It is a benchmark for the Oil market and WTI price is frequently quoted in the media.
Like all assets, supply and demand are the key drivers of WTI Oil price. As such, global growth can be a driver of increased demand and vice versa for weak global growth. Political instability, wars, and sanctions can disrupt supply and impact prices. The decisions of OPEC, a group of major Oil-producing countries, is another key driver of price. The value of the US Dollar influences the price of WTI Crude Oil, since Oil is predominantly traded in US Dollars, thus a weaker US Dollar can make Oil more affordable and vice versa.
The weekly Oil inventory reports published by the American Petroleum Institute (API) and the Energy Information Agency (EIA) impact the price of WTI Oil. Changes in inventories reflect fluctuating supply and demand. If the data shows a drop in inventories it can indicate increased demand, pushing up Oil price. Higher inventories can reflect increased supply, pushing down prices. API’s report is published every Tuesday and EIA’s the day after. Their results are usually similar, falling within 1% of each other 75% of the time. The EIA data is considered more reliable, since it is a government agency.
OPEC (Organization of the Petroleum Exporting Countries) is a group of 13 Oil-producing nations who collectively decide production quotas for member countries at twice-yearly meetings. Their decisions often impact WTI Oil prices. When OPEC decides to lower quotas, it can tighten supply, pushing up Oil prices. When OPEC increases production, it has the opposite effect. OPEC+ refers to an expanded group that includes ten extra non-OPEC members, the most notable of which is Russia.
After last week's focus on the state of the US labor market, this week inflation is back on the center stage. The US Dollar (USD) already showed some weakness yesterday when the Producer Price Index (PPI) was released, coming in slightly below analysts' expectations. This was partly due to the fact that some components of the PPI are directly included in the calculation of the PCE deflator, which is the Fed's preferred measure of inflation. But the lower-than-expected PPI probably also fueled hopes that today's consumer price data could come in lower than expected, Commerzbank’s FX strategist Volkmar Baur notes.
Risk is more in the direction of a stronger USD
“When this happened last month, it triggered significant market movements. On July 10, the day before the last CPI release, EUR/USD stood at 1.08. At the same time, the two-year Treasury yield was more than 40 basis points higher, and the market was expecting two 25-basis-point rate cuts from the Fed by the end of the year, not four.”
“The risk is probably more in the direction of a stronger USD. The Fed will not consider cutting rates more quickly and aggressively just because inflation is moving faster towards 2%. The current annual rate of around 3% is still too high, even if the monthly rates have been low recently. But, should inflation come in higher than expected, contrary to today's hopes, this would make a 50 basis point move in September rather unlikely.”
“Our economists have recently reiterated that they do not expect a recession in the U.S. in the near term. In that case, I think it is very unlikely that the Fed will move by 50 basis points at one of the three remaining Fed meetings, which is what the market is currently pricing in. And in all likelihood, this pricing out will not be gradual, but tied to a data point. It may not happen today, but it could very well at some point over the next few weeks.”
US PPI inflation depreciated the Dollar Index (DXY) by 0.5% to 102.62. At the time of writing, DXY is trading at 102.47, DBS FX analyst Philip Wee notes.
PPI inflation flat at 0% MoM in July
“A lower-than-expected US PPI inflation depreciated the Dollar Index (DXY) by 0.5% to 102.62, near the 102.69 close on August 5. PPI inflation increased by 0.1% MoM in July vs. the consensus for it to stay unchanged at June’s 0.2%.”
“Excluding food and energy prices, core PPI inflation was flat at 0% MoM in July, less than the 0.2% consensus, while June was revised to 0.3% from 0.4%. The US Treasury 2Y yield fell a second session by 8.8 bps to 3.93%, while the 10Y yield declined less by 6.1 bps to 3.84%.”
“The futures market priced in a 159% chance of the Fed lowering interest rates by 50 bps to 4.75-5.00% at its FOMC meeting on September 18.”
The US Dollar (USD) could continue to decline; the support at 7.1300 is likely out of reach. While downward momentum has been boosted, it is unclear at this time if it is sufficiently enough for USD to break below 7.0635, UOB Group FX analysts Quek Ser Leang and Lee Sue Ann note.
Bears may try to test 7.1300
24-HOUR VIEW: “Our view of sideways trading yesterday was incorrect. Instead of trading sideways, USD plunged, closing sharply lower by 0.41% (7.1490). While severely oversold, USD could continue to decline today. However, the support at 7.1300 is likely out of reach (there is another support level at 7.1410). Resistance is at 7.1580; a breach of 7.1660 would suggest that the weakness has stabilised.”
1-3 WEEKS VIEW: “We have held a negative USD view since late last month (as annotated in the chart below). After USD fell sharply to 7.0636 and rebounded, in our update from last Tuesday (06 Aug, spot at 7.1400), we highlighted that ‘while further USD weakness is not ruled out, the low near 7.0635 is solid support now.’ We added, ‘a breach of 7.2000 would mean that the weakness has stabilised.’ USD subsequently traded sideways, and we noted two days ago (12 Aug, spot at 7.1770) that ‘downward momentum is fading, and the likelihood of USD breaking below 7.0635 has diminished.’ Yesterday, USD fell sharply by 0.41% (7.1490). While downward momentum has been boosted, it is unclear at this time if it is sufficiently enough for USD to break below 7.0635. Nevertheless, the bias remains on the downside as long as 7.1850 (‘strong resistance’ level previously at 7.2000) is not breached.”
- The US Dollar on the backfoot ahead of US CPI for July later on Wednesday.
- Massive risk-on on Tuesday crushed the Greenback across the board.
- The US Dollar index trades in the mid-102.00 range and could trade in another ballpark by the closing bell.
The US Dollar (USD) trades lower again, as measured by the US Dollar Index (DXY), in the European session on Wednesday following a 0.50% decline a day before. The US Dollar snapped under pressure after a massive wave of risk-on pushed US equities higher and sent US yields lower on Tuesday. The biggest reason for that move was weaker Producer Price Index (PPI) data on all fronts and segments in July, which hypes up the upcoming consumer inflation number with elevated expectations of coming in softer than expected.
On the economic data front, the US Consumer Price Index (CPI) for July will be key on Wednesday. If the PPI data from Tuesday holds any relevance, traders will want to gear up for some volatility going into the US CPI number. Ahead of the US data, Europe will release the preliminary Gross Domestic Product (GDP) for the second quarter, which might also move the US Dollar Index.
Daily digest market movers: CPI ahead of Jackson Hole
- Japan must seek a new prime minister as Fumio Kishida does not want to run for a second term.
- The Royal Bank of New Zealand (RBNZ) surprised the market with a 25 basis point interest rate cut during the Asian session on Wednesday and the message that the cutting cycle has started. RBNZ Chairman Adrian Orr even said that a 50 basis point cut was on the table for this meeting. A comment that sent the New Zealand Dollar 1% lower against the US Dollar.
- At 11:00 GMT, the Mortgage Bankers Association (MBA) will release its weekly Mortgage Applications Index for the week ending August 9. The previous week, it was up 6.9%
- At 12:30 GMt, the US consumer inflation data for July will be released:
- Headline monthly CPI inflation is expected to rise by 0.2% in July following the -0.1% the month before. The yearly benchmark is expected to remain at 3.0%.
- Core monthly CPI inflation is expected to increase by 0.2% after the 0.1% in June. The yearly gauge is expected to soften to 3.2% from 3.3%.
- Equity markets are rallying higher in Japan based on the political news that a new prime minister needs to be found. The Topix trades up over 1%, while the Nikkei lags by 0.4%. European equities are up less than 0.5%, while US futures are flat, awaiting the US CPI release.
- The CME Fedwatch Tool shows a 47.5% chance of a 25 basis points (bps) interest rate cut by the Fed in September against a 52.5% chance for a 50 bps cut. Another 25 bps cut (if September is a 25 bps cut) is expected in November by 31.5%, while there is a 50.8% chance that rates will be 75 bps below the current levels and a 17.7% probability of rates being 100 basis points lower.
- The US 10-year benchmark rate trades at 3.84% and slips further away to fresh lows for this week.
US Dollar Index Technical Analysis: Not going quietly
The US Dollar Index (DXY) has moved away from the crucial 103.18 pivotal level following the surprise PPI release on Tuesday. From a technical perspective, a slide below 103.00 suggests more downside should be at hand. The DXY will need to decline further, pulling the Relative Strength Index (RSI) into oversold to see ample support and sending it back up towards 103.00.
A two-tiered recovery can be taken away from the charts, with the first resistance(yes, again, the same level we have been talking about since last week) at 103.18, where the DXY has been unable to hold above in recent days. Once bulls can hold that level and move away from it, 104.00 comes into play. However, further upside is limited as the 200-day Simple Moving Average (SMA) at 104.12 will throw a spanner in the works in the near term.
On the downside, the oversold condition in the Relative Strength Index (RSI) indicator has eased in the daily chart and holds room for a small leg lower. Support nearby is the August 5 low at 102.17. Once through there, pressure will start to build on 102.00 as a big psychological figure before testing 101.90, which was a pivotal level in December 2023 and January 2024.
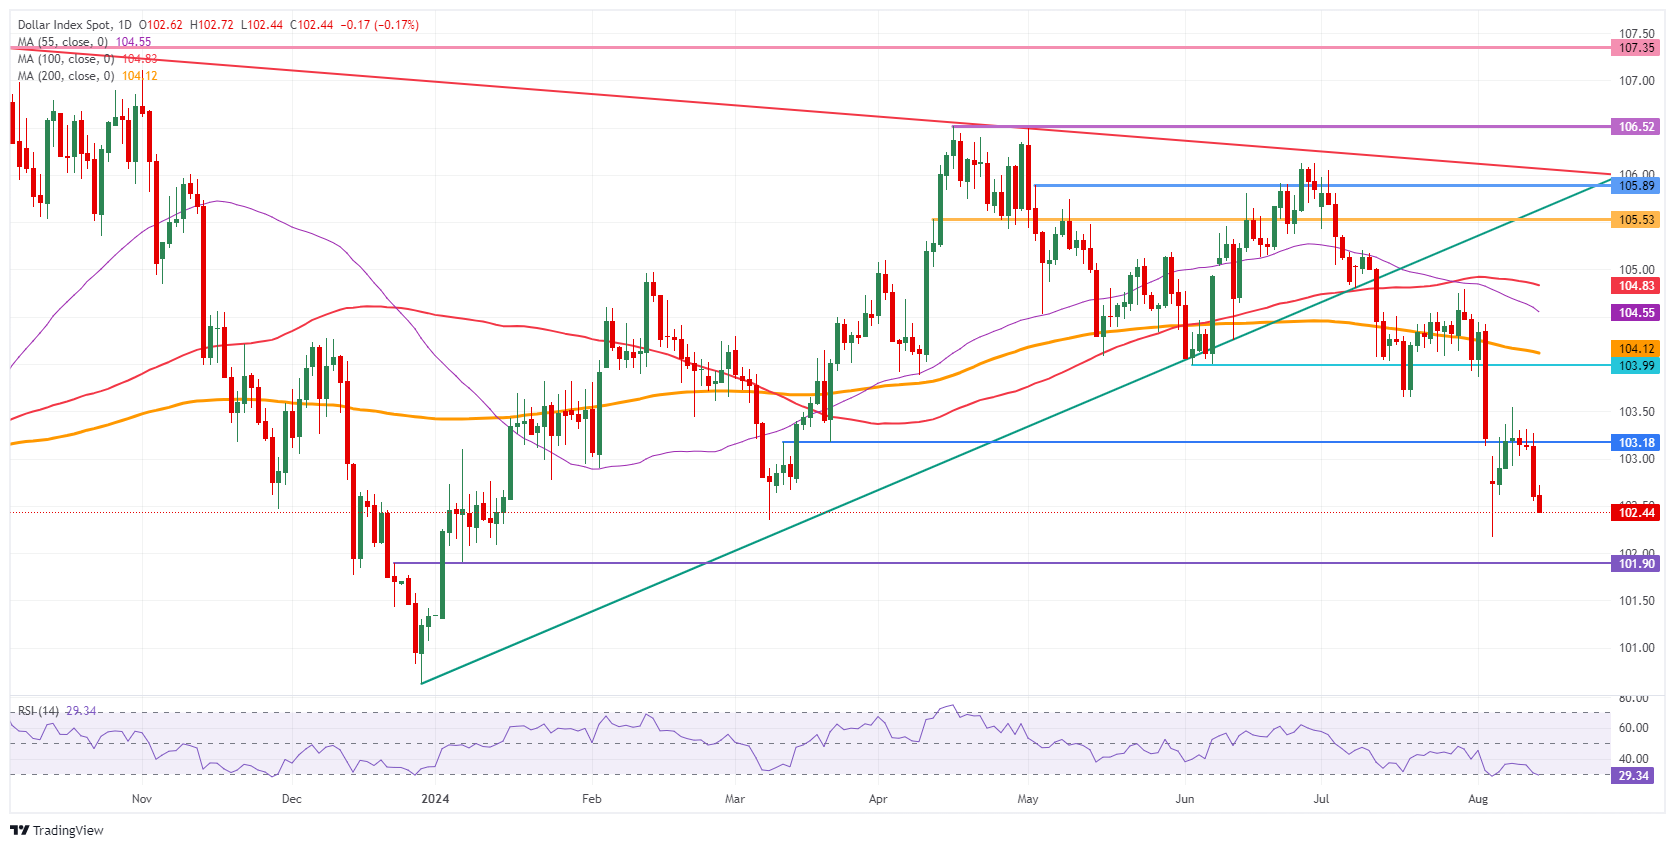
US Dollar Index: Daily Chart
US Dollar FAQs
The US Dollar (USD) is the official currency of the United States of America, and the ‘de facto’ currency of a significant number of other countries where it is found in circulation alongside local notes. It is the most heavily traded currency in the world, accounting for over 88% of all global foreign exchange turnover, or an average of $6.6 trillion in transactions per day, according to data from 2022. Following the second world war, the USD took over from the British Pound as the world’s reserve currency. For most of its history, the US Dollar was backed by Gold, until the Bretton Woods Agreement in 1971 when the Gold Standard went away.
The most important single factor impacting on the value of the US Dollar is monetary policy, which is shaped by the Federal Reserve (Fed). The Fed has two mandates: to achieve price stability (control inflation) and foster full employment. Its primary tool to achieve these two goals is by adjusting interest rates. When prices are rising too quickly and inflation is above the Fed’s 2% target, the Fed will raise rates, which helps the USD value. When inflation falls below 2% or the Unemployment Rate is too high, the Fed may lower interest rates, which weighs on the Greenback.
In extreme situations, the Federal Reserve can also print more Dollars and enact quantitative easing (QE). QE is the process by which the Fed substantially increases the flow of credit in a stuck financial system. It is a non-standard policy measure used when credit has dried up because banks will not lend to each other (out of the fear of counterparty default). It is a last resort when simply lowering interest rates is unlikely to achieve the necessary result. It was the Fed’s weapon of choice to combat the credit crunch that occurred during the Great Financial Crisis in 2008. It involves the Fed printing more Dollars and using them to buy US government bonds predominantly from financial institutions. QE usually leads to a weaker US Dollar.
Quantitative tightening (QT) is the reverse process whereby the Federal Reserve stops buying bonds from financial institutions and does not reinvest the principal from the bonds it holds maturing in new purchases. It is usually positive for the US Dollar.
The US Dollar (USD) is expected to edge lower; given that momentum is not strong, any decline is unlikely to break below 146.00. Otherwise, a breach of 148.30 would mean the weakness in USD has stabilised, UOB Group FX analysts Quek Ser Leang and Lee Sue Ann note.
The closest resistance is at 148.30
24-HOUR VIEW: “Yesterday, we noted ‘there has been no clear increase in either upward or downward momentum.’ We expected USD to ‘continue to trade in a range, probably between 146.50 and 148.00.’ Our view of range trading was not wrong, as USD traded in a range of 146.59/147.94, closing slightly lower by 0.25% (146.82). There has been a slight increase in momentum. Today, we expect USD to edge lower. Given that momentum is not strong, any decline is unlikely to break below 146.00 (minor support is at 146.50). Resistance is at 147.55, followed by 148.00.”
1-3 WEEKS VIEW: “Our update from two days ago (12 Aug, spot at 146.90) remains valid. As highlighted, downward momentum is beginning to wane, and a breach of 148.30 (no change in ‘strong resistance’ level) would mean that the weakness in USD has stabilised.”
Strong momentum suggests further New Zealand Dollar (NZD) strength, even though it is unlikely to be able to reach the significant resistance at 0.6120, UOB Group FX analysts Quek Ser Leang and Lee Sue Ann note.
Closest support is at 0.6005
24-HOUR VIEW: “Although we expected NZD to rise above 0.6035 yesterday, we indicated that ‘it might not be able to maintain a foothold above this level.’ We also indicated that ‘the major resistance at 0.6055 is unlikely to come into view.’ The anticipated NZD strength exceeded our expectations, as it broke above both 0.6035 and 0.6055, soaring to a high of 0.6082. NZD closed on a strong note at 0.6077 (+0.98%). While overbought, strong momentum suggests further NZD strength, even though it is unlikely to be able to reach the significant resistance at 0.6120 (there is another resistance at 0.6100). To keep the momentum going, NZD must not break below 0.6025 (minor support is at 0.6055).”
1-3 WEEKS VIEW: “We turned positive in NZD early this month. As we tracked the advance, in our most recent narrative from two days ago (12 Aug, spot at 0.6000), we highlighted that ‘while NZD could continue to rise, it must break clearly above 0.6035 before an advance to 0.6055 can be expected.’ After trading in a relatively quiet manner for a couple of days, NZD took off yesterday and soared to a high of 0.6082. The price action continues to suggest NZD strength, even though we acknowledge a significant resistance at 0.6120. We will continue to hold a positive NZD view provided that the ‘strong support’ at 0.6005 (level previously at 0.5960) is not breached.”
- AUD/JPY’s upside appears to have stalled near 98.00 ahead of the Australian labor market data for July.
- Fading global risk-aversion has weighed on the Japanese Yen.
- The BoJ is expected to raise its interest rates to 1% by the year-end.
The AUD/JPY pair rises to near 97.87 in Wednesday’s European session. The cross struggles to extend its upside above the immediate resistance of 98.00 as investors have sidelined ahead of the Australian Employment data for July, which will be published on Thursday.
The Aussie Employment report is expected to show that the labor market was added with fresh 26.5K payrolls, lower than June’s reading of 50.2K. The Unemployment Rate is seen steady at 4.1%. Easing labor market conditions would prompt expectations of interest-rate cuts by the Reserve Bank of Australia (RBA) sooner rather than later.
Currently, financial markets expect that the RBA will not reduce its key Official Cash Rate (OCR) this year. Market speculation for the RBA pivoting to interest-rate cuts next year were prompted by RBA Governor Michelle Bullock’s hawkish guidance. Bullock said last week that the central bank is vigilant to inflation risks and interest rates would be hiked further if needed.
Meanwhile, improved market sentiment continues to provide support to the Australian Dollar (AUD). Global risk-appetite improves as fears of a potential United States (US) recession have waned.
On the Japanese Yen (JPY) front, easing widespread risk-aversion has weighed on safe-haven flows to the Yen. The next trigger for the Yen will be the preliminary Q2 Gross Domestic Product (GDP) data, which will be published on Thursday. The Japanese economy is estimated to have grown by 0.5% after contracting at a similar pace in the previous quarter. Upbeat GDP growth would boost speculation for further policy-tightening by the Bank of Japan (BoJ).
In the last monetary policy meeting, the BoJ hiked its interest rates unexpectedly by 25 basis points (bps) and announced plans to taper bond-buying operations. A research note from Danske Bank showed that the BoJ could raise its interest rates to 1% within the coming 12 months.
Japanese Yen FAQs
The Japanese Yen (JPY) is one of the world’s most traded currencies. Its value is broadly determined by the performance of the Japanese economy, but more specifically by the Bank of Japan’s policy, the differential between Japanese and US bond yields, or risk sentiment among traders, among other factors.
One of the Bank of Japan’s mandates is currency control, so its moves are key for the Yen. The BoJ has directly intervened in currency markets sometimes, generally to lower the value of the Yen, although it refrains from doing it often due to political concerns of its main trading partners. The current BoJ ultra-loose monetary policy, based on massive stimulus to the economy, has caused the Yen to depreciate against its main currency peers. This process has exacerbated more recently due to an increasing policy divergence between the Bank of Japan and other main central banks, which have opted to increase interest rates sharply to fight decades-high levels of inflation.
The BoJ’s stance of sticking to ultra-loose monetary policy has led to a widening policy divergence with other central banks, particularly with the US Federal Reserve. This supports a widening of the differential between the 10-year US and Japanese bonds, which favors the US Dollar against the Japanese Yen.
The Japanese Yen is often seen as a safe-haven investment. This means that in times of market stress, investors are more likely to put their money in the Japanese currency due to its supposed reliability and stability. Turbulent times are likely to strengthen the Yen’s value against other currencies seen as more risky to invest in.
Strong momentum is likely to lead to further Australian Dollar (AUD) strength; it remains to be seen if it can break above 0.6660, UOB Group FX analysts Quek Ser Leang and Lee Sue Ann note.
Closest resistance is at 0.6660
24-HOUR VIEW: “Yesterday, we expected AUD to trade in a sideways range of 0.6560/0.6600. Our expectation was incorrect. Instead of trading sideways, AUD soared, closing sharply higher by 0.74% (0.6634). While conditions are overbought, strong momentum is likely to lead to further AUD strength. However, it remains to be seen if it can break above 0.6660. Support is at 0.6615; a breach of 0.6600 would indicate that AUD is not strengthening further.”
1-3 WEEKS VIEW: “Two days ago (12 Aug, spot at 0.6570), we indicated that ‘there has been a slight increase in momentum, but not sufficiently enough to suggest the start of a sustained advance.’ We were of the view that that AUD ‘must break and remain above 0.6600 before further advance can be expected.’ We were also of the view that ‘the chance of AUD breaking clearly above 0.6600 will increase in the next few days provided that 0.6520 (‘strong support’ level) is not breached’ and that ‘if AUD breaks clearly above 0.6600, the next level to watch is 0.6660.’ Yesterday, AUD not only broke clearly above 0.6600, but it also soared further, reaching a high of 0.6638. Upward momentum has increased further, and as mentioned two days ago, the level to focus on is 0.6660. Looking ahead, the next resistance above 0.6660 is a significant level at 0.6700. On the downside, the ‘strong support’ level has moved higher to 0.6580 from 0.6520.”
- Gold is consolidating under chart resistance as falling US yields and a tense geopolitical backdrop support the metal.
- Upside may be limited, however, by overextended positioning.
- The precious metal is at the top of a range-bound consolidation, with the short-term trend biased to extend sideways.
Gold (XAU/USD) trades in the $2,470s on Wednesday as it continues consolidating after its August rally. Falling US bond yields helped stimulate the rally as these are negatively correlated to Gold. Safe-haven flows further support the Yellow Metal due to growing geopolitical concerns emanating from the Middle East and Russia-Ukraine conflict. These haven flows, however, may be capped due to overextended positioning, according to analysts.
Gold boosted by PPI undershoot
Gold gained a shot in the arm after the release of US Producer Price Index (PPI) data on Tuesday. The data showed an overall easing in inflationary conditions and increased expectations that interest rates are poised to fall in the US. Core PPI, in particular, failed to meet expectations.
Additionally, the Reserve Bank of New Zealand (RBNZ) made a surprise 0.25% cut to its policy rate early Wednesday, possibly suggesting interest rates are falling globally. Lower interest rates are positive for Gold because they make it more attractive to investors relative to other assets that pay interest.
Gold is “overbought” and offers limited upside potential
Gold may be limited in terms of its upside potential even if geopolitical risk intensifies, according to TD Securities. This view echoes that of IG Index and Redward Associates which highlighted extreme positioning in the Gold Futures market in a recent report.
“Gold as a safe-haven is not necessarily a compelling proposition,” says Daniel Ghali, Senior Commodity Strategist at TD Securities.
Whilst geopolitical risks from a potential imminent attack by Iran are supporting the Yellow Metal, the effect is limited because investors are already “over-committed”. This was reflected by Gold’s relatively tepid response to the panic selling triggered by the US Nonfarm Payrolls jobs data miss at the beginning of August.
“Not only are macro funds well positioned,” says the strategist, “Systematic trend followers are 'max long', and the bar for outflows continues to inch lower by the day. Asian speculators are also vulnerable, with near-record positions held in precious metals as a currency-depreciation hedge, the driver of which is now unwinding,” he adds.
Asian central banks had been hoarding Gold earlier in the year when the US Dollar (USD) rose following stickier-than-expected US inflation data in the Spring, which derailed Federal Reserve (Fed) rate-cut expectations. This led to an extreme devaluation of Asian FX against USD, and Asian central banks bought Gold as a currency hedge.
“This contrasts sharply with the early-year set-up, which featured a historic underpositioning that ultimately led to strong price performance. As safe-haven flows subside, several speculative cohorts' positions may be vulnerable to a reprice in lofty Fed expectations,” continues Ghali.
Only China’s retail demand remains resilient at the moment, according to the strategist, who says that flows into Chinese Gold ETFs remain strong, however, demand for ETFs outside of China has “resumed its decline”.
Technical Analysis: Gold continues consolidating beneath range ceiling
Gold is consolidating just under the ceiling of a range it has been bouncing up and down since July. The short-term trend is probably sideways and, given “the trend is your friend”, is more likely than not to extend in that direction.
XAU/USD 4-hour Chart
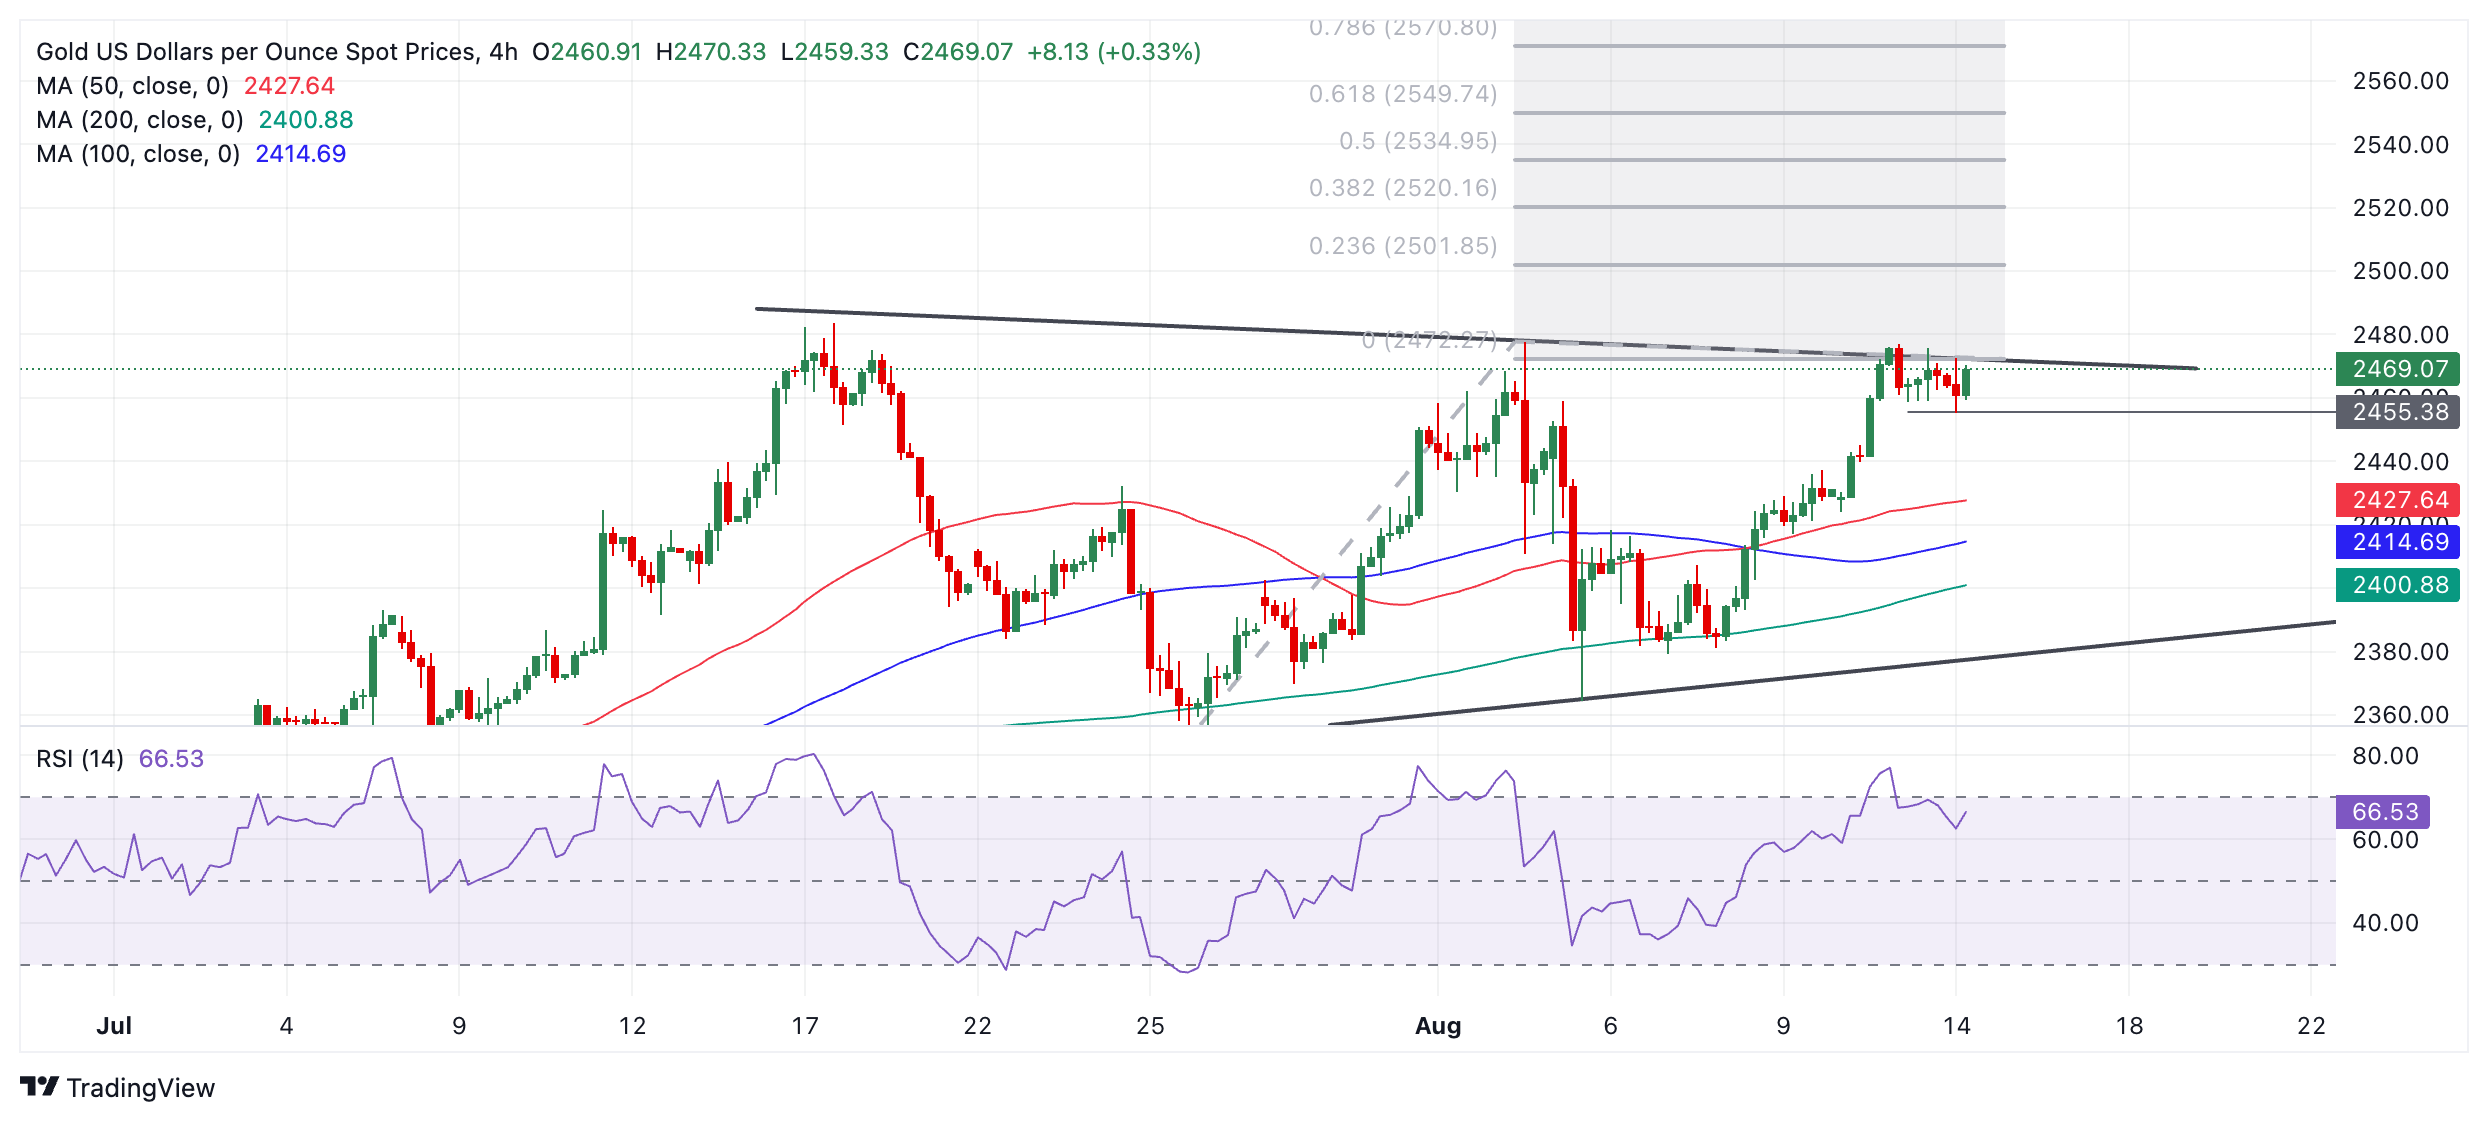
A break below $2,455 on a closing basis would help confirm the start of a fresh down leg within the range, thereby extending the sideways trend. If so, the price will probably move down to $2,400 or perhaps the range floor in the $2,390s. Due to the fact the range is tapering slightly, it might also be a triangle pattern in the final stages of development.
A decisive break above the range ceiling, however, would indicate the development of a more bullish trend. Such a breakout would probably follow through higher to at least $2,550, calculated by taking the 0.618 Fibonacci ratio of the range’s height and extrapolating it higher.
A decisive break would be one characterized by a long green candle that pierced clearly through the level and closed near its high, or three green candles in a row that breached the level.
Economic Indicator
Consumer Price Index (MoM)
Inflationary or deflationary tendencies are measured by periodically summing the prices of a basket of representative goods and services and presenting the data as The Consumer Price Index (CPI). CPI data is compiled on a monthly basis and released by the US Department of Labor Statistics. The MoM figure compares the prices of goods in the reference month to the previous month.The CPI is a key indicator to measure inflation and changes in purchasing trends. Generally, a high reading is seen as bullish for the US Dollar (USD), while a low reading is seen as bearish.
Read more.Next release: Wed Aug 14, 2024 12:30
Frequency: Monthly
Consensus: 0.2%
Previous: -0.1%
Source: US Bureau of Labor Statistics
The US Federal Reserve has a dual mandate of maintaining price stability and maximum employment. According to such mandate, inflation should be at around 2% YoY and has become the weakest pillar of the central bank’s directive ever since the world suffered a pandemic, which extends to these days. Price pressures keep rising amid supply-chain issues and bottlenecks, with the Consumer Price Index (CPI) hanging at multi-decade highs. The Fed has already taken measures to tame inflation and is expected to maintain an aggressive stance in the foreseeable future.
The Pound Sterling (GBP) could break above 1.2900, but it might not be able to maintain a foothold above this level, UOB Group FX analysts Quek Ser Leang and Lee Sue Ann note.
Bears may try to test 1.2780
24-HOUR VIEW: “We did not anticipate GBP to surge yesterday, as it registered its biggest 1-day gain in four months (1.2862, +0.76%). We were expecting sideways trading. While GBP could rise further today and break above 1.2900, oversold conditions suggest it might not be able to maintain a foothold above this level. The next resistance at 1.2950 is unlikely to come into view. On the downside, support levels are at 1.2845 and 1.2820.”
1-3 WEEKS VIEW: “After holding a negative GBP view since late last month, we turned neutral yesterday (13 Aug, spot at 1.2765), indicating that ‘the weakness from late last month has stabilised.’ We expected GBP to ‘trade between 1.2700 and 1.2850 for the time being.’ We did expect GBP to break quickly above 1.2850, as it soared to a high of 1.2873 in NY trade. The price action indicates that instead of trading in a range, GBP is likely to rebound further, potentially to 1.2950. However, note that 1.2900 is also quite a strong resistance level. To keep the momentum going, GBP must not break below 1.2780 (current level of ‘strong support’).”
The Eurozone economy grew by 0..3% in the three months to June of 2024, the second estimate released by Eurostat showed on Wednesday.
The first readout showed that GDP in the old continent expanded by 0.3% in the same period.
The bloc’s GDP rose at an annual rate of 0.6% in Q2 vs. 0.6%, as reported in the initial estimate while aligning with the market expectations.
Meanwhile, the Eurozone Employment Change for Q2 arrived at 0.2% QoQ and 0.8% YoY.
Further, Industrial Production for the 26 nations union in June dropped by 0.1% MoM and 3.9% YoY.
EUR/USD reaction to the Eurozone data
EUR/USD is holding higher ground on the mixed Eurozone data and was last seen trading at 1.1022, up 0.26% on the day.
Euro PRICE Today
The table below shows the percentage change of Euro (EUR) against listed major currencies today. Euro was the strongest against the New Zealand Dollar.
| USD | EUR | GBP | JPY | CAD | AUD | NZD | CHF | |
|---|---|---|---|---|---|---|---|---|
| USD | -0.26% | 0.16% | 0.19% | 0.01% | -0.04% | 1.11% | -0.31% | |
| EUR | 0.26% | 0.41% | 0.44% | 0.25% | 0.27% | 1.35% | -0.05% | |
| GBP | -0.16% | -0.41% | 0.04% | -0.14% | -0.15% | 0.94% | -0.43% | |
| JPY | -0.19% | -0.44% | -0.04% | -0.17% | -0.20% | 0.90% | -0.45% | |
| CAD | -0.01% | -0.25% | 0.14% | 0.17% | -0.03% | 1.08% | -0.28% | |
| AUD | 0.04% | -0.27% | 0.15% | 0.20% | 0.03% | 1.08% | -0.30% | |
| NZD | -1.11% | -1.35% | -0.94% | -0.90% | -1.08% | -1.08% | -1.35% | |
| CHF | 0.31% | 0.05% | 0.43% | 0.45% | 0.28% | 0.30% | 1.35% |
The heat map shows percentage changes of major currencies against each other. The base currency is picked from the left column, while the quote currency is picked from the top row. For example, if you pick the Euro from the left column and move along the horizontal line to the US Dollar, the percentage change displayed in the box will represent EUR (base)/USD (quote).
- NZD/JPY witnessed a dramatic turnaround from a nearly two-week high touched this Wednesday.
- The RBNZ’s surprise rate cut prompts aggressive selling, though a positive risk tone helps limit losses.
- The technical setup favors bearish traders and supports prospects for a further near-term downfall.
The NZD/JPY cross retreated around 150 pips from the 89.50 area, or a nearly two-week high touched earlier this Wednesday in reaction to the Reserve Bank of New Zealand's (RBNZ) surprise 25 basis points (bps) rate cut. Spot prices, however, manage to rebound a few pips from the daily low and trade around mid-0.8800s during the first half of the European session, still down 0.80% for the day.
A generally positive tone around the equity markets, along with diminishing odds of the Bank of Japan (BoJ) hiking interest rates again this year, undermines the safe-haven Japanese Yen (JPY) and offers some support to the NZD/JPY cross. That said, any meaningful recovery still seems elusive in the wake of the RBNZ's dovish tilt, indicating more cuts over the coming months in the wake of the recent progress towards meeting the annual inflation target and weaker domestic economic growth.
From a technical perspective, the NZD/JPY cross once again failed to make it through the 38.2% Fibonacci retracement level of the July-August fall. The said barrier is pegged around the 89.10-89.15 region and is followed by the daily high, around the 89.50 area. A sustained strength beyond the latter will be seen as a fresh trigger for bullish traders and set the stage for the resumption of the recent strong recovery from the vicinity of the 83.00 mark, or the lowest level since May 2023 touched last week.
The NZD/JPY cross might then aim to surpass the 90.00 psychological mark and climb further towards the next relevant hurdle near the 90.50-90.55 region. The momentum could extend further towards the 50% Fibo. level, around the 91.00 mark, which could act as a strong barrier and cap the upside for spot prices.
Meanwhile, oscillators on the daily chart are holding deep in negative territory and have also recovered from the oversold zone. This, in turn, suggests that any meaningful positive move might still be seen as a selling opportunity and runs the risk of fizzling out rather quickly. That said, bearish traders are likely to wait for a convincing break below the 88.00 mark before placing fresh bets. The NZD/JPY cross might then turn vulnerable to test sub-87.00 levels, or the 23.6% Fibo. level support.
NZD/JPY daily chart
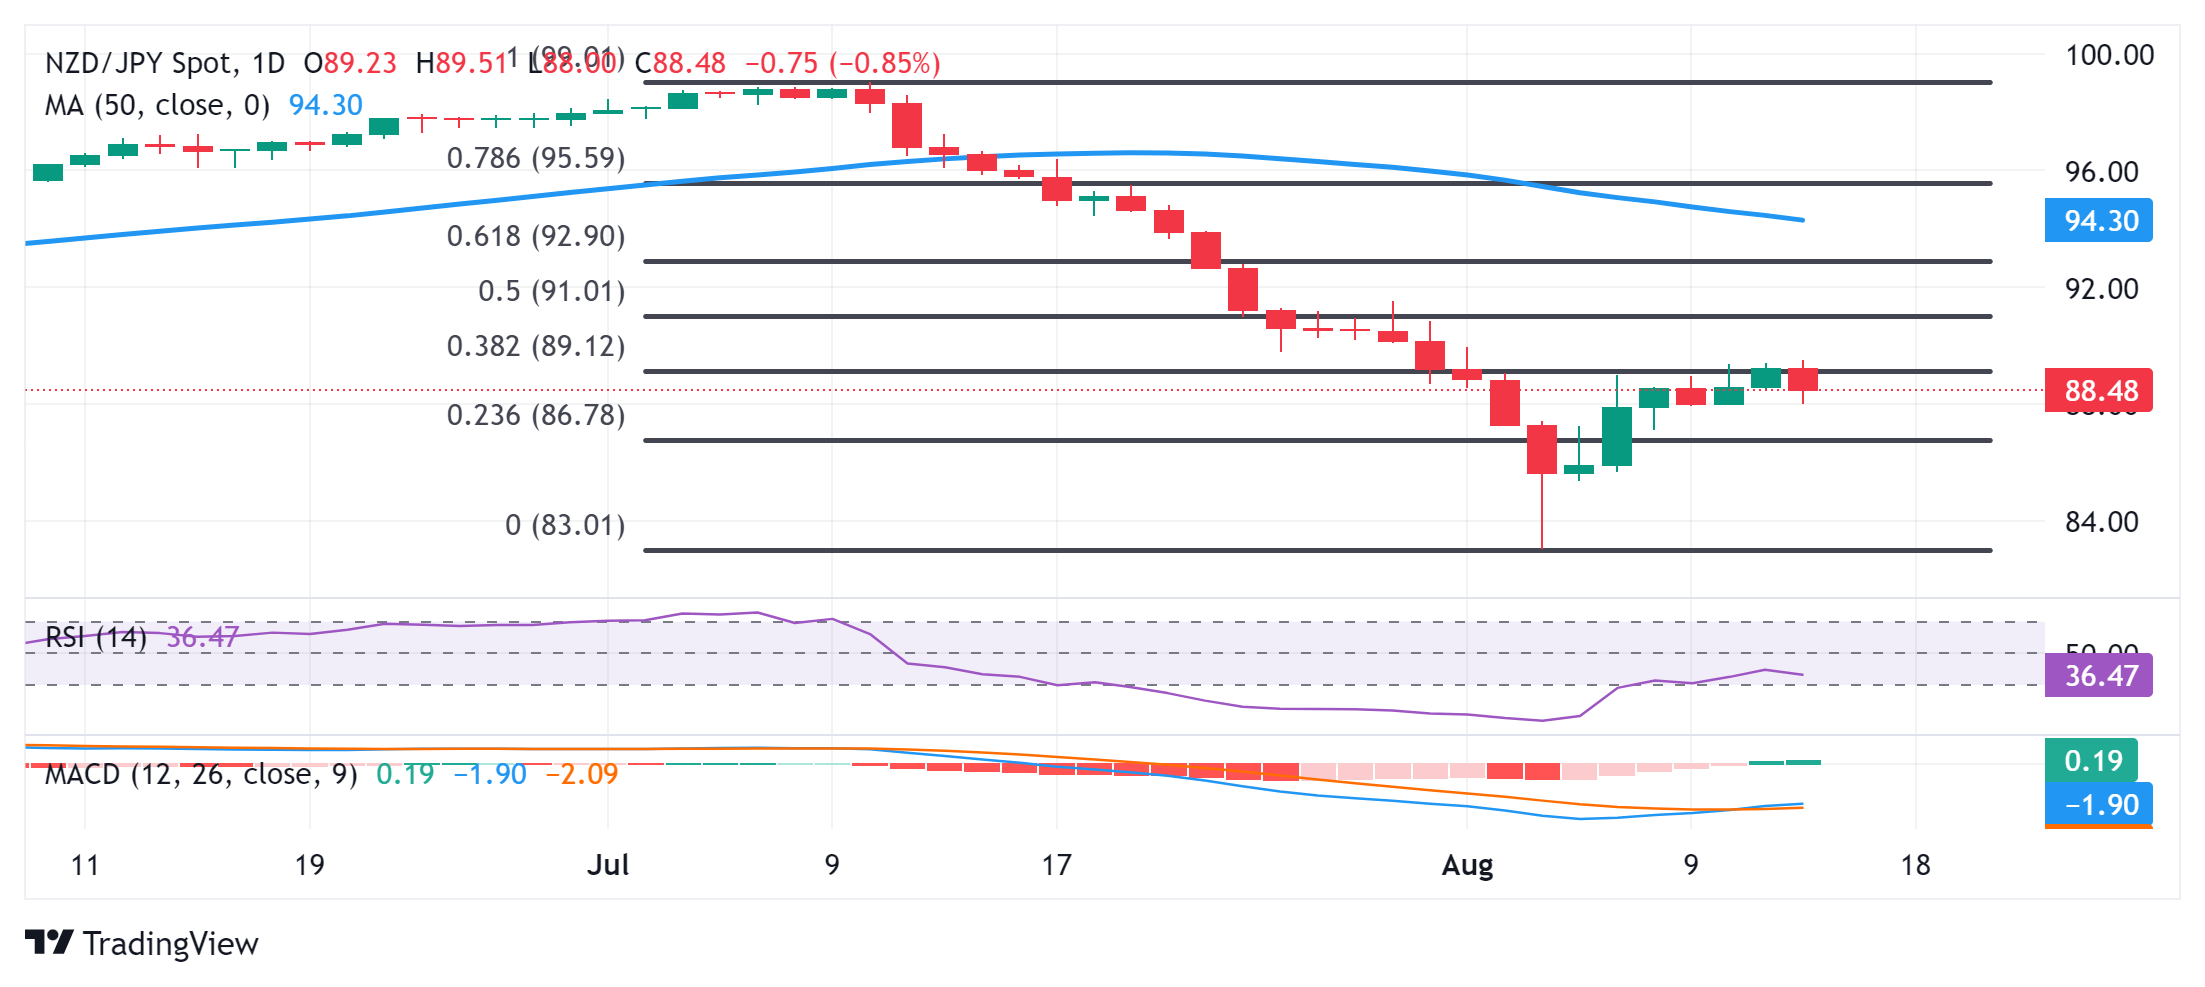
New Zealand Dollar FAQs
The New Zealand Dollar (NZD), also known as the Kiwi, is a well-known traded currency among investors. Its value is broadly determined by the health of the New Zealand economy and the country’s central bank policy. Still, there are some unique particularities that also can make NZD move. The performance of the Chinese economy tends to move the Kiwi because China is New Zealand’s biggest trading partner. Bad news for the Chinese economy likely means less New Zealand exports to the country, hitting the economy and thus its currency. Another factor moving NZD is dairy prices as the dairy industry is New Zealand’s main export. High dairy prices boost export income, contributing positively to the economy and thus to the NZD.
The Reserve Bank of New Zealand (RBNZ) aims to achieve and maintain an inflation rate between 1% and 3% over the medium term, with a focus to keep it near the 2% mid-point. To this end, the bank sets an appropriate level of interest rates. When inflation is too high, the RBNZ will increase interest rates to cool the economy, but the move will also make bond yields higher, increasing investors’ appeal to invest in the country and thus boosting NZD. On the contrary, lower interest rates tend to weaken NZD. The so-called rate differential, or how rates in New Zealand are or are expected to be compared to the ones set by the US Federal Reserve, can also play a key role in moving the NZD/USD pair.
Macroeconomic data releases in New Zealand are key to assess the state of the economy and can impact the New Zealand Dollar’s (NZD) valuation. A strong economy, based on high economic growth, low unemployment and high confidence is good for NZD. High economic growth attracts foreign investment and may encourage the Reserve Bank of New Zealand to increase interest rates, if this economic strength comes together with elevated inflation. Conversely, if economic data is weak, NZD is likely to depreciate.
The New Zealand Dollar (NZD) tends to strengthen during risk-on periods, or when investors perceive that broader market risks are low and are optimistic about growth. This tends to lead to a more favorable outlook for commodities and so-called ‘commodity currencies’ such as the Kiwi. Conversely, NZD tends to weaken at times of market turbulence or economic uncertainty as investors tend to sell higher-risk assets and flee to the more-stable safe havens.
The Euro (EUR) is expected to move higher and could break above last week’s high near 1.1010; the next resistance at 1.1050 is likely out of reach. After that, the next level to watch is 1.1070, UOB Group FX analysts Quek Ser Leang and Lee Sue Ann note.
The next resistance is at 1.1050
24-HOUR VIEW: “Yesterday, we detected ‘a slight increase in momentum.’ We expected EUR to edge higher, but we noted that ‘as upward momentum is not strong for now, any advance is unlikely to break the resistance at 1.0960.’ Our view of a higher EUR was not wrong, but we did not anticipate the sudden lift-off that sent it soaring by 0.56% (NY close of 1.0992). We continue to expect EUR to move higher today, and while it could break above last week’s high near 1.1010, overbought conditions suggest that the next resistance at 1.1050 is likely out of reach. To maintain the strong momentum, EUR must not break below 1.0955 with minor support at 1.0975.”
1-3 WEEKS VIEW: “We turned positive EUR early last week. After EUR soared to 1.1008 and pulled back, we indicated last Tuesday (06 Aug, spot at 1.0955) that EUR ‘is still positive, but it has to surpass 1.1010 before further advance to 1.1070 can be expected.’ EUR subsequently traded sideways, and in our most recent narrative from two days ago (12 Aug, spot at 1.0915), we indicated that ‘if EUR breaches the ‘strong support’ level at 1.0875, it would mean the likelihood of it rising to 1.1010 has faded.’ EUR did not breach 1.0875. Instead, it took off and surged to a high of 1.0999 yesterday. Upward momentum has been rejuvenated, and a break of 1.1010 would not be surprising. The next level to watch is 1.1070. Overall, we will continue to hold a positive EUR view as long as 1.0925 (‘strong support’ level previously at 1.0875) is not breached.”
The PBoC faces difficult trade-offs among growth, currency and financial stability goals. Growth appears to be the priority near-term; we see more RRR and rate cuts in the pipeline. Pressure on CNY may rise in case of a renewed trade war, despite recent respite on Fed cut expectations. Interventions in the CGB market are likely to give way to prudential measures to curb financial risks, Standard Chartered economists Shuang Ding and Hunter Chan note.
Limited scope for CNY depreciation
“The People’s Bank of China (PBoC) has multiple goals and when these goals conflict with each other, the central bank has to prioritise some while keeping deviation of the other goals within tolerable ranges. Following the surprise rate cut in July, we expect more monetary easing in the near future, together with faster fiscal spending and housing destocking, to prevent growth from falling significantly below 5%.”
“While the Chinese yuan (CNY) has recently recovered earlier losses relative to the USD due to expectations of faster Fed rate cuts and narrowing rate differentials, the currency may come under pressure again if Trump wins the November election and implements a 60% tariff on China’s imports. We see limited scope for CNY depreciation in that case, as the benefit of a large devaluation appears elusive while capital outflow risk is likely to be instantaneous.”
“With long-term central government bond (CGB) yields declining sharply, the PBoC has become increasingly concerned that smaller banks with large CGB exposures could suffer heavy mark-to-market losses when yields rebound. We expect the central bank to shift to prudential measures to address duration mismatches of smaller banks, as direct market interventions are costly and tend to create distortions.”
- Silver price faces immediate resistance around the 14-day EMA at $28.00 level.
- The daily chart analysis indicates a breakout above a descending triangle, suggesting a potential bullish trend reversal.
- The upper boundary of the descending triangle around the $27.75 level acts as immediate support.
Silver price (XAG/USD) price retraces its recent gains, trading around $27.90 per troy ounce during the European session on Wednesday. The analysis of the daily chart shows a breakout above a descending triangle pattern, which is considered a positive signal. This breakout suggests that the market may be shifting from a bearish to a bullish bias.
Additionally, the 14-day Relative Strength Index (RSI) is consolidating below 50 level, suggesting a downward trend. A break above the 50 level would indicate the emergence of an upward trend.
Additionally, the Moving Average Convergence Divergence (MACD) line has crossed above the signal line, suggesting a potential bullish signal. However, since both lines remain below the centerline (zero line), this indicates that the overall trend is still bearish. It might be wise to wait for further confirmation before making any significant trading decisions.
In terms of support, the Silver price is testing the upper boundary of the descending triangle around the $27.75 level. A return to the descending triangle would reinforce the bearish bias and push the metal asset to navigate the region around the $26.60 level, followed by May’s low at the $26.02 level.
On the upside, the Silver price tests an immediate resistance around the 14-day Exponential Moving Average (EMA) at the $28.00 level, followed by the “throwback support turned resistance” at the $28.60 level. A breakthrough above the latter could lead the XAG/USD pair to explore the region around the two-month high at the $31.75 level.
XAG/USD: Daily Chart
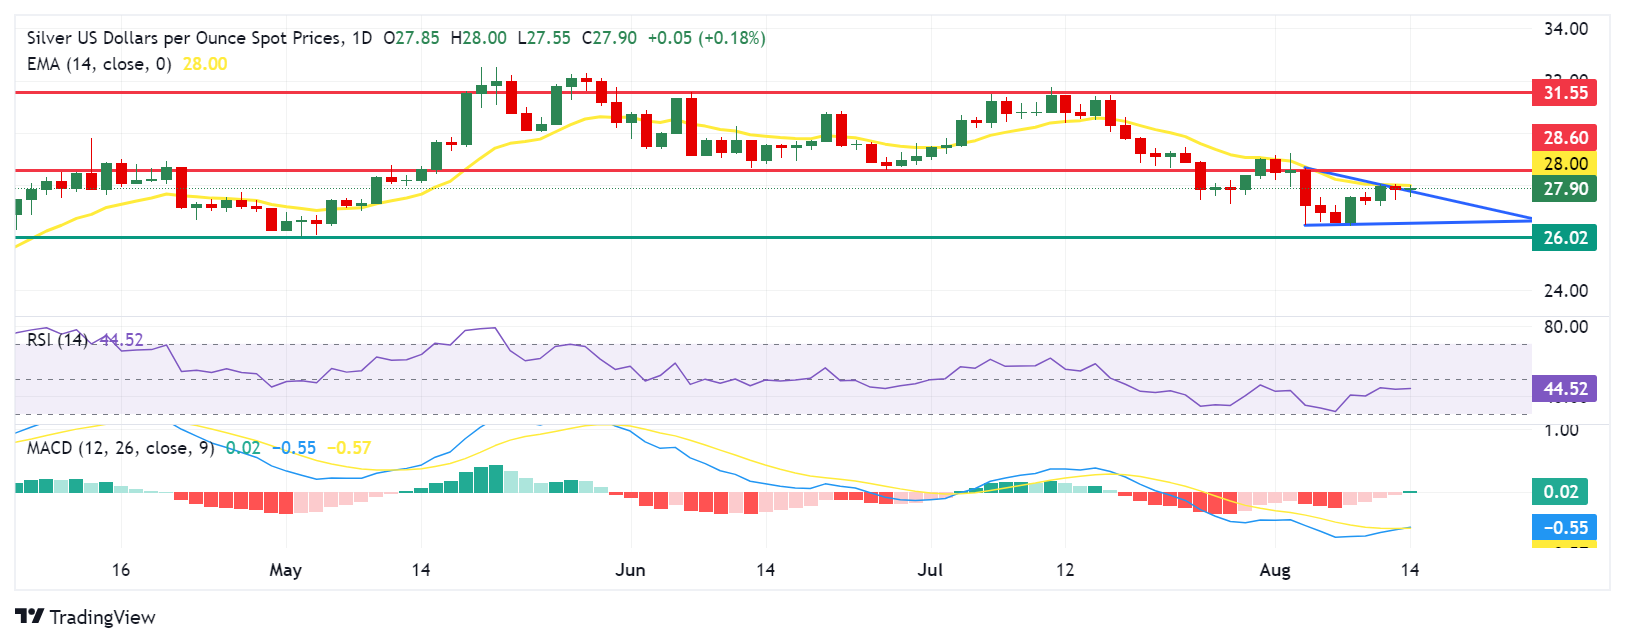
Silver FAQs
Silver is a precious metal highly traded among investors. It has been historically used as a store of value and a medium of exchange. Although less popular than Gold, traders may turn to Silver to diversify their investment portfolio, for its intrinsic value or as a potential hedge during high-inflation periods. Investors can buy physical Silver, in coins or in bars, or trade it through vehicles such as Exchange Traded Funds, which track its price on international markets.
Silver prices can move due to a wide range of factors. Geopolitical instability or fears of a deep recession can make Silver price escalate due to its safe-haven status, although to a lesser extent than Gold's. As a yieldless asset, Silver tends to rise with lower interest rates. Its moves also depend on how the US Dollar (USD) behaves as the asset is priced in dollars (XAG/USD). A strong Dollar tends to keep the price of Silver at bay, whereas a weaker Dollar is likely to propel prices up. Other factors such as investment demand, mining supply – Silver is much more abundant than Gold – and recycling rates can also affect prices.
Silver is widely used in industry, particularly in sectors such as electronics or solar energy, as it has one of the highest electric conductivity of all metals – more than Copper and Gold. A surge in demand can increase prices, while a decline tends to lower them. Dynamics in the US, Chinese and Indian economies can also contribute to price swings: for the US and particularly China, their big industrial sectors use Silver in various processes; in India, consumers’ demand for the precious metal for jewellery also plays a key role in setting prices.
Silver prices tend to follow Gold's moves. When Gold prices rise, Silver typically follows suit, as their status as safe-haven assets is similar. The Gold/Silver ratio, which shows the number of ounces of Silver needed to equal the value of one ounce of Gold, may help to determine the relative valuation between both metals. Some investors may consider a high ratio as an indicator that Silver is undervalued, or Gold is overvalued. On the contrary, a low ratio might suggest that Gold is undervalued relative to Silver.
- EUR/USD exhibits sheer strength near 1.1000 as the US Dollar weakens as Fed rate-cut bets increase.
- The Euro gains on expectations that the ECB will cut interest rates more gradually.
- Investors await the US inflation data for fresh guidance on interest rates.
EUR/USD clings to gains around the psychological resistance of 1.1000 in Wednesday’s European session, its highest level in around seven months. The major currency pair strengthens as the near-term outlook of the US Dollar (USD) is subdued due to firm speculation that the Federal Reserve (Fed) will start reducing interest rates in September.
The US Dollar Index (DXY), which tracks the Greenback’s value against six major currencies, hovers near a weekly low at 102.55.
Market expectations for Fed interest rate cuts in September strengthened further after the United States (US) Producer Price Index (PPI) report for July indicated that price pressures are on track to return to the desired rate of 2%. Headline and core PPI, which strips of volatile food and energy items, softened on a monthly as well as annual basis. This suggests that producers are losing pricing power due to deteriorating demand conditions.
On the interest rate guidance, Atlanta Fed Bank President Raphael Bostic said on Tuesday that recent has increased its confidence that inflation will return to 2% but he wants a little more evidence to endorse interest rate cuts.
For more evidence, market participants will focus on the US Consumer Price Index (CPI) data for July, which will be published at 12:30 GMT. The CPI report is expected to show that monthly headline and core inflation rose by 0.2%. Annual headline and core CPI are estimated to have decelerated by one-tenth to 2.9% and 3.2%, respectively.
A soft inflation reading would boost expectations for Fed interest rate cuts. Also, it can improve speculation that the Fed will reduce its key borrowing rates aggressively. On the contrary, hot inflation numbers would dampen the same.
Daily digest market movers: EUR/USD strengthens on firm Euro
- EUR/USD reclaims a seven-month high of slightly above 1.1000 in Wednesday’s European session. The major currency pair is upbeat due to the outperformance of the Euro (EUR) against its major peers. The Euro performs strongly on expectations that the European Central Bank (ECB) will cut its key borrowing rates further, although in a gradual manner.
- The ECB started its policy-easing cycle in June after officials gained confidence that price pressures will return to bank’s target of 2% in 2025. However, policymakers continued to refrain from committing a pre-defined interest-rate cut approach as they worry that an aggressive expansionary monetary policy stance could re-accelerate inflation again.
- A Reuters poll carried out between August 8-13 showed that over 80% of respondents expect the ECB to cut interest rates two more times this year, one in September and the other in December.
- On the economic front, investors await the revised estimates of flash Q2 Gross Domestic Product (GDP) and Employment Change data for the Eurozone, which will be published at 09:00 GMT. The Eurozone economy is anticipated to have expanded by 0.3%, in line with flash figures and the growth rate recorded in the first quarter of this year. Meanwhile, the Employment Change, a percentage measure that shows an increase in fresh payrolls, is seen rising at a slower pace of 0.2% from the prior release of 0.3%.
- Usually, the impact of revised estimates remains light, but its influence could be high on the Euro due to the absence of top-tier economic data in case there are any big revisions.
Euro Price Today:
Euro PRICE Today
The table below shows the percentage change of Euro (EUR) against listed major currencies today. Euro was the strongest against the New Zealand Dollar.
| EUR | USD | GBP | JPY | CAD | AUD | NZD | CHF | |
|---|---|---|---|---|---|---|---|---|
| EUR | 0.14% | 0.34% | 0.41% | 0.17% | 0.27% | 1.34% | -0.12% | |
| USD | -0.14% | 0.19% | 0.25% | 0.04% | 0.05% | 1.21% | -0.26% | |
| GBP | -0.34% | -0.19% | 0.08% | -0.15% | -0.08% | 1.01% | -0.43% | |
| JPY | -0.41% | -0.25% | -0.08% | -0.20% | -0.14% | 0.94% | -0.46% | |
| CAD | -0.17% | -0.04% | 0.15% | 0.20% | 0.06% | 1.16% | -0.26% | |
| AUD | -0.27% | -0.05% | 0.08% | 0.14% | -0.06% | 1.06% | -0.38% | |
| NZD | -1.34% | -1.21% | -1.01% | -0.94% | -1.16% | -1.06% | -1.40% | |
| CHF | 0.12% | 0.26% | 0.43% | 0.46% | 0.26% | 0.38% | 1.40% |
The heat map shows percentage changes of major currencies against each other. The base currency is picked from the left column, while the quote currency is picked from the top row. For example, if you pick the Euro from the left column and move along the horizontal line to the US Dollar, the percentage change displayed in the box will represent EUR (base)/USD (quote).
Technical Analysis: EUR/USD refreshes seven-month high slightly above 1.1000

EUR/USD posts a fresh seven-month high above 1.1000. The major currency pair strengthens after a breakout of the Channel formation on a daily time frame. The upward-sloping 20-day Exponential Moving Average (EMA) near 1.0900 suggests that the near-term outlook of the shared currency pair is bullish.
The 14-day Relative Strength Index (RSI) jumps into the 60.00-80.00 range, indicating that the momentum has leaned to the upside.
On the upside, the August 10, 2023, high at 1.1065 and the round-level resistance of 1.1100 will act as a major barricade for the Euro bulls.
Alternatively, a downside move below August 1 low at 1.0777 would drag the asset toward February low near 1.0700. A breakdown below the latter would expose it to the June 14 low at 1.0667.
Euro FAQs
The Euro is the currency for the 20 European Union countries that belong to the Eurozone. It is the second most heavily traded currency in the world behind the US Dollar. In 2022, it accounted for 31% of all foreign exchange transactions, with an average daily turnover of over $2.2 trillion a day. EUR/USD is the most heavily traded currency pair in the world, accounting for an estimated 30% off all transactions, followed by EUR/JPY (4%), EUR/GBP (3%) and EUR/AUD (2%).
The European Central Bank (ECB) in Frankfurt, Germany, is the reserve bank for the Eurozone. The ECB sets interest rates and manages monetary policy. The ECB’s primary mandate is to maintain price stability, which means either controlling inflation or stimulating growth. Its primary tool is the raising or lowering of interest rates. Relatively high interest rates – or the expectation of higher rates – will usually benefit the Euro and vice versa. The ECB Governing Council makes monetary policy decisions at meetings held eight times a year. Decisions are made by heads of the Eurozone national banks and six permanent members, including the President of the ECB, Christine Lagarde.
Eurozone inflation data, measured by the Harmonized Index of Consumer Prices (HICP), is an important econometric for the Euro. If inflation rises more than expected, especially if above the ECB’s 2% target, it obliges the ECB to raise interest rates to bring it back under control. Relatively high interest rates compared to its counterparts will usually benefit the Euro, as it makes the region more attractive as a place for global investors to park their money.
Data releases gauge the health of the economy and can impact on the Euro. Indicators such as GDP, Manufacturing and Services PMIs, employment, and consumer sentiment surveys can all influence the direction of the single currency. A strong economy is good for the Euro. Not only does it attract more foreign investment but it may encourage the ECB to put up interest rates, which will directly strengthen the Euro. Otherwise, if economic data is weak, the Euro is likely to fall. Economic data for the four largest economies in the euro area (Germany, France, Italy and Spain) are especially significant, as they account for 75% of the Eurozone’s economy.
Another significant data release for the Euro is the Trade Balance. This indicator measures the difference between what a country earns from its exports and what it spends on imports over a given period. If a country produces highly sought after exports then its currency will gain in value purely from the extra demand created from foreign buyers seeking to purchase these goods. Therefore, a positive net Trade Balance strengthens a currency and vice versa for a negative balance.
- The Mexican Peso rises in its key pairs after USD and GBP are pressured by weak inflation prints.
- GBP/EUR might see volatility when Eurozone GDP data is released on Wednesday.
- Banxico will probably cut interest rates gradually, according to Capital Economics.
The Mexican Peso (MXN) is trading between a third and half of a percent higher in its key trading pairs on Wednesday, as firmer risk appetite supports emerging market FX.
Investor spirits lifted after lower US factory-gate inflation led to a rally in US stocks on Tuesday. Across the pond in the UK, inflation data on Wednesday morning reveals that prices grew less than expected. This is weighing on the Pound Sterling (GBP), with GBP/MXN down 0.50% at the time of publication.
At the time of writing, one US Dollar (USD) buys 18.98 Mexican Pesos, EUR/MXN trades at 20.87, and GBP/MXN at 24.35.
Mexican Peso trades higher as key counterparts fall on data
The Mexican Peso trades higher in its most traded pairs on Wednesday, supported by an overall risk-on mood in financial markets. Tuesday’s US Producer Price Index (PPI) data showed factory-gate prices easing overall, solidifying expectations of the Federal Reserve (Fed) entering a new era of rate-cutting in September. With US borrowing costs expected to fall, US stock indices rallied, helping risk-sensitive emerging market FX like the Peso.
The Mexican Peso is performing particularly well against the Pound on Wednesday as GBP weakens following the release of mostly lower-than-expected UK inflation data. The data increases the probability of the Bank of England (BoE) cutting interest rates, which is negative for GBP since that will likely lower foreign capital inflows. The UK Consumer Price Index (CPI) fell 0.2% in July on month after gaining 0.1% in June. It came out at 2.2% year-over-year, undershooting expectations of 2.3% but higher than the 2.0% registered in June.
UK PPI was mixed, and the Retail Price Index was lower month-over-month (0.1% versus 0.2% previously) but higher YoY at 3.6% versus the 2.9% previously.
Next on Wednesday’s calendar is the Eurozone preliminary Gross Domestic Product (GDP) reading for Q2 and then later, during the US session, the US CPI reading for July. Both these may impact key Peso pairs.
Banxico to adopt gradual approach to cutting interest rates – Capital Economics
The Banxico has cut its main policy interest rate twice in 2024, once by 0.25% in March and by 0.25% in August, bringing the Banxico policy rate down to 10.75%.
The August cut came as a surprise as headline inflation remained elevated at 5.57%, but according to the Banxico Governor, Victoria Rodriguez Ceja, the decision was based on the expectation that headline inflation would come down eventually. Core prices in Mexico are much lower at 4.05% in July, its eighteenth straight month of declines.
“We expect these effects of the shocks that we observe in non-core inflation to be transitory, so we are still expecting headline inflation to return to its target at the same time, at the end of 2025,” said Rodriguez Ceja in an interview with El Financiero.
Economists at Capital Economics, however, argue that inflation in Mexico will fall only gradually because of stubbornly high dwelling inflation. This is due to a combination of lack of housing stock supply and continued rising household income.
“Housing inflation has become an increasingly important driver of core services inflation in Mexico – a key concern of the central bank, Banxico. And we think that robust household income growth and a lack of supply of dwellings will keep housing and, by extension, headline inflation higher than most expect in the next couple of years. This supports our view that Banxico’s easing cycle will be very gradual and that interest rates will stay high by past standards,” says Kimberley Sperrfechter, Emerging Markets Economist at Capital Economics.
A more gradual approach to cutting interest rates would probably keep them higher in Mexico compared to counterparts. This would support the Mexican Peso, since it will favor foreign capital inflows into the currency, given it offers higher interest rate returns to investors.
Technical Analysis: USD/MXN unfolds weak correction higher
USD/MXN is broadly rising in a channel. Since the August 5 peak of 20.07 it has been unfolding a down wave within the rising channel. That down leg bottomed at 18.77 on August 9. Since then the pair has been correcting higher.
USD/MXN 4-hour Chart
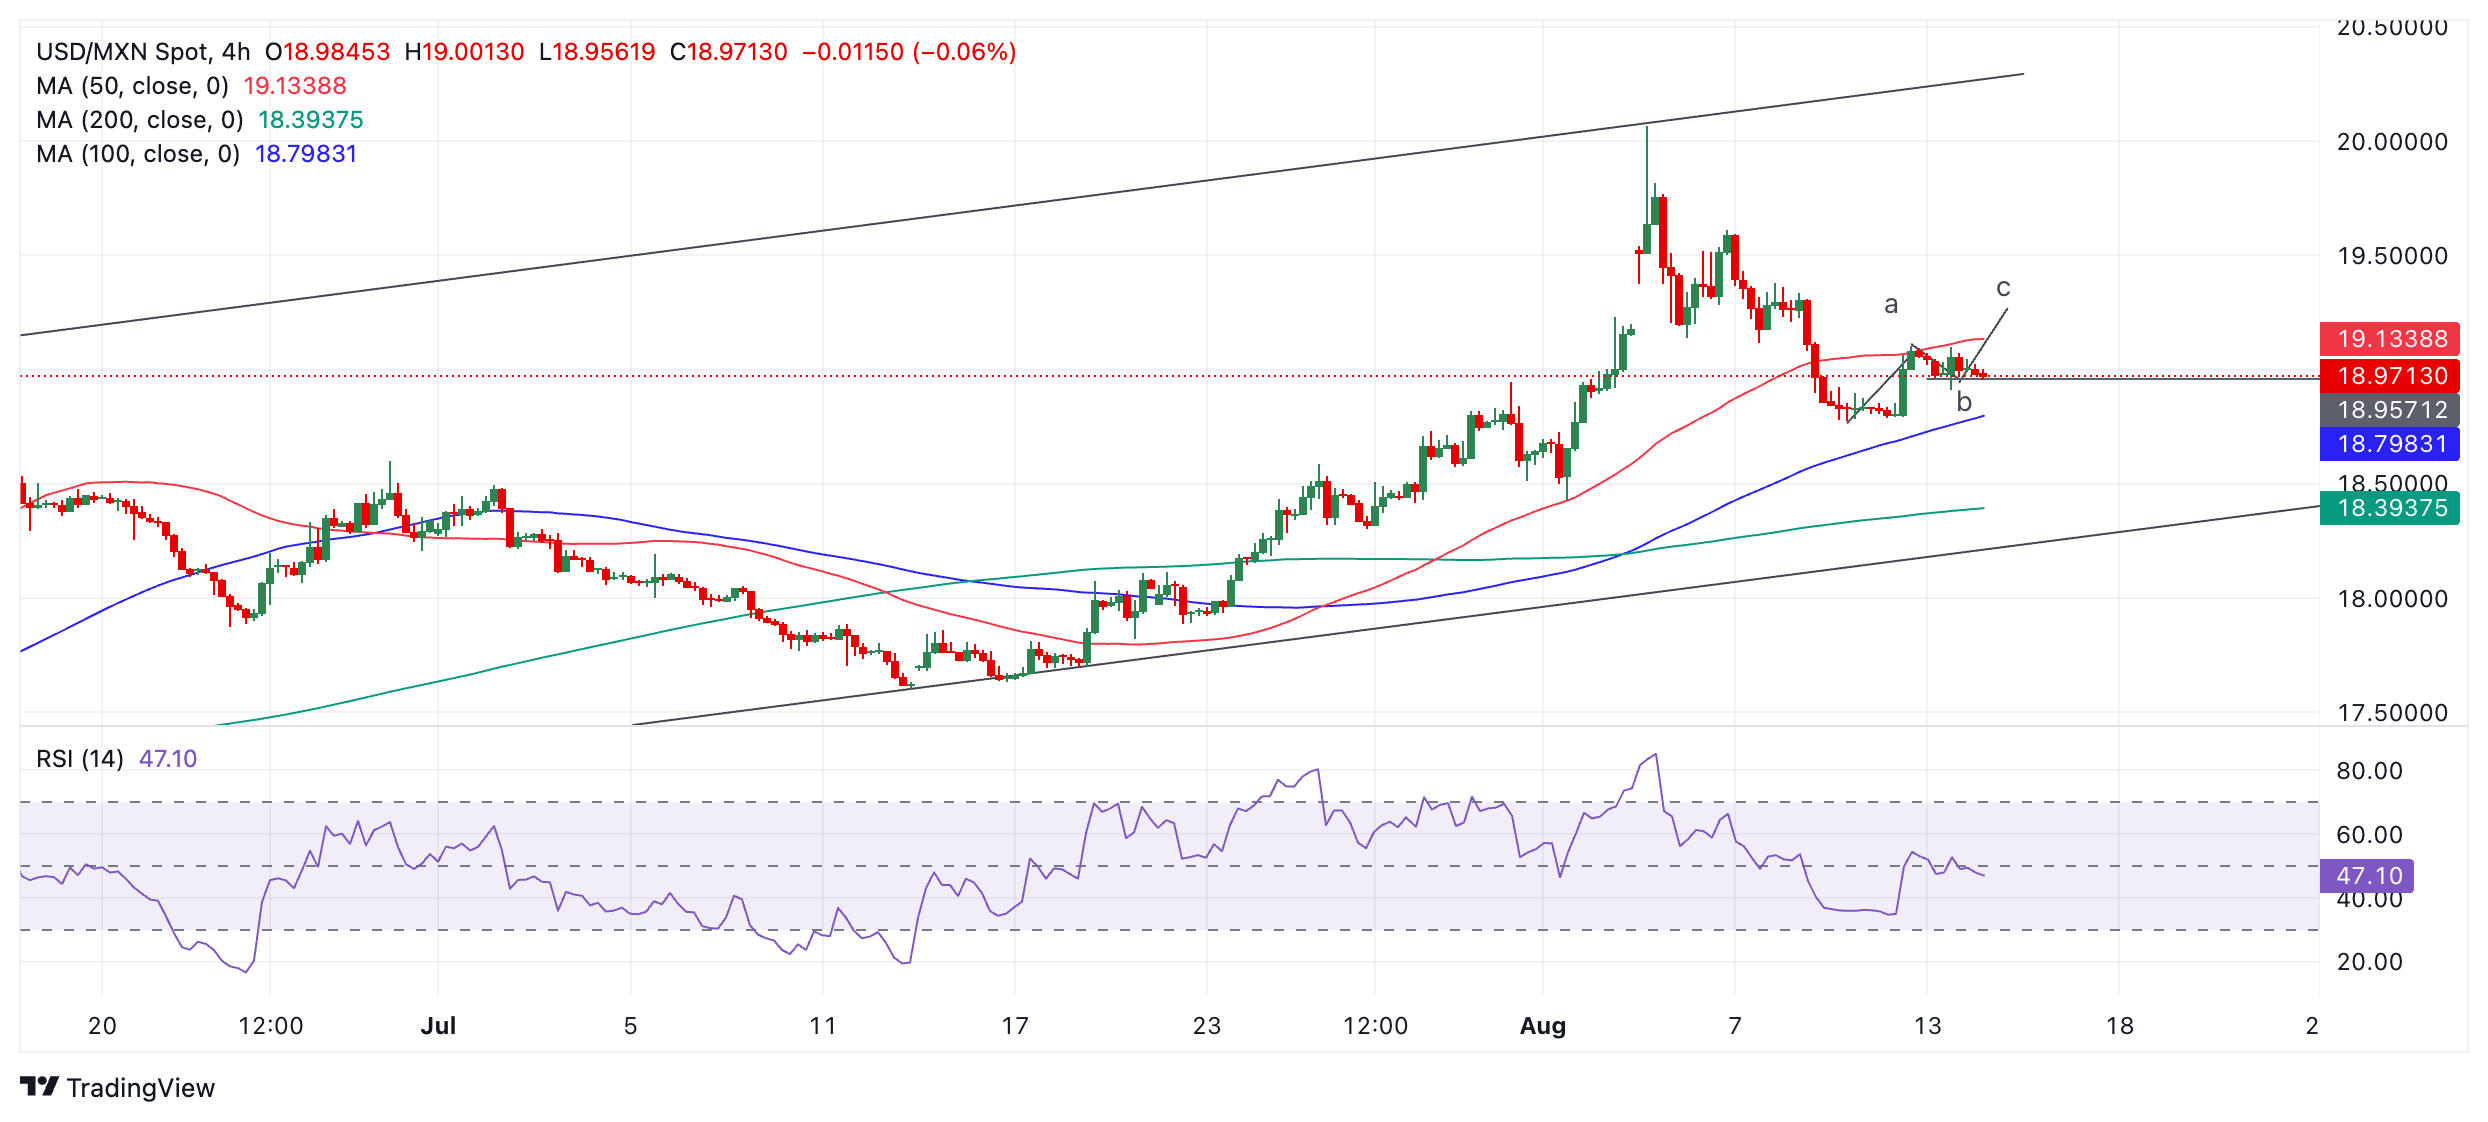
The pullback from the August 9 lows looks corrective in nature and therefore unlikely to endure. It has failed, so far, to stretch a final, third, “c” leg higher to complete an ABC correction that might have been forming. Further, the decline from the top of the channel looks unfinished.
In the event of a resumption of the down leg it will probably reach the lower channel line at around 18.30. A break back below 18.97 (lows of wave “b”) would provide added confirmation of such a resumption, as would a break below the 18.77, the swing low from August 9.
Such a break lower would probably first target 18.35 and the 200-period Simple Moving Average (SMA). In addition, the lower channel line will likely provide solid support at roughly 18.30.
Economic Indicator
Consumer Price Index (MoM)
The United Kingdom (UK) Consumer Price Index (CPI), released by the Office for National Statistics on a monthly basis, is a measure of consumer price inflation – the rate at which the prices of goods and services bought by households rise or fall – produced to international standards. It is also the inflation measure used in the government’s target. The MoM figure compares the prices of goods in the reference month to the previous month. Generally, a high reading is seen as bullish for the Pound Sterling (GBP), while a low reading is seen as bearish.
Read more.Last release: Wed Aug 14, 2024 06:00
Frequency: Monthly
Actual: -0.2%
Consensus: -
Previous: 0.1%
Source: Office for National Statistics
- NZD/USD retreats sharply from a multi-week top after the RBNZ’s surprise 25 bps rate cut.
- Dovish Fed expectations and a positive risk tone undermine the USD, lending some support.
- Traders now look forward to the US consumer inflation figures before placing directional bets.
The NZD/USD pair witnessed a dramatic intraday turnaround from a four-week high touched earlier this Wednesday after the Reserve Bank of New Zealand's (RBNZ) surprise 25 basis points (bps) rate cut. Spot prices, however, manage to defend the 0.6000 psychological mark through the early part of the European session as traders keenly await the release of the US consumer inflation figures before placing fresh directional bets.
The New Zealand Dollar (NZD) weakened across the board after the RBNZ board members decided to cut the Official Cash Rate (OCR) for the first time since March 2020 and indicated more cuts over the coming months. The central bank cited the recent progress towards meeting the annual inflation target and weak domestic economic growth behind the surprise move, which defied expectations. The dovish tilt turns out to be a key factor behind the NZD/USD pair's steep intraday downfall of over 80 pips.
The US Dollar (USD), on the other hand, languishes near its lowest level in more than a week amid expectations for deeper interest rate cuts by the Federal Reserve (Fed). The bets were lifted by the softer-than-expected US Producer Price Index (PPI) on Tuesday, which provided more evidence of cooling inflation. Apart from this, a generally positive tone around the equity markets undermines demand for the safe-haven Greenback and helps limit the downside for the perceived risk-sensitive Kiwi.
Traders also seem reluctant and prefer to wait for the release of the US consumer inflation figures for cues about the Fed's rate-cut path before placing fresh directional bets. Hence, it will be prudent to wait for strong follow-through selling before confirming that the NZD/USD pair has topped out in the near term and that the recent recovery from the mid-0.5800s, or the YTD low touched last week has run its course.
Economic Indicator
RBNZ Interest Rate Decision
The Reserve Bank of New Zealand (RBNZ) announces its interest rate decision after its seven scheduled annual policy meetings. If the RBNZ is hawkish and sees inflationary pressures rising, it raises the Official Cash Rate (OCR) to bring inflation down. This is positive for the New Zealand Dollar (NZD) since higher interest rates attract more capital inflows. Likewise, if it reaches the view that inflation is too low it lowers the OCR, which tends to weaken NZD.
Read more.Last release: Wed Aug 14, 2024 02:00
Frequency: Irregular
Actual: 5.25%
Consensus: 5.5%
Previous: 5.5%
Source: Reserve Bank of New Zealand
The Reserve Bank of New Zealand (RBNZ) holds monetary policy meetings seven times a year, announcing their decision on interest rates and the economic assessments that influenced their decision. The central bank offers clues on the economic outlook and future policy path, which are of high relevance for the NZD valuation. Positive economic developments and upbeat outlook could lead the RBNZ to tighten the policy by hiking interest rates, which tends to be NZD bullish. The policy announcements are usually followed by Governor Adrian Orr’s press conference.
Here is what you need to know on Wednesday, August 14:
Pound Sterling stays under modest bearish pressure in the European morning as investors assess the July inflation report. In the second half of the day, the Consumer Price Index (CPI) data from the US will be watched closely by market participants. In the meantime, the European economic docket will feature a revision to second-quarter Gross Domestic Product (GDP) and Industrial Production figures for June.
Following Monday's choppy action, the US Dollar Index (DXY) turned south in the American session on Tuesday as risk flows dominated the action. Wall Street's main indexes registered strong gains, with the Nasdaq Composite leading the rally with a 2.5% upsurge, and the DXY lost 0.5%. On a monthly basis, the CPI is forecast to rise 0.2% in July following the 0.1% decline recorded in June. The core CPI, which excludes volatile food and energy prices, is seen increasing 0.2% in the same period.
US Dollar PRICE This week
The table below shows the percentage change of US Dollar (USD) against listed major currencies this week. US Dollar was the weakest against the Australian Dollar.
| USD | EUR | GBP | JPY | CAD | AUD | NZD | CHF | |
|---|---|---|---|---|---|---|---|---|
| USD | -0.80% | -0.63% | 0.40% | -0.20% | -0.97% | -0.20% | -0.20% | |
| EUR | 0.80% | 0.20% | 1.18% | 0.60% | -0.28% | 0.61% | 0.61% | |
| GBP | 0.63% | -0.20% | 1.25% | 0.41% | -0.49% | 0.40% | 0.42% | |
| JPY | -0.40% | -1.18% | -1.25% | -0.56% | -1.41% | -0.58% | -0.61% | |
| CAD | 0.20% | -0.60% | -0.41% | 0.56% | -0.82% | 0.00% | 0.02% | |
| AUD | 0.97% | 0.28% | 0.49% | 1.41% | 0.82% | 0.89% | 0.90% | |
| NZD | 0.20% | -0.61% | -0.40% | 0.58% | -0.00% | -0.89% | 0.01% | |
| CHF | 0.20% | -0.61% | -0.42% | 0.61% | -0.02% | -0.90% | -0.01% |
The heat map shows percentage changes of major currencies against each other. The base currency is picked from the left column, while the quote currency is picked from the top row. For example, if you pick the US Dollar from the left column and move along the horizontal line to the Japanese Yen, the percentage change displayed in the box will represent USD (base)/JPY (quote).
The UK's Office for National Statistics reported early Wednesday that the annual CPI inflation edged higher to 2.2% from 2%. This reading came in below the market expectation of 2.3%. Additionally, the annual core CPI rose 3.3%, down from the 3.5% increase recorded in June. Other details of the report showed that the annual PPI - Input increased 0.4% and the Retail Price Index rose 3.6%, compared to analysts' estimate of 3.3%. GBP/USD turned south following these figures and was last seen trading in negative territory below 1.2850.
The Reserve Bank of New Zealand (RBNZ) announced in the Asian session that it lowered the policy rate by 25 basis points to 5.25% after the August meeting. "We are confident inflation is back in its target band we can commence re-normalize rates," RBNZ Governor Adrian Orr said in the post-meeting press conference. NZD/USD faced heavy selling pressure following the RBNZ event and was last seen trading slightly above 0.6000, where it was down more than 1% on a daily basis.
USD/JPY failed to make a decisive move in either direction on Tuesday. The pair extends its sideways grind slightly above 147.00 in the European morning on Wednesday.
EUR/USD broke out of its one-week-old trading range on Tuesday and gained more than 0.5%. The pair continues to stretch higher in the European session and was last seen trading a few pips above 1.1000.
Gold staged a technical correction following Monday's upsurge and registered small losses on Tuesday. XAU/USD stays relatively quiet and fluctuates at around $2,470 early Wednesday.
Inflation FAQs
Inflation measures the rise in the price of a representative basket of goods and services. Headline inflation is usually expressed as a percentage change on a month-on-month (MoM) and year-on-year (YoY) basis. Core inflation excludes more volatile elements such as food and fuel which can fluctuate because of geopolitical and seasonal factors. Core inflation is the figure economists focus on and is the level targeted by central banks, which are mandated to keep inflation at a manageable level, usually around 2%.
The Consumer Price Index (CPI) measures the change in prices of a basket of goods and services over a period of time. It is usually expressed as a percentage change on a month-on-month (MoM) and year-on-year (YoY) basis. Core CPI is the figure targeted by central banks as it excludes volatile food and fuel inputs. When Core CPI rises above 2% it usually results in higher interest rates and vice versa when it falls below 2%. Since higher interest rates are positive for a currency, higher inflation usually results in a stronger currency. The opposite is true when inflation falls.
Although it may seem counter-intuitive, high inflation in a country pushes up the value of its currency and vice versa for lower inflation. This is because the central bank will normally raise interest rates to combat the higher inflation, which attract more global capital inflows from investors looking for a lucrative place to park their money.
Formerly, Gold was the asset investors turned to in times of high inflation because it preserved its value, and whilst investors will often still buy Gold for its safe-haven properties in times of extreme market turmoil, this is not the case most of the time. This is because when inflation is high, central banks will put up interest rates to combat it. Higher interest rates are negative for Gold because they increase the opportunity-cost of holding Gold vis-a-vis an interest-bearing asset or placing the money in a cash deposit account. On the flipside, lower inflation tends to be positive for Gold as it brings interest rates down, making the bright metal a more viable investment alternative.
- GBP/JPY gains ground despite lower-than-expected Consumer Price Index data from the United Kingdom.
- UK Consumer Price Index rose at 2.2% YoY in July, against the expected 2.3% growth.
- The downside of the Yen could be limited due to safe-haven flows amid rising Middle-East tensions.
GBP/JPY extends its winning streak for the third consecutive session, trading around 189.00 during the early European session on Wednesday. This upside came despite a lower-than-expected Consumer Price Index (CPI) report released by the United Kingdom (UK) Office for National Statistics (ONS), which has increased the likelihood of interest-rate cuts by the Bank of England (BoE).
In July, the UK Consumer Price Index (CPI) increased by 2.2% year-on-year, up from 2.0% previously. This reading fell short of the market expectation of 2.3% growth, moving slightly above the Bank of England’s (BoE) 2.0% target.
Meanwhile, Core CPI, which excludes volatile food and energy items, rose by 3.3% year-on-year, down from 3.5% previously and below the market consensus of 3.4%. On a monthly basis, CPI decreased by 0.2%, following a 0.1% increase in June.
The upside of the GBP/JPY cross could be retrained as safe-haven flows may have strengthened the Yen amid escalating geopolitical tensions in the Middle East. The BBC reported on Tuesday that the United States deployed a guided missile submarine to the region.
Additionally, Israeli forces continued their operations near Khan Younis in southern Gaza on Monday. According to CBC News, Palestinian medics reported that Israeli military strikes on Khan Younis on Monday resulted in at least 18 fatalities.
The rising expectations of the Bank of Japan (BoJ) to hike rates again in 2024 provide support for the Japanese (Yen). Japan's parliament is scheduled to hold a special session on August 23 to discuss the Bank of Japan's (BoJ) decision to raise interest rates last month.
Economic Indicator
Consumer Price Index (YoY)
The United Kingdom (UK) Consumer Price Index (CPI), released by the Office for National Statistics on a monthly basis, is a measure of consumer price inflation – the rate at which the prices of goods and services bought by households rise or fall – produced to international standards. It is the inflation measure used in the government’s target. The YoY reading compares prices in the reference month to a year earlier. Generally, a high reading is seen as bullish for the Pound Sterling (GBP), while a low reading is seen as bearish.
Read more.Last release: Wed Aug 14, 2024 06:00
Frequency: Monthly
Actual: 2.2%
Consensus: 2.3%
Previous: 2%
Source: Office for National Statistics
The Bank of England is tasked with keeping inflation, as measured by the headline Consumer Price Index (CPI) at around 2%, giving the monthly release its importance. An increase in inflation implies a quicker and sooner increase of interest rates or the reduction of bond-buying by the BOE, which means squeezing the supply of pounds. Conversely, a drop in the pace of price rises indicates looser monetary policy. A higher-than-expected result tends to be GBP bullish.
- The Pound Sterling weakens against the US Dollar after UK inflation came in slightly softer than anticipated.
- Easing UK price pressures gives more chances to subsequent interest-rate cuts by the BoE.
- Investors await the US CPI data for July.
The Pound Sterling (GBP) faces a sharp sell-off against its major peers in Wednesday’s London session. The British currency weakens as the United Kingdom (UK) Office for National Statistics (ONS) has reported a softer-than-expected Consumer Price Index (CPI) report for July, which has boosted expectations of sequential interest-rate cuts by the Bank of England (BoE).
Annual headline CPI rose by 2.2%, less than estimates of 2.3% but accelerating after returning to banks’ target of 2% both in May and June. In its forecasts, the BoE had already warned that the headline inflation could increase again after returning to 2%. Compared with the previous month, the CPI fell by 0.2%.
The core CPI, which excludes volatile items such as food, energy, alcohol and tobacco, decelerated at a faster-than-expected pace to 3.3% compared with the 3.4% expected and June’s figure of 3.5%. A sharp decline in core inflation was prompted by slower growth of service inflation, which has remained a major driving force to stick price pressures in the UK economy. Inflation in the service sector declined to 5.2% from the former release of 5.7%.
Price pressures in the service sector are majorly driven by high wage growth, which also fell to its lowest in two years in the three months ending June. The Employment report showed on Tuesday that Average Earnings Excluding Bonuses rose at a slower pace of 5.4% from 5.7% in the quarter ending May. A sheer decline in service inflation due to slower wage growth is expected to be a big relief for BoE policymakers, who have been worried that wage pressures couldn't be controlled in the near term.
On Monday, BoE's Monetary Policy Committee (MPC) member Catherine Mann warned about inflation remaining persistent. “Goods and services prices were set to rise again, and wage pressures in the economy could take years to dissipate,” Mann said.
Daily digest market movers: Pound Sterling drops against US Dollar ahead of US inflation
- The Pound Sterling slumps to near 1.2820 against the US Dollar (USD) in Wednesday’s European trading hours. The GBP/USD pair drops as the British currency weakens after the release of the UK’s soft inflation report. Meanwhile, the near-term outlook of the US Dollar is also uncertain ahead of the US CPI data for July, which will be published at 12:30 GMT.
- The US Dollar index (DXY), which tracks the Greenback’s value against six major currencies, edges higher to near 102.67 in Wednesday’s European session after correcting to a fresh weekly low at 102.55 on Tuesday.
- US annual headline and core inflation is expected to have decelerated by one-tenth to 2.9% and 3.2%, respectively, with monthly figures growing by 0.2%. The data inflation will significantly influence market expectations for Fed interest-rate cuts for the remainder of the year.
- The US Dollar recorded a sharp sell-off on Tuesday after a mostly soft Producer Price Index (PPI) report for July increased market expectations for the Federal Reserve (Fed) to start reducing interest rates more aggressively.
- According to the CME FedWatch tool, 30-day Federal Funds Futures pricing data shows that traders see a 54.5% chance that interest rates will be reduced by 50 basis points (bps) in September. The likelihood of a 50 bps rate reduction has slightly increased after the PPI report release, but is still significantly down from the 69% recorded a week ago.
- The PPI report showed that headline producer inflation came in at 2.2%, lower than estimates of 2.3% and June’s reading of 2.7%. In the same period, the core PPI grew at a slower pace of 2.4% from expectations of 2.7% and the former release of 3%. A sharp decline in the pricing power of owners at factory gates boosted confidence of investors that inflation is on track to return to the desired rate of 2%.
Technical Analysis: Pound Sterling drops from two-week high of 1.2870
The Pound Sterling slides to near 1.2820 against the US Dollar after posting a fresh two-week high at 1.2870. The near-term appeal of the GBP/USD pair is still firm as it holds the 20-day Exponential Moving Average (EMA), which trades around 1.2800.
Earlier, the Cable showed a sharp recovery from six-week low of 1.2665 after a positive divergence formation on a daily time frame, in which the pair continues to build higher lows while the momentum oscillator makes lower lows. This generally results in a resumption of the uptrend, but it should be confirmed with more indicators.
The 14-day Relative Strength Index (RSI) recovers after finding a cushion near 40.00, exhibiting signs of buying interest at lower levels.
On the upside, August 2 high at 1.2840 and the round-level resistance of 1.2900 will act as major resistances for the Pound Sterling. Alternatively, the recovery move could falter if the asset breaks below August 8 low at 1.2665. This would expose the asset to June 27 low at 1.2613, followed by April 29 high at 1.2570.
- USD/CAD holds positive ground near 1.3715 in Wednesday’s early European session.
- Higher crude oil prices and softer USD might weigh on the pair.
- Traders will take more cues from the US July CPI inflation report, which is due later on Wednesday.
The USD/CAD pair recovers around 1.3715 on Wednesday during the early European session. The upside of the pair might be limited as the rise of crude oil prices continues to support the commodity-linked Loonie. Later on Wednesday, the US Consumer Price Index (CPI) for July will be in the spotlight.
The Greenback remains under pressure amid the expectations for deeper interest rate cuts by the Federal Reserve (Fed) after the softer US Producer Price Index (PPI) data on Tuesday. The US Producer Price Index (PPI) for final demand came in softer than expected at 2.2% YoY in July, from 2.7% in June, according to the Bureau of Labor Statistics.
Meanwhile, the rise of crude oil prices due to a significant fall in US inventories supports the Loonie. It's worth noting that higher oil prices generally support the CAD lower as Canada is the leading exporter of Oil to the United States (US).
The Bank of Canada (BoC) decided to cut a quarter-point in its overnight rate target to 4.5% on July 24, followed by its June cut. A dovish stance from the BoC might undermine the Canadian Dollar (CAD) and cap the pair’s downside. Many economists expect the Canadian central bank to cut rates at each of the three policy-setting meetings it has left in 2024, starting in the September meeting.
Canadian Dollar FAQs
The key factors driving the Canadian Dollar (CAD) are the level of interest rates set by the Bank of Canada (BoC), the price of Oil, Canada’s largest export, the health of its economy, inflation and the Trade Balance, which is the difference between the value of Canada’s exports versus its imports. Other factors include market sentiment – whether investors are taking on more risky assets (risk-on) or seeking safe-havens (risk-off) – with risk-on being CAD-positive. As its largest trading partner, the health of the US economy is also a key factor influencing the Canadian Dollar.
The Bank of Canada (BoC) has a significant influence on the Canadian Dollar by setting the level of interest rates that banks can lend to one another. This influences the level of interest rates for everyone. The main goal of the BoC is to maintain inflation at 1-3% by adjusting interest rates up or down. Relatively higher interest rates tend to be positive for the CAD. The Bank of Canada can also use quantitative easing and tightening to influence credit conditions, with the former CAD-negative and the latter CAD-positive.
The price of Oil is a key factor impacting the value of the Canadian Dollar. Petroleum is Canada’s biggest export, so Oil price tends to have an immediate impact on the CAD value. Generally, if Oil price rises CAD also goes up, as aggregate demand for the currency increases. The opposite is the case if the price of Oil falls. Higher Oil prices also tend to result in a greater likelihood of a positive Trade Balance, which is also supportive of the CAD.
While inflation had always traditionally been thought of as a negative factor for a currency since it lowers the value of money, the opposite has actually been the case in modern times with the relaxation of cross-border capital controls. Higher inflation tends to lead central banks to put up interest rates which attracts more capital inflows from global investors seeking a lucrative place to keep their money. This increases demand for the local currency, which in Canada’s case is the Canadian Dollar.
Macroeconomic data releases gauge the health of the economy and can have an impact on the Canadian Dollar. Indicators such as GDP, Manufacturing and Services PMIs, employment, and consumer sentiment surveys can all influence the direction of the CAD. A strong economy is good for the Canadian Dollar. Not only does it attract more foreign investment but it may encourage the Bank of Canada to put up interest rates, leading to a stronger currency. If economic data is weak, however, the CAD is likely to fall.
FX option expiries for Aug 14 NY cut at 10:00 Eastern Time, via DTCC, can be found below.
EUR/USD: EUR amounts
- 1.0800 1.1b
- 1.0805 865m
- 1.0925 1.2b
- 1.0980 683m
- 1.1035 1.8b
GBP/USD: GBP amounts
- 1.2725 573m
- 1.2800 816m
- 1.3050 498m
USD/JPY: USD amounts
- 146.25 1.2b
- 150.50 536m
USD/CHF: USD amounts
- 0.8715 1.8b
- 0.8820 745m
AUD/USD: AUD amounts
- 0.6670 481m
USD/CAD: USD amounts
- 1.3640 499m
- 1.3700 724m
- 1.3730 676m
- 1.3900 1.4b
- 1.4000 490m
NZD/USD: NZD amounts
- 0.6090 1.1b
- EUR/GBP gathers gains ground near 0.8570 in Wednesday’s early European session.
- The UK annual CPI increased 2.2% in July vs. 2.3% expected.
- Investors will keep an eye on the Eurozone Q2 GDP data on Wednesday.
=The EUR/GBP cross edges higher to near 0.8570 during the early European session on Wednesday. The Cable loses traction after the UK Consumer Price Index (CPI) inflation data for July. Investors await the Eurozone Gross Domestic Product (GDP) for the second quarter (Q2), which is due later in the day.
Data released by the Office for National Statistics showed on Wednesday that the UK CPI rose 2.2% YoY in July, compared to 2.0% in June. This figure was below the market consensus of 2.3%. Meanwhile, the Core CPI, excluding volatile food and energy items, climbed 3.3% YoY in July versus 3.5% prior, worse than the forecast of 3.4%. The softer UK CPI inflation report exerts some selling pressure on the Pound Sterling (GBP) as it has triggered the expectation of an interest-rate cut by the Bank of England (BoE) in August.
On Thursday, traders will shift their attention to the UK Gross Domestic Product (GDP) for the second quarter (Q2), which is projected to expand 1.0% year-on-year. On a quarterly basis, the GDP number is forecasted to grow 0.6% in Q2.
On the Euro front, the Eurozone Gross Domestic Product (GDP) for the second quarter (Q2) will be published. The Eurozone economy is estimated to grow 0.3% QoQ and 0.6% YoY in Q2. The weaker-than-expected GDP growth numbers could weigh on the Euro (EUR) and cap the downside for EUR/GBP.
Inflation FAQs
Inflation measures the rise in the price of a representative basket of goods and services. Headline inflation is usually expressed as a percentage change on a month-on-month (MoM) and year-on-year (YoY) basis. Core inflation excludes more volatile elements such as food and fuel which can fluctuate because of geopolitical and seasonal factors. Core inflation is the figure economists focus on and is the level targeted by central banks, which are mandated to keep inflation at a manageable level, usually around 2%.
The Consumer Price Index (CPI) measures the change in prices of a basket of goods and services over a period of time. It is usually expressed as a percentage change on a month-on-month (MoM) and year-on-year (YoY) basis. Core CPI is the figure targeted by central banks as it excludes volatile food and fuel inputs. When Core CPI rises above 2% it usually results in higher interest rates and vice versa when it falls below 2%. Since higher interest rates are positive for a currency, higher inflation usually results in a stronger currency. The opposite is true when inflation falls.
Although it may seem counter-intuitive, high inflation in a country pushes up the value of its currency and vice versa for lower inflation. This is because the central bank will normally raise interest rates to combat the higher inflation, which attract more global capital inflows from investors looking for a lucrative place to park their money.
Formerly, Gold was the asset investors turned to in times of high inflation because it preserved its value, and whilst investors will often still buy Gold for its safe-haven properties in times of extreme market turmoil, this is not the case most of the time. This is because when inflation is high, central banks will put up interest rates to combat it. Higher interest rates are negative for Gold because they increase the opportunity-cost of holding Gold vis-a-vis an interest-bearing asset or placing the money in a cash deposit account. On the flipside, lower inflation tends to be positive for Gold as it brings interest rates down, making the bright metal a more viable investment alternative.
- USD/CHF edges lower as the US Dollar faces challenges amid dovish sentiment surrounding the Fed.
- Traders adopt caution ahead of US CPI inflation report due on Wednesday.
- The Swiss Franc could have received support from safe-haven flows amid rising geopolitical tensions in the Middle East.
USD/CHF remains tepid for the second successive day, trading around 0.8650 during the Asian hours on Wednesday. The USD/CHF pair faces challenges as the US Dollar (USD) struggles with dovish sentiment surrounding the US Federal Reserve (Fed) regarding its monetary policy outlook.
However, the recent downbeat Producer Price Index (PPI) data from the United States (US) have decreased the bets for a bigger interest rate cut by the US Federal Reserve (Fed) in September. Furthermore, traders will likely observe the US CPI inflation report on Wednesday, which could offer some hints about the Federal Reserve’s (Fed) interest rate cut path.
Additionally, Reuters reported on Tuesday, that Atlanta Fed President Raphael Bostic stated that recent economic data has increased his confidence that the Fed can achieve its 2% inflation target. However, Bostic indicated that additional evidence is required before he would support a reduction in interest rates.
Safe-haven demand may have bolstered the Swiss Franc (CHF) amidst escalating geopolitical tensions in the Middle East. On Tuesday, the United States deployed a guided missile submarine to the region, according to the BBC. Additionally, Israeli forces continued their operations near Khan Younis in southern Gaza on Monday. CBC News reported that Palestinian medics indicated Israeli military strikes on Khan Younis on Monday resulted in the deaths of at least 18 people.
Traders are likely anticipating Swiss Producer and Import Prices data for July, scheduled for release on Thursday, with expectations pointing to a slight increase in the cost of imported goods. On Friday, the focus will shift to the annual Industrial Production report for the second quarter, which may show a decline in production volumes.
Swiss Franc FAQs
The Swiss Franc (CHF) is Switzerland’s official currency. It is among the top ten most traded currencies globally, reaching volumes that well exceed the size of the Swiss economy. Its value is determined by the broad market sentiment, the country’s economic health or action taken by the Swiss National Bank (SNB), among other factors. Between 2011 and 2015, the Swiss Franc was pegged to the Euro (EUR). The peg was abruptly removed, resulting in a more than 20% increase in the Franc’s value, causing a turmoil in markets. Even though the peg isn’t in force anymore, CHF fortunes tend to be highly correlated with the Euro ones due to the high dependency of the Swiss economy on the neighboring Eurozone.
The Swiss Franc (CHF) is considered a safe-haven asset, or a currency that investors tend to buy in times of market stress. This is due to the perceived status of Switzerland in the world: a stable economy, a strong export sector, big central bank reserves or a longstanding political stance towards neutrality in global conflicts make the country’s currency a good choice for investors fleeing from risks. Turbulent times are likely to strengthen CHF value against other currencies that are seen as more risky to invest in.
The Swiss National Bank (SNB) meets four times a year – once every quarter, less than other major central banks – to decide on monetary policy. The bank aims for an annual inflation rate of less than 2%. When inflation is above target or forecasted to be above target in the foreseeable future, the bank will attempt to tame price growth by raising its policy rate. Higher interest rates are generally positive for the Swiss Franc (CHF) as they lead to higher yields, making the country a more attractive place for investors. On the contrary, lower interest rates tend to weaken CHF.
Macroeconomic data releases in Switzerland are key to assessing the state of the economy and can impact the Swiss Franc’s (CHF) valuation. The Swiss economy is broadly stable, but any sudden change in economic growth, inflation, current account or the central bank’s currency reserves have the potential to trigger moves in CHF. Generally, high economic growth, low unemployment and high confidence are good for CHF. Conversely, if economic data points to weakening momentum, CHF is likely to depreciate.
As a small and open economy, Switzerland is heavily dependent on the health of the neighboring Eurozone economies. The broader European Union is Switzerland’s main economic partner and a key political ally, so macroeconomic and monetary policy stability in the Eurozone is essential for Switzerland and, thus, for the Swiss Franc (CHF). With such dependency, some models suggest that the correlation between the fortunes of the Euro (EUR) and the CHF is more than 90%, or close to perfect.
Gold prices fell in India on Wednesday, according to data compiled by FXStreet.
The price for Gold stood at 6,640.25 Indian Rupees (INR) per gram, down compared with the INR 6,649.34 it cost on Tuesday.
The price for Gold decreased to INR 77,450.62 per tola from INR 77,556.65 per tola a day earlier.
| Unit measure | Gold Price in INR |
|---|---|
| 1 Gram | 6,640.25 |
| 10 Grams | 66,403.62 |
| Tola | 77,450.62 |
| Troy Ounce | 206,531.80 |
FXStreet calculates Gold prices in India by adapting international prices (USD/INR) to the local currency and measurement units. Prices are updated daily based on the market rates taken at the time of publication. Prices are just for reference and local rates could diverge slightly.
Gold FAQs
Gold has played a key role in human’s history as it has been widely used as a store of value and medium of exchange. Currently, apart from its shine and usage for jewelry, the precious metal is widely seen as a safe-haven asset, meaning that it is considered a good investment during turbulent times. Gold is also widely seen as a hedge against inflation and against depreciating currencies as it doesn’t rely on any specific issuer or government.
Central banks are the biggest Gold holders. In their aim to support their currencies in turbulent times, central banks tend to diversify their reserves and buy Gold to improve the perceived strength of the economy and the currency. High Gold reserves can be a source of trust for a country’s solvency. Central banks added 1,136 tonnes of Gold worth around $70 billion to their reserves in 2022, according to data from the World Gold Council. This is the highest yearly purchase since records began. Central banks from emerging economies such as China, India and Turkey are quickly increasing their Gold reserves.
Gold has an inverse correlation with the US Dollar and US Treasuries, which are both major reserve and safe-haven assets. When the Dollar depreciates, Gold tends to rise, enabling investors and central banks to diversify their assets in turbulent times. Gold is also inversely correlated with risk assets. A rally in the stock market tends to weaken Gold price, while sell-offs in riskier markets tend to favor the precious metal.
The price can move due to a wide range of factors. Geopolitical instability or fears of a deep recession can quickly make Gold price escalate due to its safe-haven status. As a yield-less asset, Gold tends to rise with lower interest rates, while higher cost of money usually weighs down on the yellow metal. Still, most moves depend on how the US Dollar (USD) behaves as the asset is priced in dollars (XAU/USD). A strong Dollar tends to keep the price of Gold controlled, whereas a weaker Dollar is likely to push Gold prices up.
(An automation tool was used in creating this post.)
- EUR/USD trades flat near 1.0990 in Wednesday’s early European session.
- The US PPI rose 2.2% year-on-year in July, softer than expected.
- ECB is likely to deliver two more 25 basis point rate cuts this year, according to Reuters surveys.
The EUR/USD pair trades on a flat note near 1.0990 during the early European session on Wednesday. Traders prefer to wait on the sidelines ahead of the release of top-tier economic data from the Eurozone and the US. The Eurozone Gross Domestic Product (GDP) for the second quarter (Q2) and the US Consumer Price Index (CPI) for July will be closely watched.
Data released by the Bureau of Labor Statistics on Tuesday showed that the Producer Price Index (PPI) for final demand in the US rose 2.2% YoY in July from 2.7% in the previous month, below the 2.3% expected. The monthly PPI increased by 0.1% MoM in the same period after rising by 0.2% in June. The Core PPI, which excludes volatile food and energy prices, rose 2.4% YoY in July, compared to 3.0% in June, lower than the market consensus of 2.7%.
The markets expect a 25 basis point (bps) rate cut by the Federal Reserve (Fed) in September, while a 50 bps cut in September cannot be ruled out, but it will depend entirely on the data. Atlanta Fed President Raphael Bostic emphasized on Tuesday that recent economic data made him "more confident" that the Fed can get inflation back to its 2% target. Still, more evidence is needed before he's ready to support lowering interest rates.
Across the pond, the Eurozone economy is estimated to grow 0.3% QoQ and 0.6% YoY in Q2. The weaker-than-expected GDP growth numbers could weigh on the Euro (EUR) against the US dollar (USD).
According to Reuters, the majority of economists polled see the European Central Bank (ECB) cutting its deposit rate twice more this year, in September and December. The anticipation that the ECB will cut rates fewer than markets previously expected is likely to cap the downside for the Euro for the time being. ING chief Eurozone economist, Carsten Brzeski, noted, "I expect the ECB to slightly revise upward its inflation projections, and it's strange then to continue cutting rates.”
Euro FAQs
The Euro is the currency for the 20 European Union countries that belong to the Eurozone. It is the second most heavily traded currency in the world behind the US Dollar. In 2022, it accounted for 31% of all foreign exchange transactions, with an average daily turnover of over $2.2 trillion a day. EUR/USD is the most heavily traded currency pair in the world, accounting for an estimated 30% off all transactions, followed by EUR/JPY (4%), EUR/GBP (3%) and EUR/AUD (2%).
The European Central Bank (ECB) in Frankfurt, Germany, is the reserve bank for the Eurozone. The ECB sets interest rates and manages monetary policy. The ECB’s primary mandate is to maintain price stability, which means either controlling inflation or stimulating growth. Its primary tool is the raising or lowering of interest rates. Relatively high interest rates – or the expectation of higher rates – will usually benefit the Euro and vice versa. The ECB Governing Council makes monetary policy decisions at meetings held eight times a year. Decisions are made by heads of the Eurozone national banks and six permanent members, including the President of the ECB, Christine Lagarde.
Eurozone inflation data, measured by the Harmonized Index of Consumer Prices (HICP), is an important econometric for the Euro. If inflation rises more than expected, especially if above the ECB’s 2% target, it obliges the ECB to raise interest rates to bring it back under control. Relatively high interest rates compared to its counterparts will usually benefit the Euro, as it makes the region more attractive as a place for global investors to park their money.
Data releases gauge the health of the economy and can impact on the Euro. Indicators such as GDP, Manufacturing and Services PMIs, employment, and consumer sentiment surveys can all influence the direction of the single currency. A strong economy is good for the Euro. Not only does it attract more foreign investment but it may encourage the ECB to put up interest rates, which will directly strengthen the Euro. Otherwise, if economic data is weak, the Euro is likely to fall. Economic data for the four largest economies in the euro area (Germany, France, Italy and Spain) are especially significant, as they account for 75% of the Eurozone’s economy.
Another significant data release for the Euro is the Trade Balance. This indicator measures the difference between what a country earns from its exports and what it spends on imports over a given period. If a country produces highly sought after exports then its currency will gain in value purely from the extra demand created from foreign buyers seeking to purchase these goods. Therefore, a positive net Trade Balance strengthens a currency and vice versa for a negative balance.
- GBP/USD struggles to lure buyers ahead of the crucial inflation data from the UK and the US.
- A combination of factors keeps the USD bulls on the defensive and lends support to the pair.
- The fundamental backdrop supports prospects for an extension of a one-week-old uptrend.
The GBP/USD pair ticks lower during the Asian session on Wednesday and moves away from over a two-week high, around the 1.2870-1.2875 region touched the previous day. The downside, however, remains cushioned as traders keenly await the release of the latest consumer inflation figures from the UK and the US.
The UK CPI will play a key role in influencing the Bank of England's (BoE) monetary policy decision and drive the British Pound (GBP). Apart from this, the crucial US CPI report will be scrutinized for cues about the Federal Reserve's (Fed) rate cut path, which, in turn, should provide some meaningful impetus to the US Dollar (USD) and help in determining the next leg of a directional move for the GBP/USD pair.
Ahead of the high-impact macroeconomic data, the GBP might continue to draw some support from Tuesday's UK data showing a surprise drop in the unemployment rate. This, to a larger extent, overshadowed a jump in the number of people claiming unemployment-related benefits, by 135 K in July, and a sharp deceleration in the wage growth, from the 5.7% YoY rate to 4.5% during the three months to June.
The USD, on the other hand, is undermined by expectations for bigger interest rate cuts by the Fed, bolstered by the softer-than-expected US Producer Price Index (PPI) on Tuesday. Apart from this, a generally positive risk tone keeps the USD bulls on the defensive and should act as a tailwind for the GBP/USD pair. Hence, any meaningful corrective slide might be seen as a buying opportunity and remain limited.
Economic Indicator
Consumer Price Index (YoY)
The United Kingdom (UK) Consumer Price Index (CPI), released by the Office for National Statistics on a monthly basis, is a measure of consumer price inflation – the rate at which the prices of goods and services bought by households rise or fall – produced to international standards. It is the inflation measure used in the government’s target. The YoY reading compares prices in the reference month to a year earlier. Generally, a high reading is seen as bullish for the Pound Sterling (GBP), while a low reading is seen as bearish.
Read more.Next release: Wed Aug 14, 2024 06:00
Frequency: Monthly
Consensus: 2.3%
Previous: 2%
Source: Office for National Statistics
The Bank of England is tasked with keeping inflation, as measured by the headline Consumer Price Index (CPI) at around 2%, giving the monthly release its importance. An increase in inflation implies a quicker and sooner increase of interest rates or the reduction of bond-buying by the BOE, which means squeezing the supply of pounds. Conversely, a drop in the pace of price rises indicates looser monetary policy. A higher-than-expected result tends to be GBP bullish.
- The downside of the Silver price could be restrained due to rising Middle East tensions.
- The BBC reported on Tuesday that the US has deployed a guided missile submarine to the Middle East.
- The lower-than-expected US PPI data have diminished the odds of a bigger rate cut by the Fed in September.
Silver price (XAG/USD) extends its losses for the second consecutive day, trading around $27.70 per troy ounce during Wednesday’s Asian session. This downside of the safe-haven Silver could be attributed to an improved risk-on mood despite rising geopolitical tensions in the Middle East.
The BBC reported on Tuesday that the United States sent a guided missile submarine to the Middle East. Additionally, Israeli forces pressed on with their operations near the southern Gaza city of Khan Younis on Monday. CBC News cited Palestinian medics saying Israeli military strikes on Khan Younis on Monday killed at least 18 people.
The downbeat Producer Price Index (PPI) data from the United States (US) have decreased the bets for a bigger interest rate cut by the US Federal Reserve (Fed) in September. Furthermore, traders will likely observe the US CPI inflation report on Wednesday, which could offer some hints about the Federal Reserve’s (Fed) interest rate cut path.
The US Producer Price Index (PPI) rose 2.2% YoY in July from 2.7% in June, falling short of the market expectation of 2.3%. Meanwhile, the PPI increased 0.1% MoM after rising by 0.2% in June. The Core PPI rose by 2.4% year-on-year in July, against the previous reading of 3.0%. The index fell short of an estimate of 2.7%. The Core PPI remained unchanged.
On Tuesday, Atlanta Fed President Raphael Bostic stated that recent economic data has increased his confidence that the Fed can achieve its 2% inflation target. However, Bostic indicated that additional evidence is required before he would support a reduction in interest rates, according to Reuters.
Silver FAQs
Silver is a precious metal highly traded among investors. It has been historically used as a store of value and a medium of exchange. Although less popular than Gold, traders may turn to Silver to diversify their investment portfolio, for its intrinsic value or as a potential hedge during high-inflation periods. Investors can buy physical Silver, in coins or in bars, or trade it through vehicles such as Exchange Traded Funds, which track its price on international markets.
Silver prices can move due to a wide range of factors. Geopolitical instability or fears of a deep recession can make Silver price escalate due to its safe-haven status, although to a lesser extent than Gold's. As a yieldless asset, Silver tends to rise with lower interest rates. Its moves also depend on how the US Dollar (USD) behaves as the asset is priced in dollars (XAG/USD). A strong Dollar tends to keep the price of Silver at bay, whereas a weaker Dollar is likely to propel prices up. Other factors such as investment demand, mining supply – Silver is much more abundant than Gold – and recycling rates can also affect prices.
Silver is widely used in industry, particularly in sectors such as electronics or solar energy, as it has one of the highest electric conductivity of all metals – more than Copper and Gold. A surge in demand can increase prices, while a decline tends to lower them. Dynamics in the US, Chinese and Indian economies can also contribute to price swings: for the US and particularly China, their big industrial sectors use Silver in various processes; in India, consumers’ demand for the precious metal for jewellery also plays a key role in setting prices.
Silver prices tend to follow Gold's moves. When Gold prices rise, Silver typically follows suit, as their status as safe-haven assets is similar. The Gold/Silver ratio, which shows the number of ounces of Silver needed to equal the value of one ounce of Gold, may help to determine the relative valuation between both metals. Some investors may consider a high ratio as an indicator that Silver is undervalued, or Gold is overvalued. On the contrary, a low ratio might suggest that Gold is undervalued relative to Silver.
- The Japanese Yen gains ground due to safe-haven flows amid Middle East tensions.
- Japan's parliament will hold a special session to discuss the BoJ interest rate hike last month.
- Downbeat US PPI data have boosted the odds for a larger Fed rate cut in September.
The Japanese Yen (JPY) extends its gains against the US Dollar (USD) on Wednesday. The USD/JPY pair faces challenges due to rising expectations of the Bank of Japan (BoJ) hiking rates again in 2024. Japan's parliament is scheduled to hold a special session on August 23 to discuss the Bank of Japan's (BoJ) decision to raise interest rates last month. BoJ Governor Kazuo Ueda is expected to attend the session, according to government sources cited by Reuters.
The safe-haven flows might have contributed support for the Yen amid rising geopolitical tensions in the Middle East. The BBC reported on Tuesday that the United States sent a guided missile submarine to the Middle East.
The US Dollar lost ground following lower-than-expected Producer Price Index (PPI) data from the United States (US) released on Tuesday. This has increased the bets for US Federal Reserve (Fed) interest rate cuts. Investors will likely observe the US CPI inflation report on Wednesday, which could offer some hints about the Federal Reserve’s (Fed) interest rate cut path.
Daily Digest Market Movers: Japanese Yen appreciates due to rising odds of BoJ hiking rates again
- Japanese Prime Minister Fumio Kishida announced at a press conference on Wednesday that he will not seek re-election as the leader of the Liberal Democratic Party (LDP) in September. Kishida emphasized the need to combat Japan's deflation-prone economy by promoting wage and investment growth and achieving the goal of expanding Japan's GDP to ¥600 trillion.
- Rabobank's senior FX strategist, Jane Foley, observes that this week's series of US data releases, along with next week's Jackson Hole event, should provide the market with clearer insights into the potential responses of US policymakers. However, their main expectation is that the Fed will reduce rates by 25 basis points in September and likely cut them again before the end of the year.
- The US Producer Price Index (PPI) rose 2.2% YoY in July from 2.7% in June, falling short of the market expectation of 2.3%. Meanwhile, the PPI increased 0.1% MoM after rising by 0.2% in June. The Core PPI rose by 2.4% year-on-year in July, against the previous reading of 3.0%. The index fell short of an estimate of 2.7%. The Core PPI remained unchanged.
- On Tuesday, Atlanta Fed President Raphael Bostic stated that recent economic data has increased his confidence that the Fed can achieve its 2% inflation target. However, Bostic indicated that additional evidence is required before he would support a reduction in interest rates, according to Reuters.
- On Sunday, Federal Reserve Governor Michelle Bowman stated that she continues to see upside risks for inflation and ongoing strength in the labor market. Bowman suggested that the Federal Reserve may not be prepared to cut rates at its next meeting in September, according to Bloomberg.
- The Bank of Japan’s Summary of Opinions from the Monetary Policy Meeting on July 30 and 31 indicated that several members believe economic activity and prices are evolving as expected by the BoJ. They are aiming for a neutral rate of "at least around 1%" as a medium-term target.
- The minutes from the Bank of Japan's June meeting indicated that some members voiced concerns about rising import prices due to the recent decline in the JPY, which could present an upside risk to inflation. One member highlighted that cost-push inflation might exacerbate underlying inflation if it leads to increased inflation expectations and wage hikes.
Technical Analysis: USD/JPY hovers around 147.00 with an immediate barrier at nine-day EMA
USD/JPY trades around 146.80 on Wednesday. The daily chart analysis shows that the pair remains below the nine-day Exponential Moving Average (EMA), suggesting a bearish trend in the short term. Moreover, the 14-day Relative Strength Index (RSI) is positioned at the 30 level, suggesting a potential for a correction.
For support levels, the USD/JPY pair might test a seven-month low of 141.69, recorded on August 5, followed by a secondary support level at 140.25.
On the upside, the pair could face immediate resistance at the nine-day EMA around 147.45. A breakout above this level might reduce bearish momentum and enable the pair to approach the 50-day EMA at 153.40, with the potential to test the resistance level of 154.50, where previous support has now turned into resistance.
USD/JPY: Daily Chart
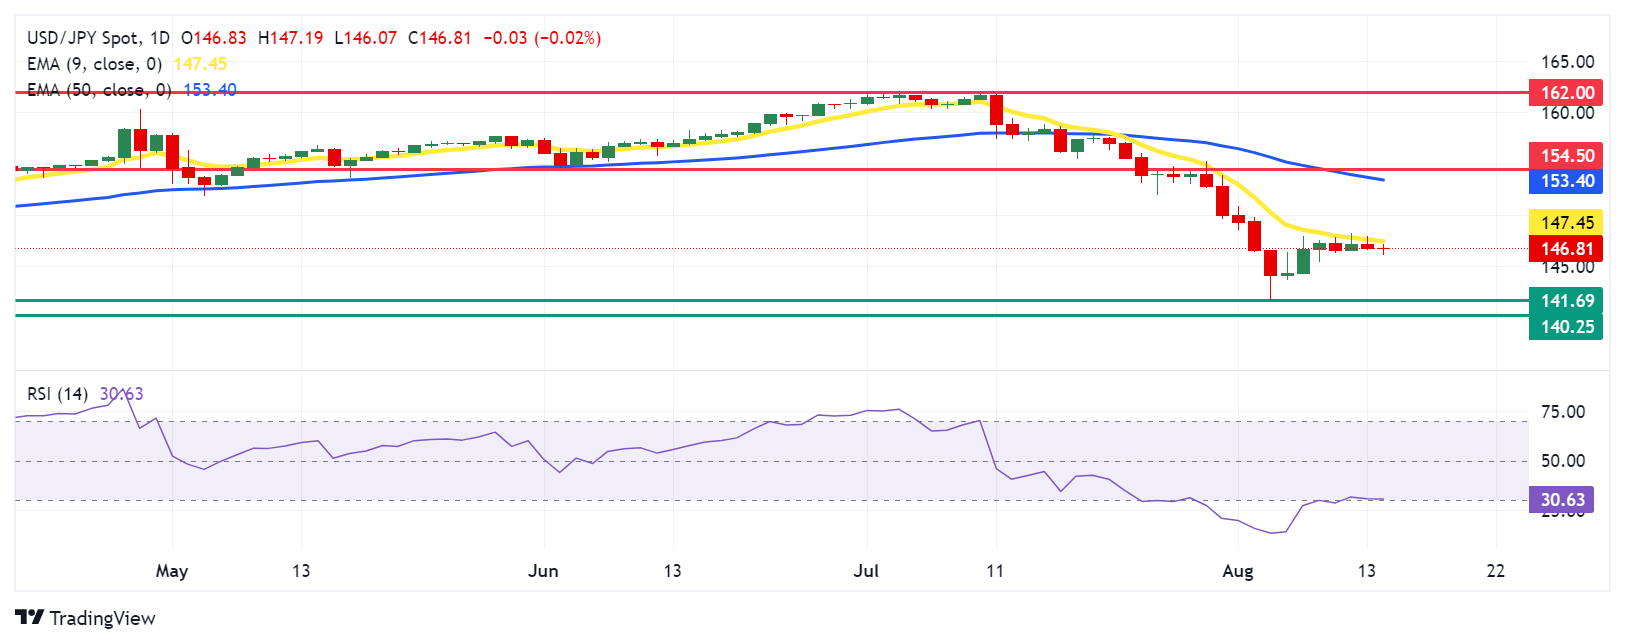
Japanese Yen PRICE Today
The table below shows the percentage change of Japanese Yen (JPY) against listed major currencies today. Japanese Yen was the strongest against the New Zealand Dollar.
| USD | EUR | GBP | JPY | CAD | AUD | NZD | CHF | |
|---|---|---|---|---|---|---|---|---|
| USD | 0.03% | 0.05% | -0.03% | 0.08% | 0.08% | 1.12% | -0.01% | |
| EUR | -0.03% | 0.03% | -0.06% | 0.04% | 0.11% | 1.07% | -0.04% | |
| GBP | -0.05% | -0.03% | -0.06% | 0.05% | 0.09% | 1.08% | -0.03% | |
| JPY | 0.03% | 0.06% | 0.06% | 0.11% | 0.13% | 1.12% | 0.05% | |
| CAD | -0.08% | -0.04% | -0.05% | -0.11% | 0.02% | 1.02% | -0.06% | |
| AUD | -0.08% | -0.11% | -0.09% | -0.13% | -0.02% | 0.97% | -0.14% | |
| NZD | -1.12% | -1.07% | -1.08% | -1.12% | -1.02% | -0.97% | -1.07% | |
| CHF | 0.01% | 0.04% | 0.03% | -0.05% | 0.06% | 0.14% | 1.07% |
The heat map shows percentage changes of major currencies against each other. The base currency is picked from the left column, while the quote currency is picked from the top row. For example, if you pick the Japanese Yen from the left column and move along the horizontal line to the US Dollar, the percentage change displayed in the box will represent JPY (base)/USD (quote).
Bank of Japan FAQs
The Bank of Japan (BoJ) is the Japanese central bank, which sets monetary policy in the country. Its mandate is to issue banknotes and carry out currency and monetary control to ensure price stability, which means an inflation target of around 2%.
The Bank of Japan has embarked in an ultra-loose monetary policy since 2013 in order to stimulate the economy and fuel inflation amid a low-inflationary environment. The bank’s policy is based on Quantitative and Qualitative Easing (QQE), or printing notes to buy assets such as government or corporate bonds to provide liquidity. In 2016, the bank doubled down on its strategy and further loosened policy by first introducing negative interest rates and then directly controlling the yield of its 10-year government bonds.
The Bank’s massive stimulus has caused the Yen to depreciate against its main currency peers. This process has exacerbated more recently due to an increasing policy divergence between the Bank of Japan and other main central banks, which have opted to increase interest rates sharply to fight decades-high levels of inflation. The BoJ’s policy of holding down rates has led to a widening differential with other currencies, dragging down the value of the Yen.
A weaker Yen and the spike in global energy prices have led to an increase in Japanese inflation, which has exceeded the BoJ’s 2% target. With wage inflation becoming a cause of concern, the BoJ looks to move away from ultra loose policy, while trying to avoid slowing the activity too much.
- NZD/JPY plummets around 150 pips intraday in reaction to the RBNZ’s surprise 25 bps rate cut.
- RBNZ Governor Adrian Orr noted that we are going back into a period of low and stable inflation.
- A positive risk tone undermines the safe-haven JPY, albeit does little to lend support to the cross.
The NZD/JPY cross retreats sharply from a nearly two-week high touched during the Asian session on Wednesday and dives to the 88.00 mark after the Reserve Bank of New Zealand (RBNZ) announced its policy decision.
The RBNZ board members decided to cut the Official Cash Rate (OCR) for the first time in over 4 years, by 25 basis points (bps) to 5.25%. This surprise move defies economists' expectations and comes almost a year ahead of the central bank's projections. In the accompanying policy statement, the central bank forecasted more cuts over the coming months, citing the recent progress towards meeting the annual inflation target and weak domestic economic growth. This, in turn, is seen weighing heavily on the New Zealand Dollar (NZD) and exerting downward pressure on the NZD/JPY cross.
In the post-meeting press conference, RBNZ Governor Adrian Orr said that policymakers considered a range of moves and the consensus was for a 25 bps rate cut. Orr added that rates are not back at neutral in the forecast period as projections show that we are going back into a period of low and stable inflation. The comments did little to provide any respite to the NZD bulls, though a positive risk tone undermines the safe-haven Japanese Yen (JPY) and could lend some support to the NZD/JPY cross. That said, the lack of any meaningful buying supports prospects for a further depreciating move.
Investors now look forward to the release of the US consumer inflation figures, due later during the North American session, which could infuse volatility in the financial markets and influence the JPY demand. This, in turn, could provide some impetus to the NZD/JPY cross and produce short-term trading opportunities.
RBNZ FAQs
The Reserve Bank of New Zealand (RBNZ) is the country’s central bank. Its economic objectives are achieving and maintaining price stability – achieved when inflation, measured by the Consumer Price Index (CPI), falls within the band of between 1% and 3% – and supporting maximum sustainable employment.
The Reserve Bank of New Zealand’s (RBNZ) Monetary Policy Committee (MPC) decides the appropriate level of the Official Cash Rate (OCR) according to its objectives. When inflation is above target, the bank will attempt to tame it by raising its key OCR, making it more expensive for households and businesses to borrow money and thus cooling the economy. Higher interest rates are generally positive for the New Zealand Dollar (NZD) as they lead to higher yields, making the country a more attractive place for investors. On the contrary, lower interest rates tend to weaken NZD.
Employment is important for the Reserve Bank of New Zealand (RBNZ) because a tight labor market can fuel inflation. The RBNZ’s goal of “maximum sustainable employment” is defined as the highest use of labor resources that can be sustained over time without creating an acceleration in inflation. “When employment is at its maximum sustainable level, there will be low and stable inflation. However, if employment is above the maximum sustainable level for too long, it will eventually cause prices to rise more and more quickly, requiring the MPC to raise interest rates to keep inflation under control,” the bank says.
In extreme situations, the Reserve Bank of New Zealand (RBNZ) can enact a monetary policy tool called Quantitative Easing. QE is the process by which the RBNZ prints local currency and uses it to buy assets – usually government or corporate bonds – from banks and other financial institutions with the aim to increase the domestic money supply and spur economic activity. QE usually results in a weaker New Zealand Dollar (NZD). QE is a last resort when simply lowering interest rates is unlikely to achieve the objectives of the central bank. The RBNZ used it during the Covid-19 pandemic.
- WTI trades in negative territory near $77.20 in Wednesday’s Asian session.
- Less fears of a wider Middle East war and slowing global demand concerns undermine the WTI price.
- API reported a significant fall in US crude inventories last week.
West Texas Intermediate (WTI), the US crude oil benchmark, is trading around $77.20 on Wednesday. WTI price edges lower on the back of easing fears of a wider Middle East war and concerns about the strength of global oil demand.
The ongoing geopolitical tensions in the Middle East could raise the fear of crude oil supply disruptions from a leading oil-producing region, but the wider war seemed less likely as Iran suggested renewed cease-fire talks with Hamas could prevent retaliation.
The International Energy Agency (IEA) forecasted that growth in crude oil demand would slow as the summer US driving season ended in the coming weeks, and be further covered when planned production increases hit the market later this year. Meanwhile, the Organization of the Petroleum Exporting Countries (OPEC) lowered its prediction for global oil demand growth in 2024, citing weaker-than-expected data from the first half of the year and less optimism for the Chinese economy.
The US crude inventories declined significantly last week. According to the American Petroleum Institute (API), crude oil stockpiles in the United States for the week ending August 9 fell by 5.205 million barrels, compared to an increase of 0.18 million barrels in the previous week. The market consensus estimated that stocks would decline by 2.0 million barrels.
On the other hand, the expectation of the interest rate cut by the US Federal Reserve (Fed) might boost the black gold. Traders anticipate a 25 basis point (bps) rate cut in September, followed by similar reductions in November and December. Atlanta Fed President Raphael Bostic said on Tuesday that recent economic data made him "more confident" that the Fed can get inflation back to its 2% target. Still, more evidence is needed before he's ready to support lowering interest rates. The US Consumer Price Index (CPI) for July, which is due on Wednesday, will be closely monitored and could offer some hints about the interest rate outlook.
WTI Oil FAQs
WTI Oil is a type of Crude Oil sold on international markets. The WTI stands for West Texas Intermediate, one of three major types including Brent and Dubai Crude. WTI is also referred to as “light” and “sweet” because of its relatively low gravity and sulfur content respectively. It is considered a high quality Oil that is easily refined. It is sourced in the United States and distributed via the Cushing hub, which is considered “The Pipeline Crossroads of the World”. It is a benchmark for the Oil market and WTI price is frequently quoted in the media.
Like all assets, supply and demand are the key drivers of WTI Oil price. As such, global growth can be a driver of increased demand and vice versa for weak global growth. Political instability, wars, and sanctions can disrupt supply and impact prices. The decisions of OPEC, a group of major Oil-producing countries, is another key driver of price. The value of the US Dollar influences the price of WTI Crude Oil, since Oil is predominantly traded in US Dollars, thus a weaker US Dollar can make Oil more affordable and vice versa.
The weekly Oil inventory reports published by the American Petroleum Institute (API) and the Energy Information Agency (EIA) impact the price of WTI Oil. Changes in inventories reflect fluctuating supply and demand. If the data shows a drop in inventories it can indicate increased demand, pushing up Oil price. Higher inventories can reflect increased supply, pushing down prices. API’s report is published every Tuesday and EIA’s the day after. Their results are usually similar, falling within 1% of each other 75% of the time. The EIA data is considered more reliable, since it is a government agency.
OPEC (Organization of the Petroleum Exporting Countries) is a group of 13 Oil-producing nations who collectively decide production quotas for member countries at twice-yearly meetings. Their decisions often impact WTI Oil prices. When OPEC decides to lower quotas, it can tighten supply, pushing up Oil prices. When OPEC increases production, it has the opposite effect. OPEC+ refers to an expanded group that includes ten extra non-OPEC members, the most notable of which is Russia.
Reserve Bank of New Zealand’s (RBNZ) Governor Adrian Orr explains the dovish policy pivot at a press conference, following the surprise announcement of a 25 basis point (bps) interest-rate cut on Wednesday.
Orr is responding to questions from the press conference.
Key quotes
We are confident inflation back in its target band can commence re-normalize rates.
We considered a range of moves, consensus was for 25 bps.
Keen to see actual inflation data.
Rates not back at neutral in the forecast period.
We had no pressure from lawmakers on rates.
Projections show we are going back into period of low and stable inflation.
Broad range of indicators are consistently soft.
Reasonable first step for monetary easing, in strong position to move calmly.
Remarkably pleased with how economy has panned out with our forecasts.
High frequency data show economy weakening.
developing story ....
Market reaction to RBNZ Orr’s presser
NZD/USD is accelerating its decline to near 0.6115 on Orr’s comments, down 1.05% on the day.
RBNZ FAQs
The Reserve Bank of New Zealand (RBNZ) is the country’s central bank. Its economic objectives are achieving and maintaining price stability – achieved when inflation, measured by the Consumer Price Index (CPI), falls within the band of between 1% and 3% – and supporting maximum sustainable employment.
The Reserve Bank of New Zealand’s (RBNZ) Monetary Policy Committee (MPC) decides the appropriate level of the Official Cash Rate (OCR) according to its objectives. When inflation is above target, the bank will attempt to tame it by raising its key OCR, making it more expensive for households and businesses to borrow money and thus cooling the economy. Higher interest rates are generally positive for the New Zealand Dollar (NZD) as they lead to higher yields, making the country a more attractive place for investors. On the contrary, lower interest rates tend to weaken NZD.
Employment is important for the Reserve Bank of New Zealand (RBNZ) because a tight labor market can fuel inflation. The RBNZ’s goal of “maximum sustainable employment” is defined as the highest use of labor resources that can be sustained over time without creating an acceleration in inflation. “When employment is at its maximum sustainable level, there will be low and stable inflation. However, if employment is above the maximum sustainable level for too long, it will eventually cause prices to rise more and more quickly, requiring the MPC to raise interest rates to keep inflation under control,” the bank says.
In extreme situations, the Reserve Bank of New Zealand (RBNZ) can enact a monetary policy tool called Quantitative Easing. QE is the process by which the RBNZ prints local currency and uses it to buy assets – usually government or corporate bonds – from banks and other financial institutions with the aim to increase the domestic money supply and spur economic activity. QE usually results in a weaker New Zealand Dollar (NZD). QE is a last resort when simply lowering interest rates is unlikely to achieve the objectives of the central bank. The RBNZ used it during the Covid-19 pandemic.
- The US Consumer Price Index is forecast to rise 2.9% YoY in July, at a softer pace than June’s 3% increase.
- Annual core CPI inflation is expected to soften to 3.2%.
- The inflation data could influence the probability of a 50 bps Fed rate cut in September.
The Bureau of Labor Statistics (BLS) will publish the highly anticipated Consumer Price Index (CPI) inflation data from the United States (US) for July on Wednesday at 12:30 GMT.
The US Dollar (USD) braces for intense volatility, as any surprises from the US inflation report could significantly impact the market’s pricing of the Federal Reserve (Fed) interest rate cut expectations in September.
What to expect in the next CPI data report?
Inflation in the US, as measured by the CPI, is expected to increase at an annual rate of 2.9% in July, down slightly from the 3% rise reported in June. The core CPI inflation, which excludes volatile food and energy prices, is seen ticking down to 3.2% from 3.3% in the same period.
Meanwhile, the US CPI is set to rise 0.2% MoM in July after declining by 0.1% in June. Finally, the monthly core CPI inflation is forecast to print 0.2%.
The disappointing jobs report from the US, which showed that Nonfarm Payrolls rose 114,000 in July, revived expectations for the Federal Reserve to cut the policy rate multiple times this year starting in September. Following the July 30-31 policy meeting, Fed Chairman Jerome Powell refrained from confirming a rate cut in September but noted that there was a “real discussion” about lowering the policy rate at that meeting. Additionally, Powell acknowledged that they are attentive to risks on both sides of the dual mandate.
According to the CME FedWatch Tool, markets are currently pricing in a nearly 50% probability of a 50 basis points (bps) rate cut in September.
Previewing the July inflation data, “while gaining some momentum, we expect core CPI prices to remain largely under control in July after registering an unexpected contraction in June,” said TD Securities analysts in a weekly report and added:
“Headline inflation likely strengthened m/m as well as energy prices are expected to rebound post sharp declines in May/Jun. Our unrounded core CPI forecast at 0.14% m/m suggests larger risks toward a rounded 0.2% increase.”
How could the US Consumer Price Index report affect EUR/USD?
The market anticipation of a 50 bps Fed rate cut in September will be put to test when July inflation data is released. In case the monthly core CPI, which is not distorted by base effects and the prices of volatile items, rises 0.3% or more, investors could lean towards a 25 bps rate reduction at the next Fed meeting. The market positioning suggests that such a reading could trigger a rebound in the US Treasury bond yields and help the US Dollar (USD) gather strength against its rivals with the immediate reaction.
If the monthly core CPI rises less than expected, market participants could remain hopeful about a 50 bps cut in September. In this scenario, the USD is likely to come under renewed selling pressure.
Eren Sengezer, European Session Lead Analyst at FXStreet, offers a brief technical outlook for EUR/USD and explains: “EUR/USD’s near-term technical picture suggests that the bullish bias remains intact, with the Relative Strength Index (RSI) indicator on the daily chart holding comfortably above 50. Additionally, the pair staged a decisive rebound after testing the 20-day SMA last week, reflecting the sellers’ hesitancy to commit to an extended decline.”
“On the upside, 1.0950 (static level) aligns as interim resistance before 1.1000 (psychological level, static level). If EUR/USD manages to flip 1.1000 into support, it could target 1.1140 (December 28, 2023, high) next. Looking south, immediate support could be identified at 1.0880 (20-day SMA) ahead of 1.0830 (200-day SMA) and 1.0800 (100-day SMA).”
Economic Indicator
Consumer Price Index (YoY)
Inflationary or deflationary tendencies are measured by periodically summing the prices of a basket of representative goods and services and presenting the data as The Consumer Price Index (CPI). CPI data is compiled on a monthly basis and released by the US Department of Labor Statistics. The YoY reading compares the prices of goods in the reference month to the same month a year earlier.The CPI is a key indicator to measure inflation and changes in purchasing trends. Generally speaking, a high reading is seen as bullish for the US Dollar (USD), while a low reading is seen as bearish.
Read more.Next release: Wed Aug 14, 2024 12:30
Frequency: Monthly
Consensus: 2.9%
Previous: 3%
Source: US Bureau of Labor Statistics
The US Federal Reserve has a dual mandate of maintaining price stability and maximum employment. According to such mandate, inflation should be at around 2% YoY and has become the weakest pillar of the central bank’s directive ever since the world suffered a pandemic, which extends to these days. Price pressures keep rising amid supply-chain issues and bottlenecks, with the Consumer Price Index (CPI) hanging at multi-decade highs. The Fed has already taken measures to tame inflation and is expected to maintain an aggressive stance in the foreseeable future.
Speaking at a press conference on Wednesday, Japanese Prime Minister (PM) Fumio Kishida said that he “won't run for re-election as Liberal Democratic Party (LDP) leader.
Additional quotes
Important to show new face of LDP in the leadership race.
First step to do so is for me to step down.
Will fully support new leader.
Made this decision considering what's best for public.
Have no hesitation in taking responsibility as head of LDP for issues caused by members.
Not appropriate for me as leader who is stepping down to comment on successor.
- USD/CAD attracts some buyers near 1.3700, though the attempted recovery lacks follow-through.
- An uptick in Oil prices underpins the Loonie and acts as a headwind amid subdued USD price action.
- Traders also seem reluctant to place aggressive bets ahead of the crucial US consumer inflation data.
The USD/CAD pair bounces off a nearly four-week trough touched during the Asian session on Wednesday and reverses a part of the previous day's downfall. Spot prices manage to hold above the 1.3700 mark, though lack bullish conviction, warranting some caution before positioning for any meaningful recovery.
Crude Oil prices regain positive traction amid estimates of a fall in US inventories and the risk of a broadening conflict in the Middle East, which is seen underpinning the commodity-linked Loonie and acting as a headwind for the USD/CAD pair. The American Petroleum Institute (API) data showed on Tuesday that US crude stocks shrunk by 5.21 million barrels during the week ended August 9, suggesting higher demand in the world's biggest oil consumer.
Meanwhile, the US Dollar (USD) languishes near its lowest level in over a week amid expectations for deeper interest rate cuts by the Federal Reserve (Fed), bolstered by a softer-than-expected US Producer Price Index (PPI) data on Tuesday. In fact, the US Bureau of Labor Statistics reported on Tuesday that the Producer Price Index (PPI) for final demand decelerated sharply from the 2.7% YoY rate to 2.2% in July, suggesting that inflation continues to moderate.
The weaker reading lifted bets for a bigger, 50 basis points (bps) rate cut by the Fed in September and dragged the US Treasury bond yields lower across the board. This, along with the risk-on mood, continues to weigh on the safe-haven buck and contributes to capping the upside for the USD/CAD pair. Hence, the intraday uptick could be solely attributed to some repositioning trade ahead of the crucial US consumer inflation figures, due for release later this Wednesday.
US Dollar PRICE Today
The table below shows the percentage change of US Dollar (USD) against listed major currencies today. US Dollar was the strongest against the New Zealand Dollar.
| USD | EUR | GBP | JPY | CAD | AUD | NZD | CHF | |
|---|---|---|---|---|---|---|---|---|
| USD | 0.01% | 0.04% | -0.25% | 0.07% | 0.05% | 0.73% | -0.11% | |
| EUR | -0.01% | 0.02% | -0.27% | 0.04% | 0.09% | 0.69% | -0.11% | |
| GBP | -0.04% | -0.02% | -0.26% | 0.05% | 0.07% | 0.70% | -0.10% | |
| JPY | 0.25% | 0.27% | 0.26% | 0.34% | 0.34% | 0.97% | 0.21% | |
| CAD | -0.07% | -0.04% | -0.05% | -0.34% | 0.00% | 0.64% | -0.13% | |
| AUD | -0.05% | -0.09% | -0.07% | -0.34% | 0.00% | 0.60% | -0.18% | |
| NZD | -0.73% | -0.69% | -0.70% | -0.97% | -0.64% | -0.60% | -0.77% | |
| CHF | 0.11% | 0.11% | 0.10% | -0.21% | 0.13% | 0.18% | 0.77% |
The heat map shows percentage changes of major currencies against each other. The base currency is picked from the left column, while the quote currency is picked from the top row. For example, if you pick the US Dollar from the left column and move along the horizontal line to the Japanese Yen, the percentage change displayed in the box will represent USD (base)/JPY (quote).
- The AUD/NZD lost ground following the RBNZ's unexpected 25 basis point rate cut on Wednesday.
- The RBNZ Monetary Policy Statement indicates that inflation is decreasing and returning to the 1-3% target range.
- The Australian Dollar advances due to the decreasing likelihood of an RBA rate cut soon.
AUD/NZD breaks its three-day losing streak, trading around 1.0990 during the Asian session on Wednesday. This upward movement is attributed to the Reserve Bank of New Zealand's (RBNZ) unexpected decision to cut its Official Cash Rate (OCR) by 25 basis points to 5.25% at its August meeting. Traders are looking forward to further insights from the press conference and RBNZ Governor Adrian Orr’s speech scheduled for later in the day.
According to the RBNZ Monetary Policy Statement (MPS) summary, inflation is decreasing and returning to the 1-3% target range. Service sector inflation is anticipated to drop further. The committee's decision on additional easing will depend on their confidence that pricing behavior remains aligned with a low inflation environment. The Consumer Price Index (CPI) is expected to stay around the target midpoint in the foreseeable future.
On the Aussie front, recent data shows that Australian wage growth remained elevated in the second quarter, prompting the Reserve Bank of Australia (RBA) to adopt a hawkish stance regarding its policy outlook. This has been supporting the Australian Dollar (AUD) and underpinning the AUD/NZD cross.
Last week, RBA Governor Michele Bullock ruled out the possibility of rate cuts for the next six months. Bullock emphasized that the Australian central bank remains vigilant about inflation risks and is ready to raise rates again if needed.
Economic Indicator
RBNZ Interest Rate Decision
The Reserve Bank of New Zealand (RBNZ) announces its interest rate decision after its seven scheduled annual policy meetings. If the RBNZ is hawkish and sees inflationary pressures rising, it raises the Official Cash Rate (OCR) to bring inflation down. This is positive for the New Zealand Dollar (NZD) since higher interest rates attract more capital inflows. Likewise, if it reaches the view that inflation is too low it lowers the OCR, which tends to weaken NZD.
Read more.Last release: Wed Aug 14, 2024 02:00
Frequency: Irregular
Actual: 5.25%
Consensus: 5.5%
Previous: 5.5%
Source: Reserve Bank of New Zealand
The Reserve Bank of New Zealand (RBNZ) holds monetary policy meetings seven times a year, announcing their decision on interest rates and the economic assessments that influenced their decision. The central bank offers clues on the economic outlook and future policy path, which are of high relevance for the NZD valuation. Positive economic developments and upbeat outlook could lead the RBNZ to tighten the policy by hiking interest rates, which tends to be NZD bullish. The policy announcements are usually followed by Governor Adrian Orr’s press conference.
- Gold price turns lower for the second straight day, though the downside seems limited.
- A positive risk tone is seen undermining the safe-haven metal ahead of the US CPI report.
- Geopolitical risks, bets for bigger Fed rate cuts and subdued USD demand to lend support.
Gold price (XAU/USD) ended in the red on Tuesday as bulls opted to take some profits off the table following the recent gains registered over the past three days and ahead of the key US inflation data. The commodity remains under some selling pressure for the second straight day on Wednesday, though fears about a wider Middle East conflict and dovish Federal Reserve (Fed) expectations should help limit any further losses.
The US macro data published on Tuesday suggested that inflation continues to moderate and supports prospects for deeper interest rate cuts by the Fed. This keeps the US Dollar (USD) bulls on the defensive near a one-week low and provides a modest lift to the non-yielding yellow metal. That said, a generally positive risk tone might cap gains for the safe-haven XAU/USD and warrant some caution for aggressive bullish traders.
Daily Digest Market Movers: Gold price is unlikely to witness any meaningful downfall amid Middle East tensions, Fed rate cut bets
- Gold price trades with modest losses for the second straight day on Wednesday, albeit lacking follow-through and remains well within striking distance of the all-time high touched in July.
- A Hamas official said on Tuesday that the group had decided not to participate in the talks because its leaders do not think the Israeli government has been negotiating in good faith.
- Iranian officials told Reuters that only a ceasefire deal in Gaza would hold Iran back from direct retaliation against Israel for the assassination of Hamas leader Ismail Haniyeh on its soil.
- The development increases the risk of a broader Middle East war and should act as a tailwind for the safe-haven metal amid bets for bigger interest rate cuts by the Federal Reserve.
- The US Bureau of Labor Statistics reported on Tuesday that the Producer Price Index (PPI) for final demand rose by 2.2% on a yearly basis in July, down from 2.7% in the previous month.
- On a monthly basis, the PPI increased 0.1%, while the core PPI (that excludes volatile food and energy components) missed estimates and remained flat during the reported month.
- The softer data provided more evidence of cooling inflation and opened the door for the Fed to begin its policy-easing cycle, triggering a fresh leg down in the US Treasury bond yields.
- Atlanta Fed President Raphael Bostic reiterated on Tuesday that he’ll likely be ready to cut by the end of the year, though he wants to see a little more data before supporting the move.
- The US Dollar languishes near its lowest level in over a week and could further benefit the XAU/USD as the focus now shifts to the closely-watched US Consumer Price Index (CPI).
- The headline CPI is anticipated to ease from the 3.0% YoY rate to 2.9% in July and the core CPI is seen coming in at 3.2% as compared to the 3.3% rise recorded in June.
- A weaker reading will further lift bets for a 50-basis points Fed rate cut in September and weigh on the Greenback, paving the way for further gains for the non-yielding yellow metal.
Technical Analysis: Gold price seems poised to surpass the record peak and climb further towards $2,500
From a technical perspective, the recent rally from the 50-day Simple Moving Average (SMA) support and positive oscillators on the daily chart favor bullish traders. Hence, any meaningful slide might still be seen as a buying opportunity and remain limited. The Gold price seems poised to retest the record high, around the $2,483-2,484 area, and aim to conquer the $2,500 psychological mark. A sustained strength beyond the latter will mark a fresh breakout through a broader trading range held over the past month or so and set the stage for a further near-term appreciating move.
On the flip side, the $2,450-2,448 resistance breakpoint now seems to protect the immediate downside, below which the Gold price could slide back to the weekly low, around the $2,424-2,423 region touched on Monday. The next relevant support is pegged near the $2,412-2,410 area ahead of the $2,400 round-figure mark. Failure to defend the said support levels might turn the XAU/USD vulnerable to challenge the 50-day Simple Moving Average (SMA) support near the $2,378-2,379 region. Some follow-through selling might shift the bias in favor of bearish traders and expose the 100-day SMA support, currently near the $2,358-2,357 area. This is closely followed by the late July low, around the $2,353-2,352 area, which if broken should pave the way for deeper losses.
Gold FAQs
Gold has played a key role in human’s history as it has been widely used as a store of value and medium of exchange. Currently, apart from its shine and usage for jewelry, the precious metal is widely seen as a safe-haven asset, meaning that it is considered a good investment during turbulent times. Gold is also widely seen as a hedge against inflation and against depreciating currencies as it doesn’t rely on any specific issuer or government.
Central banks are the biggest Gold holders. In their aim to support their currencies in turbulent times, central banks tend to diversify their reserves and buy Gold to improve the perceived strength of the economy and the currency. High Gold reserves can be a source of trust for a country’s solvency. Central banks added 1,136 tonnes of Gold worth around $70 billion to their reserves in 2022, according to data from the World Gold Council. This is the highest yearly purchase since records began. Central banks from emerging economies such as China, India and Turkey are quickly increasing their Gold reserves.
Gold has an inverse correlation with the US Dollar and US Treasuries, which are both major reserve and safe-haven assets. When the Dollar depreciates, Gold tends to rise, enabling investors and central banks to diversify their assets in turbulent times. Gold is also inversely correlated with risk assets. A rally in the stock market tends to weaken Gold price, while sell-offs in riskier markets tend to favor the precious metal.
The price can move due to a wide range of factors. Geopolitical instability or fears of a deep recession can quickly make Gold price escalate due to its safe-haven status. As a yield-less asset, Gold tends to rise with lower interest rates, while higher cost of money usually weighs down on the yellow metal. Still, most moves depend on how the US Dollar (USD) behaves as the asset is priced in dollars (XAU/USD). A strong Dollar tends to keep the price of Gold controlled, whereas a weaker Dollar is likely to push Gold prices up.
| Raw materials | Closed | Change, % |
|---|---|---|
| Silver | 27.851 | -0.32 |
| Gold | 246.544 | -0.2 |
| Palladium | 938.35 | 2.37 |
- The Indian Rupee loses ground in Wednesday’s early Asian session.
- Higher crude oil prices and risk aversion dent sentiment and weigh on the INR.
- The Indian WPI inflation and US CPI will be closely watched on Wednesday.
The Indian Rupee (INR) edges lower on Wednesday despite the decline of the US Dollar (USD). The weak domestic markets and the rise of crude oil prices weighed on investor sentiments and dragged the INR lower. Furthermore, risk aversion in the markets amid escalating geopolitical tension in the Middle East limits the local currency’s upside.
On the other hand, the Reserve Bank of India (RBI) is likely to sell USD to stabilize and prevent the INR from a more significant depreciation. Investors will keep an eye on India’s Wholesale Price Index (WPI) inflation, Fuel and Food reports for July. On the US front, the Consumer Price Index (CPI) could offer some hints about the interest rate outlook.
Daily Digest Market Movers: Indian Rupee weakens ahead of PPI report
- The Indian Wholesale Price Index (WPI) inflation is estimated to ease from 3.36% YoY in June to 2.39% in July.
- India and Russia are looking at establishing a benchmark Rupee-Ruble exchange rate to allow direct trade between the two countries, rather than using the USD due to Western sanctions on Moscow, according to the Economic Times.
- The US Producer Price Index (PPI) for final demand in the US came in softer than expected at 2.2% YoY in July, from 2.7% in June, according to the Bureau of Labor Statistics on Tuesday.
- The core PPI, which excludes volatile food and energy prices, rose 2.4% YoY in July, compared to the previous reading of 3.0%, lower than the market consensus of 2.7%.
- On a monthly basis, the headline PPI rose 0.1% in July, while the core PPI remained unchanged in the same period.
- Atlanta Fed President Raphael Bostic said on Tuesday that he is looking for “a little more data” before supporting lower interest rates.
Technical Analysis: USD/INR’s bullish bias persists in the longer term
Indian Rupee trades weaker on the day. According to the daily chart, the positive stance of the USD/INR pair prevails as the pair remains well above the key 100-day Exponential Moving Average (EMA) and the two-month-old uptrend line. The upward momentum is reinforced by the 14-day Relative Strength Index (RSI), which holds above the midline near 60.50, indicating bullish momentum still dominates.
The key upside barrier for USD/INR appears near the 84.00 psychological mark. A sustained move above this level would signal further upside towards the next hurdle at the all-time high of 84.24.
On the downside, the uptrend line at 83.85 appears to be providing some support to the pair. If the price fails to hold this support level, it would pave the way to the 100-day EMA at 83.53.
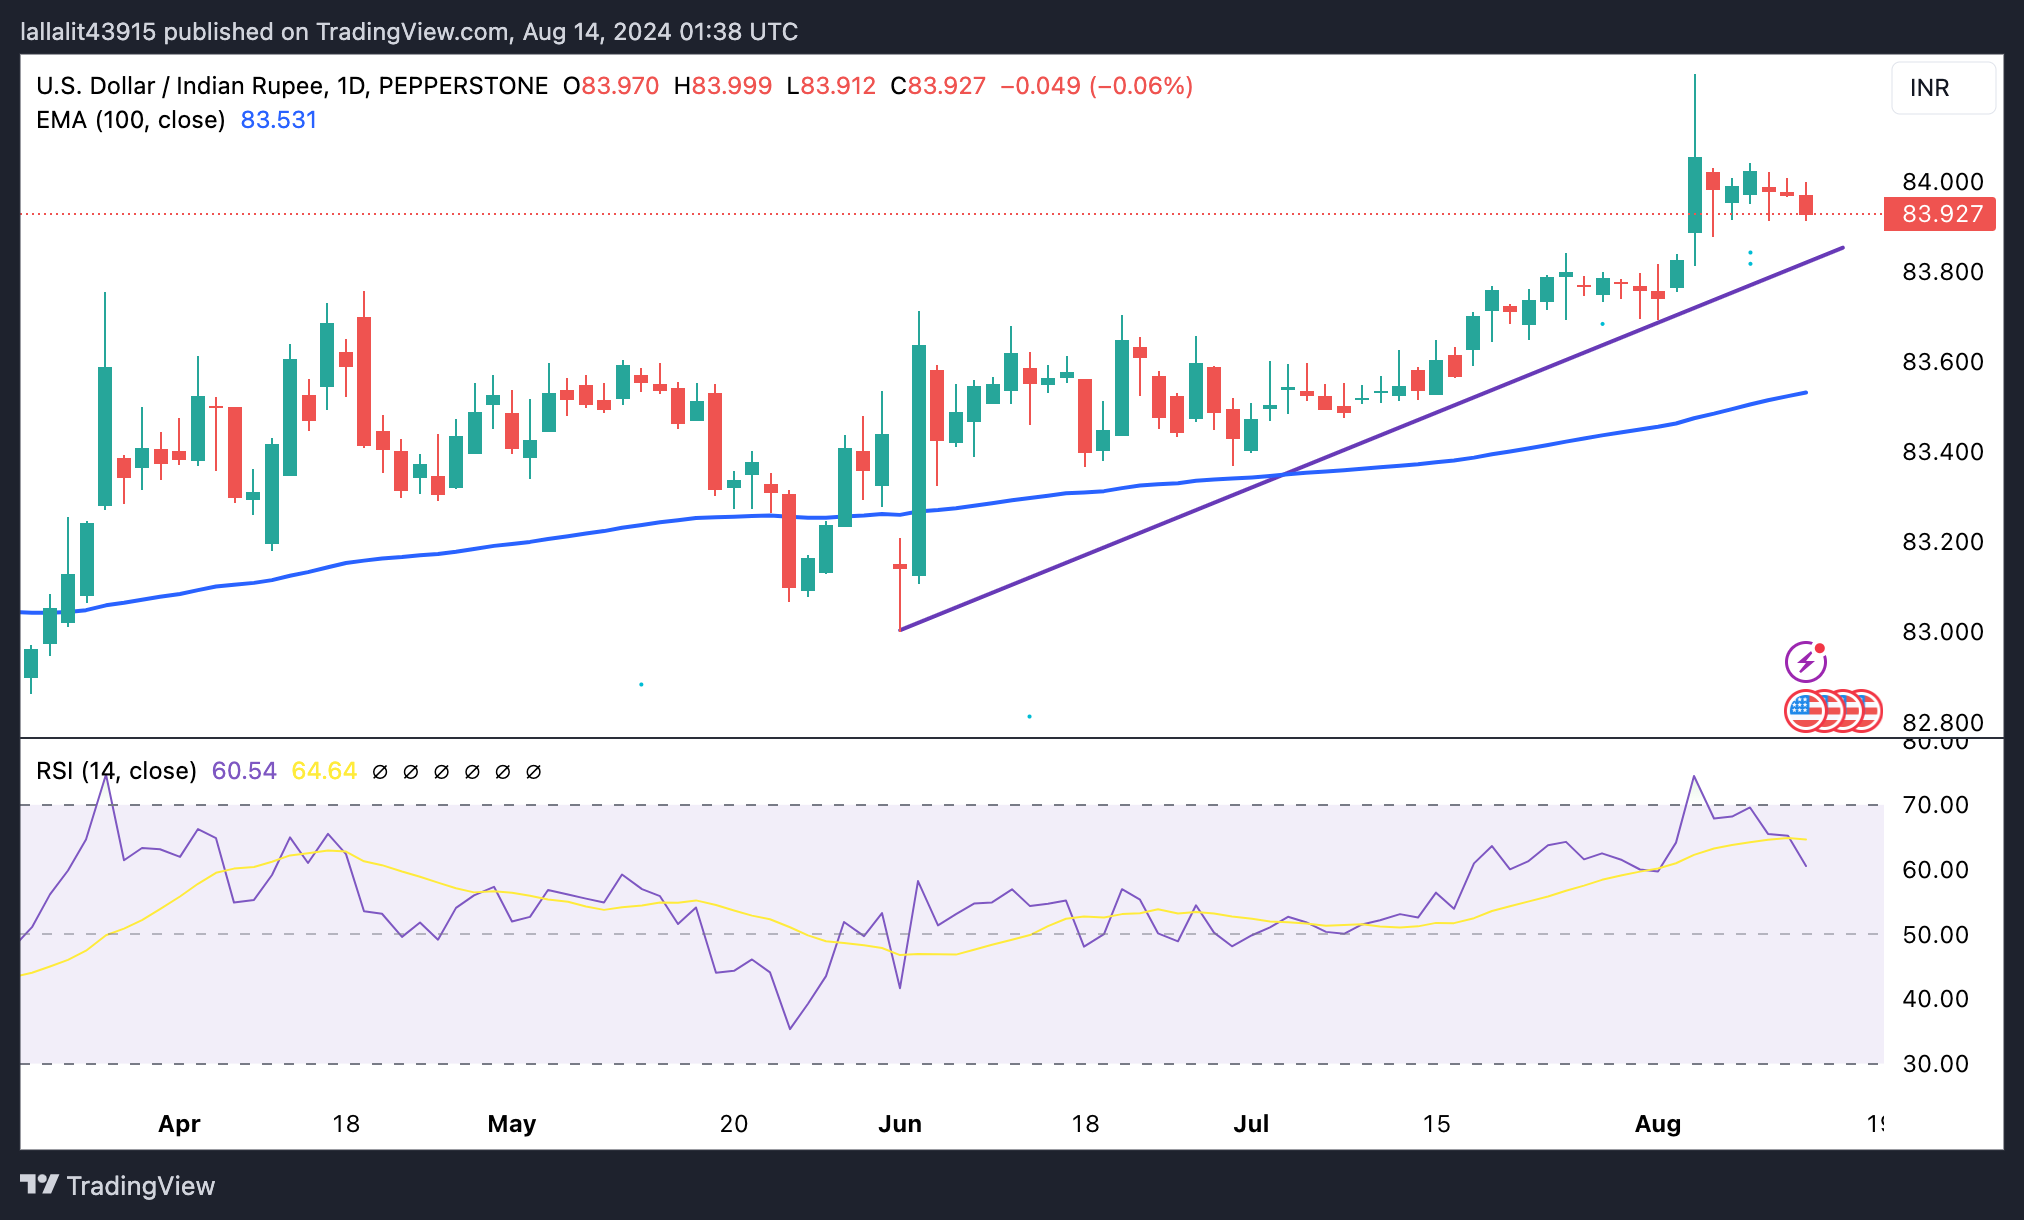
US Dollar price today
The table below shows the percentage change of US Dollar (USD) against listed major currencies today. US Dollar was the strongest against the .
| USD | EUR | GBP | CAD | AUD | JPY | NZD | CHF | |
| USD | 0.04% | 0.07% | 0.03% | 0.18% | -0.33% | 0.81% | -0.11% | |
| EUR | -0.04% | 0.02% | -0.01% | 0.11% | -0.36% | 0.75% | -0.13% | |
| GBP | -0.07% | -0.02% | -0.03% | 0.09% | -0.38% | 0.74% | -0.18% | |
| CAD | -0.03% | 0.01% | 0.03% | 0.13% | -0.35% | 0.78% | -0.15% | |
| AUD | -0.18% | -0.14% | -0.13% | -0.15% | -0.52% | 0.57% | -0.32% | |
| JPY | 0.36% | 0.39% | 0.35% | 0.31% | 0.48% | 1.14% | 0.23% | |
| NZD | -0.80% | -0.77% | -0.74% | -0.73% | -0.64% | -1.12% | -0.90% | |
| CHF | 0.09% | 0.16% | 0.19% | 0.16% | 0.29% | -0.23% | 0.91% |
The heat map shows percentage changes of major currencies against each other. The base currency is picked from the left column, while the quote currency is picked from the top row. For example, if you pick the Euro from the left column and move along the horizontal line to the Japanese Yen, the percentage change displayed in the box will represent EUR (base)/JPY (quote).
Indian Rupee FAQs
The Indian Rupee (INR) is one of the most sensitive currencies to external factors. The price of Crude Oil (the country is highly dependent on imported Oil), the value of the US Dollar – most trade is conducted in USD – and the level of foreign investment, are all influential. Direct intervention by the Reserve Bank of India (RBI) in FX markets to keep the exchange rate stable, as well as the level of interest rates set by the RBI, are further major influencing factors on the Rupee.
The Reserve Bank of India (RBI) actively intervenes in forex markets to maintain a stable exchange rate, to help facilitate trade. In addition, the RBI tries to maintain the inflation rate at its 4% target by adjusting interest rates. Higher interest rates usually strengthen the Rupee. This is due to the role of the ‘carry trade’ in which investors borrow in countries with lower interest rates so as to place their money in countries’ offering relatively higher interest rates and profit from the difference.
Macroeconomic factors that influence the value of the Rupee include inflation, interest rates, the economic growth rate (GDP), the balance of trade, and inflows from foreign investment. A higher growth rate can lead to more overseas investment, pushing up demand for the Rupee. A less negative balance of trade will eventually lead to a stronger Rupee. Higher interest rates, especially real rates (interest rates less inflation) are also positive for the Rupee. A risk-on environment can lead to greater inflows of Foreign Direct and Indirect Investment (FDI and FII), which also benefit the Rupee.
Higher inflation, particularly, if it is comparatively higher than India’s peers, is generally negative for the currency as it reflects devaluation through oversupply. Inflation also increases the cost of exports, leading to more Rupees being sold to purchase foreign imports, which is Rupee-negative. At the same time, higher inflation usually leads to the Reserve Bank of India (RBI) raising interest rates and this can be positive for the Rupee, due to increased demand from international investors. The opposite effect is true of lower inflation.
- United Kingdom’s CPI is foreseen to tick higher in July to 2.3% YoY.
- The Bank of England acknowledged the battle against inflation is not done.
- The Pound Sterling advances against the US Dollar ahead of key data.
The United Kingdom (UK) will release the Consumer Price Index (CPI) for July on Wednesday, a high-impact macroeconomic event. The data, published by the Office for National Statistics (ONS), directly influences the Bank of England (BoE) monetary policy decision and, hence, the Sterling Pound (GBP).
When policymakers met at the end of July, the BoE trimmed the Bank Rate by 25 basis points (bps) to 5%, as inflation, as measured by the CPI, stood at 2% in May and June, meeting the central bank’s goal.
What to expect from the next UK inflation report?
The UK CPI is expected to have risen at an annual pace of 2.3% in July, above the preferred 2%. Core annual inflation, however, is foreseen at 3.4%, below the 3.5% posted in June.
Nevertheless, the figures are in line with what the central bank anticipated in its latest meeting. The Monetary Policy Committee (MPC) stated that “CPI inflation is expected to increase to around 2¾% in the second half of this year, as declines in energy prices last year fall out of the annual comparison, revealing more clearly the prevailing persistence of domestic inflationary pressures. Private sector regular average weekly earnings growth has fallen to 5.6% in the three months to May, and services consumer price inflation has declined to 5.7% in June.”
Even further, the meeting Minutes showed that the Committee “discussed developments in internationally traded goods prices, noting the presence of a range of risks that could be material for the UK inflation outlook.”
With that in mind, an uptick in inflation figures would not mean an imminent interest rate hike, as policymakers are well aware the road is still bumpy. On the other hand, a rate cut is also out of the picture for now: “Monetary policy will need to continue to remain restrictive for sufficiently long until the risks to inflation returning sustainably to the 2% target in the medium term have dissipated further.”
The main focus will be on services inflation, which held steady at 5.7% year-over-year (YoY) in June after rising by more than expected for two months in a row. Easing services inflation will be read as good news and seen as anticipation of a potential rate cut when the BoE meets in November.
When will the UK Consumer Price Index report be released and how could it affect GBP/USD?
In the present scenario, upcoming UK CPI data will likely be taken with a pinch of salt. As said, the expected increase in annual inflation figures won’t twist policymakers’ hands but instead fall within expectations. Higher-than-expected figures, however, may spur speculation about a more hawkish BoE and a potential delay for the next interest rate cut to 2025. In such a case, the Pound Sterling may edge higher against its major rivals.
The opposite case is also valid: a lower-than-anticipated outcome in CPI figures will boost the odds for a soon-to-come rate cut and weigh on the British currency. There is still another – quite unlikely – scenario: Annual CPI falling below 2%. This will push speculative interest into pricing in a sooner-to-come rate cut and could result in GBP plummeting.
Valeria Bednarik, FXStreet's Chief Analyst, analyzes the possible GBP/USD scenarios following the release of the UK CPI figures: “The GBP/USD pair fluctuates around the 1.2800 mark ahead of the announcement, as demand for the US Dollar receded following a week dominated by risk-aversion. The pair bottomed at 1.2664 last week, a potential bearish target should the annual CPI ease to below 2%. On the contrary, a reading above 2.5% may push GBP/USD towards the 1.2900 region.”
Technically speaking, Bednarik adds: “The bullish potential seems limited, according to the daily chart. Despite advancing, technical indicators remain within negative levels. Furthermore, the positive momentum seems to be easing ahead of the announcement. At the same time, the pair develops below a firmly bearish 20 Simple Moving Average (SMA), currently providing dynamic resistance at around 1.2830. Finally, the 100 and 200 SMAs stand directionless below the current level, suggesting buying interest is not firm enough to put the pair on a continued bullish path.”
Economic Indicator
Consumer Price Index (YoY)
The United Kingdom (UK) Consumer Price Index (CPI), released by the Office for National Statistics on a monthly basis, is a measure of consumer price inflation – the rate at which the prices of goods and services bought by households rise or fall – produced to international standards. It is the inflation measure used in the government’s target. The YoY reading compares prices in the reference month to a year earlier. Generally, a high reading is seen as bullish for the Pound Sterling (GBP), while a low reading is seen as bearish.
Read more.Next release: Wed Aug 14, 2024 06:00
Frequency: Monthly
Consensus: 2.3%
Previous: 2%
Source: Office for National Statistics
The Bank of England is tasked with keeping inflation, as measured by the headline Consumer Price Index (CPI) at around 2%, giving the monthly release its importance. An increase in inflation implies a quicker and sooner increase of interest rates or the reduction of bond-buying by the BOE, which means squeezing the supply of pounds. Conversely, a drop in the pace of price rises indicates looser monetary policy. A higher-than-expected result tends to be GBP bullish.
BoE FAQs
The Bank of England (BoE) decides monetary policy for the United Kingdom. Its primary goal is to achieve ‘price stability’, or a steady inflation rate of 2%. Its tool for achieving this is via the adjustment of base lending rates. The BoE sets the rate at which it lends to commercial banks and banks lend to each other, determining the level of interest rates in the economy overall. This also impacts the value of the Pound Sterling (GBP).
When inflation is above the Bank of England’s target it responds by raising interest rates, making it more expensive for people and businesses to access credit. This is positive for the Pound Sterling because higher interest rates make the UK a more attractive place for global investors to park their money. When inflation falls below target, it is a sign economic growth is slowing, and the BoE will consider lowering interest rates to cheapen credit in the hope businesses will borrow to invest in growth-generating projects – a negative for the Pound Sterling.
In extreme situations, the Bank of England can enact a policy called Quantitative Easing (QE). QE is the process by which the BoE substantially increases the flow of credit in a stuck financial system. QE is a last resort policy when lowering interest rates will not achieve the necessary result. The process of QE involves the BoE printing money to buy assets – usually government or AAA-rated corporate bonds – from banks and other financial institutions. QE usually results in a weaker Pound Sterling.
Quantitative tightening (QT) is the reverse of QE, enacted when the economy is strengthening and inflation starts rising. Whilst in QE the Bank of England (BoE) purchases government and corporate bonds from financial institutions to encourage them to lend; in QT, the BoE stops buying more bonds, and stops reinvesting the principal maturing on the bonds it already holds. It is usually positive for the Pound Sterling.
- The Australian Dollar appreciates as recent labor data reduces the likelihood of an RBA rate cut in the near term.
- The Aussie Dollar may face challenges due to safe-haven flows amid rising geopolitical tensions in the Middle East.
- The US Dollar experienced losses following downbeat Producer Price Index data on Tuesday.
The Australian Dollar (AUD) extends its gains for the third successive session against the US Dollar on Wednesday. The AUD/USD pair may advance further as recent data shows that Australian wage growth remained elevated in the second quarter, prompting the Reserve Bank of Australia (RBA) to adopt a hawkish stance regarding its policy outlook.
The RBA maintained the cash rate at last week’s meeting to ensure inflation returns to its 2-3% target. RBA Governor Michele Bullock also dismissed the possibility of rate cuts for the next six months, emphasizing that the Australian central bank remains cautious about inflation risks and is prepared to raise rates again if necessary. Traders are now awaiting the release of Consumer Inflation Expectations and Employment data from Australia on Thursday.
The AUD/USD pair received support as the US Dollar lost ground following lower-than-expected Producer Price Index (PPI) data from the United States (US) released on Tuesday. Investors will likely observe the US CPI inflation report on Wednesday, which could offer some hints about the Federal Reserve’s (Fed) interest rate cut path.
Daily Digest Market Movers: Australian Dollar appreciates as traders expect the RBA to remain hawkish
- On Tuesday, Atlanta Fed President Raphael Bostic stated that recent economic data has increased his confidence that the Fed can achieve its 2% inflation target. However, Bostic indicated that additional evidence is required before he would support a reduction in interest rates, according to Reuters.
- The US Core Producer Price Index (PPI) rose by 2.4% year-on-year in July, against the previous reading of 3.0%. The index fell short of an estimate of 2.7%. The Core PPI remained unchanged.
- The US PPI rose 2.2% YoY in July from 2.7% in June, falling short of the market expectation of 2.3%. Meanwhile, the PPI increased 0.1% MoM after rising by a 0.2% in June.
- Australia's Westpac Consumer Confidence rose by 2.8% in August, swinging from a 1.1% fall in July. Meanwhile, the Wage Price Index remained steady with a 0.8% rise in the second quarter, slightly below the market expectation of a 0.9% increase.
- On Monday, Reserve Bank of Australia (RBA) Deputy Governor Andrew Hauser attributed persistent inflation to weaker supply and a tight labor market. Hauser also noted that economic forecasts are surrounded by significant uncertainty.
- The upside of the risk-sensitive AUD could be restrained due to safe-haven flows amid increased geopolitical tensions in the Middle East. On Sunday, Defense Minister Yoav Gallant informed US Defense Secretary Lloyd Austin that Iran's military activities indicate preparations for a significant strike on Israel, as reported by Axios writer Barak Ravid.
- On Sunday, Federal Reserve Governor Michelle Bowman stated that she continues to see upside risks for inflation and ongoing strength in the labor market. This suggests that the Fed may not be prepared to cut rates at their next meeting in September, according to Bloomberg.
- Last week, Westpac updated its RBA forecast, now predicting the first rate cut will occur in February 2025, a shift from the previously anticipated November 2024. They also revised their terminal rate forecast to 3.35%, up from the previous 3.10%. The RBA is now viewed as more cautious, needing stronger evidence before considering rate cuts.
Technical Analysis: Australian Dollar rises to near 0.6650
The Australian Dollar trades around 0.6640 on Wednesday. The daily chart analysis indicates that the AUD/USD pair moves upward within an ascending channel, signaling a strengthening bullish bias. Additionally, the 14-day Relative Strength Index (RSI) has surpassed the 50 level, confirming the bullish momentum.
On the upside, the AUD/USD pair might test the upper boundary of the ascending channel at the 0.6675 level. A breakout above this level could push the pair toward its six-month high of 0.6798, reached on July 11.
In terms of support, the AUD/USD pair might test the nine-day Exponential Moving Average (EMA) at 0.6587, followed by the lower boundary of the ascending channel and the throwback level at 0.6575. A decline below the latter could strengthen a bearish outlook, potentially pushing the pair toward the throwback level at 0.6470.
AUD/USD: Daily Chart
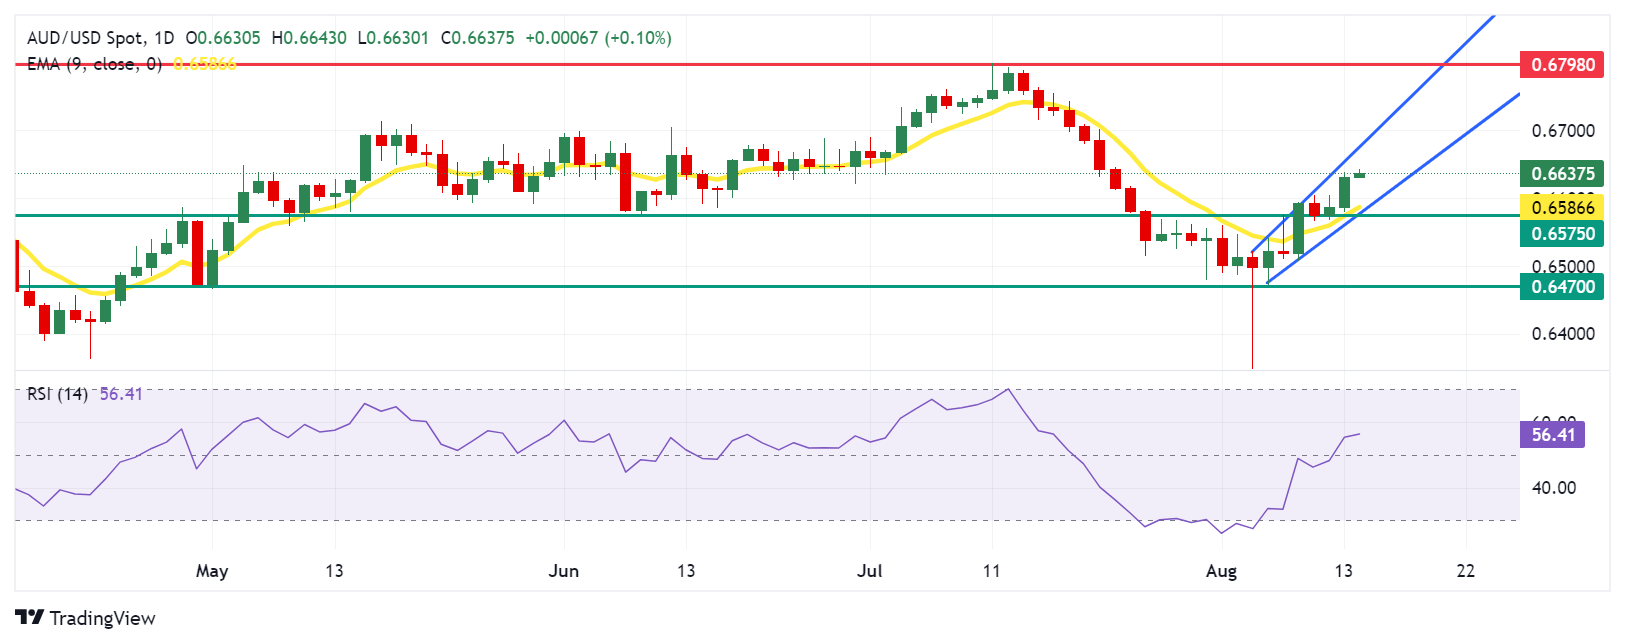
Australian Dollar PRICE Today
The table below shows the percentage change of Australian Dollar (AUD) against listed major currencies today. Australian Dollar was the strongest against the New Zealand Dollar.
| USD | EUR | GBP | JPY | CAD | AUD | NZD | CHF | |
|---|---|---|---|---|---|---|---|---|
| USD | 0.00% | -0.02% | 0.01% | 0.02% | -0.12% | 0.13% | 0.02% | |
| EUR | -0.00% | -0.03% | 0.03% | 0.00% | -0.07% | 0.12% | 0.01% | |
| GBP | 0.02% | 0.03% | 0.08% | 0.05% | -0.06% | 0.16% | 0.07% | |
| JPY | -0.01% | -0.03% | -0.08% | 0.00% | -0.12% | 0.09% | 0.04% | |
| CAD | -0.02% | 0.00% | -0.05% | -0.00% | -0.12% | 0.11% | 0.03% | |
| AUD | 0.12% | 0.07% | 0.06% | 0.12% | 0.12% | 0.19% | 0.11% | |
| NZD | -0.13% | -0.12% | -0.16% | -0.09% | -0.11% | -0.19% | -0.07% | |
| CHF | -0.02% | -0.01% | -0.07% | -0.04% | -0.03% | -0.11% | 0.07% |
The heat map shows percentage changes of major currencies against each other. The base currency is picked from the left column, while the quote currency is picked from the top row. For example, if you pick the Australian Dollar from the left column and move along the horizontal line to the US Dollar, the percentage change displayed in the box will represent AUD (base)/USD (quote).
RBA FAQs
The Reserve Bank of Australia (RBA) sets interest rates and manages monetary policy for Australia. Decisions are made by a board of governors at 11 meetings a year and ad hoc emergency meetings as required. The RBA’s primary mandate is to maintain price stability, which means an inflation rate of 2-3%, but also “..to contribute to the stability of the currency, full employment, and the economic prosperity and welfare of the Australian people.” Its main tool for achieving this is by raising or lowering interest rates. Relatively high interest rates will strengthen the Australian Dollar (AUD) and vice versa. Other RBA tools include quantitative easing and tightening.
While inflation had always traditionally been thought of as a negative factor for currencies since it lowers the value of money in general, the opposite has actually been the case in modern times with the relaxation of cross-border capital controls. Moderately higher inflation now tends to lead central banks to put up their interest rates, which in turn has the effect of attracting more capital inflows from global investors seeking a lucrative place to keep their money. This increases demand for the local currency, which in the case of Australia is the Aussie Dollar.
Macroeconomic data gauges the health of an economy and can have an impact on the value of its currency. Investors prefer to invest their capital in economies that are safe and growing rather than precarious and shrinking. Greater capital inflows increase the aggregate demand and value of the domestic currency. Classic indicators, such as GDP, Manufacturing and Services PMIs, employment, and consumer sentiment surveys can influence AUD. A strong economy may encourage the Reserve Bank of Australia to put up interest rates, also supporting AUD.
Quantitative Easing (QE) is a tool used in extreme situations when lowering interest rates is not enough to restore the flow of credit in the economy. QE is the process by which the Reserve Bank of Australia (RBA) prints Australian Dollars (AUD) for the purpose of buying assets – usually government or corporate bonds – from financial institutions, thereby providing them with much-needed liquidity. QE usually results in a weaker AUD.
Quantitative tightening (QT) is the reverse of QE. It is undertaken after QE when an economic recovery is underway and inflation starts rising. Whilst in QE the Reserve Bank of Australia (RBA) purchases government and corporate bonds from financial institutions to provide them with liquidity, in QT the RBA stops buying more assets, and stops reinvesting the principal maturing on the bonds it already holds. It would be positive (or bullish) for the Australian Dollar.
On Wednesday, the People’s Bank of China (PBOC) set the USD/CNY central rate for the trading session ahead at 7.1415, as against the previous day's fix of 7.1479 and 7.1493 Reuters estimates.
- USD/JPY regains positive traction on Tuesday, albeit the uptick lacks bullish conviction.
- A positive risk tone undermines the safe-haven JPY and lends some support to the pair.
- Bets for bigger Fed rate cuts weigh on the USD and should cap gains ahead of the US CPI.
The USD/JPY pair attracts some dip-buying during the Asia session on Wednesday and climbs back above the 147.00 mark in the last hour, reversing the previous day's modest downfall. Spot prices, however, remain confined in a familiar range held over the past week or so as traders keenly await the US consumer inflation figures before positioning for the next leg of a directional move.
The closely-watched US Consumer Price Index (CPI) report is due for release later today and will be looked upon for cues about the Federal Reserve's (Fed) rate-cut path. This, in turn, will play a key role in influencing the USD demand in the near term and provide some meaningful impetus to the USD/JPY pair. Heading into the key data risk, the upbeat market mood is seen undermining the safe-haven Japanese Yen (JPY) and acting as a tailwind for the USD/JPY pair.
Meanwhile, data released on Tuesday showed that the US Producer Price Index (PPI) rose less than expected in July, supporting prospects for deeper interest rate cuts by the Federal Reserve (Fed) in September. This, in turn, dragged the US Treasury bond yields lower across the board and the US Dollar (USD) to over a one-week low. Apart from this, expectations that the Bank of Japan (BoJ) will hike rates again in 2024 help limit the JPY losses and might cap the USD/JPY pair.
Even from a technical perspective, the recent range-bound price action points to indecision among traders. This further makes it prudent to wait for strong follow-through buying before confirming that spot prices have bottomed out near the 141.70-141.65 region, or the lowest level since early January touched last week.
Risk sentiment FAQs
In the world of financial jargon the two widely used terms “risk-on” and “risk off'' refer to the level of risk that investors are willing to stomach during the period referenced. In a “risk-on” market, investors are optimistic about the future and more willing to buy risky assets. In a “risk-off” market investors start to ‘play it safe’ because they are worried about the future, and therefore buy less risky assets that are more certain of bringing a return, even if it is relatively modest.
Typically, during periods of “risk-on”, stock markets will rise, most commodities – except Gold – will also gain in value, since they benefit from a positive growth outlook. The currencies of nations that are heavy commodity exporters strengthen because of increased demand, and Cryptocurrencies rise. In a “risk-off” market, Bonds go up – especially major government Bonds – Gold shines, and safe-haven currencies such as the Japanese Yen, Swiss Franc and US Dollar all benefit.
The Australian Dollar (AUD), the Canadian Dollar (CAD), the New Zealand Dollar (NZD) and minor FX like the Ruble (RUB) and the South African Rand (ZAR), all tend to rise in markets that are “risk-on”. This is because the economies of these currencies are heavily reliant on commodity exports for growth, and commodities tend to rise in price during risk-on periods. This is because investors foresee greater demand for raw materials in the future due to heightened economic activity.
The major currencies that tend to rise during periods of “risk-off” are the US Dollar (USD), the Japanese Yen (JPY) and the Swiss Franc (CHF). The US Dollar, because it is the world’s reserve currency, and because in times of crisis investors buy US government debt, which is seen as safe because the largest economy in the world is unlikely to default. The Yen, from increased demand for Japanese government bonds, because a high proportion are held by domestic investors who are unlikely to dump them – even in a crisis. The Swiss Franc, because strict Swiss banking laws offer investors enhanced capital protection.
| Index | Change, points | Closed | Change, % |
|---|---|---|---|
| NIKKEI 225 | 1207.51 | 36232.51 | 3.45 |
| Hang Seng | 62.41 | 17174.06 | 0.36 |
| KOSPI | 3.2 | 2621.5 | 0.12 |
| ASX 200 | 13.1 | 7826.8 | 0.17 |
| DAX | 85.58 | 17812.05 | 0.48 |
| CAC 40 | 25.2 | 7275.87 | 0.35 |
| Dow Jones | 408.63 | 39765.64 | 1.04 |
| S&P 500 | 90.04 | 5434.43 | 1.68 |
| NASDAQ Composite | 407 | 17187.61 | 2.43 |
- Gold price posts modest gains around $2,465 in Wednesday’s early Asian session.
- The escalating tensions in the Middle East increase safe-haven demand, benefiting Gold.
- The US July Consumer Price Index report will be the highlight on Wednesday.
Gold price (XAU/USD) trades with mild gains near $2,465 during the early Asian session on Wednesday. The upside of the yellow metal might be underpinned by the safe-haven flows amid ongoing tensions in the Middle East. Traders will closely watch the release of the US July Consumer Price Index (CPI), which is due later on Wednesday.
Safe-haven demand from heightened tensions in the Middle East might lift the precious metal in the near term. The BBC reported on Tuesday that the United States sent a guided missile submarine to the Middle East as tensions rise in the region. The action comes in response to fears of a wider regional conflict after the recent assassination of senior Hezbollah and Hamas leaders. Analysts from Saxo Bank A/S noted that gold remains “supported by geopolitical risks and anticipated Federal Reserve rate cuts amid heightened tensions” involving Iran and Israel as well as Ukraine.
On Tuesday, Atlanta Fed President Raphael Bostic said that recent economic data made him "more confident" that the Fed can get inflation back to its 2% target. Still, more evidence is needed before he's ready to support lowering interest rates.
The US CPI inflation report on Wednesday could offer some hints about the Federal Reserve’s (Fed) interest rate cut path. The CPI is expected to increase 0.2% MoM in July, compared to the previous month of a 0.1% decline. On an annual basis, the CPI inflation is estimated to ease to 2.9% in July from 3.0% in June.
The softer reading could fuel the chance of a Fed rate cut in September. On the other hand, a hotter inflation outcome might diminish the odds of a Fed easing policy, which is likely to exert some selling pressure on the non-yielding Gold.
Gold FAQs
Gold has played a key role in human’s history as it has been widely used as a store of value and medium of exchange. Currently, apart from its shine and usage for jewelry, the precious metal is widely seen as a safe-haven asset, meaning that it is considered a good investment during turbulent times. Gold is also widely seen as a hedge against inflation and against depreciating currencies as it doesn’t rely on any specific issuer or government.
Central banks are the biggest Gold holders. In their aim to support their currencies in turbulent times, central banks tend to diversify their reserves and buy Gold to improve the perceived strength of the economy and the currency. High Gold reserves can be a source of trust for a country’s solvency. Central banks added 1,136 tonnes of Gold worth around $70 billion to their reserves in 2022, according to data from the World Gold Council. This is the highest yearly purchase since records began. Central banks from emerging economies such as China, India and Turkey are quickly increasing their Gold reserves.
Gold has an inverse correlation with the US Dollar and US Treasuries, which are both major reserve and safe-haven assets. When the Dollar depreciates, Gold tends to rise, enabling investors and central banks to diversify their assets in turbulent times. Gold is also inversely correlated with risk assets. A rally in the stock market tends to weaken Gold price, while sell-offs in riskier markets tend to favor the precious metal.
The price can move due to a wide range of factors. Geopolitical instability or fears of a deep recession can quickly make Gold price escalate due to its safe-haven status. As a yield-less asset, Gold tends to rise with lower interest rates, while higher cost of money usually weighs down on the yellow metal. Still, most moves depend on how the US Dollar (USD) behaves as the asset is priced in dollars (XAU/USD). A strong Dollar tends to keep the price of Gold controlled, whereas a weaker Dollar is likely to push Gold prices up.
| Pare | Closed | Change, % |
|---|---|---|
| AUDUSD | 0.66307 | 0.67 |
| EURJPY | 161.406 | 0.29 |
| EURUSD | 1.09912 | 0.54 |
| GBPJPY | 188.876 | 0.51 |
| GBPUSD | 1.28607 | 0.75 |
| NZDUSD | 0.6074 | 0.91 |
| USDCAD | 1.3705 | -0.26 |
| USDCHF | 0.86435 | -0.09 |
| USDJPY | 146.845 | -0.25 |


© 2000-2026. Bản quyền Teletrade.
Trang web này được quản lý bởi Teletrade D.J. LLC 2351 LLC 2022 (Euro House, Richmond Hill Road, Kingstown, VC0100, St. Vincent and the Grenadines).
Thông tin trên trang web không phải là cơ sở để đưa ra quyết định đầu tư và chỉ được cung cấp cho mục đích làm quen.
Giao dịch trên thị trường tài chính (đặc biệt là giao dịch sử dụng các công cụ biên) mở ra những cơ hội lớn và tạo điều kiện cho các nhà đầu tư sẵn sàng mạo hiểm để thu lợi nhuận, tuy nhiên nó mang trong mình nguy cơ rủi ro khá cao. Chính vì vậy trước khi tiến hành giao dịch cần phải xem xét mọi mặt vấn đề chấp nhận tiến hành giao dịch cụ thể xét theo quan điểm của nguồn lực tài chính sẵn có và mức độ am hiểu thị trường tài chính.
Sử dụng thông tin: sử dụng toàn bộ hay riêng biệt các dữ liệu trên trang web của công ty TeleTrade như một nguồn cung cấp thông tin nhất định. Việc sử dụng tư liệu từ trang web cần kèm theo liên kết đến trang teletrade.vn. Việc tự động thu thập số liệu cũng như thông tin từ trang web TeleTrade đều không được phép.
Xin vui lòng liên hệ với pr@teletrade.global nếu có câu hỏi.
ngân hàng