- Phân tích
- Tin tức và các công cụ
- Tin tức thị trường
Tin tức thì trường
- Final Euro inflation figures to be overshadowed by US CPI inflation print.
- Fed Chair Jerome Powell due to speak on Tuesday.
- US consumer inflation expectations rose again, complicating the path to rate cuts.
EUR/USD found slim upside on Monday, climbing from early bids near 1.0770 but bullish momentum remains limited with the pair struggling to break above the 1.0800 level.
German final Harmonized Index of Consumer Prices (HICP) inflation figures are due during the European market session, but the mid-tier final inflation print is unlikely to drive market volatility unless inflation numbers see late adjustments compared to the preliminary figures. European Gross Domestic Product (GDP) growth for the first quarter are slated for Wednesday, and markets are expected QoQ GDP growth to hold steady at 0.3%.
US consumer inflation expectations rose in April according to a survey from the Federal Reserve (Fed) Bank of New York. According to the NY Fed’s consumer sentiment survey, US consumers broadly expect inflation over the next year to accelerate to 3.3%. Consumer one-year inflation expectations rose from 3.0% in March.
US Producer Price Index (PPI) inflation numbers are due during Tuesday’s US market session, where investors are expecting producer-level inflation in April to tick higher to 0.3% MoM compared to the previous month’s 0.2%.
EUR/USD technical outlook
EUR/USD continues to trade into the high end after a bounce-and-run from the 200-hour Exponential Moving Average (EMA) last week near 1.0730. Bullish potential remains capped by a near-term supply zone above the 1.0800 handle.
Daily candlesticks show the EUR/USD trading into firm technical resistance at the 200-day EMA at 1.0789, a failed launch from bidders could see the pair falling back into the last swing low near 1.0600. A topside break from buyers will send the pair into immediate resistance from the last swing high just below 1.0900.
EUR/USD hourly chart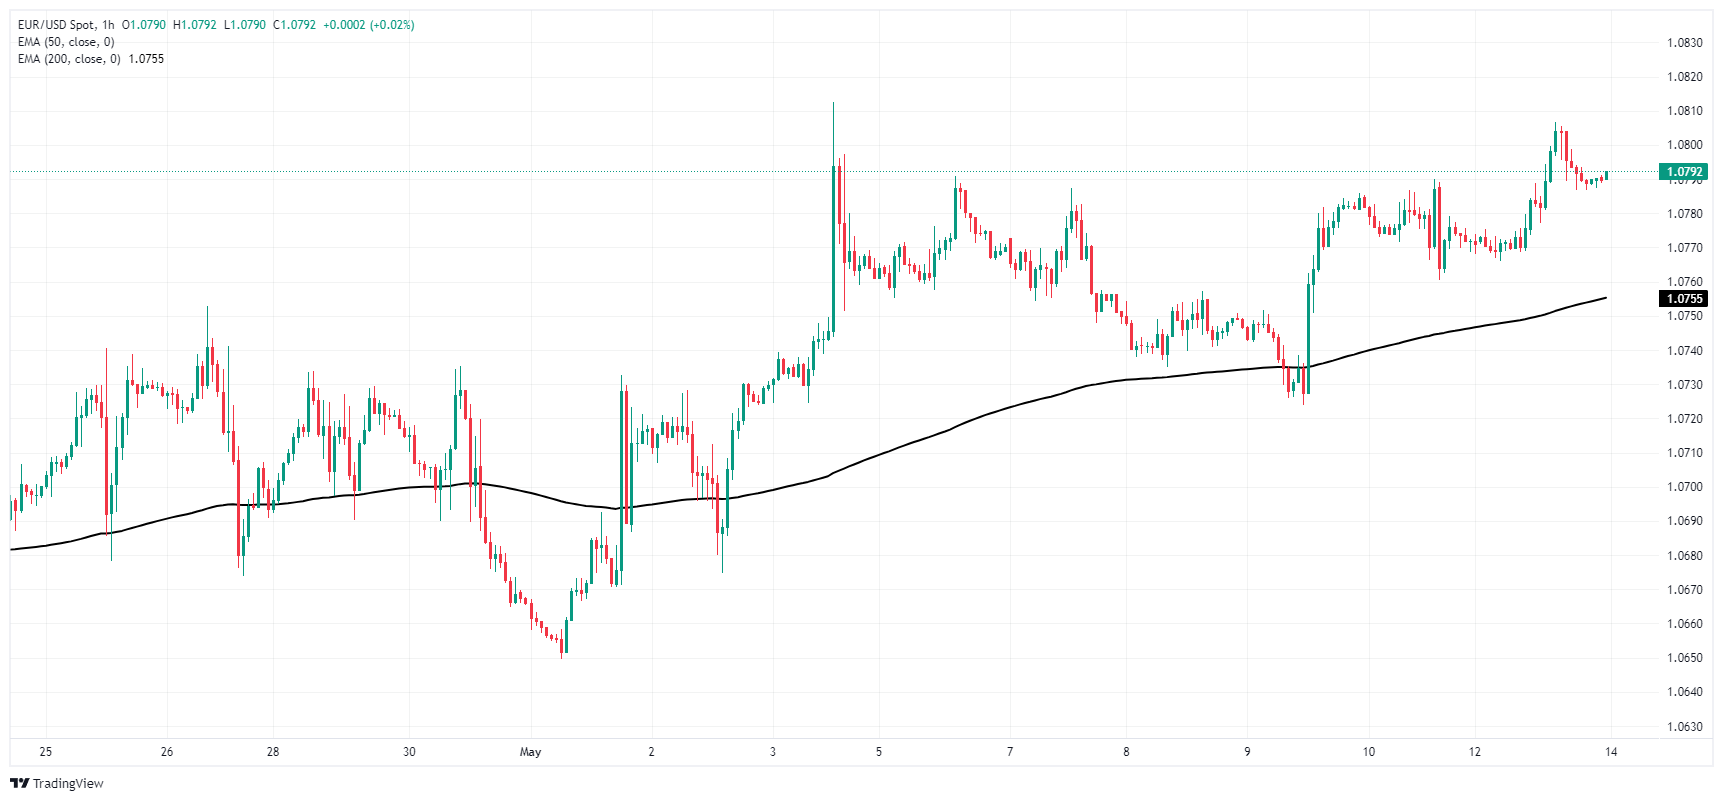
EUR/USD daily chart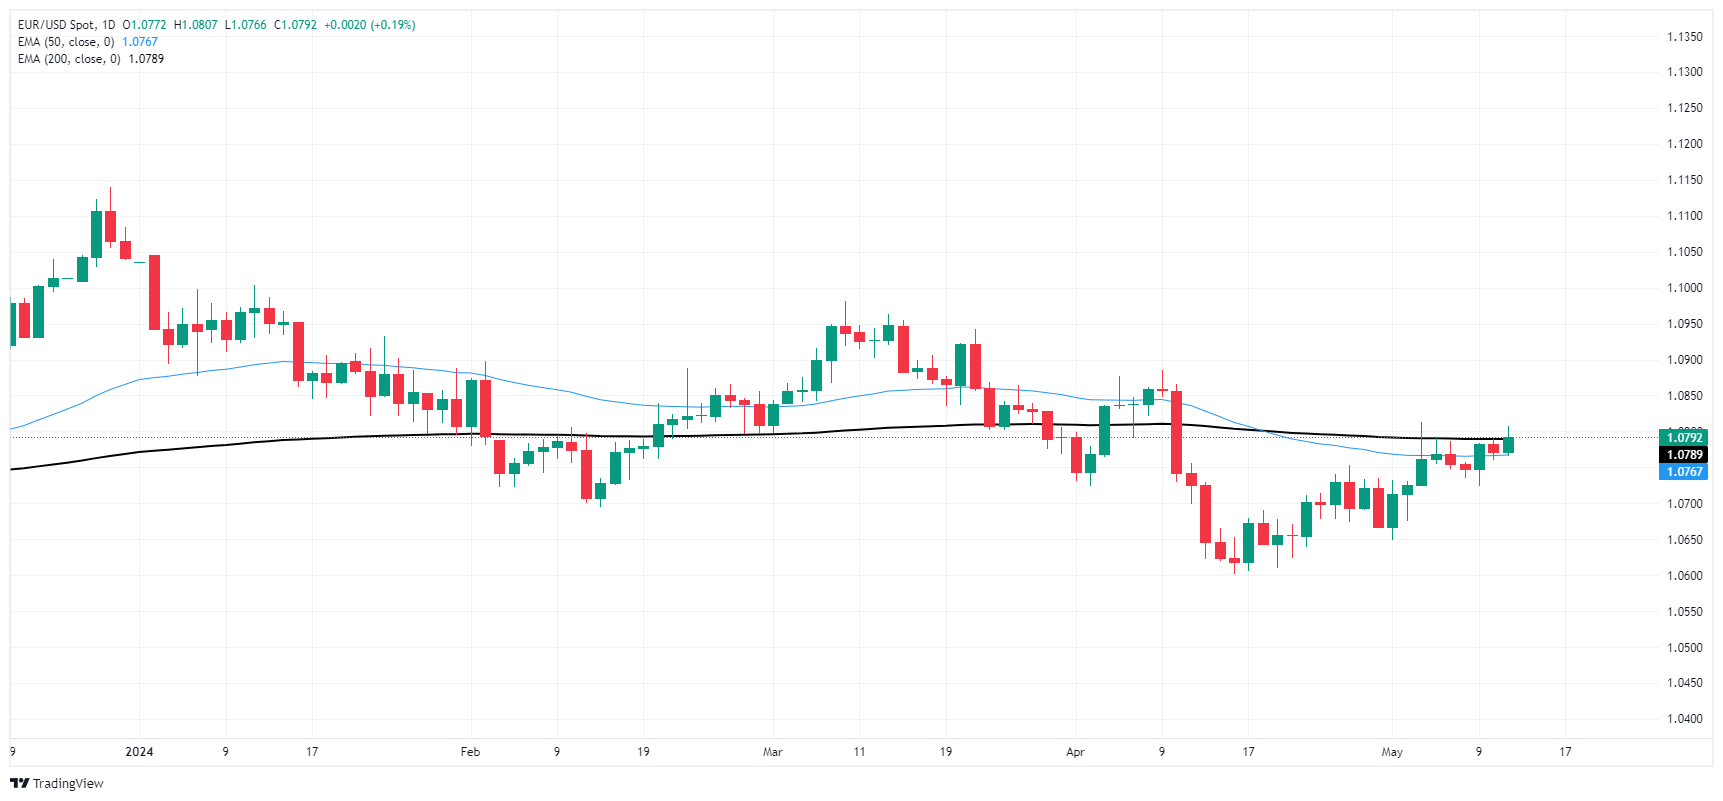
- GBP/USD trades sideways around 1.2560 in Tuesday’s early Asian session.
- Many Fed officials emphasized the need to hold interest rates at current levels until inflation returns to the target.
- Markets have priced in a 25 bps reduction in August and 50 bps in cuts overall in 2024.
The GBP/USD pair consolidates its gains near 1.2560 on Tuesday during the early Asian session. The weaker US Dollar (USD) amidst the generalized better tone in the appetite for risk-related assets provides some support to the major pair. Investors will closely monitor the UK employment market, the speech by the BoE's Pill, and US Producer Price Index (PPI) data, due later on Tuesday.
Several Federal Reserve (Fed) officials emphasized the need to hold rates higher for longer as inflation remains elevated. Fed vice chair Philip Jefferson on Monday became the latest central bank official to call for holding interest rates at current levels until inflation shows more signs of easing. Jefferson said that he will continue to look for additional evidence that inflation is going to return to the 2% target.
The financial markets have priced in nearly 5% odds of June rate cuts, down from 10%, while the chance of September rate cuts has fallen to 75% from nearly 90% at the start of last week. The cautious approach from Fed officials will likely lift the Greenback in the near term and cap the upside of the pair.
On the other hand, there is growing speculation that the Bank of England (BoE) will begin to cut the interest rate in the summer, with traders pricing in a 25 basis point (bps) reduction in August and 50 basis points (bps) in cuts overall in 2024. The BoE governor Andrew Bailey said during the press conference that he would monitor the forthcoming data releases before deciding on rate cuts. The UK employment data for April might offer some cues about the economic situation and further monetary policy. A higher-than-expected outcome might weigh on the Pound Sterling (GBP) and create a headwind for the GBP/USD pair.
New Zealand's Electronic Retail Sales contracted in April, falling -0.4%. The decline slowed the pace of contraction from the previous month's -0.7%, but the annualized figure decelerated further, falling -3.8% compared to the previous period's -2.3% (revised from -3.0%).
Seasonally-adjusted retail card spending totals declined to their lowest levels since August of 2022, with durables goods spending falling the furthest, declining $11 million NZD.
About New Zealand Electronic Card Retail Sales
Electronic Card Retail Sales as reported by Statistics New Zealand, measures purchases made in New Zealand on debit, credit and store cards. The figure gives hint of strength in the retail sector and influences interest rate decisions. A high number is generally positive (bullish) for the New Zealand dollar, while a weak number is seen as negative (bearish)
New Zealand saw it's single-worst YoY net migration loss for the year ended in March, with New Zealand population outflows of 52,500 YoY.
New Zealand migrant departures outnumbered arrivals nearly three to one in the MArch 2024 year, with total population inflows of 25,800 compared to 78,200 outflows.
Market reaction
NZD/USD continues to cycle familiar territory near the 0.6000 handle, with the pair stuck in the midrange heading into Tuesday's early Pacific market session.
- GBP/JPY rose more than 0.50% on Monday amid safe-haven peers’ depreciation.
- The uptrend is set to continue above 196.00, with key resistance at 197.92 and above 200.00.
The Pound Sterling climbed for the sixth consecutive day versus the Japanese Yen amid a risk-on impulse. Safe-haven currencies remained the laggards during the session as investors braced for the release of US inflation data. The GBP/JPY trades at 196.16, virtually unchanged.
GBP/JPY Price Analysis: Technical outlook
The GBP/JPY has resumed its uptrend, breaching the first key resistance level seen at the Kijun-Sen at 195.26, which opened the door to reclaim 196.00. Worth noting that momentum favors a bullish continuation, as depicted by the Relative Strength Index (RSI).
With that said, if GBP/JPY edges toward the 197.00 psychological level and bears fail to step in, the next key resistance to emerge would be the April 26 high at 197.92. Once cleared, further upside is seen, with the year-to-date (YTD) up next at 200.59.
The other scenario would be if the cross-pair tumbled below 196.00, exacerbating a dip below the Kijun-Sen seen at 195.26, as sellers would set their sights at the Senkou Span A at 194.54. Once cleared, the next stop would be the Senkou Span B at 194.24, followed by the Tenkan-Sen at 193.81.
GBP/JPY Price Action – Daily Chart

- The daily RSI and MACD indicate diminishing buying momentum as bulls struggle to gain further ground.
- The hourly indicators reveal that sellers have a slight upper hand ahead of the Asian session.
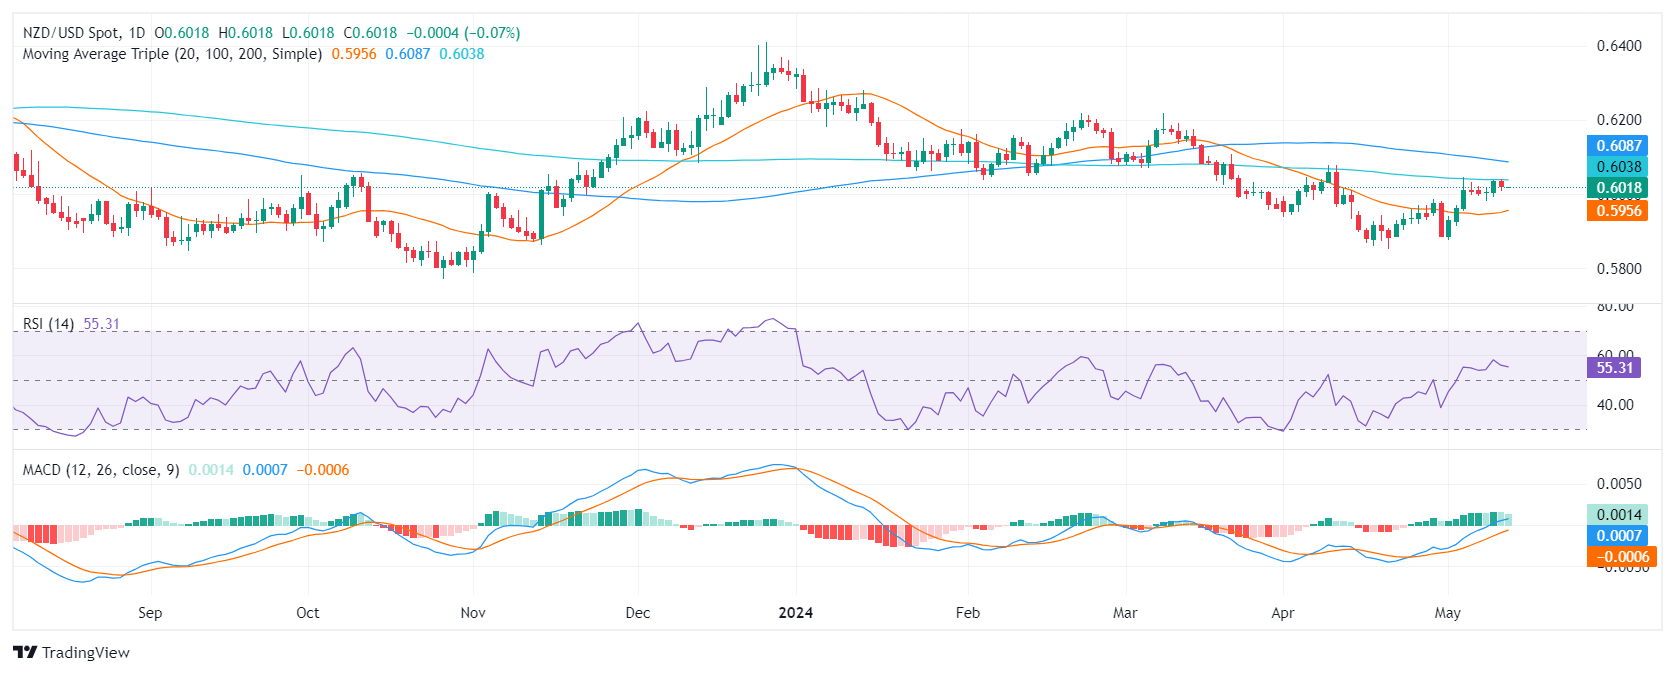
In Monday's session, the NZD/USD pair traded with mild losses, and sellers gained ground. As the pair is facing strong resistance at the 200-day Simple Moving Average (SMA), the pair struggles to consolidate advances. Indicators are flattening and indicate that the moment of the bulls may be coming to an end.
On the daily chart, the Relative Strength Index (RSI) shows a flattening traction above 50. At the same time, the Moving Average Convergence Divergence (MACD) histogram reveals a decrease in buying momentum, demonstrated by diminishing green bars.
NZD/USD daily chart
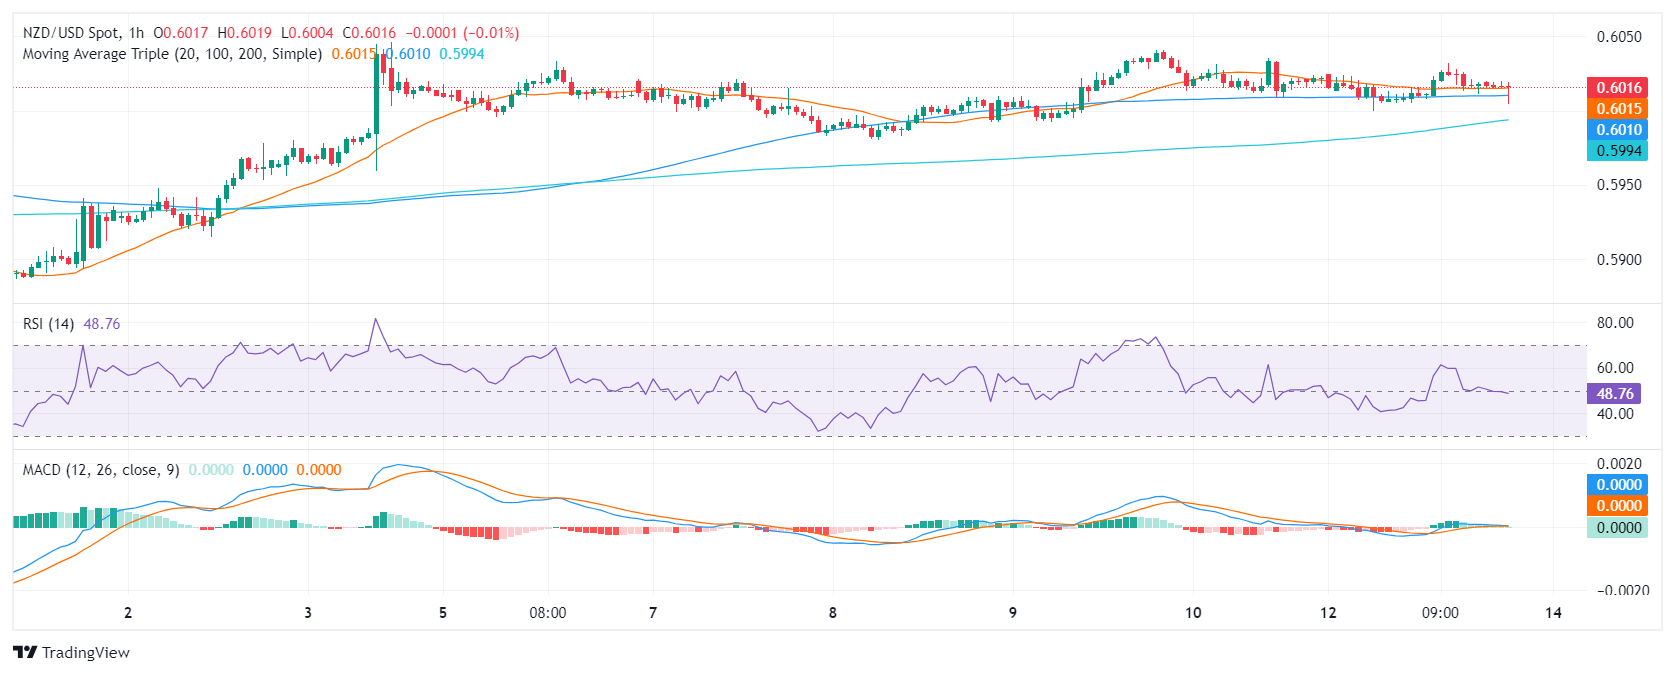
The hourly RSI indicates a slightly negative trend with the latest reading falling towards its middlepoint, showing a slight dominance from the sellers in the market. This is supported by the MACD, which also prints decreasing green bars, further confirming the decrease in buying momentum at an intraday level.
NZD/USD hourly chart
Interpreting the broader perspective, the NZD/USD is positioned below the thresholds of its 100, 200-day Simple Moving Averages (SMA). Significant bearish momentum, implying a prevailing downward trend in both the medium and long term. However, if the buyers defend the 20-day SMA, they may still have some hope to make another stride to reclaim the 200-day SMA.4
- Crude Oil rebounded to kick off the new trading week.
- Despite recovery, topside momentum remains limited.
- Geopolitical tensions are mixing poorly with increasing risk of oversupply.
West Texas Intermediate (WTI) US Crude Oil recovered ground on Monday as energy traders stepped back into barrel bets on continued geopolitical tensions in the Middle East, but steadily-rising US Crude Oil supplies are crimping upside potential in Crude Oil markets.
A ceasefire in the ongoing Israel-Palestinian Hamas conflict is proving to be a difficult task to accomplish, and Israeli forces continue to push into Palestinian territory. Israel’s refusal to accept a ceasefire deal are putting a floor beneath Crude Oil prices as investors remain wary of a potential spillover into neighboring regions crucial to global Crude Oil supply.
Despite renewed barrel buying on Monday, upside potential for Crude OIl remains limited as US production continues to outpace demand. According to the Energy Information Administration (EIA), US Crude Oil production in the Permian Basin is set to rise to its highest levels of barrel output since December of last year. Week-on-week barrel supply counts have steadily outrun forecasts as production overfills facilities, outrunning energy demand.
The American Petroleum Institute (API) will be publishing their latest Weekly Crude Oil Stocks count on Tuesday, forecast to show a buildup of one million barrels through the week ended May 10. The EIA’s own Crude Oil Stocks Change, due on Wednesday, will be publishing on Wednesday.
WTI technical outlook
Despite Monday’s price recovery, WTI remains trapped in near-term technical levels as US Crude Oil trades on the high side of a supply zone between $78.00 and $77.00 per barrel. Bullish momentum is capped by the 200-hour Exponential Moving Average (EMA) at $79.08.
Daily candles remain hampered by the 200-day EMA at 79.25, and Crude Oil is struggling to develop bullish legs after falling from the last swing high above $86.00 per barrel.
WTI hourly chart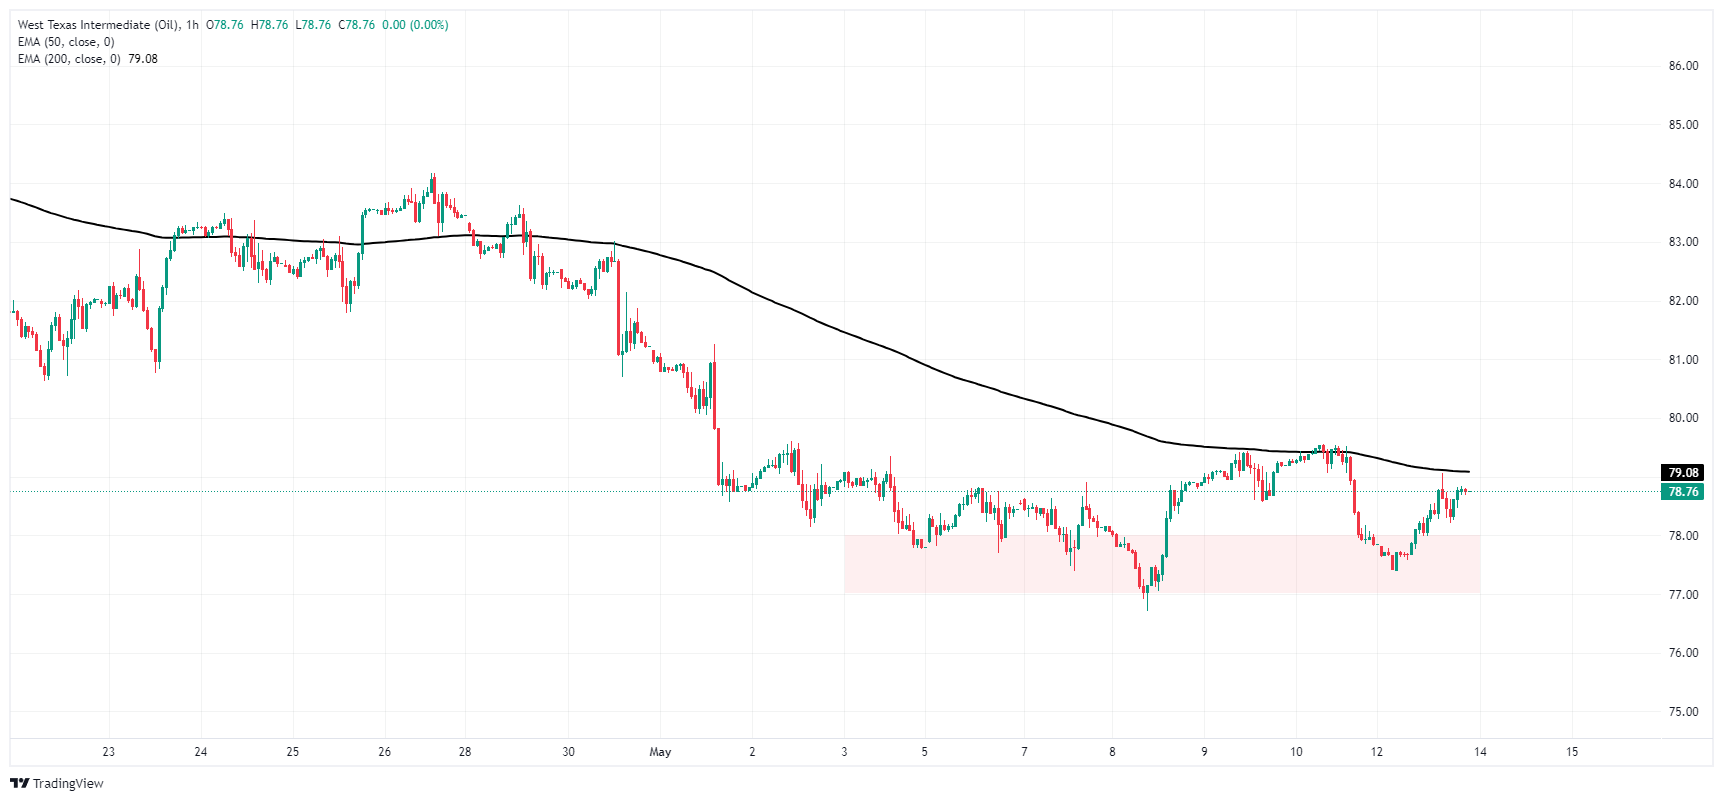
WTI daily chart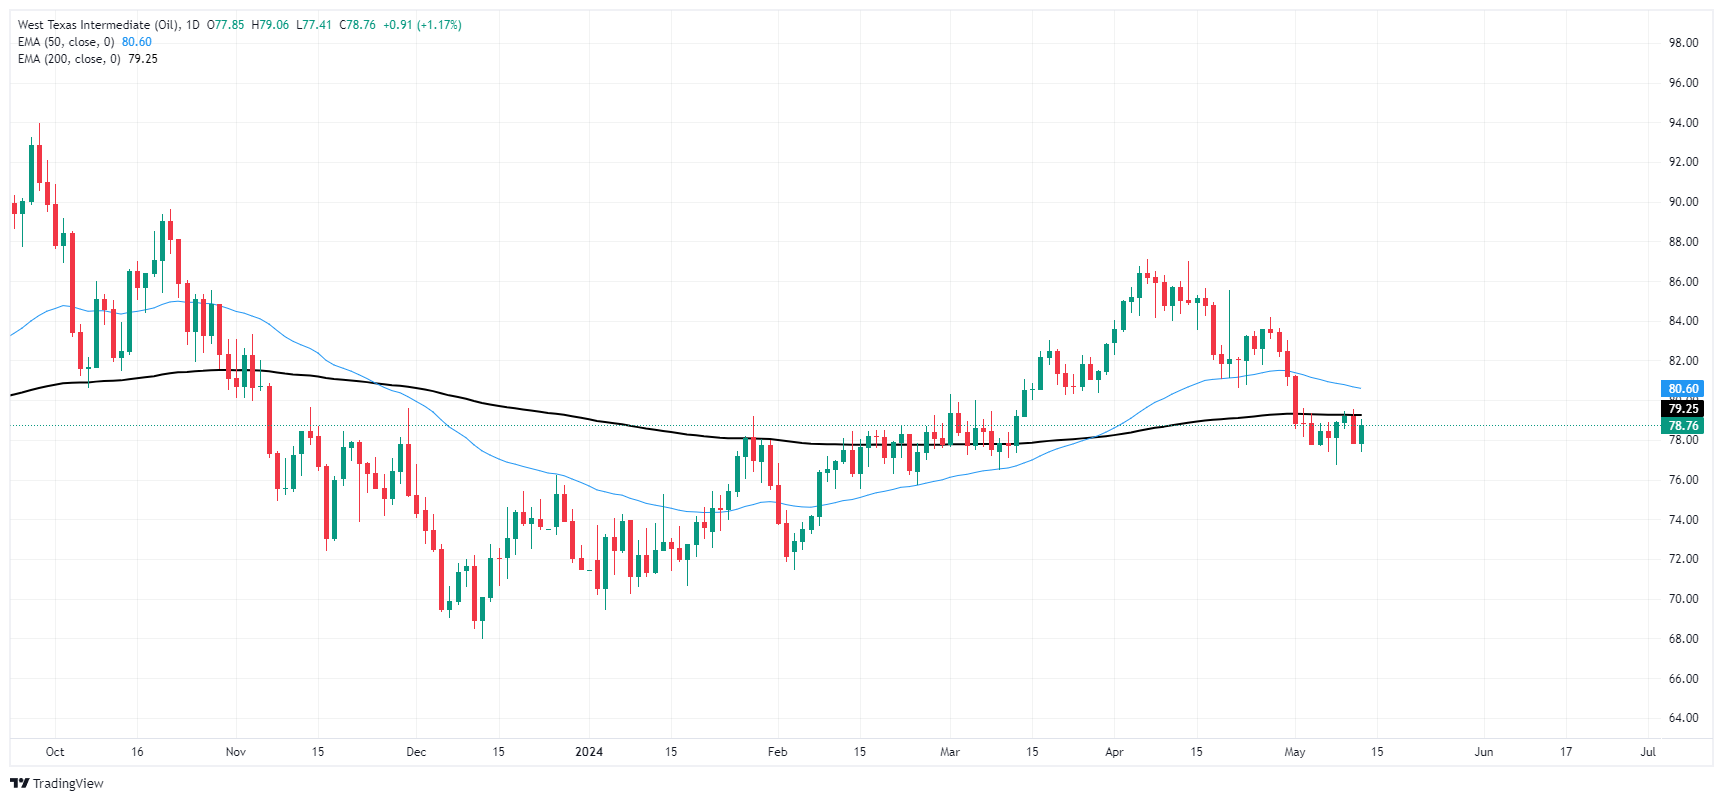
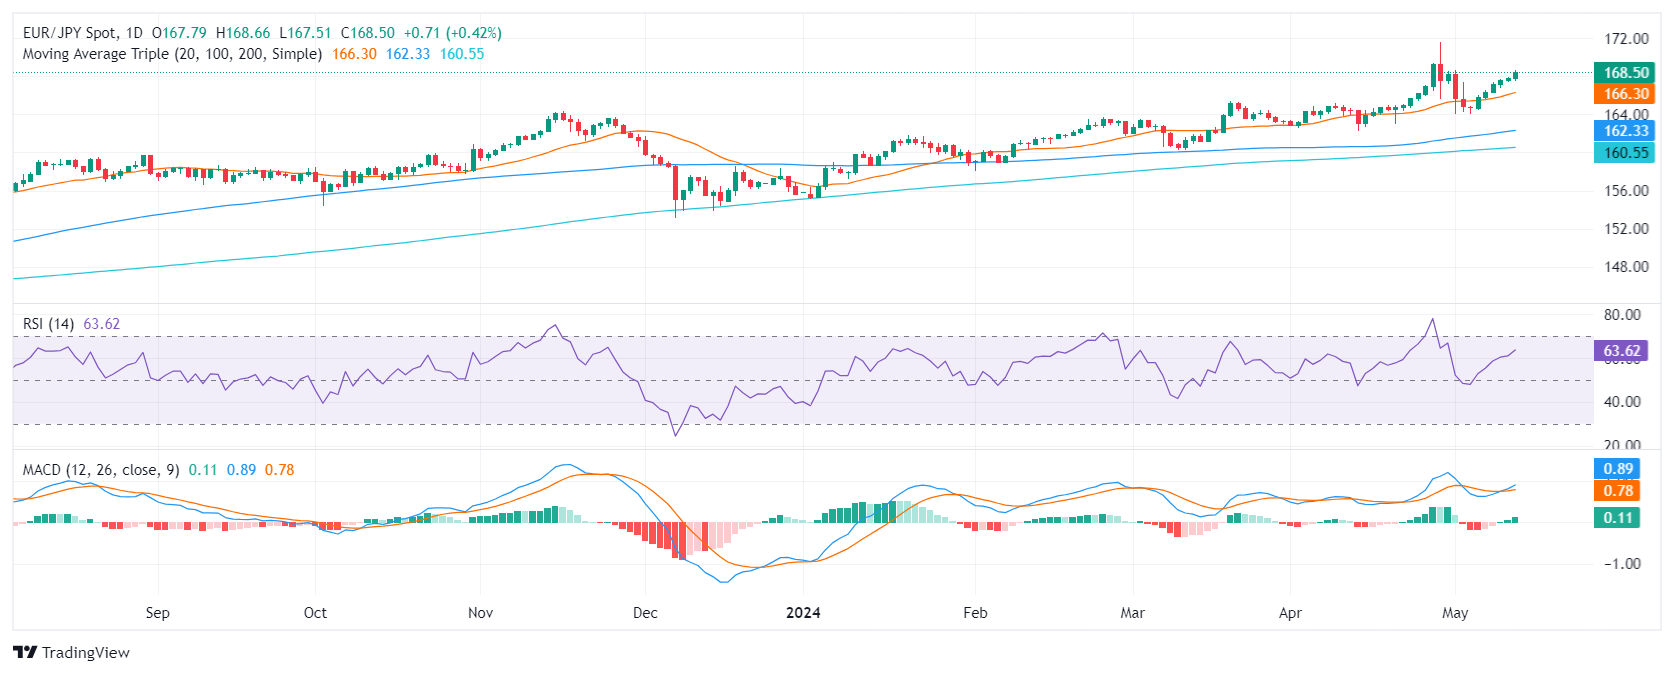
- The daily chart of the EUR/JPY reveals strong buying momentum, backed by positive RSI and MACD readings.
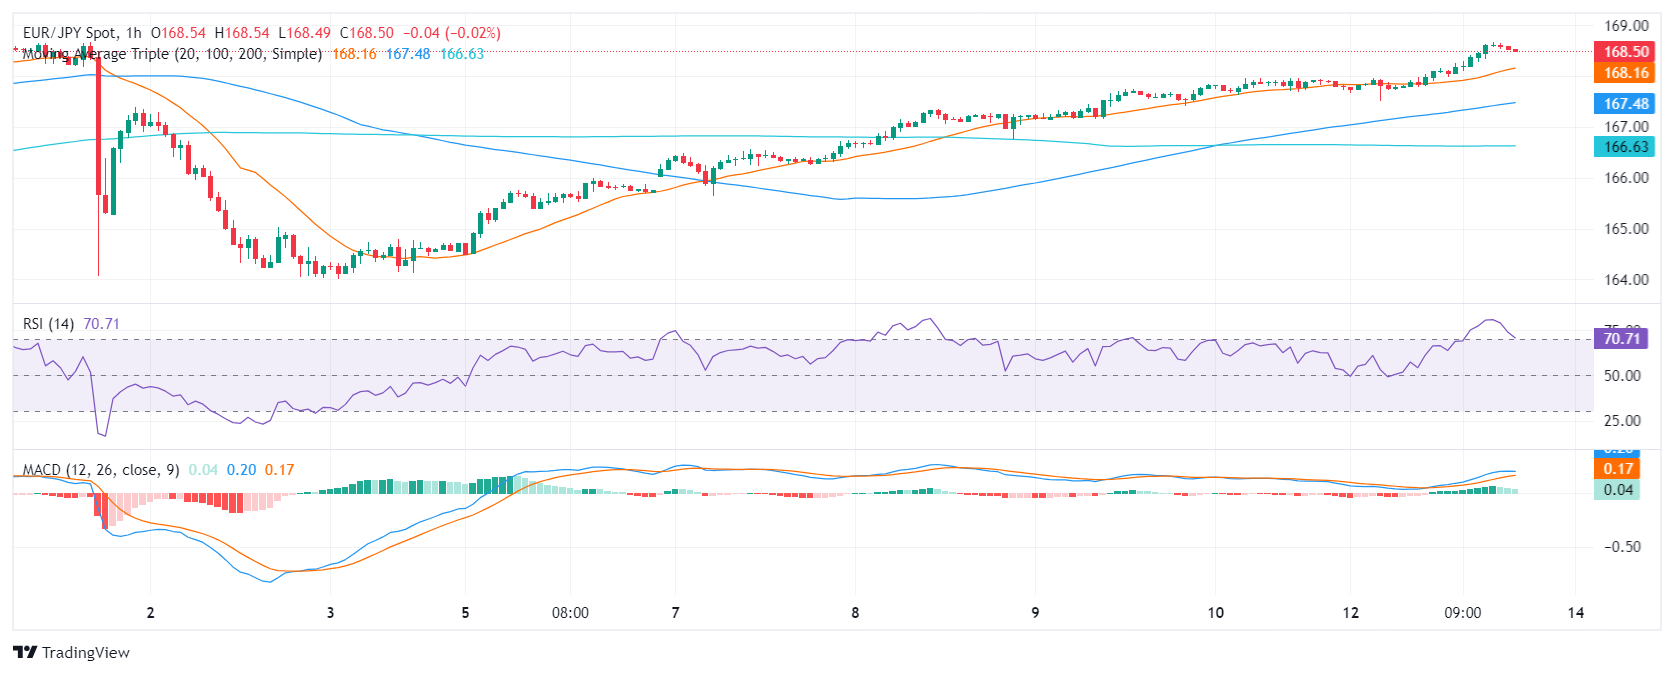
- Hourly chart indicators show a possible easing off from overbought status, potentially hinting at a nearing correction.
In Monday's session, the EUR/JPY pair showed strong bullish momentum, registering a rise to 168.52, marking a favorable 0.45% shift. However, potential short-term wavering observed in the hourly chart's indicators, suggests an approaching cooling-off phase, which could lead to profit-taking. As the ascent continues, investors are monitoring for a possible retest of the cycle highs above 170.00 in future sessions.
On the daily chart, the Relative Strength Index (RSI) is situated within the positive territory, signaling a buying bias. The consistent upward movement of the RSI, especially its peak at approximately 63, indicates strong buying momentum. Concurrently, the Moving Average Convergence Divergence (MACD) histogram shows increasing green bars, reinforcing the bullish outlook.
EUR/JPY daily chart
Moving to the hourly chart, the RSI shows heightened levels, consistently breaching the overbought threshold. A notable drop from approximately 80 to around 70 level, however, suggests a possible easing off from overbought status. Complementarily, the MACD on the hourly chart registers reducing green bars, implying a slowing pace of buying activity.
EUR/JPY hourly chart
Assessing the overall scenario, the EUR/JPY remains resilient around its Simple Moving Average (SMA) clusters. The pair is above the 20, 100, and 200-day SMA, important short- and long-term trend indicators, signifying a potential bullish bias in the near-term outlook. In addition, the pair being close to multi-year highs also paints with green the overall outlook.
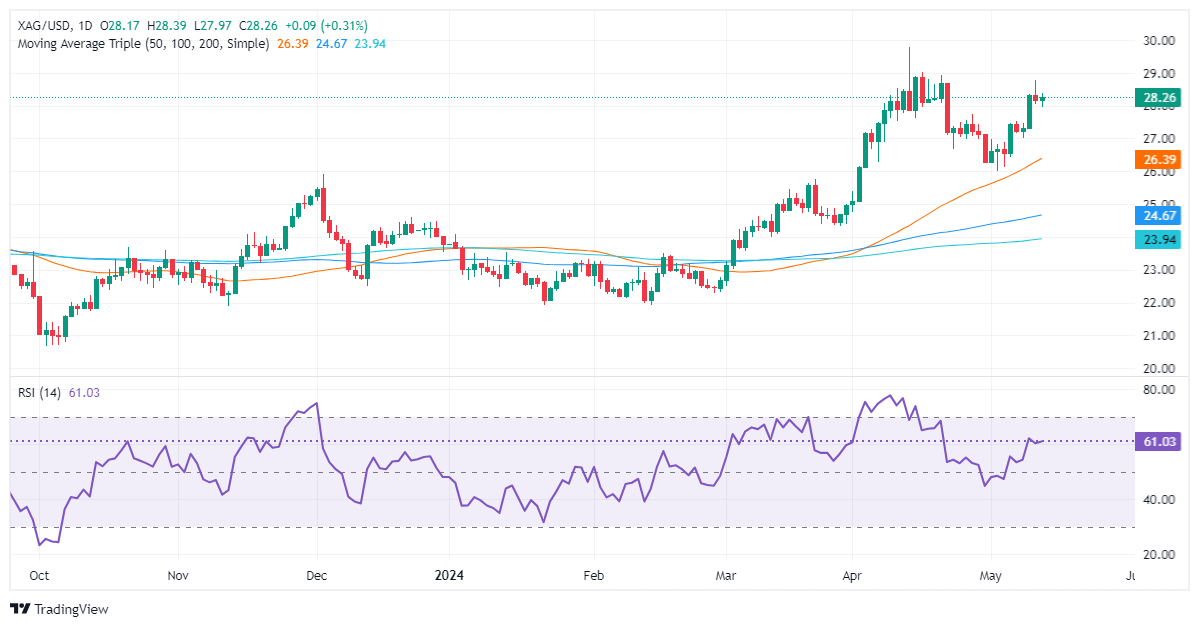
- Silver prices climb due to a weaker US Dollar and lower US yields.
- Traders await key inflation data from the US and Fed Chair Powell's speech.
- Momentum favors bulls, but a daily close below $28.00 and Silver could dip toward $27.00, short-term.
Silver's price advanced 0.28% on Monday, courtesy of falling yields in US Treasuries and a softer US Dollar. A scarce economic schedule in the US keeps investors bracing for releasing the Consumer Price Index (CPI) on May 15, but first, traders will deal with Fed Chair Jerome Powell's speech on Tuesday. The XAG/USD trades at $28.22 after hitting a low of $27.97.
XAG/USD Price Analysis: Technical outlook
After peaking at around $28.74 last week, Silver dipped toward the $28.00 figure before reversing its course and shifting positively during the day. However, the grey metal remains below the June 10, 2021, high of $28.28, which could open the door for a pullback.
Momentum, as measured by the Relative Strength Index (RSI), favors the XAG/USD bulls, but a daily close below $28.00 could pave the way for further losses.
In that outcome, the XAG/USD first support would be the 38.2% Fib retracement at $27.70, followed by April’s 15 low of $27.59. Once cleared, the next stop would be the 50% Fib retracement at $27.06.
On the other hand, if Silver stays above $28.00, that could open the door for a bullish continuation. The first resistance would be May 10, high at $28.76. Once cleared, key resistance levels surface, like the $29.00 figure, followed by the year-to-date (YTD) high of $29.79.
XAG/USD Price Action – Daily Chart
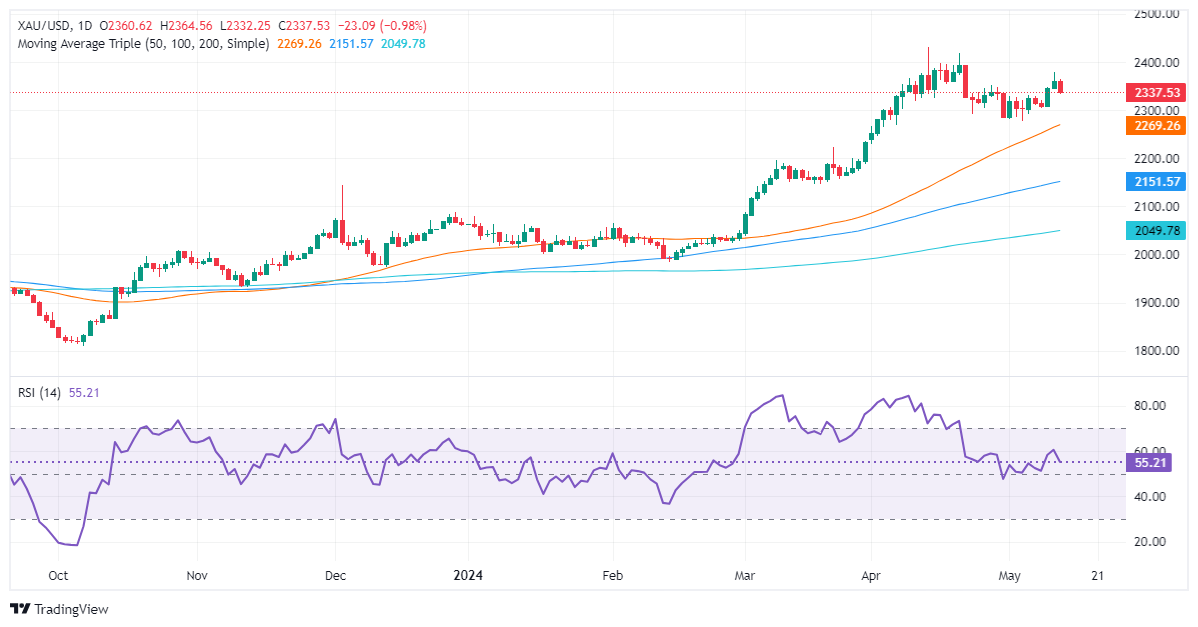
- Gold falls 1%, retreating from $2,350, despite typically supportive lower US Treasury yields.
- US economic events, including inflation data and a speech by Fed Chair Powell, are poised to influence markets.
- Fed Vice-Chairman Jefferson was hawkish, stressed importance of driving inflation toward 2% target.
Gold prices retreated sharply on Monday from near $2,350 even though US Treasury yields declined, undermining appetite for the Greenback. Traders brace for a busy economic docket in the United States (US) led by the release of inflation figures, Retail Sales, and the May 14 speech of Federal Reserve (Fed) Chair Jerome Powell.
Earlier on Monday, Fed Vice-Chairman Philip Jefferson addressed the media in a Q&A session at the Cleveland Fed. He said, “We continue to look for additional evidence that inflation is going to return to our 2% target.”
The XAU/USD trades at $2,336, down 1% amid a risk-on impulse. Wall Street continues to post gains. Recent labor market data, such as April’s Nonfarm Payrolls and last week’s Initial Unemployment Claims, could pressure the Fed. In its latest monetary policy statement, officials recognized that the risks to achieving the Fed's dual mandate of fostering maximum employment and price stability have become more balanced over the past year.
Meanwhile, the US Bureau of Labor Statistics (BLS) is expected to release the producer and consumer inflation data for April on May 14 and 15. If price pressures reaccelerate, the Fed can hold rates “higher for longer.”
Daily digest market movers: Gold falls as US data could influence Fed’s rate path
- Gold prices fell amid lower US Treasury yields and a strong US Dollar. The US 10-year Treasury note yields 4.479% and is down two basis points (bps) from its opening level. The US Dollar Index (DXY), which tracks the Greenback's performance against six other currencies, falls 0.10% to 105.20.
- The Producer Price Index (PPI) for April is expected to be at 0.3% MoM, a tenth above the prior month’s number. Core PPI is foreseen at 0.2% MoM, unchanged compared to March.
- April’s Consumer Price Index (CPI) is projected to remain unchanged compared to March’s reading at 0.4% MoM. The Core CPI is expected to resume its lower trend from 0.4% in March to 0.3% MoM.
- Investors are eyeing Fed Chair Jerome Powell's speech on May 14.
- Further data will be featured during the week, led by Retail Sales on May 15, Initial Jobless Claims, and Industrial Production on May 16.
- The New York Federal Reserve released its monthly Survey of Consumer Expectations on Monday, showing that the year's inflation expectations increased to 3.3% vs. 3% in March. The data came after the University of Michigan Consumer Sentiment poll showed that inflation expectations for a one-year outlook rose from 3.2% to 3.5%.
- Interest rate cut expectations toward the end of the year remain at 34 basis points (bps), according to data provided by the Chicago Board of Trade (CBOT).
Technical analysis: Gold price tumbles below $2,350 with bears eyeing $2,300
The uptrend in the Gold price remains intact, even though from a technical perspective the formation of a quasi Shooting Star candlestick pattern followed by a bearish Belt Hold line opened the door for a leg down. Although momentum favors buyers, the short term is aiming lower, meaning they’re losing traction.
Hence, XAU/USD's first support would be the May 9 low of $2,306, followed by the $2,300 figure. Once cleared, the next stop would be the 50-day Simple Moving Average (SMA) at $2,249.
On the other hand, if buyers reclaim $2,359, look for a test of the April 26 high at $2,352. A breach of the latter would expose the $2,400 figure, immediately followed by the April 19 high at $2,417 and the all-time high of $2,431.
Gold FAQs
Gold has played a key role in human’s history as it has been widely used as a store of value and medium of exchange. Currently, apart from its shine and usage for jewelry, the precious metal is widely seen as a safe-haven asset, meaning that it is considered a good investment during turbulent times. Gold is also widely seen as a hedge against inflation and against depreciating currencies as it doesn’t rely on any specific issuer or government.
Central banks are the biggest Gold holders. In their aim to support their currencies in turbulent times, central banks tend to diversify their reserves and buy Gold to improve the perceived strength of the economy and the currency. High Gold reserves can be a source of trust for a country’s solvency. Central banks added 1,136 tonnes of Gold worth around $70 billion to their reserves in 2022, according to data from the World Gold Council. This is the highest yearly purchase since records began. Central banks from emerging economies such as China, India and Turkey are quickly increasing their Gold reserves.
Gold has an inverse correlation with the US Dollar and US Treasuries, which are both major reserve and safe-haven assets. When the Dollar depreciates, Gold tends to rise, enabling investors and central banks to diversify their assets in turbulent times. Gold is also inversely correlated with risk assets. A rally in the stock market tends to weaken Gold price, while sell-offs in riskier markets tend to favor the precious metal.
The price can move due to a wide range of factors. Geopolitical instability or fears of a deep recession can quickly make Gold price escalate due to its safe-haven status. As a yield-less asset, Gold tends to rise with lower interest rates, while higher cost of money usually weighs down on the yellow metal. Still, most moves depend on how the US Dollar (USD) behaves as the asset is priced in dollars (XAU/USD). A strong Dollar tends to keep the price of Gold controlled, whereas a weaker Dollar is likely to push Gold prices up.
The Greenback kicked off the week on the back foot amidst the generalized better tone in the appetite for the risk-related assets. Easing inflation figures in China and further stimulus helped with the sentiment amidst rising caution prior to the publication of crucial US inflation data.
Here is what you need to know on Tuesday, May 14:
The USD Index (DXY) traded with modest losses, although it managed to keep business above the 105.00 support. On May 14, Producer Prices are due along with the speech by Fed’s L. Cook and the discussion panel with Chair Powell.
EUR/USD reclaimed the area beyond the 1.0800 barrier to print new multi-day highs amidst broad-based Dollar weakness. Germany’s final Inflation Rate is due on May 14 seconded by the Economic Sentiment gauged by the ZEW institute in both Germany and the broader euro bloc.
GBP/USD advanced markedly past the 1.2500 barrier on the back of the resumption of the selling pressure in the Greenback. The publication of the UK labour market figures and the speech by BoE’s H. Pill are all expected to MY 14.
USD/JPY kept its march north in place, advancing to fresh highs past the 156.00 hurdle. The Japanese docket includes the release of Producer Prices on May 14.
In line with its risky peers, AUD/USD faded Friday’s pullback and rose beyond the 0.6600 mark, maintaining its trade in the upper end of the monthly range for the time being. The next publication of note in Oz will be the Wage Price Index on May 15.
WTI prices reversed part of Friday’s weakness and rose markedly further up of the $79.00 mark per barrel on Monday on the back of auspicious data from China and supply concerns from wildfires in Canada.
Gold prices reversed two straight sessions of gains and retreated to the $2,330 zone amidst rising prudence pre-US CPI. Silver prices, in the meantime, advanced modestly above the $28.00 mark per ounce.
- Dow Jones sheds 0.2% on Monday after NY Fed inflation survey accelerated.
- Markets continue to pin hopes on Fed rate cuts in 2024.
- US PPI, CPI inflation figures loom in the week ahead.
The Dow Jones Industrial Average (DJIA) kicked off the new trading week softly higher before getting knocked back after the Federal Reserve (Fed) Bank of New York revealed that consumer inflation expectations for the coming year accelerated to 3.3%. NY Fed consumer one-year inflation expectations from the previous 3.0% as price growth continues to eat away at consumer purchasing power.
US Producer Price Index (PPI) inflation data is slated for Tuesday. Markets expect Core PPI Inflation for the year ended April to hold steady at 2.4%. On Wednesday, US Consumer Price Index (CPI) inflation data will be updated, with April’s MoM headline CPI inflation expected to hold flat at 0.4%.
Despite rising consumer inflation expectations, market participants continue to lean into Fed rate cut hopes. According to the CME’s FedWatch Tool, rate markets are pricing in 65% odds of a September rate trim, with 90% odds priced in of at least one rate cut in before the end of the year. Market bets on rate cuts have begun to come unchained from overall expectations, with a Reuters poll of economists revealing nearly two-thirds of respondents expecting a September cut. At the same time, polled economists also do not see inflation hitting the Fed’s 2% target until 2026, complicating the outlook for Fed rate cuts.
Dow Jones news
The Dow Jones is down around a fifth of a percent on Monday, with half of the index’s component equities in the red for the day’s market session. Home Depot Inc. (HD) is leading the index lower, tumbling -1.4% and losing around 5 points to trade at $351.52 per share. On the high side, Intel Corp. (INTC) rose around 2.7%, climbing to $30.64 per share.
Dow Jones technical outlook
The Dow Jones Industrial Average rose to 39,640.00 early Monday before an intraday slide, bouncing off of the 39,400.00 level as the major equity index churns within technical levels established late last week.
Daily candlesticks show the Dow Jones index is due for a pullback with the index still trading on the high end of a seven-day winning streak, having risen around 5% from the last swing low into 37,600.00. The Dow Jones’ recent bull run brought the equity index within reach of all-time highs set just below the 40,000.00 price level, and bulls remain firmly in control with price action firmly norther of the 200-day Exponential Moving Average (EMA) at 36,938.27.
Dow Jones five minute chart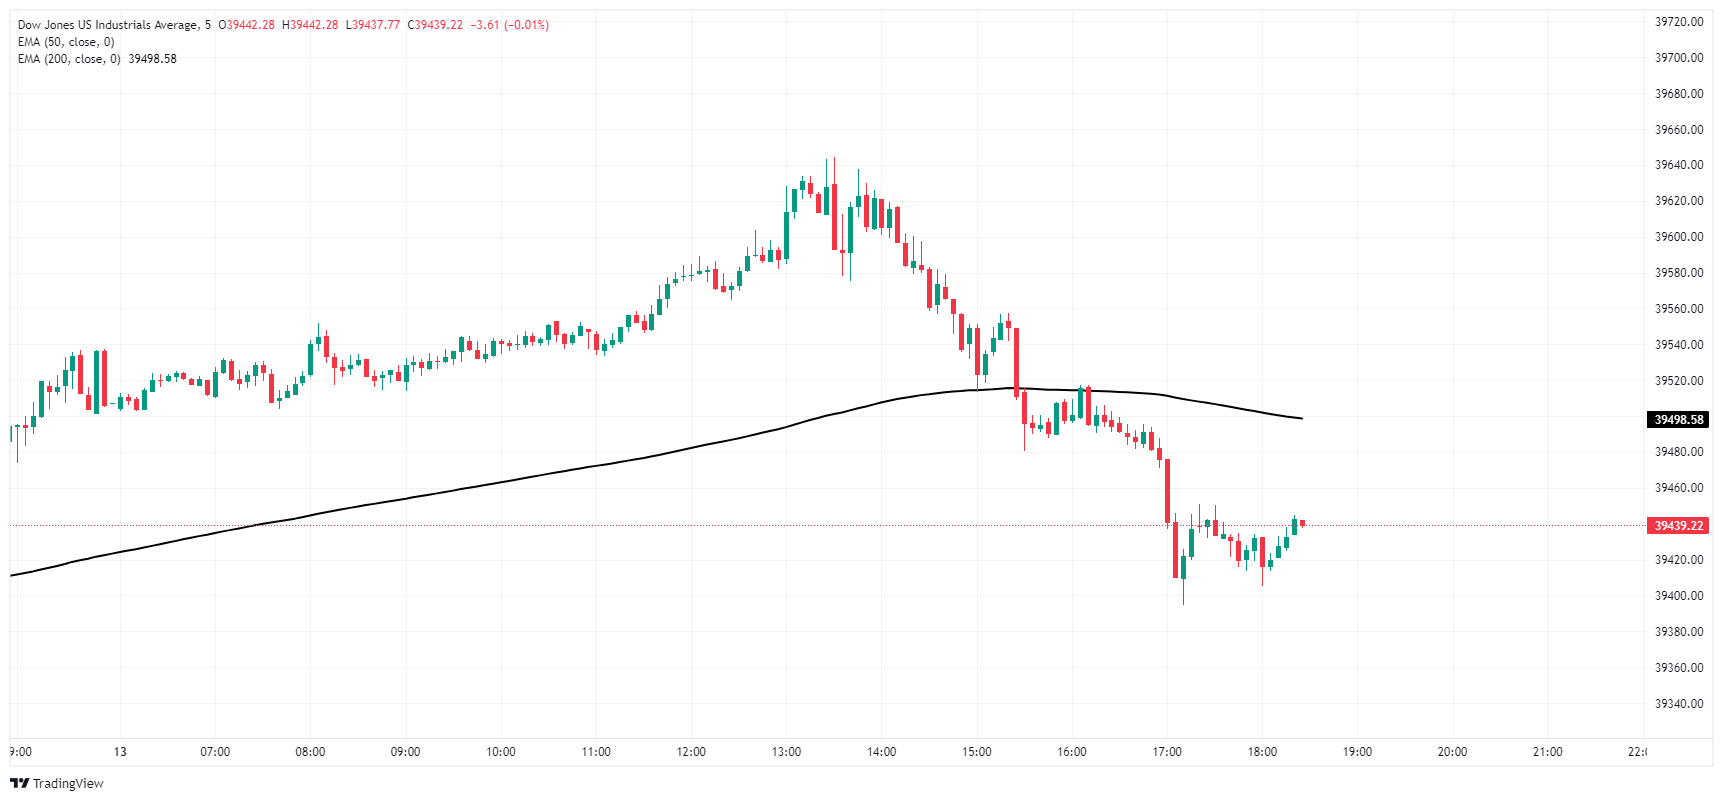
Dow Jones daily chart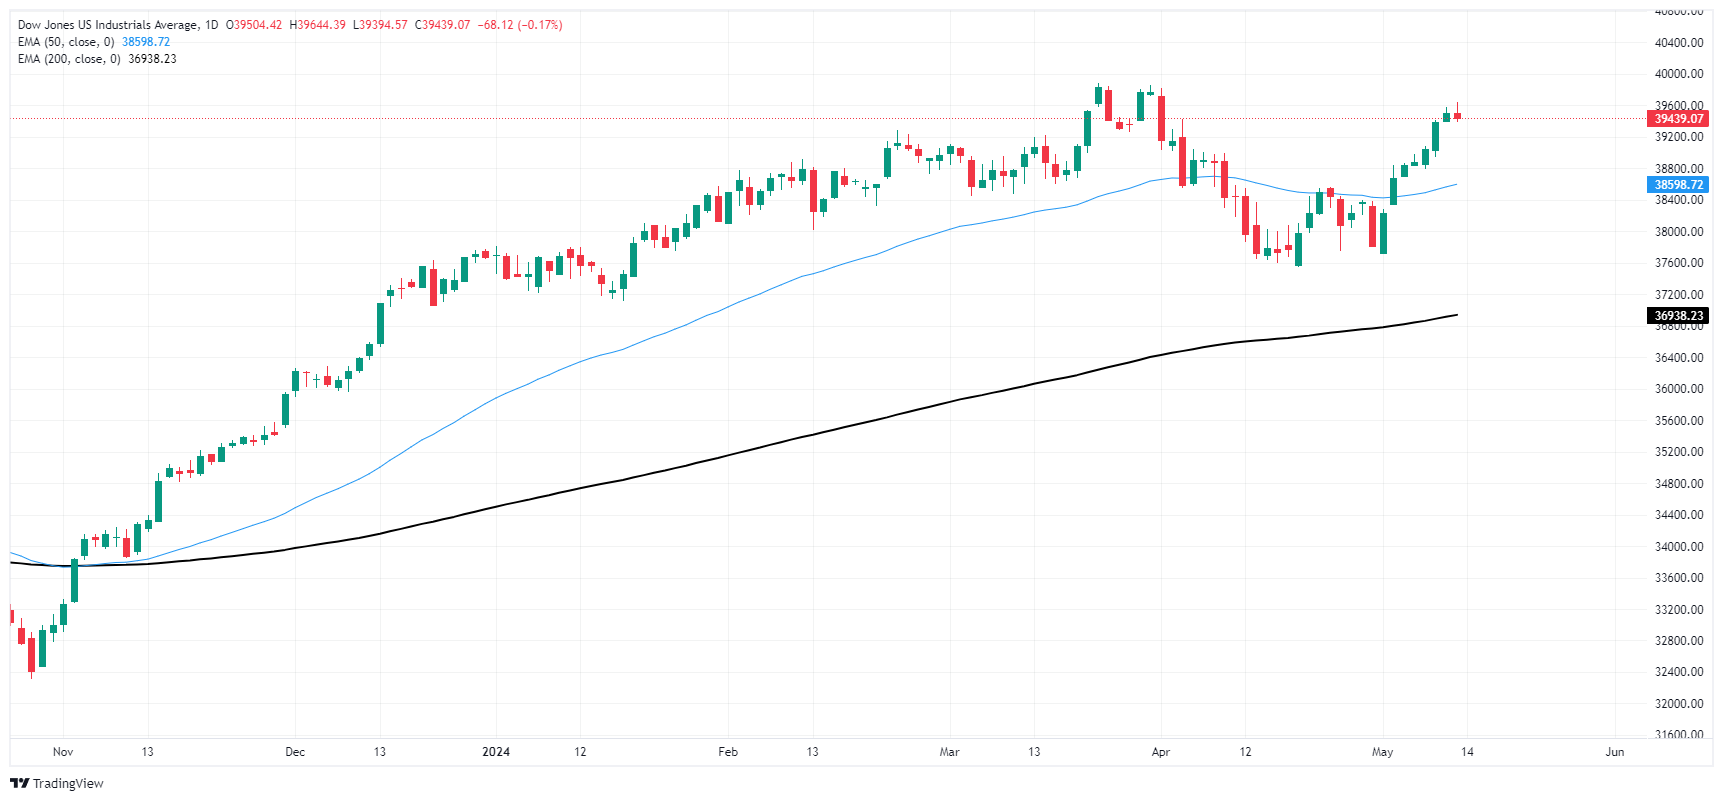
Fed FAQs
Monetary policy in the US is shaped by the Federal Reserve (Fed). The Fed has two mandates: to achieve price stability and foster full employment. Its primary tool to achieve these goals is by adjusting interest rates. When prices are rising too quickly and inflation is above the Fed’s 2% target, it raises interest rates, increasing borrowing costs throughout the economy. This results in a stronger US Dollar (USD) as it makes the US a more attractive place for international investors to park their money. When inflation falls below 2% or the Unemployment Rate is too high, the Fed may lower interest rates to encourage borrowing, which weighs on the Greenback.
The Federal Reserve (Fed) holds eight policy meetings a year, where the Federal Open Market Committee (FOMC) assesses economic conditions and makes monetary policy decisions. The FOMC is attended by twelve Fed officials – the seven members of the Board of Governors, the president of the Federal Reserve Bank of New York, and four of the remaining eleven regional Reserve Bank presidents, who serve one-year terms on a rotating basis.
In extreme situations, the Federal Reserve may resort to a policy named Quantitative Easing (QE). QE is the process by which the Fed substantially increases the flow of credit in a stuck financial system. It is a non-standard policy measure used during crises or when inflation is extremely low. It was the Fed’s weapon of choice during the Great Financial Crisis in 2008. It involves the Fed printing more Dollars and using them to buy high grade bonds from financial institutions. QE usually weakens the US Dollar.
Quantitative tightening (QT) is the reverse process of QE, whereby the Federal Reserve stops buying bonds from financial institutions and does not reinvest the principal from the bonds it holds maturing, to purchase new bonds. It is usually positive for the value of the US Dollar.
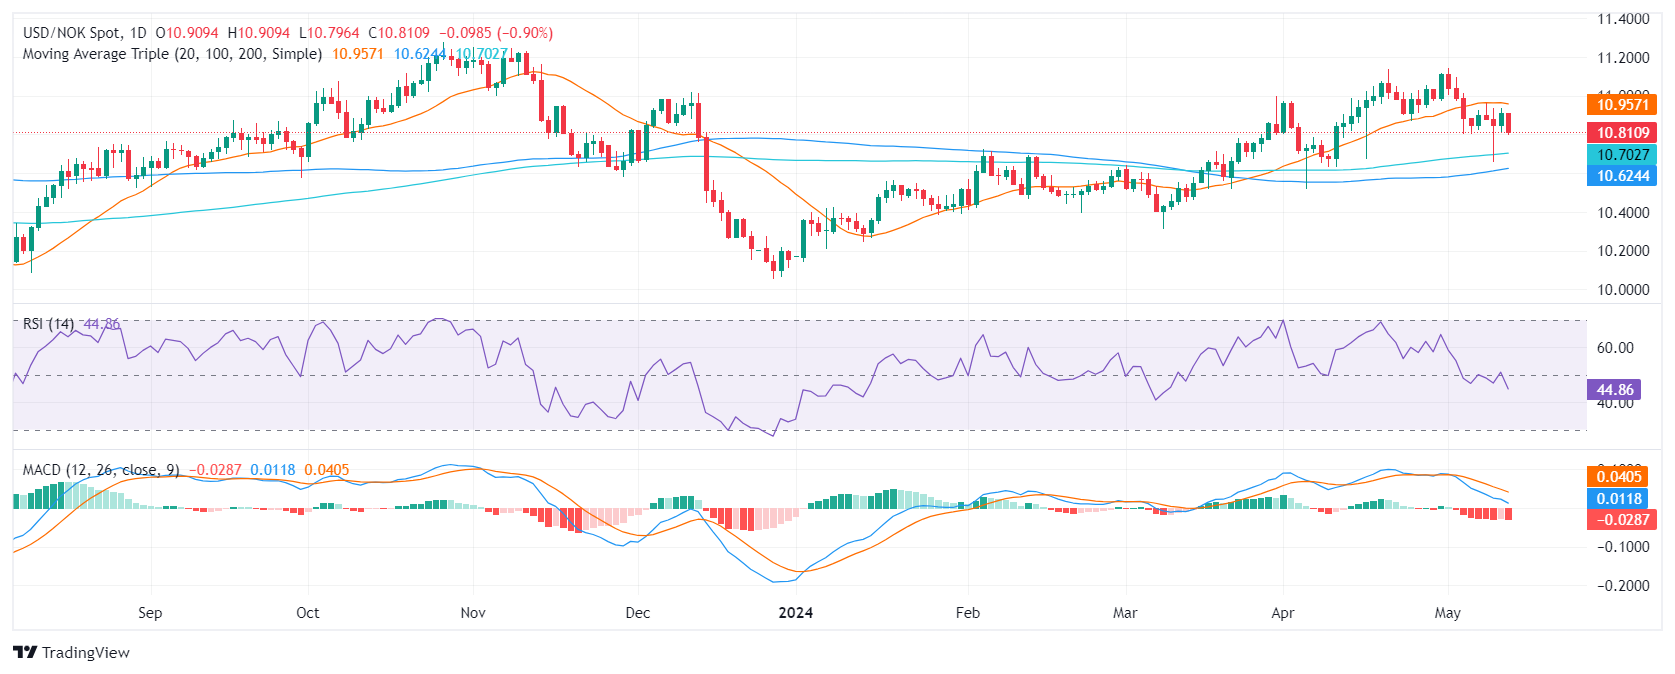
- With the Norges Bank holding rates at 4.5% and suggesting a prolonged duration of stringent monetary policies, a bullish trend for the NOK is likely.
- The Federal Reserve's cautious remarks provided support to the Dollar lately.
- Retail Sales and CPI data from the US this week will set the pace of the pair.
The USD/NOK pair saw a sharp decrease in Monday's trading session, driven primarily by ongoing hawkish sentiment from the Norges Bank and a somewhat weak start of the week for the Greenback.
The Federal Reserve (Fed) made guarded comments that have boosted the Dollar last week. As for now, the possibility of a June rate cut dropped to 5% compared to 10% at the start of last week, whereas July's odds fell to close to 25% from 40%, with a November adjustment remaining fully priced in. However, those odds will vary as the Fed has clearly stated that it remains data-dependant and this week’s Consumer Price Index (CPI) data from April as well as Retail Sales will be closely looked upon by investors.
On the NOK’s side, Norway's central bank, Norges Bank, maintained its hawkish stance, keeping the interest rate at 4.5% and implying an extended duration of a strict monetary policy. This inclination, along with April's Consumer Price Index (CPI) which showed a slight increase to an annual rate of 3.6% and an unexpected jump in the underlying inflation rate to 4.4%, has given rise to a bullish outlook for the NOK. Market participants only predict a 50 basis point cuts in the upcoming 12 months.
USD/NOK technical analysis
On the daily chart, the Relative Strength Index (RSI) for the USD/NOK pair resides in the negative territory, indicating a modest bearish momentum. Despite the RSI's oscillations within the negative and positive zones in recent sessions, the latest reading reveals a clearer downward trend, suggesting that sellers might slightly rule the market at the moment. The Moving Average Convergence Divergence (MACD) histogram, which shows ascending red bars, further supports this. These red bars on the MACD indicate that negative momentum is escalating and that bearish sentiment is taking root.
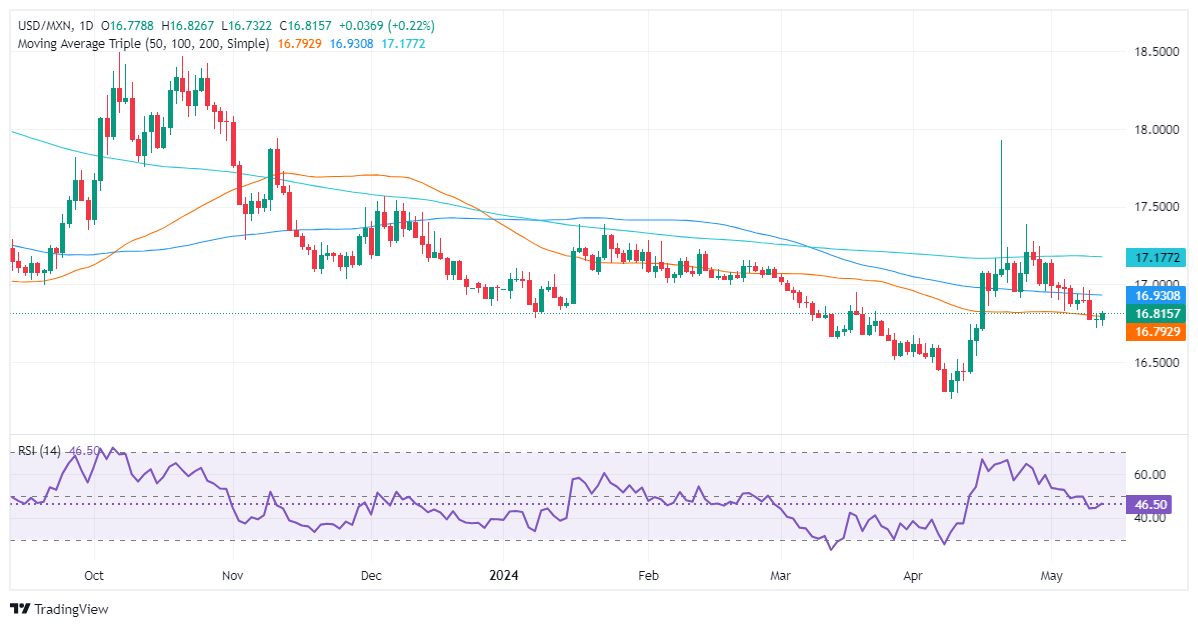
- Mexican Peso drops 0.51% against USD after Banxico Governor suggests potential rate cuts.
- Governor Rodriguez Ceja notes core inflation's downtrend, fueling speculation of a June 27 rate cut.
- Attention turns to US inflation data, critical for upcoming Fed policy decisions.
The Mexican Peso depreciated versus the US Dollar during the North American session on Monday after Bank of Mexico (Banxico) Governor Victoria Rodriguez Ceja commented, “We could evaluate downward adjustments” to the main reference rate. In the meantime, traders brace for the release of the latest inflation figures in the United States (US), which would be the spotlight as the Federal Reserve (Fed) delineates its monetary policy path. The USD/MXN trades at 16.81, up 0.51%.
Banxico Governor Victoria Rodriguez Ceja noted that the increase in general inflation was due to volatile non-core components. Nevertheless, she added that core prices continued a “very clear” downtrend. She added that depending on the evolution of the inflationary outlook, the Mexican central bank could evaluate whether to continue lowering interest rates, starting with the next meeting on June 27.
Last week, Banxico decided to keep rates unchanged at 11.00% following March’s first rate cut. In its monetary policy statement, the Governing Council mentioned that inflationary shocks “are foreseen to take longer to dissipate,” which spurred an upward revision of inflationary figures.
Across the border, the US economic docket featured a speech by Fed Vice-Chair Philip Jefferson, who said that it’s appropriate to keep policy rates restrictive until inflation ebbs.
Daily digest market movers: Mexican Peso drops amid a light economic docket
- Mexico’s economic docket will be absent during the current week. The next economic data released would be Retail Sales expected on May 20, followed by the Gross Domestic Product (GDP) and inflation figures on May 23.
- Banxico will reveal its latest meeting minutes on May 23.
- April's data show that Mexico’s headline inflation is reaccelerating. However, core prices are falling. This spurred Banxico’s revision to its inflation projections, with the bank expected to hit its 3% target toward the last quarter of 2025, later than March’s estimates for Q2 2025. Core inflation is projected to hit 3% in Q2 2025.
- In the short term, the US economic docket will feature the Producer Price Index (PPI) on May 14, followed by the Consumer Price Index (CPI) and Retail Sales on May 15.
- USD/MXN traders are eyeing Fed Chair Jerome Powell’s on May 14.
- The deterioration in consumer sentiment, alongside a cooling labor market, has opened the door for investors to price in rate cuts by the Fed. This is because US central bank policymakers acknowledged that risks to achieving its dual mandate on employment and inflation “moved toward better balance over the past year.”
- Data from the futures market show odds for a quarter-percentage-point Fed rate cut in September at 79% versus 78% last Friday.
Technical analysis: Mexican Peso falls as USD/MXN rises above 16.80
The USD/MXN downtrend remains in play, but a daily close above last Friday’s high of 16.81 could form a ‘bullish engulfing’ candle pattern, which could pave the way for a leg up. In the near term, momentum favors sellers as the Relative Strength Index (RSI) remains bearish but is briskly turning bullish.
If buyers lift the exchange rate above the 100-day Simple Moving Average (SMA) at 16.92, that could exacerbate a rally toward the 17.00 psychological level. A breach of the latter would expose the 200-day SMA at 17.17, followed by the January 23 swing high of 17.38 and the year-to-date high of 17.92.
On the flip side, a bearish continuation could resume if the USD/MXN tumbles below the 50-day SMA at 16.78, opening the door to test the 2023 low of 16.62, followed by the current year-to-date low of 16.25.
Mexican Peso FAQs
The Mexican Peso (MXN) is the most traded currency among its Latin American peers. Its value is broadly determined by the performance of the Mexican economy, the country’s central bank’s policy, the amount of foreign investment in the country and even the levels of remittances sent by Mexicans who live abroad, particularly in the United States. Geopolitical trends can also move MXN: for example, the process of nearshoring – or the decision by some firms to relocate manufacturing capacity and supply chains closer to their home countries – is also seen as a catalyst for the Mexican currency as the country is considered a key manufacturing hub in the American continent. Another catalyst for MXN is Oil prices as Mexico is a key exporter of the commodity.
The main objective of Mexico’s central bank, also known as Banxico, is to maintain inflation at low and stable levels (at or close to its target of 3%, the midpoint in a tolerance band of between 2% and 4%). To this end, the bank sets an appropriate level of interest rates. When inflation is too high, Banxico will attempt to tame it by raising interest rates, making it more expensive for households and businesses to borrow money, thus cooling demand and the overall economy. Higher interest rates are generally positive for the Mexican Peso (MXN) as they lead to higher yields, making the country a more attractive place for investors. On the contrary, lower interest rates tend to weaken MXN.
Macroeconomic data releases are key to assess the state of the economy and can have an impact on the Mexican Peso (MXN) valuation. A strong Mexican economy, based on high economic growth, low unemployment and high confidence is good for MXN. Not only does it attract more foreign investment but it may encourage the Bank of Mexico (Banxico) to increase interest rates, particularly if this strength comes together with elevated inflation. However, if economic data is weak, MXN is likely to depreciate.
As an emerging-market currency, the Mexican Peso (MXN) tends to strive during risk-on periods, or when investors perceive that broader market risks are low and thus are eager to engage with investments that carry a higher risk. Conversely, MXN tends to weaken at times of market turbulence or economic uncertainty as investors tend to sell higher-risk assets and flee to the more-stable safe havens.
- USD/JPY continues to grind higher as markets eat away at “Yentervention” declines.
- US inflation figures to dominate the trading week.
- Markets still hope for two rate cuts in 2024 despite inflation outlook.
USD/JPY broke above the 156.00 handle on Monday as markets continue to chew through Japanese Yen (JPY) gains following a pair of suspected “Yenterventions” from the Bank of Japan (BoJ) at the end of April and beginning of May. The BoJ has remained tight-lipped on the matter, refusing to officially confirm or deny direct intervention in global markets on behalf of the Yen. Still, BoJ financial operations reported overspending on forecast expenditures by around nine billion Yen the same week the JPY recovered 4.5% against the US Dollar (USD).
Markets will be focusing squarely on US inflation figures due this week,though Japanese Gross Domestic Product data is due early Thursday. Markets are broadly expecting Japanese GDP growth to contract, forecast to print at -0.4% in Q1 compared to the previous quarter’s 0.1%.
US Producer Price Index (PPI) inflation is slated for Tuesday, with Core PPI inflation expected to hold steady at 2.4% YoY in April. Wednesday’s US Consumer Price Index (CPI) inflation is expected to hold steady at 0.4% MoM in April, with YoY headline CPI inflation expected to tick down to 3.4% from 3.5%.
Despite a recent parade of policymakers from the Federal Reserve (Fed) voicing caution about markets hoping for rate cuts at a faster pace and sooner than the Fed can achieve, market hopes are still pinned firmly on two Fed cuts in 2024, with the first broadly expected to come in September. According to the CME’s FedWatch Tool, rate markets are pricing in nearly 90% odds of a rate cut in 2024, with 65% odds of a 25-basis-point cut in at the Fed’s September rate meeting.
USD/JPY technical outlook
USD/JPY has been slow to recover ground, but progress has been notably one-sided as the pair drifts higher, climbing over the 200-hour Exponential Moving Average (EMA) near 155.36. The pair is testing into chart territory north of the 156.00 handle, and is up nearly 3% from the last post-Yentervention bottom below 152.00.
USD/JPY is on pace to close in the green for a fifth out of the last six trading days after a sharp decline from multi-year highs above 160.00. The long-term bullish uptrend remains firmly intact, with bids trading well above the 200-day EMA at 148.29.
USD/JPY hourly chart
USD/JPY daily chart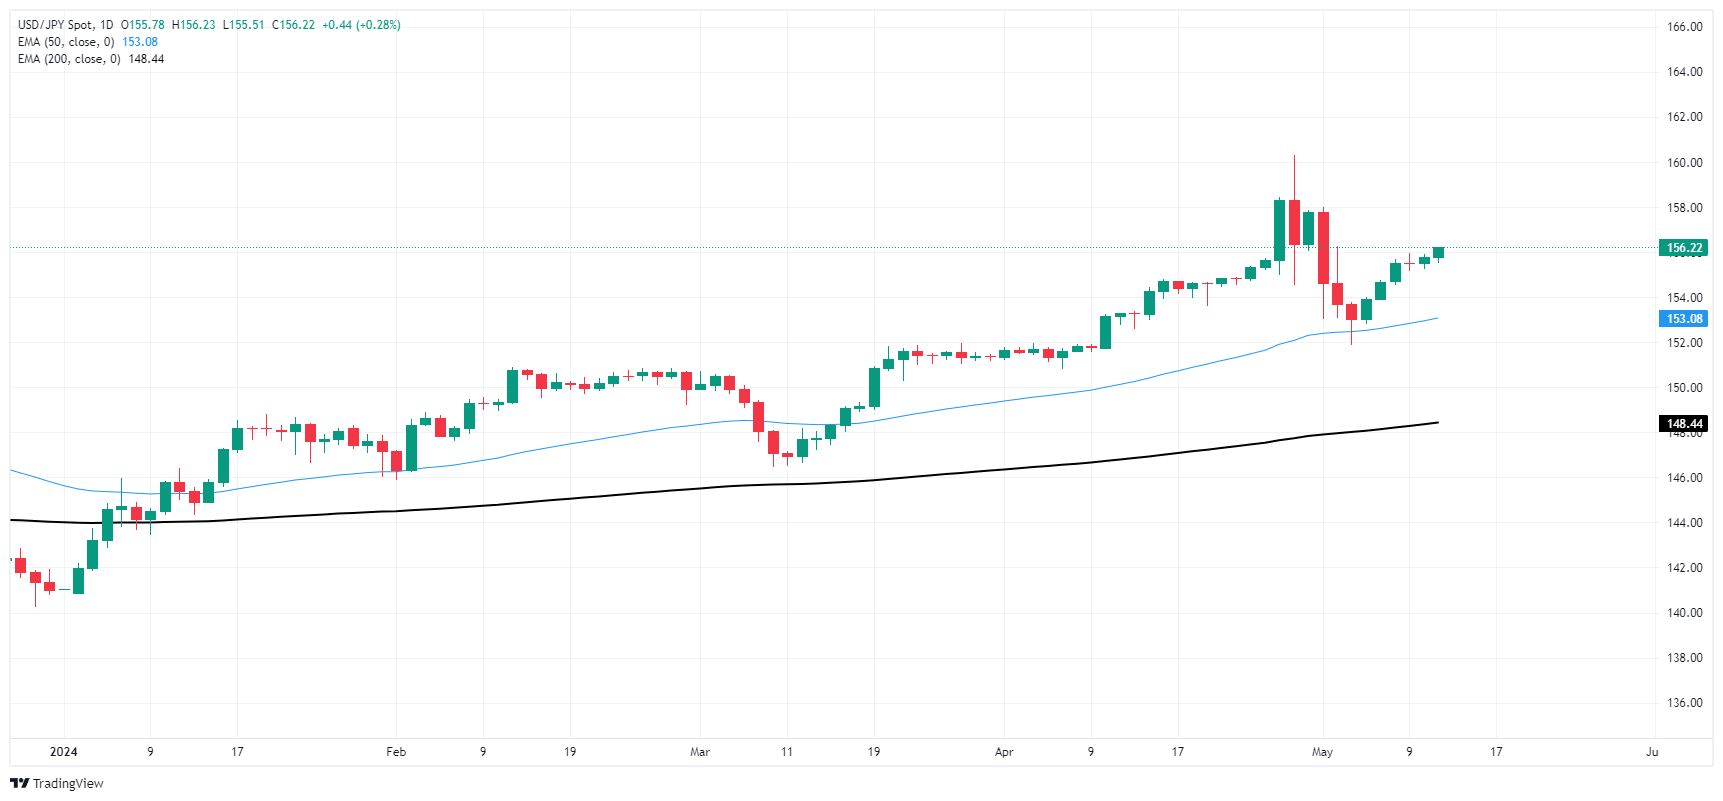
- DXY Index exhibits mild losses at 105.35, indicating a modest bearish trend.
- Market attention is centered on conservative Fed comments and April inflation expectations that could shape US Dollar outlook.
- Bets on the Fed remain steady and also lend support ot the USD.
The US Dollar Index (DXY) is trading mildly lower at 105.35 on Monday at the midpoint of the US session. The strong market odds and the Federal Reserve's (Fed) hawkish stance toward cutting interest rates limits the losses for the US Dollar. Any possible Greenback rally predominantly depends on major US data this week, particularly April’s Consumer Price Index (CPI) on Wednesday.
The US economy continues to exhibit robust growth in Q2, underpinning the USD's recovery following cautious Fed comments. Signals hinting at no imminent rate cuts have adjusted the market's easing expectations, fostering a more hawkish outlook. Fed officials' stance, while cautious, is largely data-driven, and key indicators such as CPI and Retail Sales due this week will drive the narrative.
Daily digest market movers: DXY mildly down ahead of CPI
- Fed remains vigilant, limiting USD losses. Rate cuts are not imminent with the probability of a June cut decreasing from 10% to 5% at the start of last week. Probability of a July cut reduced to approximately 25% from 40%.
- A November rate cut remains fully anticipated by the markets.
- This week is crucial with three major economic figures expected: Producer Price Index (PPI), CPI and Retail Sales. Market predictions suggest persistent inflation and robust growth in the US, which is likely to be verified by the upcoming data that would extend the Greenback’s rally.
DXY technical analysis: DXY reflects a probable bearish outlook despite bulls' efforts
The current technical picture of the DXY shows mixed signals that lean toward a more bearish outlook. The Relative Strength Index (RSI) prominently reveals a negative slope and is entrenched in negative territory. This points to a growing dominance of selling pressure, indicative of weakened buying momentum and a potential downward trend. Simultaneously, the Moving Average Convergence Divergence (MACD) displays flat red bars, a signal that, despite a struggling bullish momentum, the bearish momentum is failing to make strong gains.
As for the Simple Moving Averages (SMAs), they exhibit intricate dynamics. The DXY is trading beneath the 20-day SMA, representing short-term bearish dominance. However, the fact that the Index still remains above both the 100 and 200-day SMAs may hint toward potential long-term bullish pressure.
US Dollar FAQs
The US Dollar (USD) is the official currency of the United States of America, and the ‘de facto’ currency of a significant number of other countries where it is found in circulation alongside local notes. It is the most heavily traded currency in the world, accounting for over 88% of all global foreign exchange turnover, or an average of $6.6 trillion in transactions per day, according to data from 2022. Following the second world war, the USD took over from the British Pound as the world’s reserve currency. For most of its history, the US Dollar was backed by Gold, until the Bretton Woods Agreement in 1971 when the Gold Standard went away.
The most important single factor impacting on the value of the US Dollar is monetary policy, which is shaped by the Federal Reserve (Fed). The Fed has two mandates: to achieve price stability (control inflation) and foster full employment. Its primary tool to achieve these two goals is by adjusting interest rates. When prices are rising too quickly and inflation is above the Fed’s 2% target, the Fed will raise rates, which helps the USD value. When inflation falls below 2% or the Unemployment Rate is too high, the Fed may lower interest rates, which weighs on the Greenback.
In extreme situations, the Federal Reserve can also print more Dollars and enact quantitative easing (QE). QE is the process by which the Fed substantially increases the flow of credit in a stuck financial system. It is a non-standard policy measure used when credit has dried up because banks will not lend to each other (out of the fear of counterparty default). It is a last resort when simply lowering interest rates is unlikely to achieve the necessary result. It was the Fed’s weapon of choice to combat the credit crunch that occurred during the Great Financial Crisis in 2008. It involves the Fed printing more Dollars and using them to buy US government bonds predominantly from financial institutions. QE usually leads to a weaker US Dollar.
Quantitative tightening (QT) is the reverse process whereby the Federal Reserve stops buying bonds from financial institutions and does not reinvest the principal from the bonds it holds maturing in new purchases. It is usually positive for the US Dollar.
- Canadian Dollar middles as markets focus on Fed rate cuts.
- Canada issued far fewer building permits than expected in March.
- Markets continue to bet on two rate cuts in 2024 despite cautionary Fedspeak.
The Canadian Dollar (CAD) churned within familiar levels on Monday as a data-light economic calendar kicks off the new trading week. Investors continue to hinge risk appetite on rate cut expectations from the Federal Reserve (Fed) with updates to US inflation data due later in the week.
Canada saw a sharper-than-expected decline in new Building Permits issued in March, but data from early in the housing cycle remains low-tier and limited-impact. Canadian economic data remains low-priority for the rest of the week, leaving market participants to focus on the US Producer Price Index (PPI) due on Tuesday, followed by US Consumer Price Index (CPI) inflation and Retail Sales on Wednesday.
Daily digest market movers: Canadian Dollar stuck in the middle as rate cut hopes dominate
- Canadian Building Permits issued in March declined -11.7%, far below the -4.6% forecast, the sharpest decline in MoM Building Permits since June of 2023. April’s Building Permits were also revised slightly lower to 8.9% from 9.3%.
- The latest Survey of Consumer Expectations from the New York Fed noted that surveyed consumers expect inflation to rise to 3.3% over the next year, higher than the previous survey’s 3.0%.
- A Reuters survey of 108 economists showed nearly two-thirds of respondents still expect a quarter-point cut from the Fed by September despite none expecting inflation to reach the Fed’s 2% target before 2026.
- YoY US Producer Price Index inflation is expected to rise to 2.2% on Tuesday, compared to the previous period’s 2.1%.
- Wednesday’s US CPI inflation print for April is forecast to hold steady at 0.4% MoM, with the YoY figure expected to tick down to 3.4% from 3.5%.
Canadian Dollar PRICE Today
The table below shows the percentage change of Canadian Dollar (CAD) against listed major currencies today. Canadian Dollar was the strongest against the British Pound.
| USD | EUR | GBP | JPY | CAD | AUD | NZD | CHF | |
|---|---|---|---|---|---|---|---|---|
| USD | 0.22% | 0.28% | -0.27% | -0.05% | 0.12% | -0.11% | -0.14% | |
| EUR | -0.22% | 0.11% | -0.49% | -0.25% | -0.07% | -0.31% | -0.34% | |
| GBP | -0.28% | -0.11% | -0.53% | -0.37% | -0.19% | -0.42% | -0.45% | |
| JPY | 0.27% | 0.49% | 0.53% | 0.25% | 0.36% | 0.22% | 0.12% | |
| CAD | 0.05% | 0.25% | 0.37% | -0.25% | 0.14% | -0.05% | -0.00% | |
| AUD | -0.12% | 0.07% | 0.19% | -0.36% | -0.14% | -0.13% | -0.27% | |
| NZD | 0.11% | 0.31% | 0.42% | -0.22% | 0.05% | 0.13% | -0.03% | |
| CHF | 0.14% | 0.34% | 0.45% | -0.12% | 0.00% | 0.27% | 0.03% |
The heat map shows percentage changes of major currencies against each other. The base currency is picked from the left column, while the quote currency is picked from the top row. For example, if you pick the Canadian Dollar from the left column and move along the horizontal line to the US Dollar, the percentage change displayed in the box will represent CAD (base)/USD (quote).
Technical analysis: Canadian Dollar middles as markets hold steady
The Canadian Dollar (CAD) trades tightly on Monday, sticking close to the new trading week’s opening bids. The CAD is trading within a quarter of a percent against nearly all of its major currency peers on Monday and holding next to flat against the US Dollar (USD).
The USD/CAD is struggling to find momentum on Monday, holding in place near 1.3680. Bids are treading water just above a near-term supply zone from 1.3660 to 1.3615. Topside momentum is capped by the 200-hour Exponential Moving Average (EMA) just below the 1.3700 handle, while short-sellers have been unsuccessful in dragging the pair back down to 1.3600.
USD/CAD hourly chart
USD/CAD daily chart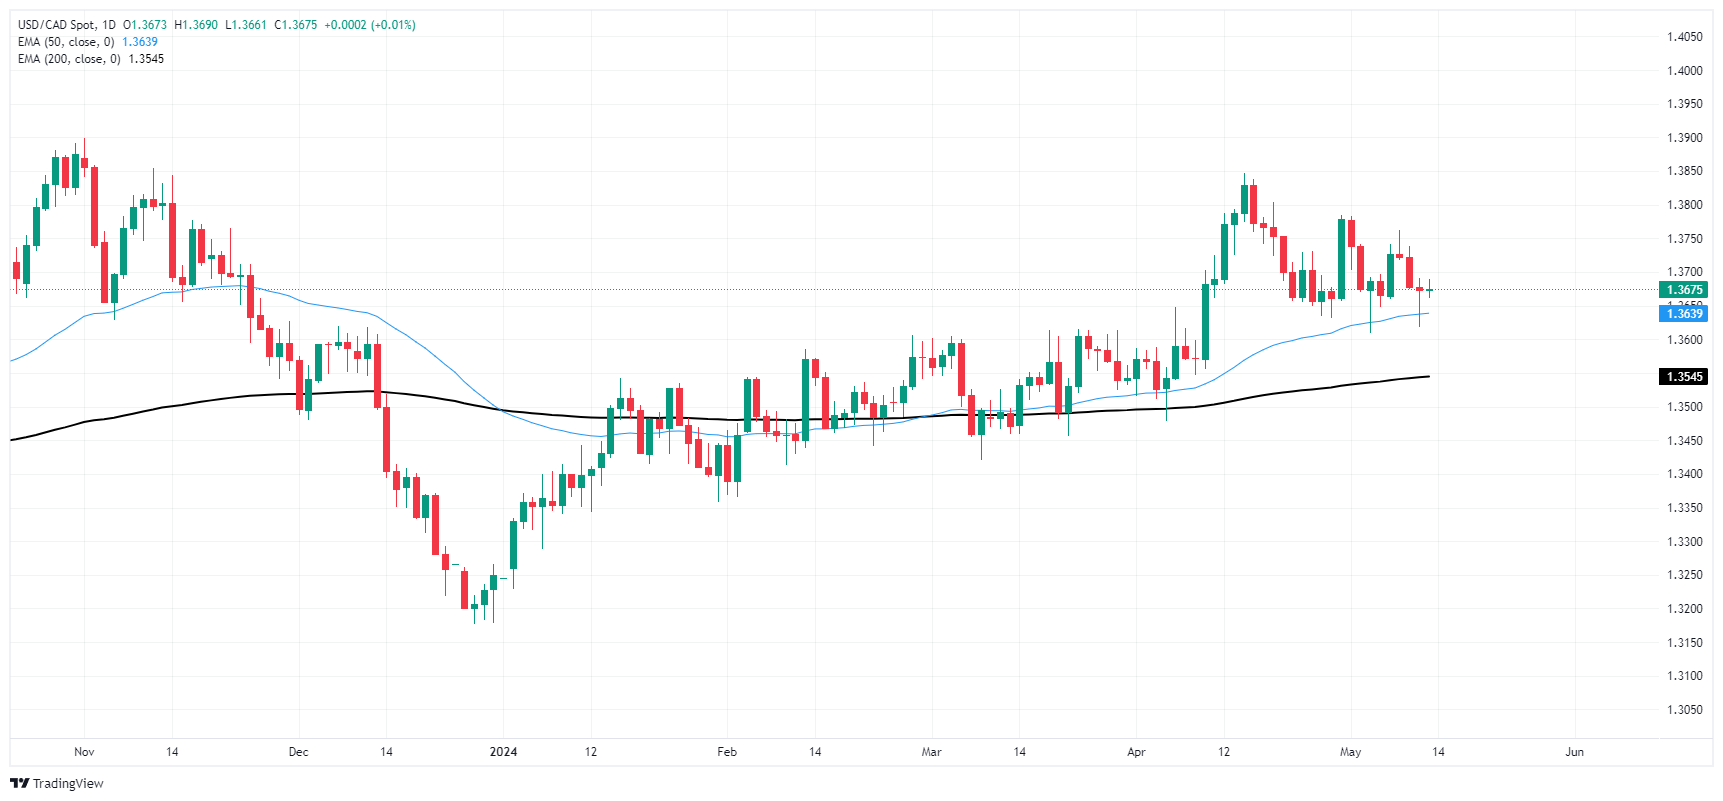
Canadian Dollar FAQs
The key factors driving the Canadian Dollar (CAD) are the level of interest rates set by the Bank of Canada (BoC), the price of Oil, Canada’s largest export, the health of its economy, inflation and the Trade Balance, which is the difference between the value of Canada’s exports versus its imports. Other factors include market sentiment – whether investors are taking on more risky assets (risk-on) or seeking safe-havens (risk-off) – with risk-on being CAD-positive. As its largest trading partner, the health of the US economy is also a key factor influencing the Canadian Dollar.
The Bank of Canada (BoC) has a significant influence on the Canadian Dollar by setting the level of interest rates that banks can lend to one another. This influences the level of interest rates for everyone. The main goal of the BoC is to maintain inflation at 1-3% by adjusting interest rates up or down. Relatively higher interest rates tend to be positive for the CAD. The Bank of Canada can also use quantitative easing and tightening to influence credit conditions, with the former CAD-negative and the latter CAD-positive.
The price of Oil is a key factor impacting the value of the Canadian Dollar. Petroleum is Canada’s biggest export, so Oil price tends to have an immediate impact on the CAD value. Generally, if Oil price rises CAD also goes up, as aggregate demand for the currency increases. The opposite is the case if the price of Oil falls. Higher Oil prices also tend to result in a greater likelihood of a positive Trade Balance, which is also supportive of the CAD.
While inflation had always traditionally been thought of as a negative factor for a currency since it lowers the value of money, the opposite has actually been the case in modern times with the relaxation of cross-border capital controls. Higher inflation tends to lead central banks to put up interest rates which attracts more capital inflows from global investors seeking a lucrative place to keep their money. This increases demand for the local currency, which in Canada’s case is the Canadian Dollar.
Macroeconomic data releases gauge the health of the economy and can have an impact on the Canadian Dollar. Indicators such as GDP, Manufacturing and Services PMIs, employment, and consumer sentiment surveys can all influence the direction of the CAD. A strong economy is good for the Canadian Dollar. Not only does it attract more foreign investment but it may encourage the Bank of Canada to put up interest rates, leading to a stronger currency. If economic data is weak, however, the CAD is likely to fall.
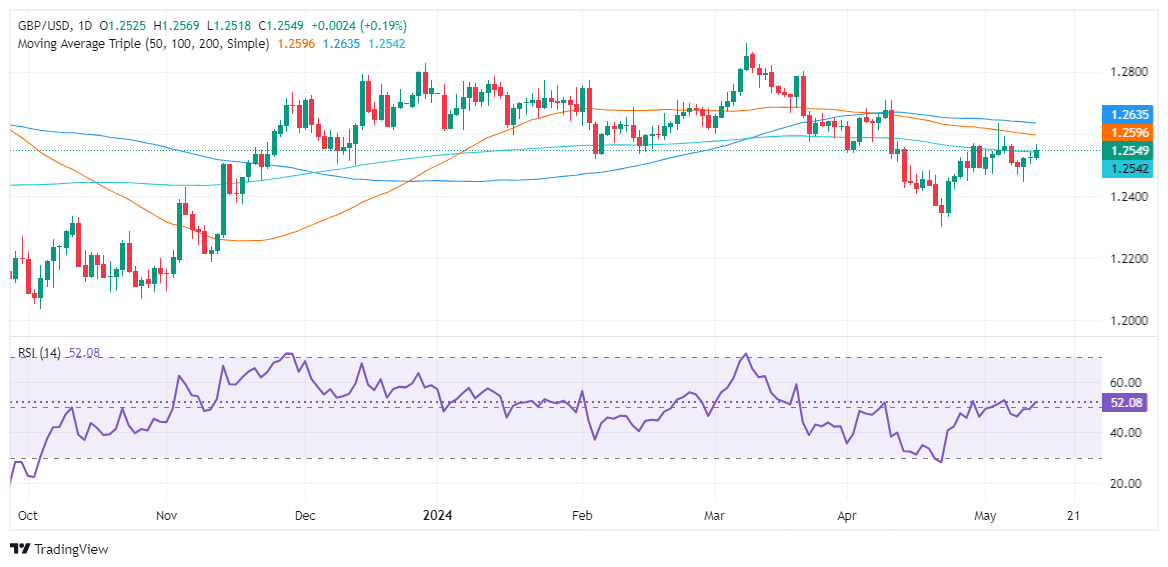
- GBP/USD edges higher on soft US Dollar, climbs above 200-DMA.
- If buyers reclaim 1.2600, look for a test of 1.2700 in the near term.
- Once the pair tumbles below 1.2500, look for a drop toward 1.2445 and 1.2299.
The Pound Sterling gains traction against the US Dollar and climbs above the 200-day moving average (DMA) of 1.2541 in early trading during the North American session. At the time of writing, the GBP/USD trades at 1.2566, up by 0.36%.
GBP/USD Price Analysis: Technical outlook
The GBP/USD is currently uncertain, showing a neutral bias. It is unable to decisively continue trending up and push above the May 3 high at 1.2634, the latest cycle high. Once cleared, that could exacerbate a rally toward the April 9 high at 1.2709 before challenging the psychological 1.2800 figure.
On the other hand, a bearish resumption is most likely once sellers’ step in and breach below the 200-DMA and 1.2500. If those two levels are taken out, the next support emerges at 1.2445 the May 9 low, followed by the April 22 low of 1.2299.
GBP/USD Price Action – Daily Chart
- USD/CAD falls sharply from 1.3700 amid a soft US Dollar.
- Investors await the US Inflation for fresh guidance on interest rates.
- Strong Canadian job data deepens uncertainty over BoC rate-cut prospects.
The USD/CAD pair falls back sharply while attempting to recapture the round-level resistance of 1.3700 in Monday’s American session. The Loonie asset comes under pressure as the US Dollar falls sharply due to firm speculation that the Federal Reserve (Fed) will start reducing interest rates from the September meeting.
This has also improved the risk appetite of investors. The S&P 500 opens on a positive note, exhibiting a cheerful market sentiment. The US Dollar Index (DXY), which tracks the Greenback’s value against six major currencies, remains feeble near the crucial support of 105.00. 10-year US Treasury yields fall sharply to 4.47%. The deepening confidence of investors for the Fed to return to policy normalisation is an unfavourable scenario for the US Dollar and bond yields.
The US Dollar is under pressure as weak United States Nonfarm Payrolls (NFP) for April and larger-than-expected Initial Jobless Claims for the week ending May 3 have shaken investors’ confidence in labor market strength.
Meanwhile, investors shift focus to the US Inflation data for April, which will be published on Wednesday. Hotter-than-expected inflation data would neutralize the impact of fewer hiring and slower wage growth in April and will force traders to unwind their bets in favor of rate cuts in September. On the contrary, soft inflation data will further boosts Fed rate-cut prospects.
On the Canadian Dollar front, strong Employment data for April has blown expectations for the Bank of Canada (BoC), pivoting to policy normalisation from the June meeting. Statistics Canada reported that Canadian employers hired 90.4K job-seekers in April, significantly higher than the consensus of 18K. In March, the job market recorded a lay-off of 2.2K employees. The Unemployment Rate remains steady at 6.1% while investors estimated the joblessness to rise to 6.2%.
Federal Reserve Vice-Chairman Phillip Jefferson stated on Monday that he advocates maintaining current interest rates until there is evident moderation in price pressures.
Key Takeaways
Economy has made a lot of progress, inflation has retreated’
The labor market has been very resilient.
I view the economy as in a solid position.
The decline in inflation has attenuated.
Inflation is a source of concern.
Is focused even more so on inflation given broader strength.
It is appropriate that we maintain the policy rate in restrictive territory.
Important to look for more evidence inflation is abating.
It is appropriate to keep the policy rate restrictive until clear inflation ebbing.
Market Reaction
The Greenback remains largely on the defensive and promps the USD Index (DXY) to recede to the area of daily lows near the 105.00 neighbourhood on Monday.
- The Japanese Yen drops further as investors remain uncertain about BoJ extending the policy normalization process.
- Japan’s economy is estimated to have contracted by 0.4% in the January-March period, exhibiting a weak start to the year.
- The US Dollar will dance to the tunes of the US consumer and producer inflation data.
The Japanese Yen (JPY) falls further to 156.00 against the US Dollar (USD) in Monday’s European session. The USD/JPY pair moves upwards as investors worry that rising inflation in the Japanese economy is mainly the outcome of a weak Yen, which should be driven by a wage growth spiral for price pressures to sustain steadily above the desired rate of 2%.
The communication from Bank of Japan’s (BoJ) Summary of Opinions (SOP) for the April meeting, released last week, indicated that inflationary pressures in Japan are majorly induced by weak Yen. Policymakers discussed possible scenarios for further rate hikes. One member said the extent of consumption recovery toward the latter half of this year will be key in considering the timing for the next policy change.
This week, the outlook of the Japanese Yen will be guided by preliminary Japan’s Q1 Gross Domestic Product (GDP) data, which will be published on Thursday. The consensus suggests that the Japanese economy contracted by 0.4% in the January-March period after expanding by 0.1% in the last quarter of 2023. On an annualized basis, the Japanese economy is estimated to have contracted significantly by 1.5%.
Daily digest market movers: Japanese Yen weakens despite subdued USD
- The Japanese Yen extends its downside to near 156.00 against the US Dollar even though the Greenback is on the back foot due to deepening concerns over the United States labor market strength after weak Nonfarm Payrolls (NFP) for April, lower Job Openings for March and a large number of individuals claiming jobless benefits for the first time for the week ending May 3. The US Dollar Index (DXY), which tracks the US Dollar’s value against six major currencies, is slightly down below 105.30.
- In the current scenario, easing tight labor market conditions is unfavorable for the US Dollar and bond yields as it exhibits softening inflation outlook, which strengthens speculation for the US Federal Reserve (Fed) returning to policy normalization. The CME FedWatch tool shows that the September meeting will be the earliest when interest rates will be lowered from their current range of 5.25%-5.50%.
- This week, investors will focus on the US Producer Price Index (PPI), Consumer Price Index (CPI) and Retail Sales data for April. The US PPI data releasing on Tuesday will exhibit the change in prices of goods and services by business owners. On Wednesday, consumer inflation and Retail Sales data will be released, which will provide fresh cues on the interest rate outlook.
- Economists expect that monthly headline and core CPI rose by 0.3% in April, slower than March’s reading of 0.4%. Annual headline CPI is forecasted to have softened to 3.4% from 3.5% in March. In the same period, the core inflation that strips off volatile food and energy prices is anticipated to have decelerated to 3.6% from the prior reading of 3.8%.
- Hot inflation data will offset investors’ optimism for Fed rate cuts in September built on easing labor market data. On the contrary, soft inflation figures will strengthen investors’ confidence in the Fed reducing interest rates from September. Traders could raise bets for the Fed to start lowering borrowing rates in July if the inflation data decelerates more than expected.
Technical Analysis: Japanese Yen retraces 50% downside move from multi-year low of 160.32
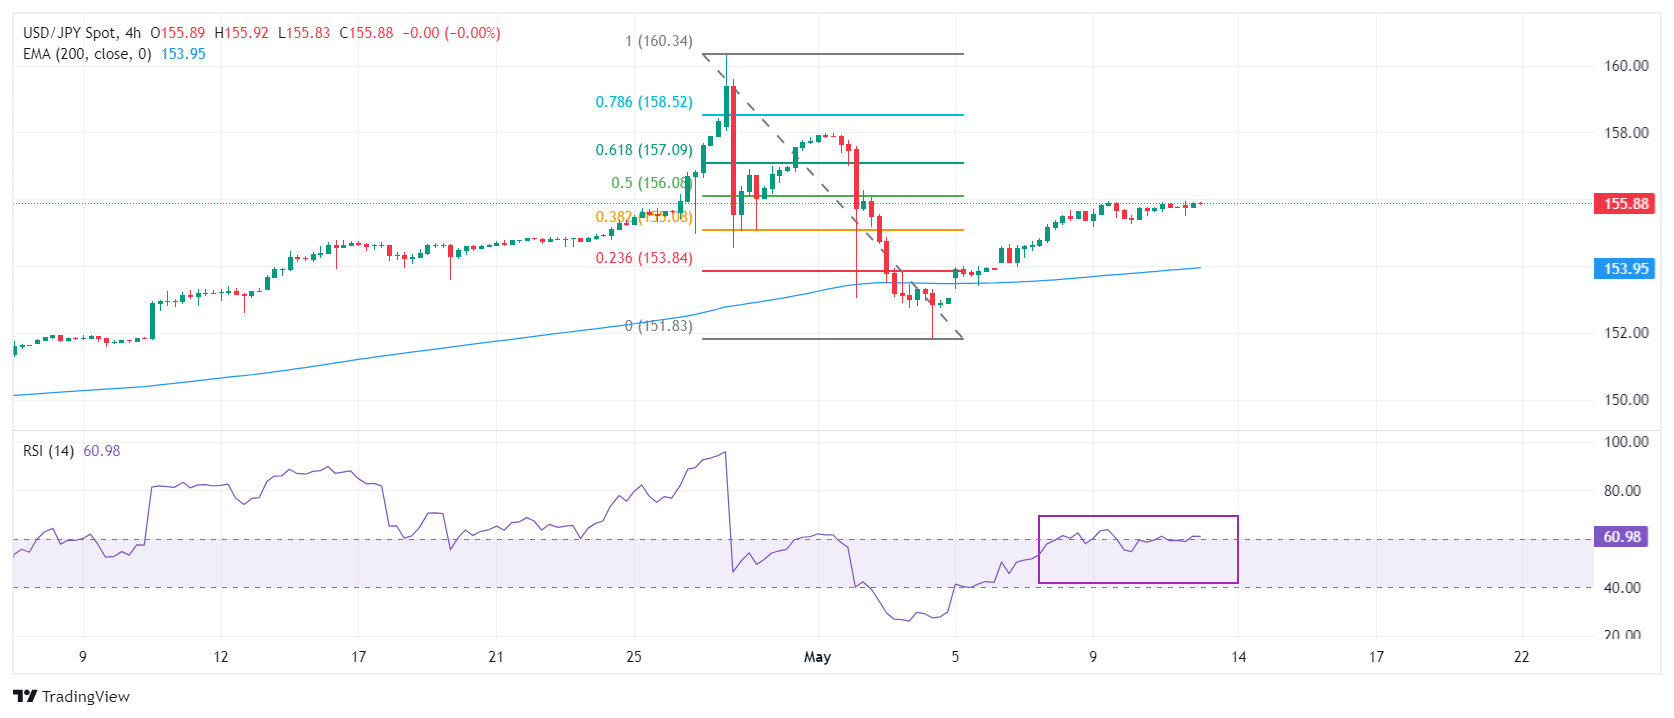
The Japanese Yen retraces 50% downside move from April’s low of 160.32 against the US Dollar, where investors suspect that the Japanese officials intervened. Investors suspected a probable intervention after the BoJ data suggested that it spent nearly 60 billion Yen to prevent further downside. The USD/JPY pair fell to near 151.82 after the suspected stealth intervention.
The 200-period Exponential Moving Average (EMA), which is currently trading near 156.00, acted as a major support for the US Dollar bulls. The cushion near the 200-EMA suggested that a positive long-term outlook is intact.
The 14-period Relative Strength Index (RSI) hovers near 60.00. A decisive break above this level will trigger the upside momentum.
Japanese Yen FAQs
The Japanese Yen (JPY) is one of the world’s most traded currencies. Its value is broadly determined by the performance of the Japanese economy, but more specifically by the Bank of Japan’s policy, the differential between Japanese and US bond yields, or risk sentiment among traders, among other factors.
One of the Bank of Japan’s mandates is currency control, so its moves are key for the Yen. The BoJ has directly intervened in currency markets sometimes, generally to lower the value of the Yen, although it refrains from doing it often due to political concerns of its main trading partners. The current BoJ ultra-loose monetary policy, based on massive stimulus to the economy, has caused the Yen to depreciate against its main currency peers. This process has exacerbated more recently due to an increasing policy divergence between the Bank of Japan and other main central banks, which have opted to increase interest rates sharply to fight decades-high levels of inflation.
The BoJ’s stance of sticking to ultra-loose monetary policy has led to a widening policy divergence with other central banks, particularly with the US Federal Reserve. This supports a widening of the differential between the 10-year US and Japanese bonds, which favors the US Dollar against the Japanese Yen.
The Japanese Yen is often seen as a safe-haven investment. This means that in times of market stress, investors are more likely to put their money in the Japanese currency due to its supposed reliability and stability. Turbulent times are likely to strengthen the Yen’s value against other currencies seen as more risky to invest in.
- The US Dollar consolidates on Monday after whipsaw moves last week.
- The economic calendar is quiet on Monday ahead of a busy week ahead.
- The US Dollar Index trades around 105.30, in the middle of last week’s range.
The US Dollar (USD) is trading flat and quiet on Monday, with the DXY US Dollar Index right in the middle of last week’s range at 105.30. The week starts calm on the economic data front, but it will get busier as days go by with the release of the US Producer Price Index (PPI) numbers on Tuesday and the Consumer Price Index (CPI) data on Wednesday.
On Monday, two US Federal Reserve (Fed) members are set to take the stage: Federal Reserve Vice Chair Phillip Jefferson is set to deliver opening remarks and participate in a Q&A session at the Theory and Practice conference in Cleveland. Jefferson will be joined by Federal Reserve Bank of Cleveland President Loretta Mester in that same session. Both Fed speakers are voting members at the Federal Open Market Committee (FOMC) for this year.
Daily digest market movers: Dull Monday ahead
- A very quiet start to this week is expected. No real outliers to report on the quote board, besides the Czech Krona (USD/CZK), which is outperforming against the Greenback by nearly 0.50%.
- At 13:00 GMT, Fed Vice Chair Phillip Jefferson and Federal Reserve Bank of Cleveland President Loretta Mester will both participate in a Q&A session at the Theory and Practice conference in Cleveland.
- The US Treasury Department will auction a 3-month and a 6-month bill around 15:30 GMT.
- The equity markets started the week very mixed after the German Dax posted a fresh historic high on Friday. Investors seem to be keeping their powder dry for later this week.
- The CME Fedwatch Tool suggests a 96.5% probability that June will still see no change to the Federal Reserve's fed fund rate. Odds of a rate cut in July are also out of the cards, while for September the tool shows a 48.6% chance that rates will be 25 basis points lower than current levels.
- The benchmark 10-year US Treasury Note trades around 4.48%, around the lower range for this Monday after hitting 4.94% earlier.
US Dollar Index Technical Analysis: This was it, nothing to see here
The US Dollar Index (DXY) is entering a soft patch with the risk of easing a bit. Markets are considering three scenarios, two of which favoring a weaker Greenback. Traders will be looking closely at the incoming data to look for confirmation on either three.
The first two scenarios that lead to a softer US Dollar are stagflation or a pickup in disinflation. With stagflation, economic growth would start to deteriorate while inflation would remain elevated, putting the Fed on the spot of being unable to lower interest rates in order to soften the blow of the economic contraction. Meanwhile, a resumption of the disinflation trend might bring June back into play for a rate cut and trigger a soft landing. The only element that would see the US Dollar stronger would be if economic data outperforms while inflation remains elevated as well, as this scenario would open the door for further rate hikes.
On the upside, 105.52 (a pivotal level since April 11) needs to be recovered, ideally through a daily close above this level, before targeting the April 16 high at 106.52 for a third time. Further up and above the 107.00 round level, the DXY index could meet resistance at 107.35, the October 3 high.
On the downside, the 55-day and the 200-day Simple Moving Averages (SMAs) at 104.54 and 104.25, respectively, have already provided ample support. If those levels are unable to hold, the 100-day SMA near 103.89 is the next best candidate.
US Dollar FAQs
The US Dollar (USD) is the official currency of the United States of America, and the ‘de facto’ currency of a significant number of other countries where it is found in circulation alongside local notes. It is the most heavily traded currency in the world, accounting for over 88% of all global foreign exchange turnover, or an average of $6.6 trillion in transactions per day, according to data from 2022. Following the second world war, the USD took over from the British Pound as the world’s reserve currency. For most of its history, the US Dollar was backed by Gold, until the Bretton Woods Agreement in 1971 when the Gold Standard went away.
The most important single factor impacting on the value of the US Dollar is monetary policy, which is shaped by the Federal Reserve (Fed). The Fed has two mandates: to achieve price stability (control inflation) and foster full employment. Its primary tool to achieve these two goals is by adjusting interest rates. When prices are rising too quickly and inflation is above the Fed’s 2% target, the Fed will raise rates, which helps the USD value. When inflation falls below 2% or the Unemployment Rate is too high, the Fed may lower interest rates, which weighs on the Greenback.
In extreme situations, the Federal Reserve can also print more Dollars and enact quantitative easing (QE). QE is the process by which the Fed substantially increases the flow of credit in a stuck financial system. It is a non-standard policy measure used when credit has dried up because banks will not lend to each other (out of the fear of counterparty default). It is a last resort when simply lowering interest rates is unlikely to achieve the necessary result. It was the Fed’s weapon of choice to combat the credit crunch that occurred during the Great Financial Crisis in 2008. It involves the Fed printing more Dollars and using them to buy US government bonds predominantly from financial institutions. QE usually leads to a weaker US Dollar.
Quantitative tightening (QT) is the reverse process whereby the Federal Reserve stops buying bonds from financial institutions and does not reinvest the principal from the bonds it holds maturing in new purchases. It is usually positive for the US Dollar.
- Oil retreats to $78.00 after a failed attempt to snap above $80.00 on Friday.
- More criticism emerges globally towards Israel and its approach to Gaza.
- The US Dollar Index steadies around 105.30 ahead of US CPI data later this week.
Oil prices edge up slightly on Monday, but levels are flashing red lights after closing nearly flat last week. The black gold has been unable to rally on the back of further rising tensions on the situation in the Middle East after the US suspended the delivery of certain weapons to Israel amid concerns over the offensive in Rafah. Meanwhile, speculation is mounting over OPEC+ not unwinding its voluntary production cuts at the upcoming meeting in June.
Meanwhile, the US Dollar Index (DXY) is in the middle of a two-week range around 105.30 and looking for direction. Traders are starting to see possibilities ranging from a soft landing to a stagflation scenario. Markets will look at the US Consumer Price Index (CPI) numbers on Wednesday to see if the hotter-than-expected inflation readings recorded in the first quarter extend into April.
At the time of writing, Crude Oil (WTI) trades at $78.06 and Brent Crude at $82.70.
Oil news and market movers: Easing further
- Arab News reports that several Oil traders confirmed that part of the recent correction comes from the outlook of less demand linked to the US Federal Reserve (Fed) keeping rates steady for longer. A rate cut would give a boost to the economy and thus Oil demand.
- Goldman Sachs issued a report on Monday saying that they no longer expect OPEC+ to announce any partial unwinding of the voluntary production cuts at the June meeting.
- Bloomberg reports that Crude Oil Storages floating in tankers have fallen by 11% since last week. That would be the lowest level since February 2020 to only 55.92 million barrels as of May 10.
Oil Technical Analysis: Hanging by a thread
Oil prices are flashing some red lights while trading around a risk level. With Oil prices right at the green ascending trend line, the risk of a snap below it would mean a possible downward movement first to $75.00 and next to $68.15, which would represent a 3% and 10% decline, respectively. . That would materialise as traders get more accustomed to the risk exposure in the Middle East.
On the upside, the line in the sand remains at $79.73 with the 200-day Simple Moving Average (SMA). Once above that level, the double layer is coming up with the 100-day SMA and the red descending trend line at $78.23. In case of an upward extension above that zone, there the road is open for $87.12 again.
On the downside, the pivotal level at $75.28 is the last solid line in the sand that could end this decline. If this level is unable to hold, investors could expect an accelerated sell-off towards $72.00 and $70.00. That would erase all gains for 2024 and then Oil price could test $68, the December 13 low.

US WTI Crude Oil: Daily Chart
WTI Oil FAQs
WTI Oil is a type of Crude Oil sold on international markets. The WTI stands for West Texas Intermediate, one of three major types including Brent and Dubai Crude. WTI is also referred to as “light” and “sweet” because of its relatively low gravity and sulfur content respectively. It is considered a high quality Oil that is easily refined. It is sourced in the United States and distributed via the Cushing hub, which is considered “The Pipeline Crossroads of the World”. It is a benchmark for the Oil market and WTI price is frequently quoted in the media.
Like all assets, supply and demand are the key drivers of WTI Oil price. As such, global growth can be a driver of increased demand and vice versa for weak global growth. Political instability, wars, and sanctions can disrupt supply and impact prices. The decisions of OPEC, a group of major Oil-producing countries, is another key driver of price. The value of the US Dollar influences the price of WTI Crude Oil, since Oil is predominantly traded in US Dollars, thus a weaker US Dollar can make Oil more affordable and vice versa.
The weekly Oil inventory reports published by the American Petroleum Institute (API) and the Energy Information Agency (EIA) impact the price of WTI Oil. Changes in inventories reflect fluctuating supply and demand. If the data shows a drop in inventories it can indicate increased demand, pushing up Oil price. Higher inventories can reflect increased supply, pushing down prices. API’s report is published every Tuesday and EIA’s the day after. Their results are usually similar, falling within 1% of each other 75% of the time. The EIA data is considered more reliable, since it is a government agency.
OPEC (Organization of the Petroleum Exporting Countries) is a group of 13 Oil-producing nations who collectively decide production quotas for member countries at twice-yearly meetings. Their decisions often impact WTI Oil prices. When OPEC decides to lower quotas, it can tighten supply, pushing up Oil prices. When OPEC increases production, it has the opposite effect. OPEC+ refers to an expanded group that includes ten extra non-OPEC members, the most notable of which is Russia.
- AUD/USD is consolidating after pulling back from its May 3 peak.
- A break above 0.6624 would likely result in a volatile move higher
- AUD/USD may have formed a Measured Move with a final target at around 0.6690.
AUD/USD is trading in the 0.6610s on Monday as it continues its sideways consolidation after pulling back from its May 3 peak.
Despite oscillating sideways for the last week, the pair is probably in a short-term uptrend, evidenced by the rising sequence of peaks and troughs since the April 19 lows.
AUD/USD 4-hour Chart
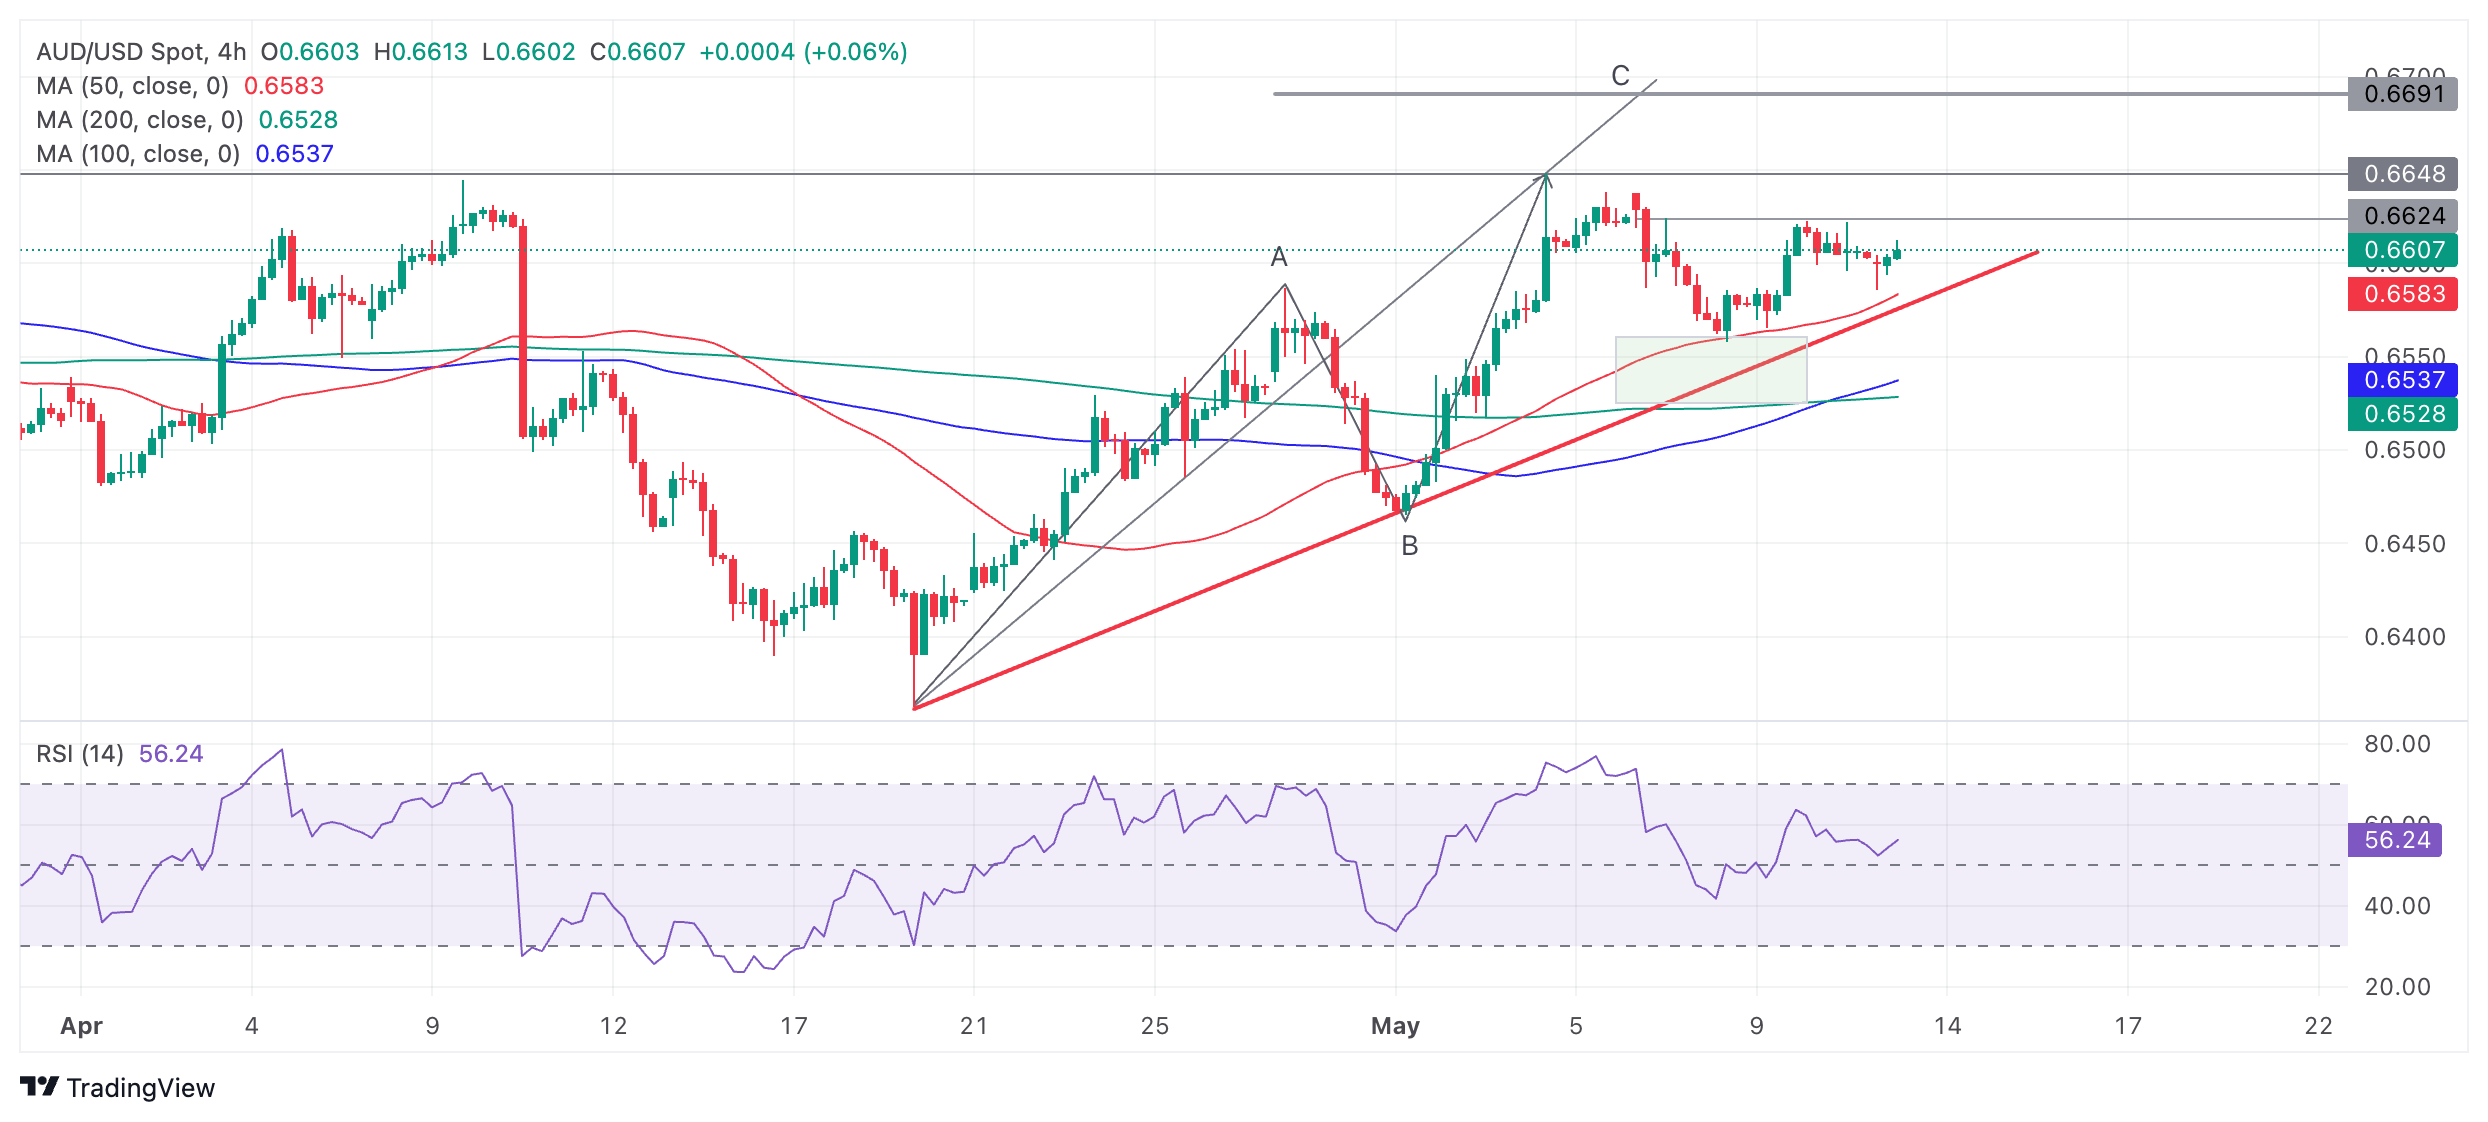
Given the old saying that “the trend is your friend”, therefore, the odds favor AUD/USD going higher.
AUD/USD has attempted but failed to break above the 0.6624 resistance level on several occasions. Nevertheless, a break would provide confirmation of further upside to the next target at the 0.6649 May 3 high.
Assuming AUD/USD successfully breaks above 0.6624 it will probably result in a highly volatile move to the upside, since the level has been touched on multiple occasions which usually results in a strong move once broken.
The next target higher would probably be at around 0.6680-90, generated by a possible Measured Move pattern that AUD/USD has formed since the April 19 lows.
Measured Moves are like large zig-zags composed of three waves, labeled A, B and C. The general expectation is that wave C will be either the same length as A or a Fibonacci 0.681 of A.
Wave C has already reached the Fibonacci 0.681 target at the May 3 highs, however, it could also achieve the target where C=A at 0.6690.
A decisive break below the red trendline would be a bearish sign, suggesting a potential reversal of the trend.
A decisive break would be one accompanied by a long red candle which closes near its low or three red candles in a row that break below the trendline.
- EUR/USD moves higher above 1.0780 as the appeal for risky assets improves.
- The ECB is expected to start reducing interest rates in June.
- Investors keenly await the US inflation data for fresh guidance on the Fed’s interest rates.
EUR/USD rises to 1.0780 in Monday’s European session due to improved market sentiment. The major currency pair holds gains as traders have priced in that interest rate cuts from the European Central Bank (ECB) will be more and start earlier than the Federal Reserve (Fed). Financial markets have anticipated that the ECB will reduce interest rates by 70 basis points (bps) this year and will start lowering them from the June meeting.
On the contrary, the Fed is expected to begin reducing interest rates from September and investors expect the Fed to bring down borrowing rates by 45 bps by the year-end.
This week, the Euro will be guided by Eurozone Q1 preliminary Gross Domestic Product (GDP) data, which will be published on Wednesday. The Eurostat is expected to report that the economy has grown steadily by 0.3% and 0.4% on a quarterly and an annual basis, respectively. The GDP data will provide fresh cues about the Eurozone’s economic outlook. EUR/USD will also be guided by the US Consumer Price Index (CPI) data for April, which is also set to be released on Wednesday.
Daily digest market movers: EUR/USD gains ahead of crucial Eurozone, US economic data
- EUR/USD clings to gains near 1.0780 as the market sentiment is upbeat. S&P 500 futures register nominal gains in the European session as investors shrugged off uncertainty ahead of the United States Consumer Price Index (CPI) data for April, which will be published on Wednesday.
- Economists have forecasted that annual headline inflation declined to 3.4% in April from 3.5% in March. The annual core CPI, which excludes volatile food and energy prices, is estimated to have decelerated to 3.6% from the prior reading of 3.8%. Monthly headline and core inflation are expected to have slowed to 0.3%, compared to the former reading of 0.4%.
- US consumer inflation data will significantly influence market expectations for Federal Reserve rate cuts, which investors are currently anticipating from the September meeting. The CME FedEWatch tool shows that there is a 61% chance that interest rates will come down from their current range of 5.25%-5.50%.
- Before the US CPI data, investors will focus on the US Producer Price Index (PPI) data for April, which will be published on Tuesday. The producer inflation data will indicate whether business owners hiked or reduced prices of goods and services at the premises.
- The US Dollar Index (DXY), which tracks the Greenback’s value against six major currencies, is subdued near 105.30 in Monday’s European session. Last week, the US Dollar came under pressure after a significant rise in Initial Jobless Claims for the week ending May 3 that dampened investors’ confidence in US labor market strength.
Technical Analysis: EUR/USD plays around 200-day EMA

EUR/USD recovers Friday’s losses and rises to 1.0780, close to the 200-day Exponential Moving Average (EMA), which trades around 1.0780.
The shared currency pair is steadily approaching the downward-sloping border of the Symmetrical Triangle pattern formed on a daily timeframe, which is plotted from December 28 high around 1.1140. The upward-sloping border of the triangle pattern is marked from the October 3 low at 1.0448. The Symmetrical Triangle formation exhibits a sharp volatility contraction.
The 14-period Relative Strength Index (RSI) oscillates inside the 40.00-60.00 range, suggesting indecisiveness among market participants.
Euro FAQs
The Euro is the currency for the 20 European Union countries that belong to the Eurozone. It is the second most heavily traded currency in the world behind the US Dollar. In 2022, it accounted for 31% of all foreign exchange transactions, with an average daily turnover of over $2.2 trillion a day. EUR/USD is the most heavily traded currency pair in the world, accounting for an estimated 30% off all transactions, followed by EUR/JPY (4%), EUR/GBP (3%) and EUR/AUD (2%).
The European Central Bank (ECB) in Frankfurt, Germany, is the reserve bank for the Eurozone. The ECB sets interest rates and manages monetary policy. The ECB’s primary mandate is to maintain price stability, which means either controlling inflation or stimulating growth. Its primary tool is the raising or lowering of interest rates. Relatively high interest rates – or the expectation of higher rates – will usually benefit the Euro and vice versa. The ECB Governing Council makes monetary policy decisions at meetings held eight times a year. Decisions are made by heads of the Eurozone national banks and six permanent members, including the President of the ECB, Christine Lagarde.
Eurozone inflation data, measured by the Harmonized Index of Consumer Prices (HICP), is an important econometric for the Euro. If inflation rises more than expected, especially if above the ECB’s 2% target, it obliges the ECB to raise interest rates to bring it back under control. Relatively high interest rates compared to its counterparts will usually benefit the Euro, as it makes the region more attractive as a place for global investors to park their money.
Data releases gauge the health of the economy and can impact on the Euro. Indicators such as GDP, Manufacturing and Services PMIs, employment, and consumer sentiment surveys can all influence the direction of the single currency. A strong economy is good for the Euro. Not only does it attract more foreign investment but it may encourage the ECB to put up interest rates, which will directly strengthen the Euro. Otherwise, if economic data is weak, the Euro is likely to fall. Economic data for the four largest economies in the euro area (Germany, France, Italy and Spain) are especially significant, as they account for 75% of the Eurozone’s economy.
Another significant data release for the Euro is the Trade Balance. This indicator measures the difference between what a country earns from its exports and what it spends on imports over a given period. If a country produces highly sought after exports then its currency will gain in value purely from the extra demand created from foreign buyers seeking to purchase these goods. Therefore, a positive net Trade Balance strengthens a currency and vice versa for a negative balance.
- EUR/GBP edges higher due to the positive shift in consumer spending trends in Eurozone.
- BoE’s Chief Economist Huw Pill indicated a growing belief that rate cuts might be on the horizon.
- The higher-than-anticipated UK GDP data provided support for the Pound Sterling.
EUR/GBP retraces its recent losses from the previous session, hovering around 0.8600 during the European session on Monday. The Euro gains ground due to a prevalent positive sentiment after the stronger Retail Sales data from the Eurozone during the last week.
The monthly Eurozone Retail Sales (MoM) surged by 0.8% in March, marking the most significant increase in retail activity since September 2022. Furthermore, Retail Sales (YoY) also increased 0.7%, indicating the first growth in retail since September 2022 and signaling a positive shift in consumer spending trends.
On the GBP front, higher-than-anticipated UK Gross Domestic Product (GDP) figures released on Friday, provided support for the Pound Sterling (GBP), undermined the EUR/GBP cross. The UK economy expanded 0.6% in Q1, surpassing projections and indicating the end of the country's brief recession. This robust economic rebound marked the strongest growth seen in over two years.
However, the British Pound encountered a challenge following dovish remarks from Huw Pill, Chief Economist at the Bank of England (BoE). Pill echoed the sentiment of the majority of the BoE's Monetary Policy Committee (MPC), who opted to maintain interest rates at 5.25% on Thursday. Nevertheless, he subsequently indicated a growing belief that rate cuts could be on the horizon.
Market participants are likely to anticipate employment data on Tuesday, with expectations of the UK Claimant Count Change showing an increase in the number of individuals claiming jobless benefits in April. Additionally, the ILO Unemployment Rate (3M) is anticipated to show a rise in the number of unemployed workers in the UK. In the Eurozone, German Consumer Price Index data are expected to remain unchanged across the board for April.
- Silver price is correcting back after rallying during May.
- The correction is likely to run out of steam eventually and the uptrend to resume.
- Support at $27.51 may provide the staging post for a bullish revival.
Silver (XAG/USD) price is correcting back after the strong rally in May became overbought and bullish traders unwound their longs.
Despite the correction, the short-term trend for Silver remains bullish and given the old adage that “the trend is your friend,” it is expected to resume and push higher once the pull back ends.
4-hour Chart

There are no signs yet that the correction has ended – though downside momentum is slowing – and it is possible Silver could continue falling.
The next major support level that may act as a barrier to further losses is at the former April 26 highs at $27.51. A reversal at that level could signal the resumption of the dominant uptrend.
A break above the May 10 high at $28.77 would indicate the formation of a higher high and suggest extension.
Beyond that there is the possibility of a retest of the $30.00 long-term range highs.
Silver prices (XAG/USD) fell on Monday, according to FXStreet data. Silver trades at $28.13 per troy ounce, down 0.14% from the $28.17 it cost on Friday.
Silver prices have increased by 10.44% since the beginning of the year.
| Unit measure | Today Price |
|---|---|
| Silver price per troy ounce | $28.13 |
| Silver price per gram | $0.90 |
The Gold/Silver ratio, which shows the number of troy ounces of Silver needed to equal the value of one troy ounce of Gold, stood at 83.32 on Monday, down from 83.80 on Friday.
Investors might use this ratio to determine the relative valuation of Gold and Silver. Some may consider a high ratio as an indicator that Silver is undervalued – or Gold is overvalued – and might buy Silver or sell Gold accordingly. Conversely, a low ratio might suggest that Gold is undervalued relative to Silver.
Silver FAQs
Silver is a precious metal highly traded among investors. It has been historically used as a store of value and a medium of exchange. Although less popular than Gold, traders may turn to Silver to diversify their investment portfolio, for its intrinsic value or as a potential hedge during high-inflation periods. Investors can buy physical Silver, in coins or in bars, or trade it through vehicles such as Exchange Traded Funds, which track its price on international markets.
Silver prices can move due to a wide range of factors. Geopolitical instability or fears of a deep recession can make Silver price escalate due to its safe-haven status, although to a lesser extent than Gold's. As a yieldless asset, Silver tends to rise with lower interest rates. Its moves also depend on how the US Dollar (USD) behaves as the asset is priced in dollars (XAG/USD). A strong Dollar tends to keep the price of Silver at bay, whereas a weaker Dollar is likely to propel prices up. Other factors such as investment demand, mining supply – Silver is much more abundant than Gold – and recycling rates can also affect prices.
Silver is widely used in industry, particularly in sectors such as electronics or solar energy, as it has one of the highest electric conductivity of all metals – more than Copper and Gold. A surge in demand can increase prices, while a decline tends to lower them. Dynamics in the US, Chinese and Indian economies can also contribute to price swings: for the US and particularly China, their big industrial sectors use Silver in various processes; in India, consumers’ demand for the precious metal for jewellery also plays a key role in setting prices.
Silver prices tend to follow Gold's moves. When Gold prices rise, Silver typically follows suit, as their status as safe-haven assets is similar. The Gold/Silver ratio, which shows the number of ounces of Silver needed to equal the value of one ounce of Gold, may help to determine the relative valuation between both metals. Some investors may consider a high ratio as an indicator that Silver is undervalued, or Gold is overvalued. On the contrary, a low ratio might suggest that Gold is undervalued relative to Silver.
Gold prices fell in India on Monday, according to data from India's Multi Commodity Exchange (MCX).
Gold price stood at 72,209 Indian Rupees (INR) per 10 grams, down INR 509 compared with the INR 72,718 it cost on Friday.
As for futures contracts, Gold prices decreased to INR 72,046 per 10 gms from INR 72,727 per 10 gms.
Prices for Silver futures contracts decreased to INR 84,480 per kg from INR 84,791 per kg.
| Major Indian city | Gold Price |
|---|---|
| Ahmedabad | 74,805 |
| Mumbai | 74,500 |
| New Delhi | 74,520 |
| Chennai | 74,790 |
| Kolkata | 74,660 |
Global Market Movers: Comex Gold price falls after Michigan Sentiment Survey data
Gold price has reversed lower following the release of the University of Michigan Consumer Sentiment Survey on Friday, which showed a surprise fall in sentiment whilst at the same time higher inflation expectations.
The preliminary University of Michigan Consumer Sentiment index for May fell to 67.4 from 77.2 when economists had expected a much gentler decline to 76.0.
At the same time, the long-run inflation expectations component rose to 3.1% from 3.0% previously.
Higher inflation expectations suggest the Federal Reserve (Fed) may continue to delay its expected move to cut interest rates. This is negative for Gold since higher interest rates increase the opportunity cost of holding Gold compared to interest-yielding assets like bonds or cash.
(An automation tool was used in creating this post.)
Gold FAQs
Gold has played a key role in human’s history as it has been widely used as a store of value and medium of exchange. Currently, apart from its shine and usage for jewelry, the precious metal is widely seen as a safe-haven asset, meaning that it is considered a good investment during turbulent times. Gold is also widely seen as a hedge against inflation and against depreciating currencies as it doesn’t rely on any specific issuer or government.
Central banks are the biggest Gold holders. In their aim to support their currencies in turbulent times, central banks tend to diversify their reserves and buy Gold to improve the perceived strength of the economy and the currency. High Gold reserves can be a source of trust for a country’s solvency. Central banks added 1,136 tonnes of Gold worth around $70 billion to their reserves in 2022, according to data from the World Gold Council. This is the highest yearly purchase since records began. Central banks from emerging economies such as China, India and Turkey are quickly increasing their Gold reserves.
Gold has an inverse correlation with the US Dollar and US Treasuries, which are both major reserve and safe-haven assets. When the Dollar depreciates, Gold tends to rise, enabling investors and central banks to diversify their assets in turbulent times. Gold is also inversely correlated with risk assets. A rally in the stock market tends to weaken Gold price, while sell-offs in riskier markets tend to favor the precious metal.
The price can move due to a wide range of factors. Geopolitical instability or fears of a deep recession can quickly make Gold price escalate due to its safe-haven status. As a yield-less asset, Gold tends to rise with lower interest rates, while higher cost of money usually weighs down on the yellow metal. Still, most moves depend on how the US Dollar (USD) behaves as the asset is priced in dollars (XAU/USD). A strong Dollar tends to keep the price of Gold controlled, whereas a weaker Dollar is likely to push Gold prices up.
- Gold falls after US Consumer Sentiment data shows a sharp decline in optimism and higher inflation expectations.
- Higher inflation could keep interest rates elevated, reducing the attractiveness of non-yielding Gold.
- Uptrending XAU/USD corrects back and puts pressure on a key support level.
Gold price (XAU/USD) corrects back, falling a half a percent to the $2,340s on Monday after US Consumer Sentiment data suggested interest rates may remain higher for longer, reducing Gold’s attractiveness as a non-yielding asset.
Gold price falls after Michigan Sentiment Survey data
Gold price has reversed lower following the release of the University of Michigan Consumer Sentiment Survey on Friday, which showed a surprise fall in sentiment whilst at the same time higher inflation expectations.
The preliminary University of Michigan Consumer Sentiment index for May fell to 67.4 from 77.2 when economists had expected a much gentler decline to 76.0.
At the same time, the long-run inflation expectations component rose to 3.1% from 3.0% previously.
Higher inflation expectations suggest the Federal Reserve (Fed) may continue to delay its expected move to cut interest rates. This is negative for Gold since higher interest rates increase the opportunity cost of holding Gold compared to interest-yielding assets like bonds or cash.
Technical Analysis: Gold price corrects sharply back
Gold price (XAU/USD) is correcting back after its rally at the start of May.
The Relative Strength Index (RSI) momentum indicator moved into neutral territory during the US session on Friday after being overbought, giving a sell signal, and price responded accordingly.
Gold has reached a major support level from previous highs at $2,350, which it is attempting to pierce through. If it is successful it could continue to fall.
XAU/USD 4-hour Chart
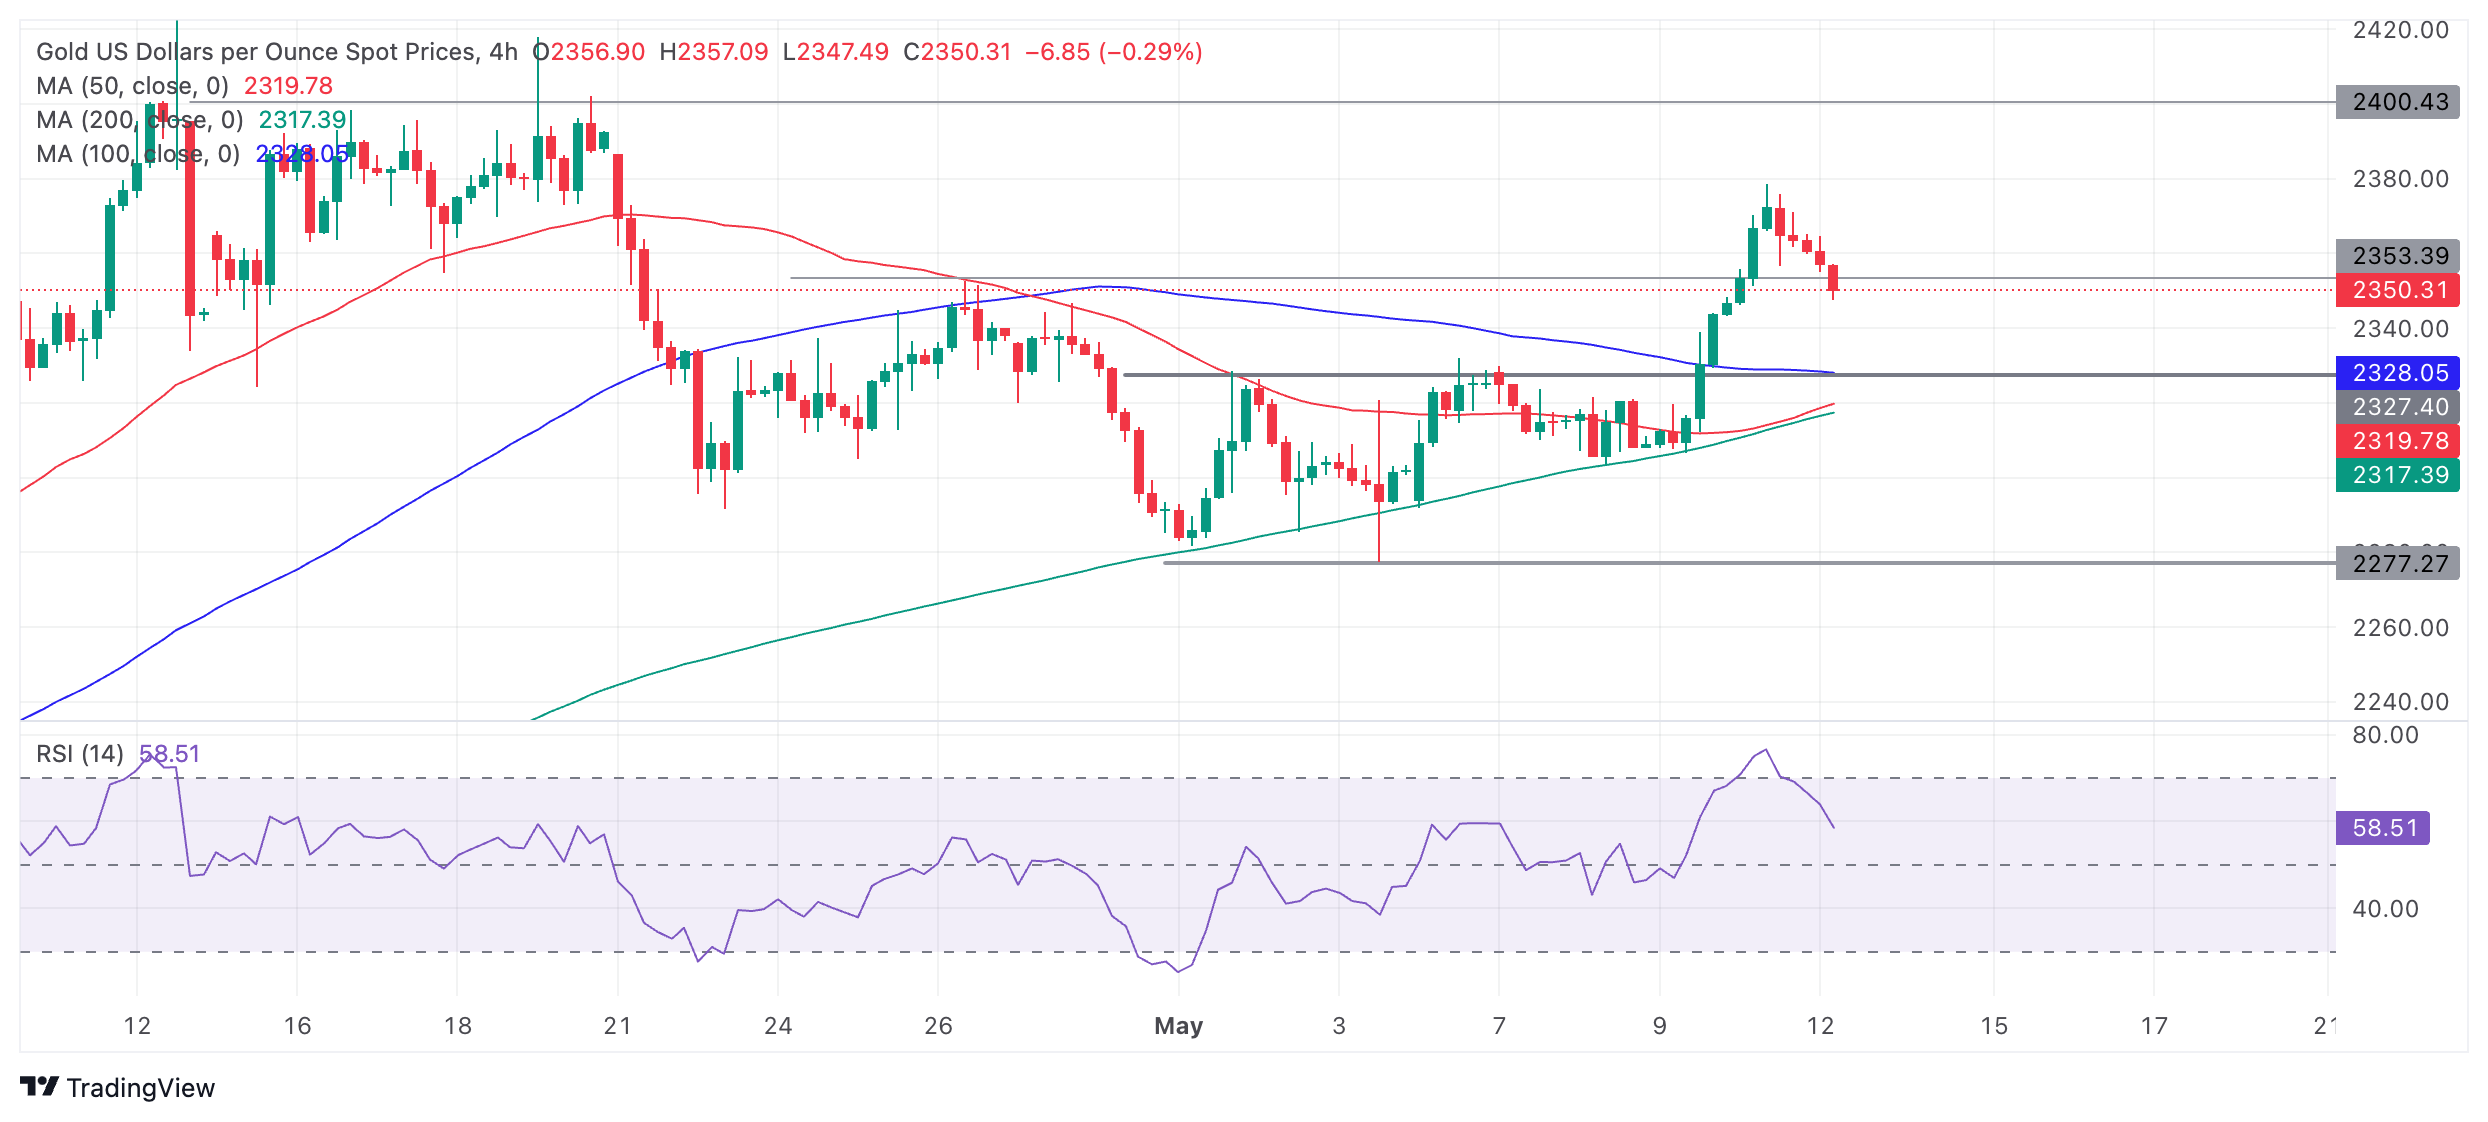
Despite the pull back the short-term trend is still probably bullish, suggesting it is likely the precious metal will stop correcting at some point and resume its uptrend. There are no signs yet of this happening however.
Assuming the uptrend does resume, the next target for Gold would be at around $2,400, roughly at the height of the April highs. A break back above the $2,378 May 10 high would provide confirmation.
The medium and long-term charts (daily and weekly) are also bullish, adding a supportive backdrop for Gold.
Economic Indicator
UoM 5-year Consumer Inflation Expectation
The University of Michigan's Survey of Consumers includes a long-run, five-year, inflation expectation component that the Fed uses when calculating its quarterly Index of Common Inflation Expectations.
Read more.Last release: Fri May 10, 2024 14:00 (Prel)
Frequency: Monthly
Actual: 3.1%
Consensus: -
Previous: 3%
Source: University of Michigan
- USD/CHF inches higher due to a firmer US Dollar driven by cautious remarks from Fed officials.
- The decline in the US Treasury yields limits the advance of the Greenback.
- Swiss Consumer Climate (YoY) came in at the reading of -38.1 for April, compared to -38.0 prior.
USD/CHF gains ground for the second successive session, trading around 0.9070 during the European trading hours on Monday. The US Dollar remains firmer due to the hawkish sentiment surrounding the Federal Reserve (Fed) to maintain higher interest rates for an extended period, underpinning the USD/CHF pair. This sentiment is bolstered by the cautious comments from Federal Reserve (Fed) officials regarding interest rate cuts.
However, Friday's release of the US Consumer Sentiment Index added to evidence suggesting a slowdown in the economy. The index declined to 67.4 in May from April's 77.2, hitting a six-month low and falling short of market expectations. This has put pressure on the US Treasury yields, limiting the advance of the Greenback.
As per Reuters, Neel Kashkari, President of the Minneapolis Federal Reserve (Fed), exercised caution regarding the extent of tightness in monetary policy. In an interview with CNBC on Friday, Kashkari remarked that although the bar for another rate hike is high, it should not be completely dismissed. Furthermore, San Francisco Fed President Mary Daly stressed the importance of sustaining a prolonged tight policy stance to achieve the Federal Reserve's inflation goals.
The US Dollar Index (DXY), which gauges the performance of the US Dollar (USD) against six major currencies, trades around 105.30 with 2-year and 10-year yields on US Treasury bonds standing at 4.85% and 4.48%, respectively, by the press time.
In Switzerland, SECO Consumer Climate (YoY) experienced a slight decline in April, with a reading of -38.1, compared to the previous -38.0 and an expected -40.0. However, it still significantly trailed the long-term average.
Over the past week, the Swiss National Bank (SNB) saw its foreign exchange reserves climb to CHF 720 billion in April, marking the fifth consecutive increase. The SNB has redirected its attention from deliberately strengthening the Swiss Franc (CHF), as the central bank intensifies its focus on combating inflation.
- The Pound Sterling holds gains above 1.2500 inspired by strong UK Q1 GDP data.
- The UK economy expanded by 0.6%, moving out of the recession seen in the second half of 2023.
- Investors await UK employment and US inflation data for fresh guidance.
The Pound Sterling (GBP) exhibits strength above the psychological support of 1.2500 against the US Dollar (USD) in Monday’s London session. The GBP/USD pair holds firmly as the US Dollar struggles to recover higher-than-expected Initial Jobless Claims for the week ending May 3, which raised concerns over the health of the United States labor market.
The confidence of financial markets for the US Federal Reserve (Fed) to start lowering interest rates from the September meeting has increased as US labor market conditions have cooled down. For now, investors shift their focus to the US Consumer Price Index (CPI) data for April, which will be published on Wednesday.
Annual headline CPI is forecasted to have softened to 3.4% from 3.5% in March. In the same period, the core inflation, which strips off volatile food and energy prices, is anticipated to have decelerated to 3.6% from the prior reading of 3.8%. Economists expect that the monthly headline and core CPI have grown at a slower pace of 0.3% from the prior reading of 0.4%.
Daily digest market movers: Pound Sterling rises on multiple tailwinds
- The Pound Sterling holds strength inspired by the robust UK Q1 Gross Domestic Product (GDP) data released on Friday. The United Kingdom Office for National Statistics (ONS) reported that the economy expanded at a stronger pace of 0.6%, beating estimates of 0.4%. This led to an end to the technical recession registered in the second half of 2023.
- After the GDP data, UK Chancellor Jeremy Hunt said: "There is no doubt it has been a difficult few years, but today's growth figures are proof that the economy is returning to full health for the first time since the pandemic," Reuters reported.
- After strong UK growth data, the strength of the UK economy will now be tested on the grounds of labor market data, which will be published on Tuesday. Economists expect that the ILO Unemployment Rate for the three months ending March rose to 4.3% from the prior reading of 4.2%. Apart from the jobless rate, investors will keenly on the Average Earnings data that has been fuelling service inflation, which is almost double that of what should be consistent to bring inflation down to the 2% target.
- Annual Average Earnings Including Bonuses are estimated to have slowed to 5.3% in the three months ending March from the prior reading of 5.6%. A sharp decline in the wage growth momentum would boost expectations for the BoE to begin reducing interest rates in June.
- Last week, the BoE kept interest rates steady at 5.25% for the sixth time in a row. Overall, the BoE's communication indicated that it is swiftly leaning toward policy normalization. BoE Deputy Governor Dave Ramsden joined policymaker Swati Dhingra and voted for a rate cut by 25 basis points (bps) to 5.0%. In the press conference, BoE Governor Andrew Bailey said the central bank could deliver more rate cuts than investors have anticipated.
Technical Analysis: Pound Sterling recovers from 50% Fibo retracement around 1.2470

The Pound Sterling advances to 1.2540 on Monday due to multiple tailwinds. The GBP/USD pair recovered sharply from 50% Fibonacci retracement (plotted from April 22 low of 1.2299 to May 3 high of 1.2634) near 1.2470. The Cable remains sticky to the 20-day Exponential Moving Average (EMA), which trades around 1.2520, suggesting a sideways trend.
The pair is still below the neckline of the Head and Shoulder (H&S) chart pattern formed on a daily timeframe. On April 12, the Cable fell sharply after breaking below the neckline of the H&S pattern plotted from December 8 low around 1.2500.
The 14-period Relative Strength Index (RSI) oscillates in the 40.00-60.00 range, suggesting indecisiveness among market participants.
Pound Sterling FAQs
The Pound Sterling (GBP) is the oldest currency in the world (886 AD) and the official currency of the United Kingdom. It is the fourth most traded unit for foreign exchange (FX) in the world, accounting for 12% of all transactions, averaging $630 billion a day, according to 2022 data. Its key trading pairs are GBP/USD, aka ‘Cable’, which accounts for 11% of FX, GBP/JPY, or the ‘Dragon’ as it is known by traders (3%), and EUR/GBP (2%). The Pound Sterling is issued by the Bank of England (BoE).
The single most important factor influencing the value of the Pound Sterling is monetary policy decided by the Bank of England. The BoE bases its decisions on whether it has achieved its primary goal of “price stability” – a steady inflation rate of around 2%. Its primary tool for achieving this is the adjustment of interest rates. When inflation is too high, the BoE will try to rein it in by raising interest rates, making it more expensive for people and businesses to access credit. This is generally positive for GBP, as higher interest rates make the UK a more attractive place for global investors to park their money. When inflation falls too low it is a sign economic growth is slowing. In this scenario, the BoE will consider lowering interest rates to cheapen credit so businesses will borrow more to invest in growth-generating projects.
Data releases gauge the health of the economy and can impact the value of the Pound Sterling. Indicators such as GDP, Manufacturing and Services PMIs, and employment can all influence the direction of the GBP. A strong economy is good for Sterling. Not only does it attract more foreign investment but it may encourage the BoE to put up interest rates, which will directly strengthen GBP. Otherwise, if economic data is weak, the Pound Sterling is likely to fall.
Another significant data release for the Pound Sterling is the Trade Balance. This indicator measures the difference between what a country earns from its exports and what it spends on imports over a given period. If a country produces highly sought-after exports, its currency will benefit purely from the extra demand created from foreign buyers seeking to purchase these goods. Therefore, a positive net Trade Balance strengthens a currency and vice versa for a negative balance.
- EUR/JPY rises for the sixth day in a row on a wide interest rate differential.
- The Euro is further bolstered by stronger-than-expected Q1 GDP growth data.
- Then Bank of Japan reduces quantitative easing in latest operation, temporarily supporting the Yen.
EUR/JPY climbs to within a pip of 168.00 on Monday, its sixth day of gains in a row, as traders preference the Euro owing to the wide interest-rate differential between the Eurozone and Japan.
Relatively higher interest rates in Europe, of 4.5%, compared to Japan’s 0.0% - 0.1% benefit the Euro (EUR) more than the Japanese Yen (JPY) because they lead to higher capital inflows. This in turns leads to gains for EUR/JPY.
The short-term uptrend in EUR/JPY extends despite firming expectations that the European Central Bank (ECB) will cut interest rates in June, whilst the Bank of Japan (BoJ) is more likely to raise interest rates at some point before the end of 2024 – narrowing the differential. Recent data from Japan which showed weak wage growth and inflation, however, has extended the timeline for the expected rate hikes in Japan, reducing the performance of JPY.
The Euro on the other hand, has gained after the release of first quarter GDP data showed a surprise increase of 0.3% in the Eurozone GDP growth rate. This was the fastest growth rate since the third quarter of 2022 and beat market expectations of a marginal 0.1% expansion. It also comes after a run of moribund readings showing anemic growth for the continent.
EUR/JPY dipped temporarily to a low of 167.50 early on Monday after the BoJ reduced its last round of quantitative easing (QE). From previously buying 475 billion Yen in 5-10 year Japanese government bonds it reduced its purchases to 425B instead. A decrease in bond buying is seen as a tightening policy – similar to raising interest rates – which tends to be positive for a currency.
In addition, influential member of the ruling party, Katsunobu Kato said that Japan is seeing conditions fall in place for the BoJ to normalize monetary policy, i.e raise rates.
Kato added, however, that the BoJ must monitor economic conditions and coordinate carefully with the government in working out when to raise interest rates, according to Lallalit Srijandorn, FX Analyst at FXStreet.
FX option expiries for May 13 NY cut at 10:00 Eastern Time, via DTCC, can be found below
- EUR/USD: EUR amounts
- 1.0650 2.8b
- 1.0675 684m
- 1.0745 613m
- 1.0750 3.5b
- 1.0755 1.4b
- 1.0815 630m
- GBP/USD: GBP amounts
- 1.2530 724m
- 1.2550 455m
- 1.2565 672m
- EUR/GBP: EUR amounts
- 0.8560 390m
- USD/JPY: USD amounts
- 155.00 711m
- 155.05 914m
- 155.15 1.2b
- 155.25 501m
- AUD/USD: AUD amounts
- 0.6530 855m
- 0.6600 462m
- USD/CHF: USD amounts
- 0.9090 430m
- 0.9100 400m
- 0.9105 947m
- The Mexican Peso edges higher as interest rates in Mexico are expected to remain elevated.
- Relatively higher interest rates attract higher inflows of foreign capital.
- USD/MXN consolidates in its downtrend after a breakout. More downside is expected.
The Mexican Peso (MXN) trades slightly higher in its major pairs on Monday, continuing to benefit from relatively higher interest rate expectations in Mexico following last week’s central bank decision.
USD/MXN is exchanging hands at 16.76, EUR/MXN at 18.06 and GBP/MXN at 21.01, at the time of publication.
Mexican Peso edges higher on interest rate expectations
The Mexican Peso trades higher, on the back of favorable interest rate expectations – a major driver of FX, where funds tend to flow to countries with higher interest rates.
At the Bank of Mexico (Banxico) meeting last Thursday, the central bank decided to leave its policy rate unchanged at 11.00% after cutting by 0.25% in March. It cited persistent inflation as the reason for not cutting again, leading to a rebound in the Peso.
The central bank also upwardly revised its inflation forecasts for the next six quarters, which indicates it sees an environment of sustained inflationary pressures ahead. This makes it less likely to lower interest rates in the short-term, further supporting the Mexican Peso.
Technical Analysis: USD/MXN consolidates within a down trend
USD/MXN – the value of one US Dollar in Mexican Pesos – decisively broke below the bottom of a short-term range at 16.86 last week, reflecting the continued strengthening of the Mexican Peso.
The breakout of the range – which could also possibly be interpreted as a descending triangle pattern – was a decisive technical development that suggests a protracted move lower.
USD/MXN 4-hour Chart
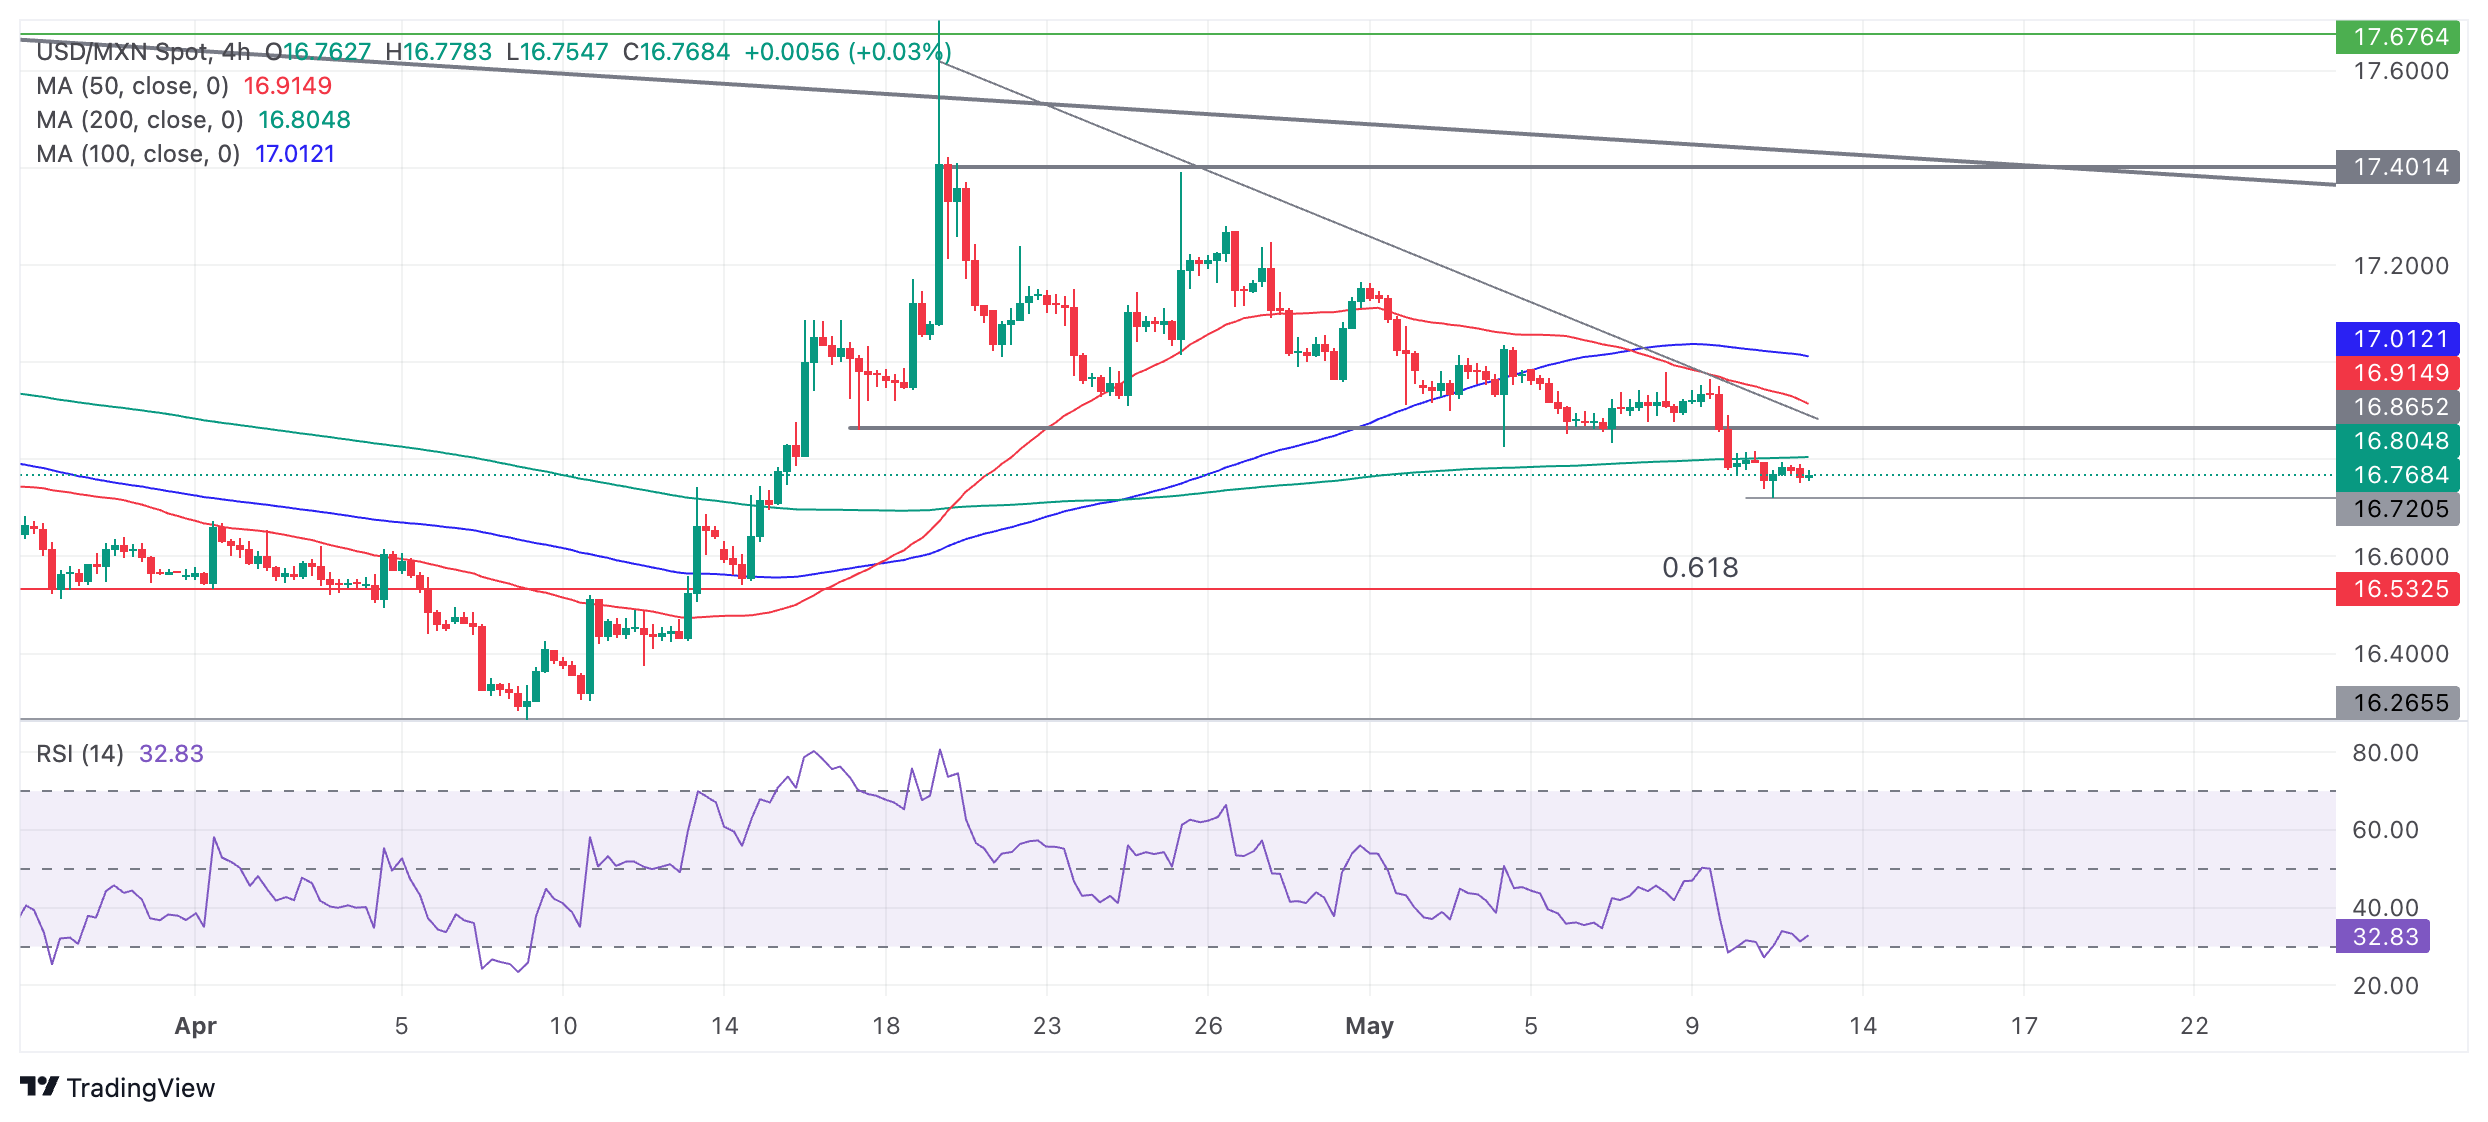
A conservative target for the breakout lies at 16.54, the 0.681 Fibonacci ratio of the height of the range extrapolated lower. This is followed by 16.34, the full height of the range extrapolated lower.
The short-term trend is now probably bearish following the breakdown from the range, which, given the old adage that the “trend is your friend”, suggests the odds favor continued downside.
However, the current move is temporarily oversold according to the Relative Strength Index (RSI). The RSI dipped into oversold territory on Friday and has since risen back out. This gives a short-term buy signal and suggests a pull back or sideways consolidation could be underway.
However, the pair is expected to eventually continue its march lower given the breakout from the range and the dominant downtrend. A break below 16.72 would confirm a continuation south.
Given the medium and long-term trends are bearish, the odds further favor more downside for the pair in line with those trends.
Economic Indicator
Central Bank Interest Rate
The Bank of Mexico announces a key interest rate which affects the whole range of interest rates set by commercial banks, building societies and other institutions for their own savers and borrowers. Generally speaking, if the central bank is hawkish about the inflationary outlook of the economy and rises the interest rates it is positive, or bullish, for the Mexican Peso.
Read more.Last release: Thu May 09, 2024 19:00
Frequency: Irregular
Actual: 11%
Consensus: 11%
Previous: 11%
Source: Banxico
- EUR/USD oscillates in a narrow trading range near 1.0770 in Monday’s early European session.
- The pair maintains the bearish outlook below the key EMA.
- The immediate resistance level will emerge at the 1.0790–1.0800 region; the initial support level is seen at 1.0724.
The EUR/USD pair remains flat around 1.0770 on Monday during the early European trading hours. The pair struggles to find a clear direction ahead of the key US events this week. The US April Producer Price Index (PPI) will be due on Tuesday, and the final reading of the Consumer Price Index (CPI) will be released on Wednesday.
Technically, EUR/USD remains stuck within a descending trend channel since mid-December 2023. The major pair keeps the bearish vibe unchanged as it is below the key 100-period Exponential Moving Average (EMA) on the daily timeframe. Nonetheless, the 14-day Relative Strength Index (RSI) stands in bullish territory around 54.5, suggesting that further upside cannot be ruled out.
The crucial upside barrier for EUR/USD will emerge near the 100-day EMA and the upper boundary of the descending trend channel in the 1.0790–1.0800 zone. A bullish breakout above the latter will see a rally to a high of April 9 at 1.0885. Further north, the next hurdle is seen near a high of March 21 at 1.0943, en route to a high of March 8 at 1.0981, and finally the 1.1000 psychological level.
On the flip side, the initial support level is located around a low of May 9 at 1.0724. Any follow-through selling below this level will see a drop to a low of May 2 at 1.0650, en route to a low of April 16 at 1.0600. The additional downside filter to watch is the lower limit of the descending trend channel at 1.0515.
EUR/USD daily chart

Here is what you need to know on Monday, May 13:
Financial markets remain quiet to start the new week and major currency pairs fluctuate near the previous week's closing levels. The economic calendar will not offer any high-tier data releases on Monday and investors will continue to scrutinize comments from central bank officials.
The US Dollar (USD) Index recovered modestly on Friday after declining sharply on Thursday, supported by Federal Reserve (Fed) policymakers' hawkish tone. In the early European morning on Monday, the USD Index holds steady above 105.00 and the benchmark 10-year US Treasury bond yield moves sideways near 4.5%. In the meantime, US stock index futures trade modestly higher.
US Dollar PRICE Last 7 days
The table below shows the percentage change of US Dollar (USD) against listed major currencies last 7 days. US Dollar was the weakest against the Japanese Yen.
| USD | EUR | GBP | JPY | CAD | AUD | NZD | CHF | |
|---|---|---|---|---|---|---|---|---|
| USD | 0.11% | -0.15% | -1.81% | -0.07% | -0.17% | -0.07% | -0.22% | |
| EUR | -0.11% | -0.17% | -1.80% | -0.11% | -0.07% | -0.10% | -0.23% | |
| GBP | 0.15% | 0.17% | -1.64% | 0.05% | 0.09% | 0.06% | -0.04% | |
| JPY | 1.81% | 1.80% | 1.64% | 1.70% | 1.63% | 1.74% | 1.61% | |
| CAD | 0.07% | 0.11% | -0.05% | -1.70% | -0.20% | 0.02% | -0.06% | |
| AUD | 0.17% | 0.07% | -0.09% | -1.63% | 0.20% | -0.05% | -0.10% | |
| NZD | 0.07% | 0.10% | -0.06% | -1.74% | -0.02% | 0.05% | -0.08% | |
| CHF | 0.22% | 0.23% | 0.04% | -1.61% | 0.06% | 0.10% | 0.08% |
The heat map shows percentage changes of major currencies against each other. The base currency is picked from the left column, while the quote currency is picked from the top row. For example, if you pick the US Dollar from the left column and move along the horizontal line to the Japanese Yen, the percentage change displayed in the box will represent USD (base)/JPY (quote).
Following Thursday's upsurge, EUR/USD retreated Friday but managed to post small gains for the week. In the early European session on Monday, the pair stays in a consolidation phase above 1.0750.
After falling to its lowest level in two weeks below 1.2450 on Thursday, GBP/USD reversed its direction and closed the week above 1.2500. The pair moves up and down in a narrow band above that level to start the new week. The UK's Office for National Statistics will release labor market data early Tuesday.
The data from Australia showed in the Asian session that National Australia Bank's Business Conditions Index edged lower to 7 in April from 9 in March, while the Business Confidence Index remained unchanged at 1. AUD/USD showed no reaction to these figures and was last seen moving sideways near 0.6600. Over the weekend, the National Bureau of Statistics of China reported that the Consumer Price Index (CPI) rose 0.3% on a yearly basis in April, surpassing the market expectation and March's increase of 0.1%.
Australian Dollar holds ground around a psychological level, awaits Aussie Budget Release.
USD/JPY trades slightly below 156.00 after rising nearly 2% in the previous week. In the early Asian trading hours of the Asian session on Tuesday, the Producer Price Index for April will be featured in the Japanese economic calendar.
Gold gained 2.5% and snapped a two-week losing streak. XAU/USD stages a downward correction early Monday and trades at around $2,350.
Gold price loses traction, eyes on Fedspeak.
Fed FAQs
Monetary policy in the US is shaped by the Federal Reserve (Fed). The Fed has two mandates: to achieve price stability and foster full employment. Its primary tool to achieve these goals is by adjusting interest rates. When prices are rising too quickly and inflation is above the Fed’s 2% target, it raises interest rates, increasing borrowing costs throughout the economy. This results in a stronger US Dollar (USD) as it makes the US a more attractive place for international investors to park their money. When inflation falls below 2% or the Unemployment Rate is too high, the Fed may lower interest rates to encourage borrowing, which weighs on the Greenback.
The Federal Reserve (Fed) holds eight policy meetings a year, where the Federal Open Market Committee (FOMC) assesses economic conditions and makes monetary policy decisions. The FOMC is attended by twelve Fed officials – the seven members of the Board of Governors, the president of the Federal Reserve Bank of New York, and four of the remaining eleven regional Reserve Bank presidents, who serve one-year terms on a rotating basis.
In extreme situations, the Federal Reserve may resort to a policy named Quantitative Easing (QE). QE is the process by which the Fed substantially increases the flow of credit in a stuck financial system. It is a non-standard policy measure used during crises or when inflation is extremely low. It was the Fed’s weapon of choice during the Great Financial Crisis in 2008. It involves the Fed printing more Dollars and using them to buy high grade bonds from financial institutions. QE usually weakens the US Dollar.
Quantitative tightening (QT) is the reverse process of QE, whereby the Federal Reserve stops buying bonds from financial institutions and does not reinvest the principal from the bonds it holds maturing, to purchase new bonds. It is usually positive for the value of the US Dollar.
- WTI Oil price extended losses as Fed officials indicated higher interest rates for longer, which could dampen Oil demand.
- The crude Oil prices received pressure as China’s lower PPI indicated persistent sluggishness in business demand.
- Iraq's Oil minister Hayan Abdul Ghani committed to the voluntary Oil production cuts agreed upon by the OPEC.
West Texas Intermediate (WTI) crude Oil price have experienced a second consecutive decline, trading around $77.70 per barrel during Monday's Asian session. This downward trend in Oil prices could be attributed to uncertainties surrounding crude Oil demand.
US Federal Reserve (Fed) officials have indicated that interest rates could remain elevated for an extended period, potentially impacting growth and reducing Oil demand in the United States (US), the world's largest Oil consumer. Moreover, Friday's release of the US Consumer Sentiment Index added to evidence suggesting a slowdown in the economy. The index declined to 67.4 in May from April's 77.2, hitting a six-month low and falling short of market expectations.
As reported by Reuters, Neel Kashkari, President of the Minneapolis Federal Reserve (Fed), shared concerns regarding the degree of tightness in monetary policy. In an interview with CNBC on Friday, Kashkari acknowledged that while the criteria for another rate hike are stringent, they cannot be entirely discounted. Additionally, San Francisco Fed President Mary Daly emphasized the importance of sustaining a prolonged restrictive policy to achieve the Federal Reserve's inflation goals.
Moreover, China witnessed another decline in its Producer Price Index (PPI), registering a 2.5% drop. This marks the 19th consecutive month of deflation, indicating persistent sluggishness in business demand in the largest Oil-importing nation. This exerts additional downward pressure on Oil prices.
In the Middle East, as reported by Reuters citing the Iraqi state news agency, Hayan Abdul Ghani, Deputy Prime Minister for Energy Affairs and Minister of Oil of Iraq, affirmed Iraq's commitment to the voluntary Oil production cuts agreed upon by the Organization of the Petroleum Exporting Countries (OPEC). Ghani also expressed Iraq's readiness to cooperate with fellow member nations in endeavors aimed at fostering greater stability in the global Oil markets.
- USD/CAD gains ground around 1.3680 in Friday’s early European European session.
- Fed’s Logan said it’s not clear if policy is tight enough to bring inflation down, adding it’s too soon to cut rates.
- The Canadian economy added 90,000 jobs in April, above the consensus of 20,000 gains.
The USD/CAD pair recovers some lost ground near 1.3680 during the early European session on Monday. Meanwhile, the USD Index (DXY) holds positive ground around 105.30 ahead of the US key economic data. The final reading of the US Consumer Price Index (CPI) will be due on Wednesday, which is expected to show an increase of 3.4% over the year in April, compared to a 3.5% annual rise in March.
The US Federal Reserve (Fed) officials said they are waiting for evidence that inflation is on a downward trajectory before the central bank considers cutting the fed funds rate from the 23-year high. Dallas Fed President Lorie Logan said that it’s not clear if monetary policy is tight enough to bring inflation down to the 2% target and it is too soon to be cutting interest rates.
Additionally, San Francisco Fed President Mary Daly emphasized the need for prolonged restrictive policy to achieve the Fed's inflation targets. Minneapolis Fed President Neel Kashkari stated that he's in a "wait-and-see mode,” and there is a "high" bar to concluding that higher rates are needed to cool inflation. The cautious approach of the Fed officials provides some support to the Greenback and acts as a tailwind for the USD/CAD pair.
On the other hand, the Canadian economy added 90,000 jobs in April. This figure registered the strongest increase in 15 months and beat the estimation of 20,000 gains, according to Statistics Canada. Furthermore, the Unemployment Rate held at 6.1% in April. The resilience of the labor market affords the Bank of Canada (BoC) more time to wait to ensure that inflation will be sustained. However, the decline in crude oil prices exerts some selling pressure on the Loonie, as Canada is the leading exporter of oil to the United States.
- NZD/USD has depreciated as the softer Inflation Expectations (Q2) fueled speculation that the RBNZ may lower rates in 2024.
- The Kiwi Business NZ PSI fell to 47.1 in April, its lowest level since January 2022.
- Minneapolis Fed President Neel Kashkari refrained from completely dismissing another rate hike.
NZD/USD continues to lose ground for the second session, trading around 0.6000 during the Asian session on Monday. The New Zealand Dollar (NZD) depreciated following the release of the 2-year RBNZ Inflation Expectations (QoQ) for the second quarter, which fell to 2.33% from the previous quarter's 2.50%. This decline has fueled speculation that the Reserve Bank of New Zealand (RBNZ) might consider lowering rates later in 2024.
Moreover, the Kiwi Dollar faced pressure as Monday’s Business NZ PSI, a key indicator measuring business activity in New Zealand's services sector, dropped to 47.1 in April, its lowest level since January 2022. Although, on Friday, the Business NZ Performance of Manufacturing Index (PMI) rose to 48.9 in April from March's 46.8, it remained below February's reading of 49.1.
The US Dollar Index (DXY), which measures the performance of the US Dollar (USD) against six major currencies, continues to strengthen as traders analyze Friday's crucial economic data from the United States (US) and cautious remarks from Federal Reserve (Fed) officials regarding potential interest rate adjustments. However, the recent decline in US Treasury yields may impede the Greenback's upward momentum.
On Friday, the University of Michigan Consumer Sentiment Index, dropped to 67.4 in May from April's 77.2, marking a six-month low and falling short of market expectations of 76 reading. Meanwhile, the UoM 5-year Consumer Inflation Expectation rose to 3.1%, a six-month high, up from 3.0% prior.
As reported by Reuters, Neel Kashkari, President of the Minneapolis Federal Reserve (Fed), voiced concerns regarding the degree of tightness in monetary policy. In an interview with CNBC on Friday, Kashkari acknowledged that although the bar for another rate hike is set high, it cannot be completely dismissed.
Furthermore, investors are poised to closely monitor key US economic indicators that could significantly influence the market this week. Notable highlights include the release of the Producer Price Index (PPI) on Tuesday, followed by reports on the Consumer Price Index (CPI) and Retail Sales on Wednesday.
- Gold price loses ground in Monday’s Asian session.
- The lower bets on the Fed rate cuts weigh on the precious metal.
- Fed’s Jefferson and Mester are set to speak later on Monday.
Gold price (XAU/USD) loses its recovery momentum on Monday during the Asian session. The hawkish remarks from the Federal Reserve (Fed) and growing speculation that the Fed might delay its easing plans have boosted the Greenback and dragged the USD-denominated gold lower. However, signs of economic weakness and ongoing geopolitical tensions in the Middle East are likely to support precious metals in the near term.
Gold traders will keep an eye on the Fed’s Jefferson and Mester speeches on Monday. Later this week, the US Consumer Price Index (CPI), Producer Price Index (PPI), and Retail Sales will be in the spotlight. In case of stronger-than-expected economic data, this might dampen the hope for a Fed rate cut and exert some selling pressure on the XAU/USD
Daily Digest Market Movers: Gold price attracts some sellers amid the Fed’s hawkish remarks
- San Francisco Fed President Mary Daly highlighted the need for prolonged restrictive policy to achieve the Fed's inflation targets.
- Atlanta Fed President Raphael Bostic said that the central bank is probably still planning to cut its interest rates this year, despite the uncertain outlook.
- Dallas Fed President Lorie Logan said that there are upside risks to inflation, adding that it is too soon to cut interest rates.
- Minneapolis Fed President Neel Kashkari stated that he's in a "wait-and-see mode,” and there is a "high" bar to concluding that higher rates are needed to cool inflation.
- The Israeli military said that it launched operations in northern Gaza overnight and that "precise operations" are ongoing in eastern Rafah and near the Rafah border, as well as in the Zeitoun neighborhood in central Gaza. The military engagement in Rafah occurs before a full-scale invasion, per CNN.
- The initial reading of the Michigan Consumer Sentiment Index dropped to 67.4 in May from 77.2 in April, weaker than the expectation of 76.0.
- The University of Michigan's (UoM) one-year inflation outlook jumped to 3.5%, while the five-year outlook rose to 3.1%. Both figures registered the highest level since November 2023.
Technical Analysis: Gold price keeps the constructive picture unchanged
The gold price edges lower on the day. Nonetheless, the bullish stance of the yellow metal remains intact as it holds above the key 100-day Exponential Moving Average (EMA) on the four-hour chart. The upward momentum is supported by the 14-day Relative Strength Index (RSI) which stands in bullish territory around 63.50, suggesting the further upside looks favorable.
The first upside barrier for XAU/USD will emerge near a high of May 10, $2,378, en route to the $2,400 psychological level. A decisive break above this level could clear the path for a rally to the next major resistance near an all-time high near $2,432, and then the $2,500 figure.
On the downside, the key support level is seen near the confluence of the resistance-turned-support level and the 100-period EMA at $2,325. Further south, the next contention level is located near a low of May 2 at $2,281.
US Dollar price today
The table below shows the percentage change of US Dollar (USD) against listed major currencies today. US Dollar was the strongest against the New Zealand Dollar.
| USD | EUR | GBP | CAD | AUD | JPY | NZD | CHF | |
| USD | -0.02% | -0.03% | 0.02% | 0.02% | -0.04% | 0.16% | 0.01% | |
| EUR | 0.01% | -0.02% | 0.05% | 0.04% | -0.03% | 0.19% | 0.03% | |
| GBP | 0.03% | 0.01% | 0.06% | 0.05% | -0.01% | 0.19% | 0.05% | |
| CAD | -0.02% | -0.04% | -0.06% | -0.01% | -0.07% | 0.14% | -0.01% | |
| AUD | -0.04% | -0.07% | -0.06% | 0.01% | -0.07% | 0.15% | -0.01% | |
| JPY | 0.04% | 0.02% | 0.01% | 0.07% | 0.07% | 0.18% | 0.06% | |
| NZD | -0.15% | -0.18% | -0.20% | -0.13% | -0.14% | -0.21% | -0.14% | |
| CHF | -0.02% | -0.03% | -0.05% | 0.02% | 0.00% | -0.06% | 0.15% |
The heat map shows percentage changes of major currencies against each other. The base currency is picked from the left column, while the quote currency is picked from the top row. For example, if you pick the Euro from the left column and move along the horizontal line to the Japanese Yen, the percentage change displayed in the box will represent EUR (base)/JPY (quote).
Gold FAQs
Gold has played a key role in human’s history as it has been widely used as a store of value and medium of exchange. Currently, apart from its shine and usage for jewelry, the precious metal is widely seen as a safe-haven asset, meaning that it is considered a good investment during turbulent times. Gold is also widely seen as a hedge against inflation and against depreciating currencies as it doesn’t rely on any specific issuer or government.
Central banks are the biggest Gold holders. In their aim to support their currencies in turbulent times, central banks tend to diversify their reserves and buy Gold to improve the perceived strength of the economy and the currency. High Gold reserves can be a source of trust for a country’s solvency. Central banks added 1,136 tonnes of Gold worth around $70 billion to their reserves in 2022, according to data from the World Gold Council. This is the highest yearly purchase since records began. Central banks from emerging economies such as China, India and Turkey are quickly increasing their Gold reserves.
Gold has an inverse correlation with the US Dollar and US Treasuries, which are both major reserve and safe-haven assets. When the Dollar depreciates, Gold tends to rise, enabling investors and central banks to diversify their assets in turbulent times. Gold is also inversely correlated with risk assets. A rally in the stock market tends to weaken Gold price, while sell-offs in riskier markets tend to favor the precious metal.
The price can move due to a wide range of factors. Geopolitical instability or fears of a deep recession can quickly make Gold price escalate due to its safe-haven status. As a yield-less asset, Gold tends to rise with lower interest rates, while higher cost of money usually weighs down on the yellow metal. Still, most moves depend on how the US Dollar (USD) behaves as the asset is priced in dollars (XAU/USD). A strong Dollar tends to keep the price of Gold controlled, whereas a weaker Dollar is likely to push Gold prices up.
- The Australian Dollar depreciates due to the dovish sentiment surrounding the RBA.
- Australia's Treasury announced that inflation could re-enter the RBA target range by the end of 2024.
- The US Dollar received support from the cautious comments from Fed officials regarding interest rate cuts.
The Australian Dollar (AUD) extended its losses on Monday, possibly due to the Reserve Bank of Australia (RBA)'s less hawkish stance after it decided to keep its interest rate unchanged at 4.35% on Tuesday. Markets were speculating that the RBA might adopt a more hawkish stance, fueled by last week's inflation data, which exceeded expectations.
Australia's Treasury announced on Sunday that they forecasted that inflation could re-enter the Reserve Bank of Australia's (RBA) target range by the end of 2024. In their December outlook, officials predicted that CPI inflation would decrease to 3.75% by mid-2024 and 2.75% by mid-2025, aligning it with the RBA's target range.
The US Dollar Index (DXY), which gauges the performance of the US Dollar (USD) against six major currencies, continues to gain ground as traders digest Friday’s key economic data and cautious comments from Federal Reserve (Fed) officials regarding interest rate cuts. However, the downward correction in the US Treasury yields could limit the advance of the Greenback.
In the United States (US), investors are geared to focus on pivotal economic indicators that could serve as significant market catalysts this week. Key highlights include the Producer Price Index (PPI) scheduled for release on Tuesday, followed by the Consumer Price Index (CPI) and Retail Sales reports on Wednesday.
Daily Digest Market Movers: Australian Dollar depreciates due to a dovish RBA
- National Australia Bank's Business Conditions fell to 7 in April, from the previous reading of 9. Meanwhile, National Australia Bank's Business Confidence stood at the reading of 1.
- According to The Guardian, Treasurer of Australia Jim Chalmers hinted at positive developments during a series of television interviews on Sunday morning. Chalmers suggested that the upcoming budget would reveal a quicker decline in inflation than what the RBA had anticipated. He emphasized that Tuesday night's budget aims to lower inflation rather than exacerbate it, while also aiming to alleviate some of the burdens for individuals.
- According to Reuters, Neel Kashkari, President of the Minneapolis Federal Reserve (Fed), expressed caution regarding the level of restrictiveness in monetary policy. On Friday, Kashkari stated in an interview with CNBC that while the threshold for another rate hike is high, it cannot be entirely ruled out. Additionally, San Francisco Fed President Mary Daly emphasized the necessity of maintaining a prolonged restrictive policy to attain the Federal Reserve's inflation objectives.
- On Friday, the University of Michigan Consumer Sentiment Index, dropped to 67.4 in May from April's 77.2, marking a six-month low and falling short of market expectations of 76 reading. Meanwhile, the UoM 5-year Consumer Inflation Expectation rose to 3.1%, a six-month high, up from 3.0% prior.
- The Commonwealth Bank of Australia (CBA) has revised down its forecasts for the Australian Dollar at the end of 2024 is 0.69, down from 0.71 previously. CBA cites factors such as the interest rate gap and elevated US Treasury bond yields, which are bolstering the US Dollar. The Federal Reserve's cautious stance on high inflation and its reluctance to implement rate cuts further support the US Dollar, as reported on forexlive.com.
Technical Analysis: Australian Dollar hovers around the psychological level of 0.6600
The Australian Dollar trades around 0.6600 on Monday. The AUD/USD pair maintains a sideways movement within a symmetrical triangle pattern, with the 14-day Relative Strength Index (RSI) suggesting a bullish inclination as it remains above the 50 level.
The AUD/USD pair could test the upper boundary near the swing area at 0.6650. A breakthrough above this level might prompt a retest of March's high at 0.6667, potentially extending gains toward the psychological barrier of 0.6700.
In terms of downside, immediate support is anticipated around the 14-day Exponential Moving Average (EMA) at 0.6569. Should the pair breach below this EMA, it could encounter additional selling pressure, potentially targeting the area around the lower boundary of the symmetrical triangle, approximately at 0.6465.
AUD/USD: Daily Chart
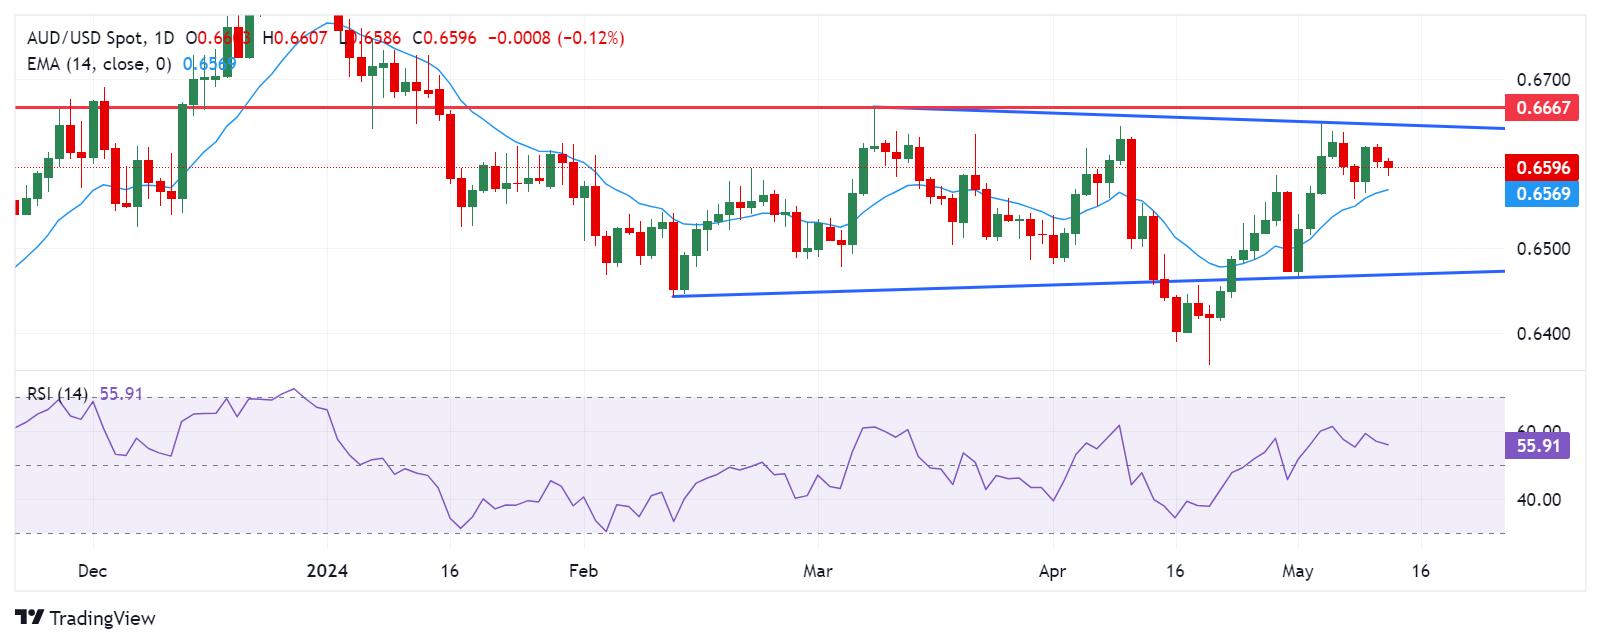
Australian Dollar price today
The table below shows the percentage change of the Australian Dollar (AUD) against listed major currencies today. The Australian Dollar was the weakest against the Pound Sterling.
| USD | EUR | GBP | CAD | AUD | JPY | NZD | CHF | |
| USD | -0.02% | -0.06% | -0.05% | -0.08% | -0.05% | -0.07% | -0.04% | |
| EUR | 0.02% | -0.04% | -0.02% | -0.06% | -0.03% | -0.03% | -0.02% | |
| GBP | 0.06% | 0.05% | 0.02% | -0.02% | 0.02% | -0.01% | 0.03% | |
| CAD | 0.05% | 0.02% | -0.02% | -0.04% | -0.01% | -0.01% | 0.01% | |
| AUD | 0.08% | 0.07% | 0.02% | 0.05% | 0.03% | 0.03% | 0.05% | |
| JPY | 0.05% | 0.00% | -0.02% | 0.01% | -0.02% | -0.04% | 0.02% | |
| NZD | 0.06% | 0.03% | -0.02% | 0.01% | -0.04% | 0.00% | 0.02% | |
| CHF | 0.03% | 0.01% | -0.03% | -0.01% | -0.05% | -0.01% | -0.03% |
The heat map shows percentage changes of major currencies against each other. The base currency is picked from the left column, while the quote currency is picked from the top row. For example, if you pick the Euro from the left column and move along the horizontal line to the Japanese Yen, the percentage change displayed in the box will represent EUR (base)/JPY (quote).
Australian Dollar FAQs
One of the most significant factors for the Australian Dollar (AUD) is the level of interest rates set by the Reserve Bank of Australia (RBA). Because Australia is a resource-rich country another key driver is the price of its biggest export, Iron Ore. The health of the Chinese economy, its largest trading partner, is a factor, as well as inflation in Australia, its growth rate and Trade Balance. Market sentiment – whether investors are taking on more risky assets (risk-on) or seeking safe-havens (risk-off) – is also a factor, with risk-on positive for AUD.
The Reserve Bank of Australia (RBA) influences the Australian Dollar (AUD) by setting the level of interest rates that Australian banks can lend to each other. This influences the level of interest rates in the economy as a whole. The main goal of the RBA is to maintain a stable inflation rate of 2-3% by adjusting interest rates up or down. Relatively high interest rates compared to other major central banks support the AUD, and the opposite for relatively low. The RBA can also use quantitative easing and tightening to influence credit conditions, with the former AUD-negative and the latter AUD-positive.
China is Australia’s largest trading partner so the health of the Chinese economy is a major influence on the value of the Australian Dollar (AUD). When the Chinese economy is doing well it purchases more raw materials, goods and services from Australia, lifting demand for the AUD, and pushing up its value. The opposite is the case when the Chinese economy is not growing as fast as expected. Positive or negative surprises in Chinese growth data, therefore, often have a direct impact on the Australian Dollar and its pairs.
Iron Ore is Australia’s largest export, accounting for $118 billion a year according to data from 2021, with China as its primary destination. The price of Iron Ore, therefore, can be a driver of the Australian Dollar. Generally, if the price of Iron Ore rises, AUD also goes up, as aggregate demand for the currency increases. The opposite is the case if the price of Iron Ore falls. Higher Iron Ore prices also tend to result in a greater likelihood of a positive Trade Balance for Australia, which is also positive of the AUD.
The Trade Balance, which is the difference between what a country earns from its exports versus what it pays for its imports, is another factor that can influence the value of the Australian Dollar. If Australia produces highly sought after exports, then its currency will gain in value purely from the surplus demand created from foreign buyers seeking to purchase its exports versus what it spends to purchase imports. Therefore, a positive net Trade Balance strengthens the AUD, with the opposite effect if the Trade Balance is negative.
New Zealand's (NZ) inflation expectations extended their decline on a 12-month and a two-year time frame for the second quarter of 2024, the Reserve Bank of New Zealand’s (RBNZ) latest monetary conditions survey showed on Tuesday.
Two-year inflation expectations, seen as the time frame when RBNZ policy action will filter through to prices, eased slightly from 2.50% seen in Q1 2024 to 2.33% in Q2 of this year.
NZ average one-year inflation expectations dropped to 2.73% in Q2 vs. 3.22% seen in the first quarter of 2024.
NZD/USD reaction on softening inflation expectations
The New Zealand Dollar (NZD) came under renewed selling pressure after falling inflation expectations. At the press time, NZD/USD is losing 0.34% on the day to trade the 0.6001.
New Zealand Dollar FAQs
The New Zealand Dollar (NZD), also known as the Kiwi, is a well-known traded currency among investors. Its value is broadly determined by the health of the New Zealand economy and the country’s central bank policy. Still, there are some unique particularities that also can make NZD move. The performance of the Chinese economy tends to move the Kiwi because China is New Zealand’s biggest trading partner. Bad news for the Chinese economy likely means less New Zealand exports to the country, hitting the economy and thus its currency. Another factor moving NZD is dairy prices as the dairy industry is New Zealand’s main export. High dairy prices boost export income, contributing positively to the economy and thus to the NZD.
The Reserve Bank of New Zealand (RBNZ) aims to achieve and maintain an inflation rate between 1% and 3% over the medium term, with a focus to keep it near the 2% mid-point. To this end, the bank sets an appropriate level of interest rates. When inflation is too high, the RBNZ will increase interest rates to cool the economy, but the move will also make bond yields higher, increasing investors’ appeal to invest in the country and thus boosting NZD. On the contrary, lower interest rates tend to weaken NZD. The so-called rate differential, or how rates in New Zealand are or are expected to be compared to the ones set by the US Federal Reserve, can also play a key role in moving the NZD/USD pair.
Macroeconomic data releases in New Zealand are key to assess the state of the economy and can impact the New Zealand Dollar’s (NZD) valuation. A strong economy, based on high economic growth, low unemployment and high confidence is good for NZD. High economic growth attracts foreign investment and may encourage the Reserve Bank of New Zealand to increase interest rates, if this economic strength comes together with elevated inflation. Conversely, if economic data is weak, NZD is likely to depreciate.
The New Zealand Dollar (NZD) tends to strengthen during risk-on periods, or when investors perceive that broader market risks are low and are optimistic about growth. This tends to lead to a more favorable outlook for commodities and so-called ‘commodity currencies’ such as the Kiwi. Conversely, NZD tends to weaken at times of market turbulence or economic uncertainty as investors tend to sell higher-risk assets and flee to the more-stable safe havens.
| Raw materials | Closed | Change, % |
|---|---|---|
| Silver | 28.168 | -0.58 |
| Gold | 2360.83 | 0.65 |
| Palladium | 977.06 | 0.94 |
China’s Consumer Price Index (CPI) rose 0.3% YoY in April after reporting a 0.1% growth in March. The market forecast was for a 0.1% increase.
Chinese CPI inflation came in at 0.1% over the month in April versus March’s 1.0 decline.
China’s Producer Price Index (PPI) fell 2.5% YoY in April, compared with a 2.8% drop seen previously. The data missed expectations for a 2.3% decrease in the reported period.
Market reaction to Chinese inflation data
At the press time, AUD/USD is losing 0.24% on the day to trade at 0.6585.
Australian Dollar FAQs
One of the most significant factors for the Australian Dollar (AUD) is the level of interest rates set by the Reserve Bank of Australia (RBA). Because Australia is a resource-rich country another key driver is the price of its biggest export, Iron Ore. The health of the Chinese economy, its largest trading partner, is a factor, as well as inflation in Australia, its growth rate and Trade Balance. Market sentiment – whether investors are taking on more risky assets (risk-on) or seeking safe-havens (risk-off) – is also a factor, with risk-on positive for AUD.
The Reserve Bank of Australia (RBA) influences the Australian Dollar (AUD) by setting the level of interest rates that Australian banks can lend to each other. This influences the level of interest rates in the economy as a whole. The main goal of the RBA is to maintain a stable inflation rate of 2-3% by adjusting interest rates up or down. Relatively high interest rates compared to other major central banks support the AUD, and the opposite for relatively low. The RBA can also use quantitative easing and tightening to influence credit conditions, with the former AUD-negative and the latter AUD-positive.
China is Australia’s largest trading partner so the health of the Chinese economy is a major influence on the value of the Australian Dollar (AUD). When the Chinese economy is doing well it purchases more raw materials, goods and services from Australia, lifting demand for the AUD, and pushing up its value. The opposite is the case when the Chinese economy is not growing as fast as expected. Positive or negative surprises in Chinese growth data, therefore, often have a direct impact on the Australian Dollar and its pairs.
Iron Ore is Australia’s largest export, accounting for $118 billion a year according to data from 2021, with China as its primary destination. The price of Iron Ore, therefore, can be a driver of the Australian Dollar. Generally, if the price of Iron Ore rises, AUD also goes up, as aggregate demand for the currency increases. The opposite is the case if the price of Iron Ore falls. Higher Iron Ore prices also tend to result in a greater likelihood of a positive Trade Balance for Australia, which is also positive of the AUD.
The Trade Balance, which is the difference between what a country earns from its exports versus what it pays for its imports, is another factor that can influence the value of the Australian Dollar. If Australia produces highly sought after exports, then its currency will gain in value purely from the surplus demand created from foreign buyers seeking to purchase its exports versus what it spends to purchase imports. Therefore, a positive net Trade Balance strengthens the AUD, with the opposite effect if the Trade Balance is negative.
- USD/JPY remains firm around 155.85 in Monday’s Asian session.
- The BoJ reduced the amount of JGBs that it purchased in its latest operation.
- A cautious approach from the US Fed boosts the Greenback broadly.
The USD/JPY pair trades on a stronger note near 155.85 during the Asian trading hours on Monday. The hawkish stance from the US Federal Reserve (Fed) has provided some support to the Greenback in recent sessions. Investors will take more cues from the US Consumer Price Index (CPI), Producer, Price Index (PPI), and Retail Sales this week for fresh impetus. Also, Fed Jefferson and Mester are set to speak later on Monday.
Early Monday, the Bank of Japan (BoJ) reduced the amount of Japanese Government Bonds (JGBs) that it purchased in its latest operation in the 5–10-year window to 425bn Yen from 475bn Yen at the previous operation. Ruling party heavyweight Katsunobu Kato said that Japan is seeing conditions fall in place for the central bank to normalize monetary policy. However, the BoJ must monitor economic conditions and coordinate carefully with the government in working out when to raise rates.
The Fed officials delivered a cautious message last week. Financial markets have priced in 5% odds of a June rate cut, down from 10% at the start of last week, while September chances have fallen to 75% from nearly 90% at the beginning of last week. The preliminary University of Michigan Consumer Sentiment Index arrived at 67.4 in May from 77.2 in April, worse than the estimation of 76.0. Furthermore, the one-year inflation outlook climbed to 3.5%, and the five-year outlook rose to 3.1%, the highest level since November 2023. The wide interest rate differential between Japan and the United States continues to undermine the Japanese Yen (JPY) and create a tailwind for the USD/JPY pair.
- GBP/USD inches higher possibly driven by improved risk appetite on Monday.
- BoE’s Chief Economist Huw Pill indicated a growing belief that rate cuts might be on the horizon.
- The US Dollar struggled as the US Consumer Sentiment Index dropped to 67.4 in May, marking a six-month low.
GBP/USD edges higher to near 1.2520 during the Asian session on Monday, possibly due to improved risk appetite. The Pound Sterling (GBP) was bolstered by releasing higher-than-expected UK Gross Domestic Product (GDP) figures on Friday. The UK economy expanded by 0.6% in Q1, surpassing forecasts and signaling the end of the nation's brief recession. This economic rebound represented the most robust growth seen in over two years.
However, the British Pound faced a challenge following dovish remarks from Huw Pill, Chief Economist at the Bank of England (BoE). Pill echoed the sentiment of the majority of the BoE's Monetary Policy Committee (MPC), who opted to maintain interest rates at 5.25% on Thursday. Yet, he subsequently expressed a growing belief that rate cuts could be imminent.
The market participants are likely to await the employment data from the United Kingdom (UK) on Tuesday with expectations of Claimant Count Change showing an increase in the number of those claiming jobless benefits in April. Additionally, the ILO Unemployment Rate (3M) is expected to show an increase in number of unemployed workers in the UK.
This week, investors in the United States (US) are poised to focus on key economic indicators for potential market drivers, including the Consumer Price Index (CPI), Producer Price Index (PPI), and Retail Sales.
On Friday, the US Dollar (USD) encountered challenges following the release of the University of Michigan consumer sentiment index, which dropped to 67.4 in May from April's 77.2, marking a six-month low and falling short of market expectations of 76 reading.
However, the extent of these losses may have been curbed by an uptick in inflation expectations for the year ahead, with a reading of 3.5%, the highest in six months compared to April's 3.2%. Additionally, the five-year inflation outlook rose to 3.1%, a six-month high, up from 3.0% previously. These inflation indicators might have supported the US Treasury yields to advance, potentially lending support to the Greenback.
A former chief cabinet secretary, Katsunobu Kato, said on Monday that Japan is seeing conditions fall in place for the central bank to normalize monetary policy. A ruling party heavyweight underscored growing political support for further interest rate hikes, per Reuters.
Key quotes
“Japan is seeing conditions fall in place for the central bank to normalize monetary policy.”
“Bank of Japan must keep a close eye on economic conditions and coordinate carefully with the government in working out when to raise rates.”
"Japan is shifting to an era where prices and wages rise, from one where both barely moved.”
"It's therefore natural for monetary policy to revert to the original style in which interest rates move in positive territory reflecting market function.”
"Key to the decision on whether to actually raise interest rates is Japan's economy, especially consumption, which isn't necessarily strong."
Market reaction
At the press time, USD/JPY is adding 0.01% on the day to trade at 155.77.
Japanese Yen FAQs
The Japanese Yen (JPY) is one of the world’s most traded currencies. Its value is broadly determined by the performance of the Japanese economy, but more specifically by the Bank of Japan’s policy, the differential between Japanese and US bond yields, or risk sentiment among traders, among other factors.
One of the Bank of Japan’s mandates is currency control, so its moves are key for the Yen. The BoJ has directly intervened in currency markets sometimes, generally to lower the value of the Yen, although it refrains from doing it often due to political concerns of its main trading partners. The current BoJ ultra-loose monetary policy, based on massive stimulus to the economy, has caused the Yen to depreciate against its main currency peers. This process has exacerbated more recently due to an increasing policy divergence between the Bank of Japan and other main central banks, which have opted to increase interest rates sharply to fight decades-high levels of inflation.
The BoJ’s stance of sticking to ultra-loose monetary policy has led to a widening policy divergence with other central banks, particularly with the US Federal Reserve. This supports a widening of the differential between the 10-year US and Japanese bonds, which favors the US Dollar against the Japanese Yen.
The Japanese Yen is often seen as a safe-haven investment. This means that in times of market stress, investors are more likely to put their money in the Japanese currency due to its supposed reliability and stability. Turbulent times are likely to strengthen the Yen’s value against other currencies seen as more risky to invest in.
The People’s Bank of China (PBoC) set the USD/CNY central rate for the trading session ahead on Monday at 7.1030 as compared to the previous day's fix of 7.1011 and 7.2284 Reuters estimates.
- EUR/USD weakens to 1.0770 in Monday’s early Asian session.
- The high-for-longer US rate narrative and, the Fed’s hawkish comments lift the Greenback.
- The ECB policymakers noted last month that they will likely be in a position to cut interest rates in June.
The EUR/USD pair trades on a softer note around 1.0770 during the early Asian trading hours on Monday. Investors turn to cautious mode and prefer to wait on the sidelines ahead of the US key economic data this week. The final reading of the US Consumer Price Index (CPI) for April will take center stage on Wednesday, which is expected to show an increase of 3.4% YoY.
A jump in consumer inflation expectations has raised the expectation that the Federal Reserve might hold a rate for longer. The inflation outlook registered the highest level since November 2023, with the one-year inflation outlook surging to 3.5% and the five-year outlook rising to 3.1%. Dallas Fed President Lorie Logan said that there are upside risks to inflation, adding it is too soon to be cutting interest rates.
Meanwhile, Minneapolis Fed President Neel Kashkari stated that he's in a "wait-and-see mode” and there is a "high" bar to concluding that higher rates are needed to cool inflation. These hawkish remarks from the Fed officials boost the Greenback and weigh on the major pair.
On the other hand, the European Central Bank (ECB) policymakers noted last month that they will likely be in a position to cut interest rates in June as inflation in the Eurozone is on track to ease back to 2% next year, according to the account of their April meeting. Markets expect the ECB to cut its interest rate on June 6 despite the rate path beyond that is uncertain. The growing speculation of an ECB rate cut and a possible delay by the US Fed to its rate cuts is likely to cap the upside of the Euro (EUR) and create a headwind for the EUR/USD pair in the near term.
| Index | Change, points | Closed | Change, % |
|---|---|---|---|
| NIKKEI 225 | 155.13 | 38229.11 | 0.41 |
| Hang Seng | 425.87 | 18963.68 | 2.3 |
| KOSPI | 15.49 | 2727.63 | 0.57 |
| ASX 200 | 27.4 | 7749 | 0.35 |
| DAX | 86.25 | 18772.85 | 0.46 |
| CAC 40 | 31.49 | 8219.14 | 0.38 |
| Dow Jones | 125.08 | 39512.84 | 0.32 |
| S&P 500 | 8.6 | 5222.68 | 0.16 |
| NASDAQ Composite | -5.39 | 16340.87 | -0.03 |
| Pare | Closed | Change, % |
|---|---|---|
| AUDUSD | 0.66033 | -0.28 |
| EURJPY | 167.77 | 0.12 |
| EURUSD | 1.07696 | -0.14 |
| GBPJPY | 195.112 | 0.24 |
| GBPUSD | 1.25236 | -0.03 |
| NZDUSD | 0.60187 | -0.3 |
| USDCAD | 1.36719 | -0.01 |
| USDCHF | 0.9065 | 0.1 |
| USDJPY | 155.793 | 0.27 |


© 2000-2026. Bản quyền Teletrade.
Trang web này được quản lý bởi Teletrade D.J. LLC 2351 LLC 2022 (Euro House, Richmond Hill Road, Kingstown, VC0100, St. Vincent and the Grenadines).
Thông tin trên trang web không phải là cơ sở để đưa ra quyết định đầu tư và chỉ được cung cấp cho mục đích làm quen.
Giao dịch trên thị trường tài chính (đặc biệt là giao dịch sử dụng các công cụ biên) mở ra những cơ hội lớn và tạo điều kiện cho các nhà đầu tư sẵn sàng mạo hiểm để thu lợi nhuận, tuy nhiên nó mang trong mình nguy cơ rủi ro khá cao. Chính vì vậy trước khi tiến hành giao dịch cần phải xem xét mọi mặt vấn đề chấp nhận tiến hành giao dịch cụ thể xét theo quan điểm của nguồn lực tài chính sẵn có và mức độ am hiểu thị trường tài chính.
Sử dụng thông tin: sử dụng toàn bộ hay riêng biệt các dữ liệu trên trang web của công ty TeleTrade như một nguồn cung cấp thông tin nhất định. Việc sử dụng tư liệu từ trang web cần kèm theo liên kết đến trang teletrade.vn. Việc tự động thu thập số liệu cũng như thông tin từ trang web TeleTrade đều không được phép.
Xin vui lòng liên hệ với pr@teletrade.global nếu có câu hỏi.
ngân hàng