- Phân tích
- Tin tức và các công cụ
- Tin tức thị trường
Tin tức thì trường
Bank of Canada (BoC) Governor Tiff Macklem reiterated on Wednesday that there is a limit to how far the Canadian central bank can diverge on rates from the Federal Reserve (Fed), but they’re not close to that limit.
Key quotes
"For many of our citizens, this has been their first experience with high inflation, and it has been painful.”
"We need to meet people where they are and ensure they understand what we’re doing and why we’re doing it.”
"Recent history has been a stark reminder that inflation is our common enemy.”
“It's reasonable to expect more cuts on the horizon, but that the central bank is taking it "one meeting at a time."
“There are limits to that divergence, but we’re not close to that limit.”
Market reaction
At the time of writing, USD/CAD is trading 0.02% lower on the day to trade at 1.3720.
Bank of Canada FAQs
The Bank of Canada (BoC), based in Ottawa, is the institution that sets interest rates and manages monetary policy for Canada. It does so at eight scheduled meetings a year and ad hoc emergency meetings that are held as required. The BoC primary mandate is to maintain price stability, which means keeping inflation at between 1-3%. Its main tool for achieving this is by raising or lowering interest rates. Relatively high interest rates will usually result in a stronger Canadian Dollar (CAD) and vice versa. Other tools used include quantitative easing and tightening.
In extreme situations, the Bank of Canada can enact a policy tool called Quantitative Easing. QE is the process by which the BoC prints Canadian Dollars for the purpose of buying assets – usually government or corporate bonds – from financial institutions. QE usually results in a weaker CAD. QE is a last resort when simply lowering interest rates is unlikely to achieve the objective of price stability. The Bank of Canada used the measure during the Great Financial Crisis of 2009-11 when credit froze after banks lost faith in each other’s ability to repay debts.
Quantitative tightening (QT) is the reverse of QE. It is undertaken after QE when an economic recovery is underway and inflation starts rising. Whilst in QE the Bank of Canada purchases government and corporate bonds from financial institutions to provide them with liquidity, in QT the BoC stops buying more assets, and stops reinvesting the principal maturing on the bonds it already holds. It is usually positive (or bullish) for the Canadian Dollar.
- GBP/USD edges lower to 1.2795 after retreating from three-month highs on Thursday.
- The Fed kept its benchmark overnight borrowing rate targeted in a range of 5.25%-5.50% on Wednesday, as widely expected.
- The UK GDP flatlined in April, arriving at 0% after expanding 0.4% in March.
The GBP/USD pair loses some ground near 1.2795 after retracing from three-month highs of 1.2860 during the early Asian session on Thursday. The negative surprise of the US Consumer Price Index (CPI) inflation report in May weighs on the Greenback, but the hawkish hold by the Federal Reserve (Fed) modestly caps the USD’s downside.
Inflation in the United States held flat in May, dragging the US Dollar (USD) lower. The CPI figure eased to 3.3% on a yearly basis in May from 3.4% in April, below the market consensus of 3.4%, the US Bureau of Labor Statistics (BLS) reported on Wednesday. The core CPI, which excludes volatile food and energy prices, increased 3.4%, compared to a 3.6% rise in April and the estimation of 3.5%. On a monthly basis, the CPI was unchanged, while the core CPI increased 0.2% in May.
Furthermore, the Federal Open Market Committee (FOMC) decided to keep its benchmark lending rate in a range of 5.25%-5.50% for the seventh time in a row at its June meeting on Wednesday. The FOMC officials expect just one rate cut this year, down from three in March, according to its most recent economic predictions. The so-called ‘dot-plot’ showed that the median of the FOMC officials revised their forecast of the federal funds rate from 4.6% to 5.1%, towards the end of 2024.
Futures traders are now pricing in a 73% odds of rate cut from the Fed in September, up from 53% before the CPI data released, according to the CME FedWatch tool. Later on Thursday, investors will keep an eye on the US weekly Initial Jobless Claims, along with the Producer Prices Index (PPI) and the Fed's John Williams speech.
On the other hand, the UK economic growth stalls in April, according to a flash reading published by the Office for National Statistics (ONS) on Wednesday. The UK Gross Domestic Product (GDP) came in at 0% in April after growing 0.4% in March, in line with the market consensus. The Bank of England (BoE) will meet on June 20 for the next move of its monetary policy. Investors believe there is little possibility of a rate cut in June and shift their expectations towards August or September.
- EUR/USD climbed to 1.0850 before facing a pullback after Fed rate call.
- FOMC “dot plot” teases less rate cuts in 2024 than previously expected.
- ECB talking points to round out the Euro’s week.
EUR/USD launched higher on Wednesday, climbing after broad-market risk appetite surged following a cooler-than-expected print in US Consumer Price Index (CPI) inflation, but a hawkish tilt to the Federal Reserve’s latest update to its dot plot of interest rate expectations crimped market sentiment to round out the day.
Forex Today: US inflation dominates headlines
According to the Federal Open Market Committee (FOMC) and its Summary of Economic Projections (SEP), only a single quarter-point rate cut is now expected in 2024. Market hopes for Fed rate cuts have steadily clashed with the Federal Reserve’s own rate cut expectations through 2024, and according to the CME’s FedWatch Tool, rate markets are still pricing in over 60% odds of at least a 25 basis-point rate trim on September 18.
Read more: Jerome Powell comments on rate outlook after keeping policy settings unchanged
Eurogroup meetings on Thursday and Friday, pan-European Industrial Production figures, and several speeches from European Central Bank (ECB) policymakers will wrap up the trading week’s Euro events, while US jobless claims and the Michigan Consumer Sentiment Index will provide perspective after the Fed’s latest rate call.
European Industrial Production figures for April are slated for Thursday, with median market forecasts expecting figures to ease to 0.2% MoM compared to the previous 0.6%. US Initial Jobles Claims for the week ended June 7 are expected later on Thursday, with investors expecting 225K new jobless claimants compared to the previous week’s 229K.
A handful of speeches from ECB central planners smatter Friday’s economic calendar, and the Univeristy of Michigan’s Consumer Sentiment Index for June is expected to recover to 72.0 from 69.1.
EUR/USD technical outlook
EUR/USD is once again mired in congestion at the 200-day Exponential Moving Average (EMA) at 1.0803. Wednesday’s bullish push dragged the pair back into contention with a descending trendline drawn from 2024’s peak bids near 1.1150, but near-term technical resistance is keeping the Fiber pinned. The pair has etched in a near-term technical rejection from 1.0850, and the way is open for a bearish return to this week’s low bids near 1.0720.
EUR/USD hourly chart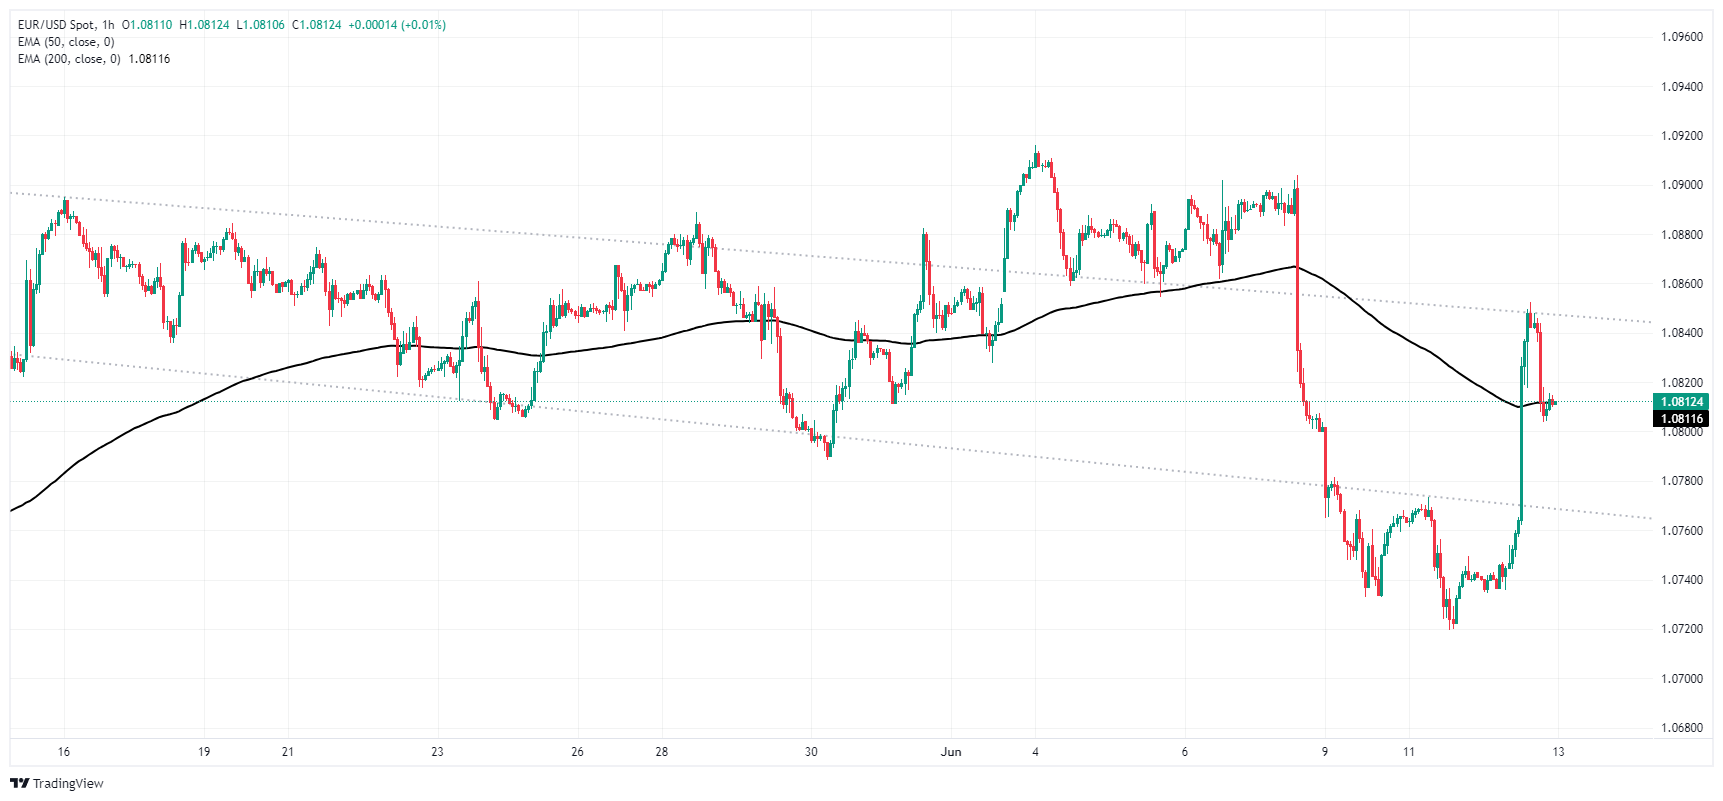
EUR/USD daily chart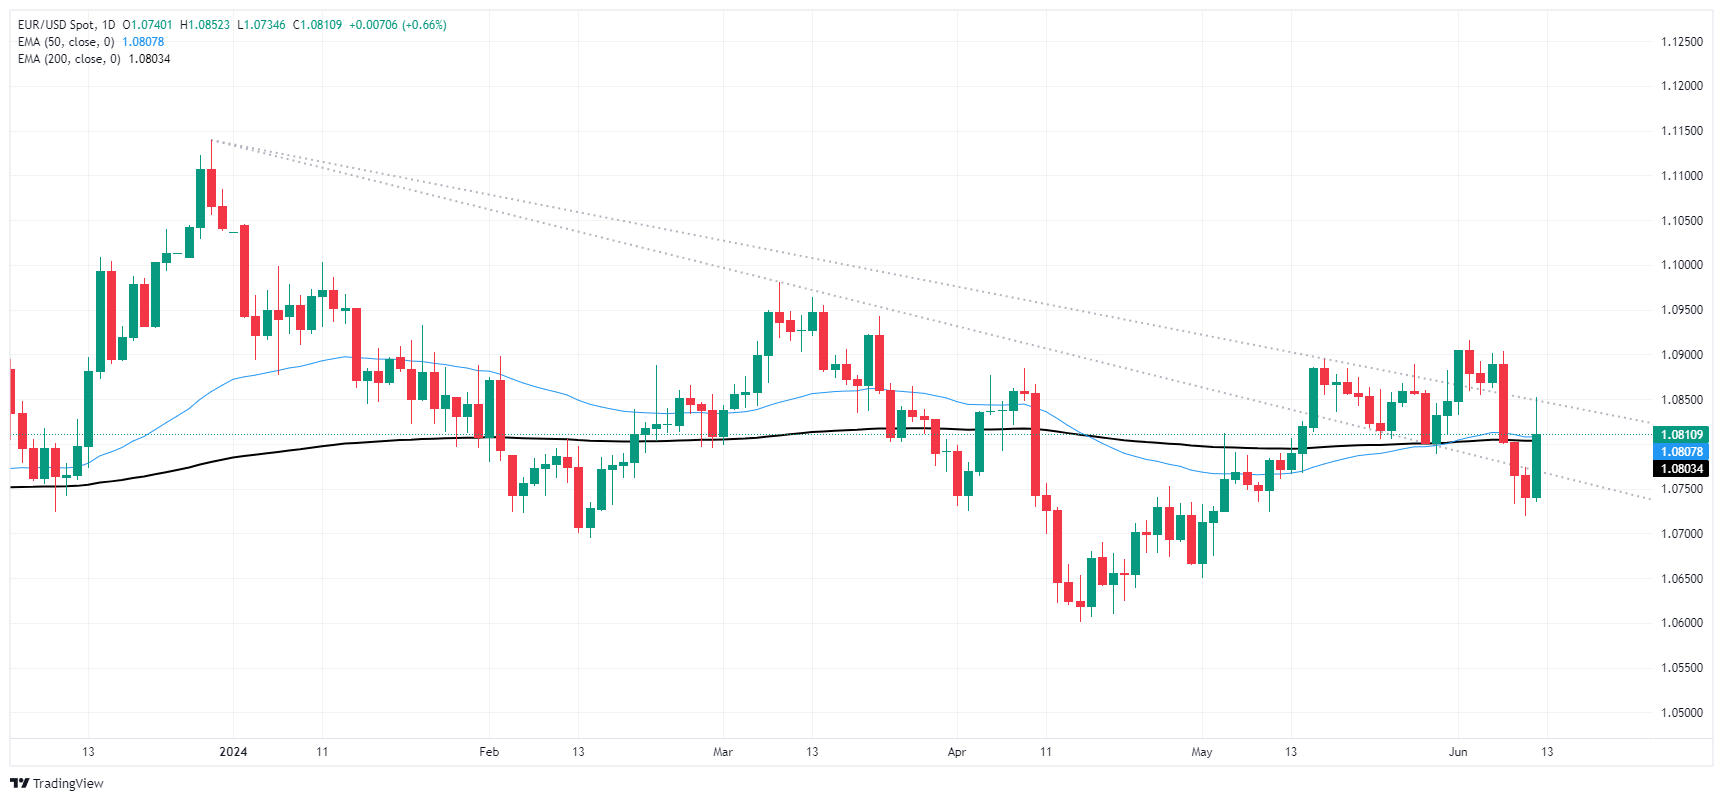
- Silver rises 1.45% as Fed leaves policy unchanged, adjusts inflation outlook, and anticipates one rate cut.
- XAG/USD shows a double-top pattern indicating potential declines; initial support at $29.00.
- Resistance at $30.05; surpassing this could target recent highs, though buyers continue to face challenges.
Silver prices registered solid gains of 1.45% on Wednesday, as the US Federal Reserve kept monetary policy unchanged while upwardly reviewing its inflation expectations and adjusted its estimates for the federal funds rate. As the US central bank projects one rate cut, the XAG/USD trades at $29.59, down 0.29% as Thursday’s Asian session begins.
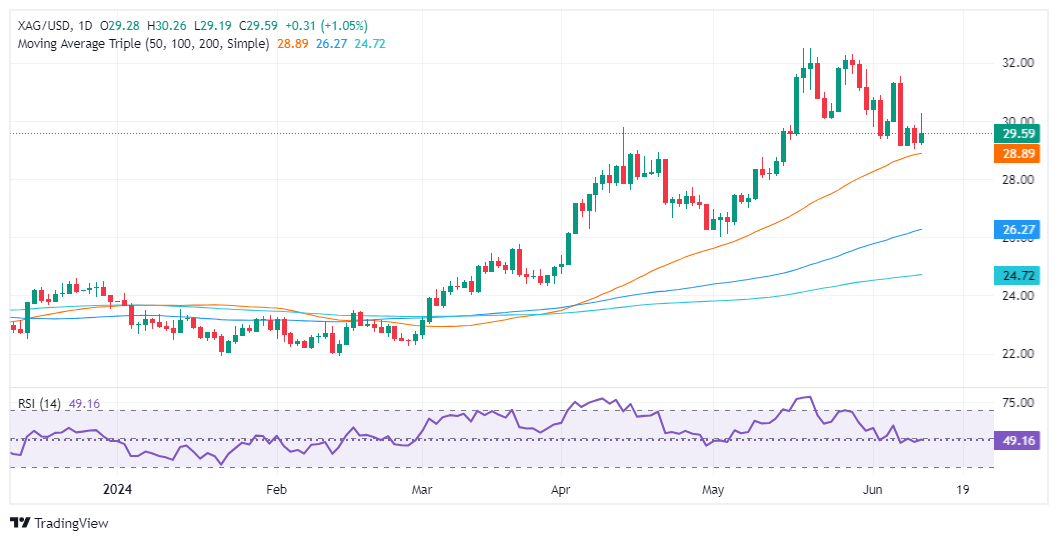
XAG/USD Price Analysis: Technical Outlook
Silver's double-top chart pattern remains in effect, suggesting that the metal's spot prices might decline further. XAG/USD fell below the May 24 low of $30.05, confirming the double-top pattern.
The initial support for XAG/USD is at $29.00, followed by the June 7 low of $29.12. Breaking below this level could lead to a drop under $29.00, then to the May 18, 2021, high turned support of $28.74, and subsequently to the June 10, 2021, high of $28.34. The final target is the double top objective at $27.80.
Conversely, if XAG/USD moves upwards and closes above $29.00, it could challenge the May 24 low, which has turned into resistance at $30.05. Buyers are struggling to reclaim $30.00, indicating potential for further downside.
XAG/USD Price Action – Daily Chart
- Guppy tips into new 16-year high of 200.95 despite soft UK data.
- UK Manufacturing Production tumbled in April, contracted more than expected.
- Yen traders look ahead to Friday’s latest rate call from BoJ.
GBP/JPY found a new 16-year high of 200.95 on Wednesday, with Guppy bidders shrugging off a steep miss in UK manufacturing activity as the Yen continues to weaken across the board.
UK Manufacturing Production saw its sharpest drawdown since 2021, declining -1.4% MoM in April and completely missing the forecast -0.2% contraction from the previous month’s scant 0.3% growth. GBP traders shrugged off the downside print in UK manufacturing activity to bid the Sterling higher against the Yen, clipping into a 16-year peak before slipping back slightly amidst broad-market flows.
Yen markets are pivoting to face the Bank of Japan’s (BoJ) latest rate call and Monetary Policy Statement. The BoJ has left the Yen notoriously unprotected as the Japanese central bank’s hypereasy policy stance leaves the JPY notably weak, with Yen flows floundering as the rate differential between the BoJ and other major global central banks weighs on JPY strength.
GBP/JPY technical outlook
GBP/JPY continues to pin firmly into bullish territory, trading north of the 200-hour Exponential Moving Average (EMA) at 199.73. The pair’s tilt into new highs on Wednesday leaves the pair overextended with few technical resistance points in the way. However, overbought conditions could see a near-term snap back to consolidation levels near 199.50.
GBP/JPY hourly chart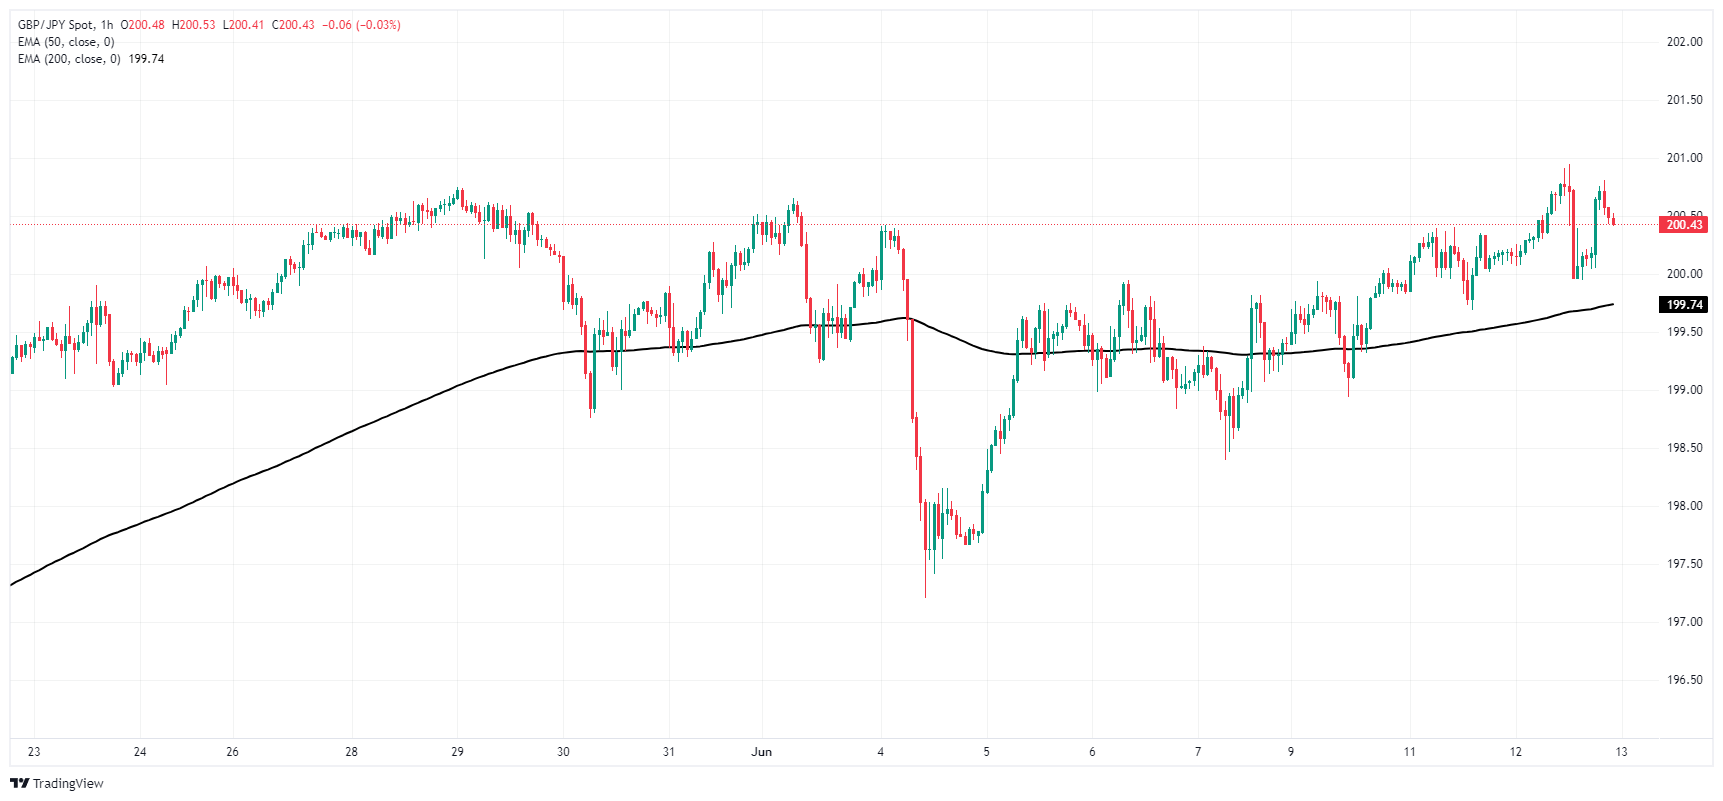
GBP/JPY daily chart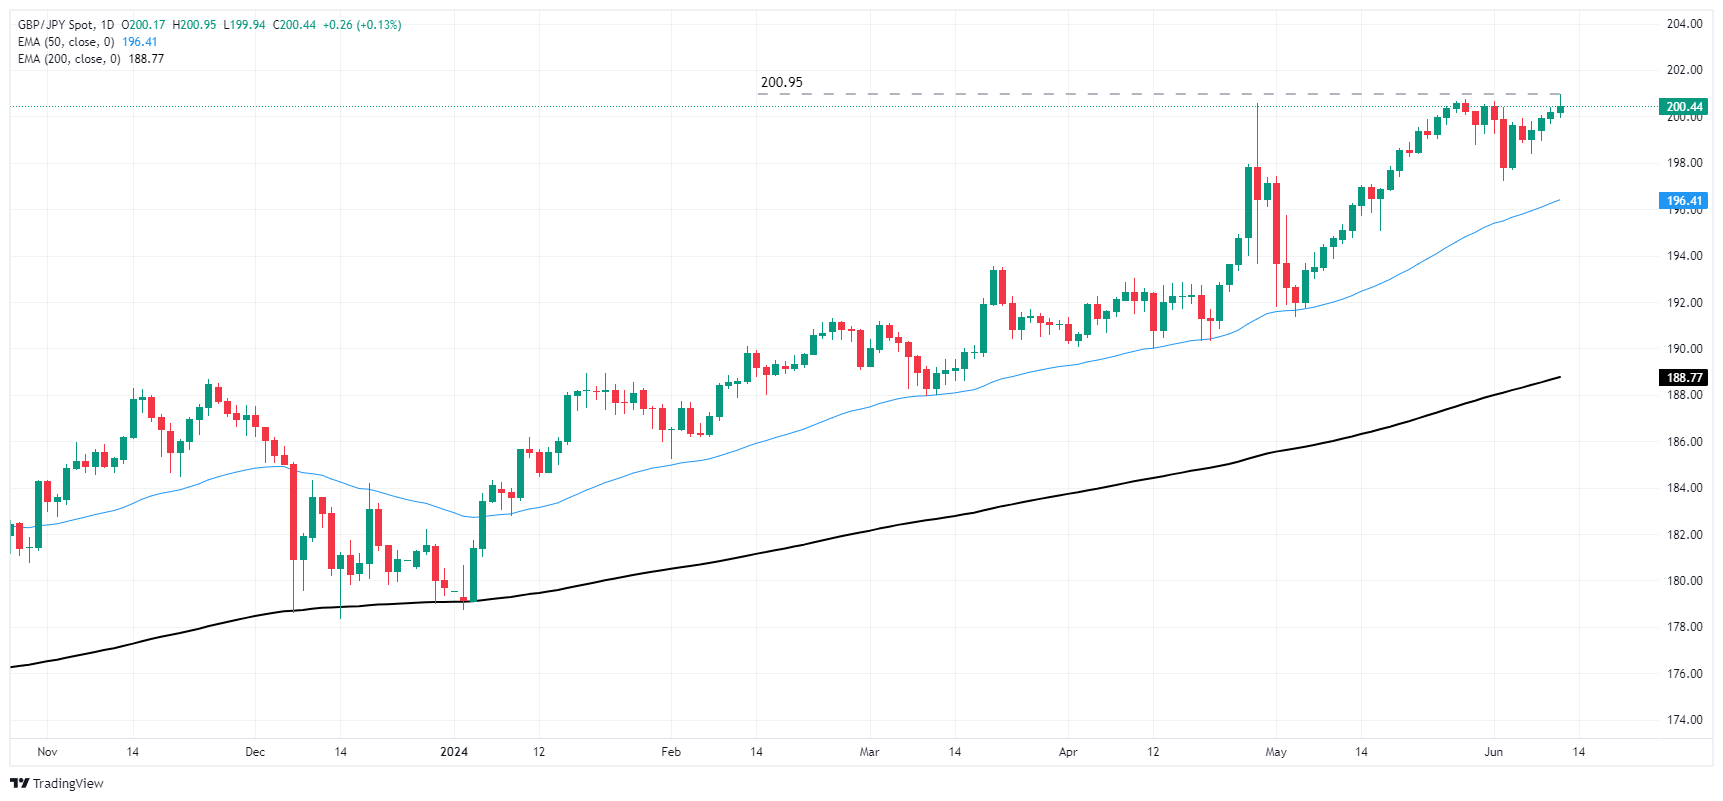
- USD/CHF trades at 0.8944, recovering from daily lows of 0.8893 following the Fed's hawkish stance.
- Fed keeps rates at 5.25%-5.50%, revises federal funds rate projection to 5.1% for end of 2024.
- May’s US inflation data is weaker than April’s, impacting USD as Treasury yields plunge; upcoming PPI and jobless claims data are in focus.
The USD/CHF remains in the red, yet off daily lows of 0.8893 after the US Federal Reserve held rates unchanged and tilted hawkish. Policymakers expected just one rate cut instead of the three foresaw in the Summary of Economic Projections (SEP) in March 2024. Therefore, traders booked profits as the major recovered some ground and exchanged hands at 0.8944, down 0.35%.
Swiss Franc trims some gains after Fed’s adjust interest rate cut expectations
Federal Reserve officials tilted hawkish on their June monetary policy meeting decision via the Summary of Economic Projections (SEP), as they project just one interest rate cut instead of the three foresaw since the December 2023 meeting. They voted unanimously to keep the federal funds rate (FFR) at around 5.25%-5.50% and upward revised their inflation expectations as measured by the Personal Consumption Expenditure (PCE) Price Index.
The SEP showed that Fed officials upward revised their projections of the federal funds rate from 4.6% to 5.1% toward the end of 2024. Regarding Gross Domestic Product (GDP) for 2024, they project a 2.1% increase, as foreseen in March, while the Unemployment Rate is projected at 4%, unchanged from March’s SEP. PCE inflation is expected to rise from 2.4% to 2.6%, and Core PCE is expected to rise from 2.6% to 2.8%.
Earlier, the US Bureau of Labor Statistics (BLS) revealed that May’s inflation in the US was unchanged, but lower than April’s data. This weakened the Greenback due to plunging US Treasury bond yields.
Ahead of the week, the US economic docket will feature May’s Producer Price Index (PPI) and Initial Jobless Claims (IJC) on Thursday.
USD/CHF Price Analysis: Technical outlook
From a daily chart perspective, the USD/CHF dived and tested the 200-day moving average (DMA) at 0.8896 before recovering from its earlier losses. Although the pair aimed higher, it was capped at the 100-DMA at 0.8949, a strong resistance level. If it’s cleared, the pair could rally toward 0.9000 and beyond. On the downside, the first support would be the 200-DMA at 0.8896. Key support levels lie below, like the 0.8800 figure.
- The AUD/JPY pair surpassed the 20-day SMA, indicating a rising bullish momentum.
- Despite the rise, the pair is still in a consolidation phase, hinting at the possibility of limited gains.
- The bull's next target stands at 105.00.
In Wednesday's session, the AUD/JPY pair exhibited a promising move, surpassing the 20-day Simple Moving Average (SMA) at 103.90. This could be a positive sign, demonstrating strength in the Australian Dollar against its competitors. However, the ongoing consolidation phase suggests that there may not be enough momentum for a persistent rise.
The daily Relative Strength Index (RSI) for the AUD/JPY currently stands at 59 suggesting a significant shift from Tuesday’'s 53. On the other hand, the Moving Average Convergence Divergence (MACD) continues to display decreasing red bars, suggesting a potential weakening in the bearish momentum.
AUD/JPY daily chart
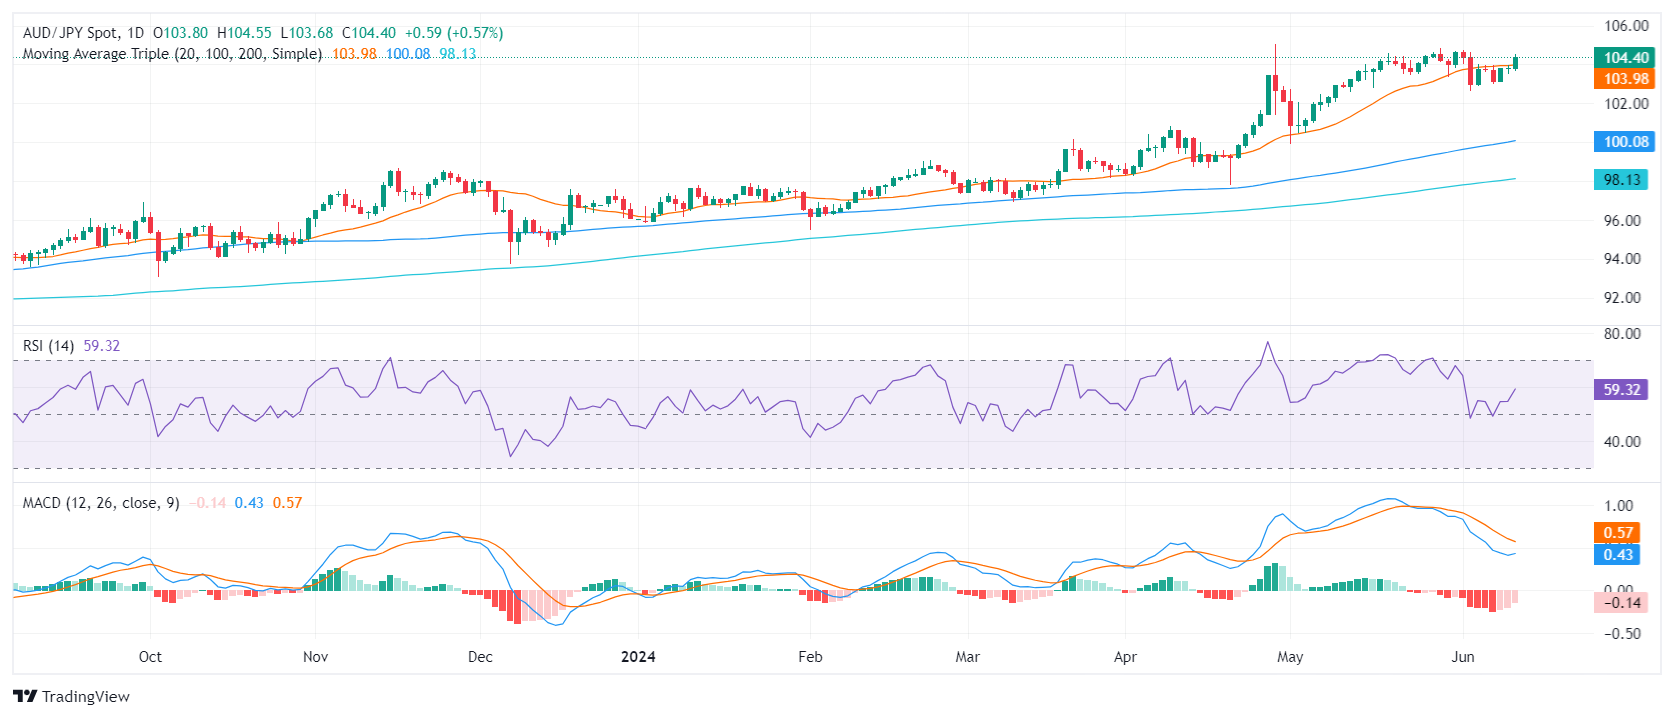
In conclusion, the AUD/JPY pair seems to be in a consolidation phase, despite successfully rising above the 20-day SMA. The range of 102.00-103.00 may denote the next trading patterns unless the bulls retain control above the 20-day SMA. Nonetheless, the reduction in selling momentum could denote a preparation by the bulls for the next upward swing and might retest the 105.00 area.
- The Australian Unemployment Rate is foreseen to contract to 4% in May.
- Employment Change expected to remain tepid, up by 27.5K in the month.
- AUD/USD set to run to fresh multi-month highs with an upbeat report.
Australia is set to release the May employment report on Thursday at 1:30 GMT. The Australian Bureau of Statistics (ABS) is expected to announce the country added 27.5K new job positions in the month, down from the 38.5K gained in April. The Unemployment Rate is foreseen at 4%, easing from the previous 4.1%. Ahead of the announcement, the Australian Dollar (AUD) is up amid broad US Dollar’s weakness.
Headline Employment Change is split into full-time and part-time positions. Generally speaking, full-time jobs imply working 38 hours per week or more and usually include additional benefits, but they mostly represent consistent income. On the other hand, part-time employment generally means higher hourly rates but lacks consistency and benefits. That’s why the economy prefers full-time jobs.
According to the April report, seasonally adjusted, the number of people counted as officially unemployed increased by 30,300 in the month, while the number of employed people increased by 38,500. The latter combines an increase of 44,600 part-time positions and a loss of 6,100 full-time jobs.
Australian unemployment rate expected to ease in May
Market analysts anticipate the Australian Unemployment Rate will ease from the 4.1% posted in April to 4%. April’s level was the highest since March 2022, and was also hit in January this year.
The decline in full-time employment and the uptick in the unemployment rate in April was seen as a tepid sign of a loosening labor market. Speculative interest would welcome another monthly report in such a line as it could lift the odds for an interest rate cut in the country before the year's end.
The Reserve Bank of Australia (RBA) met early in May, and policymakers decided to leave the benchmark rate at 4.35%. The RBA also warned about inflation risks being on the upside but refrained from reinstating the tightening bias dropped in the previous meeting. Policymakers also noted that inflation is easing more slowly than previously expected. “The economic outlook remains uncertain, and recent data have demonstrated that the process of returning inflation to target is unlikely to be smooth,” said the Board’s statement.
Ahead of the employment report, market players believe the RBA could deliver a rate cut in November and four more throughout 2025. However, sticky inflation and a tight labor market may push the odds further down the road. According to the ABS, the Consumer Price Index rose by 3.6% in the twelve months to April, up from the previous 3.5%. It was the second consecutive month in which inflation posted a small increase, in line with policymakers’ concerns.
With that in mind, a better-than-anticipated employment report would fuel speculation the RBA will not cut rates until February 2025 and boost the Australian Dollar.
Ahead of Australian employment figures, the focus was on the United States (US). The Bureau of Labor Statistics (BLS) reported that the Consumer Price Index (CPI) rose 3.3% YoY in May after hitting 3.4% in April. The CPI remained unchanged on a monthly basis, easing from the previous 0.3%. The core readings, which exclude volatile food and energy prices, were also below forecast and eased from the April readings. The annual core CPI rose 3.4%, while the monthly figure was up by 0.2%.
The softer-than-anticipated US inflation figures triggered a US Dollar sell-off, prompting AUD/USD higher.
When will the Australian employment report be released, and how could it affect AUD/USD?
The ABS will publish the May employment report early on Thursday. As previously stated, Australia is expected to have added 27.5K new job positions in the month, while the Unemployment Rate is foreseen at 4%. Finally, the Participation Rate is foreseen to hold at 66.7%.
From a technical perspective, Valeria Bednarik, Chief Analyst at FXStreet, notes: “The AUD/USD pair nears a relevant high posted mid-May at 0.6713 as optimism reigns. Beyond the 0.6700 mark, the pair can run towards the 0.6700 region with an upbeat Australian employment report, although given the pre-news rally, additional advances without a pullback in the middle seem unlikely. Near-term support can be found at around 0.6630, followed by the 0.6580 price zone.”
Bednarik adds: “Ultimately, AUD/USD direction will depend on how the data would affect the odds for a rate cut in Australia. It is worth remembering that the Australian interest rate peaked below those of its major counterparts, making it less worrisome should local policymakers decide to delay the decision.”
Employment FAQs
Labor market conditions are a key element in assessing the health of an economy and thus a key driver for currency valuation. High employment, or low unemployment, has positive implications for consumer spending and economic growth, boosting the value of the local currency. Moreover, a very tight labor market – a situation in which there is a shortage of workers to fill open positions – can also have implications on inflation levels because low labor supply and high demand leads to higher wages.
The pace at which salaries are growing in an economy is key for policymakers. High wage growth means that households have more money to spend, usually leading to price increases in consumer goods. In contrast to more volatile sources of inflation such as energy prices, wage growth is seen as a key component of underlying and persisting inflation as salary increases are unlikely to be undone. Central banks around the world pay close attention to wage growth data when deciding on monetary policy.
The weight that each central bank assigns to labor market conditions depends on its objectives. Some central banks explicitly have mandates related to the labor market beyond controlling inflation levels. The US Federal Reserve (Fed), for example, has the dual mandate of promoting maximum employment and stable prices. Meanwhile, the European Central Bank’s (ECB) sole mandate is to keep inflation under control. Still, and despite whatever mandates they have, labor market conditions are an important factor for policymakers given their significance as a gauge of the health of the economy and their direct relationship to inflation.
Economic Indicator
Unemployment Rate s.a.
The Unemployment Rate, released by the Australian Bureau of Statistics, is the number of unemployed workers divided by the total civilian labor force, expressed as a percentage. If the rate increases, it indicates a lack of expansion within the Australian labor market and a weakness within the Australian economy. A decrease in the figure is seen as bullish for the Australian Dollar (AUD), while an increase is seen as bearish.
Read more.Last release: Thu May 16, 2024 01:30
Frequency: Monthly
Actual: 4.1%
Consensus: 3.9%
Previous: 3.8%
Source: Australian Bureau of Statistics
The Australian Bureau of Statistics (ABS) publishes an overview of trends in the Australian labour market, with unemployment rate a closely watched indicator. It is released about 15 days after the month end and throws light on the overall economic conditions, as it is highly correlated to consumer spending and inflation. Despite the lagging nature of the indicator, it affects the Reserve Bank of Australia’s (RBA) interest rate decisions, in turn, moving the Australian dollar. Upbeat figure tends to be AUD positive.
- Crude Oil markets rose on Wednesday before trimming gains post-Fed.
- WTI peaked near $79.00 per barrel before falling back into the day’s range.
- Odds of two rate cuts in 2024 are evaporating, crimping risk appetite.
West Texas Intermediate (WTI) US Crude Oil rose through Wednesday’s early trading, hitting a fresh June high near $79.00 per barrel before slumping back below $78.00 after the Energy Information Administration (EIA) reported another buildup in US Crude Oil supplies coupled with another Federal Reserve (Fed) rate hold.
Fed Chairman Jerome Powell hit markets with a cautious tone on rate cut expectations, noting that inflation progress still has a lot of progress to make before the Fed will be confident enough to cut rate. The Federal Open Market Committee (FOMC) has trimmed expectations of rate cuts, with the FOMC’s Summary of Economic Projections (SEP) or “dot plot” expecting only a single quarter-point cut in 2024 according to the median projection.
Broader market sentiment tilted firmly into the bullish early Wednesday after US Consumer Price Index (CPI) inflation cooled faster than expected in May, with headline CPI inflation easing to 0.0% MoM compared to the forecast tick down to 0.1% from the previous 0.3%, and YoY Core CPI inflation also eased to 3.4% versus the forecast 3.5% and last of 3.6%. Market hopes for a September rate cut of at least 25 basis points peaked over 70% in the early US trading session before Fed caution swamped out sentiment.
The Energy Information Administration (EIA) reported another unexpected buildup in US Crude Oil Stocks Change for the week ended June 7, adding 3.73 million barrels to the previous week’s 1.233 million, washing out the forecast contraction of -1.55 million.
WTI technical outlook
WTI peaked just shy of $79.00 per barrel on Wednesday before facing a technical rejection from a descending trendline drawn from 2024’s peak bids at $87.12, and near-term strength goes to the bears. However, technical support comes from the 200-hour Exponential Moving Average (EMA) rising into $76.60 and could limit downside momentum.
Wednesday’s bullish peak ran aground of heavy resistance from the 200-day EMA at $78.83, and US Crude Oil’s recovery from near-term lows near $72.45 could face another turn lower.
WTI hourly chart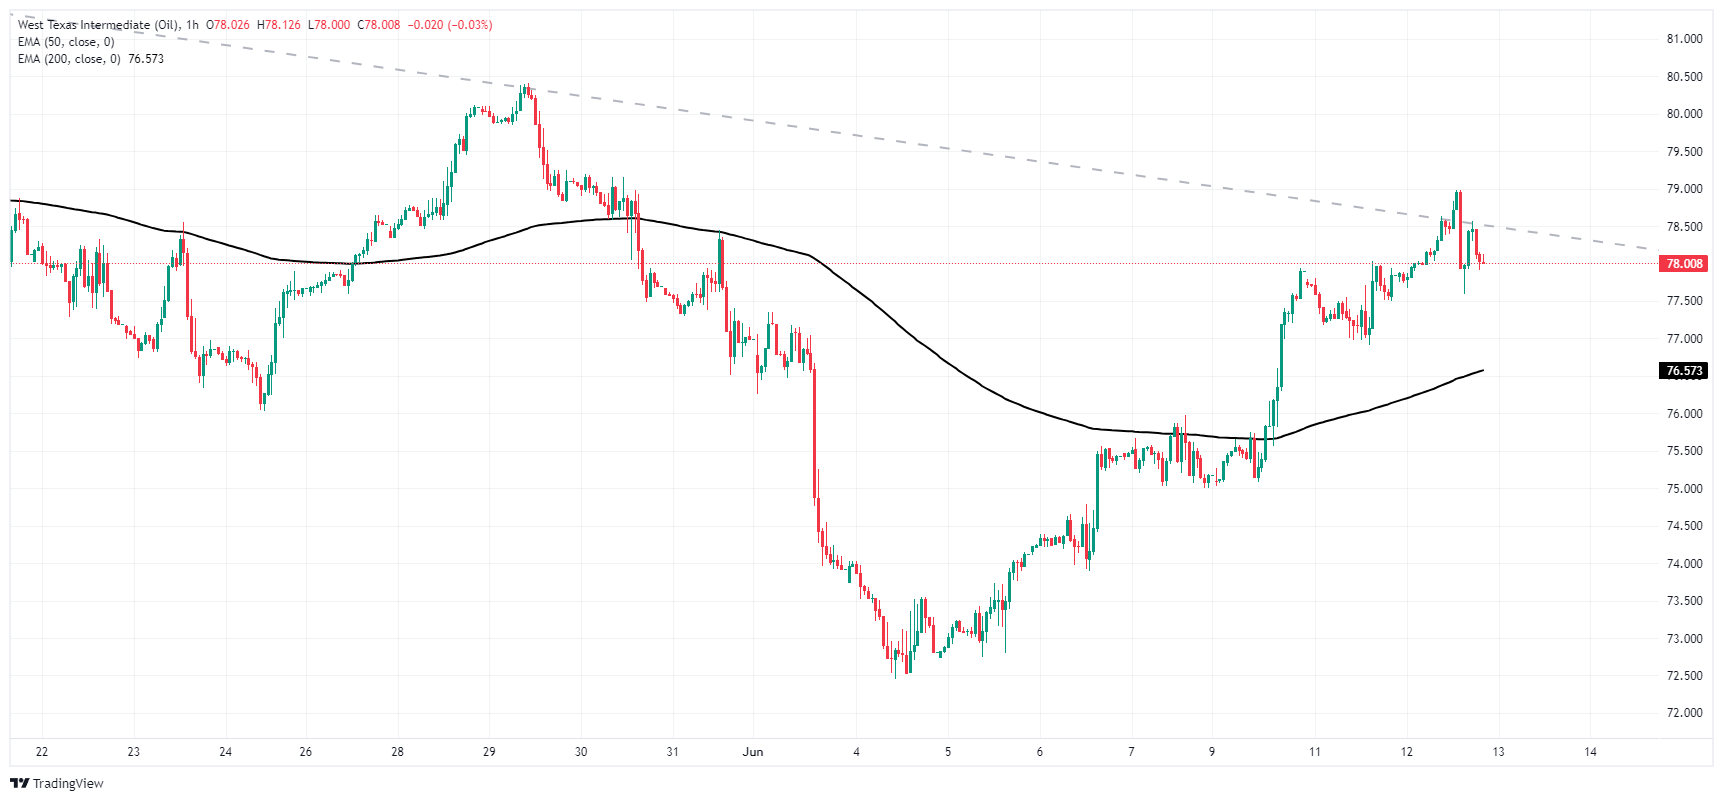
WTI daily chart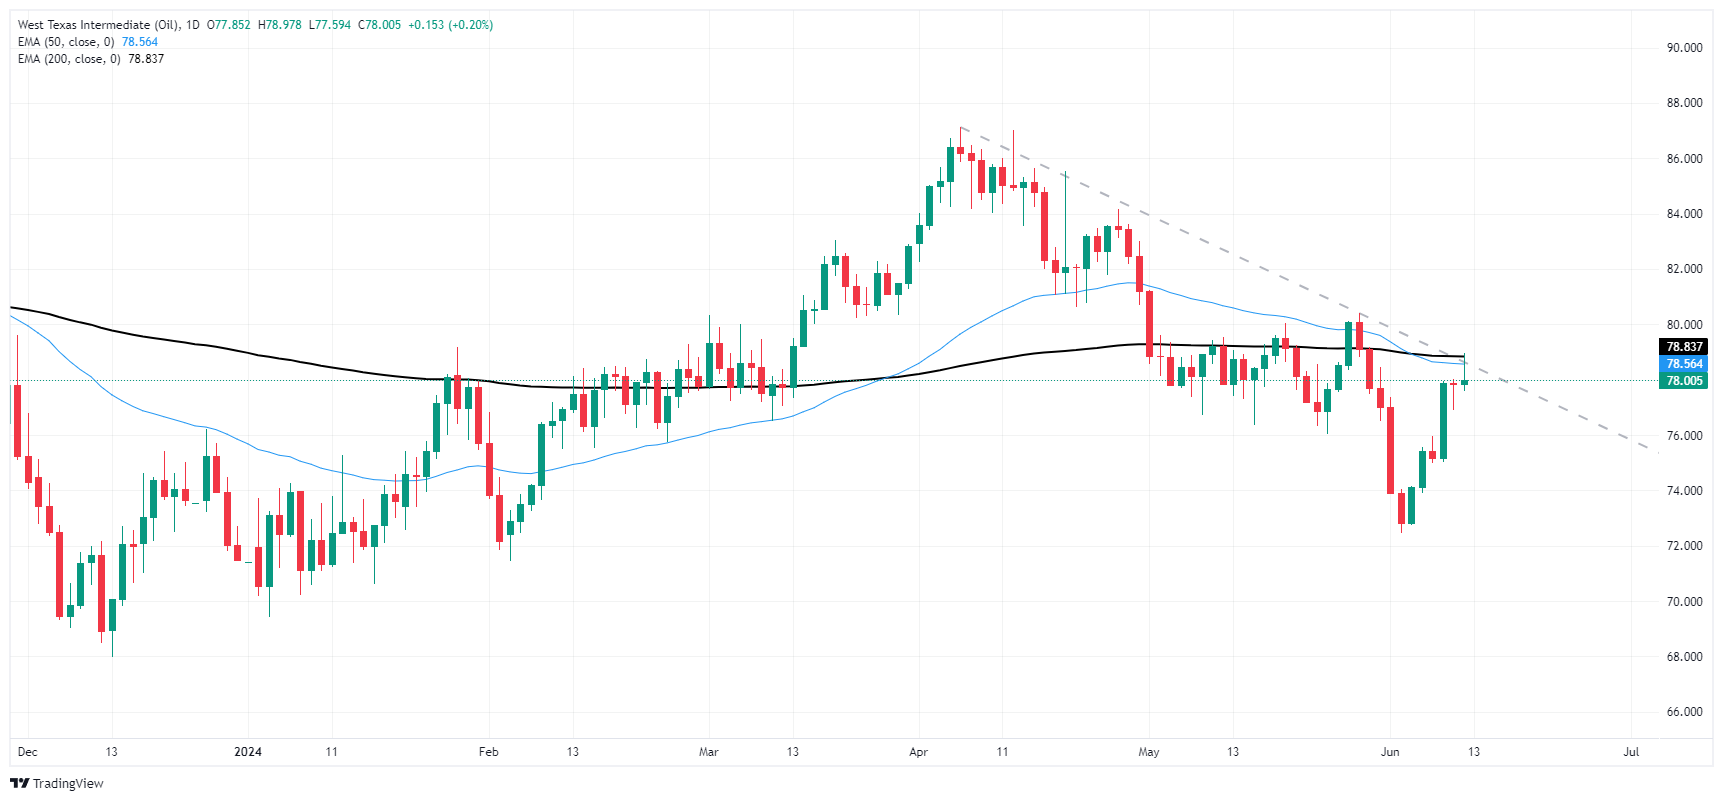
The Greenback sharply reversed its recent positive streak on the back of the negative surprise of US CPI in May, while the hawkish hold by the Federal Reserve helped the USD Index (DXY) regain some composure.
Here is what you need to know on Thursday, June 13:
The USD Index (DXY) revisited the area of three-day lows on the back of declining US yields, lower CPI and after the Fed left rates unchanged, as expected. On June 13, the usual weekly Initial Jobless Claims are due seconded by Producer Prices and the speech by Fed’s Williams.
EUR/USD managed to stage quite a colourful comeback and advanced beyond 1.0800 the figure, although part of those gains fizzled out post-Powell’s press conference. Industrial Production readings in the euro bloc are expected on June 13.
GBP/USD rose to three-month highs well north of 1.2800 following the sharp sell-off in the US Dollar. There are no data releases scheduled for June 13 across the Channel.
USD/JPY reversed three consecutive daily declines, although it bounced off three-day lows near 155.70 as the Greenback trimmed some losses at the end of the day. The Quarterly BSI Large Manufacturing index and weekly Foreign Bond Investment figures will be published on June 13.
AUD/USD briefly retested the area just beyond the 0.6700 barrier against the backdrop of a strong pick-up in the selling bias in the US Dollar. The release of the Australian labour market report takes centre stage on June 13 seconded by Westpac’s Consumer Confidence print.
Prices of WTI advanced marginally as traders assessed the Fed’s interest rate decision and another negative weekly report of US crude oil inventories.
Gold prices ended Wednesday’s session marginally on the defensive after it could not sustain a post-Fed move above $2,340 region. Silver charted small gains but it came under pressure soon after hitting the $30.00 mark per ounce.
Federal Reserve Chairman Jerome Powell explains the decision to leave the policy rate, federal funds rate, unchanged at the range of 5.25%-5.5% and responds to questions in the post-meeting press conference.
Key quotes
"We will look at totality of data on labor, economic growth and inflation to begin rate cuts."
"I am not at a point of giving dates for rate cuts."
"We are well aware of the two-sided risks we face."
"We understand risks of waiting too long, or moving too quickly."
"We are trying to manage those risks."
"We don't think it will be appropriate to loosen policy until we are more confident on inflation."
"I think our current approach is the right way to think about it."
"It is not our plan to wait for things to break and then try to fix them."
"Our plan is not to wait for things to break and then try to fix it."
Fed FAQs
Monetary policy in the US is shaped by the Federal Reserve (Fed). The Fed has two mandates: to achieve price stability and foster full employment. Its primary tool to achieve these goals is by adjusting interest rates. When prices are rising too quickly and inflation is above the Fed’s 2% target, it raises interest rates, increasing borrowing costs throughout the economy. This results in a stronger US Dollar (USD) as it makes the US a more attractive place for international investors to park their money. When inflation falls below 2% or the Unemployment Rate is too high, the Fed may lower interest rates to encourage borrowing, which weighs on the Greenback.
The Federal Reserve (Fed) holds eight policy meetings a year, where the Federal Open Market Committee (FOMC) assesses economic conditions and makes monetary policy decisions. The FOMC is attended by twelve Fed officials – the seven members of the Board of Governors, the president of the Federal Reserve Bank of New York, and four of the remaining eleven regional Reserve Bank presidents, who serve one-year terms on a rotating basis.
In extreme situations, the Federal Reserve may resort to a policy named Quantitative Easing (QE). QE is the process by which the Fed substantially increases the flow of credit in a stuck financial system. It is a non-standard policy measure used during crises or when inflation is extremely low. It was the Fed’s weapon of choice during the Great Financial Crisis in 2008. It involves the Fed printing more Dollars and using them to buy high grade bonds from financial institutions. QE usually weakens the US Dollar.
Quantitative tightening (QT) is the reverse process of QE, whereby the Federal Reserve stops buying bonds from financial institutions and does not reinvest the principal from the bonds it holds maturing, to purchase new bonds. It is usually positive for the value of the US Dollar.
Federal Reserve Chairman Jerome Powell explains the decision to leave the policy rate, federal funds rate, unchanged at the range of 5.25%-5.5% and responds to questions in the post-meeting press conference.
Key quotes
"Readings like today's CPI is a step in the right direction."
"But one reading is just one reading, don't want to be too motivated by that."
"We are doing everything we can to bring inflation back down under control."
"We in the phase of sticking with it until we get it done."
"We are encouraged that we are still seeing solid economic growth."
"Today's inflation report is also encouraging, but comes after several that were not so encouraging."
"It may take several years for the bulge in rent prices to work it's way through to lower housing inflation."
"Household sector is still in pretty good shape, just not as good as a year ago."
"We do see increasing financial pressures on more lower income people."
"Best thing we can do is foster a strong jobs economy."
"If we see unemployment more than we forecast, we would view that as unexpected weakening."
"Of course we can't wait for that to happen, and that's why we always look at balance of risks."
"A decision to loosen policy could have several reasons associated with it."
"If we saw troubling weakening in labor market, that is something we would consider responding to."
Fed FAQs
Monetary policy in the US is shaped by the Federal Reserve (Fed). The Fed has two mandates: to achieve price stability and foster full employment. Its primary tool to achieve these goals is by adjusting interest rates. When prices are rising too quickly and inflation is above the Fed’s 2% target, it raises interest rates, increasing borrowing costs throughout the economy. This results in a stronger US Dollar (USD) as it makes the US a more attractive place for international investors to park their money. When inflation falls below 2% or the Unemployment Rate is too high, the Fed may lower interest rates to encourage borrowing, which weighs on the Greenback.
The Federal Reserve (Fed) holds eight policy meetings a year, where the Federal Open Market Committee (FOMC) assesses economic conditions and makes monetary policy decisions. The FOMC is attended by twelve Fed officials – the seven members of the Board of Governors, the president of the Federal Reserve Bank of New York, and four of the remaining eleven regional Reserve Bank presidents, who serve one-year terms on a rotating basis.
In extreme situations, the Federal Reserve may resort to a policy named Quantitative Easing (QE). QE is the process by which the Fed substantially increases the flow of credit in a stuck financial system. It is a non-standard policy measure used during crises or when inflation is extremely low. It was the Fed’s weapon of choice during the Great Financial Crisis in 2008. It involves the Fed printing more Dollars and using them to buy high grade bonds from financial institutions. QE usually weakens the US Dollar.
Quantitative tightening (QT) is the reverse process of QE, whereby the Federal Reserve stops buying bonds from financial institutions and does not reinvest the principal from the bonds it holds maturing, to purchase new bonds. It is usually positive for the value of the US Dollar.
Federal Reserve Chairman Jerome Powell explains the decision to leave the policy rate, federal funds rate, unchanged at the range of 5.25%-5.5% and responds to questions in the post-meeting press conference.
Key quotes
"Improvement in inflation has been coming from unwinding of pandemic distortions, complemented by monetary policy."
"Inflation is also improving because of positive supply shock."
"These inflation dynamics can continue."
"We don't know if we are down to demand determining inflation."
"We are getting good results in bringing down inflation with gradual cooling of economy so far."
"Housing situation is complicated."
"Ultimately, best thing we can do for housing market is bring inflation down."
"Banking system has been solid, strong, well-capitalized."
"Wages still running above a sustainable path."
"Wages not principle cause of inflation, but needs them to come down for overall inflation to get back to 2%."
Inflation FAQs
Inflation measures the rise in the price of a representative basket of goods and services. Headline inflation is usually expressed as a percentage change on a month-on-month (MoM) and year-on-year (YoY) basis. Core inflation excludes more volatile elements such as food and fuel which can fluctuate because of geopolitical and seasonal factors. Core inflation is the figure economists focus on and is the level targeted by central banks, which are mandated to keep inflation at a manageable level, usually around 2%.
The Consumer Price Index (CPI) measures the change in prices of a basket of goods and services over a period of time. It is usually expressed as a percentage change on a month-on-month (MoM) and year-on-year (YoY) basis. Core CPI is the figure targeted by central banks as it excludes volatile food and fuel inputs. When Core CPI rises above 2% it usually results in higher interest rates and vice versa when it falls below 2%. Since higher interest rates are positive for a currency, higher inflation usually results in a stronger currency. The opposite is true when inflation falls.
Although it may seem counter-intuitive, high inflation in a country pushes up the value of its currency and vice versa for lower inflation. This is because the central bank will normally raise interest rates to combat the higher inflation, which attract more global capital inflows from investors looking for a lucrative place to park their money.
Formerly, Gold was the asset investors turned to in times of high inflation because it preserved its value, and whilst investors will often still buy Gold for its safe-haven properties in times of extreme market turmoil, this is not the case most of the time. This is because when inflation is high, central banks will put up interest rates to combat it. Higher interest rates are negative for Gold because they increase the opportunity-cost of holding Gold vis-a-vis an interest-bearing asset or placing the money in a cash deposit account. On the flipside, lower inflation tends to be positive for Gold as it brings interest rates down, making the bright metal a more viable investment alternative.
Federal Reserve Chairman Jerome Powell explains the decision to leave the policy rate, federal funds rate, unchanged at the range of 5.25%-5.5% and responds to questions in the post-meeting press conference.
Key quotes
"I like to look at 3 and 6 month series on payrolls report given differences in establishment and household survey."
"Overall picture is one of strong and gradually cooling labor market."
"It has given us an ambiguous result, but fact remains labor market is strong."
"No longer the super heated labor market of a few years ago."
"The big thing that change rate path forecasts was inflation."
"We had a pause in progress in inflation in first quarter, the takeaway was that it will take longer to get to rate cuts."
"We have to let the data light the way."
"Today was a better inflation report than almost anyone expected."
"Long-run neutral rate of interest is theoretical."
"People are coming to the view that rates are less likely to go back down to pre-pandemic levels."
"We are making policy with the economy we have and distortions we have."
"Policy is restrictive."
"The question of whether it's restrictive enough will be answered over time."
"Evidence is pretty clear though that policy is currently restrictive and having impact we hoped for."
"We are prepared to adjust policy as appropriate."
Fed FAQs
Monetary policy in the US is shaped by the Federal Reserve (Fed). The Fed has two mandates: to achieve price stability and foster full employment. Its primary tool to achieve these goals is by adjusting interest rates. When prices are rising too quickly and inflation is above the Fed’s 2% target, it raises interest rates, increasing borrowing costs throughout the economy. This results in a stronger US Dollar (USD) as it makes the US a more attractive place for international investors to park their money. When inflation falls below 2% or the Unemployment Rate is too high, the Fed may lower interest rates to encourage borrowing, which weighs on the Greenback.
The Federal Reserve (Fed) holds eight policy meetings a year, where the Federal Open Market Committee (FOMC) assesses economic conditions and makes monetary policy decisions. The FOMC is attended by twelve Fed officials – the seven members of the Board of Governors, the president of the Federal Reserve Bank of New York, and four of the remaining eleven regional Reserve Bank presidents, who serve one-year terms on a rotating basis.
In extreme situations, the Federal Reserve may resort to a policy named Quantitative Easing (QE). QE is the process by which the Fed substantially increases the flow of credit in a stuck financial system. It is a non-standard policy measure used during crises or when inflation is extremely low. It was the Fed’s weapon of choice during the Great Financial Crisis in 2008. It involves the Fed printing more Dollars and using them to buy high grade bonds from financial institutions. QE usually weakens the US Dollar.
Quantitative tightening (QT) is the reverse process of QE, whereby the Federal Reserve stops buying bonds from financial institutions and does not reinvest the principal from the bonds it holds maturing, to purchase new bonds. It is usually positive for the value of the US Dollar.
Federal Reserve Chairman Jerome Powell explains the decision to leave the policy rate, federal funds rate, unchanged at the range of 5.25%-5.5% and responds to questions in the post-meeting press conference.
Key quotes
"We need further confidence, more good inflation readings but won't be specific about how many to start rate cuts."
"We'll also be looking at balance of risks, outlook as well."
"Unexpected weakness in labor market could also call for a response."
"We will be monitoring labor market for signs of weakness, but not seeing that right now."
"We don't see ourselves as having the confidence that would warrant policy loosening at this time."
"FOMC participants were allowed to update their forecasts to incorporate CPI data today if they wanted to."
"We still have low unemployment, but has softened a bit and that's an important statistic."
"Argument that job gains may be a bit overstated, but still strong."
"We are seeing gradual cooling in labor market as it moves into better balance."
US Dollar FAQs
The US Dollar (USD) is the official currency of the United States of America, and the ‘de facto’ currency of a significant number of other countries where it is found in circulation alongside local notes. It is the most heavily traded currency in the world, accounting for over 88% of all global foreign exchange turnover, or an average of $6.6 trillion in transactions per day, according to data from 2022. Following the second world war, the USD took over from the British Pound as the world’s reserve currency. For most of its history, the US Dollar was backed by Gold, until the Bretton Woods Agreement in 1971 when the Gold Standard went away.
The most important single factor impacting on the value of the US Dollar is monetary policy, which is shaped by the Federal Reserve (Fed). The Fed has two mandates: to achieve price stability (control inflation) and foster full employment. Its primary tool to achieve these two goals is by adjusting interest rates. When prices are rising too quickly and inflation is above the Fed’s 2% target, the Fed will raise rates, which helps the USD value. When inflation falls below 2% or the Unemployment Rate is too high, the Fed may lower interest rates, which weighs on the Greenback.
In extreme situations, the Federal Reserve can also print more Dollars and enact quantitative easing (QE). QE is the process by which the Fed substantially increases the flow of credit in a stuck financial system. It is a non-standard policy measure used when credit has dried up because banks will not lend to each other (out of the fear of counterparty default). It is a last resort when simply lowering interest rates is unlikely to achieve the necessary result. It was the Fed’s weapon of choice to combat the credit crunch that occurred during the Great Financial Crisis in 2008. It involves the Fed printing more Dollars and using them to buy US government bonds predominantly from financial institutions. QE usually leads to a weaker US Dollar.
Quantitative tightening (QT) is the reverse process whereby the Federal Reserve stops buying bonds from financial institutions and does not reinvest the principal from the bonds it holds maturing in new purchases. It is usually positive for the US Dollar.
Federal Reserve Chairman Jerome Powell explains the decision to leave the policy rate, federal funds rate, unchanged at the range of 5.25%-5.5% and responds to questions in the post-meeting press conference.
Key quotes
"The Summary of Economic Projections are not a plan or any kind of decision."
"Assessment of policy will adjust."
"If the economy remains solid and inflation persists, will keep rates where they are for as long as needed."
"The opposite is also true in terms of rate cuts."
"Policy is well-positioned, will continue to make decisions meeting by meeting."
"We are practicing a slight element of conservatism on our inflation outlook."
"We don't have high confidence in forecasts."
"We welcome today's inflation reading, hope for more like that."
"We need more confidence on inflation moving back down to 2%."
"The test for cutting rates is more confidence that inflation is moving toward 2%."
"We have a fairly conservative forecast on inflation, if we get better readings, I think we will see forecasts come down."
"We all agree that we are data dependent."
"No one on the Committee has a strong commitment to a rate forecast."
"We have no commitment to a particular rate cut."
"Policymakers are not trying to send a strong signal with forecasts."
Dot Plot FAQs
The “Dot Plot” is the popular name of the interest-rate projections by the Federal Open Market Committee (FOMC) of the US Federal Reserve (Fed), which implements monetary policy. These are published in the Summary of Economic Projections, a report in which FOMC members also release their individual projections on economic growth, the unemployment rate and inflation for the current year and the next few ones. The document consists of a chart plotting interest-rate projections, with each FOMC member’s forecast represented by a dot. The Fed also adds a table summarizing the range of forecasts and the median for each indicator. This makes it easier for market participants to see how policymakers expect the US economy to perform in the near, medium and long term.
The US Federal Reserve publishes the “Dot Plot” once every other meeting, or in four of the eight yearly scheduled meetings. The Summary of Economic Projections report is published along with the monetary policy decision.
The “Dot Plot” gives a comprehensive insight into the expectations from Federal Reserve (Fed) policymakers. As projections reflect each official’s projection for interest rates at the end of each year, it is considered a key forward-looking indicator. By looking at the “Dot Plot” and comparing the data to current interest-rate levels, market participants can see where policymakers expect rates to head to and the overall direction of monetary policy. As projections are released quarterly, the “Dot Plot” is widely used as a guide to figure out the terminal rate and the possible timing of a policy pivot.
The most market-moving data in the “Dot Plot” is the projection of the federal funds rate. Any change compared with previous projections is likely to influence the US Dollar (USD) valuation. Generally, if the “Dot Plot” shows that policymakers expect higher interest rates in the near term, this tends to be bullish for USD. Likewise, if projections point to lower rates ahead, the USD is likely to weaken.
Federal Reserve Chairman Jerome Powell explains the decision to leave the policy rate, federal funds rate, unchanged at the range of 5.25%-5.5% and responds to questions in the post-meeting press conference.
Key quotes
"Our economy has made considerable progress."
"Continued strong job gains in the economy."
"Inflation has eased substantially but it's still too high."
"We are maintaining a restrictive stance to keep demand in line with supply."
"Recent indicators suggest economic growth still expanding at solid pace."
"Private domestic final purchases, a clearer signal, is still strong."
"Consumer spending remains solid."
"Investment in equipment has picked up from an anemic pace."
"Labor market coming into better balance."
"April and May jobs pace still strong, unemployment rate remains low."
"A broad set of indicators suggest the labor market back to where it was on the eve of the pandemic."
"Overall broad set of indicators in the labor market show it is relatively tight but not overheated."
"We expect labor market strength to continue."
"More recent readings on inflation have shown easing."
"So far this year, we have not got greater confidence on inflation in order to cut."
"Will need to see more good data to bolster confidence on inflation."
Fed FAQs
Monetary policy in the US is shaped by the Federal Reserve (Fed). The Fed has two mandates: to achieve price stability and foster full employment. Its primary tool to achieve these goals is by adjusting interest rates. When prices are rising too quickly and inflation is above the Fed’s 2% target, it raises interest rates, increasing borrowing costs throughout the economy. This results in a stronger US Dollar (USD) as it makes the US a more attractive place for international investors to park their money. When inflation falls below 2% or the Unemployment Rate is too high, the Fed may lower interest rates to encourage borrowing, which weighs on the Greenback.
The Federal Reserve (Fed) holds eight policy meetings a year, where the Federal Open Market Committee (FOMC) assesses economic conditions and makes monetary policy decisions. The FOMC is attended by twelve Fed officials – the seven members of the Board of Governors, the president of the Federal Reserve Bank of New York, and four of the remaining eleven regional Reserve Bank presidents, who serve one-year terms on a rotating basis.
In extreme situations, the Federal Reserve may resort to a policy named Quantitative Easing (QE). QE is the process by which the Fed substantially increases the flow of credit in a stuck financial system. It is a non-standard policy measure used during crises or when inflation is extremely low. It was the Fed’s weapon of choice during the Great Financial Crisis in 2008. It involves the Fed printing more Dollars and using them to buy high grade bonds from financial institutions. QE usually weakens the US Dollar.
Quantitative tightening (QT) is the reverse process of QE, whereby the Federal Reserve stops buying bonds from financial institutions and does not reinvest the principal from the bonds it holds maturing, to purchase new bonds. It is usually positive for the value of the US Dollar.
- Fed maintains interest rates; projects higher rates through 2024 with a federal funds rate adjustment to 5.10%.
- Cooler US inflation report pressures the Greenback, leading to a decline in USD/JPY.
- Fed's economic outlook: Stable growth at 2.1%, steady unemployment at 4%, with minor hikes in PCE and Core PCE inflation rates.
The USD/JPY retreated on Wednesday after the Federal Reserve's decision to keep interest rates unchanged while tilting slightly hawkish as Fed officials upward revised the federal fund's rates. However, a cooler-than-expected US inflation report weighed on the Greenback ahead of Fed Chair Jerome Powell's presser. The major trades at 156.26, down 0.55%.
USD/JPY drops 0.55% amid Fed's hawkish hold, cooler US inflation report
The Federal Reserve’s monetary policy statement highlighted that Fed officials do "not expect it will be appropriate to reduce the target range until it has gained greater confidence that inflation is moving sustainably toward 2 percent." They also stated that "the Committee would be prepared to adjust the stance of monetary policy as appropriate if risks emerge that could impede the attainment of the Committee’s goals."
Meanwhile, the Summary of Economic Projections (SEP) revealed that policymakers tilted slightly hawkish, as the median foresees the federal funds rate to end at 5.10% in 2024, up from 4.60% in March’s projections. The economy is expected to grow 2.1%, consistent with their March forecast, while the unemployment rate is projected to remain at 4%, unchanged from the previous SEP. PCE inflation is expected to rise slightly from 2.4% to 2.6%, and Core PCE inflation is projected to increase from 2.6% to 2.8%.
USD/JPY Reaction to Fed’s Decision - Hourly Chart
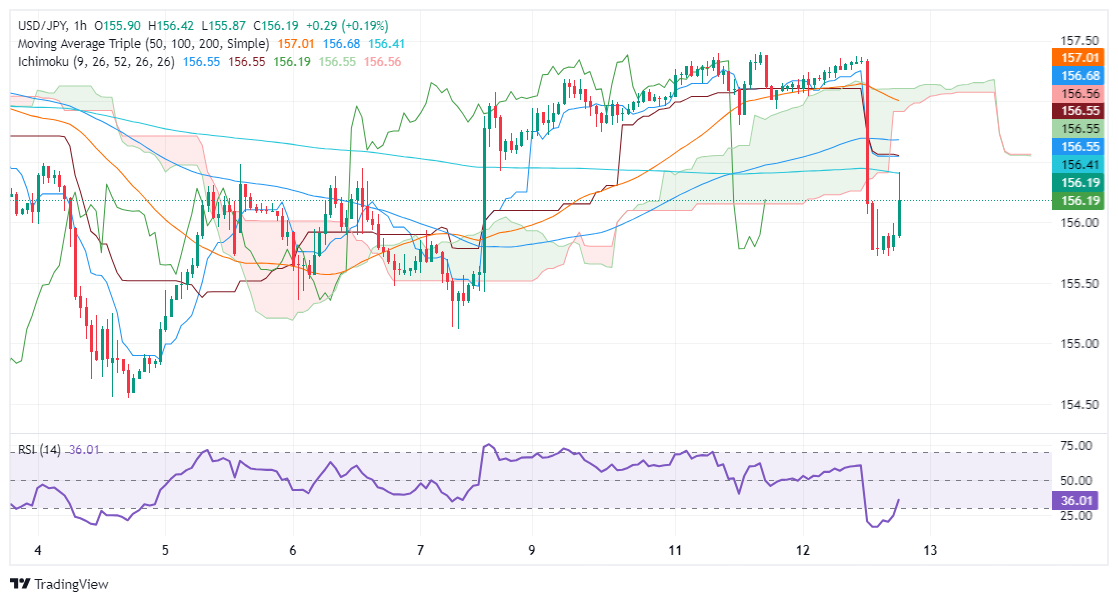
The USD/JPY bounced off daily lows at around 155.80 and edged above the 156.00 figure, but it was capped by the 100-Simple Moving Average (SMA) at 156.55. For buyers to extend its gains, they must clear the 100-SMA, and test the bottom of the Ichimoku Cloud at around 156.80/95. Further gains are seen above 157.00.
- Fed holds rates steady at 5.25%-5.50% as expected.
- Dot plot indicates that most FOMC members are seeing fewer rate cuts this year.
- As an initial reaction, the USD recovered and the pair cleared some of its daily losses.
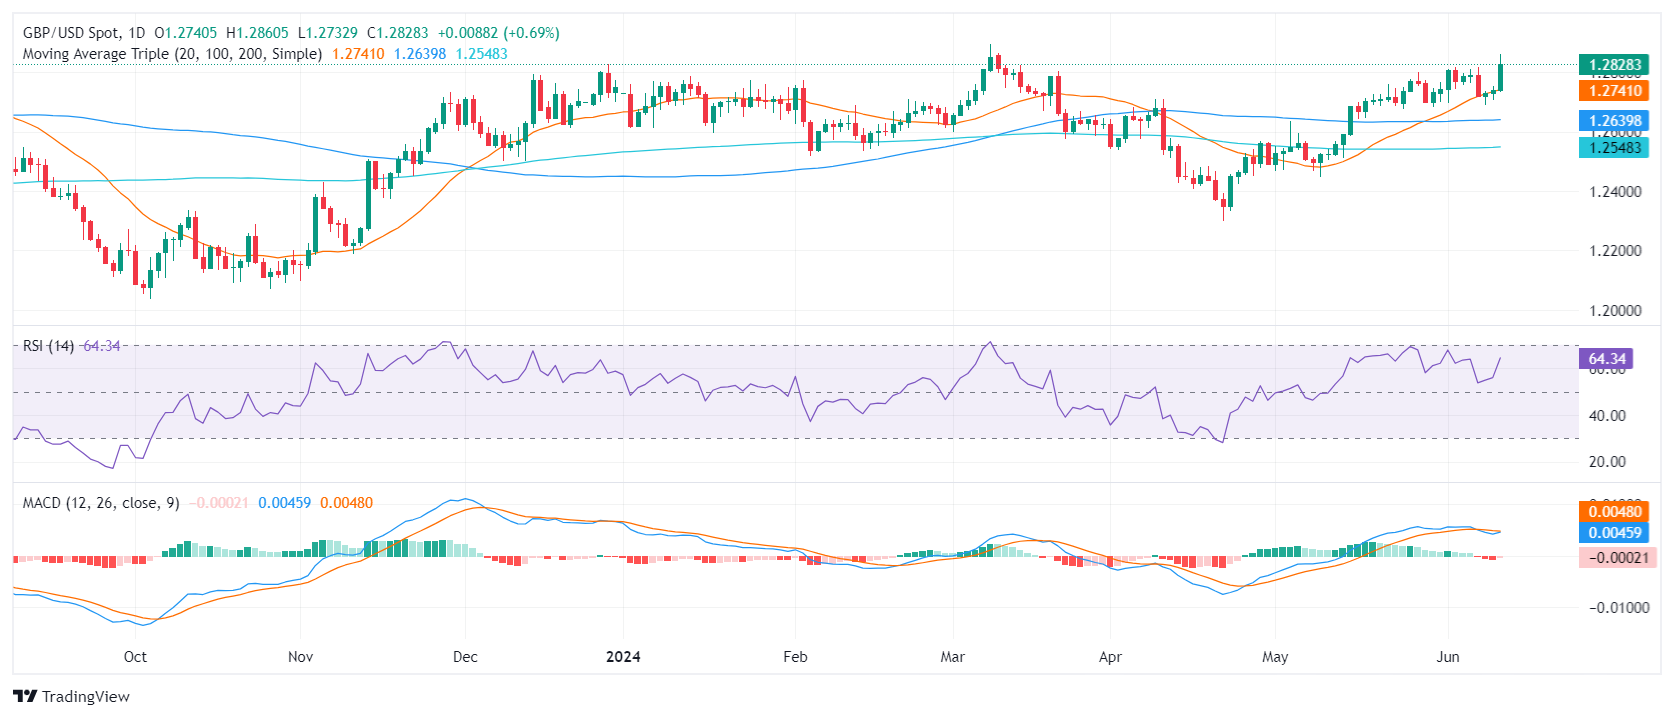
On Wednesday, the GBP/USD cleared some of its gains following the Federal Reserve (Fed) decision to hold rates steady at 5.25%-5.50% and stands at 1.2830. What strengthened the USD is that the dot plot suggested that the members are seeing two instead of three rate cuts in 2024.
Regarding economic protections, the bank revised its Personal Consumption Expenditures (PCE) forecasts to 2.4% YoY from 2.6% YoY, while growth protections remain unchanged. The interest protections, via the so-called dot plot, showed an upward revision of the interest rates by the end of 2024 now at 5.1%, up from 4.6%, and for the 2025 at 4.1%, up from 3.9%. The projection for 2026 stood at 3.1%, and the longer-run rate has been revised to 2.8% from 2.6%.
As a reaction, the USD recovered some ground following the soft Consumer Price Index (CPI) figures from May, which triggered a sharp decline in US Treasury bond yields earlier in the session. The US 2, 5 and 10-year rates cleared some losses but are still down by more than 2%.
GBP/USD technical analysis
Indicators on the daily chart significantly recovered and remain deep in positive terrain. The Relative Strength Index (RSI) moved toward 60, while the Moving Average Convergence Divergence (MACD) prints decreasing red bars, indicating a decreasing selling pressure. The overall outlook remains positive as the pair rides above the 20, 100 and 200-day Simple Moving Averages (SMA).
- Gold trades at $2,335 as lower-than-expected US inflation boosts rate cut speculation, but Fed holds rates steady.
- Fed’s statement highlights a cautious approach to rate cuts, with inflation projections for 2024 edging higher.
- US 10-year Treasury yield drops 14 basis points to 4.266%, while DXY falls 0.83% to 104.38, supporting gold prices.
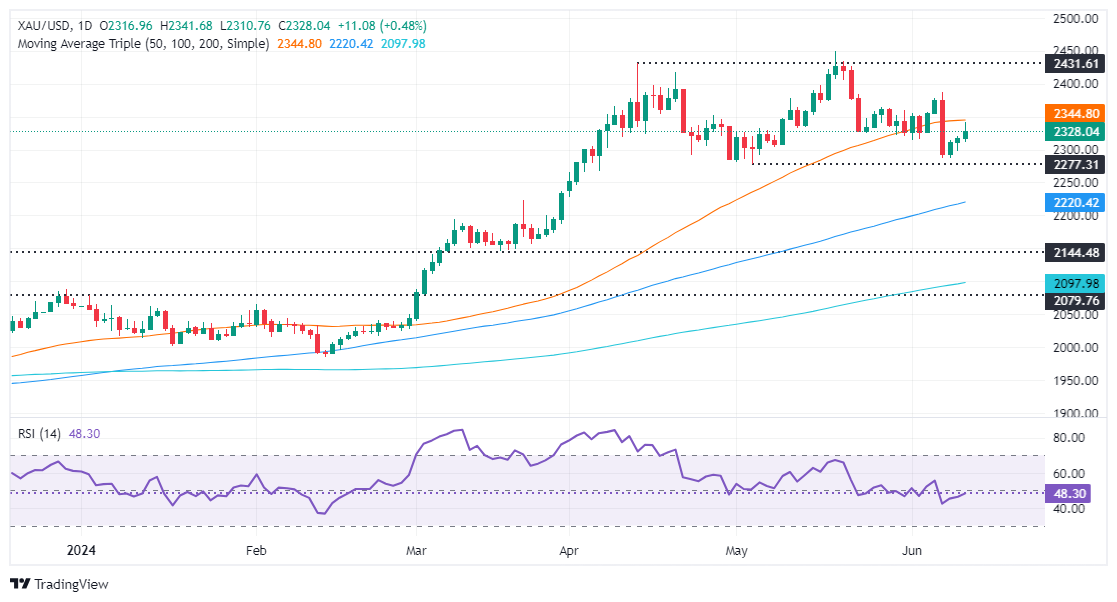
Gold prices climbed on Wednesday following a lower-than-expected inflation report in the United States (US), which increased the odds of a Federal Reserve (Fed) interest rate cut later in the year. Nevertheless, the Federal Reserve decided to keep rates unchanged at its meeting and revised lower interest rate cut expectations for 2024, tilting hawkish. The XAU/USD trades at $2,335, gaining 0.81% on the day.
In its monetary policy statement, the Fed mentioned they do “not expect it will be appropriate to reduce the target range until it has gained greater confidence that inflation is moving sustainably toward 2 percent.” They added that “the Committee would be prepared to adjust the stance of monetary policy as appropriate if risks emerge that could impede the attainment of the Committee’s goals.”
Aside from this, the so-called ‘dot-plot’ showed that the median of the Fed officials upward revised their projections of the federal funds rate from 4.6% to 5.1%, toward the end of 2024. This means they are foreseen just one rate cut, compared to the current effective federal funds rate standing at 5.33%.
Federal Reserve officials updated their economic projections for 2024. According to the Summary of Economic Projections (SEP), they expect the economy to grow 2.1%, as foreseen in March, while the Unemployment Rate is estimated at 4%, unchanged from the previous SEP. PCE inflation is expected to edge higher from 2.4% to 2.6%, and Core PCE to rise from 2.6% to 2.8%.
Earlier, the US Bureau of Labor Statistics (BLS) revealed that May’s inflation in the US was unchanged compared to April’s data, strengthening the golden metal as US Treasury bond yields plunged. The Greenback tumbled to a three-day low, as revealed by the US Dollar Index (DXY), which measures the performance of the buck’s value against a basket of six other currencies.
The US 10-year Treasury note yield edges down 14 basis points to 4.266%, a tailwind for the yellow metal. Consequently, the DXY plummeted 0.83% to 104.38.
According to the CME FedWatch Tool, the latest US inflation report increased the odds of a Fed rate cut in September from 46.7% to 61.3%.
Daily digest market movers: Gold price stays firm post Fed’s decision
- US Consumer Price Index (CPI) remained unchanged at 0% MoM, falling short of the 0.1% monthly estimate and April's 0.3% increase. Over the twelve months leading to May, the CPI rose by 3.3%, below both April's figure and the 3.4% consensus.
- Core inflation figures decreased from 0.3% to 0.2% MoM. Annually, core inflation was 3.4%, which was lower than expected 3.5% and April's 3.6%.
- On Tuesday, the NFIB Small Business Optimism Index for May hit its highest level of the year. The survey highlighted that businesses struggle with inflation and access to cheap financing.
- December’s 2024 fed funds futures contract hints that investors expect 28 basis points of rate cuts by the Fed through the end of the year.
- News that the People’s Bank of China paused its 18-month bullion buying spree weighed on the precious metal. PBOC holdings held steady at 72.80 million troy ounces of Gold in May.
Technical analysis: Gold price rises as buyers target $2,380
Gold remains neutral to downwardly biased after forming a Head-and-Shoulders chart pattern. Although it hints that the non-yielding metal could be headed to the downside, the Fed’s decision could negate the chart pattern if XAU/USD climbs past the June 7 cycle high of $2.387, opening the door to test the $2,400 mark.
Conversely, if XAU/USD drops below the $2,300 figure, the next demand area would be the May 3 low of $2,277, followed by the March 21 high of $2,222. Further losses lie beneath, as sellers would eye the Head-and-Shoulders chart pattern objective at around $2170 to $2160.
Gold FAQs
Gold has played a key role in human’s history as it has been widely used as a store of value and medium of exchange. Currently, apart from its shine and usage for jewelry, the precious metal is widely seen as a safe-haven asset, meaning that it is considered a good investment during turbulent times. Gold is also widely seen as a hedge against inflation and against depreciating currencies as it doesn’t rely on any specific issuer or government.
Central banks are the biggest Gold holders. In their aim to support their currencies in turbulent times, central banks tend to diversify their reserves and buy Gold to improve the perceived strength of the economy and the currency. High Gold reserves can be a source of trust for a country’s solvency. Central banks added 1,136 tonnes of Gold worth around $70 billion to their reserves in 2022, according to data from the World Gold Council. This is the highest yearly purchase since records began. Central banks from emerging economies such as China, India and Turkey are quickly increasing their Gold reserves.
Gold has an inverse correlation with the US Dollar and US Treasuries, which are both major reserve and safe-haven assets. When the Dollar depreciates, Gold tends to rise, enabling investors and central banks to diversify their assets in turbulent times. Gold is also inversely correlated with risk assets. A rally in the stock market tends to weaken Gold price, while sell-offs in riskier markets tend to favor the precious metal.
The price can move due to a wide range of factors. Geopolitical instability or fears of a deep recession can quickly make Gold price escalate due to its safe-haven status. As a yield-less asset, Gold tends to rise with lower interest rates, while higher cost of money usually weighs down on the yellow metal. Still, most moves depend on how the US Dollar (USD) behaves as the asset is priced in dollars (XAU/USD). A strong Dollar tends to keep the price of Gold controlled, whereas a weaker Dollar is likely to push Gold prices up.
- EUR/USD pulls back from 1.0850 after Fed holds rates; rate cuts look less likely.
- Fed dot plot sees less likelihood of rate cuts in 2024.
- Fed's forward-looking rate expectations tick higher.
EUR/USD pivoted away from 1.0850 on Wednesday after the Federal Reserve (Fed) held rates as markets broadly expected, but a shift in the Fed's "dot plot" of interest rate expectations is warning that interest rates are likely to continue holding higher for longer
Fed leaves policy rate unchanged at 5.25%-5.5% as forecast
The Fed's interest rate outlook sees higher rates than previously expected, with the 1-year rate outlook rising to 4.1% from the previous 3.9%. The 2-year rate outlook held steady at 3.1%, and the long-term interest rate outlook rose to 2.8% from 2.6%.
Live Coverage: Fed dot plot cools Gold, stocks, buoys US Dollar
According to the Fed's dot plot, only a single rate cut in 2024 is looking more likely. Four members of the Federal Open Market Committee (FOMC) see no rate cuts at all in 2024, with seven FOMC members expecting only a single quarter-point cut. Eight FOMC voters still see two cuts for the year, but the summary of FOMC rate expectations has shifted firmly back from previous forecasts.
EUR/USD rallied hard early Wednesday after US Consumer Price Index (CPI) inflation cooled faster than expected in May. The Fiber rose 1.10% to 1.0850 after May's US CPI eased to 0.0% MoM, down from the forecast 0.1% and easing further from the previous 0.3%. However, an uneasy Fed has trimmed bullish momentum, and the pair is dropping back post-FOMC as investors await Fed Chair Jerome Powell's press conference at the bottom of the hour.
more to come...
- AUD/USD surges as soft US inflation figures buoy the Australian Dollar.
- Attention is now on Fed's decision later in the session.
- Australian traders are digesting the inflation figures from China released during the Asian session.
On Tuesday, the Australian Dollar (AUD) gained against the US Dollar (USD), countering the prior bearish pressure, and is now lingering around the 0.6705 area. This uptrend is likely induced by the release of soft inflation figures from the US. The announcement of the Federal Reserve (Fed) meeting, at 18:00 GMT, is expected to trigger volatility.
On the Australian front, soft inflation data from China, a vital trading partner, is currently being evaluated by Australian traders. The Chinese inflation figures could influence the monetary policy of the Reserve Bank of Australia (RBA) and the performance of the Australian dollar as economic weakness in China might prompt sooner rate cuts.
Daily digest market movers: Australian Dollar is gaining strength as traders digest US CPI data
- On the US side, markets were met with somewhat softer May Consumer Price Index (CPI) data on Tuesday.
- CPI dropped to 3.3% annually in May, falling short of the market's 3.4% expectation.
- Core CPI also saw a dip, while the overall CPI remained stable on a monthly basis.
- Two-day Fed meeting concludes on Wednesday. Given that most inflation measures have remained higher than desired since their last meeting, it's highly unlikely that there will be any shift in Fed's tone.
- On the Chinese side, China's May Consumer Price Index (CPI) was slightly lower than expected, while its Producer Price Index (PPI) was higher than anticipated.
- As Chinese economy grapples with deflationary risks that could steer their monetary policy to remain loose, which might be followed by the RBA.
Technical analysis: AUD/USD bulls gain momentum, outlook looks bright
The Relative Strength Index (RSI) has ascended above the 50 level, which supports the bullish sentiment, while the Moving Average Convergence Divergence (MACD) presents shrinking red bars that reflect diminishing selling pressure.
The overall positive outlook remains intact as the pair continues to stay above the 100 and 200-day Simple Moving Averages (SMA) around 0.6550. This position above these key levels suggests an overall favorable trend. Furthermore, the bulls took over the 20-day SMA on Wednesday, leading to a brightened short-term outlook.
Australian Dollar FAQs
One of the most significant factors for the Australian Dollar (AUD) is the level of interest rates set by the Reserve Bank of Australia (RBA). Because Australia is a resource-rich country another key driver is the price of its biggest export, Iron Ore. The health of the Chinese economy, its largest trading partner, is a factor, as well as inflation in Australia, its growth rate and Trade Balance. Market sentiment – whether investors are taking on more risky assets (risk-on) or seeking safe-havens (risk-off) – is also a factor, with risk-on positive for AUD.
The Reserve Bank of Australia (RBA) influences the Australian Dollar (AUD) by setting the level of interest rates that Australian banks can lend to each other. This influences the level of interest rates in the economy as a whole. The main goal of the RBA is to maintain a stable inflation rate of 2-3% by adjusting interest rates up or down. Relatively high interest rates compared to other major central banks support the AUD, and the opposite for relatively low. The RBA can also use quantitative easing and tightening to influence credit conditions, with the former AUD-negative and the latter AUD-positive.
China is Australia’s largest trading partner so the health of the Chinese economy is a major influence on the value of the Australian Dollar (AUD). When the Chinese economy is doing well it purchases more raw materials, goods and services from Australia, lifting demand for the AUD, and pushing up its value. The opposite is the case when the Chinese economy is not growing as fast as expected. Positive or negative surprises in Chinese growth data, therefore, often have a direct impact on the Australian Dollar and its pairs.
Iron Ore is Australia’s largest export, accounting for $118 billion a year according to data from 2021, with China as its primary destination. The price of Iron Ore, therefore, can be a driver of the Australian Dollar. Generally, if the price of Iron Ore rises, AUD also goes up, as aggregate demand for the currency increases. The opposite is the case if the price of Iron Ore falls. Higher Iron Ore prices also tend to result in a greater likelihood of a positive Trade Balance for Australia, which is also positive of the AUD.
The Trade Balance, which is the difference between what a country earns from its exports versus what it pays for its imports, is another factor that can influence the value of the Australian Dollar. If Australia produces highly sought after exports, then its currency will gain in value purely from the surplus demand created from foreign buyers seeking to purchase its exports versus what it spends to purchase imports. Therefore, a positive net Trade Balance strengthens the AUD, with the opposite effect if the Trade Balance is negative.
- Mexican Peso falls 0.60%, continuing its decline for a second consecutive day.
- Political turmoil and judicial reform concerns in Mexico lead to over 10% depreciation since June 2 election.
- A softer US inflation report moderates further Peso losses, yet political uncertainties maintain USD/MXN near multi-month highs.
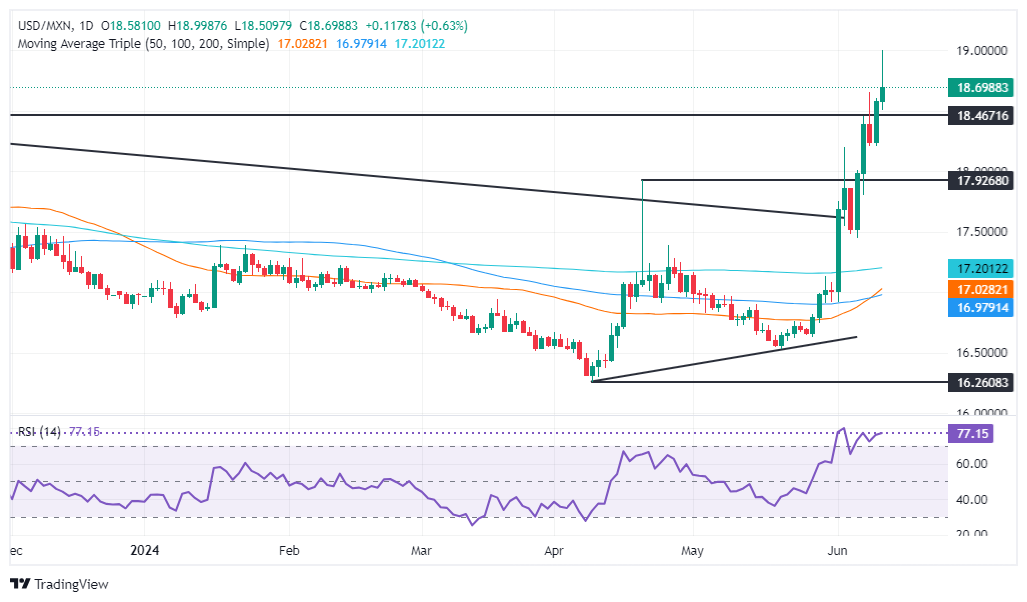
The Mexican Peso extended its losses for the second straight day on Wednesday against the US Dollar after hitting a 14-month low of 18.99, as traders remained nervous about controversial reforms to the Mexican constitution. Meanwhile, a softer-than-expected US inflation report capped the Mexican currency fall, yet it remains trading with losses of 0.65% near18.66.
Mexico’s political turmoil has weakened the Mexican currency by more than 10% following the June 2 general election. Investors are nervous about President Andres Manuel Lopez Obrador’s (AMLO) imminent judicial reform in September, which would allow the popular election of judges and magistrates of the Supreme Court.
The dissolution of key autonomous bodies, including the INAI and the Electoral Institute (INE), poses a significant threat to Mexico's hard-won democracy, which has been in place since the 1990s. If implemented, this move could potentially disrupt the democratic processes that have been the cornerstone of Mexico's political and economic stability.
During his morning press conference, President AMLO belittled the markets. According to Reuters, he said, "They are wrong, respectfully, if they are thinking that we are going to go back on reforming the judiciary, which is rotten, which is dominated by corruption, just because there is financial nervousness."
The USD/MXN hit a new multi-month high of 18.99 during the European session amid political and economic uncertainty surrounding Mexico.
AMLO’s pending reforms will be submitted to the newly elected Mexican Congress once it takes office in September, one month before President-elect Claudia Sheinbaum begins her six-year presidency.
Across the border, May’s US inflation was softer than expected, which weakened the Greenback against a basket of six currencies, but not against the Peso. At 18:00 GMT, the US Federal Reserve (Fed) is expected to deliver its monetary policy decision and its economic projections.
Daily digest market movers: Mexican Peso on the defensive amidst political uncertainty
- In February 2024, AMLO put forward several proposals to the Mexican Congress. These include a Supreme Court reform that suggests electing Supreme Court ministers through popular vote; an electoral reform aimed at electing electoral commission councilors by popular vote and reducing multi-member representation; and a reform of autonomous bodies that proposes dissolving the transparency body.
- Mexican Peso depreciation could weigh on the Bank of Mexico's (Banxico) decision to ease policy, even though last month’s core inflation slowed. Therefore, keeping interest rates higher could prompt deceleration in the economy and increase odds of a recession.
- Morgan Stanley noted that if Mexico’s upcoming government and Congress adopted an unorthodox agenda, it would undermine Mexican institutions and be bearish for the Mexican Peso, which could weaken to 19.20.
- The US Bureau of Labor Statistics (BLS) reported that the Consumer Price Index (CPI) remained unchanged at 0% MoM, falling short of the 0.1% monthly estimate and April's 0.3% increase. Over the twelve months leading to May, the CPI rose by 3.3%, below both April's figure and the 3.4% consensus.
- Core inflation figures decreased from 0.3% to 0.2% MoM. Annually, core inflation was 3.4%, which was lower than the expected 3.5% and April's 3.6%.
- The latest US inflation report increased the odds for a Fed rate cut in September, according to the CME FedWatch Tool, from 46.7% to 61.3%.
- December’s 2024 fed funds futures contract hints that investors expect 28 basis points of rate cuts by the Fed through the end of the year.
Technical analysis: Mexican Peso slides as USD/MXN approaches 19.00
The USD/MXN is bullishly biased even though the Peso has recovered some ground ahead of the Fed’s monetary policy decision. Once the exotic pair broke the four-year downslope resistance trendline, that opened the door for further upside. Momentum depicts that buyers are in charge, as portrayed by the Relative Strength Index (RSI) being overbought, hinting that bulls are taking a respite ahead of the Fed.
The USD/MXN's next resistance would be the year-to-date high of 18.99, followed by the March 20, 2023, high of 19.23. A breach of the latter will sponsor an uptick to 19.50, ahead of the psychological 20.00 mark.
On the other hand, sellers must push the USD/MXN back below the April 19 high of 18.15 if they want to keep the pair within the 18.00-18.15 trading range.
Mexican Peso FAQs
The Mexican Peso (MXN) is the most traded currency among its Latin American peers. Its value is broadly determined by the performance of the Mexican economy, the country’s central bank’s policy, the amount of foreign investment in the country and even the levels of remittances sent by Mexicans who live abroad, particularly in the United States. Geopolitical trends can also move MXN: for example, the process of nearshoring – or the decision by some firms to relocate manufacturing capacity and supply chains closer to their home countries – is also seen as a catalyst for the Mexican currency as the country is considered a key manufacturing hub in the American continent. Another catalyst for MXN is Oil prices as Mexico is a key exporter of the commodity.
The main objective of Mexico’s central bank, also known as Banxico, is to maintain inflation at low and stable levels (at or close to its target of 3%, the midpoint in a tolerance band of between 2% and 4%). To this end, the bank sets an appropriate level of interest rates. When inflation is too high, Banxico will attempt to tame it by raising interest rates, making it more expensive for households and businesses to borrow money, thus cooling demand and the overall economy. Higher interest rates are generally positive for the Mexican Peso (MXN) as they lead to higher yields, making the country a more attractive place for investors. On the contrary, lower interest rates tend to weaken MXN.
Macroeconomic data releases are key to assess the state of the economy and can have an impact on the Mexican Peso (MXN) valuation. A strong Mexican economy, based on high economic growth, low unemployment and high confidence is good for MXN. Not only does it attract more foreign investment but it may encourage the Bank of Mexico (Banxico) to increase interest rates, particularly if this strength comes together with elevated inflation. However, if economic data is weak, MXN is likely to depreciate.
As an emerging-market currency, the Mexican Peso (MXN) tends to strive during risk-on periods, or when investors perceive that broader market risks are low and thus are eager to engage with investments that carry a higher risk. Conversely, MXN tends to weaken at times of market turbulence or economic uncertainty as investors tend to sell higher-risk assets and flee to the more-stable safe havens.
- Dow Jones jumped a full percent after CPI inflation cooled before receding to flat.
- Fed watchers on high alert as “Dot plot” update looms ahead.
- Fed rate call broadly expected to hold as investors wrestle with September cut odds.
The Dow Jones soared over 350 points in early Wednesday trading after US Consumer Price Index (CPI) inflation receded faster than expected, but investors are pulling back ahead of the Federal Reserve’s (Fed) latest rate call that will bring a hotly-anticipated update to the Fed’s “dot plot” of Interest Rate Expectations. With the Fed still due on Wednesday, the Dow Jones has pulled back to the day’s opening bids near 38,780.00.
US CPI inflation cooled to 0.0% MoM in May, below the forecast 0.1% and receding even faster from the previous month’s 0.3%. Core CPI ticked down to 3.4% YoY, below the forecast 3.5% and dropping away from the previous period’s 3.6%. With CPI inflation figures easing further, investor sentiment is leaning further into hopes of a September rate cut.
According to the CME’s FedWatch Tool, rate markets are now pricing in 70% odds of the Fed trimming rates at least 25 basis points on September 18, but Wednesday’s Fed outing is reigniting some caution.
Dow Jones news
The Dow Jones is roughly on-balance on Wednesday but tilted towards the lower side. 20 of the index’s 30 securities are leaning into the red ahead of the Fed, with Nike Inc. (NKE) leading the crowd lower, falling -1.8% to $94.14 per share. Apple Inc. (AAPL) is extending a broad climb as investors pin their hopes on Apple’s announced integration of ChatGPT into their operating software. AAPL is up 4.11% on Wednesday, climbing to $215.83 per share.
Dow Jones technical outlook
Wednesday’s CPI-fueled rally briefly peaked above 39,120.00 before risk appetite chilled and sent the Dow Jones back into the day’s opening range near 38,790.00. The major equity index remains mired in near-term congestion at the 200-hour Exponential Moving Average (EMA) at 38,866.60. Bidders have manage to price in a technical rebound from the week’s low bids near 38,400.00, but technical resistance is building from multiple rejections from chart regions north of the 39,000.00 handle.
Dow Jones hourly chart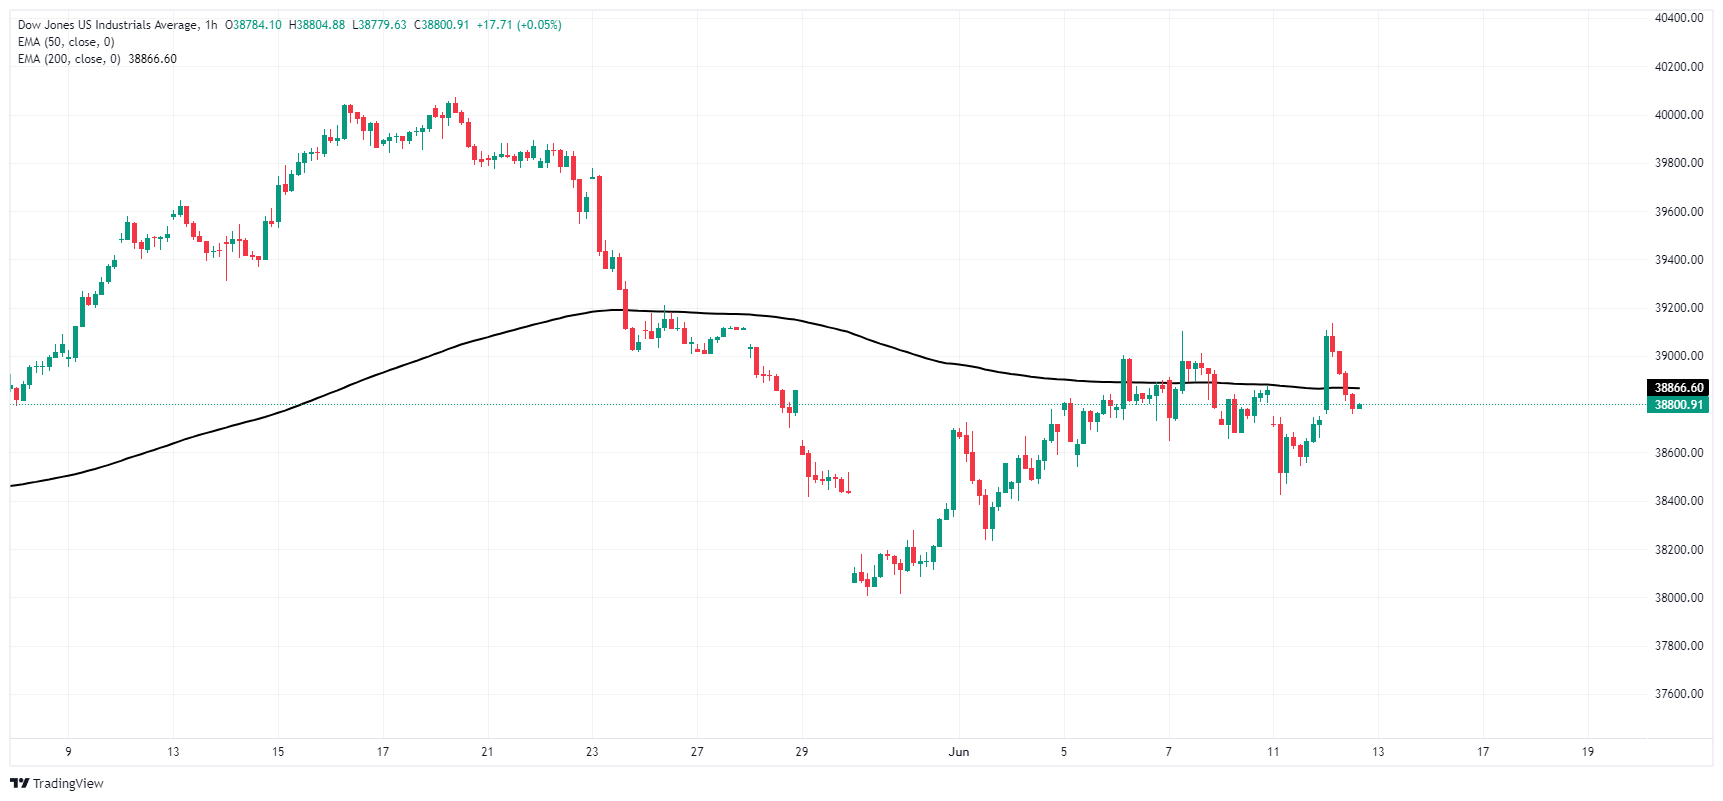
Dow Jones daily chart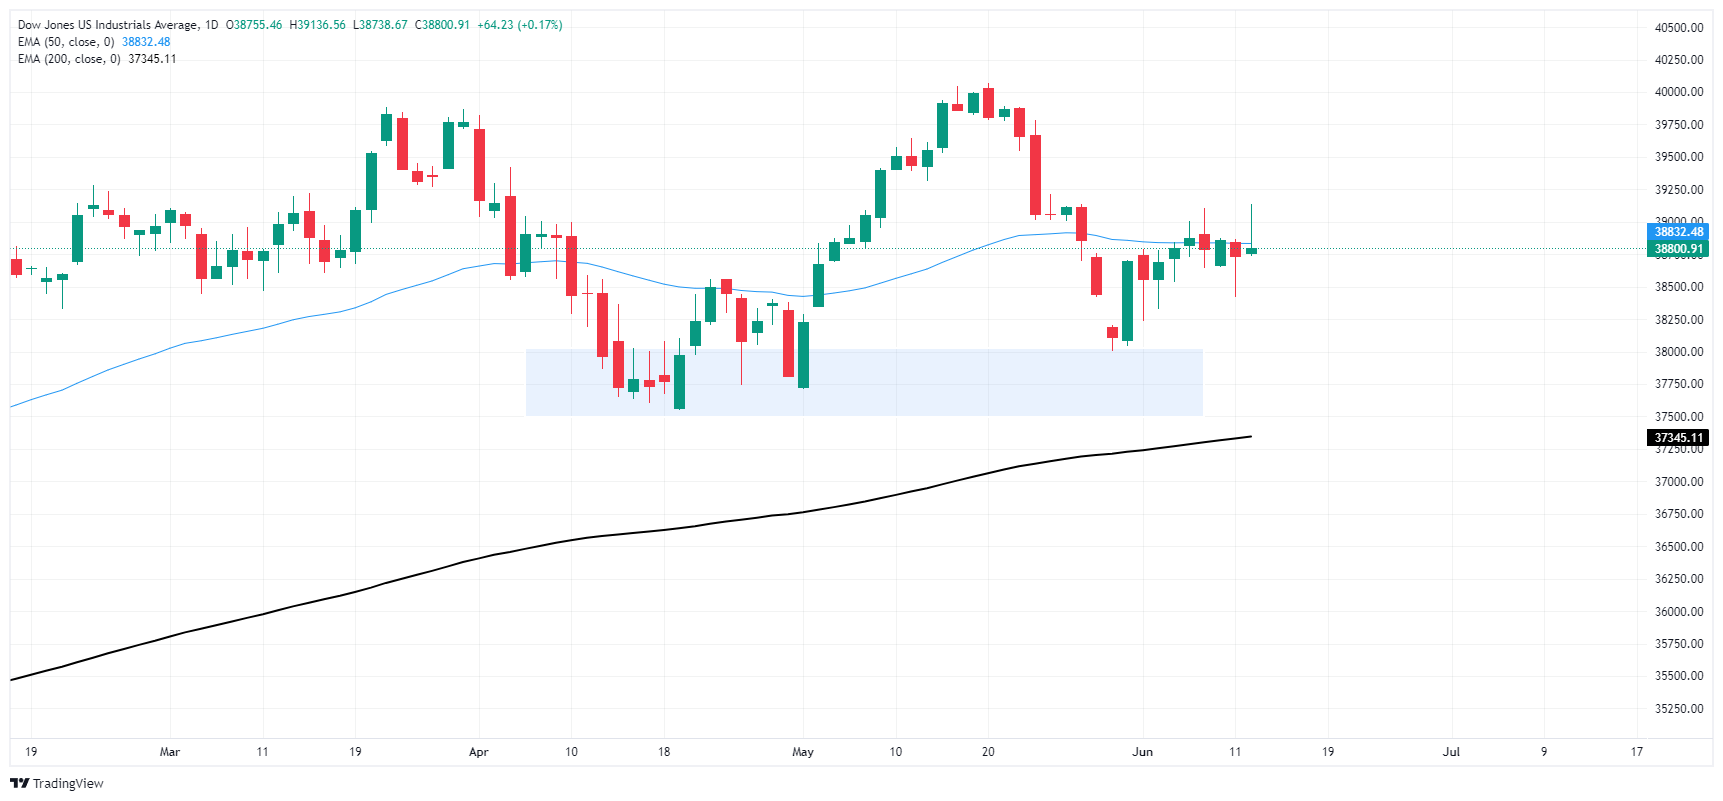
Dow Jones FAQs
The Dow Jones Industrial Average, one of the oldest stock market indices in the world, is compiled of the 30 most traded stocks in the US. The index is price-weighted rather than weighted by capitalization. It is calculated by summing the prices of the constituent stocks and dividing them by a factor, currently 0.152. The index was founded by Charles Dow, who also founded the Wall Street Journal. In later years it has been criticized for not being broadly representative enough because it only tracks 30 conglomerates, unlike broader indices such as the S&P 500.
Many different factors drive the Dow Jones Industrial Average (DJIA). The aggregate performance of the component companies revealed in quarterly company earnings reports is the main one. US and global macroeconomic data also contributes as it impacts on investor sentiment. The level of interest rates, set by the Federal Reserve (Fed), also influences the DJIA as it affects the cost of credit, on which many corporations are heavily reliant. Therefore, inflation can be a major driver as well as other metrics which impact the Fed decisions.
Dow Theory is a method for identifying the primary trend of the stock market developed by Charles Dow. A key step is to compare the direction of the Dow Jones Industrial Average (DJIA) and the Dow Jones Transportation Average (DJTA) and only follow trends where both are moving in the same direction. Volume is a confirmatory criteria. The theory uses elements of peak and trough analysis. Dow’s theory posits three trend phases: accumulation, when smart money starts buying or selling; public participation, when the wider public joins in; and distribution, when the smart money exits.
There are a number of ways to trade the DJIA. One is to use ETFs which allow investors to trade the DJIA as a single security, rather than having to buy shares in all 30 constituent companies. A leading example is the SPDR Dow Jones Industrial Average ETF (DIA). DJIA futures contracts enable traders to speculate on the future value of the index and Options provide the right, but not the obligation, to buy or sell the index at a predetermined price in the future. Mutual funds enable investors to buy a share of a diversified portfolio of DJIA stocks thus providing exposure to the overall index.
- USD pauses uptrend after the release of soft US inflation.
- Greenback to rely on FOMC meeting to dictate its next move.
- Investors expect hawkish hold with US central bank keeping rates at 5.25-5.50% range.
On Wednesday, the US Dollar Index (DXY) saw a downward trend following the release of US Consumer Price Index (CPI) data and ahead of the Federal Reserve’s (Fed) Federal Open Market Committee (FOMC) decision.
The two-day FOMC meeting, which ends on Wednesday, is a pivotal point for market observers as they will get a clearer outlook on the latest data, which saw inflation softening despite a strong labor market.
Daily digest market movers: DXY absorbs hit on CPI reading, eyes turn to FOMC
- US Bureau of Labor Statistics (BLS) reports a decline in US CPI to 3.3% YoY in May, down from 3.4% in April and slightly below market expectation of 3.4%.
- Annual core CPI rose 3.4%, marking a decrease from April's 3.6% and falling below analysts' estimate of 3.5%.
- Markets expect a hawkish hold from the Fed, maintaining the stance that was portrayed before Wednesday's inflation data was released.
- Dot plot and Chair Powell’s press conference will potentially swing the US Dollar in a significant way. A shift toward a dovish stance from Powell could cause downward pressure on Greenback.
- Updated forecasts will also be key as they will give additional clues to investors on when the Fed will start cutting. As for now, the easing cycle odds are on a start in November.
DXY technical analysis: Bears make their move to reclaim ground
Indicators on the daily chart weakened on Wednesday with the Relative Strength Index (RSI) dropping below 50 and the Moving Average Convergence Divergence (MACD) flashing decreasing green bars.
The index also fell beneath the key support point of 104.50, amplifying the bearish perspective as it now trades below the 20, 100 and 200-day Simple Moving Average (SMA).
US Dollar FAQs
The US Dollar (USD) is the official currency of the United States of America, and the ‘de facto’ currency of a significant number of other countries where it is found in circulation alongside local notes. It is the most heavily traded currency in the world, accounting for over 88% of all global foreign exchange turnover, or an average of $6.6 trillion in transactions per day, according to data from 2022. Following the second world war, the USD took over from the British Pound as the world’s reserve currency. For most of its history, the US Dollar was backed by Gold, until the Bretton Woods Agreement in 1971 when the Gold Standard went away.
The most important single factor impacting on the value of the US Dollar is monetary policy, which is shaped by the Federal Reserve (Fed). The Fed has two mandates: to achieve price stability (control inflation) and foster full employment. Its primary tool to achieve these two goals is by adjusting interest rates. When prices are rising too quickly and inflation is above the Fed’s 2% target, the Fed will raise rates, which helps the USD value. When inflation falls below 2% or the Unemployment Rate is too high, the Fed may lower interest rates, which weighs on the Greenback.
In extreme situations, the Federal Reserve can also print more Dollars and enact quantitative easing (QE). QE is the process by which the Fed substantially increases the flow of credit in a stuck financial system. It is a non-standard policy measure used when credit has dried up because banks will not lend to each other (out of the fear of counterparty default). It is a last resort when simply lowering interest rates is unlikely to achieve the necessary result. It was the Fed’s weapon of choice to combat the credit crunch that occurred during the Great Financial Crisis in 2008. It involves the Fed printing more Dollars and using them to buy US government bonds predominantly from financial institutions. QE usually leads to a weaker US Dollar.
Quantitative tightening (QT) is the reverse process whereby the Federal Reserve stops buying bonds from financial institutions and does not reinvest the principal from the bonds it holds maturing in new purchases. It is usually positive for the US Dollar.
- Canadian Dollar broadly weaker on Wednesday, but Greenback falls further.
- Canada brings little of note to the table, BoC Governor Macklem due later.
- Cooling US CPI inflation bolsters market confidence ahead of Fed’s “dot plot”.
The Canadian Dollar (CAD) is broadly lower on Wednesday, falling against most of its competitors as CAD interest flounders. However, a cooler-than-expected print in US Consumer Price Index (CPI) inflation has bolstered broad-market sentiment, pushing the US Dollar down even faster than the CAD.
Canada delivers little of note on the economic calendar for the rest of the week. An appearance by Bank of Canada (BoC) Governor Tiff Macklem due later on Wednesday is likely to be drowned out by market reactions to the Federal Reserve’s (Fed) latest update to its “dot plot” of Interest Rate Projections.
Daily digest market movers: Canadian Dollar weakens, but Greenback dumps after US CPI beat
- US CPI inflation eased to 0.0% MoM from the previous 0.3%, dipping below the forecast for 0.1% in May.
- Core CPI inflation ticked down to 3.4% YoY in May, lower than the forecast 3.5% and easing further back from the previous period’s 3.6%.
- Signs of easing inflation pummeled the Greenback and sparked a resurgence of hope for a September rate cut from the Fed. The CME’s FedWatch Tool shows rate markets are once again pricing in over 70% odds of at least a quarter-point trim from the Fed on September 18.
- Fed’s updated Interest Rate Projections are due at 18:00 GMT, alongside another expected rate hold, and will be followed by a press conference headed by Fed Chairman Jerome Powell at 18:30 GMT.
- BoC Governor Tiff Macklem will participate in a panel discussion labeled “Overcoming Economic Volatility” during one of the most volatile days of the season at the Conference of Montreal beginning at 19:30 GMT.
Canadian Dollar PRICE Today
The table below shows the percentage change of Canadian Dollar (CAD) against listed major currencies today. Canadian Dollar was the strongest against the US Dollar.
| USD | EUR | GBP | JPY | CAD | AUD | NZD | CHF | |
|---|---|---|---|---|---|---|---|---|
| USD | -0.95% | -0.79% | -0.84% | -0.48% | -1.37% | -1.15% | -0.72% | |
| EUR | 0.95% | 0.17% | 0.08% | 0.44% | -0.44% | -0.19% | 0.23% | |
| GBP | 0.79% | -0.17% | -0.06% | 0.30% | -0.57% | -0.33% | 0.07% | |
| JPY | 0.84% | -0.08% | 0.06% | 0.34% | -0.53% | -0.31% | 0.12% | |
| CAD | 0.48% | -0.44% | -0.30% | -0.34% | -0.89% | -0.63% | -0.25% | |
| AUD | 1.37% | 0.44% | 0.57% | 0.53% | 0.89% | 0.25% | 0.66% | |
| NZD | 1.15% | 0.19% | 0.33% | 0.31% | 0.63% | -0.25% | 0.41% | |
| CHF | 0.72% | -0.23% | -0.07% | -0.12% | 0.25% | -0.66% | -0.41% |
The heat map shows percentage changes of major currencies against each other. The base currency is picked from the left column, while the quote currency is picked from the top row. For example, if you pick the Canadian Dollar from the left column and move along the horizontal line to the US Dollar, the percentage change displayed in the box will represent CAD (base)/USD (quote).
Technical analysis: Canadian Dollar falls but Greenback falls faster
The Canadian Dollar (CAD) is broadly weaker on Wednesday, backsliding against most of its major currency peers. The CAD is down nearly a full percent against the Australian Dollar (AUD) and three-quarters of one percent against the New Zealand Dollar (NZD). Despite weak bids for the CAD, the Greenback is declining faster, bolstering the CAD to a half-percent gain against the US Dollar.
USD/CAD is on pace for one of its worst days in 2024, backsliding half of a percent and falling back below 1.3750 as the pair routinely fails to drive further north of the 50-day Exponential Moving Average (EMA) at 1.3663. A drop below key technical levels will see the pair extend declines into a near-term demand zone below 1.3630, where a price floor at the 1.3600 handle is waiting.
USD/CAD hourly chart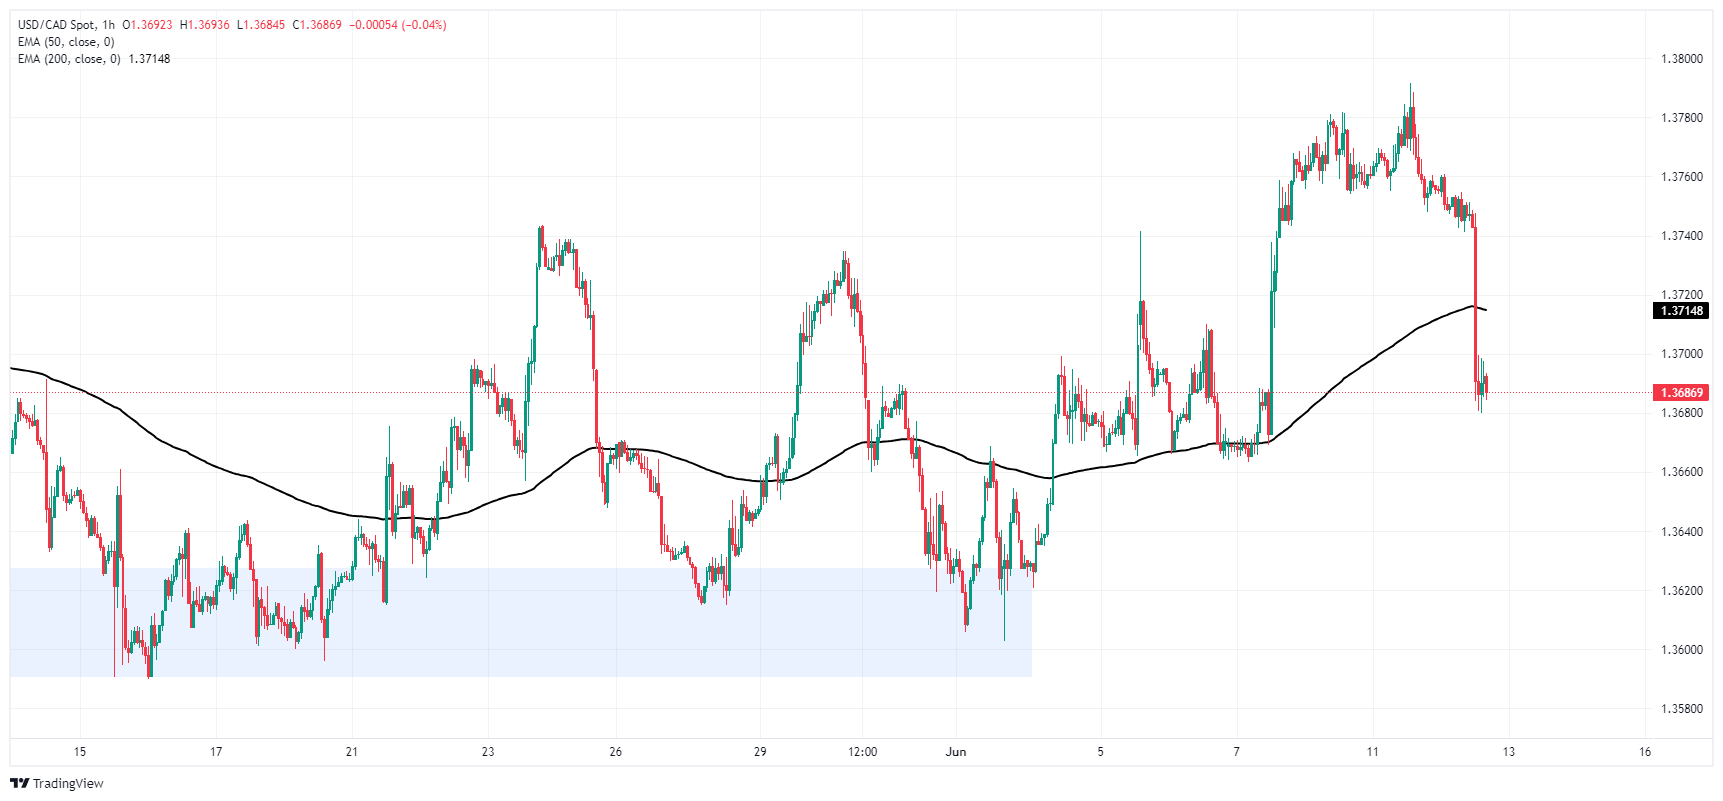
USD/CAD daily chart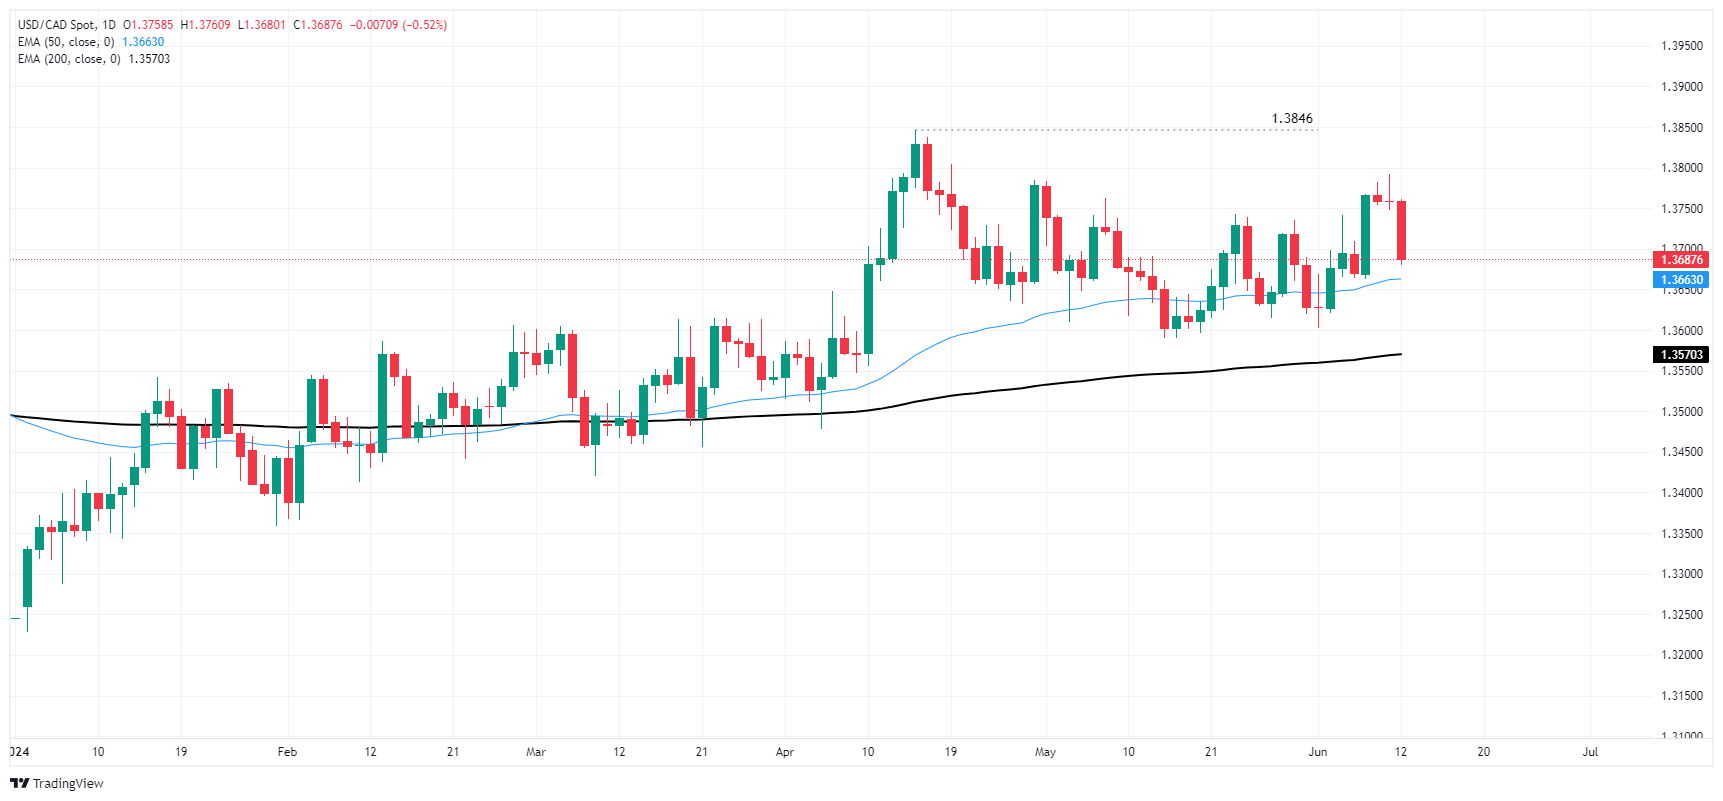
Canadian Dollar FAQs
The key factors driving the Canadian Dollar (CAD) are the level of interest rates set by the Bank of Canada (BoC), the price of Oil, Canada’s largest export, the health of its economy, inflation and the Trade Balance, which is the difference between the value of Canada’s exports versus its imports. Other factors include market sentiment – whether investors are taking on more risky assets (risk-on) or seeking safe-havens (risk-off) – with risk-on being CAD-positive. As its largest trading partner, the health of the US economy is also a key factor influencing the Canadian Dollar.
The Bank of Canada (BoC) has a significant influence on the Canadian Dollar by setting the level of interest rates that banks can lend to one another. This influences the level of interest rates for everyone. The main goal of the BoC is to maintain inflation at 1-3% by adjusting interest rates up or down. Relatively higher interest rates tend to be positive for the CAD. The Bank of Canada can also use quantitative easing and tightening to influence credit conditions, with the former CAD-negative and the latter CAD-positive.
The price of Oil is a key factor impacting the value of the Canadian Dollar. Petroleum is Canada’s biggest export, so Oil price tends to have an immediate impact on the CAD value. Generally, if Oil price rises CAD also goes up, as aggregate demand for the currency increases. The opposite is the case if the price of Oil falls. Higher Oil prices also tend to result in a greater likelihood of a positive Trade Balance, which is also supportive of the CAD.
While inflation had always traditionally been thought of as a negative factor for a currency since it lowers the value of money, the opposite has actually been the case in modern times with the relaxation of cross-border capital controls. Higher inflation tends to lead central banks to put up interest rates which attracts more capital inflows from global investors seeking a lucrative place to keep their money. This increases demand for the local currency, which in Canada’s case is the Canadian Dollar.
Macroeconomic data releases gauge the health of the economy and can have an impact on the Canadian Dollar. Indicators such as GDP, Manufacturing and Services PMIs, employment, and consumer sentiment surveys can all influence the direction of the CAD. A strong economy is good for the Canadian Dollar. Not only does it attract more foreign investment but it may encourage the Bank of Canada to put up interest rates, leading to a stronger currency. If economic data is weak, however, the CAD is likely to fall.
- US CPI for May unchanged at 0% MoM, below estimates of 0.1%, with annual increase at 3.3%.
- 10-year Treasury bond yield drops 14 basis points to 4.266%, lowest since April.
- Gold hits weekly high of $2,341; traders anticipate potential 25 bps rate cut by September with 61.3% odds.
US Treasury yields collapsed on Wednesday after a colder-than-expected May US Consumer Price Index (CPI) report increased speculation about the Federal Reserve's rate cuts in 2024. Despite that, caution is warranted, as the Federal Open Market Committee (FOMC) will reveal its monetary policy decision at around 18:00 GMT.
Colder-than-expected inflation report drives speculation of rate cuts ahead of FOMC policy decision
The US Bureau of Labor Statistics (BLS) revealed that the CPI was unchanged at 0% MoM, below estimates of 0.1% and April’s 0.3% increase. In the twelve months to May, it rose by 3.3%, below April’s and the 3.4% consensus.
Underlying inflation figures decreased from 0.3% to 0.2% MoM, while on an annual basis, hit 3.4%, lower than expectations of 3.5% and April’s 3.6%.
The US 10-year Treasury bond yield plummeted 14 basis points to 4.266%, its lowest level since April, after beginning the session at 4.426%. This pushed Gold prices toward a weekly high of $2,341 before stabilizing at around $2,324.
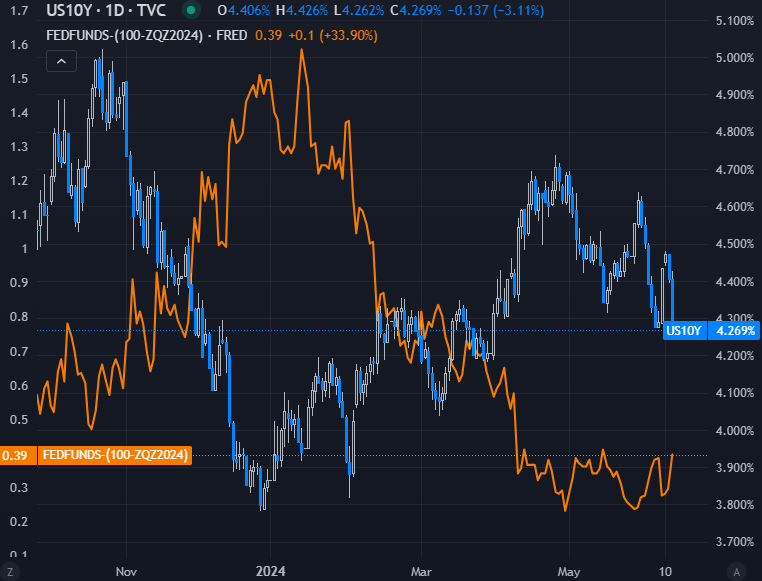
Data from the Chicago Board of Trade (CBOT) shows that traders expect 39 basis points (bps) of easing, according to December’s 2024 fed funds rate futures contract. In the meantime, the CME FedWatch Tool shows odds for a 25 bps rate cut in September jumped from 46.8% a day ago to 61.3%.
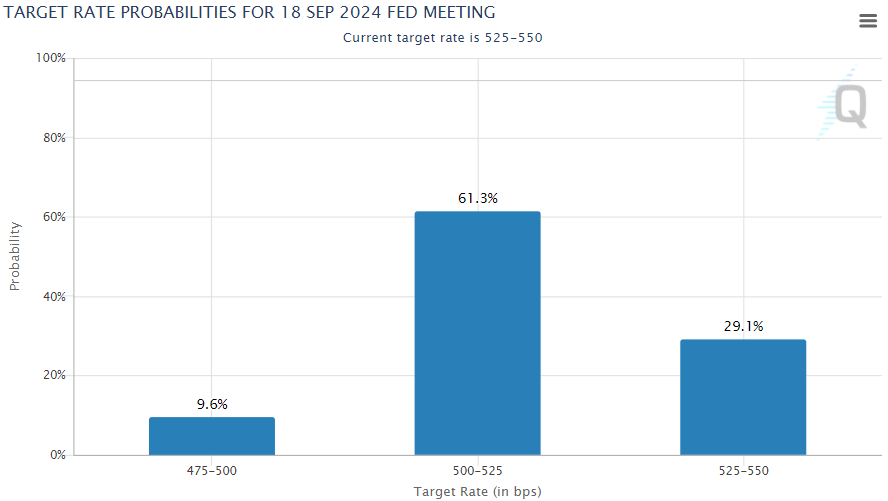
US inflation data came ahead of the Federal Reserve’s monetary policy decision. The Fed is expected to keep rates unchanged while updating its economic projections. Traders would be looking for hints about the future interest rate path.
Inflation FAQs
Inflation measures the rise in the price of a representative basket of goods and services. Headline inflation is usually expressed as a percentage change on a month-on-month (MoM) and year-on-year (YoY) basis. Core inflation excludes more volatile elements such as food and fuel which can fluctuate because of geopolitical and seasonal factors. Core inflation is the figure economists focus on and is the level targeted by central banks, which are mandated to keep inflation at a manageable level, usually around 2%.
The Consumer Price Index (CPI) measures the change in prices of a basket of goods and services over a period of time. It is usually expressed as a percentage change on a month-on-month (MoM) and year-on-year (YoY) basis. Core CPI is the figure targeted by central banks as it excludes volatile food and fuel inputs. When Core CPI rises above 2% it usually results in higher interest rates and vice versa when it falls below 2%. Since higher interest rates are positive for a currency, higher inflation usually results in a stronger currency. The opposite is true when inflation falls.
Although it may seem counter-intuitive, high inflation in a country pushes up the value of its currency and vice versa for lower inflation. This is because the central bank will normally raise interest rates to combat the higher inflation, which attract more global capital inflows from investors looking for a lucrative place to park their money.
Formerly, Gold was the asset investors turned to in times of high inflation because it preserved its value, and whilst investors will often still buy Gold for its safe-haven properties in times of extreme market turmoil, this is not the case most of the time. This is because when inflation is high, central banks will put up interest rates to combat it. Higher interest rates are negative for Gold because they increase the opportunity-cost of holding Gold vis-a-vis an interest-bearing asset or placing the money in a cash deposit account. On the flipside, lower inflation tends to be positive for Gold as it brings interest rates down, making the bright metal a more viable investment alternative.
- Silver shoots up after the release of US inflation data.
- It threatens to break above an important resistance level at $30.00.
- At the same time the precious metal continues to make lower lows suggesting a bearish bias in the short-term.
Silver (XAG/USD) pops higher after market-moving data on Wednesday and attempts to break back above a key resistance level at $30.00, the top of a four-year consolidation range.
The precious metal temporarily rises above the red 50 Simple Moving Average (SMA) reaching a high of $30.26 after the release of US Consumer Price Index (CPI) data, however, it has fallen back down and is currently trading in the $29.90s. It is unclear whether it will break back above the resistance level on a closing 4-hour period basis or not.
Silver 4-hour Chart
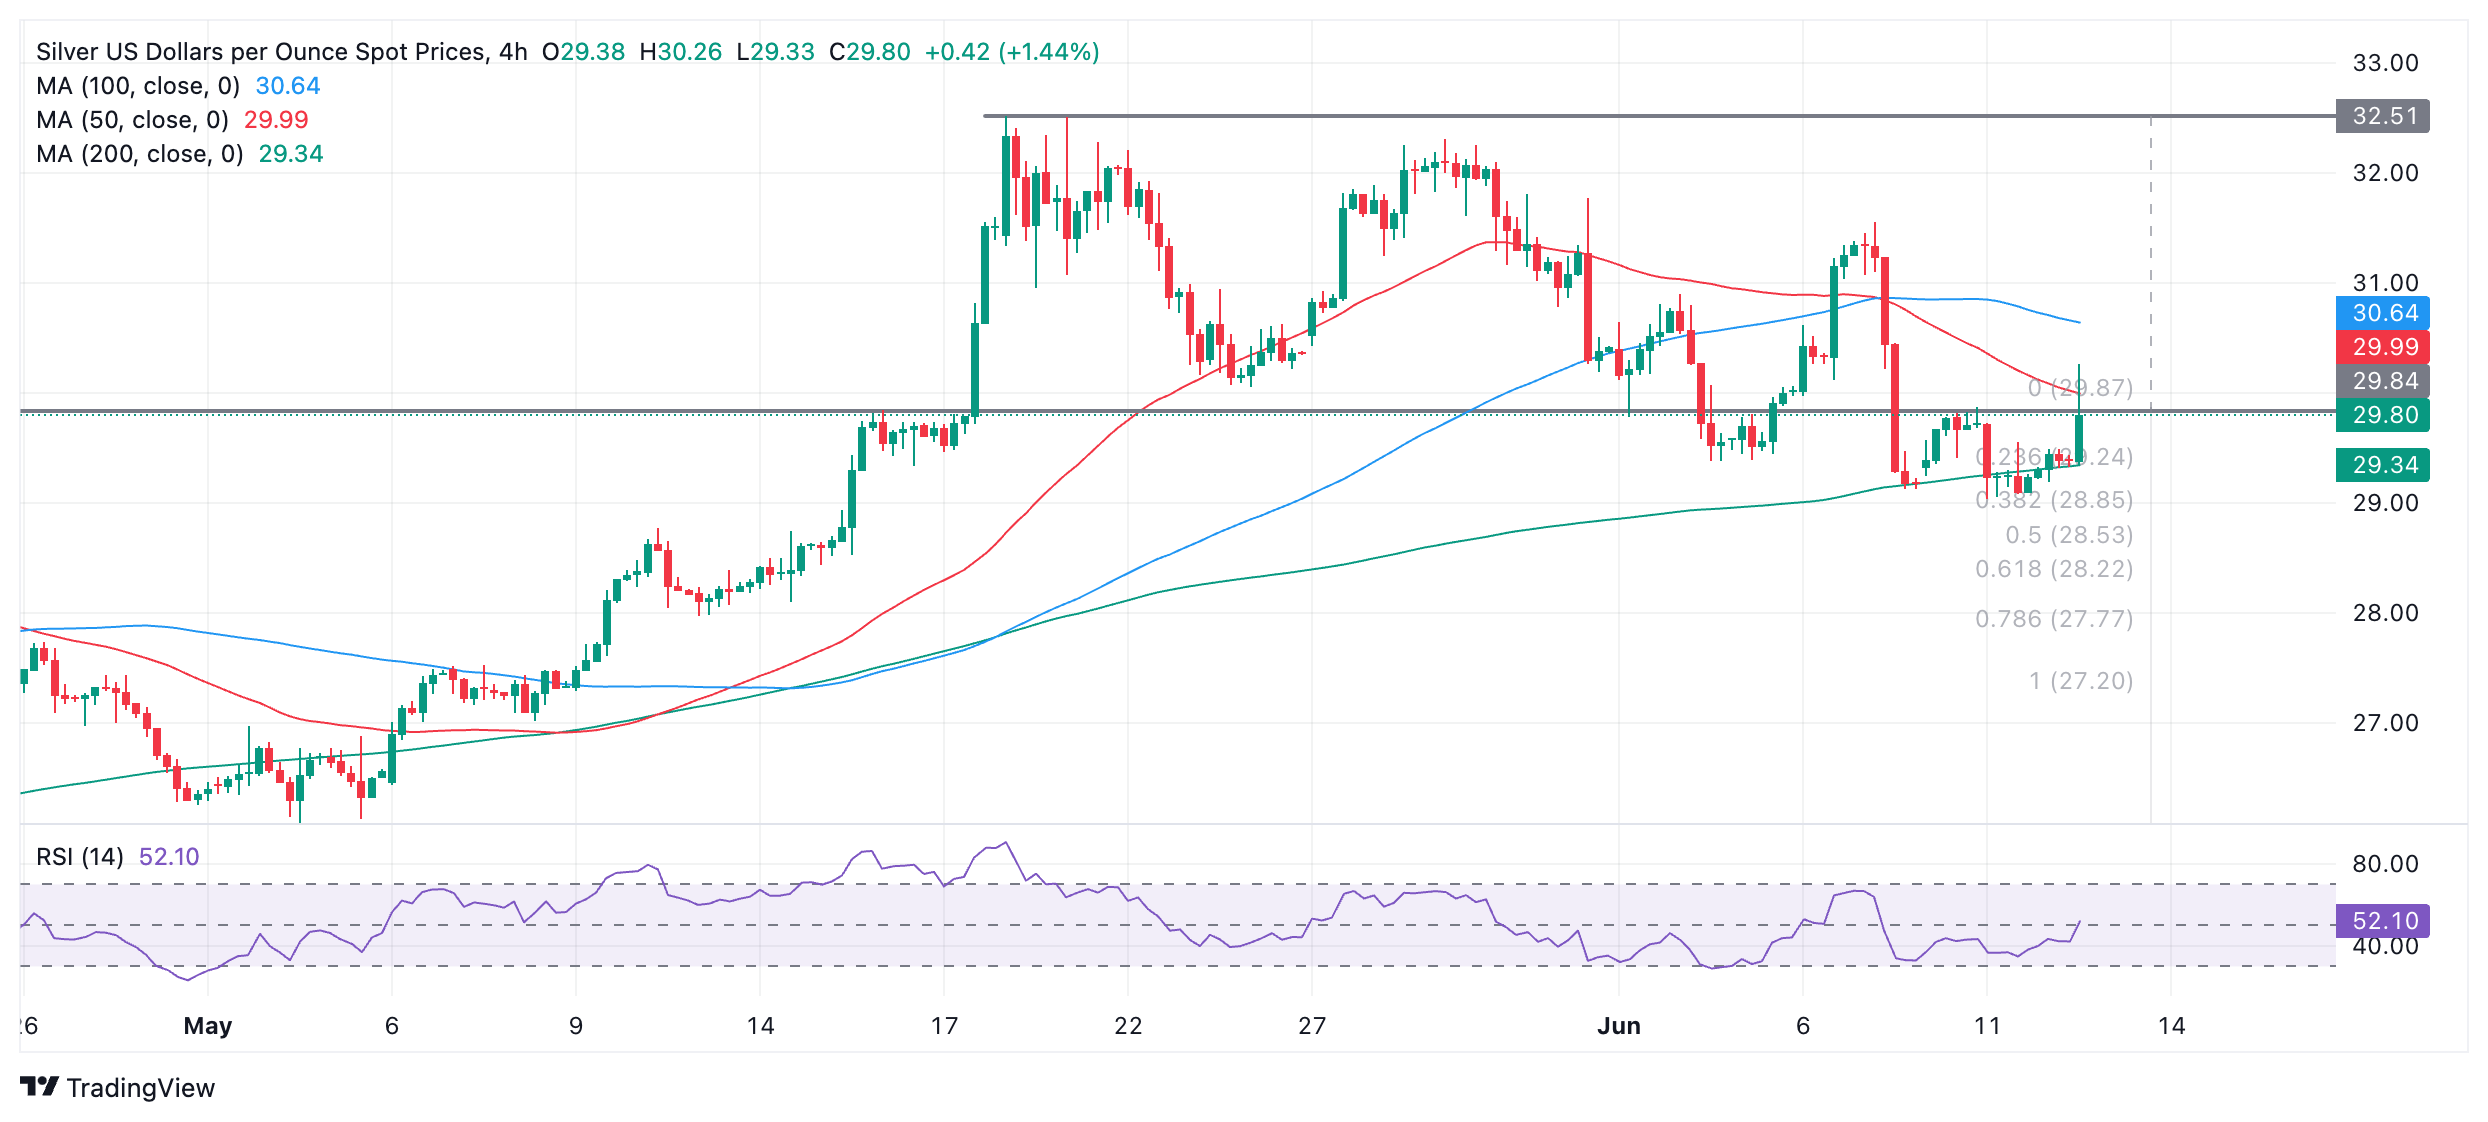
Prior to the spike, Silver had fallen to a new lower low of $29.04, just below the 200 Simple Moving Average (SMA).
A break back below $29.04 (June 11 low) would confirm another lower low, continuing the sequence of Silver’s step declines since it rolled over from its peak at $32.51 established in May.
There is a possibility it could fall to an initial target at $28.21, the 0.618 Fibonacci ratio of the height of the range that unfolded in the second half of May, extrapolated lower. This is the usual method used by technical analysts for establishing targets after breakouts from ranges. Further bearishness could see Silver even reach as low as $27.19, the 100% extrapolation of the height of the range lower.
Alternatively a close back above the $30.00 resistance level would bring the short-term bear bias into doubt. A move above the $31.55 lower high would suggest the possibility of a recovery back up to the range high at $32.51 and a change in the short-term trend.
- GBP/USD soared more than 0.70% on Wednesday, post-CPI, ahead of FOMC’s decision.
- Key technical resistance lies at YTD highs of 1.2893, 1.2900, and the 1.3000 figure.
- Sellers must push prices beneath 1.2800, to remain hopeful of lower prices.
The Pound Sterling recovered some ground versus the US Dollar in early trading on Wednesday after the US Department of Labor revealed that inflation is cooling in the United States. This development happened ahead of the Federal Reserve's monetary policy decision, which would be followed by Fed Chair Jerome Powell's press conference. Therefore, the GBP/USD hit a two-month high and traded at 1.28434, gaining more than 0.70%.
GBP/USD Price Analysis: Technical outlook
The GBP/USD remains upward biased, and after the US inflation data, has broken to new two-month highs, with just the year-to-date (YTD) high lying ahead at 1.2893. Once cleared, the next stop would be 1.3000 before challenging last year's high of 1.3142.
Momentum shifts strongly bullish, as depicted by the Relative Strength Index (RSI), which aims upward toward becoming overbought. Yet it remains shy of the highest RSI peak of 72.
If sellers want to regain control, they must drag the GBP/USD below 1.2800. Once surpassed, the next support would be 1.2750, ahead of the current week’s low of 1.2687.
GBP/USD Price Action – Daily Chart
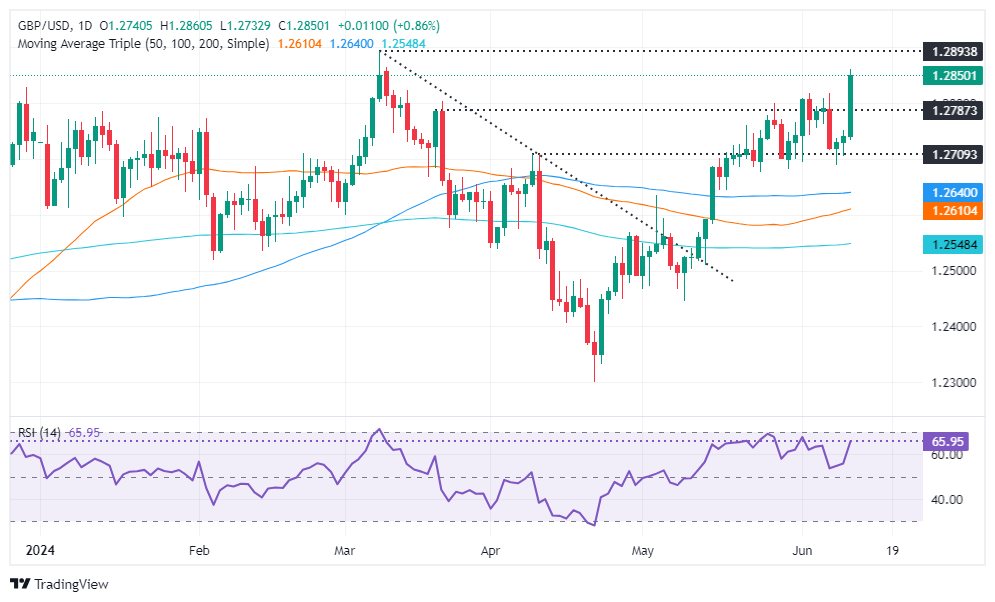
British Pound PRICE Today
The table below shows the percentage change of British Pound (GBP) against listed major currencies today. British Pound was the strongest against the US Dollar.
| USD | EUR | GBP | JPY | CAD | AUD | NZD | CHF | |
|---|---|---|---|---|---|---|---|---|
| USD | -0.98% | -0.86% | -0.81% | -0.56% | -1.36% | -1.22% | -0.76% | |
| EUR | 0.98% | 0.12% | 0.14% | 0.39% | -0.40% | -0.24% | 0.23% | |
| GBP | 0.86% | -0.12% | 0.04% | 0.29% | -0.49% | -0.34% | 0.10% | |
| JPY | 0.81% | -0.14% | -0.04% | 0.24% | -0.55% | -0.40% | 0.05% | |
| CAD | 0.56% | -0.39% | -0.29% | -0.24% | -0.80% | -0.63% | -0.20% | |
| AUD | 1.36% | 0.40% | 0.49% | 0.55% | 0.80% | 0.16% | 0.63% | |
| NZD | 1.22% | 0.24% | 0.34% | 0.40% | 0.63% | -0.16% | 0.44% | |
| CHF | 0.76% | -0.23% | -0.10% | -0.05% | 0.20% | -0.63% | -0.44% |
The heat map shows percentage changes of major currencies against each other. The base currency is picked from the left column, while the quote currency is picked from the top row. For example, if you pick the British Pound from the left column and move along the horizontal line to the US Dollar, the percentage change displayed in the box will represent GBP (base)/USD (quote).
The US Consumer Price Index (CPI) fell to 3.3% in May from 3.4% in April. Federal Reserve Chair Jerome Powell and other Fed officials will be relieved that price growth took a step back, says Nathan Janzen, Assistant Chief Economist at the Royal Bank of Canada. Still, the bank's main scenario is that the Fed won't cut interest rates until the end of the year, in December.
Softer-than-expected CPI set to put Fed on hold
“Year-over-year CPI growth edged down to 3.3% in May from 3.4% in April, softer than expected. Prices of core services ex-rent edged slightly lower from April in May (-0.04%), the lowest MoM reading since September 2021.”
“Core (excluding food and energy prices) price growth slowed to 3.4% from 3.6% YoY on a more normal looking 0.2% MoM increase in May, the first increase under 0.3% since October. Energy price growth ticked higher YoY with a drop in gasoline prices from April (-3.6%).”
“Federal Reserve officials will be relieved that price growth took a step back in May after signs of reacceleration earlier this year. Further data should help to reinforce Fed Chair Powell's view that interest rates are already at 'restrictive' enough levels. Our own base-case assumes the first Fed rate cut will come in December.”
- NZD/USD refreshes four-month high near 0.6220 as softer-than-expected US CPI report boosts Fed rate-cut bets for September.
- Investors await the Fed’s policy decision.
- The Kiwi asset sets to deliver an Inverted H&S breakout.
The NZD/USD pair shoots to a four-month high near 0.6220 in Wednesday’s New York session. The Kiwi asset strengthens as the soft United States (US) Consumer Price Index (CPI) report for May has boosted the Federal Reserve’s (Fed) rate-cut bets for the September meeting, which has improved the risk appetite of market participants significantly.
Meanwhile, market volatility is expected to remain high as investors brace for Fed’s monetary policy outcome in the late New York session. The Fed is expected to leave interest rates unchanged in the range of 5.25%-5.50%.
Investors will majorly focus on the Fed’s dot-plot, which indicates where policymakers see interest rates heading. Fed officials are expected to project fewer rate cuts than three anticipated in March as they lack confidence that inflation will sustaining return to the 2% target. However, soft inflation for May would improve their confidence that the disinflation process has resumed.
On the Kiwi front, firm expectations that the Reserve Bank of New Zealand (RBNZ) will keep interest rates at their current levels for the entire year has kept the New Zealand Dollar upbeat.
NZD/USD seems confident to deliver a breakout of the Inverted Head and Shoulder (H&S) chart pattern on a daily timeframe. A breakout move of the above-mentioned chart formation results in a bullish reversal. The 20-day Exponential Moving Average (EMA) near 0.6130 continues to remain a major cushion for the New Zealand Dollar bulls. Upward-sloping 50-DEMA near 0.6085 suggests that the overall trend is bullish.
The 14-period Relative Strength Index (RSI) jumps into the 60.00-80.00 range. Should the oscillator establish itself in this range, momentum would lean toward the upside.
More upside would appear if the asset stabilizes above the intraday high of 0.6220, which will expose the asset January 15 high near 0.6250, followed by January 12 high near 0.6280.
On the contrary, fresh downside would appear if the asset breaks below April 4 high around 0.6050 This would drag the asset towards the psychological support of 0.6000 and April 25 high at 0.5969.
NZD/USD daily chart
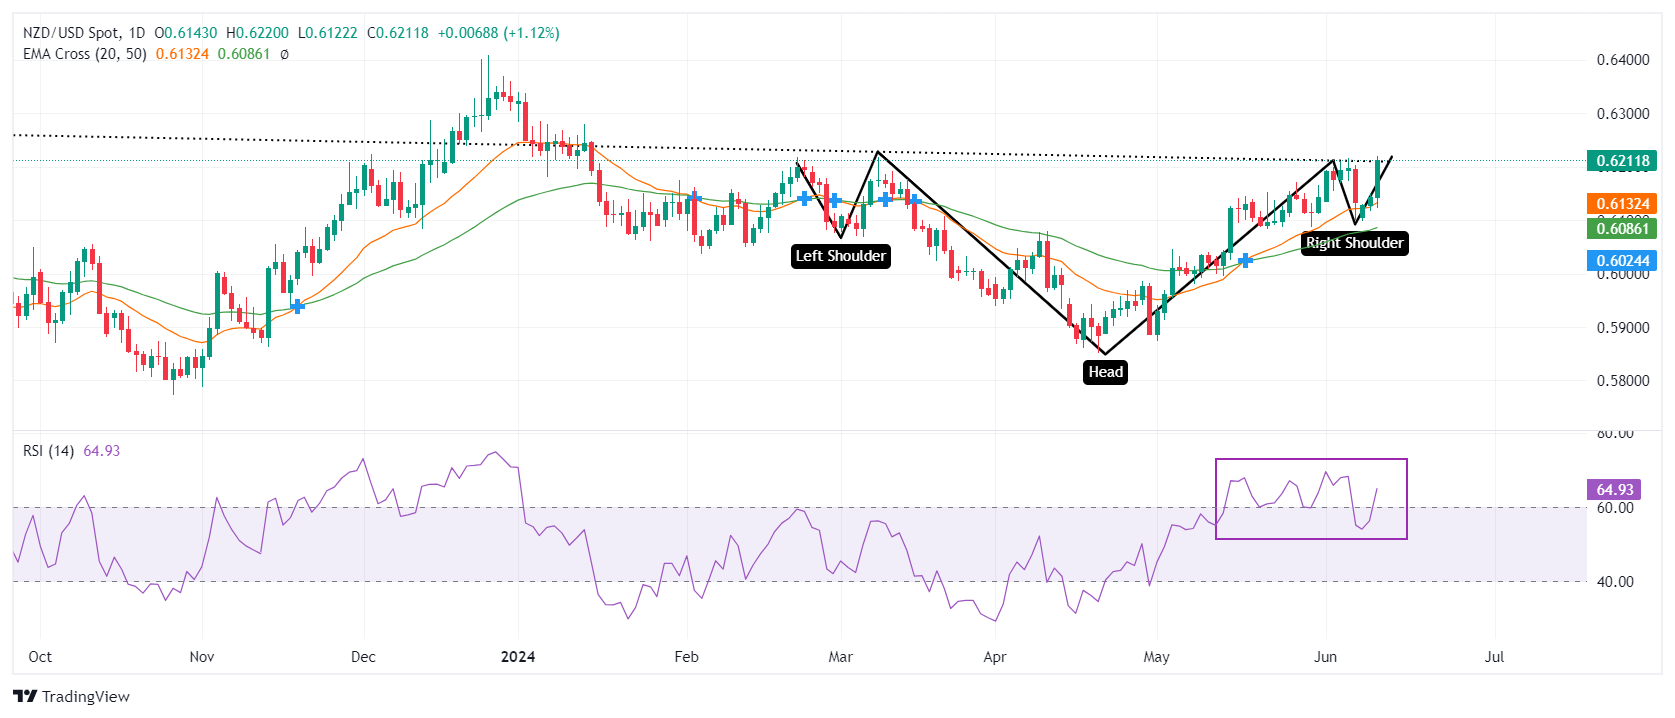
Commodity Trading Advisors (CTAs) are sellers once again in Henry Hub Natural Gas, TDS analysts note.
Natural gas fails to move above $3.50
“As expected, the market was prone to an easing of the momentum flows as prices failed to move above the $3.50/MMBtu level that was required to see continued buying pressure.”
“CTAs are now rebuilding their short positions, and a break below $2.97/MMBtu would prompt additional selling.”
Oil is on the rise amid some Commodity Trading Advisor (CTA) buying and spreads showing signs of recovery, analysts at TD Securities note in a research note.
Markets see uptrends reforming after OPEC+ meeting
“The energy complex is recovering nicely as CTA buying begins to take hold with uptrends reforming post-OPEC+ announcement. Spreads have also shown major signs of recovery, with Dec-Dec spreads jumping over 40% off the lows seen in the aftermath of the OPEC+ decision.”
“In this sense, CTAs are back on the bid in WTI and Brent crude, with the next upside triggers at prices north of $79.87/bbl and $83.16/bbl respectively.”
“With that said, the backwardation remains much reduced vs the levels seen in March-April, suggesting there is still more relative concern about Q4 balances and beyond, which should serve as a resistance to major upside.”
It is Federal Reserve (Fed) decision day, and the precious metals markets are widely expecting the US central bank to keep rates unchanged, TDS analysts note. The recent US Consumer Price Index (CPI) data, which came in softer than expected, could lead Fed Chairman Jerome Powell to sound more optimistic in his remarks later on Wednesday, a scenario that would be positive for Gold, they say.
Gold to see some buying above $2,333
“We expect Powell to sound optimistic given the recent data, and anticipate the dots will show only two cuts in 2024 rather than the previous three. For the precious metals market, this outcome is baked into the cake, particularly as Fed pricing remains tighter than the Fed guidance itself.”
“Given the outlook will remain extremely data dependent, it is likely that Gold (XAU/USD) investors continue to watch for a weakening trend in data before the macro cohort steps back into the market. In this sense, the latest CPI data coming in below expectations has given the yellow metal a boost.”
“Looking forward, Gold could see some marginal CTA buying above $2,333/oz, and remains well insulated from selling with the closest notable trigger being around the $2,203/oz mark.”
The Federal Reserve (Fed) is about to end its two-day meeting with a hawkish hold, analysts at BBH note.
Fed is set to wait until inflation hits 2% target
“At the May 1 decision, the Fed acknowledged the worsening inflation outlook by noting that in recent months, there has been a lack of further progress toward the Committee's 2% inflation objective.”
“The Fed reiterated that it does not expect it will be appropriate to reduce the target range until it has gained greater confidence that inflation is moving sustainably toward 2%.”
“With most inflation measures still running higher than desired since that meeting, we do not expect the Fed to shift its tone today.”
- EUR/GBP has hit the key downside target for its range breakout.
- The Relative Strength Index has fallen into the oversold zone.
- The technical picture suggests the pair is in a bearish trend but risks pulling back in the short-term.
EUR/GBP is in a downtrend with odds favoring a continuation lower whilst a heightened chance in the short-term the pair might pull back first.
EUR/GBP has broken out of a range and fallen to a key downside target based on the breakout. The achievement of the target suggests a risk that the pair may bottom out and rotate higher in a pullback.
EUR/GBP Daily Chart
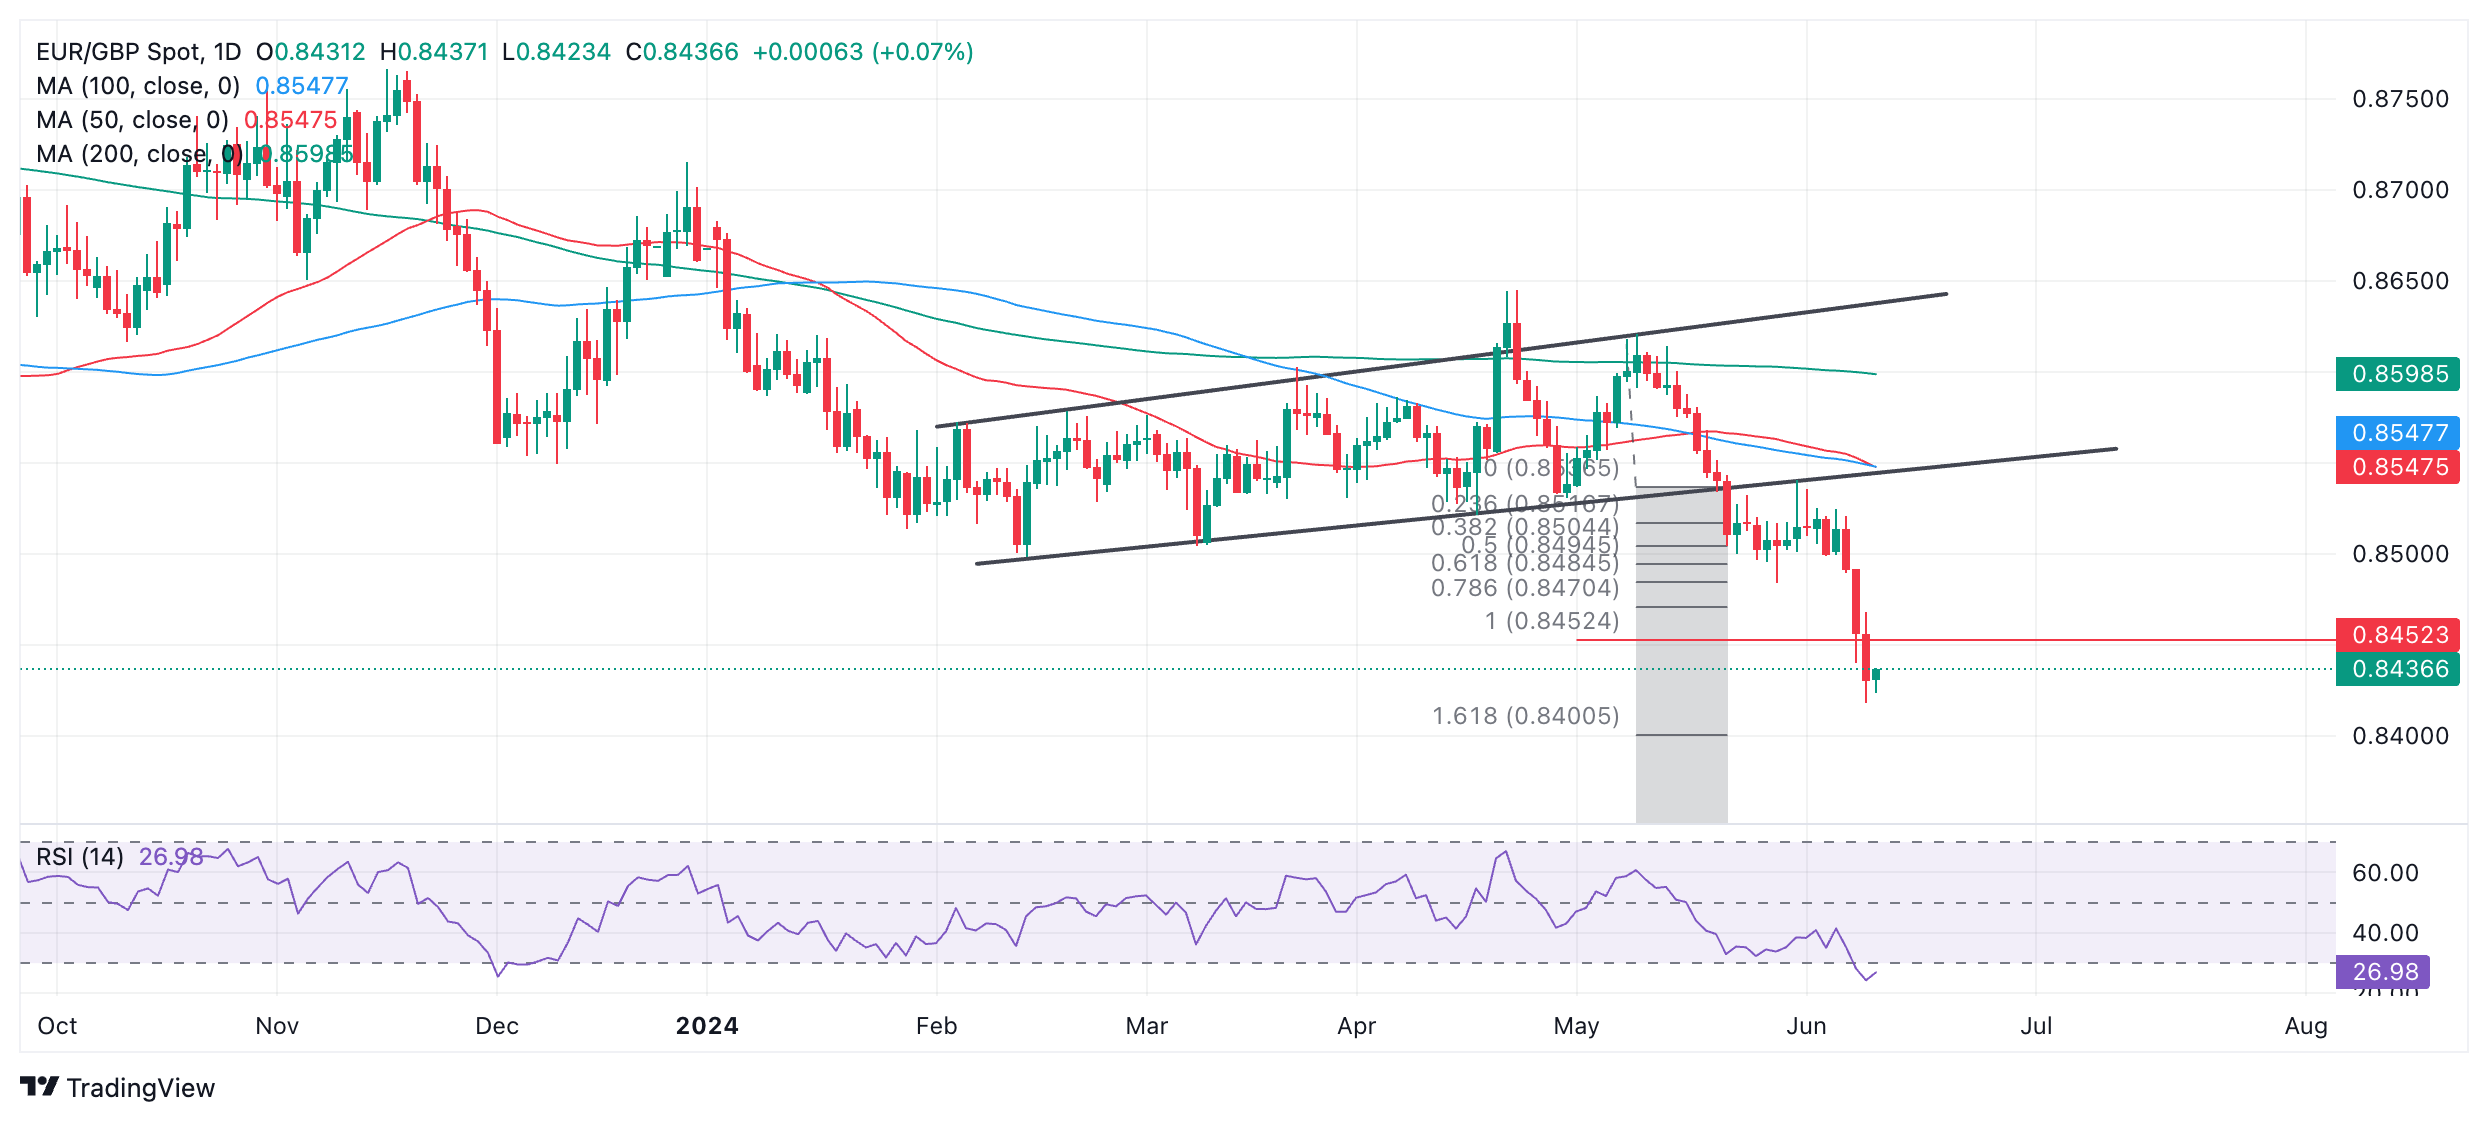
The trend, both on a short, intermediate and long-term basis is bearish on balance, however, suggesting a continued risk of more downside once the pullback, if it evolves, completes.
Price has reached both the conservative and main target for the breakout from the range that evolved during 2024. The main target lies at 0.8452, the 100% extrapolation of the height of the range lower.
The Relative Strength Index (RSI) is oversold, suggesting the downtrend may be overstretched and that short-holders should not add to their positions. It also increases the probability of correction higher unfolding.
Given the dominant downtrend, the pair will probably resume its decline once any corrections complete. A break below 0.8418 (June 11 low) would create a lower low and probably result in a deeper sell-off, with 0.8400 coming in as the next target, followed by 0.8340 (August 2022 low).
- Oil gains ground on Wednesday ahead of a busy US trading session.
- US API stockpiles data showed a bigger-than-expected decline in inventories.
- The US Dollar Index trades comfortably above 105.00 ahead of US CPI and the Fed’s rate decision.
Oil prices are sprinting higher on Wednesday, touching the highest level since May 30, supported by a larger-than-expected decrease in US inventories. Data from the American Petroleum Institute (API) showed on Tuesday that crude stockpiles declined by 2.428 million barrels in the week ending June 7, well above the 1.75 drawdown expected and swinging from a 4.052 million buildup a week earlier. The Energy Information Administration (EIA) will release its own numbers later this Wednesday, with analysts predicting also a decline in Oil stockpiles.
Meanwhile, the US Dollar Index (DXY) is trading above 105.00 as the dust settles after the political turmoil in Europe, particularly in France, following the results of the parliament elections. Traders are focused on the US data, with the US Consumer Price Index (CPI) numbers ahead of the US opening bell as the main event. This will be followed by the interest-rate decision from the US Federal Reserve (Fed). Although no change in the policy rate is expected, the dot plot projections and the speech from Fed Chairman Jerome Powell could send the DXY in any direction.
At the time of writing, Crude Oil (WTI) trades at $78.28 and Brent Crude at $82.36
Oil news and market movers: Dislocation between price action and option markets
- Option markets flow and positioning still shows traders are unwinding their bullish bets with OPEC+ reopening its production in the fall of 2024 and China demand remaining sluggish, Bloomberg reports.
- Kazakhstan will need to compensate for its additional volume of 45,000 Oil barrels per day as it exceeded its agreed production level within OPEC+. Hence the country will decrease its coming output quota in order to make good on the surplus it released earlier this year, extended until September 2025, Reuters reports.
- At 14:30 GMT, the Energy Information Administration (EIA) will release the weekly Crude stockpile changes. The previous number was a build of 1.233 million barrels, and a drawdown of 1.55 million expected for this week.
Oil Technical Analysis: Fed to kill off any recovery
Oil prices are edging higher, but any further advance hinges on the Fed. Any indication that interest rates could remain higher for longer would kill off any aspirations for Oil traders to jump above $80. Should Fed Chairman Jerome Powell deliver a hawkish speech in terms of no forward guidance, smashing hopes for a rate cut for 2024, a nosedive move in Oil could materialize. As China’s economic recovery is not picking up further, all hopes were placed on the US for a second economic boom and surge in demand. With interest rates remaining high, this might not come, and OPEC+ is set to open up its production back to normal capacity and flood the market.
Looking up, the key two levels ahead of $80.00 are the 100-day and 200-day Simple Moving Averages (SMA) at $79.23 and $79.27, respectively. Next, the 55-day Simple Moving Average (SMA) at $80.37 is a level with a lot of resistance where any recovery rally could pause. Once broken through there, the road looks quite open to head to $87.12.
The $76.00 marker is still acting as a support with the $75.27 level playing a crucial role if traders still want to have an option to head back to $80.00. However, risks are skewed towards another leg lower if the Fed is hawkish, sending Oil further down below $70.00.
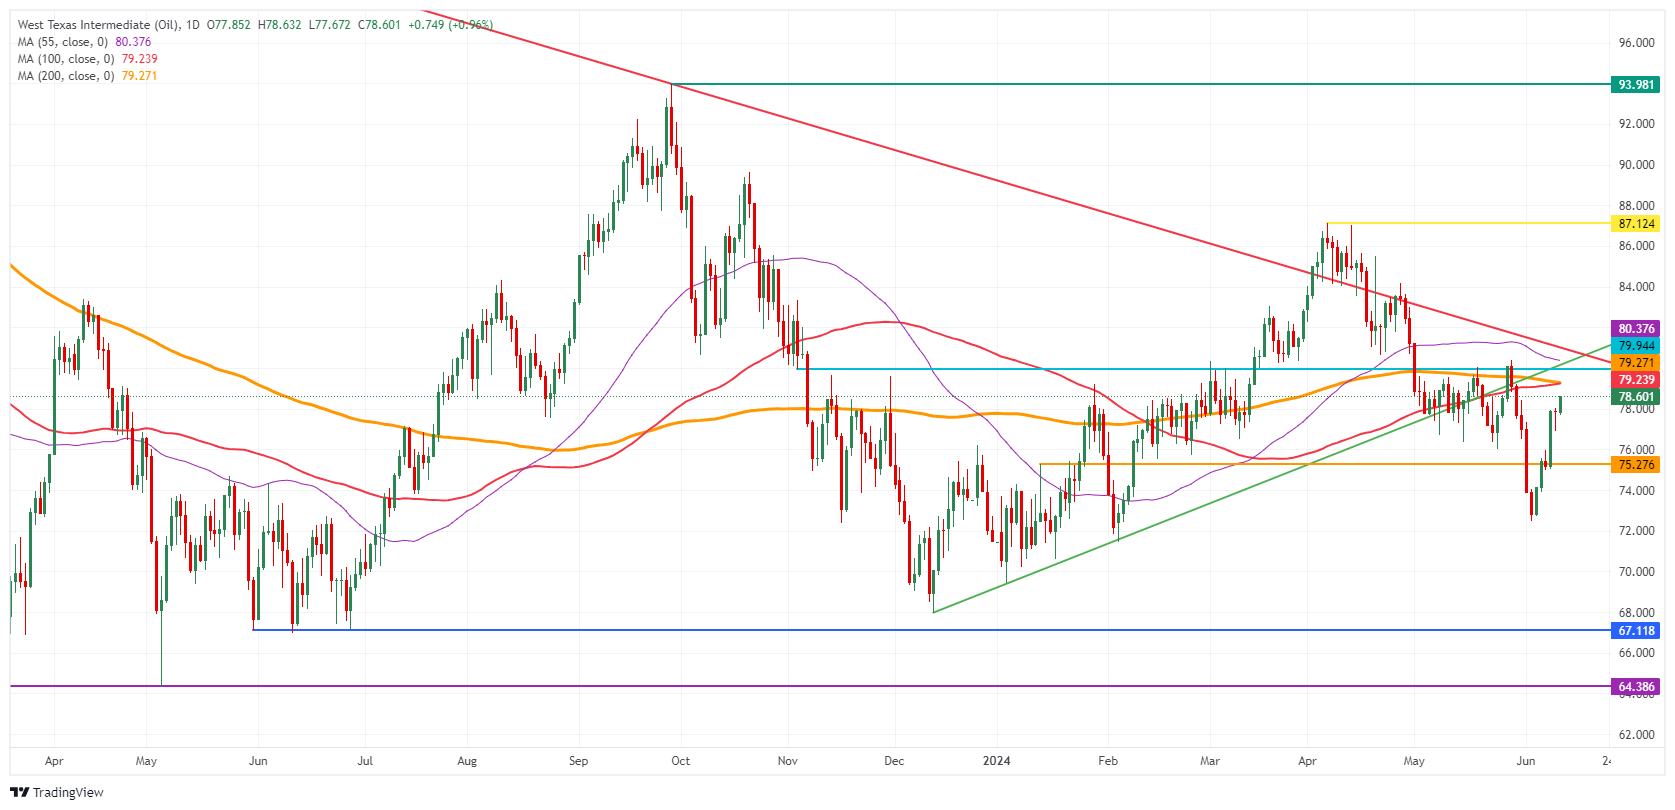
US WTI Crude Oil: Daily Chart
WTI Oil FAQs
WTI Oil is a type of Crude Oil sold on international markets. The WTI stands for West Texas Intermediate, one of three major types including Brent and Dubai Crude. WTI is also referred to as “light” and “sweet” because of its relatively low gravity and sulfur content respectively. It is considered a high quality Oil that is easily refined. It is sourced in the United States and distributed via the Cushing hub, which is considered “The Pipeline Crossroads of the World”. It is a benchmark for the Oil market and WTI price is frequently quoted in the media.
Like all assets, supply and demand are the key drivers of WTI Oil price. As such, global growth can be a driver of increased demand and vice versa for weak global growth. Political instability, wars, and sanctions can disrupt supply and impact prices. The decisions of OPEC, a group of major Oil-producing countries, is another key driver of price. The value of the US Dollar influences the price of WTI Crude Oil, since Oil is predominantly traded in US Dollars, thus a weaker US Dollar can make Oil more affordable and vice versa.
The weekly Oil inventory reports published by the American Petroleum Institute (API) and the Energy Information Agency (EIA) impact the price of WTI Oil. Changes in inventories reflect fluctuating supply and demand. If the data shows a drop in inventories it can indicate increased demand, pushing up Oil price. Higher inventories can reflect increased supply, pushing down prices. API’s report is published every Tuesday and EIA’s the day after. Their results are usually similar, falling within 1% of each other 75% of the time. The EIA data is considered more reliable, since it is a government agency.
OPEC (Organization of the Petroleum Exporting Countries) is a group of 13 Oil-producing nations who collectively decide production quotas for member countries at twice-yearly meetings. Their decisions often impact WTI Oil prices. When OPEC decides to lower quotas, it can tighten supply, pushing up Oil prices. When OPEC increases production, it has the opposite effect. OPEC+ refers to an expanded group that includes ten extra non-OPEC members, the most notable of which is Russia.
- AUD/USD is trading marginally higher ahead of key data from the US.
- The Federal Reserve is expected to change its forecasts and this may boost the USD, weighing on AUD/USD.
- The RBA is the last G10 central bank expected to cut interest rates – a fact that supports AUD/USD.
AUD/USD trades marginally higher in the 0.6610s on Wednesday prior to the release of market-moving inflation data from the US. Later this afternoon, AUD/USD could face further volatility when the US Federal Reserve (Fed) concludes its June policy meeting and releases its latest set of economic forecasts.
The Fed is responsible for setting interest rates in the US, and these, in turn, impact the value of the US Dollar. Higher interest rates cause an appreciation in the USD due to investors reaping higher returns by parking their money in the US; the opposite is true for lower interest rates.
Whilst the Fed is not expected to change its interest rates at the June meeting, the contents of its accompanying statement; the answers given by the Fed Chairman Jerome Powell at the press conference afterwards, and any changes made to the Summary of Economic Projections (SEP) can and probably will influence AUD/USD.
Markets expect the Fed to change its projections of the future course of its interest rate, or “dot-plot”, from forecasting three 0.25% rate cuts in 2024 to less – possibly even just one, according to strategists at Societe Generale.
Such a revision would probably support the USD and weigh on AUD/USD. Any mention of delaying interest rate cuts in the statement or from J Powell might also weigh on the pair.
The Fed’s base interest rate, the Fed Funds Rate is currently 5.25% - 5.50% whilst the Reserve Bank of Australia’s (RBA) policy rate is 4.35%. This would seem to marginally favor the USD over the AUD (bearish for AUD/USD). Due to higher inflation in Australia, however, the RBA, is the last G10 reserve bank expected to cut interest rates, with most analysts not seeing a cut until 2025. The Fed, meanwhile, is slightly more than 50% likely to cut interest rates in September at the time of writing and almost 70% likely by November. The outlook, therefore, suggests US rates will fall, closing the differential – something that is positive for AUD/USD.
US Treasury benchmark 10-year bond yields meanwhile – a measure of inflation expectations and the strength of the US economy – lie at 4.40% compared to Australia’s 4.30%. This overall marginally preferences the USD over the AUD, all other things being equal.
- Silver price hovers above $29.00 ahead of eventful New York session.
- The US CPI data will be followed by the Fed’s policy, which will provide cues about when the central bank will return to policy normalization.
- Fed’s dot plot is expected to show fewer rate cuts than three forecasted in March.
Silver price (XAG/USD) steadies above its crucial support of $29.00 in Wednesday’s European session. The white metal is little changed ahead of the United States (US) Consumer Price Index (CPI) data for May and the Federal Reserve’s (Fed) interest rate decision, which are scheduled in the North American session.
Also, the US Dollar and bond yields pause as investors brace for crucial events. The US Dollar Index (DXY), which tracks the Greenback’s value against six major currencies, edges down to 105.20. 10-year US Treasury Yields steady near 4.40%.
Investors will pay close attention to the US inflation to know whether the progress in the disinflation process has resumed. The CPI data expectedly decelerated in April after remaining stubbornly higher in the first quarter of the year.
Meanwhile, the Fed is expected to remain status quo for the seventh straight time. The major trigger for global markets will be the Fed’s dot plot that indicates where policymakers see Federal fund rates heading in medium and longer-term timeframe.
The dot plot is expected to show fewer rate cuts this year from March’s forecast, given strong labor market conditions and weak confidence of officials on progress in the disinflation process.
Silver technical analysis
Silver price trades inside Thursday’s trading range, exhibiting indecisiveness among market participants. The asset trades close to the neckline of the Head and Shoulder (H&S) chart pattern, which is marked from April 9 high at 1.0885 on a four-hour timeframe. A breakdown of the above-mentioned chart pattern results in a bearish reversal.
The near-term outlook remains uncertain as 20 and 50-day Exponential Moving Averages (EMAs) near $30.00 and $29.60, respectively, are declining.
The 14-period Relative Strength Index (RSI) hovers near 40.00. A bearish momentum would trigger if it breaks below the same.
Silver four-hour chart
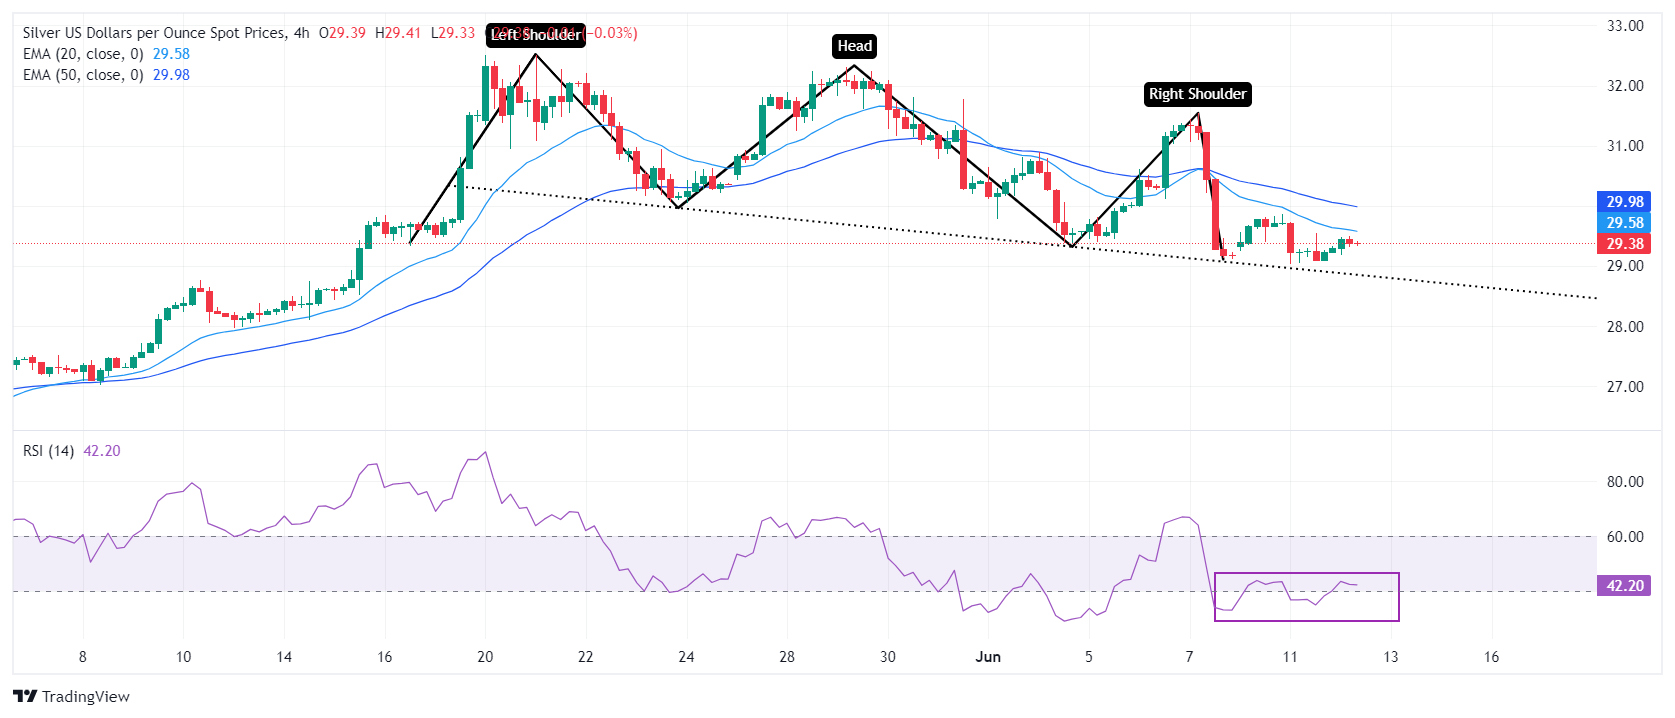
- The US Dollar trades mixed on Wednesday, nearly flat against its most major peers.
- Traders are on edge over upcoming US CPI release for May and the Fed interest rate decision.
- The US Dollar index trades comfortably above 105.00 and is set to face some volatility.
The US Dollar (USD) trades nearly flat in Wednesday’s European session and holds above the 105.00 level ahead of two key economic events: the US Consumer Price Index (CPI) release for May and the US Federal Reserve (Fed) interest rate decision. Meanwhile, in the runup to the US data, markets can digest and let the dust settle over the turmoil in Europe and its recent election results.
On the economic front, market expectations for the monthly core CPI are very narrow, from a low estimate of 0.2% to a high estimate of 0.3%. Headline CPI is expected to range between 0.1% and 0.2%. Should the actual CPI number fall below the lowest expectation or come out above the highest, expect some substantial movements in the US Dollar Index (DXY).
Daily digest market movers: CPI as appetiser ahead of the Fed
- At 11:00 GMT, the Mortgage Bankers Association (MBA) releases the Mortgage Applications number for the week ending on June 7. The previous week, a notable decline of 5.2% was printed, with no expectations available.
- At 12:30 GMT, the US Bureau of Labor Statistics will release the US Consumer Price Index for May:
- Monthly core inflation is expected to increase steadily by 0.3%.
- Monthly headline inflation is seen rising by 0.1% from the 0.3% increase in April.
- Yearly core inflation is expected to soften a touch to 3.5% from 3.6% in April.
- Yearly headline inflation should remain stable at 3.4%.
- Markets will digest the CPI release until 18:00 GMT, when the US Federal Open Market Committee (FOMC) will release its statement on the Federal Reserve’s interest rate decision. As markets have fully priced in an unchanged rate at 5.50%, the dot plot, where all Fed officials get to pencil in their projections and forecasts on how they see monetary policy going forward, will be more important.
- At 18:30 GMT, Fed Chairman Jerome Powell will take the stage and deliver a speech with questions and answers on the recent monetary policy decision.
- Asian equities are in the red across Japan and China. Europe seems to be snapping the losing sentiment and trades in the green, as the US futures.
- The CME FedWatch Tool shows a 47.4% chance of Fed interest rate at the current level in September. Odds for a 25 basic points rate cut stand at 48.3%, while a very slim 4.3% chance is priced in a 50 basic points rate cut
- The benchmark 10-year US Treasury Note slides to the lowest level for this week, near 4.4%, and flirts with further declines.
US Dollar index Technical Analysis: Here come the fireworks
The US Dollar index (DXY) is set to either trade another leg higher or to erase all weekly gains with the US CPI and Fed decision as main drivers on Wednesday. Although, one scenario might be playing out which would result in an actual standstill for the US Dollar. That would be if the disinflation is still on track with CPI coming in softer than expected, being contradicted later on with the Fed rate decision where Fed Chairman Jerome Powell could turn hawkish and say that the Fed will need to stay steady for longer in order to really get inflation where they want it to be.
On the upside, there are some technical or pivotal levels to watch out for. The first is 105.52, a level that held support during most of April. The next level to watch is 105.88, which triggered a rejection at the start of May and will likely play its role as resistance again. Further up, the biggest challenge remains at 106.51, the year-to-date high from April 16.
On the downside, a trifecta of Simple Moving Averages (SMA) is now playing as support. First, and very close, is the 55-day SMA at 105.07. A touch lower, near 104.48, both the 100-day and the 200-day SMA are forming a double layer of protection to support any declines in the US Dollar index. Should this area be broken down, look for 104.00 to salvage the situation.
US Dollar FAQs
The US Dollar (USD) is the official currency of the United States of America, and the ‘de facto’ currency of a significant number of other countries where it is found in circulation alongside local notes. It is the most heavily traded currency in the world, accounting for over 88% of all global foreign exchange turnover, or an average of $6.6 trillion in transactions per day, according to data from 2022. Following the second world war, the USD took over from the British Pound as the world’s reserve currency. For most of its history, the US Dollar was backed by Gold, until the Bretton Woods Agreement in 1971 when the Gold Standard went away.
The most important single factor impacting on the value of the US Dollar is monetary policy, which is shaped by the Federal Reserve (Fed). The Fed has two mandates: to achieve price stability (control inflation) and foster full employment. Its primary tool to achieve these two goals is by adjusting interest rates. When prices are rising too quickly and inflation is above the Fed’s 2% target, the Fed will raise rates, which helps the USD value. When inflation falls below 2% or the Unemployment Rate is too high, the Fed may lower interest rates, which weighs on the Greenback.
In extreme situations, the Federal Reserve can also print more Dollars and enact quantitative easing (QE). QE is the process by which the Fed substantially increases the flow of credit in a stuck financial system. It is a non-standard policy measure used when credit has dried up because banks will not lend to each other (out of the fear of counterparty default). It is a last resort when simply lowering interest rates is unlikely to achieve the necessary result. It was the Fed’s weapon of choice to combat the credit crunch that occurred during the Great Financial Crisis in 2008. It involves the Fed printing more Dollars and using them to buy US government bonds predominantly from financial institutions. QE usually leads to a weaker US Dollar.
Quantitative tightening (QT) is the reverse process whereby the Federal Reserve stops buying bonds from financial institutions and does not reinvest the principal from the bonds it holds maturing in new purchases. It is usually positive for the US Dollar.
- Gold is down marginally as traders foresee fewer interest rate cuts in the US and China’s PBoC halts its Gold buying.
- The precious metal could experience volatility when impactful CPI data and the Fed meeting decision are released on Wednesday.
- XAU/USD continues to bump up against key resistance at $2,315.
Gold (XAU/USD) trades marginally lower on Wednesday as expectations that interest rates in the US will remain high, and news the People’s Bank of China (PBoC) has halted Gold buying after an 18-month spree, weigh on the precious metal.
Gold trades in the $2,310s ahead of potentially market-moving data from the US in the form of the Consumer Price Index (CPI) data for May followed by the Federal Reserve’s (Fed) Open Market Committee Meeting (FOMC).
Gold weakens on elevated rate outlook
Interest rates in the US are expected to remain higher for longer and this is weighing on the price of Gold. US Nonfarm Payrolls (NFP) data on Friday suggested that a buoyant labor market and rising wages might continue to push up inflation. This, in turn, reduced the probabilities of the Fed seeing fit to lower interest rates in September. The maintenance of higher interest rates for longer increases the opportunity cost of holding non-yielding Gold, making it less attractive to investors.
Now investors await US CPI data for May out at 12:30 GMT in order to get feedback on the current trajectory of inflation. Economists are expecting broad prices to have risen by 0.1% month-over-month and 3.4% year-over-year. Core prices are seen rising by 0.3% and 3.5%, respectively. Higher-than-expected readings will fuel the inflation narrative portrayed by the payrolls data, further reducing the probability of a cut by September, which currently stands at 53% according to the CME FedWatch Tool. November will then come into view as the most likely month for the Fed to begin lowering interest rates. Such a scenario would probably lead to a bearish reaction in Gold.
After the CPI data will come the FOMC at 18:00 GMT. Although the Fed is not seen changing interest rates, investors expect changes to the Summary of Economic Projections (SEP) or “dot-plot”, which provides a graphical view of how Fed members see interest rates evolving in the future. Currently the dot-plot is signaling the Fed cutting interest rates three times in 2024, in 0.25% tranches. Given the recent strong NFP data – and dependent on the CPI release – however, this figure may be lower in the new SEP. If so, traders could sell Gold.
Technical Analysis: Gold continues to retest key resistance
Gold continues to pull back and retest resistance from the bottom of its previous range at $2,315. That said, Gold is probably in a short-term downtrend, and given that “the trend is your friend,” the odds favor it continuing lower in the short-term.
The next downside target is at around $2,285, the 100% extrapolation of the down-move prior to the trendline break in May, or “a”.
XAU/USD 4-hour Chart
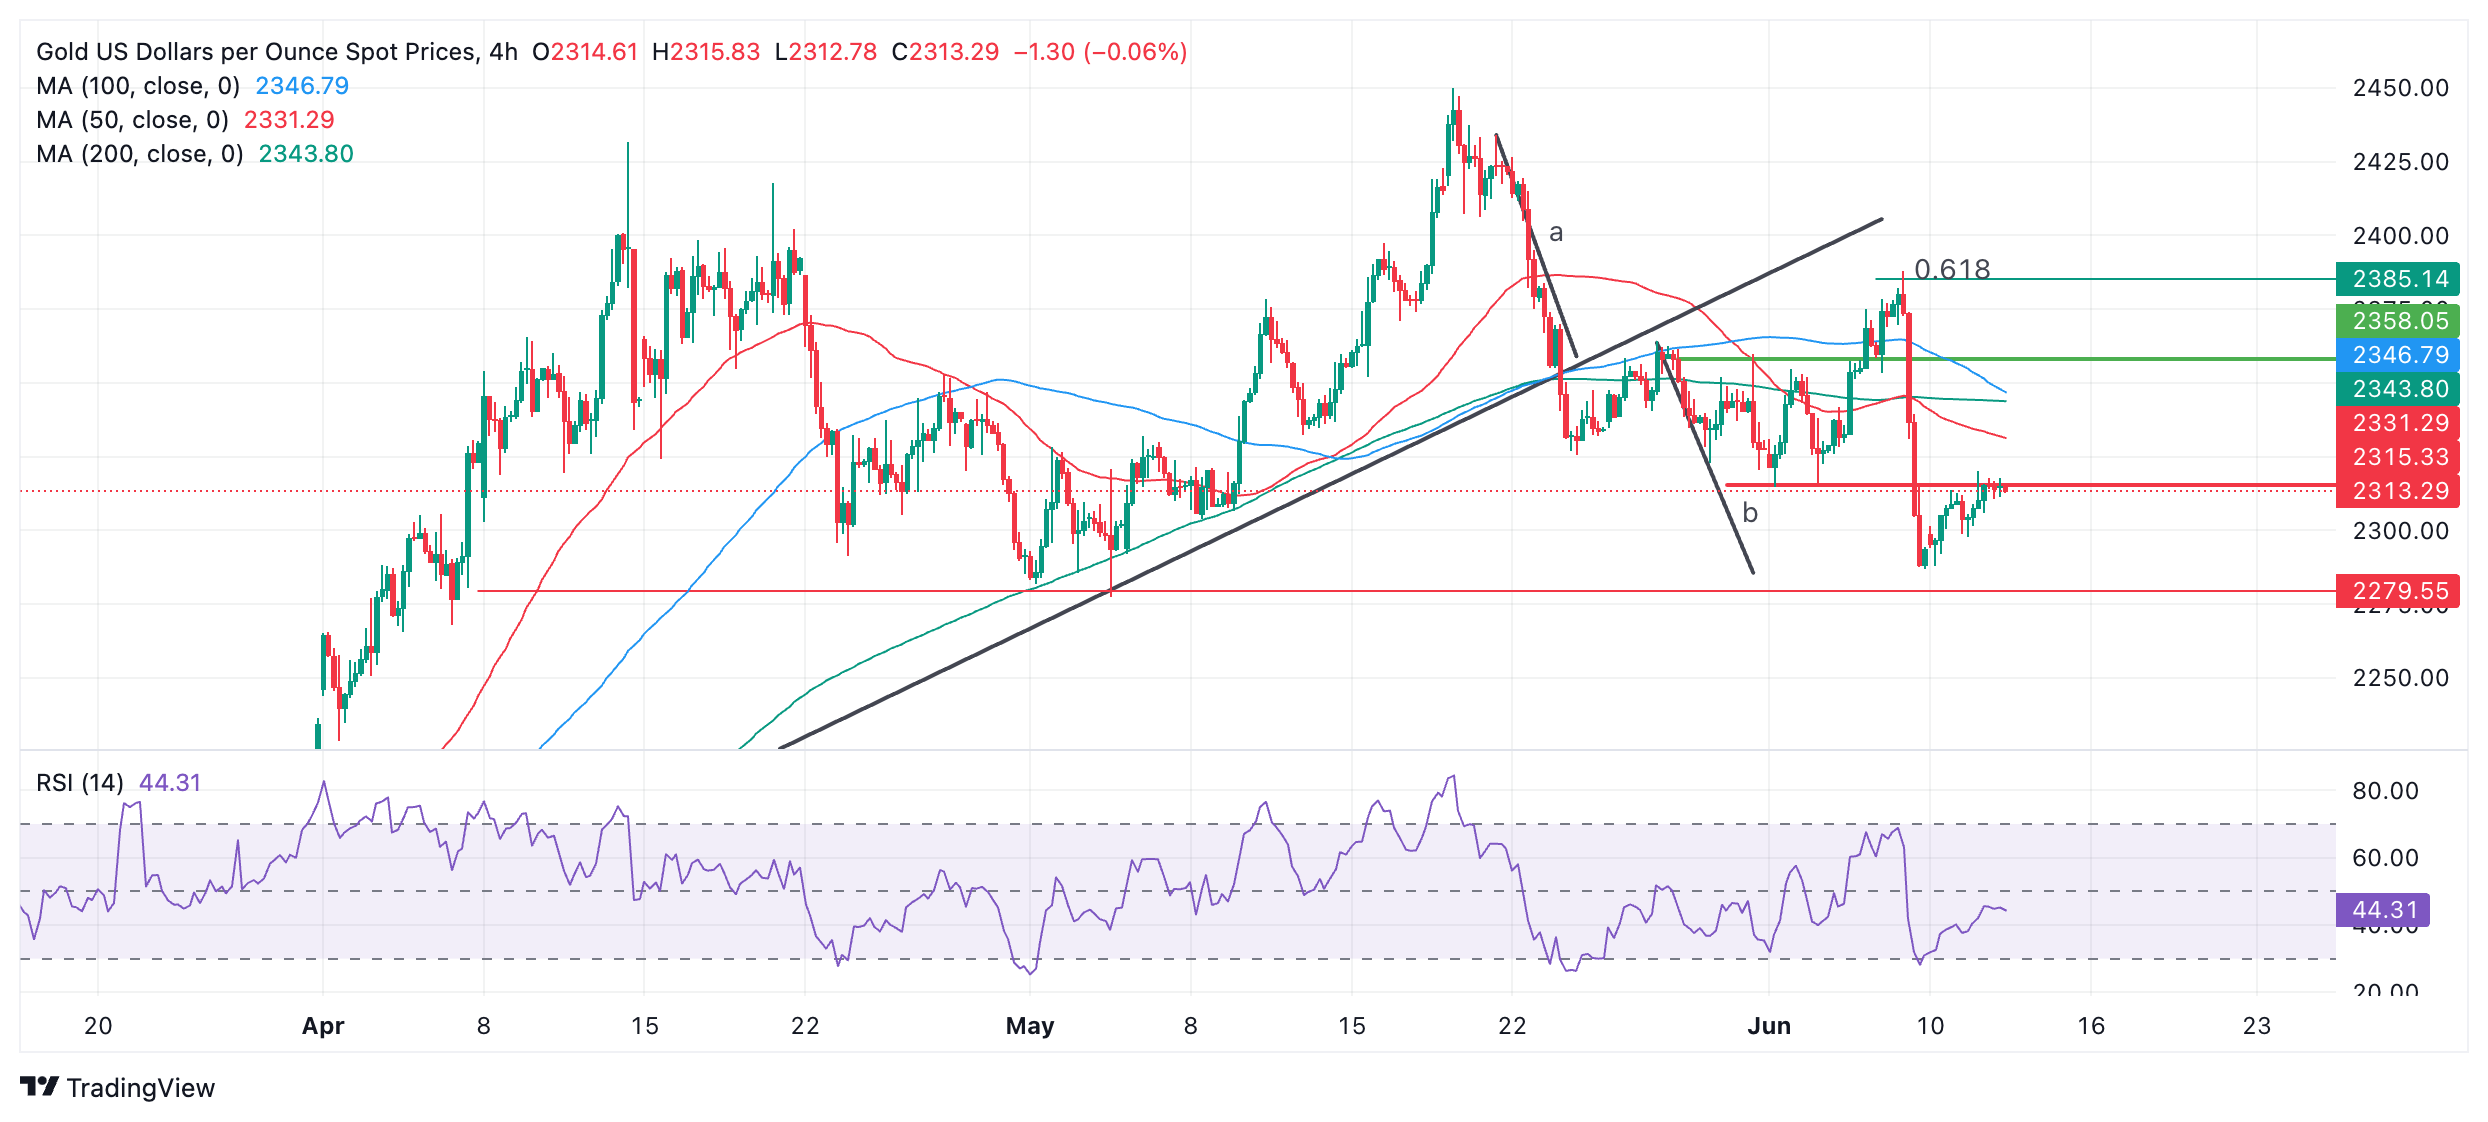
A stronger move down could see Gold meet support at $2,279 (late April-early May swing low).
On the other hand, a decisive break above the resistance level at $2,315 could suggest the short-term downtrend is losing momentum and more upside might be on the horizon.
Despite short-term weakness, the precious metal’s medium and long-term trends are still bullish, and the chances of a recovery remain high.
Economic Indicator
Consumer Price Index (MoM)
Inflationary or deflationary tendencies are measured by periodically summing the prices of a basket of representative goods and services and presenting the data as The Consumer Price Index (CPI). CPI data is compiled on a monthly basis and released by the US Department of Labor Statistics. The MoM figure compares the prices of goods in the reference month to the previous month.The CPI is a key indicator to measure inflation and changes in purchasing trends. Generally, a high reading is seen as bullish for the US Dollar (USD), while a low reading is seen as bearish.
Read more.Next release: Wed Jun 12, 2024 12:30
Frequency: Monthly
Consensus: 0.1%
Previous: 0.3%
Source: US Bureau of Labor Statistics
The US Federal Reserve has a dual mandate of maintaining price stability and maximum employment. According to such mandate, inflation should be at around 2% YoY and has become the weakest pillar of the central bank’s directive ever since the world suffered a pandemic, which extends to these days. Price pressures keep rising amid supply-chain issues and bottlenecks, with the Consumer Price Index (CPI) hanging at multi-decade highs. The Fed has already taken measures to tame inflation and is expected to maintain an aggressive stance in the foreseeable future.
- The Federal Reserve is widely expected to hold policy rate unchanged.
- Fed Chairman Powell’s remarks could provide important clues about the timing of the policy pivot.
- Markets see a strong chance that the Fed will wait until September to lower the interest rate.
The US Federal Reserve (Fed) will announce monetary policy decisions following the June policy meeting and release the revised Summary of Economic Projections (SEP), the so-called dot plot, on Wednesday. Market participants widely anticipate that the US central bank will leave the policy rate unchanged at 5.25%-5.5% for the seventh consecutive meeting.
The CME FedWatch Tool shows that markets see little to no chance of a rate cut either in June or July. Hence, investors will scrutinize the SEP and comments from Fed Chairman Jerome Powell to try to confirm or deny a policy pivot in September. According to the CME FedWatch Tool, there is a 51% probability of a no change in the Fed interest rate in September.
The data from the US showed that the core Personal Consumption Expenditures (PCE) Price Index, the Fed’s preferred gauge of inflation, rose 0.2% on a monthly basis in April. This reading came in below the market expectation for an increase of 0.3% and revived optimism about a Fed policy pivot in September. The upbeat employment figures for May, however, caused investors to reassess the US central bank’s policy outlook. After the US Bureau of Labor Statistics reported that Nonfarm Payrolls rose 272,000 in May, compared to the market expectation of 185,000, and the annual wage inflation edged higher to 4.1% from 4% in April, the probability of a Fed rate cut in September dropped to 49% from 60% before the release.
The dot plot published in March showed that policymakers were expecting the Fed to lower the policy rate by a total of 75 basis points in 2024, while expecting the annual core PCE inflation to be at 2.6%, up from 2.4% projected in December’s SEP.
Previewing the Fed meeting, “the FOMC is expected to keep the Fed funds target range unchanged at 5.25%-5.50%, with Chair Powell likely providing a similar policy message to May,” TD Securities analysts say and add:
“However, the risk is that the chairman appears optimistic given the recent evolution of the consumer, and if May CPI inflation shows progress. We expect the dot plot to show two cuts as the new median for 2024, and four for 2025.”
When will the Fed announce its interest rate decision and how could it affect EUR/USD?
The US Federal Reserve is scheduled to announce its interest rate decision and publish the monetary policy statement alongside the SEP on Wednesday, June 12, at 18:00 GMT. This will be followed by Chairman Powell's press conference starting at 18:30 GMT.
In his last public appearance, Chairman Powell said they are committed to bringing inflation back to 2% but acknowledged that the restrictive policy may take longer than expected to reach this goal. "I don't think it's likely that the next move would be a rate hike, it’s more likely that we would hold the policy rate where it is,” he added.
In case the dot plot shows that policymakers are still expecting a total of 75 bps reduction in the policy rate in 2024, this could be seen as a significant dovish surprise and weigh heavily on the US Treasury bond yields and the US Dollar (USD). Nevertheless, this scenario is extremely unlikely at this point.
The market positioning suggests that the USD is facing a two-way risk heading into the event. The CME FedWatch Tool shows that there is a less-than-50% probability of the Fed lowering the policy rate by 50 bps in 2024. If the dot plot points to two 25 bps cuts this year, the initial reaction could weigh on US T-bond yields and force the USD to weaken against its rivals. On the other hand, the USD is likely to outperform its rivals in case policymakers foresee a single rate cut in 2024. Finally, there could be a strong USD rally if the SEP shows that several some policymakers prefer the policy rate to remain unchanged for the rest of the year.
FXStreet analyst Yohay Elam shares a brief preview of possible market reaction to the dot plot. “A median of one cut would boost the US Dollar (USD), while two cuts would buoy stocks and Gold,” Elam says and continues: “Investors will also eye the statement, especially comments on inflation, on the back of fresh CPI data published earlier in the day. The key word is confidence. If the bank is confident that inflation is falling, it would be positive to markets, while reiterating a worried approach on price rises would weigh.”
Meanwhile, Eren Sengezer, European Session Lead Analyst at FXStreet, provides a short-term technical outlook for EUR/USD:
“The Relative Strength Index (RSI) on the daily chart dropped below 50 following the sharp two-day decline seen on Friday and Monday, reflecting the bearish shift in the short-term outlook. Additionally, EUR/USD fell below the 1.0790-1.0800 area, where the lower limit of the ascending regression channel meets the 100-day and the 200-day Simple Moving Averages (SMA).”
“If EUR/USD fails to reclaim 1.0790-1.0800, technical sellers could remain interested. In this scenario, an extended slide toward 1.0680 (Fibonacci 78.6% retracement of the uptrend that started in mid-April) and 1.0620 (beginning point of the uptrend) could be seen. On the upside, the 20-day SMA could act as interim resistance at 1.0850 before 1.0900 (mid-point of the ascending channel) and 1.0970 (upper limit of the ascending channel), once the pair stabilizes above 1.0790-1.0800.”
Interest rates FAQs
Interest rates are charged by financial institutions on loans to borrowers and are paid as interest to savers and depositors. They are influenced by base lending rates, which are set by central banks in response to changes in the economy. Central banks normally have a mandate to ensure price stability, which in most cases means targeting a core inflation rate of around 2%. If inflation falls below target the central bank may cut base lending rates, with a view to stimulating lending and boosting the economy. If inflation rises substantially above 2% it normally results in the central bank raising base lending rates in an attempt to lower inflation.
Higher interest rates generally help strengthen a country’s currency as they make it a more attractive place for global investors to park their money.
Higher interest rates overall weigh on the price of Gold because they increase the opportunity cost of holding Gold instead of investing in an interest-bearing asset or placing cash in the bank. If interest rates are high that usually pushes up the price of the US Dollar (USD), and since Gold is priced in Dollars, this has the effect of lowering the price of Gold.
The Fed funds rate is the overnight rate at which US banks lend to each other. It is the oft-quoted headline rate set by the Federal Reserve at its FOMC meetings. It is set as a range, for example 4.75%-5.00%, though the upper limit (in that case 5.00%) is the quoted figure. Market expectations for future Fed funds rate are tracked by the CME FedWatch tool, which shapes how many financial markets behave in anticipation of future Federal Reserve monetary policy decisions.
Economic Indicator
FOMC Economic Projections
At four of its eight scheduled annual meetings, the Federal Reserve (Fed) releases a report detailing its projections for inflation, the unemployment rate and economic growth over the next two years and, more importantly, a breakdown of each Federal Open Market Committee (FOMC) member's individual interest rate forecasts.
Read more.Last release: Wed Mar 20, 2024 18:00
Frequency: Irregular
Actual: -
Consensus: -
Previous: -
Source: Federal Reserve
- USD/CAD trades cautiously ahead of US Inflation and Fed’s policy outcome
- The Fed is expected to leave interest rates unchanged for seventh straight time.
- The BoC could deliver subsequent rate cuts, given weak labor market conditions.
The USD/CAD pair drops to 1.3740 in Wednesday’s European session after failing to recapture the round-level resistance of 1.3800 on Tuesday. The Loonie asset corrects as firm recovery of almost 1.40$ in the US Dollar Index (DXY) appears to be stalling due to uncertainty ahead of the United States (US) Consumer Price Index (CPI) data for May and the Federal Reserve’s (Fed) interest rate decision, which are scheduled in the North American session.
US annual core CPI, which excludes volatile food and energy prices, is estimated to have eased slightly to 3.5% from April’s release of 3.6%, with headline figures growing steadily by 3.4%. The inflation data turning out to be stubborn would weaken market expectations for the Fed to begin reducing interest rates from the September meeting, while soft number would boost them.
Meanwhile, investors will majorly focus on the Fed’s dot plot as the central bank is expected to remain status quo for the seventh straight time.
The Canadian Dollar remains broadly on the backfoot as investors expect that the Bank of Canada (BoC) could deliver subsequent rate cuts to boost labor demand. Canada’s inflation has already declined into BoC’s preferred core CPI range of 1%-3%.
USD/CAD strengthens after a breakout of the Descending Triangle chart pattern formed on a daily timeframe. Upward-sloping 20- and 50-day Exponential Moving Averages (EMAs) near 1.3700 and 1.3660, respectively, suggest that the overall trend is bullish.
The 14-period Relative Strength Index (RSI) hovers near 60.00. A sustainable move above the same will push momentum towards the upside.
Fresh buying opportunity would emerge if the asset breaks above April 17 high at 1.3838. This would drive the asset towards 1 November 2023 high at 1.3900, followed by the psychological resistance of 1.4000.
In an alternate scenario, a breakdown below June 7 low at 1.3663 will expose the asset to May 3 low around 1.3600 and April 9 low around 1.3547.
USD/CAD daily chart
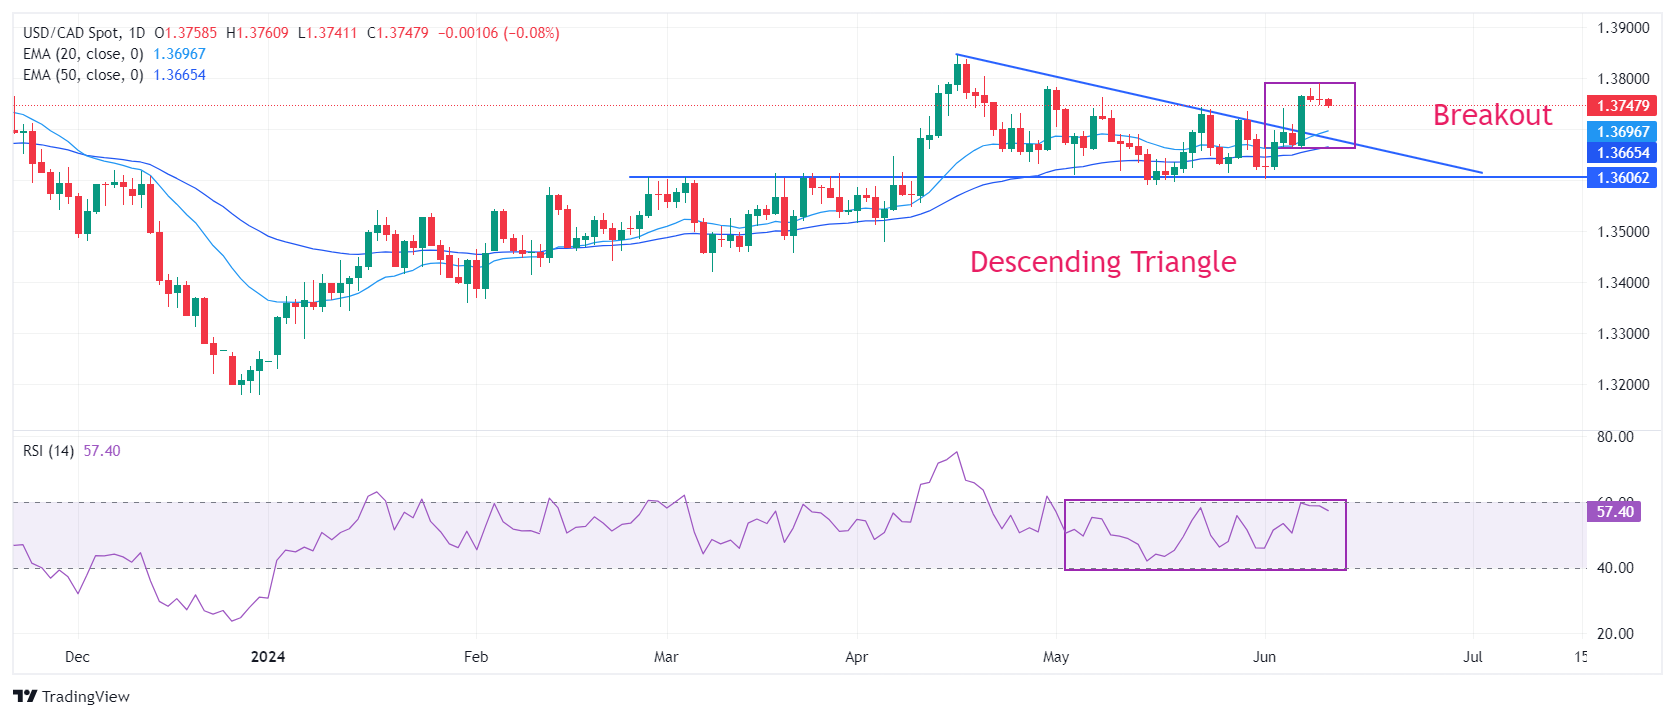
- EUR/USD finds support near 1.0710 but the outlook remains uncertain ahead of an eventful New York session.
- The US CPI and the Fed’s dot plot will provide cues about the time frame and number of rate cuts this year.
- ECB policymakers refrain from providing a specific interest-rate path.
EUR/USD edges higher to 1.0750 in Wednesday’s European session ahead of the United States (US) Consumer Price Index (CPI) data for May and the Federal Reserve’s (Fed) interest rate decision, which are scheduled for the American session. The US Dollar Index (DXY), which tracks the Greenback’s value against six major currencies, falls slightly to 105.20.
Investors will pay close attention to US inflation data and the Fed’s dot plot as it is widely expected that the central bank will leave interest rates unchanged in the range of 5.25%-5.50% for the seventh time in a row. The US inflation data will provide cues about when the Fed will start reducing interest rates. The Fed’s dot plot indicates where policymakers see the federal funds rate heading in the medium and long-term time frames.
Economists see US annual core inflation, which strips off volatile food and energy prices, decelerating to 3.5% from April’s reading of 3.6%. In the same period, headline inflation is expected to have grown steadily by 3.4%. Monthly headline CPI is estimated to have grown at a slower pace of 0.1% from 0.3% in April, with core inflation rising steadily by 0.3%.
Currently, financial markets are mixed about the Fed choosing the September meeting as the one in which the central bank will begin cutting interest rates. Traders pared Fed rate-cut bets for September after the US Nonfarm Payrolls (NFP) report for May indicated robust job demand and strong wage growth, which suggested a stubborn inflation outlook.
The new projections for the number of rate cuts are expected to show fewer rate cuts compared to the three predicted In March’s dot plot as officials lose confidence over progress in the disinflation process. Consumer Price Index (CPI) data for the January-March period turned out to be stronger than expected, highlighting the persistence of inflation. However, price pressures abated as expected in April but failed to bring conviction that the disinflation process has resumed.
Daily digest market movers: EUR/USD steadies as US Dollar falls slightly
- EUR/USD finds a cushion and rebounds slightly to 1.0750 despite caution ahead of an eventful New York session and uncertainty surrounding the French elections. Political stability in the Eurozone shaked after French President Emmanuel Macron’s decision to call for a snap election after suffering a defeat by Jordan Bardella-led far-right National Rally, popularly known as Rassemblement National (RN).
- Exit polls on Monday showed that the RN party could win 235 to 265 seats, still short of the 289 needed for an absolute majority, Reuters reported. Analysts see Macron’s decision to call a snap election as a gamble that could further weaken the position of the Centralist alliance.
- Meanwhile, uncertainty over the European Central Bank’s (ECB) interest-rate path appears to be waning as policymakers are holding themselves back from committing to any specific rate-cut trajectory. ECB officials worry that inflation could remain sticky in the next few months due to steady wage growth, which fuels service inflation. In May, Eurozone service inflation rose to 4.1%, the highest in seven months.
- ECB policymaker and Governor of the French central bank Francois Villeroy de Galhau said on Tuesday that he is confident that price pressures will return to its 2% target next year but they have to pass through some bumps in monthly data. "This 'noise' is not very meaningful, and hence we are still more 'outlook driven' and will look still more closely at the inflation forecast,” Villeroy added, according to Reuters.
Technical Analysis: EUR/USD returns inside triangle formation
EUR/USD finds temporary support after sliding to an almost five-week low near 1.0710. The near-term outlook of the major currency pair remains downbeat as it has fallen back inside the Symmetrical Triangle chart formation on a daily time frame after a fakeout. The shared currency pair is expected to find support near 1.0636, the upward-sloping order of the above-mentioned chart pattern plotted from 3 October 2023 low at 1.0448.
The long-term outlook of the shared currency pair has also turned negative as it drops below the 200-day Exponential Moving Average (EMA), which trades around 1.0800.
The 14-period Relative Strength Index (RSI) falls sharply to 40.00. A decisive break below the same would trigger a bearish momentum.
Euro FAQs
The Euro is the currency for the 20 European Union countries that belong to the Eurozone. It is the second most heavily traded currency in the world behind the US Dollar. In 2022, it accounted for 31% of all foreign exchange transactions, with an average daily turnover of over $2.2 trillion a day. EUR/USD is the most heavily traded currency pair in the world, accounting for an estimated 30% off all transactions, followed by EUR/JPY (4%), EUR/GBP (3%) and EUR/AUD (2%).
The European Central Bank (ECB) in Frankfurt, Germany, is the reserve bank for the Eurozone. The ECB sets interest rates and manages monetary policy. The ECB’s primary mandate is to maintain price stability, which means either controlling inflation or stimulating growth. Its primary tool is the raising or lowering of interest rates. Relatively high interest rates – or the expectation of higher rates – will usually benefit the Euro and vice versa. The ECB Governing Council makes monetary policy decisions at meetings held eight times a year. Decisions are made by heads of the Eurozone national banks and six permanent members, including the President of the ECB, Christine Lagarde.
Eurozone inflation data, measured by the Harmonized Index of Consumer Prices (HICP), is an important econometric for the Euro. If inflation rises more than expected, especially if above the ECB’s 2% target, it obliges the ECB to raise interest rates to bring it back under control. Relatively high interest rates compared to its counterparts will usually benefit the Euro, as it makes the region more attractive as a place for global investors to park their money.
Data releases gauge the health of the economy and can impact on the Euro. Indicators such as GDP, Manufacturing and Services PMIs, employment, and consumer sentiment surveys can all influence the direction of the single currency. A strong economy is good for the Euro. Not only does it attract more foreign investment but it may encourage the ECB to put up interest rates, which will directly strengthen the Euro. Otherwise, if economic data is weak, the Euro is likely to fall. Economic data for the four largest economies in the euro area (Germany, France, Italy and Spain) are especially significant, as they account for 75% of the Eurozone’s economy.
Another significant data release for the Euro is the Trade Balance. This indicator measures the difference between what a country earns from its exports and what it spends on imports over a given period. If a country produces highly sought after exports then its currency will gain in value purely from the extra demand created from foreign buyers seeking to purchase these goods. Therefore, a positive net Trade Balance strengthens a currency and vice versa for a negative balance.
Silver prices (XAG/USD) rose on Wednesday, according to FXStreet data. Silver trades at $29.37 per troy ounce, up 0.31% from the $29.28 it cost on Tuesday.
Silver prices have increased by 15.31% since the beginning of the year.
| Unit measure | Today Price |
|---|---|
| Silver price per troy ounce | $29.37 |
| Silver price per gram | $0.94 |
The Gold/Silver ratio, which shows the number of troy ounces of Silver needed to equal the value of one troy ounce of Gold, stood at 78.81 on Wednesday, down from 79.13 on Tuesday.
Investors might use this ratio to determine the relative valuation of Gold and Silver. Some may consider a high ratio as an indicator that Silver is undervalued – or Gold is overvalued – and might buy Silver or sell Gold accordingly. Conversely, a low ratio might suggest that Gold is undervalued relative to Silver.
Silver FAQs
Silver is a precious metal highly traded among investors. It has been historically used as a store of value and a medium of exchange. Although less popular than Gold, traders may turn to Silver to diversify their investment portfolio, for its intrinsic value or as a potential hedge during high-inflation periods. Investors can buy physical Silver, in coins or in bars, or trade it through vehicles such as Exchange Traded Funds, which track its price on international markets.
Silver prices can move due to a wide range of factors. Geopolitical instability or fears of a deep recession can make Silver price escalate due to its safe-haven status, although to a lesser extent than Gold's. As a yieldless asset, Silver tends to rise with lower interest rates. Its moves also depend on how the US Dollar (USD) behaves as the asset is priced in dollars (XAG/USD). A strong Dollar tends to keep the price of Silver at bay, whereas a weaker Dollar is likely to propel prices up. Other factors such as investment demand, mining supply – Silver is much more abundant than Gold – and recycling rates can also affect prices.
Silver is widely used in industry, particularly in sectors such as electronics or solar energy, as it has one of the highest electric conductivity of all metals – more than Copper and Gold. A surge in demand can increase prices, while a decline tends to lower them. Dynamics in the US, Chinese and Indian economies can also contribute to price swings: for the US and particularly China, their big industrial sectors use Silver in various processes; in India, consumers’ demand for the precious metal for jewellery also plays a key role in setting prices.
Silver prices tend to follow Gold's moves. When Gold prices rise, Silver typically follows suit, as their status as safe-haven assets is similar. The Gold/Silver ratio, which shows the number of ounces of Silver needed to equal the value of one ounce of Gold, may help to determine the relative valuation between both metals. Some investors may consider a high ratio as an indicator that Silver is undervalued, or Gold is overvalued. On the contrary, a low ratio might suggest that Gold is undervalued relative to Silver.
(An automation tool was used in creating this post.)
- The Mexican Peso continues to weaken to new lows as investors weigh the impact of the new government reforms.
- President-elect Claudia Sheinbaum gives the go-ahead for discussions of key reforms pledged by her predecessor.
- USD/MXN breaks above key October 2023 highs, bringing long-term trend into confusion.
The Mexican Peso (MXN) continues to depreciate on Wednesday as investors fret about constitutional reforms proposed by the left-wing administration of President-elect Dr. Claudia Sheinbaum.
Critics argue the reforms – which encompass minimum wages, state-sector pensions and the judiciary, amongst other things – could be negative for the economy and in some cases anti-democratic.
At the time of writing a single US Dollar (USD) will now buy you 18.63 Mexican Pesos (compared to circa 17.00 just prior to the election). EUR/MXN, meanwhile, is trading at 20.04 and GBP/MXN at 23.77.
Mexican Peso weakens after Sheinbaum launches reform agenda
The Mexican Peso extends its post-June 2 election slump on Wednesday after the President-elect gave the green light to a raft of reforms proposed by her predecessor, and fellow Morena party representative, President Andrés Manuel López Obrador (AMLO).
Sheinbaum announced, during a press conference at the Palacio Nacional on Monday, that she would be putting forward as a priority the discussion of reforms to the judiciary, the re-election of officials to public posts, and teachers’ pensions. Markets roiled in the aftermath, both from the uncertainty of the outcomes of these “discussions” and their effect on the economy, according to the Financial Times (FT).
Sheinbaum said that after she elects her cabinet next week the “constitutional reform of the judiciary would be among the first reforms to be approved.” When asked if these reforms would weaken the Mexican Peso, Sheinbaum said she did not believe they would impact financial markets.
Markets bite back
However, foreign exchange traders had other ideas, selling the Peso in droves after Sheinbaum’s comments.
“It wasn’t clear if the discussions would lead to changes to the plans, and her assurances did little to calm foreign exchange traders. The Peso, one of the most liquid emerging market currencies, weakened almost 2%,” said Christine Murray, Mexico and Central America Correspondent for the FT.
The new reforms to the judiciary will mean judges are elected by popular vote, not appointed as is currently the case. The proposed policy encompasses the heads of bar associations, law schools, and lower court judges. Judges will also have their salaries and terms capped. The reforms stem from criticisms of the current system which it is argued enables corruption and cronyism.
Critics, however, argue the reforms will lead to an erosion of the checks and balances of the executive's power, according to Bloomberg News. AMLO himself, for example, has been waging a war against the country’s top court after it obstructed his efforts to push through reforms during his presidency.
Sheinbaum seeks to hardwire the reforms into the Mexican constitution, thereby enshrining them in law “forever”, yet this requires a supermajority in both houses (over two-thirds of the seats). Unlike AMLO, Sheinbaum’s coalition, Sigamos Haciendo Historia (SHH), now has a supermajority in the Congress and is only two seats short in the Senate.
In her press conference, Sheinbaum also promised to build the “second floor” of López Obrador’s project to raise minimum wages, increase social programs and build mega-infrastructure projects. However, the banning of independent sector regulators would be in the second wave.
Although some analysts, such as those at JP Morgan, have said the Peso’s depreciation due to the election is overdone, other experts say some of the reforms violate Mexico’s trade agreement with the US and Canada, raising the prospect of a trade war which would undoubtedly harm the Mexican currency.
Sheinbaum also stated at her press conference that she would be meeting a delegation sent by US President Joe Biden on Wednesday.
Investors fear AMLO’s last month
The Mexican Peso has also weakened on investors’ concerns at the possibility that AMLO himself may use the SHH supermajority to push through the reforms before he retires on October 1.
“Congress is expected to convene on September 1, potentially giving López Obrador a one-month window to push through reforms before retiring,” said a report from AFP News on Barron’s.
Technical Analysis: USD/MXN breaks above key October 2023 high
USD/MXN continues to extend its uptrend after decisively breaking above key resistance at 18.49 (October 2023 high).
USD/MXN Daily Chart
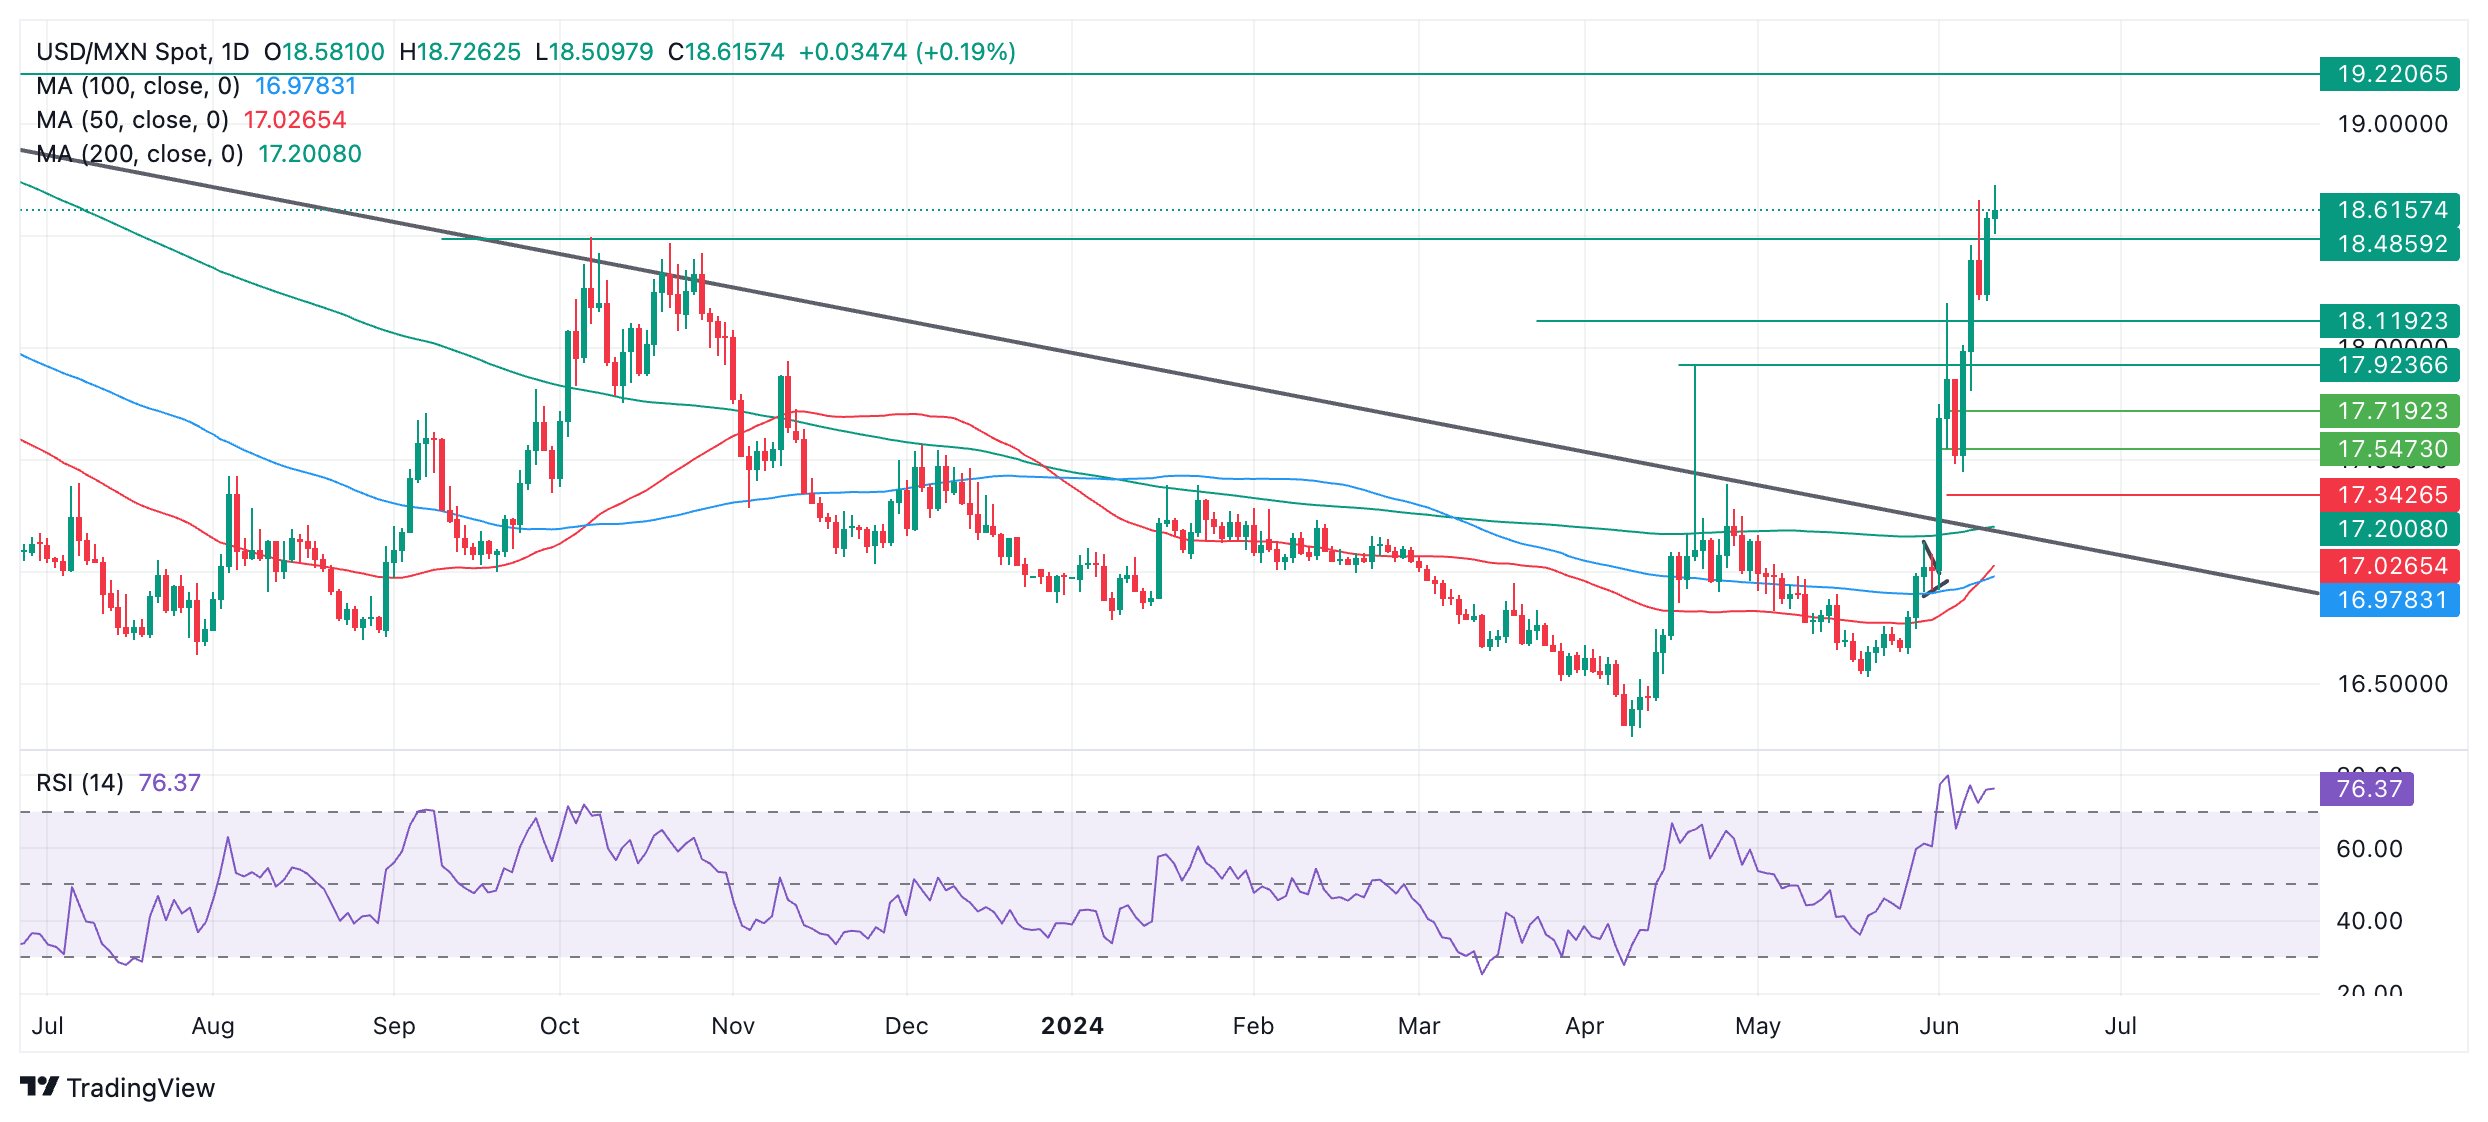
Given “the trend is your friend,” the odds favor a continuation even higher in the short-term, with the next target potentially situated at 19.22 (March 2023 high).
The Relative Strength Index (RSI) is in the overbought zone, however, suggesting traders should not add to their long positions. It also increases the possibility of a pullback developing, although the established uptrend is likely to eventually resume.
The direction of the long-term trend is in doubt after the break above the October 2023 high. Previous to that, it was down.
Mexican Peso FAQs
The Mexican Peso (MXN) is the most traded currency among its Latin American peers. Its value is broadly determined by the performance of the Mexican economy, the country’s central bank’s policy, the amount of foreign investment in the country and even the levels of remittances sent by Mexicans who live abroad, particularly in the United States. Geopolitical trends can also move MXN: for example, the process of nearshoring – or the decision by some firms to relocate manufacturing capacity and supply chains closer to their home countries – is also seen as a catalyst for the Mexican currency as the country is considered a key manufacturing hub in the American continent. Another catalyst for MXN is Oil prices as Mexico is a key exporter of the commodity.
The main objective of Mexico’s central bank, also known as Banxico, is to maintain inflation at low and stable levels (at or close to its target of 3%, the midpoint in a tolerance band of between 2% and 4%). To this end, the bank sets an appropriate level of interest rates. When inflation is too high, Banxico will attempt to tame it by raising interest rates, making it more expensive for households and businesses to borrow money, thus cooling demand and the overall economy. Higher interest rates are generally positive for the Mexican Peso (MXN) as they lead to higher yields, making the country a more attractive place for investors. On the contrary, lower interest rates tend to weaken MXN.
Macroeconomic data releases are key to assess the state of the economy and can have an impact on the Mexican Peso (MXN) valuation. A strong Mexican economy, based on high economic growth, low unemployment and high confidence is good for MXN. Not only does it attract more foreign investment but it may encourage the Bank of Mexico (Banxico) to increase interest rates, particularly if this strength comes together with elevated inflation. However, if economic data is weak, MXN is likely to depreciate.
As an emerging-market currency, the Mexican Peso (MXN) tends to strive during risk-on periods, or when investors perceive that broader market risks are low and thus are eager to engage with investments that carry a higher risk. Conversely, MXN tends to weaken at times of market turbulence or economic uncertainty as investors tend to sell higher-risk assets and flee to the more-stable safe havens.
In its monthly oil market report published on Wednesday, the International Energy Agency (IEA) slashed the 2024 global oil demand growth forecast by 100,000 bpd to 960,000 barrels per day (bpd).
Additional takeaways
Sees 2025 oil demand growth at 1 mln bpd amid a muted economy and clean energy technology deployment.
Non-OPEC+ producers led by united states will make up three-quarters of production capacity increase to 2030.
Demand growth to be led by Asian economies, especially by road transport in India and jet fuel, petchems in China.
Oil demand in advanced economies will fall to less than 43 mln bpd by 2030 from close to 46 mln bpd in 2023.
Global oil demand will rise to nearly 106 mln bpd toward end of decade from around 102 mln bpd in 2023.
Supply surplus this decade should make oil companies examine their strategies.
Global oil demand set to peak by 2029 at 105.6 mln bpd and contract narrowly in 2030.
By 2030 oil supply capacity will rise to nearly 114 mln bpd or 8 mln bpd above global demand.
Market reaction
At the time of writing, WTI is testing eight-day highs near $78.50, up 0.55% on the day.
WTI Oil FAQs
WTI Oil is a type of Crude Oil sold on international markets. The WTI stands for West Texas Intermediate, one of three major types including Brent and Dubai Crude. WTI is also referred to as “light” and “sweet” because of its relatively low gravity and sulfur content respectively. It is considered a high quality Oil that is easily refined. It is sourced in the United States and distributed via the Cushing hub, which is considered “The Pipeline Crossroads of the World”. It is a benchmark for the Oil market and WTI price is frequently quoted in the media.
Like all assets, supply and demand are the key drivers of WTI Oil price. As such, global growth can be a driver of increased demand and vice versa for weak global growth. Political instability, wars, and sanctions can disrupt supply and impact prices. The decisions of OPEC, a group of major Oil-producing countries, is another key driver of price. The value of the US Dollar influences the price of WTI Crude Oil, since Oil is predominantly traded in US Dollars, thus a weaker US Dollar can make Oil more affordable and vice versa.
The weekly Oil inventory reports published by the American Petroleum Institute (API) and the Energy Information Agency (EIA) impact the price of WTI Oil. Changes in inventories reflect fluctuating supply and demand. If the data shows a drop in inventories it can indicate increased demand, pushing up Oil price. Higher inventories can reflect increased supply, pushing down prices. API’s report is published every Tuesday and EIA’s the day after. Their results are usually similar, falling within 1% of each other 75% of the time. The EIA data is considered more reliable, since it is a government agency.
OPEC (Organization of the Petroleum Exporting Countries) is a group of 13 Oil-producing nations who collectively decide production quotas for member countries at twice-yearly meetings. Their decisions often impact WTI Oil prices. When OPEC decides to lower quotas, it can tighten supply, pushing up Oil prices. When OPEC increases production, it has the opposite effect. OPEC+ refers to an expanded group that includes ten extra non-OPEC members, the most notable of which is Russia.
- NZD/USD inches lower as the US Dollar remains strong ahead of the Fed’s interest rate decision on Wednesday.
- CME FedWatch Tool suggests the likelihood of a Fed rate cut in September has decreased to 52%.
- The RBNZ is anticipated to maintain its current interest rate until at least mid-2025.
NZD/USD edges lower as traders favor the US Dollar (USD) ahead of the Federal Reserve's (Fed) decision and the release of US inflation figures for May, scheduled for later in the North American trading hours. The NZD/USD pair edges lower to near 0.6140 during the European hours on Wednesday.
The Federal Reserve is widely expected to keep the policy rate unchanged, maintaining it in the range of 5.25%-5.50% in June as it strives to reduce inflation toward its 2% target. The strong US labor market conditions have reduced the chances of a Fed rate cut in September. According to the CME FedWatch Tool, the probability of a Fed rate cut in September by at least 25 basis points has decreased to 52%, down from 67% a week earlier.
Investors will likely closely monitor key US inflation data, which is due later in the North American session. The US headline and core CPI figures for May are projected to show year-over-year increases of 3.4% and 3.5%, respectively.
On Kiwi’s front, consumer inflation remained steady in May, while producer price deflation eased in China, a major trade partner of New Zealand. This situation suggests a need for additional stimulus to boost demand. China's Consumer Price Index (CPI) remained consistent at a 0.3% increase year-over-year in May, falling short of the expected 0.4% rise. On a monthly basis, Chinese CPI decreased by 0.1%, compared to a 0.1% increase in April.
Despite a weakening economy, high interest rates in New Zealand have continued to support the New Zealand Dollar (NZD). The Reserve Bank of New Zealand (RBNZ) is anticipated to maintain its current policy stance until at least mid-2025.
- USD/CHF moves sideways ahead of the interest rate decision by the Fed.
- The Swiss Franc may appreciate due to the hawkish sentiment surrounding the SNB.
- CME FedWatch Tool suggests the probability of a Fed rate cut in September has decreased to 52%.
USD/CHF moves sideways with low liquidity, trading around 0.8970 during the early European session on Wednesday. The Swiss Franc (CHF) receives support against the US Dollar (USD) as the Swiss National Bank (SNB) is unlikely to implement an interest rate cut in June. Previously, SNB Chairman Thomas J. Jordan warned of minor upside risks to inflation expectations.
Traders are anticipating the SNB Financial Stability Report on Thursday, which will provide an assessment of the banking sector's stability and the financial market infrastructure. Additionally, Producer and Import Prices will also be eyed.
The US Dollar (USD) remains stable ahead of the Federal Reserve’s (Fed) policy decision on Wednesday. The Fed is anticipated to keep interest rates steady in the range of 5.25%-5.50% as it aims to curb inflation toward its 2% target.
The robust US jobs data for May has reduced the odds of the Fed interest rate cut in September. The CME FedWatch Tool indicates that the likelihood of a Fed rate cut in September by at least 25 basis points has decreased to 52%, down from 67% a week earlier.
Investors will also observe key US inflation data, which is expected later in the North American session. The US headline and core CPI figures for May are estimated to show year-over-year increases of 3.4% and 3.5%, respectively.
- The Pound Sterling holds to recent gains around 1.2750 even as the UK economy remained stagnant in April.
- UK Manufacturing output and Industrial Production contracted significantly in April.
- Market sentiment remains cautious ahead of US inflation data and the Fed’s decision.
The Pound Sterling (GBP) hovers around 1.2750 against the US Dollar (USD) in Wednesday’s London session, broadly unaffected by the United Kingdom's (UK) monthly Gross Domestic Product (GDP) and Industrial Production data for April. The UK Office for National Statistics (ONS) reported that the economy remained stagnant, as economists expected, signaling a subdued start to the second quarter.
The UK economy failed to grow in April as a mild expansion in the services sector was offset by a decline in Industrial Production and construction output. The decrease in manufacturing sector activity was driven by lower production in the pharmaceutical and food sectors, the data showed.
Manufacturing Output and Industrial Production data, which measure factory activity, contracted at a faster pace than expected in April after expanding in March. Monthly Manufacturing Production declined by a sharp 1.4% vs. expectations of a slight fall of 0.2%. In the same period, Industrial Production dropped by 0.9% against expectations of a meager 0.1% decline.
Weak factory data suggests that households and businesses struggle to bear the burden of high interest rates by the Bank of England (BoE). This could force the BoE to start easing its monetary policy sooner.
Still, other indicators may prompt policymakers to hold back calls for rate cuts. UK wage growth remains high, becoming a major barrier for the BoE to return to policy normalization. Wages rose steadily by 6.0% in the three months to April, which is significantly higher than what is needed for inflation to return to the desired rate of 2%.
Daily digest market movers: Pound Sterling to remain volatile ahead of US CPI, Fed’s decision
- The Pound Sterling is slightly firm against the US Dollar ahead of the United States (US) Consumer Price Index (CPI) data for May and the Federal Reserve’s (Fed) monetary policy announcement in the New York session. The inflation data will significantly influence market expectations about when and how far the Fed will reduce interest rates this year. Recently, stronger-than-projected employment creation and wage growth have already diminished expectations for the Fed to begin lowering key borrowing rates from the September meeting.
- Annual core inflation, which strips off volatile food and energy prices, is estimated to have decelerated to 3.5% from April’s reading of 3.6%. In the same period, the headline inflation is expected to have grown steadily by 3.4%. While monthly headline inflation is forecasted to have grown at a slower pace of 0.1% from the former release of 0.3%, the core CPI is estimated to have maintained a steady growth rate of 0.3%.
- Volatility is expected to be high in Wednesday’s American session as the US inflation data will be followed by Fed’s monetary policy decision. The Fed is widely anticipated to leave rates unchanged at current levels of 5.25%-5.50%. Therefore, investors will pay close attention to Fed’s dot plot, which indicates where policymakers see the federal fund rate heading in medium and long-term time frames.
- Recent economic data suggests that labor market conditions are tight and price pressures are still high, so Fed policymakers are expected to be more hawkish compared with the last dot plot. Officials are expected to argue in favor of at most two rate cuts this year against three projected in March’s dot plot.
Technical Analysis: Pound Sterling remains supported
The Pound Sterling shows a cautious recovery move from an almost two-week low of 1.2690 ahead of key US economic events. The GBP/USD pair continues to remain well-supported by the 20-day Exponential Moving Average (EMA), which trades around 1.2714. Also, the 50-day EMA is sloping higher, suggesting that the near-term trend is still upbeat.
The Cable still holds the 61.8% Fibonacci retracement support at 1.2665, which is plotted from the March 8 high of 1.2900 to the April 22 low at 1.2300.
The 14-period Relative Strength Index (RSI) has shifted into the 40.00-60.00 range, suggesting that the momentum is losing strength.
Here is what you need to know on Wednesday, June 12:
The US Dollar (USD) holds steady early Wednesday as investors gear up for key macroeconomic events that could significantly impact the currency's valuation. The US Bureau of Labor Statistic will release the Consumer Price Index data for May in the early American session. Later in the day, the Federal Reserve will announce monetary policy decisions and publish the revised Summary of Economic Projections (SEP), the so-called dot plot.
US Dollar PRICE This week
The table below shows the percentage change of US Dollar (USD) against listed major currencies this week. US Dollar was the strongest against the Euro.
| USD | EUR | GBP | JPY | CAD | AUD | NZD | CHF | |
|---|---|---|---|---|---|---|---|---|
| USD | 0.56% | -0.14% | 0.28% | -0.06% | -0.46% | -0.54% | -0.01% | |
| EUR | -0.56% | -0.36% | -0.02% | -0.36% | -0.74% | -0.84% | -0.32% | |
| GBP | 0.14% | 0.36% | 0.46% | -0.00% | -0.38% | -0.49% | 0.03% | |
| JPY | -0.28% | 0.02% | -0.46% | -0.33% | -0.81% | -0.93% | -0.25% | |
| CAD | 0.06% | 0.36% | 0.00% | 0.33% | -0.36% | -0.49% | 0.04% | |
| AUD | 0.46% | 0.74% | 0.38% | 0.81% | 0.36% | -0.10% | 0.44% | |
| NZD | 0.54% | 0.84% | 0.49% | 0.93% | 0.49% | 0.10% | 0.53% | |
| CHF | 0.01% | 0.32% | -0.03% | 0.25% | -0.04% | -0.44% | -0.53% |
The heat map shows percentage changes of major currencies against each other. The base currency is picked from the left column, while the quote currency is picked from the top row. For example, if you pick the US Dollar from the left column and move along the horizontal line to the Japanese Yen, the percentage change displayed in the box will represent USD (base)/JPY (quote).
The action in foreign exchange markets remained choppy in the absence of high-tier data releases on Tuesday. Although the USD Index registered daily gains, it struggled to gather bullish momentum. The benchmark 10-year US Treasury bond yield lost more than 2% and Wall Street's main indexes ended the day mixed. The annual CPI is forecast to rise 3.4% in May, matching April's increase. On a monthly basis, the CPI and the core CPI, which excludes volatile food and energy prices, is expected to increase 0.1% and 0.3%, respectively. Later in the day, the Fed is set to leave the policy rate unchanged at 5.25%-5.5% range. Investors will pay close attention to macroeconomic projections, especially the interest rate.
US CPI set to steady in May ahead of Federal Reserve decision.
The data from China showed earlier in the day that the CPI declined 0.1% on a monthly basis, while the annual CPI rose 0.3%. After closing the day virtually unchanged on Tuesday, AUD/USD edged higher in the Asian session on Wednesday and was last seen trading slightly above 0.6600.
Australian Dollar trades with modest gains, awaits Fed rate decision.
USD/JPY extends its sideways grind above 157.00 early Wednesday after failing to make a decisive move in either direction on Tuesday. The Producer Price Index in Japan rose 0.7% on a monthly basis in May, surpassing the market expectation for an increase of 0.4%.
Japanese Yen may see limited downside due to higher producer prices.
The UK's Office for National Statistics reported that the UK economy stagnated in April, with the monthly real Gross Domestic Product arriving at 0%. In the same period, Industrial Production contracted by 0.9% and the Manufacturing Production decreased by 1.4%. GBP/USD largely ignored these readings and was last seen fluctuating slightly below 1.2750.
EUR/USD remained under bearish pressure and registered its lowest daily close in over a month below 1.0750 on Tuesday. The pair struggles to stage a rebound and continues to trade below 1.0750 in the European morning on Wednesday.
After finding support near $2,300, Gold recovered modestly and registered small gains on Monday and Tuesday. XAU/USD stays relatively quiet in the European morning and fluctuates above $2,310.
Gold price fails to attract buyers as traders await US CPI and Fed decision.
Economic Indicator
FOMC Economic Projections
At four of its eight scheduled annual meetings, the Federal Reserve (Fed) releases a report detailing its projections for inflation, the unemployment rate and economic growth over the next two years and, more importantly, a breakdown of each Federal Open Market Committee (FOMC) member's individual interest rate forecasts.
Read more.Last release: Wed Mar 20, 2024 18:00
Frequency: Irregular
Actual: -
Consensus: -
Previous: -
Source: Federal Reserve
European Central Bank (ECB) Governing Council member and Bank of France President, Francois Villeroy de Galhau, made some comments on the French economic and political scenario on Wednesday.
Key quotes
Cannot comment on political situation.
I think that it is important that, whatever is the result of this vote, France can quickly clarify its economic strategy and in particular its budget strategy.
Before the announcement on snap elections, we had already mentioned hazards of the environment.
Inflation will be below 2% in france starting next year, even at 1.7%.
Market reaction
EUR/USD is oscillating below 1.0750, modestly flat on the day.
- EUR/GBP trades in negative territory for the fourth consecutive day near 0.8430 on Wednesday.
- UK GDP arrived at 0% in April after expanding 0.4% in March, in line with the consensus.
- German HICP figure rose 2.8% YoY in May, compared to the previous reading and the estimation of 2.8%.
The EUR/GBP cross extends the decline around 0.8430 during the early European trading hours on Wednesday. Meanwhile, political uncertainty in Europe exerts some selling pressure on the Euro (EUR) against the Pound Sterling (GBP).
The latest data published by the Office for National Statistics (ONS) showed on Wednesday that the UK Gross Domestic Product (GDP) stagnated in April after growing 0.4% in March, in line with the market consensus. Meanwhile, the UK Industrial Production came in worse than expected in April, dropping 0.9% on a monthly basis from a 0.2% increase in March. The mixed UK economic data did little to no impact on the Euro as risk sentiment remains to influence the currency pair.
France's President Emmanuel Macron has dissolved the country's parliament and announced a snap election after exit polls indicated that his Renaissance party would be defeated by the far-right opposition in European parliamentary elections on Sunday, per CNN. The political uncertainty surrounding the Eurozone's second-biggest economy weighs on the shared currency and acts as a headwind for EUR/GBP.
Furthermore, inflation in Germany remained elevated in May, Destatis reported on Wednesday. The German Harmonized Index of Consumer Prices (HICP) rose 2.8% YoY in May, compared to the previous reading and the estimation of 2.8%. On a monthly basis, the HICP figure increased by 0.2% MoM in May, compared to the forecast of 0.2%.
Gold prices remained broadly unchanged in India on Wednesday, according to data compiled by FXStreet.
The price for Gold stood at 6,218.89 Indian Rupees (INR) per gram, broadly stable compared with the INR 6,224.64 it cost on Tuesday.
The price for Gold was broadly steady at INR 72,535.91 per tola from INR 72,602.97 per tola a day earlier.
| Unit measure | Gold Price in INR |
|---|---|
| 1 Gram | 6,218.89 |
| 10 Grams | 62,188.90 |
| Tola | 72,535.91 |
| Troy Ounce | 193,429.20 |
FXStreet calculates Gold prices in India by adapting international prices (USD/INR) to the local currency and measurement units. Prices are updated daily based on the market rates taken at the time of publication. Prices are just for reference and local rates could diverge slightly.
Global Market Movers: Comex Gold price treads water amid Fed rate jitters, stronger USD
- Reduced bets for an imminent interest rate cut by the Federal Reserve in September, along with China's decision to pause buying, turn out to be key factors capping the upside for the Gold price.
- The current market pricing indicates that the Fed could cut rates by only 25 basis points this year, either at the November or December policy meeting, which continues to underpin the US Dollar.
- The USD Index (DXY), which tracks the Greenback against a basket of currencies, stands tall near its highest level since May 9 and contributes to keeping a lid on the Dollar-denominated commodity.
- Traders, however, now seem reluctant and prefer to wait for more cues about the likely timing when the Fed will start cutting interest rates before placing fresh directional bets around the XAU/USD.
- Hence, the focus will remain glued to Wednesday's release of the latest US consumer inflation figures and the crucial FOMC monetary policy decision, due to be announced later during the US session.
- Stronger jobs and wage data released on Friday raised concerns that inflation may remain sticky amid a still resilient US economy, which, in turn, will reaffirm higher for longer interest rates narrative.
- The headline US Consumer Price Index is expected to ease to 0.1% in May from the 0.3% previous, and the yearly rate is seen unchanged at 3.4%, still well above the Fed's annualized target of 2%.
- Moreover, Core CPI is anticipated to hold steady at 0.3% during the reported month and edge lower to the 3.5% YoY rate from 3.6% in April, reaffirming stubbornly high inflationary pressure.
- Meanwhile, the US central bank is expected to leave interest rates unchanged and release updated economic projections, including the so-called "dot plot", which will influence the precious metal.
Gold FAQs
Gold has played a key role in human’s history as it has been widely used as a store of value and medium of exchange. Currently, apart from its shine and usage for jewelry, the precious metal is widely seen as a safe-haven asset, meaning that it is considered a good investment during turbulent times. Gold is also widely seen as a hedge against inflation and against depreciating currencies as it doesn’t rely on any specific issuer or government.
Central banks are the biggest Gold holders. In their aim to support their currencies in turbulent times, central banks tend to diversify their reserves and buy Gold to improve the perceived strength of the economy and the currency. High Gold reserves can be a source of trust for a country’s solvency. Central banks added 1,136 tonnes of Gold worth around $70 billion to their reserves in 2022, according to data from the World Gold Council. This is the highest yearly purchase since records began. Central banks from emerging economies such as China, India and Turkey are quickly increasing their Gold reserves.
Gold has an inverse correlation with the US Dollar and US Treasuries, which are both major reserve and safe-haven assets. When the Dollar depreciates, Gold tends to rise, enabling investors and central banks to diversify their assets in turbulent times. Gold is also inversely correlated with risk assets. A rally in the stock market tends to weaken Gold price, while sell-offs in riskier markets tend to favor the precious metal.
The price can move due to a wide range of factors. Geopolitical instability or fears of a deep recession can quickly make Gold price escalate due to its safe-haven status. As a yield-less asset, Gold tends to rise with lower interest rates, while higher cost of money usually weighs down on the yellow metal. Still, most moves depend on how the US Dollar (USD) behaves as the asset is priced in dollars (XAU/USD). A strong Dollar tends to keep the price of Gold controlled, whereas a weaker Dollar is likely to push Gold prices up.
(An automation tool was used in creating this post.)
FX option expiries for June 12 NY cut at 10:00 Eastern Time, via DTCC, can be found below
- EUR/USD: EUR amounts
- 1.0700 567m
- 1.0800 2.1b
- 1.0810 940m
- 1.0900 711m
- 1.0950 654m
- GBP/USD: GBP amounts
- 1.2795 1.8b
- 1.2805 645m
- USD/JPY: USD amounts
- 156.00 940m
- 156.60 757m
- 157.00 842m
- 157.50 610m
- USD/CHF: USD amounts
- 0.8800 748m
- 0.8975 494m
- AUD/USD: AUD amounts
- 0.6615 1.4b
- 0.6620 1.2b
- 0.6630 1.1b
- 0.6650 798m
- USD/CAD: USD amounts
- 1.3800 751m
- 1.3850 485m
- NZD/USD: NZD amounts
- 0.6100 990m
- 0.6200 1.5b
- EUR/GBP: EUR amounts
- 0.8480 460m
- UK GDP came in at 0% MoM in April vs. 0% forecast.
- GBP/USD remains below 1.2750 after the UK data.
The UK economy stalled in April, with GDP arriving at 0% after expanding 0.4% in March, the latest data published by the Office for National Statistics (ONS) showed on Wednesday. Markets expected no growth in the reported period.
Meanwhile, the Index of services (April) came in at 0.9% 3M/3M vs. March’s 0.7% print and 0.8% forecast.
Other data from the UK showed that Industrial Production and Manufacturing Production dropped 0.9% and 1.4%, respectively, on a monthly basis, in April.
Separately, the UK Goods Trade Balance came in at GBP-19.607 billion MoM in April vs. GBP-14.20 billion expected and GBP-13.967 billion previously.
Market reaction to the UK data
The Pound Sterling is unperturbed by the mixed UK economic data. At the press time, GBP/USD is trading 0.05% higher on the day at 1.2746.
British Pound PRICE Today
The table below shows the percentage change of British Pound (GBP) against listed major currencies today. British Pound was the strongest against the Japanese Yen.
| USD | EUR | GBP | JPY | CAD | AUD | NZD | CHF | |
|---|---|---|---|---|---|---|---|---|
| USD | -0.04% | -0.05% | 0.08% | -0.09% | -0.20% | -0.08% | -0.02% | |
| EUR | 0.04% | -0.01% | 0.12% | -0.09% | -0.19% | -0.04% | 0.00% | |
| GBP | 0.05% | 0.01% | 0.14% | -0.05% | -0.14% | 0.00% | 0.03% | |
| JPY | -0.08% | -0.12% | -0.14% | -0.20% | -0.29% | -0.16% | -0.11% | |
| CAD | 0.09% | 0.09% | 0.05% | 0.20% | -0.11% | 0.05% | 0.06% | |
| AUD | 0.20% | 0.19% | 0.14% | 0.29% | 0.11% | 0.15% | 0.20% | |
| NZD | 0.08% | 0.04% | -0.00% | 0.16% | -0.05% | -0.15% | 0.03% | |
| CHF | 0.02% | 0.00% | -0.03% | 0.11% | -0.06% | -0.20% | -0.03% |
The heat map shows percentage changes of major currencies against each other. The base currency is picked from the left column, while the quote currency is picked from the top row. For example, if you pick the British Pound from the left column and move along the horizontal line to the US Dollar, the percentage change displayed in the box will represent GBP (base)/USD (quote).
- GBP/USD may gain ground as technical analysis suggests a bullish bias for the pair.
- The momentum indicator MACD suggests confirmation of a bullish trend for the pair.
- The pair may find immediate support at the 21-day EMA at 1.2712, followed by the lower boundary of the ascending channel at 1.2700.
The GBP/USD pair consolidates near 1.2750 during the Asian session on Wednesday. The pair maintains its position within an ascending channel pattern on the daily chart, with the 14-day Relative Strength Index (RSI) above the 50 level, indicating a bullish bias.
Furthermore, the Moving Average Convergence Divergence (MACD) momentum indicator reinforces the bullish trend. The MACD line is above the centerline and diverges above the signal line, suggesting further upward movement.
In terms of resistance, the psychological level of 1.2800 poses a significant barrier. A breakthrough above this level could propel the GBP/USD pair toward testing the upper boundary of the ascending channel around 1.3000.
To the downside, initial support is evident at the 21-day Exponential Moving Average (EMA) situated at 1.2715, with further support lying at the lower boundary of the ascending channel around 1.2700. Should the GBP/USD pair breach this level, it might encounter additional pressure, potentially testing the vicinity of the throwback support at 1.2450.
GBP/USD: Daily Chart
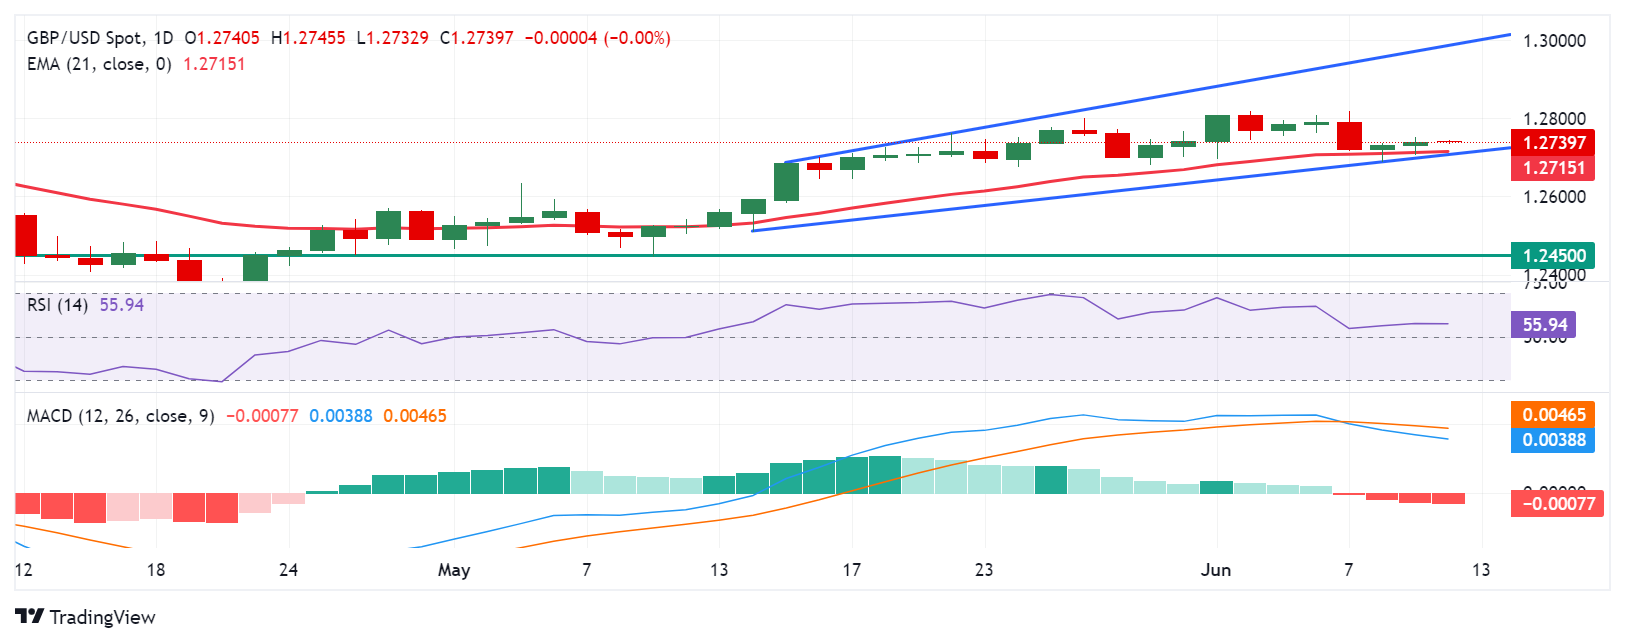
- Silver price edges higher near $29.40 Wednesday’s Asian session, up 0.40% on the day.
- The negative stance of Silver remains intact below the 100-period EMA, with a bearish RSI indicator.
- The crucial resistance level is seen at the $30.0 psychological mark; the initial support level is located at $29.04.
The Silver price (XAG/USD) recovers to $29.40 on Wednesday despite the stronger Greenback. However, the upside for white metal might be limited by the speculation of delayed rate cuts by the US Federal Reserve (Fed). The market could turn cautious later in the day ahead of the release of the US Consumer Price Index (CPI) and the Fed interest rate decision.
Technically, Silver keeps the bearish vibe unchanged on the 4-hour chart as the white metal holds below the key 100-period Exponential Moving Average (EMA). Furthermore, the downward momentum is supported by the Relative Strength Index (RSI), which stands in the bearish zone near 43.0, suggesting the path of least resistance is to the downside.
The key upside barrier for silver will emerge at $30.0, the psychological mark and 100-period EMA. A decisive break above the latter will see a rally to $30.90, the upper boundary of the Bollinger Band. The additional upside filter to watch is a high of June 7 at $31.55, and finally a high of May 29 at $32.31.
On the flip side, a low of June 11 at $29.04 acts as an initial support level for XAG/USD. Any follow-through selling below this level will see a drop to the lower limit of the Bollinger Band at $28.40. Further south, the next contention level is located at the $28.00 round figure.
Silver (XAG/USD) 4-hour chart
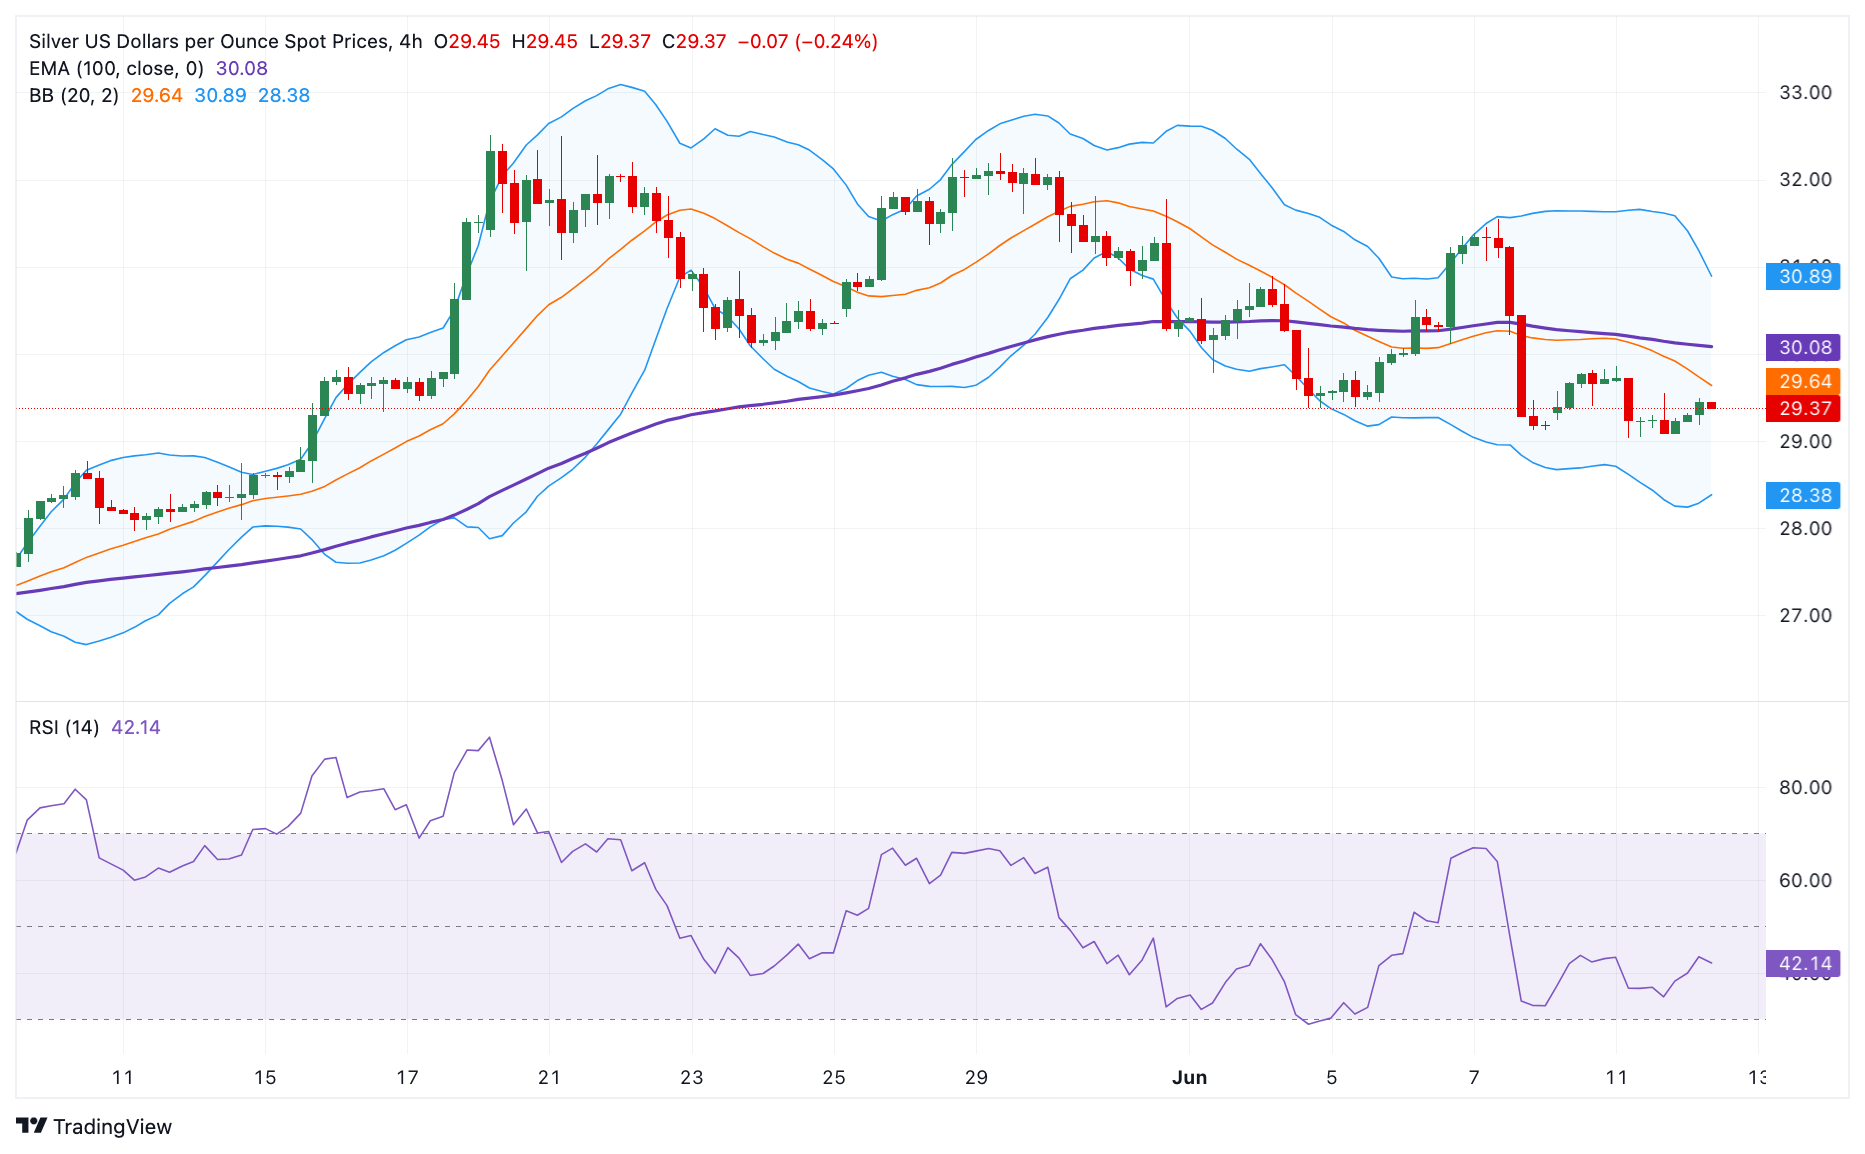
- EUR/USD struggles to lure buyers and is undermined by a combination of factors.
- Reduced Fed rate cut bets continue to lend support to the USD and cap the upside.
- Political uncertainty in Europe weighs on the Euro ahead of the US CPI and Fed.
The EUR/USD pair oscillates in a narrow range during the Asian session on Wednesday and consolidates its losses registered over the past three days, to the 1.0720 area, or the lowest level since early May touched the previous day. Spot prices currently trade just below mid-1.0700s, nearly unchanged for the day, as traders await the release of the US consumer inflation figures and the crucial FOMC decision before placing fresh directional bets.
Heading into the key data/event risks, diminishing odds for an imminent rate cut by the Federal Reserve (Fed) in September assist the US Dollar (USD) to stand tall near a one-month peak touched on Tuesday. The shared currency, on the other hand, is undermined by the fact that Eurosceptic nationalists registered the biggest gains in European Parliament elections in the Sunday vote. Adding to this, French President Emmanuel Macron's decision to call snap elections later this month increases political uncertainty in the Eurozone's second-largest economy and contributes to capping the EUR/USD pair.
From a technical perspective, this week's sustained break and acceptance below the very important 200-day Simple Moving Average (SMA) near the 1.0800 mark was seen as a fresh trigger for bearish traders. Furthermore, oscillators on the daily chart are holding in the negative territory, suggesting that the path of least resistance for the EUR/USD pair is to the downside. Hence, any attempted recovery could attract fresh sellers near the 200-day SMA. This should act as a key pivotal point, which if cleared might prompt a short-covering rally to the 1.0865-1.0870 supply zone en route to the 1.0900 mark.
On the flip side, bearish traders might now wait for some follow-through selling below the 1.0700 mark before placing fresh bets. The EUR/USD pair might then accelerate the downward trajectory towards the next relevant support near the 1.0650-1.0640 region before eventually dropping to the 1.0600 mark, or the YTD low touched in April. A convincing break below the latter should pave the way for an extension of the recent downtrend witnessed over the past week or so, from levels just above the 1.0900 round figure.
EUR/USD daily chart
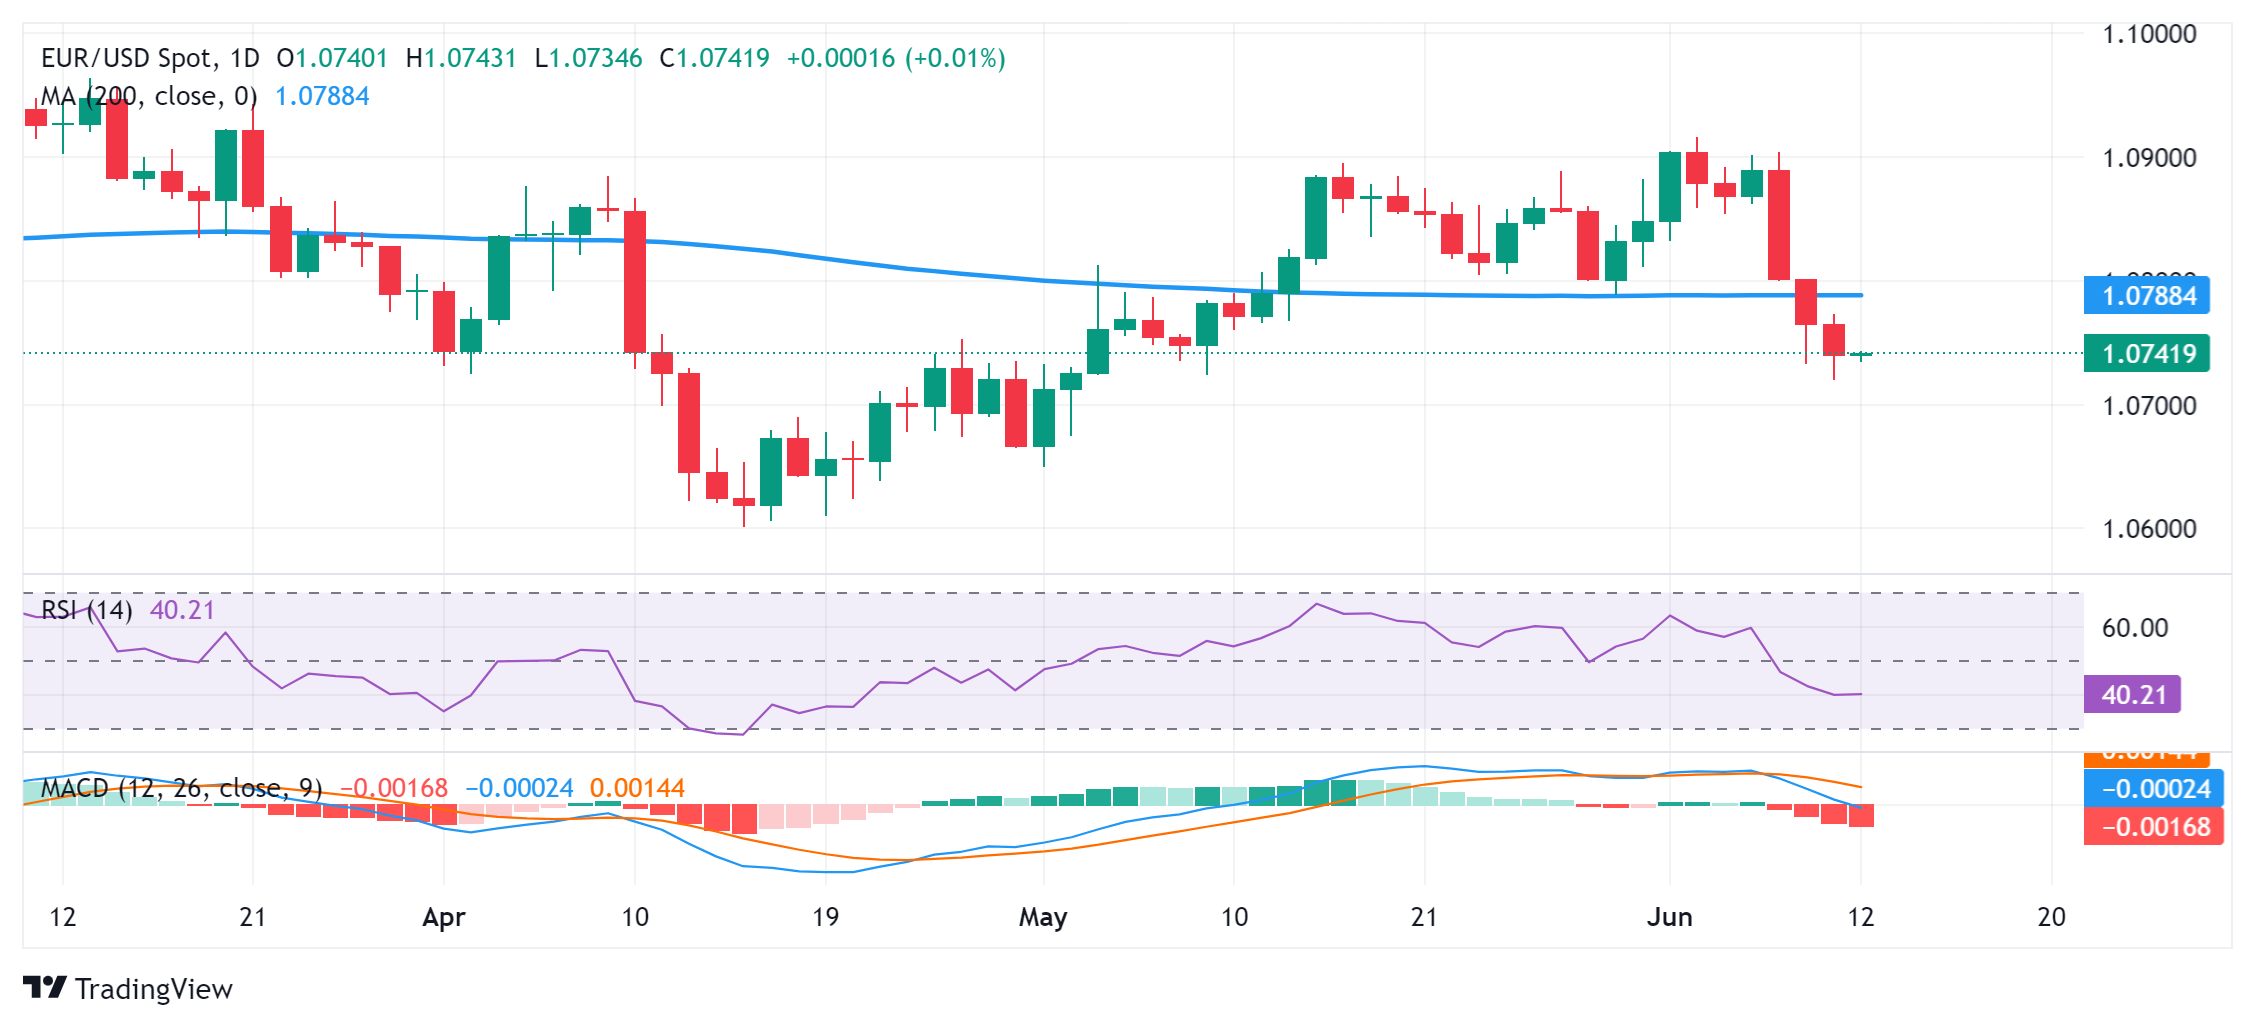
- The Japanese Yen edges lower as traders favor the US Dollar ahead of the Fed's interest rate decision.
- The Japanese Yen may appreciate as PPI jumped 2.4% YoY in May, exceeding market expectations of a 2.0% rise.
- The US Dollar maintains its position as robust US jobs data for May has diminished the likelihood of a Fed rate cut in September.
The Japanese Yen (JPY) continues its losing streak for the fourth consecutive session on Wednesday. The USD/JPY pair strengthens as investors favor the US Dollar (USD) ahead of the Federal Reserve's (Fed) decision and the release of US inflation figures for May, scheduled for later in the North American trading hours.
The Japanese Yen may receive support due to higher-than-expected Japanese Producer Price Index (PPI) data. Data showed that producer prices jumped 2.4% year-on-year in May, exceeding market expectations of a 2.0% rise, fueling concerns that this might lead to higher consumer inflation.
The Bank of Japan (BoJ) is expected to maintain its monetary policy unchanged on Friday. The interest rate divergence between the US and Japan continues to undermine the Japanese Yen (JPY), creating a tailwind for the USD/JPY pair.
The US Dollar Index (DXY), which measures the value of the US Dollar (USD) against six major currencies, remains strong as robust US jobs data for May has reduced the odds of a Fed rate cut in September. The CME FedWatch Tool indicates that the likelihood of a Fed rate cut in September by at least 25 basis points has decreased to 52%, down from 67% a week earlier.
Daily Digest Market Movers: Japanese Yen declines due to interest rate differential
- Japan Finance Minister Shunichi Suzuki said on Tuesday it is important to continue efforts to achieve economic growth and attain fiscal health to retain confidence in the country's fiscal policy, per Reuters.
- Nearly two-thirds of economists surveyed in a Reuters poll on Tuesday anticipate that the Bank of Japan will opt to commence tapering its monthly bond purchases at Friday's policy meeting. This decision marks a significant initial move aimed at gradually reducing the central bank's burgeoning balance sheet.
- Takeshi Minami, Chief Economist at Norinchukin Research Institute said, "There is no longer any reason to continue large-scale purchases of government bonds since it has been judged that a 2% rise in prices is within reach," per Reuters.
- Japan’s 10-year government bond yield moves below 1% ahead of the Bank of Japan’s (BoJ) policy meeting on Friday. The central bank is expected to maintain its current rate policy, while traders are closely watching for any potential reduction in the bank’s monthly bond purchases.
- On Monday, Japan’s Gross Domestic Product (GDP) Annualized contracted by 1.8% in the first quarter, compared to a previous decline of 2.0%. The figures slightly exceeded market forecasts of a 1.9% decrease. Meanwhile, Japan's GDP (QoQ) shrank by 0.5%, which is in line with the flash data.
- Rabobank suggested in its weekly report that the Federal Reserve may cut rates in September and December, more likely because of a deteriorating economy than because of progress on inflation. This is because they think that the US economy is entering a stagflationary phase with persistent inflation and an economic slowdown that is likely to end in a mild recession later this year.
- According to Reuters, while speaking to parliament last week, Bank of Japan (BoJ) Governor Kazuo Ueda stated that inflation expectations are gradually rising but have yet to reach 2%. Ueda said, "We have been scrutinizing market developments since the March decision. As we proceed to exit our massive monetary stimulus, it's appropriate to reduce bond purchases."
Technical Analysis: USD/JPY hovers around 157.00
USD/JPY trades around 157.20 on Wednesday. Analysis of the daily chart suggests a bullish inclination as the pair consolidates within an ascending channel pattern. Additionally, the 14-day Relative Strength Index (RSI) is above the 50 level, indicating a tendency for upward momentum.
A significant hurdle is noticeable at the psychological level of 158.00. A breakthrough above this level could provide support, potentially guiding the USD/JPY pair toward the upper boundary near 158.80. Further resistance is observed at 160.32, marking its highest level in over thirty years.
On the downside, the lower boundary of the ascending channel is around the 50-day Exponential Moving Average (EMA) at 155.03. A breach below this level might intensify downward pressure on the USD/JPY pair, potentially directing it toward the throwback support area around 152.80.
USD/JPY: Daily Chart
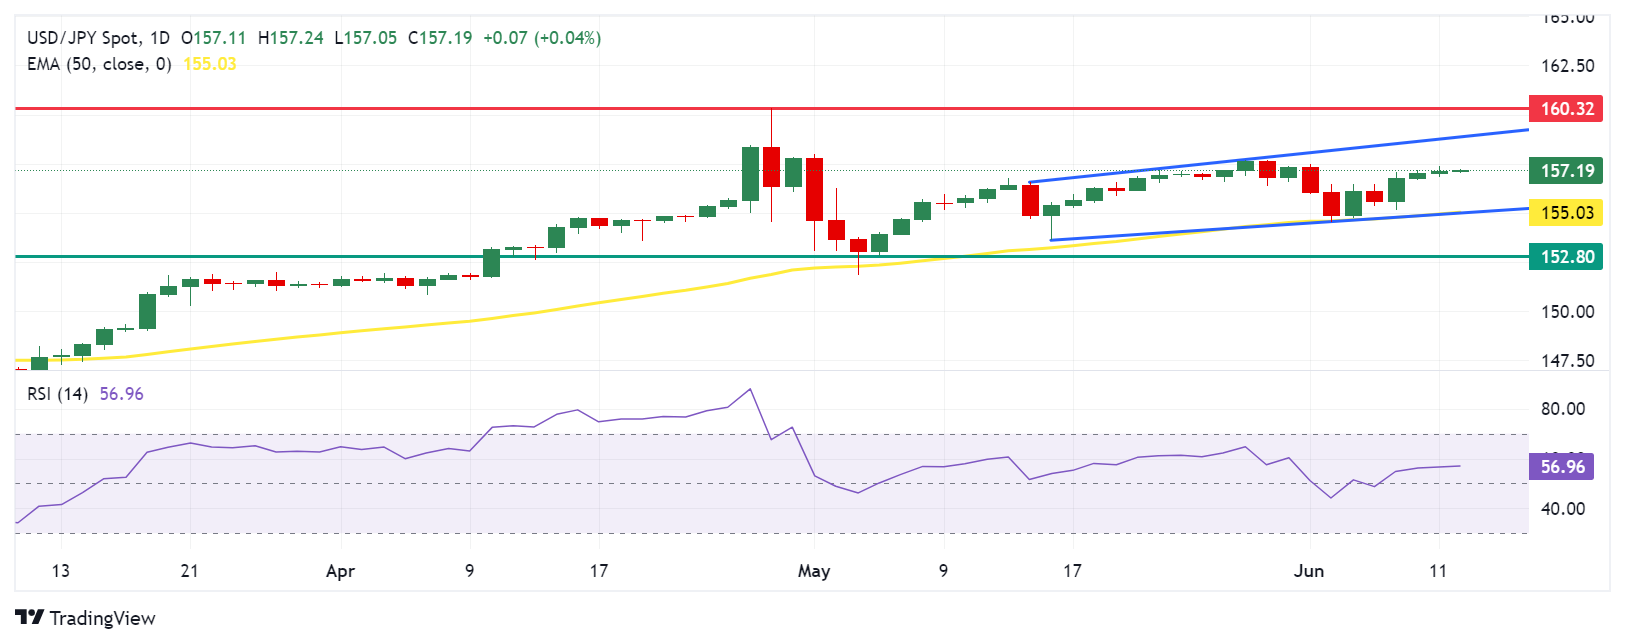
Japanese Yen price today
The table below shows the percentage change of the Japanese Yen (JPY) against listed major currencies today. Japanese Yen was the weakest against the Australian Dollar.
| USD | EUR | GBP | CAD | AUD | JPY | NZD | CHF | |
| USD | -0.03% | -0.04% | -0.05% | -0.14% | 0.06% | -0.04% | -0.02% | |
| EUR | 0.03% | -0.02% | -0.02% | -0.12% | 0.08% | -0.02% | 0.00% | |
| GBP | 0.04% | 0.02% | -0.01% | -0.10% | 0.10% | 0.00% | 0.03% | |
| CAD | 0.05% | 0.03% | 0.01% | -0.09% | 0.10% | 0.01% | 0.03% | |
| AUD | 0.14% | 0.11% | 0.10% | 0.09% | 0.19% | 0.09% | 0.12% | |
| JPY | -0.06% | -0.10% | -0.10% | -0.10% | -0.20% | -0.08% | -0.08% | |
| NZD | 0.03% | 0.02% | 0.00% | -0.01% | -0.10% | 0.09% | 0.02% | |
| CHF | 0.01% | -0.01% | -0.02% | -0.03% | -0.13% | 0.08% | -0.02% |
The heat map shows percentage changes of major currencies against each other. The base currency is picked from the left column, while the quote currency is picked from the top row. For example, if you pick the Euro from the left column and move along the horizontal line to the Japanese Yen, the percentage change displayed in the box will represent EUR (base)/JPY (quote).
Japanese Yen FAQs
The Japanese Yen (JPY) is one of the world’s most traded currencies. Its value is broadly determined by the performance of the Japanese economy, but more specifically by the Bank of Japan’s policy, the differential between Japanese and US bond yields, or risk sentiment among traders, among other factors.
One of the Bank of Japan’s mandates is currency control, so its moves are key for the Yen. The BoJ has directly intervened in currency markets sometimes, generally to lower the value of the Yen, although it refrains from doing it often due to political concerns of its main trading partners. The current BoJ ultra-loose monetary policy, based on massive stimulus to the economy, has caused the Yen to depreciate against its main currency peers. This process has been exacerbated more recently due to an increasing policy divergence between the Bank of Japan and other main central banks, which have opted to increase interest rates sharply to fight decades-high levels of inflation.
The BoJ’s stance of sticking to ultra-loose monetary policy has led to a widening policy divergence with other central banks, particularly with the US Federal Reserve. This supports a widening of the differential between the 10-year US and Japanese bonds, which favors the US Dollar against the Japanese Yen.
The Japanese Yen is often seen as a safe-haven investment. This means that in times of market stress, investors are more likely to put their money in the Japanese currency due to its supposed reliability and stability. Turbulent times are likely to strengthen the Yen’s value against other currencies seen as more risky to invest in.
- The US Consumer Price Index is forecast to rise 3.4% YoY in May, at the same pace as in April.
- Annual core CPI inflation is expected to inch lower from 3.6% in April to 3.5% in May.
- The inflation data could impact the US Dollar value and the September rate cut expectations.
The Bureau of Labor Statistics (BLS) will publish the highly anticipated Consumer Price Index (CPI) inflation data from the United States (US) for May on Wednesday at 12:30 GMT.
The US Dollar braces for intense volatility, as any surprises from the US inflation report could significantly impact the market’s pricing of the Federal Reserve (Fed) interest rate cut expectations in September.
What to expect in the next CPI data report?
Inflation in the US, as measured by the CPI, is expected to increase at an annual rate of 3.4% in May, at the same pace seen in April. The core CPI inflation, which excludes volatile food and energy prices, is seen at 3.5% in the same period, a tad lower than the 3.6% figure recorded in April.
Meanwhile, the US CPI is set to rise 0.1% MoM in May, compared to a 0.3% growth in April. The core CPI inflation is likely to hold steady at 0.3% over the month in May.
Just a day before the April CPI data release, Federal Reserve Chairman Jerome Powell spoke at a moderated discussion at the Foreign Bankers' Association's Annual General Meeting in Amsterdam. Powell shifted to a dovish stance on the interest rates outlook, noting that "confidence in inflation moving back down is lower than it was. My confidence on that is not as high as it was before."
Powell added: "Don't think it's likely that the next move would be a rate hike, more likely that we would hold policy rate where it is."
The headline and core CPI inflation softened in April, justifying Powell’s commentary. Since then, a slew of US business activity and employment data added credence to the market’s pricing of a Fed interest rate cut in September.
That, however, changed following a robust US labor market report released on Friday, which showed that Nonfarm Payrolls increased by 272K jobs last month, against a predicted job gain of 185K. Average Hourly Earnings rose 4.1% in the same period, compared to the 4% increase in April, beating expectations for a 3.9% growth.
The data portrayed continued tightness in the US labor market conditions and an uptick in wage inflation, tempering bets for a September Fed rate cut. Markets dialed down bets of a 25 basis points (bps) rate cut in September to 43% from about 55% before the report, according to the CME Group’s FedWatch Tool, now pricing roughly an even chance of two rate cuts by the end of 2024 versus about a 68% chance seen before the NFP release, per Reuters.
Previewing the May inflation report, “we expect next week's CPI report to show that core inflation slowed again to a "soft" 0.3% m/m pace in May after posting a firmer 0.29% gain in April. The headline likely rose by a softer 0.1% m/m as energy prices likely provided large relief,” said TD Securities analysts in a weekly report.
“Note that our unrounded core CPI forecast at 0.26% m/m suggests larger risks for a dovish surprise to a rounded 0.2% increase,” the analysts added.
How could the US Consumer Price Index report affect EUR/USD?
Amidst a fall in energy prices during May, the monthly headline CPI and core CPI figure could see a downside surprise. However, the US Dollar’s reaction to the data release could be limited ahead of the all-important Fed policy announcements due later on Wednesday.
In case the monthly core CPI rises 0.3% or more, it could reinforce the market’s confidence that the Fed could extend the pause in September, especially after the impressive labor market data for May. In this scenario, the US Dollar is likely to see a further upside against its major rivals. Conversely, a downside surprise in the monthly core inflation to 0.1% or lower could rekindle hopes of a continued disinflationary trend, reinforcing September rate cut expectations and fuelling a renewed USD sell-off across the board.
Dhwani Mehta, Asian Session Lead Analyst at FXStreet, offers a brief technical outlook for EUR/USD and explains: “The Relative Strength Index (RSI) indicator on the daily chart holds below 50 ahead of the US inflation data, indicating a bearish outlook for EUR/USD in the short term. Further, the pair has broken below all the major Simple Moving Averages (SMA) on the daily time frame, adding to the downside bias.”
“If EUR/USD rises above the key supply zone near 1.0780, the confluence of the 200-day and 50-day SMAs, it could put the 100-day SMA at 1.0805 immediately to test. Acceptance above the latter could compel buyers to target the 21-day SMA barrier at 1.0843 before challenging the 1.0900 threshold. Alternatively, if the downside extends below the 1.0650 support, sellers will retest the April 16 low of 1.0601.” Dhwani adds.
Economic Indicator
Consumer Price Index (YoY)
Inflationary or deflationary tendencies are measured by periodically summing the prices of a basket of representative goods and services and presenting the data as The Consumer Price Index (CPI). CPI data is compiled on a monthly basis and released by the US Department of Labor Statistics. The YoY reading compares the prices of goods in the reference month to the same month a year earlier.The CPI is a key indicator to measure inflation and changes in purchasing trends. Generally speaking, a high reading is seen as bullish for the US Dollar (USD), while a low reading is seen as bearish.
Read more.Next release: Wed Jun 12, 2024 12:30
Frequency: Monthly
Consensus: 3.4%
Previous: 3.4%
Source: US Bureau of Labor Statistics
The US Federal Reserve has a dual mandate of maintaining price stability and maximum employment. According to such mandate, inflation should be at around 2% YoY and has become the weakest pillar of the central bank’s directive ever since the world suffered a pandemic, which extends to these days. Price pressures keep rising amid supply-chain issues and bottlenecks, with the Consumer Price Index (CPI) hanging at multi-decade highs. The Fed has already taken measures to tame inflation and is expected to maintain an aggressive stance in the foreseeable future.
Inflation FAQs
Inflation measures the rise in the price of a representative basket of goods and services. Headline inflation is usually expressed as a percentage change on a month-on-month (MoM) and year-on-year (YoY) basis. Core inflation excludes more volatile elements such as food and fuel which can fluctuate because of geopolitical and seasonal factors. Core inflation is the figure economists focus on and is the level targeted by central banks, which are mandated to keep inflation at a manageable level, usually around 2%.
The Consumer Price Index (CPI) measures the change in prices of a basket of goods and services over a period of time. It is usually expressed as a percentage change on a month-on-month (MoM) and year-on-year (YoY) basis. Core CPI is the figure targeted by central banks as it excludes volatile food and fuel inputs. When Core CPI rises above 2% it usually results in higher interest rates and vice versa when it falls below 2%. Since higher interest rates are positive for a currency, higher inflation usually results in a stronger currency. The opposite is true when inflation falls.
Although it may seem counter-intuitive, high inflation in a country pushes up the value of its currency and vice versa for lower inflation. This is because the central bank will normally raise interest rates to combat the higher inflation, which attract more global capital inflows from investors looking for a lucrative place to park their money.
Formerly, Gold was the asset investors turned to in times of high inflation because it preserved its value, and whilst investors will often still buy Gold for its safe-haven properties in times of extreme market turmoil, this is not the case most of the time. This is because when inflation is high, central banks will put up interest rates to combat it. Higher interest rates are negative for Gold because they increase the opportunity-cost of holding Gold vis-a-vis an interest-bearing asset or placing the money in a cash deposit account. On the flipside, lower inflation tends to be positive for Gold as it brings interest rates down, making the bright metal a more viable investment alternative.
- USD/CAD extends the overnight retracement slide from over a one-month peak.
- An uptick in Crude Oil prices underpins the Loonie and exerts downward pressure.
- Reduced Fed rate cut bets favor the USD bulls and should help limit deeper losses.
- Traders look to the US CPI report and FOMC decision for a fresh directional impetus.
The USD/CAD pair edges lower during the Asian session on Wednesday and currently trades around mid-1.3700s, though the downtick lacks bearish conviction. Spot prices remain well within the striking distance of the highest level since April 19, around the 1.3790 area set on Tuesday, as traders await more cues about the timing of when the Federal Reserve (Fed) will start cutting rates before placing directional bets.
Hence, the focus remains on the release of the latest consumer inflation figures from the United States (US) and the outcome of a two-day Federal Open Market Committee (FOMC) meeting later today. The Fed decision will be accompanied by updated economic projections, along with the so-called "dot plot", which should offer fresh insight into the US central bank's rate-cut path. This will play a key role in influencing the near-term US Dollar (USD) price dynamics and provide some meaningful impetus to the USD/CAD pair.
Heading into the key data/event risks, growing acceptance that the Fed will keep rates higher for longer amid a strong US labor market and sticky inflation assists the USD in holding steady near a one-month peak touched on Tuesday. This, in turn, could lend some support to the USD/CAD pair and help limit losses. The upside, however, seems limited in the wake of an uptick in Crude Oil prices, which tends to underpin the commodity-linked Loonie. Nevertheless, the mixed fundamental backdrop warrants caution for aggressive traders.
From a technical perspective, the recent breakout through the 1.3740-1.3750 supply zone was seen as a fresh trigger for bulls. Moreover, oscillators on the daily chart are holding in the positive territory, suggesting that the path of least resistance for the USD/CAD pair is to the upside. Hence, any subsequent slide could be seen as a buying opportunity and remain cushioned.
- Indian Rupee edges higher on Wednesday amid the firmer US Dollar.
- The potential FX intervention from the RBI might protect INR from further weakness.
- The Indian Consumer Price Index (CPI) for May is due on Wednesday ahead of the US key events.
Indian Rupee (INR) trades on a positive note on Wednesday despite the stronger US Dollar (USD). The downside for the INR might be limited as the Reserve Bank of India (RBI) is likely to prevent local currency from depreciating. On the other hand, the weakness in Asian peers, the rise in crude oil prices, and the cautious mood might drag the INR lower.
India’s May Consumer Price Index (CPI) and Industrial Production are due on Wednesday. On the US front, the CPI inflation data will be released ahead of the Federal Reserve (Fed) monetary policy meeting. The Fed is widely expected to maintain policy rates steady at its June meeting on Wednesday. Investors will closely monitor Fed Chair Jerome Powell's message during the press conference for more clues about any modifications to the interest rate dot plot. The hawkish tone from the Fed’s Powell could boost the US Dollar and create a tailwind for the pair.
Daily Digest Market Movers: Indian Rupee gains ground ahead of the key events from both India and the US
- The one-month implied volatility of the USD/INR pair has dropped to 2.20%, down from a six-month peak of 3.35% in May.
- “Don’t think there’s a lot of fresh positioning (on USD/INR) currently as people are mostly waiting for Fed and US (inflation) data,” said a foreign exchange trader at a private bank.
- India’s CPI inflation is expected to rise to 4.90 YoY in May from 4.83% in April.
- World Bank stated in its June Global Economic Prospects report that India will remain the fastest-growing of the world’s largest economies with a steady average annual growth of 6.7% between FY25 and FY27.
- The US headline CPI figure is estimated to show an increase of 3.4% YoY in May, while the core CPI for May is projected to rise 3.5% YoY.
- Interest rate futures are pricing in about 38 basis points (bps) of rate cuts over 2024, down from nearly 50 bps last week.
Technical analysis: USD/INR’s positive outlook persists in the longer term
The Indian Rupee trades stronger on the day. The positive outlook of the USD/INR pair prevails as the pair is above the key 100-day Exponential Moving Average (EMA) and descending trend channel upper boundary.
Further consolidation cannot be ruled out in the near term, supported by the neutral 14-day Relative Strength Index (RSI), which stands flat around the 50-midline.
The next upside barrier will emerge at 83.72, a high of April 17. Further north, the next hurdle to watch is the 84.00 psychological mark. On the flip side, the crucial support level is seen at 83.30, portraying the confluence of the 100-day EMA and descending trend channel upper boundary. A breach of this level will pave the way to 82.78, a low of January 15.
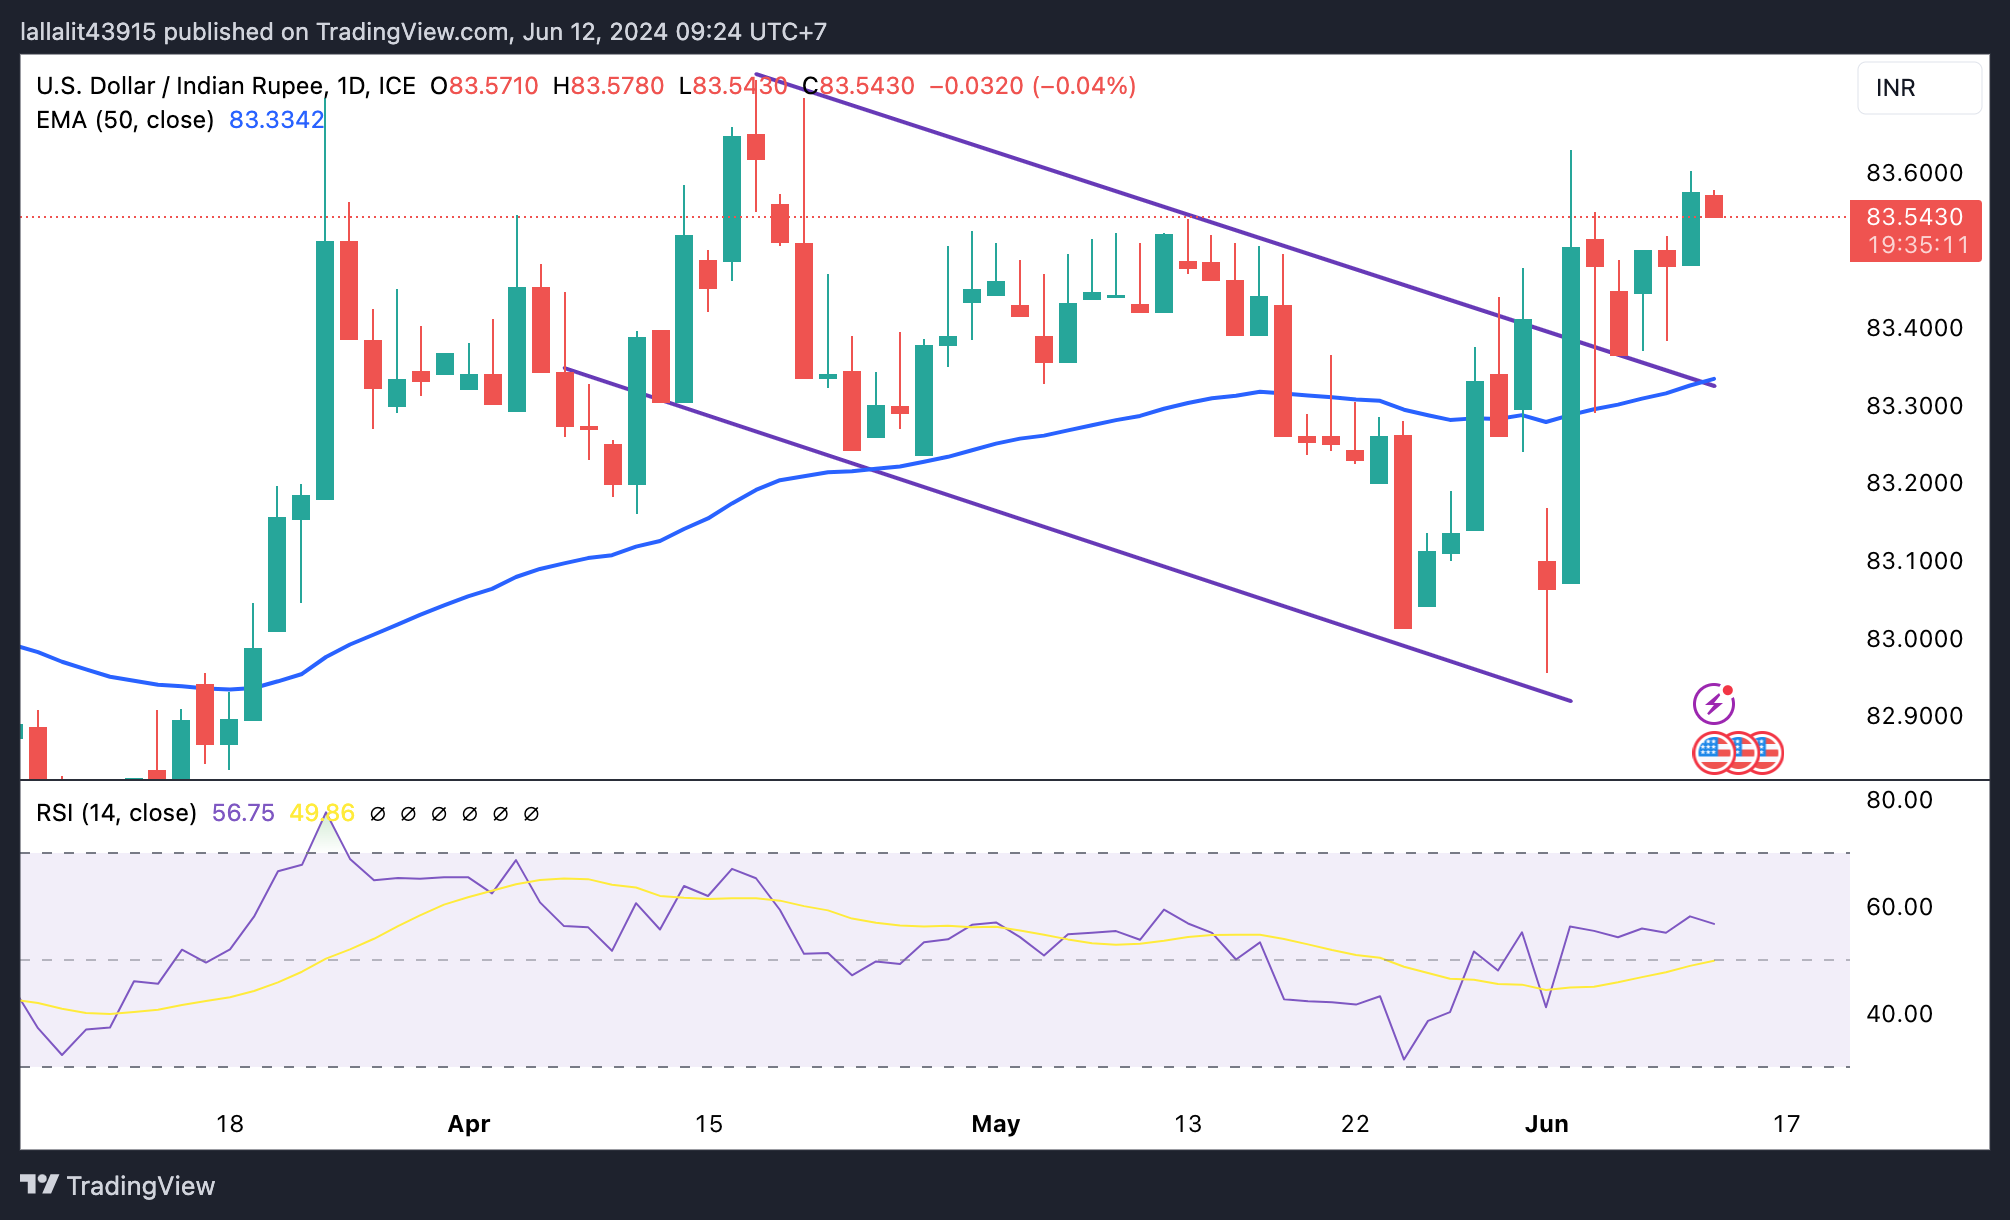
US Dollar price today
The table below shows the percentage change of US Dollar (USD) against listed major currencies today. US Dollar was the weakest against the .
| USD | EUR | GBP | CAD | AUD | JPY | NZD | CHF | |
| USD | -0.02% | -0.01% | -0.04% | -0.09% | 0.01% | -0.01% | -0.03% | |
| EUR | 0.02% | 0.00% | -0.02% | -0.07% | 0.03% | -0.01% | -0.01% | |
| GBP | 0.01% | 0.00% | -0.02% | -0.08% | 0.02% | 0.00% | -0.02% | |
| CAD | 0.04% | 0.02% | 0.04% | -0.05% | 0.05% | 0.02% | 0.00% | |
| AUD | 0.09% | 0.07% | 0.07% | 0.05% | 0.10% | 0.07% | 0.06% | |
| JPY | -0.01% | -0.04% | -0.03% | -0.06% | -0.10% | 0.00% | -0.04% | |
| NZD | 0.01% | 0.00% | 0.00% | -0.03% | -0.08% | 0.03% | -0.01% | |
| CHF | 0.03% | 0.01% | 0.02% | -0.01% | -0.06% | 0.04% | 0.01% |
The heat map shows percentage changes of major currencies against each other. The base currency is picked from the left column, while the quote currency is picked from the top row. For example, if you pick the Euro from the left column and move along the horizontal line to the Japanese Yen, the percentage change displayed in the box will represent EUR (base)/JPY (quote).
Indian Rupee FAQs
The Indian Rupee (INR) is one of the most sensitive currencies to external factors. The price of Crude Oil (the country is highly dependent on imported Oil), the value of the US Dollar – most trade is conducted in USD – and the level of foreign investment, are all influential. Direct intervention by the Reserve Bank of India (RBI) in FX markets to keep the exchange rate stable, as well as the level of interest rates set by the RBI, are further major influencing factors on the Rupee.
The Reserve Bank of India (RBI) actively intervenes in forex markets to maintain a stable exchange rate, to help facilitate trade. In addition, the RBI tries to maintain the inflation rate at its 4% target by adjusting interest rates. Higher interest rates usually strengthen the Rupee. This is due to the role of the ‘carry trade’ in which investors borrow in countries with lower interest rates so as to place their money in countries’ offering relatively higher interest rates and profit from the difference.
Macroeconomic factors that influence the value of the Rupee include inflation, interest rates, the economic growth rate (GDP), the balance of trade, and inflows from foreign investment. A higher growth rate can lead to more overseas investment, pushing up demand for the Rupee. A less negative balance of trade will eventually lead to a stronger Rupee. Higher interest rates, especially real rates (interest rates less inflation) are also positive for the Rupee. A risk-on environment can lead to greater inflows of Foreign Direct and Indirect Investment (FDI and FII), which also benefit the Rupee.
Higher inflation, particularly, if it is comparatively higher than India’s peers, is generally negative for the currency as it reflects devaluation through oversupply. Inflation also increases the cost of exports, leading to more Rupees being sold to purchase foreign imports, which is Rupee-negative. At the same time, higher inflation usually leads to the Reserve Bank of India (RBI) raising interest rates and this can be positive for the Rupee, due to increased demand from international investors. The opposite effect is true of lower inflation.
- The Australian Dollar gains ground as the RBA is expected to keep higher rates for longer.
- The Australian Dollar may limit its upside due to softer-than-expected inflation data from its trade partner, China.
- The US Dollar remains strong as the Fed is expected to keep rates steady in the range of 5.25%-5.50% on Wednesday.
The Australian Dollar (AUD) edges higher on Wednesday, possibly supported by the hawkish sentiment surrounding the Reserve Bank of Australia (RBA) to maintain higher rates this year. Last week, RBA Governor Michele Bullock indicated that the central bank is prepared to increase interest rates if the Consumer Price Index (CPI) does not return to the target range of 1%-3%, according to NCA NewsWire.
The Australian Dollar may struggle due to softer-than-expected Chinese consumer inflation data released on Wednesday. China’s CPI increased by 0.3% year-over-year in May, missing expectations for a 0.4% rise. Chinese CPI inflation decreased by 0.1% MoM versus April’s 0.1% increase.
The US Dollar (USD) remains strong, bolstered by robust US jobs data for May. This development has reduced the odds of two Federal Reserve (Fed) interest rate cuts in 2024. The CME FedWatch Tool indicates that the likelihood of a Fed rate cut in September by at least 25 basis points has decreased to 52%, down from 67% a week earlier.
Investors adopt caution ahead of the Federal Reserve's policy decision and key US inflation data expected later in the North American session. The Fed is anticipated to keep interest rates steady in the range of 5.25%-5.50% as it aims to curb inflation toward its 2% target. The US headline and core CPI figures for May are estimated to show year-over-year increases of 3.4% and 3.5%, respectively.
Daily Digest Market Movers: Australian Dollar inches higher due to hawkish RBA
- China’s Producer Price Index (PPI) decreased by 1.4% year-over-year in May, compared to the expected decline of 1.5% and April's 2.5% fall. This marked the 20th consecutive month of contraction in factory-gate prices, but it was the smallest decline since February 2023.
- Australian Treasurer Jim Chalmers stated that the visit of China's Premier Li Qiang to Australia is an important opportunity. Chalmers noted underlying weaknesses in China's economy and expressed that he does not expect China's economy to recover immediately.
- Australia's NAB Business Confidence index dropped to -3 index points in May, marking the lowest figure in six months and turning negative for the first time since last November. Meanwhile, Business Conditions fell to 6 index points, slightly below the long-run average.
- On Tuesday, National Australia Bank (NAB) Chief Economist Alan Oster commented, “There are warning signs on the outlook for growth but at the same time reasons to be very wary about the inflation outlook, and they expect the RBA to keep rates on hold for some time yet as they navigate through these contrasting risks,” as per the official transcript.
- Rabobank suggested in its report that the Federal Reserve may cut rates in September and December, more likely because of a deteriorating economy than because of progress on inflation. This is because they think that the US economy is entering a stagflationary phase with persistent inflation and an economic slowdown that is likely to end in a mild recession later this year.
Technical Analysis: Australian Dollar moves above 0.6600
The Australian Dollar trades around 0.6610 on Wednesday. Analysis of the daily chart indicates a neutral bias for the AUD/USD pair, as it consolidates within the horizontal channel pattern. The 14-day Relative Strength Index (RSI) is positioned slightly below the 50 level. A further movement may suggest a clear directional trend.
Immediate support region is identified around the 50-day Exponential Moving Average (EMA) at 0.6600, which is aligned with the lower boundary of the horizontal channel. A break below the latter could put pressure on the AUD/USD pair, pushing it toward the throwback support at 0.6580.
On the upside, the AUD/USD pair could explore the region around the upper threshold of the horizontal channel around the level of 0.6690, followed by the psychological level of 0.6700 and May’s high of 0.6714.
AUD/USD: Daily Chart
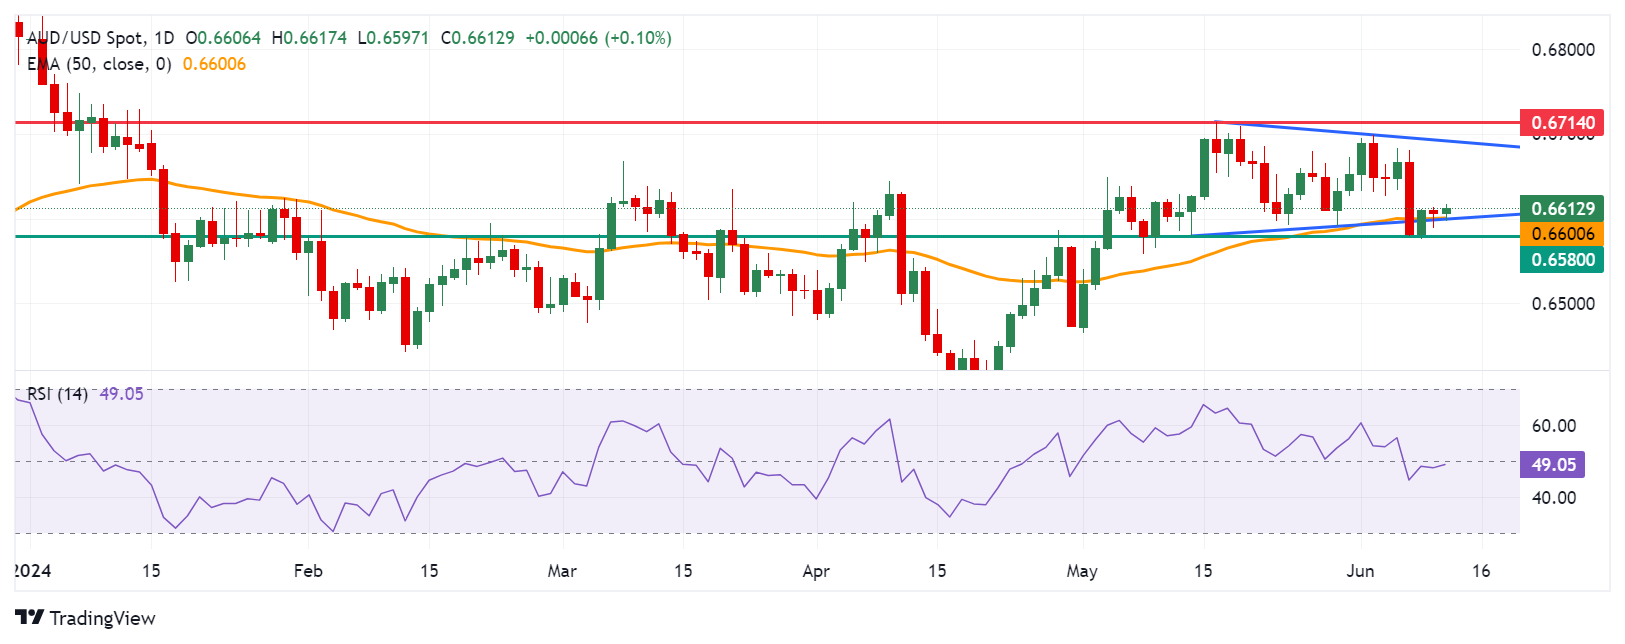
Australian Dollar price today
The table below shows the percentage change of the Australian Dollar (AUD) against listed major currencies today. The Australian Dollar was the strongest against the Japanese Yen.
| USD | EUR | GBP | CAD | AUD | JPY | NZD | CHF | |
| USD | -0.02% | -0.01% | -0.01% | -0.07% | 0.05% | 0.01% | -0.01% | |
| EUR | 0.01% | 0.01% | -0.01% | -0.05% | 0.07% | 0.02% | 0.00% | |
| GBP | 0.01% | -0.01% | -0.02% | -0.07% | 0.06% | 0.01% | -0.01% | |
| CAD | 0.03% | 0.00% | 0.02% | -0.05% | 0.08% | 0.02% | 0.01% | |
| AUD | 0.07% | 0.06% | 0.07% | 0.05% | 0.13% | 0.08% | 0.06% | |
| JPY | -0.05% | -0.08% | -0.07% | -0.08% | -0.14% | -0.03% | -0.07% | |
| NZD | -0.01% | -0.02% | -0.01% | -0.03% | -0.08% | 0.05% | -0.03% | |
| CHF | 0.01% | -0.01% | 0.01% | -0.01% | -0.06% | 0.06% | 0.02% |
The heat map shows percentage changes of major currencies against each other. The base currency is picked from the left column, while the quote currency is picked from the top row. For example, if you pick the Euro from the left column and move along the horizontal line to the Japanese Yen, the percentage change displayed in the box will represent EUR (base)/JPY (quote).
Australian Dollar FAQs
One of the most significant factors for the Australian Dollar (AUD) is the level of interest rates set by the Reserve Bank of Australia (RBA). Because Australia is a resource-rich country another key driver is the price of its biggest export, Iron Ore. The health of the Chinese economy, its largest trading partner, is a factor, as well as inflation in Australia, its growth rate, and Trade Balance. Market sentiment – whether investors are taking on more risky assets (risk-on) or seeking safe havens (risk-off) – is also a factor, with risk-on positive for AUD.
The Reserve Bank of Australia (RBA) influences the Australian Dollar (AUD) by setting the level of interest rates that Australian banks can lend to each other. This influences the level of interest rates in the economy as a whole. The main goal of the RBA is to maintain a stable inflation rate of 2-3% by adjusting interest rates up or down. Relatively high interest rates compared to other major central banks support the AUD, and the opposite for relatively low. The RBA can also use quantitative easing and tightening to influence credit conditions, with the former AUD-negative and the latter AUD-positive.
China is Australia’s largest trading partner so the health of the Chinese economy is a major influence on the value of the Australian Dollar (AUD). When the Chinese economy is doing well it purchases more raw materials, goods and services from Australia, lifting demand for the AUD, and pushing up its value. The opposite is the case when the Chinese economy is not growing as fast as expected. Positive or negative surprises in Chinese growth data, therefore, often have a direct impact on the Australian Dollar and its pairs.
Iron Ore is Australia’s largest export, accounting for $118 billion a year according to data from 2021, with China as its primary destination. The price of Iron Ore, therefore, can be a driver of the Australian Dollar. Generally, if the price of Iron Ore rises, AUD also goes up, as aggregate demand for the currency increases. The opposite is the case if the price of Iron Ore falls. Higher Iron Ore prices also tend to result in a greater likelihood of a positive Trade Balance for Australia, which is also positive of the AUD.
The Trade Balance, which is the difference between what a country earns from its exports versus what it pays for its imports, is another factor that can influence the value of the Australian Dollar. If Australia produces highly sought after exports, then its currency will gain in value purely from the surplus demand created from foreign buyers seeking to purchase its exports versus what it spends to purchase imports. Therefore, a positive net Trade Balance strengthens the AUD, with the opposite effect if the Trade Balance is negative.
| Raw materials | Closed | Change, % |
|---|---|---|
| Silver | 29.269 | -1.72 |
| Gold | 2316.53 | 0.25 |
| Palladium | 889.29 | -1.72 |
- Gold price struggles to capitalize on its modest gains registered over the past two days.
- Diminishing odds for a September Fed rate cut underpin the USD and act as a headwind.
- Investors now look to the US CPI and FOMC policy decision for a fresh directional impetus.
Gold price (XAU/USD) showed some resilience below the $2,300 mark and posted modest gains for the second straight day on Tuesday. The uptick, however, lacks bullish conviction as traders keenly await the release of the latest consumer inflation figures from the United States (US) and the outcome of the highly-anticipated Federal Open Market Committee (FOMC) meeting later this Wednesday. This should provide fresh cues about the likely timing when the Federal Reserve (Fed) will start cutting interest rates, which, in turn, will play a key role in influencing the next leg of a directional move for the non-yielding yellow metal.
Heading into the key data/event risks, growing acceptance that the Fed will keep rates higher for longer amid a strong US labor market and sticky inflation continues to act as a headwind for the Gold price. The hawkish outlook, meanwhile, assists the US Dollar (USD) to stand tall near a one-month peak, which, in turn, is seen as another factor that contributes to capping the upside for the XAU/USD. The downside, however, seems cushioned in the wake of political uncertainty in Europe and persistent geopolitical tensions, warranting caution before positioning for an extension of the recent pullback from the all-time peak.
Daily Digest Market Movers: Gold price bulls remain on the sidelines amid hawkish Fed expectations
- Reduced bets for an imminent interest rate cut by the Federal Reserve in September, along with China's decision to pause buying, turn out to be key factors capping the upside for the Gold price.
- The current market pricing indicates that the Fed could cut rates by only 25 basis points this year, either at the November or December policy meeting, which continues to underpin the US Dollar.
- The USD Index (DXY), which tracks the Greenback against a basket of currencies, stands tall near its highest level since May 9 and contributes to keeping a lid on the Dollar-denominated commodity.
- Traders, however, now seem reluctant and prefer to wait for more cues about the likely timing when the Fed will start cutting interest rates before placing fresh directional bets around the XAU/USD.
- Hence, the focus will remain glued to Wednesday's release of the latest US consumer inflation figures and the crucial FOMC monetary policy decision, due to be announced later during the US session.
- Stronger jobs and wage data released on Friday raised concerns that inflation may remain sticky amid a still resilient US economy, which, in turn, will reaffirm higher for longer interest rates narrative.
- The headline US Consumer Price Index is expected to ease to 0.1% in May from the 0.3% previous, and the yearly rate is seen unchanged at 3.4%, still well above the Fed's annualized target of 2%.
- Moreover, Core CPI is anticipated to hold steady at 0.3% during the reported month and edge lower to the 3.5% YoY rate from 3.6% in April, reaffirming stubbornly high inflationary pressure.
- Meanwhile, the US central bank is expected to leave interest rates unchanged and release updated economic projections, including the so-called "dot plot", which will influence the precious metal.
Technical Analysis: Gold price needs to break below $2,285 support for bears to seize control
From a technical perspective, the $2,300 round figure now seems to act as immediate support ahead of the $2,285 horizontal zone. Against the backdrop of Friday's breakdown below the 50-day Simple Moving Average (SMA), some follow-through selling below the latter will be seen as a fresh trigger for bearish traders. Given that oscillators on the daily chart are holding in the negative territory, the Gold price might then accelerate the slide towards the next relevant support near the $2,254-2,253 region. The downward trajectory could extend further towards the $2,225-2,220 area en route to the $2,200 mark.
On the flip side, any strength beyond the $2,325 hurdle is more likely to attract fresh sellers and remain capped near the 50-day SMA support breakpoint, currently pegged near the $2,345 region. This is followed by the $2,360-2,362 supply zone, which, if cleared decisively, should allow the Gold price to retest last week’s swing high, around the $2,387-2,388 area and reclaim the $2,400 mark. A sustained strength beyond the latter will negate any near-term negative bias and pave the way for a further appreciating move in the near term.
Gold FAQs
Gold has played a key role in human’s history as it has been widely used as a store of value and medium of exchange. Currently, apart from its shine and usage for jewelry, the precious metal is widely seen as a safe-haven asset, meaning that it is considered a good investment during turbulent times. Gold is also widely seen as a hedge against inflation and against depreciating currencies as it doesn’t rely on any specific issuer or government.
Central banks are the biggest Gold holders. In their aim to support their currencies in turbulent times, central banks tend to diversify their reserves and buy Gold to improve the perceived strength of the economy and the currency. High Gold reserves can be a source of trust for a country’s solvency. Central banks added 1,136 tonnes of Gold worth around $70 billion to their reserves in 2022, according to data from the World Gold Council. This is the highest yearly purchase since records began. Central banks from emerging economies such as China, India and Turkey are quickly increasing their Gold reserves.
Gold has an inverse correlation with the US Dollar and US Treasuries, which are both major reserve and safe-haven assets. When the Dollar depreciates, Gold tends to rise, enabling investors and central banks to diversify their assets in turbulent times. Gold is also inversely correlated with risk assets. A rally in the stock market tends to weaken Gold price, while sell-offs in riskier markets tend to favor the precious metal.
The price can move due to a wide range of factors. Geopolitical instability or fears of a deep recession can quickly make Gold price escalate due to its safe-haven status. As a yield-less asset, Gold tends to rise with lower interest rates, while higher cost of money usually weighs down on the yellow metal. Still, most moves depend on how the US Dollar (USD) behaves as the asset is priced in dollars (XAU/USD). A strong Dollar tends to keep the price of Gold controlled, whereas a weaker Dollar is likely to push Gold prices up.
- WTI may appreciate as the US Energy Information Administration anticipates optimistic global demand.
- EIA increased world Oil demand growth forecast to 1.10 million barrels per day in 2024.
- Oil prices struggled due to the Fed's hawkish stance on monetary policy.
West Texas Intermediate (WTI) Oil price hovers around $77.90 per barrel during Asian trading hours on Wednesday. Crude Oil prices may rise due to optimistic global demand forecasts from the US Energy Information Administration (EIA).
According to Reuters, the EIA increased its 2024 world Oil demand growth forecast to 1.10 million barrels per day (bpd) from the previous estimate of 900,000 bpd. Additionally, the Organization of the Petroleum Exporting Countries (OPEC) maintained its 2024 forecast for robust growth in global Oil demand, citing expectations for increased travel and tourism in the second half of the year.
Analysts at the energy consulting firm Gelber and Associates noted, "Futures are higher as expectations of summer demand are supportive of prices despite the broader macro landscape remaining less optimistic than weeks previous," per Reuters.
A strong US jobs report from the previous week has reinforced the Federal Reserve's hawkish stance on monetary policy. The Fed is expected to maintain higher borrowing costs for an extended period, which could slow economic growth and reduce demand for Oil. Investors await the Federal Reserve's (Fed) policy decision, along with the US inflation figures for May on Wednesday.
China’s Consumer Price Index (CPI) increased by 0.3% over the year in May, at the same pace as seen in April. The reading missed expectations for a 0.4% growth in the reported period.
Chinese CPI inflation came in at -0.1% MoM in May versus April’s 0.1% increase, worse than the 0% expected.
China’s Producer Price Index (PPI) dropped 1.4% YoY in May, as against the previous decline of 2.5%. The market forecast was for a 1.5% decrease.
Market reaction to China’s inflation data
AUD/USD is unfazed by the mixed Chinese inflation data, losing 0.05% on the day to trade near 0.6610 after the data release.
Australian Dollar PRICE Today
The table below shows the percentage change of Australian Dollar (AUD) against listed major currencies today. Australian Dollar was the weakest against the Canadian Dollar.
| USD | EUR | GBP | JPY | CAD | AUD | NZD | CHF | |
|---|---|---|---|---|---|---|---|---|
| USD | 0.00% | 0.02% | -0.03% | -0.02% | -0.03% | 0.02% | 0.01% | |
| EUR | -0.01% | 0.01% | -0.07% | -0.06% | -0.06% | 0.00% | 0.01% | |
| GBP | -0.02% | -0.01% | -0.04% | -0.06% | -0.04% | 0.02% | 0.00% | |
| JPY | 0.03% | 0.07% | 0.04% | -0.02% | -0.01% | 0.03% | 0.04% | |
| CAD | 0.02% | 0.06% | 0.06% | 0.02% | -0.00% | 0.07% | 0.04% | |
| AUD | 0.03% | 0.06% | 0.04% | 0.00% | 0.00% | 0.06% | 0.07% | |
| NZD | -0.02% | -0.00% | -0.02% | -0.03% | -0.07% | -0.06% | -0.01% | |
| CHF | -0.01% | -0.01% | -0.00% | -0.04% | -0.04% | -0.07% | 0.00% |
The heat map shows percentage changes of major currencies against each other. The base currency is picked from the left column, while the quote currency is picked from the top row. For example, if you pick the Australian Dollar from the left column and move along the horizontal line to the US Dollar, the percentage change displayed in the box will represent AUD (base)/USD (quote).
The People’s Bank of China (PBoC) set the USD/CNY central rate for the trading session ahead on Wednesday at 7.1133, as against the previous day's fix of 7.1135 and 7.2558 Reuters estimates.
- NZD/USD loses ground near 0.6140 on Wednesday.
- A two-day FOMC meeting begins on Tuesday and ends on Wednesday with an expected hawkish hold.
- The RBNZ’s hawkish stance might support the Kiwi against the USD in the near term.
The NZD/USD pair snaps the two-day winning streak around 0.6140 on Wednesday during the early Asian session. Markets turn cautious ahead of the key US events, which provide some support for the Greenback. The US Consumer Price Index (CPI) data and the FOMC monetary policy meeting will take center stage on Wednesday.
The FOMC is widely expected to keep rates on hold at its June meeting as there was little progress on getting inflation moving back towards the 2% target. Markets see a 52% odds of a September cut from the Fed, while the chance of a November cut around 67%, according to the CME FedWatch tool.
Inflation in the United States showed signs of cooling in April after coming in hotter than expected in the first quarter of this year. Traders will keep an eye on the May CPI for more cues about the inflation outlook. In case the report shows that US inflation remains elevated in May, this might prompt speculation about Fed rate cuts this year and could boost the US Dollar (USD) broadly.
Inflation in New Zealand remains above the Reserve Bank of New Zealand’s (RBNZ) 1-3% target band, although it is gradually moving down. However, the central bank is concerned about sticky domestic inflation and puts an increased chance of a future hike. The RBNZ’s new forecasts show an easing cycle starting in the third quarter of this year. The hawkish stance from the RBNZ is likely to underpin the New Zealand Dollar (NZD) and create a tailwind for the NZD/USD pair.
| Index | Change, points | Closed | Change, % |
|---|---|---|---|
| NIKKEI 225 | 96.63 | 39134.79 | 0.25 |
| Hang Seng | -190.61 | 18176.34 | -1.04 |
| KOSPI | 4.15 | 2705.32 | 0.15 |
| ASX 200 | -104.6 | 7755.4 | -1.33 |
| DAX | -124.95 | 18369.94 | -0.68 |
| CAC 40 | -104.77 | 7789.21 | -1.33 |
| Dow Jones | -120.62 | 38747.42 | -0.31 |
| S&P 500 | 14.53 | 5375.32 | 0.27 |
| NASDAQ Composite | 151.02 | 17343.55 | 0.88 |
| Pare | Closed | Change, % |
|---|---|---|
| AUDUSD | 0.66058 | -0.09 |
| EURJPY | 168.775 | -0.17 |
| EURUSD | 1.07417 | -0.24 |
| GBPJPY | 200.139 | 0.12 |
| GBPUSD | 1.27388 | 0.05 |
| NZDUSD | 0.61418 | 0.18 |
| USDCAD | 1.37554 | -0 |
| USDCHF | 0.89729 | 0.1 |
| USDJPY | 157.111 | 0.07 |
- USD/JPY trades in positive territory for the fourth consecutive day on Wednesday.
- The US CPI inflation report and the Fed interest rate decision will be closely watched later on Wednesday.
- The BoJ is expected to keep the short-term policy rate steady at 0-0.1% at its June meeting on Friday.
The USD/JPY pair extends the rally near 157.15 during the early Asian trading hours on Wednesday. Traders prefer to wait on the sidelines ahead of the key events. The US Consumer Price Index (CPI) data will be released on Wednesday. The FOMC monetary policy meeting and the press conference will also be the highlights of the day.
The stronger-than-expected US jobs data released last week fueled the expectation that the Federal Reserve (Fed) might keep interest rates higher for longer, which provides some support for the Greenback. Market players will take more cues from the US CPI inflation data. The US CPI figure is projected to show an increase of 3.4% YoY in May, while core CPI is forecast to rise 3.5% YoY. The US Fed is anticipated to keep rates on hold at its June meeting on Wednesday.
On the JPY’s front, the Bank of Japan (BoJ) is expected to maintain interest rates unchanged on Friday. Additionally, nearly two-thirds of economists from a Reuters poll showed the BoJ is expected to start tapering its monthly bond buying, now set at around 6 trillion yen ($38 billion). In the meantime, the interest rate divergence between the US and Japan continues to undermine the Japanese Yen (JPY) against the USD and create a tailwind for the USD/JPY pair.


© 2000-2026. Bản quyền Teletrade.
Trang web này được quản lý bởi Teletrade D.J. LLC 2351 LLC 2022 (Euro House, Richmond Hill Road, Kingstown, VC0100, St. Vincent and the Grenadines).
Thông tin trên trang web không phải là cơ sở để đưa ra quyết định đầu tư và chỉ được cung cấp cho mục đích làm quen.
Giao dịch trên thị trường tài chính (đặc biệt là giao dịch sử dụng các công cụ biên) mở ra những cơ hội lớn và tạo điều kiện cho các nhà đầu tư sẵn sàng mạo hiểm để thu lợi nhuận, tuy nhiên nó mang trong mình nguy cơ rủi ro khá cao. Chính vì vậy trước khi tiến hành giao dịch cần phải xem xét mọi mặt vấn đề chấp nhận tiến hành giao dịch cụ thể xét theo quan điểm của nguồn lực tài chính sẵn có và mức độ am hiểu thị trường tài chính.
Sử dụng thông tin: sử dụng toàn bộ hay riêng biệt các dữ liệu trên trang web của công ty TeleTrade như một nguồn cung cấp thông tin nhất định. Việc sử dụng tư liệu từ trang web cần kèm theo liên kết đến trang teletrade.vn. Việc tự động thu thập số liệu cũng như thông tin từ trang web TeleTrade đều không được phép.
Xin vui lòng liên hệ với pr@teletrade.global nếu có câu hỏi.
ngân hàng