- Phân tích
- Tin tức và các công cụ
- Tin tức thị trường
Tin tức thì trường
- EU parliparliamentarytions knock back market stability.
- US CPI inflation and Fed rate call due on Wednesday.
- Fed’s update to “dot plot” on Wednesday is heavily anticipated.
EUR/USD slid into a third straight loss on Tuesday as market sentiment sours on the back of roiled EU parliamentary elections. Elections saw a firm swing into support for center-right and far-right parties by European voters and steep losses for left-leaning political parties as EU citizens express dissatisfaction with economic fragility and current policy tactics from established European ruling parties.
An update in US Consumer Price Index (CPI) inflation and the latest Federal Reserve (Fed) rate call are due on Wednesday, and market sentiment is coiling around itself as investors fear a steep shift in the Fed’s “dot plot”, or summary of Interest Rate Expectations looking forward. The Fed is broadly expected to hold interest rates this week, but markets will be piling into the latest dot plot to see if the Fed is still expecting to deliver some rate cuts in 2024.
US CPI inflation, Fed rate call dominate investor headspace
Markets are expecting US CPI inflation to cool down to 0.1% MoM in April compared to the previous month’s 0.3%, and annualized Core CPI inflation is expected to tick down to 3.5% YoY compared to the previous 3.6%.
The Fed’s latest rate call and Monetary Policy Statement will draw plenty of attention on Wednesday, but broad investor attention will be focused squarely on updates to the Fed’s dot plot. With interest rate expectations getting knocked steadily back in 2024, investors are increasingly concerned that Wednesday’s Fed outing will see a shift in the dot plot to exclude rate cuts in 2024.
EUR/USD technical outlook
In only three days, EUR/USD went from challenging the bullish side of a descending trendline to falling back into the bearish half, tumbling below declining technical levels from 2024’s early highs near 1.1150. The pair has slipped back below the 200-day Exponential Moving Average (EMA) near 1.0814, and the pair is challenging chart territory on the south end of 1.0750.
EUR/USD hourly chart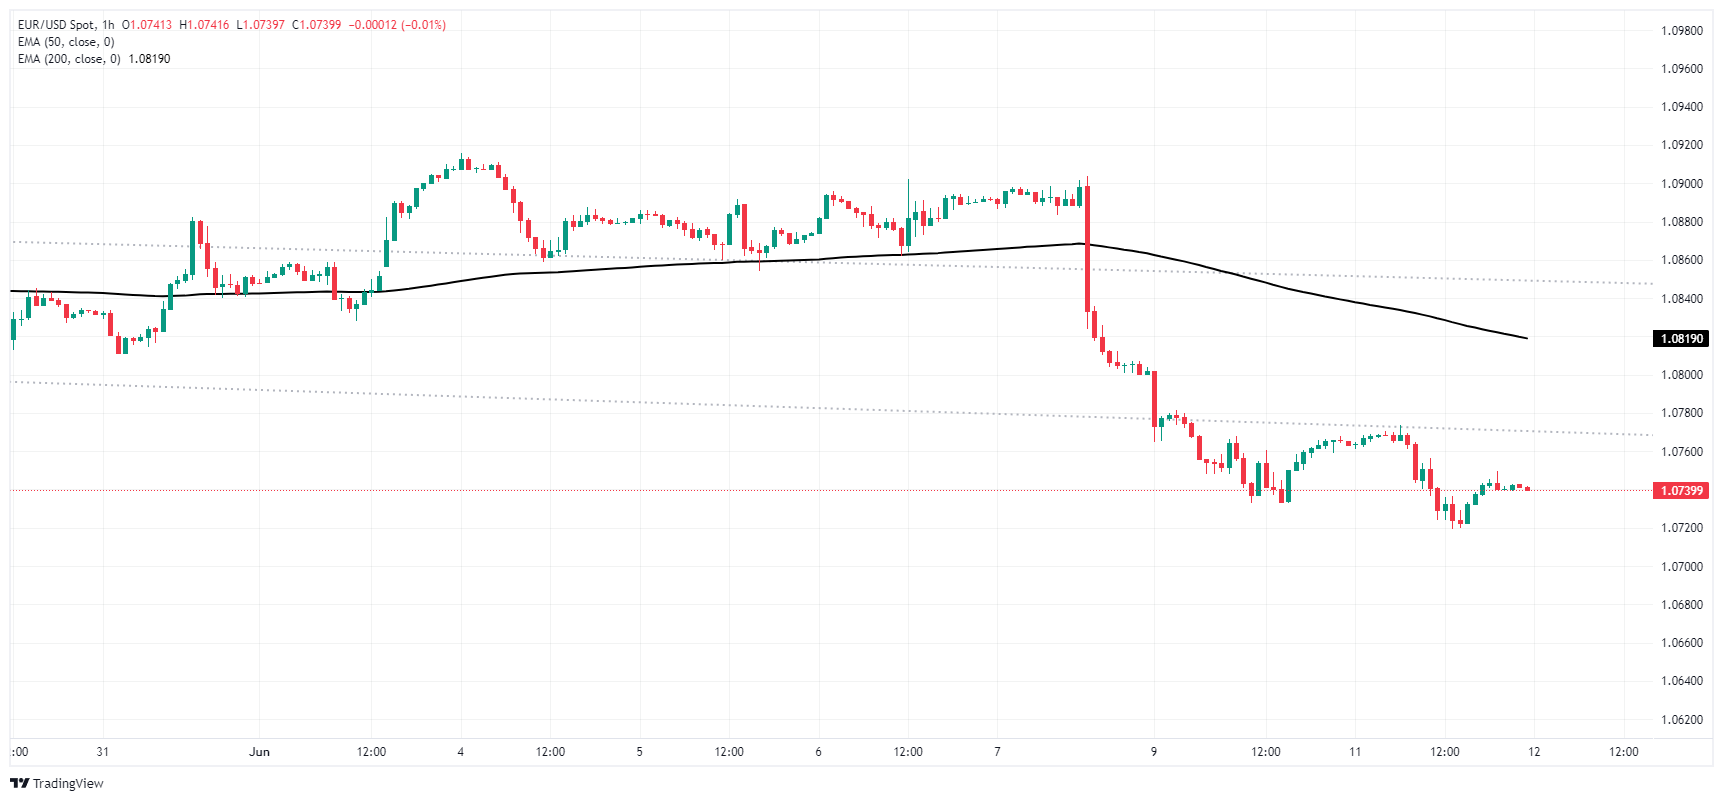
EUR/USD daily chart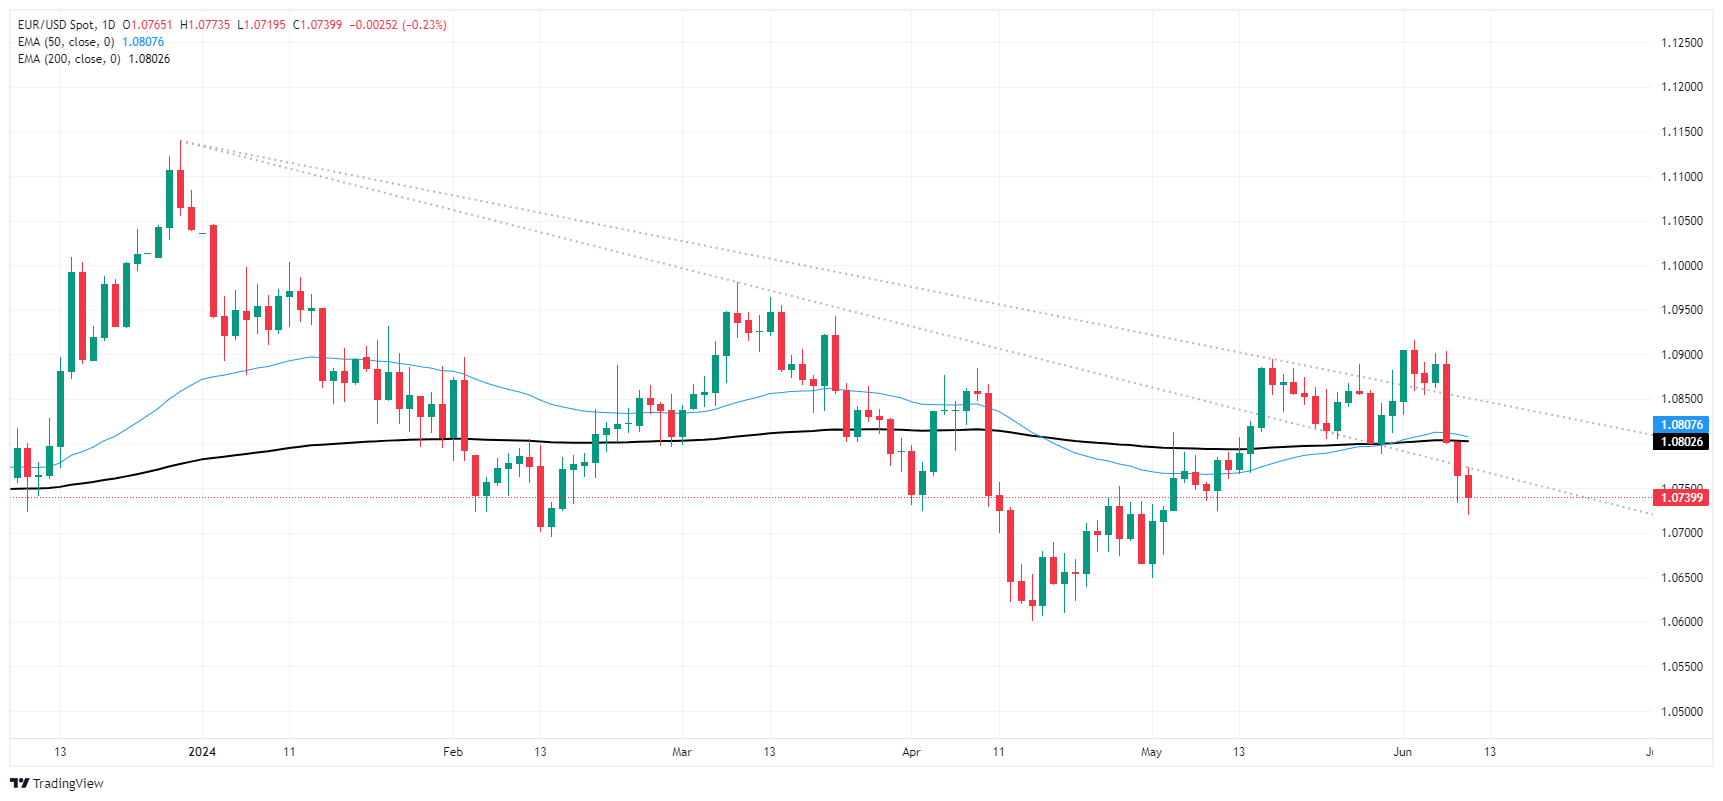
- GBP/USD trades with a mild bearish bias near 1.2740 amid firmer US Dollar on Wednesday.
- The US Fed is anticipated to keep rates on hold at its June monetary policy meeting.
- The weaker UK employment data put pressure on the BoE's potential interest rate path.
The GBP/USD pair trades with mild losses around 1.2740 during the early Asian session on Wednesday. Extended gains in the US Dollar (USD) amid the cautious mood weigh on the major pair. Investors will closely watch the US Consumer Price Index (CPI) inflation data, just few hours before the FOMC meeting.
The stronger US employment report last week dampened the expectation that the US Federal Reserve (Fed) will start cutting interest rates in September. Nonetheless, a softer-than-expected inflation report might influence Fed Chair Jerome Powell to maintain his stance of three interest rate cuts by the end of the year. This, in turn, might exert selling pressure on the Greenback. The US CPI figure is expected to show an increase of 3.4% YoY in May, while the core CPI is estimated to rise 3.5% YoY in the same report period.
The Fed is widely expected to keep rates on hold at its June meeting on Wednesday. Traders will take more cues from the latest interest rate projections about how many times the Fed expects to ease rates in 2024. According to the CME FedWatch Tool, the markets are expecting just one to two cuts in 2024.
On the other hand, the UK labor market has been contracting for the fourth time in a row. The Employment Change declined by 140K in the three months to April, compared to a 177K decrease in the previous reading. Meanwhile, the ILO Unemployment Rate increased to 4.4% in the three months to April from the previous reading of 4.3%, worse than the market expectation of 4.3%. The number of people claiming jobless benefits rose by 50.4K in May from an increase of 8.4K in April. The Pound Sterling (GBP) has edged lower after the weaker reports, as the Unemployment Rate and May Claimant data showed a worrying picture of the UK labour market condition.
- Silver prices drop 1.65% as the US Dollar gains 0.15%.
- Double-top chart pattern indicates potential further decline, with key supports at $29.00 and below.
- US inflation data and FOMC decision on Wednesday poised to impact silver prices and the broader market.
Silver prices retreated on Tuesday and fell 1.65% as the Greenback remained in the driver’s seat and posted gains of 0.15%, ahead of crucial data to be revealed on Wednesday. US inflation figures and the FOMC’s monetary policy decision would dictate the US Dollar's faith. The XAG/USD trades at $29.27 and gains some 0.12% as Wednesday’s Asian session begins.
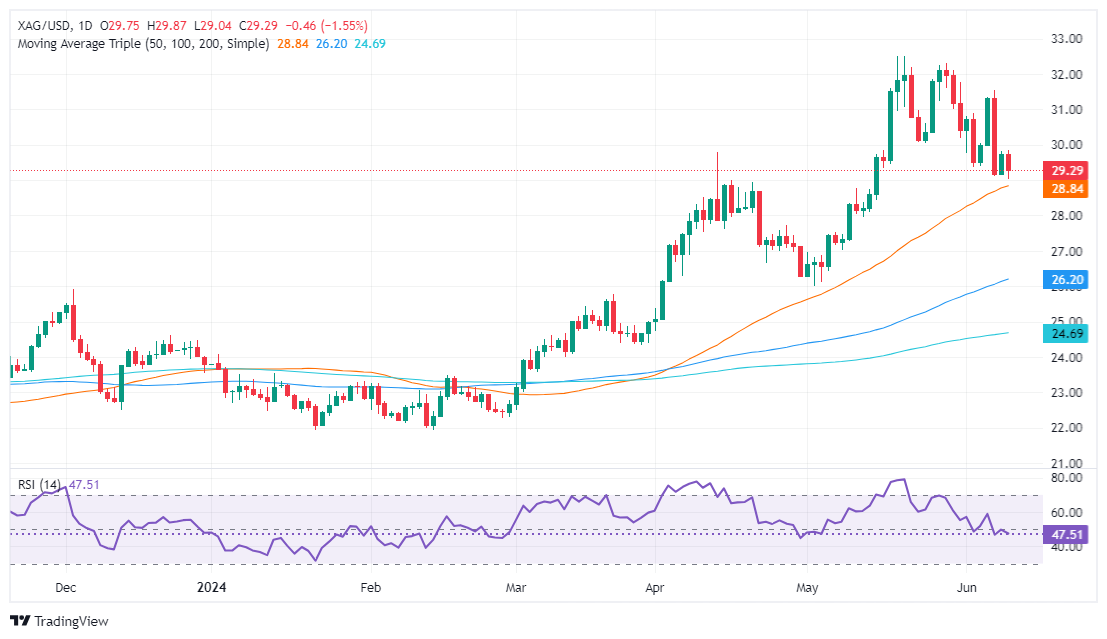
XAG/USD Price Analysis: Technical outlook
Silver's double-top chart pattern remains in play, hinting that spot prices of the grey metal will decline further. XAG/USD fell below the May 24 low of $30.05, confirming the double-top pattern.
The initial support for XAG/USD remains at $29.00, followed by the June 7 low of $29.12. Breaking below this level could lead to a drop under $29.00, then to the May 18, 2021, high turned support of $28.74, and subsequently to the June 10, 2021, high of $28.34. The final target is the double top objective at $27.80.
On the other hand, if XAG/USD moves upwards and closes above $29.00, it could challenge the May 24 low, which has turned into resistance at $30.05. Buyers are currently struggling to reclaim $30.00, which suggests potential for further downside.
XAG/USD Price Action – Daily Chart
- WTI held onto recovery territory near $78.00 on Tuesday as markets draw tight.
- API reports a steeper-than-expected drawdown in weekly crude stocks.
- EIA follow-up reporting to get drowned out by Fed rate call.
West Texas Intermediate (WTI) US Crude Oil failed to extend an ongoing recovery on the back of renewed hopes of a global supply drawdown. Investor sentiment is buckling down for the wait to Wednesday’s latest Federal Reserve (Fed) rate call and update to the Fed’s “dot plot” of Interest Rate Expectations.
Despite investor sentiment drifting lower ahead of a key Fed outing on Wednesday, Crude Oil markets held steady after the American Petroleum Institute (API) reported a steeper-than-expected drawdown in Weekly Crude Oil Stocks. API Crude Oil stocks for the week ended June 7 contracted by 2.428 million barrels, steeper than the forecast -1.75 million drawdown and helping to eat away at the previous week’s 4.052 million barrel buildup.
Week-on-week Crude Oil Stocks Change counts from the Energy Information Administration (EIA) are due on Wednesday, but will likely get drowned out by a high-impact Fed showing and an update to US Consumer Price Index (CPI) inflation.
The Fed will be updating its Interest Rate Expectations, and investors will be huddled around the economic calendar looking for adjustments to the Fed’s “dot plot”. US CPI inflation is expected earlier Wednesday, and median market forecasts are hoping for MoM CPI inflation to cool to just 0.1% compared to the previous month’s 0.3%.
WTI technical outlook
WTI has recovered nearly 7.5% from recent lows near $72.50 per barrel, but intraday bullish momentum has hit a key technical barrier at $78.00 per barrel.
Long-term bullish momentum could run into a ceiling in short order if a descending trendline holds. A recovery into the $80.00 handle will also need to break and hold above the 200-day Exponential Moving Average (EMA) near $78.90.
WTI hourly chart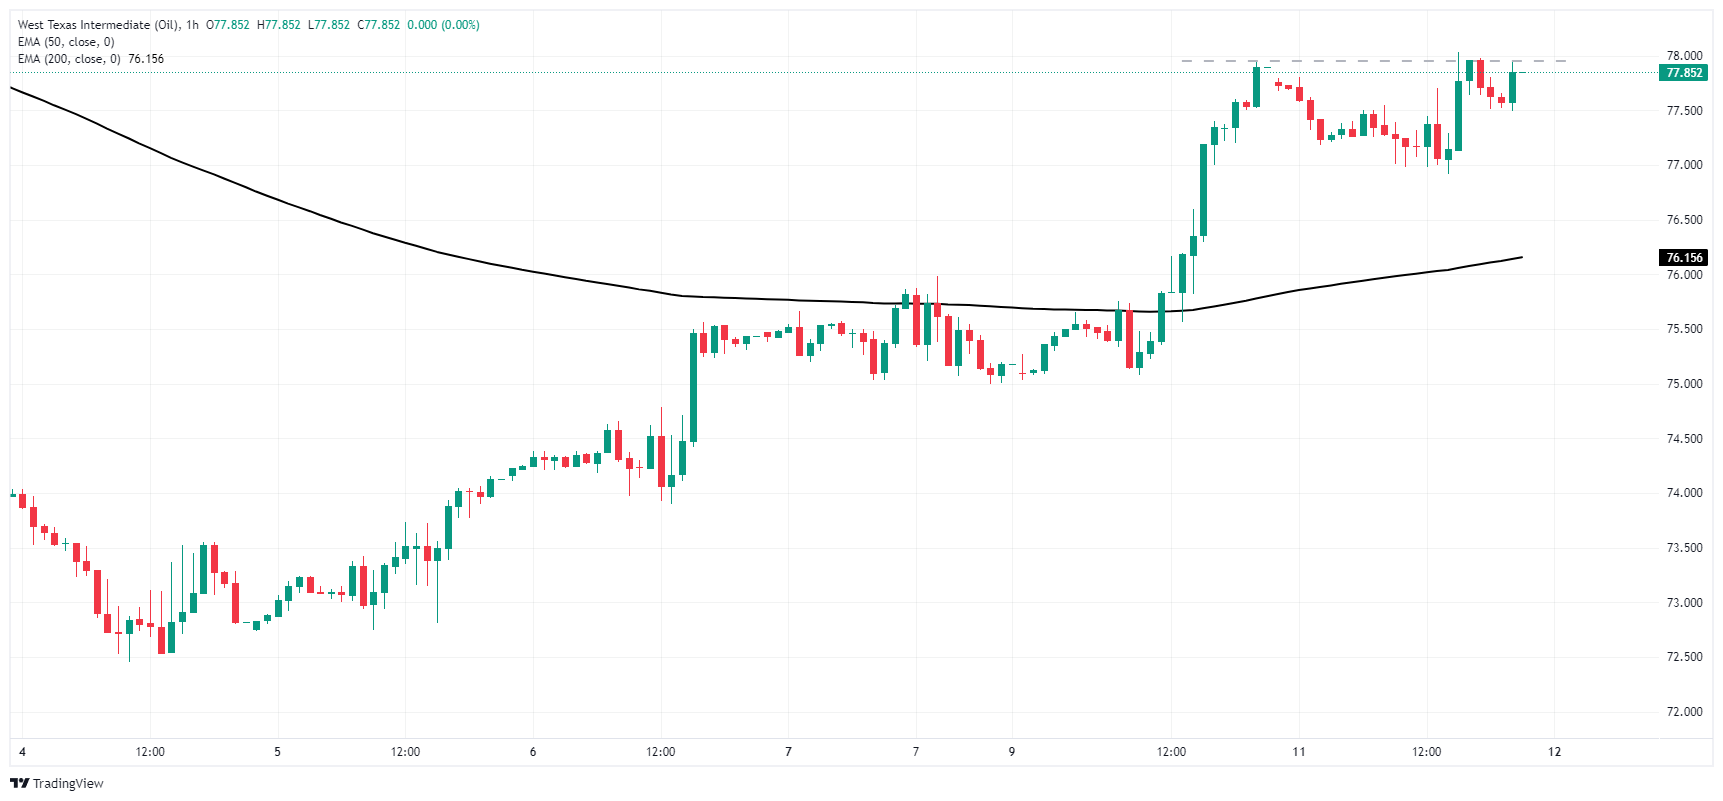
WTI daily chart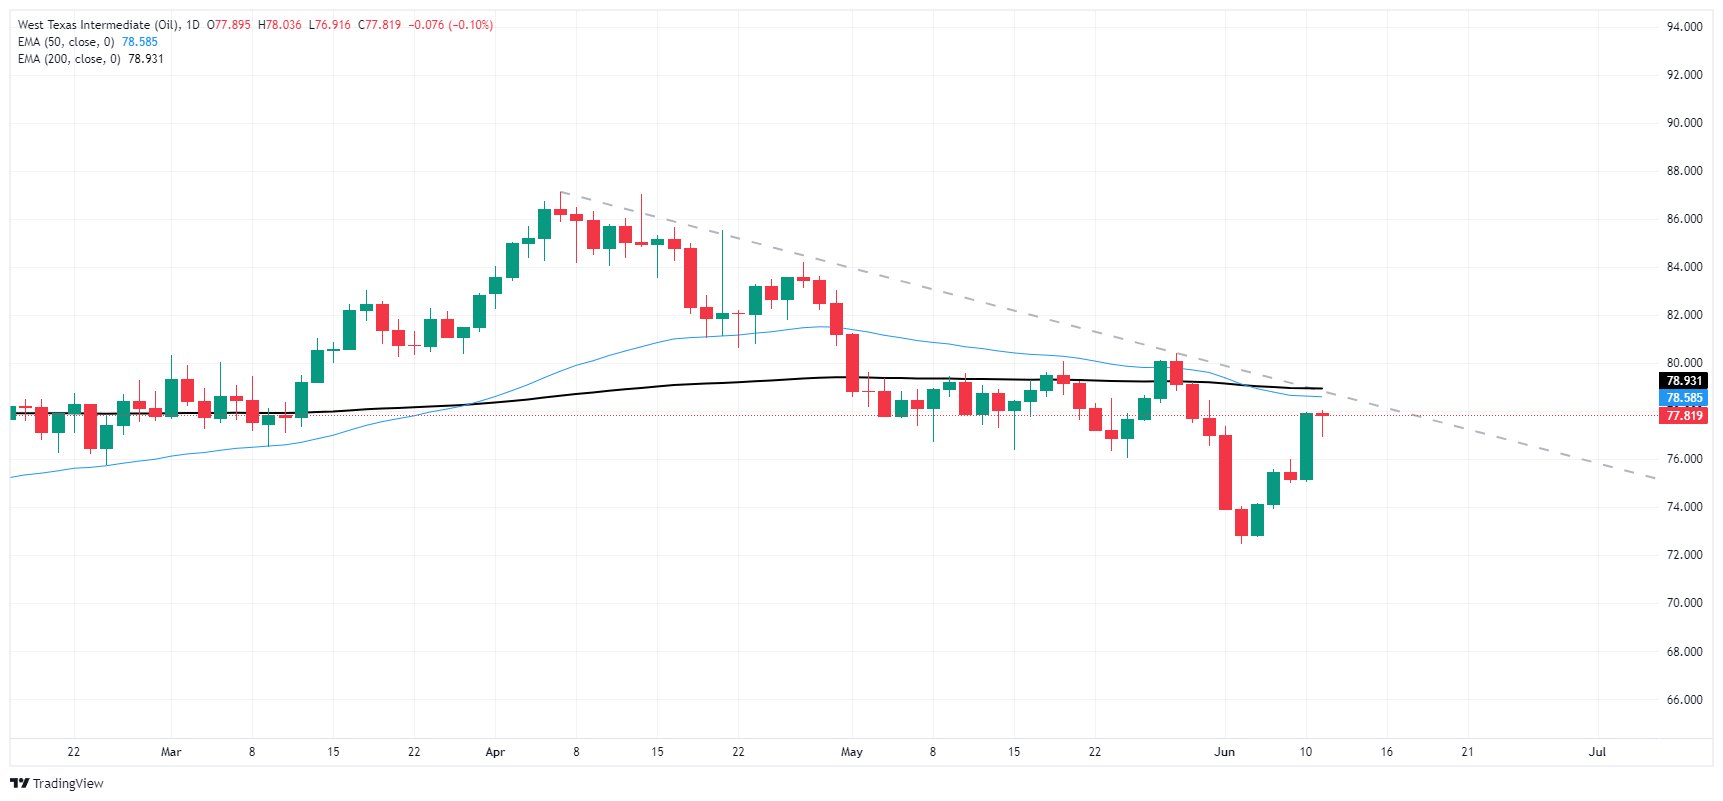
- The Kiwi gathers strength against Yen, staying comfortably above the 20-day SMA on Tuesday.
- Continuation of the consolidation phase is likely, with trading potentially framed between 95.00 and 97.00.
- After a sharp ascent in May, buyers are likely consolidating gains for possible further ascent.
On Tuesday, the NZD/JPY pair demonstrated resilience above the 20-day Simple Moving Average (SMA) at 95.90, with the pair inching closer to cycle highs near 97.00. The landscape indicates that the consolidation phase continues to hold sway, potentially limiting all upward movements of the cross past the mentioned cycle highs.
The Relative Strength Index (RSI) for NZD/JPY on the daily chart has escalated to 58 from 56.60, suggestive of an increase in buying momentum. Conversely, the Moving Average Convergence Divergence (MACD) continues to print red bars, insinuating a possible suppression of the bullish momentum and thereby corroborating the ongoing consolidation.
NZD/JPY daily chart
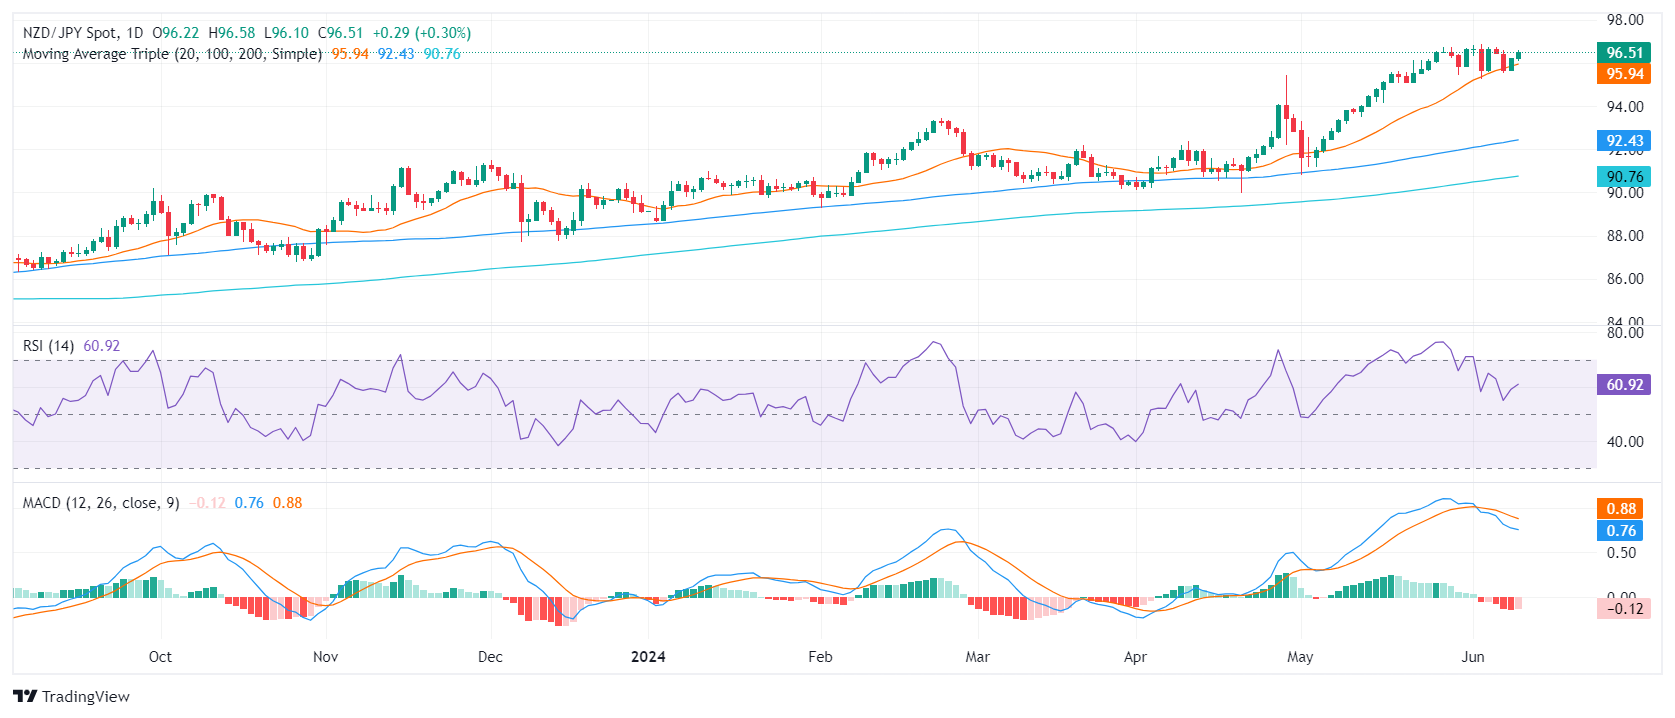
With buyers affirming presence above the 20-day SMA and indicators alluding to possible exhaustion, it elucidates the market's need to consolidate following the substantial surge observed in May. The ensuing trading sessions may continue to see the pair oscillate between the 95.00 level as a support and the 97.00 level as resistance, as the pair possibly stabilizes following recent gains.
- The daily MACD and RSI indicate decreased bearish momentum.
- A notable support threshold is holding up at 168.00, with recovery levels eyed at 169.70, around the 20-day SMA.
- Despite recent downturns, the broader bullish outlook remains sustained by the 100 and 200-day SMAs.
On Tuesday, the EUR/JPY pair continued to float around the 168.00 level, moving minorly negative as the pair continued sideways trading. Any potential recovery falls at the hands of the 20-day Simple Moving Average (SMA) which is currently near the 169.70 mark, which acts as an upper boundary hurdle.
The daily Relative Strength Index (RSI) has nudged lower towards 50 maintaining a bearish aura. This, coupled with the continuing display of flat red MACD bars, construes potentially consolidative behavior amidst the ongoing neutral landscape. Hence, the market appears to be in a holding pattern pending a significant driver for more substantial moves.
EUR/JPY daily chart
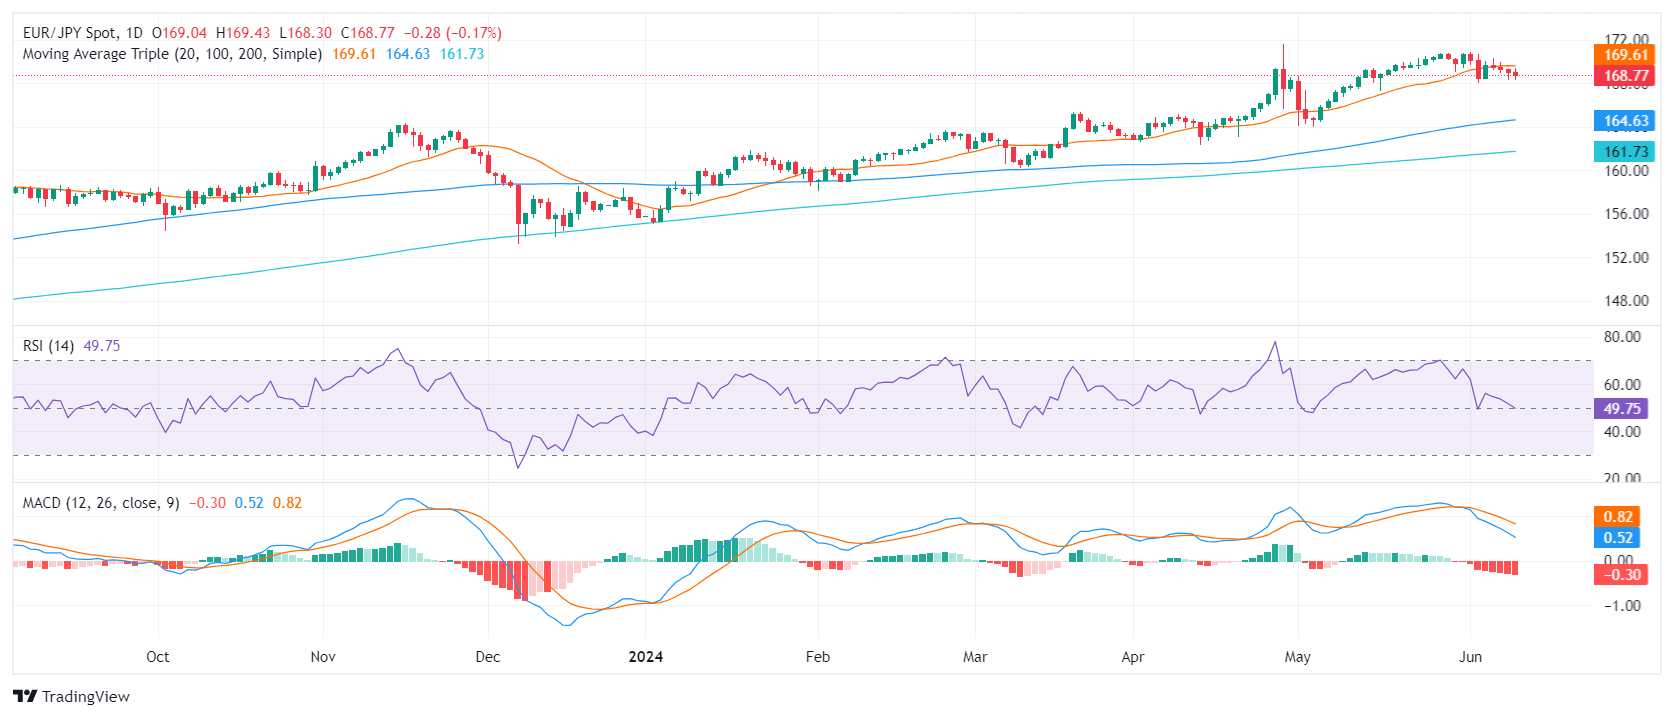
That being said, the overarching bullish forces remain at play. The fundamental stronghold arises from the 100 and 200-day SMAs present at approximately 164.00 and 161.00, which might provide defense against potential losses.
To conclude, traders remain focused on the movements around the 168.00 support level and the 169.70 recovery hurdle. A breach either way may decide the direction of the upcoming sessions.
- USD/JPY is virtually unchanged but below its opening price.
- The momentum begins to shift in favor of sellers, yet they must reclaim key support levels.
- If buyers reclaim 157.00 and 157.71, that could pave the way to test YTD high levels.
The USD/JPY retreats during the North American session yet is virtually unchanged as traders brace for Wednesday’s busy economic docket, which will feature May's US Consumer Price Index (CPI) data and the Federal Open Market Committee (FOMC) monetary policy decision. The pair trades at 156.94, down some 0.06%.
USD/JPY Price Analysis: Technical outlook
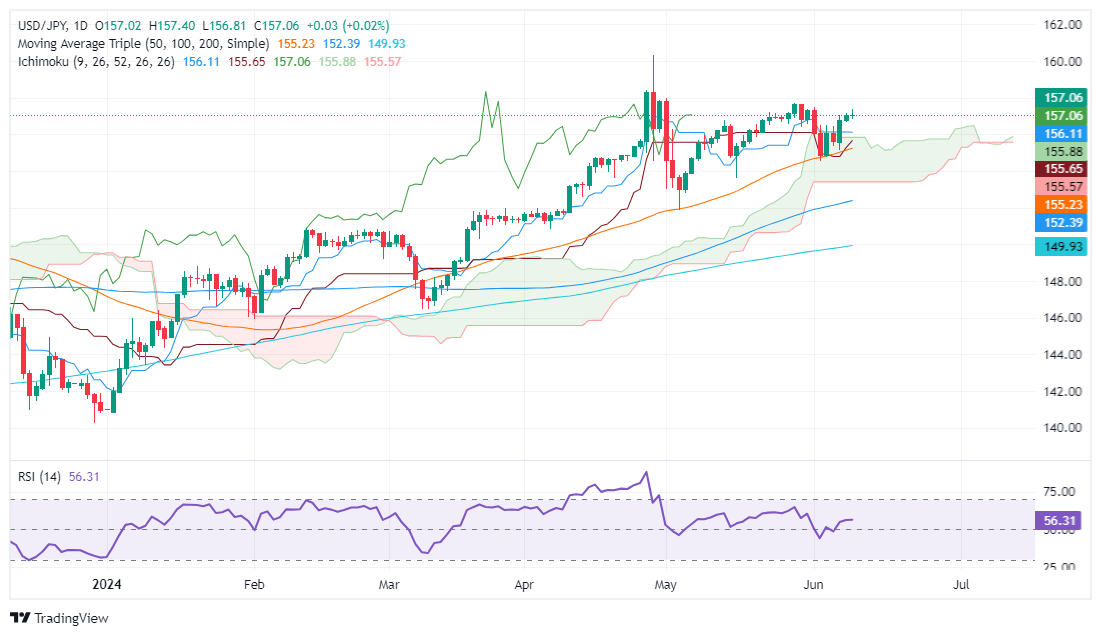
The USD/JPY daily chart suggests that buyers are losing steam; after hitting a weekly high of 157.40, they failed to hold gains above 157.00. Momentum is also fading, as the Relative Strength Index (RSI) remains bullish, but it’s aiming downwards.
If the USD/JPY extends its fall below the current weekly low of 156.64, the next stop would be the Senkou Span A at 155.88. Further losses are seen at Senkou Span B at 155.65, followed by the 50-day moving average (DMA) at 155.22.
Conversely, if USD/JPY buyers lift the exchange rate past the 157.00 figure, the next resistance would be the May 29 high of 157.71. Once cleared, the next stop would be the April 26 high at 158.44 before challenging the year-to-date (YTD) high of 158.44.
USD/JPY Price Action – Daily Chart
Japanese Yen PRICE Today
The table below shows the percentage change of Japanese Yen (JPY) against listed major currencies today. Japanese Yen was the strongest against the Euro.
| USD | EUR | GBP | JPY | CAD | AUD | NZD | CHF | |
|---|---|---|---|---|---|---|---|---|
| USD | 0.19% | -0.12% | 0.00% | -0.05% | 0.01% | -0.30% | 0.11% | |
| EUR | -0.19% | -0.31% | -0.19% | -0.23% | -0.16% | -0.48% | -0.08% | |
| GBP | 0.12% | 0.31% | 0.12% | 0.07% | 0.13% | -0.18% | 0.19% | |
| JPY | 0.00% | 0.19% | -0.12% | -0.03% | 0.00% | -0.30% | 0.08% | |
| CAD | 0.05% | 0.23% | -0.07% | 0.03% | 0.06% | -0.26% | 0.12% | |
| AUD | -0.01% | 0.16% | -0.13% | -0.01% | -0.06% | -0.32% | 0.05% | |
| NZD | 0.30% | 0.48% | 0.18% | 0.30% | 0.26% | 0.32% | 0.38% | |
| CHF | -0.11% | 0.08% | -0.19% | -0.08% | -0.12% | -0.05% | -0.38% |
The heat map shows percentage changes of major currencies against each other. The base currency is picked from the left column, while the quote currency is picked from the top row. For example, if you pick the Japanese Yen from the left column and move along the horizontal line to the US Dollar, the percentage change displayed in the box will represent JPY (base)/USD (quote).
- EUR/GBP tumbles to its lowest bids in nine months as EU elections shake Euro.
- Sterling bidders Looking ahead to UK GDP after weak-kneed UK labor print.
- Flurry of ECB speeches expected throughout the week.
EUR/GBP shed weight on Tuesday, extending recent losses and falling a third of a percent as turbulent EU Parliamentary elections destabilize European markets. UK labor data disappointed with an upswing in unemployment claims, and Sterling traders will be looking ahead to Wednesday’s UK Gross Domestic Product (GDP) update.
An upswing in support for center-right to far-right political parties during the European Parliamentary elections has jostled market stability in Europe this week. France has called for a snap election after a large shift in the key European country’s voting base as French President Macron sees his support evaporate among voters. France will return to the voting polls in a two-round election to select a new government on June 30 and July 7.
The European Central Bank (ECB) recently delivered a much-anticipated rate cut, but policymakers are broadly cautioning that a follow-up rate cut may not be on the cards unless economic data deteriorates further. A slew of mid-tier appearances from ECB heads are due throughout the week.
UK labor figures broadly missed the mark on Tuesday, with an unexpected uptick in the 3-month ILO Unemployment Rate to 4.4% in April versus the forecast hold at 4.3%. May’s Claimant Count Change also surged to 50.4K versus the expected 10.2K, while the previous month saw a slight revision to 8.4K. A surge of 50.4K new unemployment claims represents the worst MoM upswing in unemployment benefits seekers since March of 2021.
GBP traders will be looking ahead to Wednesday’s UK GDP print, which is forecast to hold at 0.0% MoM compared to the previous 0.4%.
Economic Indicator
Gross Domestic Product (MoM)
The Gross Domestic Product (GDP), released by the Office for National Statistics on a monthly and quarterly basis, is a measure of the total value of all goods and services produced in the UK during a given period. The GDP is considered as the main measure of UK economic activity. The MoM reading compares economic activity in the reference month to the previous month. Generally, a rise in this indicator is bullish for the Pound Sterling (GBP), while a low reading is seen as bearish.
Read more.Next release: Wed Jun 12, 2024 06:00
Frequency: Monthly
Consensus: 0%
Previous: 0.4%
Source: Office for National Statistics
EUR/GBP technical outlook
EUR/GBP has fallen out of recent consolidation to test multi-month lows as the Euro swoons against the Sterling. The pair tumbled to 0.8420 before finding the brakes, but bullish recovery remains limited as EUR/GBP wrestling with price action below 0.8460.
Tuesday’s declines are just a capstone on recent bearish pressure pushing the pair lower. EUR/GBP has closed flat or down for four straight weeks, and is firmly on pace to chalk in a fifth. The 200-day Exponential Moving Average (EMA) is turning bearish from 0.8617, and any bullish recoveries will run aground of familiar technical consolidation levels above the 0.8500 handle.
EUR/GBP hourly chart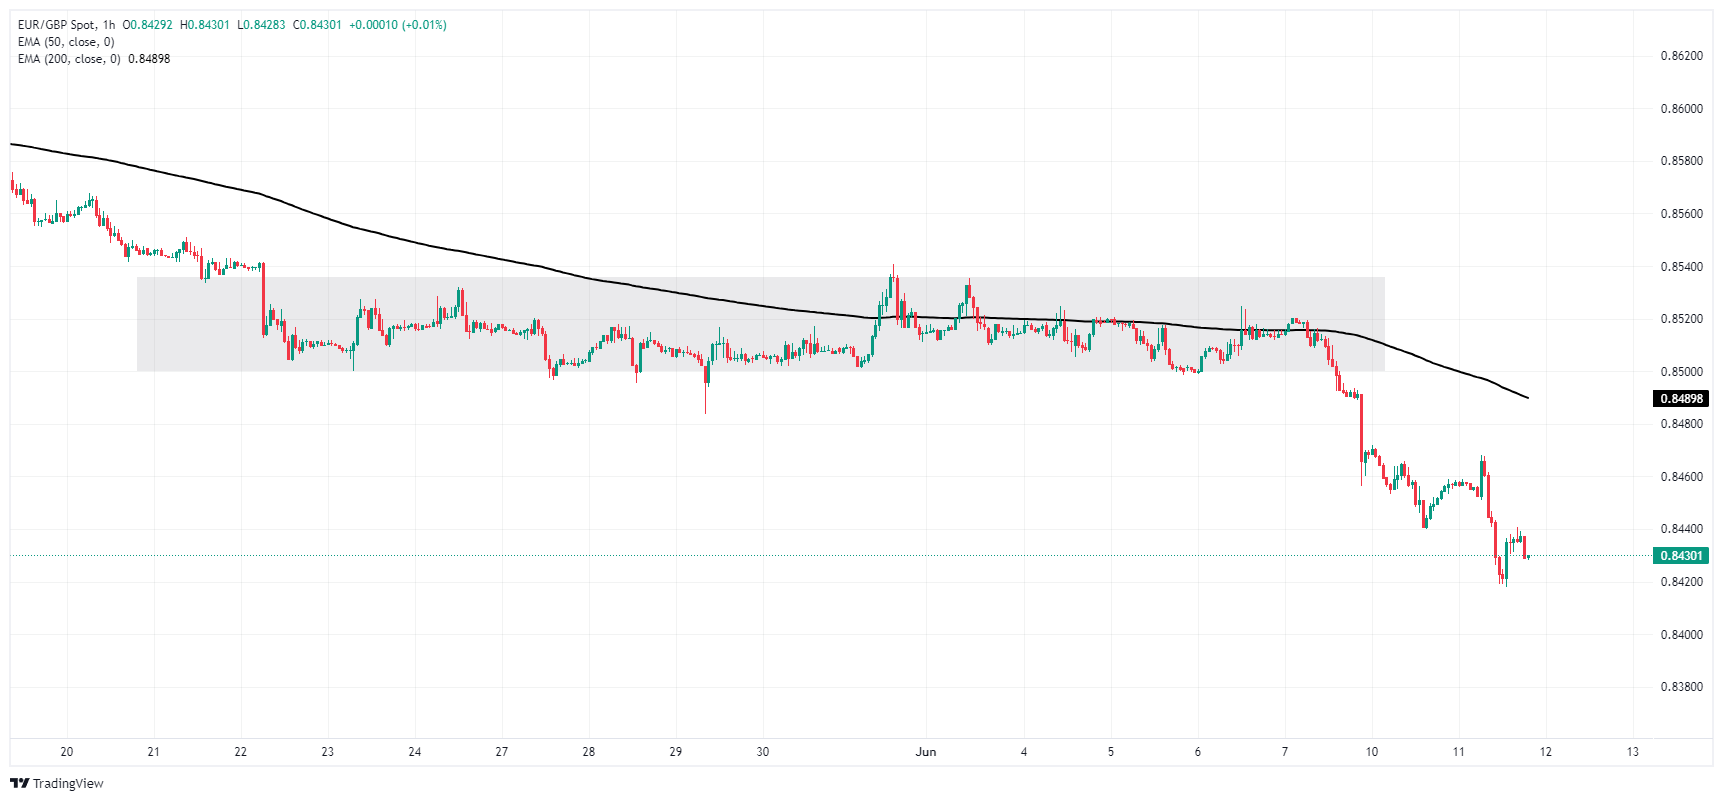
EUR/GBP daily chart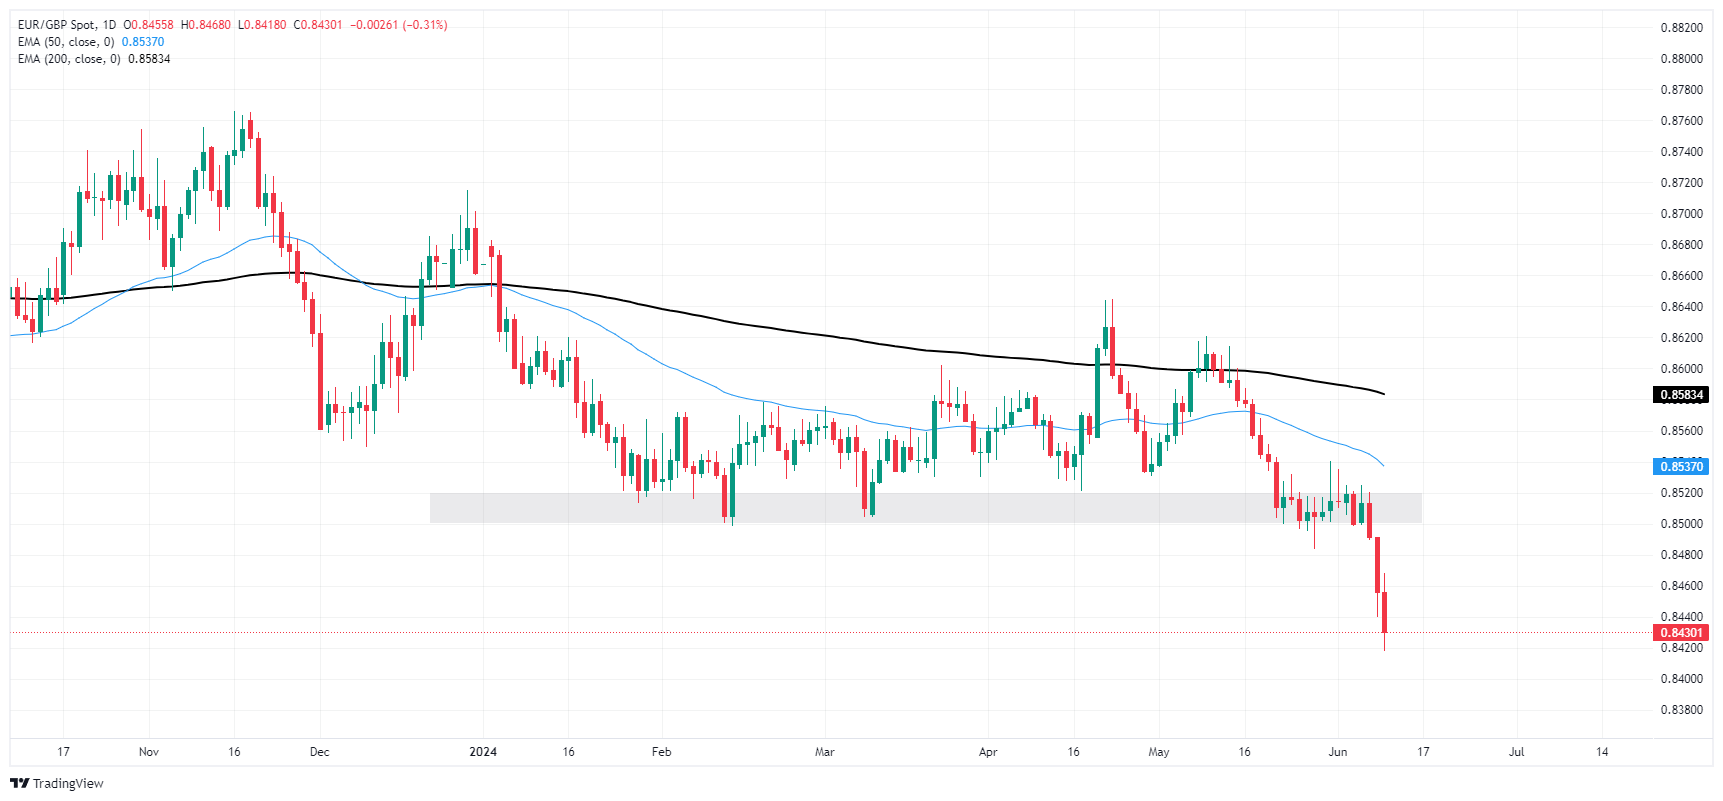
- In Tuesday's session, the pair approached the 20-day SMA, and got rejected.
- The pair is still in consolidation mode and may not have enough momentum to continue rising.
- The 102.00-104.00 range becomes an anticipated movement area for the upcoming sessions.
In Tuesday’s sessions, the AUD/JPY pair has been making strides to improve the short-term outlook, nearing the 20-day Simple Moving Average (SMA) at 103.90. However, with the pair still in consolidation mode, there might not be enough momentum for further rise. In line with that, buyers failed to hold daily gains.
The daily Relative Strength Index (RSI) for the AUD/JPY currently stands at 53, displaying a slight but positive momentum. Furthermore, the Moving Average Convergence Divergence (MACD) continues to print decreasing red bars, hinting towards a certain weakness in the bearish momentum.
AUD/JPY daily chart
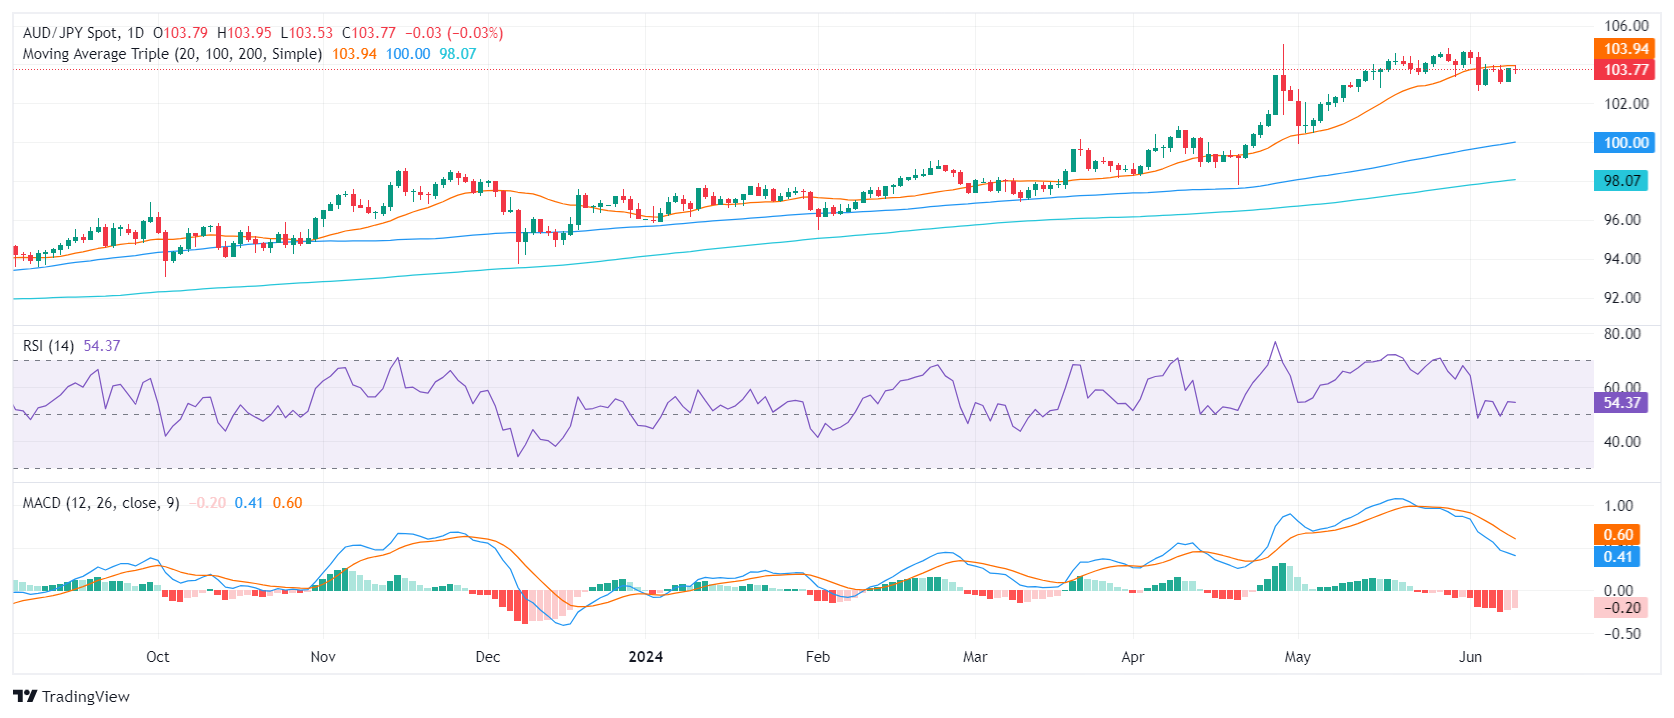
In conclusion, the AUD/JPY pair seems to be in consolidation mode as it struggles to rise above the 20-day SMA. The range between 102.00 and 104.00 may signal future trading movements unless bulls can regain control above the 20-day SMA, pushing towards the 105.00 resistance level. On the positive side for the buyers, there are some signs of a slight deceleration in the bearish activities.
- Gold trades up 0.07% as markets brace for significant US economic releases.
- US NFIB Small Business Optimism Index exceeds expectations, signaling robust economic sentiment.
- Upcoming CPI and FOMC decision, including the ‘dot plot,’ expected to impact Gold prices amid persistent inflation concerns.
Gold prices advanced for the second straight day amid a stronger US Dollar, yet it remains near familiar levels as traders brace for the release of crucial data from the United States (US). XAU/USD traders are in wait-and-see mode as the Federal Open Market Committee (FOMC) begins its two-day meeting, which will unveil the latest monetary policy decision on Wednesday. The XAU/USD trades at $2,311, up 0.07% and virtually unchanged.
Tuesday’s US economic docket remains scarce with just the release of the May NFIB Small Business Optimism Index, which exceeded estimates and April’s data. On Wednesday, the Consumer Price Index (CPI) is expected to remain firm near April’s numbers, hinting that inflation remains stubbornly high even though the Federal Reserve (Fed) raised rates by more than 500 basis points during the last few years.
After the CPI, the Fed, led by its Chair Jerome Powell, will release its monetary policy statement and the Summary of Economic Projections (SEP), which includes the famous ‘dot plot’ that depicts a “probable path’ for monetary policy.
A Reuters poll hinted that most analysts estimate a 25-basis-point (bps) interest rate cut by the Fed, in 2024. Meanwhile, data from the Chicago Board of Trade (CBOT) shows that the December 2024 fed funds futures contract suggests that most traders expect 28 bps of easing toward the end of the year.
In the meantime, the US 10-year Treasury note yield edges down six basis points to 4.41%, a headwind for the yellow metal. Consequently, the DXY, an index of the US Dollar against six other currencies, increased 0.15% to 105.25.
Daily digest market movers: Gold price stays firm ahead of US inflation, Fed’s decision
- News that the People’s Bank of China paused its 18-month bullion buying spree weighed on the precious metal. “Holdings of the precious metal by the PBOC held steady at 72.80 million troy ounces for May,” according to MarketWatch.
- The US NFIB Small Business Optimism Index in May reached its highest level of the year at 90.5, up from April’s 89.7.
- NFIB Chief Economist Bill Dunkelberg commented that inflation is the “single most important problem” in business operations. Companies expected to hire more people according to the survey, adding that financing is one of the top business problems.
- US CPI for May is expected to dip from 0.3% to 0.1% MoM, and core CPI is projected to remain steady at 0.3% MoM.
- In the 12 months to May, CPI is expected to remain unchanged at 3.4% compared to April, with the underlying core CPI expected to decelerate from 3.6% to 3.5%.
- Last week’s US jobs data hinted that the US economy remains robust, making the Fed less adept at easing policy. However, a softer-than-expected inflation report could influence Fed Chair Powell and company to keep their stance of expecting three interest rate cuts toward the end of the year.
- According to the CME FedWatch Tool, Tuesday’s odds for a Fed rate cut in September dipped from 50% last week to 46.7%.
Technical analysis: Gold price climbs, hovers around $2,310
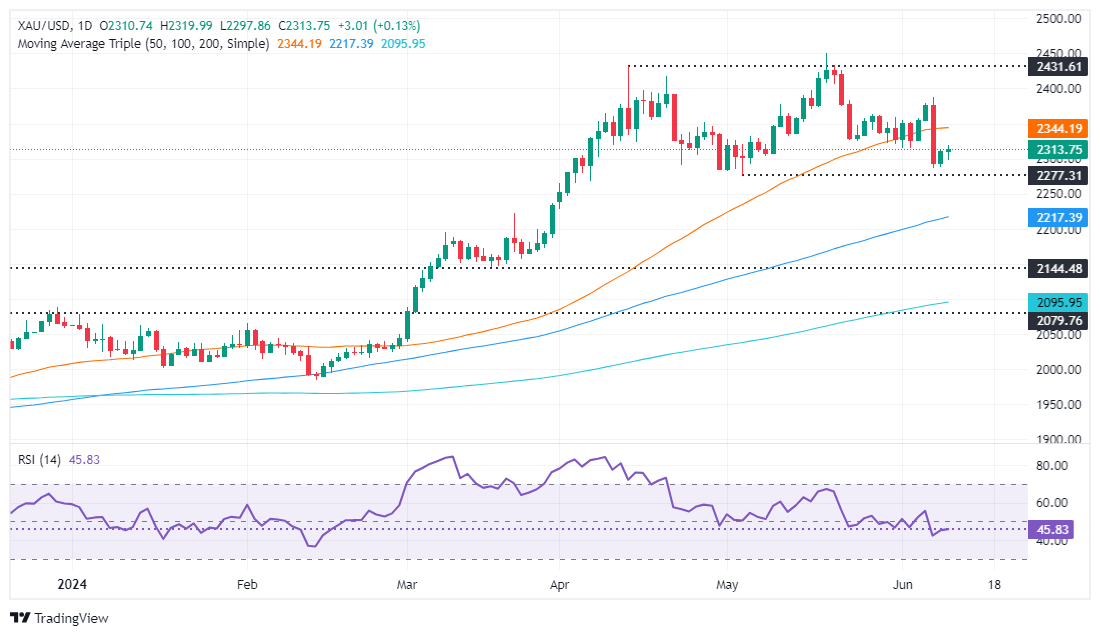
Gold price formed a Head-and-Shoulders chart pattern, which suggests the yellow metal could be headed to hit the pattern objective from $2,160 to $2,170. However, the non-yielding metal is still subdued at $2,300, awaiting a fresh catalyst, which could be the Fed’s monetary policy decision.
If XAU/USD drops below the $2,300 figure, the next demand area would be the May 3 low of $2,277, followed by the March 21 high of $2,222. Further losses lie beneath with buyers’ next line of defense close to the $2,200 figure.
Conversely, if Gold buyers lift prices above $2,350, look for a consolidation in the $2,350 to $2,380 area.
Gold FAQs
Gold has played a key role in human’s history as it has been widely used as a store of value and medium of exchange. Currently, apart from its shine and usage for jewelry, the precious metal is widely seen as a safe-haven asset, meaning that it is considered a good investment during turbulent times. Gold is also widely seen as a hedge against inflation and against depreciating currencies as it doesn’t rely on any specific issuer or government.
Central banks are the biggest Gold holders. In their aim to support their currencies in turbulent times, central banks tend to diversify their reserves and buy Gold to improve the perceived strength of the economy and the currency. High Gold reserves can be a source of trust for a country’s solvency. Central banks added 1,136 tonnes of Gold worth around $70 billion to their reserves in 2022, according to data from the World Gold Council. This is the highest yearly purchase since records began. Central banks from emerging economies such as China, India and Turkey are quickly increasing their Gold reserves.
Gold has an inverse correlation with the US Dollar and US Treasuries, which are both major reserve and safe-haven assets. When the Dollar depreciates, Gold tends to rise, enabling investors and central banks to diversify their assets in turbulent times. Gold is also inversely correlated with risk assets. A rally in the stock market tends to weaken Gold price, while sell-offs in riskier markets tend to favor the precious metal.
The price can move due to a wide range of factors. Geopolitical instability or fears of a deep recession can quickly make Gold price escalate due to its safe-haven status. As a yield-less asset, Gold tends to rise with lower interest rates, while higher cost of money usually weighs down on the yellow metal. Still, most moves depend on how the US Dollar (USD) behaves as the asset is priced in dollars (XAU/USD). A strong Dollar tends to keep the price of Gold controlled, whereas a weaker Dollar is likely to push Gold prices up.
The Greenback extended its promising start to the week and kept the risk complex under pressure on Tuesday as market participants continued to evaluate political jitters in Europe and pre-FOMC cautiousness started to kick in.
Here is what you need to know on Wednesday, June 12:
The USD Index (DXY) extended its march north of the 105.00 barrier ahead of key data releases. On June 12, the US Inflation Rate will take centre stage seconded by the FOMC meeting and the press conference by Chief J. Powell.
EUR/USD remained well on the downside and reached new multi-week lows near 1.0720 amidst Dollar’s gains and persistent political concerns. Final Inflation Rate in Germany will be the sole data release in the region on June 12 along with the speech by the ECB’s Mc Caul.
GBP/USD alternated up & downs in the low-1.2700s against the backdrop of further gains in the Greenback and poor prints from the UK labour market report. GDP figures will be at the centre of the debate on the UK docket on June 12, followed by Construction Output, Balance of Trade, Industrial and Manufacturing Production and the NIESR Monthly GDP Tracker.
USD/JPY maintained its bullish stance past the 157.00 barrier on the back of gains in the Dollar and despite declining US and Japanese yields. Producer Prices are due in Japan on June 12.
AUD/USD managed to bounce off daily lows in the 0.6590-0.6585 band despite the Dollar’s advance and the poor session in the commodity complex.
WTI prices retreated marginally amidst the strong Dollar and ahead of the key FOMC event on Wednesday.
Gold prices clung to its daily gains above the $2,300 mark per troy ounce amidst rising cautiousness prior to the publication of US CPI and the Fed’s interest rate decision. Silver resumed its downtrend and revisited the area of monthly lows around the $29.00 mark per ounce.
- AUD/USD wades through mixed trading as sellers regain momentum.
- Focus is now on Wednesday’s US inflation figures and Fed dot plot.
- Australia releases mixed NAB business survey figures.
On Tuesday, the AUD/USD pair experienced mixed trading, facing some bearish pressure and lingering around the 0.6605 area. This shift occurred as sellers re-entered the market after a minor rebound on Monday. The ongoing Federal Reserve (Fed) two-day meeting, due to conclude on Wednesday, and the US May inflation data release will be the key drivers this week.
On the Australian front, a mixed economic outlook with inflation stubbornly high might prompt the Reserve Bank of Australia (RBA) to delay cuts, which might limit losses for the Aussie.
Daily digest market movers: Aussie is under pressure as traders anticipate CPI and the Fed's decision
- On the US side, markets await the May Consumer Price Index (CPI) data due to be released on Wednesday.
- Fed's two-day meeting, which began on Tuesday and will end on Wednesday, has gripped the market's attention. Any fresh clue on their interest rate forecast might trigger volatility in markets.
- Guidance from an updated dot plot are anticipated as well.
- NAB’s May business survey shows mixed results for Australia’s outlook as the business confidence dropped to a six-month low of -3 from 1 in April.
- Business conditions dipped slightly to 6, just below the long-term average while the Employment sub-component showed improvement.
- These indicators suggest the RBA should remain cautious about easing prematurely.
Technical analysis: AUD/USD maintains support despite retracement
Following recent declines, the Relative Strength Index (RSI) continues to be below 50, supporting the bearish mood, while the Moving Average Convergence Divergence (MACD) prints red bars, reflecting a growing selling pressure.
Nonetheless, the positive outlook remains the same as the pair remains above the 100 and 200-day SMA at approximately 0.6550, suggesting an overall positive trend.
Australian Dollar FAQs
One of the most significant factors for the Australian Dollar (AUD) is the level of interest rates set by the Reserve Bank of Australia (RBA). Because Australia is a resource-rich country another key driver is the price of its biggest export, Iron Ore. The health of the Chinese economy, its largest trading partner, is a factor, as well as inflation in Australia, its growth rate and Trade Balance. Market sentiment – whether investors are taking on more risky assets (risk-on) or seeking safe-havens (risk-off) – is also a factor, with risk-on positive for AUD.
The Reserve Bank of Australia (RBA) influences the Australian Dollar (AUD) by setting the level of interest rates that Australian banks can lend to each other. This influences the level of interest rates in the economy as a whole. The main goal of the RBA is to maintain a stable inflation rate of 2-3% by adjusting interest rates up or down. Relatively high interest rates compared to other major central banks support the AUD, and the opposite for relatively low. The RBA can also use quantitative easing and tightening to influence credit conditions, with the former AUD-negative and the latter AUD-positive.
China is Australia’s largest trading partner so the health of the Chinese economy is a major influence on the value of the Australian Dollar (AUD). When the Chinese economy is doing well it purchases more raw materials, goods and services from Australia, lifting demand for the AUD, and pushing up its value. The opposite is the case when the Chinese economy is not growing as fast as expected. Positive or negative surprises in Chinese growth data, therefore, often have a direct impact on the Australian Dollar and its pairs.
Iron Ore is Australia’s largest export, accounting for $118 billion a year according to data from 2021, with China as its primary destination. The price of Iron Ore, therefore, can be a driver of the Australian Dollar. Generally, if the price of Iron Ore rises, AUD also goes up, as aggregate demand for the currency increases. The opposite is the case if the price of Iron Ore falls. Higher Iron Ore prices also tend to result in a greater likelihood of a positive Trade Balance for Australia, which is also positive of the AUD.
The Trade Balance, which is the difference between what a country earns from its exports versus what it pays for its imports, is another factor that can influence the value of the Australian Dollar. If Australia produces highly sought after exports, then its currency will gain in value purely from the surplus demand created from foreign buyers seeking to purchase its exports versus what it spends to purchase imports. Therefore, a positive net Trade Balance strengthens the AUD, with the opposite effect if the Trade Balance is negative.
- Dow Jones backslides over 250 points as equities brace for Fed updates.
- Investors are icnreasingly concerned about the pace of rate cuts.
- Wednesday’s update to the Fed’s “dot plot” will draw plenty of attention.
The Dow Jones Industrial Average (DJIA) is struggling under the weight of investor trepidation ahead of Wednesday’s key Federal Reserve (Fed) outing. The Fed is broadly expected to hold rates in the 500-525 basis point range in June and July, but investors are worried that 2024 may see even less rate cuts than previously expected. The Fed’s “dot plot” of Interest Rate Expectations will be updated on Wednesday, and a fresh update on US Consumer Price Index (CPI) inflation will also drop on markets.
Yields on US Treasuries slightly declined on Tuesday, with 10-Year Notes easing to 4.438% from 4.483%, helping to bolster the mood and giving equities a late leg up. However market focus remains on Wednesday’s double-header of US CPI inflation and Fed “dot plot” update.
Rate markets are still holding out hope for a quarter-point cut in September, and according to the CME’s FedWatch Tool, interest rate traders are pricing in 51% odds of at least a 25 basis point cut on September 18. However, any big shifts in the Fed’s interest rate expectations could spark a flurry of action in either direction depending on the Fed’s outlook.
Dow Jones news
Nearly all of the Dow Jones’ constituent equities are seeing declines on Tuesday, with firm gains from Apple Inc. (AAPL) doing nearly all of the heavy lifting. Apple hit a fresh 52-week high of $205.46, climbing 12.34 points and gaining 6.4% on the day as investors continue to scoop up anything that references AI tech.
An increasingly-negative outlook on the US economy has been gripping investors this week, sending critical stocks broadly lower. Boeing Co. (BA) fell -3.2% to $184.05 per share, closely followed by American Express Co. which fell -3.07% to $225.30 per share.
Dow Jones technical outlook
The Dow Jones is the worst-performing of the major American equity indexes on Tuesday, declining over 250 points and falling below 38,600.00. The Dow Jones plunged to 38,425.00 in early trading, but recovery momentum remains limited.
A long-term demand zone rests just below 38,000.00 to prop up any extended declines, but buyers will have their work cut out for them if they want to push the Dow Jones back into fresh all-time-highs above 40,000.00.
Dow Jones five minute chart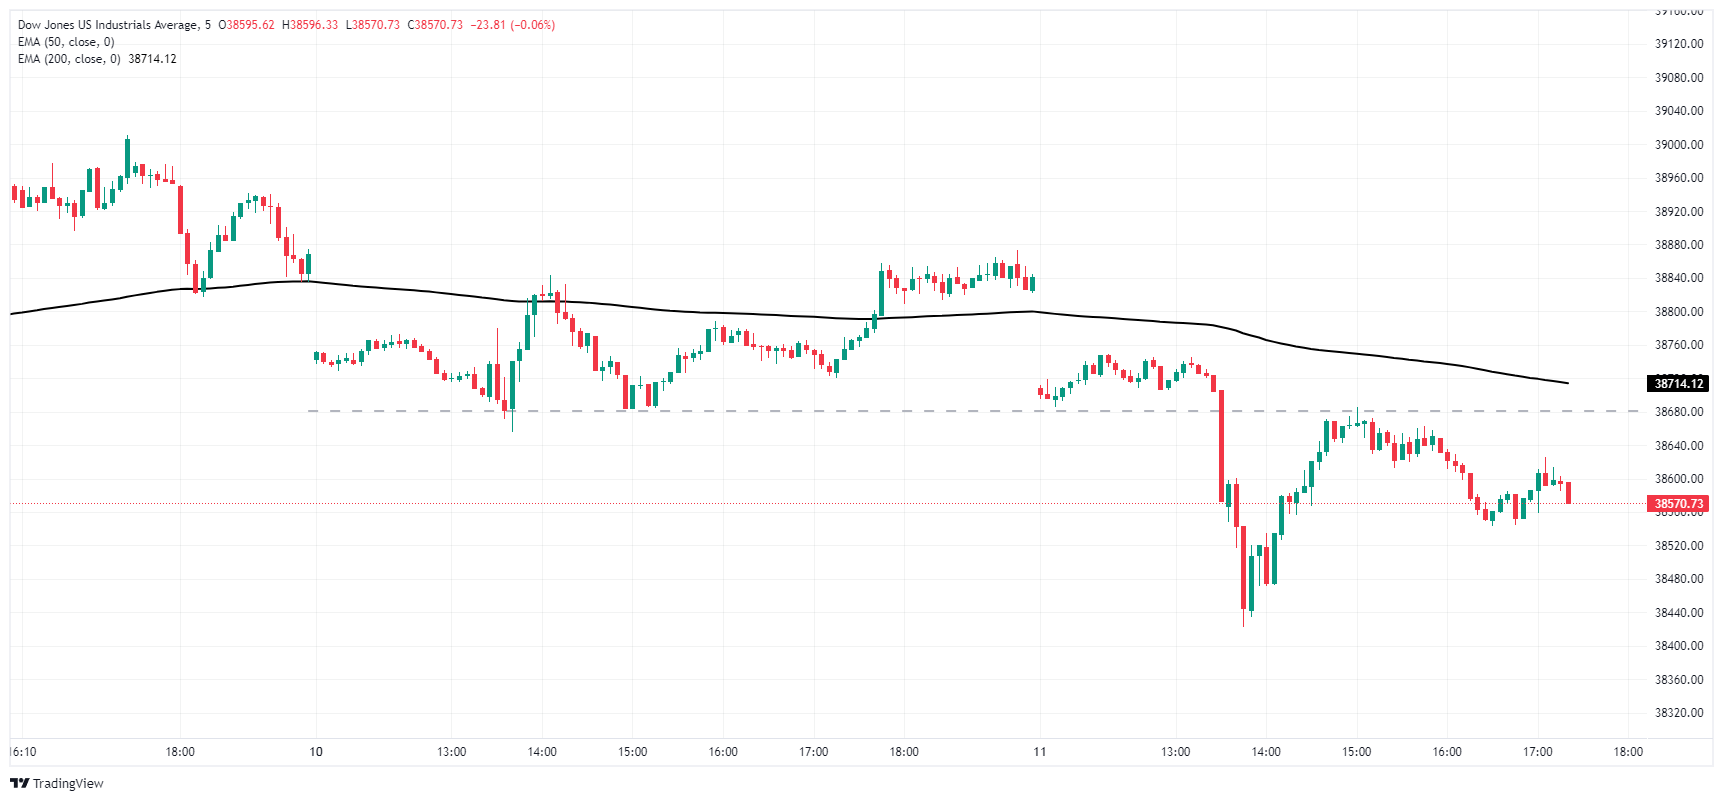
Dow Jones daily chart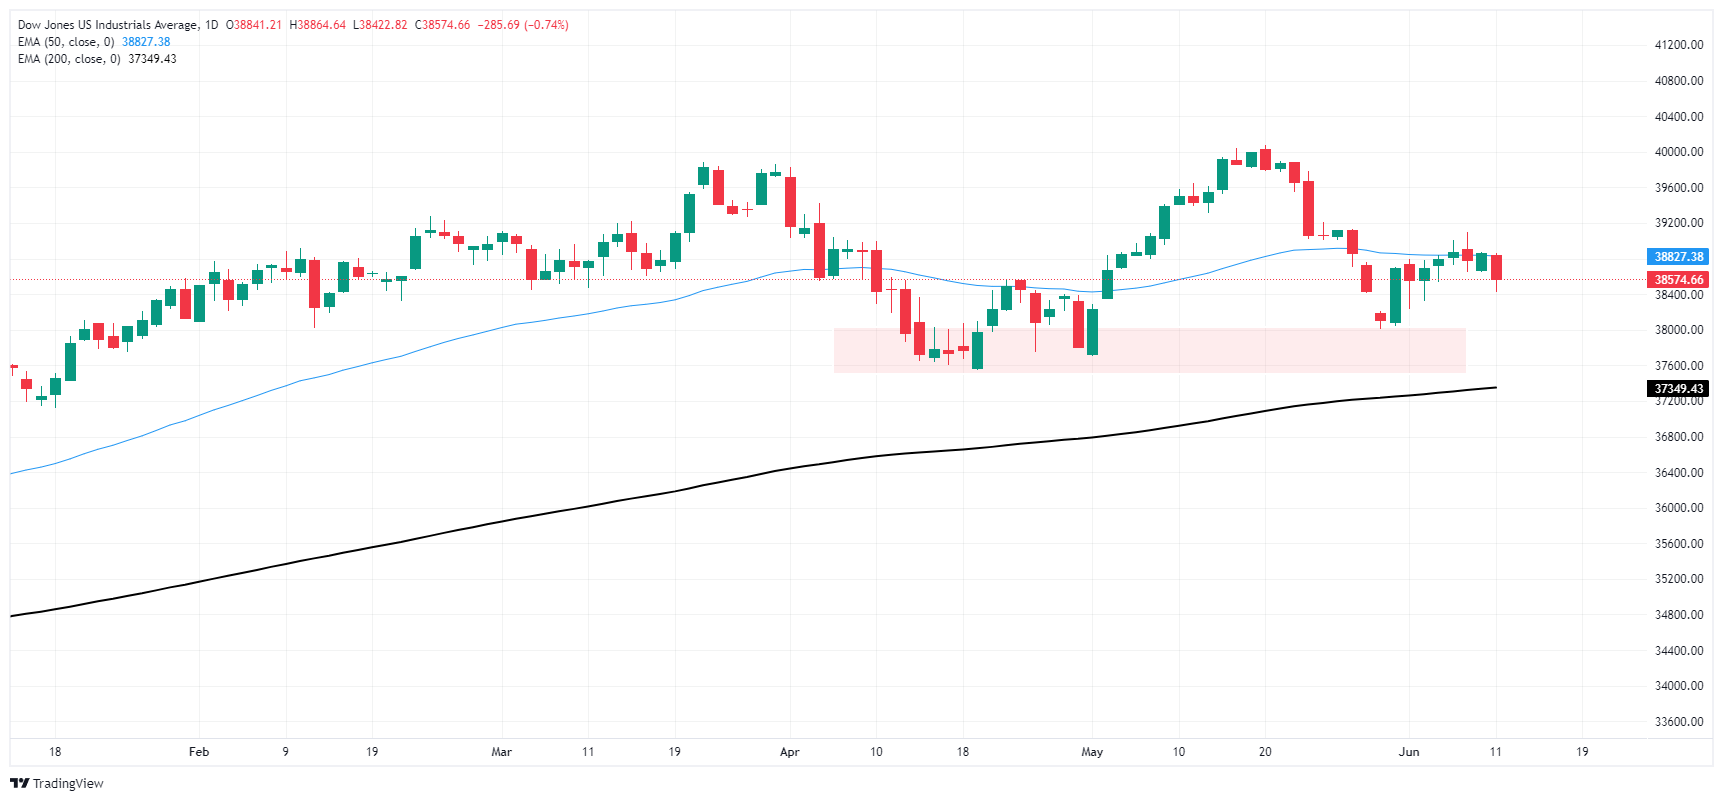
Dow Jones FAQs
The Dow Jones Industrial Average, one of the oldest stock market indices in the world, is compiled of the 30 most traded stocks in the US. The index is price-weighted rather than weighted by capitalization. It is calculated by summing the prices of the constituent stocks and dividing them by a factor, currently 0.152. The index was founded by Charles Dow, who also founded the Wall Street Journal. In later years it has been criticized for not being broadly representative enough because it only tracks 30 conglomerates, unlike broader indices such as the S&P 500.
Many different factors drive the Dow Jones Industrial Average (DJIA). The aggregate performance of the component companies revealed in quarterly company earnings reports is the main one. US and global macroeconomic data also contributes as it impacts on investor sentiment. The level of interest rates, set by the Federal Reserve (Fed), also influences the DJIA as it affects the cost of credit, on which many corporations are heavily reliant. Therefore, inflation can be a major driver as well as other metrics which impact the Fed decisions.
Dow Theory is a method for identifying the primary trend of the stock market developed by Charles Dow. A key step is to compare the direction of the Dow Jones Industrial Average (DJIA) and the Dow Jones Transportation Average (DJTA) and only follow trends where both are moving in the same direction. Volume is a confirmatory criteria. The theory uses elements of peak and trough analysis. Dow’s theory posits three trend phases: accumulation, when smart money starts buying or selling; public participation, when the wider public joins in; and distribution, when the smart money exits.
There are a number of ways to trade the DJIA. One is to use ETFs which allow investors to trade the DJIA as a single security, rather than having to buy shares in all 30 constituent companies. A leading example is the SPDR Dow Jones Industrial Average ETF (DIA). DJIA futures contracts enable traders to speculate on the future value of the index and Options provide the right, but not the obligation, to buy or sell the index at a predetermined price in the future. Mutual funds enable investors to buy a share of a diversified portfolio of DJIA stocks thus providing exposure to the overall index.
- Mexican Peso continues to depreciate more than 1.20% on Tuesday as investors fear judiciary reform and dissolution of autonomous bodies.
- Sheinbaum’s confirmation of “Plan C” program drives volatility with USD/MXN rallying to 18.57.
- Political uncertainty overshadows Mexico’s economic data; US CPI, Fed decision expected to extend USD/MXN rally.
The Mexican Peso freefall continued Tuesday, following virtual President-Elect Claudia Sheinbaum’s press conference on Monday, during which she reassured voters the judiciary reform is a go, raising investors' fears as the USD/MXN soared. The exotic pair trades at 17.43, posting gains of more than 1.20% after bouncing off lows of 18.19.
The USD/MXN rallied to 18.57 after Sheinbaum confirmed that she would prioritize the so-called “Plan C” program. This program seeks to push changes to the Constitution that involve judiciary reform, the dissolution of autonomous bodies, and the electoral commission, among 15 other reforms.
Joaquin Monfort, analyst at FX Street, writes, “The reform to the judiciary seeks to replace the current system, in which Supreme Court judges are appointed, with judges elected by popular vote. The policy also encompasses the heads of bar associations, law schools and some lower court judges. The reforms stem from criticisms of the current system[,] which it is argued enables corruption and cronyism.”
Meanwhile, President Andres Manuel Lopez Obrador (AMLO), at his usual morning press conference on Tuesday, emphasized that the judiciary reform is urgent and should be approved in September when the newly elected Mexican Congress takes office.
In the meantime, the release of Mexican economic data has taken a backseat amidst political uncertainty. Industrial Production in April plummeted on a monthly basis, yet annual figures expanded above the consensus.
USD/MXN traders should know that the pair will be extremely sensitive and volatile amid political uncertainty in Mexico.
On the US front, the Consumer Price Index (CPI) for May is anticipated to show persistent inflation ahead of the Federal Reserve’s (Fed) monetary policy decision. Recent US data indicates that the Fed will likely keep rates unchanged, maintaining its "higher for longer" approach.
Daily digest market movers: Mexican Peso slides sharply as AMLO’s judiciary reform could be approved in September
- Mexico’s Industrial Production in May came at -0.5% MoM, below estimates of 0.3% and March’s 0.5%. Annually, it grew 5.1%, above the consensus of 4.4% and improved compared to March’s -3.0%.
- In February 2024, AMLO put forward several proposals to the Mexican Congress. These include a Supreme Court reform that suggests electing Supreme Court ministers through popular vote; an electoral reform aimed at electing electoral commission councilors by popular vote and reducing multi-member representation; and a reform of autonomous bodies that proposes dissolving the transparency body.
- Mexican Peso depreciation could weigh on the Bank of Mexico's (Banxico) decision to ease policy, even though last month’s core inflation slowed. Therefore, keeping interest rates higher could prompt deceleration in the economy and increase the odds of a recession.
- Morgan Stanley noted that if Mexico’s upcoming government and Congress adopted an unorthodox agenda, it would undermine Mexican institutions and be bearish for the Mexican Peso, which could weaken to 19.20.
- Last week’s US economic data decreased the odds for a Fed rate cut in September, according to the CME FedWatch Tool, from above 50% to 46.7%.
- December’s 2024 fed funds futures contract hints that investors expect 28 basis points of rate cuts by the Fed through the end of the year.
Technical analysis: Mexican Peso slumps sharply with USD/MXN buyers eyeing 19.00
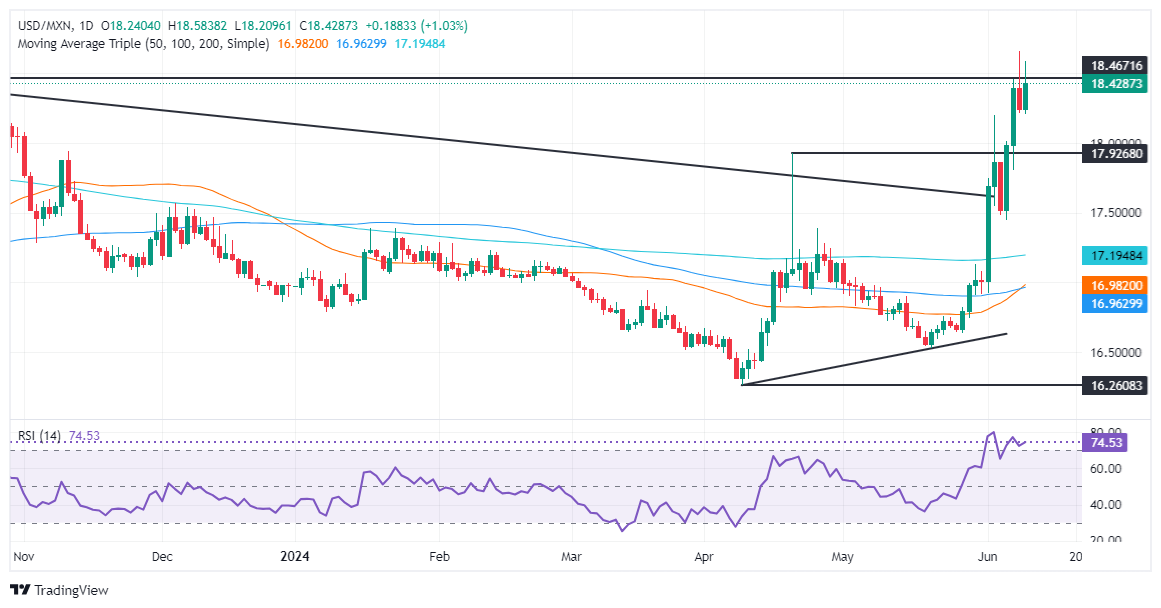
The USD/MXN remains bullishly biased even though the rally stalled after hitting a multi-month high of 18.65, which sponsored a leg down toward the current exchange rate. Last week, I wrote that “a fifth daily close above a four-year-old downslope resistance trendline drawn from all-time highs (ATH) at around $25.77.” So far, price action suggests the exotic pair would continue to trend higher amid political uncertainty.
The USD/MXN's next resistance would be the October 6 high of 18.48, followed by the day’s high of 18.57. Once surpassed, the next ceiling level would be the psychological 19.00 figure. Overhead resistance levels lie ahead, with the March 20, 2023, high of 19.23 up next ahead of the psychological 20.00 mark.
On the other hand, sellers need to push the USD/MXN back below the April 19 high of 18.15 if they want to keep the pair within the 18.00-18.15 trading range.
Mexican Peso FAQs
The Mexican Peso (MXN) is the most traded currency among its Latin American peers. Its value is broadly determined by the performance of the Mexican economy, the country’s central bank’s policy, the amount of foreign investment in the country and even the levels of remittances sent by Mexicans who live abroad, particularly in the United States. Geopolitical trends can also move MXN: for example, the process of nearshoring – or the decision by some firms to relocate manufacturing capacity and supply chains closer to their home countries – is also seen as a catalyst for the Mexican currency as the country is considered a key manufacturing hub in the American continent. Another catalyst for MXN is Oil prices as Mexico is a key exporter of the commodity.
The main objective of Mexico’s central bank, also known as Banxico, is to maintain inflation at low and stable levels (at or close to its target of 3%, the midpoint in a tolerance band of between 2% and 4%). To this end, the bank sets an appropriate level of interest rates. When inflation is too high, Banxico will attempt to tame it by raising interest rates, making it more expensive for households and businesses to borrow money, thus cooling demand and the overall economy. Higher interest rates are generally positive for the Mexican Peso (MXN) as they lead to higher yields, making the country a more attractive place for investors. On the contrary, lower interest rates tend to weaken MXN.
Macroeconomic data releases are key to assess the state of the economy and can have an impact on the Mexican Peso (MXN) valuation. A strong Mexican economy, based on high economic growth, low unemployment and high confidence is good for MXN. Not only does it attract more foreign investment but it may encourage the Bank of Mexico (Banxico) to increase interest rates, particularly if this strength comes together with elevated inflation. However, if economic data is weak, MXN is likely to depreciate.
As an emerging-market currency, the Mexican Peso (MXN) tends to strive during risk-on periods, or when investors perceive that broader market risks are low and thus are eager to engage with investments that carry a higher risk. Conversely, MXN tends to weaken at times of market turbulence or economic uncertainty as investors tend to sell higher-risk assets and flee to the more-stable safe havens.
- USD sees continuous rise with keen eye toward FOMC meeting, prolonging its third consecutive day of gains.
- US economic outlook remains strong and investors await fresh economic forecasts from the FOMC.
- Markets anticipate hawkish tone on Wednesday’s Fed decision.
On Tuesday, the US Dollar Index (DXY) saw an upward trend toward the 105.36 area. The session won’t provide any highlights as cannons are pointing to Wednesday’s session.
The two-day Federal Open Market Committee (FOMC) meeting, which kicked off on Tuesday and will end on Wednesday, is eyed by market observers. Any changes to the interest rate outlook or guidance by Federal Reserve (Fed) members are bound to stir market movements. The outcome of the famous dot plot will also be closely watched.
Daily digest market movers: DXY gains further ground on quiet Tuesday, eyes on FOMC
- Updated dot plots will provide valuable insight. A single shift from three interest rate cuts to two by a Fed policymaker could potentially elevate the 2024 median from 4.625% to 4.875%.
- Markets expect a seemingly 'hawkish hold' from the Fed, keeping rates at 5.5%.
- Consequently, the odds of a September cut appear to be a 50:50 chance, and November cut odds stand at approximately 85%.
- US will also release inflation data on Wednesday. The core Consumer Price Index (CPI) for May is forecast to decelerate slightly to 3.5% YoY, while headline inflation is anticipated to remain steady at 3.4%.
DXY technical analysis: Fundamentals on Wednesday to stir trajectory
Indicators on the daily chart remain strong, and both the Relative Strength Index (RSI) and the Moving Average Convergence Divergence (MACD) jumped to positive terrain. Additionally, the Index recovered above the 20, 100, and 200-day Simple Moving Averages (SMA), which brightened the outlook for the short term.
Fundamental stimulus on Wednesday will dictate the pace of the next sessions, and markets should eye the 106.00 area in case the DXY faces bullish pressure. On the downside, the 104.50 area remains as a strong support.
US Dollar FAQs
The US Dollar (USD) is the official currency of the United States of America, and the ‘de facto’ currency of a significant number of other countries where it is found in circulation alongside local notes. It is the most heavily traded currency in the world, accounting for over 88% of all global foreign exchange turnover, or an average of $6.6 trillion in transactions per day, according to data from 2022. Following the second world war, the USD took over from the British Pound as the world’s reserve currency. For most of its history, the US Dollar was backed by Gold, until the Bretton Woods Agreement in 1971 when the Gold Standard went away.
The most important single factor impacting on the value of the US Dollar is monetary policy, which is shaped by the Federal Reserve (Fed). The Fed has two mandates: to achieve price stability (control inflation) and foster full employment. Its primary tool to achieve these two goals is by adjusting interest rates. When prices are rising too quickly and inflation is above the Fed’s 2% target, the Fed will raise rates, which helps the USD value. When inflation falls below 2% or the Unemployment Rate is too high, the Fed may lower interest rates, which weighs on the Greenback.
In extreme situations, the Federal Reserve can also print more Dollars and enact quantitative easing (QE). QE is the process by which the Fed substantially increases the flow of credit in a stuck financial system. It is a non-standard policy measure used when credit has dried up because banks will not lend to each other (out of the fear of counterparty default). It is a last resort when simply lowering interest rates is unlikely to achieve the necessary result. It was the Fed’s weapon of choice to combat the credit crunch that occurred during the Great Financial Crisis in 2008. It involves the Fed printing more Dollars and using them to buy US government bonds predominantly from financial institutions. QE usually leads to a weaker US Dollar.
Quantitative tightening (QT) is the reverse process whereby the Federal Reserve stops buying bonds from financial institutions and does not reinvest the principal from the bonds it holds maturing in new purchases. It is usually positive for the US Dollar.
- Canadian Dollar trades steadily on Tuesday with little momentum.
- Canada brings strictly low-tier data to the table this week.
- Fed rate cut expectations still dominate market outlook.
The Canadian Dollar (CAD) is trading mostly flat on Tuesday as investors stubbornly dig in their heels ahead of Wednesday’s key data prints from the US. US Consumer Price Index (CPI) inflation is slated for the midweek market session, followed by a fresh rate call from the Federal Reserve (Fed) that is broadly expected to hold rates in the 500-525 basis point range.
Canada is limited to just low-tier economic data releases this week, except for a single showing from the Bank of Canada’s (BoC) Governor Tiff Macklem, who is slated to make an appearance on Wednesday. However, the BoC Governor’s statement is likely to get drowned out by market reactions to shifts in the Fed’s “dot plot” of Interest Rate Projections due at the same time as the Fed’s rate call this week.
Daily digest market movers: Markets getting nervous ahead of mega Wednesday Fed showing
- CAD finds little reason to move, trades within a quarter of a percent against its peers.
- Canadian Building Permits surged by 20.5% in April, the highest MoM change in four years.
- Markets are hoping that US CPI inflation cools to 0.1% MoM in May, down from the previous 0.3%.
- US Core CPI is forecast to tick down to 3.5% YoY versus the previous 3.6%.
- Fed is broadly expected to keep rates where they are for now, but investors will be keenly focused on Fed’s updated “dot plot” on Wednesday.
- Rate markets see slightly better-than-even odds of at least a quarter-point cut from the Fed in September, according to the CME’s FedWatch Tool.
Canadian Dollar PRICE Today
The table below shows the percentage change of Canadian Dollar (CAD) against listed major currencies today. Canadian Dollar was the strongest against the Euro.
| USD | EUR | GBP | JPY | CAD | AUD | NZD | CHF | |
|---|---|---|---|---|---|---|---|---|
| USD | 0.26% | 0.05% | 0.19% | 0.07% | 0.18% | -0.08% | 0.23% | |
| EUR | -0.26% | -0.21% | -0.07% | -0.19% | -0.07% | -0.34% | -0.02% | |
| GBP | -0.05% | 0.21% | 0.14% | 0.01% | 0.12% | -0.14% | 0.17% | |
| JPY | -0.19% | 0.07% | -0.14% | -0.12% | -0.02% | -0.29% | 0.04% | |
| CAD | -0.07% | 0.19% | -0.01% | 0.12% | 0.11% | -0.16% | 0.16% | |
| AUD | -0.18% | 0.07% | -0.12% | 0.02% | -0.11% | -0.27% | 0.04% | |
| NZD | 0.08% | 0.34% | 0.14% | 0.29% | 0.16% | 0.27% | 0.32% | |
| CHF | -0.23% | 0.02% | -0.17% | -0.04% | -0.16% | -0.04% | -0.32% |
The heat map shows percentage changes of major currencies against each other. The base currency is picked from the left column, while the quote currency is picked from the top row. For example, if you pick the Canadian Dollar from the left column and move along the horizontal line to the US Dollar, the percentage change displayed in the box will represent CAD (base)/USD (quote).
Technical analysis: CAD cycles familiar levels, but some Greenback strength pokes through
The Canadian Dollar (CAD) is trading tightly on Tuesday, refusing to give up too much ground to the Greenback and sticking to familiar intraday technical levels. Elsewhere, the Canadian Dollar is finding small gains, climbing around a fifth of one percent against the Euro (EUR), Swiss Franc (CHF) and Japanese Yen (JPY).
USD/CAD briefly tested above 1.3780 in early Tuesday trading as the US Dollar builds on minor risk-off flows, but the CAD is holding steady, limiting movement in the pair. CAD bidders will be looking for Greenback weakness to drag USD/CAD back down from the 1.3800 handle.
2024’s highs rest at 1.3846, and any downside plunges in USD/CAD will find a demand zone just above the 1.3600 handle. Daily candlesticks are still holding on the high side, trading up nearly 4% for the year.
USD/CAD hourly chart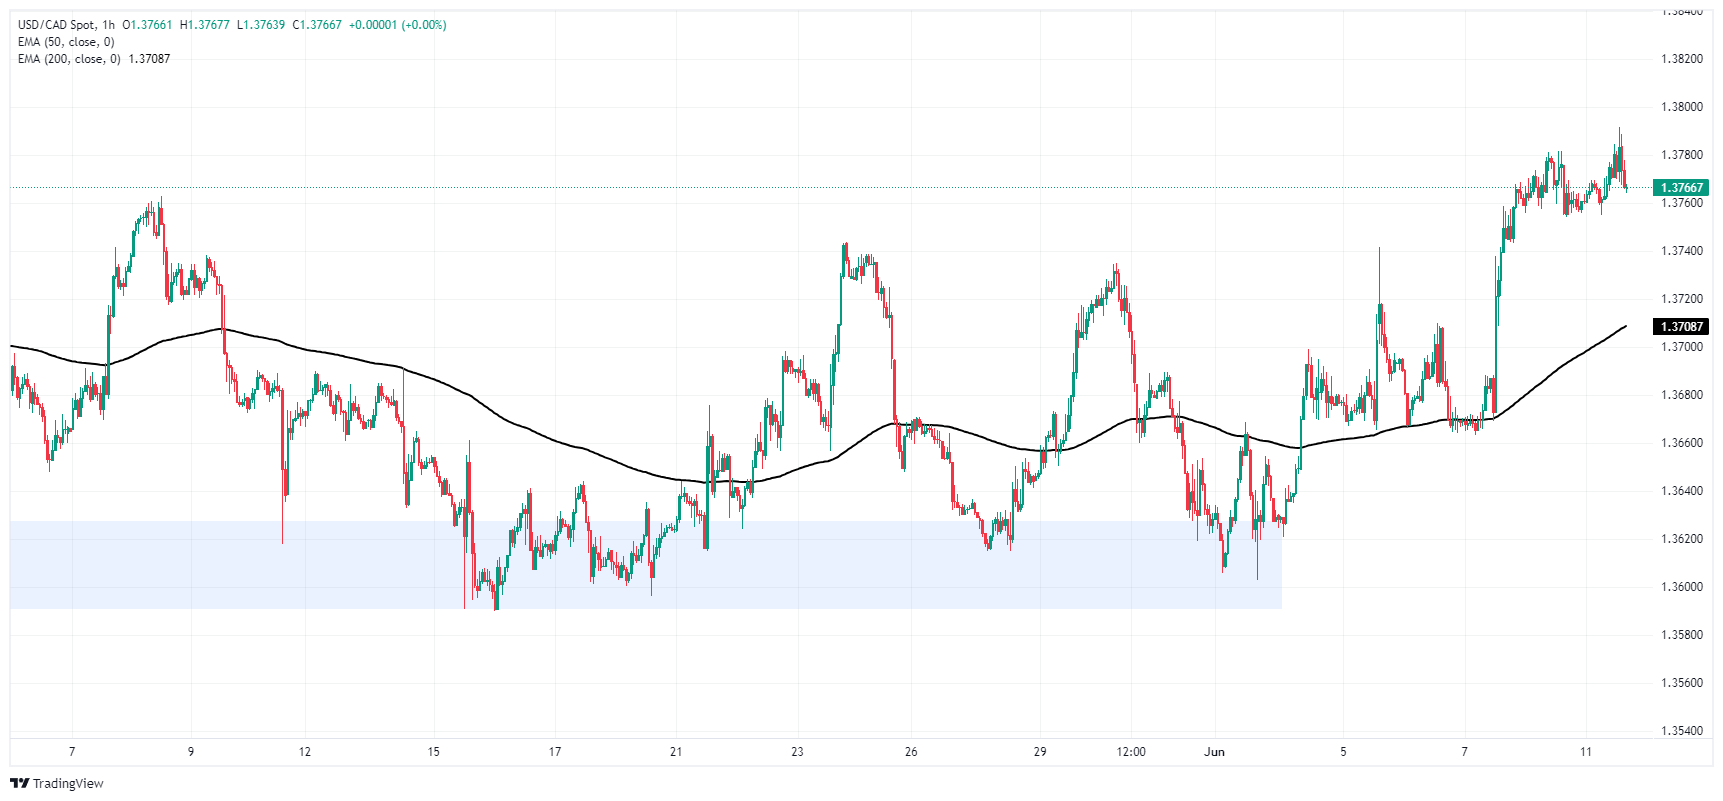
USD/CAD daily chart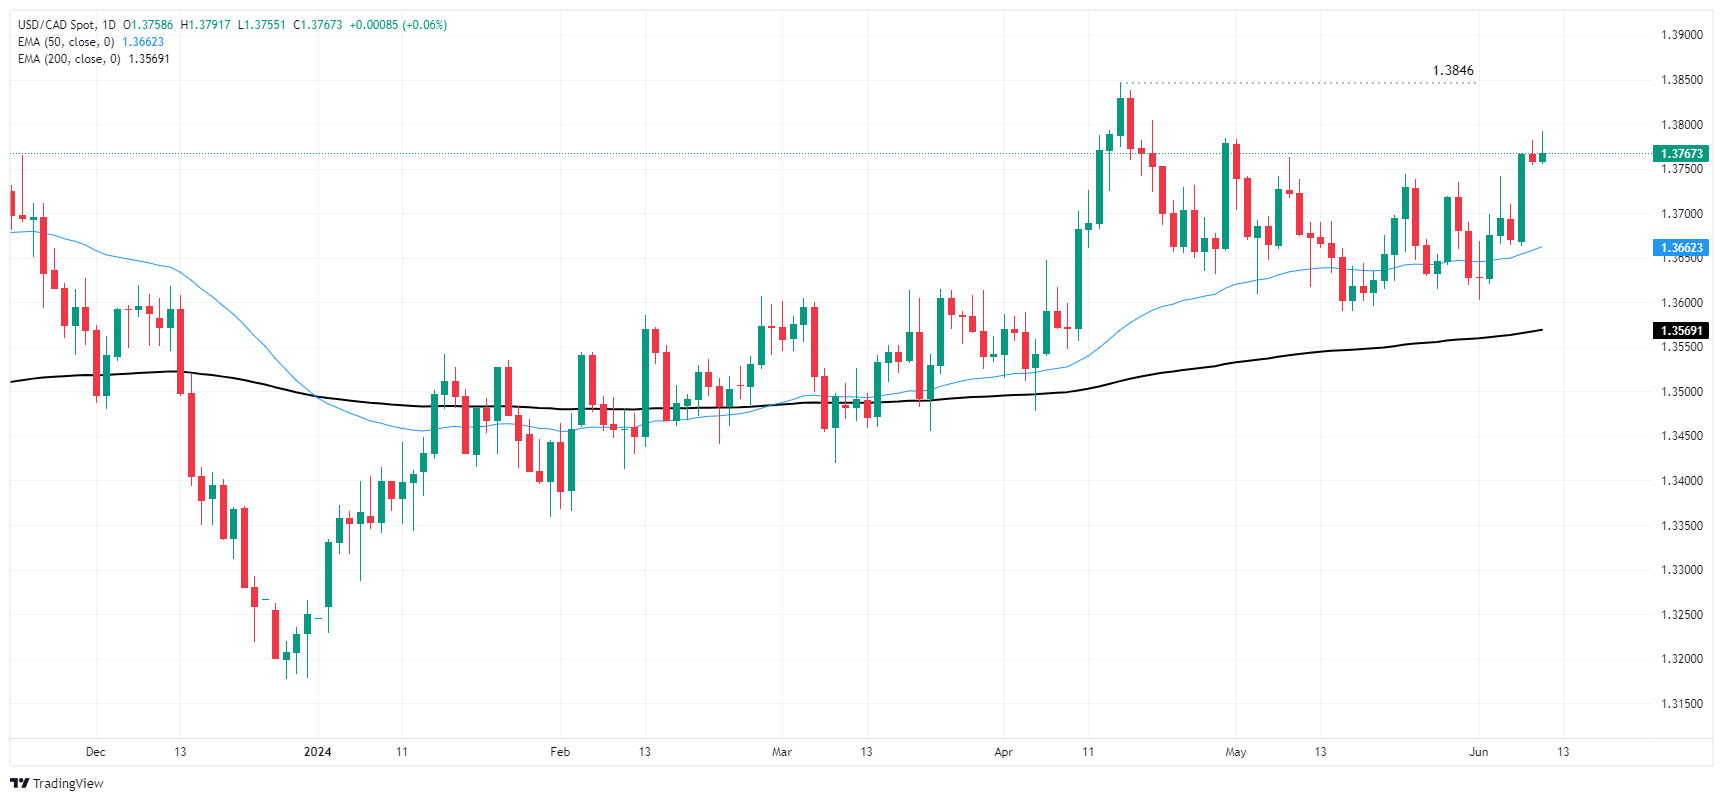
Canadian Dollar FAQs
The key factors driving the Canadian Dollar (CAD) are the level of interest rates set by the Bank of Canada (BoC), the price of Oil, Canada’s largest export, the health of its economy, inflation and the Trade Balance, which is the difference between the value of Canada’s exports versus its imports. Other factors include market sentiment – whether investors are taking on more risky assets (risk-on) or seeking safe-havens (risk-off) – with risk-on being CAD-positive. As its largest trading partner, the health of the US economy is also a key factor influencing the Canadian Dollar.
The Bank of Canada (BoC) has a significant influence on the Canadian Dollar by setting the level of interest rates that banks can lend to one another. This influences the level of interest rates for everyone. The main goal of the BoC is to maintain inflation at 1-3% by adjusting interest rates up or down. Relatively higher interest rates tend to be positive for the CAD. The Bank of Canada can also use quantitative easing and tightening to influence credit conditions, with the former CAD-negative and the latter CAD-positive.
The price of Oil is a key factor impacting the value of the Canadian Dollar. Petroleum is Canada’s biggest export, so Oil price tends to have an immediate impact on the CAD value. Generally, if Oil price rises CAD also goes up, as aggregate demand for the currency increases. The opposite is the case if the price of Oil falls. Higher Oil prices also tend to result in a greater likelihood of a positive Trade Balance, which is also supportive of the CAD.
While inflation had always traditionally been thought of as a negative factor for a currency since it lowers the value of money, the opposite has actually been the case in modern times with the relaxation of cross-border capital controls. Higher inflation tends to lead central banks to put up interest rates which attracts more capital inflows from global investors seeking a lucrative place to keep their money. This increases demand for the local currency, which in Canada’s case is the Canadian Dollar.
Macroeconomic data releases gauge the health of the economy and can have an impact on the Canadian Dollar. Indicators such as GDP, Manufacturing and Services PMIs, employment, and consumer sentiment surveys can all influence the direction of the CAD. A strong economy is good for the Canadian Dollar. Not only does it attract more foreign investment but it may encourage the Bank of Canada to put up interest rates, leading to a stronger currency. If economic data is weak, however, the CAD is likely to fall.
- GBP/USD tumbles 0.14% due to disappointing UK employment data.
- Technical outlook shows neutral bias with momentum fading, consolidating between 1.2687-1.2750.
- A hawkish Fed could push GBP/USD below 1.2687, targeting 1.2643/37 and 1.2600; resistance at 1.2750 and 1.2800.
The GBP/USD dropped during the North American session after employment data from the UK was weaker than expected, undermining the Pound Sterling. Therefore, the major trades at 1.2711, down 0.14%.
GBP/USD Price Analysis: Technical outlook
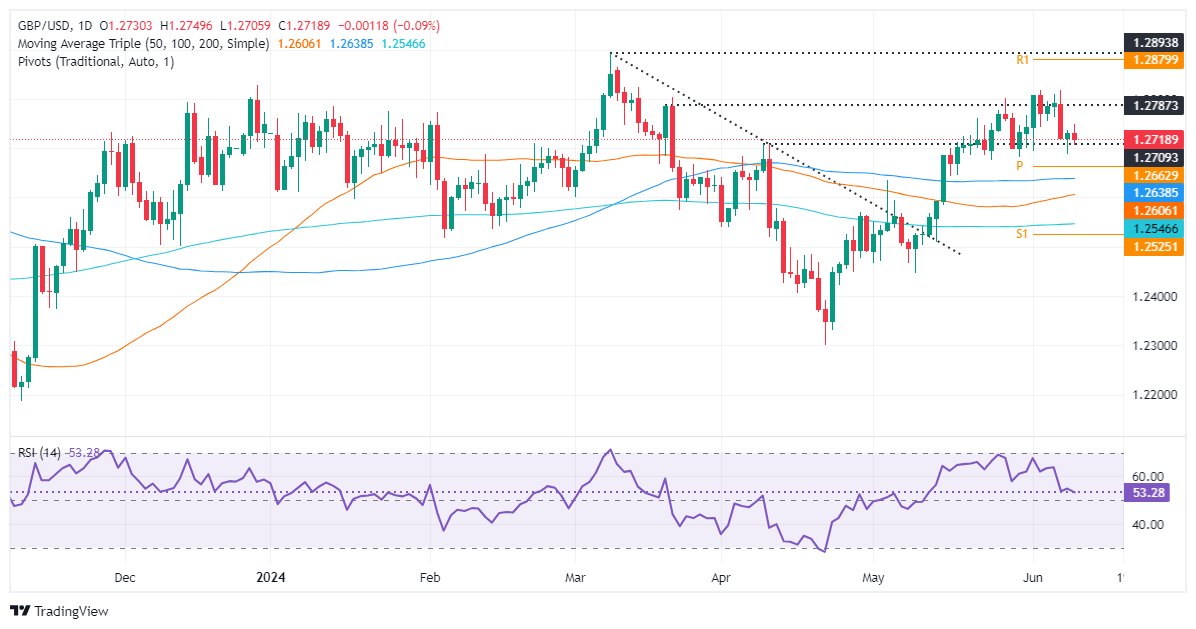
From a daily chart perspective, the GBP/USD remains neutral-biased, consolidating at around 1.2687-1.2750 ahead of Wednesday's Federal Reserve monetary policy decision. Momentum suggests that buying pressure is fading, according to the Relative Strength Index (RSI), with sellers gathering traction.
Therefore, the Fed’s hawkish tilted hold decision could push the GBP/USD below the current week’s low of 1.2687, followed by the confluence of the 100-day moving average (DMA) and May 3 cycle high turned support at 1.2643/37, before diving to 1.2600.
On the flip side, if buyers lift the exchange rate past 1.2750, a challenge of the 1.2800 figure is on the cards.
GBP/USD Price Action – Daily Chart
British Pound PRICE Today
The table below shows the percentage change of British Pound (GBP) against listed major currencies today. British Pound was the strongest against the Euro.
| USD | EUR | GBP | JPY | CAD | AUD | NZD | CHF | |
|---|---|---|---|---|---|---|---|---|
| USD | 0.36% | 0.09% | 0.20% | 0.13% | 0.25% | 0.06% | 0.30% | |
| EUR | -0.36% | -0.26% | -0.15% | -0.22% | -0.08% | -0.30% | -0.05% | |
| GBP | -0.09% | 0.26% | 0.10% | 0.03% | 0.16% | -0.05% | 0.19% | |
| JPY | -0.20% | 0.15% | -0.10% | -0.08% | 0.03% | -0.17% | 0.08% | |
| CAD | -0.13% | 0.22% | -0.03% | 0.08% | 0.12% | -0.08% | 0.16% | |
| AUD | -0.25% | 0.08% | -0.16% | -0.03% | -0.12% | -0.21% | 0.02% | |
| NZD | -0.06% | 0.30% | 0.05% | 0.17% | 0.08% | 0.21% | 0.25% | |
| CHF | -0.30% | 0.05% | -0.19% | -0.08% | -0.16% | -0.02% | -0.25% |
The heat map shows percentage changes of major currencies against each other. The base currency is picked from the left column, while the quote currency is picked from the top row. For example, if you pick the British Pound from the left column and move along the horizontal line to the US Dollar, the percentage change displayed in the box will represent GBP (base)/USD (quote).
Industrial metals are melting lower amid concerns around Chinese demand, analysts at TD Securities noted.
Copper faces a moderate sell-off
“Reports that Chinese fabricator demand for copper has been muted are weighing on the red metal, particularly as inventories around the globe increase.”
“Physical demand signals have been clashing with extremely bullish money manager positioning for months, and with little signs of tightness materializing, there have been signs these investors have started to unwind their positions.”
“With that said, Commodity Trading Advisors (CTAs) remain comfortable with their length above $9,428/t, however, top Shanghai funds who had bought recently are now liquidating their recent purchases. Elsewhere, CTAs are sellers of zinc and lead on the day, and modest buyers of nickel.”
Gold (XAU/USD) prices show resilience amid China halting its purchasing program and the Federal Reserve uncertainty, analysts at TD Securities note.
Gold can see a moderate sell-off below $2,325/oz
“The Gold continues to show strength despite Fed uncertainty. News that China halted its buying program for reserves notably hit the yellow metal, while the strong US data added further uncertainty to macro investors' appetite as the timing of rate cuts is again called into question.”
“Looking forward, the Yellow Metal could see some marginal Commodity Trading Advisor (CTA) selling below $2,325/oz, however there still remains a notable margin of safety before the next large CTA selling trigger around the $2,202/oz mark.”
- USD/CAD climbs to near 1.3800 as the US Dollar strengthens ahead of a volatile Wednesday.
- Investors will keenly focus on the Fed’s dot plot for the interest rate outlook.
- BoC Macklem may provide cues over subsequent rate cuts.
The USD/CAD pair jumps to near the round-level resistance of 1.3800 in Tuesday’s American session. The Loonie asset strengthens as the US Dollar (USD) rises to the monthly high. The US Dollar Index (DXY), which tracks the Greenback’s value against six major currencies, jumps to 105.40 as market sentiment remains risk-averse ahead of the United States (US) Consumer Price Index (CPI) data for May and the Federal Reserve’s (Fed) interest rate decision, which are scheduled for Wednesday.
The S&P 500 delivered significant losses in the opening session, exhibiting investors' weak risk appetite. Investors remain cautious ahead of the Fed’s dot-plot, which will indicate where policymakers see the Federal fund rate heading. The Fed’s decision on interest rates is widely expected to be unchanged, as inflation is far from the desired rate of 2%.
Fed officials have been advocating for maintaining the current interest rate framework for a long time until they gain greater confidence that inflation is progressively declining. Soft inflation data for three or four months could build that confidence among policymakers.
Meanwhile, the Canadian Dollar will dance to the tunes of the speech from Bank of Canada (BoC) Governor Tiff Macklem, which is scheduled for Wednesday. BoC Macklem will provide more cues about whether the central bank will announce subsequent rate cuts.
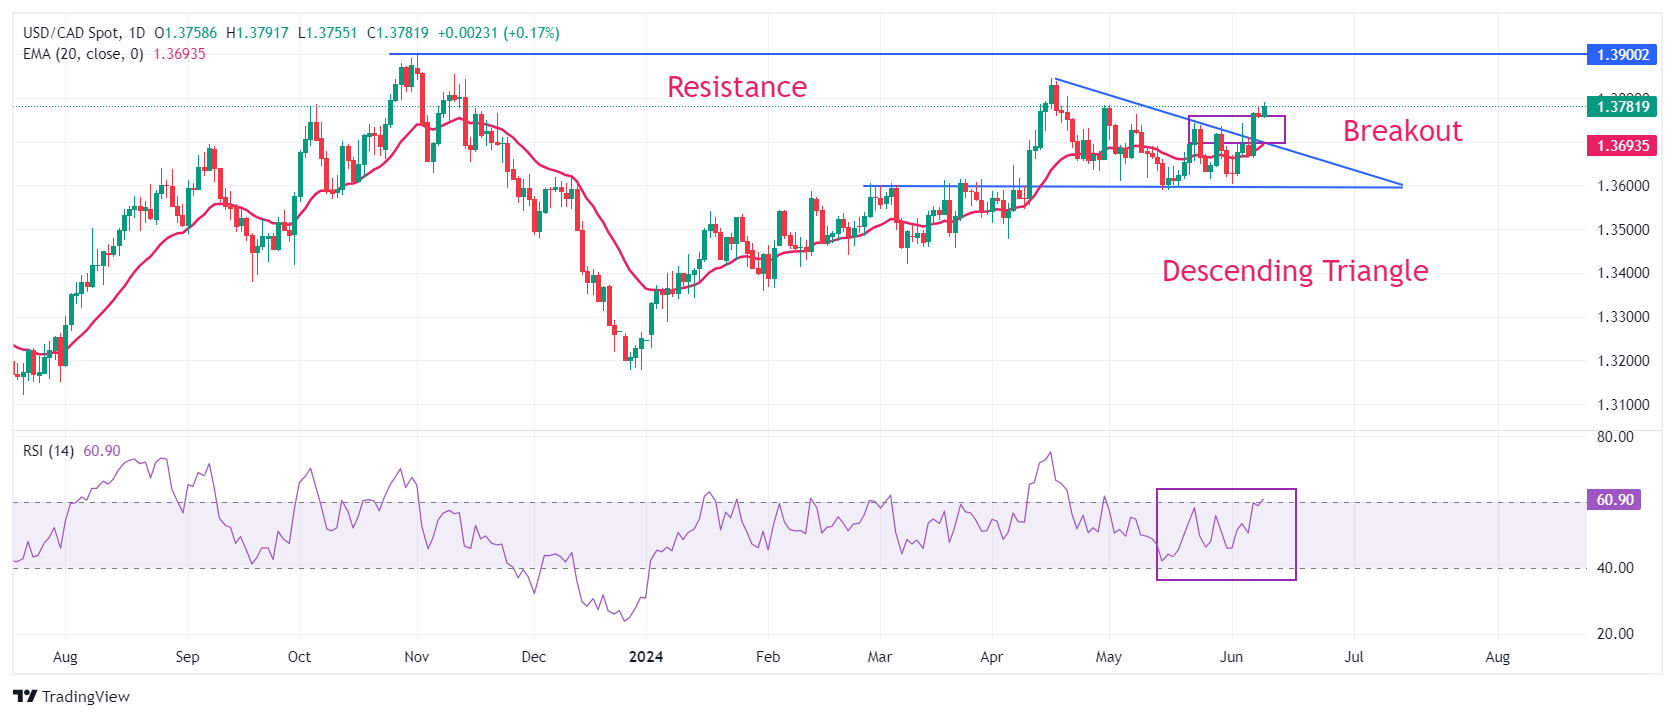
USD/CAD strengthens after a breakout of the Descending Triangle chart pattern formed on a daily timeframe. The upward-sloping 20-day Exponential Moving Average (EMA) near 1.3700 suggests that the near-term trend is bullish.
The 14-period Relative Strength Index (RSI) jumps above 60.00. A sustainable move above the same will push momentum towards the upside.
Fresh buying opportunity would emerge if the asset breaks above April 17 high at 1.3838. This would drive the asset towards 1 November 2023 high at 1.3900, followed by the psychological resistance of 1.4000.
In an alternate scenario, a breakdown below June 7 low at 1.3663 will expose the asset to May 3 low around 1.3600 and April 9 low around 1.3547.
USD/CAD daily chart
The Federal Reserve's (Fed) Federal Open Market Committee (FOMC) is widely expected to keep rates unchanged on Wednesday, with Chairman Jerome Powell likely providing a similar policy message compared to May, analysts at TD Securities write in a note.
US Dollar set to remain strong
The base scenario is that the chairman appears somewhat optimistic given the recent evolution of the data, especially if the May CPI report shows further progress on inflation. We also look for the dot plot to show two cuts as the 2024 median.
Treasuries will react to the dot plot and possible dovish lean from Powell with a modest bull steepening. However, continued range trading is likely given ongoing "data dependent" outlook.
Expect the US Dollar (USD) to remain strong amid relative rate divergence and a narrowing window for FX vol to remain suppressed.
The two-day FOMC meeting begins on Tuesday and ends on Wednesday. Analysts at BBH expect a hawkish hold.
September cut is a coin flip
"There is a lot for the Fed to consider but in the end, they will have no choice but to keep rates on hold for the foreseeable future. Since the May 1 decision, there has been little progress on getting inflation moving back towards the 2% target. In fact, some key inflation metrics such as super core PCE have actually picked up."
"Real sector data have been mixed but remain relative robust on the whole even as financial conditions remain loose. Markets have taken notice, with odds of a September cut basically a coin flip and odds of a November cut around 85%."
- AUD/USD holds ground slightly below 0.6600 while the outlook remains uncertain.
- The Fed is expected to hold interest rates steady for the seventh straight time.
- The Australian Dollar will dance to the tunes of the Employment data.
The AUD/USD pair gains ground slightly below the round-level resistance of 0.6600 in Tuesday’s New York session. The Aussie asset finds cushion even though the US Dollar (USD) remains firm amid cautious market mood ahead of the United States (US) Consumer Price Index (CPI) data for May and the Federal Reserve’s (Fed) monetary policy announcement on Wednesday.
The S&P 500 opens on a bearish note amid expectations that the Fed will keep interest rates steady in the range of 5.25%- 5.50%. 10-year US Treasury yields have edged down to 4.44% but hold their strong recovery from 4.27%. The US Dollar Index (DXY) extends its upside to the monthly high near 105.45.
Investors see the Fed holding interest rates at their current levels for the seventh time in a row as the battle against stubborn inflation continues. Fed officials will not consider rate cuts until they are convinced that inflation will sustainably return to the desired rate of 2%.
Investors will pay close attention to the US CPI data for May to determine the current status of inflation. Annual core inflation, which excludes food and energy prices, is estimated to have decelerated to 3.5% from the prior release of 3.6%, with the headline figure rising steadily by 3.4%.
Meanwhile, the Australian Dollar will dance to the tunes of the Employment data for May, which will be published on Thursday. The Australian laborforce is expected to have expanded by 27.5K fresh payrolls. In April, Australian employers hired 38.5K new workers. The Unemployment Rate is estimated to have declined to 4.0% from 4.1% in April. The employment data will influence market speculation for Reserve Bank of Australia (RBA) rate cuts.
Currently, investors expect that the RBA will not reduce interest rates this year. Market expectations for the RBA, keeping interest rates restrictive for the entire year, strengthened after commentary from RBA Governor Michele Bullock indicated that the central bank is prepared to increase interest rates further if inflation does not return to the target range of 1%- 3%.
- WTI corrects to $77.00 as investors turn cautious ahead of eventful Wednesday.
- China’s PPI is expected to continue its deflating streak.
- The Fed is widely anticipated to maintain interest rates steady in the 5.25%-5.50% range.
West Texas Intermediate (WTI), futures on NYMEX, declines to near $77.00 in Tuesday’s New York session. The oil price's appeal has remained significantly strong in the past few trading sessions, as investors were upbeat on demand due to the summer vacation season in the Northern Hemisphere.
The black gold recovered sharply after declining to a four-month low near $72.50. That sell-off was driven by the OPEC+ meeting in which members communicated about shrinking production cuts to some extent.
However, uncertainty among investors ahead of the May Consumer Price Index (CPI) data release in the world’s largest and second-largest nations has kept a lid on the Oil price. Investors will keenly focus on China’s annual CPI data, which is estimated to have grown steadily by 0.3%.
Market participants will also pay close attention to annual Producer Price Index (PPI) numbers, which indicate changes in prices set by business owners at their premises. The PPI data is expected to have deflated at a slower pace of 1.8% from the prior reading of 2.5%. It is worth noting that China is the second largest importer of Oil in the world, and strong demand from the region improves the global Oil demand outlook.
Meanwhile, the US inflation data will also be on the radar as investors want to know whether price pressures are progressively declining towards the desired rate of 2%. Signs of inflation remaining stubborn would shrink market speculation for Federal Reserve (Fed) rate cuts. Currently, investors expect that the Fed will cut interest rates only once this year.
The major event for the market will be the Fed’s interest rate decision on Wednesday. The Fed is expected to remain status-quo with a hawkish interest rates outlook.
- Gold rolls over after retesting key resistance as the outlook for US interest rates remains elevated.
- This keeps the opportunity cost of holding non-yielding Gold high, making it less attractive to investors.
Gold (XAU/USD) trades a quarter of a percent lower on Tuesday after being rejected by key support-turned-resistance at $2,315 late Monday.
Higher interest-rate expectations in the US are weighing on the precious metal. The release of better-than-expected US jobs data on Friday suggested continued inflationary pressures. This, in turn, makes it less likely the US Federal Reserve (Fed) will lower interest rates in September, and the maintenance of higher interest rates increases the opportunity cost of holding non-yielding Gold, making it less attractive to investors.
Gold weakens after US employment data alters outlook for interest rates
The positive wage-and-employment picture painted by the US Nonfarm Payrolls (NFP) data suggested a reappraisal of US interest-rate expectations, with the Fed now expected to maintain interest rates elevated for longer.
The market’s expectations that the Fed will cut interest rates in September fell to just over 50% after the release of the NFP, from 67% previously, according to the CME FedWatch tool, which bases its estimates on 30-day US Fed Fund Futures pricing data. The current probability stands at around 54%.
That said, the outlook for global interest rates is more subdued, providing a supportive backdrop for Gold. The Bank of Canada (BoC) cut its overnight rate by 0.25% to 4.75% last week, as did the European Central Bank (ECB). The release of lower inflation data in Switzerland has prompted speculation that the Swiss National Bank (SNB) could also cut interest rates at its June 20 meeting after an initial cut in March.
Gold traders will now be looking for further cues on price direction at the Federal Reserve June meeting, which concludes on Wednesday, as well as the US Consumer Price Index (CPI) data for May out on the same day.
Technical Analysis: Gold retests resistance and rolls over
Gold has pulled back to retest the bottom of the range at $2,315, turned over, and begun falling again. Gold is in a short-term downtrend, and given that “the trend is your friend,” it will probably continue lower.
The next downside target is at about $2,285, the 100% extrapolation of the prior downward movement in May “a”. A stronger move down could see Gold meet support at $2,279 (late April-early May swing low).
XAU/USD 4-hour Chart
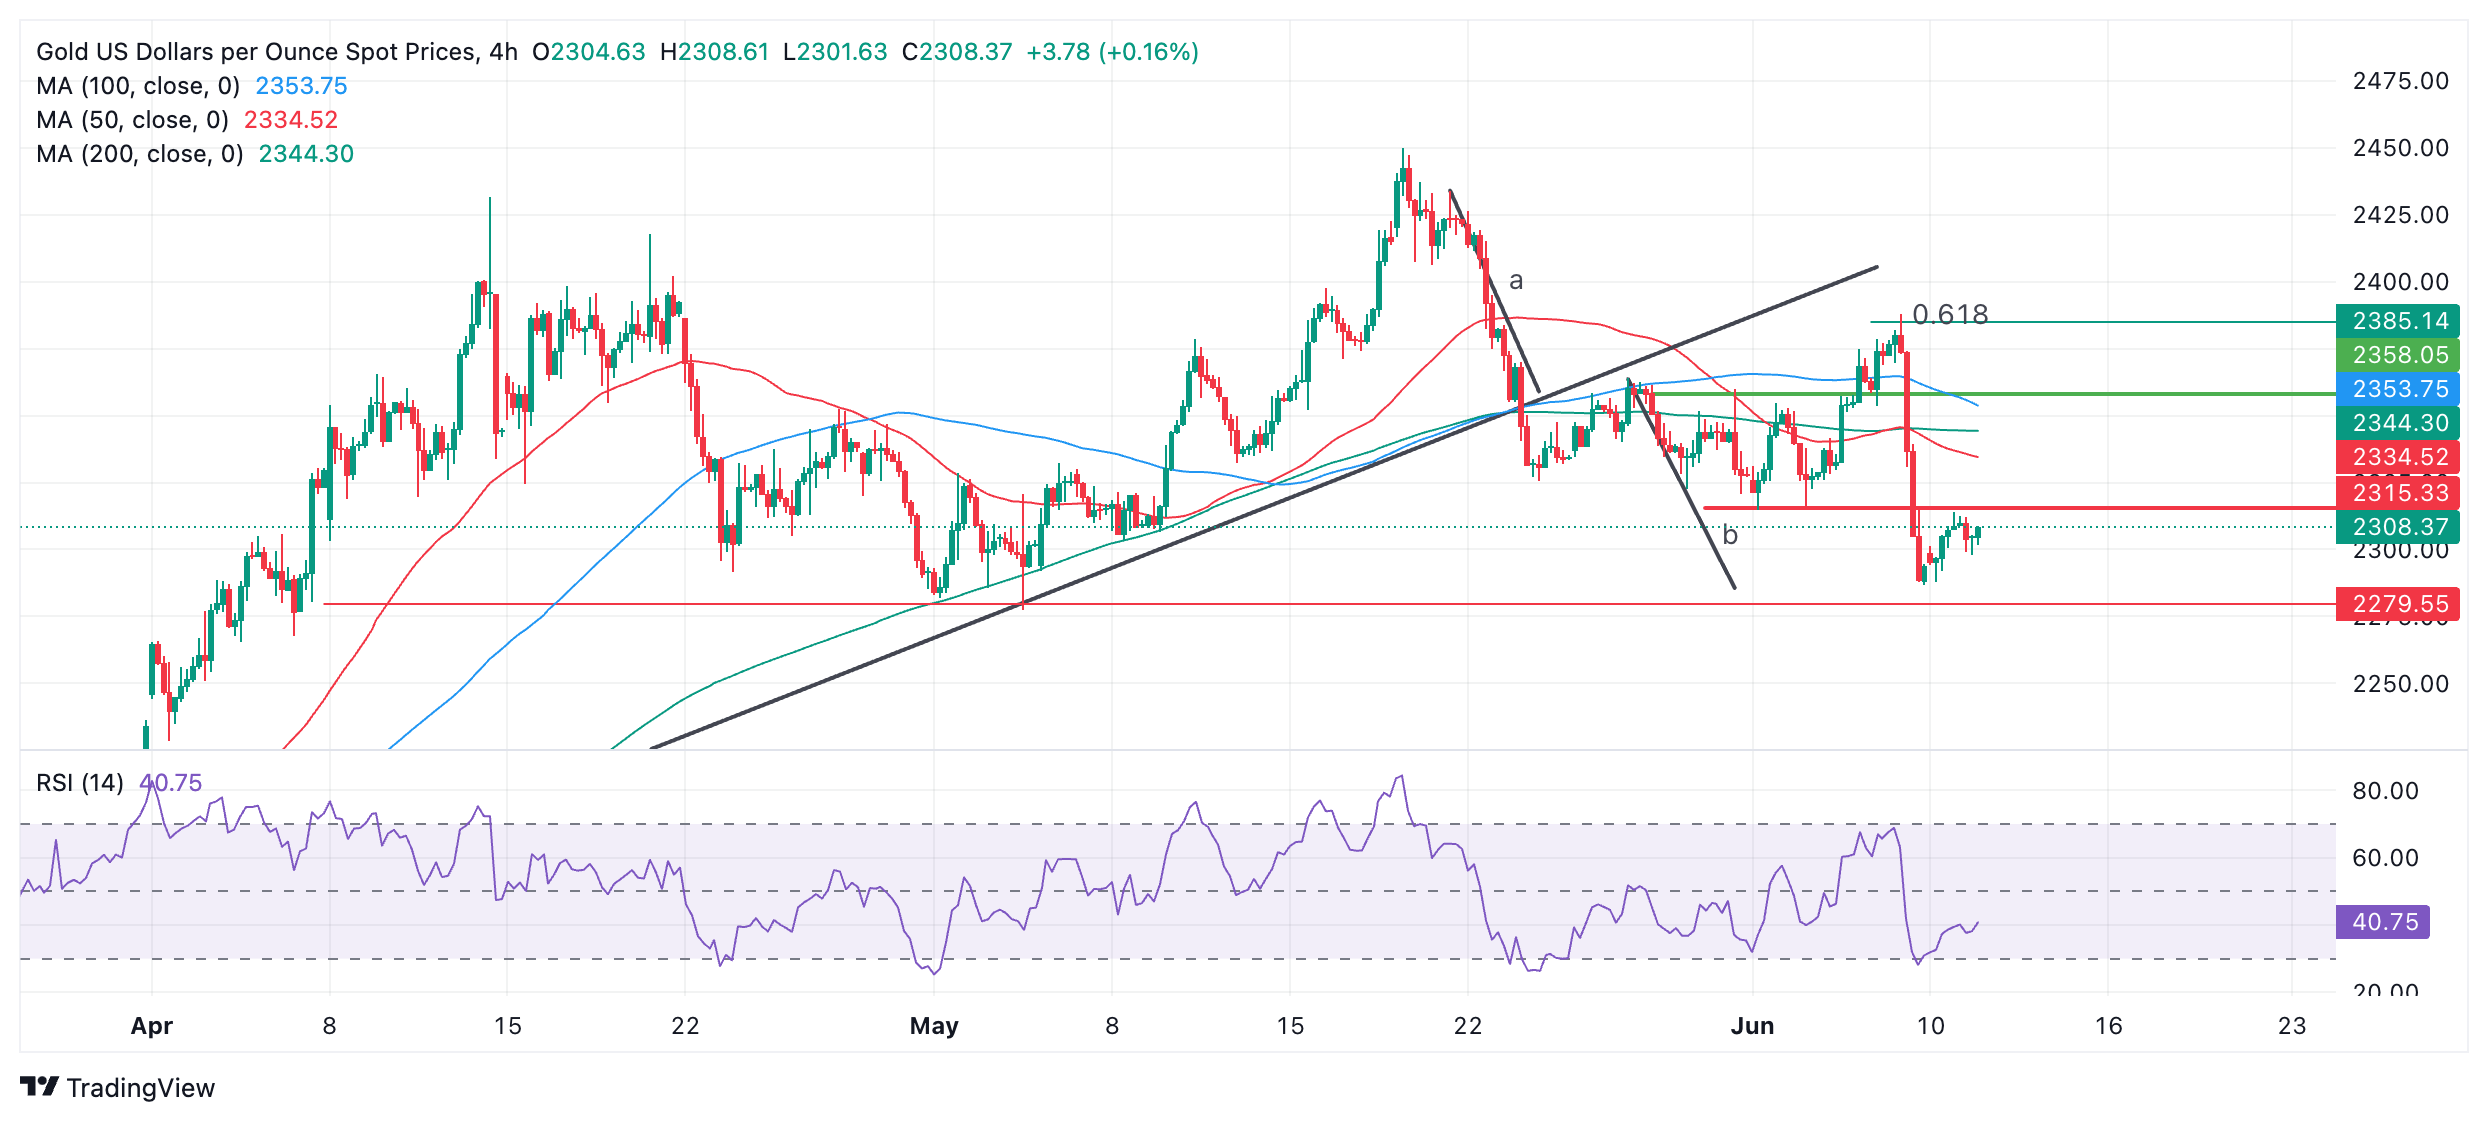
On the other hand, a decisive break above the former floor of the range at $2,315 could suggest the short-term downtrend is losing momentum and more upside might be on the horizon.
Despite short-term weakness, the precious metal’s medium and long-term trends are still bullish, and the risk of a recovery remains high.
Economic Indicator
Nonfarm Payrolls
The Nonfarm Payrolls release presents the number of new jobs created in the US during the previous month in all non-agricultural businesses; it is released by the US Bureau of Labor Statistics (BLS). The monthly changes in payrolls can be extremely volatile. The number is also subject to strong reviews, which can also trigger volatility in the Forex board. Generally speaking, a high reading is seen as bullish for the US Dollar (USD), while a low reading is seen as bearish, although previous months' reviews and the Unemployment Rate are as relevant as the headline figure. The market's reaction, therefore, depends on how the market assesses all the data contained in the BLS report as a whole.
Read more.Last release: Fri Jun 07, 2024 12:30
Frequency: Monthly
Actual: 272K
Consensus: 185K
Previous: 175K
Source: US Bureau of Labor Statistics
America’s monthly jobs report is considered the most important economic indicator for forex traders. Released on the first Friday following the reported month, the change in the number of positions is closely correlated with the overall performance of the economy and is monitored by policymakers. Full employment is one of the Federal Reserve’s mandates and it considers developments in the labor market when setting its policies, thus impacting currencies. Despite several leading indicators shaping estimates, Nonfarm Payrolls tend to surprise markets and trigger substantial volatility. Actual figures beating the consensus tend to be USD bullish.
European Central Bank (ECB) Chief Economist Phillip Lane said on Tuesday that they will be agile on interest rates, per Reuters.
Key quotes
"We still have many degrees of flexibility to react to upside or downside shocks."
"We have a good degree of confidence at arriving at 2% inflation target, reserving flexibility on exact timeline."
"We have a dynamic now of transitioning back towards 2% target, have to be careful that converges rather than get stuck at some higher number."
"We look at exchange rate, it is one factor among many and fluctuations we are seeing are invisible in terms of inflation."
"One way to deal with uncertainty is a little bit of waiting, wait and make sure you're not taking a step you're going to regret."
Market reaction
EUR/USD stays under bearish pressure and was last seen losing 0.3% on the day at 1.0730.
- The US Dollar was unable to hold on to Monday’s gains.
- The Greenback eases a touch after headlines that Le Pen won’t run in the June French snap elections.
- The US Dollar index trades just above 105.00 and flirts with nearby support levels.
The US Dollar (USD) trades flat, just above 105.00 on Tuesday, and is unlikely to move away in the coming hours unless something pivotal occurs. Despite its gains from Monday, after French President Emmanuel Macron called for snap elections in June, the sting is being taken out of the event with Marine Le Pen, head of the Far Right movement in France, will not be running in those . This actually eases the odds for an upheaval shift in the upcoming French elections, which are just three weeks away.
On the economic front, the US Dollar index (DXY) moves alongside political news out of Europe ahead of Wednesday’s main events: the US Consumer Price Index for May and the Federal Reserve (Fed) interest rate decision. Before that, two very light data elements will find their way to the markets on Tuesday: the NFIB Business Optimism Index for May and the Redbook Index for the first week of June.
Daily digest market movers: Wake me up when Wednesday starts
- The m ain headline hitting the wires on Tuesday comes from France, where Marine Le Pen, head of the Far Right movement, said she will not be running in the upcoming snap elections at the end of June. This can be considered as a victory for current French President Emmanuel Macron as his government sees its odds of surviving these snap elections rising with Le Pen now backing down.
- At 10:00 GMT, the National Federation of Independent Business (NFIB) has released its Business Optimism Index for May. The result was a beat on expectation an the previous print of 89.8, with 90.5 as number for May.
- At 12:55 GMT, the Redbook Index for the week ending June 7 will be released. The previous reading was at 5.8%, and no forecast is available.
- The US Treasury is set to unleash some debt to the markets
- 52-week bill auction expected at 15:30 GMT.
- 10-year Note Auction will be allocated at 17:00 GMT.
- Equities are mixed on Tuesday. European indices are recovering on the back of the French elections news, while Chinese stocks are sliding lower by near 1%. US futures are flat.
- The CME FedWatch Tool shows a 45.6% chance of the Federal Reserve (Fed) interest rate at the current level in September. Odds for a 25 basic points rate cut stand at 50%, while a very slim 4.4% chance is priced in a 50 basic points rate cut
- The benchmark 10-year US Treasury Note slides to the lowest level for this week, near 4.44%, and flirts with further declines.
US Dollar Index Technical Analysis: Yawn!
The US Dollar Index (DXY) could be summarised with one word on Tuesday: Yawn! Expect no big movements, with markets remaining sidelined ahead of the main US events for this week on Wednesday.
On the upside, there are some technical or pivotal levels to watch out for. The first is 105.52, a level that held support during most of April. The next level to watch is 105.88, which triggered a rejection at the start of May and will likely play its role as resistance again. Further up, the biggest challenge remains at 106.51, the year-to-date high from April 16.
On the downside, a trifecta of Simple Moving Averages is now playing as support. First, and very close, is the 55-day SMA at 105.05. A touch lower, near 104.47, both the 100-day and the 200-day SMA are forming a double layer of protection to support any declines in the US Dollar index. Should this area be broken down, look for 104.00 to salvage the situation.
US Dollar FAQs
The US Dollar (USD) is the official currency of the United States of America, and the ‘de facto’ currency of a significant number of other countries where it is found in circulation alongside local notes. It is the most heavily traded currency in the world, accounting for over 88% of all global foreign exchange turnover, or an average of $6.6 trillion in transactions per day, according to data from 2022. Following the second world war, the USD took over from the British Pound as the world’s reserve currency. For most of its history, the US Dollar was backed by Gold, until the Bretton Woods Agreement in 1971 when the Gold Standard went away.
The most important single factor impacting on the value of the US Dollar is monetary policy, which is shaped by the Federal Reserve (Fed). The Fed has two mandates: to achieve price stability (control inflation) and foster full employment. Its primary tool to achieve these two goals is by adjusting interest rates. When prices are rising too quickly and inflation is above the Fed’s 2% target, the Fed will raise rates, which helps the USD value. When inflation falls below 2% or the Unemployment Rate is too high, the Fed may lower interest rates, which weighs on the Greenback.
In extreme situations, the Federal Reserve can also print more Dollars and enact quantitative easing (QE). QE is the process by which the Fed substantially increases the flow of credit in a stuck financial system. It is a non-standard policy measure used when credit has dried up because banks will not lend to each other (out of the fear of counterparty default). It is a last resort when simply lowering interest rates is unlikely to achieve the necessary result. It was the Fed’s weapon of choice to combat the credit crunch that occurred during the Great Financial Crisis in 2008. It involves the Fed printing more Dollars and using them to buy US government bonds predominantly from financial institutions. QE usually leads to a weaker US Dollar.
Quantitative tightening (QT) is the reverse process whereby the Federal Reserve stops buying bonds from financial institutions and does not reinvest the principal from the bonds it holds maturing in new purchases. It is usually positive for the US Dollar.
- EUR/USD stays on the back foot near 1.0730 as the European Union’s political uncertainty weakens the Euro’s appeal.
- The ECB refuses to commit to a specific interest-rate trajectory.
- The US Dollar’s appeal remains firm ahead of the Fed’s decision and the US CPI report.
EUR/USD shows weakness near the immediate support of 1.0730 in Tuesday’s European session. The major currency pair remains on the back foot as the Euro shifted into a bearish trajectory following French President Emmanuel Macron’s unprecedented decision to dissolve parliament and call for a snap election, which spooked political stability.
Macron’s decision to call for a snap election came after exit polls for EU parliamentary elections showed that seats won by Jordan Bardella-led-far-right National Rally came in at 32%-33%, more than twice the votes secured by Macron’s Centrist alliance.
European Central Bank (ECB) policymakers' cautious approach to the interest rate outlook also fails to uplift the Euro. ECB policymakers worry that progress in inflation towards the bank’s target could stall as wage growth appears to be stubborn. On Monday, ECB President Christine Lagarde said in an interview that last week’s rate-cut move doesn’t commit to any linear declining path. "There might be periods where we hold rates again,” Lagarde said, according to Reuters.
Daily digest market movers: EUR/USD hit hard by multiple headwinds
- EUR/USD finds a temporary cushion after plunging to near 1.0730 as traders focus on the United States Consumer Price Index (CPI) data for May and the Federal Reserve’s (Fed) monetary policy decision on Wednesday.
- Annual core inflation, which strips off volatile food and energy prices, is estimated to have decelerated to 3.5% from April’s reading of 3.6%. In the same period, the headline inflation is expected to have grown steadily by 3.4%. While monthly headline inflation is forecasted to have grown at a slower pace of 0.1% from the former release of 0.3%, the core CPI is estimated to have maintained a steady growth rate of 0.3%. The US CPI report will indicate whether price pressures are on course to return to the desired rate of 2%.
- Meanwhile, the Fed is widely anticipated to keep interest rates steady in the range of 5.25%-5.50% for the seventh consecutive time. Therefore, investors will pay more attention to Fed Chair Jerome Powell’s press conference and the dot plot, which will indicate where policymakers see the federal fund rate heading. The CME FedWatch tool shows that 30-day Fed Fund Rate pricing data suggest only one rate-cut move this year, which could be announced either in the November or December meeting.
- Fed policymakers said they want to be sure about sustained progress in the disinflation process before considering rate cuts. They have already warned that premature rate cuts could revamp price pressures again. Increasing chances that the Fed will maintain the current interest rate framework for a longer period has improved the US Dollar’s appeal. The US Dollar Index (DXY), which tracks the Greenback’s value against six major currencies, holds gains above the crucial support of 105.00.
EUR/USD Price Today:
Euro PRICE Today
The table below shows the percentage change of Euro (EUR) against listed major currencies today. Euro was the strongest against the Australian Dollar.
| EUR | USD | GBP | JPY | CAD | AUD | NZD | CHF | |
|---|---|---|---|---|---|---|---|---|
| EUR | -0.20% | -0.32% | -0.15% | -0.09% | -0.03% | -0.19% | -0.17% | |
| USD | 0.20% | -0.12% | 0.05% | 0.10% | 0.14% | 0.00% | 0.01% | |
| GBP | 0.32% | 0.12% | 0.16% | 0.22% | 0.26% | 0.11% | 0.12% | |
| JPY | 0.15% | -0.05% | -0.16% | 0.05% | 0.08% | -0.07% | -0.05% | |
| CAD | 0.09% | -0.10% | -0.22% | -0.05% | 0.05% | -0.11% | -0.10% | |
| AUD | 0.03% | -0.14% | -0.26% | -0.08% | -0.05% | -0.15% | -0.15% | |
| NZD | 0.19% | 0.00% | -0.11% | 0.07% | 0.11% | 0.15% | 0.01% | |
| CHF | 0.17% | -0.01% | -0.12% | 0.05% | 0.10% | 0.15% | -0.01% |
The heat map shows percentage changes of major currencies against each other. The base currency is picked from the left column, while the quote currency is picked from the top row. For example, if you pick the Euro from the left column and move along the horizontal line to the US Dollar, the percentage change displayed in the box will represent EUR (base)/USD (quote).
Technical Analysis: EUR/USD continues its losing streak
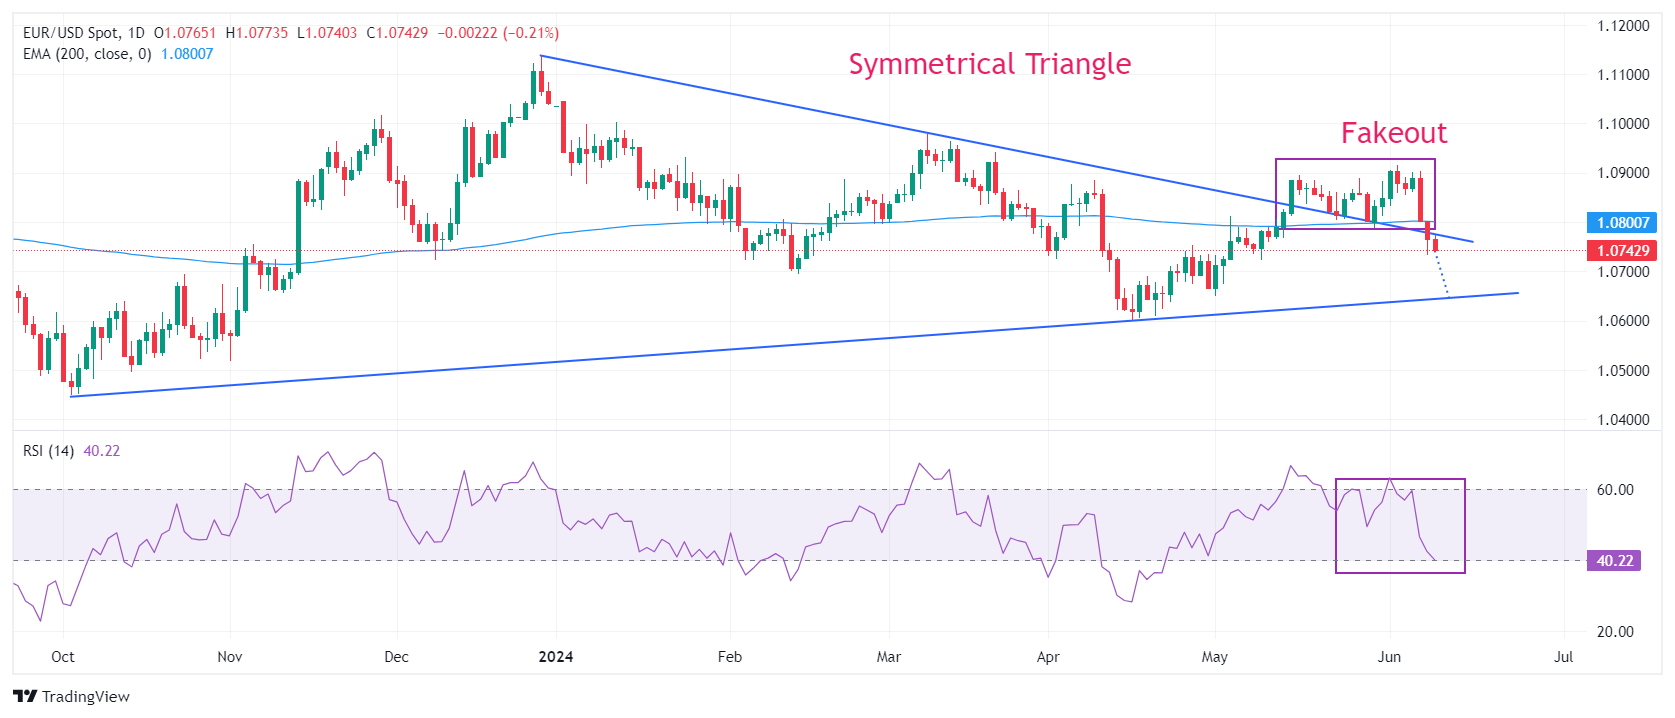
EUR/USD extends its losing streak for the third trading session on Tuesday. The major currency pair weakened after failing to hold the breakout of the Symmetrical Triangle formation, suggesting that the overall trend has turned bearish. The shared currency pair has now returned inside the triangle formation and is expected to find support at 10.636, near the upward-sloping order of the chart pattern plotted from 3 October 2023 low at 1.0448.
The long-term outlook of the shared currency pair has also turned negative as prices dropped below the 200-day Exponential Moving Average (EMA), which trades around 1.0800.
The 14-period Relative Strength Index (RSI) falls sharply to 40.00. A decisive break below this level would trigger bearish momentum.
Euro FAQs
The Euro is the currency for the 20 European Union countries that belong to the Eurozone. It is the second most heavily traded currency in the world behind the US Dollar. In 2022, it accounted for 31% of all foreign exchange transactions, with an average daily turnover of over $2.2 trillion a day. EUR/USD is the most heavily traded currency pair in the world, accounting for an estimated 30% off all transactions, followed by EUR/JPY (4%), EUR/GBP (3%) and EUR/AUD (2%).
The European Central Bank (ECB) in Frankfurt, Germany, is the reserve bank for the Eurozone. The ECB sets interest rates and manages monetary policy. The ECB’s primary mandate is to maintain price stability, which means either controlling inflation or stimulating growth. Its primary tool is the raising or lowering of interest rates. Relatively high interest rates – or the expectation of higher rates – will usually benefit the Euro and vice versa. The ECB Governing Council makes monetary policy decisions at meetings held eight times a year. Decisions are made by heads of the Eurozone national banks and six permanent members, including the President of the ECB, Christine Lagarde.
Eurozone inflation data, measured by the Harmonized Index of Consumer Prices (HICP), is an important econometric for the Euro. If inflation rises more than expected, especially if above the ECB’s 2% target, it obliges the ECB to raise interest rates to bring it back under control. Relatively high interest rates compared to its counterparts will usually benefit the Euro, as it makes the region more attractive as a place for global investors to park their money.
Data releases gauge the health of the economy and can impact on the Euro. Indicators such as GDP, Manufacturing and Services PMIs, employment, and consumer sentiment surveys can all influence the direction of the single currency. A strong economy is good for the Euro. Not only does it attract more foreign investment but it may encourage the ECB to put up interest rates, which will directly strengthen the Euro. Otherwise, if economic data is weak, the Euro is likely to fall. Economic data for the four largest economies in the euro area (Germany, France, Italy and Spain) are especially significant, as they account for 75% of the Eurozone’s economy.
Another significant data release for the Euro is the Trade Balance. This indicator measures the difference between what a country earns from its exports and what it spends on imports over a given period. If a country produces highly sought after exports then its currency will gain in value purely from the extra demand created from foreign buyers seeking to purchase these goods. Therefore, a positive net Trade Balance strengthens a currency and vice versa for a negative balance.
- Natural Gas price shows no signs of fatigue and resides near the high of 2024.
- Brussels is discussing keeping Gas flows from Russia open for next year.
- The US Dollar Index resides near 105.00 ahead of Wednesday’s CPI and Fed meeting.
Natural Gas price (XNG/USD) trades higher on Tuesday, nearing a fresh yearly high, as Europe discusses ways of keeping flows via Ukraine alive next year and amid increasing supply from Norway. . While Norwegian flows are at their highest levels since April, Europe is looking to talk to Ukraine and Russia to keep the Gas flowing. This opens up a sore wound for Europe after it pledged to ban Russian gas. With big uncertainties now over whether Europe can even become independent from Russian Gas, prices are rallying as traders foresee that Europe will need to buy more Gas if Russia or Ukraine refuse to strike a deal.
Meanwhile, the US Dollar Index (DXY), which tracks the Greenback’s value against six major currencies, is lingering above 105.00 in a very calm start of the week. The DXY was moving a bit on Monday on the back of the outcome from the European elections, though the move has eased now. It looks like traders will await the main events on Wednesday, with the Consumer Price Index (CPI) release and the US Federal Reserve’s (Fed) rate decision and dot plot.
Natural Gas is trading at $3.07 per MMBtu at the time of writing.
Natural Gas news and market movers: Australia a fly in the ointment
- Bloomberg reports that Chevron has halted all gas production at its Wheatstone offshore facility in Australia to complete repairs to the fuel system. Production was already suspended on Monday.
- Ukraine’s state-run Gas company Naftogaz says it sees substantial interest from Europe to tap its Gas reserves and facilities, Reuters reports.
- Europe is considering bypassing Ukraine should Kyiv not want to cooperate with a European-Russian Gas deal. One option under consideration is to divert gas flows from Ukraine to Azerbaijan into Europe, Bloomberg reports.
Natural Gas Technical Analysis: Third time’s the charm?
Natural Gas trades higher, printing a fifth green daily candle in a row. Though more upside might be granted, the current level is a heavy cap which will not be easy to overcome. Should this $3.07-$3.10 barrier snap, a quick run up to $3.50 could be in the cards.
The pivotal level near $3.07 (high from March 6, 2023) remains key as prices failed to post a daily close above it. Add the red descending trend line coming in at $3.12, which would slam down any attempts to jump higher. Further up, the fresh year-to-date high at $3.16 is the level to beat.
On the downside, the 200-day Simple Moving Average (SMA) acts as the first support near $2.53. Should that support area fail to hold, the next target could be the pivotal level near $2.14, with interim support by the 55-day SMA near $2.34. Further down, the biggest support comes at $2.11 with the 100-day SMA.
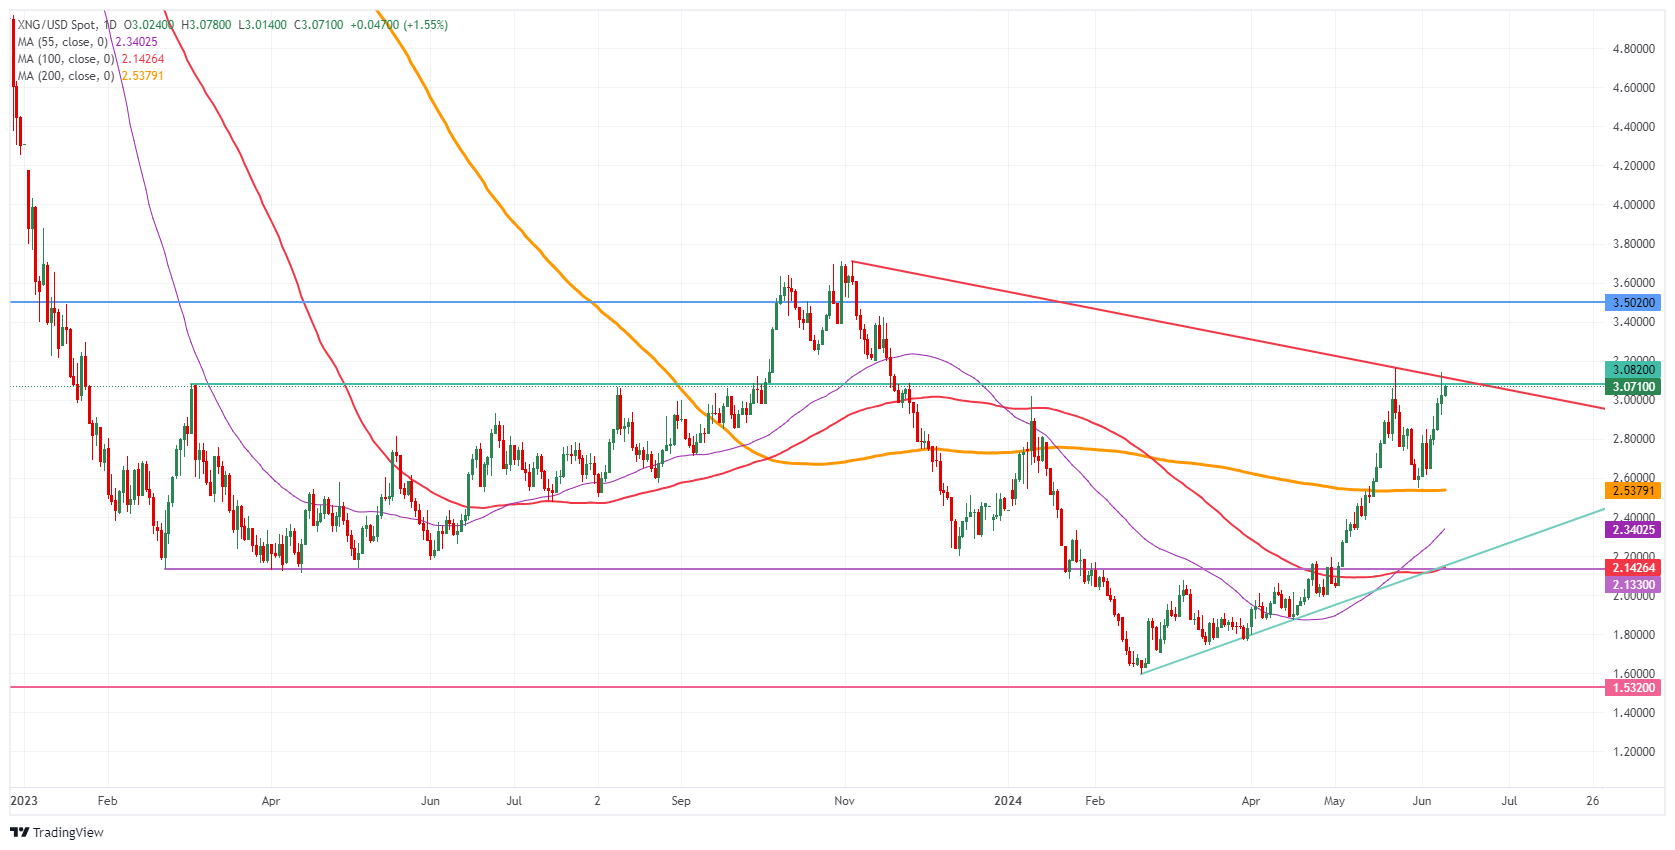
Natural Gas: Daily Chart
Natural Gas FAQs
Supply and demand dynamics are a key factor influencing Natural Gas prices, and are themselves influenced by global economic growth, industrial activity, population growth, production levels, and inventories. The weather impacts Natural Gas prices because more Gas is used during cold winters and hot summers for heating and cooling. Competition from other energy sources impacts prices as consumers may switch to cheaper sources. Geopolitical events are factors as exemplified by the war in Ukraine. Government policies relating to extraction, transportation, and environmental issues also impact prices.
The main economic release influencing Natural Gas prices is the weekly inventory bulletin from the Energy Information Administration (EIA), a US government agency that produces US gas market data. The EIA Gas bulletin usually comes out on Thursday at 14:30 GMT, a day after the EIA publishes its weekly Oil bulletin. Economic data from large consumers of Natural Gas can impact supply and demand, the largest of which include China, Germany and Japan. Natural Gas is primarily priced and traded in US Dollars, thus economic releases impacting the US Dollar are also factors.
The US Dollar is the world’s reserve currency and most commodities, including Natural Gas are priced and traded on international markets in US Dollars. As such, the value of the US Dollar is a factor in the price of Natural Gas, because if the Dollar strengthens it means less Dollars are required to buy the same volume of Gas (the price falls), and vice versa if USD strengthens.
- EUR/GBP is exposed to 0.8400 due to multiple headwinds.
- The Euro weakens as French Macron’s surprise call for a snap election has resulted in political uncertainty.
- UK’s steady wage growth has deepened fears of inflation remaining persistent.
The EUR/GBP pair seems exposed to more downside towards the round-level support of 0.8400. The cross is under pressure amid uncertain Euro’s appeal due to French President Emmanuel Macron’s decision to dissolve parliament and calling for a snap election and firm Pound Sterling amid expectations of the Bank of England (BoE) delaying rate cuts.
French Macron’s unprecedented call for a snap election came after exit polls for Eurozone parliamentary elections indicated that the general public desires a change in administration, resulting in political uncertainty as Marine Le Pen-led-Centrist’s alliance was already expected to suffer a defeat from Jordan Bardella-led-far-right National Rally. Seats won by the far-right at 32%-33% were more than twice the Centralist alliance.
Meanwhile, the Euro struggles to gain ground, albeit the European Central Bank (ECB) is refusing to commit to subsequent rate cuts. Last week, the ECB commenced its rate-cut campaign after reducing the Deposit Facility Rate by 25 basis points (bps) for the first time in five years but hesitate to commit a linear declining path as it worries that progress in inflation towards 2% could pause due to steady wage growth outlook. Currently, financial markets expect that the BoE will deliver only one more rate-cut decision by the year-end.
In the United Kingdom (UK) economy, interest rates appear to remain at their current levels for a longer period as wage growth remains steady despite soft labor demand. The UK labor market report for three months ending April showed that Average Earnings Excluding Bonuses, which is a wage inflation measure, grew in line with estimates and the prior release of 6.0%. Wage growth has been a major driver of service inflation, which has been a barrier for Bank of England (BoE) policymakers to initiate a confident return to policy normalization.
The number of employed individuals decreased consecutively for the fourth time as firms refrained from hiring due to weak household spending. The labor force shrank by 140K workers, lower than the prior release of 177 K. The ILO Unemployment Rate rose to 4.4% from the estimates and the prior release of 4.3%.
- The Mexican Peso resumes weakening after President-elect Sheinbaum gives the green light to judicial reforms.
- Markets also fear President Obrador using his last month in office to push through the reforms himself.
- USD/MXN pushes back up against key October 2023 highs at 18.49 as it resumes the march higher.
The Mexican Peso (MXN) trades roughly a percent lower in its key pairs on Tuesday after a press conference by President-elect Claudia Sheinbaum. In it, Sheinbaum confirmed she would be pushing ahead with reforms to the judiciary, which have raised concerns amongst investors and contributed to an over 8.0% devaluation of the Peso since the election on June 2.
At the time of writing USD/MXN is exchanging hands at 18.44, EUR/MXN is trading at 19.82 and GBP/MXN at 23.47.
Mexican Peso weakens after Sheinbaum presses
The Mexican Peso started depreciating again on Monday during a press conference given by Sheinbaum, at which she confirmed she would be prioritizing controversial reforms of the judiciary that investors fear could negatively impact the business climate in the country, according to Reuters.
Up until then, Mexico’s first woman President had avoided giving a clear commitment to the reforms, which were first proposed by the present incumbent, President Andrés Manuel López Obrador (AMLO), as part of a sweeping list of changes back in February.
In a press conference at the presidential palace on Monday, however, Sheinbaum said that after she elects her cabinet next week the “constitutional reform of the judiciary would be among the first reforms to be approved.” When asked if these would weaken the Mexican Peso, Sheinbaum said she did not believe they would impact financial markets. Other reforms that the President-elect said she would be prioritizing were those to social benefits, she added.
The reform to the judiciary seeks to replace the current system, in which Supreme Court judges are appointed, with judges elected by popular vote. The policy also encompasses the heads of bar associations, law schools and some lower court judges. The reforms stem from criticisms of the current system which it is argued enables corruption and cronyism.
To be pushed through, they require amendments to the constitution, for which a supermajority in both houses (over two-thirds of the seats) is necessary. Unlike AMLO, Sheinbaum’s coalition has a supermajority in the Congress and is only two seats short in the Senate.
In her press conference, Sheinbaum also said that she would be meeting a delegation sent by US President Joe Biden on Wednesday.
Fear of AMLO
Investors are further concerned by the possibility that AMLO himself may use the supermajority to push through the reforms before he retires on October 1.
“Congress is expected to convene on September 1, potentially giving Lopez Obrador a one-month window to push through reforms before retiring,” said a report from AFP News on Barron’s.
Technical Analysis: USD/MXN penned in by October 2023 highs
USD/MXN – the value of one US Dollar in Mexican Pesos – retains an upside bias as it pushes back up to resistance at 18.49 (October 2023 high).
USD/MXN Daily Chart
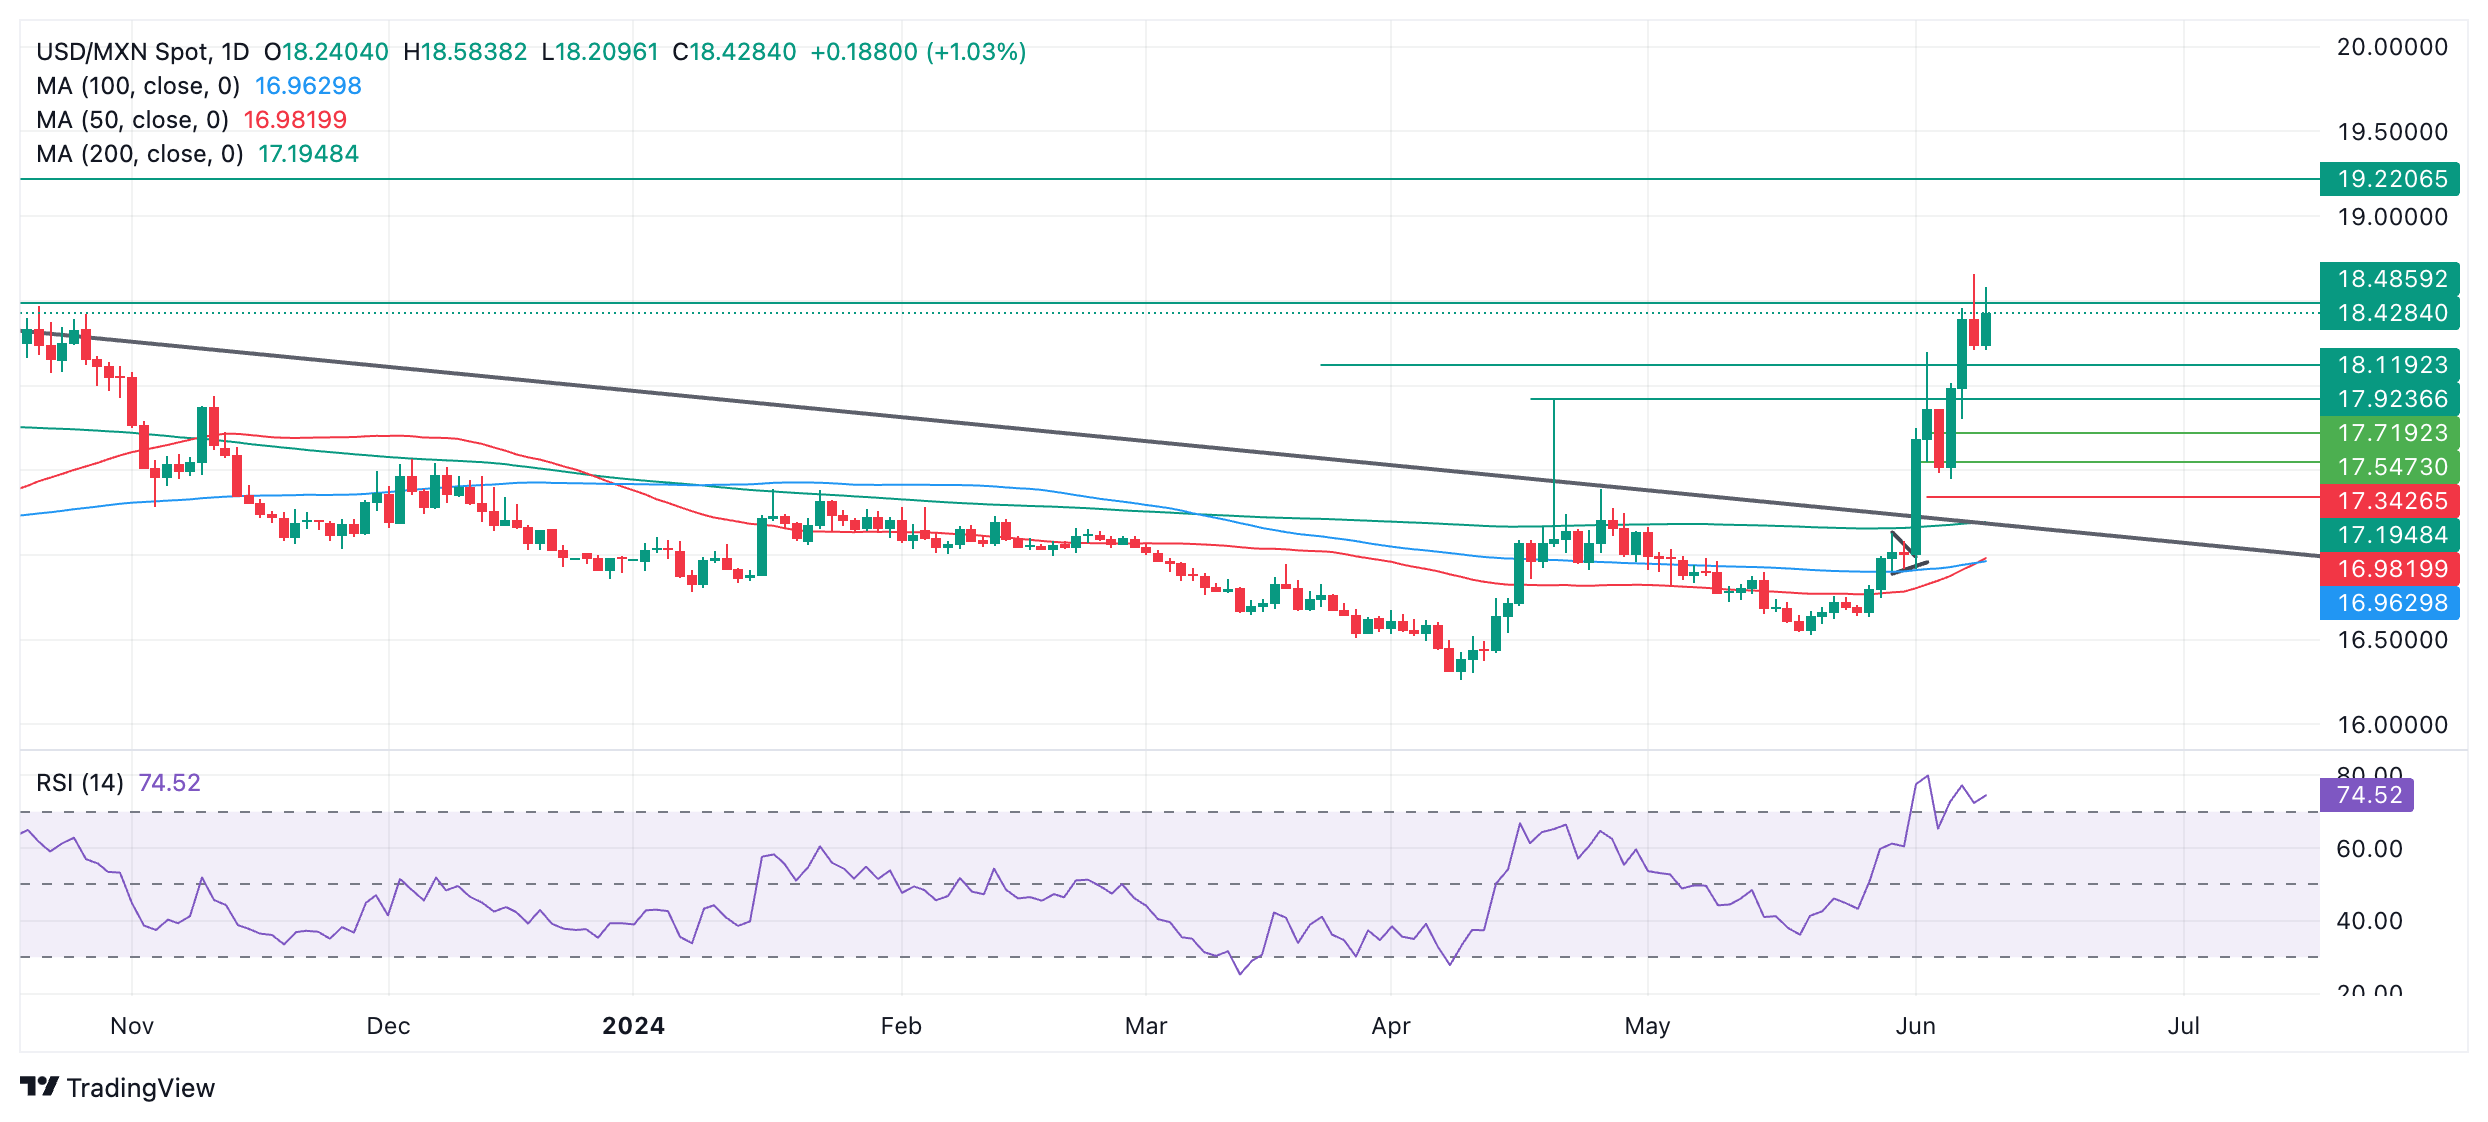
The rally in June means the pair is probably in a short and intermediate-term uptrend, and given that “the trend is your friend,” the odds favor price continuing higher.
The Relative Strength Index (RSI) is in the overbought zone, however, suggesting traders should not add to their long positions. It also increases the possibility of a pullback developing, although the established uptrend is likely to eventually resume after that.
A break above the October high would probably confirm prices going even higher, with the next target potentially situated at 19.22 (March 2023 high).
The long-term trend is probably still bearish, however, suggesting moderate background risks continue.
Mexican Peso FAQs
The Mexican Peso (MXN) is the most traded currency among its Latin American peers. Its value is broadly determined by the performance of the Mexican economy, the country’s central bank’s policy, the amount of foreign investment in the country and even the levels of remittances sent by Mexicans who live abroad, particularly in the United States. Geopolitical trends can also move MXN: for example, the process of nearshoring – or the decision by some firms to relocate manufacturing capacity and supply chains closer to their home countries – is also seen as a catalyst for the Mexican currency as the country is considered a key manufacturing hub in the American continent. Another catalyst for MXN is Oil prices as Mexico is a key exporter of the commodity.
The main objective of Mexico’s central bank, also known as Banxico, is to maintain inflation at low and stable levels (at or close to its target of 3%, the midpoint in a tolerance band of between 2% and 4%). To this end, the bank sets an appropriate level of interest rates. When inflation is too high, Banxico will attempt to tame it by raising interest rates, making it more expensive for households and businesses to borrow money, thus cooling demand and the overall economy. Higher interest rates are generally positive for the Mexican Peso (MXN) as they lead to higher yields, making the country a more attractive place for investors. On the contrary, lower interest rates tend to weaken MXN.
Macroeconomic data releases are key to assess the state of the economy and can have an impact on the Mexican Peso (MXN) valuation. A strong Mexican economy, based on high economic growth, low unemployment and high confidence is good for MXN. Not only does it attract more foreign investment but it may encourage the Bank of Mexico (Banxico) to increase interest rates, particularly if this strength comes together with elevated inflation. However, if economic data is weak, MXN is likely to depreciate.
As an emerging-market currency, the Mexican Peso (MXN) tends to strive during risk-on periods, or when investors perceive that broader market risks are low and thus are eager to engage with investments that carry a higher risk. Conversely, MXN tends to weaken at times of market turbulence or economic uncertainty as investors tend to sell higher-risk assets and flee to the more-stable safe havens.
- NZD/USD edges lower due to the hawkish sentiment surrounding the Fed.
- CME FedWatch Tool suggests the odds of a Fed rate cut in September have decreased to nearly 49.0%.
- The New Zealand Dollar may limit its downside as RBNZ is expected to maintain tightening policy for longer.
NZD/USD edges lower to near 0.6120 during the European trading session on Tuesday. US Dollar (USD) gains ground against the Kiwi Dollar as investors adopt a cautious stance ahead of the Federal Reserve’s (Fed) interest rate decision scheduled on Wednesday.
The Federal Reserve is anticipated to keep interest rates steady in the range of 5.25%-5.50% as it aims to curb inflation toward its 2% target. According to the CME FedWatch Tool, the likelihood of a Fed rate cut in September by at least 25 basis points has decreased to nearly 49.0%, down from 59.5% a week earlier.
The US Dollar Index (DXY), which measures the value of the US Dollar (USD) against six major currencies, maintains its position due to the emergence of the hawkish sentiment surrounding the Fed regarding its policy tightening. The robust US jobs data for May has reduced the likelihood of the two Fed rate cuts in 2024.
On the Kiwi front, traders are likely awaiting China’s CPI and PPI reports on Wednesday for insights into the economic conditions of New Zealand’s largest export market.
High interest rates in New Zealand have continued to provide sustained support to the New Zealand Dollar (NZD) despite a weakening economy. The Reserve Bank of New Zealand (RBNZ) is expected to maintain a stable policy until at least mid-2025 to allow for a thorough data assessment.
Silver prices (XAG/USD) fell on Tuesday, according to FXStreet data. Silver trades at $29.23 per troy ounce, down 1.73% from the $29.75 it cost on Monday.
Silver prices have increased by 14.76% since the beginning of the year.
| Unit measure | Today Price |
|---|---|
| Silver price per troy ounce | $29.23 |
| Silver price per gram | $0.94 |
The Gold/Silver ratio, which shows the number of troy ounces of Silver needed to equal the value of one troy ounce of Gold, stood at 78.90 on Tuesday, up from 77.68 on Monday.
Investors might use this ratio to determine the relative valuation of Gold and Silver. Some may consider a high ratio as an indicator that Silver is undervalued – or Gold is overvalued – and might buy Silver or sell Gold accordingly. Conversely, a low ratio might suggest that Gold is undervalued relative to Silver.
Silver FAQs
Silver is a precious metal highly traded among investors. It has been historically used as a store of value and a medium of exchange. Although less popular than Gold, traders may turn to Silver to diversify their investment portfolio, for its intrinsic value or as a potential hedge during high-inflation periods. Investors can buy physical Silver, in coins or in bars, or trade it through vehicles such as Exchange Traded Funds, which track its price on international markets.
Silver prices can move due to a wide range of factors. Geopolitical instability or fears of a deep recession can make Silver price escalate due to its safe-haven status, although to a lesser extent than Gold's. As a yieldless asset, Silver tends to rise with lower interest rates. Its moves also depend on how the US Dollar (USD) behaves as the asset is priced in dollars (XAG/USD). A strong Dollar tends to keep the price of Silver at bay, whereas a weaker Dollar is likely to propel prices up. Other factors such as investment demand, mining supply – Silver is much more abundant than Gold – and recycling rates can also affect prices.
Silver is widely used in industry, particularly in sectors such as electronics or solar energy, as it has one of the highest electric conductivity of all metals – more than Copper and Gold. A surge in demand can increase prices, while a decline tends to lower them. Dynamics in the US, Chinese and Indian economies can also contribute to price swings: for the US and particularly China, their big industrial sectors use Silver in various processes; in India, consumers’ demand for the precious metal for jewellery also plays a key role in setting prices.
Silver prices tend to follow Gold's moves. When Gold prices rise, Silver typically follows suit, as their status as safe-haven assets is similar. The Gold/Silver ratio, which shows the number of ounces of Silver needed to equal the value of one ounce of Gold, may help to determine the relative valuation between both metals. Some investors may consider a high ratio as an indicator that Silver is undervalued, or Gold is overvalued. On the contrary, a low ratio might suggest that Gold is undervalued relative to Silver.
(An automation tool was used in creating this post.)
European Central Bank (ECB) policymaker Olli Rehn said on Tuesday that the “monetary policy has dampened price pressures.”
He added that “there has been considerable progress in bringing inflation down to target.”
Market reaction
The above comments add to the renewed downside in the EUR/USD pair, as it flirts with intraday lows near 1.0750, at the time of writing.
ECB FAQs
The European Central Bank (ECB) in Frankfurt, Germany, is the reserve bank for the Eurozone. The ECB sets interest rates and manages monetary policy for the region. The ECB primary mandate is to maintain price stability, which means keeping inflation at around 2%. Its primary tool for achieving this is by raising or lowering interest rates. Relatively high interest rates will usually result in a stronger Euro and vice versa. The ECB Governing Council makes monetary policy decisions at meetings held eight times a year. Decisions are made by heads of the Eurozone national banks and six permanent members, including the President of the ECB, Christine Lagarde.
In extreme situations, the European Central Bank can enact a policy tool called Quantitative Easing. QE is the process by which the ECB prints Euros and uses them to buy assets – usually government or corporate bonds – from banks and other financial institutions. QE usually results in a weaker Euro. QE is a last resort when simply lowering interest rates is unlikely to achieve the objective of price stability. The ECB used it during the Great Financial Crisis in 2009-11, in 2015 when inflation remained stubbornly low, as well as during the covid pandemic.
Quantitative tightening (QT) is the reverse of QE. It is undertaken after QE when an economic recovery is underway and inflation starts rising. Whilst in QE the European Central Bank (ECB) purchases government and corporate bonds from financial institutions to provide them with liquidity, in QT the ECB stops buying more bonds, and stops reinvesting the principal maturing on the bonds it already holds. It is usually positive (or bullish) for the Euro.
- USD/CAD gains ground due to the hawkish sentiment surrounding the Fed.
- CME FedWatch Tool suggests the odds of a Fed rate cut in September have decreased to nearly 49.0%.
- The decline in the WTI price put pressure on the commodity-linked Canadian Dollar.
USD/CAD continues its winning streak for a third successive session, trading around 1.3760 during the European hours on Tuesday. US Dollar (USD) remains strong as investors adopt cautious stance ahead of the Federal Reserve’s (Fed) interest rate decision scheduled on Wednesday.
The Federal Reserve is anticipated to keep interest rates steady in the range of 5.25%-5.50% as it aims to curb inflation toward its 2% target. Additionally, the US headline and core CPI figures for May are estimated to show year-over-year increases of 3.4% and 3.5%, respectively.
Robust US jobs data for May has reduced the odds of two Federal Reserve interest rate cuts in 2024. According to the CME FedWatch Tool, the likelihood of a Fed rate cut in September by at least 25 basis points has decreased to nearly 49.0%, down from 59.5% a week earlier.
On Loonie’s front, the decline in the crude Oil prices put pressure on the commodity-linked Canadian Dollar (CAD), given the fact that Canada is the largest Oil exporter to the United States (US). West Texas Intermediate (WTI) Oil price hovers around $77.30 per barrel, at the time of writing.
Crude Oil prices are bolstered by expectations of increased fuel demand this summer. According to Reuters, analysts at the energy consulting firm Gelber and Associates noted, "Futures are higher as expectations of summer demand are supportive of prices despite the broader macro landscape remaining less optimistic than weeks previous."
In Canada, the unemployment rate rose to a more than two-year high of 6.2% in May. However, the economy added more jobs than expected, and there was a notable increase in wage growth. Traders are likely to observe the BoC Governor Tiff Macklem as he is scheduled to speak on Wednesday at the Conference of Montreal 2024, where he will participate in a panel discussion about inflation.
European Central Bank (ECB) policymaker Francois Villeroy de Galhau said on Tuesday that they have "significant leeway" to lower rates before exiting the restrictive policy, per Reuters.
Key takeaways
"We are monitoring actual inflation data, in particular for services, but monthly figures will be volatile due to base effects on energy."
"This noise is not very meaningful, and hence we are still more outlook-driven and will look still more closely at the inflation forecasts."
"We remain confident that barring an external shock, we will bring inflation to 2% target by next year, we will reach it with a soft rather than hard landing."
Market reaction
These comments don't seem to be having a significant impact on the Euro's valuation. At the time of press, the EUR/USD pair was virtually unchanged on the day at 1.0763.
ECB FAQs
The European Central Bank (ECB) in Frankfurt, Germany, is the reserve bank for the Eurozone. The ECB sets interest rates and manages monetary policy for the region. The ECB primary mandate is to maintain price stability, which means keeping inflation at around 2%. Its primary tool for achieving this is by raising or lowering interest rates. Relatively high interest rates will usually result in a stronger Euro and vice versa. The ECB Governing Council makes monetary policy decisions at meetings held eight times a year. Decisions are made by heads of the Eurozone national banks and six permanent members, including the President of the ECB, Christine Lagarde.
In extreme situations, the European Central Bank can enact a policy tool called Quantitative Easing. QE is the process by which the ECB prints Euros and uses them to buy assets – usually government or corporate bonds – from banks and other financial institutions. QE usually results in a weaker Euro. QE is a last resort when simply lowering interest rates is unlikely to achieve the objective of price stability. The ECB used it during the Great Financial Crisis in 2009-11, in 2015 when inflation remained stubbornly low, as well as during the covid pandemic.
Quantitative tightening (QT) is the reverse of QE. It is undertaken after QE when an economic recovery is underway and inflation starts rising. Whilst in QE the European Central Bank (ECB) purchases government and corporate bonds from financial institutions to provide them with liquidity, in QT the ECB stops buying more bonds, and stops reinvesting the principal maturing on the bonds it already holds. It is usually positive (or bullish) for the Euro.
- USD/CHF stays calm ahead of the looming Fed policy decision.
- The US Dollar remains strong as the Fed can be expected to keep rates steady in the range of 5.25%-5.50% on Wednesday.
- SNB is expected to keep interest rates unchanged in June.
USD/CHF remains calm due to thin trading as investors adopt a cautious stance ahead of the Federal Reserve’s (Fed) interest rate decision scheduled on Wednesday. The pair hovers around 0.8950 during the early European hours on Tuesday.
The Fed is anticipated to keep interest rates steady in the range of 5.25%-5.50% as it aims to curb inflation toward its 2% target. Additionally, the US headline and core CPI figures for May are estimated to show year-over-year increases of 3.4% and 3.5%, respectively.
The robust US jobs data for May has reduced the odds of two Federal Reserve (Fed) interest rate cuts in 2024. The CME FedWatch Tool indicates that the likelihood of a Fed rate cut in September by at least 25 basis points has decreased to nearly 49.0%, down from 59.5% a week earlier.
In Switzerland, the Consumer Confidence indicator remained relatively unchanged at -38 in May, compared to -38.1 in April, and falling short of forecasts of -37. Traders are now anticipating the Financial Stability Report from the Swiss National Bank (SNB), which will provide an assessment of the banking sector's stability and the financial market infrastructure.
The Swiss National Bank (SNB) is unlikely to implement an interest rate cut in June, despite inflation remaining below the 2% threshold. Previously, SNB Chairman Thomas J. Jordan warned of minor upside risks to inflation expectations.
- Silver price remains under pressure near $29.00 with a focus on the US CPI and the Fed policy outcome.
- The Fed is expected to maintain interest rates steady with hawkish guidance.
- Investors see the Fed cutting interest rates only once this year.
Silver price (XAG/USD) extends its downside to near the crucial support of $29.00 in Tuesday’s European session. The white metal weakens as the US Dollar (USD) and bond yields have performed strongly across the board due to a sharp decline in market expectations that the Federal Reserve (Fed) will start reducing interest rates from the September meeting.
Investors see the Fed lowering its key borrowing rates only once this year as fears for price pressures remaining persistent have deepened. The US Dollar Index (DXY) turns sideways after printing a fresh four-week high near 105.40. 10-year US Treasury yields have edged down to 4.44% in the London session but hold its strong recovery from 4.27%.
The next major triggers for the Silver price will be the May United States Consumer Price Index (CPI) data and the Fed’s interest rate decision. The CPI data will indicate whether the disinflation process is intact or has stalled. In the first quarter, the CPI report indicated that price pressures were higher than expected, while in April, they declined expectedly.
Meanwhile, the Fed’s decision is expected to remain status quo for the seventh time in a row as policymakers lack evidence that inflation is on course to return to the desired rate of 2%. Investors will focus on the Fed’s dot plot, which will indicate where policymakers see the federal fund rate heading. The CME FedWatch tool shows that 30-day Fed Fund Rate pricing data suggest only one rate-cut move this year.
Silver technical analysis
Silver price trades close to the neckline of the Head and Shoulder (H&S) chart pattern, which is marked from April 9 high at 1.0885 on a four-hour timeframe. A breakdown of the above-mentioned chart pattern results in a bearish reversal.
The near-term outlook remains uncertain after a bearish crossover of 20 and 50-day Exponential Moving Averages (EMAs) near $30.50.
The 14-period Relative Strength Index (RSI) has slipped into the 20.00-40.00 range, suggesting that the momentum has leaned toward the downside.
Silver four-hour chart
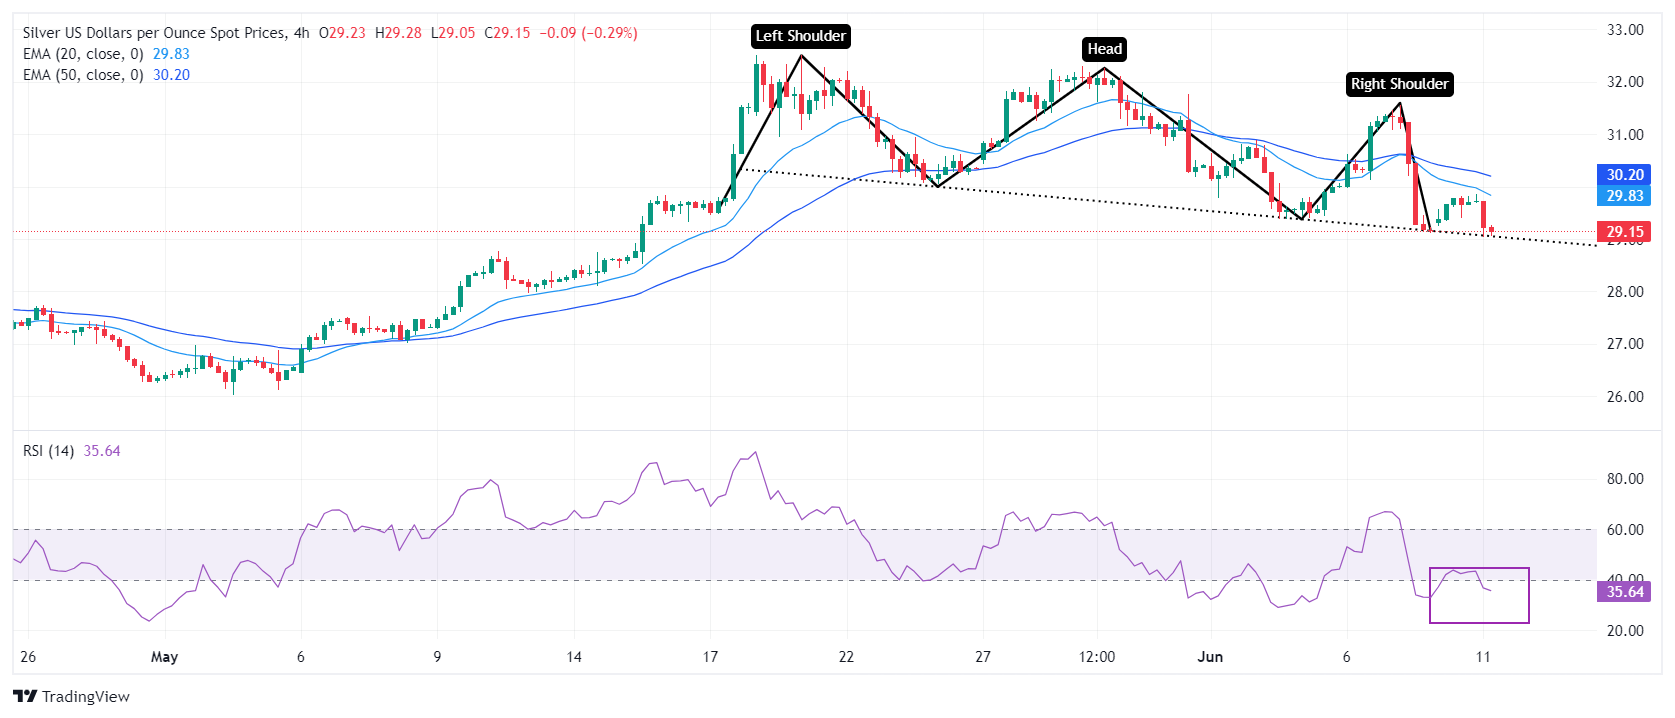
Gold prices fell in India on Tuesday, according to data compiled by FXStreet.
The price for Gold stood at 6,182.45 Indian Rupees (INR) per gram, down INR 22.48 compared with the INR 6,204.93 it cost on Monday.
The price for Gold decreased to INR 72,110.83 per tola from INR 72,372.97 per tola.
| Unit measure | Gold Price in INR |
|---|---|
| 1 Gram | 6,182.45 |
| 10 Grams | 61,824.46 |
| Tola | 72,110.83 |
| Troy Ounce | 192,301.80 |
FXStreet calculates Gold prices in India by adapting international prices (USD/INR) to the local currency and measurement units. Prices are updated daily based on the market rates taken at the time of publication. Prices are just for reference and local rates could diverge slightly.
Global Market Movers: Comex Gold price suffers from diminishing bets for a September Fed rate cut move
- The upbeat US Nonfarm Payrolls released on Friday fueled speculations that the Federal Reserve will keep rates higher for longer and turn out to be a key factor acting as a headwind for the non-yielding Comex Gold price.
- The chances of a rate cut in September fell to around 50% following the US jobs data and the markets are now pricing in just one cut of 25 basis points this year, either at the November or December policy meeting.
- The yield on the benchmark 10-year US government bond holds steady above 4.45%, while the yield on the rate-sensitive two-year US Treasury note remains close to 5.0%, which, in turn, is underpinning the US Dollar.
- The USD Index, which tracks the Greenback against a basket of currencies, stands tall near its highest level since May 14 set on Monday and contributes to capping the upside for the USD-denominated commodity.
- French President Emmanuel Macron's decision to call snap elections later this month increased political uncertainty in the Eurozone's second-biggest economy and could lend support to the XAU/USD.
- Traders also seem reluctant and keenly await this week's key US macro data – the latest consumer inflation figures – and the crucial FOMC decision on Wednesday before placing aggressive directional bets.
Gold FAQs
Gold has played a key role in human’s history as it has been widely used as a store of value and medium of exchange. Currently, apart from its shine and usage for jewelry, the precious metal is widely seen as a safe-haven asset, meaning that it is considered a good investment during turbulent times. Gold is also widely seen as a hedge against inflation and against depreciating currencies as it doesn’t rely on any specific issuer or government.
Central banks are the biggest Gold holders. In their aim to support their currencies in turbulent times, central banks tend to diversify their reserves and buy Gold to improve the perceived strength of the economy and the currency. High Gold reserves can be a source of trust for a country’s solvency. Central banks added 1,136 tonnes of Gold worth around $70 billion to their reserves in 2022, according to data from the World Gold Council. This is the highest yearly purchase since records began. Central banks from emerging economies such as China, India and Turkey are quickly increasing their Gold reserves.
Gold has an inverse correlation with the US Dollar and US Treasuries, which are both major reserve and safe-haven assets. When the Dollar depreciates, Gold tends to rise, enabling investors and central banks to diversify their assets in turbulent times. Gold is also inversely correlated with risk assets. A rally in the stock market tends to weaken Gold price, while sell-offs in riskier markets tend to favor the precious metal.
The price can move due to a wide range of factors. Geopolitical instability or fears of a deep recession can quickly make Gold price escalate due to its safe-haven status. As a yield-less asset, Gold tends to rise with lower interest rates, while higher cost of money usually weighs down on the yellow metal. Still, most moves depend on how the US Dollar (USD) behaves as the asset is priced in dollars (XAU/USD). A strong Dollar tends to keep the price of Gold controlled, whereas a weaker Dollar is likely to push Gold prices up.
(An automation tool was used in creating this post.)
Here is what you need to know on Tuesday, June 11:
The US Dollar Index fluctuates in a tight channel above 105.00 early Tuesday after posting small gains on Monday. The economic calendar will not feature any high-impact data releases. Later in the American session, the US Treasury will hold a 10-year Treasury note auction and the Federal Reserve's (Fed) two-day policy meeting will get underway.
The risk-averse market atmosphere helped the US Dollar (USD) stay resilient against its rivals at the beginning of the week. Meanwhile, investors refrain from taking large positions ahead of Wednesday's Consumer Price Index (CPI) data and the Fed's policy decisions. The US central bank will also release the revised Summary of Economic Projections.
US Dollar PRICE This week
The table below shows the percentage change of US Dollar (USD) against listed major currencies this week. US Dollar was the strongest against the Euro.
| USD | EUR | GBP | JPY | CAD | AUD | NZD | CHF | |
|---|---|---|---|---|---|---|---|---|
| USD | 0.31% | 0.00% | 0.28% | 0.02% | -0.39% | -0.36% | -0.11% | |
| EUR | -0.31% | 0.04% | 0.22% | -0.04% | -0.43% | -0.42% | -0.17% | |
| GBP | -0.00% | -0.04% | 0.32% | -0.07% | -0.46% | -0.45% | -0.21% | |
| JPY | -0.28% | -0.22% | -0.32% | -0.26% | -0.75% | -0.75% | -0.34% | |
| CAD | -0.02% | 0.04% | 0.07% | 0.26% | -0.38% | -0.38% | -0.14% | |
| AUD | 0.39% | 0.43% | 0.46% | 0.75% | 0.38% | 0.01% | 0.26% | |
| NZD | 0.36% | 0.42% | 0.45% | 0.75% | 0.38% | -0.01% | 0.25% | |
| CHF | 0.11% | 0.17% | 0.21% | 0.34% | 0.14% | -0.26% | -0.25% |
The heat map shows percentage changes of major currencies against each other. The base currency is picked from the left column, while the quote currency is picked from the top row. For example, if you pick the US Dollar from the left column and move along the horizontal line to the Japanese Yen, the percentage change displayed in the box will represent USD (base)/JPY (quote).
During the Asian trading hours, the data from Australia showed that the National Australia Bank's Business Confidence Index dropped to -3 in May from 2 in April. AUD/USD largely ignored this data and was last seen moving sideways in a tight channel slightly above 0.6600.
Australian Dollar remains tepid as investors adopt caution ahead of looming Fed decision.
The UK's Office for National Statistics reported early Tuesday that the ILO Unemployment Rate edged higher to 4.4% in the three months to April, with the Employment Change coming in at -140,000 in the same period. Additionally, annual wage inflation, as measured by the change in the Average Earnings Including Bonus, held steady at 5.9%. GBP/USD lost its traction following the UK labor market data and erased its daily gains. Nevertheless, the pair managed to stabilize above 1.2700.
Pound Sterling edges down due to weak UK Employment, uncertainty ahead of Fed decision.
Following a two-day decline, EUR/USD recovers modestly and trades above 1.0750 in the European morning on Tuesday.
Widening spreads, falling Euro – The Fed won’t help lift sentiment.
USD/JPY closed the first day of the week in positive territory and continued to stretch higher during the Asian trading hours on Tuesday. At the time of press, the pair was trading at its highest level in a week above 157.00.
Gold registered small gains on Monday but struggled to gather bullish momentum. XAU/USD was last seen moving up and down in a narrow band at around $2,300.
Gold price remains on the defensive amid renewed rate jitters, US Dollar demand.
Central banks FAQs
Central Banks have a key mandate which is making sure that there is price stability in a country or region. Economies are constantly facing inflation or deflation when prices for certain goods and services are fluctuating. Constant rising prices for the same goods means inflation, constant lowered prices for the same goods means deflation. It is the task of the central bank to keep the demand in line by tweaking its policy rate. For the biggest central banks like the US Federal Reserve (Fed), the European Central Bank (ECB) or the Bank of England (BoE), the mandate is to keep inflation close to 2%.
A central bank has one important tool at its disposal to get inflation higher or lower, and that is by tweaking its benchmark policy rate, commonly known as interest rate. On pre-communicated moments, the central bank will issue a statement with its policy rate and provide additional reasoning on why it is either remaining or changing (cutting or hiking) it. Local banks will adjust their savings and lending rates accordingly, which in turn will make it either harder or easier for people to earn on their savings or for companies to take out loans and make investments in their businesses. When the central bank hikes interest rates substantially, this is called monetary tightening. When it is cutting its benchmark rate, it is called monetary easing.
A central bank is often politically independent. Members of the central bank policy board are passing through a series of panels and hearings before being appointed to a policy board seat. Each member in that board often has a certain conviction on how the central bank should control inflation and the subsequent monetary policy. Members that want a very loose monetary policy, with low rates and cheap lending, to boost the economy substantially while being content to see inflation slightly above 2%, are called ‘doves’. Members that rather want to see higher rates to reward savings and want to keep a lit on inflation at all time are called ‘hawks’ and will not rest until inflation is at or just below 2%.
Normally, there is a chairman or president who leads each meeting, needs to create a consensus between the hawks or doves and has his or her final say when it would come down to a vote split to avoid a 50-50 tie on whether the current policy should be adjusted. The chairman will deliver speeches which often can be followed live, where the current monetary stance and outlook is being communicated. A central bank will try to push forward its monetary policy without triggering violent swings in rates, equities, or its currency. All members of the central bank will channel their stance toward the markets in advance of a policy meeting event. A few days before a policy meeting takes place until the new policy has been communicated, members are forbidden to talk publicly. This is called the blackout period.
- The Pound Sterling declines from 1.2740 against the US Dollar due to weak UK employment data and a firm US Dollar.
- The BoE could struggle to shift toward policy normalization as steady UK wage growth offset the impact of weaker employment levels.
- Investors see the Fed arguing to maintain a restrictive framework for longer.
The Pound Sterling (GBP) falls back after facing selling pressure near 1.2740 in Tuesday’s London session. The GBP/USD pair weakens due to poor United Kingdom (UK) Employment data for three months through April and a firm US Dollar (USD) amid expectations that the Federal Reserve (Fed) will delay interest-rate cuts.
The UK Office for National Statistics (ONS) reported that the labor market recorded a drawdown for the fourth time in a row. Employment fell by 140,000 workers in the three months to April, less than the 177,000 decline in employment seen in the January-March period. The ILO Unemployment Rate rose to 4.4%, higher than the expected 4.3%. The labor market data indicates that firms struggle to bear the consequences of the Bank of England's (BoE) higher interest rates.
Meanwhile, wage growth remained steady in the February-April period. Average Earnings Excluding Bonuses, which is a wage inflation measure, grew in line with estimates and the prior release of 6.0%. Also, Average Earnings Including bonuses grew steadily by 5.9%, upwardly revised from 5.7% and higher than the estimates of 5.7%. High wage growth could hamper the BoE's move towards lowering interest rates.
Daily digest market movers: Pound Sterling weighed by weak labor market data
- The Pound Sterling faces selling pressure near 1.2740 after a short-lived pullback against the US Dollar. The US Dollar remains firm as investors turn cautious ahead of the United States (US) Consumer Price Index (CPI) data for May and the Federal Reserve’s interest rate decision, which are scheduled for Wednesday. The US Dollar Index (DXY), which tracks the Greenback’s value against six major currencies, consolidates after rising to almost monthly high near 105.40.
- Monthly headline inflation is expected to grow at a slower pace of 0.1% from 0.3% in April, with annual figures growing steadily by 3.4%. In the same period, the annual core CPI, which excludes volatile food and energy prices, is expected to have decelerated to 3.5% from the former release of 3.6%, with monthly figures maintaining the current growth rate of 0.3%.
- Steady or higher-than-expected inflation figures would force Fed policymakers to argue in favor of maintaining the current interest rate framework for a longer period. Soft figures, on the contrary, would reinforce their confidence that the progress in the disinflation process has not stalled.
- The major event for investors will be the Fed’s interest rate decision, in which officials are expected to keep rates on hold for the seventh straight time. Policymakers said they won't lower rates until they get sufficient evidence that inflation will sustainably return to the desired rate of 2%. Investors will keenly focus on Fed Chair Jerome Powell’s press conference and the dot plot to get significant cues about the interest rate outlook.
- Currently, market speculation for Fed rate cuts for the entire year suggests that there will be only one rate cut this year, either in the November or December meeting. Meanwhile, investors’ expectations for the Fed reducing interest rates in the September meeting have diminished significantly.
Technical Analysis: Pound Sterling holds above 1.2700
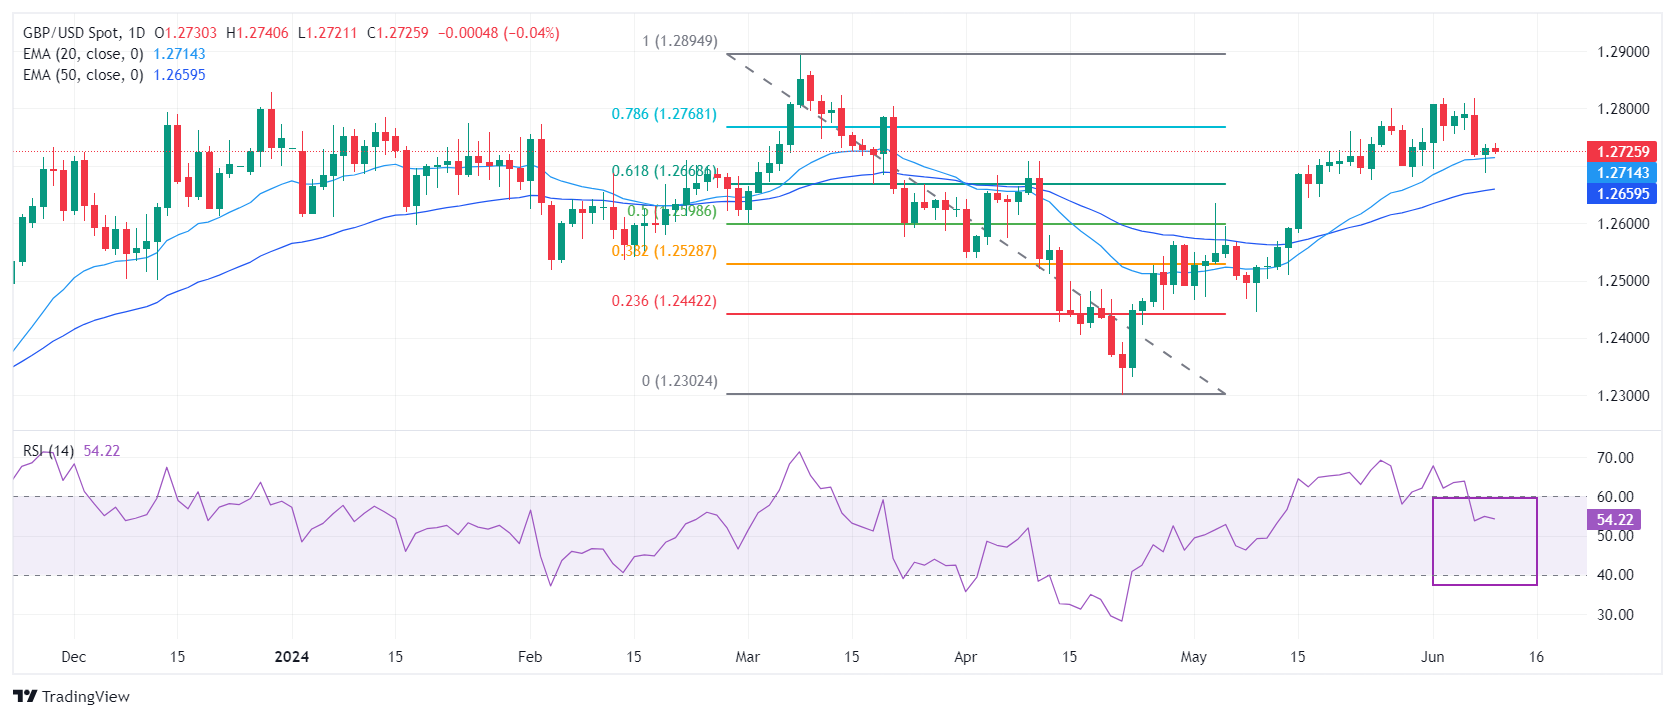
The Pound Sterling finds an interim cushion near the round-level support of 1.2700 against the US Dollar. The GBP/USD pair continues to be well-supported by the 20-day Exponential Moving Average (EMA), which trades around 1.2714. Also, the 50-day EMA is loping higher, suggesting that the near-term trend is still upbeat.
The Cable still holds the 61.8% Fibonacci retracement support (plotted from the March 8 high of 1.2900 to the April 22 low at 1.2300) at 1.2665.
However, the 14-period Relative Strength Index (RSI) has shifted into the lower range of 40.00-60.00, suggesting that the momentum is losing strength.
Pound Sterling FAQs
The Pound Sterling (GBP) is the oldest currency in the world (886 AD) and the official currency of the United Kingdom. It is the fourth most traded unit for foreign exchange (FX) in the world, accounting for 12% of all transactions, averaging $630 billion a day, according to 2022 data. Its key trading pairs are GBP/USD, aka ‘Cable’, which accounts for 11% of FX, GBP/JPY, or the ‘Dragon’ as it is known by traders (3%), and EUR/GBP (2%). The Pound Sterling is issued by the Bank of England (BoE).
The single most important factor influencing the value of the Pound Sterling is monetary policy decided by the Bank of England. The BoE bases its decisions on whether it has achieved its primary goal of “price stability” – a steady inflation rate of around 2%. Its primary tool for achieving this is the adjustment of interest rates. When inflation is too high, the BoE will try to rein it in by raising interest rates, making it more expensive for people and businesses to access credit. This is generally positive for GBP, as higher interest rates make the UK a more attractive place for global investors to park their money. When inflation falls too low it is a sign economic growth is slowing. In this scenario, the BoE will consider lowering interest rates to cheapen credit so businesses will borrow more to invest in growth-generating projects.
Data releases gauge the health of the economy and can impact the value of the Pound Sterling. Indicators such as GDP, Manufacturing and Services PMIs, and employment can all influence the direction of the GBP. A strong economy is good for Sterling. Not only does it attract more foreign investment but it may encourage the BoE to put up interest rates, which will directly strengthen GBP. Otherwise, if economic data is weak, the Pound Sterling is likely to fall.
Another significant data release for the Pound Sterling is the Trade Balance. This indicator measures the difference between what a country earns from its exports and what it spends on imports over a given period. If a country produces highly sought-after exports, its currency will benefit purely from the extra demand created from foreign buyers seeking to purchase these goods. Therefore, a positive net Trade Balance strengthens a currency and vice versa for a negative balance.
- GBP/JPY holds positive ground near 200.10 in Tuesday’s early European session.
- The UK Unemployment Rate rose to 4.4% in three months to April; Claimant Count Change arrived at 50.4K in May.
- Analysts expect the BoJ to commence tapering its monthly bond purchases at Friday's policy meeting, according to Reuters polls.
The GBP/JPY cross trades in positive territory for the third consecutive day around 200.10 during the early European session on Tuesday. The cross dropped a few pips on mixed UK employment data. Investors will shift their attention to the Bank of Japan (BoJ) monetary policy meeting on Friday.
The latest data from the UK Office for National Statistics on Tuesday showed that the ILO Unemployment Rate rose to 4.4% in the three months to April from 4.3% in the previous reading, worse than the market expectation of 4.3%. Meanwhile, the number of people claiming jobless benefits rose by 50.4K in May from an increase of 8.4K in April. The UK Employment Change came in at -140K in the three months to April, versus a -177K decrease in the previous reading.
Apart from this, the UK Average Earnings excluding Bonus rose 6.0% 3M YoY in April, compared to a 6.0% increase in March, beating the estimations. The Average Earnings including Bonus increased by 5.9% in the same period and above the consensus of 5.7%. The Pound Sterling (GBP) attracts modest sellers in the immediate reaction to the mixed UK employment market data.
The BoJ is expected to commence tapering its monthly bond purchases at Friday's policy meeting, according to nearly two-thirds of economists surveyed in a Reuters poll on Tuesday. The Japanese central bank is widely anticipated to keep its short-term interest rate unchanged at 0.0%–0.1%. Investors will closely watch the BoJ’s statement. The dovish tone from the BoJ might exert some selling pressure on the Japanese Yen (JPY) and create a tailwind for the GBP/JPY cross.
- The UK Unemployment Rate rose to 4.4% in three months to April.
- The Claimant Count Change for Britain came in at 50.4K in May.
- GBP/USD eases 1.2700 after mixed UK jobs data.
The United Kingdom’s (UK) ILO Unemployment Rate rose to 4.4% in the three months to April after reporting 4.3% in the previous period, data published by the Office for National Statistics (ONS) showed Tuesday. The market consensus was for a 4.3% reading.
Additional details of the report showed that the number of people claiming jobless benefits rose by 50.4K in May, compared with a revised increase of 8.4K reported in April, beating the expected 10.2K increment.
The Employment Change data for April came in at -140K, as against March’s -177K.
Meanwhile, Average Earnings excluding Bonus in the UK rose 6.0% 3M YoY in April versus a 6.0% growth recorded in March. The reading matched the expectations.
Another measure of wage inflation, Average Earnings including Bonus increased by 5.9% in the same period, at the same pace as seen in the quarter through March and above the expected raise of 5.7%.
GBP/USD reaction to the UK employment report
GBP/USD ticked a few pips lower on the mixed UK employment data. The pair is trading flat on the day at 1.2725, as of writing.
British Pound PRICE Today
The table below shows the percentage change of British Pound (GBP) against listed major currencies today. British Pound was the strongest against the Japanese Yen.
| USD | EUR | GBP | JPY | CAD | AUD | NZD | CHF | |
|---|---|---|---|---|---|---|---|---|
| USD | -0.01% | 0.03% | 0.16% | 0.02% | 0.13% | 0.10% | 0.02% | |
| EUR | 0.01% | 0.04% | 0.15% | 0.04% | 0.16% | 0.12% | 0.06% | |
| GBP | -0.03% | -0.04% | 0.12% | -0.01% | 0.10% | 0.06% | -0.03% | |
| JPY | -0.16% | -0.15% | -0.12% | -0.13% | -0.04% | -0.07% | -0.14% | |
| CAD | -0.02% | -0.04% | 0.01% | 0.13% | 0.11% | 0.07% | -0.02% | |
| AUD | -0.13% | -0.16% | -0.10% | 0.04% | -0.11% | -0.04% | -0.14% | |
| NZD | -0.10% | -0.12% | -0.06% | 0.07% | -0.07% | 0.04% | -0.08% | |
| CHF | -0.02% | -0.06% | 0.03% | 0.14% | 0.02% | 0.14% | 0.08% |
The heat map shows percentage changes of major currencies against each other. The base currency is picked from the left column, while the quote currency is picked from the top row. For example, if you pick the British Pound from the left column and move along the horizontal line to the US Dollar, the percentage change displayed in the box will represent GBP (base)/USD (quote).
FX option expiries for June 11 NY cut at 10:00 Eastern Time, via DTCC, can be found below
- EUR/USD: EUR amounts
- 1.0700 635m
- 1.0825 429m
- 1.0900 555m
- USD/CHF: USD amounts
- 0.8955 500m
- AUD/USD: AUD amounts
- 0.6620 923m
- USD/CAD: USD amounts
- 1.3600 477m
- 1.3650 645m
- 1.3700 824m
- USD/CNH trades with mild gains around 7.2650 on Tuesday.
- The stronger US employment data sparked a paring of bets for Fed rate cuts this year, boosting the USD broadly.
- China’s major state-owned banks spotted selling Dollars for Yuan in onshore FX market to stabilise Chinese currency, said Reuters.
- The US May CPI inflation data and Fed interest rate decision on Wednesday will be closely watched.
The USD/CNH pair trades flat near 7.2650 during the early European session on Tuesday. The onshore Yuan (CNH) bounces off the seven-month lows amid the foreign exchange (FX) intervention against a strengthening US Dollar (USD) from China’s major state-owned banks.
The Greenback edged higher in the previous sessions, supported by higher US Treasury bond yields after surprisingly robust US employment data last week. The US economy created far more jobs than expected in May, which dampened the expectation that the US Fed would start cutting interest rates in September. Traders have priced in a nearly 47% possibility of a Fed rate cut for September, down from 68% before the NFP data, according to the CME FedWatch tool. The US Nonfarm Payrolls (NFP) climbed 272,000 in May from a 165,000 increase (revised from 175,000) in April and came in above the forecast of 185,000.
The Chinese Yuan fell to a near seven-month low against the USD on Tuesday, prompting China’s state banks to sell Dollars for Yuan in the onshore spot FX market on Tuesday to keep the local currency from falling too quickly, according to Reuters.
Investors will closely watch the US May Consumer Price Index (CPI) data, which is due on Wednesday. The CPI inflation figure is estimated to show an increase of 3.4% YoY in May, while the core CPI is projected to rise 3.5% YoY in the same report period. Later on Wednesday, the Fed monetary policy meeting will be in the spotlight, with no change in rate expected. After the meeting, the Fed will update the Summary of Economic Projections (SEP). Market players will keep an eye on the tone of the meeting. The hawkish comments from Fed officials might further lift the USD broadly and create a tailwind for USD/CNH.
- GBP/USD could find resistance around the psychological level of 1.2800.
- The momentum indicator MACD suggests a confirmation of a bullish trend for the pair.
- The 21-day EMA at 1.2712 appears as the immediate support, followed by the lower boundary of the rising channel at 1.2700.
GBP/USD extends its gains for the second successive session ahead of employment data release from the United Kingdom (UK), trading around 1.2740 during the Asian session on Tuesday. The pair consolidates within the rising channel pattern on a daily chart, with the 14-day Relative Strength Index (RSI) positioned above the 50 level. indicating the bullish bias.
Additionally, the momentum indicator Moving Average Convergence Divergence (MACD) suggests a confirmation of the bullish trend as the MACD line is positioned above the centreline and shows divergence above the signal line.
The GBP/USD pair could find the key resistance around the psychological level of 1.2800. A breakthrough above this level could lead the pair to test the upper threshold of the rising channel around the level of 1.2970.
On the downside, the immediate support appears at the 21-day Exponential Moving Average (EMA) at 1.2712, followed by the lower boundary of the rising channel at 1.2700. A break below the latter could exert pressure on the GBP/USD pair to navigate the area around the throwback support at 1.2450.
GBP/USD: Daily Chart
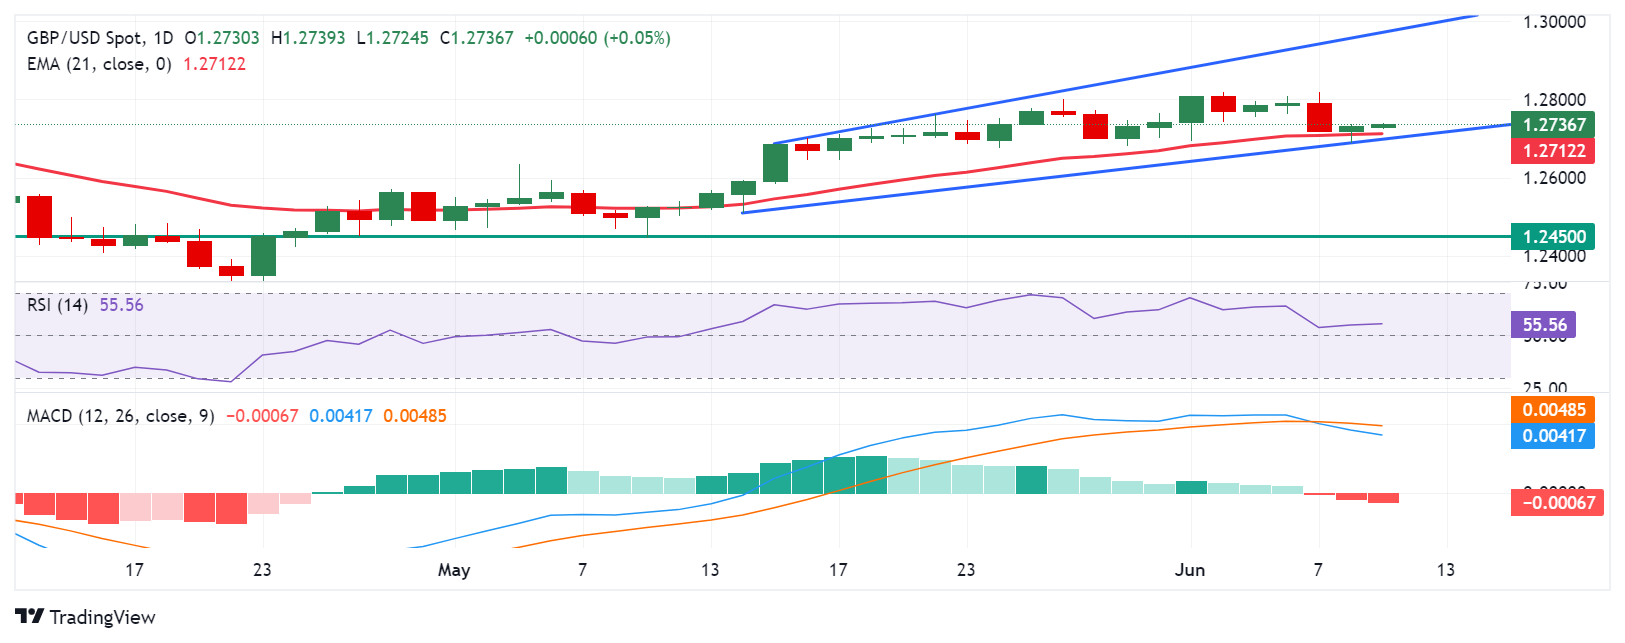
- The Japanese Yen edges lower as the BoJ is expected to maintain its current interest rates on Friday.
- The stable Japan’s equity market has undermined the JPY.
- The US Dollar holds ground due to reduced odds of the two Fed rate cuts in 2024.
The Japanese Yen (JPY) edges lower for the third consecutive trading day on Tuesday. The USD/JPY pair received support from a stronger US Dollar (USD) as investors remained cautious ahead of the Federal Reserve's (Fed) decision, along with the US inflation figures for May on Wednesday.
The Japanese Yen struggled after mixed data was released on Monday. Japan's Gross Domestic Product (GDP) Annualized showed that the economy contracted less than expected in the first quarter. Meanwhile, the GDP (QoQ) shrank in Q1, matching flash data. Additionally, the stable performance in the equity market has undermined the JPY. Investors are looking forward to the Bank of Japan’s (BoJ) policy decision on Friday.
The US Dollar Index (DXY), which measures the value of the US Dollar (USD) against six major currencies, maintains its position due to the reduced likelihood of the two Federal Reserve (Fed) interest rate cuts in 2024. The CME FedWatch Tool indicates that the likelihood of a Fed rate cut in September by at least 25 basis points has decreased to nearly 49.0%, down from 59.5% a week earlier.
Daily Digest Market Movers: Japanese Yen edges lower due to dovish BoJ
- Japan Finance Minister Shunichi Suzuki said on Tuesday it is important to continue efforts to achieve economic growth and attain fiscal health to retain confidence in the country's fiscal policy, per Reuters.
- Japan’s Gross Domestic Product (GDP) Annualized contracted by 1.8% in the first quarter, compared to a previous decline of 2.0%. The figures slightly exceeded market forecasts of a 1.9% decrease. Meanwhile, Japan's GDP (QoQ) shrank by 0.5%, in line with the flash data.
- Japan’s 10-year government bond yield moves above 1.02% ahead of the Bank of Japan’s (BoJ) policy meeting on Friday. The central bank is expected to maintain its current interest rates, while traders are closely watching for any potential reduction in the bank’s monthly bond purchases.
- Rabobank suggested in its report that the Federal Reserve may cut rates in September and December, more likely because of a deteriorating economy than because of progress on inflation. This is because they think that the US economy is entering a stagflationary phase with persistent inflation and an economic slowdown that is likely to end in a mild recession later this year.
- According to the US Bureau of Labor Statistics (BLS) on Friday, May's US Nonfarm Payrolls (NFP) increased by 272,000, up from 165,000 in April. The wage inflation, as measured by the Average Hourly Earnings, rose 4.1% YoY in May from 4.0% (revised from 3.9%) in April, above the market consensus of 3.9%.
- According to Reuters, while speaking to parliament on Thursday, Bank of Japan (BoJ) Governor Kazuo Ueda stated that inflation expectations are gradually rising but have yet to reach 2%. Ueda said, "We are still scrutinizing market developments since the March decision. As we proceed in exiting our massive monetary stimulus, it's appropriate to reduce bond purchases."
Technical Analysis: USD/JPY maintains a position around 157.00
USD/JPY trades around 157.20 on Tuesday. Analysis of the daily chart reveals a bullish inclination as the pair consolidates within an ascending channel pattern. Additionally, the 14-day Relative Strength Index (RSI) sits above the 50 level, indicating a propensity for upward momentum.
A significant hurdle is noticeable at the psychological level of 158.00. A breakthrough above this level could provide support, potentially guiding the USD/JPY pair toward the vicinity of the upper boundary near the level of 158.60. Further resistance is observed at 160.32, marking its highest level in over thirty years.
To the downside, the lower boundary of the ascending channel, approximately at the level of 154.90, stands out as the primary support, coinciding with the 50-day Exponential Moving Average (EMA) at 154.86. A breach below this level might intensify downward pressure on the USD/JPY pair, potentially directing it toward the throwback support area around 152.80.
USD/JPY: Daily Chart
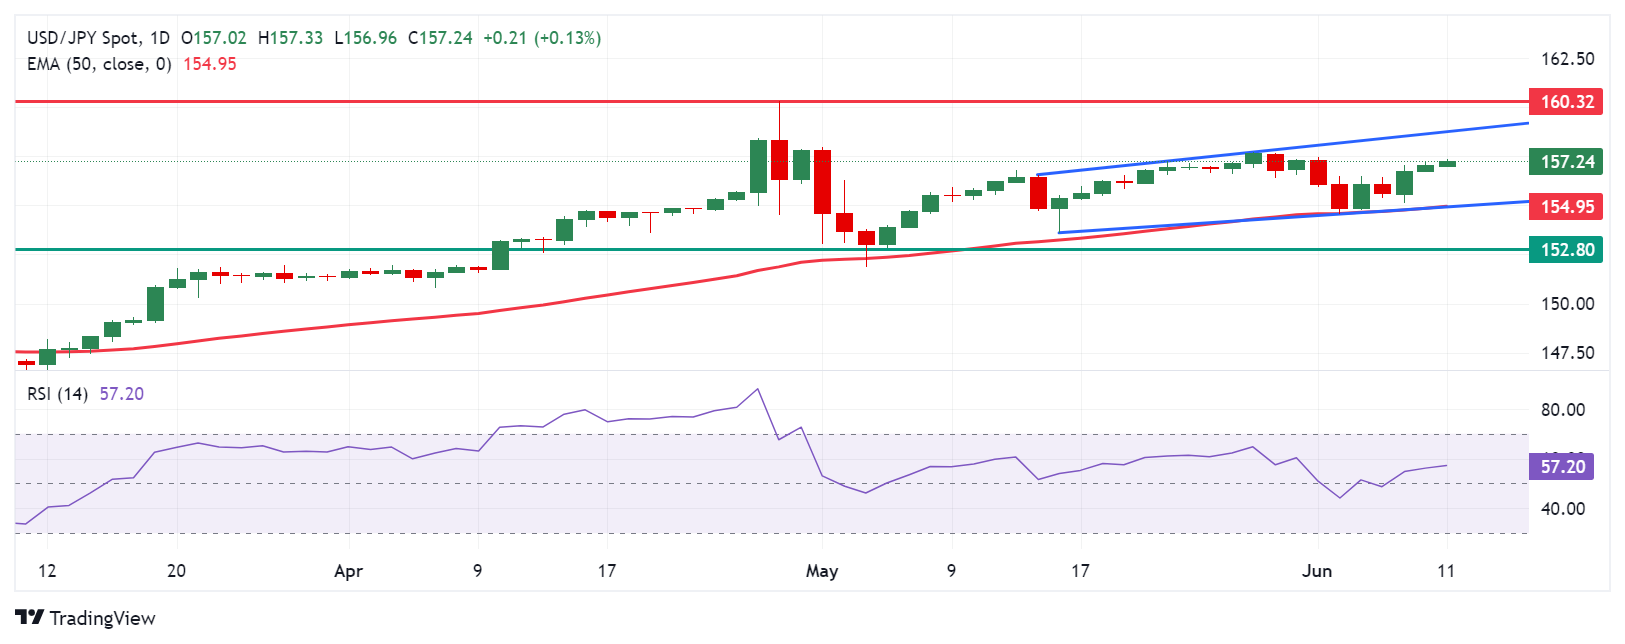
Japanese Yen price today
The table below shows the percentage change of the Japanese Yen (JPY) against listed major currencies today. Japanese Yen was the weakest against the Pound Sterling.
| USD | EUR | GBP | CAD | AUD | JPY | NZD | CHF | |
| USD | -0.05% | -0.07% | 0.03% | 0.16% | 0.11% | 0.11% | 0.01% | |
| EUR | 0.06% | -0.03% | 0.09% | 0.23% | 0.18% | 0.18% | 0.06% | |
| GBP | 0.08% | 0.03% | 0.11% | 0.25% | 0.20% | 0.21% | 0.08% | |
| CAD | -0.03% | -0.09% | -0.11% | 0.14% | 0.09% | 0.09% | -0.04% | |
| AUD | -0.17% | -0.22% | -0.25% | -0.14% | -0.04% | -0.05% | -0.17% | |
| JPY | -0.13% | -0.17% | -0.21% | -0.09% | 0.07% | -0.02% | -0.12% | |
| NZD | -0.11% | -0.16% | -0.20% | -0.08% | 0.06% | 0.01% | -0.11% | |
| CHF | 0.00% | -0.05% | -0.09% | 0.03% | 0.15% | 0.11% | 0.11% |
The heat map shows percentage changes of major currencies against each other. The base currency is picked from the left column, while the quote currency is picked from the top row. For example, if you pick the Euro from the left column and move along the horizontal line to the Japanese Yen, the percentage change displayed in the box will represent EUR (base)/JPY (quote).
Japanese Yen FAQs
The Japanese Yen (JPY) is one of the world’s most traded currencies. Its value is broadly determined by the performance of the Japanese economy, but more specifically by the Bank of Japan’s policy, the differential between Japanese and US bond yields, or risk sentiment among traders, among other factors.
One of the Bank of Japan’s mandates is currency control, so its moves are key for the Yen. The BoJ has directly intervened in currency markets sometimes, generally to lower the value of the Yen, although it refrains from doing it often due to political concerns of its main trading partners. The current BoJ ultra-loose monetary policy, based on massive stimulus to the economy, has caused the Yen to depreciate against its main currency peers. This process has exacerbated more recently due to an increasing policy divergence between the Bank of Japan and other main central banks, which have opted to increase interest rates sharply to fight decades-high levels of inflation.
The BoJ’s stance of sticking to ultra-loose monetary policy has led to a widening policy divergence with other central banks, particularly with the US Federal Reserve. This supports a widening of the differential between the 10-year US and Japanese bonds, which favors the US Dollar against the Japanese Yen.
The Japanese Yen is often seen as a safe-haven investment. This means that in times of market stress, investors are more likely to put their money in the Japanese currency due to its supposed reliability and stability. Turbulent times are likely to strengthen the Yen’s value against other currencies seen as more risky to invest in.
- EUR/USD struggles to lure buyers and is undermined by a combination of factors.
- Reduced Fed rate cut bets continue to lend support to the USD and cap the upside.
- Political uncertainty in Europe is further holding back the Euro bulls on the defensive.
The EUR/USD pair edges higher during the Asian session on Tuesday and currently trades around the 1.0765-1.0770 area, albeit lacks strong follow-through buying. Moreover, the fundamental backdrop and the technical setup warrant some caution before positioning for an extension of the previous day's modest rebound from the 1.0735-1.0730 region, or a one-month low.
The US Dollar (USD) remains well supported by growing acceptance that the Federal Reserve (Fed) might keep interest rates higher for longer, bolstered by the stronger-than-expected US jobs data released on Friday. Adding to this, French President Emmanuel Macron's decision to call snap elections later this month increased political uncertainty in the Eurozone's second-biggest economy, which might continue to undermine the shared currency. This, in turn, favors bearish traders and validates the near-term negative outlook for the EUR/USD pair.
From a technical perspective, the post-NFP fall below the 100-day Simple Moving Average (SMA) near the 1.0800 mark and a subsequent breakdown through the 200-day SMA adds credence to the negative outlook amid bearish oscillators on the daily chart. Hence, any further move up might still be seen as a selling opportunity and runs the risk of fizzling out rather quickly near the 1.0800 round figure. The said handle should act as a pivotal point, which if cleared decisively might prompt a short-covering rally towards the 1.0865-1.0870 supply zone en route to the 1.0900 mark.
On the flip side, the overnight swing low, around the 1.0735-1.0730 area now seems to protect the immediate downside ahead of the 1.0700 round figure. Some follow-through selling will be seen as a fresh trigger for bearish traders and drag the EUR/USD pair to the next relevant support near the 1.0650-1.0640 region. Spot prices could eventually slide towards testing the 1.0600 mark, or the YTD low touched in April.
EUR/USD daily chart
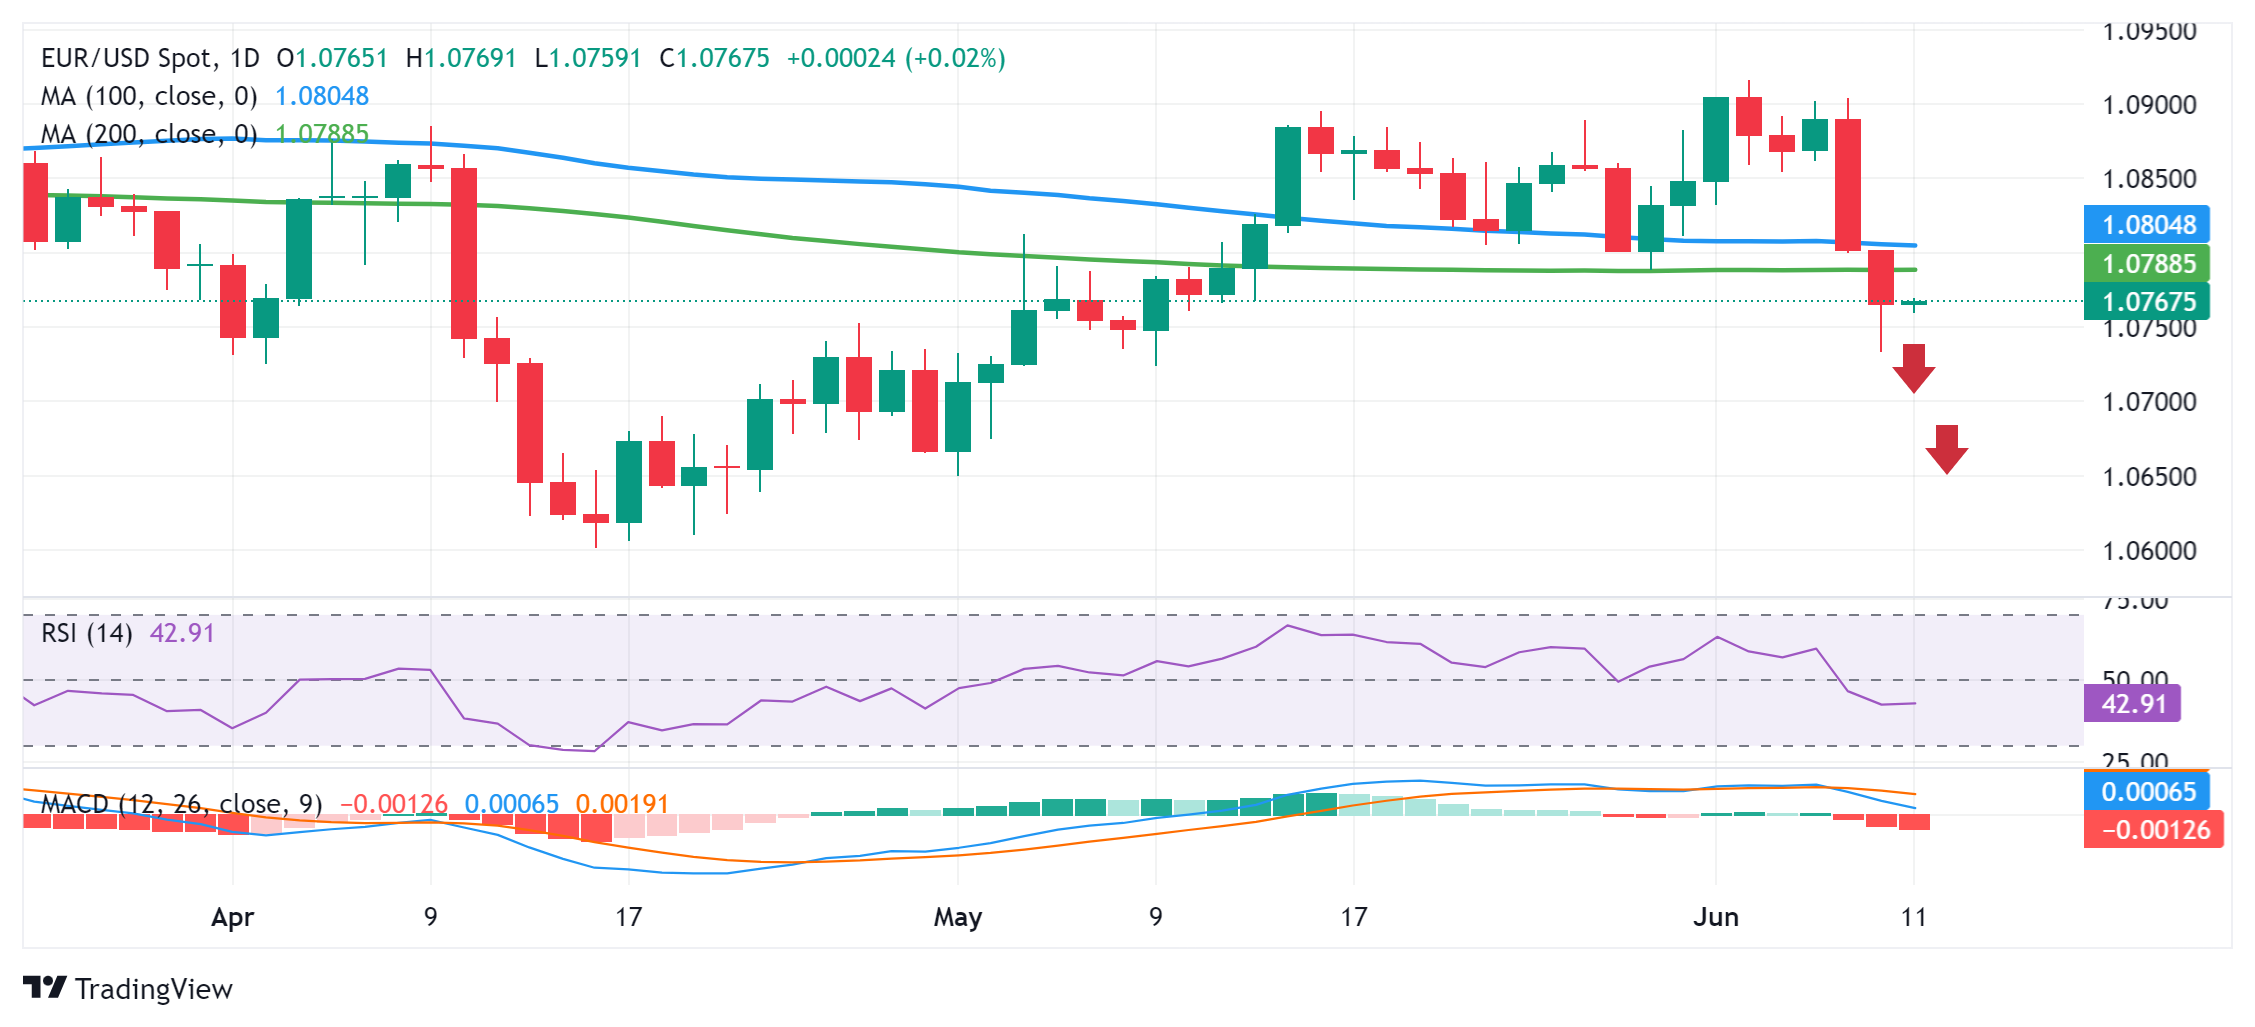
- The Australian Dollar loses ground due to risk aversion as Fed decision looms.
- The Australian Dollar may limit its downside as RBA expects to maintain higher rates in 2024.
- The US Dollar (USD) holds ground as the Fed expects to keep rates steady in the range of 5.25%-5.50% on Wednesday.
The Australian Dollar (AUD) edges lower on Tuesday as the US Dollar (USD) remains strong, bolstered by robust US jobs data for May. This development has reduced the odds of two Federal Reserve (Fed) interest rate cuts in 2024. The CME FedWatch Tool indicates that the likelihood of a Fed rate cut in September by at least 25 basis points has decreased to nearly 49.0%, down from 59.5% a week earlier.
The downside for the Australian Dollar may be limited as traders expect the Reserve Bank of Australia (RBA) to maintain higher rates this year. Last week, RBA Governor Michele Bullock indicated that the central bank is prepared to increase interest rates if the Consumer Price Index (CPI) does not return to the target range of 1%-3%, according to NCA NewsWire.
The US Dollar (USD) maintains its position despite two days of declining US Treasury yields. Investors have become cautious ahead of the Federal Reserve's policy decision and key US inflation data expected on Wednesday. The Fed is anticipated to keep interest rates steady in the range of 5.25%-5.50% as it aims to curb inflation toward its 2% target. The US headline and core CPI figures for May are estimated to show year-over-year increases of 3.4% and 3.5%, respectively.
Daily Digest Market Movers: Australian Dollar declines due to risk aversion
- Australia's NAB Business Confidence index dropped to -3 index points in May, marking the lowest figure in six months and turning negative for the first time since last November. Meanwhile, Business Conditions fell to 6 index points, slightly below the long-run average.
- On Tuesday, National Australia Bank (NAB) Chief Economist Alan Oster commented “There are warning signs on the outlook for growth but at the same time reasons to be very wary about the inflation outlook, and they expect the RBA to keep rates on hold for some time yet as they navigate through these contrasting risks,” as per the official transcript.
- Rabobank suggested in its report that the Federal Reserve may cut rates in September and December, more likely because of a deteriorating economy than because of progress on inflation. This is because they think that the US economy is entering a stagflationary phase with persistent inflation and an economic slowdown that is likely to end in a mild recession later this year.
- According to the US Bureau of Labor Statistics (BLS) on Friday, May's US Nonfarm Payrolls (NFP) increased by 272,000, up from 165,000 in April. The wage inflation, as measured by the Average Hourly Earnings, rose 4.1% YoY in May from 4.0% (revised from 3.9%) in April, above the market consensus of 3.9%.
- On Friday, Australia's Trade Balance widened to A$6,548 ($4,321.68) million MoM in May, exceeding the expected A$5,500 million and April's balance of A$5,024 million. Imports plunged by 7.2% MoM in May, swinging from April’s 4.2% increase. Exports shrank 2.5% following the previous decline of 0.6%.
Technical Analysis: Australian Dollar moves below 0.6600
The Australian Dollar trades around 0.6590 on Tuesday. Analysis of the daily chart indicates a weakening bullish bias for the AUD/USD pair, as it has dropped below the lower boundary of an ascending channel pattern. This is supported by the 14-day Relative Strength Index (RSI), which is slightly below the 50 level.
Key support levels are identified at 0.6550 and then 0.6500. A break below the latter could put pressure on the AUD/USD pair, pushing it toward the throwback support at 0.6470.
On the upside, the 21-day Exponential Moving Average (EMA) at 0.6625 serves as a key resistance, along with the lower boundary of the ascending channel around 0.6635. Re-entering the ascending channel pattern could strengthen the bullish bias, leading the AUD/USD pair to aim for the psychological level of 0.6700, followed by May’s high of 0.6714.
AUD/USD: Daily Chart
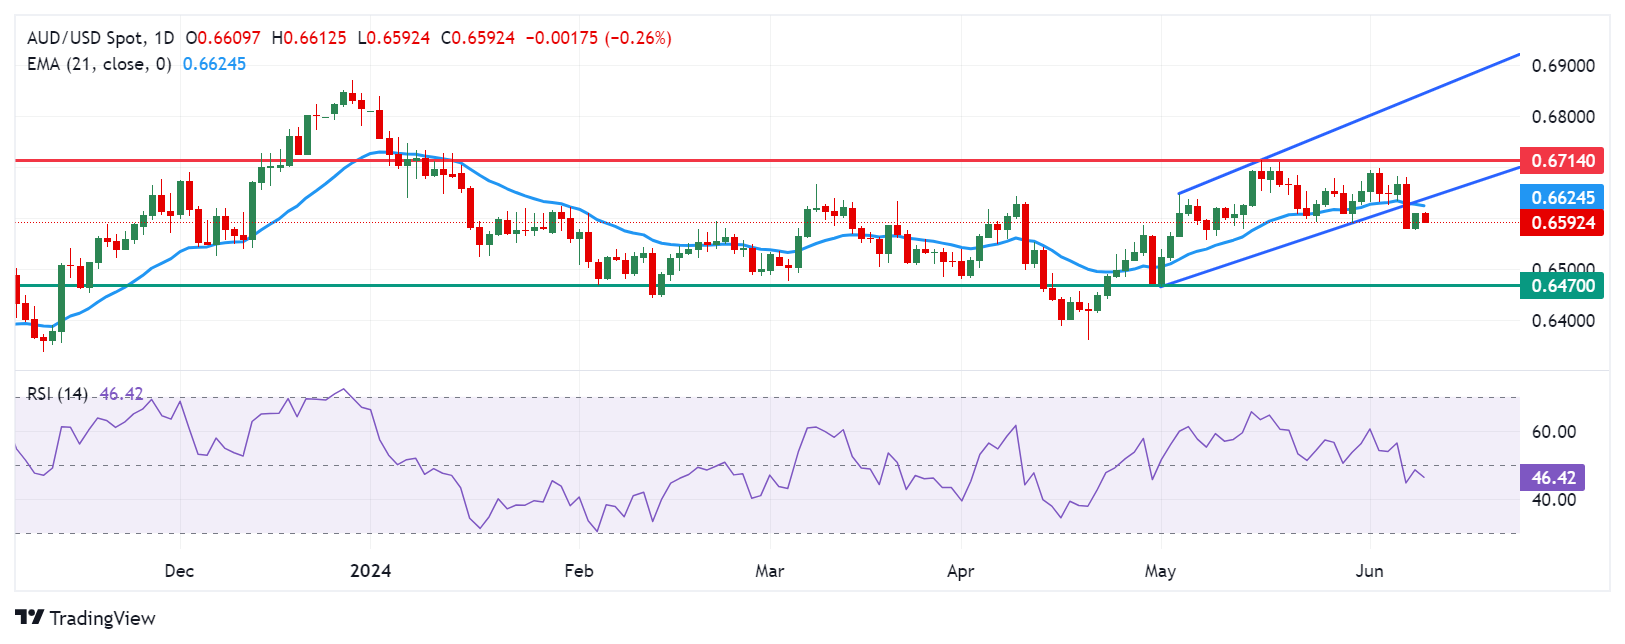
Australian Dollar price today
The table below shows the percentage change of the Australian Dollar (AUD) against listed major currencies today. The Australian Dollar was the weakest against the Euro.
| USD | EUR | GBP | CAD | AUD | JPY | NZD | CHF | |
| USD | -0.05% | -0.04% | 0.04% | 0.21% | 0.11% | 0.09% | 0.01% | |
| EUR | 0.04% | -0.02% | 0.09% | 0.28% | 0.17% | 0.14% | 0.05% | |
| GBP | 0.06% | 0.02% | 0.10% | 0.27% | 0.17% | 0.17% | 0.06% | |
| CAD | -0.03% | -0.08% | -0.08% | 0.19% | 0.08% | 0.06% | -0.03% | |
| AUD | -0.23% | -0.27% | -0.27% | -0.18% | -0.10% | -0.12% | -0.22% | |
| JPY | -0.12% | -0.16% | -0.17% | -0.07% | 0.12% | -0.03% | -0.12% | |
| NZD | -0.09% | -0.16% | -0.18% | -0.05% | 0.12% | 0.00% | -0.09% | |
| CHF | 0.00% | -0.05% | -0.06% | 0.04% | 0.20% | 0.10% | 0.10% |
The heat map shows percentage changes of major currencies against each other. The base currency is picked from the left column, while the quote currency is picked from the top row. For example, if you pick the Euro from the left column and move along the horizontal line to the Japanese Yen, the percentage change displayed in the box will represent EUR (base)/JPY (quote).
Australian Dollar FAQs
One of the most significant factors for the Australian Dollar (AUD) is the level of interest rates set by the Reserve Bank of Australia (RBA). Because Australia is a resource-rich country another key driver is the price of its biggest export, Iron Ore. The health of the Chinese economy, its largest trading partner, is a factor, as well as inflation in Australia, its growth rate and Trade Balance. Market sentiment – whether investors are taking on more risky assets (risk-on) or seeking safe-havens (risk-off) – is also a factor, with risk-on positive for AUD.
The Reserve Bank of Australia (RBA) influences the Australian Dollar (AUD) by setting the level of interest rates that Australian banks can lend to each other. This influences the level of interest rates in the economy as a whole. The main goal of the RBA is to maintain a stable inflation rate of 2-3% by adjusting interest rates up or down. Relatively high interest rates compared to other major central banks support the AUD, and the opposite for relatively low. The RBA can also use quantitative easing and tightening to influence credit conditions, with the former AUD-negative and the latter AUD-positive.
China is Australia’s largest trading partner so the health of the Chinese economy is a major influence on the value of the Australian Dollar (AUD). When the Chinese economy is doing well it purchases more raw materials, goods and services from Australia, lifting demand for the AUD, and pushing up its value. The opposite is the case when the Chinese economy is not growing as fast as expected. Positive or negative surprises in Chinese growth data, therefore, often have a direct impact on the Australian Dollar and its pairs.
Iron Ore is Australia’s largest export, accounting for $118 billion a year according to data from 2021, with China as its primary destination. The price of Iron Ore, therefore, can be a driver of the Australian Dollar. Generally, if the price of Iron Ore rises, AUD also goes up, as aggregate demand for the currency increases. The opposite is the case if the price of Iron Ore falls. Higher Iron Ore prices also tend to result in a greater likelihood of a positive Trade Balance for Australia, which is also positive of the AUD.
The Trade Balance, which is the difference between what a country earns from its exports versus what it pays for its imports, is another factor that can influence the value of the Australian Dollar. If Australia produces highly sought after exports, then its currency will gain in value purely from the surplus demand created from foreign buyers seeking to purchase its exports versus what it spends to purchase imports. Therefore, a positive net Trade Balance strengthens the AUD, with the opposite effect if the Trade Balance is negative.
- Indian Rupee trades sideways on Tuesday amid a cautious mood.
- Higher US bond yields and lower bets on Fed rate cuts might drag the INR lower against the US Dollar.
- The respective Indian and US Consumer Price Index (CPI) inflation data are due on Wednesday ahead of the Fed rate decision.
Indian Rupee (INR) remains flat on Tuesday despite the firmer US Dollar (USD). The rising US bond yields and lower bets on rate cuts from the Federal Reserve (Fed) after stronger-than-expected US employment data lift the Greenback for the time being. Nonetheless, the lower crude oil prices and easing political uncertainties surrounding India’s election might support the INR and cap the upside for the pair. Additionally, the Reserve Bank of India (RBI) is likely to intervene in the market to prevent the Indian Rupee from depreciating.
Market players will keep an eye on India’s Consumer Price Index (CPI), which is due on Wednesday. On the US docket, the May CPI will be released ahead of the Fed interest rate decision. After the Fed meeting, the US central bank will update the Summary of Economic Projections (SEP). Any hawkish message from Fed officials is likely to boost the Greenback against its rivals.
Daily Digest Market Movers: Indian Rupee awaits the fresh catalysts
- The INR closed at 83.5050 against the US Dollar, down 0.1% from its close at 83.3725 in the previous session.
- India is estimated to expand at 7% in FY25 as the post-pandemic recovery in the capital expenditure (capex) cycle, fueled by government spending and robust residential real estate demand, said Tanvee Gupta Jain, chief India economist at UBS Securities.
- "We expect the rupee to trade with a slight negative bias on strong US Dollar amid rising expectations of a delay in interest rate cut by the US Federal Reserve due to tight job market," said BNP Paribas Research Analyst Anuj Choudhary.
- Financial markets have priced in a nearly 47% chance of a Fed rate cut for the September meeting, down from 68% before the NFP data, according to the CME FedWatch tool.
- The US headline CPI figure is expected to show an increase of 3.4% YoY in May, while core CPI is estimated to rise 3.5% YoY in the same report period.
Technical analysis: USD/INR maintains a constructive outlook in the longer term
The Indian Rupee trades flat on the day. The USD/INR pair keeps the bullish vibe unchanged on the daily timeframe while holding above the descending trend channel upper boundary and the key 100-day Exponential Moving Average (EMA).
In the near term, the extended consolidation phase is likely to continue since the 14-day Relative Strength Index (RSI) hovers lower towards the 50-midline.
Any follow-through buying above 83.55, a high of June 5, will pave the way to 83.72, a high of April 17. Extended gains will see a rally to the 84.00 psychological level.
On the downside, the first downside target is seen at the 83.30–83.35 region, portraying the resistance-turned-support level and the 100-day EMA. A breach of this level will expose the 83.00 round level, followed by 82.78, a low of January 15.
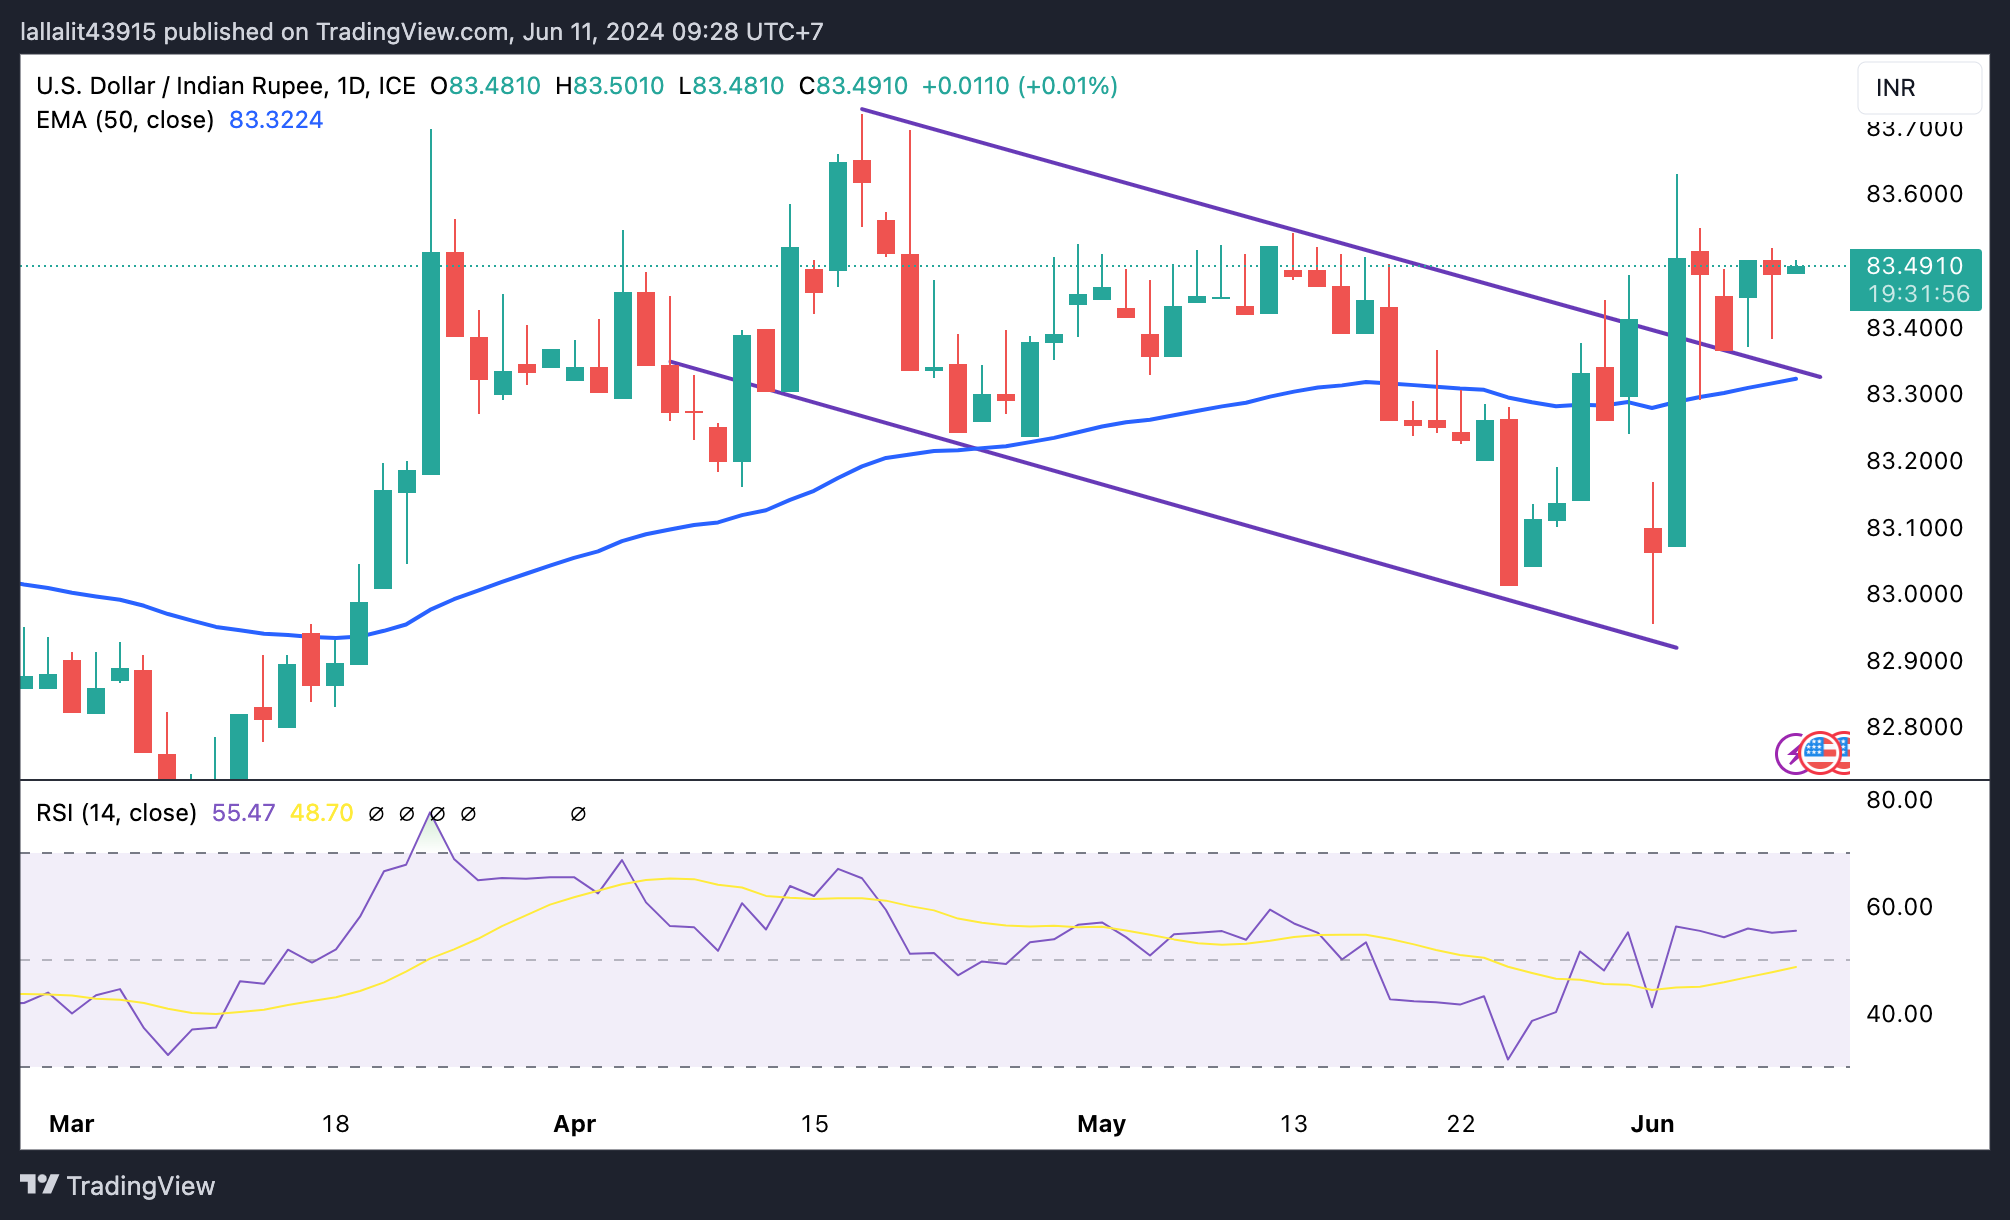
US Dollar price today
The table below shows the percentage change of US Dollar (USD) against listed major currencies today. US Dollar was the strongest against the Australian Dollar.
| USD | EUR | GBP | CAD | AUD | JPY | NZD | CHF | |
| USD | -0.05% | -0.04% | 0.04% | 0.21% | 0.11% | 0.09% | 0.01% | |
| EUR | 0.04% | -0.02% | 0.09% | 0.28% | 0.17% | 0.14% | 0.05% | |
| GBP | 0.06% | 0.02% | 0.10% | 0.27% | 0.17% | 0.17% | 0.06% | |
| CAD | -0.03% | -0.08% | -0.08% | 0.19% | 0.08% | 0.06% | -0.03% | |
| AUD | -0.23% | -0.27% | -0.27% | -0.18% | -0.10% | -0.12% | -0.22% | |
| JPY | -0.12% | -0.16% | -0.17% | -0.07% | 0.12% | -0.03% | -0.12% | |
| NZD | -0.09% | -0.16% | -0.18% | -0.05% | 0.12% | 0.00% | -0.09% | |
| CHF | 0.00% | -0.05% | -0.06% | 0.04% | 0.20% | 0.10% | 0.10% |
The heat map shows percentage changes of major currencies against each other. The base currency is picked from the left column, while the quote currency is picked from the top row. For example, if you pick the Euro from the left column and move along the horizontal line to the Japanese Yen, the percentage change displayed in the box will represent EUR (base)/JPY (quote).
Indian Rupee FAQs
The Indian Rupee (INR) is one of the most sensitive currencies to external factors. The price of Crude Oil (the country is highly dependent on imported Oil), the value of the US Dollar – most trade is conducted in USD – and the level of foreign investment, are all influential. Direct intervention by the Reserve Bank of India (RBI) in FX markets to keep the exchange rate stable, as well as the level of interest rates set by the RBI, are further major influencing factors on the Rupee.
The Reserve Bank of India (RBI) actively intervenes in forex markets to maintain a stable exchange rate, to help facilitate trade. In addition, the RBI tries to maintain the inflation rate at its 4% target by adjusting interest rates. Higher interest rates usually strengthen the Rupee. This is due to the role of the ‘carry trade’ in which investors borrow in countries with lower interest rates so as to place their money in countries’ offering relatively higher interest rates and profit from the difference.
Macroeconomic factors that influence the value of the Rupee include inflation, interest rates, the economic growth rate (GDP), the balance of trade, and inflows from foreign investment. A higher growth rate can lead to more overseas investment, pushing up demand for the Rupee. A less negative balance of trade will eventually lead to a stronger Rupee. Higher interest rates, especially real rates (interest rates less inflation) are also positive for the Rupee. A risk-on environment can lead to greater inflows of Foreign Direct and Indirect Investment (FDI and FII), which also benefit the Rupee.
Higher inflation, particularly, if it is comparatively higher than India’s peers, is generally negative for the currency as it reflects devaluation through oversupply. Inflation also increases the cost of exports, leading to more Rupees being sold to purchase foreign imports, which is Rupee-negative. At the same time, higher inflation usually leads to the Reserve Bank of India (RBI) raising interest rates and this can be positive for the Rupee, due to increased demand from international investors. The opposite effect is true of lower inflation.
- USD/JPY attracts buyers for the third straight day and draws support from a combination of factors.
- The BoJ policy uncertainty and a weak domestic economy continue to undermine the Japanese Yen.
- Reduced Fed rate cut bets lend support to the USD and contribute to the pair’s steady positive move.
The USD/JPY pair scales higher for the third straight day – also marking the fourth day of a positive move in the previous five – and climbs to over a one-week high, around the 157.25 area during the Asian session on Tuesday. Spot prices, however, remain below the 157.65-157.70 supply zone as traders seem reluctant ahead of this week's key US macro data and central bank event risks.
The US consumer inflation figures are due for release on Wednesday, which will be followed by the highly-anticipated FOMC monetary policy decision. Investors will look for cues about the likely timing when the Federal Reserve (Fed) will begin cutting interest rates. This, in turn, will play a key role in influencing the near-term US Dollar (USD) price dynamics and provide some meaningful impetus to the USD/JPY pair ahead of the Bank of Japan (BoJ) decision on Friday.
Market participants remain uncertain if the Japanese central bank will announce a reduction in the monthly government bond purchases amid a weaker economy. In fact, the Cabinet Office reported on Monday that contracted by 0.5% during the first quarter and by the 1.8% YoY rate. This, along with a stable performance around the equity markets, is seen undermining the Japanese Yen (JPY) and turning out to be a key factor acting as a tailwind for the USD/JPY pair.
The USD, on the other hand, stands tall near its highest level since May 14 touched on Monday and continues to draw support from growing acceptance that the Federal Reserve (Fed) might keep interest rates higher for longer. The expectations were fueled by the stronger-than-expected US jobs data released on Friday. This, in turn, favors the USD bulls and supports prospects for an extension of the USD/JPY pair's recent rise from the 50-day Simple Moving Average (SMA).
| Raw materials | Closed | Change, % |
|---|---|---|
| Silver | 29.712 | 1.98 |
| Gold | 2310.43 | 0.88 |
| Palladium | 907.65 | -0.37 |
- Gold price stalls the previous day’s recovery move from its lowest level in over a month.
- Reduced bets for a September Fed rate cut underpin the USD and cap the yellow metal.
- Renewed political uncertainty in Europe and geopolitical risks should limit the downside.
- Traders also seem reluctant ahead of the US CPI and the FOMC decision on Wednesday.
Gold price (XAU/USD) gained some positive traction on the first day of a new week and reversed a part of Friday's post-NFP slump to the $2,287-2,286 area, or over a one-month low. The uptick, however, remains capped in the wake of a bullish US Dollar (USD), which tends to undermine demand for the USD-denominated commodity. The stronger-than-expected US monthly jobs report released on Friday forced investors to scale back their bets for an imminent interest rate cut by the Federal Reserve (Fed) in September. This keeps the US Treasury bond yields elevated and assists the USD to stand tall near a multi-week high touched on Monday.
Furthermore, the People's Bank of China (PBoC) reported no change to its gold holdings in May, marking an end to its one-and-a-half-year-long buying spree. This further contributes to keeping a lid on the Gold price, though political uncertainty in Europe should help limit the downside. Traders might also prefer to wait on the sidelines ahead of this week's release of the latest US consumer inflation figures and the highly-anticipated FOMC monetary policy decision on Wednesday. Investors will look for cues about the likely timing when the Fed will begin cutting rates, which will determine the near-term trajectory for the non-yielding yellow metal.
Daily Digest Market Movers: Gold price struggles to lure buyers amid hawkish Fed expectations, bullish USD
- The upbeat US Nonfarm Payrolls released on Friday fueled speculations that the Federal Reserve will keep rates higher for longer and turn out to be a key factor acting as a headwind for the non-yielding Gold price.
- The chances of a rate cut in September fell to around 50% following the US jobs data and the markets are now pricing in just one cut of 25 basis points this year, either at the November or December policy meeting.
- The yield on the benchmark 10-year US government bond holds steady above 4.45%, while the yield on the rate-sensitive two-year US Treasury note remains close to 5.0%, which, in turn, is underpinning the US Dollar.
- The USD Index, which tracks the Greenback against a basket of currencies, stands tall near its highest level since May 14 set on Monday and contributes to capping the upside for the USD-denominated commodity.
- French President Emmanuel Macron's decision to call snap elections later this month increased political uncertainty in the Eurozone's second-biggest economy and could lend support to the XAU/USD.
- Traders also seem reluctant and keenly await this week's key US macro data – the latest consumer inflation figures – and the crucial FOMC decision on Wednesday before placing aggressive directional bets.
Technical Analysis: Gold price bears have the upper hand below 50-day SMA, $2,285 is the last point of defense
From a technical perspective, Friday's breakdown below the 50-day Simple Moving Average (SMA) was seen as a fresh trigger for bearish traders against the backdrop of negative oscillators on the daily chart. Some follow-through selling below the $2,285 horizontal support will reaffirm the bearish outlook and drag the Gold price to the next relevant support near the $2,254-2,253 region. The downward trajectory could extend further towards the $2,225-2,220 area en route to the $2,200 round figure.
On the flip side, the $2,325 horizontal zone is likely to act as an immediate strong barrier ahead of the 50-day SMA support breakpoint, currently pegged near the $2,343-2,344 region. This is followed by the $2,360-2,362 supply zone, which if cleared should allow the Gold price to retest last week’s swing high, around the $2,387-2,388 area and reclaim the $2,400 mark. A sustained strength beyond the latter will negate any near-term negative bias and pave the way for a further appreciating move in the near term.
Gold FAQs
Gold has played a key role in human’s history as it has been widely used as a store of value and medium of exchange. Currently, apart from its shine and usage for jewelry, the precious metal is widely seen as a safe-haven asset, meaning that it is considered a good investment during turbulent times. Gold is also widely seen as a hedge against inflation and against depreciating currencies as it doesn’t rely on any specific issuer or government.
Central banks are the biggest Gold holders. In their aim to support their currencies in turbulent times, central banks tend to diversify their reserves and buy Gold to improve the perceived strength of the economy and the currency. High Gold reserves can be a source of trust for a country’s solvency. Central banks added 1,136 tonnes of Gold worth around $70 billion to their reserves in 2022, according to data from the World Gold Council. This is the highest yearly purchase since records began. Central banks from emerging economies such as China, India and Turkey are quickly increasing their Gold reserves.
Gold has an inverse correlation with the US Dollar and US Treasuries, which are both major reserve and safe-haven assets. When the Dollar depreciates, Gold tends to rise, enabling investors and central banks to diversify their assets in turbulent times. Gold is also inversely correlated with risk assets. A rally in the stock market tends to weaken Gold price, while sell-offs in riskier markets tend to favor the precious metal.
The price can move due to a wide range of factors. Geopolitical instability or fears of a deep recession can quickly make Gold price escalate due to its safe-haven status. As a yield-less asset, Gold tends to rise with lower interest rates, while higher cost of money usually weighs down on the yellow metal. Still, most moves depend on how the US Dollar (USD) behaves as the asset is priced in dollars (XAU/USD). A strong Dollar tends to keep the price of Gold controlled, whereas a weaker Dollar is likely to push Gold prices up.
- WTI price gained ground due to rising expectations of increased fuel demand this summer.
- Goldman Sachs analysts anticipated strong summer transport demand will lead to a third-quarter Oil market deficit of 1.3 million barrels per day.
- Crude Oil prices may struggle as the Fed expects to keep higher rates for longer.
West Texas Intermediate (WTI) Oil price hovers around $77.50 per barrel during the Asian hours on Tuesday. Crude oil prices are bolstered by expectations of increased fuel demand this summer. According to Reuters, analysts at the energy consulting firm Gelber and Associates noted, “Futures are higher as expectations of summer demand are supportive of prices despite the broader macro landscape remaining less optimistic than weeks previous."
Furthermore, Goldman Sachs analysts indicated in a note that they anticipate strong summer transport demand will lead to a third-quarter Oil market deficit of 1.3 million barrels per day (bpd).
However, a strong US jobs report from the previous week has reinforced the Federal Reserve's hawkish stance on monetary policy. The Fed is expected to maintain higher borrowing costs for an extended period, which could slow economic growth and reduce demand for Oil. Additionally, a stronger US Dollar (USD) can negatively impact Oil demand by making USD-denominated commodities like Oil more expensive for holders of other currencies.
The CME FedWatch Tool indicates that the likelihood of a Fed rate cut in September by at least 25 basis points has decreased to nearly 49.0%, down from 59.5% a week earlier.
Additionally, concerns over a potential Oil supply surplus have increased as the Organization of the Petroleum Exporting Countries and its allies (OPEC+) decided to gradually unwind voluntary cuts from eight member countries starting in October. By December, over 500,000 barrels per day (bpd) are expected to re-enter the market, with a total of 1.8 million bpd returning by June 2025.
The People’s Bank of China (PBoC) set the USD/CNY central rate for the trading session ahead on Tuesday at 7.1135, as against the previous day's fix of 7.1106 and 7.2724 Reuters estimates.
- USD/CAD holds positive ground near 1.3765 amid firmer US Dollar.
- US Fed is expected to maintain interest rates steady in the range of 5.25%-5.50 in its June meeting on Wednesday
- The lower crude oil prices weigh on the commodity-linked Loonie, lifting the pair higher.
The USD/CAD pair trades in the positive territory around 1.3765 amid the renewed US Dollar (USD) demand on Tuesday during the early Asian trading hours. Meanwhile, the decline in crude oil prices undermines the commodity-linked Loonie and creates a tailwind for USD/CAD.
The robust US employment data for May pared back rate cut expectations from the Federal Open Market Commit (FOMC). Traders are now pricing in nearly 47% chances of a rate cut for the September meeting, down from 68% before the NFP data, according to the CME FedWatch tool. At the June monetary meeting on Wednesday, the US Federal Reserve (Fed) is expected to maintain interest rates steady in the range of 5.25%-5.50 to curb inflation towards the Fed’s 2% target.
The US Consumer Price Index (CPI) inflation data on Wednesday might offer some hints about the inflation trajectory and future monetary policy outlook. The US headline and CPI figure are estimated to show an increase of 3.4% YoY abd e 3.5% YoY in May.
Meanwhile, Crude Oil prices edge lower as OPEC ministers said that they would not increase supply if prices remained weak. It's worth noting that Canada is the dominant source of crude oil imports for the United. States and higher oil prices generally underpin the Canadian Dollar (CAD).
Japanese Finance Minister Shunichi Suzuki said on Tuesday that it’s important to continue efforts to achieve fiscal health. Suzuki stated that he’s interested in discussing Russia's sanctions at G7 summit, adding usage of frozen Russian assets needs to be in
Market reaction
At the time of writing, USD/PY is trading 0.09% higher on the day to trade at 157.17.
Japanese Yen FAQs
The Japanese Yen (JPY) is one of the world’s most traded currencies. Its value is broadly determined by the performance of the Japanese economy, but more specifically by the Bank of Japan’s policy, the differential between Japanese and US bond yields, or risk sentiment among traders, among other factors.
One of the Bank of Japan’s mandates is currency control, so its moves are key for the Yen. The BoJ has directly intervened in currency markets sometimes, generally to lower the value of the Yen, although it refrains from doing it often due to political concerns of its main trading partners. The current BoJ ultra-loose monetary policy, based on massive stimulus to the economy, has caused the Yen to depreciate against its main currency peers. This process has exacerbated more recently due to an increasing policy divergence between the Bank of Japan and other main central banks, which have opted to increase interest rates sharply to fight decades-high levels of inflation.
The BoJ’s stance of sticking to ultra-loose monetary policy has led to a widening policy divergence with other central banks, particularly with the US Federal Reserve. This supports a widening of the differential between the 10-year US and Japanese bonds, which favors the US Dollar against the Japanese Yen.
The Japanese Yen is often seen as a safe-haven investment. This means that in times of market stress, investors are more likely to put their money in the Japanese currency due to its supposed reliability and stability. Turbulent times are likely to strengthen the Yen’s value against other currencies seen as more risky to invest in.
| Index | Change, points | Closed | Change, % |
|---|---|---|---|
| NIKKEI 225 | 354.23 | 39038.16 | 0.92 |
| KOSPI | -21.5 | 2701.17 | -0.79 |
| DAX | -62.38 | 18494.89 | -0.34 |
| CAC 40 | -107.82 | 7893.98 | -1.35 |
| Dow Jones | 69.05 | 38868.04 | 0.18 |
| S&P 500 | 13.8 | 5360.79 | 0.26 |
| NASDAQ Composite | 59.4 | 17192.53 | 0.35 |
| Pare | Closed | Change, % |
|---|---|---|
| AUDUSD | 0.6609 | 0.46 |
| EURJPY | 169.004 | 0.05 |
| EURUSD | 1.07639 | -0.11 |
| GBPJPY | 199.839 | 0.17 |
| GBPUSD | 1.27285 | 0.02 |
| NZDUSD | 0.61269 | 0.41 |
| USDCAD | 1.37579 | -0.06 |
| USDCHF | 0.89619 | -0.11 |
| USDJPY | 157.001 | 0.16 |
- NZD/USD edges lower near 0.6130 in Tuesday’s early Asian session.
- Any signs of US inflation data improvement might trigger the Fed to cut rates in the coming months.
- The RBNZ’s hawkish stance might continue to support the Kiwi in the near term.
The NZD/USD pair trades on a softer note around 0.6130 on Tuesday during the early Asian session. The rebound of the USD Index (DXY) above the 105.00 barrier drags the pair lower. Amid the absence of top-tier economic data from New Zealand, the NZD/USD pair will be influenced by the USD. The US Consumer Price Index (CPI) inflation data and the Federal Reserve (Fed) monetary policy meeting will take center stage on Wednesday.
Inflation in the United States remained uncomfortably high in the first three months of this year, making it more complicated for the US Federal Reserve (Fed) to cut the interest rate. Even though CPI inflation eased in April, Fed officials prefer to wait for more evidence before cutting their benchmark rate. If the May inflation report on Wednesday shows further signs of improvement, it might trigger the Fed to ease policy in the coming months. Rate cuts would eventually lead to the weakening of the US Dollar (USD), which might create a tailwind for NZD/USD.
However, the strong employment report last week raised the bet that the Fed might provide a more hawkish policy update and signal a delay to rate-cut plans as inflation remains elevated. MUFG analysts said "the power of the U.S. jobs data ... reinforces the risk of the Fed remaining on the sidelines for longer.”
On the other hand, the hawkish stance from the Reserve Bank of New Zealand (RBNZ) might continue to lift the New Zealand Dollar (NZD) against the USD. The New Zealand central bank is expected to maintain its current policy stance until at least mid-2025, aiming for a comprehensive evaluation of data.


© 2000-2026. Bản quyền Teletrade.
Trang web này được quản lý bởi Teletrade D.J. LLC 2351 LLC 2022 (Euro House, Richmond Hill Road, Kingstown, VC0100, St. Vincent and the Grenadines).
Thông tin trên trang web không phải là cơ sở để đưa ra quyết định đầu tư và chỉ được cung cấp cho mục đích làm quen.
Giao dịch trên thị trường tài chính (đặc biệt là giao dịch sử dụng các công cụ biên) mở ra những cơ hội lớn và tạo điều kiện cho các nhà đầu tư sẵn sàng mạo hiểm để thu lợi nhuận, tuy nhiên nó mang trong mình nguy cơ rủi ro khá cao. Chính vì vậy trước khi tiến hành giao dịch cần phải xem xét mọi mặt vấn đề chấp nhận tiến hành giao dịch cụ thể xét theo quan điểm của nguồn lực tài chính sẵn có và mức độ am hiểu thị trường tài chính.
Sử dụng thông tin: sử dụng toàn bộ hay riêng biệt các dữ liệu trên trang web của công ty TeleTrade như một nguồn cung cấp thông tin nhất định. Việc sử dụng tư liệu từ trang web cần kèm theo liên kết đến trang teletrade.vn. Việc tự động thu thập số liệu cũng như thông tin từ trang web TeleTrade đều không được phép.
Xin vui lòng liên hệ với pr@teletrade.global nếu có câu hỏi.
ngân hàng