LƯU Ý: Tài liệu trong nguồn cấp dữ liệu tin tức và phân tích được cập nhật tự động, tải lại trang có thể làm chậm quá trình xuất hiện tài liệu mới. Để nhận được tài liệu nhanh chóng, chúng tôi khuyên bạn nên luôn mở nguồn cấp tin tức.
Sort by topic
tất cả tin tức
Sắp xếp theo cặp tiền tệ
11.02.2025
23:51
Japan Money Supply M2+CD (YoY) unchanged at 1.3% in January
US President Donald's trade adviser Peter Navarro said late Tuesday that Australia was "killing the aluminium market", the day after Trump signed executive orders for import tariffs on some metals. Australia hopes to secure exemptions to the new taxes on steel and aluminium.
Trump on Monday signed executive orders, which will see 25% taxes placed on imports of steel and aluminium to the United States from March 12.
Market reaction
At the press time, the AUD/USD pair is down 0.07% on the day to trade at 0.6292.
Tariffs FAQs
Tariffs are customs duties levied on certain merchandise imports or a category of products. Tariffs are designed to help local producers and manufacturers be more competitive in the market by providing a price advantage over similar goods that can be imported. Tariffs are widely used as tools of protectionism, along with trade barriers and import quotas.
Although tariffs and taxes both generate government revenue to fund public goods and services, they have several distinctions. Tariffs are prepaid at the port of entry, while taxes are paid at the time of purchase. Taxes are imposed on individual taxpayers and businesses, while tariffs are paid by importers.
There are two schools of thought among economists regarding the usage of tariffs. While some argue that tariffs are necessary to protect domestic industries and address trade imbalances, others see them as a harmful tool that could potentially drive prices higher over the long term and lead to a damaging trade war by encouraging tit-for-tat tariffs.
During the run-up to the presidential election in November 2024, Donald Trump made it clear that he intends to use tariffs to support the US economy and American producers. In 2024, Mexico, China and Canada accounted for 42% of total US imports. In this period, Mexico stood out as the top exporter with $466.6 billion, according to the US Census Bureau. Hence, Trump wants to focus on these three nations when imposing tariffs. He also plans to use the revenue generated through tariffs to lower personal income taxes.
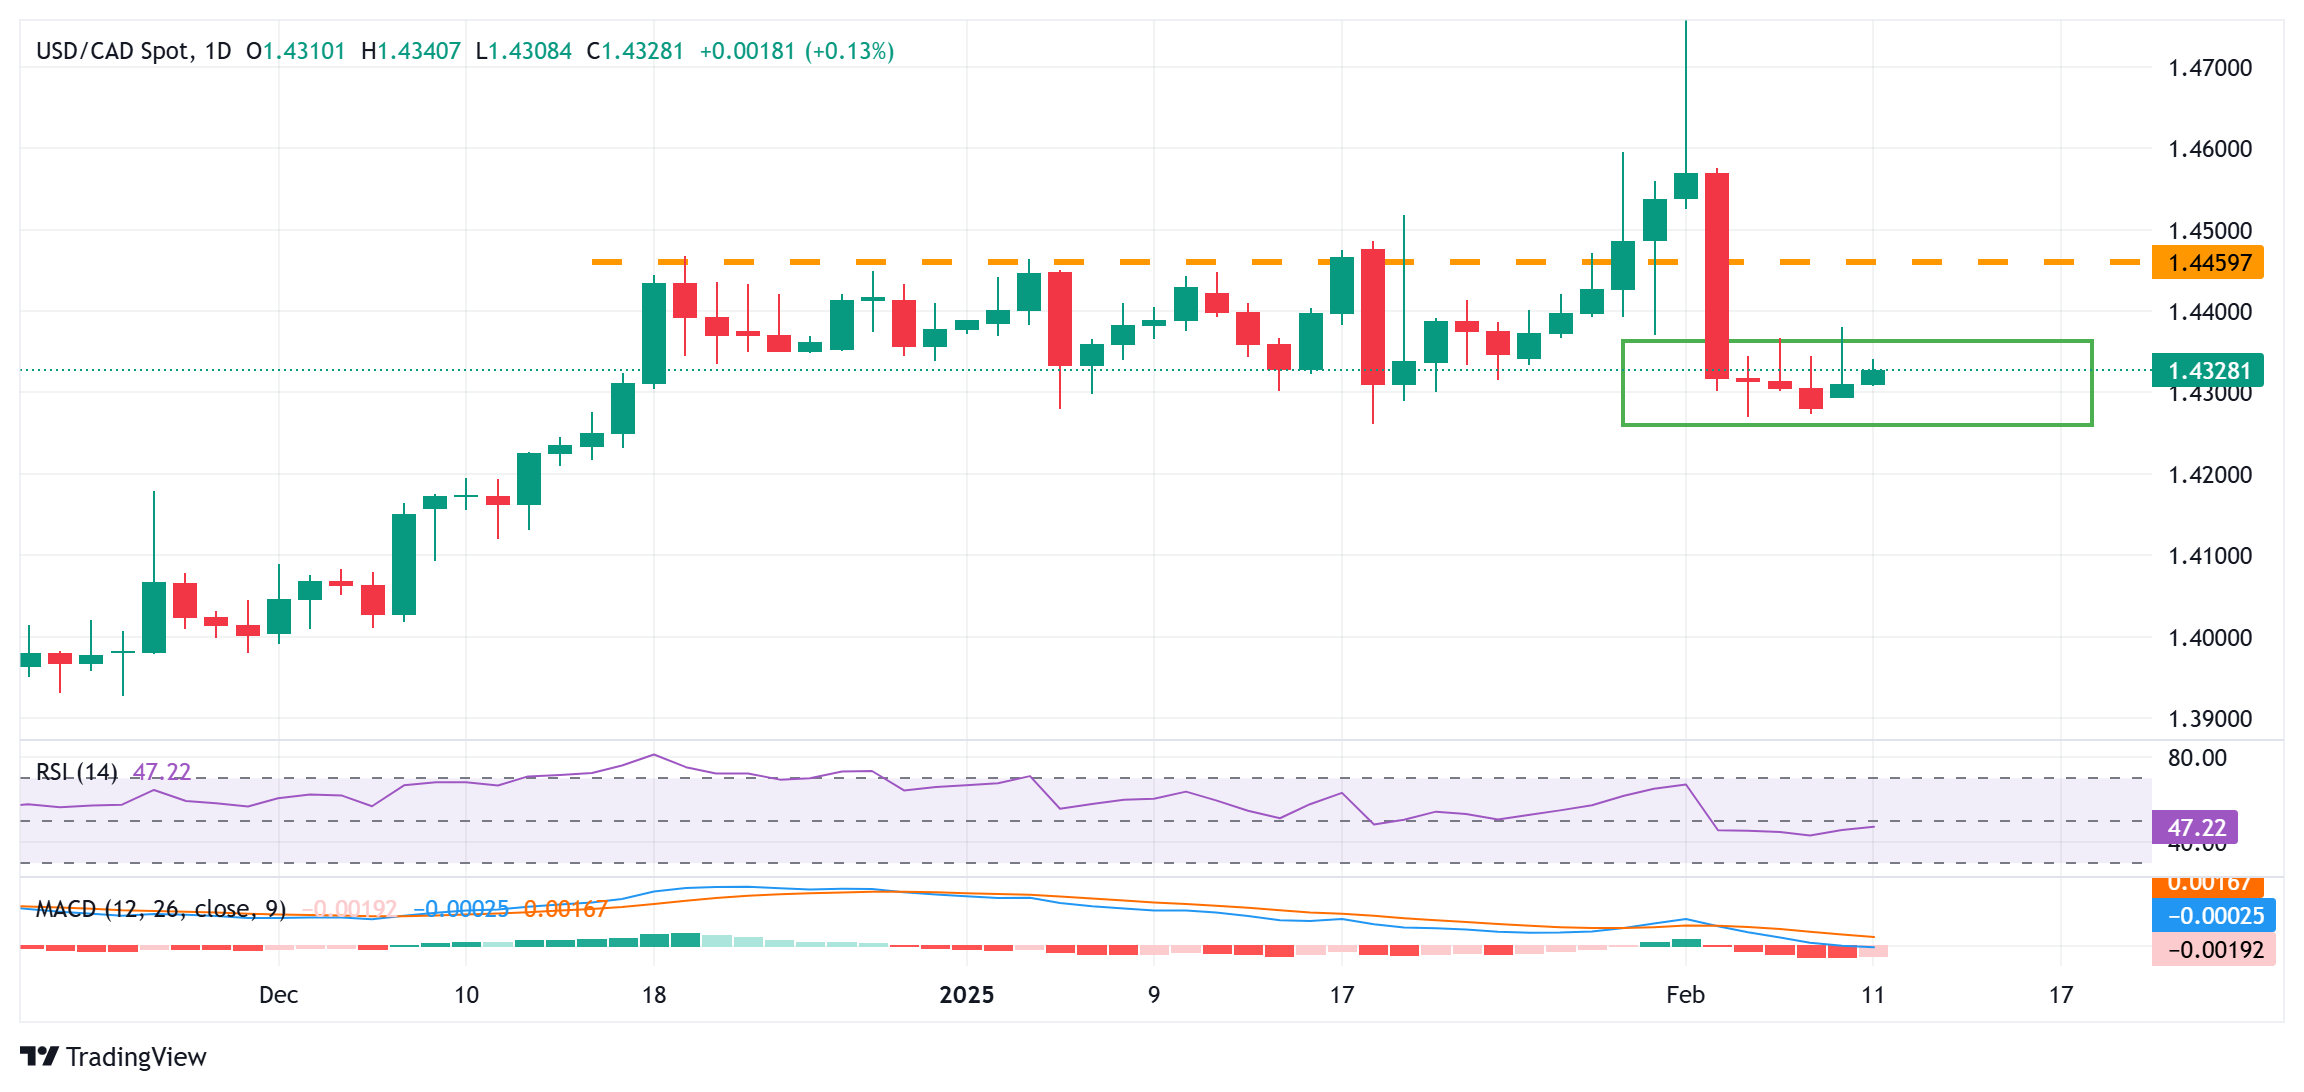
USD/CAD softens to near 1.4280 in Tuesday’s late American session.
Fed's Powell said the central bank is in no rush to cut rates again.
White House said 25% steel tariffs would stack on top of other levies.
The USD/CAD pair trades with mild negative bias around 1.4280 during the late American session on Tuesday. The US Dollar (USD) weakens as Federal Reserve (Fed) Chair Jerome Powell’s testimony before Congress wasn’t as hawkish as expected. Later on Wednesday, the release of the US Consumer Price Index (CPI) inflation data will take center stage.
In his semi-annual report to Congress, Fed’s Powell said the Fed officials “do not need to be in a hurry" to cut interest rates due to strength in the job market and solid economic growth. He added that US President Donald Trump's tariff policies could put more upward pressure on prices, making it harder for the central bank to lower rates. On Monday, Trump ordered 25% tariffs on all imported steel and aluminum. He's also threatened widespread taxes on other imports.
Trump stated on Sunday that he plans to impose 25% tariffs on all steel and aluminum imports into the US, on top of existing metals duties. Traders will closely monitor the developments surrounding trade tariff policies. The concerns about the impact of any new trade levies could weigh on the commodities-linked Loonie as Canada is a major exporter of steel and aluminium to the US.
Canadian Dollar FAQs
The key factors driving the Canadian Dollar (CAD) are the level of interest rates set by the Bank of Canada (BoC), the price of Oil, Canada’s largest export, the health of its economy, inflation and the Trade Balance, which is the difference between the value of Canada’s exports versus its imports. Other factors include market sentiment – whether investors are taking on more risky assets (risk-on) or seeking safe-havens (risk-off) – with risk-on being CAD-positive. As its largest trading partner, the health of the US economy is also a key factor influencing the Canadian Dollar.
The Bank of Canada (BoC) has a significant influence on the Canadian Dollar by setting the level of interest rates that banks can lend to one another. This influences the level of interest rates for everyone. The main goal of the BoC is to maintain inflation at 1-3% by adjusting interest rates up or down. Relatively higher interest rates tend to be positive for the CAD. The Bank of Canada can also use quantitative easing and tightening to influence credit conditions, with the former CAD-negative and the latter CAD-positive.
The price of Oil is a key factor impacting the value of the Canadian Dollar. Petroleum is Canada’s biggest export, so Oil price tends to have an immediate impact on the CAD value. Generally, if Oil price rises CAD also goes up, as aggregate demand for the currency increases. The opposite is the case if the price of Oil falls. Higher Oil prices also tend to result in a greater likelihood of a positive Trade Balance, which is also supportive of the CAD.
While inflation had always traditionally been thought of as a negative factor for a currency since it lowers the value of money, the opposite has actually been the case in modern times with the relaxation of cross-border capital controls. Higher inflation tends to lead central banks to put up interest rates which attracts more capital inflows from global investors seeking a lucrative place to keep their money. This increases demand for the local currency, which in Canada’s case is the Canadian Dollar.
Macroeconomic data releases gauge the health of the economy and can have an impact on the Canadian Dollar. Indicators such as GDP, Manufacturing and Services PMIs, employment, and consumer sentiment surveys can all influence the direction of the CAD. A strong economy is good for the Canadian Dollar. Not only does it attract more foreign investment but it may encourage the Bank of Canada to put up interest rates, leading to a stronger currency. If economic data is weak, however, the CAD is likely to fall.
EUR/USD gained 0.5% after Greenback flows eased back on Tuesday.
European economic data remains thin, and Fed Chair Powell sold a steady rate plan.
US CPI and PPI inflation figures are due through the midweek sessions.
EUR/USD snapped a three-day losing streak, recovering ground and rebounding to just north of 1.0350 as broad-market flows reversed out of the safe haven Greenback and investor sentiment broadly rebounded. Investors are shrugging off US President Donald Trump’s latest tariff threats, and Federal Reserve (Fed) Chair Jerome Powell reiterated the Fed’s dedication to following a data-dependent approach in the face of volatile, inconsistent trade policy messaging from the Trump administration.
European data releases are overall tepid this week. German final Harmonized Index of Consumer Prices for the year ended January are due on Thursday, alongside pan-EU Gross Domestic Product figures for the fourth quarter slated for Friday. Neither datapoint is expected to move the needle very much, as neither figure is a preliminary print and European data tends to be well-forecast and priced in ahead of the release schedule.
US Consumer Price Index (CPI) inflation will be the dominant print on Wednesday. Headline US CPI inflation is expected to hold at 2.9% YoY, while core CPI inflation is forecast to tick down to 3.1% versus the last print of 3.2%. US Producer Price Index (PPI) inflation follows up on Thursday, with core PPI business-level inflation expected to cool slightly to 3.3% YoY from 3.5%.
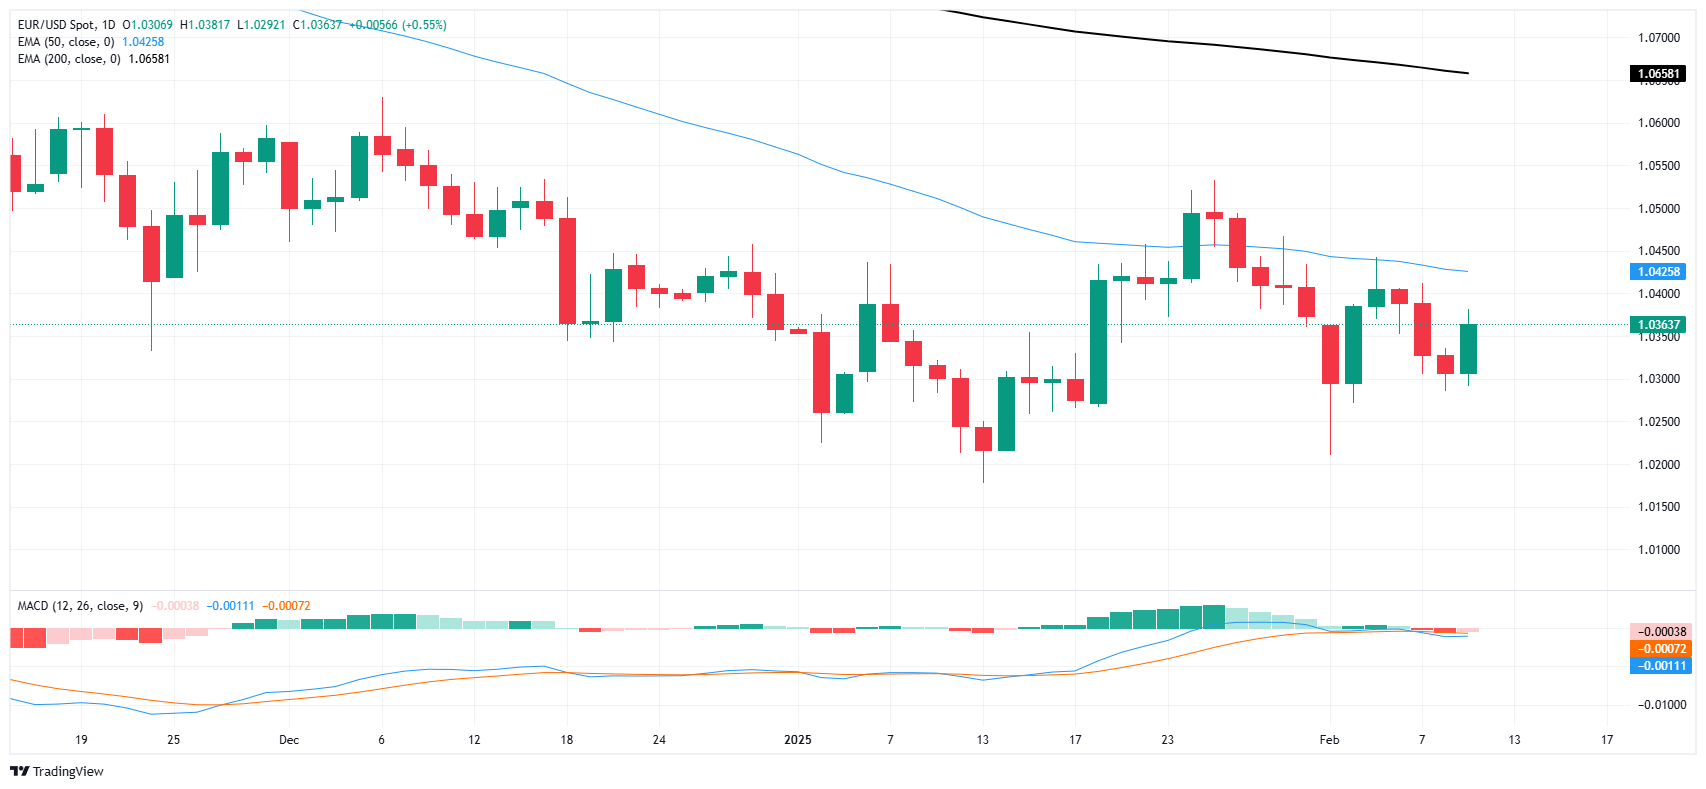
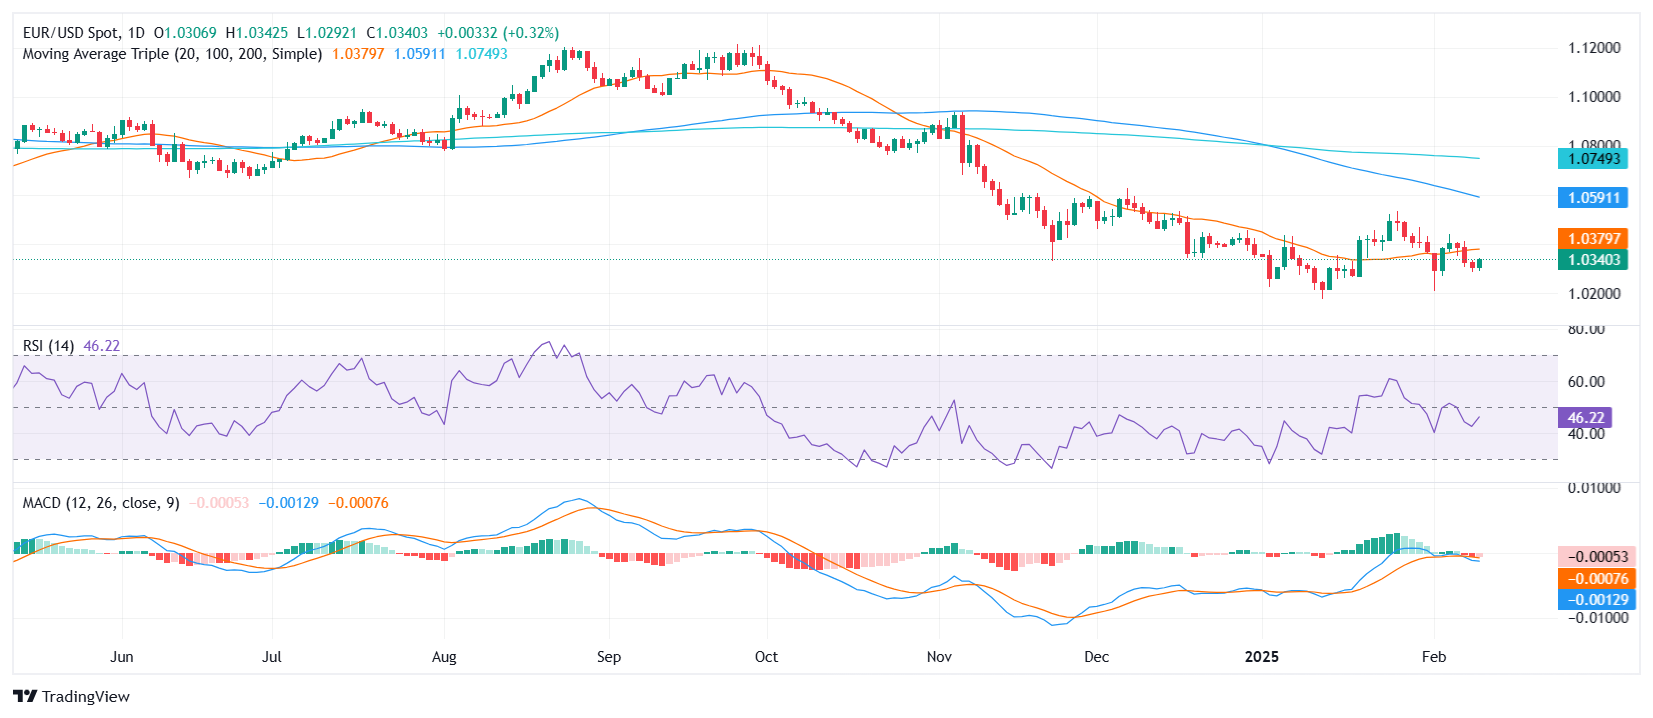
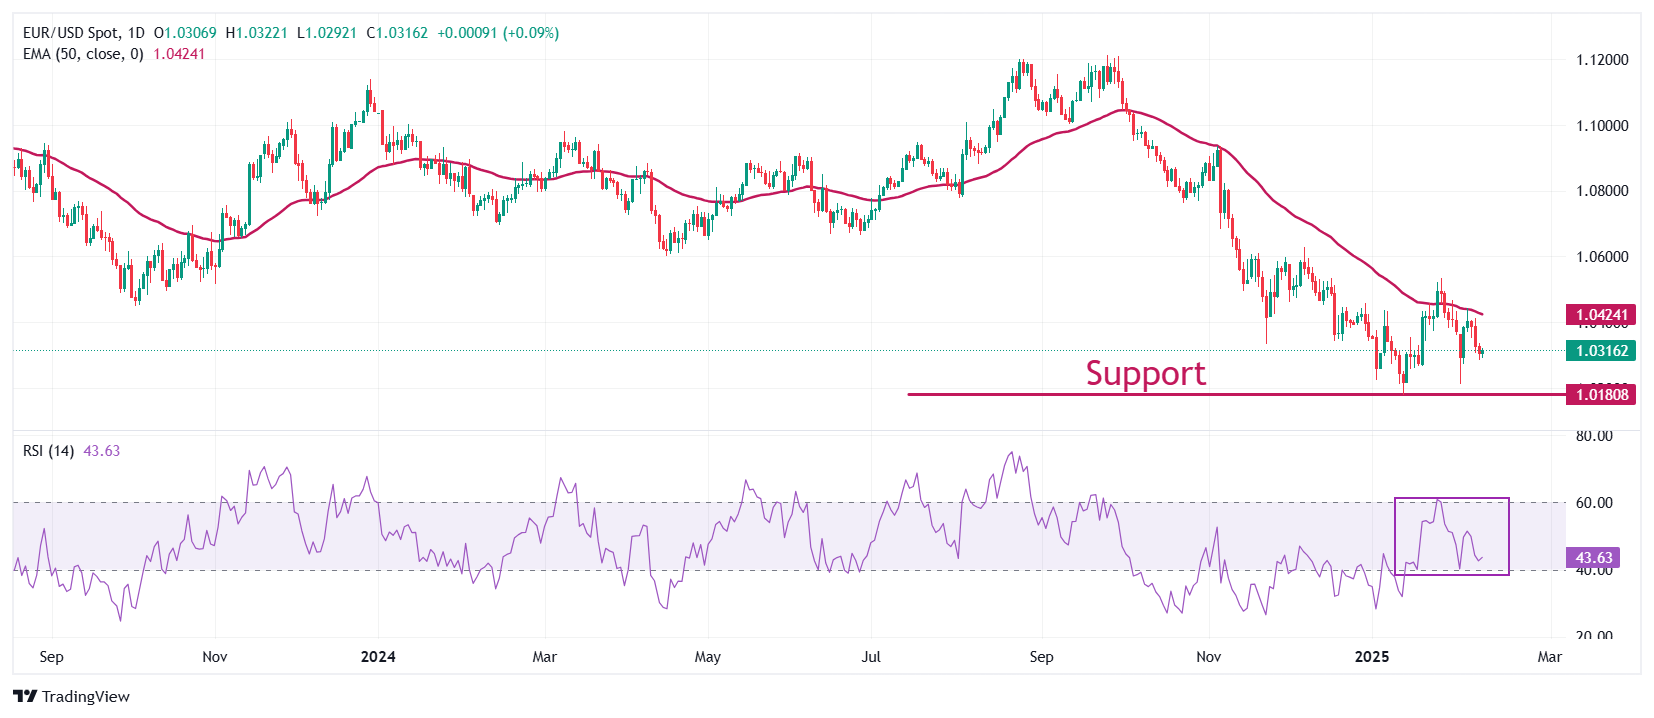
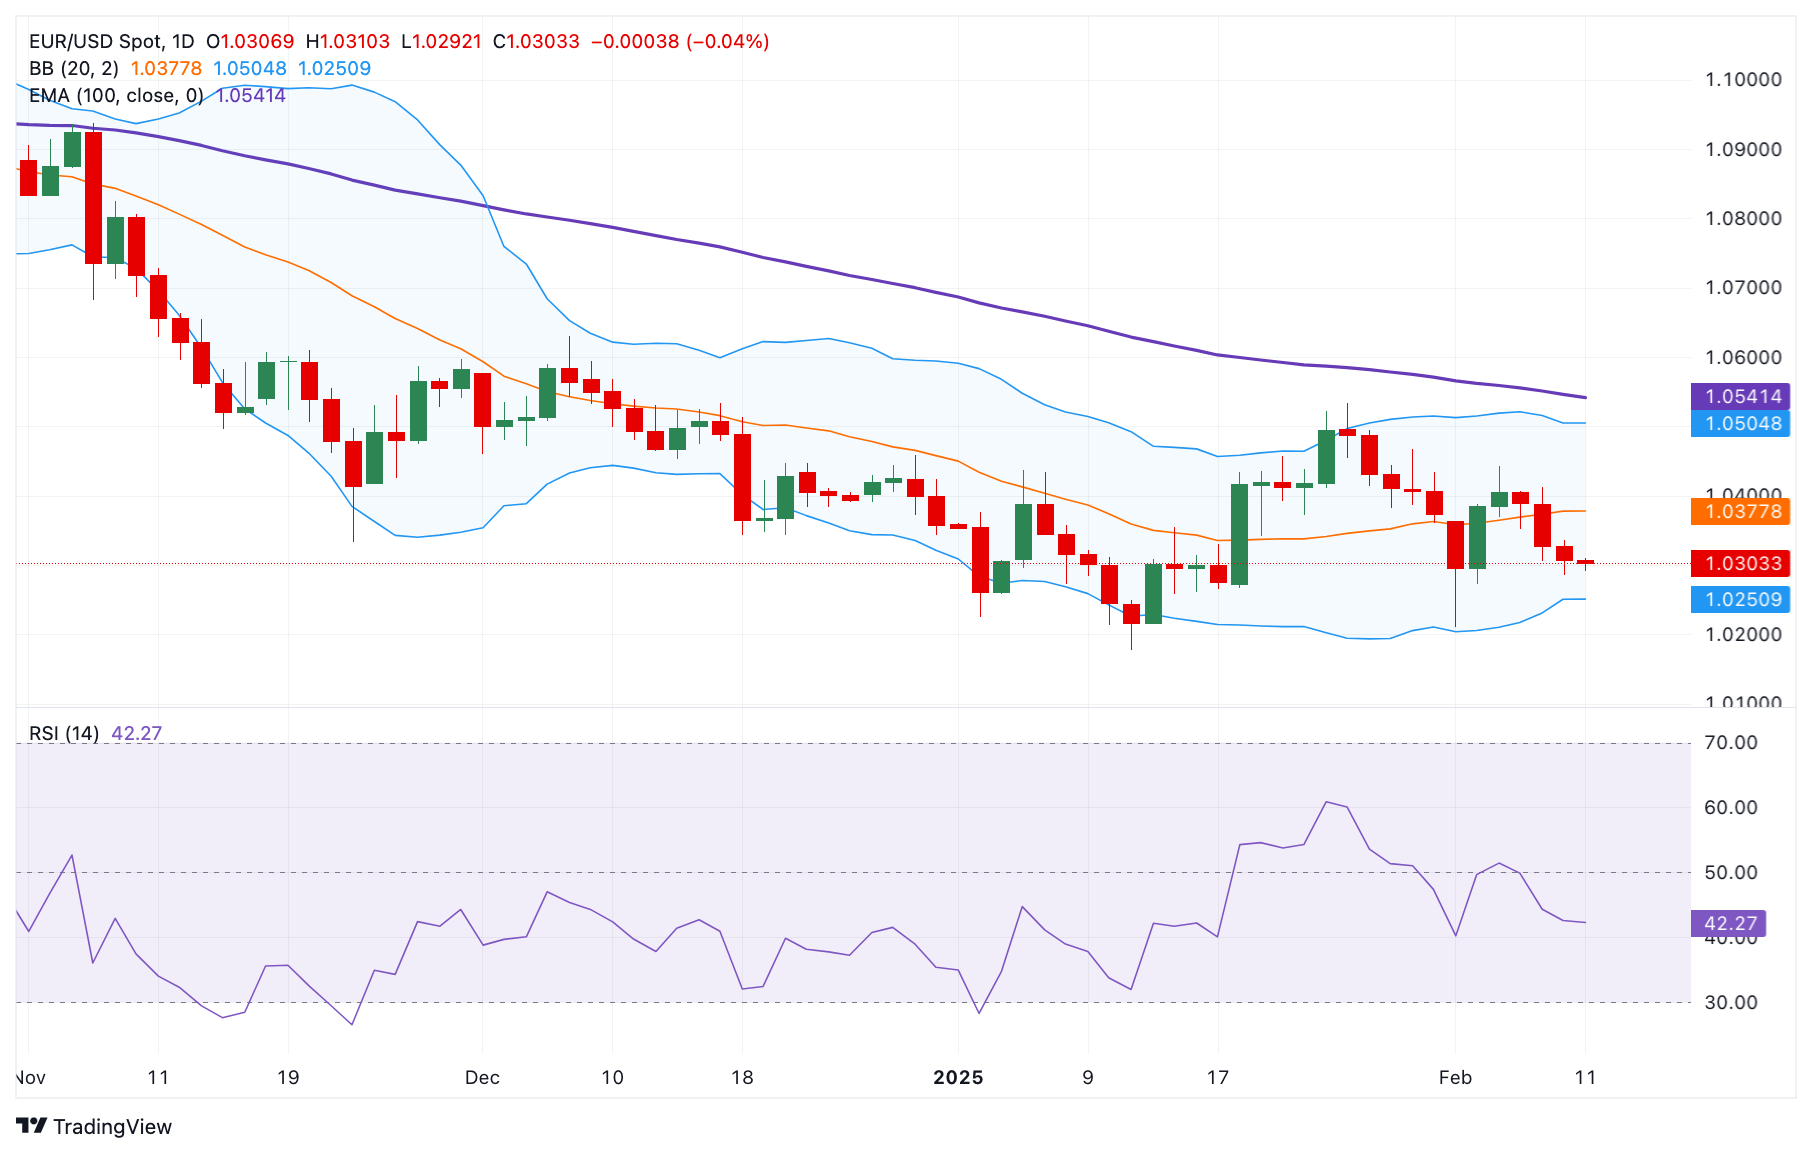
EUR/USD price forecast
EUR/USD traders found the buy button and bolstered the pair back above the 1.0350 level on Tuesday. Fiber broke out of a three-day down streak. Still, momentum remains limited, and the pair continues to trade into a familiar congestion zone just below the 50-day Exponential Moving Average (EMA) near 1.0430.
EUR/USD daily chart
Euro FAQs
The Euro is the currency for the 19 European Union countries that belong to the Eurozone. It is the second most heavily traded currency in the world behind the US Dollar. In 2022, it accounted for 31% of all foreign exchange transactions, with an average daily turnover of over $2.2 trillion a day. EUR/USD is the most heavily traded currency pair in the world, accounting for an estimated 30% off all transactions, followed by EUR/JPY (4%), EUR/GBP (3%) and EUR/AUD (2%).
The European Central Bank (ECB) in Frankfurt, Germany, is the reserve bank for the Eurozone. The ECB sets interest rates and manages monetary policy. The ECB’s primary mandate is to maintain price stability, which means either controlling inflation or stimulating growth. Its primary tool is the raising or lowering of interest rates. Relatively high interest rates – or the expectation of higher rates – will usually benefit the Euro and vice versa. The ECB Governing Council makes monetary policy decisions at meetings held eight times a year. Decisions are made by heads of the Eurozone national banks and six permanent members, including the President of the ECB, Christine Lagarde.
Eurozone inflation data, measured by the Harmonized Index of Consumer Prices (HICP), is an important econometric for the Euro. If inflation rises more than expected, especially if above the ECB’s 2% target, it obliges the ECB to raise interest rates to bring it back under control. Relatively high interest rates compared to its counterparts will usually benefit the Euro, as it makes the region more attractive as a place for global investors to park their money.
Data releases gauge the health of the economy and can impact on the Euro. Indicators such as GDP, Manufacturing and Services PMIs, employment, and consumer sentiment surveys can all influence the direction of the single currency. A strong economy is good for the Euro. Not only does it attract more foreign investment but it may encourage the ECB to put up interest rates, which will directly strengthen the Euro. Otherwise, if economic data is weak, the Euro is likely to fall. Economic data for the four largest economies in the euro area (Germany, France, Italy and Spain) are especially significant, as they account for 75% of the Eurozone’s economy.
Another significant data release for the Euro is the Trade Balance. This indicator measures the difference between what a country earns from its exports and what it spends on imports over a given period. If a country produces highly sought after exports then its currency will gain in value purely from the extra demand created from foreign buyers seeking to purchase these goods. Therefore, a positive net Trade Balance strengthens a currency and vice versa for a negative balance.
GBP/USD rose 0.6% on Tuesday, bolstered by Greenback outflows.
Fed Chair Powell sees few moves on rates, tariffs expected to be reversed.
US inflation data, UK GDP growth figures on the horizon.
GBP/USD recovered ground on Tuesday, snapping a three-day losing streak and recovering back into touch range of the 1.2450 level, rising around two-thirds of one percent on the day. Global FX markets sold off the US Dollar slightly as risk appetite softly recovers across the board, bolstered by a steady-handed appearance from Federal Reserve (Fed) Chair Jerome Powell and and expectations that the latest iteration of US President Donald Trump’s tariff threats will be averted by last-minute concessions, as has been the pattern since Donald Trump took over the White House.
UK data remains thin through the midweek sessions, but Cable traders will be on the lookout for Thursday’s UK Gross Domestic Product (GDP) print. UK GDP is expected to show a recovery to an annualized 1.1% during the fourth quarter, though the Q4 GDP QoQ print is expected to come in at a -0.1% contraction.
US Consumer Price Index (CPI) inflation will be the dominant print on Wednesday. Headline US CPI inflation is expected to hold at 2.9% YoY, while core CPI inflation is forecast to tick down to 3.1% versus the last print of 3.2%. US Producer Price Index (PPI) inflation follows up on Thursday, with core PPI business-level inflation expected to cool slightly to 3.3% YoY from 3.5%.
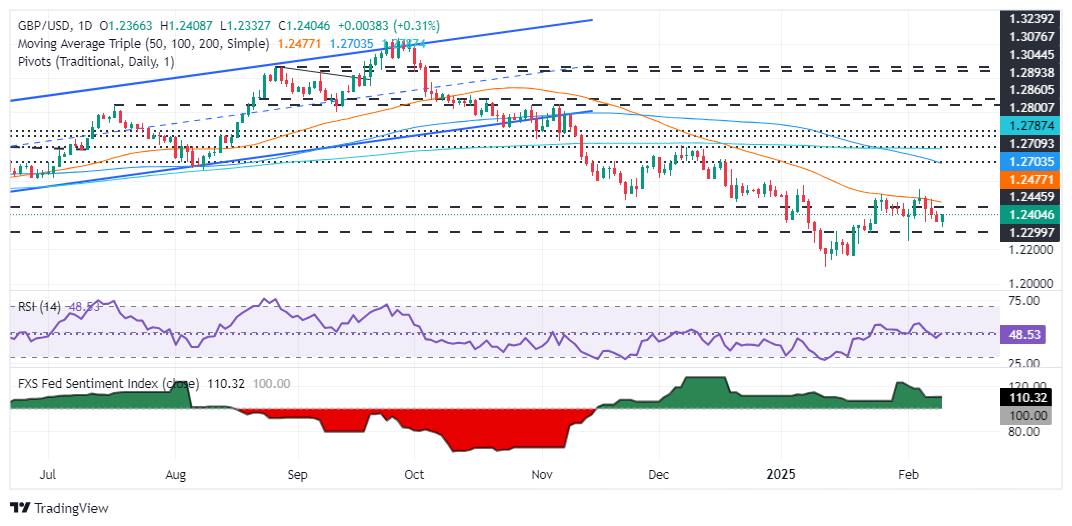
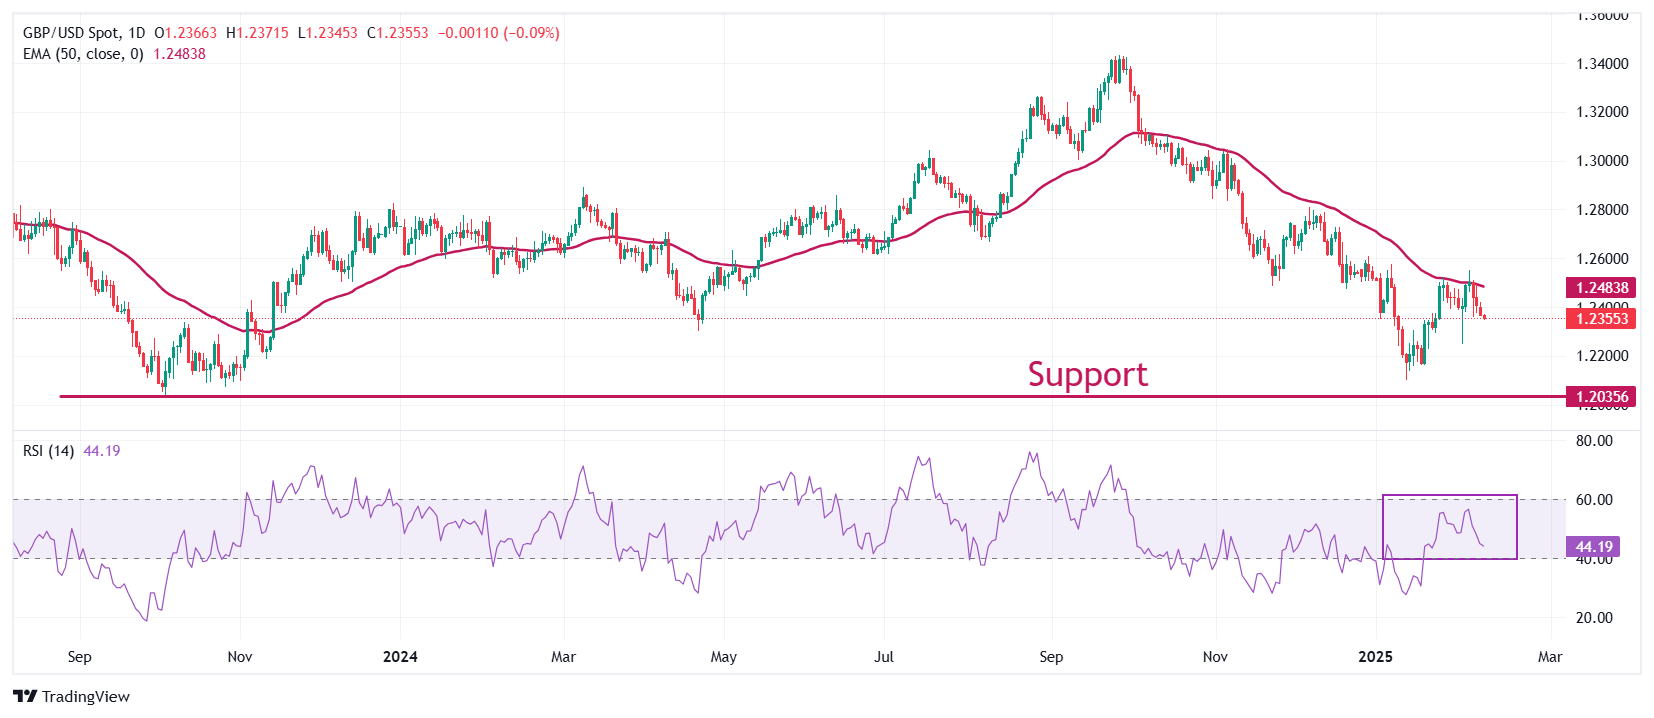
GBP/USD price forecast
Tuesday saw the GBP/USD shake off its near-term bearish momentum, cutting off a three-day losing streak and recovering some chart territory to reclaim a familiar midrange near 1.2450. The pair still remains hobbled just south of the 50-day Exponential Moving Average (EMA) near the 1.2500 handle.
GBP/USD daily chart
Pound Sterling FAQs
The Pound Sterling (GBP) is the oldest currency in the world (886 AD) and the official currency of the United Kingdom. It is the fourth most traded unit for foreign exchange (FX) in the world, accounting for 12% of all transactions, averaging $630 billion a day, according to 2022 data. Its key trading pairs are GBP/USD, also known as ‘Cable’, which accounts for 11% of FX, GBP/JPY, or the ‘Dragon’ as it is known by traders (3%), and EUR/GBP (2%). The Pound Sterling is issued by the Bank of England (BoE).
The single most important factor influencing the value of the Pound Sterling is monetary policy decided by the Bank of England. The BoE bases its decisions on whether it has achieved its primary goal of “price stability” – a steady inflation rate of around 2%. Its primary tool for achieving this is the adjustment of interest rates. When inflation is too high, the BoE will try to rein it in by raising interest rates, making it more expensive for people and businesses to access credit. This is generally positive for GBP, as higher interest rates make the UK a more attractive place for global investors to park their money. When inflation falls too low it is a sign economic growth is slowing. In this scenario, the BoE will consider lowering interest rates to cheapen credit so businesses will borrow more to invest in growth-generating projects.
Data releases gauge the health of the economy and can impact the value of the Pound Sterling. Indicators such as GDP, Manufacturing and Services PMIs, and employment can all influence the direction of the GBP. A strong economy is good for Sterling. Not only does it attract more foreign investment but it may encourage the BoE to put up interest rates, which will directly strengthen GBP. Otherwise, if economic data is weak, the Pound Sterling is likely to fall.
Another significant data release for the Pound Sterling is the Trade Balance. This indicator measures the difference between what a country earns from its exports and what it spends on imports over a given period. If a country produces highly sought-after exports, its currency will benefit purely from the extra demand created from foreign buyers seeking to purchase these goods. Therefore, a positive net Trade Balance strengthens a currency and vice versa for a negative balance.
AUD/JPY rebounds from 94.30 low, showing minimal change as Asian session progresses.
Neutral to slight downward bias indicated; key breakout point at Kijun-sen 95.91 for gains.
Watch resistance at 97.50 and support at 95.61 as traders navigate volatile trading conditions.
The AUD/JPY bounced off after hitting five-month lows of 94.30 on February 10, yet buyers stepped in and pushed the cross-pair above the 95.00 mark. At the time of writing, the pair is exchanged hands at 95.82, down a minimal 0.06 as Wednesday’s Asian session commences.
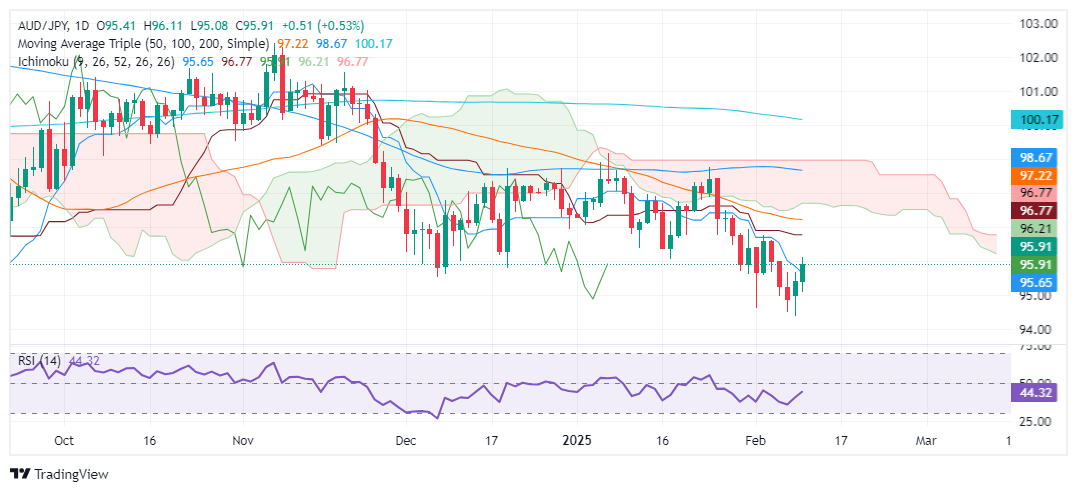
AUD/JPY Price Forecast: Technical outlook
The cross-pair is neutral to slightly downward-biased after dropping from a yearly peak of 99.15. On its way down, the AUD/JPY cleared the Ichimoku Cloud (Kumo), extending its losses to almost 4% in the year.
Since then, the AUD/JPY has recovered with momentum shifting neutral, as depicted by the Relative Strength Index (RSI). But if bulls want to regain some ground, they must clear the Kijun-sen at 95.91 before the pair challenges the bottom of the Kumo near 97.50.
If those two levels are surpassed, the next resistance would be the January 24 swing high at 98.75 before testing the top of the Kumo at 99.00.
For sellers, the scenario suggests they need to clear the Tenkan-sen at 95.61, followed by the 95.00 mark. If cleared the AUD/JPY remains vulnerable to further downside.
AUD/JPY Price Chart – Daily
Australian Dollar FAQs
One of the most significant factors for the Australian Dollar (AUD) is the level of interest rates set by the Reserve Bank of Australia (RBA). Because Australia is a resource-rich country another key driver is the price of its biggest export, Iron Ore. The health of the Chinese economy, its largest trading partner, is a factor, as well as inflation in Australia, its growth rate and Trade Balance. Market sentiment – whether investors are taking on more risky assets (risk-on) or seeking safe-havens (risk-off) – is also a factor, with risk-on positive for AUD.
The Reserve Bank of Australia (RBA) influences the Australian Dollar (AUD) by setting the level of interest rates that Australian banks can lend to each other. This influences the level of interest rates in the economy as a whole. The main goal of the RBA is to maintain a stable inflation rate of 2-3% by adjusting interest rates up or down. Relatively high interest rates compared to other major central banks support the AUD, and the opposite for relatively low. The RBA can also use quantitative easing and tightening to influence credit conditions, with the former AUD-negative and the latter AUD-positive.
China is Australia’s largest trading partner so the health of the Chinese economy is a major influence on the value of the Australian Dollar (AUD). When the Chinese economy is doing well it purchases more raw materials, goods and services from Australia, lifting demand for the AUD, and pushing up its value. The opposite is the case when the Chinese economy is not growing as fast as expected. Positive or negative surprises in Chinese growth data, therefore, often have a direct impact on the Australian Dollar and its pairs.
Iron Ore is Australia’s largest export, accounting for $118 billion a year according to data from 2021, with China as its primary destination. The price of Iron Ore, therefore, can be a driver of the Australian Dollar. Generally, if the price of Iron Ore rises, AUD also goes up, as aggregate demand for the currency increases. The opposite is the case if the price of Iron Ore falls. Higher Iron Ore prices also tend to result in a greater likelihood of a positive Trade Balance for Australia, which is also positive of the AUD.
The Trade Balance, which is the difference between what a country earns from its exports versus what it pays for its imports, is another factor that can influence the value of the Australian Dollar. If Australia produces highly sought after exports, then its currency will gain in value purely from the surplus demand created from foreign buyers seeking to purchase its exports versus what it spends to purchase imports. Therefore, a positive net Trade Balance strengthens the AUD, with the opposite effect if the Trade Balance is negative.
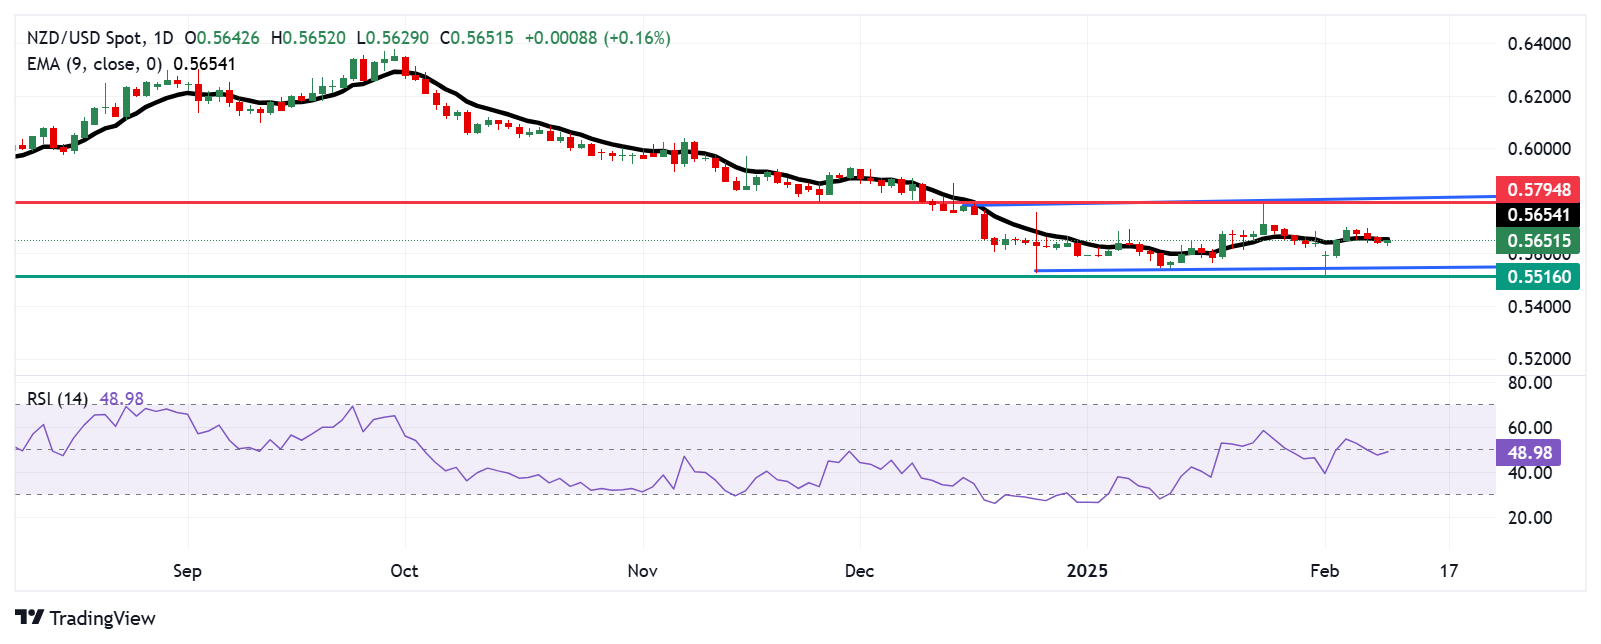
NZD/USD climbs on Tuesday, reaching 0.5655 as buyers gain traction.
The pair tests the 20-day SMA at 0.5650, a key technical threshold.
Momentum indicators show mixed signals, with bullish attempts facing resistance.
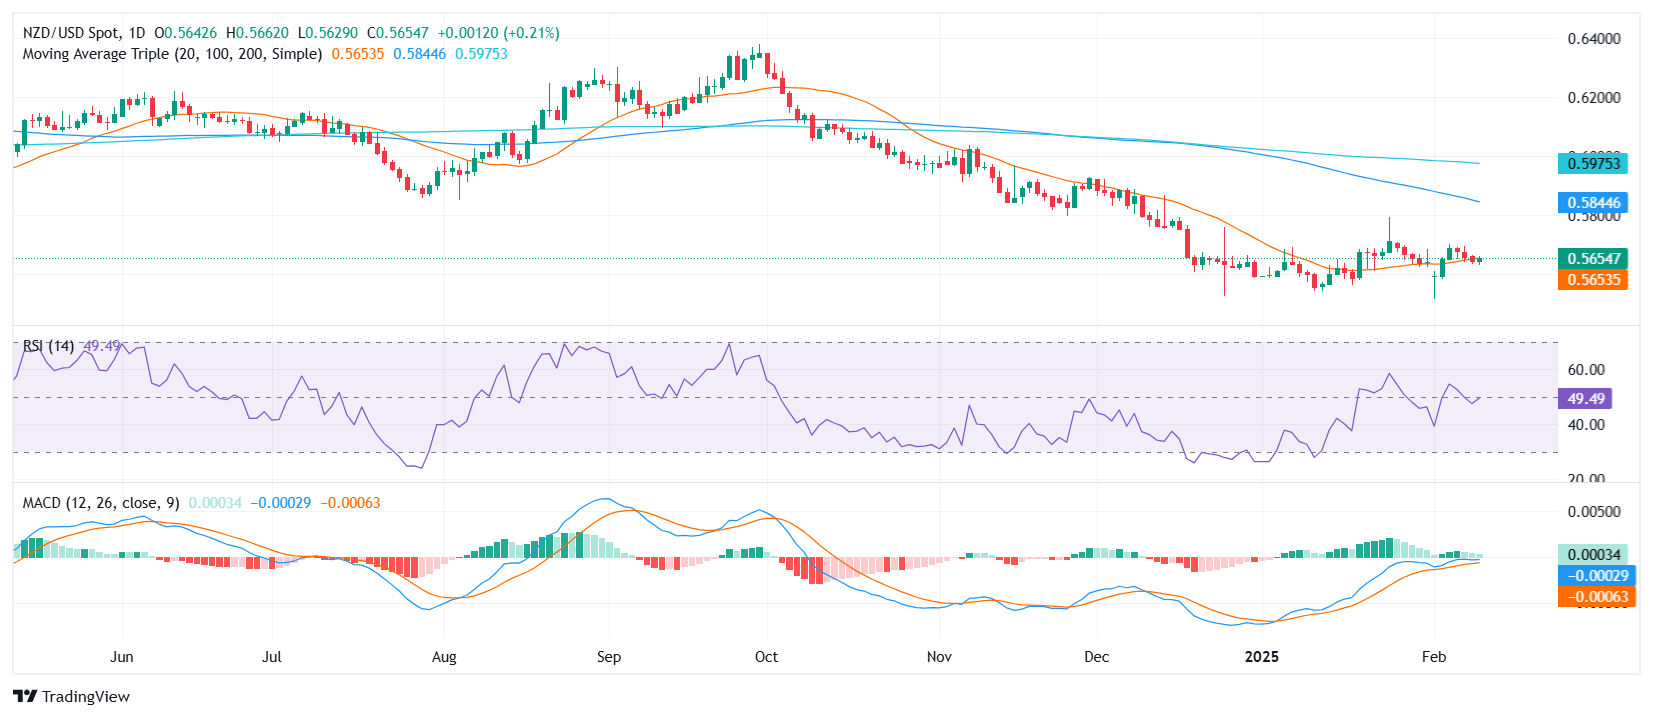
NZD/USD advanced on Tuesday, rising 0.31% to trade at 0.5655 as bulls attempted to regain control. The pair is currently testing the 20-day Simple Moving Average (SMA) at 0.5650, a level that has acted as a key resistance zone. A sustained hold above this mark could improve the near-term outlook, while failure to maintain upward pressure may leave the pair vulnerable to renewed selling.
Technical indicators offer a mixed perspective. The Relative Strength Index (RSI) has climbed sharply to 51, signaling improving bullish sentiment as it moves into positive territory. However, the Moving Average Convergence Divergence (MACD) histogram remains flat with green bars, suggesting that while selling pressure has eased, bullish momentum remains tentative.
Looking ahead, a decisive break above 0.5670 could open the door toward 0.5700, reinforcing a more constructive bias. On the downside, if the pair fails to hold the 20-day SMA, sellers may regain control, with immediate support emerging at 0.5620, followed by the 0.5600 psychological level.
NZD/USD daily chart
21:39
United States API Weekly Crude Oil Stock came in at 9.043M, above forecasts (2.8M) in February 7
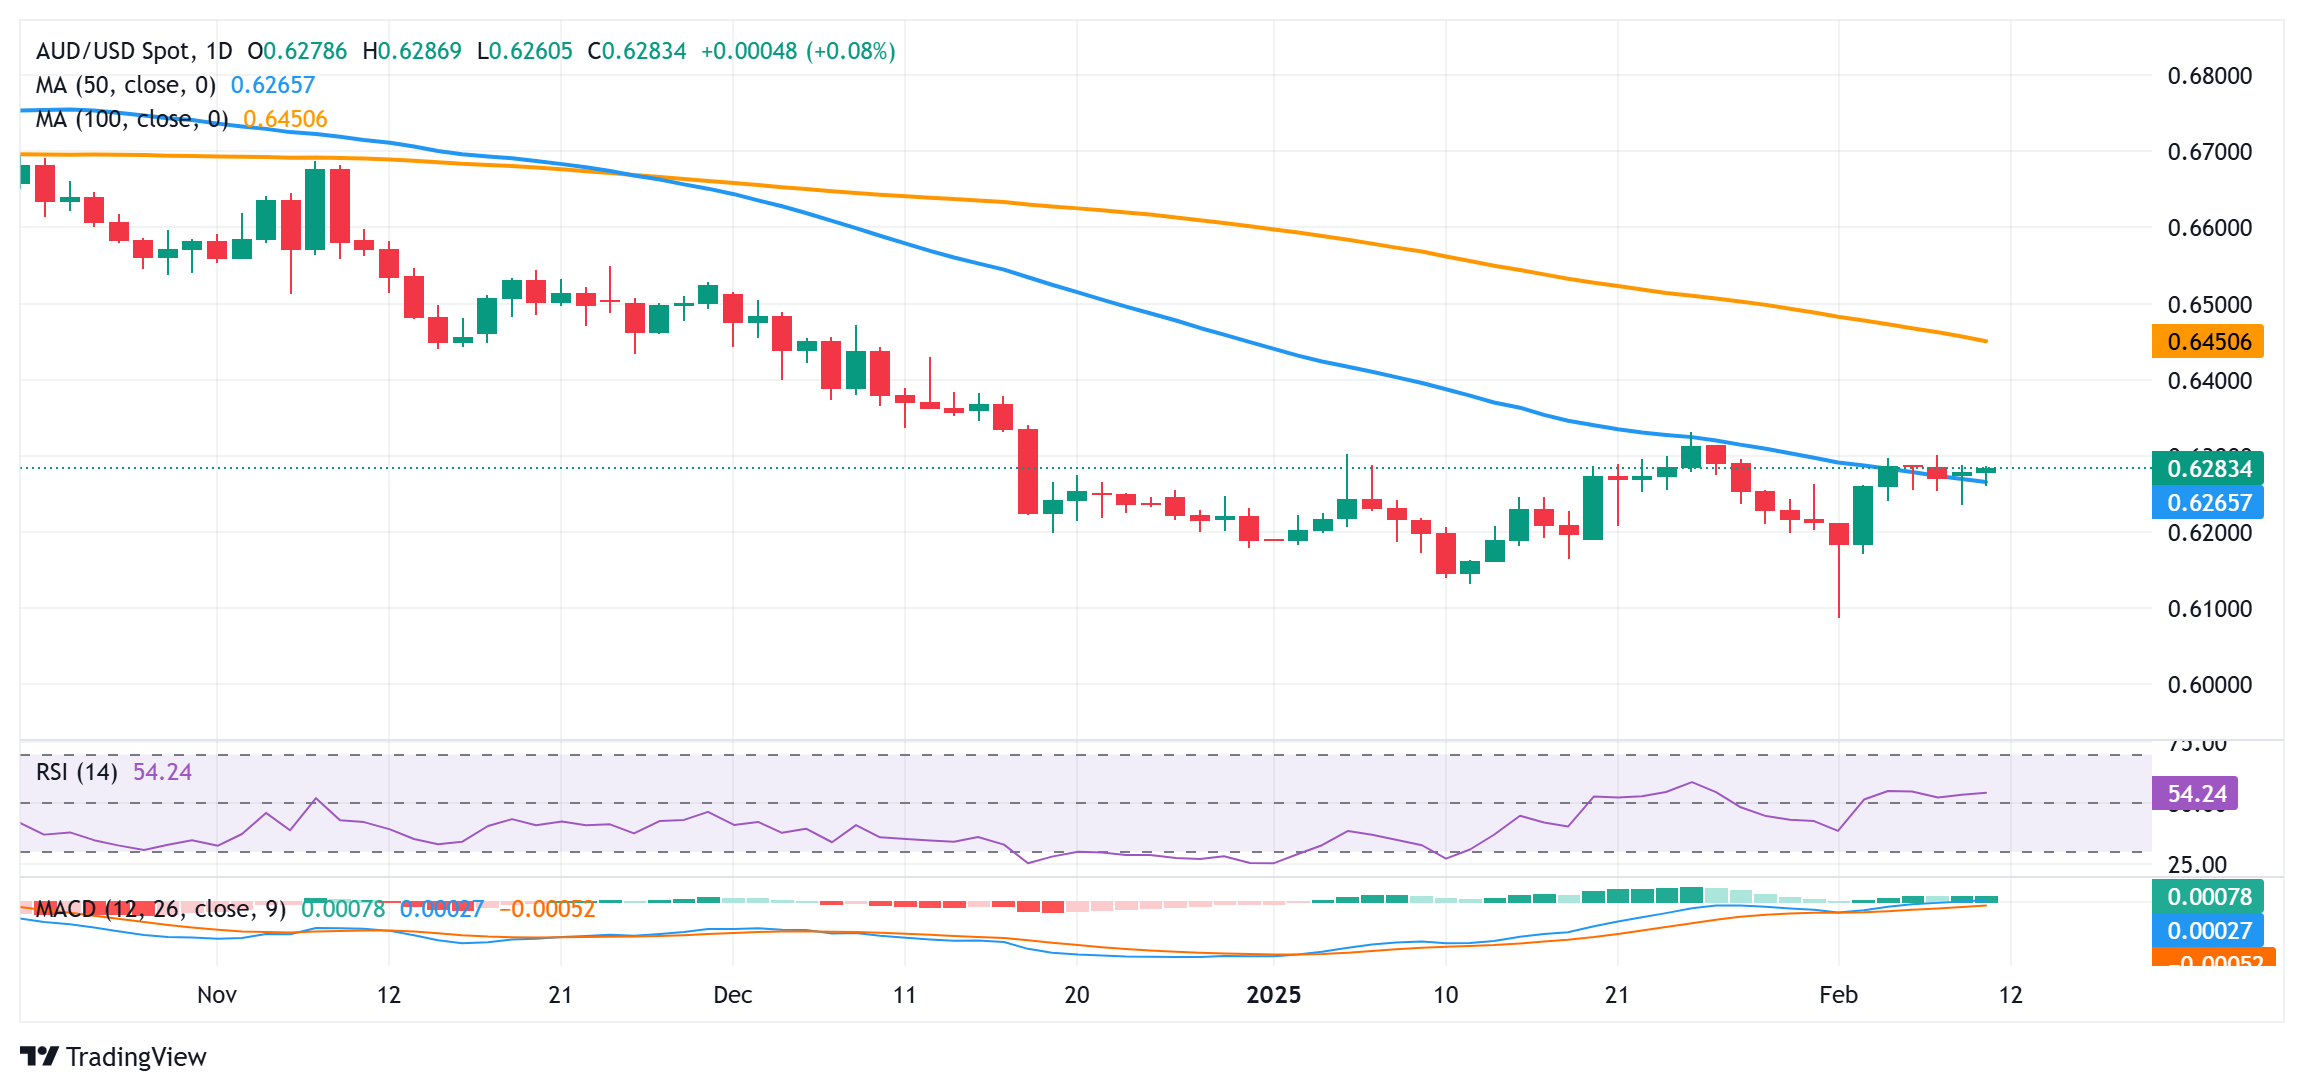
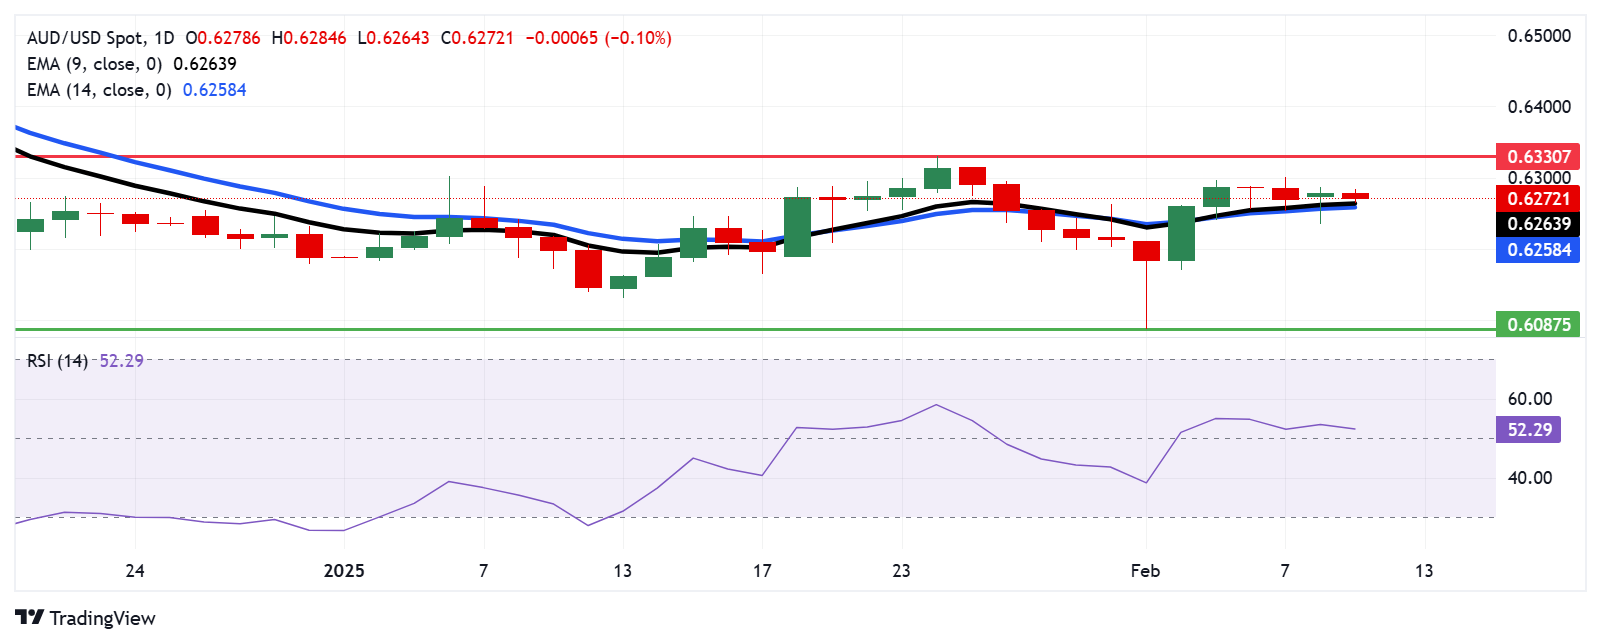
AUD/USD remains confined below 0.6300, trading around 0.6260 on Tuesday.
The pair has consolidated sideways for five consecutive sessions.
Ongoing US tariff threats and mixed inflation data weigh on the Aussie.
Expectations of an imminent RBA rate cut add to market uncertainty and cap further gains.
The Australian Dollar (AUD) remains in a sideways consolidative move for the fifth straight day, trading below the 0.6300 mark on Tuesday. Investor sentiment is cautious as United States (US) tariff threats on Chinese goods persist and Beijing retaliates, while market participants focus on US Q4 economic data and upcoming domestic Consumer Price Index (CPI) reports that could shape Reserve Bank of Australia (RBA) policy.
On Tuesday, markets reacted to Federal Reserve (Fed) Chair Jerome Powell’s testimony before the US Congress, which saw him take a cautious tone. Focus now shifts to inflation data from the US on Wednesday.
Daily Digest Market Movers: Aussie under pressure amid global trade and policy uncertainty
The US Dollar Index (DXY) revisited the 108.00 support despite higher US yields and a cautious tone from Fed Chair Powell. With the upcoming release of the US Inflation Rate, along with testimony from Fed officials like Bostic and Waller, market participants anticipate further insights into the Fed's policy stance.
Recent trade developments have been volatile. Trump’s imposition of a 25% duty on imports from Canada and Mexico, delayed by a month, provided short-lived relief, yet his 10% tariff on Chinese goods remains active.
In retaliation, China has signaled it will contest these tariffs at the World Trade Organization (WTO), sparking concerns over reduced demand for Australia’s resource exports.
On the domestic front, Australia’s Q4 Consumer Price Index (CPI) showed headline inflation at 2.5% YoY, down from 2.8%, and a trimmed mean CPI at a three-year low of 3.2%.
These softer inflation readings have strengthened market expectations of a 25 basis point rate cut by the RBA in February, though many believe total easing could reach 85 basis points over the next year.
AUD/USD Technical Outlook: Consolidation persists as technicals hint at cautious momentum
The AUD/USD pair remains range-bound, currently trading around 0.6260 as the pair continues its sideways consolidation. While the market has held support below the 0.6300 resistance, technical indicators reflect a cautious outlook. The Relative Strength Index (RSI) is at 55, still positive but showing signs of a decline, which indicates that bullish momentum is weakening.
Concurrently, the Moving Average Convergence Divergence (MACD) histogram prints rising green bars, hinting at a gradual build in momentum. With the pair confined in a narrow range between approximately 0.6230 and 0.6300, traders are awaiting decisive US and Australian economic data to trigger a clear directional move.
Australian Dollar FAQs
One of the most significant factors for the Australian Dollar (AUD) is the level of interest rates set by the Reserve Bank of Australia (RBA). Because Australia is a resource-rich country another key driver is the price of its biggest export, Iron Ore. The health of the Chinese economy, its largest trading partner, is a factor, as well as inflation in Australia, its growth rate and Trade Balance. Market sentiment – whether investors are taking on more risky assets (risk-on) or seeking safe-havens (risk-off) – is also a factor, with risk-on positive for AUD.
The Reserve Bank of Australia (RBA) influences the Australian Dollar (AUD) by setting the level of interest rates that Australian banks can lend to each other. This influences the level of interest rates in the economy as a whole. The main goal of the RBA is to maintain a stable inflation rate of 2-3% by adjusting interest rates up or down. Relatively high interest rates compared to other major central banks support the AUD, and the opposite for relatively low. The RBA can also use quantitative easing and tightening to influence credit conditions, with the former AUD-negative and the latter AUD-positive.
China is Australia’s largest trading partner so the health of the Chinese economy is a major influence on the value of the Australian Dollar (AUD). When the Chinese economy is doing well it purchases more raw materials, goods and services from Australia, lifting demand for the AUD, and pushing up its value. The opposite is the case when the Chinese economy is not growing as fast as expected. Positive or negative surprises in Chinese growth data, therefore, often have a direct impact on the Australian Dollar and its pairs.
Iron Ore is Australia’s largest export, accounting for $118 billion a year according to data from 2021, with China as its primary destination. The price of Iron Ore, therefore, can be a driver of the Australian Dollar. Generally, if the price of Iron Ore rises, AUD also goes up, as aggregate demand for the currency increases. The opposite is the case if the price of Iron Ore falls. Higher Iron Ore prices also tend to result in a greater likelihood of a positive Trade Balance for Australia, which is also positive of the AUD.
The Trade Balance, which is the difference between what a country earns from its exports versus what it pays for its imports, is another factor that can influence the value of the Australian Dollar. If Australia produces highly sought after exports, then its currency will gain in value purely from the surplus demand created from foreign buyers seeking to purchase its exports versus what it spends to purchase imports. Therefore, a positive net Trade Balance strengthens the AUD, with the opposite effect if the Trade Balance is negative.
Federal Reserve (Fed) Bank of New York President John Williams noted on Tuesday that US growth metrics are overall in a good place, specifically highlighting that US Gross Domestic Product (GDP) growth should hold steady this year and next.
Key highlights
Monetary policy well positioned to achieve the Fed goals.
The Fed has made significant progress lowering inflation.
The labor market in good balance, not an inflation driver.
Inflation to hang around 2.5% this year, 2% in coming years.
US to grow by around 2% this year and next.
Economic outlook is highly uncertain due in part to government policy.
The US economy is in a good place.
Modestly restrictive policy should return inflation to 2%.
Inflation expectations are well anchored.
Wage gains consistent with productivity and inflation outlook.
The Fed is not quite to its goals, but the economy is in a good place.
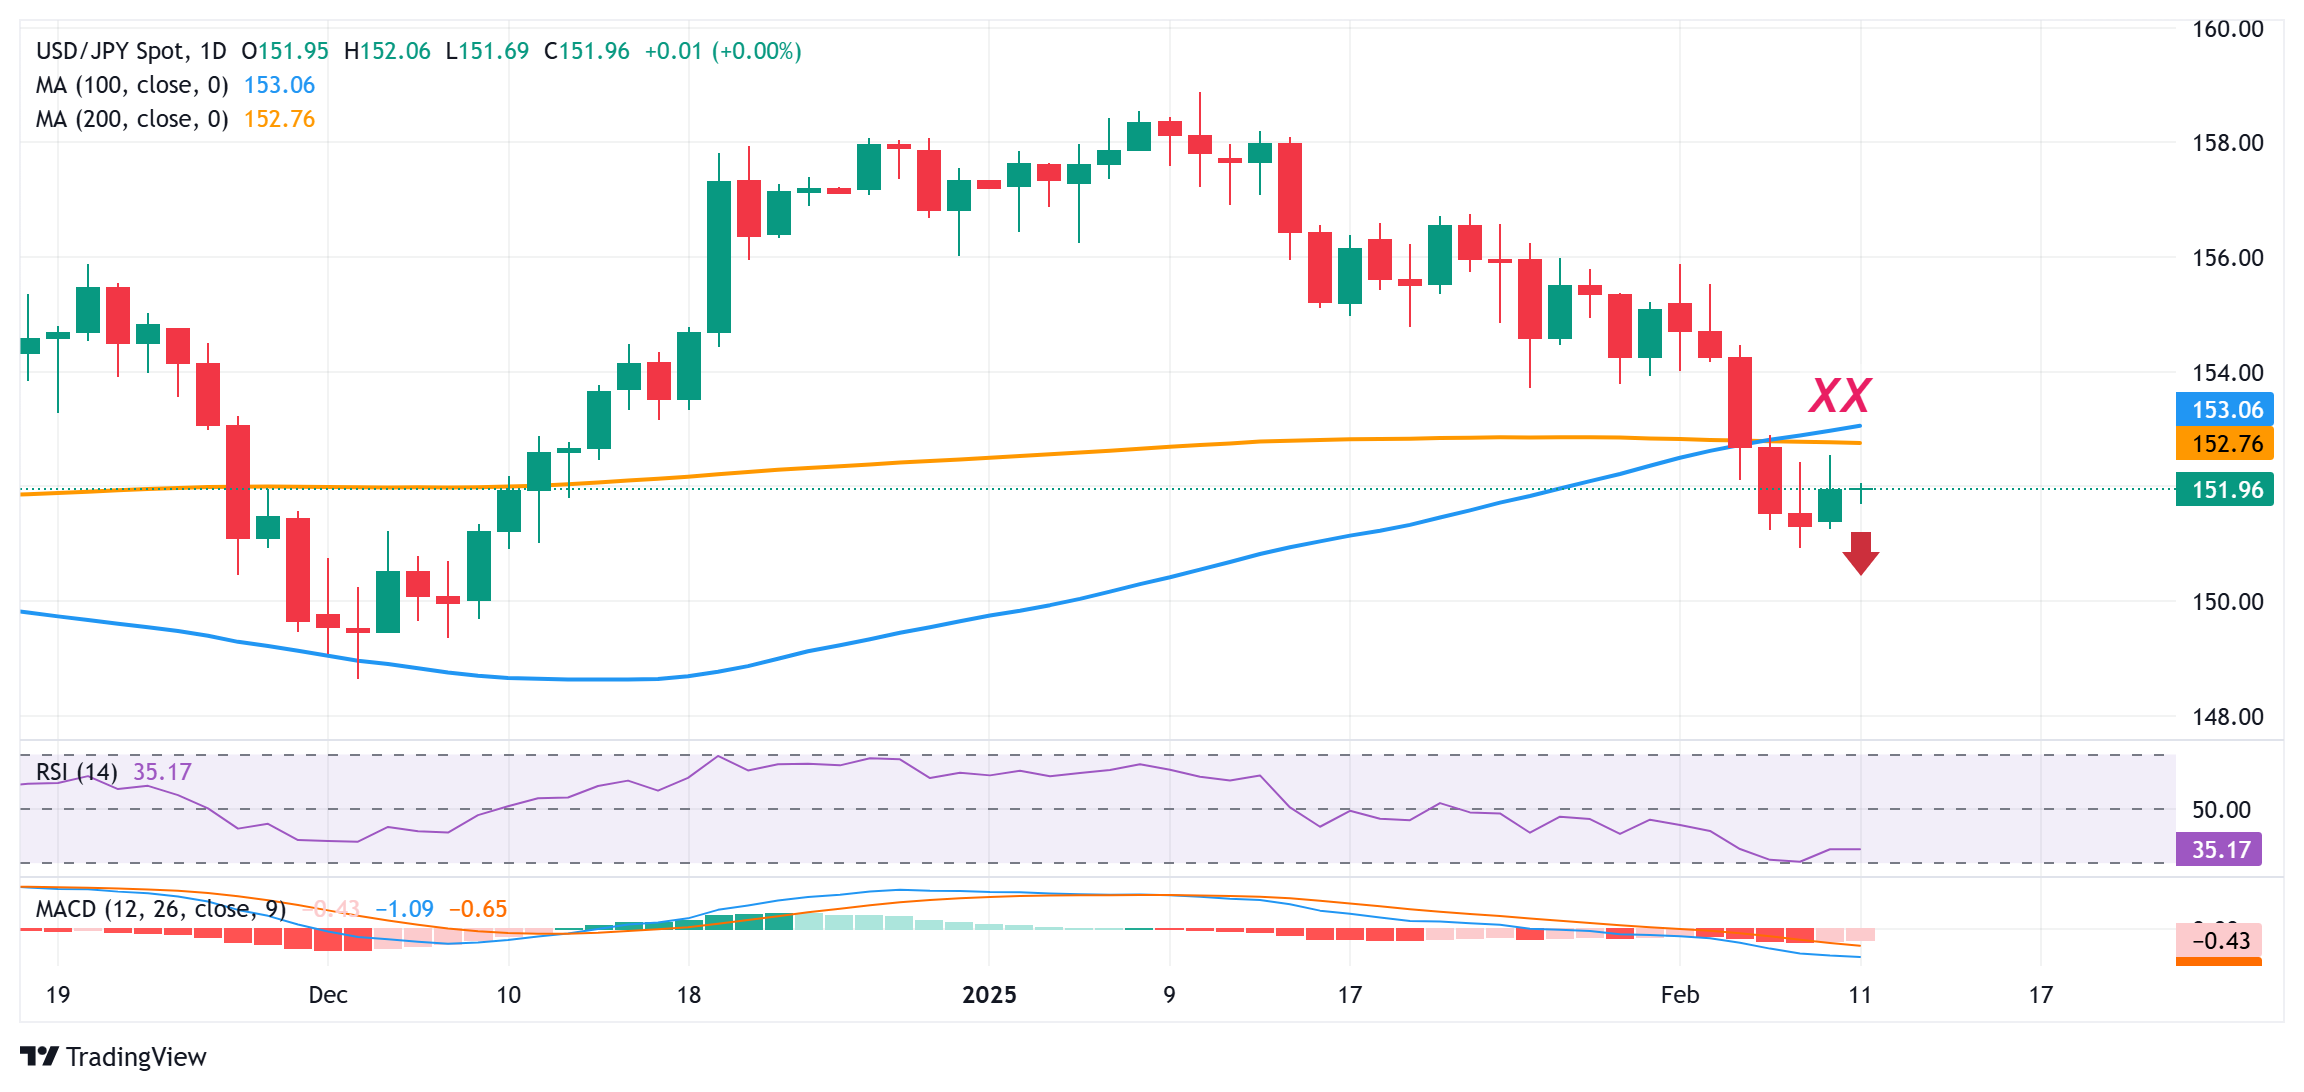
USD/JPY rebounds 0.35% from 151.64 low, driven by bond yield movements.
Technical analysis hints at bullish shift; resistance near 200-day SMA at 152.76.
Downside risks if SMA not surpassed; supports at 152.00 and 150.93 in focus.
The USD/JPY climbed during the North American session. It trades at 152.52 and posts gains of over 0.35% after hitting a daily low of 151.64. The rise of the US 10-year T-note bond yield spurred the rise of the pair, which is positively correlated to the yield of the 10-year.
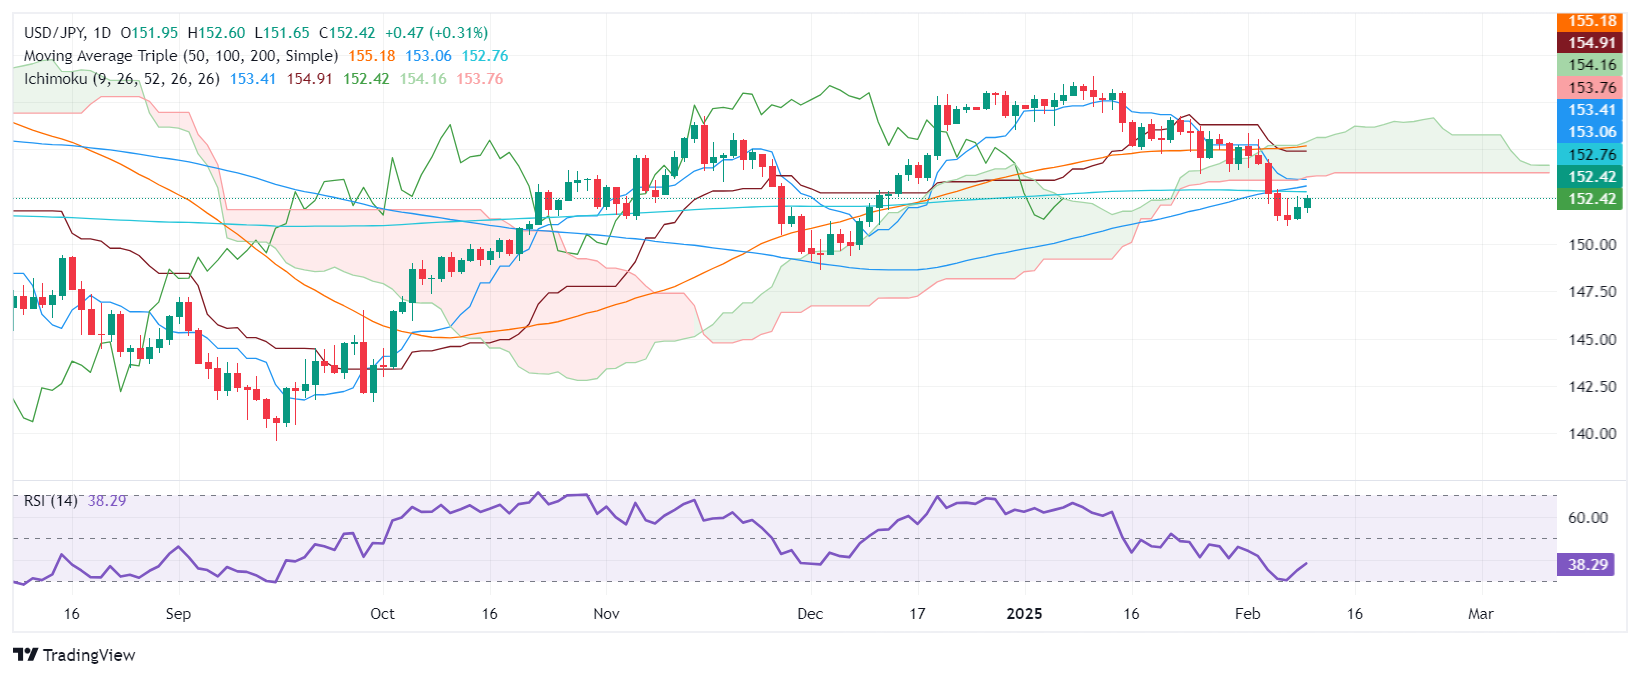
USD/JPY Price Forecast: Technical outlook
The USD/JPY remains biased downward, even though buyers could challenge the 200-day Simple Moving Average (SMA) at 152.76. The momentum shifted slightly bullish even though the relative strength index (RSI) remains bearish, and the slope aims upwards.
If buyers regain the 200-day SMA, the following key resistance would be the 153.00 mark before testing the Senkou Span B base at 153.76.
On the other hand, if USD/JPY stays below the 200-day SMA, the first support would be the 152.00 figure. Further losses lie below the February 7 daily low of 150.93, followed by the December 3 swing low of 148.64.
USD/JPY Price Chart – Daily
Japanese Yen PRICE Today
The table below shows the percentage change of Japanese Yen (JPY) against listed major currencies today. Japanese Yen was the strongest against the Swiss Franc.
USD
EUR
GBP
JPY
CAD
AUD
NZD
CHF
USD
-0.53%
-0.60%
0.30%
-0.16%
-0.28%
-0.23%
0.16%
EUR
0.53%
-0.08%
0.85%
0.39%
0.25%
0.30%
0.70%
GBP
0.60%
0.08%
0.93%
0.46%
0.31%
0.36%
0.76%
JPY
-0.30%
-0.85%
-0.93%
-0.45%
-0.59%
-0.53%
-0.14%
CAD
0.16%
-0.39%
-0.46%
0.45%
-0.13%
-0.08%
0.31%
AUD
0.28%
-0.25%
-0.31%
0.59%
0.13%
0.05%
0.44%
NZD
0.23%
-0.30%
-0.36%
0.53%
0.08%
-0.05%
0.39%
CHF
-0.16%
-0.70%
-0.76%
0.14%
-0.31%
-0.44%
-0.39%
The heat map shows percentage changes of major currencies against each other. The base currency is picked from the left column, while the quote currency is picked from the top row. For example, if you pick the Japanese Yen from the left column and move along the horizontal line to the US Dollar, the percentage change displayed in the box will represent JPY (base)/USD (quote).
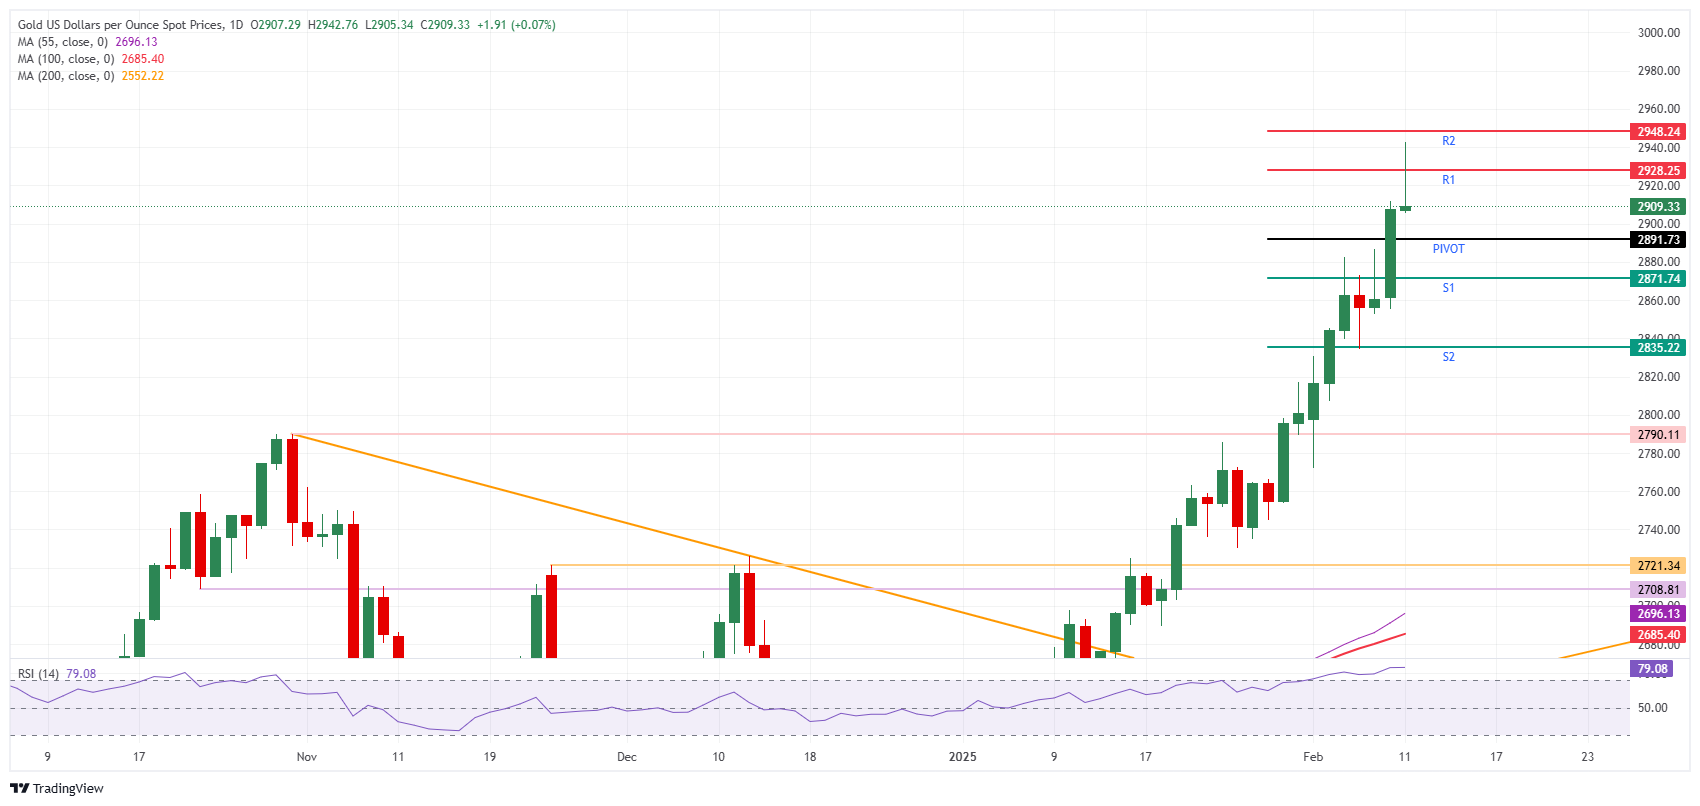
Gold's rally stalls, dropping 0.18% after profit-booking and Fed Powell commentary.
Fed Chair Powell cites strong economic indicators and sees no immediate need for rate cuts amid trade tensions.
Future US economic reports and Fed speeches are anticipated to impact Gold's trajectory further.
Gold prices edged lower during the North American session, dropping a minimal 0.18% on Tuesday after hitting a record-high of $2,942 earlier in the session. Heightened tensions due to the trade war sparked by United States (US) President Donald Trump's new tariffs pushed the golden metal to new all-time highs before retreating. XAU/USD trades near $2,900 at the time of writing.
The financial markets' narrative remains unchanged after Trump decided to apply 25% duties on steel and aluminum imported to the United States. Initially, bullion prices edged up, but traders booked profits ahead of Federal Reserve (Fed) Chair Jerome Powell's testimony at the US Senate.
At his hearing, Powell said the Fed is in no rush to reduce borrowing costs due to the economy’s strength and that inflation remains above the 2% target. He added that the labor market is “broadly in balance” and that it wasn’t a source of inflationary pressure.
When asked whether the US economy would hit a recession, he denied it.
Data-wise, the NFIB Small Business Optimism Index fell to 102.8 in January from 105.1 in December, the highest print since October 2018.
This week, the US economic docket will feature US inflation figures on the consumer and producer sides, along with further Federal Reserve speakers.
Daily digest market movers: Gold price retreats as US Treasury yields rise
The US 10-year Treasury bond yield edges up three basis points (bps) at 4.531%.
US real yields, which correlate inversely to Bullion prices, gain one bps sit at 2.079%, a headwind for XAU/USD.
Bullion has seen increased demand from central banks, with the World Gold Council (WGC) reporting that central banks purchased over 1,000 tons of gold for the third consecutive year in 2024. Following Trump's electoral victory, purchases by central banks surged by more than 54% year-over-year to 333 tons, according to WGC data.
The New York Fed Survey of Consumers revealed that inflation expectations remain well anchored despite consumers' estimates of inflation at 3% in the near term. Nevertheless, expectations for five years jumped from 2.7% to 3%.
Cleveland Fed President Beth Hammack preferred maintaining interest rates steady for an extended period so the Federal Reserve could assess economic conditions. She described the current monetary policy as ”modestly restrictive” and highlighted the ongoing uncertainty about whether inflation will continue approaching the Fed's target of 2%.
Last week, US employment data was mixed, though the dip in the Unemployment Rate hints at the strength of the labor market. This might prevent the Fed from cutting rates soon.
A Reuters poll showed the Fed was expected to wait until the next quarter before cutting rates again
Money market fed funds rate futures are pricing in 38.5 basis points of easing by the Federal Reserve in 2025.
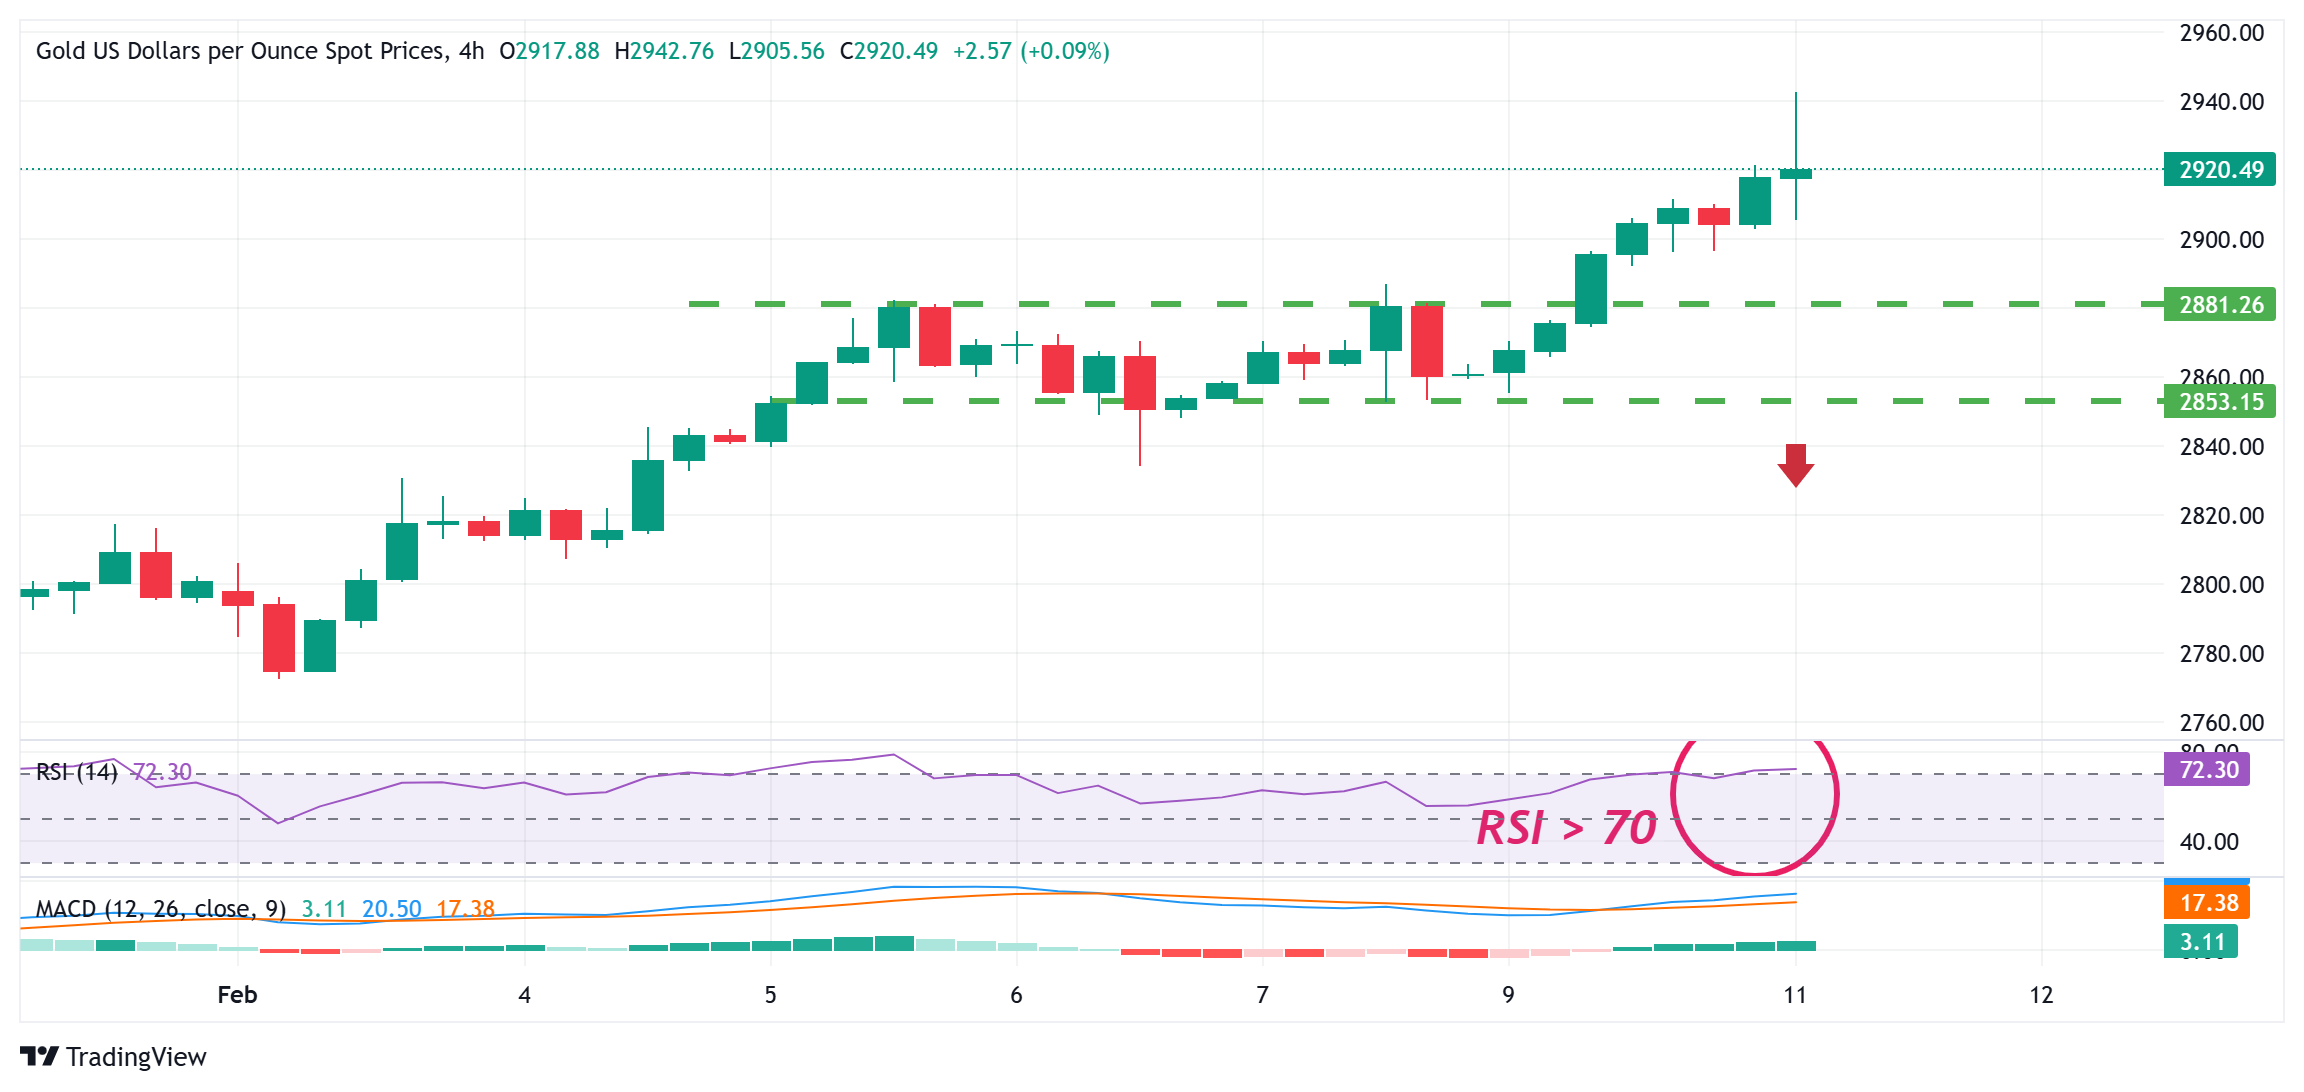
XAU/USD technical outlook: Gold price retraces and clings to $2,900
Gold price trend is tilted to the upside despite forming a ‘doji’ near the $2,900 figure after hitting an all-time high of $2,942. This suggests that buyers are reluctant to drive prices higher.
The Relative Strength Index (RSI) suggests that bullish momentum remains, but being at overbought territory opens the door for a pullback.
If XAU/USD drops below $2,900, the first support would be the psychological $2,850 mark. Once surpassed, the October 31 cycle high turned support at $2,790 is up next, ahead of January’s 27 swing low of $2,730.
On the other hand, if bulls push prices above the record high, key resistance levels lie ahead like the $2,950 psychological level, followed by the $3,000 mark.
Gold FAQs
Gold has played a key role in human’s history as it has been widely used as a store of value and medium of exchange. Currently, apart from its shine and usage for jewelry, the precious metal is widely seen as a safe-haven asset, meaning that it is considered a good investment during turbulent times. Gold is also widely seen as a hedge against inflation and against depreciating currencies as it doesn’t rely on any specific issuer or government.
Central banks are the biggest Gold holders. In their aim to support their currencies in turbulent times, central banks tend to diversify their reserves and buy Gold to improve the perceived strength of the economy and the currency. High Gold reserves can be a source of trust for a country’s solvency. Central banks added 1,136 tonnes of Gold worth around $70 billion to their reserves in 2022, according to data from the World Gold Council. This is the highest yearly purchase since records began. Central banks from emerging economies such as China, India and Turkey are quickly increasing their Gold reserves.
Gold has an inverse correlation with the US Dollar and US Treasuries, which are both major reserve and safe-haven assets. When the Dollar depreciates, Gold tends to rise, enabling investors and central banks to diversify their assets in turbulent times. Gold is also inversely correlated with risk assets. A rally in the stock market tends to weaken Gold price, while sell-offs in riskier markets tend to favor the precious metal.
The price can move due to a wide range of factors. Geopolitical instability or fears of a deep recession can quickly make Gold price escalate due to its safe-haven status. As a yield-less asset, Gold tends to rise with lower interest rates, while higher cost of money usually weighs down on the yellow metal. Still, most moves depend on how the US Dollar (USD) behaves as the asset is priced in dollars (XAU/USD). A strong Dollar tends to keep the price of Gold controlled, whereas a weaker Dollar is likely to push Gold prices up.
The Canadian Dollar remained tepid against the Greenback on Tuesday.
Housing Starts in Canada rose in December, but data impact is low.
Markets are brushing off the latest tariff tirade from President Trump.
The Canadian Dollar (CAD) continues to hold within it’s medium-term technical range against the US Dollar (USD), keeping the USD/CAD pair pinned near 1.4300 after a firm recovery from multi-decade lows last week. Canadian economic data is thin and strictly low-tier this week, and the market is taking US President Donald Trump’s latest trade wear rhetoric in stride as a full walk back is expected once again.
Canada saw a firm rebound in issued Building Permits in December, reversing a previous cyclical contraction. However the data is back-dated too far to be of any significance, providing only thin support for the Loonie. President Trump’s latest threat to impose a flat 25% tariff on all imported steel and aluminum into the US has been kicked down the road to March 12, leading markets to believe that this is just the next iteration of empty threats that will result in more headlines than actual action on US trade policies.
Daily digest market movers: Canadian Dollar holds steady, markets brush off tariff talk
The Canadian Dollar traded within one-tenth of one percent of Tuesday’s opening bids against the Greenback.
Canadian Building Permits rebounded to 11.0% in December, up from November's revised -5.6% contraction.
Investors hoping for signals of incoming rate cuts were likely disappointed by Federal Reserve (Fed) Chair Jerome Powell’s testimony before the US Senate Banking Committee.
President Trump signed executive orders calling for 25% tariffs on steel and aluminum imports starting on March 12, but investors expect another last-minute pivot from the Trump administration.
Within less than 24 hours, President Trump’s latest tariff issuance has gone from no exemptions and no exclusions to include possible exemptions for Australia and China.
Global markets will be keeping a close eye on Wednesday’s US Consumer Price Index (CPI) inflation print, which is expected to show US inflation remaining stuck near 2.9% YoY.
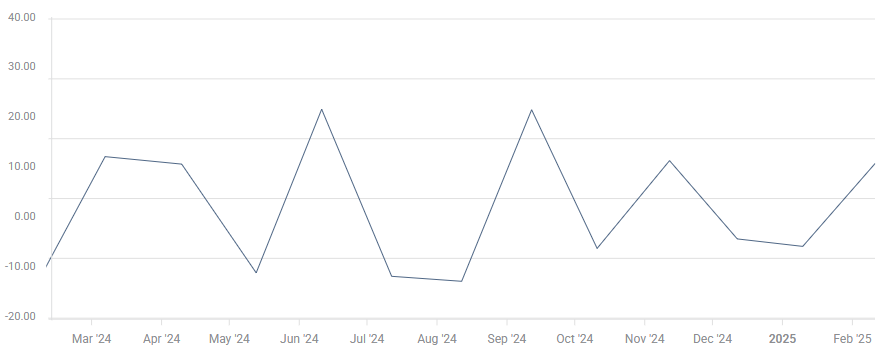
Canadian Building Permits
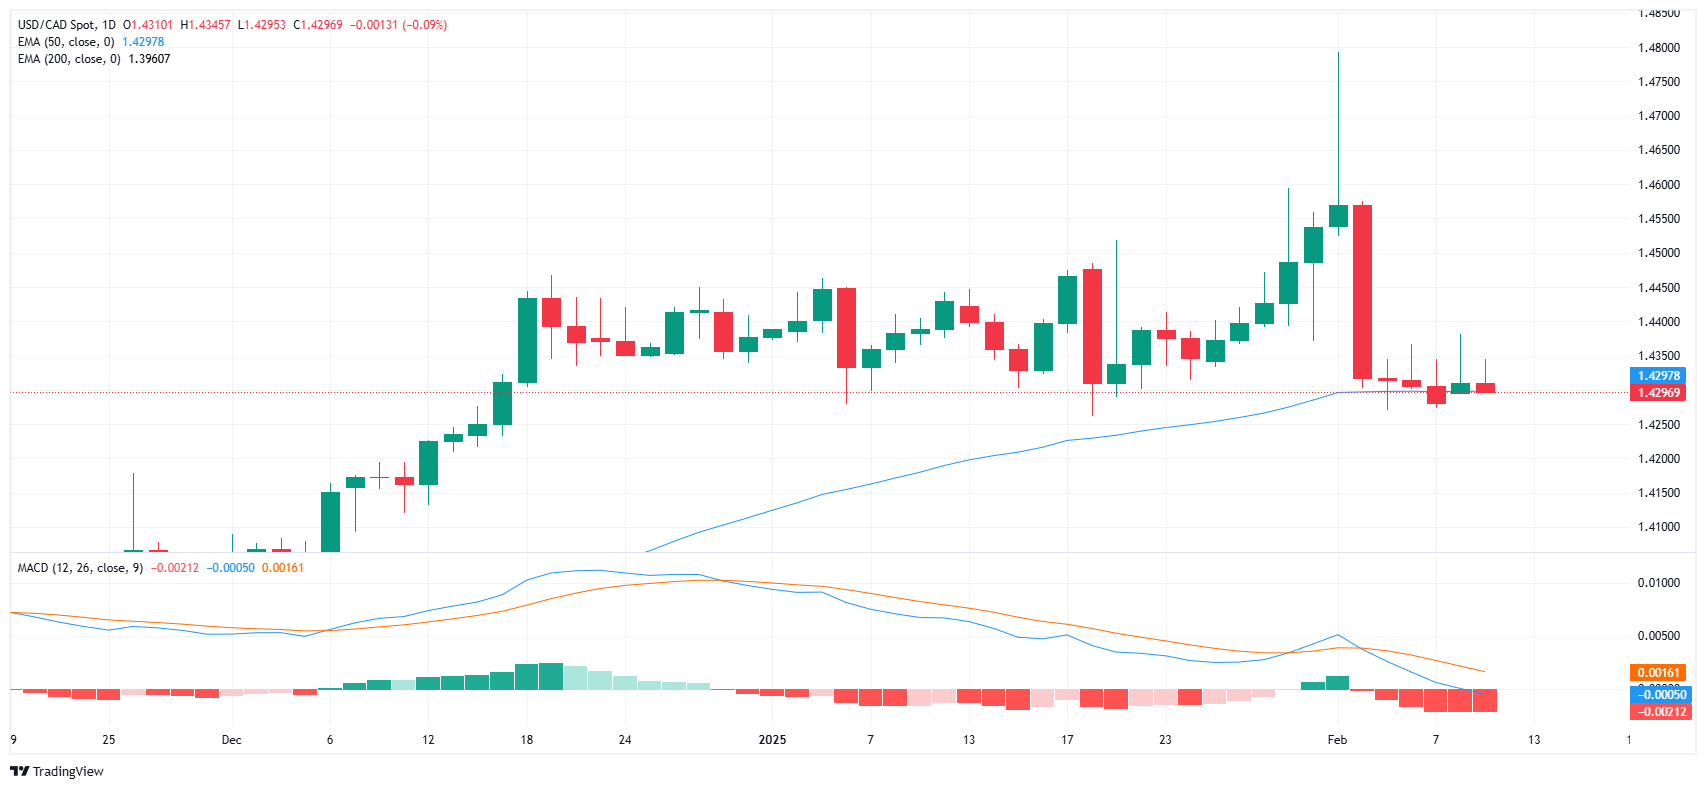
Canadian Dollar price forecast
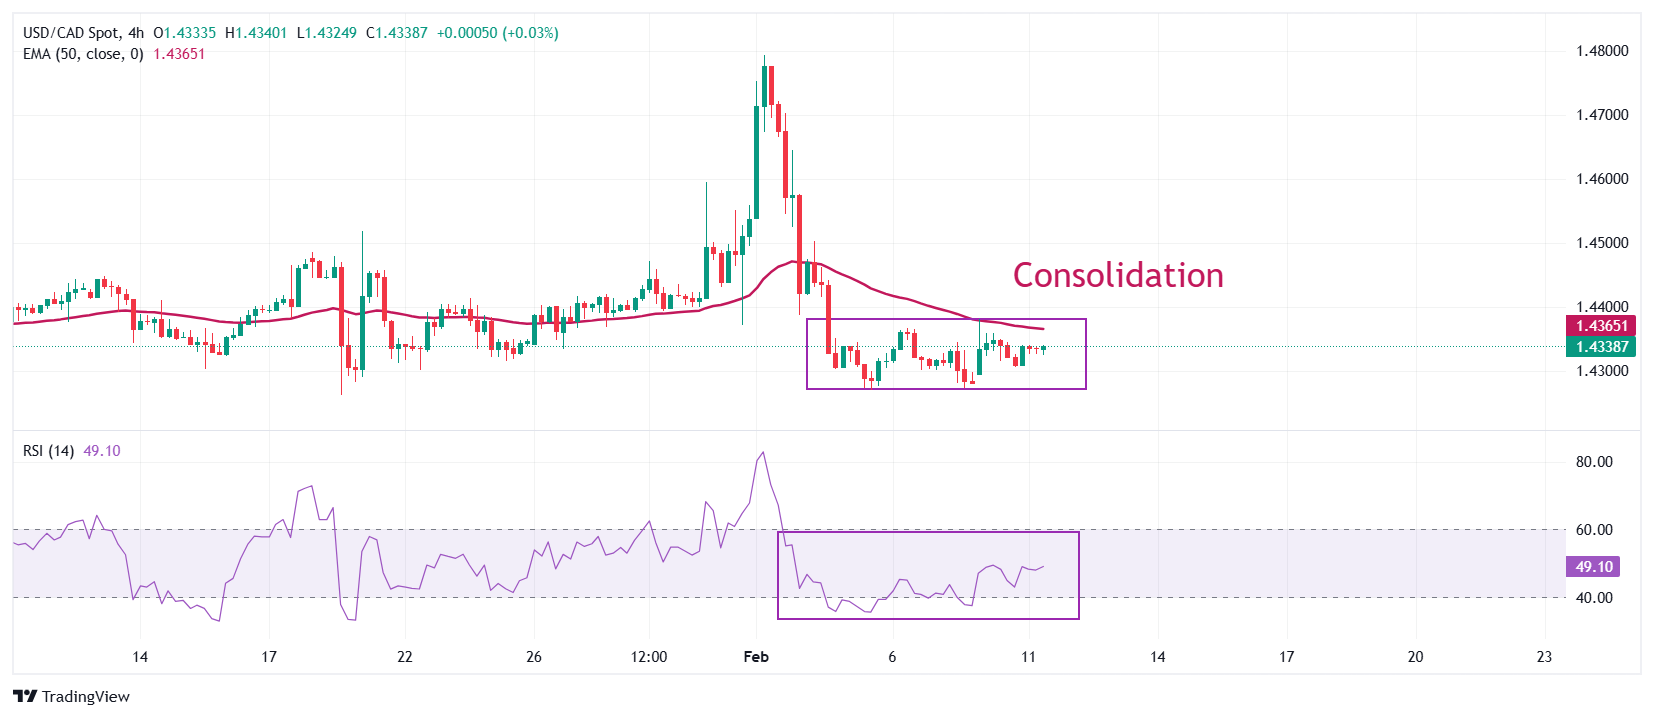
The Canadian Dollar (CAD) remains buried within consolidation against the Greenback. The Loonie briefly fell to its lowest point in two decades against the US Dollar last week, sending USD/CAD to its highest bids since 2002, but a walkback of President Trump’s tariff threats last week crippled any chance of a meaningful shift in the pair’s dynamic.
Near-term price action remains hobbled at the 50-day Exponential Moving Average (EMA) near the 1.4300 handle. Markets are awaiting a reason to risk betting on momentum in either direction, though Loonie bulls will have an eye on the 200-day EMA drifting toward 1.4000.
USD/CAD daily chart
Canadian Dollar FAQs
The key factors driving the Canadian Dollar (CAD) are the level of interest rates set by the Bank of Canada (BoC), the price of Oil, Canada’s largest export, the health of its economy, inflation and the Trade Balance, which is the difference between the value of Canada’s exports versus its imports. Other factors include market sentiment – whether investors are taking on more risky assets (risk-on) or seeking safe-havens (risk-off) – with risk-on being CAD-positive. As its largest trading partner, the health of the US economy is also a key factor influencing the Canadian Dollar.
The Bank of Canada (BoC) has a significant influence on the Canadian Dollar by setting the level of interest rates that banks can lend to one another. This influences the level of interest rates for everyone. The main goal of the BoC is to maintain inflation at 1-3% by adjusting interest rates up or down. Relatively higher interest rates tend to be positive for the CAD. The Bank of Canada can also use quantitative easing and tightening to influence credit conditions, with the former CAD-negative and the latter CAD-positive.
The price of Oil is a key factor impacting the value of the Canadian Dollar. Petroleum is Canada’s biggest export, so Oil price tends to have an immediate impact on the CAD value. Generally, if Oil price rises CAD also goes up, as aggregate demand for the currency increases. The opposite is the case if the price of Oil falls. Higher Oil prices also tend to result in a greater likelihood of a positive Trade Balance, which is also supportive of the CAD.
While inflation had always traditionally been thought of as a negative factor for a currency since it lowers the value of money, the opposite has actually been the case in modern times with the relaxation of cross-border capital controls. Higher inflation tends to lead central banks to put up interest rates which attracts more capital inflows from global investors seeking a lucrative place to keep their money. This increases demand for the local currency, which in Canada’s case is the Canadian Dollar.
Macroeconomic data releases gauge the health of the economy and can have an impact on the Canadian Dollar. Indicators such as GDP, Manufacturing and Services PMIs, employment, and consumer sentiment surveys can all influence the direction of the CAD. A strong economy is good for the Canadian Dollar. Not only does it attract more foreign investment but it may encourage the Bank of Canada to put up interest rates, leading to a stronger currency. If economic data is weak, however, the CAD is likely to fall.
The US Dollar set aside three consecutive daily advances on Tuesday, coming back to test the 108.00 region despite Chief Powell’s prudent tone at his semiannual testimony and ahead of the upcoming US CPI data release.
Here is what you need to know on Wednesday, February 12:
The US Dollar Index (DXY) revisited the 108.00 support despite higher US yields across the board and the cautious message from Chair Powell. The release of the Inflation Rate will be at the centre of the debate, seconded by another testimony by Chair Powell, MBA Mortgage Applications and the EIA’s weekly report on US crude oil inventories. In addition, the Fed’s Bostic and Waller are due to speak.
EUR/USD managed well to leave behind a three-day negative streak, advancing to two-day peaks near 1.0350. Germany’s Current Accounts results will be released along with the speech by the ECB’s Nagel.
In line with its risk-linked peers, GBP/USD picked up upside traction and climbed north of 1.2400 the figure to hit new weekly tops. The speech by the BoE’s Greene will be the sole release on the domestic docket.
USD/JPY added to the ongoing recovery, up for the third day in a row and retesting the 152.60 zone. The Japanese docket will only include January’s Machine Tool Orders.
AUD/USD kept Monday’s optimism well in place, although a move to the resistance area around 0.6300 remained elusive. Home Loans figures and Investment Lending for Homes will take centre stage.
WTI prices clinched their third daily gain in a row, surpassing the $73.00 mark per barrel on the back of the resumption of supply concerns.
Gold prices hit a record high past the $2,940 level per ounce troy, although that initial move rapidly fizzled out on the back of profit taking. Silver prices traded on the defensive, fading Monday’s uptick and breaking below the $32.00 mark per ounce.
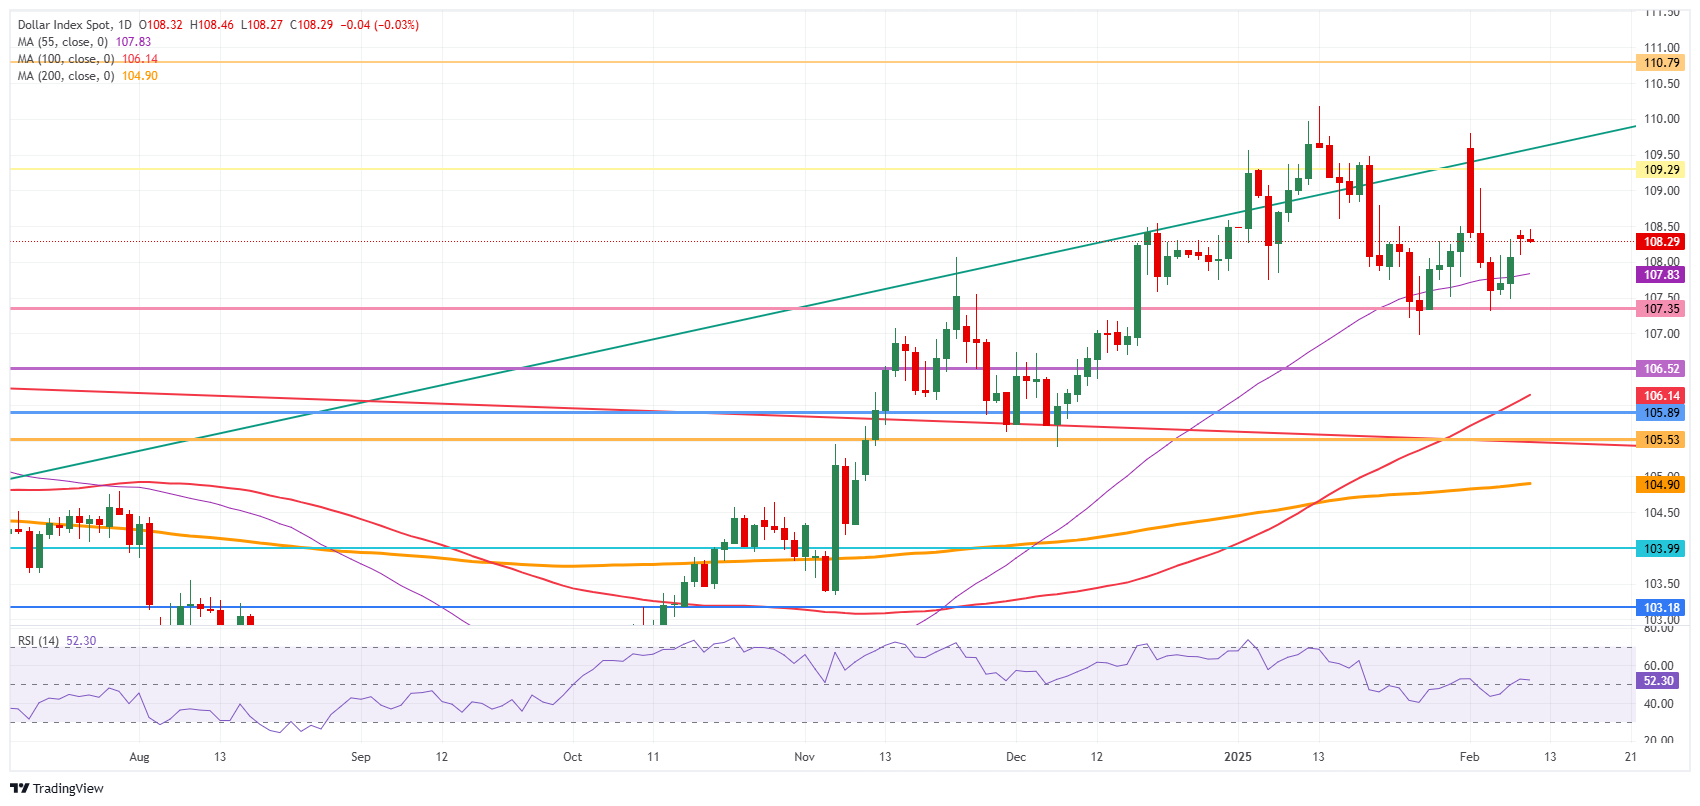
The US Dollar Index trades with losses for the second consecutive session on Tuesday, hovering above 108.00 without clear direction.
Federal Reserve Chair Jerome Powell signals no urgency to adjust monetary policy, keeping markets in a cautious stance.
The CME FedWatch Tool shows that markets are pricing in a hold at March’s meeting.
The US Dollar Index (DXY), which measures the value of the US Dollar against a basket of currencies, remains down for the second day after hearing from the head of the US central bank. Federal Reserve (Fed) Chair Jerome Powell's testimony to Congress emphasized a data-dependent approach, indicating that rates will stay steady unless inflation or labor conditions shift. This notion reduced the chance of a rate cut at the March meeting.
Daily digest market movers: US Dollar loses traction after Powell’s cautious testimony
The main market mover on Tuesday was Powell’s testimony before Congress, which wasn’t as hawkish as expected and might have weakened the USD.
The Fed Chair confirms no immediate changes to policy, keeping the 2% core inflation target intact.
Powell acknowledges inflation is still somewhat elevated but emphasizes patience in adjusting monetary policy.
He also highlighted concerns over long-term rates, stating they are driven by fiscal deficit and inflation expectations.
Equities remain mostly flat with investors digesting Powell’s neutral stance on interest rates and trade.
The CME FedWatch Tool indicates a 90% probability that the Fed will maintain rates at 4.25%-4.50% in March.
Elsewhere, the US 10-year yield climbs toward 4.55%, extending its rebound from a year-to-date low of 4.40% reached last week.
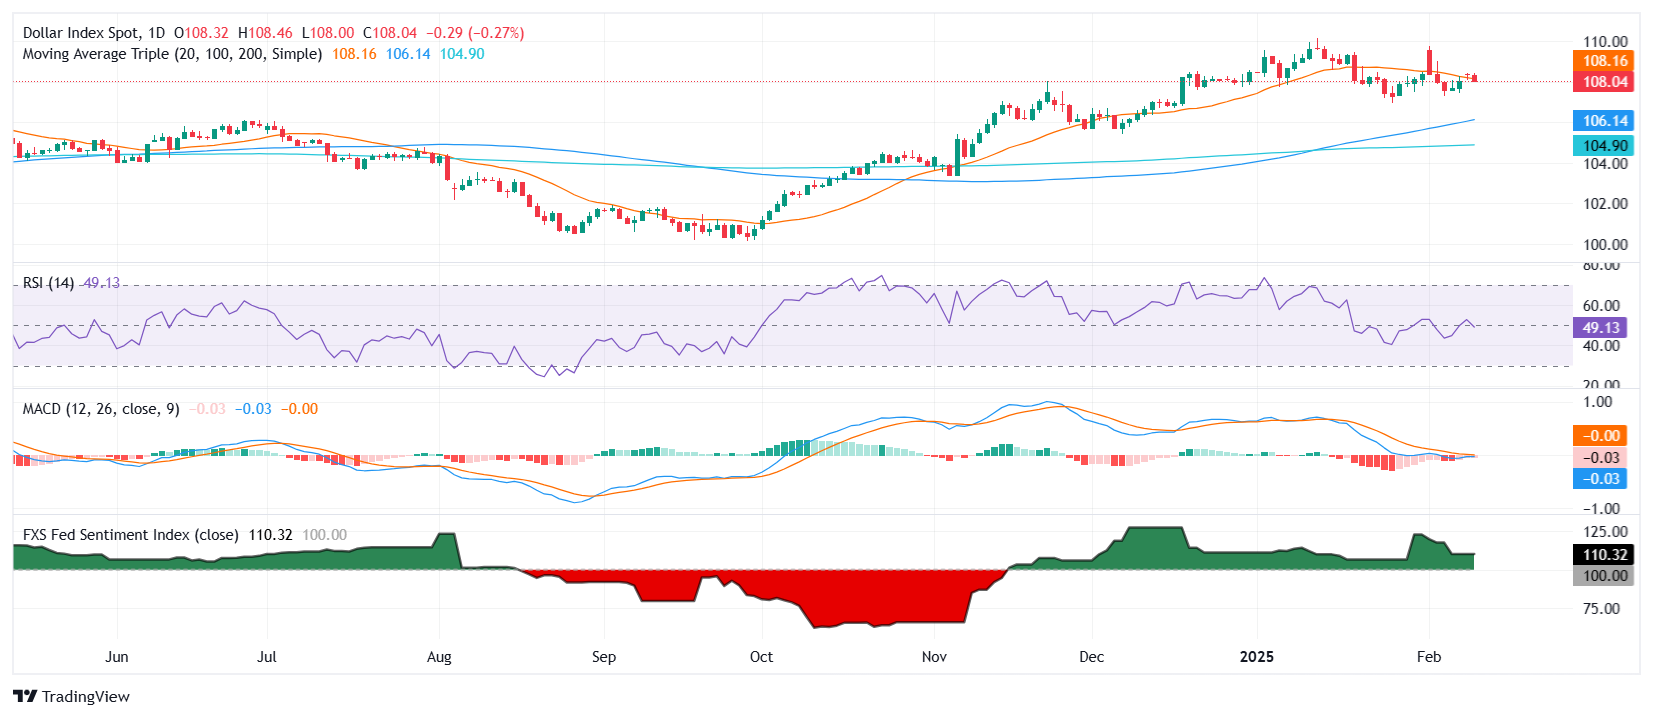
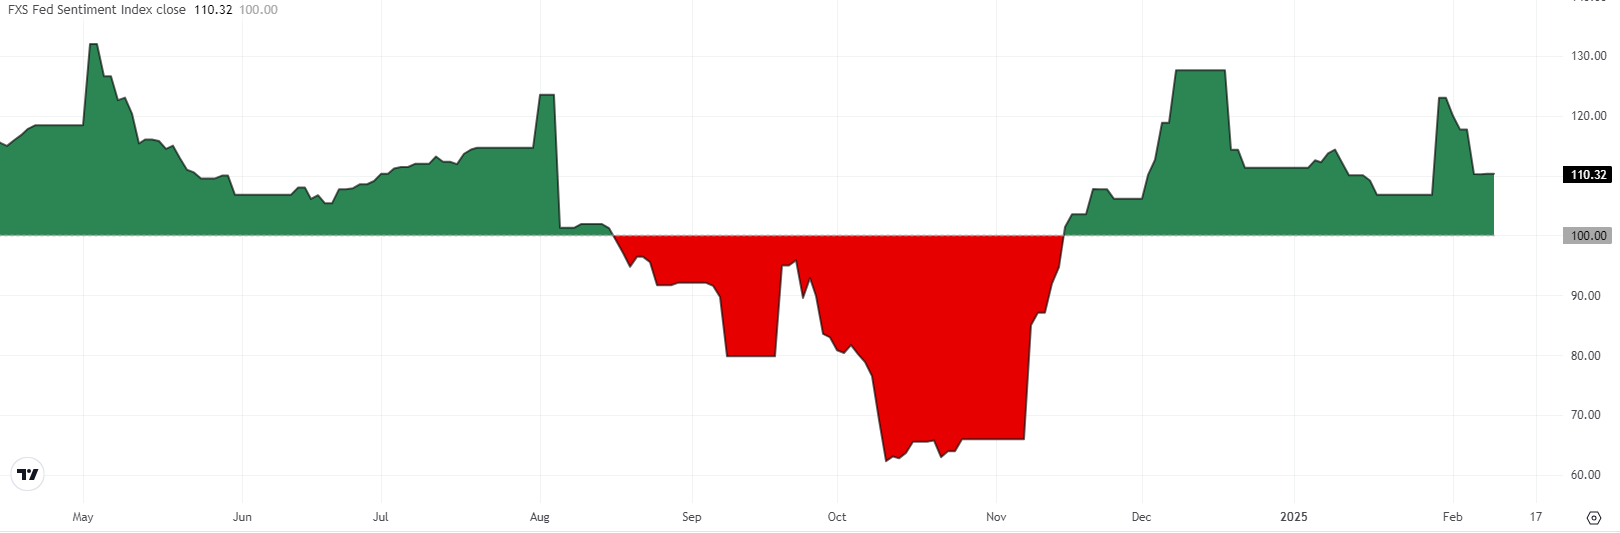
In fact the Fed's sentiment index on the daily chart signlas that the bank's hawkish tone has eased somewhat.
DXY technical outlook: Dollar weakens as key support levels come into play
The US Dollar Index struggles to maintain momentum, slipping below the 20-day Simple Moving Average (SMA) around 108.50. The Relative Strength Index (RSI) is drifting lower, approaching bearish territory below 50, signaling declining momentum. The Moving Average Convergence Divergence (MACD) histogram is turning negative, indicating growing bearish traction.
If selling pressure intensifies, immediate support lies at 108.00, followed by the psychological level of 107.50. On the upside, resistance is seen at 108.80 and the 109.20 zone, which could cap short-term rebounds.
US Dollar FAQs
The US Dollar (USD) is the official currency of the United States of America, and the ‘de facto’ currency of a significant number of other countries where it is found in circulation alongside local notes. It is the most heavily traded currency in the world, accounting for over 88% of all global foreign exchange turnover, or an average of $6.6 trillion in transactions per day, according to data from 2022. Following the second world war, the USD took over from the British Pound as the world’s reserve currency. For most of its history, the US Dollar was backed by Gold, until the Bretton Woods Agreement in 1971 when the Gold Standard went away.
The most important single factor impacting on the value of the US Dollar is monetary policy, which is shaped by the Federal Reserve (Fed). The Fed has two mandates: to achieve price stability (control inflation) and foster full employment. Its primary tool to achieve these two goals is by adjusting interest rates. When prices are rising too quickly and inflation is above the Fed’s 2% target, the Fed will raise rates, which helps the USD value. When inflation falls below 2% or the Unemployment Rate is too high, the Fed may lower interest rates, which weighs on the Greenback.
In extreme situations, the Federal Reserve can also print more Dollars and enact quantitative easing (QE). QE is the process by which the Fed substantially increases the flow of credit in a stuck financial system. It is a non-standard policy measure used when credit has dried up because banks will not lend to each other (out of the fear of counterparty default). It is a last resort when simply lowering interest rates is unlikely to achieve the necessary result. It was the Fed’s weapon of choice to combat the credit crunch that occurred during the Great Financial Crisis in 2008. It involves the Fed printing more Dollars and using them to buy US government bonds predominantly from financial institutions. QE usually leads to a weaker US Dollar.
Quantitative tightening (QT) is the reverse process whereby the Federal Reserve stops buying bonds from financial institutions and does not reinvest the principal from the bonds it holds maturing in new purchases. It is usually positive for the US Dollar.
18:03
United States 3-Year Note Auction dipped from previous 4.332% to 4.3%
The Dow Jones held steady as investors digest Fed Chair remarks.
Markets are brushing off the latest batch of tariff threats.
Key US inflation data looms ahead this week.
The Dow Jones Industrial Average (DJIA) is mostly on balance on Tuesday, holding steady near 44,500 after Federal Reserve (Fed) Chair Jerome Powell signaled that the Fed is willing to wait as long as necessary to make sure the economy is stable and further progress on inflation will be made before cutting rates again. United States (US) President Donald Trump escalated his ongoing efforts to spark a global trade war between the US and everybody else. Investors are banking on another last-minute resolution and shrugging off President Trump’s tariff bluster.
Fed Chair Powell reiterated most of his recent talking points when he presented the Fed’s Monetary Policy Report to the Senate Banking Committee on Tuesday. The Fed head noted that neutral rates have likely risen since the 2020 pandemic and that the Fed is comfortable holding interest rates where they are for the time being unless a drastic shift in US labor or inflation figures presents itself.
US President Donald Trump launched a fresh round of tariff threats this week, but market participants are getting used to his “all bark, no bite” approach to blustery trade statements. Since the pre-election campaign trail, President Trump has been kicking the can down the road on his own tariff threats, promising day-one widespread tariffs that have yet to appear outside of a meager tariff increase on Chinese goods.
The latest batch of still-hypothetical tariffs that Donald Trump signed into pseudo-existence this week is a wide, catch-all 25% tariff on all steel and aluminum imports into the US, with warnings that the Trump administration will give no exemptions or exceptions to anyone, and will be looking at automobiles and microchips next. According to reporting, potential exemptions have already been floated toward both Australia and China, and the tariffs themselves may not come into effect until March 12. After a heady spin around the tariff threat carousel last week, investors are now chalking President Trump’s tariff threats up to strong-armed negotiating, and that another reason to stall actually implementing the tariffs will be found at the eleventh hour.
Dow Jones news
The Dow Jones is roughly balanced at the midpoint on Tuesday, though some major players are finding room to move higher and keeping the index tilted into the bullish side. Salesforce (CRM) withered around 1.4% to fall below $323 per share as the AI-driven tech sector stutters. Coca-Cola (KO) rose 3.5%, climbing to $67 per share after beating Wall Street earnings forecasts, and Apple also gained ground, moving 3.2% higher to $235 per share.
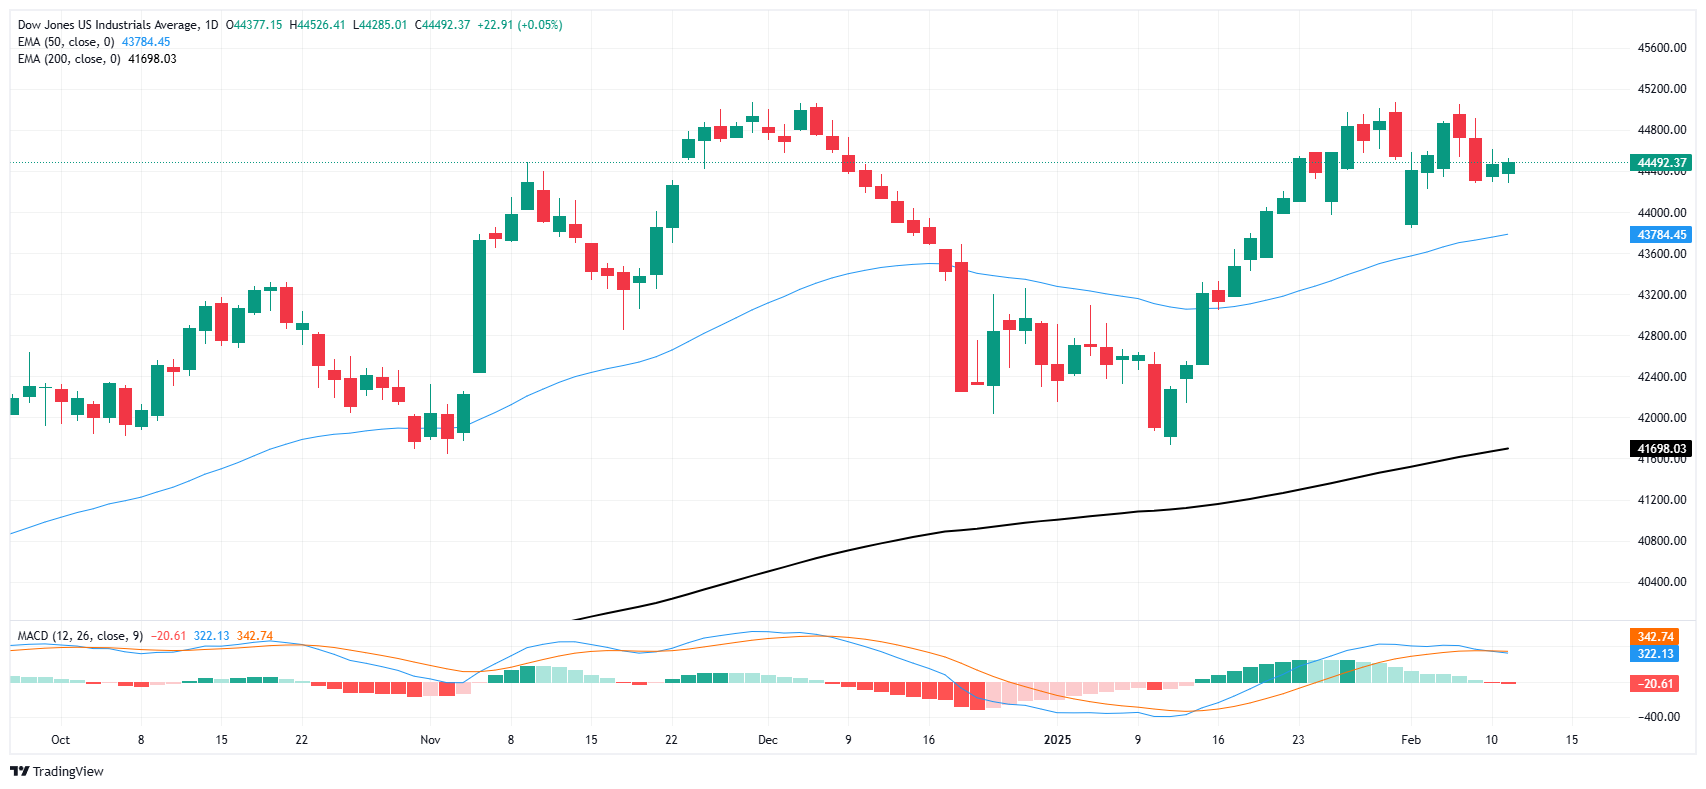
Dow Jones price forecast
The Dow Jones is looking higher but treading water for the time being, holding close to record high territory as bidders try to gather momentum. The major equity index got knocked lower last week on tariff threats, testing the 44,00 handle, but investor risk appetite remained firm enough to find a technical floor and keep price action on the high side.
The trend is still leaning into the top end, but it’s been a while since the Dow Jones could chalk in a new record high, with 45,071 being the current number to beat, set in late November. The ongoing bullish trend remains well intact, with DJIA outrunning its own 200-day Exponential Moving Average (EMA) for 15 straight months. The 200-day EMA is well below current price action, rising into the 42,000 level.
Dow Jones daily chart
Dow Jones FAQs
The Dow Jones Industrial Average, one of the oldest stock market indices in the world, is compiled of the 30 most traded stocks in the US. The index is price-weighted rather than weighted by capitalization. It is calculated by summing the prices of the constituent stocks and dividing them by a factor, currently 0.152. The index was founded by Charles Dow, who also founded the Wall Street Journal. In later years it has been criticized for not being broadly representative enough because it only tracks 30 conglomerates, unlike broader indices such as the S&P 500.
Many different factors drive the Dow Jones Industrial Average (DJIA). The aggregate performance of the component companies revealed in quarterly company earnings reports is the main one. US and global macroeconomic data also contributes as it impacts on investor sentiment. The level of interest rates, set by the Federal Reserve (Fed), also influences the DJIA as it affects the cost of credit, on which many corporations are heavily reliant. Therefore, inflation can be a major driver as well as other metrics which impact the Fed decisions.
Dow Theory is a method for identifying the primary trend of the stock market developed by Charles Dow. A key step is to compare the direction of the Dow Jones Industrial Average (DJIA) and the Dow Jones Transportation Average (DJTA) and only follow trends where both are moving in the same direction. Volume is a confirmatory criteria. The theory uses elements of peak and trough analysis. Dow’s theory posits three trend phases: accumulation, when smart money starts buying or selling; public participation, when the wider public joins in; and distribution, when the smart money exits.
There are a number of ways to trade the DJIA. One is to use ETFs which allow investors to trade the DJIA as a single security, rather than having to buy shares in all 30 constituent companies. A leading example is the SPDR Dow Jones Industrial Average ETF (DIA). DJIA futures contracts enable traders to speculate on the future value of the index and Options provide the right, but not the obligation, to buy or sell the index at a predetermined price in the future. Mutual funds enable investors to buy a share of a diversified portfolio of DJIA stocks thus providing exposure to the overall index.
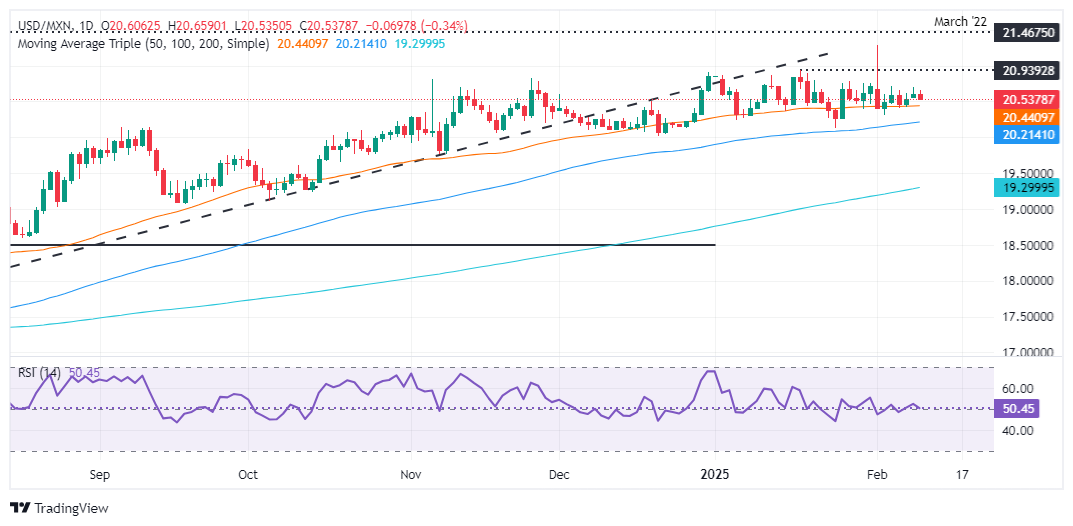
Mexican Peso shows resilience despite 25% US tariffs on steel and aluminum set for March 12.
Fed Chair Jerome Powell's latest comments underscore a less restrictive policy stance, affirming economic strength.
Mexico's Industrial Production deteriorates, but Peso benefits from market dynamics despite Banxico's dovish tilt.
The Mexican Peso (MXN) remains steady against the Greenback on Tuesday after finishing Monday’s session with losses of 0.35%. Still, it stages a comeback as United States (US) President Donald Trump imposes 25% tariffs on Mexican steel and aluminum, expected to be effective March 12. Contrarily to depreciating, the Mexican currency strengthens slightly and the USD/MXN pair trades at 20.59, down 0.23%, after hitting a daily high of 20.65.
Federal Reserve (Fed) Chairman Jerome Powell has crossed the wires as of this writing. He said the Fed’s policy stance is less restrictive than it had been, adding that the economy remains strong and that “we do not need to be in a hurry to adjust our policy stance.”
Powell reiterated that monetary policy is in a good place and the US is not in a recession.
In Mexico, Industrial Production continued to deteriorate in December, highlighting the country's economic slowdown. Despite this and Banco de Mexico's (Banxico) dovish approach, the Peso has extended its gains.
Ahead this week, the US economic docket will feature the US inflation figures on the consumer and the producer side, along with further Federal Reserve speakers.
Mexico’s Industrial Production (IP) in December plunged -1.4% MoM, below the -0.5% contraction expected by economists. In the twelve months to December, IP plummeted -2.7%, shrinking more than November’s -1.4%.
On Monday, Banxico Governor Victoria Rodriguez Ceja was dovish and revealed that the central bank could cut rates of the same magnitude as in February, adding that the job of bringing inflation to the 3% goal has not concluded.
Rodriguez added that Banxico remains attentive to what might happen in March after the 30-day grace period provided by Trump.
Cleveland’s Fed President Beth Hammack commented that she favors holding rates steady for some time so the Fed can assess the economy. She added that the policy is ‘modestly restrictive’ and emphasized that it is still unclear whether inflation will keep moving towards the Fed’s 2% goal.
Trade disputes between the US and Mexico remain in the boiler room. Although the countries found common ground previously, USD/MXN traders should know that there is a 30-day pause and that tensions could arise toward the end of February.
Money market fed funds rate futures are pricing in 38.5 basis points (bps) of easing by the Fed in 2025.
USD/MXN technical outlook: Mexican Peso to remain range-bound
The USD/MXN pair uptrend remains intact, but Tuesday’s price action shows the emerging market currency's resilience. During the last four days, the pair has remained within the 20.30 – 20.70 area, with momentum slightly tilted to the upside, as depicted by the Relative Strength Index (RSI).
For a bullish continuation, buyers need to reclaim 20.70 before challenging the January 17 high at 20.90. Once surpassed, the next stop would be 21.00, followed by the year-to-date (YTD) at 21.29. On the flip side, sellers are driving the exchange rate below the 50-day Simple Moving Average (SMA) at 20.54, and the pair would be poised to test 20.00, but first bears need to clear the 100-day SMA at 20.22.
Mexican Peso FAQs
The Mexican Peso (MXN) is the most traded currency among its Latin American peers. Its value is broadly determined by the performance of the Mexican economy, the country’s central bank’s policy, the amount of foreign investment in the country and even the levels of remittances sent by Mexicans who live abroad, particularly in the United States. Geopolitical trends can also move MXN: for example, the process of nearshoring – or the decision by some firms to relocate manufacturing capacity and supply chains closer to their home countries – is also seen as a catalyst for the Mexican currency as the country is considered a key manufacturing hub in the American continent. Another catalyst for MXN is Oil prices as Mexico is a key exporter of the commodity.
The main objective of Mexico’s central bank, also known as Banxico, is to maintain inflation at low and stable levels (at or close to its target of 3%, the midpoint in a tolerance band of between 2% and 4%). To this end, the bank sets an appropriate level of interest rates. When inflation is too high, Banxico will attempt to tame it by raising interest rates, making it more expensive for households and businesses to borrow money, thus cooling demand and the overall economy. Higher interest rates are generally positive for the Mexican Peso (MXN) as they lead to higher yields, making the country a more attractive place for investors. On the contrary, lower interest rates tend to weaken MXN.
Macroeconomic data releases are key to assess the state of the economy and can have an impact on the Mexican Peso (MXN) valuation. A strong Mexican economy, based on high economic growth, low unemployment and high confidence is good for MXN. Not only does it attract more foreign investment but it may encourage the Bank of Mexico (Banxico) to increase interest rates, particularly if this strength comes together with elevated inflation. However, if economic data is weak, MXN is likely to depreciate.
As an emerging-market currency, the Mexican Peso (MXN) tends to strive during risk-on periods, or when investors perceive that broader market risks are low and thus are eager to engage with investments that carry a higher risk. Conversely, MXN tends to weaken at times of market turbulence or economic uncertainty as investors tend to sell higher-risk assets and flee to the more-stable safe havens.
EUR/USD rises on Tuesday, trading at 1.0335 as momentum builds.
Indicators show improving bullish traction, with the pair extending gains above the 20-day SMA.
Fundamental drivers take center stage, with Powell’s remarks before Congress likely to dictate the next move.
EUR/USD continued its upward trajectory on Tuesday, gaining 0.30% to trade at 1.0335 as buyers extended their control above the 20-day Simple Moving Average (SMA). The pair’s technical outlook appears increasingly constructive, though the upcoming testimony by Federal Reserve (Fed) Chair Jerome Powell may introduce fresh volatility.
Technical indicators point to strengthening bullish momentum. The Relative Strength Index (RSI) has climbed sharply to 46, signaling growing buying interest despite remaining in negative territory. Meanwhile, the Moving Average Convergence Divergence (MACD) histogram is printing green bars, suggesting that bearish pressure has stalled, though a decisive shift into bullish territory is still needed.
Looking ahead, Powell’s testimony before Congress will be the key catalyst for EUR/USD’s next move. Any indication of a shift in monetary policy expectations could drive further volatility. The first key resistance lies near 1.0350, with a break above this level opening the door toward 1.0400. On the downside, immediate support is seen at 1.0280, followed by the psychological 1.0250 handle.
The British Pound resumed its uptrend early on Tuesday morning following the latest US President Trump tariff round, which included base metals like aluminum and steel. The Greenback weakened, as seen by the GBP/USD pair trading above 1.2400, gaining 0.31%.
British Pound ascends amid new US tariffs and cautious central bank rhetoric
Wall Street is set to open in the red, with traders turning risk-averse after Trump signed a proclamation to reimpose a 25% tariff on steel and aluminum imports, effective March 12. In the meantime, a slight economic docket, mainly driven by Federal Reserve speakers, leaves traders awaiting Fed Chair Jerome Powell's testimony at the US Congress.
In the meantime, Cleveland’s Fed President Beth Hammack commented that she favors holding rates steady for some time so the Fed can assess the economy. She added that policy is ‘modestly restrictive’ and emphasized that it is still unclear whether inflation will keep moving towards the Fed’s 2% goal.
Across the Pond, Bank of England (BoE) member Catherine Mann voted for a 50 basis points (bps) interest rate cut last week, joining Swati Dhingra. Mann was a well-known uber-hawk in the BoE.
Mann said that she still views restrictive monetary policy as necessary and sees the long-term R-star or neutral rate at the higher end of the 3.0% - 3.5% range, given by BoE's latest survey of investors. She added, “I choose 50 basis points now, along with continued restrictiveness in the future and a higher long-term Bank Rate to 'cut through the noise.’”
GBP/USD Price Forecast: Technical outlook
Given the fundamental backdrop, the GBP/USD extended its gains after printing an ‘inverted hammer’ preceded by a downtrend. Nevertheless, the downward pressure stills unless buyers clear the 50-day Simple Moving Average (SMA) at 1.2479, which could expose the latest cycle high at 1.2549, February’s 5 peak.
In that outcome, the GBP/USD would extend its rally and challenge the 100-day SMA at 1.2718. Conversely, if the pair drops below 1.2400, sellers could drive the exchange rate towards the February 3 daily low of 1.2248.
British Pound PRICE Today
The table below shows the percentage change of British Pound (GBP) against listed major currencies today. British Pound was the strongest against the Swiss Franc.
USD
EUR
GBP
JPY
CAD
AUD
NZD
CHF
USD
-0.22%
-0.29%
0.21%
0.06%
-0.10%
-0.16%
0.22%
EUR
0.22%
-0.09%
0.42%
0.28%
0.12%
0.06%
0.45%
GBP
0.29%
0.09%
0.51%
0.36%
0.19%
0.13%
0.52%
JPY
-0.21%
-0.42%
-0.51%
-0.14%
-0.31%
-0.37%
0.02%
CAD
-0.06%
-0.28%
-0.36%
0.14%
-0.16%
-0.22%
0.16%
AUD
0.10%
-0.12%
-0.19%
0.31%
0.16%
-0.07%
0.32%
NZD
0.16%
-0.06%
-0.13%
0.37%
0.22%
0.07%
0.38%
CHF
-0.22%
-0.45%
-0.52%
-0.02%
-0.16%
-0.32%
-0.38%
The heat map shows percentage changes of major currencies against each other. The base currency is picked from the left column, while the quote currency is picked from the top row. For example, if you pick the British Pound from the left column and move along the horizontal line to the US Dollar, the percentage change displayed in the box will represent GBP (base)/USD (quote).
Silver price discovers temporary support near $31.30 as the US Dollar drops ahead of Fed Powell’s testimony before Congress.
Fed Powell guided that interest rates will remain at their current levels in the January policy meeting.
Deepening fears of a global trade war would keep the Silver price in the frontfoot.
Silver price (XAG/USD) finds a temporary cushion near $31.30 in Tuesday’s North American session after declining sharply earlier in the day. The white metal gauges little buying interest as the US Dollar (USD) drops ahead of Federal Reserve (Fed) Chair Jerome Powell’s testimony before Congress.
The US Dollar Index (DXY), which tracks the Greenback’s value against six major currencies, faces slight pressure and drops to near 108.20.
Market participants will pay close attention to the Fed Powell’s commentary on the interest rate outlook. In January, Powell said in the press conference after interest rates remained steady that monetary policy adjustments won’t be appropriate unless officials see “real progress in inflation or at least some weakness in the labor market”.
By that time, the major catalyst for the Fed to assess the monetary policy stance had been the United States (US) Nonfarm Payrolls (NFP) data for January, which showed that the Unemployment Rate decelerated to 4% and employment numbers missed estimates due to extreme weather events.
However, the overall outlook of the Silver price remains firm due to heightened fears of a global trade war. On Monday, US President Donald Trump signed executive orders to impose 25% tariffs on imports of steel and aluminum, without exemptions and exceptions, and guided that there will be reciprocal tariffs in the coming days. Historically, the appeal of precious metals, such as Silver, increases in an uncertain global environment.
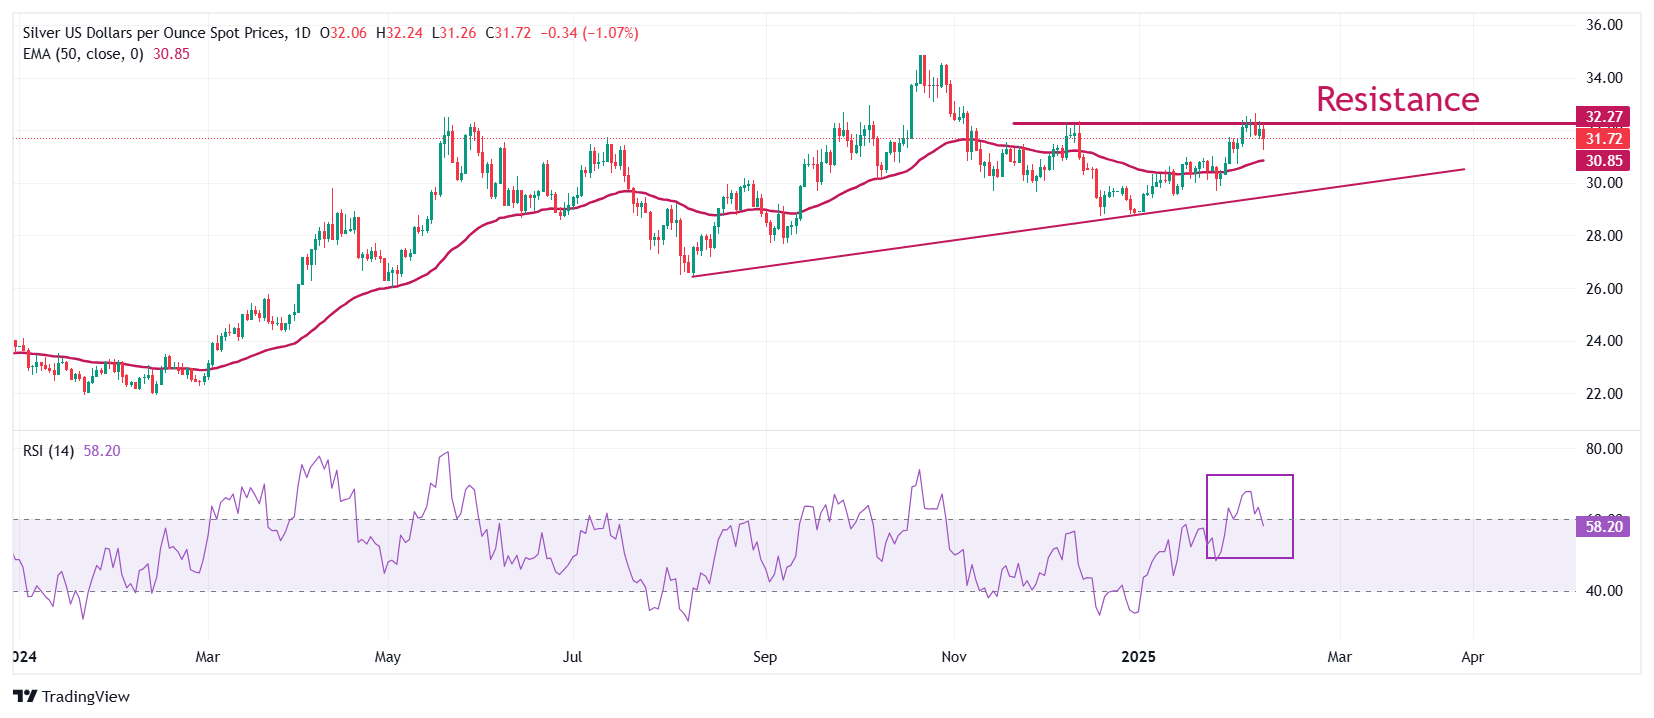
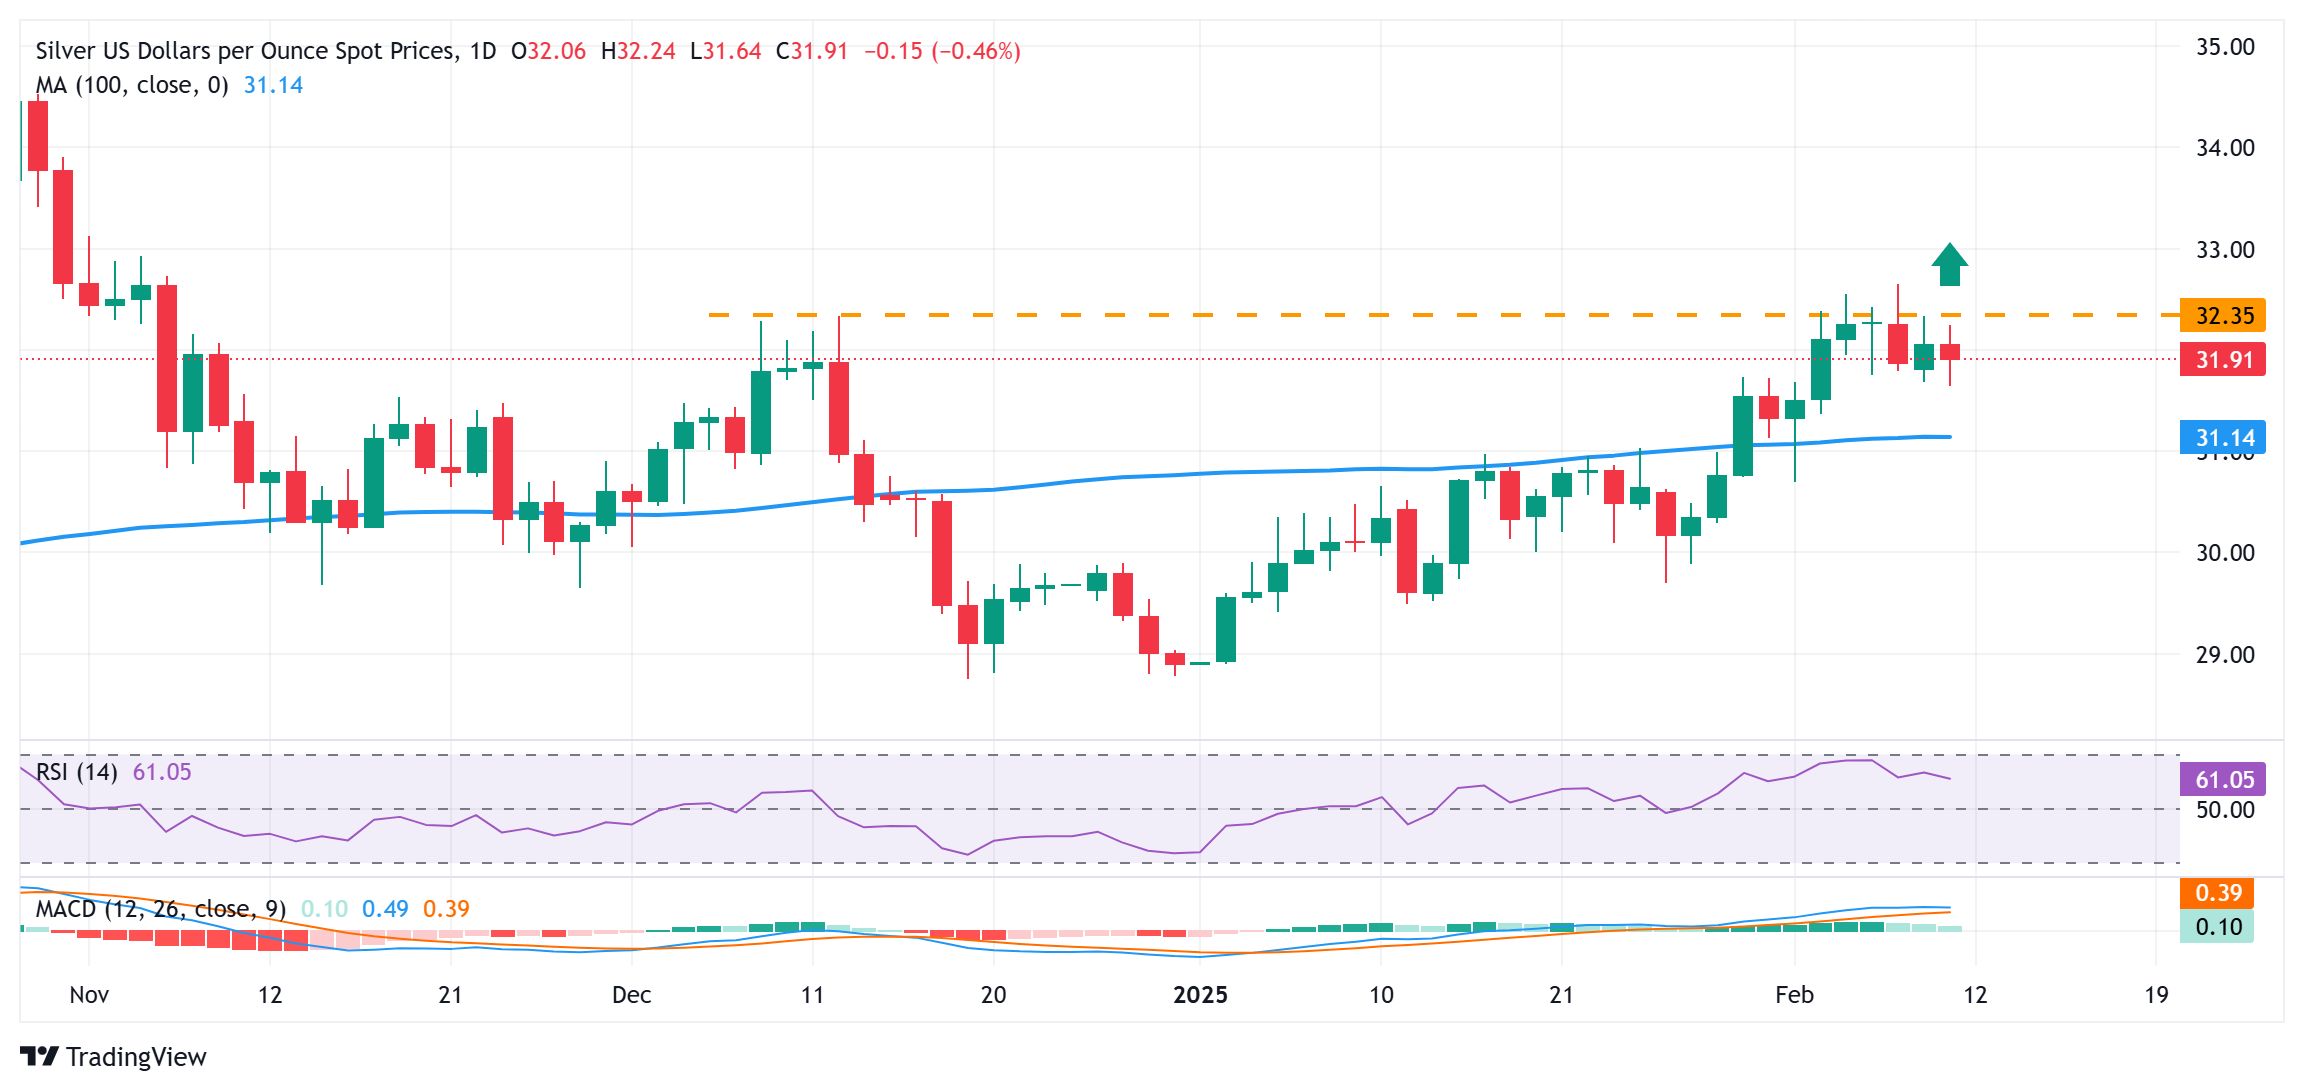
Silver technical analysis
Silver price continues to face pressure near the immediate resistance of $32.50, which is plotted from the December 9 high. The outlook of the white metal remains bullish as it holds above the 50-day Exponential Moving Average (EMA), which trades around $30.85.
The 14-day Relative Strength Index (RSI) falls back inside the 40.00-60.00 range, suggesting that the momentum is not bullish for now. However, the upside bias is intact.
Looking down, the upward-sloping trendline from the August 8 low of $26.45 will be the key support for the Silver price around $29.50. While, the October 31 high of $33.90 will be the key barrier.
Silver daily chart
Silver FAQs
Silver is a precious metal highly traded among investors. It has been historically used as a store of value and a medium of exchange. Although less popular than Gold, traders may turn to Silver to diversify their investment portfolio, for its intrinsic value or as a potential hedge during high-inflation periods. Investors can buy physical Silver, in coins or in bars, or trade it through vehicles such as Exchange Traded Funds, which track its price on international markets.
Silver prices can move due to a wide range of factors. Geopolitical instability or fears of a deep recession can make Silver price escalate due to its safe-haven status, although to a lesser extent than Gold's. As a yieldless asset, Silver tends to rise with lower interest rates. Its moves also depend on how the US Dollar (USD) behaves as the asset is priced in dollars (XAG/USD). A strong Dollar tends to keep the price of Silver at bay, whereas a weaker Dollar is likely to propel prices up. Other factors such as investment demand, mining supply – Silver is much more abundant than Gold – and recycling rates can also affect prices.
Silver is widely used in industry, particularly in sectors such as electronics or solar energy, as it has one of the highest electric conductivity of all metals – more than Copper and Gold. A surge in demand can increase prices, while a decline tends to lower them. Dynamics in the US, Chinese and Indian economies can also contribute to price swings: for the US and particularly China, their big industrial sectors use Silver in various processes; in India, consumers’ demand for the precious metal for jewellery also plays a key role in setting prices.
Silver prices tend to follow Gold's moves. When Gold prices rise, Silver typically follows suit, as their status as safe-haven assets is similar. The Gold/Silver ratio, which shows the number of ounces of Silver needed to equal the value of one ounce of Gold, may help to determine the relative valuation between both metals. Some investors may consider a high ratio as an indicator that Silver is undervalued, or Gold is overvalued. On the contrary, a low ratio might suggest that Gold is undervalued relative to Silver.
The Pound Sterling (GBP) is little changed on the session, Scotiabank's Chief FX Strategist Shaun Osborne notes.
GBP little changed
"BoE rate setter Mann justified her sudden switch from rate hawk to dove with the need to 'cut through the noise', suggesting that she feels her colleagues are moving too slowly on cuts. Governor Bailey clearly favours a cautious and gradual approach to easing, however."
"Cable’s drift back from last week’s high has steadied around the 61.8% retracement of the Monday/Wednesday rally. Intraday price action looks mildly positive, with spot forming a bullish outside range on the 6-hour chart through European dealing. GBP gains through 1.2380 in our session may drive a little more strength towards 1.2425/50 in the short run. Support is 1.2325."
NZD/USD trades sideways around 0.5650 ahead of Fed Chair Powell’s testimony.
Fed Powell is unlikely to provide a timeline for the central bank's resume of its policy-easing cycle.
The RBNZ is expected to continue reducing interest rates due to the weak labor market.
The NZD/USD pair trades flat around 0.5650 in the North American session on Tuesday. The Kiwi pair exhibits indecisiveness, with investors focusing on the Federal Reserve (Fed) Chair Jerome Powell’s testimony at the Capitol Hill at 15:00 GMT.
Ahead of Fed Powell’s testimony, the US Dollar Index (DXY), which tracks the Greenback’s value against six major currencies, trades subduedly around 108.30.
Investors await Fed Powell’s speech to get cues about the monetary policy outlook. The Fed left its interest rates in the range of 4.25%-4.50% in the January policy meeting, and Powell guided that monetary policy adjustments would be appropriate only when officials would see “real progress in inflation and at least some weakness in the labor market.
Market participants would also like to know the impact of 25% tariffs on imports of steel and aluminum, imposed by United States (US) President Donald Trump on Monday, on the inflation outlook. Market experts believe that Trump’s international agenda will be inflationary for the economy.
This week, the New Zealand Dollar (NZD) will be guided by market expectations for the Reserve Bank of New Zealand’s (RBNZ) interest rate decision on February 19 due to the light economic calendar. The RBNZ has already reduced its Official Cash Rate (OCR) by 125 basis points (bps) to 4.25% and investors expect the central bank to continue easing the monetary policy further due to weakness in the job market.
New Zealand Dollar FAQs
The New Zealand Dollar (NZD), also known as the Kiwi, is a well-known traded currency among investors. Its value is broadly determined by the health of the New Zealand economy and the country’s central bank policy. Still, there are some unique particularities that also can make NZD move. The performance of the Chinese economy tends to move the Kiwi because China is New Zealand’s biggest trading partner. Bad news for the Chinese economy likely means less New Zealand exports to the country, hitting the economy and thus its currency. Another factor moving NZD is dairy prices as the dairy industry is New Zealand’s main export. High dairy prices boost export income, contributing positively to the economy and thus to the NZD.
The Reserve Bank of New Zealand (RBNZ) aims to achieve and maintain an inflation rate between 1% and 3% over the medium term, with a focus to keep it near the 2% mid-point. To this end, the bank sets an appropriate level of interest rates. When inflation is too high, the RBNZ will increase interest rates to cool the economy, but the move will also make bond yields higher, increasing investors’ appeal to invest in the country and thus boosting NZD. On the contrary, lower interest rates tend to weaken NZD. The so-called rate differential, or how rates in New Zealand are or are expected to be compared to the ones set by the US Federal Reserve, can also play a key role in moving the NZD/USD pair.
Macroeconomic data releases in New Zealand are key to assess the state of the economy and can impact the New Zealand Dollar’s (NZD) valuation. A strong economy, based on high economic growth, low unemployment and high confidence is good for NZD. High economic growth attracts foreign investment and may encourage the Reserve Bank of New Zealand to increase interest rates, if this economic strength comes together with elevated inflation. Conversely, if economic data is weak, NZD is likely to depreciate.
The New Zealand Dollar (NZD) tends to strengthen during risk-on periods, or when investors perceive that broader market risks are low and are optimistic about growth. This tends to lead to a more favorable outlook for commodities and so-called ‘commodity currencies’ such as the Kiwi. Conversely, NZD tends to weaken at times of market turbulence or economic uncertainty as investors tend to sell higher-risk assets and flee to the more-stable safe havens.
ECB President Lagarde told EU lawmakers yesterday that inflationary pressures were easing and the central bank was on target to reach its 2% inflation goal this year, Scotiabank's Chief FX Strategist Shaun Osborne notes.
EUR holds range around 1.03
"Lagarde cautioned that trade tensions posed a risk for the outlook, however. Markets continue to anticipate at least another 75bps of easing from the ECB over the balance of the year. Heightened trade tensions in the coming months will add to easing bets and keep the EUR on the defensive."
"Spot is holding around the mid-point of the wide range that developed early last week. The EUR has found some support below 1.03 so far this week but faces resistance around 1.0355 that low volume/low conviction trading may struggle to overcome. Look for more range trading around the figure for now."
The Canadian Dollar (CAD) is softer in response to the latest tariff threat from the US, Scotiabank's Chief FX Strategist Shaun Osborne notes.
CAD holds consolidation range
"But the CAD’s loss is relatively minor and spot is holding within yesterday’s range and is still trading a little below estimated fair value (unchanged this morning at 1.4387). Tariff threats will keep markets guessing about the outlook for BoC policy."
"March pricing is a little better than 50/50 for a cut at this point—policymakers may not have enough information to make the call at that point—but April swaps are pricing in 31bps of easing—up a couple of ticks from yesterday. Wide/wider short-term spreads will remain a major drag on the CAD’s broader outlook."
"Spot is holding within a fairly tight trading range that developed after last week’s huge market swings. Support is 1.4260/70 while the ceiling of the trading range sits at 1.4370/80 (40-day MA sits at 1.4380 this morning). Broader trading patterns continue to lean a little more constructively for the CAD after the huge reversal from Monday’s peak. That may lead to the market to at least try and test support in the upper 1.42s if volatility eases in the next week or so."
Markets are having a relatively muted reaction to the latest round of tariff threats from President Trump—25% tariffs on all steel and aluminum imports, effective March 12th, Scotiabank's Chief FX Strategist Shaun Osborne notes.
USD trades mixed to slightly lower in quiet trade
"The EU has said it will respond. Australia’s early call for an exemption will be considered by the president. It is perhaps the delayed implementation that is leaving markets cautious but a little cool on developments—there is time for talks to negotiate the tariff threat away perhaps. Trading overall looks pretty quiet—a lull in the action after last week’s market swings. Tokyo markets were closed earlier."
"The US Dollar (USD) is trading a little lower on the session overall, with the Dollar Index (DXY) losing a little ground on the back of a steady to slightly firmer Euro (EUR). The CAD is underperforming but losses are mild (less than 0.2%). Stocks are flat to slightly lower and bonds are broadly lower across major markets. More tariff talk means potentially slower growth and upward pressure on prices. Crude is up a little while copper and iron ore are lower. Gold hit a new record high of $2942 earlier on haven demand but has since edge back to little changed.
"It’s a light day for data but Fed Chair Powell delivers his semi-annual testimony to Senate lawmakers today (House tomorrow). Prepared remarks start around 10ET. Comments are likely to underscore the Fed is on hold for, perhaps for an extended period, which may give the USD a small lift."
13:55
United States Redbook Index (YoY): 5.3% (February 7) vs previous 5.7%
Federal Reserve Bank of Cleveland President Beth Hammack said on Tuesday that it will likely be appropriate to hold interest rates steady for some time, as reported by Reuters.
Key takeaways
"Patient approach to rates will give Fed time to assess economy."
"Fed is well positioned to respond to changes in the economy."
"Monetary policy is only modestly restrictive."
"Risks to inflation right now are skewed to upside."
"There is a lot of uncertainty around government policy."
"Best to take time to assess impact of any tariffs."
"Still not clear inflation will keep moving down to 2%."
"Getting inflation to target is paramount for Fed."
"Fed’s challenge is to lower inflation while keeping job market healthy."
"Economy is in a good place, job market is solid."
Market reaction
The US Dollar Index showed no reaction to these comments and was last seen virtually unchanged on the day at 108.30.
13:30
Canada Building Permits (MoM) above forecasts (2.3%) in December: Actual (11%)
13:17
Russia Foreign Trade below forecasts ($7B) in December: Actual ($5.575B)
12:01
Mexico Industrial Output (YoY) declined to -2.7% in December from previous -1.4%
12:01
Brazil IPCA Inflation came in at 0.16%, above forecasts (0.14%) in January
The US Dollar trades fairly flat for a second day in a row this week.
All eyes are on Fed Chairman Jerome Powell heading to Capitol Hill.
The US Dollar Index (DXY) is trading sideways above 108.00
The US Dollar Index (DXY), which tracks the performance of the US Dollar against six major currencies, is broadly flat and still resides above 108.00. The Greenback looks to be immune to US President Donald Trump's tariff talks. While China silently slapped some minor tariffs on US goods in a tit-for-tat move on Monday, Trump introduced a 15% levy on steel and aluminum for all countries importing that will come into effect on March 12.
The economic calendar this Tuesday is being taken over by the Federal Reserve (Fed). Besides Fed Chairman Jerome Powell testifying before Congress, three Fed speakers are due to make an appearance. Traders will want to hear if the central bank has plans for any changes in its monetary policy soon.
Daily digest market movers: A snooze fest
At 11:00 GMT, The National Federation of Independent Business (NFIB) has released its Business Optimism Index for January. The number came in at 102.8, below the 104.6 estimate and down from 105.1 in the December reading.
Fed Chairman Jerome Powell will keep his semiannual testimony before Congress at 15:00 GMT.
More Fed speakers are lined out to speak throughout the day:
At 13:50 GMT, President of the Federal Reserve Bank of Cleveland Beth Hammack will talk at the 2025 Economic Outlook Conference at the Central Bank Center.
At 20:30 GMT, Federal Reserve Governor Michelle Bowman speaks at the Iowa Bankers Association Bank Management and Policy Conference in Des Moines.
At 20:30 GMT, Federal Reserve Bank of New York President John Williams also delivers keynote remarks at the CBIA Economic Summit and Outlook 2025, organized by the Connecticut Business and Industry Association (CBIA) in Connecticut.
Equities are struggling this Tuesday with the tariff hangover starting to weigh on them. All major European and US indices are in the red, though less than 0.5%.
The CME FedWatch tool projects a 93.5% chance that the Fed will keep interest rates unchanged at its next meeting on March 19.
The US 10-year yield is trading around 4.51%, ticking up further for a second day in a row and recovering further from its fresh yearly low of 4.40% printed last week.
US Dollar Index Technical Analysis: Tailrisk from Powell
The US Dollar Index (DXY) is really turning into a snooze fest this week. No real movement in the Greenback as of yet, despite plenty of headlines. Though US yields are the asset to monitor, with Powell’s testimony ahead, things might start to move from now.
On the upside, the first barrier at 109.30 (July 14, 2022, high and rising trendline) was briefly surpassed but did not hold last week. Once that level is reclaimed, the next level to hit before advancing further remains at 110.79 (September 7, 2022, high).
On the downside, 107.35 (October 3, 2023, high) is still acting as strong support after several tests last week. In case more downside occurs, look for 106.52 (April 16, 2024, high), 106.14 (100-day Simple Moving Average), or even 105.89 (resistance in June 2024) as better support levels.
US Dollar Index: Daily Chart
US Dollar FAQs
The US Dollar (USD) is the official currency of the United States of America, and the ‘de facto’ currency of a significant number of other countries where it is found in circulation alongside local notes. It is the most heavily traded currency in the world, accounting for over 88% of all global foreign exchange turnover, or an average of $6.6 trillion in transactions per day, according to data from 2022. Following the second world war, the USD took over from the British Pound as the world’s reserve currency. For most of its history, the US Dollar was backed by Gold, until the Bretton Woods Agreement in 1971 when the Gold Standard went away.
The most important single factor impacting on the value of the US Dollar is monetary policy, which is shaped by the Federal Reserve (Fed). The Fed has two mandates: to achieve price stability (control inflation) and foster full employment. Its primary tool to achieve these two goals is by adjusting interest rates. When prices are rising too quickly and inflation is above the Fed’s 2% target, the Fed will raise rates, which helps the USD value. When inflation falls below 2% or the Unemployment Rate is too high, the Fed may lower interest rates, which weighs on the Greenback.
In extreme situations, the Federal Reserve can also print more Dollars and enact quantitative easing (QE). QE is the process by which the Fed substantially increases the flow of credit in a stuck financial system. It is a non-standard policy measure used when credit has dried up because banks will not lend to each other (out of the fear of counterparty default). It is a last resort when simply lowering interest rates is unlikely to achieve the necessary result. It was the Fed’s weapon of choice to combat the credit crunch that occurred during the Great Financial Crisis in 2008. It involves the Fed printing more Dollars and using them to buy US government bonds predominantly from financial institutions. QE usually leads to a weaker US Dollar.
Quantitative tightening (QT) is the reverse process whereby the Federal Reserve stops buying bonds from financial institutions and does not reinvest the principal from the bonds it holds maturing in new purchases. It is usually positive for the US Dollar.
Europe continues to face high energy prices due to gas supply concerns, global trade tensions, and low wind levels. Gas prices have averaged €50/MWh so far this year, with German baseload power prices at €122/MWh, the highest since early 2023 and late 2022, respectively, Rabobank's Energy Strategist Florence Schmit notes.
Europe continues to face high energy prices
"The EU's gas storage targets are under pressure due to unfavorable summer-winter spreads, leading to low storage incentives over the coming months. Current storage levels are already below 50% of capacity and risk being depleted to 30% by the end of March."
"Sanctions on Russia’s energy sector remain the biggest risk premium for European gas, with Russian pipeline gas accounting for 5% of Europe’s supply mix and Russian LNG accounting for 16% of LNG deliveries. China’s 15% tariff on imports of U.S. LNG temporarily frees up supply for Europe but does not alter global supply availability in the short term."
"Wind power generation so far this winter retreated to the lowest since the winter of 2020/2021 but the continued buildout of renewable capacity could help prices end the upward spiral from spring."
USD/JPY trades sideways around 152.00 as Fed Powell’s testimony takes center stage.
Fed Powell is unlikely to provide cues about the timeline from when the central bank could resume the policy expansion cycle.
Yen’s rally appears to have stalled, which was based on BoJ's hawkish bets.
The USD/JPY pair inches higher to near 152.00 in Tuesday’s European session but trades inside Monday’s trading range, which suggests a sideways trend. The pair consolidates as investors await Federal Reserve (Fed) Chair Jerome Powell’s testimony before Congress at 15:00 GMT.
Investors will look for cues about how long the Fed will hold interest rates in the current range of 4.25%-4.50%. Jerome Powell is not expected to provide any timeline about when the Fed could resume its policy-easing cycle, which it paused in January.
In the January meeting, Jerome Powell said that monetary policy adjustments would become appropriate only after policymakers see “real progress in inflation or at least some weakness in the labor market”.
Investors would also like to know the impact of the 25% tariff imposition on imports of steel and aluminum by United States (US) President Donald Trump, which will come into effect on March 12, on inflation and the economy. While, Powell will likely say that it is too early to project.
However, market participants expect that Trump’s tariffs agenda will be inflationary for the US economy.
Meanwhile, a month-long upside move in the Japanese Yen (JPY) appears to have paused for a while. The Japanese Yen remained firm in January on expectations that the Bank of Japan (BoJ) is on track to narrow rate differentials with other central banks. BoJ Governor Kazuo Ueda and Deputy Governor Himino have signaled the possibility of another interest rate hike if the economy and prices perform in line with the central bank's projections.
Japanese Yen PRICE Last 30 days
The table below shows the percentage change of Japanese Yen (JPY) against listed major currencies last 30 days. Japanese Yen was the strongest against the Swiss Franc.
USD
EUR
GBP
JPY
CAD
AUD
NZD
CHF
USD
-0.17%
-0.44%
-3.73%
-0.32%
-1.17%
-0.74%
0.03%
EUR
0.17%
-0.27%
-3.58%
-0.15%
-1.02%
-0.58%
0.19%
GBP
0.44%
0.27%
-3.26%
0.12%
-0.75%
-0.30%
0.47%
JPY
3.73%
3.58%
3.26%
3.54%
2.65%
3.08%
3.91%
CAD
0.32%
0.15%
-0.12%
-3.54%
-0.87%
-0.43%
0.35%
AUD
1.17%
1.02%
0.75%
-2.65%
0.87%
0.44%
1.22%
NZD
0.74%
0.58%
0.30%
-3.08%
0.43%
-0.44%
0.77%
CHF
-0.03%
-0.19%
-0.47%
-3.91%
-0.35%
-1.22%
-0.77%
The heat map shows percentage changes of major currencies against each other. The base currency is picked from the left column, while the quote currency is picked from the top row. For example, if you pick the Japanese Yen from the left column and move along the horizontal line to the US Dollar, the percentage change displayed in the box will represent JPY (base)/USD (quote).
West Texas Intermediate (WTI) Oil price advances on Tuesday, according to FXStreet data. WTI trades at $72.92 per barrel, up from Monday’s close at $72.19. Brent Oil Exchange Rate (Brent crude) is also up, advancing from the $75.81 price posted on Monday, and trading at $76.60.
WTI Oil FAQs
WTI Oil is a type of Crude Oil sold on international markets. The WTI stands for West Texas Intermediate, one of three major types including Brent and Dubai Crude. WTI is also referred to as “light” and “sweet” because of its relatively low gravity and sulfur content respectively. It is considered a high quality Oil that is easily refined. It is sourced in the United States and distributed via the Cushing hub, which is considered “The Pipeline Crossroads of the World”. It is a benchmark for the Oil market and WTI price is frequently quoted in the media.
Like all assets, supply and demand are the key drivers of WTI Oil price. As such, global growth can be a driver of increased demand and vice versa for weak global growth. Political instability, wars, and sanctions can disrupt supply and impact prices. The decisions of OPEC, a group of major Oil-producing countries, is another key driver of price. The value of the US Dollar influences the price of WTI Crude Oil, since Oil is predominantly traded in US Dollars, thus a weaker US Dollar can make Oil more affordable and vice versa.
The weekly Oil inventory reports published by the American Petroleum Institute (API) and the Energy Information Agency (EIA) impact the price of WTI Oil. Changes in inventories reflect fluctuating supply and demand. If the data shows a drop in inventories it can indicate increased demand, pushing up Oil price. Higher inventories can reflect increased supply, pushing down prices. API’s report is published every Tuesday and EIA’s the day after. Their results are usually similar, falling within 1% of each other 75% of the time. The EIA data is considered more reliable, since it is a government agency.
OPEC (Organization of the Petroleum Exporting Countries) is a group of 12 Oil-producing nations who collectively decide production quotas for member countries at twice-yearly meetings. Their decisions often impact WTI Oil prices. When OPEC decides to lower quotas, it can tighten supply, pushing up Oil prices. When OPEC increases production, it has the opposite effect. OPEC+ refers to an expanded group that includes ten extra non-OPEC members, the most notable of which is Russia.
(An automation tool was used in creating this post.)
11:00
South Africa Manufacturing Production Index (YoY) up to -1.2% in December from previous -2.6%
11:00
United States NFIB Business Optimism Index came in at 102.8, below expectations (104.6) in January
USD/CAD stays above 1.4300, with investors awaiting the Fed’s Chair Powell’s testimony.
The Fed left its key interest rates steady in January.
The Canadian economy is expected to face the severe burden of US Trump’s order to impose 25% tariffs on steel and aluminum.
The USD/CAD pair trades inside Monday’s trading range around 1.4330 in Tuesday’s European session. The Loonie pair consolidates as investors await Federal Reserve (Fed) Chair Jerome Powell’s testimony before Congress at 15:00 GMT.
Investors will pay close attention to Fed Powell’s commentary to know for how long the Fed will keep interest rates unchanged in the range of 4.25%-4.50%. Strategists at Macquarie said, "Our updated view is for no change in the fed funds rate during 2025 with it likely to remain in the 4.25 to 4.5% range. Previously we had suggested there would be just one further 25 bps cut in either March or May."
Market participants believe that orders of 25% tariff imposition on imports of steel and aluminum by United States (US) President Donald Trump will be inflationary for the economy. Such a scenario will force Fed officials to maintain a status quo for longer.
Meanwhile, the outlook of the Canadian Dollar (CAD) remains bearish as Canada is expected to be the biggest casualty of Trump’s tariffs. Investors should note that Canada is the largest exporter of aluminum to the US.
On the economic front, investors will focus on the US Consumer Price Index (CPI) data for January, which will be released on Wednesday.
USD/CAD trades in a tight range of 1.4270-1.4380 from a week. The 50-period Exponential Moving Average (EMA) near 1.4365 continues to be a major barrier for the US Dollar bulls.
The 14-period Relative Strength Index (RSI) oscillates in the 40.00-60.00 range, which indicates a sideways trend.
A fresh upside move toward the round-level resistance of 1.4500 and the January 30 high of 1.4600 would appear after the pair breaks above the February 10 high of 1.4380.
In an alternate scenario, a downside move below the February 5 low of 1.4270 would drag the pair towards the December 10 high of 1.4195, followed by the December 11 low of 1.4120.
USD/CAD four-hour chart
Canadian Dollar FAQs
The key factors driving the Canadian Dollar (CAD) are the level of interest rates set by the Bank of Canada (BoC), the price of Oil, Canada’s largest export, the health of its economy, inflation and the Trade Balance, which is the difference between the value of Canada’s exports versus its imports. Other factors include market sentiment – whether investors are taking on more risky assets (risk-on) or seeking safe-havens (risk-off) – with risk-on being CAD-positive. As its largest trading partner, the health of the US economy is also a key factor influencing the Canadian Dollar.
The Bank of Canada (BoC) has a significant influence on the Canadian Dollar by setting the level of interest rates that banks can lend to one another. This influences the level of interest rates for everyone. The main goal of the BoC is to maintain inflation at 1-3% by adjusting interest rates up or down. Relatively higher interest rates tend to be positive for the CAD. The Bank of Canada can also use quantitative easing and tightening to influence credit conditions, with the former CAD-negative and the latter CAD-positive.
The price of Oil is a key factor impacting the value of the Canadian Dollar. Petroleum is Canada’s biggest export, so Oil price tends to have an immediate impact on the CAD value. Generally, if Oil price rises CAD also goes up, as aggregate demand for the currency increases. The opposite is the case if the price of Oil falls. Higher Oil prices also tend to result in a greater likelihood of a positive Trade Balance, which is also supportive of the CAD.
While inflation had always traditionally been thought of as a negative factor for a currency since it lowers the value of money, the opposite has actually been the case in modern times with the relaxation of cross-border capital controls. Higher inflation tends to lead central banks to put up interest rates which attracts more capital inflows from global investors seeking a lucrative place to keep their money. This increases demand for the local currency, which in Canada’s case is the Canadian Dollar.
Macroeconomic data releases gauge the health of the economy and can have an impact on the Canadian Dollar. Indicators such as GDP, Manufacturing and Services PMIs, employment, and consumer sentiment surveys can all influence the direction of the CAD. A strong economy is good for the Canadian Dollar. Not only does it attract more foreign investment but it may encourage the Bank of Canada to put up interest rates, leading to a stronger currency. If economic data is weak, however, the CAD is likely to fall.
EUR/USD is broadly sideways around 1.0300, with investors focusing on Fed Chair Jerome Powell’s testimony before Congress.
US President Trump imposed 25% tariffs on imports of steel and aluminum from all nations.
The Eurozone is expected to be the major casualty of Trump’s reciprocal tariffs.
EUR/USD ticks higher but is broadly sideways around 1.0300 in Tuesday’s European trading session as investors await the Federal Reserve (Fed) Chair Jerome Powell’s testimony before Congress at 15:00 GMT. Investors will pay close attention to Powell’s comments to know for how long the Fed will keep interest rates steady in the range of 4.25%-4.50% and the likely impact of 25% tariffs on all steel and aluminum imports on the monetary policy outlook.
In January, the Fed left interest rates unchanged and Powell said that the central bank will remain in the waiting mode until it sees “real progress in inflation or at least some weakness in labor market”.
On Monday, United States (US) President Donald Trump signed executive orders of a 25% levy on imports of steel and aluminum from all nations, which will come into effect on March 12. Trump also said that there will be reciprocal tariffs over nations where he sees unfair trade practices in the coming days. The US President has outlined tariffs on metals to boost local production and reduce dependence on other nations.
Market participants are concerned over Trump’s international agenda, which is expected to result in a global trade war and high inflation in the US economy.
For fresh cues on inflation, investors will focus on the US Consumer Price Index (CPI) data for January, which will be released on Wednesday at 13:30 GMT. Economists expect the annual core CPI – which excludes volatile food and energy prices – to have grown at a slower pace of 3.1%, compared to a 3.2% increase in December. In the same period, the headline inflation is estimated to have remained steady at 2.9%.
Daily digest market movers: EUR/USD ticks higher as Euro gains
EUR/USD edges higher as the Euro (EUR) outperforms its major peers, even though market participants expect Trump’s reciprocal tariffs will be unfavorable for the Eurozone. The impact of reciprocal tariffs is expected to be severe on the Eurozone as it charges 10% levies on automobile imports from the US and pays 2.5% import duty for domestic autos supplied to them. Such a scenario will be unfavorable for the Euro as lower sales would result in economic contraction.
The outlook of the Euro is also vulnerable on the monetary policy front given the possibility that the rate differential between the European Central Bank (ECB) and the Fed could widen. Traders have fully priced in three interest rate cuts by the ECB and see them coming by the summer. Firm dovish bets are based on expectations that inflationary pressures are expected to return sustainably to near the central bank’s target of 2%.
Three interest rate cuts by the ECB of 25 basis points (bps) would push the Deposit Facility rate lower to 2%, a figure that is close to the neutral rate, as projected by economists at the ECB.
Contrary to market expectations, ECB policymaker and Governor of the Bank of Portugal Mario Centeno expects that the central bank could go “below the neutral rate” as the Eurozone economy is not “strong enough to support inflation at 2%”.
Technical Analysis: EUR/USD oscillates inside Monday’s trading range
EUR/USD trades inside Monday’s trading range around 1.0300 in Tuesday’s European session. The outlook of the major currency pair remains bearish as the 50-day Exponential Moving Average (EMA) around 1.0430 continues to be a major barricade for the Euro bulls.
The 14-day Relative Strength Index (RSI) oscillates in the 40.00-60.00 range, indicating a sideways trend.
Looking down, the January 13 low of 1.0177 and the round-level support of 1.0100 will act as major support zones for the pair. Conversely, the psychological resistance of 1.0500 will be the key barrier for the Euro bulls.
Euro FAQs
The Euro is the currency for the 19 European Union countries that belong to the Eurozone. It is the second most heavily traded currency in the world behind the US Dollar. In 2022, it accounted for 31% of all foreign exchange transactions, with an average daily turnover of over $2.2 trillion a day. EUR/USD is the most heavily traded currency pair in the world, accounting for an estimated 30% off all transactions, followed by EUR/JPY (4%), EUR/GBP (3%) and EUR/AUD (2%).
The European Central Bank (ECB) in Frankfurt, Germany, is the reserve bank for the Eurozone. The ECB sets interest rates and manages monetary policy. The ECB’s primary mandate is to maintain price stability, which means either controlling inflation or stimulating growth. Its primary tool is the raising or lowering of interest rates. Relatively high interest rates – or the expectation of higher rates – will usually benefit the Euro and vice versa. The ECB Governing Council makes monetary policy decisions at meetings held eight times a year. Decisions are made by heads of the Eurozone national banks and six permanent members, including the President of the ECB, Christine Lagarde.
Eurozone inflation data, measured by the Harmonized Index of Consumer Prices (HICP), is an important econometric for the Euro. If inflation rises more than expected, especially if above the ECB’s 2% target, it obliges the ECB to raise interest rates to bring it back under control. Relatively high interest rates compared to its counterparts will usually benefit the Euro, as it makes the region more attractive as a place for global investors to park their money.
Data releases gauge the health of the economy and can impact on the Euro. Indicators such as GDP, Manufacturing and Services PMIs, employment, and consumer sentiment surveys can all influence the direction of the single currency. A strong economy is good for the Euro. Not only does it attract more foreign investment but it may encourage the ECB to put up interest rates, which will directly strengthen the Euro. Otherwise, if economic data is weak, the Euro is likely to fall. Economic data for the four largest economies in the euro area (Germany, France, Italy and Spain) are especially significant, as they account for 75% of the Eurozone’s economy.
Another significant data release for the Euro is the Trade Balance. This indicator measures the difference between what a country earns from its exports and what it spends on imports over a given period. If a country produces highly sought after exports then its currency will gain in value purely from the extra demand created from foreign buyers seeking to purchase these goods. Therefore, a positive net Trade Balance strengthens a currency and vice versa for a negative balance.
Gold resumed its uptrend after breakout from a multi-month consolidation and has reached $2940, Societe Generale’s FX analysts report.
Gold can reach the $2985/3000 range
“The move is a bit stretched but signals of a meaningful pullback are not yet visible. Recent pivot low of $2830 will be a potential support in case a brief decline develops.”
“Defence of this can lead to persistence in up move. Beyond $2940, next potential hurdle could be located at the upper limit of an ascending channel near $2985/3000.”
Federal Reserve (Fed) Chairman Jerome Powell will testify on the semiannual Monetary Policy Report before the Senate Banking, Housing and Urban Affairs Committee at 15:00 GMT on Tuesday.
In the Monetary Policy Report published on Friday, February 7, the Fed reiterated that policymakers will weigh incoming data, the evolving outlook and the balance of risks when they consider future policy moves. In the meantime, 67 of 101 economists that took part in a recently-conducted Reuters survey said that they expect the US central bank to lower the policy rate by at least once by end-June. According to the CME FedWatch Tool, markets are currently pricing in a less-than-10% probability of the Fed lowering the policy rate by 25 basis points (bps) in March.
Following the January policy decisions, FXStreet (FXS) Fed Sentiment Index climbed above 120, reflecting a hawkish sentiment. Since then, however, the Fed Sentiment Index retreated to 110 as some policymakers adopted a relatively less hawkish language. Although this decline suggests that the Fed is softening its tone, it is yet to signal a dovish shift.
In an interview with Bloomberg on Wednesday, February 5, Richmond Fed President Thomas Barkin noted that he was still leaning towards additional rate cuts this year and said that he expects 12-month inflation numbers to "come down nicely." On a more neutral note, "the Fed needs to be mindful of overheating and deterioration, but things are largely going well," Chicago Fed President Austan Goolsbee said and added that he is hopeful that tariffs end up not being a big impediment to trade, based on what they saw recently.
Fed FAQs
Monetary policy in the US is shaped by the Federal Reserve (Fed). The Fed has two mandates: to achieve price stability and foster full employment. Its primary tool to achieve these goals is by adjusting interest rates. When prices are rising too quickly and inflation is above the Fed’s 2% target, it raises interest rates, increasing borrowing costs throughout the economy. This results in a stronger US Dollar (USD) as it makes the US a more attractive place for international investors to park their money. When inflation falls below 2% or the Unemployment Rate is too high, the Fed may lower interest rates to encourage borrowing, which weighs on the Greenback.
The Federal Reserve (Fed) holds eight policy meetings a year, where the Federal Open Market Committee (FOMC) assesses economic conditions and makes monetary policy decisions. The FOMC is attended by twelve Fed officials – the seven members of the Board of Governors, the president of the Federal Reserve Bank of New York, and four of the remaining eleven regional Reserve Bank presidents, who serve one-year terms on a rotating basis.
In extreme situations, the Federal Reserve may resort to a policy named Quantitative Easing (QE). QE is the process by which the Fed substantially increases the flow of credit in a stuck financial system. It is a non-standard policy measure used during crises or when inflation is extremely low. It was the Fed’s weapon of choice during the Great Financial Crisis in 2008. It involves the Fed printing more Dollars and using them to buy high grade bonds from financial institutions. QE usually weakens the US Dollar.
Quantitative tightening (QT) is the reverse process of QE, whereby the Federal Reserve stops buying bonds from financial institutions and does not reinvest the principal from the bonds it holds maturing, to purchase new bonds. It is usually positive for the value of the US Dollar.
WTI is trading above $72/bbl while ICE Brent edged above $76/bbl this morning, ING’s commodity analysts Warren Patterson and Ewa Manthey notes.
Geopolitical tensions push oil prices up
“NYMEX WTI is trading above $72/bbl while ICE Brent edged above $76/bbl this morning as the energy sector in Ukraine and Russia continue to face drone assaults, while signs of tighter supplies in Russia and rising geopolitical tensions further pushed the energy complex higher.”
“According to media reports, drones attacked a Russian oil refinery plant in the Saratov region. The affected plant is part of the Rosneft oil company known as Kreking, one of the oldest Russian oil refineries. Meanwhile, Russia also targeted Ukraine’s gas and power facilities in an overnight attack.”
10:01
Spain 3-Month Letras Auction: 2.431% vs previous 2.493%
Jerome Powell’s testimony in the US Congress will be a top-tier market-moving event this week.
New clues on the Federal Reserve interest rate path are awaited.
US Dollar, stock markets and other asset classes could see big swings with the Fed Chair’s words.
Jerome Powell, Chairman of the United States (US) Federal Reserve (Fed), will deliver the Semi-Annual Monetary Policy Report and testify before the Senate Banking Committee on Tuesday. The hearing, entitled “The Semi-Annual Monetary Policy Report to the Congress,” will start at 15:00 GMT and it will have the full attention of all financial market players.
Jerome Powell is expected to address the main takeaways of the Fed’s Semi-Annual Federal Reserve Monetary Policy Report, published last Friday. In that report, the Fed noted that financial conditions continue to appear “somewhat restrictive” and reiterated that policymakers will weigh data when deciding on future policy moves.
In a long Q&A session, US representatives are expected to ask Powell about the interest rate path, inflation developments, and the economic outlook. They are also very likely to inquire about how US President Donald Trump’s policies could influence prices, growth prospects and the monetary policy moving forward.
The CME Group FedWatch Tool shows that markets price in a less-than-10% probability that the Fed will lower the policy rate by 25 basis points (bps) in March after the latest employment report reaffirmed tight conditions in the labor market.
In January, Nonfarm Payrolls (NFP) rose 143,000. Although this reading came in below the market expectation of 170,000, the US Bureau of Labor Statistics (BLS) announced upward revisions to previous NFP prints. "The change in total Nonfarm Payroll employment for November was revised up by 49,000, from +212,000 to +261,000, and the change for December was revised up by 51,000, from +256,000 to +307,000. With these revisions, employment in November and December combined is 100,000 higher than previously reported," the BLS noted in its press release.
The market positioning suggests that the US Dollar (USD) has little room left on the upside even if Powell confirms that they will hold the policy unchanged in March. On the other hand, the USD could come under selling pressure in case Powell adopts an optimistic tone about the inflation outlook and leaves the door open for a rate reduction at the next policy meeting.
About Jerome Powell (via Federalreserve.gov)
"Jerome H. Powell first took office as Chair of the Board of Governors of the Federal Reserve System on February 5, 2018, for a four-year term. He was reappointed to the office and sworn in for a second four-year term on May 23, 2022. Mr. Powell also serves as Chairman of the Federal Open Market Committee, the System's principal monetary policymaking body. Mr. Powell has served as a member of the Board of Governors since taking office on May 25, 2012, to fill an unexpired term. He was reappointed to the Board and sworn in on June 16, 2014, for a term ending January 31, 2028."
Fed FAQs
Monetary policy in the US is shaped by the Federal Reserve (Fed). The Fed has two mandates: to achieve price stability and foster full employment. Its primary tool to achieve these goals is by adjusting interest rates. When prices are rising too quickly and inflation is above the Fed’s 2% target, it raises interest rates, increasing borrowing costs throughout the economy. This results in a stronger US Dollar (USD) as it makes the US a more attractive place for international investors to park their money. When inflation falls below 2% or the Unemployment Rate is too high, the Fed may lower interest rates to encourage borrowing, which weighs on the Greenback.
The Federal Reserve (Fed) holds eight policy meetings a year, where the Federal Open Market Committee (FOMC) assesses economic conditions and makes monetary policy decisions. The FOMC is attended by twelve Fed officials – the seven members of the Board of Governors, the president of the Federal Reserve Bank of New York, and four of the remaining eleven regional Reserve Bank presidents, who serve one-year terms on a rotating basis.
In extreme situations, the Federal Reserve may resort to a policy named Quantitative Easing (QE). QE is the process by which the Fed substantially increases the flow of credit in a stuck financial system. It is a non-standard policy measure used during crises or when inflation is extremely low. It was the Fed’s weapon of choice during the Great Financial Crisis in 2008. It involves the Fed printing more Dollars and using them to buy high grade bonds from financial institutions. QE usually weakens the US Dollar.
Quantitative tightening (QT) is the reverse process of QE, whereby the Federal Reserve stops buying bonds from financial institutions and does not reinvest the principal from the bonds it holds maturing, to purchase new bonds. It is usually positive for the value of the US Dollar.
AUD/USD is consolidating near the top-end of its year-to-date 0.6100-0.6330 range, BBH’s FX analysts note.
RBA to start easing at the next February 18 meeting
“Australia’s Westpac–Melbourne Institute Consumer Sentiment Index was essentially unchanged at 92.2 in February. While the headline print remains below the long-term average of 100.5, the forward-looking sub-indexes edged higher.”
“Regardless, softer inflation pressures in Q4 support the case for the RBA to start easing at the next February 18 meeting, with markets pricing-in a 90% probability.”
“RBA/Fed policy trend and sluggish Chinese economic activity point to additional AUD/USD downside.”
Gold hits another fresh all-time high at $2,942 and surges over 11% for 2025.
Markets got caught by surprise this Monday with countermeasures from China to US President Donald Trump’s tariffs.
The $3,000 is gaining quickly, though tail risks could grow from here.
Gold’s price (XAU/USD) has set another record high at $2,942 in early Tuesday trading before paring back nearly all the incurred gains for the day. Meanwhile, United States (US) President Donald Trump has imposed 25% tariffs on steel and aluminum imports for all countries as of March 12,, while China has quietly imposed retaliatory tariffs on some US goods. China is only showing its teeth by now and has not gone full blazing, while US President Trump is nowhere near his promised 60% levies on all Chinese products as announced earlier in his campaign, Bloomberg reports.
Meanwhile, traders will focus on Federal Reserve (Fed) Chair Jerome Powell’s semiannual testimony to lawmakers on Tuesday and Wednesday for fresh clues about the path the US monetary policy will take. Powell is likely to highlight the resilient economy as a key reason central bankers are in no rush to cut borrowing costs further. This is a big risk for Gold this Tuesday, as it could be a bearish element for bullion.
Daily digest market movers: Tariff safe haven
At 15:00 GMT, Fed Chairman Jerome Powell testifies before the US Senate Banking Committee
US President Donald Trump said on Monday that the latest round of levies, which go into effect in March, would bolster domestic production and bring more jobs to the US. He also warned the tariffs “may go higher”, Bloomberg reports.
The CME FedWatch tool shows a 93.5% chance that interest rates will remain unchanged in March, compared to a slim 6.5% chance of a 25 basis point (bps) interest rate cut.
Technical Analysis: Resistance levels to watch
A whopping 11% of gains so far this year is making bullion already the favorite trade for the first quarter. Tail risks are set to kick in though, with Fed Chairman Powell to speak later this Tuesday at Capitol Hill. If his speech is hawkish, yields are expected to surge, which could spark some sizable profit-taking in the Gold rally.
The Pivot Point level on Tuesday is the first nearby support at $2,891, followed by the S1 support at $2,871. From there, S2 support should come in at $2,835. In case of a correction, the bigger $2,790 level (October 31, 2024, high) should be able to catch any falling knives.
On the upside, the R1 resistance comes in at $2,928, which was already tested earlier this Tuesday. In case the rally recovers again in the European and US sessions, the $2,950 level, which is the confluence of a big figure and the R2 resistance, will be tested for a break to the upside. Further up, the $3,000 psychological level could be next.
XAU/USD: Daily Chart
US-China Trade War FAQs
Generally speaking, a trade war is an economic conflict between two or more countries due to extreme protectionism on one end. It implies the creation of trade barriers, such as tariffs, which result in counter-barriers, escalating import costs, and hence the cost of living.
An economic conflict between the United States (US) and China began early in 2018, when President Donald Trump set trade barriers on China, claiming unfair commercial practices and intellectual property theft from the Asian giant. China took retaliatory action, imposing tariffs on multiple US goods, such as automobiles and soybeans. Tensions escalated until the two countries signed the US-China Phase One trade deal in January 2020. The agreement required structural reforms and other changes to China’s economic and trade regime and pretended to restore stability and trust between the two nations. However, the Coronavirus pandemic took the focus out of the conflict. Yet, it is worth mentioning that President Joe Biden, who took office after Trump, kept tariffs in place and even added some additional levies.
The return of Donald Trump to the White House as the 47th US President has sparked a fresh wave of tensions between the two countries. During the 2024 election campaign, Trump pledged to impose 60% tariffs on China once he returned to office, which he did on January 20, 2025. With Trump back, the US-China trade war is meant to resume where it was left, with tit-for-tat policies affecting the global economic landscape amid disruptions in global supply chains, resulting in a reduction in spending, particularly investment, and directly feeding into the Consumer Price Index inflation.
Gas prices in Europe are trading at their highest level in two years with the most active TTF futures moving above €58.5/MWh yesterday, ING’s commodity analysts Warren Patterson and Ewa Manthey notes.
US and EU natural gas prices edge higher
“The upward rally was driven by rising demand following cooler weather conditions, ongoing supply disruptions, weaker power generation from renewables and low levels of inventory at 48.5% currently.”
“Prolonged colder temperatures across Europe have intensified the need for heating eventually resulting in a faster depletion of inventories. Similarly, US natural gas prices edged higher in the week following the forecasts of cooler temperatures over much of the US.”
09:51
Spain 9-Month Letras Auction fell from previous 2.485% to 2.248%
US Dollar (USD) is expected to trade between 7.3040 and 7.3240. In the longer run, outlook remains mixed, but USD is likely to trade in a narrower range of 7.2500/7.3300, UOB Group’s FX analysts Quek Ser Leang and Peter Chia note.
Outlook for USD remains mixed
24-HOUR VIEW: “We noted ‘a slight increase in upward momentum’ yesterday. We highlighted that USD ‘could edge higher, but as momentum is not strong, it is unlikely to break above 7.3300.’ Instead of edging higher, USD traded in a quiet manner between 7.3047 and 7.3174, closing largely unchanged at 7.3090 (+0.06%). The price provides no fresh clues. Today, we expect USD to trade between 7.3040 and 7.3240.”
1-3 WEEKS VIEW: “We highlighted last Friday (07 Feb, spot at 7.2865) that ‘while the outlook remains mixed, the decreasing volatility over the past couple of days suggests USD could trade in a narrower range of 7.2500/7.3300.’ There is no change in our view.”
US President Donald Trump has set a 25% tariff on steel and Aluminum imports. The tariffs will apply to all US imports of steel and Aluminum, including from the country's biggest suppliers of both metals, Canada and Mexico. The duties will also include finished metal products. The new rates will go into effect on March 12. Trump said the new duties are meant to crack down on the efforts of countries like Russia and China to circumvent existing duties, bolster domestic production and bring more jobs back to the US, ING’s commodity analysts Warren Patterson and Ewa Manthey notes.
Aluminum is likely to be most impacted by potential tariffs
“However, previous tariffs did not lead to increased domestic Aluminum production. In 2024, the output of the US steel industry was 1% lower than it had been in 2017 before the introduction of the first round of tariffs by Trump, while the Aluminum industry produced almost 10% less. Trump's move comes on top of new 10% tariffs on goods from China. The President has also expanded the tariffs introduced in 2018, which former US President Joe Biden largely kept in place. Exemptions for major suppliers including Canada, Mexico, Brazil and the EU are now removed and the rate of Aluminum imports has been raised from 10% to 25%.”
“The US imports substantial amounts of Aluminum and steel from Canada. Approximately half of the US's Aluminum requirements are sourced internationally, with Canada being the largest supplier, contributing 58% of these imports. The United Arab Emirates follows, providing 6%, according to US government data. The US also relies on Mexico and Canada for around 90% of its Aluminum scrap imports. Meanwhile, around 23% of steel imports into the US arrive from Canada, followed by Brazil at 16%, Mexico at 12% and South Korea at 10%.”
“Aluminum is likely to be most impacted by potential tariffs on metals with the US importing significant volumes of its Aluminum from abroad. Tariffs would result in higher Aluminum prices in the US, representing a significant upside risk to the US Midwest premium this year. However, the effects on LME prices will be minimal. US tariffs previously had little impact on LME prices. Tariffs also risk demand destruction in the US as the extra costs would most likely be passed on to end consumers.”
Silver prices (XAG/USD) fell on Tuesday, according to FXStreet data. Silver trades at $31.78 per troy ounce, down 0.89% from the $32.06 it cost on Monday.
Silver prices have increased by 9.98% since the beginning of the year.
Unit measure
Silver Price Today in USD
Troy Ounce
31.78
1 Gram
1.02
The Gold/Silver ratio, which shows the number of ounces of Silver needed to equal the value of one ounce of Gold, stood at 91.61 on Tuesday, up from 90.68 on Monday.
Silver FAQs
Silver is a precious metal highly traded among investors. It has been historically used as a store of value and a medium of exchange. Although less popular than Gold, traders may turn to Silver to diversify their investment portfolio, for its intrinsic value or as a potential hedge during high-inflation periods. Investors can buy physical Silver, in coins or in bars, or trade it through vehicles such as Exchange Traded Funds, which track its price on international markets.
Silver prices can move due to a wide range of factors. Geopolitical instability or fears of a deep recession can make Silver price escalate due to its safe-haven status, although to a lesser extent than Gold's. As a yieldless asset, Silver tends to rise with lower interest rates. Its moves also depend on how the US Dollar (USD) behaves as the asset is priced in dollars (XAG/USD). A strong Dollar tends to keep the price of Silver at bay, whereas a weaker Dollar is likely to propel prices up. Other factors such as investment demand, mining supply – Silver is much more abundant than Gold – and recycling rates can also affect prices.
Silver is widely used in industry, particularly in sectors such as electronics or solar energy, as it has one of the highest electric conductivity of all metals – more than Copper and Gold. A surge in demand can increase prices, while a decline tends to lower them. Dynamics in the US, Chinese and Indian economies can also contribute to price swings: for the US and particularly China, their big industrial sectors use Silver in various processes; in India, consumers’ demand for the precious metal for jewellery also plays a key role in setting prices.
Silver prices tend to follow Gold's moves. When Gold prices rise, Silver typically follows suit, as their status as safe-haven assets is similar. The Gold/Silver ratio, which shows the number of ounces of Silver needed to equal the value of one ounce of Gold, may help to determine the relative valuation between both metals. Some investors may consider a high ratio as an indicator that Silver is undervalued, or Gold is overvalued. On the contrary, a low ratio might suggest that Gold is undervalued relative to Silver.
(An automation tool was used in creating this post.)
US Dollar (USD) is likely to trade in a range, probably between 151.30 and 152.35. In the longer run, USD outlook remains negative; the level to monitor is 150.00, UOB Group’s FX analysts Quek Ser Leang and Peter Chia note.
USD outlook remains negative
24-HOUR VIEW: “Following last Friday’s price movements, we indicated yesterday (Monday) that ‘there has been no increase in either downward or upward momentum.’ We were of the view that USD ‘is likely to trade in a range between 151.10 and 152.70.’ USD subsequently traded in a narrower range than expected (151.24/152.53). The price action still appears to be part of a range trading phase, probably between 151.30 and 152.35.”
1-3 WEEKS VIEW: “We turned negative in USD last Thursday (06 Feb, spot at 152.60). On Friday (07 Feb, spot at 151.10), we pointed, ‘USD outlook remains negative, and the level to monitor is 150.00. We will maintain our negative view as long as 153.00 (‘strong resistance’ level previously at 153.30) is not breached.”
The Dollar Index (DXY) is staying relatively bid above 108.00 as markets remain gripped by the tariff threat. 'Reciprocal' tariffs could be due any day and the market remains uncertain whether these would apply only to certain key sectors, such as autos, pharma or semiconductors – or more broadly. US President Donald Trump is supposedly set to sign another batch of executive orders today at 1600CET, so let's see, ING’s FX analysts Chris Turner notes.
DXY is staying relatively bid above 108.00
“Also helping the dollar have been energy prices. The Rest of the World views purchases of US LNG as a key balm to soothe impending tariffs. This week it is Indian energy importers ready to sign new LNG deals ahead of PM Narendra Modi's visit to Washington. This comes at a time when natural gas prices are rising as Europe deals with a cold snap and declining Russian gas imports. Higher gas prices and more geopolitical deals to purchase US LNG are dollar-positive.”
“It is a quiet day on the US data calendar, where US small business optimism should largely hold onto the surge seen after last November's election result. In focus, however, will be Federal Reserve Chair Jerome Powell's semi-annual monetary policy testimony to the Senate at 1600CET. We doubt he needs to sound any more dovish at the moment and we see his speech as a neutral/positive event risk for the USD.”
“DXY could nudge up towards the 109.00 area if Trump announces broader reciprocal tariffs today.”
Silver price loses ground despite safe-haven demand following US tariffs.
Trump's 25% tariff on steel and aluminum imports heightens the threat of a wider trade dispute.
Safe-haven demand increases as Middle East tensions escalate, following Trump's call for Israel to end its ceasefire with Hamas.
Silver price (XAG/USD) retraces its recent gains, trading around $31.80 per troy ounce during the European session on Tuesday. However, the downside of the metal price could be restrained as safe-haven demand for precious metals surged amid increased risk aversion following the latest US tariffs.
US President Donald Trump imposed a flat 25% tariff on steel and aluminum imports on Monday, removing all exemptions and nullifying previous trade agreements with key United States (US) allies. The move is intended to support struggling domestic industries but increases the risk of a broader trade conflict.
Geopolitical tensions in the Middle East could support the prices of the safe-haven Silver. President Trump has urged Israel to end its ceasefire with Hamas if hostages are not returned by the weekend, increasing the risk of renewed conflict as both sides accuse each other of violating the agreement.
However, the demand for non-interest-bearing Silver could face challenges as higher interest rates in the United States (US) could last longer. A Reuters poll of economists suggests the US Federal Reserve (Fed) may postpone interest rate cuts until next quarter due to inflation concerns. Many analysts who had anticipated a rate cut in March have now adjusted their forecasts, with most predicting at least one cut by June.
Investors await the release of the latest US inflation figures and comments from Federal Reserve Chair Jerome Powell later this week, which could influence the outlook for US monetary policy.
Silver FAQs
Silver is a precious metal highly traded among investors. It has been historically used as a store of value and a medium of exchange. Although less popular than Gold, traders may turn to Silver to diversify their investment portfolio, for its intrinsic value or as a potential hedge during high-inflation periods. Investors can buy physical Silver, in coins or in bars, or trade it through vehicles such as Exchange Traded Funds, which track its price on international markets.
Silver prices can move due to a wide range of factors. Geopolitical instability or fears of a deep recession can make Silver price escalate due to its safe-haven status, although to a lesser extent than Gold's. As a yieldless asset, Silver tends to rise with lower interest rates. Its moves also depend on how the US Dollar (USD) behaves as the asset is priced in dollars (XAG/USD). A strong Dollar tends to keep the price of Silver at bay, whereas a weaker Dollar is likely to propel prices up. Other factors such as investment demand, mining supply – Silver is much more abundant than Gold – and recycling rates can also affect prices.
Silver is widely used in industry, particularly in sectors such as electronics or solar energy, as it has one of the highest electric conductivity of all metals – more than Copper and Gold. A surge in demand can increase prices, while a decline tends to lower them. Dynamics in the US, Chinese and Indian economies can also contribute to price swings: for the US and particularly China, their big industrial sectors use Silver in various processes; in India, consumers’ demand for the precious metal for jewellery also plays a key role in setting prices.
Silver prices tend to follow Gold's moves. When Gold prices rise, Silver typically follows suit, as their status as safe-haven assets is similar. The Gold/Silver ratio, which shows the number of ounces of Silver needed to equal the value of one ounce of Gold, may help to determine the relative valuation between both metals. Some investors may consider a high ratio as an indicator that Silver is undervalued, or Gold is overvalued. On the contrary, a low ratio might suggest that Gold is undervalued relative to Silver.
AUD/USD continues with its struggle to gain any meaningful traction on Tuesday.
RBA rate cut bets, and US-China trade tensions cap the Aussie amid a stronger USD.
Bulls await a sustained strength above the 0.6300 mark before placing fresh bets.
The AUD/USD pair extends its sideways consolidative price move for the fifth straight day and remains below the 0.6300 mark through the first half of the European session on Tuesday.
Against the backdrop of rising bets for an imminent rate cut by the Reserve Bank of Australia (RBA) next week, escalating US-China trade tensions turn out to be a key factor acting as a headwind for the Australian Dollar (AUD). Apart from this, a modest US Dollar (USD) strength, bolstered by expectations that US President Donald Trump's trade tariffs would boost inflation and force the Federal Reserve (Fed) to stick to its hawkish stance, contributes to capping the AUD/USD pair.
From a technical perspective, spot prices now seem to have found acceptance above the 50-day Simple Moving Average (SMA). Moreover, oscillators on the daily chart have just started gaining positive traction and suggest that the path of least resistance for the AUD/USD pair is to the upside. That said, it will be prudent to wait for a sustained strength above the 0.6300 mark before positioning for an extension of the recent recovery from the lowest level since April 2020 touched earlier this month.
The subsequent move-up could lift spot prices to the 0.6365-0.6370 intermediate hurdle en route to the 0.6400 mark and the 100-day SMA barrier, currently pegged near the 0.6455 region. Some follow-through buying beyond the latter will suggest that spot prices have bottomed out and pave the way for a further near-term appreciating move.
On the flip side, the overnight swing low, around the 0.6235 region, now seems to act as an immediate support, below which the AUD/USD pair could slide to sub-0.6200 levels. The downward trajectory could extend further towards the 0.6145-0.6140 area en route to the multi-year low, around the 0.6090-0.6085 region. Spot prices might eventually drop to the 0.6000 psychological mark before aiming to test the April 2020 swing low, around the 0.5980 zone.
AUD/USD daily chart
US-China Trade War FAQs
Generally speaking, a trade war is an economic conflict between two or more countries due to extreme protectionism on one end. It implies the creation of trade barriers, such as tariffs, which result in counter-barriers, escalating import costs, and hence the cost of living.
An economic conflict between the United States (US) and China began early in 2018, when President Donald Trump set trade barriers on China, claiming unfair commercial practices and intellectual property theft from the Asian giant. China took retaliatory action, imposing tariffs on multiple US goods, such as automobiles and soybeans. Tensions escalated until the two countries signed the US-China Phase One trade deal in January 2020. The agreement required structural reforms and other changes to China’s economic and trade regime and pretended to restore stability and trust between the two nations. However, the Coronavirus pandemic took the focus out of the conflict. Yet, it is worth mentioning that President Joe Biden, who took office after Trump, kept tariffs in place and even added some additional levies.
The return of Donald Trump to the White House as the 47th US President has sparked a fresh wave of tensions between the two countries. During the 2024 election campaign, Trump pledged to impose 60% tariffs on China once he returned to office, which he did on January 20, 2025. With Trump back, the US-China trade war is meant to resume where it was left, with tit-for-tat policies affecting the global economic landscape amid disruptions in global supply chains, resulting in a reduction in spending, particularly investment, and directly feeding into the Consumer Price Index inflation.
Downward momentum has increased somewhat; New Zealand Dollar (NZD) is likely to drift lower towards 0.5625. In the longer run, for the time being, NZD is likely to trade in a range between 0.5595 and 0.5720.
NZD probably to trade between 0.5595 and 0.5720
24-HOUR VIEW: "We expected NZD to 'trade in a range between 0.5625 and 0.5680' yesterday. NZD then traded in a 0.5637/0.5664 range, closing at 0.5643 (-0.24%). Downward momentum has increased somewhat, and today, NZD is likely to drift lower towards 0.5625. A clear break below this level seems unlikely. Resistance is at 0.5655, followed by 0.5670."
1-3 WEEKS VIEW: "In our latest narrative from last Thursday (06 Feb, spot at 0.5685), we indicated that 'there has been a tentative buildup in momentum, and NZD could rise gradually to 0.5725.' Since then, NZD has not been able to make any headway on the upside, and the buildup in momentum has largely faded. For the time being, NZD is likely to trade in a range between 0.5595 and 0.5720."
Even though EUR/USD is range-bound, we are starting to see some decent moves lower in EUR/SEK and EUR/NOK, UOB Group's FX analysts Quek Ser Leang and Peter Chia note.
EUR/NOK is set to test and possibly break 11.50
"In EUR/SEK, two-year swap differentials have moved in favour of the krona as the ECB is priced for another 88bp of easing this year, while the Riksbank is barely expected to cut once. But the story seems larger than rate differentials, and like its CEE peers, the krona is shaking off the rise in gas prices."
"This resilience may be driven by growing optimism about a potential ceasefire deal in Ukraine. Expectations are that the US will reveal more of its plans at a Munich security conference this weekend – although any breakthrough with Russia would be a major surprise and is not priced in FX markets."
"For now, however, EUR/SEK can drift down to the 11.15 area. And Norway, benefiting hugely from the rise in energy prices, can see EUR/NOK test and possibly break 11.50."
Australian Dollar (AUD) is expected to trade with a downward bias; mild momentum suggests any decline is limited to a test of 0.6230. In the longer run, buildup in momentum is fading; a break below 0.6230 would mean that AUD is likely to trade in a range, UOB Group's FX analysts Quek Ser Leang and Peter Chia note.
AUD is expected to trade with a downward bias
24-HOUR VIEW: "Our expectation for AUD to trade with a 'downward bias' yesterday did not materialise. We continue to detect a slight increase in downward momentum and expect AUD to trade with a downward bias today. Given the mild downward momentum, any decline is limited to a test of 0.6230. On the upside, resistance levels are at 0.6290 and 0.6310."
1-3 WEEKS VIEW: "Our more recent narrative was from last Thursday (06 Feb, spot at 0.6280), wherein 'upward momentum is beginning to build, and if AUD closes above 0.6310, it could trigger an advance to 0.6355.' Since then, AUD traded in a relatively quiet manner, and the buildup in momentum is fading. From here, if AUD breaks below 0.6230 (‘strong support’ level previously at 0.6200), it would mean that AUD is likely to trade in a range."
EUR/USD remains offered as the weekend announcement over steel tariffs was the first to hit the EU, ING's FX analyst Chris Turner notes.
Decline towards the 1.0250/60 range seems probable
"Europe is now bracing for other sectors, such as autos, to be tariffed. There is little justification for the EU bloc as a whole to be hit with reciprocal tariffs since the EU tariff regime is relatively low. But, presumably, European politicians are more fearful about broader tariffs in April once the US Commerce Department delivers its report on why the US runs large trade deficits."
"Whatever today's news on tariffs, wide rate spreads justify EUR/USD continuing to trade near 1.03 and undermine the need for any corrective bounce. As our rate strategy colleagues discuss here, the decoupling of the eurozone from US rate spreads can see differentials stay wide, if not move wider over the coming months."
"Combined with rising natural gas prices, expect EUR/USD to stay offered. A decline towards the 1.0250/60 range, or potentially lower, seems probable ahead of the new tariffs."
Tentative buildup in downward momentum could lead to Pound Sterling (GBP) edging lower; the major support at 1.2310 is unlikely to come into view. In the longer run, for the time being, GBP is likely to trade in a 1.2310/1.2550 range, UOB Group's FX analysts Quek Ser Leang and Peter Chia note.
GBP is likely to trade in a 1.2310/1.2550 range
24-HOUR VIEW: "Yesterday, we noted that 'there has been a tentative buildup in momentum.' We held the view that GBP 'could weaken today, but any decline is not expected to reach the major support at 1.2310 (minor support is at 1.2350).' The subsequent price action did not turn out as we expected, with GBP trading in a 1.2363/1.2420 range before closing lower by 0.27% at 1.2367. We continue to detect a tentative buildup in momentum, and this could lead to GBP edging lower today. However, the major support at 1.2310 is still unlikely to come into view. Note that there is a minor support level at 1.2330. The downward pressure will remain intact as long as 1.2405 (minor resistance is at 1.2385) is not breached."
1-3 WEEKS VIEW: "Last Friday (09 Feb, spot at 1.2440), we indicated that 'for the time being, GBP is likely to trade in a 1.2310/1.2550 range.' While there has been a slight increase in downward momentum, we continue to hold the same view for now."
Yesterday's inflation print out of Norway surprised slightly to the topside which alongside the rally in natural gas prices has kept NOK bid in the early parts of this week, Danske Bank's FX analysts report.
Monday's inflation print doesn't seem to be a game changer
"While the natural gas price situation bears monitoring - a development we do not find one-sided positive for NOK – we emphasize that the inflation details revealed that it was imported inflation created the topside surprise while domestic inflation actually moved lower."
"With the latter being the clearly more important driver of Norges Bank's medium term inflation view we do not see yesterday's inflation print as any game changer for our call of 4 Norwegian rate cuts this year stating in March."
USD/CAD edges higher as Trump’s new tariff provides a modest lift to the safe-haven USD.
Recovering crude Oil prices and reduced bets for a March BoC rate cut underpin the Loonie.
Investors now look to Fed Chair Jerome Powell’s testimony for some meaningful impetus.
The USD/CAD pair attracts some buyers for the second straight day on Tuesday, though it lacks bullish conviction and remains confined in a familiar range held over the past week or so. The US Dollar (USD) crept higher in reaction to US President Donald Trump's new tariffs on commodity imports and turns out to be a key factor acting as a tailwind for the currency pair. Trump signed executive orders imposing 25% tariffs on imports of steel and aluminum into the US and told reporters that he would announce reciprocal tariffs on other countries in the next two days. This reignited global trade war fears, which, in turn, boosted demand for traditional safe-haven assets, including the Greenback.
Meanwhile, Friday's mostly upbeat US employment details, along with expectations that Trump's protectionist policies would boost inflation in the US, could force the Federal Reserve (Fed) to stick to its hawkish stance. This is seen as another factor that contributes to a modest USD uptick to over a one-week high. However, the market reaction so far has been limited, which is evident from the lack of any follow-through USD buying. Apart from this, a further recovery in Crude Oil prices from the year-to-date low touched last Friday underpins the commodity-linked Loonie and contributes to caping the USD/CAD pair amid diminishing chances of a Bank of Canada (BoC) rate cut next month.
In fact, the odds for a BoC rate cut at the March 12 meeting fell from 80% to 55% following the release of strong Canadian jobs data released on Friday. Traders also seem reluctant ahead of Fed Chair Jerome Powell's semi-annual congressional testimony. Powell's remarks will be scrutinized closely for fresh cues about the Fed's rate-cut path, which, in turn, will play a key role in influencing the USD demand in the near term. Apart from this, Oil price dynamics should contribute to providing meaningful impetus to the USD/CAD pair and contribute to producing short-term trading opportunities. Nevertheless, the mixed fundamental backdrop warrants caution before placing directional bets.
USD/CAD daily chart
Technical Outlook
From a technical perspective, the range-bound price action witnessed over the past week or so could be categorized as a bearish consolidation phase against the backdrop of the recent pullback from the 1.4800 neighbourhood or over a two-decade high. Moreover, oscillators on the daily chart have just started gaining negative traction and favor bearish traders. That said, it will be prudent to wait for a convincing break below the trading range support, around the 1.4275-1.4270 region, before positioning for further losses. The USD/CAD pair might then accelerate the slide further towards the 1.4235 intermediate support en route to the 1.4200 mark and the 1.4165-1.4160 region.
On the flip side, the overnight swing high, around the 1.4375 area, now seems to act as an immediate hurdle ahead of the 1.4400 mark. Some follow-through buying has the potential to lift the USD/CAD pair to the next relevant barrier near the 1.4465-1.4470 horizontal zone. This is followed by the 1.4500 psychological mark, which, if cleared, will shift the near-term bias in favor of bullish traders. The subsequent move up could extend further towards the 1.4545-1.4550 region before spot prices eventually aim towards reclaiming the 1.4600 round-figure mark.
Soft underlying tone suggests Euro (EUR) could drift lower; any decline is unlikely to reach the major support at 1.0250. In the longer run, outlook remains unclear; price movements are likely to stay within a 1.0250/1.0450 range for now, UOB Group's FX analysts Quek Ser Leang and Peter Chia note.
EUR/USD cad drift lower
24-HOUR VIEW: "While we expected EUR to 'weaken further' yesterday, we pointed out that 'any decline is unlikely to reach the major support at 1.0250.' Aside from the brief drop in early Sydney trade yesterday, EUR traded in a relatively quiet manner. That said, the underlying tone appears soft, and today, EUR is likely to drift lower, but any decline is still unlikely to reach the major support at 1.0250 (there is another support level at 1.0275). Resistance is at 1.0330; a breach of 1.0350 would indicate that the current mild downward pressure has eased."
1-3 WEEKS VIEW: "Our most recent narrative was from last Wednesday (05 Feb, spot at 1.0375), wherein 'the outlook is unclear for now, and EUR could trade in a broad range of 1.0250/1.0490 for the time being.' The outlook remains unclear, but the price movements are likely to stay within a narrower 1.0250/1.0450 range for now."
EUR/GBP appreciates following the BoE Catherine Mann’s comments on late Monday.
BoE’s Mann stated that UK businesses may struggle to raise prices this year due to job losses and weaker consumer spending.
The Euro may struggle due to the increased likelihood of deeper ECB rate cuts in the future.
EUR/GBP extends its gains for the second consecutive day, trading around 0.8350 during the European hours on Tuesday. The currency cross appreciated as the Pound Sterling (GBP) lost ground following the remarks from Bank of England (BoE) Monetary Policy Committee member Catherine Mann late Monday.
BoE’s Mann stated that United Kingdom’s (UK) businesses may struggle to raise prices this year as job losses and weaker consumer spending dampen inflation, according to the Financial Times. Mann, who is scheduled to speak again, suggested that corporate pricing power is fading, reducing inflationary pressures. BoE Governor Andrew Bailey's remarks later on Tuesday will also be closely watched.
On the data front, the British Retail Consortium (BRC) Like-for-Like Retail Sales in the UK increased by 2.5% year-on-year in January 2025, slowing from December’s 3.1% gain but surpassing market expectations of 0.2%. BRC Chief Executive Helen Dickinson noted that while the performance remains strong, its sustainability in the coming months remains uncertain.
On Monday, US President Donald Trump implemented a 25% tariff on steel and aluminum imports, eliminating all exemptions and overriding previous trade agreements with key US allies. Earlier, German Chancellor Olaf Scholz warned that the European Union (EU) could respond “within an hour” if the US proceeded with the proposed tariffs on European goods. This escalation in trade tensions is increasing risk aversion, putting pressure on the risk-sensitive Euro and capping gains for the EUR/GBP cross.
Additionally, the Euro could face challenges amid rising concerns over potential deflationary pressures in the Eurozone due to expected US tariffs have intensified odds of deeper ECB rate cuts, with markets now predicting the deposit rate could fall to 1.87% by December.
Economic Indicator
BoE's Governor Bailey speech
Andrew Bailey is the Bank of England's Governor. He took office on March 16th, 2020, at the end of Mark Carney's term. Bailey was serving as the Chief Executive of the Financial Conduct Authority before being designated. This British central banker was also the Deputy Governor of the Bank of England from April 2013 to July 2016 and the Chief Cashier of the Bank of England from January 2004 until April 2011.
EUR/USD has dropped toward 1.03 following another tariff headline over the weekend, with Trump announcing that he will impose 25% tariffs on US imports of steel and aluminum - primarily impacting Canada, Mexico, Brazil, and China, Danske Bank's FX analysts report.
EUR/USD to trade in the 1.04-1.05 range
"Tariff fears are strengthening the broad USD and pushing short-term US inflation expectations higher and prompting markets to price in faster rate cuts outside of the US. Yesterday saw mostly sideways trading, and a similar pattern is likely today ahead of tomorrow's US CPI print and Fed Chair Powell's testimony before Congress."
"Our tactical bias remains toward lower US yields and a broadly weaker USD. Historically, the broad USD tends to weaken when the manufacturing sector improves relative to the services sector, which we explore in this week's RtM USD."
"In the near term, we expect EUR/USD to trade in the 1.04-1.05 range, while maintaining our strategic view that EUR/USD could test parity over the course of the year."
NZD/USD tests the immediate resistance at a nine-day EMA of 0.5654.
The 14-day RSI is positioned below the 50 level, suggesting a bearish bias is active.
A successful break below 0.5650 could lead the pair to approach the rectangle’s lower boundary at the 0.5550 level.
The NZD/USD pair breaks its three-day losing streak, trading around 0.5650 during the early European hours on Tuesday. The technical analysis of the daily chart indicates that buyers and sellers are unsure of the long-term direction of the asset as the pair consolidates within a rectangular pattern.
Additionally, the 14-day Relative Strength Index (RSI) is positioned slightly below the 50 level, suggesting a bearish bias is active. However, the NZD/USD pair remains slightly below the nine-day Exponential Moving Average (EMA), reflecting that short-term price momentum is also dampened.
Regarding its support, the NZD/USD pair tests a crucial level of 0.5650. A successful break below this level could lead the pair to navigate the region around the lower threshold of the rectangle at the 0.5550 level, followed by its support area at 0.5516—its lowest point since October 2022, reached on February 3.
On the upside, the NZD/USD pair tests the nine-day EMA at 0.5654. A break above this level could improve the short-term price momentum and support the pair to navigate the area around its nine-week high of 0.5794, reached on January 24. The further barrier appears at the psychological level of 0.5800, followed by the upper threshold of the rectangle at 0.5810.
NZD/USD: Daily Chart
New Zealand Dollar PRICE Today
The table below shows the percentage change of New Zealand Dollar (NZD) against listed major currencies today. New Zealand Dollar was the strongest against the British Pound.
USD
EUR
GBP
JPY
CAD
AUD
NZD
CHF
USD
0.02%
0.18%
0.06%
0.14%
-0.05%
-0.13%
0.04%
EUR
-0.02%
0.14%
0.00%
0.12%
-0.07%
-0.15%
0.02%
GBP
-0.18%
-0.14%
-0.13%
-0.03%
-0.23%
-0.30%
-0.13%
JPY
-0.06%
0.00%
0.13%
0.10%
-0.09%
-0.17%
0.00%
CAD
-0.14%
-0.12%
0.03%
-0.10%
-0.19%
-0.27%
-0.10%
AUD
0.05%
0.07%
0.23%
0.09%
0.19%
-0.08%
0.09%
NZD
0.13%
0.15%
0.30%
0.17%
0.27%
0.08%
0.17%
CHF
-0.04%
-0.02%
0.13%
-0.01%
0.10%
-0.09%
-0.17%
The heat map shows percentage changes of major currencies against each other. The base currency is picked from the left column, while the quote currency is picked from the top row. For example, if you pick the New Zealand Dollar from the left column and move along the horizontal line to the US Dollar, the percentage change displayed in the box will represent NZD (base)/USD (quote).
The Pound Sterling is under pressure on Tuesday as BoE official Catherine Mann is concerned over weak demand and guides cracks in the labor market.
US President Trump imposes 25% tariffs on steel and aluminum and is poised to announce reciprocal tariffs.
Investors await BoE Bailey and Fed Powell’s speech on Tuesday.
The Pound Sterling (GBP) weakens against its major peers in European trading hours on Tuesday after a dovish commentary from Bank of England (BoE) Monetary Policy Committee (MPC) member Catherine Mann in an interview with the Financial Times (FT) earlier in the day.
Investors were keenly awaiting Catherine Mann’s interview to know the reasons that forced her to favor a bigger interest rate reduction in the previous week’s policy decision after being an outspoken hawk for a long period.
Mann said that she changed her mind about the policy because “demand conditions are quite a bit weaker than has been the case”. So, a 50 basis points (bps) rate cut call from her was a way to communicate with traders about “what we think are the appropriate financial conditions for the United Kingdom (UK) economy”.
When asked about her outlook on inflation and demand, Mann was confident that inflation would remain consistent with the BoE’s target of 2% later this year and saw a “non-linear” fall in employment.
Last week, the BoE reduced its key borrowing rates by 25 bps to 4.5%, as expected, with a 9-0 vote split favoring a rate cut. Seven MPC members voted for a 25 bps interest rate reduction. Surprisingly, Catherine Mann joined MPC member Swati Dhingra and favored a larger-than-usual rate cut.
In Tuesday’s session, investors will focus on BoE Governor Andrew Bailey’s speech at the University of Chicago Booth School of Business in London for more interest rate guidance.
Daily digest market movers: Pound Sterling drops against USD as Trump imposes 25% tariffs on steel and aluminum
The Pound Sterling trades subduedly against the US Dollar (USD) around 1.2350 in Tuesday’s European session. The outlook of the GBP/USD pair remains bearish as the US Dollar performs strongly on the assumption that the impact of 25% tariffs on steel and aluminum imports by all nations into the United States (US) will be inflationary.
On Monday, US President Donald Trump signed executive orders to impose 25% tariffs on all imports of steel and aluminum and confirmed that no country would be exempt from the duties, which will come into effect from March 4. Trump added that he will also announce reciprocal tariffs in the coming days.
Market participants worry that US importers will bear the impact of higher metal prices. This scenario would be inflationary for the economy, as business owners would pass on the impact of higher input prices to end consumers. This would force Federal Reserve (Fed) officials to wait more months before resuming the policy-easing cycle, which the central bank paused in January.
For meaningful cues on the interest rate outlook, investors will focus on Fed Chair Jerome Powell’s testimony before Congress at 15:00 GMT. Powell is also scheduled to testify before Congress on Wednesday.
In the January policy meeting, Jerome Powell said that monetary policy adjustments would become appropriate only when the Fed will see “real progress in inflation or at least some weakness in the labor market”.
This week, investors will also focus on the US Consumer Price Index (CPI) data for January, which will be released on Wednesday.
The Pound Sterling extends its losing streak for the fourth trading day against the US Dollar and posts a fresh weekly low near 1.2350 on Tuesday. The GBP/USD pair resumed its downside journey after recovering to near the 50-day Exponential Moving Average (EMA) around 1.2484.
The 14-day Relative Strength Index (RSI) oscillates inside the 40.00-60.00 range, suggesting a sideways trend.
Looking down, the January 13 low of 1.2100 and the October 2023 low of 1.2050 will act as key support zones for the pair. On the upside, the December 30 high of 1.2607 will act as key resistance.
Pound Sterling FAQs
The Pound Sterling (GBP) is the oldest currency in the world (886 AD) and the official currency of the United Kingdom. It is the fourth most traded unit for foreign exchange (FX) in the world, accounting for 12% of all transactions, averaging $630 billion a day, according to 2022 data. Its key trading pairs are GBP/USD, also known as ‘Cable’, which accounts for 11% of FX, GBP/JPY, or the ‘Dragon’ as it is known by traders (3%), and EUR/GBP (2%). The Pound Sterling is issued by the Bank of England (BoE).
The single most important factor influencing the value of the Pound Sterling is monetary policy decided by the Bank of England. The BoE bases its decisions on whether it has achieved its primary goal of “price stability” – a steady inflation rate of around 2%. Its primary tool for achieving this is the adjustment of interest rates. When inflation is too high, the BoE will try to rein it in by raising interest rates, making it more expensive for people and businesses to access credit. This is generally positive for GBP, as higher interest rates make the UK a more attractive place for global investors to park their money. When inflation falls too low it is a sign economic growth is slowing. In this scenario, the BoE will consider lowering interest rates to cheapen credit so businesses will borrow more to invest in growth-generating projects.
Data releases gauge the health of the economy and can impact the value of the Pound Sterling. Indicators such as GDP, Manufacturing and Services PMIs, and employment can all influence the direction of the GBP. A strong economy is good for Sterling. Not only does it attract more foreign investment but it may encourage the BoE to put up interest rates, which will directly strengthen GBP. Otherwise, if economic data is weak, the Pound Sterling is likely to fall.
Another significant data release for the Pound Sterling is the Trade Balance. This indicator measures the difference between what a country earns from its exports and what it spends on imports over a given period. If a country produces highly sought-after exports, its currency will benefit purely from the extra demand created from foreign buyers seeking to purchase these goods. Therefore, a positive net Trade Balance strengthens a currency and vice versa for a negative balance.
Here is what you need to know on Tuesday, February 11:
The US Dollar (USD) holds its ground early Tuesday after posting small gains against its major rivals on Monday, as markets turn cautious. The economic calendar will not offer any high-impact data releases but Federal Reserve (Fed) Chairman Jerome Powell's testimony before the Congress could ramp up the market volatility. Later in the American session, several other Fed policymakers are scheduled to deliver speeches as well.
US Dollar PRICE This week
The table below shows the percentage change of US Dollar (USD) against listed major currencies this week. US Dollar was the strongest against the Japanese Yen.
USD
EUR
GBP
JPY
CAD
AUD
NZD
CHF
USD
0.22%
0.36%
0.43%
0.33%
-0.05%
0.26%
0.26%
EUR
-0.22%
0.20%
0.33%
0.22%
-0.28%
0.12%
0.12%
GBP
-0.36%
-0.20%
-0.04%
-0.02%
-0.48%
-0.08%
-0.10%
JPY
-0.43%
-0.33%
0.04%
-0.13%
-0.40%
-0.17%
-0.16%
CAD
-0.33%
-0.22%
0.02%
0.13%
-0.35%
-0.10%
-0.12%
AUD
0.05%
0.28%
0.48%
0.40%
0.35%
0.40%
0.37%
NZD
-0.26%
-0.12%
0.08%
0.17%
0.10%
-0.40%
-0.02%
CHF
-0.26%
-0.12%
0.10%
0.16%
0.12%
-0.37%
0.02%
The heat map shows percentage changes of major currencies against each other. The base currency is picked from the left column, while the quote currency is picked from the top row. For example, if you pick the US Dollar from the left column and move along the horizontal line to the Japanese Yen, the percentage change displayed in the box will represent USD (base)/JPY (quote).
US President Donald Trump has signed an order to impose a sweeping 25% tariffs on all steel and aluminum imports into the US. Trump also noted that his administration will look into tariffs on automobiles, microchips, and pharmaceuticals next. Although the White House said there won't be any exemptions on tariffs, Australian Prime Minister Anthony Albanese announced that Trump has agreed to consider an exemption for Australia over steel and aluminum tariffs.
The USD Index stays comfortably above 108.00 after closing modestly higher on Monday. Meanwhile, US stock index futures were last seen losing between 0.2% and 0.35%. Powell will deliver a prepared statement and respond to questions in his testimony on the semiannual Monetary Policy Report before the Senate Banking, Housing and Urban Affairs Committee, starting at 15:00 GMT.
EUR/USD closed the first trading day of the week marginally lower. The pair stays relatively quiet and trades in a tight channel at around 1.0300 in the European morning on Tuesday.
GBP/USD posted losses for the third consecutive trading day on Monday. The pair struggles to regain its traction and trades in the negative territory at around 1.2350.
USD/JPY corrected higher Monday following the previous week's sharp decline before stabilizing near 152.00 on Tuesday.
Gold extended its uptrend and gained more than 1.5% on Monday. XAU/USD preserved its bullish momentum during the Asian trading hours and set a new all-time high above $2,940. The pair retreats in the European morning but holds comfortably above $2,900.
Fed FAQs
Monetary policy in the US is shaped by the Federal Reserve (Fed). The Fed has two mandates: to achieve price stability and foster full employment. Its primary tool to achieve these goals is by adjusting interest rates. When prices are rising too quickly and inflation is above the Fed’s 2% target, it raises interest rates, increasing borrowing costs throughout the economy. This results in a stronger US Dollar (USD) as it makes the US a more attractive place for international investors to park their money. When inflation falls below 2% or the Unemployment Rate is too high, the Fed may lower interest rates to encourage borrowing, which weighs on the Greenback.
The Federal Reserve (Fed) holds eight policy meetings a year, where the Federal Open Market Committee (FOMC) assesses economic conditions and makes monetary policy decisions. The FOMC is attended by twelve Fed officials – the seven members of the Board of Governors, the president of the Federal Reserve Bank of New York, and four of the remaining eleven regional Reserve Bank presidents, who serve one-year terms on a rotating basis.
In extreme situations, the Federal Reserve may resort to a policy named Quantitative Easing (QE). QE is the process by which the Fed substantially increases the flow of credit in a stuck financial system. It is a non-standard policy measure used during crises or when inflation is extremely low. It was the Fed’s weapon of choice during the Great Financial Crisis in 2008. It involves the Fed printing more Dollars and using them to buy high grade bonds from financial institutions. QE usually weakens the US Dollar.
Quantitative tightening (QT) is the reverse process of QE, whereby the Federal Reserve stops buying bonds from financial institutions and does not reinvest the principal from the bonds it holds maturing, to purchase new bonds. It is usually positive for the value of the US Dollar.
USD/CHF drifts higher to 0.9115 in Tuesday’s early European session.
The threats of reciprocal tariffs and additional protectionist measures by Trump boost the US Dollar.
The ongoing Middle East geopolitical tensions could boost the safe-haven currency like the CHF.
The USD/CHF pair trades in positive territory for the fourth consecutive day around 0.9115 on Tuesday during the early European trading hours. The threats of reciprocal tariffs and the imposition of 25% tariffs on aluminium and steel by US President Donald Trump provide some support to the US Dollar (USD). Investors will closely monitor Federal Reserve (Fed) Chair Jerome Powell’s semi-annual testimony on Tuesday.
Analysts believe that tariff policies by the Trump administration could be inflationary and put further pressure on the Fed to keep interest rates elevated. Markets are pricing in 36 basis points (bps) of cuts this year, down from 42 bps after an upbeat labour market report on Friday. This, in turn, underpins the Greenback against the Swiss Franc (CHF).
"It would not be prudent to fight this trend of US dollar strength, at least until later this year when we can have a better gauge of the breath and scope of the tariffs and the corresponding impact on the US economy," said United Overseas Bank (UOB) analysts.
On the other hand, global uncertainties and geopolitical tensions in the Middle East could drive safe-haven flows to the CHF. The Kremlin said on Monday that US-Russia relations were on the brink of collapse and refused to confirm whether Russian President Vladimir Putin had spoken with President Donald Trump, despite Trump saying so Sunday.
The Swiss Franc could trade stronger in the coming months as the Swiss National Bank (SNB) is unlikely to return to negative interest rates, Commerzbank analyst Michael Pfister said in a note. The SNB might end its rate-cutting cycle with a policy rate of 0.0%, compared with 0.5% currently.
Swiss Franc FAQs
The Swiss Franc (CHF) is Switzerland’s official currency. It is among the top ten most traded currencies globally, reaching volumes that well exceed the size of the Swiss economy. Its value is determined by the broad market sentiment, the country’s economic health or action taken by the Swiss National Bank (SNB), among other factors. Between 2011 and 2015, the Swiss Franc was pegged to the Euro (EUR). The peg was abruptly removed, resulting in a more than 20% increase in the Franc’s value, causing a turmoil in markets. Even though the peg isn’t in force anymore, CHF fortunes tend to be highly correlated with the Euro ones due to the high dependency of the Swiss economy on the neighboring Eurozone.
The Swiss Franc (CHF) is considered a safe-haven asset, or a currency that investors tend to buy in times of market stress. This is due to the perceived status of Switzerland in the world: a stable economy, a strong export sector, big central bank reserves or a longstanding political stance towards neutrality in global conflicts make the country’s currency a good choice for investors fleeing from risks. Turbulent times are likely to strengthen CHF value against other currencies that are seen as more risky to invest in.
The Swiss National Bank (SNB) meets four times a year – once every quarter, less than other major central banks – to decide on monetary policy. The bank aims for an annual inflation rate of less than 2%. When inflation is above target or forecasted to be above target in the foreseeable future, the bank will attempt to tame price growth by raising its policy rate. Higher interest rates are generally positive for the Swiss Franc (CHF) as they lead to higher yields, making the country a more attractive place for investors. On the contrary, lower interest rates tend to weaken CHF.
Macroeconomic data releases in Switzerland are key to assessing the state of the economy and can impact the Swiss Franc’s (CHF) valuation. The Swiss economy is broadly stable, but any sudden change in economic growth, inflation, current account or the central bank’s currency reserves have the potential to trigger moves in CHF. Generally, high economic growth, low unemployment and high confidence are good for CHF. Conversely, if economic data points to weakening momentum, CHF is likely to depreciate.
As a small and open economy, Switzerland is heavily dependent on the health of the neighboring Eurozone economies. The broader European Union is Switzerland’s main economic partner and a key political ally, so macroeconomic and monetary policy stability in the Eurozone is essential for Switzerland and, thus, for the Swiss Franc (CHF). With such dependency, some models suggest that the correlation between the fortunes of the Euro (EUR) and the CHF is more than 90%, or close to perfect.
06:30
France ILO Unemployment registered at 7.3%, below expectations (7.5%) in 4Q
EUR/JPY maintains its position amid rising odds of the BoJ rate hikes.
Risk aversion increases due to rising trade tensions and economic uncertainty following US tariffs on steel and aluminum imports.
The Euro struggles as the likelihood of deeper ECB rate cuts increases.
EUR/JPY remains steady after gaining ground in the previous session, trading around 156.60 during the Asian hours on Tuesday. The downside risks for the EUR/JPY cross seem possible as the Japanese Yen (JPY) gains ground against its peers, fueled by growing expectations that the Bank of Japan (BoJ) will continue raising rates this year.
The Bank of Japan Governor Kazuo Ueda and Deputy Governor Himino recently indicated the potential for another interest rate hike if economic conditions and inflation align with the central bank’s projections. Last week, BoJ board member Naoki Tamura emphasized the need to raise the policy rate to at least 1% in the latter half of fiscal 2025. Moreover, stronger-than-expected wage and household spending data have reinforced the hawkish stance on monetary policy.
Furthermore, heightened risk aversion may strengthen the safe-haven JPY while weighing on the risk-sensitive Euro, exerting downward pressure on the EUR/JPY pair. US President Donald Trump imposed a flat 25% tariff on steel and aluminum imports on Monday, removing all exemptions and nullifying previous trade agreements with key United States (US) allies. The move is intended to support struggling domestic industries but increases the risk of a broader trade conflict.
German Chancellor Olaf Scholz stated earlier that the European Union (EU) could react “within an hour” if the US imposes the proposed tariffs on European goods. Separately, Bernd Lange, head of the European Parliament’s trade committee, suggested that to avoid a trade war, the EU is open to reducing its 10% import tax on vehicles to a rate closer to the 2.5% tariff imposed by the US.
The Euro faces challenges amid rising concerns over potential deflationary pressures in the Eurozone due to expected US tariffs have intensified odds of deeper ECB rate cuts, with markets now predicting the deposit rate could fall to 1.87% by December.
Risk sentiment FAQs
In the world of financial jargon the two widely used terms “risk-on” and “risk off'' refer to the level of risk that investors are willing to stomach during the period referenced. In a “risk-on” market, investors are optimistic about the future and more willing to buy risky assets. In a “risk-off” market investors start to ‘play it safe’ because they are worried about the future, and therefore buy less risky assets that are more certain of bringing a return, even if it is relatively modest.
Typically, during periods of “risk-on”, stock markets will rise, most commodities – except Gold – will also gain in value, since they benefit from a positive growth outlook. The currencies of nations that are heavy commodity exporters strengthen because of increased demand, and Cryptocurrencies rise. In a “risk-off” market, Bonds go up – especially major government Bonds – Gold shines, and safe-haven currencies such as the Japanese Yen, Swiss Franc and US Dollar all benefit.
The Australian Dollar (AUD), the Canadian Dollar (CAD), the New Zealand Dollar (NZD) and minor FX like the Ruble (RUB) and the South African Rand (ZAR), all tend to rise in markets that are “risk-on”. This is because the economies of these currencies are heavily reliant on commodity exports for growth, and commodities tend to rise in price during risk-on periods. This is because investors foresee greater demand for raw materials in the future due to heightened economic activity.
The major currencies that tend to rise during periods of “risk-off” are the US Dollar (USD), the Japanese Yen (JPY) and the Swiss Franc (CHF). The US Dollar, because it is the world’s reserve currency, and because in times of crisis investors buy US government debt, which is seen as safe because the largest economy in the world is unlikely to default. The Yen, from increased demand for Japanese government bonds, because a high proportion are held by domestic investors who are unlikely to dump them – even in a crisis. The Swiss Franc, because strict Swiss banking laws offer investors enhanced capital protection.
GBP/JPY struggles to capitalize on the overnight modest bounce from a multi-month low.
Global trade war fears benefit the JPY’s safe-haven status and cap the upside for the cross.
The divergent BoJ-BoE policy outlook supports prospects for a further depreciating move.
The GBP/JPY cross finds some support near the 187.40 area during the Asian session on Tuesday, though it lacks follow-through and remains close to a multi-month low touched the previous day. Spot prices currently trade around the 187.85 region, nearly unchanged for the day, and seem vulnerable to prolong the recent downfall witnessed over the past three weeks or so.
US President Donald Trump's fresh tariffs on commodity imports drive some haven flows and lends support to the Japanese Yen (JPY), which continues to be underpinned by hawkish Bank of Japan (BoJ) expectations. In fact, several BoJ officials recently backed the case for more rate hikes amid worries that the broadening inflation is weighing on consumer spending. This marks a big divergence in comparison to the Bank of England's (BoE) gloomy outlook and validates the negative outlook for the GBP/JPY cross.
The UK central bank cut interest rates by a quarter-point last week, and some policymakers wanted a bigger move to offset a slowdown. Moreover, the BoE lowered its 2025 growth outlook and now forecasts it to expand by 0.75% compared to the previous estimate of 1.5%. Adding to this, BoE Governor Andrew Bailey told reporters that the central bank expects to make further rate cuts this year. This might continue to undermine the British Pound (GBP) and keep a lid on any attempted recovery for the GBP/JPY cross.
There isn't any relevant market-moving economic data due for release from the UK on Tuesday, though BoE Governor Andrew Bailey's scheduled speech might influence the GBP. Apart from this, the JPY price dynamics should contribute to producing short-term trading opportunities around the GBP/JPY cross. Nevertheless, the aforementioned fundamental backdrop seems tilted in favor of bearish traders and suggests that the path of least resistance for spot prices remains to the downside.
Economic Indicator
BoE's Governor Bailey speech
Andrew Bailey is the Bank of England's Governor. He took office on March 16th, 2020, at the end of Mark Carney's term. Bailey was serving as the Chief Executive of the Financial Conduct Authority before being designated. This British central banker was also the Deputy Governor of the Bank of England from April 2013 to July 2016 and the Chief Cashier of the Bank of England from January 2004 until April 2011.
EUR/USD remains weak near 1.0305 in Tuesday’s early European session.
The pair keeps the negative outlook below the 100-day EMA with a bearish RSI indicator.
The initial support emerges at 1.0250; the first upside barrier is located at 1.0406.
The EUR/USD pair extends its downside to around 1.0305 during the early European session on Tuesday. The Greenback strengthens after US President Donald Trump moved to substantially raise tariffs on steel and aluminium imports and said he would announce plans to impose reciprocal tariffs on other countries over the coming days.
Technically, the bearish outlook of EUR/USD remains in play as the major pair remains capped below the key 100-day Exponential Moving Average (EMA) on the daily chart. Furthermore, the downward momentum is supported by the Relative Strength Index (RSI), which is located below the midline around 42.20, suggesting that the path of least resistance is to the downside.
The first downside target for the major pair emerges at 1.0250, the lower limit of the Bollinger Band. Extended losses could see a drop to the 1.0210-1.0200 zone, representing the low of February 3 and the psychological mark. A decisive break below the mentioned level could pave the way to 1.0088, the high of October 26, 2022.
On the bright side, the high of February 6 at 1.0406 acts as an immediate resistance level for the cross. Sustained trading above this level could attract some buyers to 1.0504, the upper boundary of the Bollinger Band. Further north, the next hurdle is seen at 1.0541, the 100-day EMA.
EUR/USD daily chart
Euro FAQs
The Euro is the currency for the 19 European Union countries that belong to the Eurozone. It is the second most heavily traded currency in the world behind the US Dollar. In 2022, it accounted for 31% of all foreign exchange transactions, with an average daily turnover of over $2.2 trillion a day. EUR/USD is the most heavily traded currency pair in the world, accounting for an estimated 30% off all transactions, followed by EUR/JPY (4%), EUR/GBP (3%) and EUR/AUD (2%).
The European Central Bank (ECB) in Frankfurt, Germany, is the reserve bank for the Eurozone. The ECB sets interest rates and manages monetary policy. The ECB’s primary mandate is to maintain price stability, which means either controlling inflation or stimulating growth. Its primary tool is the raising or lowering of interest rates. Relatively high interest rates – or the expectation of higher rates – will usually benefit the Euro and vice versa. The ECB Governing Council makes monetary policy decisions at meetings held eight times a year. Decisions are made by heads of the Eurozone national banks and six permanent members, including the President of the ECB, Christine Lagarde.
Eurozone inflation data, measured by the Harmonized Index of Consumer Prices (HICP), is an important econometric for the Euro. If inflation rises more than expected, especially if above the ECB’s 2% target, it obliges the ECB to raise interest rates to bring it back under control. Relatively high interest rates compared to its counterparts will usually benefit the Euro, as it makes the region more attractive as a place for global investors to park their money.
Data releases gauge the health of the economy and can impact on the Euro. Indicators such as GDP, Manufacturing and Services PMIs, employment, and consumer sentiment surveys can all influence the direction of the single currency. A strong economy is good for the Euro. Not only does it attract more foreign investment but it may encourage the ECB to put up interest rates, which will directly strengthen the Euro. Otherwise, if economic data is weak, the Euro is likely to fall. Economic data for the four largest economies in the euro area (Germany, France, Italy and Spain) are especially significant, as they account for 75% of the Eurozone’s economy.
Another significant data release for the Euro is the Trade Balance. This indicator measures the difference between what a country earns from its exports and what it spends on imports over a given period. If a country produces highly sought after exports then its currency will gain in value purely from the extra demand created from foreign buyers seeking to purchase these goods. Therefore, a positive net Trade Balance strengthens a currency and vice versa for a negative balance.
WTI price holds gains as Russian Oil production in January fell further below the country’s OPEC+ quota.
Oil prices experience resistance amid rising trade tensions and economic uncertainty following US tariffs on steel and aluminum imports.
Geopolitical tensions increase as Trump urges Israel to end ceasefire with Hamas if hostages are not returned by the weekend.
West Texas Intermediate (WTI) crude Oil price continues its upward trend for the third straight day, trading around $72.20 during Asian hours on Tuesday. The rise in crude Oil prices is supported by concerns over increasing supply risks.
However, the upside of the WTI price remains limited due to growing trade tensions and economic uncertainty following US President Donald Trump’s decision to impose a 25% tariff increase on steel and aluminum imports. This move raises concerns about global economic growth and energy demand in the United States (US), the world’s largest Oil consumer.
According to Bloomberg, undisclosed sources indicate that Russian Oil production in January fell further below the country’s OPEC+ quota, with output dropping to 8.962 million barrels per day—16,000 barrels below its target under the OPEC+ agreement.
Meanwhile, new US sanctions target individuals and tankers transporting Iranian crude to China, intensifying pressure on Tehran. Iranian President Masoud Pezeshkian has called for OPEC members to unite against potential US sanctions, following Trump’s announcement of plans to reduce Iran’s oil exports to zero.
Geopolitical tensions in the Middle East could further support crude Oil prices. Trump has urged Israel to end its ceasefire with Hamas if hostages are not returned by the weekend, increasing the risk of renewed conflict as both sides accuse each other of violating the agreement.
Additionally, a Reuters poll of economists suggests the Federal Reserve may postpone interest rate cuts until next quarter due to inflation concerns. Many analysts who had anticipated a rate cut in March have now adjusted their forecasts, with most predicting at least one cut by June. Higher interest rates could slow economic growth in the US, the world’s largest Oil consumer, potentially dampening oil demand.
WTI Oil FAQs
WTI Oil is a type of Crude Oil sold on international markets. The WTI stands for West Texas Intermediate, one of three major types including Brent and Dubai Crude. WTI is also referred to as “light” and “sweet” because of its relatively low gravity and sulfur content respectively. It is considered a high quality Oil that is easily refined. It is sourced in the United States and distributed via the Cushing hub, which is considered “The Pipeline Crossroads of the World”. It is a benchmark for the Oil market and WTI price is frequently quoted in the media.
Like all assets, supply and demand are the key drivers of WTI Oil price. As such, global growth can be a driver of increased demand and vice versa for weak global growth. Political instability, wars, and sanctions can disrupt supply and impact prices. The decisions of OPEC, a group of major Oil-producing countries, is another key driver of price. The value of the US Dollar influences the price of WTI Crude Oil, since Oil is predominantly traded in US Dollars, thus a weaker US Dollar can make Oil more affordable and vice versa.
The weekly Oil inventory reports published by the American Petroleum Institute (API) and the Energy Information Agency (EIA) impact the price of WTI Oil. Changes in inventories reflect fluctuating supply and demand. If the data shows a drop in inventories it can indicate increased demand, pushing up Oil price. Higher inventories can reflect increased supply, pushing down prices. API’s report is published every Tuesday and EIA’s the day after. Their results are usually similar, falling within 1% of each other 75% of the time. The EIA data is considered more reliable, since it is a government agency.
OPEC (Organization of the Petroleum Exporting Countries) is a group of 12 Oil-producing nations who collectively decide production quotas for member countries at twice-yearly meetings. Their decisions often impact WTI Oil prices. When OPEC decides to lower quotas, it can tighten supply, pushing up Oil prices. When OPEC increases production, it has the opposite effect. OPEC+ refers to an expanded group that includes ten extra non-OPEC members, the most notable of which is Russia.
Gold prices rose in India on Tuesday, according to data compiled by FXStreet.
The price for Gold stood at 8,150.89 Indian Rupees (INR) per gram, up compared with the INR 8,117.77 it cost on Monday.
The price for Gold increased to INR 95,070.98 per tola from INR 94,684.09 per tola a day earlier.
Unit measure
Gold Price in INR
1 Gram
8,150.89
10 Grams
81,504.12
Tola
95,070.98
Troy Ounce
253,524.50
FXStreet calculates Gold prices in India by adapting international prices (USD/INR) to the local currency and measurement units. Prices are updated daily based on the market rates taken at the time of publication. Prices are just for reference and local rates could diverge slightly.
Gold has played a key role in human’s history as it has been widely used as a store of value and medium of exchange. Currently, apart from its shine and usage for jewelry, the precious metal is widely seen as a safe-haven asset, meaning that it is considered a good investment during turbulent times. Gold is also widely seen as a hedge against inflation and against depreciating currencies as it doesn’t rely on any specific issuer or government.
Central banks are the biggest Gold holders. In their aim to support their currencies in turbulent times, central banks tend to diversify their reserves and buy Gold to improve the perceived strength of the economy and the currency. High Gold reserves can be a source of trust for a country’s solvency. Central banks added 1,136 tonnes of Gold worth around $70 billion to their reserves in 2022, according to data from the World Gold Council. This is the highest yearly purchase since records began. Central banks from emerging economies such as China, India and Turkey are quickly increasing their Gold reserves.
Gold has an inverse correlation with the US Dollar and US Treasuries, which are both major reserve and safe-haven assets. When the Dollar depreciates, Gold tends to rise, enabling investors and central banks to diversify their assets in turbulent times. Gold is also inversely correlated with risk assets. A rally in the stock market tends to weaken Gold price, while sell-offs in riskier markets tend to favor the precious metal.
The price can move due to a wide range of factors. Geopolitical instability or fears of a deep recession can quickly make Gold price escalate due to its safe-haven status. As a yield-less asset, Gold tends to rise with lower interest rates, while higher cost of money usually weighs down on the yellow metal. Still, most moves depend on how the US Dollar (USD) behaves as the asset is priced in dollars (XAU/USD). A strong Dollar tends to keep the price of Gold controlled, whereas a weaker Dollar is likely to push Gold prices up.
(An automation tool was used in creating this post.)
Silver reverses the previous day’s positive move, though it lacks follow-through.
The setup supports prospects for an extension of over a one-month-old uptrend.
Any meaningful slide could be seen as a buying opportunity and remain limited.
Silver (XAG/USD) attracts fresh sellers during the Asian session on Tuesday and drops back closer to the overnight swing low, around the $31.65-$31.60 area. The white metal, however, trims a part of its intraday losses and currently trades just below the $32.00 mark, down 0.45% for the day.
From a technical perspective, the range-bound price action witnessed over the past week or so might be categorized as a bullish consolidation phase against the backdrop of the recent breakout through the 100-day Simple Moving Average (SMA). Moreover, oscillators on the daily chart are holding comfortably in the positive territory, suggesting that the path of least resistance for the XAG/USD is to the upside.
That said, repeated failures to find acceptance and build on momentum beyond the $32.30 barrier make it prudent to wait for a breakout through the short-term trading range before placing fresh bullish bets around the XAG/USD. The commodity might then surpass the $32.65 area, the monthly swing high touched last Friday, and aim to reclaim the $33.00 round figure for the first time since early November.
On the flip side, the $31.65-$31.60 region now seems to have emerged as an immediate support. Any further weakness below the said support could be seen as a buying opportunity and remain limited near the 100-day SMA, currently pegged around the $31.20-$31.15 zone. This is followed by the $31.00 mark, which, if broken decisively, might prompt some technical selling and pave the way for deeper losses.
Silver daily chart
Silver FAQs
Silver is a precious metal highly traded among investors. It has been historically used as a store of value and a medium of exchange. Although less popular than Gold, traders may turn to Silver to diversify their investment portfolio, for its intrinsic value or as a potential hedge during high-inflation periods. Investors can buy physical Silver, in coins or in bars, or trade it through vehicles such as Exchange Traded Funds, which track its price on international markets.
Silver prices can move due to a wide range of factors. Geopolitical instability or fears of a deep recession can make Silver price escalate due to its safe-haven status, although to a lesser extent than Gold's. As a yieldless asset, Silver tends to rise with lower interest rates. Its moves also depend on how the US Dollar (USD) behaves as the asset is priced in dollars (XAG/USD). A strong Dollar tends to keep the price of Silver at bay, whereas a weaker Dollar is likely to propel prices up. Other factors such as investment demand, mining supply – Silver is much more abundant than Gold – and recycling rates can also affect prices.
Silver is widely used in industry, particularly in sectors such as electronics or solar energy, as it has one of the highest electric conductivity of all metals – more than Copper and Gold. A surge in demand can increase prices, while a decline tends to lower them. Dynamics in the US, Chinese and Indian economies can also contribute to price swings: for the US and particularly China, their big industrial sectors use Silver in various processes; in India, consumers’ demand for the precious metal for jewellery also plays a key role in setting prices.
Silver prices tend to follow Gold's moves. When Gold prices rise, Silver typically follows suit, as their status as safe-haven assets is similar. The Gold/Silver ratio, which shows the number of ounces of Silver needed to equal the value of one ounce of Gold, may help to determine the relative valuation between both metals. Some investors may consider a high ratio as an indicator that Silver is undervalued, or Gold is overvalued. On the contrary, a low ratio might suggest that Gold is undervalued relative to Silver.
GBP/USD depreciated as Trump expanded tariffs and nullified previous trade agreements with key US allies.
President Trump raised import duty on steel and aluminum imports to a flat 25% without exceptions or exemptions.
BoE’s Mann stated that UK businesses may face difficulties in raising prices this year due to job losses.
GBP/USD continues its downward trend for the fourth consecutive day, trading near 1.2350 during Asian hours on Tuesday. The pair weakens amid escalating trade tensions after US President Donald Trump imposed a flat 25% tariff on steel and aluminum imports on Monday, removing all exemptions and nullifying previous trade agreements with key United States’ (US) allies. The move is intended to support struggling domestic industries but increases the risk of a broader trade conflict.
Trump’s proclamations raised the US aluminum tariff from 10% to 25%, eliminating country-specific exemptions, quota deals, and numerous product-specific exclusions for both metals. A White House official confirmed the new tariffs will take effect on March 4, with potential further measures targeting microchips and vehicles in the coming weeks.
Meanwhile, Bank of England (BoE) Monetary Policy Committee member Catherine Mann stated late Monday that United Kingdom’s (UK) businesses may struggle to raise prices this year as job losses and weaker consumer spending dampen inflation, according to the Financial Times. Mann, who is scheduled to speak again, suggested that corporate pricing power is fading, reducing inflationary pressures. BoE Governor Andrew Bailey's remarks later on Tuesday will also be closely watched.
In economic data, the British Retail Consortium (BRC) Like-for-Like Retail Sales in the UK increased by 2.5% year-on-year in January 2025, slowing from December’s 3.1% gain but surpassing market expectations of 0.2%. BRC Chief Executive Helen Dickinson noted that while the performance remains strong, its sustainability in the coming months remains uncertain.
Pound Sterling FAQs
The Pound Sterling (GBP) is the oldest currency in the world (886 AD) and the official currency of the United Kingdom. It is the fourth most traded unit for foreign exchange (FX) in the world, accounting for 12% of all transactions, averaging $630 billion a day, according to 2022 data. Its key trading pairs are GBP/USD, also known as ‘Cable’, which accounts for 11% of FX, GBP/JPY, or the ‘Dragon’ as it is known by traders (3%), and EUR/GBP (2%). The Pound Sterling is issued by the Bank of England (BoE).
The single most important factor influencing the value of the Pound Sterling is monetary policy decided by the Bank of England. The BoE bases its decisions on whether it has achieved its primary goal of “price stability” – a steady inflation rate of around 2%. Its primary tool for achieving this is the adjustment of interest rates. When inflation is too high, the BoE will try to rein it in by raising interest rates, making it more expensive for people and businesses to access credit. This is generally positive for GBP, as higher interest rates make the UK a more attractive place for global investors to park their money. When inflation falls too low it is a sign economic growth is slowing. In this scenario, the BoE will consider lowering interest rates to cheapen credit so businesses will borrow more to invest in growth-generating projects.
Data releases gauge the health of the economy and can impact the value of the Pound Sterling. Indicators such as GDP, Manufacturing and Services PMIs, and employment can all influence the direction of the GBP. A strong economy is good for Sterling. Not only does it attract more foreign investment but it may encourage the BoE to put up interest rates, which will directly strengthen GBP. Otherwise, if economic data is weak, the Pound Sterling is likely to fall.
Another significant data release for the Pound Sterling is the Trade Balance. This indicator measures the difference between what a country earns from its exports and what it spends on imports over a given period. If a country produces highly sought-after exports, its currency will benefit purely from the extra demand created from foreign buyers seeking to purchase these goods. Therefore, a positive net Trade Balance strengthens a currency and vice versa for a negative balance.
Gold price advances further beyond $2,900 and hits a fresh all-time peak on Tuesday.
Trump’s new tariffs and geopolitical risks continue to boost the safe-haven commodity.
A modest USD strength prompts some intraday profit-taking around the XAU/USD pair.
Gold price (XAU/USD) builds on the previous day's breakout momentum above the $2,900 round-figure mark and gains strong follow-through positive traction during the Asian session on Tuesday. US President Donald Trump's latest tariffs on commodity imports reignite global trade war fears and lift the safe-haven bullion to a fresh record high, around the $2,942-2,943 area in the last hour. Furthermore, expectations that Trump's protectionist policies would boost inflation turn out to be another factor that underpins the precious metal's status as a hedge against rising prices.
Meanwhile, Friday's upbeat US employment details, along with inflation concerns, leave room for the Federal Reserve (Fed) to hold interest rates steady, which, in turn, lifts the US Dollar (USD) to over a one-week top. Furthermore, overbought conditions on the daily chart prompt some intraday profit-taking around the non-yielding Gold price ahead of Fed Chair Jerome Powell's two-day semi-annual congressional testimony starting this Tuesday. That said, the fundamental backdrop suggests that any corrective slide could be seen as a buying opportunity and remain limited.
Gold price remains well supported by the global flight to safety amid global trade war fears
US President Donald Trump signed two proclamations on Monday, introducing 25% tariffs on metals and ending all exclusions on steel and aluminum tariffs first imposed during his first tenure from 2016 to 2020.
Adding to this, Trump told reporters that he would announce reciprocal tariffs on other countries in the next two days, propelling the safe-haven Gold price to a fresh record high during the Asian session on Tuesday.
Commenting on Middle East tensions, Trump said that Hamas should release all hostages held by midday Saturday, or he would propose canceling the Israel-Hamas ceasefire and "let all hell break loose."
The US Dollar advances to over a one-week high amid expectations that Trump's protectionist policies would reignite inflation in the US and force the Federal Reserve to stick to its hawkish stance and hold rates steady.
A stronger USD, along with overbought conditions on the daily chart, prompts some profit-taking around the XAU/USD amid some repositioning ahead of Fed Chair Jerome Powell's congressional testimony.
Powell's remarks will be closely scrutinized for cues about the Fed's rate-cut path, which, in turn, will influence the near-term USD price dynamics and provide a fresh directional impetus to the commodity.
Gold price technical setup supports prospects for the emergence of some dip-buying
From a technical perspective, a slide below the $2,900 mark is likely to find some support near the $2,886-2,882 horizontal zone. Some follow-through selling could drag the Gold price further towards the $2,855-2,852 intermediate support en route to the $2,834 region. Any further decline could be seen as a buying opportunity and is more likely to remain limited near the $2,800 mark. The latter should act as a key pivotal point, which, if broken decisively, should pave the way for deeper losses.
On the flip side, the Asian session swing high, around the $2,842-2,843 region, now seems to act as an immediate strong barrier. Bulls are likely to pause near the said barrier amid the overbought Relative Strength Index (RSI) on the daily chart, which makes it prudent to wait for some near-term consolidation or a modest pullback before positioning for the next leg up. Nevertheless, the broader technical setup suggests that the path of least resistance for the Gold price remains to the upside and supports prospects for an extension of a well-established uptrend witnessed over the past two months or so.
Gold FAQs
Gold has played a key role in human’s history as it has been widely used as a store of value and medium of exchange. Currently, apart from its shine and usage for jewelry, the precious metal is widely seen as a safe-haven asset, meaning that it is considered a good investment during turbulent times. Gold is also widely seen as a hedge against inflation and against depreciating currencies as it doesn’t rely on any specific issuer or government.
Central banks are the biggest Gold holders. In their aim to support their currencies in turbulent times, central banks tend to diversify their reserves and buy Gold to improve the perceived strength of the economy and the currency. High Gold reserves can be a source of trust for a country’s solvency. Central banks added 1,136 tonnes of Gold worth around $70 billion to their reserves in 2022, according to data from the World Gold Council. This is the highest yearly purchase since records began. Central banks from emerging economies such as China, India and Turkey are quickly increasing their Gold reserves.
Gold has an inverse correlation with the US Dollar and US Treasuries, which are both major reserve and safe-haven assets. When the Dollar depreciates, Gold tends to rise, enabling investors and central banks to diversify their assets in turbulent times. Gold is also inversely correlated with risk assets. A rally in the stock market tends to weaken Gold price, while sell-offs in riskier markets tend to favor the precious metal.
The price can move due to a wide range of factors. Geopolitical instability or fears of a deep recession can quickly make Gold price escalate due to its safe-haven status. As a yield-less asset, Gold tends to rise with lower interest rates, while higher cost of money usually weighs down on the yellow metal. Still, most moves depend on how the US Dollar (USD) behaves as the asset is priced in dollars (XAU/USD). A strong Dollar tends to keep the price of Gold controlled, whereas a weaker Dollar is likely to push Gold prices up.
Tariffs FAQs
Tariffs are customs duties levied on certain merchandise imports or a category of products. Tariffs are designed to help local producers and manufacturers be more competitive in the market by providing a price advantage over similar goods that can be imported. Tariffs are widely used as tools of protectionism, along with trade barriers and import quotas.
Although tariffs and taxes both generate government revenue to fund public goods and services, they have several distinctions. Tariffs are prepaid at the port of entry, while taxes are paid at the time of purchase. Taxes are imposed on individual taxpayers and businesses, while tariffs are paid by importers.
There are two schools of thought among economists regarding the usage of tariffs. While some argue that tariffs are necessary to protect domestic industries and address trade imbalances, others see them as a harmful tool that could potentially drive prices higher over the long term and lead to a damaging trade war by encouraging tit-for-tat tariffs.
During the run-up to the presidential election in November 2024, Donald Trump made it clear that he intends to use tariffs to support the US economy and American producers. In 2024, Mexico, China and Canada accounted for 42% of total US imports. In this period, Mexico stood out as the top exporter with $466.6 billion, according to the US Census Bureau. Hence, Trump wants to focus on these three nations when imposing tariffs. He also plans to use the revenue generated through tariffs to lower personal income taxes.
USD/CAD strengthened due to rising trade war tensions as Trump expanded tariffs on steel and aluminum imports.
President Trump raised import duty on steel and aluminum imports to a flat 25% without exceptions or exemptions.
Canada’s Industry Minister condemned the tariffs as “totally unjustified” and stated, “Our response will be clear and calibrated.”
USD/CAD extends its gains for the second successive day, trading around 1.4330 during the Asian hours on Tuesday. The pair appreciated due to escalating trade tensions after US President Donald Trump significantly increased tariffs on steel and aluminum imports to a flat 25% on Monday, with no exceptions or exemptions. The move aims to support struggling domestic industries but raises the risk of a multi-front trade war.
Trump signed proclamations raising the US aluminum tariff rate from 10% to 25%, eliminating country exemptions, quota deals, and hundreds of thousands of product-specific tariff exclusions for both metals. A White House official confirmed the new measures would take effect on March 4, with further action on microchips and vehicles under consideration in the coming weeks.
Canada supplied nearly 80% of US primary aluminum imports in 2024. Steel imports made up approximately 23% of US steel consumption in 2023, with Canada, Brazil, and Mexico as the top suppliers.
Canada’s Industry Minister Francois-Philippe Champagne condemned the tariffs as “totally unjustified,” emphasizing that Canadian steel and aluminum play a vital role in key US industries such as defense, shipbuilding, energy, and automotive manufacturing. "We are consulting with our international partners as we examine the details. Our response will be clear and calibrated," he stated.
The US Dollar Index (DXY), which measures the US Dollar’s value against six major currencies, extends its gains for the fourth successive session and rises to near 108.50 at the time of writing. The Greenback receives support as the US Federal Reserve (Fed) is now expected to keep interest rates steady this year, following January’s jobs report released on Friday, which indicated slowing job growth but a lower Unemployment Rate.
A Reuters poll of economists now suggests the Federal Reserve will delay cutting interest rates until next quarter amid rising inflation concerns. Many who had previously expected a March rate cut have revised their forecasts. The majority of economists surveyed between February 4-10 anticipate at least one rate cut by June, though opinions on the exact timing remain divided.
Tariffs FAQs
Tariffs are customs duties levied on certain merchandise imports or a category of products. Tariffs are designed to help local producers and manufacturers be more competitive in the market by providing a price advantage over similar goods that can be imported. Tariffs are widely used as tools of protectionism, along with trade barriers and import quotas.
Although tariffs and taxes both generate government revenue to fund public goods and services, they have several distinctions. Tariffs are prepaid at the port of entry, while taxes are paid at the time of purchase. Taxes are imposed on individual taxpayers and businesses, while tariffs are paid by importers.
There are two schools of thought among economists regarding the usage of tariffs. While some argue that tariffs are necessary to protect domestic industries and address trade imbalances, others see them as a harmful tool that could potentially drive prices higher over the long term and lead to a damaging trade war by encouraging tit-for-tat tariffs.
During the run-up to the presidential election in November 2024, Donald Trump made it clear that he intends to use tariffs to support the US economy and American producers. In 2024, Mexico, China and Canada accounted for 42% of total US imports. In this period, Mexico stood out as the top exporter with $466.6 billion, according to the US Census Bureau. Hence, Trump wants to focus on these three nations when imposing tariffs. He also plans to use the revenue generated through tariffs to lower personal income taxes.
03:02
Indonesia Consumer Confidence declined to 127.2 in January from previous 127.7
The Indian Rupee edges lower in Tuesday’s Asian session.
Trade tariff worries, sustained foreign outflows, and concerns on an Indian economic slowdown weigh on the INR.
Investors await Fed Chair Jerome Powell’s semi-annual testimony on Tuesday.
The Indian Rupee (INR) remains weak on Tuesday after falling to a fresh record low in the previous session. The risk of fresh US trade tariffs spurs losses in most regional currencies, including the INR. Investors are concerned about the Indian economy as data signal that Asia’s third-largest economy is slowing. The country’s Gross Domestic Product (GDP) is forecast to expand by 6.4% in the year through March, the weakest pace since the pandemic. Additionally, the sustained portfolio outflows contribute to the local currency’s downside.
Nonetheless, the Reserve Bank of India (RBI) might step in routinely to curb excess volatility in the currency. The frequent interventions have weighed on India's Foreign exchange reserves, which are hovering near an 11-month low. Federal Reserve (Fed) Chair Jerome Powell’s semi-annual testimony will be the highlight later on Tuesday.
Indian Rupee loses traction amidst tariff threats
The Indian Rupee has declined continuously since Trump's victory in the US elections last November, falling by around 4.5% since then.
"We believe the risks to INR over the coming months are skewed towards relative weakness. If the broad USD were to weaken, we believe the downside in USD/INR would be mitigated by active RBI FX purchases," Nomura said in a note.
India has high tariffs that lock out imports, Trump's top economic adviser Kevin Hassett said on Monday, adding that India's Prime Minister had a lot to discuss with Trump when the two leaders meet soon.
India is considering tariff cuts in at least a dozen sectors, from electronics to medical equipment and chemicals, in order to promote US exports and align with India's domestic manufacturing ambitions.
India also plans to propose increasing energy product imports from the US, estimated at over $11 billion in the first eleven months of 2024, to alleviate trade imbalances.
On Monday, US President Donald Trump expanded his steel and aluminum tariffs to cover all imports, effectively canceling deals with the European Union, the United Kingdom, Japan and others.
The new executive order builds on the 25% tariff on steel and the 10% tariff the first Trump administration imposed in 2018 by raising duties, closing loopholes and eliminating exemptions, according to a White House official.
USD/INR keeps the constructive view but bulls turn cautious amid a shooting star
The Indian Rupee softens on the day. According to the daily chart, the positive view of the USD/INR pair prevails as the price is above the key 100-day Exponential Moving Average (EMA), indicating that bulls have the upper hand.
However, the 14-day Relative Strength Index (RSI) reaches overbought territory beyond the 70.00 mark, potentially signaling a temporary weakness or further consolidation in the near term.
The first upside barrier for USD/INR emerges in the 87.95-88.00 zone, representing an all-time high and psychological level. If buyers step in, the pair could see a rally to 88.50.
On the flip side, the initial support level to watch is 87.31, the low of February 7. If bearish momentum persists, the pair could fall back to the 87.05-87.00 regions, representing the low of February 5 and the round mark. Further south, the next contention level is seen at 86.51, the low of February 3.
Indian Rupee FAQs
The Indian Rupee (INR) is one of the most sensitive currencies to external factors. The price of Crude Oil (the country is highly dependent on imported Oil), the value of the US Dollar – most trade is conducted in USD – and the level of foreign investment, are all influential. Direct intervention by the Reserve Bank of India (RBI) in FX markets to keep the exchange rate stable, as well as the level of interest rates set by the RBI, are further major influencing factors on the Rupee.
The Reserve Bank of India (RBI) actively intervenes in forex markets to maintain a stable exchange rate, to help facilitate trade. In addition, the RBI tries to maintain the inflation rate at its 4% target by adjusting interest rates. Higher interest rates usually strengthen the Rupee. This is due to the role of the ‘carry trade’ in which investors borrow in countries with lower interest rates so as to place their money in countries’ offering relatively higher interest rates and profit from the difference.
Macroeconomic factors that influence the value of the Rupee include inflation, interest rates, the economic growth rate (GDP), the balance of trade, and inflows from foreign investment. A higher growth rate can lead to more overseas investment, pushing up demand for the Rupee. A less negative balance of trade will eventually lead to a stronger Rupee. Higher interest rates, especially real rates (interest rates less inflation) are also positive for the Rupee. A risk-on environment can lead to greater inflows of Foreign Direct and Indirect Investment (FDI and FII), which also benefit the Rupee.
Higher inflation, particularly, if it is comparatively higher than India’s peers, is generally negative for the currency as it reflects devaluation through oversupply. Inflation also increases the cost of exports, leading to more Rupees being sold to purchase foreign imports, which is Rupee-negative. At the same time, higher inflation usually leads to the Reserve Bank of India (RBI) raising interest rates and this can be positive for the Rupee, due to increased demand from international investors. The opposite effect is true of lower inflation.
The Japanese Yen edges higher as Trump’s new tariffs boost demand for safe-haven assets.
Bets that the BoJ will hike rates further turn out to be another factor underpinning the JPY.
Expectations that the Fed could delay rate cuts benefit the USD and lend support to USD/JPY.
The Japanese Yen (JPY) attracted some safe-haven flows during the Asian session on Tuesday in reaction to US President Donald Trump's new tariffs on steel and aluminum imports. Apart from this, the Bank of Japan’s (BoJ) plans to hike interest rates further turn out to be another factor that underpins the JPY. This, in turn, keeps the USD/JPY pair below the 152.00 mark and a confluence support-breakpoint-turned-resistance retested on Monday.
Meanwhile, Trump's no-exemption tariffs on commodity imports effectively end deals with the European Union, the United Kingdom, Japan, and other countries. This endangers Japan's economic stability and acts as a headwind for the JPY. Moreover, expectations that Trump's policies would boost inflation and delay rate cuts by the Federal Reserve (Fed) lend support to the US Dollar (USD) and help limit losses for the USD/JPY pair.
Japanese Yen draws support from a combination of factors; bulls still have the upper hand
US President Donald Trump signed an order Monday that imposes a 25% tariff on imports of steel and aluminum into the US, fueling trade war fears and underpinning the safe-haven Japanese Yen.
Bank of Japan Governor Kazuo Ueda and Deputy Governor Himino recently signaled the possibility of another interest rate hike if the economy and prices align with the central bank's projections.
Adding to this, BoJ board member Naoki Tamura said last week policymakers need to bump up interest rates to 1% by the second half of the fiscal year beginning in April to fend off rising prices.
Moreover, several BoJ officials are in favor of more rate hikes as inflation is weighing on consumer spending. Japan's core consumer inflation has exceeded the BoJ's 2% target for nearly three years.
Meanwhile, worries that Trump's policies would reignite inflation in the US might force the Federal Reserve to stick to its hawkish stance on the back of a still resilient US economy and labor market.
The market focus now shifts to Fed Chair Jerome Powell's two-day congressional testimony starting this Tuesday, which might provide cues about the rate-cut path and influence the US Dollar.
Apart from this, the release of the latest US consumer inflation figures on Wednesday will determine the near-term USD trajectory and provide some meaningful impetus to the USD/JPY pair.
USD/JPY remains vulnerable while below the 152.50 confluence support breakpoint
From a technical perspective, the overnight failure near the 152.50 confluence support breakpoint now turned resistance, and the subsequent downtick favors bearish traders. Moreover, oscillators on the daily chart are holding deep in negative territory and are still away from being in the oversold zone. This, in turn, suggests that the path of least resistance for the USD/JPY pair is to the downside.
However, any further slide is more likely to find some support near the 151.30 horizontal zone ahead of the 151.00-150.90 area, or the lowest level since December 10 touched last Friday. Some follow-through selling below will reaffirm the negative bias and make the USD/JPY pair vulnerable to weaken further to the 150.00 psychological mark with some intermediate support near the 150.55 region.
On the flip side, the 152.50 confluence – comprising the 100- and the 200-day Simple Moving Averages (SMAs) – might continue to act as a strong immediate hurdle. A sustained strength beyond, however, might trigger a short-covering move and allow the USD/JPY pair to reclaim the 153.00 round figure. The recovery could extend further, though it is likely to remain capped near the 153.75 region.
Japanese Yen FAQs
The Japanese Yen (JPY) is one of the world’s most traded currencies. Its value is broadly determined by the performance of the Japanese economy, but more specifically by the Bank of Japan’s policy, the differential between Japanese and US bond yields, or risk sentiment among traders, among other factors.
One of the Bank of Japan’s mandates is currency control, so its moves are key for the Yen. The BoJ has directly intervened in currency markets sometimes, generally to lower the value of the Yen, although it refrains from doing it often due to political concerns of its main trading partners. The BoJ ultra-loose monetary policy between 2013 and 2024 caused the Yen to depreciate against its main currency peers due to an increasing policy divergence between the Bank of Japan and other main central banks. More recently, the gradually unwinding of this ultra-loose policy has given some support to the Yen.
Over the last decade, the BoJ’s stance of sticking to ultra-loose monetary policy has led to a widening policy divergence with other central banks, particularly with the US Federal Reserve. This supported a widening of the differential between the 10-year US and Japanese bonds, which favored the US Dollar against the Japanese Yen. The BoJ decision in 2024 to gradually abandon the ultra-loose policy, coupled with interest-rate cuts in other major central banks, is narrowing this differential.
The Japanese Yen is often seen as a safe-haven investment. This means that in times of market stress, investors are more likely to put their money in the Japanese currency due to its supposed reliability and stability. Turbulent times are likely to strengthen the Yen’s value against other currencies seen as more risky to invest in.
Tariffs FAQs
Tariffs are customs duties levied on certain merchandise imports or a category of products. Tariffs are designed to help local producers and manufacturers be more competitive in the market by providing a price advantage over similar goods that can be imported. Tariffs are widely used as tools of protectionism, along with trade barriers and import quotas.
Although tariffs and taxes both generate government revenue to fund public goods and services, they have several distinctions. Tariffs are prepaid at the port of entry, while taxes are paid at the time of purchase. Taxes are imposed on individual taxpayers and businesses, while tariffs are paid by importers.
There are two schools of thought among economists regarding the usage of tariffs. While some argue that tariffs are necessary to protect domestic industries and address trade imbalances, others see them as a harmful tool that could potentially drive prices higher over the long term and lead to a damaging trade war by encouraging tit-for-tat tariffs.
During the run-up to the presidential election in November 2024, Donald Trump made it clear that he intends to use tariffs to support the US economy and American producers. In 2024, Mexico, China and Canada accounted for 42% of total US imports. In this period, Mexico stood out as the top exporter with $466.6 billion, according to the US Census Bureau. Hence, Trump wants to focus on these three nations when imposing tariffs. He also plans to use the revenue generated through tariffs to lower personal income taxes.
The Australian Dollar depreciates as Trump imposes a 25% tariff on all steel and aluminum imports.
Australia’s Westpac Consumer Confidence rose 0.1% in February, reaching 92.2 in January from 92.1 prior.
The US Dollar appreciates amid the rising cautious mood surrounding the Fed’s policy outlook.
The Australian Dollar (AUD) weakened against the US Dollar (USD) on Tuesday as downward pressure mounted on the AUD/USD pair. The decline followed US President Donald Trump’s decision to expand steel and aluminum tariffs by 25% to include all imports, nullifying trade agreements with key US allies, including Australia. The White House confirmed that all import tax exclusions had been removed and indicated that further action on microchips and vehicles would be considered in the coming weeks.
Australia’s Westpac Consumer Confidence increased by 0.1% in February, reaching 92.2 from 92.1 in January. Despite the slight uptick, consumer confidence remained subdued due to ongoing concerns over household finances and the rising cost of living.
Market sentiment suggests growing expectations that the Reserve Bank of Australia (RBA) will lower its 4.35% cash rate at its next meeting in February. Traders now see a 95% probability of a cut to 4.10%, as recent data indicates that underlying inflation has eased more rapidly than the RBA anticipated. This has prompted several major Australian banks to shift their forecast for the first rate cut from May to February.
Australian Dollar declines amid rising cautious tone surrounding Fed’s policy outlook
The US Dollar Index (DXY), which measures the US Dollar’s value against six major currencies, rises above 108.00 at the time of writing. The Greenback receives support as the US Federal Reserve (Fed) is now expected to keep interest rates steady this year, following January’s jobs report released on Friday, which indicated slowing job growth but a lower Unemployment Rate.
US Nonfarm Payrolls (NFP) increased by 143,000 in January, significantly below December’s revised figure of 307,000 and the market expectation of 170,000. However, the Unemployment Rate declined slightly to 4% in January from 4.1% in December.
US Initial Jobless Claims rose to 219K for the week ending January 31, as reported by the US Department of Labor (DOL) on Thursday. This print surpasses initial estimates of 213K and was higher than the previous week's revised tally of 208K (from 207K).
Federal Reserve (Fed) Bank of Chicago President Austan Goolsbee mentioned on Friday that inconsistent policy approaches from the US government cause a high level of economic uncertainty that makes it difficult for the Fed to draw a bead on where the economy, and inflation specifically, are likely heading.
Meanwhile, Fed Board of Governors member Adriana Kugler noted that US growth and economic activity remain healthy overall, but noted that progress toward the Fed's inflation goals has been somewhat lopsided, per Reuters.
In an interview with CNBC, Minneapolis Fed President Neel Kashkari said that he would move towards supporting further rate cuts if they see good inflation data and the labor market stays strong
China’s Consumer Price Index (CPI) grew at an annual rate of 0.5% in January, up from 0.1% in December and exceeding the market forecast of 0.4%. On a monthly basis, CPI inflation rose 0.7% in January, compared to December’s flat reading of 0%, though it fell short of the expected 0.8% increase.
Technical Analysis: Australian Dollar tests nine-day EMA, followed by 0.6250
The AUD/USD pair hovers near 0.6270 on Tuesday, testing the nine- and 14-day Exponential Moving Averages (EMAs) on the daily chart. A break below these levels could weaken short-term price momentum. The 14-day Relative Strength Index (RSI) maintains its position above the 50 mark, suggesting a bullish bias is active.
On the upside, the AUD/USD pair may explore the region around the eight-week high of 0.6330, last reached on January 24.
The AUD/USD pair tests immediate support at the nine-day EMA of 0.6264 level, followed by the 14-day EMA of 0.6258. A decisive break below these levels could weaken the short-term price momentum, potentially pushing the pair toward 0.6087—the lowest level since April 2020, recorded on February 3.
AUD/USD: Daily Chart
Australian Dollar PRICE Today
The table below shows the percentage change of Australian Dollar (AUD) against listed major currencies today. Australian Dollar was the weakest against the Swiss Franc.
USD
EUR
GBP
JPY
CAD
AUD
NZD
CHF
USD
0.05%
0.05%
0.02%
0.17%
0.10%
0.06%
-0.01%
EUR
-0.05%
-0.02%
-0.06%
0.13%
0.05%
0.03%
-0.06%
GBP
-0.05%
0.02%
-0.02%
0.13%
0.05%
0.03%
-0.06%
JPY
-0.02%
0.06%
0.02%
0.16%
0.08%
0.06%
-0.02%
CAD
-0.17%
-0.13%
-0.13%
-0.16%
-0.07%
-0.09%
-0.19%
AUD
-0.10%
-0.05%
-0.05%
-0.08%
0.07%
-0.02%
-0.12%
NZD
-0.06%
-0.03%
-0.03%
-0.06%
0.09%
0.02%
-0.09%
CHF
0.01%
0.06%
0.06%
0.02%
0.19%
0.12%
0.09%
The heat map shows percentage changes of major currencies against each other. The base currency is picked from the left column, while the quote currency is picked from the top row. For example, if you pick the Australian Dollar from the left column and move along the horizontal line to the US Dollar, the percentage change displayed in the box will represent AUD (base)/USD (quote).
Australian Dollar FAQs
One of the most significant factors for the Australian Dollar (AUD) is the level of interest rates set by the Reserve Bank of Australia (RBA). Because Australia is a resource-rich country another key driver is the price of its biggest export, Iron Ore. The health of the Chinese economy, its largest trading partner, is a factor, as well as inflation in Australia, its growth rate and Trade Balance. Market sentiment – whether investors are taking on more risky assets (risk-on) or seeking safe-havens (risk-off) – is also a factor, with risk-on positive for AUD.
The Reserve Bank of Australia (RBA) influences the Australian Dollar (AUD) by setting the level of interest rates that Australian banks can lend to each other. This influences the level of interest rates in the economy as a whole. The main goal of the RBA is to maintain a stable inflation rate of 2-3% by adjusting interest rates up or down. Relatively high interest rates compared to other major central banks support the AUD, and the opposite for relatively low. The RBA can also use quantitative easing and tightening to influence credit conditions, with the former AUD-negative and the latter AUD-positive.
China is Australia’s largest trading partner so the health of the Chinese economy is a major influence on the value of the Australian Dollar (AUD). When the Chinese economy is doing well it purchases more raw materials, goods and services from Australia, lifting demand for the AUD, and pushing up its value. The opposite is the case when the Chinese economy is not growing as fast as expected. Positive or negative surprises in Chinese growth data, therefore, often have a direct impact on the Australian Dollar and its pairs.
Iron Ore is Australia’s largest export, accounting for $118 billion a year according to data from 2021, with China as its primary destination. The price of Iron Ore, therefore, can be a driver of the Australian Dollar. Generally, if the price of Iron Ore rises, AUD also goes up, as aggregate demand for the currency increases. The opposite is the case if the price of Iron Ore falls. Higher Iron Ore prices also tend to result in a greater likelihood of a positive Trade Balance for Australia, which is also positive of the AUD.
The Trade Balance, which is the difference between what a country earns from its exports versus what it pays for its imports, is another factor that can influence the value of the Australian Dollar. If Australia produces highly sought after exports, then its currency will gain in value purely from the surplus demand created from foreign buyers seeking to purchase its exports versus what it spends to purchase imports. Therefore, a positive net Trade Balance strengthens the AUD, with the opposite effect if the Trade Balance is negative.
NZD/USD weakens to near 0.5635 in Tuesday’s Asian session.
Trump raised aluminum and steel tariffs to 25%, from a previous 10%.
The RBNZ is expected to deliver a third consecutive supersized rate cut later this month.
The NZD/USD pair remains under selling pressure around 0.5635 during the Asian session on Tuesday. The concerns about potential trade wars under US President Donald Trump administration continue to undermine the New Zealand Dollar (NZD). Later on Tuesday, Federal Reserve (Fed) Chair Jerome Powell’s semi-annual testimony will be in the spotlight.
Trump said on Sunday that he will announce new 25% tariffs on all steel and aluminium imports into the US on Monday that would affect “everybody’, including its largest trading partners, Canada and Mexico.
New Zealand Finance Minister Nicola Willis said, "New Zealand is distinguished in that we have a very balanced and complementary trade relationship with the United States.” Willis further stated that she hopes to maintain a warm relationship with the US in the future. Investors will closely watch the developments surrounding new tariff policies. Any signs of escalating trade war tensions could drag the Kiwi lower against the USD.
Furthermore, the rising expectation that the Reserve Bank of New Zealand (RBNZ) will deliver a third consecutive supersized rate cut later this month contributes to the NZD’s downside. The markets have priced in nearly a 92% odds that the RBNZ will deliver a 50 basis points (bps) rate reduction on February 19.
RBNZ FAQs
The Reserve Bank of New Zealand (RBNZ) is the country’s central bank. Its economic objectives are achieving and maintaining price stability – achieved when inflation, measured by the Consumer Price Index (CPI), falls within the band of between 1% and 3% – and supporting maximum sustainable employment.
The Reserve Bank of New Zealand’s (RBNZ) Monetary Policy Committee (MPC) decides the appropriate level of the Official Cash Rate (OCR) according to its objectives. When inflation is above target, the bank will attempt to tame it by raising its key OCR, making it more expensive for households and businesses to borrow money and thus cooling the economy. Higher interest rates are generally positive for the New Zealand Dollar (NZD) as they lead to higher yields, making the country a more attractive place for investors. On the contrary, lower interest rates tend to weaken NZD.
Employment is important for the Reserve Bank of New Zealand (RBNZ) because a tight labor market can fuel inflation. The RBNZ’s goal of “maximum sustainable employment” is defined as the highest use of labor resources that can be sustained over time without creating an acceleration in inflation. “When employment is at its maximum sustainable level, there will be low and stable inflation. However, if employment is above the maximum sustainable level for too long, it will eventually cause prices to rise more and more quickly, requiring the MPC to raise interest rates to keep inflation under control,” the bank says.
In extreme situations, the Reserve Bank of New Zealand (RBNZ) can enact a monetary policy tool called Quantitative Easing. QE is the process by which the RBNZ prints local currency and uses it to buy assets – usually government or corporate bonds – from banks and other financial institutions with the aim to increase the domestic money supply and spur economic activity. QE usually results in a weaker New Zealand Dollar (NZD). QE is a last resort when simply lowering interest rates is unlikely to achieve the objectives of the central bank. The RBNZ used it during the Covid-19 pandemic.
The People’s Bank of China (PBOC) set the USD/CNY central rate for the trading session ahead on Tuesday at 7.1716 as compared to the previous day's fix of 7.1707 and 7.3067 Reuters estimates.
PBOC FAQs
The primary monetary policy objectives of the People's Bank of China (PBoC) are to safeguard price stability, including exchange rate stability, and promote economic growth. China’s central bank also aims to implement financial reforms, such as opening and developing the financial market.
The PBoC is owned by the state of the People's Republic of China (PRC), so it is not considered an autonomous institution. The Chinese Communist Party (CCP) Committee Secretary, nominated by the Chairman of the State Council, has a key influence on the PBoC’s management and direction, not the governor. However, Mr. Pan Gongsheng currently holds both of these posts.
Unlike the Western economies, the PBoC uses a broader set of monetary policy instruments to achieve its objectives. The primary tools include a seven-day Reverse Repo Rate (RRR), Medium-term Lending Facility (MLF), foreign exchange interventions and Reserve Requirement Ratio (RRR). However, The Loan Prime Rate (LPR) is China’s benchmark interest rate. Changes to the LPR directly influence the rates that need to be paid in the market for loans and mortgages and the interest paid on savings. By changing the LPR, China’s central bank can also influence the exchange rates of the Chinese Renminbi.
Yes, China has 19 private banks – a small fraction of the financial system. The largest private banks are digital lenders WeBank and MYbank, which are backed by tech giants Tencent and Ant Group, per The Straits Times. In 2014, China allowed domestic lenders fully capitalized by private funds to operate in the state-dominated financial sector.
New Zealand’s Finance Minister, Nicola Willis, said on Monday that the country has a very balanced and complementary trade relationship with the United States. Willis added that she hopes to maintain a warm relationship in the future.
Key quotes
New Zealand is distinguished in that we have a very balanced and complementary trade relationship with the United States.
Hopeful of pursuing ongoing positive trade relationships with it.
Market reaction
At the press time, the NZD/USD pair is down 0.15% on the day to trade at 0.5635.
Tariffs FAQs
Tariffs are customs duties levied on certain merchandise imports or a category of products. Tariffs are designed to help local producers and manufacturers be more competitive in the market by providing a price advantage over similar goods that can be imported. Tariffs are widely used as tools of protectionism, along with trade barriers and import quotas.
Although tariffs and taxes both generate government revenue to fund public goods and services, they have several distinctions. Tariffs are prepaid at the port of entry, while taxes are paid at the time of purchase. Taxes are imposed on individual taxpayers and businesses, while tariffs are paid by importers.
There are two schools of thought among economists regarding the usage of tariffs. While some argue that tariffs are necessary to protect domestic industries and address trade imbalances, others see them as a harmful tool that could potentially drive prices higher over the long term and lead to a damaging trade war by encouraging tit-for-tat tariffs.
During the run-up to the presidential election in November 2024, Donald Trump made it clear that he intends to use tariffs to support the US economy and American producers. In 2024, Mexico, China and Canada accounted for 42% of total US imports. In this period, Mexico stood out as the top exporter with $466.6 billion, according to the US Census Bureau. Hence, Trump wants to focus on these three nations when imposing tariffs. He also plans to use the revenue generated through tariffs to lower personal income taxes.
00:30
Australia National Australia Bank's Business Conditions declined to 3 in January from previous 6
00:30
Australia National Australia Bank's Business Conditions declined to 3 in January from previous 6
00:30
Australia National Australia Bank's Business Confidence climbed from previous -2 to 4 in January
00:30
Australia National Australia Bank's Business Confidence climbed from previous -2 to 4 in January
Bank of England Monetary Policy Committee member Catherine Mann said late Monday that companies will struggle to raise prices this year as consumers are hit by job losses and spending softens, per the Financial Times.
Key quotes
UK inflation is becoming less of a threat as corporate pricing power weakens. I can see pricing coming very close to [2 percent] target-consistent [levels] in the year ahead. Demand conditions are quite a bit weaker than has been the case — and I have changed my mind on that.
Market reaction
At the press time, the GBP/USD pair is down 0.08% on the day to trade at 1.2355.
BoE FAQs
The Bank of England (BoE) decides monetary policy for the United Kingdom. Its primary goal is to achieve ‘price stability’, or a steady inflation rate of 2%. Its tool for achieving this is via the adjustment of base lending rates. The BoE sets the rate at which it lends to commercial banks and banks lend to each other, determining the level of interest rates in the economy overall. This also impacts the value of the Pound Sterling (GBP).
When inflation is above the Bank of England’s target it responds by raising interest rates, making it more expensive for people and businesses to access credit. This is positive for the Pound Sterling because higher interest rates make the UK a more attractive place for global investors to park their money. When inflation falls below target, it is a sign economic growth is slowing, and the BoE will consider lowering interest rates to cheapen credit in the hope businesses will borrow to invest in growth-generating projects – a negative for the Pound Sterling.
In extreme situations, the Bank of England can enact a policy called Quantitative Easing (QE). QE is the process by which the BoE substantially increases the flow of credit in a stuck financial system. QE is a last resort policy when lowering interest rates will not achieve the necessary result. The process of QE involves the BoE printing money to buy assets – usually government or AAA-rated corporate bonds – from banks and other financial institutions. QE usually results in a weaker Pound Sterling.
Quantitative tightening (QT) is the reverse of QE, enacted when the economy is strengthening and inflation starts rising. Whilst in QE the Bank of England (BoE) purchases government and corporate bonds from financial institutions to encourage them to lend; in QT, the BoE stops buying more bonds, and stops reinvesting the principal maturing on the bonds it already holds. It is usually positive for the Pound Sterling.
WTI price extends the recovery to around $72.10 in Tuesday’s early Asian session.
Tariff uncertainty might cap the WTI’s upside in the near term.
Iran called for OPEC to unite against potential US oil sanctions.
West Texas Intermediate (WTI), the US crude oil benchmark, is trading around $72.15 during the early Asian session on Tuesday. The WTI price edges higher despite ongoing tariff concerns.
WTI price recovers some ground, even though oil traders remain worried that US President Donald Trump might start a trade war. On Monday, US President Donald Trump expanded his steel and aluminum tariffs to cover all imports, effectively canceling deals with the European Union, the United Kingdom, Japan and others.
"It's tariff uncertainty which is the name of the game. This affects risk appetite in general and has spillover effects into oil," said Harry Tchilinguiran at Onyx Capital.
The market continues to digest the news and assess the potential impacts of tariffs on global trade. Any signs of rising trade war tensions could drag the WTI price lower as tariffs could dampen global economic growth and energy demand.
On the other hand, the escalating geopolitical tensions in the Middle East and the Russia-Ukraine conflict could underpin the black gold. Iran’s President Masoud Pezeshkian urged OPEC members to unite against possible US sanctions on the major oil producer after Trump said he would seek to drive Tehran’s oil exports to zero.
WTI Oil FAQs
WTI Oil is a type of Crude Oil sold on international markets. The WTI stands for West Texas Intermediate, one of three major types including Brent and Dubai Crude. WTI is also referred to as “light” and “sweet” because of its relatively low gravity and sulfur content respectively. It is considered a high quality Oil that is easily refined. It is sourced in the United States and distributed via the Cushing hub, which is considered “The Pipeline Crossroads of the World”. It is a benchmark for the Oil market and WTI price is frequently quoted in the media.
Like all assets, supply and demand are the key drivers of WTI Oil price. As such, global growth can be a driver of increased demand and vice versa for weak global growth. Political instability, wars, and sanctions can disrupt supply and impact prices. The decisions of OPEC, a group of major Oil-producing countries, is another key driver of price. The value of the US Dollar influences the price of WTI Crude Oil, since Oil is predominantly traded in US Dollars, thus a weaker US Dollar can make Oil more affordable and vice versa.
The weekly Oil inventory reports published by the American Petroleum Institute (API) and the Energy Information Agency (EIA) impact the price of WTI Oil. Changes in inventories reflect fluctuating supply and demand. If the data shows a drop in inventories it can indicate increased demand, pushing up Oil price. Higher inventories can reflect increased supply, pushing down prices. API’s report is published every Tuesday and EIA’s the day after. Their results are usually similar, falling within 1% of each other 75% of the time. The EIA data is considered more reliable, since it is a government agency.
OPEC (Organization of the Petroleum Exporting Countries) is a group of 12 Oil-producing nations who collectively decide production quotas for member countries at twice-yearly meetings. Their decisions often impact WTI Oil prices. When OPEC decides to lower quotas, it can tighten supply, pushing up Oil prices. When OPEC increases production, it has the opposite effect. OPEC+ refers to an expanded group that includes ten extra non-OPEC members, the most notable of which is Russia.
Giao dịch trên thị trường tài chính (đặc biệt là giao dịch sử dụng các công cụ biên) mở ra những cơ hội lớn và tạo điều kiện cho các nhà đầu tư sẵn sàng mạo hiểm để thu lợi nhuận, tuy nhiên nó mang trong mình nguy cơ rủi ro khá cao. Chính vì vậy trước khi tiến hành giao dịch cần phải xem xét mọi mặt vấn đề chấp nhận tiến hành giao dịch cụ thể xét theo quan điểm của nguồn lực tài chính sẵn có và mức độ am hiểu thị trường tài chính.
Sử dụng thông tin: sử dụng toàn bộ hay riêng biệt các dữ liệu trên trang web của công ty TeleTrade như một nguồn cung cấp thông tin nhất định. Việc sử dụng tư liệu từ trang web cần kèm theo liên kết đến trang teletrade.vn. Việc tự động thu thập số liệu cũng như thông tin từ trang web TeleTrade đều không được phép.
Nhấn nút "Đăng ký" để nhận thông báo về chương trình khuyến mãi và Bonus
Cảm ơn bạn đã ghé thăm teletrade.org!
Thông tin trên trang web này có thể không tuân thủ luật pháp của quốc gia nơi bạn sống.
Vẫn xem thông tin.
Tôi xác nhận rằng các tài liệu trên trang web này không dành cho cư dân EU và tôi có thể không có quyền đăng ký tài khoản bên teletrade.org, nhưng tôi vẫn muốn tiếp tục.