- Phân tích
- Tin tức và các công cụ
- Tin tức thị trường
Tin tức thì trường
- The daily chart reveals a subtle change in buyers' momentum, noted by decreasing MACD green bars and a neutral RSI.
- Hourly indicators picture a balanced scenario for the session.
At the end of the week, the NZD/USD has lost 0.21% as buyers seem to have run out of steam. The sluggish trend momentum might suggest an emerging bearish grip, although the short-term positive outlook remains largely unbroken.
Despite the Relative Strength Index (RSI) sitting in the neutral zone and displaying a positive outlook, the overall trend appears to be flattening. The Moving Average Convergence Divergence (MACD) also echoes the slowing momentum, printing decreasing green bars.
NZD/USD daily chart

The hourly view shows a neutral bias with a mild lack of traction for either party reflected by the flat RSI and MACD.
NZD/USD hourly chart
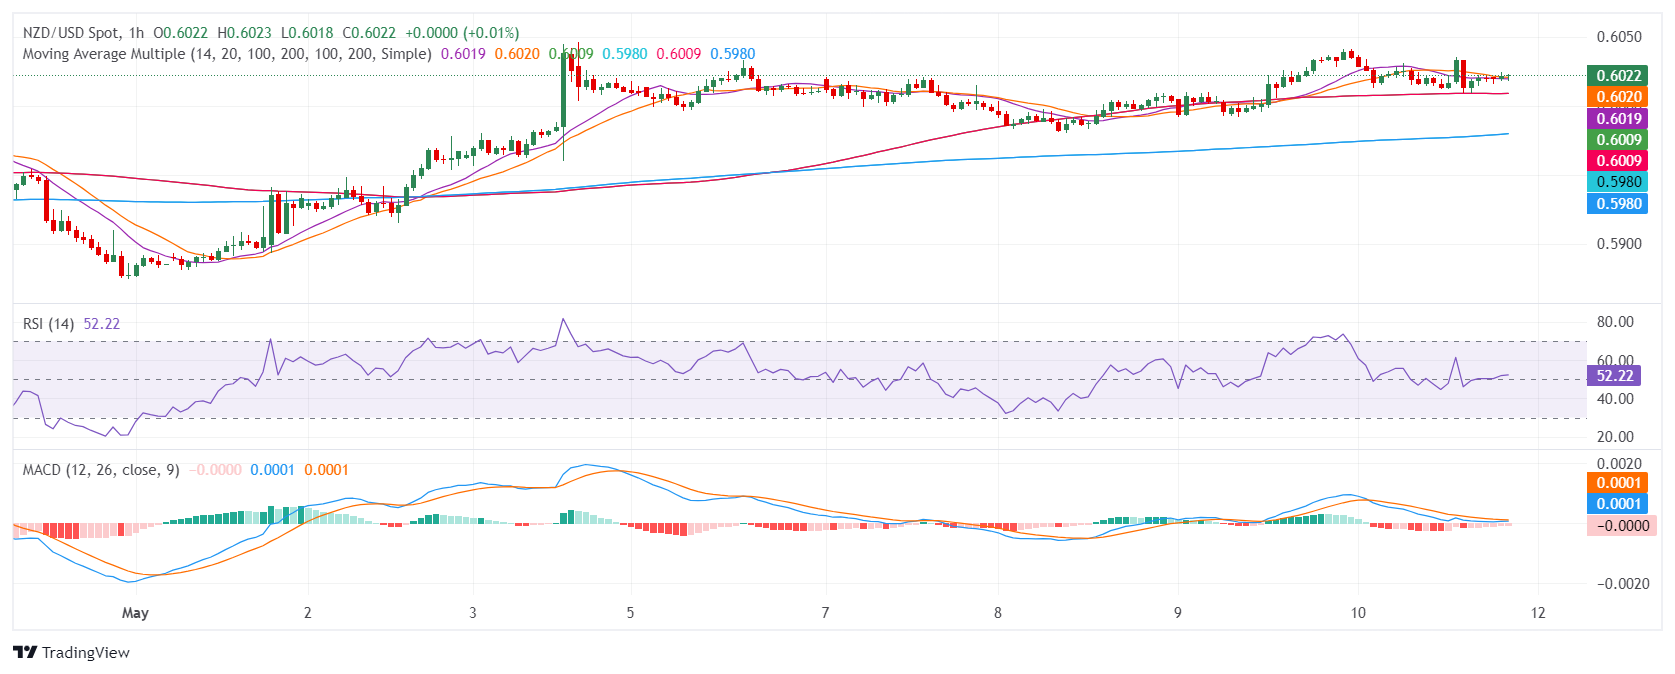
A broader inspection highlights the NZD/USD residing beneath the crucial 100 and 200-day Simple Moving Averages (SMAs), lending credence to a bearish outlook. The alleged sellers' strength is verified at the 200-day SMA barrier, further solidifying the short-term bearish slant as it rejected the buyers in Friday’s session. However, if the bulls manage to hold the key short-term 20-day SMA, the downside in the next sessions will be limited.
Federal Reserve (Fed) Bank of Richmond President Thomas Barkin hit newswires late Friday reaffirming a "patient" approach from the Fed will eventually reduce inflation to the US central bank's desired target level.
Key highlights
The current economy calls for a deliberate and patient approach.
With appropriate policy and time, inflation will hit 2%.
Demand is solid, and not overheating.
I am looking for inflation progress to sustain and broaden.
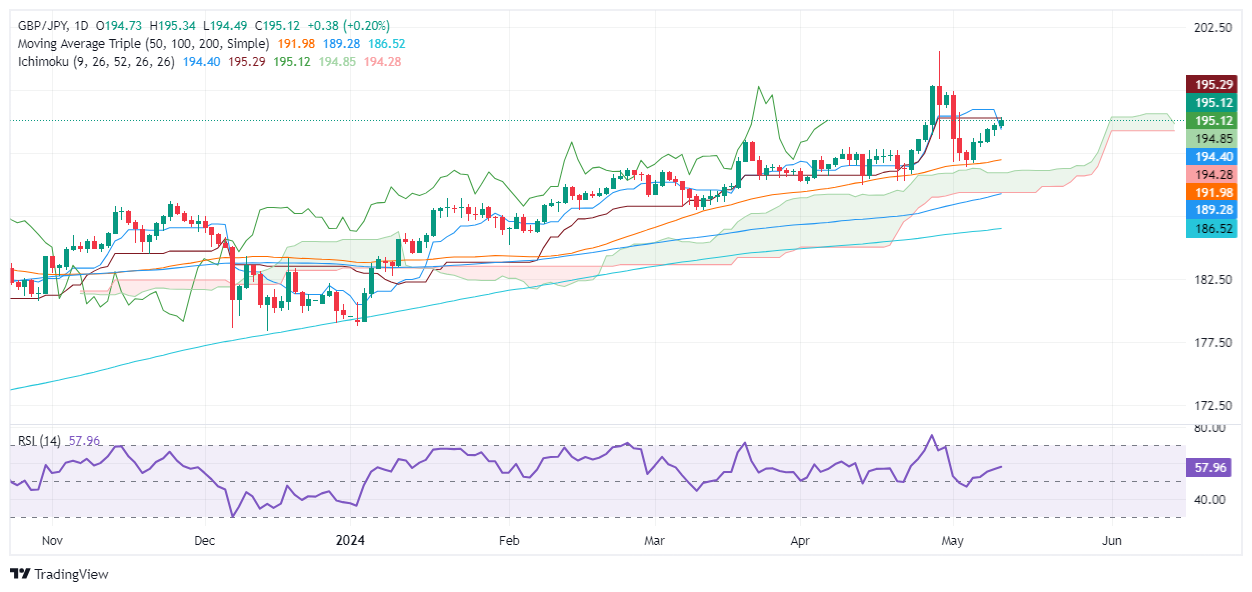
- GBP/JPY up 0.26% on Friday, totaling a 1.74% weekly gain, now at 195.10.
- Technicals show upward trend, rebounding from 50-day MA at 193.50.
- Resistance at Kijun-Sen (195.26); breaking this could push towards 196.00 and April 26 high of 197.92.
The Pound Sterling (GBP) will finish the week on a higher note against the Japanese Yen (JPY), posting gains of more than 0.26% on Friday and 1.74% weekly. At the time of writing, the GBP/JPY exchanges hands at 195.10, testing key resistance levels.
GBP/JPY Price Analysis: Technical outlook
The GBP/JPY is upward biased after recovering from the Bank of Japan intervention during the last week. Since then, the pair bottomed out at around the 50-day moving average (DMA) at around 193.50 and recovered some ground.
Even though the uptrend remains intact, the GBP/JPY faces key resistance at the Kijun-Sen at 195.26. A breach of the latter will expose the 196.00 psychological level, followed by the April 26 high at 197.92.
On the other hand, if the cross-pair falls below the Senkou Span A of 194.82, that could open the door to challenge the Senkou Span B at 194.24. Further losses are seen at 194.00.
GBP/JPY Price Action – Daily Chart
- Silver retreats from a three-week high reached at $28.74.
- Momentum favors bulls in the medium term; but shooting star looming paves the way for a retracement.
- Uptrend to resume with buyers clearing $28.74.
Silver prices reversed on Friday amid high US Treasury yields and a stronger US Dollar. The grey metal slipped 0.48% and exchanges hands at around $28.19, at the time of writing.
XAG/USD Price Analysis: Technical outlook
From a technical perspective, Silver is still upward biased, though the formation of a ‘shooting star,’ can pave the way for a pullback. Even though momentum favors bulls, as depicted by the Relative Strength Index (RSI) with readings between 60-70, its slope aims downwards.
Therefore, XAG/USD is bearishly biased in the short term. However, sellers will face solid support levels, like the $28.00 psychological level. Once cleared, the non-yielding metal could dive toward the 38.20% Fib retracement at $27.70, confluence with the April 62 high.
On the other hand, a bullish resumption could occur, if buyers reclaim the current week high of $28.76, followed by the $29.00 mark. A breach of the latter and buyers could challenge the year-to-date (YTD) high at $29.79.
XAG/USD Price Action – Daily Chart

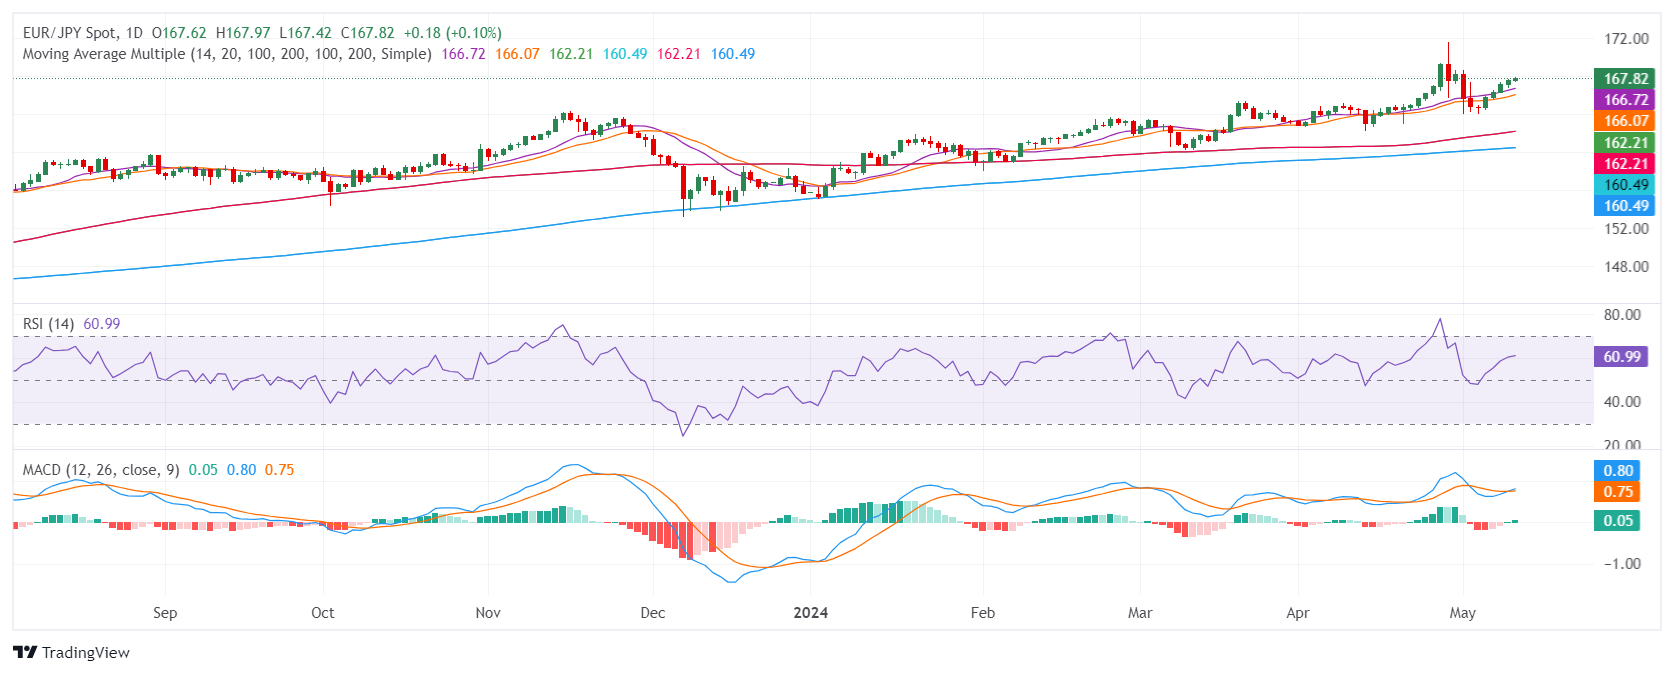
- The daily EUR/JPY RSI reveals ongoing bullish momentum, demonstrating a stable shift from 44 to 60 in the last sessions.
- Daily MACD perspectives align with the RSI, implying further progression of the positive momentum.
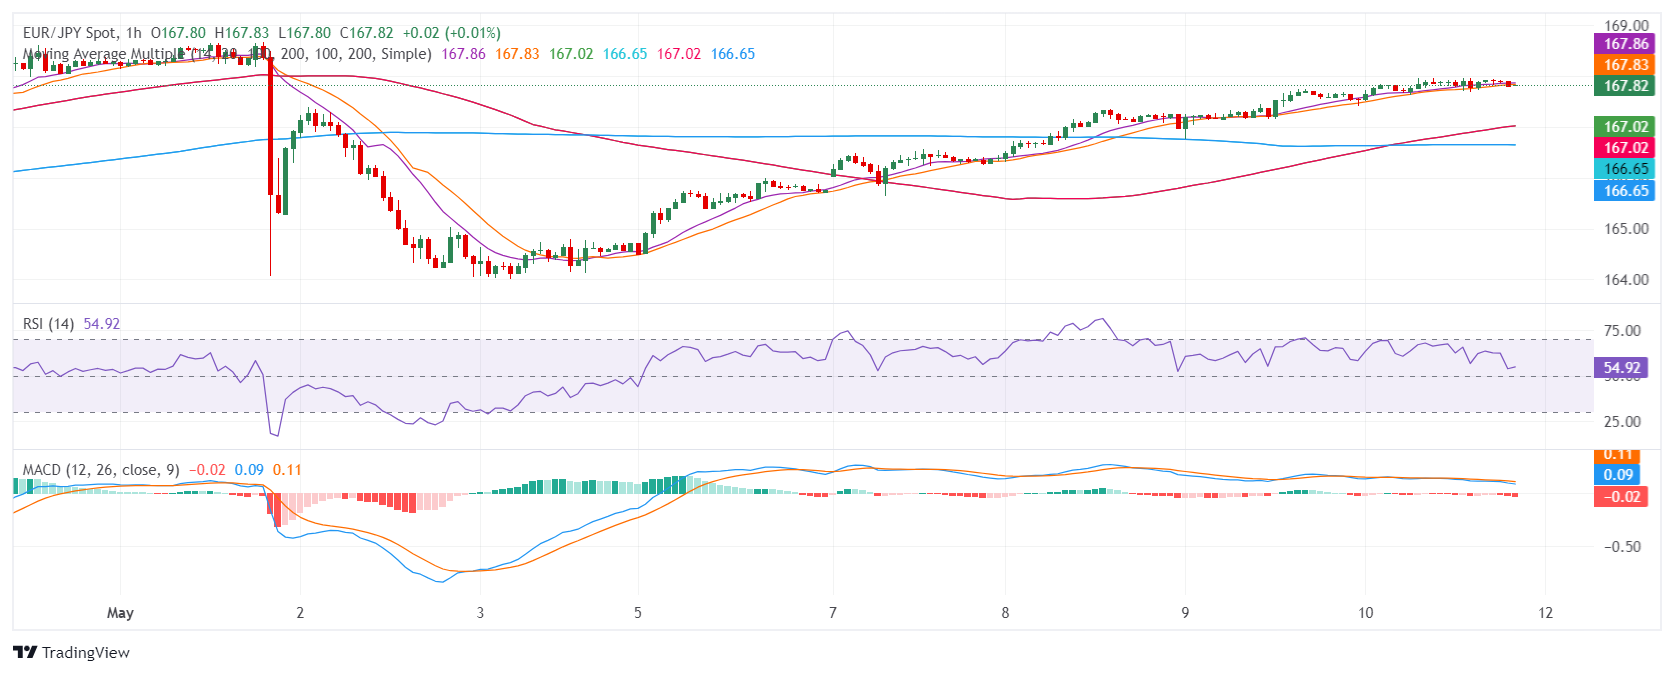
- Hourly chart shows a dip in RSI to 53 and indicates rising sellers' traction, suggesting a temporary pause in ongoing bullish momentum.
The EUR/JPY has been dominating with a steady bullish trend. It rose to 167.85 on Friday, reflecting a positive momentum primarily driven by market buyers. However, short-term sellers seem to be upping their game, implying potential transient pullbacks as indicators are flashing overbought signals in the hourly chart.
On the daily chart, the Relative Strength Index (RSI) for the EUR/JPY. A stable increase from since last week 44 to the current reading of 60 reveals an ongoing bullish momentum, primarily driven by market buyers. The Moving Average Convergence Divergence (MACD) corresponds with this perspective by showcasing rising green bars, indicating that the positive momentum is further progressing.
EURJPY daily chart
Looking at the hourly chart, the RSI presents a slight pullback to 53.26 after peaking at 67.40. While this indicates a potential slowing of buying dominance, the MACD, emphasized by rising red bars, suggests the formation of negative momentum. Despite the noticeable shift in the hourly chart, the dominant daily bullish outlook remains unchanged.
EURJPY hourly chart
In assessing the bigger picture, the EUR/JPY is positioned above its Simple Moving Averages (SMA) for the 20, 100, and 200-day periods which suggests that the buyers are clearly in command.
- Gold rebounds from daily lows, propelled by a sharp drop in US consumer sentiment and future economic outlook.
- High US Treasury yields weren’t an excuse for Gold’s advance.
- US consumers expect inflation to remain above 3% over a one-year period.
- Fed officials are cautious about rate cuts, with mixed signals from different Fed governors.
Gold prices advanced sharply late in the North American session on Friday, up by more than 1% despite US Treasury bond yields remaining high. A University of Michigan (UoM) survey showed that Americans had become pessimistic about the economy as Consumer Sentiment plunged to its lowest level in six months.
The XAU/USD trades at $2,369 after bouncing off daily lows of $2,343. Friday’s sentiment data and the weaker labor market figures revealed since the beginning of May paint a gloomy outlook for the economy of the United States (US). Although fears of a pronounced economic slowdown remain low, market participants seeking safety drove the golden metal and the US Dollar higher.
Federal Reserve officials continued to cross newswires. Atlanta’s Fed President Raphael Bostic remained hawkish, saying the Fed is on track to just one rate cut in 2024. Later, Fed Governor Michelle Bowman said that policy needs to be kept “steady” and doesn’t see rate cuts as warranted this year. The Dallas Fed’s Lorie Logan disregarded the idea of cutting interest rates.
Minneapolis Fed Neel Kashkari has recently said he is in “wait and see mode” about future monetary policy.
Next week, the US docket will feature the release of inflation figures, retail sales, building permits and Fed speeches.
Daily digest market movers: Gold strengthens as US data increases Fed rate cut hopes
- Gold prices fell amid lower US Treasury yields and a strong US Dollar. The US 10-year Treasury note yields 4.504% and gained almost five basis points (bps) from its opening level. The US Dollar Index (DXY), which tracks the Greenback's performance against six other currencies, rose 0.12% to 105.32.
- The University of Michigan Consumer Sentiment Index significantly declined in May, falling from 77.2 in April to 67.4 and did not meet the analysts' expectations of 76. Joanne Hsu, the Director of the UoM Survey, highlighted that the 10-point drop is statistically significant and marks the lowest level of consumer sentiment recorded in approximately six months.
- Additionally, inflation expectations have escalated. Inflation expectations rose from 3.2% to 3.5% in May for the one-year outlook. Over a 10-year period, expectations increased slightly from 3.0% to 3.1%.
- Softer-than-expected labor market figures, as shown by last month’s US employment report and unemployment claims data, may exert pressure on the Fed. Officials recognized that the risks to achieving the Fed's dual mandate of fostering maximum employment and price stability have become more balanced over the past year.
- After the data release, Fed rate cut probabilities increased from around 33 basis points (bps) to 34 bps points of rate cuts toward the end of 2024.
Technical analysis: Gold price resumes its uptrend, climbs above $2,350

Gold remains bullishly biased even though it retreated some 6% from its all-time high of $2,431, hit on April 12. Momentum shows that buyers are gathering steam, which is visible in the Relative Strength Index (RSI) shifting bullish since the start of May.
XAU/USD buyers cleared the April 26 high at $2,352. Despite that, Gold has consolidated at around $2,360-$2,378, with buyers unable to test the $2,400 figure. Once cleared, the next stop would be the April 19 high at $2,417, followed by the all-time high of $2,431.
Conversely, further losses are seen if Gold slides beneath the $2,300 mark. The next support would be the 50-day Simple Moving Average (SMA) at $2,249.
Gold FAQs
Gold has played a key role in human’s history as it has been widely used as a store of value and medium of exchange. Currently, apart from its shine and usage for jewelry, the precious metal is widely seen as a safe-haven asset, meaning that it is considered a good investment during turbulent times. Gold is also widely seen as a hedge against inflation and against depreciating currencies as it doesn’t rely on any specific issuer or government.
Central banks are the biggest Gold holders. In their aim to support their currencies in turbulent times, central banks tend to diversify their reserves and buy Gold to improve the perceived strength of the economy and the currency. High Gold reserves can be a source of trust for a country’s solvency. Central banks added 1,136 tonnes of Gold worth around $70 billion to their reserves in 2022, according to data from the World Gold Council. This is the highest yearly purchase since records began. Central banks from emerging economies such as China, India and Turkey are quickly increasing their Gold reserves.
Gold has an inverse correlation with the US Dollar and US Treasuries, which are both major reserve and safe-haven assets. When the Dollar depreciates, Gold tends to rise, enabling investors and central banks to diversify their assets in turbulent times. Gold is also inversely correlated with risk assets. A rally in the stock market tends to weaken Gold price, while sell-offs in riskier markets tend to favor the precious metal.
The price can move due to a wide range of factors. Geopolitical instability or fears of a deep recession can quickly make Gold price escalate due to its safe-haven status. As a yield-less asset, Gold tends to rise with lower interest rates, while higher cost of money usually weighs down on the yellow metal. Still, most moves depend on how the US Dollar (USD) behaves as the asset is priced in dollars (XAU/USD). A strong Dollar tends to keep the price of Gold controlled, whereas a weaker Dollar is likely to push Gold prices up.
- Despite hot inflation readings from Norway, the Fed’s hawkish stance limits the downside.
- Markets are gearing up for next week’s US CPI reading which may likely set the pace of the pair.
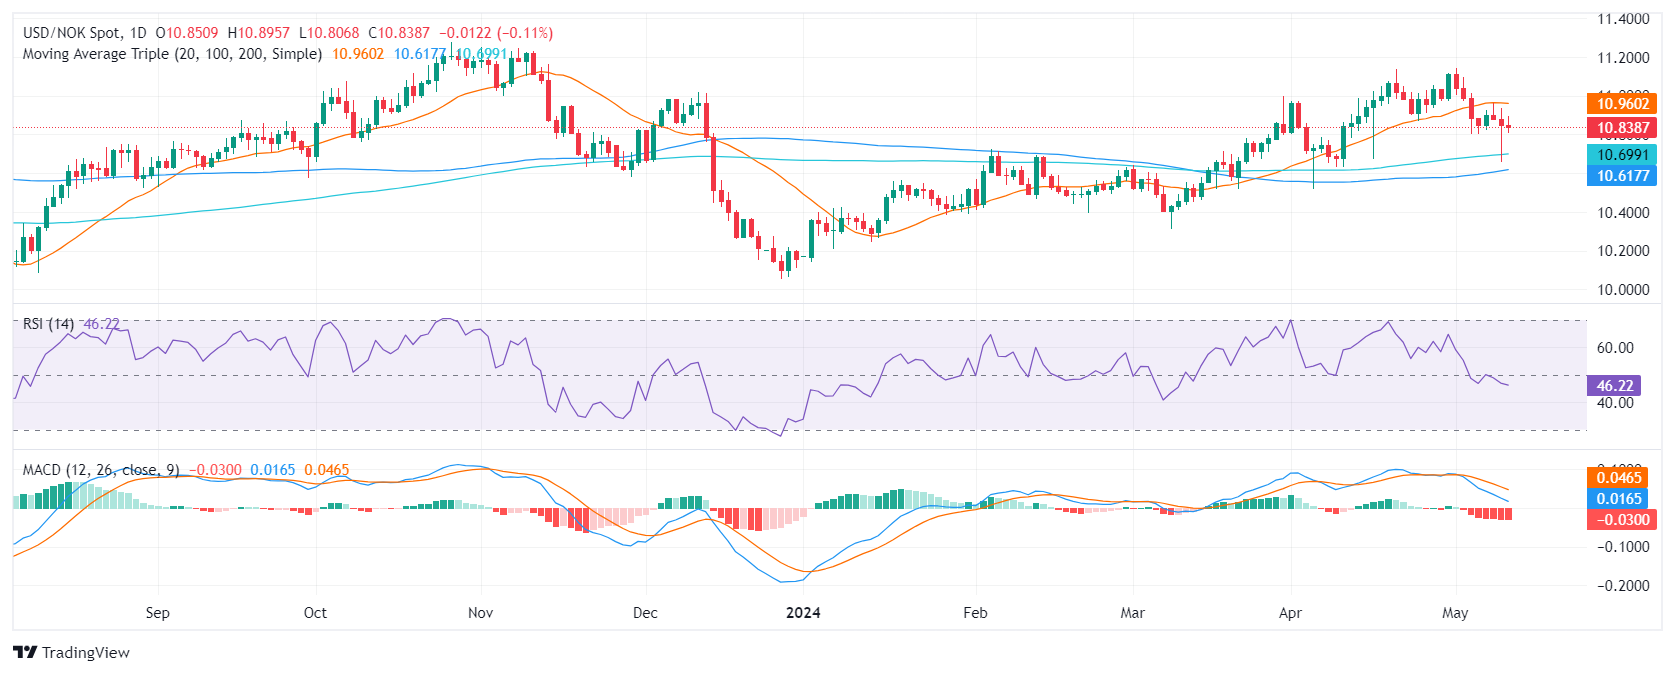
The USD/NOK pair is trading with mild losses around 10.85. The Federal Reserve's (Fed) hawkish approach seems to be aiding the USD, while strong economic recovery signals in Norway aren't offsetting this impact on the NOK. As the American calendar remains empty, all eyes are on next week’s Consumer Price Index (CPI) report from April from the US.
Norway's April CPI showed that the headline number rose to 3.6% year-on-year, which was slightly higher than anticipated, although it showed a slight drop from March's 3.9%. Meanwhile, the underlying inflation rate surprised by coming in at 4.4% year-on-year, two ticks higher than expected, and up from March's 4.5%.
Last week, the Norges Bank opted to maintain rates at 4.5% and highlighted the possibility of needing to sustain a tight monetary policy stance for a longer duration than previously anticipated, citing the current data trends. Markets are expecting only 50 bps of easing in the next 12 months.
On the US side, US Fed officials are keeping the hawkish bets steady and as for now, investors are delaying the start of the easing cycle to September.
USD/NOK technical analysis
The daily Relative Strength Index (RSI) for the USD/NOK pair remains largely within the negative territory. Today's reading is at 46.66, which suggests a somewhat bearish short-term outlook. Due to its fluctuation, with an initial high near-overbought conditions and a subsequent drop, the RSI indicates the potential for bearish pressure. However, the consistent presence within the negative territory also warns of a continuous downtrend possibility.
Simultaneously, the Moving Average Convergence Divergence (MACD) histogram strengthens this view. Rising red bars signify an increasing negative momentum, with sellers gaining a more dominant position in the market.
USD/NOK technical analysis
Upon evaluation of the bigger picture, the USD/NOK chart exhibits a strong stance above the 20, 100, and 200-day Simple Moving Averages (SMAs). As the pair trades above these key moving averages, it indicates a bullish long-term trend, considering both minor and major aspects. However, given the significant trading above these levels, traders should be mindful of the potential pullback risks, which could provide possible buying opportunities.
In conclusion, despite a bearish short-term view provided by the daily RSI and MACD indicators, the placement above the SMAs suggests an overall bullish trajectory for the USD/NOK pair. Caution is warranted due to possible volatility and the likelihood of pullbacks, hence the need for continuous monitoring of market trends and indicators.
USD/NOK daily chart
Minneapolis Federal Reserve (Fed) President Neel Kashkari added his voice to the procession of Fed officials giving their views on the US inflation outlook and the Fed's policy stance on Friday. Minneapolis Fed President Kashkari responded to questions during an interview with CNBC.
Key highlights
I am cautious about how restrictive monetary policy is.
I am in wait-and-see mode about the future of monetary policy.
The bar is high for another rate hike, but can't rule it out.
The Fed will keep rates steady if inflation data warrants.
Earlier comments from Kashkari:
The current baseline is that strong productivity rates will moderate.
The US has a long-term housing supply challenge.
Higher rates will lead to less housing supply in the short term.
- Dow Jones climbs 0.25% as investors grapple with pullback in consumer confidence.
- UoM Consumer Sentiment, Inflation Expectations come in worse than expected.
- Fedspeak dominates the headlines as policymakers talk down rate cut hopes.
The Dow Jones Industrial Average (DJIA) gained around a hundred points on Friday as equities try to shake off a decline in the University of Michigan’s Consumer Sentiment Index which showed US consumers are increasingly concerned about long-run inflation taking hold. Consumer 5-year Inflation Expectations ticked higher as the US economy begins to buckle under the weight of price growth runner even hotter and longer than previously expected.
The UoM’s Consumer Sentiment Index for May declined sharply to 67.4 in May, falling well below the market forecast 76.0 and hitting its lowest figure in six months as consumer confidence deteriorates. 5-year Consumer Inflation Expectations also ticked higher to 3.1% in May compared to the previous 3.0%.
Multiple Federal Reserve (Fed) officials hit the newswires on Friday as central planners try to talk down broad-market expectations for rate cuts in 2024 in the face of recent stubborn inflation figures.
Read more:
Fed’s Bowman: I don't see rate cuts as warranted this year
Fed's Goolsbee: Housing remains a significant inflation challenge
Fed's Logan: Too early to think about cutting rates
Dow Jones news
The Dow Jones Industrial Average is the top performing US equity index on Friday, gaining around a fifth of a percent heading into the last stretch of the trading week. Around half of the equities that makes up the DJIA are in the red, limiting upside momentum.
Nike Inc. (NKE) shed 2.25% during Friday trading, declining two points and falling below $92.00 per share. On the upside, 3M Co. (MMM) and McDonald’s Corp. (MCD) are competing for top spot, gaining 1.88% and 1.8%, respectively.
Dow Jones technical outlook
Despite hobbled risk appetite, the Dow Jones managed to set a new peak for the week, trading into 39,579.23 before settling back below 39,500.00. Top side momentum is set to stall with the Dow Jones appearing overextended. The major equity index is trading well above the 200-day Exponential Moving Average (EMA) at 36,893.00.
The Dow Jones is on pace to end a seventh consecutive day in the green, and the index is up around 2% for the week.
Dow Jones five-minute chart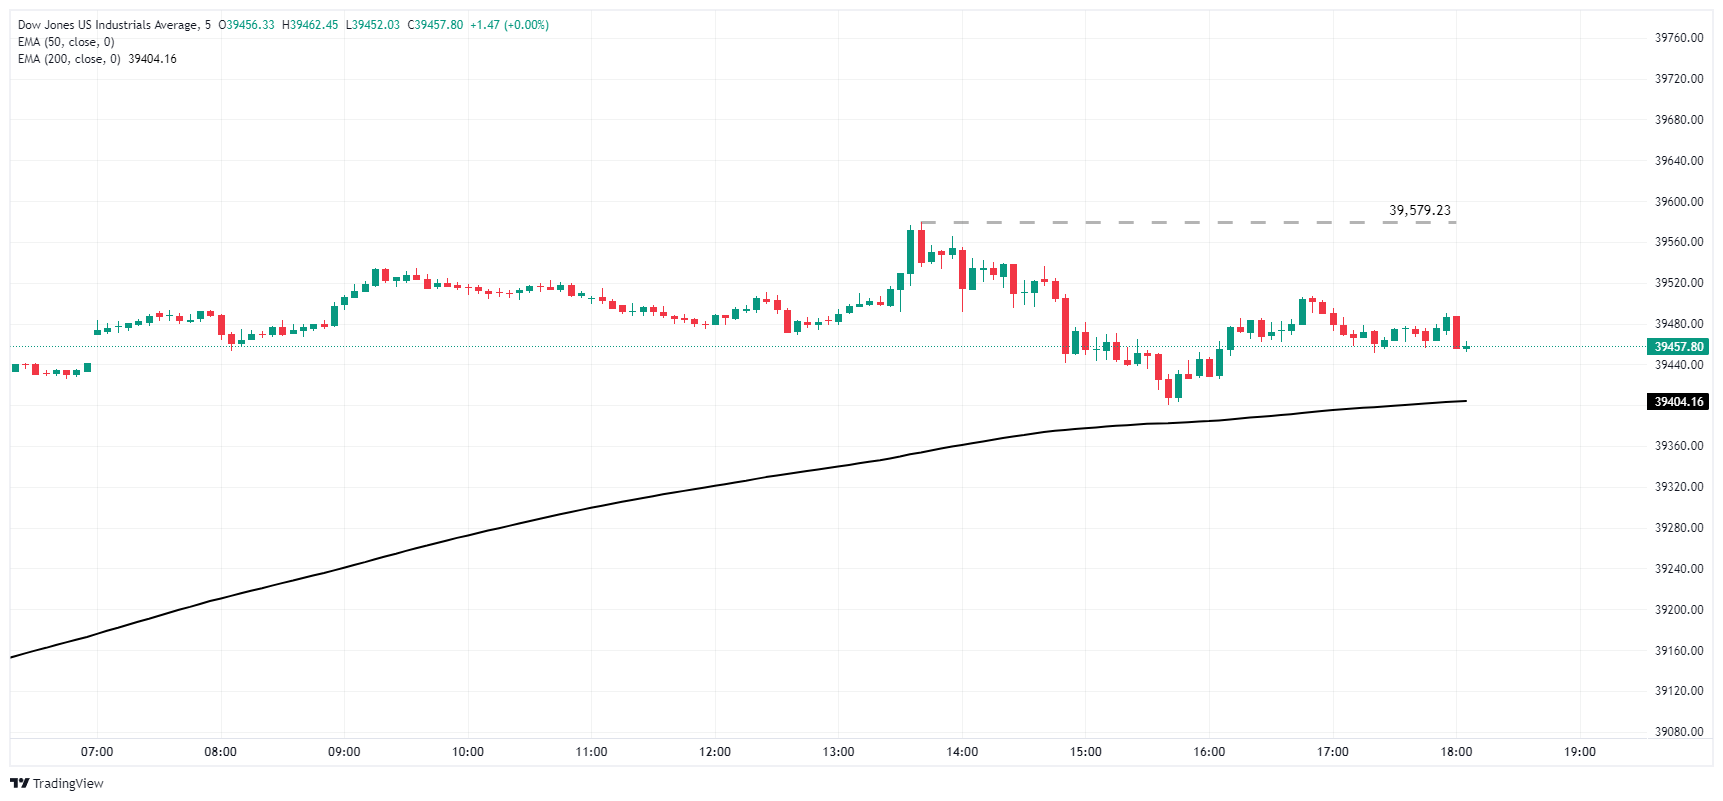
Dow Jones daily chart
Dow Jones FAQs
The Dow Jones Industrial Average, one of the oldest stock market indices in the world, is compiled of the 30 most traded stocks in the US. The index is price-weighted rather than weighted by capitalization. It is calculated by summing the prices of the constituent stocks and dividing them by a factor, currently 0.152. The index was founded by Charles Dow, who also founded the Wall Street Journal. In later years it has been criticized for not being broadly representative enough because it only tracks 30 conglomerates, unlike broader indices such as the S&P 500.
Many different factors drive the Dow Jones Industrial Average (DJIA). The aggregate performance of the component companies revealed in quarterly company earnings reports is the main one. US and global macroeconomic data also contributes as it impacts on investor sentiment. The level of interest rates, set by the Federal Reserve (Fed), also influences the DJIA as it affects the cost of credit, on which many corporations are heavily reliant. Therefore, inflation can be a major driver as well as other metrics which impact the Fed decisions.
Dow Theory is a method for identifying the primary trend of the stock market developed by Charles Dow. A key step is to compare the direction of the Dow Jones Industrial Average (DJIA) and the Dow Jones Transportation Average (DJTA) and only follow trends where both are moving in the same direction. Volume is a confirmatory criteria. The theory uses elements of peak and trough analysis. Dow’s theory posits three trend phases: accumulation, when smart money starts buying or selling; public participation, when the wider public joins in; and distribution, when the smart money exits.
There are a number of ways to trade the DJIA. One is to use ETFs which allow investors to trade the DJIA as a single security, rather than having to buy shares in all 30 constituent companies. A leading example is the SPDR Dow Jones Industrial Average ETF (DIA). DJIA futures contracts enable traders to speculate on the future value of the index and Options provide the right, but not the obligation, to buy or sell the index at a predetermined price in the future. Mutual funds enable investors to buy a share of a diversified portfolio of DJIA stocks thus providing exposure to the overall index.
Further comments from Chicago Federal Reserve (Fed) President Austan Goolsbee highlighted the Fed's ongoing battle with stubborn inflation that refuses to cool off to the US central bank's 2% target. Chicago Fed President Goolsbee's comments come on the heels of comments the policymaker made earlier while speaking at the Economic Club of Minnesota.
Key highlights
If the uptick in inflation means overheating, the Fed has to do whatever we have to do to get inflation to 2%.
Housing remains a significant inflation challenge.
If housing inflation comes down, there will be an "optimistic lane" towards 2% inflation.
I don't accept we are stuck at the "last mile" of inflation.
The supply chain is mostly healed, but benefits of the increase in labor supply may last during 2024.
Fed's Goolsbee's earlier comments: We hit an inflation bump this year, now we wait
- Mexican Peso edges up against US Dollar for second consecutive day.
- Banxico’s decision to maintain the interest rate at 11.00%, sponsored the latest leg down on USD/MXN.
- Bank of Mexico cited higher prices as reason to pause lowering rates.
- US consumers become pessimistic on economy due to inflation, unemployment, interest rates.
The Mexican Peso extended its gains for the second straight day after the Bank of Mexico (Banxico) decided to keep rates at 11.00% due to a reacceleration of inflation. In the meantime, the University of Michigan (UoM) Consumer Sentiment deteriorated in May, weighing on the performance of the Greenback versus the Mexican currency. The USD/MXN trades at 16.77, down 0.01%
On Thursday, Banxico’s Governing Council decided to keep rates unchanged, citing the latest uptick in inflation. The bank said that even though the disinflation process is expected to continue, the central bank revised its inflation projection.
In its policy statement, Banxico noted, "Considering that inflationary shocks are foreseen to take longer to dissipate, the forecasts for headline and core inflation have been revised upwards for the next six quarters. In particular, services inflation is foreseen to show more persistence, as compared to what had been previously anticipated.”
The US economic docket revealed that American consumers became less optimistic about the economy. The University of Michigan survey said they’re concerned about inflation, unemployment and interest rates.
Recently, two Federal Reserve (Fed) officials made statements that have drawn attention. Fed Governor Michelle Bowman emphasized that the US central bank should act "carefully and deliberately" in its policy decisions. Meanwhile, her colleague, Lorie Logan of the Dallas Fed, expressed that it is too early to consider cutting interest rates.
Next week, the US docket will feature the release of inflation figures, retail sales, building permits and Fed speeches.
Daily digest market movers: Mexico’s high inflation prompted Banxico to hold rates flat
- Banxico unanimously decided to keep rates at 11.00% due to recent data signaling that inflation is accelerating.
- The central bank revised its estimates that inflation would converge toward its 3% goal until the last quarter of 2025, later than March’s estimates for Q2 2025. Core inflation is projected to hit 3% in Q2 2025.
- April's data show that Mexico’s headline inflation is reaccelerating. However, core prices are falling.
- The UoM Consumer Sentiment Index retreated in May from 77.2 in April to 67.4, missing analysts’ estimates of 76. According to Joanne Hsu, Director of the UoM Survey, the 10-point decline “is statistically significant and brings sentiment to its lowest reading in about six months.”
- Inflation expectations for one year rose from 3.2% to 3.5% in May. For a 10-year period, they increased to 3.1%, a tenth up from 3.0%.
- US labor market continues to cool. April’s Nonfarm Payrolls and the release of the latest unemployment claims data can put pressure on Fed officials, who acknowledged that risks to achieving its dual mandate on employment and inflation “moved toward better balance over the past year.”
- Data from the futures market show odds for a quarter-percentage-point Fed rate cut in September at 74% versus 85% ahead of the UoM Consumer Sentiment report.
Technical analysis: Mexican Peso gains traction as USD/MXN tumbles below 16.80
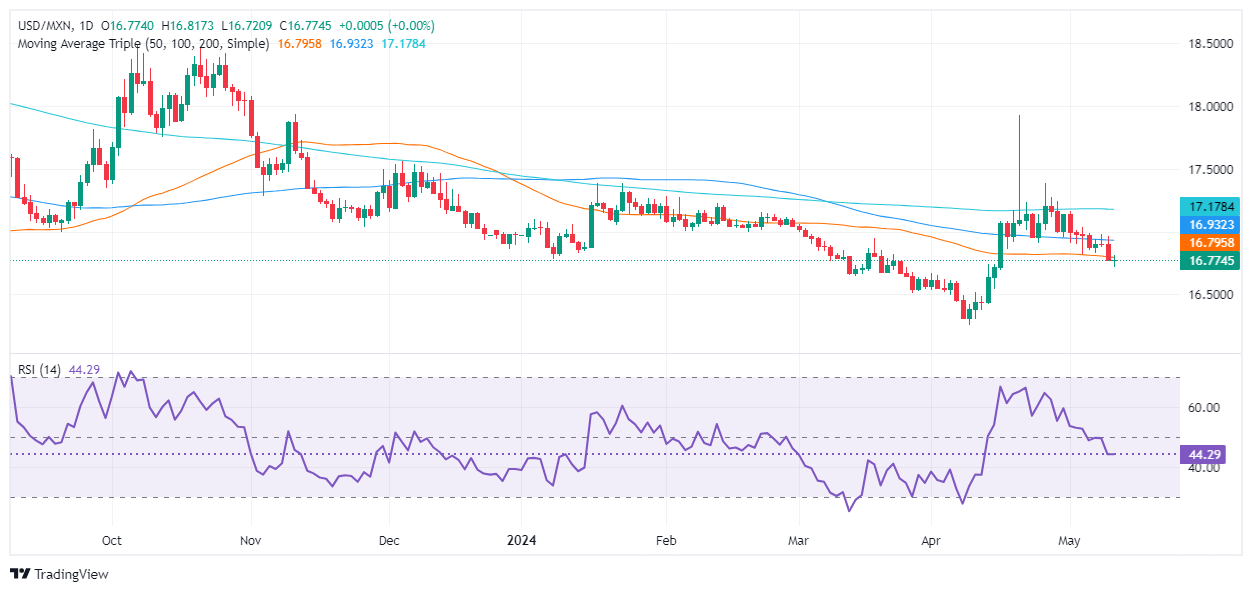
The USD/MXN downtrend remains intact as the Peso’s strength drives the pair lower. Momentum favors sellers as the Relative Strength Index (RSI) remains in bearish territory, suggesting that lower prices are expected.
If the USD/MXN remains below the 50-day Simple Moving Average (SMA) of 16.79, that could pave the way for additional losses. The next support will be the 2023 low of 16.62, followed by the current year-to-date low of 16.25.
On the other hand, if buyers claim the 100-day SMA at 16.92, that could sponsor a leg up to the 17.00 psychological level. A breach of the latter would expose the 200-day SMA at 17.17, followed by the January 23 swing high of 17.38 and the year-to-date high of 17.92.
Mexican Peso FAQs
The Mexican Peso (MXN) is the most traded currency among its Latin American peers. Its value is broadly determined by the performance of the Mexican economy, the country’s central bank’s policy, the amount of foreign investment in the country and even the levels of remittances sent by Mexicans who live abroad, particularly in the United States. Geopolitical trends can also move MXN: for example, the process of nearshoring – or the decision by some firms to relocate manufacturing capacity and supply chains closer to their home countries – is also seen as a catalyst for the Mexican currency as the country is considered a key manufacturing hub in the American continent. Another catalyst for MXN is Oil prices as Mexico is a key exporter of the commodity.
The main objective of Mexico’s central bank, also known as Banxico, is to maintain inflation at low and stable levels (at or close to its target of 3%, the midpoint in a tolerance band of between 2% and 4%). To this end, the bank sets an appropriate level of interest rates. When inflation is too high, Banxico will attempt to tame it by raising interest rates, making it more expensive for households and businesses to borrow money, thus cooling demand and the overall economy. Higher interest rates are generally positive for the Mexican Peso (MXN) as they lead to higher yields, making the country a more attractive place for investors. On the contrary, lower interest rates tend to weaken MXN.
Macroeconomic data releases are key to assess the state of the economy and can have an impact on the Mexican Peso (MXN) valuation. A strong Mexican economy, based on high economic growth, low unemployment and high confidence is good for MXN. Not only does it attract more foreign investment but it may encourage the Bank of Mexico (Banxico) to increase interest rates, particularly if this strength comes together with elevated inflation. However, if economic data is weak, MXN is likely to depreciate.
As an emerging-market currency, the Mexican Peso (MXN) tends to strive during risk-on periods, or when investors perceive that broader market risks are low and thus are eager to engage with investments that carry a higher risk. Conversely, MXN tends to weaken at times of market turbulence or economic uncertainty as investors tend to sell higher-risk assets and flee to the more-stable safe havens.
Chicago Federal Reserve (Fed) President Austan D. Goolsbee added his voice to the procession of Fed officials commenting on interest rates and inflation on Friday. Chicago Fed President Goolsbee spoke at the Economic Club of Minnesota.
Key highlights
Fed's 2% inflation target acts as an anchor on expectations.
At this time not much evidence that inflation is stalling out at 3%.
We hit an inflation bump this year, and now we wait.
We're relatively restrictive on policy.
Goolsbee is hesitant to focus too much on the recent inflation data; we've made a lot of progress.
- Canadian Dollar climbed on Friday, but Greenback remains popular bid.
- Canada added far more jobs than expected in April.
- US consumer sentiment tumbled, Fedspeak crimping rate cut hopes.
The Canadian Dollar (CAD) surged on Friday after the Canadian economy added five times as many jobs as analysts expected. However, risk-off market sentiment is limiting the CAD’s gains as the Greenback remains a popular destination for investors leery of hawkish Fedspeak and sour US consumer sentiment data.
Canada saw its highest net job gains in April since February of 2023, adding nearly 100K jobs to the Canadian economy, while the unemployment rate remained pinned at 6.1%. On the US side, both consumers and Federal Reserve (Fed) policymakers both see inflation sticking around higher and longer than rate-cut-hungry market participants have been hoping for. Risk appetite on Friday is on the wobbly side, limiting gains for the CAD.
Daily digest market movers: Canadian Dollar supported by jobs growth, but markets keep one foot in safe havens
- Canada gained 90.4K net jobs in April, beating the 18K forecast fivefold and erasing previous month’s -2.2K decline.
- Canadian Unemployment Rate held steady at 6.1%, beating market’s expected uptick to 6.2%.
- University of Michigan’s US Consumer Sentiment Index for May declines to 67.4, the sentiment survey’s lowest print in six months.
- UoM 5-year Consumer Inflation Expectations also rose to 3.1% as US consumers expect to be beleaguered by continued price acceleration looking forward.
- Souring consumer sentiment and still-high inflation expectations are hampering market hopes for rate cuts, keeping investors bid into the safe-haven Greenback.
- Fedspeak is doing little to bolster markets as Fed officials talk down odds of rate cuts in 2024.
- Read more:
- Fed’s Bowman: I don't see rate cuts as warranted this year
- Fed's Logan: Too early to think about cutting rates
Technical analysis: Canadian Dollar gains ground on Friday, but Greenback close behind
The Canadian Dollar (CAD) saw broad-market gains on Friday, hitting the green against all of its major currency peers. The CAD is up around a third of a percent against the New Zealand Dollar (NZD) and the Japanese Yen (JPY), while gaining around a quarter of a percent against the Australian Dollar (AUD). However, the CAD is close to flat against the US Dollar (USD) and the Pound Sterling (GBP), trading within a tenth of a percent at the time of writing.
USD/CAD tested below 1.3620 after plunging deep into a near-term demand zone before recovering back above 1.3660. The pair remains capped by the 200-hour Exponential Moving Average (EMA) at the 1.3700 handle.
The pair continues to find technical support from the 50-day EMA at 1.3637, but topside momentum remains limited. USD/CAD is beginning to consolidate after pulling back from the last swing high into 1.3850.
USD/CAD hourly chart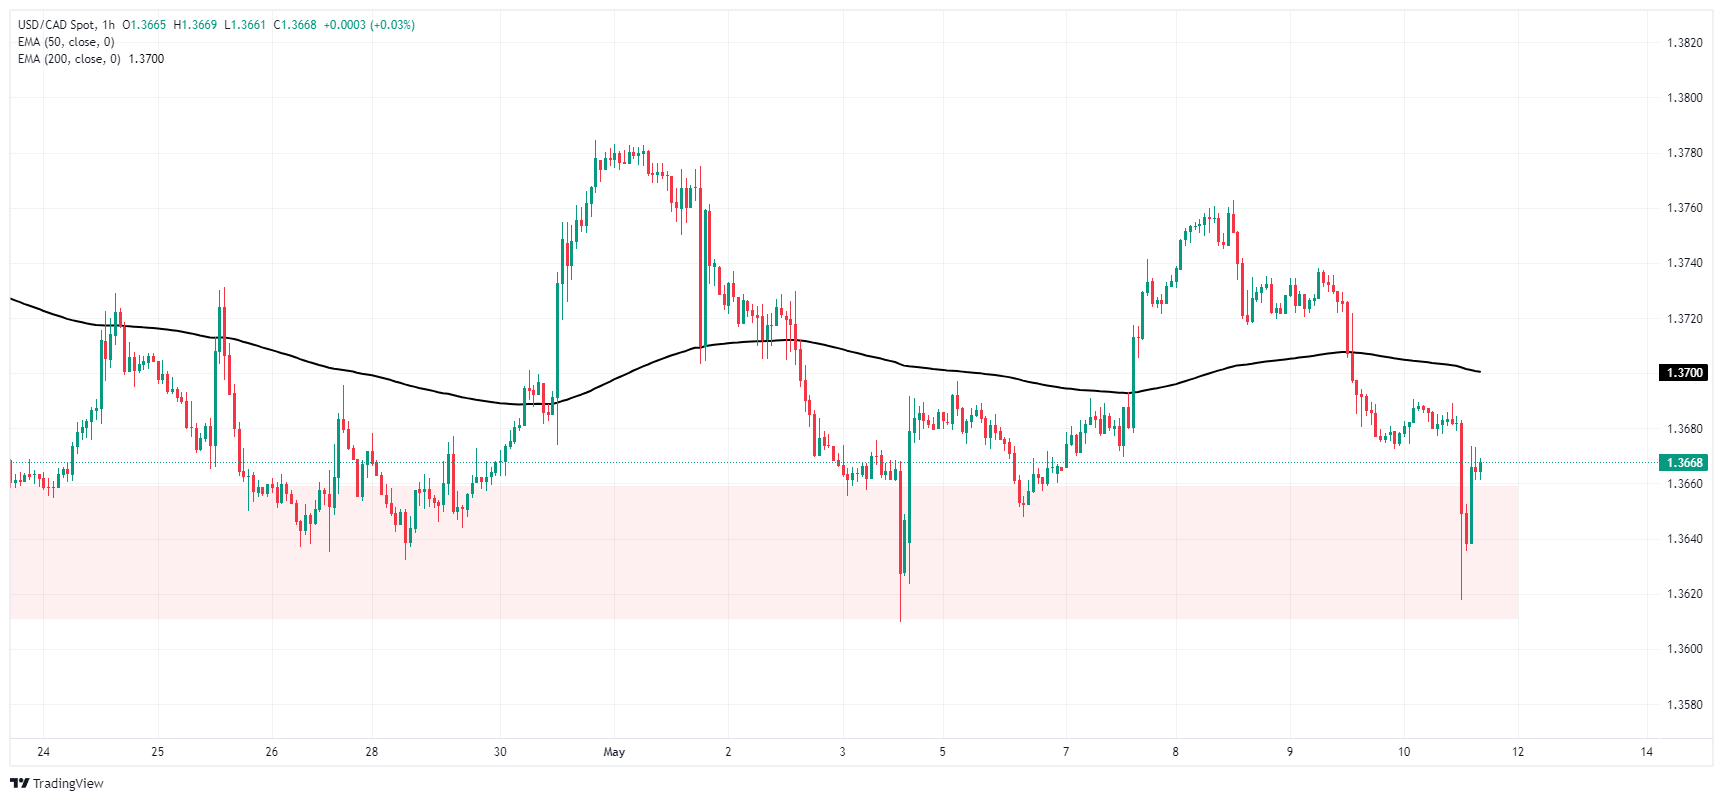
USD/CAD daily chart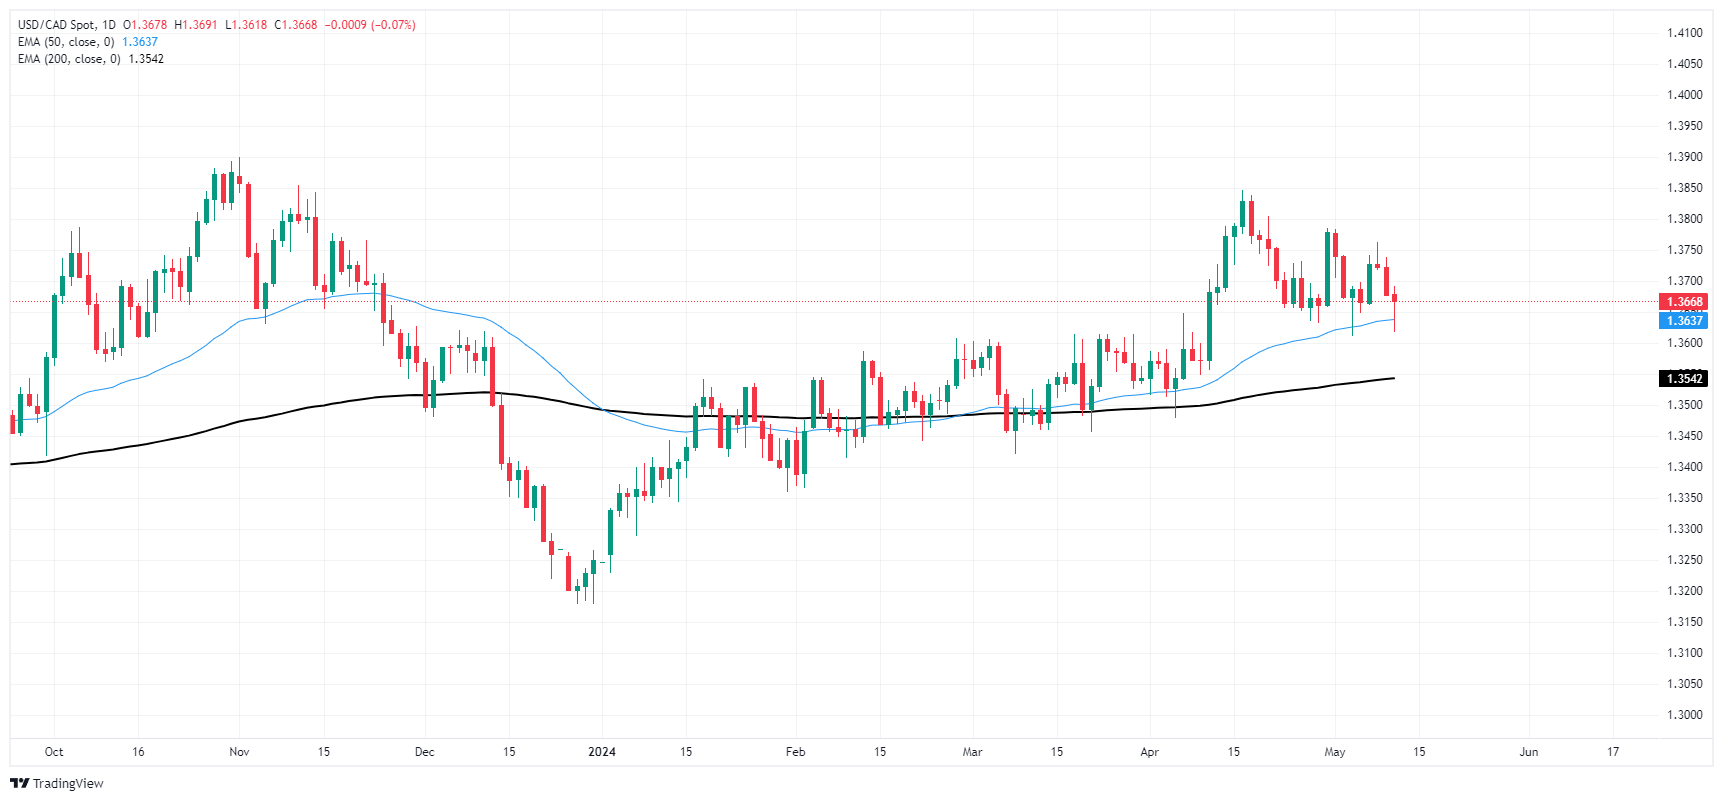
Canadian Dollar FAQs
The key factors driving the Canadian Dollar (CAD) are the level of interest rates set by the Bank of Canada (BoC), the price of Oil, Canada’s largest export, the health of its economy, inflation and the Trade Balance, which is the difference between the value of Canada’s exports versus its imports. Other factors include market sentiment – whether investors are taking on more risky assets (risk-on) or seeking safe-havens (risk-off) – with risk-on being CAD-positive. As its largest trading partner, the health of the US economy is also a key factor influencing the Canadian Dollar.
The Bank of Canada (BoC) has a significant influence on the Canadian Dollar by setting the level of interest rates that banks can lend to one another. This influences the level of interest rates for everyone. The main goal of the BoC is to maintain inflation at 1-3% by adjusting interest rates up or down. Relatively higher interest rates tend to be positive for the CAD. The Bank of Canada can also use quantitative easing and tightening to influence credit conditions, with the former CAD-negative and the latter CAD-positive.
The price of Oil is a key factor impacting the value of the Canadian Dollar. Petroleum is Canada’s biggest export, so Oil price tends to have an immediate impact on the CAD value. Generally, if Oil price rises CAD also goes up, as aggregate demand for the currency increases. The opposite is the case if the price of Oil falls. Higher Oil prices also tend to result in a greater likelihood of a positive Trade Balance, which is also supportive of the CAD.
While inflation had always traditionally been thought of as a negative factor for a currency since it lowers the value of money, the opposite has actually been the case in modern times with the relaxation of cross-border capital controls. Higher inflation tends to lead central banks to put up interest rates which attracts more capital inflows from global investors seeking a lucrative place to keep their money. This increases demand for the local currency, which in Canada’s case is the Canadian Dollar.
Macroeconomic data releases gauge the health of the economy and can have an impact on the Canadian Dollar. Indicators such as GDP, Manufacturing and Services PMIs, employment, and consumer sentiment surveys can all influence the direction of the CAD. A strong economy is good for the Canadian Dollar. Not only does it attract more foreign investment but it may encourage the Bank of Canada to put up interest rates, leading to a stronger currency. If economic data is weak, however, the CAD is likely to fall.
- Notable monetary divergence between Fed, G10 peers keeps USD afloat.
- Markets await further economic reports for insights into the US economy's health for potential adjustments to Fed expectations.
- Next week’s highlight will be April’s US CPI.
The US Dollar Index (DXY) is currently trading around the 105.35 mark, posting mild gains on Friday near the end of the trading week. The Greenback holds its ground but seems stuck as markets await drivers to continue placing their bets on the next Federal Reserve (Fed) decisions.
The US economy remains on shaky ground, and markets are expecting signs of decelerating inflation, which gives the Fed confidence to start cutting. In the meantime, the bank’s officials remain hawkish.
Daily digest market movers: DXY remains firm as markets digest Fed speaker's words
- San Francisco Fed President Mary Daly emphasizes need for prolonged restrictive policy to achieve Fed's inflation targets.
- Atlanta Fed President Raphael Bostic hinted at a possible economic deceleration. The exact timeline for rate cuts, however, remains uncertain in his view.
- Overall, Fed remains careful concerning initiation of easing policy. Despite a few Fed officials expecting a single rate cut this year, majority of market predictions foresee rate cuts starting in September. This conservative Fed strategy starkly opposes Powell's dovish indications from last week.
- Outcome of April’s Consumer Price Index (CPI) will be key for markets to continue shaping their expectations.
DXY technical analysis: DXY showcases mixed sentiment with both bulls and bears struggling for strength
The indicators on the daily chart are radiating a rather mixed picture. On one hand, the Relative Strength Index (RSI) plots a positive slope but remains in negative territory. This indicates that while the selling pressure is currently stronger, buying momentum is slowly creeping up, suggesting a potential shift in the near future.
Similarly, the Moving Average Convergence Divergence (MACD) sticks with flat red bars, indicating no strong impulse from either side.
The Simple Moving Averages (SMAs) also carry a mixed signal. Despite the DXY falling below the 20-day SMA due to bearish interference, it remains above both the 100-day and 200-day SMAs. This scenario indicates that while bears have been successful in shaping the short-term trajectory, bulls retain control over the medium to long-term trend.
US Dollar FAQs
The US Dollar (USD) is the official currency of the United States of America, and the ‘de facto’ currency of a significant number of other countries where it is found in circulation alongside local notes. It is the most heavily traded currency in the world, accounting for over 88% of all global foreign exchange turnover, or an average of $6.6 trillion in transactions per day, according to data from 2022. Following the second world war, the USD took over from the British Pound as the world’s reserve currency. For most of its history, the US Dollar was backed by Gold, until the Bretton Woods Agreement in 1971 when the Gold Standard went away.
The most important single factor impacting on the value of the US Dollar is monetary policy, which is shaped by the Federal Reserve (Fed). The Fed has two mandates: to achieve price stability (control inflation) and foster full employment. Its primary tool to achieve these two goals is by adjusting interest rates. When prices are rising too quickly and inflation is above the Fed’s 2% target, the Fed will raise rates, which helps the USD value. When inflation falls below 2% or the Unemployment Rate is too high, the Fed may lower interest rates, which weighs on the Greenback.
In extreme situations, the Federal Reserve can also print more Dollars and enact quantitative easing (QE). QE is the process by which the Fed substantially increases the flow of credit in a stuck financial system. It is a non-standard policy measure used when credit has dried up because banks will not lend to each other (out of the fear of counterparty default). It is a last resort when simply lowering interest rates is unlikely to achieve the necessary result. It was the Fed’s weapon of choice to combat the credit crunch that occurred during the Great Financial Crisis in 2008. It involves the Fed printing more Dollars and using them to buy US government bonds predominantly from financial institutions. QE usually leads to a weaker US Dollar.
Quantitative tightening (QT) is the reverse process whereby the Federal Reserve stops buying bonds from financial institutions and does not reinvest the principal from the bonds it holds maturing in new purchases. It is usually positive for the US Dollar.
Federal Reserve (Fed) Board of Governors member Michelle W. Bowman noted that she is skeptical about the chances of a rate cut in 2024 while speaking at the Texas Bankers Association Annual Convention in Arlington, Texas.
Key highlights
I don't see rate cuts as warranted this year.
If we saw unexpected shocks, that would be a case for a rate cut.
I want to see a number of months of better inflation data.
It's probably a number of meetings before I'm ready to cut.
- GBP/USD erased its earlier gains as buyers failed to reclaim 200-DMA.
- Deterioration in the US economy spurred flows to USD amid its safe-haven appeal.
- Momentum remains bearish, as RSI stays below 50, key resistance lie above spot price.
The Pound Sterling weakened against the US Dollar on Friday, even though economic data from the UK was better than expected. Fears that the US economy may slow more sharply than expected as consumer sentiment deteriorates. The GBP/USD trades at 1.2510, down 0.10%.
GBP/USD Price Analysis: Technical outlook
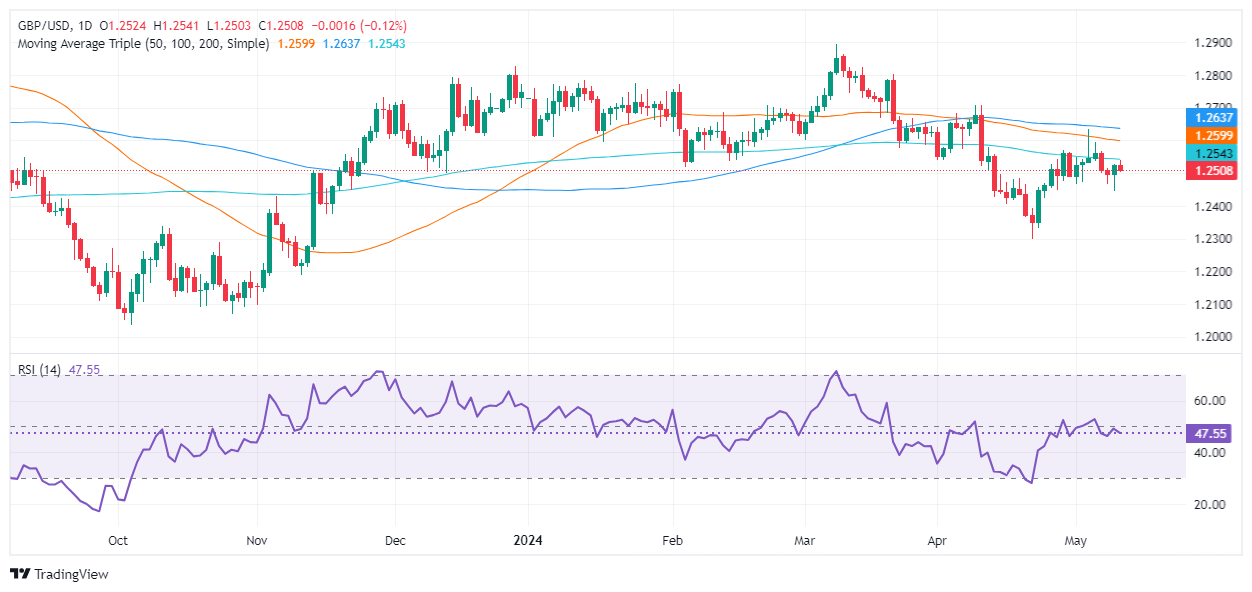
From a technical standpoint, the GBP/USD retracement toward 1.2500 keeps sellers hopeful of lower spot prices. Buying momentum is fading as buyers failed to crack the 200-day moving average (DMA) at 1.2541. That and the Relative Strength Index (RSI) remaining bearish could pave the way for further losses.
For a bearish continuation, sellers must conquer the May 9 low of 1.2445. Once cleared, it would emerge the psychological 1.2400 level, followed by the year-to-date (YTD) low of 1.2299.
On the flip side, if buyers hold GBP/USD’s exchange rate above 1.2500, they could test the 200-DMA, followed by the 50-DMA at 1.2594. the next resistance would be the 100-DMA at 1.2635.
GBP/USD Price Action – Daily Chart
- USD/JPY climbs after worse-than-expected US consumer sentiment data.
- Recession fears reignited as Americans became less optimistic about the economy.
- A jump in US inflation expectations underpins US yields and the Greenback.
The USD/JPY advanced steadily during the North American session, following a worse-than-expected University of Michigan (UoM) poll that showed that American consumers are becoming pessimistic about the economy. Despite that, the major trades at 155.83, up 0.24%.
USD/JPY rises after UoM Consumer Sentiment survey, eyes on next week US inflation
The UoM Consumer Sentiment Index retreated in May from 77.2 in April to 67.4, missing analysts’ estimates of 76. According to Joanne Hsu, the Director of the UoM Survey, the 10-point decline “is statistically significant and brings sentiment to its lowest reading in about six months.” According to the survey, Americans are becoming concerned about inflation, unemployment, and interest rates.
Inflation expectations for one year rose from 3.2% to 3.5% in May and stood at 3.1%, a tenth up from 3.0% for a ten-year period.
The US 10-year Treasury note yield rose four basis points (bps) to 4.498% following the data release. The US Dollar Index (DXY) has also advanced 0.14%, up to 105.35, as recession fears reignited, as the UoM survey suggests consumer spending could weaken in the near term.
In the meantime, two Federal Reserve officials had crossed the newswires. Fed Governor Michelle Bowman commented that the US central bank should proceed “carefully and deliberately.” Her colleague, the Dallas Fed Lorie Logan, said it's too early to think about cutting rates.
Next week, the US docket will feature the release of inflation figures, retail sales, building permits, and Fed speeches.
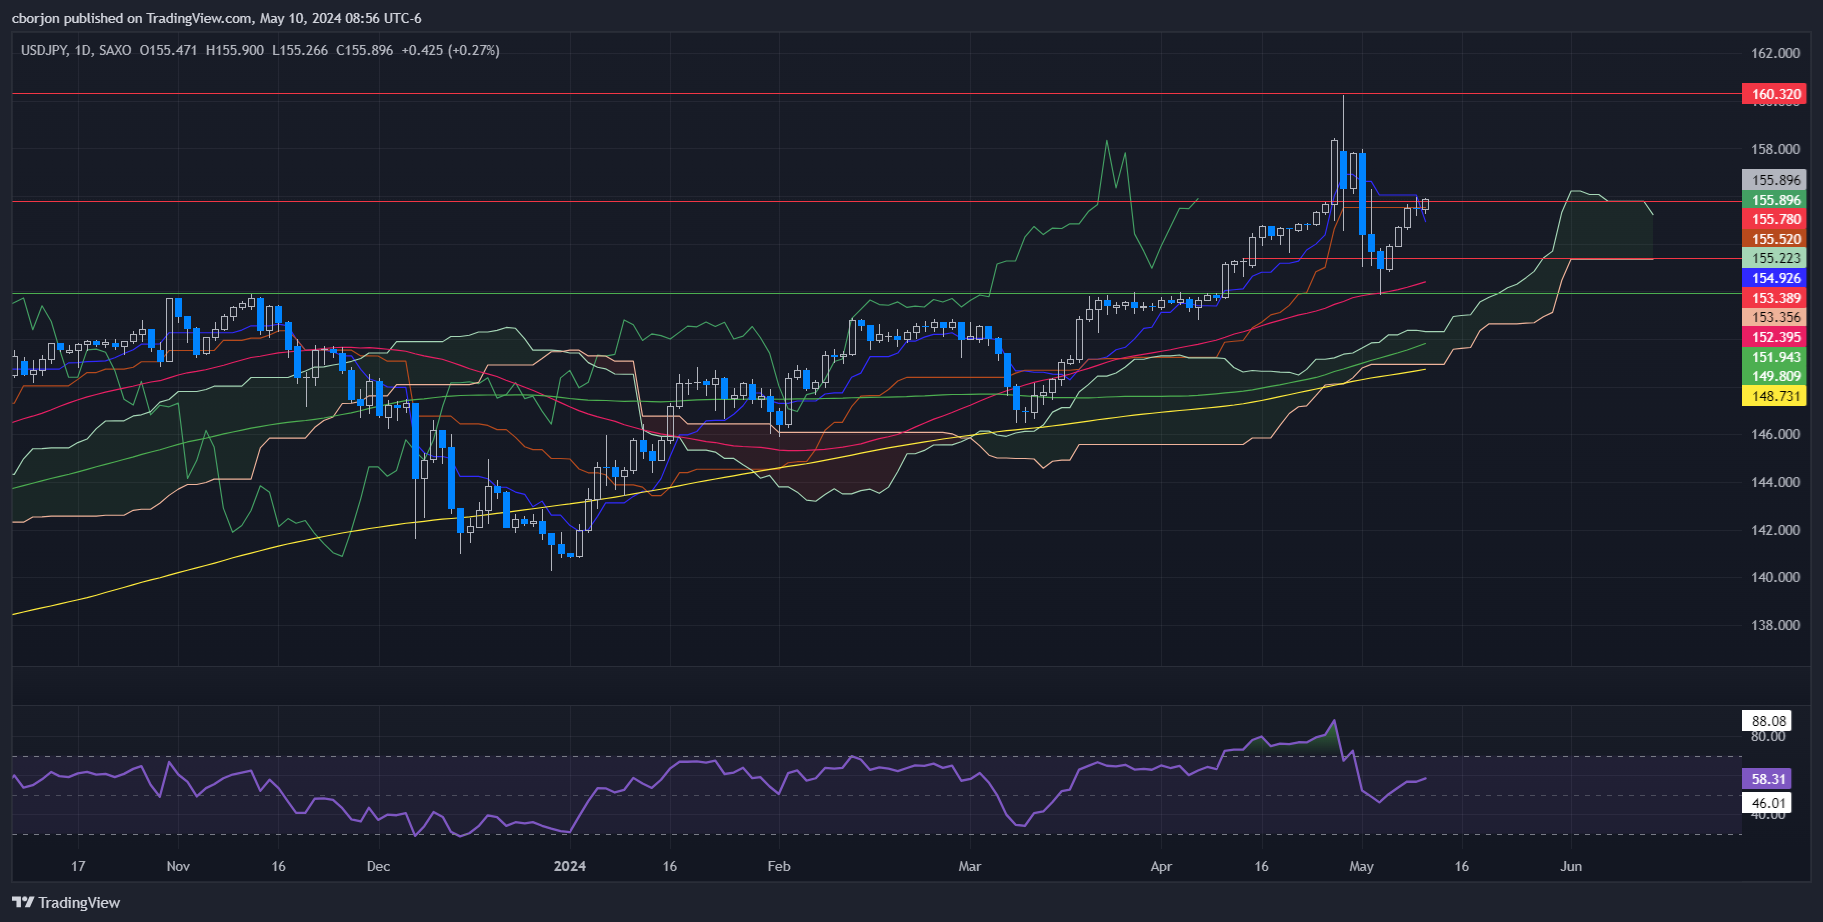
USD/JPY Price Analysis: Technical outlook
From a technical standpoint, the USD/JPY rally is set to continue, as momentum is on the side of buyers, as depicted by the Relative Strength Index (RSI). That, along with prices standing above the Ichimoku Cloud, could pave the way for bulls to challenge 156.00 in the near term. On the other hand, a drop below the Kijun-Sen at 155.78 could pave the way to challenge the Senkou Span A at 155.22, followed by the Tenkan Sen at 154.92.
The Greenback saw a decent recovery during this week, against the backdrop of the generalized erratic performance in the FX space, the continuation of the monetary policy divergence, and a cautious Fedspeak.
The US Dollar managed to reverse two weeks of losses and reclaim the area beyond the 105.00 barrier amidst some consolidative mood in US yields. On May 14, Producer Prices are due, seconded by CPI prints, Retail Sales, Business Inventories, and the NAHB Housing Market Index, all due on May 15. On May 16, the Philly Fed Manufacturing Index is expected, along with the usual weekly Initial Jobless Claims, Building Permits, Housing Starts, and Industrial Production. Finally, the CB Leading Index is due on May 17.
EUR/USD managed to clinch its fourth consecutive week of gains, although a test or surpass of the 1.0800 barrier seems elusive for the time being. Germany’s final Inflation Rate is due on May 14, along with the ZEW’s Economic Sentiment in Germany and the broader euro area. On May 15, another revision of the EMU’s GDP Growth Rate is expected, followed by the final Inflation Rate in the euro bloc on May 17.
GBP/USD retreated markedly and ended the week in negative territory amidst the bounce in the Greenback, while investors continued to assess the BoE event and positive results from key fundamentals. The UK labour market report is due on May 14, while the BoE will release its Financial Stability Report on May 16.
USD/JPY resumed its uptrend largely on the back of the increasing depreciation of the Japanese yen, despite the spectre of FX intervention continuing to linger. Producer Prices are expected on May 14, followed by preliminary GDP Growth Rate and Foreign Bond Investment figures on May 16. Final Industrial production prints will close the docket on May 17.
A choppy week prompted AUD/USD to close the week slightly on the defensive around the key 0.6600 region. The Australian Wage Price Index is due on May 15, and the labour market report is expected on May 16.
Anticipating Economic Perspectives: Voices on the Horizon
- Fed’s Mester and Jefferson speak on May 13.
- Fed’s Powell and Cook speak on May 14 along with BoE’s Pill.
- Fed’s Bowman speaks on May 15.
- Fed’s Mester, Barr and Bostic speak on May 16, along with RBA’s Hunter and BoE’s Greene.
- Fed’s Waller and BoE’s Mann speak on May 17.
Central Banks: Upcoming Meetings to Shape Monetary Policies
- The Bangko Sentral ng Pilipinas (BSP) will hold its meeting on May 16.
- Silver price holds gains above $28.00 amid firm speculation for Fed rate cuts.
- Steadily cooling US labor market conditions keep the US Dollar’s upside limited.
- Investors shift focus to the US Inflation data.
Silver price (XAG/USD) holds onto gains above the crucial figure of $28.00 in Friday’s New York session. The white metal remains firm as investors’ confidence in the Federal Reserve (Fed) starting to reduce interest rates from the September meeting has strengthened.
The CME FedWatch tool shows that traders see a 71% chance that interest rates will decline from their current levels in September, which are higher than 66% recorded a month ago. The speculation for the Fed pivoting to rate cuts has strengthened as investors lose conviction over United States labor market strength.
The US Department of Labor showed that individuals claiming jobless benefits for the first time at 231K for the week ending May 3 were higher in more than eight months. Also, recent official labor market data showed that job growth was the slowest in six months. The overall data suggests that the US labor market is struggling to bear the consequences of the Fed’s restrictive monetary policy framework.
The situation is favorable for non-yielding assets such as Silver but weighs on the US Dollar and bond yields. In spite of that the US Dollar Index (DXY), which tracks the Greenback’s value against six major currencies, holds above the 105.00 support. 10-year US Treasury yields jump to 4.49%.
Next week, US economic calendar will be data-packed as the Producer Price Index (PPI) and Consumer Price Index (CPI), and the Retail Sales data are lined-up for release. The major event will be the consumer price inflation data, which will influence market expectations for Fed rate cuts.
Silver technical analysis
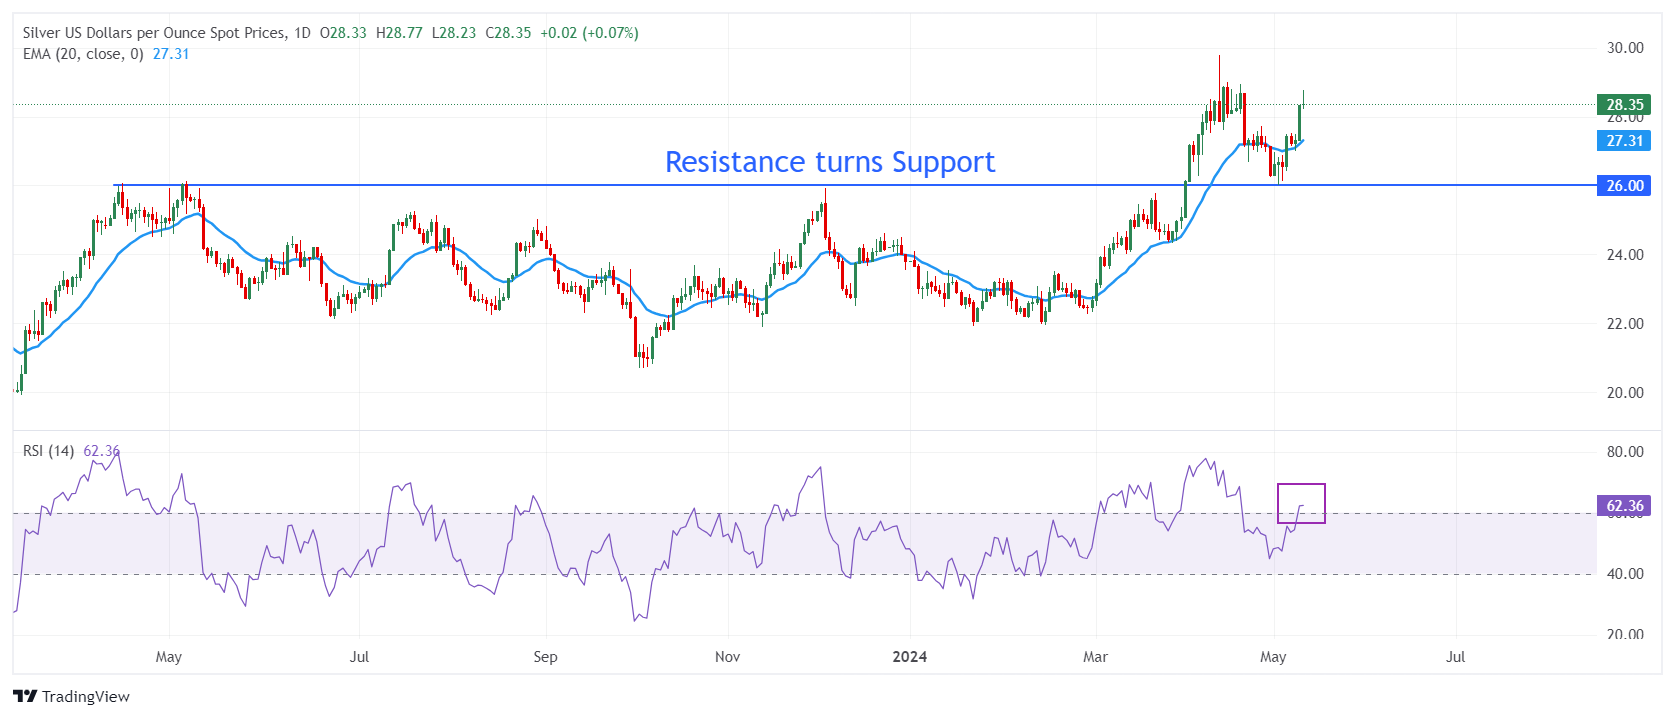
Silver price recovers sharply after discovering buying interest near the horizontal support plotted from 14 April 2023 high around $26.09 on a daily timeframe. The above-mentioned support was earlier a major resistance for the Silver price bulls. The near-term outlook of Silver has improved as it returns above the 20-period Exponential Moving Average (EMA), which trades around $27.30.
The 14-period Relative Strength Index (RSI) shifts into the bullish range of 60.00-80.00, suggesting that a bullish momentum has been triggered.
Silver daily chart
On Friday, Dallas Federal Reserve President Lorie Logan remarked that there are "uncertainties" regarding whether monetary policy is adequately restrictive to lower inflation to the Fed's target, emphasizing that it is "premature" to consider interest rate cuts at this stage.
Key Takeaways
We've made substantial progress on inflation, with labor market and economy strong.
Not a soft landing yet.
Q1 inflation data disappointing.
There are important upside risks to inflation.
There are uncertainties if policy is sufficiently restrictive.
Too early to think about cutting rates.
We need to remain flexible on policy.
The neutral interest rate level may have risen.
Events of March 2023 have really impacted how we need to think about liquidity risk.
Critically important that banks have a broad set of funding arrangements; one of them has to be the Fed's discount window.
We want to see every bank sign up for discount window.
We want to see every bank testing the discount window on a regular basis.
Safe, healthy banks use the discount window all the time; that's a good thing.
Once banks are signed up, discount window is an easy system to use.
- Consumer confidence in the United States contracted by more than anticipated in May.
- UoM survey showed one-year and five-year inflation expectations edged higher.
Consumer confidence in the US fell in May, with the University of Michigan's preliminary Consumer Sentiment Index plummeting to 67.4 in May from 77.2 in April. The reading also missed the market expectation of 76.
The Current Conditions Index declined to 68.8 from 79 in the previous month. More worrisome, 1-year inflation expectations were up to 3.5% vs 3.2% previously, while 5-year inflation expectations increased to 3.1% from 3.0%.
Market reaction
The US Dollar remains on the back foot after the report, showing no reaction to the news. Meanwhile, stock markets continue to pressure weekly highs, in line with the dominant optimism.
(This story was corrected on May 10 at 14:22 GMT to say that the index fell to 67.4 in May, not April, from 77.2 in April, not March)
- `USD/CAD drops sharply to 1.3630 after strong Canadian Employment data.
- Canadian job market expanded by 90.4K fresh payrolls while annual wage growth slowed to 4.8%.
- Fed Bostic said the central bank is uncertain about when and how much interest rates should be reduced.
The USD/CAD pair faces a sharp sell-off to 1.3630 in Friday’s early New York session as Statistics Canada has posted strong Canadian Employment data. The agency showed that the employers hired 90.4K job-seekers in April, significantly higher than the consensus of 18K. In March, the job market recorded a lay-off of 2.2K employees.
The Unemployment Rate remains steady at 6.1% while investors estimated the joblessness to rise to 6.2%. However, the annual Average Hourly Wages declined to 4.8% from 5.0% in March. Average Hourly Wages data is a leading indicator of wage growth. Slower wage growth reduces the consumer spending pace, which exhibits a soft inflation outlook.
The impact of overall Employment data is expected to be lower on Bank of Canada’s (BoC) interest rate outlook as strong job additions will offset slower wage growth.
Meanwhile, the appeal of the Canadian Dollar remains strong due to a sharp recovery in the Oil price. West Texas Intermediate (WTI), futures on NYMEX, continues its winning spell for the third trading session on Friday amid firm speculation that the Federal Reserve (Fed) will pivot to policy normalization from the September meeting. It is worth noting that Canada is the leading exporter of Oil to the United States and higher Oil prices support the Canadian Dollar.
On the US Dollar front, steadily cooling US labor market conditions have kept the US Dollar’s upside limited. The US Dollar Index, which tracks the Greenback’s value against six major currencies, rebounds slightly from the crucial support of 105.00. While investors remain optimistic that the Fed will start to reduce interest rates in September, policymakers are still uncertain about rate cuts. In the American session, Atlanta Federal Reserve President Raphael Bostic said the central bank is considering rate cuts this year but is uncertain about when and how much quantitative easing will occur.
- Natural Gas is correcting within a short-term uptrend.
- The RSI is giving a sell-signal further increasing the chances of a pullback evolving.
- The trend is expected to continue after the correction has finished.
Natural Gas price is in a short-term uptrend evidenced by the rising sequence of peaks and troughs on the 4-hour chart, and the fact it is trading above all its key Moving Averages.
Given the old adage that “the trend is your friend,” the commodity is likely to continue rallying over the short-term horizon (up to 6 weeks) unless and until the evidence suggests otherwise.
Natural Gas 4-hour Chart
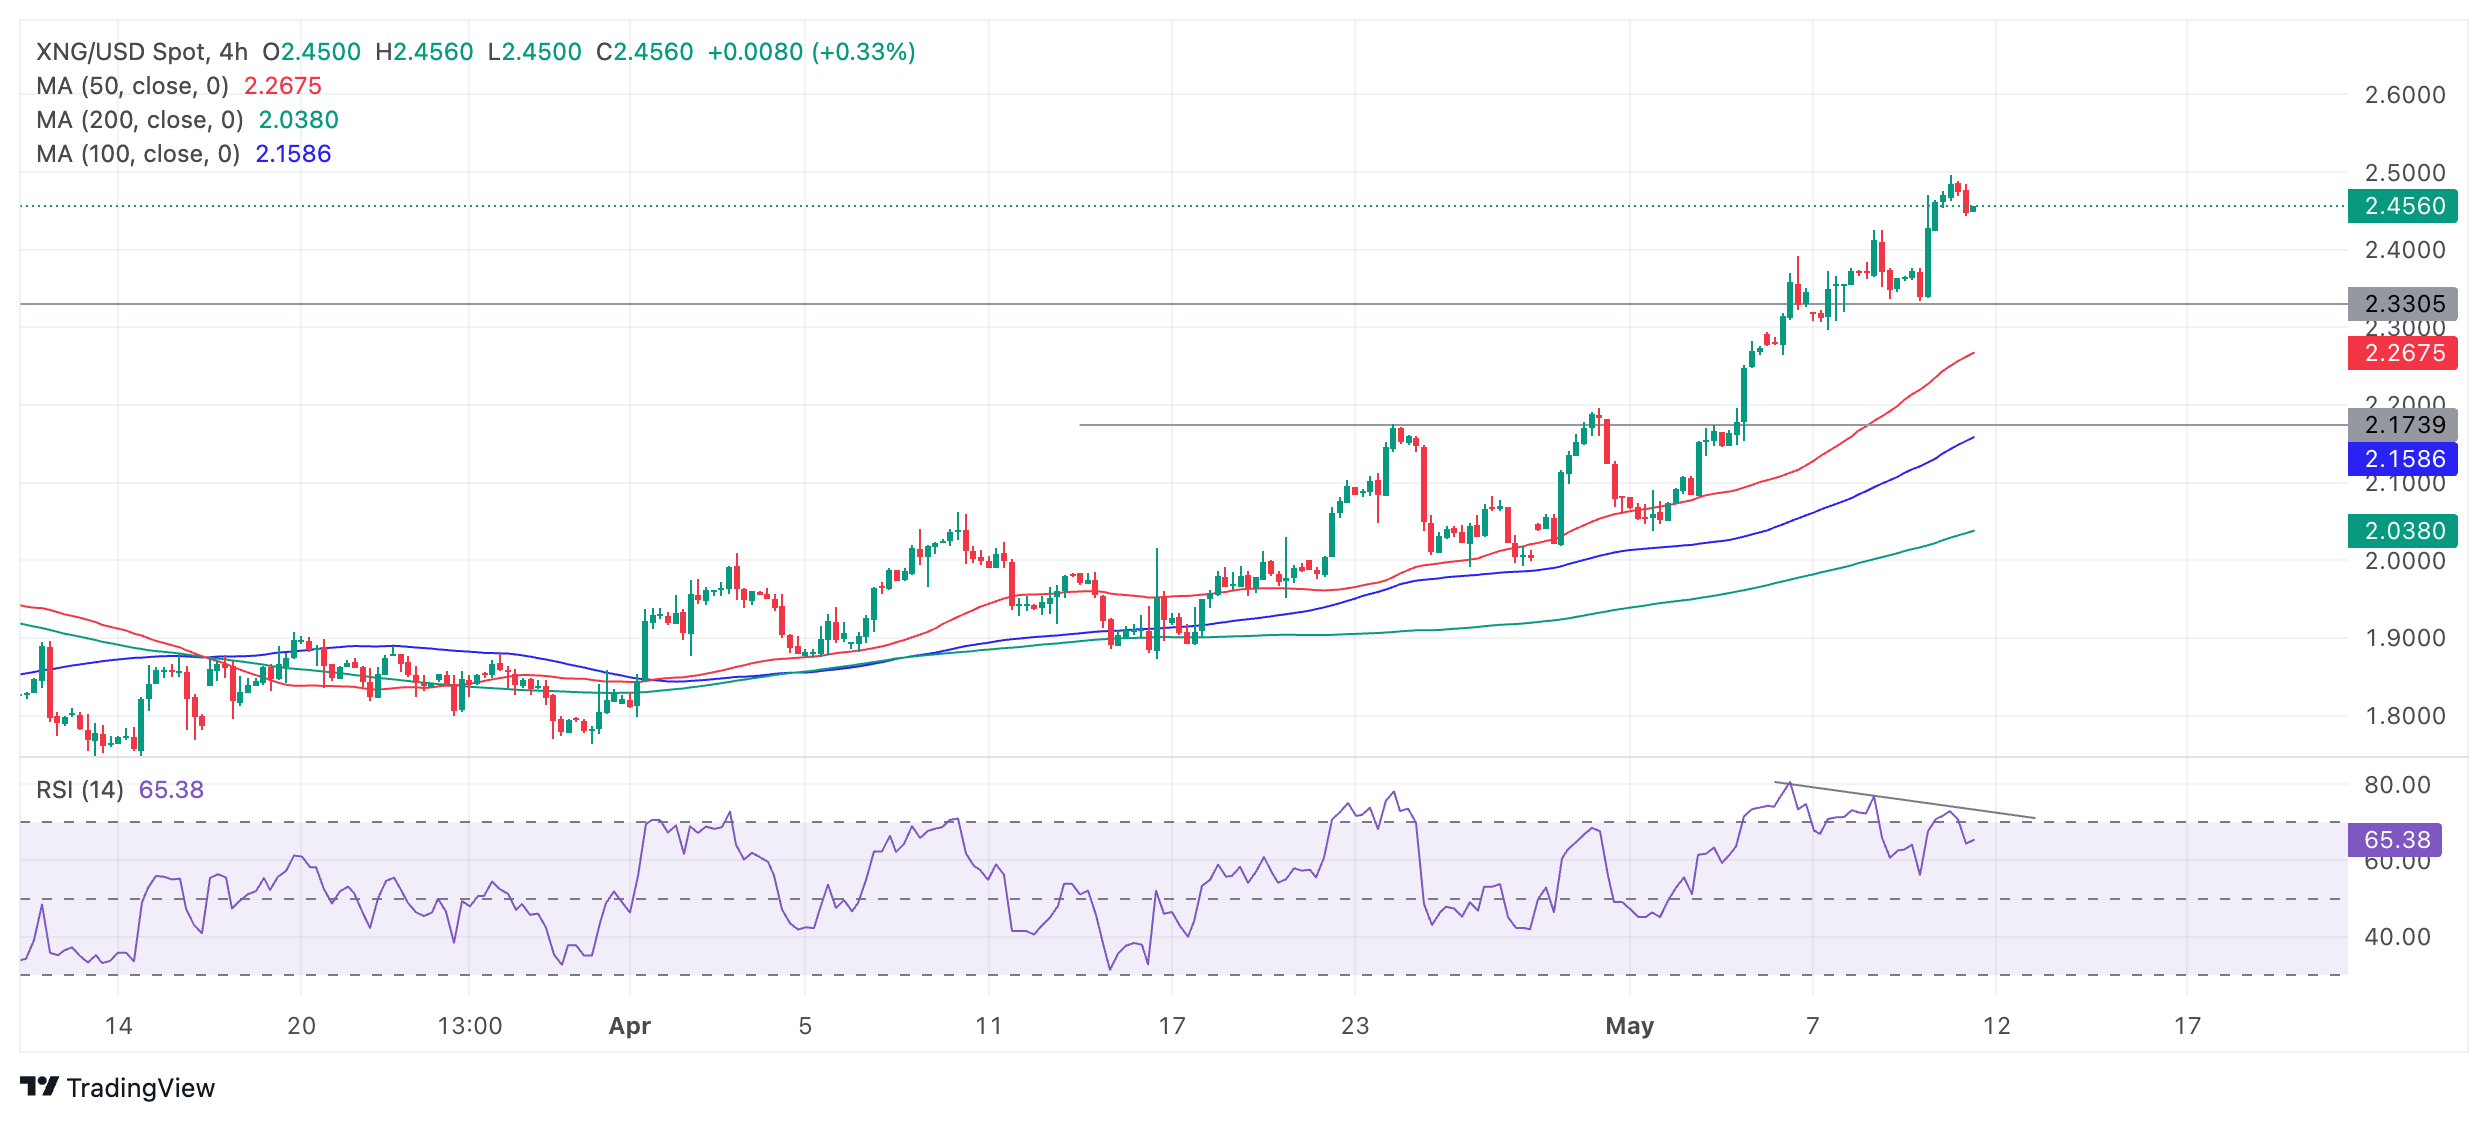
The Relative Strength Index (RSI) momentum indicator has been fluctuating at overbought extremes since May 3 and consistently showing bearish divergence with price. This occurs when price reaches new highs but the RSI fails to follow suit. It is a sign of underlying weakness.
The RSI has just moved out of overbought and re-entered neutral territory during the last bar, giving a sell signal. Taken together with the pullback in price it suggests the possibility of a deeper correction unfolding.
The zone of support between $2.42 and $2.32 MMBtu is likely to underpin any declines, however, and provide a springboard to a resumption of the uptrend eventually.
After the correction Natural Gas will probably continue to new highs in line with the dominant uptrend. A break above the $2.50 MMBtu level would indicate a continuation higher, potentially to an initial target at roughly $2.60 MMBtu.
If Natural Gas price breaks below $2.32 MMBtu it will bring the uptrend into doubt and suggest the possibility that a reversal has occurred and a new downtrend is beginning. In such a scenario, short positions as opposed to long positions would be favored.
BoE's Chief Economist, Huw Pill, was on the wires on Friday. Pill aligned with the majority of the BoE's MPC on Thursday in maintaining interest rates at 5.25%. However, he expressed afterward an increasing conviction that the time for rate cuts would soon arrive.
Key Takeaways
We must focus on persistent components of inflation, not headline rate.
MPC has sent a relatively clear signal that bank rate can be cut when there is sufficient evidence of a downward path in persistent components of inflation.
Focusing just on the next boe meeting is a little ill advised.
BOEs medium-term inflation forecasts don't necessarily give a signal on rate moves at the next meeting or the one after.
Market Reaction
GBP/USD clings to daily gains amidst the broad-based flat mood in the FX galaxy, although the earlier advance appears to have met a decent hurdle near the 200-day SMA around 1.2540.
British Pound PRICE Today
The table below shows the percentage change of British Pound (GBP) against listed major currencies today. British Pound was the strongest against the US Dollar.
| USD | EUR | GBP | JPY | CAD | AUD | NZD | CHF | |
|---|---|---|---|---|---|---|---|---|
| USD | -0.02% | 0.04% | -0.17% | -0.02% | -0.21% | -0.35% | -0.14% | |
| EUR | 0.02% | 0.06% | -0.17% | -0.02% | -0.18% | -0.34% | -0.11% | |
| GBP | -0.04% | -0.06% | -0.21% | -0.07% | -0.23% | -0.37% | -0.16% | |
| JPY | 0.17% | 0.17% | 0.21% | 0.06% | -0.08% | -0.19% | 0.02% | |
| CAD | 0.02% | 0.02% | 0.07% | -0.06% | -0.18% | -0.31% | -0.12% | |
| AUD | 0.21% | 0.18% | 0.23% | 0.08% | 0.18% | -0.13% | 0.05% | |
| NZD | 0.35% | 0.34% | 0.37% | 0.19% | 0.31% | 0.13% | 0.21% | |
| CHF | 0.14% | 0.11% | 0.16% | -0.02% | 0.12% | -0.05% | -0.21% |
The heat map shows percentage changes of major currencies against each other. The base currency is picked from the left column, while the quote currency is picked from the top row. For example, if you pick the British Pound from the left column and move along the horizontal line to the US Dollar, the percentage change displayed in the box will represent GBP (base)/USD (quote).
- The USD Index struggles to sustain above 105.00 amid signs that the US labor market cools down.
- Firm speculation for Fed rate cuts in September keeps the US Dollar on its toes.
- Investors shift focus to the US inflation data for fresh guidance.
The US Dollar Index (DXY) trades close to the crucial support of 105.00 in Friday’s European session. The USD Index struggles to hold the above-mentioned support as conviction among investors over the Federal Reserve (Fed) starting to reduce interest rates from the September meeting has strengthened. This has also improved the risk appetite of investors. S&P 500 futures have posted significant gains, exhibiting strong demand for risk-sensitive assets.
Cooling US labor market conditions boost Fed rate cut bets
The expectations for the Fed to begin reducing interest rates from the September meeting have escalated as a recent set of job data has indicated that labor market conditions are steadily cooling.
The United States Department of Labor reported on Thursday that individuals claiming jobless benefits for the first time were highest in the last eight months. For the week ending May 3, Initial Jobless Claims (IJC) were 231K, significantly higher than the consensus of 210K and the prior reading of 209K, upwardly revised from 208K. In addition to rising jobless claims, US employers added fewer jobs in April. Fresh Nonfarm Payrolls (NFP) were 175K, the lowest in six months.
Focus shifts to US Inflation
This week, investors relied on commentary from Fed policymakers to project US Dollar’s moves due to absence of top-tier economic data. Next week, US economic calendar will be data-packed as the Producer Price Index (PPI) and Consumer Price Index (CPI), and the Retail Sales data are lined-up for release. The major event will be the consumer price inflation data, which will influence market expectations for Fed rate cuts.
US Dollar technical analysis
The USD Index trades in a Rising Channel chart pattern on a daily timeframe in which each corrective move is considered as buying opportunity by the market participants. The near-term outlook of the USD Index is uncertain as the asset fails to sustain above the 20-day Exponential Moving Average (EMA), which trades around 105.40.
The 14-period Relative Strength Index (RSI) oscillates in the 40.00-60.00, suggesting indecisiveness among market participants.
USD Index daily chart

- Oil is falling in a descending channel on the short-term horizon.
- Within the channel it is currently correcting higher, however, it is likely to capitulate and resume its downtrend.
- Only a decisive break out of the channel would reverse the short-term bearish outlook.
Oil price is trading higher, exchanging hands in the 79.50s at the time of writing on Friday, as it rises up within a falling channel.
West Texas Intermediate (WTI) Crude Oil is in a short-term downtrend which, given the old adage “the trend is your friend,” is expected to eventually continue once the current correction has finished.
US WTI Oil 4-hour Chart

WTI Oil will probably continue rising first, however, given there are no signs yet that the correction is running out of steam. The price might well reach the upper channel line at around $80.00, however, when it gets there it will almost certainly meet tough resistance, and probably reverse lower.
Oil has broken above the 50 Simple Moving Average (SMA) – a bullish sign – but it has not yet broken above the 100 or 200 SMAs. Oil price would have to decisively break out of the falling channel and the 100 SMA to mark a change of trend and suggest a more bullish technical outlook.
A decisive break would be one accompanied by a long green candle that closed near its high or three green candles in a row that broke above the channel line.
Such a break, if it were to happen, could see Oil rally to an initial target at roughly $83.10, the Fibonacci 0.681 ratio of the height of the channel extrapolated higher.
The Moving Average Convergence Divergence (MACD) momentum indicator has risen above the zero-line and is painting green histogram bars suggesting the current up leg is likely to extend. Resistance from the channel line, however, will probably eventually push price back down. The overall bear trend suggests the possibility of Oil falling back down to $76.00 lows eventually.
According to an interview with Reuters, Atlanta Federal Reserve President Raphael Bostic suggested that the Fed is probably still planning to reduce interest rates this year, despite uncertainty regarding when and by how much policy easing will occur, as well as the gradual pace of inflation declines.
Key Quotes
Most firms say pricing power is at or near its limit, with wage growth moving to pre-pandemic levels.
Optimistic disinflation will continue, though the path back to the Fed's 2% target may take until late next year or early 2026.
He is thinking less about the extent of rate cuts this year and more about getting the timing right for the start of easing.
Job growth needs to slow to be consistent with the 2% target, though that does not mean unemployment will spike.
Gain of 175,000 jobs in april may be low for pandemic-era, but still above what economy needs to account for population, labor force growth.
Market Reaction
The Greenback keeps its slight buying bias in the low 105.00s when tracked by the USD Index (DXY) ahead of the release of the advanced Michigan Consumer Sentiment and speeches by Bowman, Barr and Goolsbee.
US Dollar PRICE Today
The table below shows the percentage change of US Dollar (USD) against listed major currencies today. US Dollar was the strongest against the British Pound.
| USD | EUR | GBP | JPY | CAD | AUD | NZD | CHF | |
|---|---|---|---|---|---|---|---|---|
| USD | -0.03% | 0.08% | -0.17% | -0.02% | -0.15% | -0.32% | -0.09% | |
| EUR | 0.03% | 0.10% | -0.17% | -0.01% | -0.12% | -0.31% | -0.05% | |
| GBP | -0.08% | -0.10% | -0.25% | -0.12% | -0.21% | -0.39% | -0.15% | |
| JPY | 0.17% | 0.17% | 0.25% | 0.07% | -0.01% | -0.16% | 0.08% | |
| CAD | 0.02% | 0.01% | 0.12% | -0.07% | -0.12% | -0.29% | -0.04% | |
| AUD | 0.15% | 0.12% | 0.21% | 0.01% | 0.12% | -0.17% | 0.06% | |
| NZD | 0.32% | 0.31% | 0.39% | 0.16% | 0.29% | 0.17% | 0.24% | |
| CHF | 0.09% | 0.05% | 0.15% | -0.08% | 0.04% | -0.06% | -0.24% |
The heat map shows percentage changes of major currencies against each other. The base currency is picked from the left column, while the quote currency is picked from the top row. For example, if you pick the US Dollar from the left column and move along the horizontal line to the Japanese Yen, the percentage change displayed in the box will represent USD (base)/JPY (quote).
- Gold rallies as investors turn to safety amid worsening geopolitical tensions.
- Weak US labor market data reignites speculation of early Fed rate cuts further driving Gold higher.
- Gold price enters a short-term uptrend with the bias favoring long-holders.
Gold price (XAU/USD) trades almost a percentage point higher in the $2,360s on Friday. The precious metal rises as increasing geopolitical tensions over Gaza solidify its safe-haven appeal.
The upside also results from concerns over the US labor market due to recent data, which have sparked speculation the Federal Reserve (Fed) may lower interest rates sooner than previously expected, increasing the attractiveness of the non-yielding precious metal.
Gold price rises on end of peace talks, US labor market concerns
Gold price rises due to its safe-haven appeal as peace talks between Hamas and Israel in Cairo break down and Israeli armor and military personnel amass around the city of Rafah, the last major urban center in Gaza not reduced to rubble.
The US, meanwhile, is withholding shipments of weapons and military aid to Israel after President Biden warned the country against mounting a full-scale attack on Rafah. Despite the warning, reports have come in of strikes to a mosque and several houses in the city, leading to the deaths of over a dozen people, including women and children, according to Reuters.
US Jobless Claims surprise to the upside
In the US, further evidence of a weakening labor market has reanimated expectations the Federal Reserve will need to cut interest rates sooner than previously thought.
US Initial Jobless Claims data for the week of May 3, released on Thursday, showed a higher-than-expected 231,000 rise when 210,000 had been expected from an upwardly revised 209,000 in the previous week.
This comes on the back of a Nonfarm Payrolls report that showed below-estimated readings for April in almost all key metrics measured.
The data suggests the US economy is struggling under the weight of the currently high interest rates environment and increases speculation the Fed may move to cut rates sooner than previously thought.
Commentary from Federal Reserve officials, however – most recently from Boston Fed President Susan Collins and Minneapolis Fed President Neel Kashkari – has leaned hawkish, with both arguing that inflationary pressures remain too high to consider reducing interest rates.
Major central banks mark a shift in stance
Globally most central banks are either cutting interest rates or signaling a willingness, leading to an environment in which interest rates appear to be peaking and declining – a positive for Gold.
On Wednesday, Sweden’s Riksbank cut interest rates for the first time since 2016, and the number of Bank of England (BoE) officials voting to cut rates on Thursday increased. At its March meeting, the Swiss National Bank (SNB) also opted to cut interest rates.
The European Central Bank (ECB) has all but guaranteed it will cut interest rates in June, and the Reserve Bank of Australia (RBA) accompanied its decision to hold interest rates steady at the last meeting, with dovish rhetoric.
Technical Analysis: Gold price breaks higher, beginning short-term uptrend
Gold price (XAU/USD) has broken through the ceiling of a mini-range and rallied sharply.
A reversal in the sequence of peaks and troughs on the 4-hour time frame chart now suggests the precious metal is in a short-term uptrend, which is biased to extend higher.
XAU/USD 4-hour Chart
The Relative Strength Index (RSI) momentum indicator is overbought, suggesting Gold may be overstretched and could be at risk of a pullback. A move down into neutral territory again would give a sell signal and indicate more clearly a correction. In the meantime, the advice for long-holders is not to add to their positions.
That said, the uptrend remains in progress and the price keeps pushing higher.
The next target to the upside for Gold is at around $2,400, roughly at the height of the April highs.
The bullish trend on both the medium and long-term charts (daily and weekly), overall add a supportive backdrop for Gold.
Economic Indicator
Initial Jobless Claims
The Initial Jobless Claims released by the US Department of Labor is a measure of the number of people filing first-time claims for state unemployment insurance. A larger-than-expected number indicates weakness in the US labor market, reflects negatively on the US economy, and is negative for the US Dollar (USD). On the other hand, a decreasing number should be taken as bullish for the USD.
Read more.Last release: Thu May 09, 2024 12:30
Frequency: Weekly
Actual: 231K
Consensus: 210K
Previous: 208K
Source: US Department of Labor
Every Thursday, the US Department of Labor publishes the number of previous week’s initial claims for unemployment benefits in the US. Since this reading could be highly volatile, investors may pay closer attention to the four-week average. A downtrend is seen as a sign of an improving labour market and could have a positive impact on the USD’s performance against its rivals and vice versa.
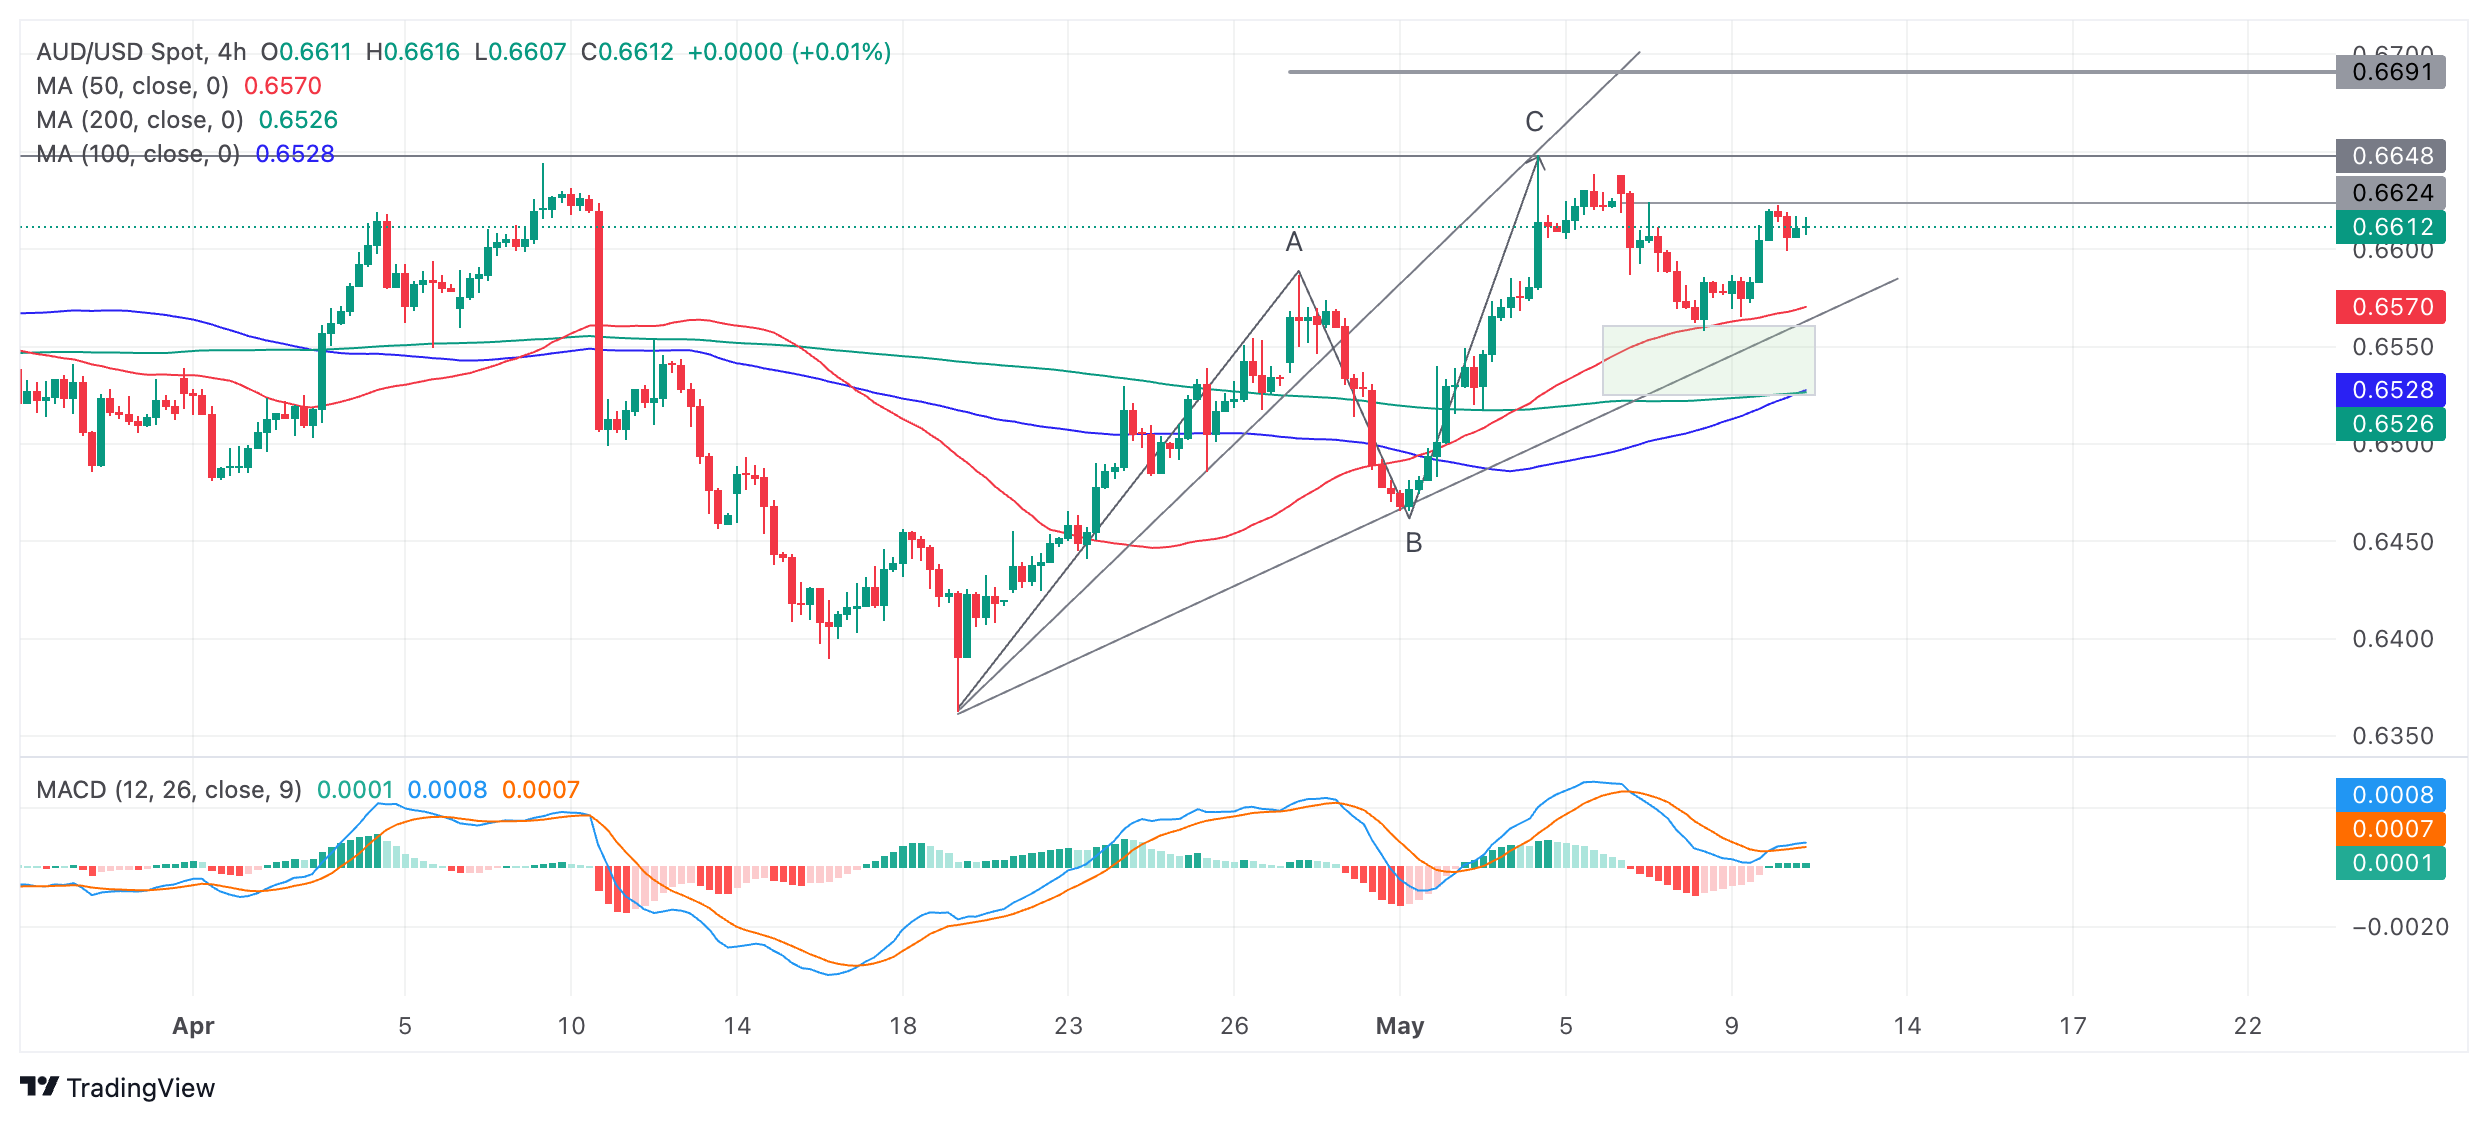
- AUD/USD is consolidating after reversing its short-term trend and beginning a new uptrend.
- A break above 0.6624 would confirm more upside for the pair.
- AUD/USD may have formed a Measured Move with a final target at around 0.6690.
AUD/USD is trading in the 0.6610s on Friday after pulling back from resistance at the 0.6624 barrier.
The pair is probably in a short-term uptrend, evidenced by the rising sequence of peaks and troughs since the April 19 lows, visible on the 4-hour chart
AUD/USD 4-hour Chart

Given the old saying that “the trend is your friend” the resumption of the uptrend suggests AUD/USD will continue higher.
A re-break above the 0.6624 highs would provide confirmation of further upside to the next target at the 0.6649 resistance level of the May 3 high. Following that, the next target would be at around 0.6680-90.
The second target is generated by a possible Measured Move pattern that AUD/USD has formed since the April 19 lows. These patterns are like large zig-zags composed of three waves, labeled A, B and C on the chart. The general expectation is that wave C will be either the same length as A or a Fibonacci 0.681 of A.
Wave C has already reached the Fibonacci 0.681 target of the Measured Move at the May 3 highs, however, there is a chance it could go all the way to the second target where C=A at 0.6690.
The Moving Average Convergence Divergence (MACD) momentum indicator has crossed above its signal line, giving a buy signal. The MACD has also started printing green histogram bars, further adding to the weight of bullish evidence.
That said, it is still possible the correction from the May 3 highs may have further to run before the uptrend properly resumes.
In the advent of more weakness, the rectangular pale green zone drawn on the chart just above the lower trendline is likely to provide a cushion of support for price. From there price will probably resume its uptrend.
Alternatively, a decisive break below the trendline would be a bearish sign, suggesting a potential reversal of the trend.
A decisive break would be one accompanied by a long red candle which closes near its low or three red candles in a row that break below the trendline.
- USD/JPY gained ground due to the recovery in the US Dollar on Friday.
- Japan’s Current Account Surplus was lower than market expectations, weakening the Japanese Yen.
- US Initial Jobless Claims rose to an eight-month high of 231K, surpassing estimates of 210K.
USD/JPY is retracing its recent losses from the previous session, trading around 155.70 during the European session on Friday. However, verbal intervention from Japanese authorities is expected to curb the upward movement of the USD/JPY pair. Japanese Finance Minister Shunichi Suzuki reiterated on Friday that he is prepared to take necessary measures concerning foreign exchange if deemed necessary.
On the data front, Japan’s Current Account Surplus (YoY) rose to JPY 3,398.8 billion in March from JPY 2,360.0 billion. This marked the 14th consecutive month of surplus in the current account but fell short of the expected increase of JPY 3,489.6 billion. The data showed that capital inflows into Japan were lower than market expectations, weakening the Japanese Yen.
The USD/JPY pair received support from the upward correction in the US Dollar (USD), driven by the hawkish sentiment surrounding the Federal Reserve (Fed) maintaining higher interest rates for an extended period.
However, the Greenback encounters resistance due to lower US Treasury yields, influenced by the lower-than-expected US Initial Jobless Claims data released on Thursday. The US Bureau of Labor Statistics (BLS) reported that the number of individuals filing for unemployment benefits exceeded expectations, with Initial Jobless Claims for the week ending May 3 rising to 231,000, surpassing estimates of 210,000 and increasing from the previous week's reading of 209,000.
Later in the day, the preliminary US Michigan Consumer Sentiment Index for May is scheduled for release, with forecasts indicating a slight decrease. This survey assesses sentiment among US consumers, covering three primary areas: personal finances, business conditions, and buying conditions.
- EUR/USD holds gains near 1.0780 as Fed rate-cut speculation keeps the US Dollar on edge.
- Easing US labor market conditions strengthens Fed rate-cut prospects.
- The ECB is projected to deliver three rate cuts this year due to easing Eurozone inflation.
EUR/USD is struck in a tight range slightly below the crucial resistance of 1.0800 in Friday’s European session after a sharp recovery from 1.0725. The major currency pair holds strength as investors have already discounted the fact that the European Central Bank (ECB) will start lowering its borrowing rates in June.
However, ECB policymakers are divided over extending the rate-cut cycle after the June meeting. A few policymakers believe that additional interest rate cuts from the July meeting could revamp price pressures.
ECB policymaker and Bank of Greece Governor Yannis Stournaras said in an interview with a Greek media outlet last week that he sees three rate cuts this year. He sees a rate cut in July as possible and added that an economic rebound in the first quarter made a three-cuts scenario more likely than four. The Eurozone economy expanded by 0.3% in the January-March period, beating expectations of a 0.1% growth.
On the contrary, ECB Governing Council member and Governor of Austria's central bank, Robert Holzmann, said on Wednesday that he doesn't see a reason to cut key interest rates "too quickly or too strongly," Reuters reported.
This week, EUR/USD has been driven by market sentiment due to the absence of tier-1 Eurozone and United States economic data. However, next week, investors will focus on the US Consumer Price Index (CPI) data for April, which will be published on Wednesday.
Daily digest market movers: EUR/USD holds strength amid improved market sentiment
- EUR/USD shows strength slightly below the round-level resistance of 1.0800 at 1.0780 due to improved market sentiment. The appeal for risk-perceived assets is strong amid firm speculation that the Federal Reserve (Fed) will start reducing interest rates in September. S&P 500 futures have posted significant gains in the European session, signalling investors’ higher risk appetite.
- Expectations for the Fed to begin lowering interest rates in September have strengthened as the US labor market showed further signs of cooling. On Thursday, the US Department of Labor reported that Initial Jobless Claims rose significantly to 231K (the highest level since November 10 week), exceeding the consensus of 210K and the prior reading of 209K.
- Apart from the higher-than-expected jobless claims, weak Nonfarm Payrolls (NFP) for April and slower job openings in March have dented investors’ confidence in the strength of the US labor market. Job growth was the lowest in six months and job postings were the lowest in three years.
- Cooling US labor market conditions indicate that the job market is struggling to bear the burden of the Fed’s restrictive monetary policy framework. The context has boosted Fed interest rate-cut prospects for September. The CME FedWatch tool shows that traders see a 71% chance that interest rates will decline from their current levels in September, which is higher than the odds of 66% recorded a month ago.
- This week, Minneapolis Fed Bank President Neel Kashkari said that weakness in the job market could justify a rate cut. However, he remained lean towards maintaining the current interest rate framework for the entire year. Kashkari signalled concerns over stalling progress in inflation declining to 2% amid a strong housing market.
Technical Analysis: EUR/USD is slightly below 1.0800
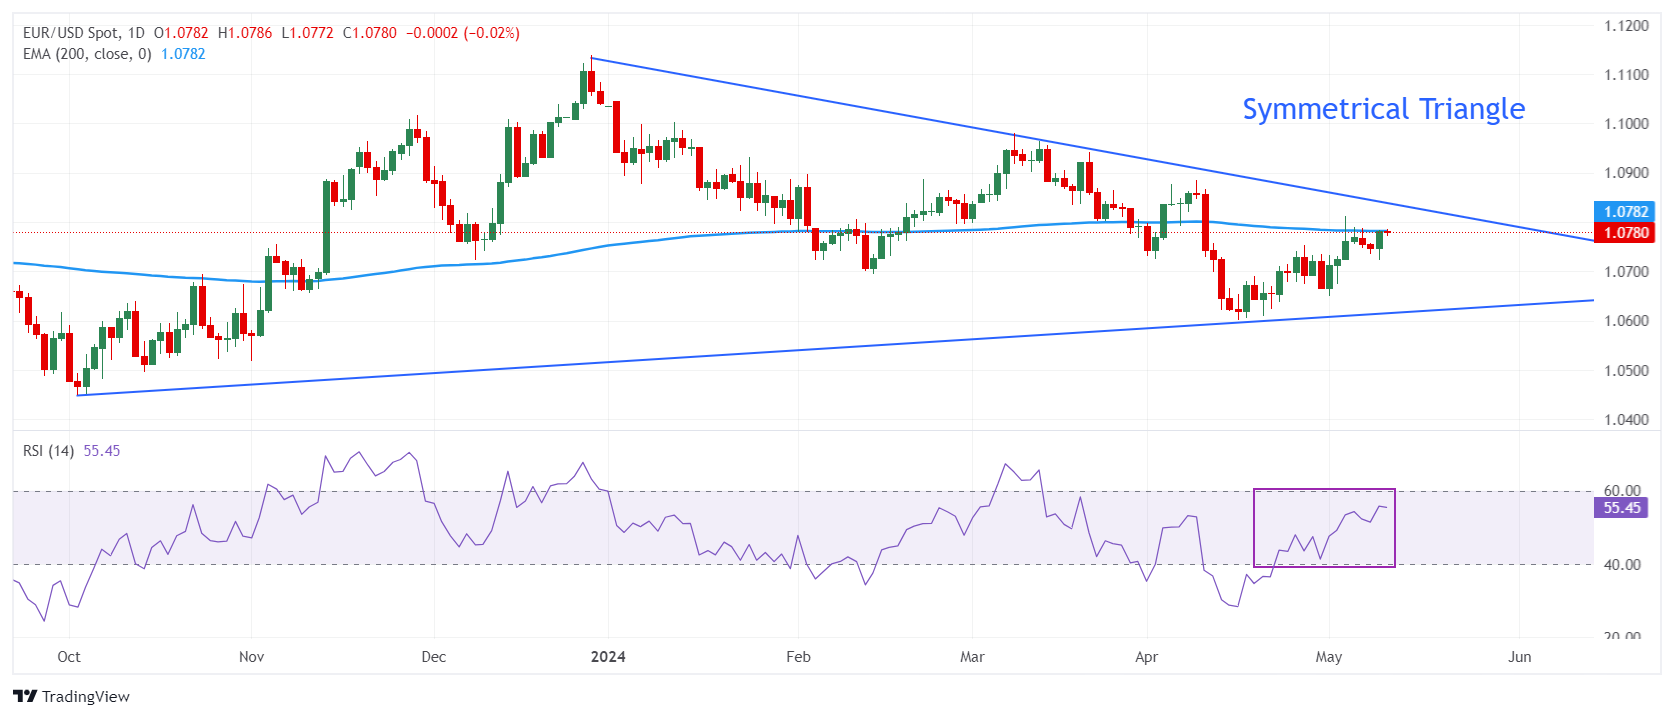
EUR/USD is steadily approaching the downward-sloping border of a Symmetrical Triangle pattern formed on a daily time frame, which is plotted from December 28 high around 1.1140. The upward-sloping border of the triangle pattern is marked from the October 3 low at 1.0448. The Symmetrical Triangle formation exhibits a sharp volatility contraction.
The major currency pair has come closer to the 200-day Exponential Moving Average (EMA), which trades around 1.0780.
The 14-period Relative Strength Index (RSI) oscillates inside the 40.00-60.00 range, suggesting indecisiveness among market participants.
Euro FAQs
The Euro is the currency for the 20 European Union countries that belong to the Eurozone. It is the second most heavily traded currency in the world behind the US Dollar. In 2022, it accounted for 31% of all foreign exchange transactions, with an average daily turnover of over $2.2 trillion a day. EUR/USD is the most heavily traded currency pair in the world, accounting for an estimated 30% off all transactions, followed by EUR/JPY (4%), EUR/GBP (3%) and EUR/AUD (2%).
The European Central Bank (ECB) in Frankfurt, Germany, is the reserve bank for the Eurozone. The ECB sets interest rates and manages monetary policy. The ECB’s primary mandate is to maintain price stability, which means either controlling inflation or stimulating growth. Its primary tool is the raising or lowering of interest rates. Relatively high interest rates – or the expectation of higher rates – will usually benefit the Euro and vice versa. The ECB Governing Council makes monetary policy decisions at meetings held eight times a year. Decisions are made by heads of the Eurozone national banks and six permanent members, including the President of the ECB, Christine Lagarde.
Eurozone inflation data, measured by the Harmonized Index of Consumer Prices (HICP), is an important econometric for the Euro. If inflation rises more than expected, especially if above the ECB’s 2% target, it obliges the ECB to raise interest rates to bring it back under control. Relatively high interest rates compared to its counterparts will usually benefit the Euro, as it makes the region more attractive as a place for global investors to park their money.
Data releases gauge the health of the economy and can impact on the Euro. Indicators such as GDP, Manufacturing and Services PMIs, employment, and consumer sentiment surveys can all influence the direction of the single currency. A strong economy is good for the Euro. Not only does it attract more foreign investment but it may encourage the ECB to put up interest rates, which will directly strengthen the Euro. Otherwise, if economic data is weak, the Euro is likely to fall. Economic data for the four largest economies in the euro area (Germany, France, Italy and Spain) are especially significant, as they account for 75% of the Eurozone’s economy.
Another significant data release for the Euro is the Trade Balance. This indicator measures the difference between what a country earns from its exports and what it spends on imports over a given period. If a country produces highly sought after exports then its currency will gain in value purely from the extra demand created from foreign buyers seeking to purchase these goods. Therefore, a positive net Trade Balance strengthens a currency and vice versa for a negative balance.
- USD/CHF could depreciate as weaker US labor data initiated the discussion over the Fed adopting a less hawkish stance.
- US Initial Jobless Claims rose to an eight-month high of 231K, surpassing estimates of 210K.
- The yield on a 10-year Swiss bond dropped to a new monthly low, making Swiss assets less attractive.
USD/CHF hovers around 0.9060 with negative sentiment during the European session on Friday following the weak US labor data released on Thursday. This has initiated a discussion of the Federal Reserve (Fed) switching toward a less hawkish stance regarding the monetary policy, undermining the US Treasury yields and weakening the US Dollar (USD).
The US Bureau of Labor Statistics (BLS) released data indicating that the number of individuals filing for unemployment benefits exceeded expectations. Initial Jobless Claims for the week ending May 3 rose to 231,000, surpassing estimates of 210,000 and showing an increase from the previous week's reading of 209,000.
The US Dollar Index (DXY), which gauges the performance of the US Dollar (USD) against six major currencies, hovers around 105.20 with 2-year and 10-year US Treasury yields standing at 4.81% and 4.44%, respectively, by the press time.
On the Swiss front, the banks are closed on Friday due to the Ascension Day holiday. The yield on the 10-year Swiss government bond dropped below the 0.7% threshold, nearing a new monthly low, in line with a global decline in bond yields. The lower yields make Swiss assets less attractive to foreign investors, leading to a decrease in demand for the Swiss Franc.
Earlier this week, the Swiss National Bank’s (SNB) foreign exchange reserves increased to CHF 720 billion in April from CHF 716 billion in the previous month. This marked the fifth consecutive rise since reaching a near seven-year low of CHF 642 billion in November. The SNB has shifted its focus away from intentionally bolstering the Swiss Franc (CHF), as the central bank has advanced its efforts against inflation.
According to the State Secretariat for Economic Affairs on Tuesday, the seasonally adjusted Swiss Unemployment Rate declined to 2.3% month-on-month in April from 2.4% in March. This marks the lowest level in four months.
Silver prices (XAG/USD) rise on Friday for a third consecutive day, according to FXStreet data. Silver trades at $28.64 per troy ounce, up 1.08% from the $28.33 it cost on Thursday and the highest level since April 22.
Silver prices have increased by 12.45% since the beginning of the year.
| Unit measure | Today Price |
|---|---|
| Silver price per troy ounce | $28.64 |
| Silver price per gram | $0.92 |
The Gold/Silver ratio, which shows the number of troy ounces of Silver needed to equal the value of one troy ounce of Gold, stood at 82.69 on Friday, down from 82.81 on Thursday.
Investors might use this ratio to determine the relative valuation of Gold and Silver. Some may consider a high ratio as an indicator that Silver is undervalued – or Gold is overvalued – and might buy Silver or sell Gold accordingly. Conversely, a low ratio might suggest that Gold is undervalued relative to Silver.
Silver FAQs
Silver is a precious metal highly traded among investors. It has been historically used as a store of value and a medium of exchange. Although less popular than Gold, traders may turn to Silver to diversify their investment portfolio, for its intrinsic value or as a potential hedge during high-inflation periods. Investors can buy physical Silver, in coins or in bars, or trade it through vehicles such as Exchange Traded Funds, which track its price on international markets.
Silver prices can move due to a wide range of factors. Geopolitical instability or fears of a deep recession can make Silver price escalate due to its safe-haven status, although to a lesser extent than Gold's. As a yieldless asset, Silver tends to rise with lower interest rates. Its moves also depend on how the US Dollar (USD) behaves as the asset is priced in dollars (XAG/USD). A strong Dollar tends to keep the price of Silver at bay, whereas a weaker Dollar is likely to propel prices up. Other factors such as investment demand, mining supply – Silver is much more abundant than Gold – and recycling rates can also affect prices.
Silver is widely used in industry, particularly in sectors such as electronics or solar energy, as it has one of the highest electric conductivity of all metals – more than Copper and Gold. A surge in demand can increase prices, while a decline tends to lower them. Dynamics in the US, Chinese and Indian economies can also contribute to price swings: for the US and particularly China, their big industrial sectors use Silver in various processes; in India, consumers’ demand for the precious metal for jewellery also plays a key role in setting prices.
Silver prices tend to follow Gold's moves. When Gold prices rise, Silver typically follows suit, as their status as safe-haven assets is similar. The Gold/Silver ratio, which shows the number of ounces of Silver needed to equal the value of one ounce of Gold, may help to determine the relative valuation between both metals. Some investors may consider a high ratio as an indicator that Silver is undervalued, or Gold is overvalued. On the contrary, a low ratio might suggest that Gold is undervalued relative to Silver.
- The Mexican Peso rallies following Thursday’s Bank of Mexico policy meeting.
- Banxico decided to keep interest rates unchanged but upwardly revised its inflation forecasts.
- USD/MXN broke below the floor of a short-term range following the news and is tipped to decline further.
The Mexican Peso (MXN) breaks higher in its most heavily traded pairs in the aftermath of the Bank of Mexico (Banxico) policy meeting on Thursday, at which the board unanimously voted to keep interest rates unchanged and substantially revised up its inflation forecasts in the light of stubbornly high price pressures.
The Banxico is now not seen cutting interest rates in the near future – a positive for its currency since higher rates attract more foreign capital inflows.
USD/MXN is exchanging hands at 16.80, EUR/MXN at 18.12 and GBP/MXN at 21.08, at the time of publication.
Mexican Peso appreciates after Banxico meeting, inflation revision
The Mexican Peso strengthened by between roughly a quarter and three quarters of a percent in its most heavily traded pairs on Thursday, after the Bank of Mexico held its May policy meeting and decided unanimously to keep the policy rate unchanged at 11.00%. This strength broadly holds up into Friday’s European trading session, with the MXN retreating only marginally from Thursday’s significant appreciation.
The Banxico revised up its inflation forecasts over the next year and a half, indicating it expected inflation to be stickier than previously anticipated. It forecast inflation to now fall more slowly to its 3.0% target, which it did not foresee reaching until Q4 of 2025.
Previously Banxico had expected inflation to fall more swiftly, reaching 3.1% in Q2 of 2025, and remaining at that level for the rest of the year (see table below). Banxico made similar revisions for core inflation.

In its accompanying statement, Banxico said, “..considering that inflationary shocks are
foreseen to take longer to dissipate, the forecasts for headline and core inflation have been revised upwards for the next six quarters. In particular, services inflation is foreseen to show more persistence, as compared to what had been previously anticipated.”
Technical Analysis: USD/MXN breaks below floor of short-term range
USD/MXN – the cost of one US Dollar in Mexican Pesos – has decisively broken below the bottom of a short-term range at 16.86 and is now expected to continue falling towards the target for the breakout.
USD/MXN 4-hour Chart
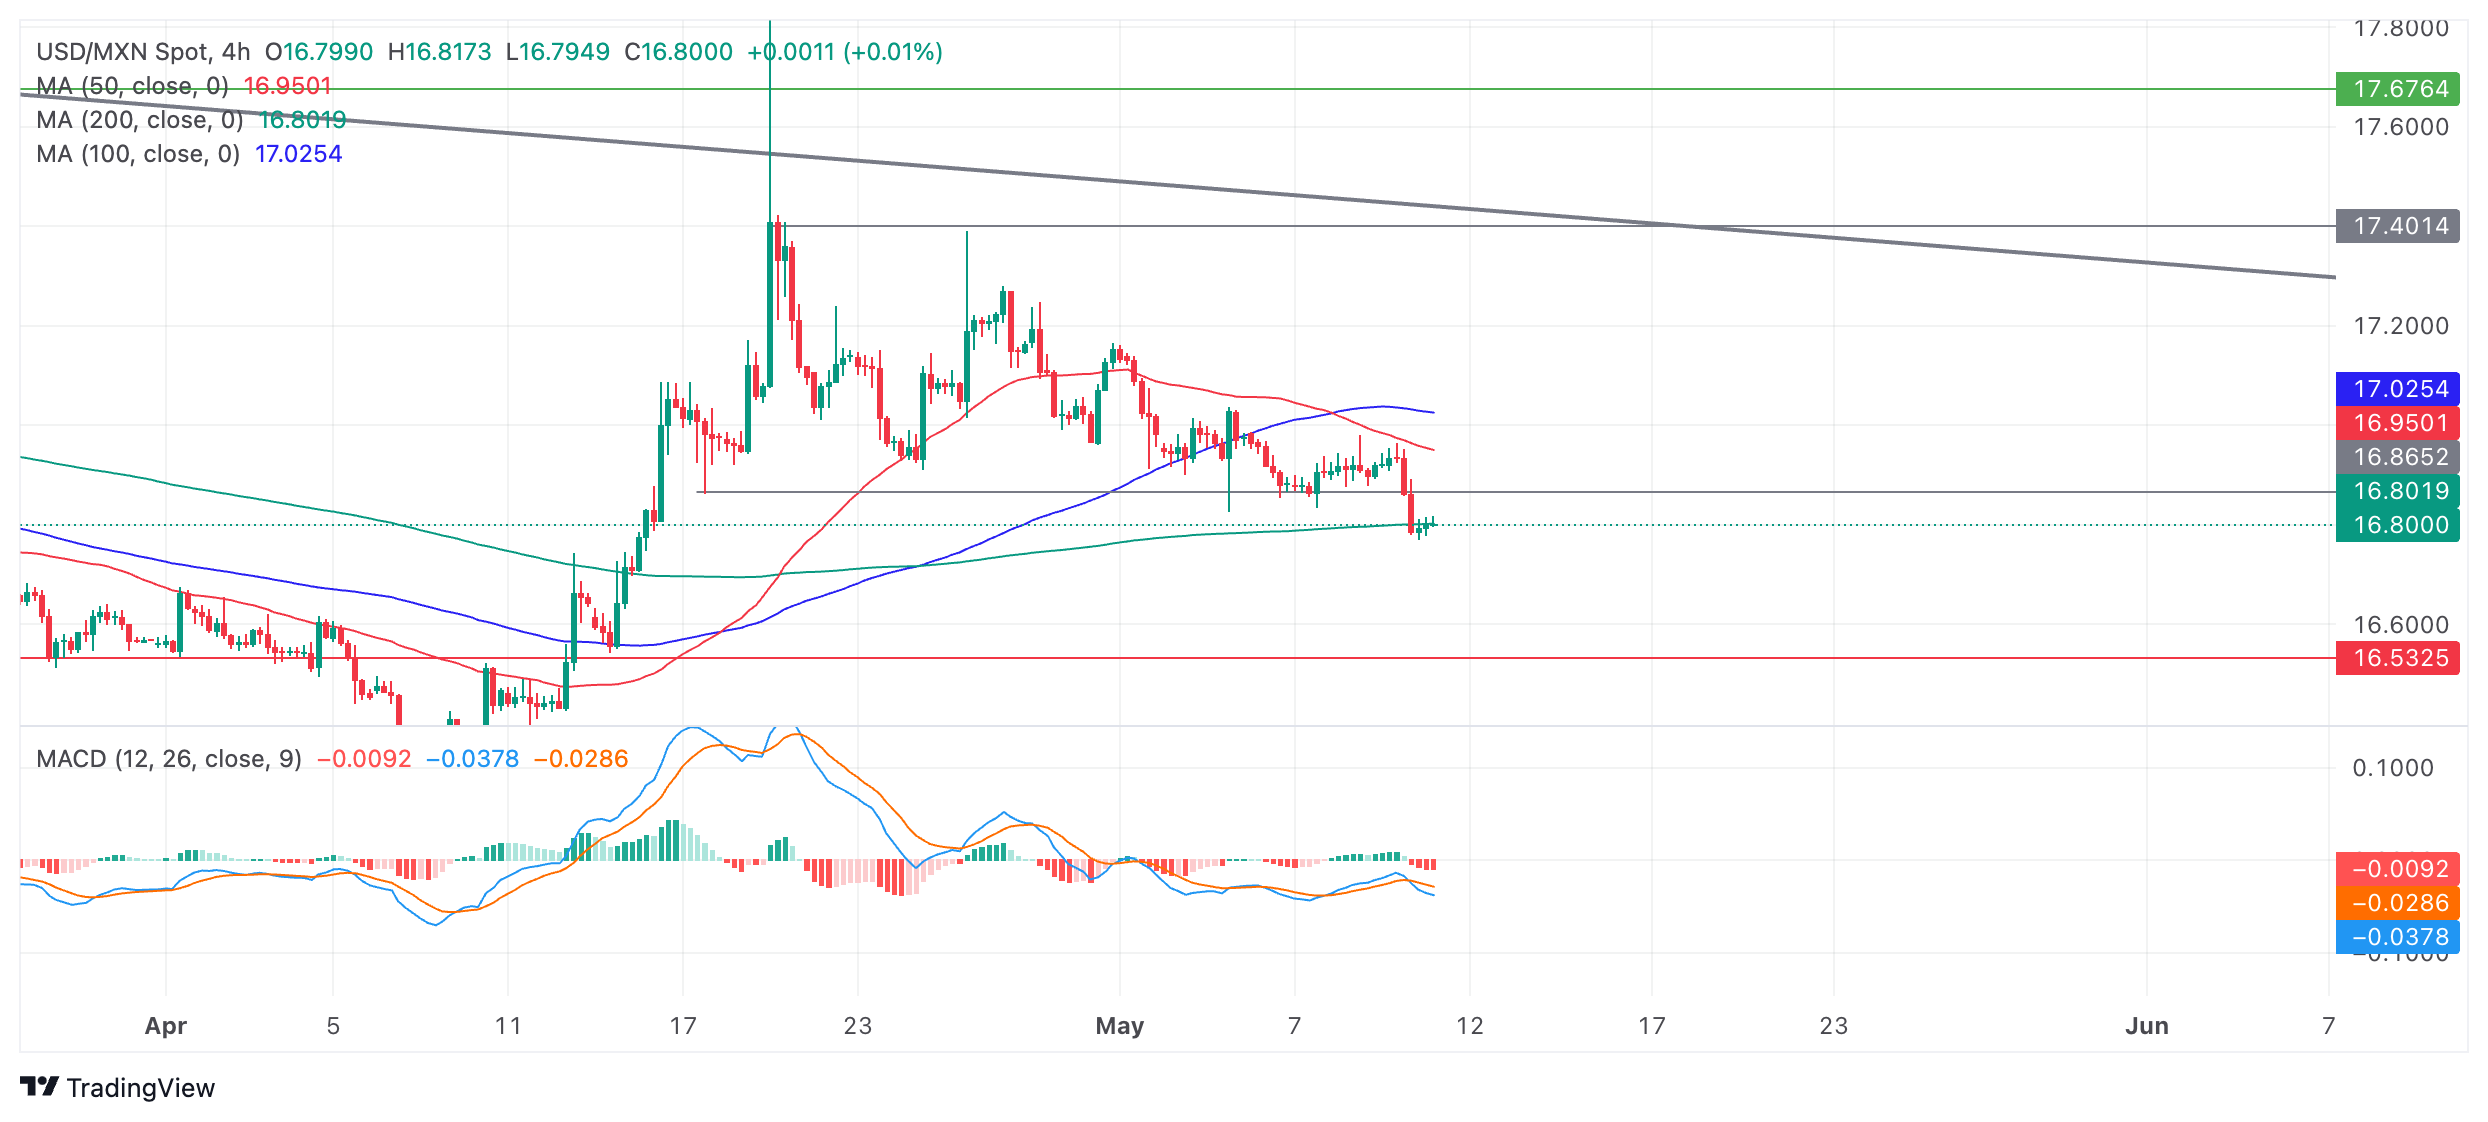
The break below the range floor generates an initial, conservative target at 16.54. This is the 0.681 Fibonacci ratio of the height of the range extrapolated lower, and it is followed by 16.34, the full height of the range extrapolated lower.
The short-term trend is now probably bearish following the breakdown from the range, which given the old adage that the “trend is your friend”, suggests the odds favor more downside.
The Moving Average Convergence Divergence (MACD) momentum indicator has crossed below its signal line, further indicating bearishness. However, the momentum accompanying the breakdown move itself was not particularly strong.
Given the medium and long-term trends are bearish, the odds further favor more downside for the pair in line with those trends.
Mexican Peso FAQs
The Mexican Peso (MXN) is the most traded currency among its Latin American peers. Its value is broadly determined by the performance of the Mexican economy, the country’s central bank’s policy, the amount of foreign investment in the country and even the levels of remittances sent by Mexicans who live abroad, particularly in the United States. Geopolitical trends can also move MXN: for example, the process of nearshoring – or the decision by some firms to relocate manufacturing capacity and supply chains closer to their home countries – is also seen as a catalyst for the Mexican currency as the country is considered a key manufacturing hub in the American continent. Another catalyst for MXN is Oil prices as Mexico is a key exporter of the commodity.
The main objective of Mexico’s central bank, also known as Banxico, is to maintain inflation at low and stable levels (at or close to its target of 3%, the midpoint in a tolerance band of between 2% and 4%). To this end, the bank sets an appropriate level of interest rates. When inflation is too high, Banxico will attempt to tame it by raising interest rates, making it more expensive for households and businesses to borrow money, thus cooling demand and the overall economy. Higher interest rates are generally positive for the Mexican Peso (MXN) as they lead to higher yields, making the country a more attractive place for investors. On the contrary, lower interest rates tend to weaken MXN.
Macroeconomic data releases are key to assess the state of the economy and can have an impact on the Mexican Peso (MXN) valuation. A strong Mexican economy, based on high economic growth, low unemployment and high confidence is good for MXN. Not only does it attract more foreign investment but it may encourage the Bank of Mexico (Banxico) to increase interest rates, particularly if this strength comes together with elevated inflation. However, if economic data is weak, MXN is likely to depreciate.
As an emerging-market currency, the Mexican Peso (MXN) tends to strive during risk-on periods, or when investors perceive that broader market risks are low and thus are eager to engage with investments that carry a higher risk. Conversely, MXN tends to weaken at times of market turbulence or economic uncertainty as investors tend to sell higher-risk assets and flee to the more-stable safe havens.
- The Pound Sterling moves higher to 1.2540 on upbeat UK Q1 GDP and March factory data.
- UK’s Q1 GDP growth suggests that the technical recession in 2023 was shallow.
- Easing US labor market conditions weigh on the US Dollar.
The Pound Sterling (GBP) extends its upside to 1.2540 in Friday’s London session as the United Kingdom Office for National Statistics (ONS) posted strong preliminary Q1 Gross Domestic Product (GDP) numbers. The agency showed that the economy expanded at a strong rate of 0.6% against expectations of 0.4% after contracting by 0.3% in the last quarter of 2023.
Strong UK GDP growth has suggested that the technical recession observed in the second half of 2023 was shallow. Annually, the UK Q1 GDP expanded by 0.2%, the same pace at which it was contracted earlier. Investors anticipated a stagnant growth on a year-over-year basis. Meanwhile, the monthly GDP growth for March was 0.4%, stronger than the consensus of 0.1% and the prior reading of 0.2%, upwardly revised from 0.1%.
Upbeat GDP growth would allow the Bank of England (BoE) to achieve a ‘soft landing’. BoE Governor Andrew Bailey commented in the press conference after the monetary policy statement that the central bank is confident that inflation will return to target in the coming months. A soft landing is a scenario in which the central bank achieves the price stability without triggering a recession.
Daily digest market movers: Pound Sterling rises on multiple tailwinds
- The Pound Sterling rises sharply to 1.2540 against the US Dollar (USD) due to upbeat preliminary Q1 GDP growth and strong factory data. Apart from the upbeat Q1 GDP data, the UK ONS showed that monthly Industrial Production rose by 0.2% in March against expectations of a decline of 0.5%. Annually, the Industrial Production grew at a higher pace of 0.5% from the estimates of 0.3%.
- Monthly Manufacturing Production surprisingly grew by 0.3% as economists anticipated a contraction of 0.4%. Annually, this indicator increased at a stronger pace of 2.3% against expectations of 1.8%.
- The situation of strong US factory data and easing inflationary pressures is favorable for the Bank of England to bring down interest rates from their current levels of 5.25%. On Thursday, the BoE kept interest rates steady for the sixth straight meeting. However, the overall message from the central bank suggested that the BoE is gradually moving to policy normalization.
- Out of the nine-members-led Monetary Policy Committee (MPC), BoE policymaker Swati Dhingra and Deputy Governor Dave Ramsden voted for a 25 basis points (bps) rate cut to 5%. Financial markets were divided over Ramsden’s vote as he supported a neutral stance on interest rates in the policy meeting in March. But his commentary in April suggested that he is confident about inflation returning to the 2% target sooner.
- Also, the commentary from Andrew Bailey on interest rates was more dovish than expected. Bailey didn't rule out speculation for BoE reducing interest rates from June. He said, "A June bank rate cut is not ruled out or planned". For the entire year, Bailey said, "It's possible we will need to cut rates more than currently priced into market rates."
- Meanwhile, the US Dollar Index (DXY) has rebounded slightly after a sharp fall to near the crucial support of 105.00. The US Dollar is still under pressure as higher-than-expected individuals claiming jobless benefits for the week ending May 3 deepened concerns over United States labor market strength. The US Department of Labor showed that Initial Jobless Claims were the highest since November 10 week, showing 231K against the consensus of 210K and the prior reading of 209K.
- Going forward, investors will shift focus to the UK’s labor market data for three months ending March and the US Consumer Price Index (CPI) data for April, which will be published next week.
Technical Analysis: Pound Sterling returns above 1.2500
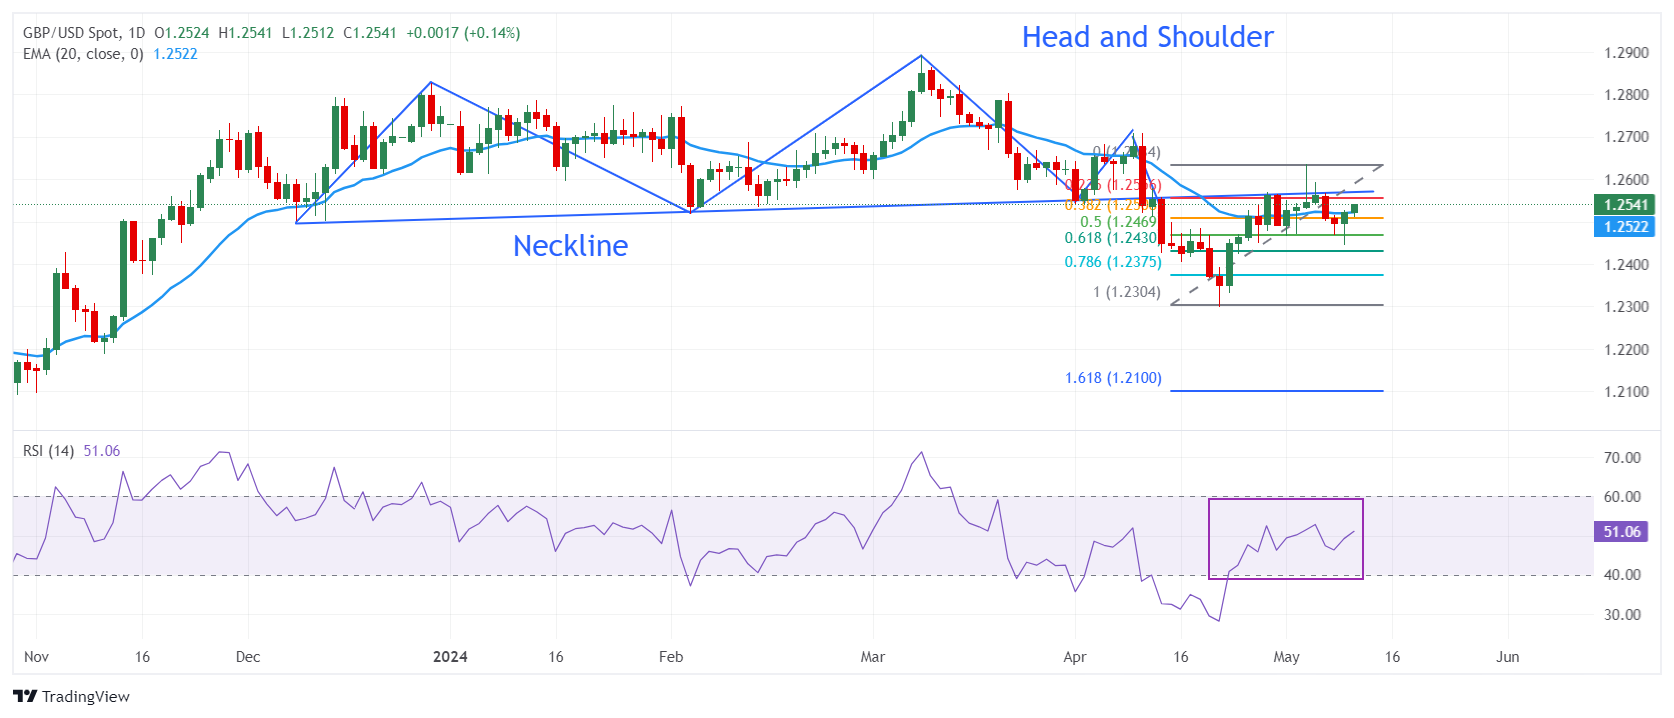
The Pound Sterling advances to 1.2540 due to multiple tailwinds. The GBP/USD pair recovered sharply from 50% Fibonacci retracement (plotted from April 22 low of 1.2299 to May 3 high of 1.2634) near 1.2470. The pair returns above the 20-day Exponential Moving Average (EMA), which trades around 1.2520.
The asset is still below the neckline of the Head and Shoulder (H&S) chart pattern on the daily timeframe. On April 12, the Cable fell sharply after breaking below the neckline of the H&S pattern plotted from December 8 low around 1.2500.
The 14-period Relative Strength Index (RSI) oscillates in the 40.00-60.00 range, suggesting indecisiveness among market participants.
Economic Indicator
Gross Domestic Product (QoQ)
The Gross Domestic Product (GDP), released by the Office for National Statistics on a monthly and quarterly basis, is a measure of the total value of all goods and services produced in the UK during a given period. The GDP is considered as the main measure of UK economic activity. The QoQ reading compares economic activity in the reference quarter to the previous quarter. Generally, a rise in this indicator is bullish for the Pound Sterling (GBP), while a low reading is seen as bearish.
Read more.Last release: Fri May 10, 2024 06:00 (Prel)
Frequency: Quarterly
Actual: 0.6%
Consensus: 0.4%
Previous: -0.3%
Source: Office for National Statistics
- EUR/GBP loses ground around 0.8595 in Friday’s early European session.
- The UK economy is officially out of recession after reports showed the GDP grew by 0.6% QOQ in Q1.
- The ECB's Guindos said the central bank won’t commit to what will happen beyond its planned June rate cut.
The EUR/GBP cross snaps the three-day winning streak near 0.8595 during the early European session on Friday. The cross are lower following the upbeat UK Gross Domestic Product (GDP) for Q1.
The UK economy has moved out of recession, National Statistics (ONS) showed Friday. The nation’s GDP grew by 0.6% QoQ in the first three months of the year, marking a return to growth after a mild recession in the second half of 2023. The figure came in stronger than the market expectation of 0.4% expansion in the first quarter. Additionally, the UK GDP expanded at an annual pace of 0.2% YoY in Q1 of 2024 from a 0.2% contraction in Q4 of 2023, above the consensus of 0% growth. In response to the upbeat data, the Pound Sterling (GBP) attracts some buyers and creates a headwind for the EUR/GBP cross.
On Thursday, the Bank of England (BoE) left its borrowing costs on hold at 5.25% for the sixth meeting in a row, opening the door to a rate cut sooner than expected. During the press conference, BoE Governor Andrew Bailey noted that “a rate cut next month was a possibility.” However, he will wait for inflation, activity, and labour market data before making the decision. The BoE Chief Economist, Huw Pill, said that the UK central bank was more confident that they would begin easing the cycle over the next few meetings, although they needed more data.
On the Euro front, European Central Bank (ECB) Vice President Luis de Guindos stated that the ECB won’t commit to what will happen beyond its planned June rate cut. “We have been very, very clear and transparent about our June decision,” said Guindos. Meanwhile, ECB Council member Robert Holzmann noted that the oil price shock can prevent the interest rate turnaround from starting in June. The less dovish tone from the ECB than the BoE is likely to cap the EUR/GBP’s downside in the near term.
- GBP/USD is gaining ground after the release of higher-than-expected UK GDP data on Friday.
- The Pound Sterling may encounter challenges on a rate cut possibility by the BoE next month.
- US Treasury yields lost ground after the release of weak US Initial Jobless Claims on Thursday.
GBP/USD edged higher to near 1.2540 during Asian hours on Friday, buoyed by the release of higher-than-expected UK Gross Domestic Product (GDP) data for the first quarter. GDP (QoQ) rose by 0.6%, reversing the previous quarter's decline of 0.3%, surpassing expectations of a 0.4% increase. Additionally, GDP (YoY) increased by 0.2%, rebounding from the previous decline of 0.2%.
However, the Pound Sterling (GBP) encountered challenges following the Bank of England’s (BoE) decision to maintain the interest rate at 5.25% on Thursday. Reuters reported that BoE Governor Andrew Bailey mentioned during the post-decision press conference that "a rate cut next month was a possibility," but he intends to wait for inflation, activity, and labor market data before deciding. This has raised the prospect of future rate cuts, putting pressure on the British Pound and weakening the GBP/USD pair.
Subsequently, the US Bureau of Labor Statistics (BLS) released data indicating that the number of individuals filing for unemployment benefits surpassed expectations. Initial Jobless Claims for the week ending May 3 rose to 231,000, exceeding estimates of 210,000 and showing an increase from the previous week's reading of 209,000. This suggests a potential shift toward a less hawkish policy outlook by the Federal Reserve (Fed), resulting in pressure on US Treasury yields and undermining the US Dollar (USD).
On Friday, the preliminary Michigan Consumer Sentiment Index is forecasted to show a slight decrease in May. This index is a survey that evaluates sentiment among US consumers, encompassing three primary areas: personal finances, business conditions, and buying conditions.
The UK economy expanded 0.6% QoQ in the first quarter (Q1) of 2024 from a 0.3% contraction in the previous reading, the preliminary estimate released by National Statistics (ONS) showed Friday. The market consensus was for an expansion of 0.4% in the reported period.
The UK GDP grew at an annual pace of 0.2% YoY in Q1 of 2024 versus -0.2% in Q4 of 2023. The figure beat the market’s expectations for a 0% growth.
Market reaction to the UK GDP data
The Pound Sterling attracts some buyers following the stronger UK GDP reports. At the press time, GBP/USD is trading 0.11% higher on the day at 1.2537.
GDP FAQs
A country’s Gross Domestic Product (GDP) measures the rate of growth of its economy over a given period of time, usually a quarter. The most reliable figures are those that compare GDP to the previous quarter e.g Q2 of 2023 vs Q1 of 2023, or to the same period in the previous year, e.g Q2 of 2023 vs Q2 of 2022. Annualized quarterly GDP figures extrapolate the growth rate of the quarter as if it were constant for the rest of the year. These can be misleading, however, if temporary shocks impact growth in one quarter but are unlikely to last all year – such as happened in the first quarter of 2020 at the outbreak of the covid pandemic, when growth plummeted.
A higher GDP result is generally positive for a nation’s currency as it reflects a growing economy, which is more likely to produce goods and services that can be exported, as well as attracting higher foreign investment. By the same token, when GDP falls it is usually negative for the currency. When an economy grows people tend to spend more, which leads to inflation. The country’s central bank then has to put up interest rates to combat the inflation with the side effect of attracting more capital inflows from global investors, thus helping the local currency appreciate.
When an economy grows and GDP is rising, people tend to spend more which leads to inflation. The country’s central bank then has to put up interest rates to combat the inflation. Higher interest rates are negative for Gold because they increase the opportunity-cost of holding Gold versus placing the money in a cash deposit account. Therefore, a higher GDP growth rate is usually a bearish factor for Gold price.
- Silver price edged higher after the weak labor data initiated the dovish sentiment surrounding the Fed.
- US Initial Jobless Claims surged to over 8-month highs to 231K, surpassing estimates of 210K.
- Silver cheers safe-haven demand amid a stalemate in ceasefire negotiations in the Middle East.
Silver price extends its gains for the third consecutive session, trading around $28.50 per troy ounce during the Asian session on Friday. The increase in the value of the grey metal can be attributed to the latest employment data from the United States (US), which supports a more accommodative monetary stance by the Federal Reserve (Fed).
Unexpectedly, US Initial Jobless Claims surged to over 8-month highs, signaling a weakening labor market and potentially providing the Fed with room to commence its easing cycle sooner rather than later. Lower interest rates typically enhance the attractiveness of non-yielding assets such as Silver.
The US Bureau of Labor Statistics (BLS) released data indicating that the number of individuals filing for unemployment benefits exceeded expectations. Initial Jobless Claims for the week ending May 3 rose to 231K, surpassing estimates of 210K and showing an increase from the previous week's reading of 209K. Furthermore, traders will closely monitor next week's CPI and PPI releases for further insights into the Fed's monetary stance, given reservations expressed by some Fed officials about easing.
On the geopolitical front, Silver experienced heightened safe-haven demand amidst a deadlock in ceasefire negotiations in the Middle East. Israeli forces mobilized tanks and engaged in gunfire near populated areas of Rafah on Thursday. This escalation followed President Joe Biden's statement that the US would withhold weapons from Israel if a substantial invasion of the southern Gaza city were initiated, as per Reuters report.
Here is what you need to know on Friday, May 10:
The US Dollar (USD) recovers modestly during the Asian session on Friday. However, the near-term appeal is still uncertain as higher-than-projected Initial Jobless Claims (IJC) for the week ending May 3 indicated that the United States (US) labor market is struggling to bear the burden of Federal Reserve’s (Fed) restrictive policy framework.
The US Dollar Index (DXY), which tracks the Greenback’s value against six major currencies, rebounds slightly after tumbling to 105.00. The next move in the US Dollar will be guided by April’s US Inflation data, which will be published on Wednesday. The inflation data will provide meaningful cues about whether the Fed will start reducing interest rates from September. Till then, interest rate guidance from Fed speakers will drive movement in the US Dollar.
US Dollar PRICE Today
The table below shows the percentage change of US Dollar (USD) against listed major currencies today. US Dollar was the strongest against the British Pound.
| USD | EUR | GBP | JPY | CAD | AUD | NZD | CHF | |
|---|---|---|---|---|---|---|---|---|
| USD | -0.06% | -0.03% | -0.11% | -0.05% | -0.16% | -0.18% | -0.06% | |
| EUR | 0.06% | 0.03% | -0.05% | -0.00% | -0.10% | -0.11% | -0.01% | |
| GBP | 0.03% | -0.03% | -0.08% | -0.03% | -0.12% | -0.12% | -0.04% | |
| JPY | 0.11% | 0.05% | 0.08% | -0.03% | -0.10% | -0.07% | 0.00% | |
| CAD | 0.05% | 0.00% | 0.03% | 0.03% | -0.11% | -0.10% | -0.01% | |
| AUD | 0.16% | 0.10% | 0.12% | 0.10% | 0.11% | 0.00% | 0.05% | |
| NZD | 0.18% | 0.11% | 0.12% | 0.07% | 0.10% | -0.01% | 0.08% | |
| CHF | 0.06% | 0.01% | 0.04% | -0.01% | 0.01% | -0.05% | -0.08% |
The heat map shows percentage changes of major currencies against each other. The base currency is picked from the left column, while the quote currency is picked from the top row. For example, if you pick the US Dollar from the left column and move along the horizontal line to the Japanese Yen, the percentage change displayed in the box will represent USD (base)/JPY (quote).
In the Asian trading hours, USD/JPY rose to 155.77 even though Japan’s annual Overall Household Spending declined at a slower pace of 1.2% against a contraction of 2.4% expected by investors. Though the decline in the households’ spending was slower than expected, weak consumer spending is unfavorable for the Bank of Japan’s (BoJ) intention to hike interest rates further.
EUR/USD holds gains near two-day high of 1.0780 as US Dollar comes under pressure. Traders have already priced in three rate cuts by the European Central Bank (ECB) this year.
GBP/USD holds’ Thursday’s gains slightly above 1.2500. The Cable covered BoE-led losses after a sharp fall in the US Dollar. The BoE kept borrowing rates steady at 5.25% as expected but its communication on the interest rate outlook was dovish. In the press conference, BoE Governor Andrew Bailey said the central bank could deliver more rate cuts than what market participants had anticipated. Out of the nine-members-led Monetary Policy Committee (MPC) team, BoE policymaker Swati Dhingra and Deputy Governor Dave Ramsden voted for a rate cut by 25 basis points (bps) to 5%.
Gold price looks set to close the week on a strong note. Spot prices rise to $2,355 amid firm speculation that the Fed will start reducing interest rates from the September meeting.
Gold price gains momentum despite hawkish Fedspeak
AUD/USD edges down during the Asian session but holds strength above the psychological support of 0.6000. The Aussie will be driven by China’s Consumer Price Index (CPI) data for April, which will be published over the weekend.
Australian Dollar hovers above a psychological level, US Consumer Sentiment awaited
(This story was corrected on May 10 at 06:20 GMT to say that USD/JPY rose to 155.77, not 155.66).
Economic Indicator
Consumer Price Index (YoY)
Inflationary or deflationary tendencies are measured by periodically summing the prices of a basket of representative goods and services and presenting the data as The Consumer Price Index (CPI). CPI data is compiled on a monthly basis and released by the US Department of Labor Statistics. The YoY reading compares the prices of goods in the reference month to the same month a year earlier.The CPI is a key indicator to measure inflation and changes in purchasing trends. Generally speaking, a high reading is seen as bullish for the US Dollar (USD), while a low reading is seen as bearish.
Read more.Next release: Wed May 15, 2024 12:30
Frequency: Monthly
Consensus: -
Previous: 3.5%
Source: US Bureau of Labor Statistics
The US Federal Reserve has a dual mandate of maintaining price stability and maximum employment. According to such mandate, inflation should be at around 2% YoY and has become the weakest pillar of the central bank’s directive ever since the world suffered a pandemic, which extends to these days. Price pressures keep rising amid supply-chain issues and bottlenecks, with the Consumer Price Index (CPI) hanging at multi-decade highs. The Fed has already taken measures to tame inflation and is expected to maintain an aggressive stance in the foreseeable future.
- EUR/USD weakens to 1.0775 on the firmer USD on Friday.
- The pair keeps the bearish vibe below the key EMA on the daily timeframe.
- The key resistance level will emerge in the 1.0790–1.0800 zone; the first downside target is located at 1.0724.
The EUR/USD pair trades on a softer note near 1.0775 during the early European hours on Friday. The downtick of the major pair is supported by the renewed US Dollar (USD) demand amid hawkish comments from Federal Reserve (Fed) officials. Later on Friday, the US Michigan Consumer Sentiment Index for May will be released, which is projected to drop from 77.2 in April to 76.0 in May.
According to the daily chart, EUR/USD has traded within a descending trend channel since mid-December 2023. The bearish outlook of the major pair remains intact, as it is below the key 100-period Exponential Moving Average (EMA). However, the 14-day Relative Strength Index (RSI) stands in bullish territory around 55, indicating that further upside cannot be ruled out.
The key resistance level for EUR/USD will emerge at the 1.0790–1.0800 region, portraying the 100-day EMA and the upper boundary of the descending trend channel. The next upside barrier is seen near a high of April 9 at 1.0885. The additional upside filter to watch is a high of March 21 at 1.0943, followed by March 8 at 1.0981, and finally the 1.1000 psychological level.
On the downside, the first downside target is located near a low of May 9 at 1.0724. Extended losses for EUR/USD expose the pair to a low of May 2 at 1.0650, en route to a low of April 16 at 1.0600. A break below this level will see a drop to the lower limit of the descending trend channel at 1.0500.
EUR/USD daily chart
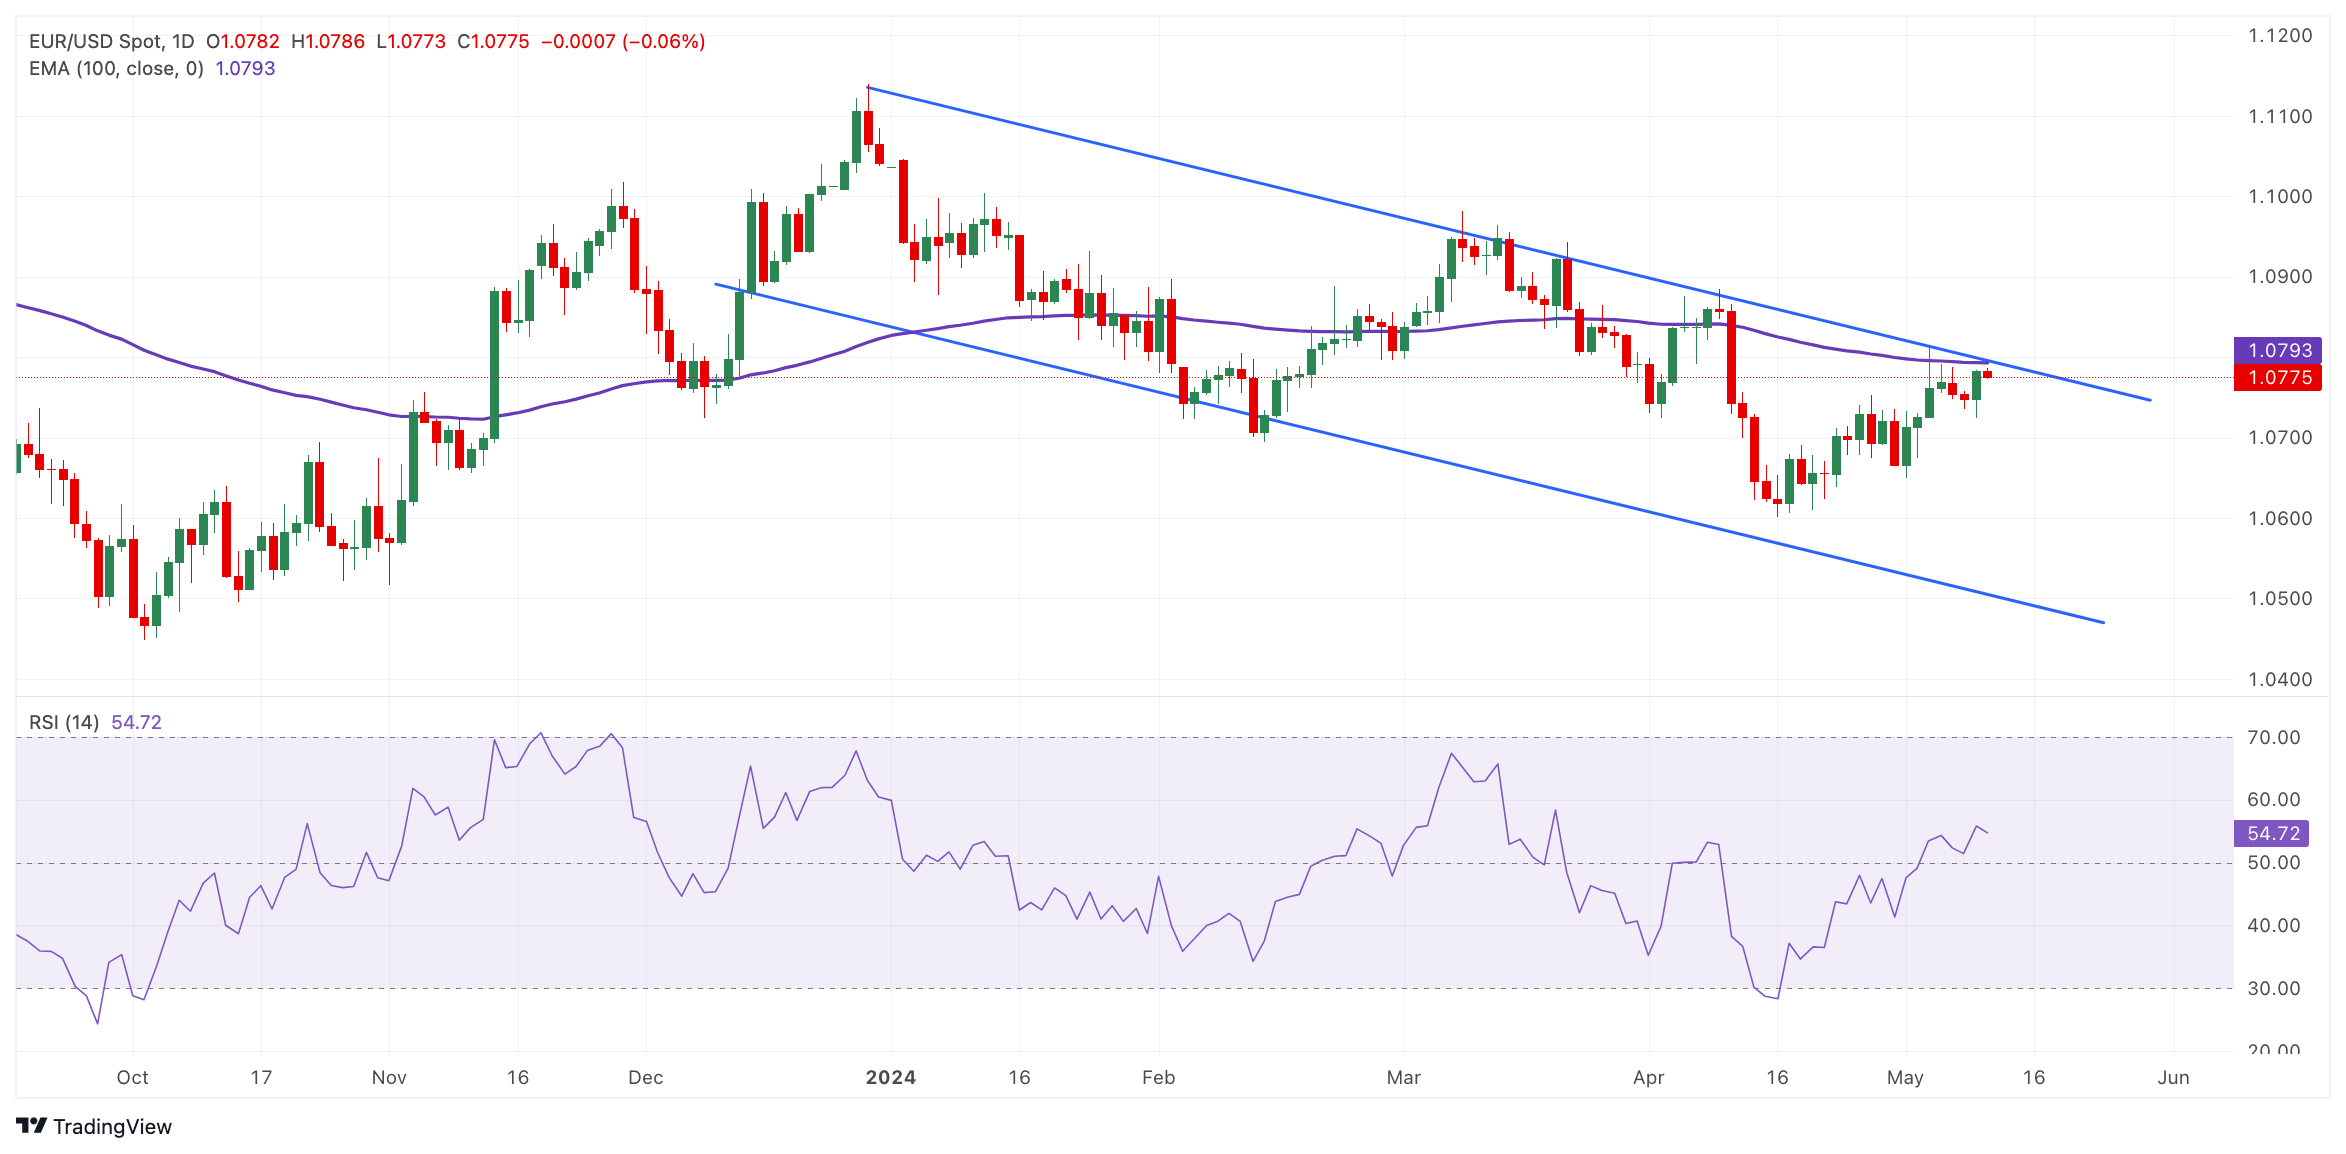
- USD/CAD gains ground due to the expectations of the Fed keeping higher rates for longer.
- US Treasury yields lost ground after the release of weak US Initial Jobless Claims on Thursday.
- BoC Governor Tiff Macklem highlighted the resilience of the financial system following the release of the Financial Stability Report.
The USD/CAD pair edges higher to near 1.3690 during the Asian trading hours on Friday. The upward correction in the US Dollar (USD) supported the pair, which could be attributed to the hawkish sentiment surrounding the Federal Reserve (Fed) to keep higher interest rates for an extended period.
However, the Greenback faced a challenge due to the lower US Treasury yields, which could be attributed to the weak US Initial Jobless Claims released on Thursday. The US Bureau of Labor Statistics (BLS) released data indicating that the number of individuals filing for unemployment benefits exceeded expectations. Initial Jobless Claims for the week ending May 3 rose to 231,000, surpassing estimates of 210,000 and showing an increase from the previous week's reading of 209,000.
Furthermore, the preliminary Michigan Consumer Sentiment Index for May is due on Friday, with forecasts indicating a slight decrease. This index is a survey that evaluates sentiment among US consumers, encompassing three primary areas: personal finances, business conditions, and buying conditions.
On the Canadian side, the Bank of Canada (BoC) released its Financial System Review (FSR) on Thursday. BoC Governor Tiff Macklem emphasized that Canada's financial system remains resilient. However, Macklem cautioned about potential volatility in global markets as expectations evolve regarding the extent and timing of rate cuts. He also noted that financial institutions still have adjustments to make to higher rates and potential shocks, which pose risks to financial stability.
BoC Deputy Governor Carolyn Rogers additionally observed that while the number of small businesses reporting insolvencies has risen, the Bank of Canada (BoC) does not perceive this as having broader implications for the Canadian economy.
The improved crude Oil prices may provide support for the Canadian Dollar (CAD) as Canada is the largest Oil exporter to the United States (US), limiting the advance of the USD/CAD pair. Western Texas Intermediate (WTI) Oil price trades around $79.40 on Friday. The black Gold edges higher amid optimism about rising demand in China and the US, the world's two biggest crude-consuming nations.
- Gold price edges higher for the second consecutive day on Friday.
- Weak employment data bolstered the speculation that the weakening economy would force the Fed to cut rates.
- The hawkish Fed talks could create bearish headwinds for gold.
Gold price (XAU/USD) gains momentum on Friday despite the modest rebound in US Dollar (USD). The yellow metal edges higher as many economists expect a weakening labor market could prompt the Federal Reserve (Fed) to cut interest rates sooner than currently expected to stimulate economic growth. Furthermore, the renewed geopolitical concerns are likely to be a positive factor for gold’s value on the market.
However, the hawkish US Fed talks on the interest rate, and the stronger US dollar (USD) might weigh on gold prices. Gold traders will keep an eye on the first reading of the US Michigan Consumer Sentiment Index for May, along with the speeches from the Fed’s Bowman, Goolsbee, and Barr. Next week, the US Consumer Price Index (CPI) report will be in the spotlight.
Daily Digest Market Movers: Gold price holds positive ground amid Fed’s hawkish comments
- San Francisco Fed President Mary Daly said that uncertainty over the inflation outlook makes policy projections difficult until the Fed gets more clarity.
- The US Initial Jobless Claims for the week ended May 4 rose to 231K from the previous week of 209K, higher than the market consensus of 210K. This figure registered the highest level since August 2023, signaling the labor market was cooling.
- Coupled with April's downbeat US Nonfarm Payrolls (NFP) of 175,000 new jobs. These reports paint a picture of a cooling US economy.
- Israeli forces massed tanks and opened fire close to built-up areas of Rafah on Thursday after President Joe Biden said the US would withhold weapons from Israel if its forces mounted a major invasion of the southern Gaza city.
- The rise in global gold demand was mainly driven by strong over-the-counter market investment, persistent central bank purchasing, and growing demand from Asian buyers, according to the WGC’s report.
- The preliminary US University of Michigan Consumer Sentiment Index is expected to drop in May from 77.2 in April to 76.0.
Technical Analysis: Gold price’s uptrend remains intact
The gold price trades on a positive note on the day. The yellow metal keeps the bullish vibe unchanged as it holds above the key 100-day Exponential Moving Average (EMA) on the daily timeframe.
In the near term, XAU/USD breaks above a descending trend channel that formed in mid-April, with the 14-day Relative Strength Index (RSI) standing in bullish territory around 67.50, which supports the buyers for the time being.
If gold bulls step in at the $2,400 psychological mark, then yellow metal could see a rally to an all-time high near $2,432, en route to the $2,500 figure. On the flip side, the first downside target will emerge at the resistance-turned-support level at $2,340. Extended losses for gold price expose XAU/USD to a potential support level at the $2,300 round mark, followed by a low of May 2 at $2,281.
US Dollar price today
The table below shows the percentage change of US Dollar (USD) against listed major currencies today. US Dollar was the weakest against the Canadian Dollar.
| USD | EUR | GBP | CAD | AUD | JPY | NZD | CHF | |
| USD | 0.08% | 0.06% | 0.06% | 0.24% | 0.22% | 0.31% | 0.10% | |
| EUR | -0.06% | 0.00% | 0.02% | 0.15% | 0.18% | 0.25% | 0.04% | |
| GBP | -0.05% | 0.01% | 0.01% | 0.16% | 0.18% | 0.24% | 0.04% | |
| CAD | -0.06% | 0.00% | 0.00% | 0.16% | 0.18% | 0.25% | 0.04% | |
| AUD | -0.24% | -0.16% | -0.16% | -0.15% | 0.01% | 0.10% | -0.12% | |
| JPY | -0.23% | -0.18% | -0.20% | -0.17% | -0.02% | 0.06% | -0.14% | |
| NZD | -0.30% | -0.25% | -0.24% | -0.23% | -0.09% | -0.08% | -0.19% | |
| CHF | -0.10% | -0.04% | -0.05% | -0.04% | 0.11% | 0.13% | 0.20% |
The heat map shows percentage changes of major currencies against each other. The base currency is picked from the left column, while the quote currency is picked from the top row. For example, if you pick the Euro from the left column and move along the horizontal line to the Japanese Yen, the percentage change displayed in the box will represent EUR (base)/JPY (quote).
Gold FAQs
Gold has played a key role in human’s history as it has been widely used as a store of value and medium of exchange. Currently, apart from its shine and usage for jewelry, the precious metal is widely seen as a safe-haven asset, meaning that it is considered a good investment during turbulent times. Gold is also widely seen as a hedge against inflation and against depreciating currencies as it doesn’t rely on any specific issuer or government.
Central banks are the biggest Gold holders. In their aim to support their currencies in turbulent times, central banks tend to diversify their reserves and buy Gold to improve the perceived strength of the economy and the currency. High Gold reserves can be a source of trust for a country’s solvency. Central banks added 1,136 tonnes of Gold worth around $70 billion to their reserves in 2022, according to data from the World Gold Council. This is the highest yearly purchase since records began. Central banks from emerging economies such as China, India and Turkey are quickly increasing their Gold reserves.
Gold has an inverse correlation with the US Dollar and US Treasuries, which are both major reserve and safe-haven assets. When the Dollar depreciates, Gold tends to rise, enabling investors and central banks to diversify their assets in turbulent times. Gold is also inversely correlated with risk assets. A rally in the stock market tends to weaken Gold price, while sell-offs in riskier markets tend to favor the precious metal.
The price can move due to a wide range of factors. Geopolitical instability or fears of a deep recession can quickly make Gold price escalate due to its safe-haven status. As a yield-less asset, Gold tends to rise with lower interest rates, while higher cost of money usually weighs down on the yellow metal. Still, most moves depend on how the US Dollar (USD) behaves as the asset is priced in dollars (XAU/USD). A strong Dollar tends to keep the price of Gold controlled, whereas a weaker Dollar is likely to push Gold prices up.
- NZD/USD retreated after the data showed the manufacturing sector had been in contraction for 14 consecutive months.
- The Business NZ Performance of Manufacturing Index improved to 48.9 from March's 46.8, yet remained below February's level of 49.1.
- The lower US Treasury yields may put pressure on the US Dollar.
NZD/USD has halted its two days of gains, trading around 0.6020 during the Asian session on Friday. The New Zealand Dollar (NZD) received pressure after the release of the Business NZ Performance of Manufacturing Index (PMI), gauging business activity in New Zealand’s manufacturing sector.
However, the data indicated an improvement in April, with the seasonally-adjusted figure reaching 48.9 compared to March's 46.8, although still below February's 49.1. Despite the manufacturing sector being in contraction for 14 consecutive months, there are signs of improvement.
On Saturday, Chinese Consumer Price Index (CPI) data is anticipated to show a 0.1% increase for April, which could influence New Zealand's market due to the close trading ties between the two nations.
The US Dollar Index (DXY), which gauges the performance of the US Dollar (USD) against six major currencies, attempts to rebound due to the sentiment of the Federal Reserve (Fed) maintaining higher interest rates for longer. However, the Greenback faced a challenge due to the lower US Treasury yields, which could be attributed to the weak US Initial Jobless Claims released on Thursday.
The US Bureau of Labor Statistics (BLS) released data indicating that the number of individuals filing for unemployment benefits exceeded expectations. Initial Jobless Claims for the week ending May 3 rose to 231,000, surpassing estimates of 210,000 and showing an increase from the previous week's reading of 209,000.
Ahead of the day, the preliminary Michigan Consumer Sentiment Index for May is due, with expectations for a slight decrease. This index is a survey that measures sentiment among US consumers, covering three main areas: personal finances, business conditions, and buying conditions.
| Raw materials | Closed | Change, % |
|---|---|---|
| Silver | 28.317 | 3.59 |
| Gold | 2345.26 | 1.52 |
| Palladium | 968.65 | 1.83 |
- The Australian Dollar retreated due to the improved US Dollar on Friday.
- The Australian Dollar is facing pressure due to the less hawkish stance of the RBA on monetary policy.
- The US Dollar rebounded due to the hawkish Fed to maintain higher interest rates for a longer period.
The Australian Dollar (AUD) is retracing its recent gains on Friday, following a rally on Thursday. The rally was propelled by a decline in the US Dollar (USD) as weak US Initial Jobless Claims indicated a more dovish outlook for the Federal Reserve (Fed). This helped offset pressure on the Aussie Dollar resulting from the Reserve Bank of Australia (RBA)'s less hawkish stance, especially in light of the higher-than-expected inflation data.
The Australian inflation rate dropped to 3.6% in the first quarter, from 4.1% in the previous quarter, marking the fifth consecutive quarter of slowing. However, it exceeded forecasts of 3.4%. Additionally, the Monthly Consumer Price Index (YoY) for March surged to 3.5%, surpassing the expected reading of 3.4%. The Reserve Bank of Australia (RBA) acknowledged that recent progress in controlling inflation has stalled and maintained its stance of keeping options open.
The US Dollar Index (DXY), which gauges the performance of the US Dollar (USD) against six major currencies, attempts to rebound due to the sentiment of the Federal Reserve (Fed) maintaining higher interest rates for longer. However, the decline in the US Treasury yields could contribute to pressure on the Greenback, supporting the AUD/USD pair.
In the United States (US), the preliminary Michigan Consumer Sentiment Index for May is set to be released on Friday, with expectations for a slight decrease. This index is a survey that measures sentiment among US consumers, covering three main areas: personal finances, business conditions, and buying conditions. Additionally, Chinese Consumer Price Index (CPI) data is expected on Saturday, which could have an impact on the Australian Dollar (AUD) as Australia and China share close trading ties.
Daily Digest Market Movers: Australian Dollar retreats due to less hawkish RBA
- The Commonwealth Bank of Australia (CBA) has revised down its forecasts for the Australian Dollar at the end of 2024 is 0.69, down from 0.71 previously. CBA cites factors such as the interest rate gap and elevated US Treasury bond yields, which are bolstering the US Dollar. The Federal Reserve's cautious stance on high inflation and its reluctance to implement rate cuts further support the US Dollar, as reported on forexlive.com.
- The US Bureau of Labor Statistics (BLS) reported that the number of individuals filing for unemployment benefits surpassed expectations. Initial Jobless Claims for the week ending May 3 increased to 231,000, exceeding estimates of 210,000 and marking a rise from the previous week's figure of 209,000.
- Chinese Imports (YoY) surged by 8.4% in April, surpassing forecasts of 5.4%. Exports grew by 1.5%, higher than the anticipated 1.0% gain. These latest figures brought a positive surprise amidst concerns of potential additional tariffs on Chinese goods by the United States (US). However, Trade Balance USD increased to $72.35 billion from March’s reading of $58.55 billion, slightly below the expected $76.7 billion.
- Australian Retail Sales (QoQ), measuring the volume of goods sold by retailers in Australia, declined by 0.4% in the first quarter of 2024, swinging from the 0.4% growth in the fourth quarter of 2023.
- RBA Governor Michele Bullock stressed the importance of staying alert to inflation risks. Bullock believes current interest rates are appropriately positioned to guide inflation back towards its target range of 2-3% by the second half of 2025 and to the midpoint by 2026.
- Societe Generale has released a note regarding the Reserve Bank of Australia, emphasizing their view that the RBA's optimism regarding economic growth is misplaced. The institution anticipates a downturn in economic growth in Australia, with the potential for surprises on the downside. They attribute this forecast partly to the prevalent effects of RBA rate hikes filtering into the economy.
- According to a Reuters report, Federal Reserve Bank of Boston President Susan Collins said on Wednesday that a need for a period of moderation in the US economy to achieve the central bank's 2% inflation target. Collins highlighted that demand will need to ease to reach this goal. She expressed confidence that Fed policy is well-aligned with the current economic outlook.
- On Tuesday, Minneapolis Fed President Neel Kashkari said that the prevailing expectation is for rates to stay steady for a considerable duration. Although the likelihood of rate hikes is minimal, it's not entirely ruled out.
Technical Analysis: Australian Dollar hovers above the psychological level of 0.6600
The Australian Dollar trades around 0.6610 on Friday. The AUD/USD pair is consolidating within a symmetrical triangle pattern, with the 14-day Relative Strength Index (RSI) indicating a bullish bias by hovering above the 50-level.
The AUD/USD pair could test the upper boundary around the swing area at the level of 0.6650. A break above this level may lead the pair to retest March’s high of 0.6667, with further upside potential toward the psychological level of 0.6700.
On the downside, immediate support for the AUD/USD pair is expected at the psychological level of 0.6600, followed by the 14-day Exponential Moving Average (EMA) around 0.6566. If the pair breaches below the EMA, it could face additional selling pressure, potentially targeting the region around the lower boundary of the symmetrical triangle near the level of 0.6465.
AUD/USD: Daily Chart
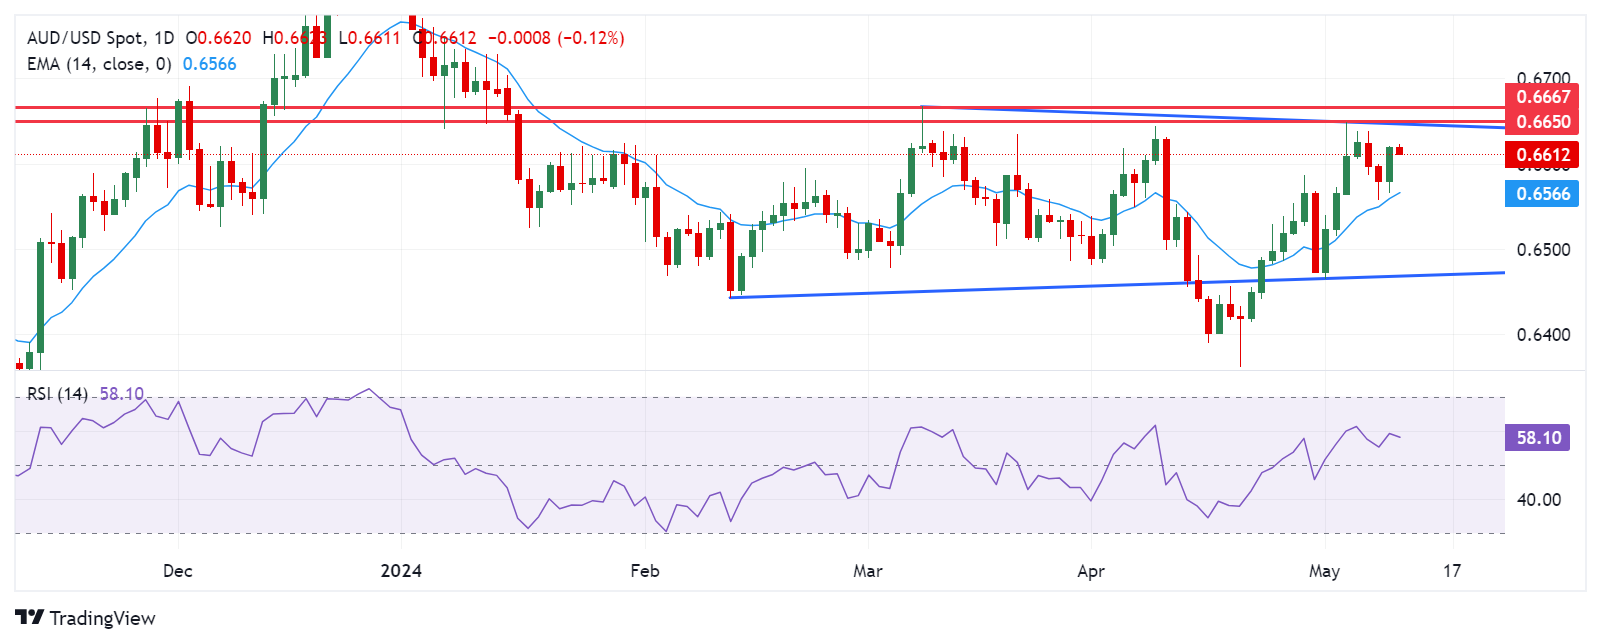
Australian Dollar price today
The table below shows the percentage change of the Australian Dollar (AUD) against listed major currencies today. The Australian Dollar was the weakest against the US Dollar.
| USD | EUR | GBP | CAD | AUD | JPY | NZD | CHF | |
| USD | 0.06% | 0.07% | 0.04% | 0.17% | 0.20% | 0.21% | 0.09% | |
| EUR | -0.05% | 0.02% | 0.01% | 0.11% | 0.15% | 0.17% | 0.03% | |
| GBP | -0.07% | -0.02% | -0.03% | 0.08% | 0.13% | 0.13% | 0.01% | |
| CAD | -0.05% | 0.00% | 0.02% | 0.11% | 0.15% | 0.18% | 0.03% | |
| AUD | -0.19% | -0.11% | -0.08% | -0.11% | 0.05% | 0.04% | -0.08% | |
| JPY | -0.20% | -0.16% | -0.15% | -0.15% | -0.06% | 0.00% | -0.12% | |
| NZD | -0.21% | -0.17% | -0.13% | -0.16% | -0.06% | -0.01% | -0.11% | |
| CHF | -0.08% | -0.04% | -0.01% | -0.04% | 0.07% | 0.11% | 0.11% |
The heat map shows percentage changes of major currencies against each other. The base currency is picked from the left column, while the quote currency is picked from the top row. For example, if you pick the Euro from the left column and move along the horizontal line to the Japanese Yen, the percentage change displayed in the box will represent EUR (base)/JPY (quote).
Australian Dollar FAQs
One of the most significant factors for the Australian Dollar (AUD) is the level of interest rates set by the Reserve Bank of Australia (RBA). Because Australia is a resource-rich country another key driver is the price of its biggest export, Iron Ore. The health of the Chinese economy, its largest trading partner, is a factor, as well as inflation in Australia, its growth rate, and Trade Balance. Market sentiment – whether investors are taking on more risky assets (risk-on) or seeking safe havens (risk-off) – is also a factor, with risk-on positive for AUD.
The Reserve Bank of Australia (RBA) influences the Australian Dollar (AUD) by setting the level of interest rates that Australian banks can lend to each other. This influences the level of interest rates in the economy as a whole. The main goal of the RBA is to maintain a stable inflation rate of 2-3% by adjusting interest rates up or down. Relatively high interest rates compared to other major central banks support the AUD, and the opposite for relatively low. The RBA can also use quantitative easing and tightening to influence credit conditions, with the former AUD-negative and the latter AUD-positive.
China is Australia’s largest trading partner so the health of the Chinese economy is a major influence on the value of the Australian Dollar (AUD). When the Chinese economy is doing well it purchases more raw materials, goods and services from Australia, lifting demand for the AUD, and pushing up its value. The opposite is the case when the Chinese economy is not growing as fast as expected. Positive or negative surprises in Chinese growth data, therefore, often have a direct impact on the Australian Dollar and its pairs.
Iron Ore is Australia’s largest export, accounting for $118 billion a year according to data from 2021, with China as its primary destination. The price of Iron Ore, therefore, can be a driver of the Australian Dollar. Generally, if the price of Iron Ore rises, AUD also goes up, as aggregate demand for the currency increases. The opposite is the case if the price of Iron Ore falls. Higher Iron Ore prices also tend to result in a greater likelihood of a positive Trade Balance for Australia, which is also positive of the AUD.
The Trade Balance, which is the difference between what a country earns from its exports versus what it pays for its imports, is another factor that can influence the value of the Australian Dollar. If Australia produces highly sought after exports, then its currency will gain in value purely from the surplus demand created from foreign buyers seeking to purchase its exports versus what it spends to purchase imports. Therefore, a positive net Trade Balance strengthens the AUD, with the opposite effect if the Trade Balance is negative.
The People’s Bank of China (PBoC) set the USD/CNY central rate for the trading session ahead on Friday at 7.1011 as compared to the previous day's fix of 7.1016 and 7.2102 Reuters estimates.
- WTI prices gain momentum to one-week highs near $79.30 on Friday.
- Rising demand optimism in China and the ongoing Middle East geopolitical tensions lift WTI prices.
- The Fed’s hawkish stance might limit the upside of USD-denominated oil.
Western Texas Intermediate (WTI), the US crude oil benchmark, is trading around $79.30 on Friday. The black gold edges higher amid optimism about rising demand in China and the US, the world's two biggest crude-consuming nations.
China’s crude oil imports rose by 5.45% in April compared to the same month last year, indicating an encouraging improvement in demand, China's official statistics showed on Thursday. The improved China Trade Balance data added to the upside momentum for WTI prices, said Tina Teng, an independent market analyst.
On Wednesday, a decline in oil inventories lifted the black gold. Crude inventories in the US dropped by 1.4 million barrels in the week ending May 3, from 7.3 million barrels built in the previous week, according to the Energy Information Administration (EIA). The market consensus projected that stocks would decrease by 1.4 million barrels.
Israeli forces massed tanks and opened fire close to built-up areas of Rafah on Thursday after President Joe Biden said the US would withhold weapons from Israel if its forces mounted a major invasion of the southern Gaza city. The ongoing geopolitical tensions and uncertainties in the Middle East are likely to raise concern about oil supply disruptions, boosting WTI prices.
Nonetheless, the stronger US Dollar (USD), supported by the hawkish stance of the US Federal Reserve (Fed), might cap the upside of the USD-denominated oil for the time being. San Francisco Fed President Mary Daly said on Thursday that uncertainty over the inflation outlook makes policy projections difficult until the Fed gets more clarity.
- USD/JPY edges higher to 155.50 in Friday’s early Asian session.
- Fed’s Collins becomes the latest Fed official to warn rates will likely stay higher for longer.
- The BoJ’s recent hawkish comments and FX intervention considerations support the Japanese Yen.
The USD/JPY pair trades on a stronger note around 155.50 on Friday during the early Asian trading hours. The renewed US Dollar (USD) demand lifts the pair. Nonetheless, the verbal intervention and the hawkish comment from the Bank of Japan’s (BOJ) Governor Kazuo Ueda might cap the downside of the Japanese Yen (JPY) for the time being.
On Thursday, San Francisco Fed President Mary Daly stated that the central bank may take more time to return inflation to its target as the uncertainty about inflation in the next few months has increased. Other Fed officials this week have also shown they favor keeping rates at their current levels for longer. This, in turn, might lift the Greenback and create a tailwind for USD/JPY.
Financial markets anticipate the US central bank to keep policy on hold for the rest of the year as it looks for "greater confidence" in inflation, and Fed’s Chair Jerome Powell emphasized that it might take longer than expected to achieve that confidence.”
On the other hand, BoJ Governor Kazuo Ueda said on Thursday that the central bank will scrutinize the JPY's recent weakness in guiding monetary policy, per Reuters. The hawkish comments have prompted the expectation of an increase in short-term borrowing costs in the coming months, which provide some support to the JPY and drag the USD/JPY lower.
Additionally, the verbal intervention from Japanese authorities is likely to limit the pair’s upside in the near term. Early Friday, Japanese Finance Minister Shunichi Suzuki said once again that he will take necessary measures regarding foreign exchange if required.
| Index | Change, points | Closed | Change, % |
|---|---|---|---|
| NIKKEI 225 | -128.39 | 38073.98 | -0.34 |
| Hang Seng | 223.95 | 18537.81 | 1.22 |
| KOSPI | -32.91 | 2712.14 | -1.2 |
| ASX 200 | -82.9 | 7721.6 | -1.06 |
| DAX | 188.22 | 18686.6 | 1.02 |
| CAC 40 | 56.24 | 8187.65 | 0.69 |
| Dow Jones | 331.37 | 39387.76 | 0.85 |
| S&P 500 | 26.41 | 5214.08 | 0.51 |
| NASDAQ Composite | 43.5 | 16346.26 | 0.27 |
| Pare | Closed | Change, % |
|---|---|---|
| AUDUSD | 0.66191 | 0.58 |
| EURJPY | 167.612 | 0.26 |
| EURUSD | 1.0781 | 0.29 |
| GBPJPY | 194.687 | 0.17 |
| GBPUSD | 1.25232 | 0.2 |
| NZDUSD | 0.60329 | 0.47 |
| USDCAD | 1.36773 | -0.34 |
| USDCHF | 0.90578 | -0.24 |
| USDJPY | 155.462 | -0.03 |
Japanese Finance Minister Shunichi Suzuki said on Friday that he will closely watch the foreign exchange (FX) move, adding that he will take necessary measures regarding FX if required.
Key quotes
“Says is closely watching FX moves.”
“Won't comment on FX levels.”
“To take necessary measures regarding foreign exchange if required.”
“To take necessary measures as required.”
“To take appropriate foreign exchange measures without hesitation.”
Market reaction
The verbal intervention has little to no market reaction to the Japanese Yen (JPY). At the time of writing, USD/JPY is trading 0.07% lower on the day to trade at 155.40.
Japanese Yen FAQs
The Japanese Yen (JPY) is one of the world’s most traded currencies. Its value is broadly determined by the performance of the Japanese economy, but more specifically by the Bank of Japan’s policy, the differential between Japanese and US bond yields, or risk sentiment among traders, among other factors.
One of the Bank of Japan’s mandates is currency control, so its moves are key for the Yen. The BoJ has directly intervened in currency markets sometimes, generally to lower the value of the Yen, although it refrains from doing it often due to political concerns of its main trading partners. The current BoJ ultra-loose monetary policy, based on massive stimulus to the economy, has caused the Yen to depreciate against its main currency peers. This process has exacerbated more recently due to an increasing policy divergence between the Bank of Japan and other main central banks, which have opted to increase interest rates sharply to fight decades-high levels of inflation.
The BoJ’s stance of sticking to ultra-loose monetary policy has led to a widening policy divergence with other central banks, particularly with the US Federal Reserve. This supports a widening of the differential between the 10-year US and Japanese bonds, which favors the US Dollar against the Japanese Yen.
The Japanese Yen is often seen as a safe-haven investment. This means that in times of market stress, investors are more likely to put their money in the Japanese currency due to its supposed reliability and stability. Turbulent times are likely to strengthen the Yen’s value against other currencies seen as more risky to invest in.


© 2000-2026. Bản quyền Teletrade.
Trang web này được quản lý bởi Teletrade D.J. LLC 2351 LLC 2022 (Euro House, Richmond Hill Road, Kingstown, VC0100, St. Vincent and the Grenadines).
Thông tin trên trang web không phải là cơ sở để đưa ra quyết định đầu tư và chỉ được cung cấp cho mục đích làm quen.
Giao dịch trên thị trường tài chính (đặc biệt là giao dịch sử dụng các công cụ biên) mở ra những cơ hội lớn và tạo điều kiện cho các nhà đầu tư sẵn sàng mạo hiểm để thu lợi nhuận, tuy nhiên nó mang trong mình nguy cơ rủi ro khá cao. Chính vì vậy trước khi tiến hành giao dịch cần phải xem xét mọi mặt vấn đề chấp nhận tiến hành giao dịch cụ thể xét theo quan điểm của nguồn lực tài chính sẵn có và mức độ am hiểu thị trường tài chính.
Sử dụng thông tin: sử dụng toàn bộ hay riêng biệt các dữ liệu trên trang web của công ty TeleTrade như một nguồn cung cấp thông tin nhất định. Việc sử dụng tư liệu từ trang web cần kèm theo liên kết đến trang teletrade.vn. Việc tự động thu thập số liệu cũng như thông tin từ trang web TeleTrade đều không được phép.
Xin vui lòng liên hệ với pr@teletrade.global nếu có câu hỏi.
ngân hàng