LƯU Ý: Tài liệu trong nguồn cấp dữ liệu tin tức và phân tích được cập nhật tự động, tải lại trang có thể làm chậm quá trình xuất hiện tài liệu mới. Để nhận được tài liệu nhanh chóng, chúng tôi khuyên bạn nên luôn mở nguồn cấp tin tức.
The Japanese economy witnessed a growth of 0.6% QoQ in the quarter to December of 2024, missing the preliminary reading of 0.7%, the final reading released by Japan’s Cabinet Office showed on Tuesday.
The Japan’s Gross Domestic Product (GDP) expanded at an annual rate of 2.2% in Q4 versus the initial estimate of 2.8%, below the market consensus.
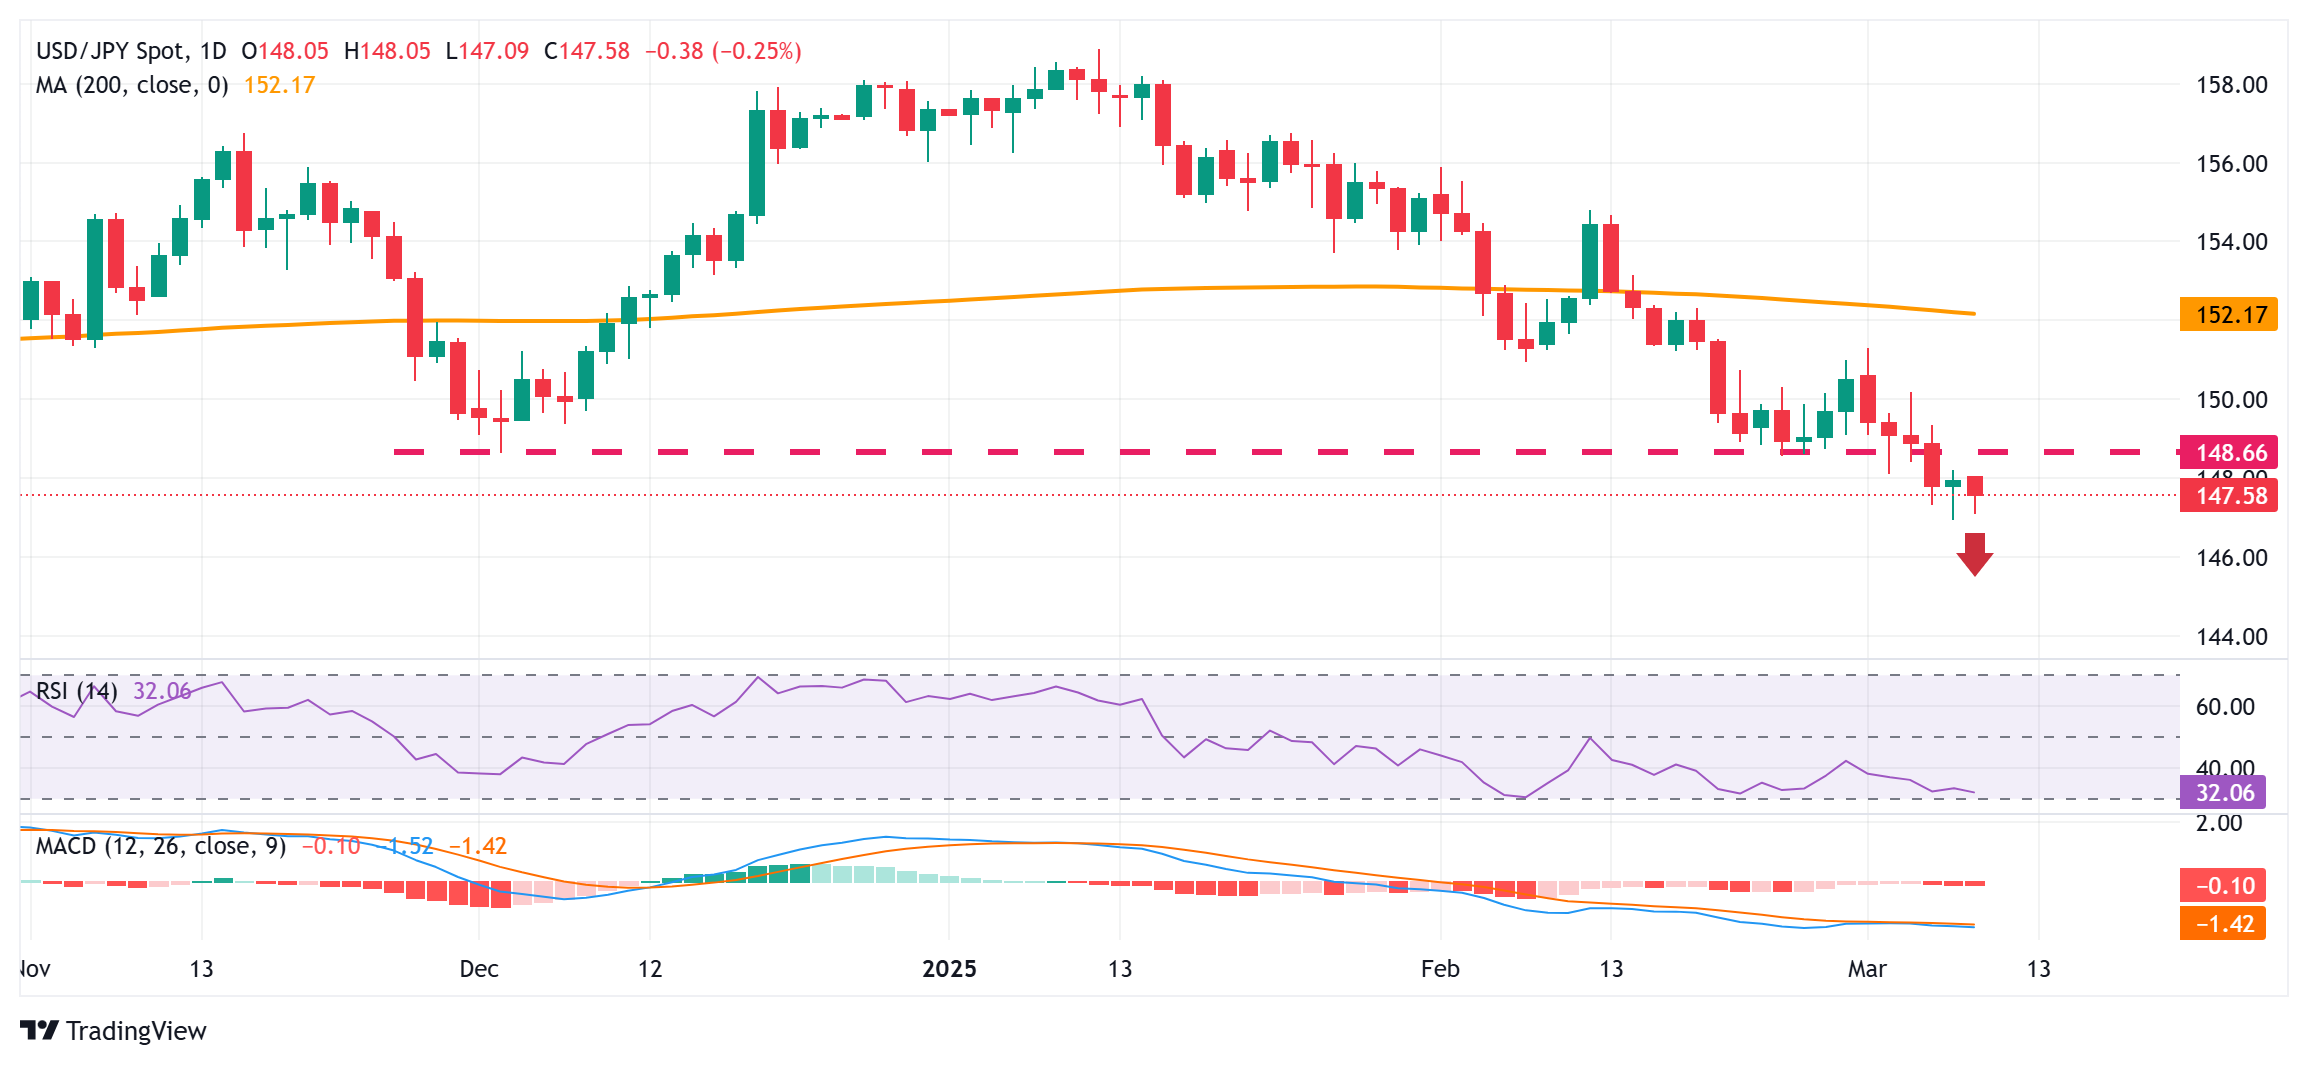
Market reaction to Japan’s GDP data
At the press time, USD/JPY trades 0.17% lower on the day at 147.02.
GDP FAQs
A country’s Gross Domestic Product (GDP) measures the rate of growth of its economy over a given period of time, usually a quarter. The most reliable figures are those that compare GDP to the previous quarter e.g Q2 of 2023 vs Q1 of 2023, or to the same period in the previous year, e.g Q2 of 2023 vs Q2 of 2022. Annualized quarterly GDP figures extrapolate the growth rate of the quarter as if it were constant for the rest of the year. These can be misleading, however, if temporary shocks impact growth in one quarter but are unlikely to last all year – such as happened in the first quarter of 2020 at the outbreak of the covid pandemic, when growth plummeted.
A higher GDP result is generally positive for a nation’s currency as it reflects a growing economy, which is more likely to produce goods and services that can be exported, as well as attracting higher foreign investment. By the same token, when GDP falls it is usually negative for the currency. When an economy grows people tend to spend more, which leads to inflation. The country’s central bank then has to put up interest rates to combat the inflation with the side effect of attracting more capital inflows from global investors, thus helping the local currency appreciate.
When an economy grows and GDP is rising, people tend to spend more which leads to inflation. The country’s central bank then has to put up interest rates to combat the inflation. Higher interest rates are negative for Gold because they increase the opportunity-cost of holding Gold versus placing the money in a cash deposit account. Therefore, a higher GDP growth rate is usually a bearish factor for Gold price.
23:52
Japan Gross Domestic Product Deflator (YoY) above expectations (2.8%) in 4Q: Actual (2.9%)
23:51
Japan Money Supply M2+CD (YoY): 1.2% (February) vs previous 1.3%
23:50
Japan Gross Domestic Product (QoQ) registered at 0.6%, below expectations (0.7%) in 4Q
23:50
Japan Gross Domestic Product Annualized declined to 2.2% in 4Q from previous 2.8%
EUR/USD stuck to its near-term midrange as Fiber traders mull their options.
US data dominates the economic release calendar this week.
US JOLTS Job Openings, CPI and PPI inflation, and Consumer Sentiment loom over the week.
EUR/USD cycled in familiar territory on Monday, kicking off the new trading week on a notable quiet note as Fiber traders gear up for a US-data-heavy data docket on the cards for this week. Equities roiled on Monday, falling nearly across the board as investors pull back in the face of rising recession fears, but Fiber traders have battened down the hatches as they await key US inflation figures this week before solidifying their bets.
Forex Today: Attention shifts to Japanese GDP and US jobs data
European economic data is strictly mid-tier or lower this week, as markets pivot to face a wide spread of key US releases. JOLTS Jobs Openings kick things off on Tuesday, which are forecast to rise slightly to 7.75M in January from the previous 7.6M. US Consumer Price Index (CPI) inflation follows up on Tuesday, and investors are hoping for a continued easing in inflation pressures after a surprise uptick in inflation metrics at the start of 2025 blindsided markets. Investors have been betting on easing inflation to keep pushing the Federal Reserve (Fed) toward more rate cuts, despite ongoing talking points from policymakers increasingly tipping their hats to wobbly US trade policies increasingly hampering forecasting abilities.
Median market forecasts expect a slight cooling in headline and core CPI numbers. Headline CPI inflation in February is expected to ease to 0.3% MoM from 0.5%, while core monthly CPI is expected to tick down to a matching 0.3% from 0.4%. Annualized CPI is similarly expected to drop slightly to 2.9% YoY from 3.0%, while core CPI for the year ended in February is forecast t tick down to 3.2% from 3.3%.
On-and-off tariffs weigh on investor sentiment
Markets continue to feel bearish pressure due to President Donald Trump’s clumsy tariff threats, which his administration keeps revisiting. The White House is attempting to impose significant tariffs on the US's closest trading partners to generate revenue that can counterbalance the large deficits arising from Trump’s proposed tax cuts. However, implementation is challenging, as the most vocal opponents of Trump’s tariff plans are largely US consumers and businesses that face heightened spending and operational costs due to retaliatory tariffs affecting crucial US industries and sectors.
President Trump faced down questions about a possible recession in the US economy, waving the subject off and branding an economic downturn as a “transition” period during a weekend interview with Fox News that was held from broadcast until early Monday. Donald Trump eventually capitulated on his own words, acknowledging that the US could be in for a ‘rough patch’. President Trump and his staff pulled double-duty on Monday attempting to rebrand the recent upswing in inflation and broad-market risk aversion as the fault of the previous Biden administration, rather than a direct result of the US’ wobbly approach to enacting tariffs on key US trading partners.
EUR/USD price forecast
EUR/USD got stuck in the muck on Monday, mulching chart paper near the 1.0850 region as Fiber’s recent bull run looks set to end. EUR/USD easily pierced through the 200-day Exponential Moving Average (EMA) last week, soaring through the key moving average near 1.0630.
Fiber climbed 5.1%, or 528 pips, bottom-to-top from the last swing low at 1.0360, but bullish momentum looks set to take a pause. Technical oscillators are pinned in overbought territory, implying EUR/USD could be primed for a fresh push to the low side.
EUR/USD daily chart
Euro FAQs
The Euro is the currency for the 19 European Union countries that belong to the Eurozone. It is the second most heavily traded currency in the world behind the US Dollar. In 2022, it accounted for 31% of all foreign exchange transactions, with an average daily turnover of over $2.2 trillion a day. EUR/USD is the most heavily traded currency pair in the world, accounting for an estimated 30% off all transactions, followed by EUR/JPY (4%), EUR/GBP (3%) and EUR/AUD (2%).
The European Central Bank (ECB) in Frankfurt, Germany, is the reserve bank for the Eurozone. The ECB sets interest rates and manages monetary policy. The ECB’s primary mandate is to maintain price stability, which means either controlling inflation or stimulating growth. Its primary tool is the raising or lowering of interest rates. Relatively high interest rates – or the expectation of higher rates – will usually benefit the Euro and vice versa. The ECB Governing Council makes monetary policy decisions at meetings held eight times a year. Decisions are made by heads of the Eurozone national banks and six permanent members, including the President of the ECB, Christine Lagarde.
Eurozone inflation data, measured by the Harmonized Index of Consumer Prices (HICP), is an important econometric for the Euro. If inflation rises more than expected, especially if above the ECB’s 2% target, it obliges the ECB to raise interest rates to bring it back under control. Relatively high interest rates compared to its counterparts will usually benefit the Euro, as it makes the region more attractive as a place for global investors to park their money.
Data releases gauge the health of the economy and can impact on the Euro. Indicators such as GDP, Manufacturing and Services PMIs, employment, and consumer sentiment surveys can all influence the direction of the single currency. A strong economy is good for the Euro. Not only does it attract more foreign investment but it may encourage the ECB to put up interest rates, which will directly strengthen the Euro. Otherwise, if economic data is weak, the Euro is likely to fall. Economic data for the four largest economies in the euro area (Germany, France, Italy and Spain) are especially significant, as they account for 75% of the Eurozone’s economy.
Another significant data release for the Euro is the Trade Balance. This indicator measures the difference between what a country earns from its exports and what it spends on imports over a given period. If a country produces highly sought after exports then its currency will gain in value purely from the extra demand created from foreign buyers seeking to purchase these goods. Therefore, a positive net Trade Balance strengthens a currency and vice versa for a negative balance.
23:30
Australia Westpac Consumer Confidence: 4% (March) vs 0.1%
23:30
Japan Overall Household Spending (YoY) came in at 0.8% below forecasts (3.6%) in January
USD/CAD trades in negative territory near 1.4435 in Monday’s late American session.
The fears of the US economic slowdown and persistent selloff on Wall Street weigh on the US Dollar.
The BoC is expected to cut its benchmark rate by 25 bps to 2.75%.
The USD/CAD pair trades with mild losses around 1.4435, snapping the two-day winning streak during the late American session on Monday. Investors worried that tariff policy uncertainty would tip the US economy into a recession, weighing on the US Dollar (USD). Investors brace for the Bank of Canada (BoC) interest rate decision on Wednesday, which is expected to continue its easing campaign.
The probable US economic slowdown and ongoing selloff on Wall Street drag the Greenback lower against the Canadian Dollar (CAD). The weaker-than-expected US February job data suggested that the Federal Reserve (Fed) remained on track to cut interest rates multiple times this year. Traders are now pricing in 75 basis points (bps) of cuts from the Fed this year, LSEG data showed, with a rate cut fully priced in for June.
Investors will closely watch the US Consumer Price Index (CPI) inflation data on Wednesday for fresh impetus. Investors hope for another cooldown in headline CPI inflation, which accelerated in January.
On the other hand, the BoC is anticipated to deliver another quarter-point rate cut at its March meeting on Wednesday while it waits to see how long the dispute with Canada’s largest trading partner lasts. CIBC analysts expect the Canadian central bank to cut 25 bps on Wednesday, lowering its benchmark rate to 2.75%, with more cuts to follow this year if trade uncertainty persists. The rising bets of further BoC rate reductions could undermine the CAD and help limit the pair’s losses.
Meanwhile, a decline in crude oil prices amid tariff uncertainty and rising output from OPEC+ producers might exert some selling pressure on the commodity-linked Loonie. It’s worth noting that Canada is the largest oil exporter to the United States (US), and lower crude oil prices tend to have a negative impact on the CAD value.
Canadian Dollar FAQs
The key factors driving the Canadian Dollar (CAD) are the level of interest rates set by the Bank of Canada (BoC), the price of Oil, Canada’s largest export, the health of its economy, inflation and the Trade Balance, which is the difference between the value of Canada’s exports versus its imports. Other factors include market sentiment – whether investors are taking on more risky assets (risk-on) or seeking safe-havens (risk-off) – with risk-on being CAD-positive. As its largest trading partner, the health of the US economy is also a key factor influencing the Canadian Dollar.
The Bank of Canada (BoC) has a significant influence on the Canadian Dollar by setting the level of interest rates that banks can lend to one another. This influences the level of interest rates for everyone. The main goal of the BoC is to maintain inflation at 1-3% by adjusting interest rates up or down. Relatively higher interest rates tend to be positive for the CAD. The Bank of Canada can also use quantitative easing and tightening to influence credit conditions, with the former CAD-negative and the latter CAD-positive.
The price of Oil is a key factor impacting the value of the Canadian Dollar. Petroleum is Canada’s biggest export, so Oil price tends to have an immediate impact on the CAD value. Generally, if Oil price rises CAD also goes up, as aggregate demand for the currency increases. The opposite is the case if the price of Oil falls. Higher Oil prices also tend to result in a greater likelihood of a positive Trade Balance, which is also supportive of the CAD.
While inflation had always traditionally been thought of as a negative factor for a currency since it lowers the value of money, the opposite has actually been the case in modern times with the relaxation of cross-border capital controls. Higher inflation tends to lead central banks to put up interest rates which attracts more capital inflows from global investors seeking a lucrative place to keep their money. This increases demand for the local currency, which in Canada’s case is the Canadian Dollar.
Macroeconomic data releases gauge the health of the economy and can have an impact on the Canadian Dollar. Indicators such as GDP, Manufacturing and Services PMIs, employment, and consumer sentiment surveys can all influence the direction of the CAD. A strong economy is good for the Canadian Dollar. Not only does it attract more foreign investment but it may encourage the Bank of Canada to put up interest rates, leading to a stronger currency. If economic data is weak, however, the CAD is likely to fall.
USD/JPY confirms bearish trend, carving lower highs and lower lows.
Next key support levels: 146.00 and September 30 low at 141.64.
RSI signals bearish momentum, with sellers gaining control.
A recovery above 148.00 could trigger a corrective bounce before the downtrend resumes.
The USD/JPY stumbles for the second consecutive day as the Japanese Yen (JPY) continues to gather strength due to safe-haven demand. At the time of writing, the pair trades at 147.01 down 0.17% as Tuesday’s Asian session begins.
USD/JPY Price Forecast: Technical outlook
The USD/JPY is set to extend its losses after clearing the October 8 swing low of 147.35, which opened the path to a drop beneath 147.00. Per the price action structure, the pair has carved successive series of lower highs and lower lows, and the separation between the spot price and the 200-day Simple Moving Average (SMA) continues to widen, a sign that sellers are gathering steam.
The Relative Strength Index (RSI) hints that bears would remain in control.
With that said, the next key support would be the 146.00 figure. If surpassed, the next floor for the USD/JPY would be the September 30 pivot low of 141.64. Conversely, if USD/JPY rises past 147.00 and ends on a closing basis above 148.00, this would pave the path for an upward correction before the downtrend resumes.
USD/JPY Price Chart – Daily
Japanese Yen FAQs
The Japanese Yen (JPY) is one of the world’s most traded currencies. Its value is broadly determined by the performance of the Japanese economy, but more specifically by the Bank of Japan’s policy, the differential between Japanese and US bond yields, or risk sentiment among traders, among other factors.
One of the Bank of Japan’s mandates is currency control, so its moves are key for the Yen. The BoJ has directly intervened in currency markets sometimes, generally to lower the value of the Yen, although it refrains from doing it often due to political concerns of its main trading partners. The BoJ ultra-loose monetary policy between 2013 and 2024 caused the Yen to depreciate against its main currency peers due to an increasing policy divergence between the Bank of Japan and other main central banks. More recently, the gradually unwinding of this ultra-loose policy has given some support to the Yen.
Over the last decade, the BoJ’s stance of sticking to ultra-loose monetary policy has led to a widening policy divergence with other central banks, particularly with the US Federal Reserve. This supported a widening of the differential between the 10-year US and Japanese bonds, which favored the US Dollar against the Japanese Yen. The BoJ decision in 2024 to gradually abandon the ultra-loose policy, coupled with interest-rate cuts in other major central banks, is narrowing this differential.
The Japanese Yen is often seen as a safe-haven investment. This means that in times of market stress, investors are more likely to put their money in the Japanese currency due to its supposed reliability and stability. Turbulent times are likely to strengthen the Yen’s value against other currencies seen as more risky to invest in.
NZD/USD was seen trading near the 0.5700 area ahead of the Asian session, marking its second consecutive daily decline.
Buyers face a key test at the 20-day SMA near 0.5960, as a break below this level could accelerate selling pressure.
Technical indicators signal increasing downside risks, with the 100-day SMA approaching a bearish crossover with the 20-day SMA.
The NZD/USD pair extended its decline on Monday ahead of the Asian session, slipping toward the 0.5700 zone as sellers maintained control. The pair has now fallen for two straight sessions, with buyers struggling to defend the 20-day Simple Moving Average (SMA), a level that has acted as key support in recent weeks. The inability to hold above this area could trigger a deeper pullback, exposing the pair to additional losses.
Technical indicators reflect a growing bearish bias. The Relative Strength Index (RSI) remains in positive territory but is declining sharply, indicating fading bullish momentum. Meanwhile, the Moving Average Convergence Divergence (MACD) is neutral, signaling a weakening trend with limited upside potential. More importantly, the 100-day SMA is edging closer to the 20-day SMA, hinting at a potential bearish crossover that could further weigh on the pair.
Looking at key technical levels, immediate support is seen at the 20-day SMA around 0.5960. A break below this level would expose the 0.5650 region, followed by stronger support near 0.5600. On the upside, resistance stands at the 0.5750 level, with a stronger barrier at 0.5800.
NZD/USD daily chart
21:45
New Zealand Manufacturing Sales climbed from previous -1.2% to 1.1% in 4Q
Silver price drops over 1.20% on Monday even though US Treasury bond yields drop and the Greenback post minuscule gains. At the time of writing, the XAG/USD trades at $32.08 after reaching a high of $32.66.
XAG/USD Price Forecast: Technical outlook
The price of silver has fallen below last Friday’s low of 32.11, with sellers eyeing the $31.00 handle. If XAG/USD closes on a daily basis below $32.00, look for a test of strong support at the confluence of the 100 and 50-day Simple Moving Averages (SMAs) at $31.22. A breach of the latter will expose $31.00 a troy ounce and clear the path to challenge the 200-day SMA at $30.50.
The Relative Strength Index (RSI) aims downwards to indicate that bulls had lost steam. Nevertheless, the RSI remains above its neutral level, indicating that bears are not out of the woods.
Therefore, if XAG/USD climbs past $32.50, the next resistance would be the 32.76 March 6 peak, followed by the $33.00 mark. Bulls could challenge the February 14 $33.39 mark, ahead of $34.00 if surpassed.
XAG/USD Price Chart – Daily
Silver FAQs
Silver is a precious metal highly traded among investors. It has been historically used as a store of value and a medium of exchange. Although less popular than Gold, traders may turn to Silver to diversify their investment portfolio, for its intrinsic value or as a potential hedge during high-inflation periods. Investors can buy physical Silver, in coins or in bars, or trade it through vehicles such as Exchange Traded Funds, which track its price on international markets.
Silver prices can move due to a wide range of factors. Geopolitical instability or fears of a deep recession can make Silver price escalate due to its safe-haven status, although to a lesser extent than Gold's. As a yieldless asset, Silver tends to rise with lower interest rates. Its moves also depend on how the US Dollar (USD) behaves as the asset is priced in dollars (XAG/USD). A strong Dollar tends to keep the price of Silver at bay, whereas a weaker Dollar is likely to propel prices up. Other factors such as investment demand, mining supply – Silver is much more abundant than Gold – and recycling rates can also affect prices.
Silver is widely used in industry, particularly in sectors such as electronics or solar energy, as it has one of the highest electric conductivity of all metals – more than Copper and Gold. A surge in demand can increase prices, while a decline tends to lower them. Dynamics in the US, Chinese and Indian economies can also contribute to price swings: for the US and particularly China, their big industrial sectors use Silver in various processes; in India, consumers’ demand for the precious metal for jewellery also plays a key role in setting prices.
Silver prices tend to follow Gold's moves. When Gold prices rise, Silver typically follows suit, as their status as safe-haven assets is similar. The Gold/Silver ratio, which shows the number of ounces of Silver needed to equal the value of one ounce of Gold, may help to determine the relative valuation between both metals. Some investors may consider a high ratio as an indicator that Silver is undervalued, or Gold is overvalued. On the contrary, a low ratio might suggest that Gold is undervalued relative to Silver.
Gold retreats as investors take profits amid fears of US stagflation.
Atlanta Fed GDPNow forecasts Q1 2025 contraction at -2.4%, the first negative print since COVID-19.
The US Dollar Index (DXY) recovers to 103.99, capping Gold’s upside.
Traders eye US CPI data on Wednesday for Fed rate-cut expectations.
Gold (XAU) price retreats as the week begins, down 0.70% and falls below the $2,900 figure as investors’ fears of a recession in the United States (US) grow amid controversial trade policies implemented by the US President Donald Trump. At the time of writing, the XAU/USD pair trades at $2,890 after hitting a daily high of $2,918.
Wall Street continued to edge lower, depicting a dismal market sentiment due to the ongoing economic slowdown. On Friday, Trump appeared in an interview and said, “There is a period of transition, because what we’re doing is very big. …We’re bringing wealth back to America. …That’s a big thing, and there are always periods; it takes a little time.”
In the meantime, Gold traders booked profits amid concerns that the US economy is facing the challenges of a stagflationary scenario. Recent data suggests the economy is slowing down sharply. The Atlanta Fed GDP Now model predicts the first quarter of 2025 at -2.4%, which would be the first negative print since the COVID-19 pandemic.
The Greenback, which was trading with losses, has recovered some ground according to the US Dollar Index (DXY). The DXY is up 0.09% at 103.99, shy of reclaiming the 104.00 mark.
Economic concerns are spreading globally after China’s inflation in February came at -0.7% YoY, well below the -0.5% estimated by economists. Worries are increasing that the economy might slow down.
Given the backdrop, traders would be eyeing the release of inflation data in the US. A hot inflation report could weigh on expectations of further easing by the Federal Reserve (Fed) and might prevent the US central bank from cutting interest rates at upcoming meetings.
This week, the US economic docket will feature Tuesday's JOLTs Job Openings data, followed by the Consumer Price Index (CPI) release on Wednesday.
The US 10-year Treasury bond yield dropped nearly nine basis points to 4.218% as traders eye the Fed’s interest rate cuts.
US real yields, as measured by the US 10-year Treasury Inflation-Protected Securities (TIPS) yield that correlates inversely to Gold prices, edge down five-and-a-half basis points to 1.906%, a tailwind for the non-yielding metal.
Recently, Fed Chair Jerome Powell reiterated that the central bank is not in a hurry to lower rates. Powell added that getting inflation to 2% would be bumpy and that the central bank doesn’t need to overreact to one or two readings. Powell said the Fed is well-positioned regarding monetary policy.
The New York Fed Consumer Sentiment Survey revealed that inflation expectations for one year in February increased from 3% to 3.1%. For the three and five-year periods, they remained unchanged at 3%. Americans expect price increases in gas, rent and food.
The latest US jobs report for February was mixed, with the economy adding over 150K people to the workforce, but the Unemployment Rate rose by 4.1%. Nevertheless, the data shows that the labor market remains solid.
The People’s Bank of China (PBoC) continues to purchase Gold, according to the World Gold Council (WGC). The PBoC increased its holdings by 10 tonnes in the first two months of 2025. However, the largest buyer was the National Bank of Poland (NBP), which increased its reserve by 29 tonnes, its largest purchase since June 2019, when it bought 95 tonnes.
Money market traders had priced in 80 basis points of easing in 2025, up from 74 bps last Friday, via data from Prime Market Terminal.
Gold price fell to a five-week low of $2,880 earlier on the day, with momentum about to turn bearish, with the Relative Strength Index (RSI) poised to cross below the 50-neutral threshold.
If XAU/USD closes daily below $2,900, sellers could be in charge and target the $2,850 figure. A breach of the latter will expose the February 28 low of $2,832, followed by the $2,800 mark.
Conversely, if Gold ends above $2,900, the next resistance would be $2,950, followed by the record high at $2,954. A breach of the latter would expose the $3,000 mark.
Gold FAQs
Gold has played a key role in human’s history as it has been widely used as a store of value and medium of exchange. Currently, apart from its shine and usage for jewelry, the precious metal is widely seen as a safe-haven asset, meaning that it is considered a good investment during turbulent times. Gold is also widely seen as a hedge against inflation and against depreciating currencies as it doesn’t rely on any specific issuer or government.
Central banks are the biggest Gold holders. In their aim to support their currencies in turbulent times, central banks tend to diversify their reserves and buy Gold to improve the perceived strength of the economy and the currency. High Gold reserves can be a source of trust for a country’s solvency. Central banks added 1,136 tonnes of Gold worth around $70 billion to their reserves in 2022, according to data from the World Gold Council. This is the highest yearly purchase since records began. Central banks from emerging economies such as China, India and Turkey are quickly increasing their Gold reserves.
Gold has an inverse correlation with the US Dollar and US Treasuries, which are both major reserve and safe-haven assets. When the Dollar depreciates, Gold tends to rise, enabling investors and central banks to diversify their assets in turbulent times. Gold is also inversely correlated with risk assets. A rally in the stock market tends to weaken Gold price, while sell-offs in riskier markets tend to favor the precious metal.
The price can move due to a wide range of factors. Geopolitical instability or fears of a deep recession can quickly make Gold price escalate due to its safe-haven status. As a yield-less asset, Gold tends to rise with lower interest rates, while higher cost of money usually weighs down on the yellow metal. Still, most moves depend on how the US Dollar (USD) behaves as the asset is priced in dollars (XAU/USD). A strong Dollar tends to keep the price of Gold controlled, whereas a weaker Dollar is likely to push Gold prices up.
AUD/JPY was seen trading near the 92.50 area ahead of the Asian session, extending its losing streak to three consecutive sessions.
The pair continues to face downward pressure, struggling to hold above the 93.00 level as sellers dominate price action.
Technical indicators suggest persistent bearish momentum, with the RSI approaching oversold conditions and the MACD showing weakening downside pressure.
The AUD/JPY pair extended its decline on Monday ahead of the Asian session, falling toward the 92.50 zone and marking a third straight day of losses. The downward momentum remains strong as the pair struggles to maintain levels above 93.00, with bearish sentiment prevailing in the short term. Risk-off flows and weak demand for the Australian Dollar continue to weigh on the pair.
From a technical perspective, the Relative Strength Index (RSI) is nearing oversold territory, currently declining sharply, which may suggest that further downside could be limited. Meanwhile, the Moving Average Convergence Divergence (MACD) is printing decreasing red bars, indicating that while bearish momentum persists, selling pressure could be moderating.
Key support levels to monitor include the 92.00 psychological area, which, if breached, could open the door for further declines toward the 91.50 zone. On the upside, the first resistance is seen around the 93.00 level, followed by stronger resistance at the 20-day Simple Moving Average (SMA) near 95.00.
The AUD/USD declines on Monday, erasing part of last week’s rebound as risk sentiment weakens.
Investors react to US President Donald Trump’s comments, signaling potential turbulence ahead for the American economy.
China’s inflation data showed a faster-than-expected decline, raising concerns over demand for Australian exports.
Technical indicators suggest a bearish outlook, with AUD/USD struggling to reclaim a key moving average.
AUD/USD fell by 0.40% on Monday as risk-off sentiment weighed on the pair. Concerns over a slowdown in the United States (US) economy initially supported the Australian Dollar (AUD), but weak Chinese inflation data and trade tensions pressured the pair lower. President Donald Trump’s comments about a "transition period" raised uncertainty over the US outlook, while a sharper-than-expected drop in China’s Consumer Price Index (CPI) signaled weakening demand, reinforcing downside risks for AUD/USD.
Daily digest market movers: Australian Dollar pressured as global risks intensify
US economic concerns deepened after President Donald Trump described the economy as being in a "transition period," suggesting a potential slowdown. Investors interpreted his remarks as an early warning of possible economic turbulence in the near term.
A series of weak US economic indicators further fueled uncertainty. Consumer confidence fell to its lowest level in 15 months, the ISM Manufacturing New Orders Index declined, and the unemployment rate showed an unexpected rise in February.
The Australian Dollar struggled as China’s CPI declined by 0.7% year-over-year, exceeding the expected 0.5% drop, while the month-over-month figure contracted by 0.2%, reflecting weakening demand. Persistent disinflation in China suggests underlying economic fragility, which could negatively impact Australia’s export-driven economy.
Trade tensions remain a major market factor. New tariffs including a 25% levy on Canadian and Mexican products and a 20% duty on Chinese imports have heightened investor fears of an escalating trade conflict. Given China’s importance as Australia’s largest trading partner, any slowdown in Chinese demand poses a significant risk to the Australian Dollar.
The US Dollar Index (DXY) remained under pressure, hovering near sub-104.00 levels, as uncertainty around future trade policies and economic growth limited upside potential. Meanwhile, the Australian Dollar fluctuated around the 0.6300 zone, reflecting the broader cautious sentiment in currency markets.
Commodity market performance remains a key driver of AUD price action. Copper prices extended Friday’s losses, while iron ore continued its decline amid a broader multi-day consolidation phase, adding to concerns over AUD sustainability.
Looking ahead, investors will focus on key US economic releases this week. The US Consumer Price Index (CPI) data for February, scheduled for release on Wednesday, is expected to shape expectations regarding Federal Reserve policy, influencing AUD/USD price action.
AUD/USD Technical Analysis: Downside pressure builds as recovery stalls
The AUD/USD pair fell on Monday, moving toward a key support zone as sellers gained momentum. The pair struggled to hold early gains and retreated as concerns over the US and Chinese economies weighed on risk sentiment. The Moving Average Convergence Divergence (MACD) indicator continues to print decreasing red histogram bars, reinforcing bearish momentum. Meanwhile, the Relative Strength Index (RSI) has dropped to 48, entering negative territory and signaling increased downside risks.
The pair is trading below the 20-day Simple Moving Average (SMA), and a failure to reclaim this level could accelerate losses. If bearish momentum persists, support is seen near the 0.6200 zone, while resistance remains at 0.6320, with a break above that level needed to shift sentiment toward the bulls.
Australian Dollar FAQs
One of the most significant factors for the Australian Dollar (AUD) is the level of interest rates set by the Reserve Bank of Australia (RBA). Because Australia is a resource-rich country another key driver is the price of its biggest export, Iron Ore. The health of the Chinese economy, its largest trading partner, is a factor, as well as inflation in Australia, its growth rate and Trade Balance. Market sentiment – whether investors are taking on more risky assets (risk-on) or seeking safe-havens (risk-off) – is also a factor, with risk-on positive for AUD.
The Reserve Bank of Australia (RBA) influences the Australian Dollar (AUD) by setting the level of interest rates that Australian banks can lend to each other. This influences the level of interest rates in the economy as a whole. The main goal of the RBA is to maintain a stable inflation rate of 2-3% by adjusting interest rates up or down. Relatively high interest rates compared to other major central banks support the AUD, and the opposite for relatively low. The RBA can also use quantitative easing and tightening to influence credit conditions, with the former AUD-negative and the latter AUD-positive.
China is Australia’s largest trading partner so the health of the Chinese economy is a major influence on the value of the Australian Dollar (AUD). When the Chinese economy is doing well it purchases more raw materials, goods and services from Australia, lifting demand for the AUD, and pushing up its value. The opposite is the case when the Chinese economy is not growing as fast as expected. Positive or negative surprises in Chinese growth data, therefore, often have a direct impact on the Australian Dollar and its pairs.
Iron Ore is Australia’s largest export, accounting for $118 billion a year according to data from 2021, with China as its primary destination. The price of Iron Ore, therefore, can be a driver of the Australian Dollar. Generally, if the price of Iron Ore rises, AUD also goes up, as aggregate demand for the currency increases. The opposite is the case if the price of Iron Ore falls. Higher Iron Ore prices also tend to result in a greater likelihood of a positive Trade Balance for Australia, which is also positive of the AUD.
The Trade Balance, which is the difference between what a country earns from its exports versus what it pays for its imports, is another factor that can influence the value of the Australian Dollar. If Australia produces highly sought after exports, then its currency will gain in value purely from the surplus demand created from foreign buyers seeking to purchase its exports versus what it spends to purchase imports. Therefore, a positive net Trade Balance strengthens the AUD, with the opposite effect if the Trade Balance is negative.
The Greenback gave some signs of life on Monday, partially reversing the ongoing leg lower amid tariff concerns and steady jitters surrounding the performance of the US economy.
Here is what you need to know on Tuesday, March 11:
The US Dollar Index (DXY) regained the 104.00 zone, although it maintained the trade near multi-month lows following a noteworthy pullback in US yields across the curve. The NFIB Business Optimism Index is due seconded by the JOLTs job Openings and the API’s weekly report on US crude oil inventories.
EUR/USD failed to extend its upward march on Monday, coming under some mild pressure always below the 1.0900 region. Absent data releases in the next couple of day, the focus well be on the ECOFIN Meeting, and speeches by the ECB’s Lagarde, Nagel and Lane.
The rally in GBP/USD appears to have met a solid resistance around the 1.2950 region so far, sparking a marked pullback to multi-day lows at the beginning of the week. The BRC Retail Sales Monitor will take centre stage across the pond.
Safe haven demand propped up the extra appreciation of the Japanese yen, sending USD/JPY well below the 147.00 support for the first time since early October. The Japanese final Q4 GDP Growth Rate will be at the centre of the debate seconded by Household Spending figures.
AUD/USD added to the recent decline and breached the 0.6300 support to clock three-day lows near 0.6270, an area coincident with the 55-day SMA. The Westpac’s Consumer Confidence gauge is due followed by NAB’s Business Confidence.
Prices of the American reference WTI resumed their downtrend, returning below the $67.00 mark against the backdrop of unabated uncertainty around US tariffs.
Gold prices added to the current leg lower, down for the third day in a row and retesting multi-day lows near $2,880 per troy ounce. Silver prices retreated further and broke below the $32.00 zone per ounce, hitting three-day lows.
The Canadian Dollar eased another 0.6% lower on Monday against the Greenback.
Bank of Canada rate call due on Wednesday, expected to cut another 25 bps.
Market sentiment continues to sour as Trump administration tilts away from “recession” talk.
The Canadian Dollar (CAD) shed further ground on Monday, extending last Friday’s late-week declines and shedding another six-tenths one percent against the US Dollar. CAD markets are coiling ahead of the Bank of Canada’s (BoC) upcoming rate call during the midweek, which is expected to reduce interest rates another quarter of a percent to 2.75%.
Adding to market pressures forcing the Loonie lower are ongoing trade war and recession fears. Market sentiment has soured recently as US President Donald Trump’s waffling on his own tariff policy has left markets uneasy about the US’ ability to maintain price stability as US businesses grapple with steep potential price increases.
Broad-market sentiment has soured steeply on Monday as investors pull out of equities and bonds, piling into the US Dollar and forcing the Loonie lower.
US President Donald Trump, when asked about a possible recession looming over the US economy, tried to wave off the suggestion by branding it as a “transition period” for the US economy. Markets reacted poorly.
Key US inflation data is due this week on Wednesday, and investors are hoping for another cooldown in headline US Consumer Price Index (CPI) inflation, which accelerated in January.
The BoC’s latest rate call is also due on Wednesday, and is expected to trim another 25 bps from its main reference rate.
On top of US CPI inflation, US Producer Price Index (PPI) inflation is due on Thursday, where markets are hoping for a similar easing in business-level inflation pressures.
Canadian Dollar price forecast
The Canadian Dollar continues to churn within a familiar consolidation range. USD/CAD has risen back into all-too-familiar chart territory near 1.4450. The 1.4500 major price handle remains a key technical barrier, keeping USD/CAD pinned in an uneasy sideways channel.
USD/CAD caught a fresh bounce from the 50-day Exponential Moving Average (EMA) near 1.4315. However, Loonie weakness appears to have run its course and the pair is quickly running into steep technical resistance. A near-term technical floor is priced in near the low end of USD/CAD’s ongoing channel, near the 1.4300 handle.
USD/CAD daily chart
Canadian Dollar FAQs
The key factors driving the Canadian Dollar (CAD) are the level of interest rates set by the Bank of Canada (BoC), the price of Oil, Canada’s largest export, the health of its economy, inflation and the Trade Balance, which is the difference between the value of Canada’s exports versus its imports. Other factors include market sentiment – whether investors are taking on more risky assets (risk-on) or seeking safe-havens (risk-off) – with risk-on being CAD-positive. As its largest trading partner, the health of the US economy is also a key factor influencing the Canadian Dollar.
The Bank of Canada (BoC) has a significant influence on the Canadian Dollar by setting the level of interest rates that banks can lend to one another. This influences the level of interest rates for everyone. The main goal of the BoC is to maintain inflation at 1-3% by adjusting interest rates up or down. Relatively higher interest rates tend to be positive for the CAD. The Bank of Canada can also use quantitative easing and tightening to influence credit conditions, with the former CAD-negative and the latter CAD-positive.
The price of Oil is a key factor impacting the value of the Canadian Dollar. Petroleum is Canada’s biggest export, so Oil price tends to have an immediate impact on the CAD value. Generally, if Oil price rises CAD also goes up, as aggregate demand for the currency increases. The opposite is the case if the price of Oil falls. Higher Oil prices also tend to result in a greater likelihood of a positive Trade Balance, which is also supportive of the CAD.
While inflation had always traditionally been thought of as a negative factor for a currency since it lowers the value of money, the opposite has actually been the case in modern times with the relaxation of cross-border capital controls. Higher inflation tends to lead central banks to put up interest rates which attracts more capital inflows from global investors seeking a lucrative place to keep their money. This increases demand for the local currency, which in Canada’s case is the Canadian Dollar.
Macroeconomic data releases gauge the health of the economy and can have an impact on the Canadian Dollar. Indicators such as GDP, Manufacturing and Services PMIs, employment, and consumer sentiment surveys can all influence the direction of the CAD. A strong economy is good for the Canadian Dollar. Not only does it attract more foreign investment but it may encourage the Bank of Canada to put up interest rates, leading to a stronger currency. If economic data is weak, however, the CAD is likely to fall.
The US Dollar (USD) remains under pressure on Monday, with DXY hovering around 103.95, struggling to find traction after last week's steep decline. Federal Reserve (Fed) Chair Jerome Powell’s latest remarks on Friday reassured markets that the central bank sees no urgent need to adjust policy at the moment, though economic uncertainties are growing. Meanwhile, the Nasdaq is facing heavy market losses, down 3.3%, as investors remain cautious ahead of key United States (US) inflation data due midweek.
Daily digest market movers: Fed in focus as CPI looms
Market participants are bracing for the release of February’s Consumer Price Index (CPI) on Wednesday, expected to provide key insights into inflation trends.
The Federal Reserve enters its blackout period ahead of the March 19 meeting, limiting central bank commentary for the week.
Fed Chair Jerome Powell reiterated on Friday that the Fed remains patient and does not see an urgent need to act, preferring to wait for additional economic data before making any policy changes.
US equities face a sharp correction, with the Nasdaq leading losses, down 3.3%.
CME FedWatch Tool indicates a majority expectation for rates to remain at current levels in May, while June rate cut expectations have risen significantly.
Ahead of the blackout media period, the Fed’s sentiment index on the daily chart has fallen towards neutral ground, which could also explain the USD’s decline.
DXY technical outlook: Testing support near 103.50
The US Dollar Index (DXY) stabilizes below 104.00, consolidating after last week’s steep drop. The 20-day and 100-day Simple Moving Averages (SMA) confirmed a bearish crossover near 107.00, reinforcing the negative trend. The Relative Strength Index (RSI) remains near oversold territory, signaling potential for a short-term rebound. Meanwhile, the Moving Average Convergence Divergence (MACD) remains bearish, suggesting further downside risk unless buyers step in near support levels. If DXY fails to reclaim 104.50, the next support is seen near 103.30, which could determine whether a deeper decline unfolds.
Inflation FAQs
Inflation measures the rise in the price of a representative basket of goods and services. Headline inflation is usually expressed as a percentage change on a month-on-month (MoM) and year-on-year (YoY) basis. Core inflation excludes more volatile elements such as food and fuel which can fluctuate because of geopolitical and seasonal factors. Core inflation is the figure economists focus on and is the level targeted by central banks, which are mandated to keep inflation at a manageable level, usually around 2%.
The Consumer Price Index (CPI) measures the change in prices of a basket of goods and services over a period of time. It is usually expressed as a percentage change on a month-on-month (MoM) and year-on-year (YoY) basis. Core CPI is the figure targeted by central banks as it excludes volatile food and fuel inputs. When Core CPI rises above 2% it usually results in higher interest rates and vice versa when it falls below 2%. Since higher interest rates are positive for a currency, higher inflation usually results in a stronger currency. The opposite is true when inflation falls.
Although it may seem counter-intuitive, high inflation in a country pushes up the value of its currency and vice versa for lower inflation. This is because the central bank will normally raise interest rates to combat the higher inflation, which attract more global capital inflows from investors looking for a lucrative place to park their money.
Formerly, Gold was the asset investors turned to in times of high inflation because it preserved its value, and whilst investors will often still buy Gold for its safe-haven properties in times of extreme market turmoil, this is not the case most of the time. This is because when inflation is high, central banks will put up interest rates to combat it. Higher interest rates are negative for Gold because they increase the opportunity-cost of holding Gold vis-a-vis an interest-bearing asset or placing the money in a cash deposit account. On the flipside, lower inflation tends to be positive for Gold as it brings interest rates down, making the bright metal a more viable investment alternative.
Mexican Peso snaps four-day winning streak as risk sentiment sours.
Dismal Mexican Consumer Confidence adds pressure to the Peso as outlook worsens for next year.
US recession fears escalate as Trump avoids questions on economic slowdown.
Despite USD weakness, safe-haven flows hurt EM currencies like the Peso.
The Mexican Peso depreciates against the US Dollar on Monday, snapping four days of consecutive losses against the emerging market currency as investors eye the release of crucial inflation figures in the United States (US). Meanwhile, the deterioration of Mexican Consumer Confidence weighed on the Peso, which is up 2.60% against the Greenback so far in 2025. The USD/MXN trades at 20.31, up 0.31%.
A dismal market mood drives the USD/MXN exchange rate higher on fears of a US recession. President Donald Trump's controversial trade policies sent the US stock market into a tailspin, while he dodged a question about a possible recession.
Across the south of the border, Consumer Confidence revealed by the Instituto Nacional de Estadistica Geografia e Informatica (INEGI) showed that consumers continued to get pessimistic about the current economic situation and about the outlook of the country in the 12 months from now.
In the meantime, fears that the US economy could be tipped into a recession or a stagflationary scenario keep investors leaning into safe-have currencies to the detriment of Emerging Market (EM) currencies like the Peso.
Despite this, the Greenback extended its losses against most G10 FX currencies. The US Dollar Index (DXY) tracks the buck's performance against a basket of six other currencies, down 0.14% to 103.76.
This week, Mexico’s economic docket will feature Industrial Production data. In the US, the schedule would reveal the JOLTs Job Openings data on Tuesday, followed by the Consumer Price Index (CPI) release on Wednesday.
Daily digest market movers: Mexican Peso pressured by US trade rhetoric
Mexico’s Consumer Confidence dropped from 46.6 to 46.3, revealed INEGI.
This data alongside with the ongoing disinflation process in Mexico, despite the recent uptick on headline and core prices, suggests Banco de Mexico (Banxico) could cut interest rates at the upcoming March 27 meeting.
Banxico’s private economist survey showed that headline inflation is forecast to end at 3.71%, while core CPI is expected to finish at 3.75%. The USD/MXN exchange rate is projected to end at 20.85 in 2025, slightly lower than the 20.90 projection in the previous survey. However, for 2026, they anticipate a sharper depreciation of the Peso, well beyond the 21.30 level expected in January’s poll.
The New York Fed Consumer Sentiment Survey revealed that inflation expectations for one year in February increased from 3% to 3.1%. For the three and five-year periods, they remained unchanged at 3%. Americans expect price increases in gas, rent and food.
A Reuters poll showed that 70 out of 74 economists say the risk of recession has risen in the US, Canada and Mexico.
Expectations that the Federal Reserve would ease policy had risen due to recession fears. Market participants estimate 80 basis points of easing toward year-end, revealed data from the Chicago Board of Trade.
In the boiler room, trade disputes between the US and Mexico remain front and center. If the countries could agree, it would pave the way for a recovery of the Mexican currency. Otherwise, further USD/MXN upside is seen as US tariffs could trigger a recession in Mexico.
USD/MXN technical outlook: Mexican Peso weakens as USD/MXN climbs past 20.30
The USD/MXN trades sideways, unable to break the 20.20-21.00 figure range for the latest five weeks. However, as of writing, traders are testing the 100-day Simple Moving Average (SMA) at 20.34, which if broken would pave the way to test the 20.50. If surpassed, the next key resistance levels would be the March 4 peak at 20.99 and the year-to-date (YTD) peak of 21.28.
Conversely, if USD/MXN hurdles the 20.20 support, the next floor would be the 20.00 figure, ahead of challenging the 200-day SMA at 19.59.
Mexican Peso FAQs
The Mexican Peso (MXN) is the most traded currency among its Latin American peers. Its value is broadly determined by the performance of the Mexican economy, the country’s central bank’s policy, the amount of foreign investment in the country and even the levels of remittances sent by Mexicans who live abroad, particularly in the United States. Geopolitical trends can also move MXN: for example, the process of nearshoring – or the decision by some firms to relocate manufacturing capacity and supply chains closer to their home countries – is also seen as a catalyst for the Mexican currency as the country is considered a key manufacturing hub in the American continent. Another catalyst for MXN is Oil prices as Mexico is a key exporter of the commodity.
The main objective of Mexico’s central bank, also known as Banxico, is to maintain inflation at low and stable levels (at or close to its target of 3%, the midpoint in a tolerance band of between 2% and 4%). To this end, the bank sets an appropriate level of interest rates. When inflation is too high, Banxico will attempt to tame it by raising interest rates, making it more expensive for households and businesses to borrow money, thus cooling demand and the overall economy. Higher interest rates are generally positive for the Mexican Peso (MXN) as they lead to higher yields, making the country a more attractive place for investors. On the contrary, lower interest rates tend to weaken MXN.
Macroeconomic data releases are key to assess the state of the economy and can have an impact on the Mexican Peso (MXN) valuation. A strong Mexican economy, based on high economic growth, low unemployment and high confidence is good for MXN. Not only does it attract more foreign investment but it may encourage the Bank of Mexico (Banxico) to increase interest rates, particularly if this strength comes together with elevated inflation. However, if economic data is weak, MXN is likely to depreciate.
As an emerging-market currency, the Mexican Peso (MXN) tends to strive during risk-on periods, or when investors perceive that broader market risks are low and thus are eager to engage with investments that carry a higher risk. Conversely, MXN tends to weaken at times of market turbulence or economic uncertainty as investors tend to sell higher-risk assets and flee to the more-stable safe havens.
The Dow Jones backslid another 700 points on Monday.
Investor sentiment continues to worsen as market mood sours.
Key US CPI and PPI inflation prints are due later this week.
The Dow Jones Industrial Average (DJIA) took another leg lower on Monday, kicking off the new trading week with a fresh 700-point decline. The Dow Jones backslid into fresh lows below 42,100 as fears of an economic downturn continue to grow and the Trump administration roils global markets with its haphazard, on-again-off-again tariff policy.
It’s a quiet start to the week on the economic data docket, but that all changes on Wednesday when the latest round of Consumer Price Index (CPI) inflation figures for February hit markets. Median market forecasts expect a slight cooling in headline and core CPI numbers. Headline CPI inflation in February is expected to ease to 0.3% MoM from 0.5%, while core monthly CPI is expected to tick down to a matching 0.3% from 0.4%. Annualized CPI is similarly expected to drop slightly to 2.9% YoY from 3.0%, while core CPI for the year ended in February is forecast t tick down to 3.2% from 3.3%.
Despite their ambiguous existence, markets are still feeling the bearish pressure from US President Donald Trump’s ham-handed tariff threats, which the Trump administration continues to pivot endlessly around. The White House team is struggling to enact steep tariffs on the US’ closest trading partners to generate government income to offset steep deficits coming from President Trump’s planned tax cuts. However, execution is proving difficult as the loudest opponents to team Trump’s tariff proposals are overwhelmingly US consumers and businesses facing steep spending and operating cost increases as counter-tariffs target key US industries and sectors.
The Trump administration faced down questions about a possible recession in the US economy, waving the subject off and branding an economic downturn as a “transition” period.
Dow Jones news
Despite Monday’s steep decline in the overall index, some listed securities held on the high side for the day. Amgen (AMGN) rose 2.3%, climbing above $332 per share as the pharma giant explores adding its own weight loss drug to the field.
Losses were concentrated in tech and banking stocks on Monday, with Apple (AAPL) and Goldman Sachs (GS) falling 5.8% and 5.6%, respectively. Apple fell to $225 per share and Goldman Sachs sank to $528 per share as recession fears and tariff concerns weighed on profit-led industries.
Dow Jones price forecast
The Dow Jones Industrial Average continues to grind its way toward the 200-day Exponential Moving Average (EMA) just below the 42,000 major price handle. The Dow Jones hit a fresh 8-week low on Monday, adding to the major equity index’s 6.55% decline from the last swing high just above the 45,000 level.
Dow Jones daily chart
Dow Jones FAQs
The Dow Jones Industrial Average, one of the oldest stock market indices in the world, is compiled of the 30 most traded stocks in the US. The index is price-weighted rather than weighted by capitalization. It is calculated by summing the prices of the constituent stocks and dividing them by a factor, currently 0.152. The index was founded by Charles Dow, who also founded the Wall Street Journal. In later years it has been criticized for not being broadly representative enough because it only tracks 30 conglomerates, unlike broader indices such as the S&P 500.
Many different factors drive the Dow Jones Industrial Average (DJIA). The aggregate performance of the component companies revealed in quarterly company earnings reports is the main one. US and global macroeconomic data also contributes as it impacts on investor sentiment. The level of interest rates, set by the Federal Reserve (Fed), also influences the DJIA as it affects the cost of credit, on which many corporations are heavily reliant. Therefore, inflation can be a major driver as well as other metrics which impact the Fed decisions.
Dow Theory is a method for identifying the primary trend of the stock market developed by Charles Dow. A key step is to compare the direction of the Dow Jones Industrial Average (DJIA) and the Dow Jones Transportation Average (DJTA) and only follow trends where both are moving in the same direction. Volume is a confirmatory criteria. The theory uses elements of peak and trough analysis. Dow’s theory posits three trend phases: accumulation, when smart money starts buying or selling; public participation, when the wider public joins in; and distribution, when the smart money exits.
There are a number of ways to trade the DJIA. One is to use ETFs which allow investors to trade the DJIA as a single security, rather than having to buy shares in all 30 constituent companies. A leading example is the SPDR Dow Jones Industrial Average ETF (DIA). DJIA futures contracts enable traders to speculate on the future value of the index and Options provide the right, but not the obligation, to buy or sell the index at a predetermined price in the future. Mutual funds enable investors to buy a share of a diversified portfolio of DJIA stocks thus providing exposure to the overall index.
EUR/USD was seen trading near the 1.0830 area after the European session, posting mild gains on Monday.
Following a strong rally of over 4% last week, the pair enters a consolidation phase, potentially stabilizing above the 200-day SMA near 1.0780.
Technical indicators remain in positive territory, though the RSI is slightly declining from overbought conditions, signaling a possible slowdown in momentum.
The EUR/USD pair extended its bullish momentum on Monday, trading near the 1.0830 zone after the European session. Despite the mild gains, the pair appears to be entering a consolidation phase after last week’s sharp surge, during which it added more than 4%. The recent slowdown could indicate that bulls are reassessing their positions, with technical indicators suggesting a potential cooling-off period.
The Relative Strength Index (RSI) remains in overbought territory but has started to decline slightly, hinting at fading upside pressure. Meanwhile, the Moving Average Convergence Divergence (MACD) continues to print rising green bars, reflecting sustained buying interest, though at a moderating pace. Given this setup, further gains may be capped in the short term unless fresh catalysts emerge.
On the support side, the key level to watch is the 200-day Simple Moving Average (SMA) at 1.0780, which may act as a floor for price action. A decisive drop below this level could see the pair correcting toward 1.0750. On the upside, immediate resistance is seen around the 1.0850 zone, with stronger hurdles near 1.0900.
Trump warns of economic turbulence due to ongoing "period of transition."
US recession fears rise, fueling bets for 80 bps of Fed rate cuts in 2025.
DXY weakens to 103.76 as investors shift to safe-haven currencies.
Traders eye US CPI on Wednesday and UK GDP figures on Friday for direction.
The Pound Sterling consolidates within familiar levels against the US Dollar amid a scarce economic docket on Monday. Key US inflation data and the UK’s Gross Domestic Product (GDP) figures are due later in the week. The GBP/USD trades at 1.2915, up 0.04%.
Sterling steady amid US inflation concerns and UK GDP anticipation
Sentiment remains dismal due to concerns about US President Donald Trump's trade policies. On Friday he said that his policies could lead to economic turbulence in the short term due to an undergoing “period of transition” because of what he’s doing is very “big.”
In the meantime, fears that the US economy could be tipped into a recession or, worse, a stagflationary scenario keep investors leaning into safe-have currencies like the Swiss Franc and the Japanese Yen. Consequently, expectations that the Federal Reserve (Fed) would ease policy had risen, with market participants estimating 80 basis points of easing towards year-end, revealed data from the Chicago Board of Trade (CBOT).
Meanwhile, the Greenback extended its losses, with the US Dollar Index (DXY), which tracks the performance of the buck against a basket of six other currencies, down 0.14% at 103.76.
The New York Fed Consumer Sentiment Survey revealed that inflation expectations for one year in February increased from 3% to 3.1%. For the three—and five-year periods, they remained unchanged at 3%. Americans expect price increases in gas, rent, and food.
This week, the US economic docket will feature the JOLTs Job Opening on Tuesday, followed by the release of the Consumer Price Index (CPI) on Wednesday. Across the pond, GBP/USD traders will eye GDP figures on Friday.
GBP/USD Price Forecast: Technical outlook
The GBP/USD trades sideways for the second straight day, unable to crack the 1.2950 figure decisively. The price action suggests that the pair is poised to edge higher. Nevertheless, the Relative Strength Index (RSI) indicates that the pair is overbought, and an appreciation of the US Dollar could drive the GBP/USD to challenge the 200-day Simple Moving Average (SMA) at 1.2788.
Conversely, if GBP/USD climbs past 1.2950, expect a test of the 1.3000 mark.
British Pound PRICE Today
The table below shows the percentage change of British Pound (GBP) against listed major currencies today. British Pound was the strongest against the Canadian Dollar.
USD
EUR
GBP
JPY
CAD
AUD
NZD
CHF
USD
0.00%
0.05%
-0.68%
0.35%
-0.07%
-0.20%
-0.06%
EUR
0.00%
0.01%
-0.68%
0.36%
0.02%
-0.22%
-0.18%
GBP
-0.05%
-0.01%
-0.74%
0.32%
0.01%
-0.29%
-0.12%
JPY
0.68%
0.68%
0.74%
1.02%
0.67%
0.39%
0.69%
CAD
-0.35%
-0.36%
-0.32%
-1.02%
-0.45%
-0.54%
-0.44%
AUD
0.07%
-0.02%
-0.01%
-0.67%
0.45%
-0.24%
-0.17%
NZD
0.20%
0.22%
0.29%
-0.39%
0.54%
0.24%
0.21%
CHF
0.06%
0.18%
0.12%
-0.69%
0.44%
0.17%
-0.21%
The heat map shows percentage changes of major currencies against each other. The base currency is picked from the left column, while the quote currency is picked from the top row. For example, if you pick the British Pound from the left column and move along the horizontal line to the US Dollar, the percentage change displayed in the box will represent GBP (base)/USD (quote).
USD/CHF slumps to a three-month low near 0.8760 amid firm safe-haven demand for the Swiss Franc.
The US economy is expected to face economic shocks in the near term.
Investors see the SNB easing the monetary policy further due to price pressures remaining lower.
The USD/CHF pair posts a fresh three-month low around 0.8760 at the start of the week. The pair weakens as the safe-haven demand of the Swiss Franc (CHF) increases amid deepening concerns over the United States (US) economic outlook.
Investors see the US economy to face economic turbulence in the near term as the “America First” agenda of President Donald Trump is expected to result in a slowdown in the overall demand. On Friday, Trump said in an interview with Fox News that there is a period of “transition”, because what we are doing is very “big”.
Fears of a US growth slowdown have prompted expectations that the Federal Reserve (Fed) could cut interest rates in the June policy meeting. According to the CME FedWatch tool, the likelihood for the Fed to cut interest rates in June has increased to 82% from 54% a month ago.
In the Swiss economy, the Swiss National Bank (SNB) is expected to continue reducing interest rates amid persistently lower inflationary pressures. In February, the Consumer Price Index (CPI) rose by 0.3%, faster than estimates of 0.2% but decelerated from 0.4% in January.
USD/CHF slides sharply after failing to revisit its 15-month high around 0.9245. The outlook of the Swiss Franc pair has become uncertain as it has dropped below the 20-week Exponential Moving Average (EMA), which trades around near 0.8920.
The 14-week Relative Strength Index (RSI) slides to near 40.00. A bearish momentum would be triggered if the RSI falls below that level.
The asset would face more downside toward the November 8 low of 0.8700 and the November 6 low of 0.8620 if it falls below the December 6 low of 0.8735.
On the flip side, a recovery move above the psychological support of 0.9000 would drive the asset towards the February 28 high of 0.9036, followed by the round-level resistance of 0.9100.
USD/CHF weekly chart
Swiss Franc FAQs
The Swiss Franc (CHF) is Switzerland’s official currency. It is among the top ten most traded currencies globally, reaching volumes that well exceed the size of the Swiss economy. Its value is determined by the broad market sentiment, the country’s economic health or action taken by the Swiss National Bank (SNB), among other factors. Between 2011 and 2015, the Swiss Franc was pegged to the Euro (EUR). The peg was abruptly removed, resulting in a more than 20% increase in the Franc’s value, causing a turmoil in markets. Even though the peg isn’t in force anymore, CHF fortunes tend to be highly correlated with the Euro ones due to the high dependency of the Swiss economy on the neighboring Eurozone.
The Swiss Franc (CHF) is considered a safe-haven asset, or a currency that investors tend to buy in times of market stress. This is due to the perceived status of Switzerland in the world: a stable economy, a strong export sector, big central bank reserves or a longstanding political stance towards neutrality in global conflicts make the country’s currency a good choice for investors fleeing from risks. Turbulent times are likely to strengthen CHF value against other currencies that are seen as more risky to invest in.
The Swiss National Bank (SNB) meets four times a year – once every quarter, less than other major central banks – to decide on monetary policy. The bank aims for an annual inflation rate of less than 2%. When inflation is above target or forecasted to be above target in the foreseeable future, the bank will attempt to tame price growth by raising its policy rate. Higher interest rates are generally positive for the Swiss Franc (CHF) as they lead to higher yields, making the country a more attractive place for investors. On the contrary, lower interest rates tend to weaken CHF.
Macroeconomic data releases in Switzerland are key to assessing the state of the economy and can impact the Swiss Franc’s (CHF) valuation. The Swiss economy is broadly stable, but any sudden change in economic growth, inflation, current account or the central bank’s currency reserves have the potential to trigger moves in CHF. Generally, high economic growth, low unemployment and high confidence are good for CHF. Conversely, if economic data points to weakening momentum, CHF is likely to depreciate.
As a small and open economy, Switzerland is heavily dependent on the health of the neighboring Eurozone economies. The broader European Union is Switzerland’s main economic partner and a key political ally, so macroeconomic and monetary policy stability in the Eurozone is essential for Switzerland and, thus, for the Swiss Franc (CHF). With such dependency, some models suggest that the correlation between the fortunes of the Euro (EUR) and the CHF is more than 90%, or close to perfect.
Last week’s headlines centered around Trump’s tariffs, US growth risks, Ukraine, European defense and German fiscal policy, Rabobank's FX analyst Jane Foley reports.
EUR/GBP to hold around the 0.84 area in the weeks ahead
"China, Canada, and Japan managed to steal a little of the limelight, but amid the fast-moving news-flow, there was very little space to digest the latest UK events. For UK Chancellor Reeves, this was probably both good and bad. The attention she received at the start of the year in response to the wobble in the gilts market was no doubt unwelcome."
"That said, last week’s news that the government is lining up welfare cuts ahead of her March 26 Spring Statement was likely very deliberately timed to ensure that the event itself would create a minimum of market reaction. Assuming that the Labour government can win the support of its own MPs for welfare reform, the market is likely to welcome some fiscal consolidation from the UK."
"That said, the dynamics for EUR/GBP have been altered by the news from the German coalition-to-be last week. As a result we have adjusted our 12-month forecast for EUR/GBP higher across the board and now have an end-of-year forecast of 0.83 from a previous estimate of 0.8150. We expect EUR/GBP to hold around the 0.84 area in the weeks ahead"
The Federal Reserve (Fed) will conduct its two-day monetary policy meeting next week and announce its decisions on March 19. Until then, the Fed will be in the blackout period, during which policymakers and officials will not be allowed to comment on the policy outlook.
According to the CME FedWatch Tool, markets virtually see no chance of a 25 basis points (bps) rate cut next week. The probability of a rate reduction in May currently stands at around 40%.
In the meantime, FXStreet (FXS) Fed Sentiment Index stays in the neutral territory, slightly below 100. Following the January meeting, the Fed left policy settings unchanged, as widely anticipated. The policy statement, however, adopted a cautious tone regarding further policy easing in the near future, citing the uncertainty surrounding the impact of policy changes. In turn, the FXS Fed Sentiment Index climbed above 120.
Comments from Fed officials following the January meeting, however, caused the FXS Fed Sentiment Index to turn south.
In his last public appearance before the beginning of the blackout period, Fed Chairman Jerome Powell noted that the policy is not on a preset course. "We can maintain policy restraint for longer if inflation progress stalls or ease if labor market unexpectedly weakens or inflation falls more than expected," Powell noted. On a more dovish note, San Francisco Fed President Mary Daly said that the elevated uncertainty about the economy and policies could weigh on demand. She further argued that they should be careful and deliberate with monetary policy.
Meanwhile, the US Dollar (USD) has been struggling to stay resilient against its rivals. Disappointing macroeconomic data releases, combined with US President Donald Trump's tariffs, revived fears over an economic downturn in the US and weighed heavily on the USD. The USD Index, which tracks the USD's performance against a basket of six major currencies, was last seen losing about 3.5% since the beginning of March, after falling nearly 1% in February.
Fed’s Bowman: Rate decisions will look at jobs, economic activity
Fed's Beige Book: Price increases ahead of tariffs could spell trouble for inflation
Tariffs FAQs
Tariffs are customs duties levied on certain merchandise imports or a category of products. Tariffs are designed to help local producers and manufacturers be more competitive in the market by providing a price advantage over similar goods that can be imported. Tariffs are widely used as tools of protectionism, along with trade barriers and import quotas.
Although tariffs and taxes both generate government revenue to fund public goods and services, they have several distinctions. Tariffs are prepaid at the port of entry, while taxes are paid at the time of purchase. Taxes are imposed on individual taxpayers and businesses, while tariffs are paid by importers.
There are two schools of thought among economists regarding the usage of tariffs. While some argue that tariffs are necessary to protect domestic industries and address trade imbalances, others see them as a harmful tool that could potentially drive prices higher over the long term and lead to a damaging trade war by encouraging tit-for-tat tariffs.
During the run-up to the presidential election in November 2024, Donald Trump made it clear that he intends to use tariffs to support the US economy and American producers. In 2024, Mexico, China and Canada accounted for 42% of total US imports. In this period, Mexico stood out as the top exporter with $466.6 billion, according to the US Census Bureau. Hence, Trump wants to focus on these three nations when imposing tariffs. He also plans to use the revenue generated through tariffs to lower personal income taxes.
AUD/USD climbs to near 0.6330 amid deepening concerns over the US economic outlook.
Investors see US economic shocks in near term amid Trump’s tariff agenda.
Soft China inflation data to dampen the Aussie Dollar’s outlook.
The AUD/USD pair rises sharply to near 0.6330 in North American trading hours on Monday. The Aussie pair attracts significant bids as the US Dollar (USD) trades cautiously, with investors turning cautious over the United States (US) economic outlook. The US Dollar Index (DXY), which tracks the Greenback’s value against six major currencies, trades around 103.50, the lowest level seen in four months.
The S&P500 is down almost 1.5% in the North American session, indicating a significant decline in investors’ risk appetite.
Market participants have become increasingly concerned over US growth prospects after commentary from US President Donald Trump on Friday that there is a “period of transition”, because what we are doing is very “big” in an interview with Fox News. Investors have taken Trump’s comments as a signal to an economic turbulence in the near term.
Additionally, weakness in a slew of economic data released lately has also flagged uncertainty over the US economic path. The US Consumer Confidence slumped to 15-month low, the ISM Manufacturing New Orders Index declined and the Unemployment Rate accelerated in February.
Meanwhile, the Australian Dollar (AUD) trades higher despite faster-than-expected slowdown in the China’s Consumer Price Index (CPI) data for February. Month-on-month CPI deflated by 0.2% after growing by 0.7% in January. Economists expected the inflation data to have deflated by 0.1%. On year, the CPI declined by 0.7% against estimates of 0.5% deflation. Persistently lower inflationary pressures indicate significant weakness in the Chinese economy. Such a scenario is unfavorable for the Aussie Dollar, knowing that Australia relies heavily on exports to China.
This week, the Australian economic calendar will be light. Therefore, investors will pay close attention to the US data to project the next move in the Aussie pair. Investors will focus closely on the US CPI data for February, which will be released on Wednesday.
Australian Dollar FAQs
One of the most significant factors for the Australian Dollar (AUD) is the level of interest rates set by the Reserve Bank of Australia (RBA). Because Australia is a resource-rich country another key driver is the price of its biggest export, Iron Ore. The health of the Chinese economy, its largest trading partner, is a factor, as well as inflation in Australia, its growth rate and Trade Balance. Market sentiment – whether investors are taking on more risky assets (risk-on) or seeking safe-havens (risk-off) – is also a factor, with risk-on positive for AUD.
The Reserve Bank of Australia (RBA) influences the Australian Dollar (AUD) by setting the level of interest rates that Australian banks can lend to each other. This influences the level of interest rates in the economy as a whole. The main goal of the RBA is to maintain a stable inflation rate of 2-3% by adjusting interest rates up or down. Relatively high interest rates compared to other major central banks support the AUD, and the opposite for relatively low. The RBA can also use quantitative easing and tightening to influence credit conditions, with the former AUD-negative and the latter AUD-positive.
China is Australia’s largest trading partner so the health of the Chinese economy is a major influence on the value of the Australian Dollar (AUD). When the Chinese economy is doing well it purchases more raw materials, goods and services from Australia, lifting demand for the AUD, and pushing up its value. The opposite is the case when the Chinese economy is not growing as fast as expected. Positive or negative surprises in Chinese growth data, therefore, often have a direct impact on the Australian Dollar and its pairs.
Iron Ore is Australia’s largest export, accounting for $118 billion a year according to data from 2021, with China as its primary destination. The price of Iron Ore, therefore, can be a driver of the Australian Dollar. Generally, if the price of Iron Ore rises, AUD also goes up, as aggregate demand for the currency increases. The opposite is the case if the price of Iron Ore falls. Higher Iron Ore prices also tend to result in a greater likelihood of a positive Trade Balance for Australia, which is also positive of the AUD.
The Trade Balance, which is the difference between what a country earns from its exports versus what it pays for its imports, is another factor that can influence the value of the Australian Dollar. If Australia produces highly sought after exports, then its currency will gain in value purely from the surplus demand created from foreign buyers seeking to purchase its exports versus what it spends to purchase imports. Therefore, a positive net Trade Balance strengthens the AUD, with the opposite effect if the Trade Balance is negative.
Pound Sterling (GBP) is little changed on the session, Scotiabank's Chief FX Strategist Shaun Osborne notes.
GBP little changed on the day
"There were no major data reports from the UK this morning, but a KPMG survey revealed a slowdown in hiring and starting pay, according to recruiters, offering further signs that the UK jobs market is cooling."
"GBP is consolidating around retracement resistance (1.2924—61.8% Fibonacci of the 1.34/1.21 decline) as gains lag the advance in the EUR somewhat. Trend momentum remains bullish on the intraday and daily oscillators, however, and the pound should see firm support on dips to the 1.2850/75 zone. A clear push through the low 1.29s targets 1.3120."
The EUR is steady on the day, Scotiabank's Chief FX Strategist Shaun Osborne notes.
EUR retains bullish undertone
"German data earlier revealed a larger than expected rise in Industrial Production (2.0% in the January month, above forecasts for a 1.5% gain) while Germany also reported a smaller than expected trade surplus (EUR16bn) for January."
"EZ/US short-term spreads have steadied but the EUR may not have fully digested the recent narrowing in differentials. Our fair value estimate for spot has improved to 1.0979, suggesting still significant upside potential in the EUR in the short run."
"Spot is consolidating but the bull trend remains firmly established on the short– and medium-term oscillators. Solid gains through 1.0805 resistance (now support) targets further gains to the mid/upper 1.10s in the short run— and possibly a retest of the late September peak at 1.1215."
The Canadian Dollar (CAD) is little changed over the weekend vs the US Dollar (USD). It remains to be seen what Mark Carney’s win in the Liberal leadership election means for Canada and markets. The formal handover from Trudeau will take place in the next few days and Carney might then decide call an election, Scotiabank's Chief FX Strategist Shaun Osborne notes.
Technical signals remain somewhat mixed
"Or he could try and hold out to see if polls continue to shift in his favour. Meanwhile, President Trump will stick with tariffs on steel and aluminum, due Wednesday, Commerce Sec. Lutnick said at the weekend, as questions remain around the chaotic roll out of tariff action from the White House recently."
"The CAD may be able to stabilize in the short run. With 25% borders tariffs delayed until April at least, the USD is overvalued relative to the tariff regime that we have. Scope for CAD gains is not all that great; spreads have narrowed but remain significantly in the USD’s favour ahead of Wednesday’s BoC decision (when another 1/4-point trim to the overnight rate is likely)."
"A generally weaker USD undertone should help put a floor under the CAD for now. Technical signals remain somewhat mixed. Trend momentum continues to favour the USD but there is resistance to USD gains between1.4475/1.4525 while support for the USD remains 1.4250 and 1.4150."
The US Dollar (USD) is consolidating last week’s heavy losses but the underlying mood across the FX market remains bearish on the USD outlook as investors continue to focus on the negative implications of President Trump’s economic agenda, Scotiabank's Chief FX Strategist Shaun Osborne notes.
USD remains soft and prone to more losses
"Growth concerns are rising, with the president underscoring the uncertain outlook ahead at the weekend, noting that the US economy is facing “a period of transition”. A look across markets this morning shows EM stocks and FX underperforming, with soft equity sentiment spilling over into European equities and US futures; E-minis are down 1% or so at writing. Bonds are finding a haven bid amid growth worries, with US Treasurys leading gains across G10 markets (10Y yields down 6bps on the day) on slowdown concerns."
"The JPY is taking advantage of lower US yields to retest USD support at 147; USD losses here risk extending to 144. The EUR retains a firm undertone but is trading a little below Friday’s peak. USD weakness looks poised to extend as sentiment continues to weaken. CFTC data Friday showed a further slide in aggregate USD long positioning while risk reversal pricing reflects a sharp fall in the demand for Bloomberg dollar index calls versus puts, reflecting the clear turn in the USD mood over the past week especially."
"Technically, the DXY looks prone to another 2-4% decline in the coming weeks. It’s a quiet start to the week on the data front. The NY Fed’s inflation expectations data will generate some interest, given the FOMC’s focus on the issue lately. CPI and PPI data later this week plus the U. Michigan Sentiment data Friday are the key releases over the next few days."
The US Dollar trades broadly flat on Monday as traders mull the economic situation in the US.
Fed Chairman Powell commented on Friday the central bank does not need to make any move right now.
The US Dollar Index hangs on to 103.50, though it faces concerns from traders.
The US Dollar Index (DXY), which tracks the performance of the US Dollar (USD) against six major currencies, trades in a very mixed pattern on Monday and holds above the four-month low of 103.50 set on Friday. Traders are mulling the recent comments from United States (US) President Donald Trump, who commented on the US economy during a Fox News interview over the weekend. The President said the US economy is in a transition period, which comes with a little bit of pain, whilst markets in recent days have questioned if the US economy is not in a recession.
On the economic data front, the focus for this week will be the Consumer Price Index (CPI) data for February on Wednesday. Besides that, it will be a very quiet week on the Federal Reserve (Fed) front as the central bank has started its blackout period ahead of the March 19 meeting.
Traders got to hear from Fed Chairman Jerome Powell on Friday evening. Powell said that the Fed does not need to do anything at this very moment while monitoring incoming data. He also acknowledged the rising economic uncertainties in the US but said they do not need to rush to adjust policy.
Daily digest market movers: A calm start to the week
It is a very calm start to the week with a near-empty economic calendar. Only the US Treasury will auction a 3-month and a 6-month bill at 15:30 GMT.
During a Fox News interview over the weekend, US President Donald Trump said the economy faced “a period of transition” as he pressed on with his focus on tariffs and federal job cuts, Bloomberg reports.
Former Bank of Canada (BoC) and Bank of England (BoE) Governor Mark Carney has won the race to replace Justin Trudeau as the new Canada Prime Minister. The upcoming Prime Minister vowed to win the trade war with President Trump, CNN reported.
Equities face some Monday gloom and are in the red across the board in China, Europe, and US equity futures ahead of the US trading session.
The CME Fedwatch Tool projects a 63.0% chance of interest rates kept in the current range of 4.25%-4.50% in the May meeting. Probabilities of interest ates being lower in June stands at 85.8%.
The US 10-year yield trades around 4.26%, off its near five-month low of 4.10% printed on Tuesday.
US Dollar Index Technical Analysis: Pressured on US economic concerns
The US Dollar Index (DXY) is under pressure and looks for direction on Monday after some headlines about US President Donald Trump over the weekend. Markets are still mulling whether the US economy is or will be in a recession as President Trump powers through with his tariffs and reciprocal levies by April. Should the US Consumer Price Index (CPI) data reveal a substantial resurgence in inflation later this week, recession fears would spark even more.
There is an upside risk at 104.00 for a firm rejection. If bulls can avoid that, look for a large sprint higher towards the 105.00 round level, with the 200-day Simple Moving Average (SMA) at 105.03. Once broken through that zone, a string of pivotal levels, such as 105.53 and 105.89, will present as caps.
On the downside, the 103.00 round level could be considered a bearish target in case US yields roll off again, with even 101.90 not unthinkable if markets further capitulate on their long-term US Dollar holdings.
US Dollar Index: Daily Chart
US-China Trade War FAQs
Generally speaking, a trade war is an economic conflict between two or more countries due to extreme protectionism on one end. It implies the creation of trade barriers, such as tariffs, which result in counter-barriers, escalating import costs, and hence the cost of living.
An economic conflict between the United States (US) and China began early in 2018, when President Donald Trump set trade barriers on China, claiming unfair commercial practices and intellectual property theft from the Asian giant. China took retaliatory action, imposing tariffs on multiple US goods, such as automobiles and soybeans. Tensions escalated until the two countries signed the US-China Phase One trade deal in January 2020. The agreement required structural reforms and other changes to China’s economic and trade regime and pretended to restore stability and trust between the two nations. However, the Coronavirus pandemic took the focus out of the conflict. Yet, it is worth mentioning that President Joe Biden, who took office after Trump, kept tariffs in place and even added some additional levies.
The return of Donald Trump to the White House as the 47th US President has sparked a fresh wave of tensions between the two countries. During the 2024 election campaign, Trump pledged to impose 60% tariffs on China once he returned to office, which he did on January 20, 2025. With Trump back, the US-China trade war is meant to resume where it was left, with tit-for-tat policies affecting the global economic landscape amid disruptions in global supply chains, resulting in a reduction in spending, particularly investment, and directly feeding into the Consumer Price Index inflation.
12:01
Mexico Consumer Confidence dipped from previous 47.1 to 46.5 in February
12:01
Mexico Consumer Confidence s.a declined to 46.3 in February from previous 46.7
EUR/JPY tumbles to near 159.00 as the safe-haven demand of the Yen increases.
The BoJ is expected to raise interest rates again this year.
Investors anticipate German debt reforms to accelerate inflationary pressures.
The EUR/JPY pair falls sharply to near 159.00 in European trading hours on Monday. The pair faces sharp selling pressure as the Japanese Yen (JPY) outperforms across the board amid dismal market sentiment.
Deepening doubts over the United States (US) economic outlook under the administration of President Donald Trump has increased the safe-haven appeal of assets, such as the Yen and Swiss Franc (CHF). Meanwhile, the US Dollar is facing strong selling pressure as signs of a slowdown in the US economy have prompted Federal Reserve (Fed) dovish bets.
Japanese Yen PRICE Today
The table below shows the percentage change of Japanese Yen (JPY) against listed major currencies today. Japanese Yen was the strongest against the Canadian Dollar.
USD
EUR
GBP
JPY
CAD
AUD
NZD
CHF
USD
-0.16%
-0.03%
-0.68%
0.06%
-0.31%
-0.29%
-0.31%
EUR
0.16%
0.09%
-0.53%
0.24%
-0.05%
-0.15%
-0.26%
GBP
0.03%
-0.09%
-0.68%
0.11%
-0.14%
-0.31%
-0.29%
JPY
0.68%
0.53%
0.68%
0.73%
0.42%
0.29%
0.43%
CAD
-0.06%
-0.24%
-0.11%
-0.73%
-0.41%
-0.35%
-0.40%
AUD
0.31%
0.05%
0.14%
-0.42%
0.41%
-0.10%
-0.16%
NZD
0.29%
0.15%
0.31%
-0.29%
0.35%
0.10%
0.06%
CHF
0.31%
0.26%
0.29%
-0.43%
0.40%
0.16%
-0.06%
The heat map shows percentage changes of major currencies against each other. The base currency is picked from the left column, while the quote currency is picked from the top row. For example, if you pick the Japanese Yen from the left column and move along the horizontal line to the US Dollar, the percentage change displayed in the box will represent JPY (base)/USD (quote).
Apart from the safe-haven demand, firm expectations that the Bank of Japan (BoJ) will raise interest rates again this year. Such a scenario would reduce rate differentials of the BoJ against other major central banks.
Meanwhile, the Euro (EUR) is underperforming at the start of the week, except the US Dollar, as investors start digesting German debt reforms. Last week, German leaders agree to stretch borrowing limit or so-called “debt brake” to boost defense spending and stimulate economic growth. Investors expect German debt reforms would boost inflation in the Eurozone.
On Thursday, European Central Bank (ECB) President Christine Lagarde refrained from guiding the impact of German debt restructuring on the monetary policy and the inflation outlook. Lagarde said in the press conference after the policy decision that said the increased defense and infrastructure spending is still a "work in progress" and the ECB "needs time" to understand the impact.
Japanese Yen FAQs
The Japanese Yen (JPY) is one of the world’s most traded currencies. Its value is broadly determined by the performance of the Japanese economy, but more specifically by the Bank of Japan’s policy, the differential between Japanese and US bond yields, or risk sentiment among traders, among other factors.
One of the Bank of Japan’s mandates is currency control, so its moves are key for the Yen. The BoJ has directly intervened in currency markets sometimes, generally to lower the value of the Yen, although it refrains from doing it often due to political concerns of its main trading partners. The BoJ ultra-loose monetary policy between 2013 and 2024 caused the Yen to depreciate against its main currency peers due to an increasing policy divergence between the Bank of Japan and other main central banks. More recently, the gradually unwinding of this ultra-loose policy has given some support to the Yen.
Over the last decade, the BoJ’s stance of sticking to ultra-loose monetary policy has led to a widening policy divergence with other central banks, particularly with the US Federal Reserve. This supported a widening of the differential between the 10-year US and Japanese bonds, which favored the US Dollar against the Japanese Yen. The BoJ decision in 2024 to gradually abandon the ultra-loose policy, coupled with interest-rate cuts in other major central banks, is narrowing this differential.
The Japanese Yen is often seen as a safe-haven investment. This means that in times of market stress, investors are more likely to put their money in the Japanese currency due to its supposed reliability and stability. Turbulent times are likely to strengthen the Yen’s value against other currencies seen as more risky to invest in.
EUR/GBP rose sharply last week fuelled by the sell-off in European fixed income, which was triggered by the outlook of a fundamental change in fiscal spending in Germany, lending support to the broad EUR, Danske Bank's FX analysts Kristoffer Kjær Lomholt and Filip Andersson report.
The cross is thus back to trading close to the 0.84 mark
"While fiscal worries in the UK are taking a back seat, for now, GBP FX tends to perform poorly when uncertainty is high and volatility is elevated. The cross is thus back to trading close to the 0.84 mark."
"While we maintain our strategic bearish view on EUR/GBP fuelled by a hawkish BoE and the expectation of improving UK macro data, we stress that if the heightened volatility and euro-positive story continues, the move higher could extend further in the near-term."
"This week, we look out for monthly UK GDP estimate for January, but more importantly further news regarding the fiscal spending plans in Germany, which are expected to be voted through parliament possibly already this week. We target the cross at 0.81 in 12M."
For CAD FX, all eyes will be on Wednesday, with the BoC meeting at 14:45 CET, where markets and consensus favour a 25bp rate cut, Danske Bank's FX analysts Kristoffer Kjær Lomholt and Filip Andersson report.
USD contunues to weaken
"Likewise, we expect the BoC to continue its easing cycle, cutting the policy rate by 25bp to 2.75% to ensure that the economy is well-prepared for the impact of US tariffs. Hence, tariffs continue to weigh heavily on the Canadian economy and CAD FX. Looking ahead, we project USD/CAD to tick down to 1.41 given stretched short CAD positioning alongside continued broad USD weakening."
USD/JPY has steadily declined from 157 to around 148 YTD, as narrowing US-Japan yield differentials and a volatile global investment environment have generally favoured the JPY, Danske Bank's FX analysts Kristoffer Kjær Lomholt and Filip Andersson report.
USD/JPY to move towards 145
"The currency remains the second-best G10 performer against the USD this year, trailing only SEK. On Friday, we hit our soft target of 147 in our short USD/JPY trade from our FX Top Trades 2025, initiated on January 14. Given further upside potential for the JPY, we maintain our short position in USD/JPY and move the trailing soft target to 145."
EUR/USD has stabilized in the 1.08-1.09 range after a highly volatile week, marking its biggest jump since 2009 following a regime shift in euro area fiscal policy, Danske Bank's FX analysts Kristoffer Kjær Lomholt and Filip Andersson report.
EUR/USD has stabilized in the 1.08-1.09 range
"Friday's February US jobs report had a limited market impact, with NFP slightly below consensus at 151K (cons.: 160K, prior: 125K), while the unemployment rate edged up to 4.1% (cons.: 4.0%, prior: 4.0%). Average hourly earnings moderated to 0.3% m/m, in line with expectations, down from 0.5% in January."
"Fed pricing remains steady, with three full 25bp cuts priced for the year and the first cut expected in June, in line with our forecast. This week is light on data, with key focus on Wednesday's US February CPI release and Friday's Michigan consumer sentiment survey for March."
"We see the broad USD remaining fragile, with the DXY index posting its largest weekly decline since November 2022. Long dollar positioning is likely being unwound as focus shifts toward cyclical US growth rather than tariff developments. We maintain a bullish EUR/USD stance on a tactical basis."
It has been a dramatic week in the global bond markets on the back of the German EUR 500bn infrastructure plan as well as more money for the defence spending and the changes to the Debt Brake. Furthermore, EU announced an EUR 800bn defence package. Hence, German and EU bonds underperformed both swaps and US Treasuries significantly, Danske Bank's FX analysts Kristoffer Kjær Lomholt and Filip Andersson report.
France is at risk of being downgraded to A+ this week
"Looking forward, then the focus will be on Germany, where the plan is expected to be passed this week. We have closed our short position in the Bund ASW-spread as we reached out target even though it could widen even further. Given the dramatic rise in the Bund yield of some 40bp during last week, then we recommend going long 10Y Bunds on an outright basis as we typically see a rebound on the back of such a significant rise."
"The positive rating story on the periphery as Greece was upgraded to A from A- by DBRS, while France is at risk of being downgraded to A+ this week as Fitch have them up for review on Friday and have France on negative outlook. The main event in the EU primary market is the expected syndicated deal from EU. Secondly, we have auctions from Italy and Germany and potentially Portugal."
USD/CAD consolidates below 1.4400 as both the US Dollar and the Canadian Dollar are underperforming.
Trump’s economic policies are expected to dent US economic growth.
Investors await the US CPI data for February and the BoC’s policy decision, both are releasing on Wednesday.
The USD/CAD pair trades in a tight range around 1.4370 in European trading hours on Monday. The Loonie pair consolidates as weakness in the US Dollar (USD) has been offset by declining Canadian Dollar (CAD). The US Dollar Index (DXY), which tracks the Greenback’s value against six major currencies, struggles to hold the key support of 103.50, the lowest level seen in four months.
The Greenback is under severe pressure as market experts believe a slowdown in the United States (US) economy due to “America First” policies by President Donald Trump. Investors expect Trump's policies to be inflationary and pro-growth in the longer term but see severe economic turbulence in the near term.
Knowing that US employers are expected to be borne the impact of Trump’s tariff policies, they would be forced to pass on the impact to end consumers. Such a scenario would result in a sharp decline in the overall demand as higher prices would diminish the purchasing power of consumers. This assumption has led to an increase in market expectations that the Federal Reserve (Fed) will reduce interest rates in the June policy meeting. The probability of the Fed to cut interest rates in June has increased to 82% from 54% a month ago, according to the CME FedWatch tool.
For more cues on the interest rate outlook, investors will focus on the US Consumer Price Index (CPI) data for February, which will be released on Wednesday. On year, headline and core CPI are estimated to have decelerated to 2.9% and 3.2%, respectively.
Meanwhile, the Canadian Dollar is underperforming as Donald Trump has imposed 25% tariffs on Canada. However, a number of products that come under the purview of the purview of United States-Mexico-Canada Agreement (USMCA) have been exempted for a month.
This week, investors will pay close attention to the Bank of Canada’s (BoC) monetary policy decision, which will be announced on Wednesday. The BoC is expected to cut interest rates by 25 basis points (bps) to 2.75%.
Economic Indicator
BoC Interest Rate Decision
The Bank of Canada (BoC) announces its interest rate decision at the end of its eight scheduled meetings per year. If the BoC believes inflation will be above target (hawkish), it will raise interest rates in order to bring it down. This is bullish for the CAD since higher interest rates attract greater inflows of foreign capital. Likewise, if the BoC sees inflation falling below target (dovish) it will lower interest rates in order to give the Canadian economy a boost in the hope inflation will rise back up. This is bearish for CAD since it detracts from foreign capital flowing into the country.
Further sideways trading seems likely; probably between 7.2300 and 7.2530. In the longer run, downward pressure remains intact; should USD break below 7.2260, the next level to watch is 7.2000, UOB Group's FX analysts Quek Ser Leang and Peter Chia note.
The next level to watch is 7.2000
24-HOUR VIEW: "Following last Thursday’s price action, we indicated on Friday that 'There has been no change in either downward or upward momentum, and USD could continue to trade sideways, likely between 7.2300 and 7.2600.' USD then traded in a range of 7.2282/7.2533, closing marginally higher by 0.02% at 7.2467. The price action provides no fresh clues, and further sideways trading seems likely, probably between 7.2300 and 7.2530."
1-3 WEEKS VIEW: "Out most recent narrative was from last Thursday (06 Mar, spot at 7.2440), wherein 'the downward pressure remains intact, and should USD break below and hold below 7.2260, the next level to watch is 7.2000.' USD has not been able to make much headway on the downside, and downward momentum is slowing. However, as long as 7.2800 (no change in ‘strong resistance’ level from last Friday) is not breached, there is still a chance for USD to break clearly below 7.2260."
USD/CNH rallied overnight by roughly 0.45% towards 7.2700, BBH FX analysts report.
China's consumption-to-GDP ratio is very low at round 40%
"China’s economy is struggling to escape a deflationary spiral. In February, headline CPI fell more than expected to -0.7% y/y (consensus: -0.4%) vs. 0.5% in January."
"This was the first drop in 13 months and largely reflects a high base from a year earlier. Core CPI declined for the first time since 2021 to -0.1% y/y vs. 0.6% in January as services prices fell the most in four years. Finally, PPI contraction extended into a 29th month falling by -2.2% y/y vs. -2.3% in January."
"To escape the debt-deflation loop, Chinese policymakers need to ramp up fiscal measures to boost consumption. China's consumption-to-GDP ratio is very low at round 40%, due to high household savings, low household income levels, and high levels of household debt."
The USDA will release its monthly World Agricultural Supply and Demand Estimates (WASDE) report on Tuesday. The market expects the agency to cut its estimate of US corn ending stocks by around 22m bushels to 1,518m bushels. Soybean ending stocks could be left unchanged at 380m bushels, ING's commodity experts Ewa Manthey and Warren Patterson note.
"Wheat could see a marginal uptick in ending stock estimates to 799m bushels. Also, the agency may revise downward its Argentine corn and soybean output estimates to 49.3mt (-0.7mt) and 48.9mt (-0.1mt), respectively. There’s the potential for Brazilian soybean output to be revised slightly higher (+0.5mt to 169.5mt). Global ending stock estimates for corn are expected to decline from 290.3mt to 289.9mt, while soybean ending stock estimates are seen rising to 124.6mt from 124.3mt."
"Recent numbers from France’s Agriculture Ministry show that 74% of the soft wheat crop was in good-to-excellent condition as of 3 March. This compares to 73% over the preceding week and 68% for the same period last year. Warmer-than-usual weather has been helpful for the wheat crop."
"The latest CFTC data suggests sentiment remains negative amid ongoing trade tensions. Money managers increased their net short position in CBOT wheat by 14,785 lots, to 82,399 lots as of 4 March. For CBOT corn, the net speculative long fell by 117,702 lots to 219,752 lots. Meanwhile, money managers shifted to a net short in CBOT soybeans after selling 43,696 lots over the week, leaving them with a net short of 35,487 lots."
Slowing momentum suggests any decline in US Dollar (USD) is unlikely to reach 147.00 again vs Japanese Yen (JPY). In the longer run, technical target met sooner than expected; USD need to remain below 147.00 before further declines are likely, UOB Group's FX analysts Quek Ser Leang and Peter Chia note.
Resistance levels are at 147.90 and 148.20
24-HOUR VIEW: "Last Thursday, USD dropped to 147.30 and then rebounded. On Friday, we indicated that 'there is room for USD to retest the 147.30 low.' We added, 'The next support at 147.00 is unlikely to come under threat.' USD fell more than expected to 146.95, rebounding strongly to close largely unchanged at 148.03 (+0.05%). Although USD traded on a soft note in early Asian trade today, slowing downward momentum suggests any decline is unlikely to reach 147.00 again (there is another support level at 147.20). On the upside, resistance levels are at 147.90 and 148.20."
1-3 WEEKS VIEW: "We revised our view to negative last Friday (07 Mar, spot at 148.00). We indicated that 'increase in momentum suggest USD could weaken to 147.00.' We did not expect USD to reach the technical target so quickly, as it dropped to 146.94 and then rebounded. While further USD weakness is not ruled out, the 147.00 level is acting as a kind of ‘low water mark’ now, meaning USD would need remain below this level before further declines are likely. It is unclear for now if USD can remain below 147.00, but the probability of such a move will remain intact provided that 148.80 (‘strong resistance’ level was at 149.30 last Friday) is not breached."
EUR/USD rises to near 1.0850 as the US Dollar weakens amid accelerating concerns over the US economic outlook.
US President Trump’s policies are expected to slow down the US economic growth.
ECB’s Centeno expects that Eurozone inflation is almost out of the woods.
EUR/USD trades firmly around 1.0850 after recovering early losses in Monday’s European session. The major currency pair strengthens as the US Dollar (USD) struggles to gain ground after last week’s sharp drop. The US Dollar Index (DXY), which tracks the Greenback’s value against six major currencies, trades vulnerable near a fresh four-month low of 103.50.
The outlook of the US Dollar remains uncertain as investors have become increasingly concerned over how United States (US) President Donald Trump’s ‘America first’ policies will shape the economy. On Friday, the comments from the President in an interview with Fox News indicated that Trump’s policies should lead to short-term economic shocks.
"There is a period of transition because what we are doing is very big,” Trump told the "Sunday Morning Futures" program. This comment came after he was asked about the possibility of a recession.
Lately, a slew of US data has indicated signs of an economic slowdown, such as 15-month low Consumer Confidence, an unexpected decline in the ISM Manufacturing New Orders, and slightly lower-than-expected Nonfarm Payrolls (NFP) data for February. Weak data has forced traders to raise bets supporting the Federal Reserve (Fed) to resume the policy-easing cycle in the June meeting. The likelihood for the Fed to cut interest rates in June has increased to 82% from 54% a month ago, according to the CME FedWatch tool.
Meanwhile, Fed Chair Jerome Powell continued to guide a “wait and see” approach on interest rates due to the lack of clarity on Trump’s tariff and tax policies. “Uncertainty around Trump administration policies and their economic effects remains high,” Powell said in an economic forum at the University of Chicago Booth School on Friday, and the “net effect of trade, immigration, fiscal, and regulation policy is what matters for the economy and the monetary policy.”
Daily digest market movers: EUR/USD faces pressure as Euro corrects
A slight downside move in the EUR/USD pair is also driven by weakness in the Euro (EUR) against its major peers at the start of the week. The Euro is down as profit-booking kicks in after a robust upside move last week. The Euro outperformed as German leaders, including likely new Chancellor Frederich Merz, agreed to stretch the borrowing limit or so-called “debt brake” and create a 500 billion Euro (EUR) infrastructure fund to boost defense spending and stimulate economic growth.
Germany’s decision of large economic stimulus forced traders to pare bets supporting the European Central Bank (ECB) to cut interest rates two times more this year, assuming that the impact could be inflationary for the Eurozone. Last week, the ECB reduced its Deposit Facility rate by 25 basis points (bps) to 2.5% but didn’t commit a preset monetary expansion path.
Meanwhile, comments from ECB policymaker and Governor of Bank of Portugal Mario Centeno in a conference on Friday indicated that more interest rate cuts are in the pipeline. Centeno said that the Eurozone is on its way to “normalizing monetary policy”. On the inflation outlook, Centeno said that inflation is "almost out of the woods" and has decelerated to "a level that is very much closer to our target".
On the economic front, month-on-month German Industrial Production data grew at a faster-than-expected pace in January. The industrial production of the Eurozone’s locomotive rose by 2%, strongly than estimates of 1.5%. In December, it declined by 1.5%. Meanwhile, Eurozone Sentix Investor Confidence improves to -2.9 in March from -12.7 in February.
Technical Analysis: EUR/USD shows resilience near 1.0800
EUR/USD stabilizes around 1.0850 after correcting to near 1.0800 on Monday. The major currency pair strengthened after a decisive breakout above the December 6 high of 1.0630 last week. The long-term outlook of the major currency pair is bullish as it holds above the 200-day Exponential Moving Average (EMA), which trades around 1.0640.
The 14-day Relative Strength Index (RSI) jumps to near 70.00, indicating a strong bullish momentum.
Looking down, the December 6 high of 1.0630 will act as the major support zone for the pair. Conversely, the November 6 high of 1.0937 and the psychological level of 1.1000 will be key barriers for the Euro bulls.
Euro FAQs
The Euro is the currency for the 19 European Union countries that belong to the Eurozone. It is the second most heavily traded currency in the world behind the US Dollar. In 2022, it accounted for 31% of all foreign exchange transactions, with an average daily turnover of over $2.2 trillion a day. EUR/USD is the most heavily traded currency pair in the world, accounting for an estimated 30% off all transactions, followed by EUR/JPY (4%), EUR/GBP (3%) and EUR/AUD (2%).
The European Central Bank (ECB) in Frankfurt, Germany, is the reserve bank for the Eurozone. The ECB sets interest rates and manages monetary policy. The ECB’s primary mandate is to maintain price stability, which means either controlling inflation or stimulating growth. Its primary tool is the raising or lowering of interest rates. Relatively high interest rates – or the expectation of higher rates – will usually benefit the Euro and vice versa. The ECB Governing Council makes monetary policy decisions at meetings held eight times a year. Decisions are made by heads of the Eurozone national banks and six permanent members, including the President of the ECB, Christine Lagarde.
Eurozone inflation data, measured by the Harmonized Index of Consumer Prices (HICP), is an important econometric for the Euro. If inflation rises more than expected, especially if above the ECB’s 2% target, it obliges the ECB to raise interest rates to bring it back under control. Relatively high interest rates compared to its counterparts will usually benefit the Euro, as it makes the region more attractive as a place for global investors to park their money.
Data releases gauge the health of the economy and can impact on the Euro. Indicators such as GDP, Manufacturing and Services PMIs, employment, and consumer sentiment surveys can all influence the direction of the single currency. A strong economy is good for the Euro. Not only does it attract more foreign investment but it may encourage the ECB to put up interest rates, which will directly strengthen the Euro. Otherwise, if economic data is weak, the Euro is likely to fall. Economic data for the four largest economies in the euro area (Germany, France, Italy and Spain) are especially significant, as they account for 75% of the Eurozone’s economy.
Another significant data release for the Euro is the Trade Balance. This indicator measures the difference between what a country earns from its exports and what it spends on imports over a given period. If a country produces highly sought after exports then its currency will gain in value purely from the extra demand created from foreign buyers seeking to purchase these goods. Therefore, a positive net Trade Balance strengthens a currency and vice versa for a negative balance.
Downward pressure on US equities last week spilled over into the oil market, with ICE Brent settling almost 3.9% lower. Though prices managed to creep back above US$70/bbl towards the end of last week, they’re now edging lower. Tariff uncertainty is a key driver behind the weakness. So is Chinese inflation data over the weekend showing that consumer prices fell 0.7% year on year in February. As a result, speculators remain bearish on the oil market. Positioning data shows speculators reduced their net longs in ICE Brent by 61,121 lots over the last reporting week to 159,425 lots as of last Tuesday -- the smallest position since December, ING's commodity experts Ewa Manthey and Warren Patterson note.
OPEC+ supply set to increase
"The Saudis released their latest official selling prices (OSPs) for April loadings. It shows cuts across almost the board, although OSPs into the US were unchanged. The flagship Arab Light crude into Asia was cut by US$0.40/bbl to US$3.50/bbl over the benchmark. The reduction comes amid growing concern over the market balance with OPEC+ supply set to increase at a moment of increasing uncertainty over demand. Chinese data on Friday showed that crude oil imports in the first two months of the year totalled 83.85m tonnes -- or around 10.4m b/d -- down 3.4% YoY and below the roughly 11.3m b/d imported in December."
"It is a relatively data-heavy week for the energy calendar. On Tuesday, the Energy Information Administration (EIA) releases its latest Short Term Energy Outlook. It will include the EIA’s latest US oil and gas production forecasts and assessment of the global balance. In last month’s release, the EIA forecast US crude oil production would grow by around 380k b/d YoY in 2025 and 140k b/d YoY in 2026. Recent price weakness poses downside risks to these numbers. OPEC’s monthly oil market report will be released Wednesday, followed by the IEA’s monthly oil market report on Thursday."
10:01
Italy Producer Price Index (YoY) up to 4.4% in January from previous 1.1%
10:01
Italy Producer Price Index (MoM) up to 1.6% in January from previous 0.6%
10:01
Greece Consumer Price Index (YoY) down to 2.5% in February from previous 2.7%
10:00
Greece Industrial Production (YoY): 2% (January) vs previous 5.8%
10:00
Greece Consumer Price Index - Harmonized (YoY) dipped from previous 3.1% to 3% in February
Slight increase in downward momentum is likely to lead to a lower range of 0.5685/0.5730 instead of a sustained decline. In the longer run, there has been no further increase in upward momentum; a break of 0.5660 would mean that the recovery is not reaching 0.5775, UOB Group's FX analysts Quek Ser Leang and Peter Chia note.
Likely to trade to a lower range of 0.5685/0.5730
24-HOUR VIEW: "We highlighted last Friday that 'further range trading seems likely, probably in a range of 0.5710/0.5760.' NZD then traded in a lower range than expected (0.5695/0.5741). There has been a slight increase in downward momentum, but this is likely to lead to a lower range of 0.5685/0.5730 instead of a sustained decline."
1-3 WEEKS VIEW: "Last Thursday (06 Mar, spot at 0.5720), we highlighted that the 'current price movements are likely part of a recovery phase that could reach 0.5775.' NZD subsequently rose to 0.5760 and then pulled back. There has been no further increase in momentum and should NZD break below 0.5660 (no change in ‘strong support’ level from last Friday), it would mean that 0.5775 is out of reach this time round."
After a week when FX markets were very much dominated by events in Europe, focus this weeks shift to China. Chinese retaliatory trade measures against US agricultural goods have come into effect and markets expect to see more focus on how high USD/CNH trades ahead of reciprocal US tariffs coming in next month, ING's FX analyst Chris Turner notes.
Markets expect to see more focus on how high USD/CNH trades
"Overnight, China went through with its retaliatory tariffs against US agricultural goods, and this Wednesday sees US tariffs go into effect on steel and aluminum imports. Hanging over the market remains the threat of extensive 'reciprocal' US trade tariffs coming in next month as Washington seeks to level the playing field for trade (and raise some much needed revenue for the domestic agenda)."
"And after all the focus last week on Europe, this week we think the market will watch the USD/CNH top-side as the market will again question whether Chinese authorities, suffering weak growth and deflation, have any greater tolerance for a weaker renminbi. We think not, but that may not prevent USD/CNH from being bought through 7.30."
Current price movements appear to be part of a range trading phase between 0.6280 and 0.6330. In the longer run, buildup in upward momentum is slowing; a breach of 0.6265 would suggest AUD is likely to trade in a range vs US Dollar (USD) instead of recovering, UOB Group's FX analysts Quek Ser Leang and Peter Chia note.
AUD is likely to trade in a range
24-HOUR VIEW: "Last Friday, we expected AUD to 'trade in a range between 0.6300 and 0.6350.' Instead of trading in a range, AUD fell to a low of 0.6283, rebounding to close lower by 0.41% at 0.6306. The decline lacks momentum, and the current price movements appear to be part of a range trading phase, most likely between 0.6280 and 0.6330."
1-3 WEEKS VIEW: "Our most recent narrative was from last Thursday (06 Mar, spot at 0.6330), wherein AUD 'could recover, potentially reaching 0.6410.' Since then, AUD has not been able to make much headway on the upside. The buildup in momentum is slowing, and a breach of 0.6265 (no change in ‘strong support’ level) would suggest AUD is likely to trade in a range instead of recovering."
FX markets are starting to settle down after a momentous week. While events in Europe were really the dominant factor, we would not have seen such big moves in EUR/USD were it not for US short-dated rates crumbling, ING's FX analyst Chris Turner notes.
DXY may return at 104.30/50
"Financial markets have priced the Fed terminal rate some 50bp lower in a little over a month. That may be enough for the time being barring some shock fall in US JOLTS job opening data (Tuesday) or big rise in the weekly initial jobless claims data (Thursday). Indeed, Federal Reserve Chair Jay Powell was quite sanguine about recent developments in a speech on Friday."
"One takeaway was his comment that sentiment readings were not good predictors of consumption growth - suggesting it may be too early to predict the demise of the US consumer. This week also sees February CPI data on Wednesday, where the core rate is expected to remain sticky at 0.3% month-on-month. This all supports Powell's conclusion on Friday that the Fed does not need to be in a hurry to cut rates and could pour a little cold water on the market's 27bp pricing for a rate cut in June."
"Also please remember that the US has now switched to Daylight Savings Time, narrowing the time difference until the clocks go forward in Europe on 30 March. Away from US data this week, the focus will be on Ukraine peace talks in Saudi Arabia and the global trade war. DXY could probably do with some consolidation after a tumultuous week, though more selling interest may return at 104.30/50 as long as the European outlook continues to be positively re-assessed."
USD/JPY is trading heavy under 148.00, BBH FX analysts report.
Faster wage growth is an upside risk to Japan’s inflation outlook
"Japan underlying wage pressures gained traction in January and could force the Bank of Japan to normalize rates by more than is currently priced-in. The policy-relevant scheduled pay growth for full-time workers rose 3% y/y (consensus: 2.9%) vs. 2.8% in December, matching the July 2024 series high of 3%."
"Of note, Japan’s biggest trade union group Rengo is demanding larger wage hikes. Members are asking an average wage increase of 6.09% this year, up from last year’s 5.85%, and seeking more than 6% for the first time in more than three decades. Faster wage growth is an upside risk to Japan’s inflation outlook."
"The swaps market is pricing in 75bps of tightening over the next two years that would see the policy rate peak near 1.25%."
Eurozone investors’ morale improved remarkedly in March.
EUR/USD jumps toward 1.0850 after the Eurozone data.
The Eurozone Sentix Investor Confidence Index leaped to -2.9 in March following February’s -12.7, the latest survey showed on Monday.
The Current Situation gauge for the bloc rose to -21.8 in March from -25.5 in February.
Sentix said: “For Germany, investors are downright euphoric.”
"The picture was different in other parts of the world. In the United States, there was a massive slump in current situation and expectations values," it added.
Market reaction to the Eurozone Sentix data
EUR/USD holds its renewed upside near 1.0850 after the Eurozone data. As of writing, EUR/USD is trading 0.11% higher on the day at around 1.0845.
Silver prices (XAG/USD) rose on Monday, according to FXStreet data. Silver trades at $32.56 per troy ounce, up 0.20% from the $32.49 it cost on Friday.
Silver prices have increased by 12.67% since the beginning of the year.
Unit measure
Silver Price Today in USD
Troy Ounce
32.56
1 Gram
1.05
The Gold/Silver ratio, which shows the number of ounces of Silver needed to equal the value of one ounce of Gold, stood at 89.45 on Monday, down from 89.56 on Friday.
Silver FAQs
Silver is a precious metal highly traded among investors. It has been historically used as a store of value and a medium of exchange. Although less popular than Gold, traders may turn to Silver to diversify their investment portfolio, for its intrinsic value or as a potential hedge during high-inflation periods. Investors can buy physical Silver, in coins or in bars, or trade it through vehicles such as Exchange Traded Funds, which track its price on international markets.
Silver prices can move due to a wide range of factors. Geopolitical instability or fears of a deep recession can make Silver price escalate due to its safe-haven status, although to a lesser extent than Gold's. As a yieldless asset, Silver tends to rise with lower interest rates. Its moves also depend on how the US Dollar (USD) behaves as the asset is priced in dollars (XAG/USD). A strong Dollar tends to keep the price of Silver at bay, whereas a weaker Dollar is likely to propel prices up. Other factors such as investment demand, mining supply – Silver is much more abundant than Gold – and recycling rates can also affect prices.
Silver is widely used in industry, particularly in sectors such as electronics or solar energy, as it has one of the highest electric conductivity of all metals – more than Copper and Gold. A surge in demand can increase prices, while a decline tends to lower them. Dynamics in the US, Chinese and Indian economies can also contribute to price swings: for the US and particularly China, their big industrial sectors use Silver in various processes; in India, consumers’ demand for the precious metal for jewellery also plays a key role in setting prices.
Silver prices tend to follow Gold's moves. When Gold prices rise, Silver typically follows suit, as their status as safe-haven assets is similar. The Gold/Silver ratio, which shows the number of ounces of Silver needed to equal the value of one ounce of Gold, may help to determine the relative valuation between both metals. Some investors may consider a high ratio as an indicator that Silver is undervalued, or Gold is overvalued. On the contrary, a low ratio might suggest that Gold is undervalued relative to Silver.
(An automation tool was used in creating this post.)
09:30
Eurozone Sentix Investor Confidence increased to -2.9 in March from previous -12.7
West Texas Intermediate (WTI) Oil price advances on Monday, early in the European session. WTI trades at $66.87 per barrel, down from Friday’s close at $66.84. Brent Oil Exchange Rate (Brent crude) is also up, advancing from the $70.18 price posted on Friday, and trading at$70.25.
WTI Oil FAQs
WTI Oil is a type of Crude Oil sold on international markets. The WTI stands for West Texas Intermediate, one of three major types including Brent and Dubai Crude. WTI is also referred to as “light” and “sweet” because of its relatively low gravity and sulfur content respectively. It is considered a high quality Oil that is easily refined. It is sourced in the United States and distributed via the Cushing hub, which is considered “The Pipeline Crossroads of the World”. It is a benchmark for the Oil market and WTI price is frequently quoted in the media.
Like all assets, supply and demand are the key drivers of WTI Oil price. As such, global growth can be a driver of increased demand and vice versa for weak global growth. Political instability, wars, and sanctions can disrupt supply and impact prices. The decisions of OPEC, a group of major Oil-producing countries, is another key driver of price. The value of the US Dollar influences the price of WTI Crude Oil, since Oil is predominantly traded in US Dollars, thus a weaker US Dollar can make Oil more affordable and vice versa.
The weekly Oil inventory reports published by the American Petroleum Institute (API) and the Energy Information Agency (EIA) impact the price of WTI Oil. Changes in inventories reflect fluctuating supply and demand. If the data shows a drop in inventories it can indicate increased demand, pushing up Oil price. Higher inventories can reflect increased supply, pushing down prices. API’s report is published every Tuesday and EIA’s the day after. Their results are usually similar, falling within 1% of each other 75% of the time. The EIA data is considered more reliable, since it is a government agency.
OPEC (Organization of the Petroleum Exporting Countries) is a group of 12 Oil-producing nations who collectively decide production quotas for member countries at twice-yearly meetings. Their decisions often impact WTI Oil prices. When OPEC decides to lower quotas, it can tighten supply, pushing up Oil prices. When OPEC increases production, it has the opposite effect. OPEC+ refers to an expanded group that includes ten extra non-OPEC members, the most notable of which is Russia.
Disclaimer: West Texas Intermediate (WTI) and Brent oil prices mentioned above are based on FXStreet data feed for Contracts for Differences (CFDs).
(An automation tool was used in creating this post.)
GBP/USD has been dragged higher by the fiscal re-rating of Europe, ING's FX analyst Chris Turner notes.
EUR/GBP to consolidate in the 08350/8400 area
"That has not had too much impact on the pricing of the Bank of England easing cycle this year, where the market continues to price around a further 50-60bp of rate cuts. Next big local inputs to the UK story come at the 20 March BoE meeting (no change expected) and the 26 March Spring Statement from Chancellor Rachel Reeves - which we see as a sterling negative event risk."
"Before then, we could see EUR/GBP consolidate in the 08350/8400 area. Risks look evenly skewed here to the upside with more positive developments out of Europe/ECB re-pricing or to the downside with a refocus on looming tariffs. For GBP/USD, the upside looks a little more difficult and it may struggle to breach resistance at 1.2925/3000 near term."
Euro (EUR) is likely to trade sideways between 1.0800 and 1.0890 vs US Dollar (USD). In the longer run, uptrend remains intact, but it is unclear for now if EUR can reach 1.0945, UOB Group's FX analysts Quek Ser Leang and Peter Chia note.
Uptrend remains intact
24-HOUR VIEW: "We highlighted last Friday that 'the current price movements are likely part of a range trading phase, probably between 1.0740 and 1.0840.' We did not expect the continued advance in EUR, as it rose to 1.0888 during the NY session and then pulled back to close at 1.0832 (+0.45%). Despite the rise, there has been no clear increase in upward momentum. Today, instead of continuing to rise, EUR is more likely to trade sideways between 1.0800 and 1.0890."
1-3 WEEKS VIEW: "We shifted our view to positive early last week (as annotated in the chart below). Tracking the subsequent sharp rally, we indicated last Friday (07 Mar, spot at 1.0790) that 'while the uptrend remains intact, at this stage, it is unclear for now if EUR can reach 1.0945.' Although EUR subsequently rose to 1.0888, conditions are deeply overbought, and it remains unclear for now if it can reach 1.0945. Overall, only a breach of 1.0690 (‘strong support’ level previously at 1.0640) would suggest that the sharp rally is ready to take a breather."
Gold steadies and trades within a very tight range on Monday.
US yields are off their year-to-date low after President Trump addressed the US economy.
Traders are gearing up for the upcoming Fed meeting on March 19.
Gold’s price (XAU/USD) stabilizes and consolidates within a tight range near the $2,900 level at the start of the week. Traders are mulling over comments from United States (US) President Donald Trump after an interview on Fox News over the weekend. When asked about the US economy, President Trump said that the economy is in a ‘transition’ phase, while markets have already floated the idea that the US economy is in a recession scenario.
Meanwhile, Federal Reserve (Fed) Chairman Jerome Powell issued some remarks on Friday before the Fed’s blackout period started. That blackout period precedes the actual policy rate decision on March 19, where expectations are for keeping the policy rate steady. Powell said that the central bank does not need to do anything at this point and that the price for keeping its policy rate steady comes with a very small price against the chances of a policy mistake by changing interest rates preemptively.
Daily digest market movers: Fed’s on board
US President Donald Trump said the economy faced “a period of transition” as he pressed on with his focus on tariffs and federal job cuts, Bloomberg reports.
Fed Chair Jerome Powell acknowledged on Friday the rising economic uncertainties in the US but said the central bank does not need to rush to adjust policy. Among recent data points, the Atlanta Fed’s Gross Domestic Product (GDP) gauge signaled the US economy may shrink this quarter. Lower borrowing costs tend to be beneficial for Gold, Reuters reports.
The CME Fedwatch Tool sees a 97.0% chance for no rate changes in the upcoming Fed policy meeting on March 19. The odds for an interest rate cut by the June 18 meeting have grown now to 81.8% on Monday.
Technical Analysis: Time to come off the boil
It is time for markets to settle down and see a pullback after stretched positions and moves on the charts. The same goes for Bullion, where the precious metal would benefit from a pullback. Should President Trump remain relatively quiet on any additional tariffs, the nervousness would start to settle and would see Gold dipping towards the S2 support of the daily Pivot Point near $2,878 or even lower, ideal for bulls to get back in before reciprocal tariffs are set to hit by next month.
While Gold trades near $2,905 at the time of writing on Monday, the daily Pivot Point at $2,912 and the daily R1 resistance at $2,927 are the key levels to watch for. In case Gold sees more inflows, the daily R2 resistance at $2,945 will possibly be the final cap ahead of the all-time high of $2,956 reached on February 24.
On the downside, the $2,900 psychological big figure and the S1 support at $2,893 acts as a double support barrier. If Bullion bulls want to avoid another leg lower, that zone must hold. Further down, the daily S2 support at $2,878 should be able to catch any additional downside pressure.
XAU/USD: Daily Chart
Gold FAQs
Gold has played a key role in human’s history as it has been widely used as a store of value and medium of exchange. Currently, apart from its shine and usage for jewelry, the precious metal is widely seen as a safe-haven asset, meaning that it is considered a good investment during turbulent times. Gold is also widely seen as a hedge against inflation and against depreciating currencies as it doesn’t rely on any specific issuer or government.
Central banks are the biggest Gold holders. In their aim to support their currencies in turbulent times, central banks tend to diversify their reserves and buy Gold to improve the perceived strength of the economy and the currency. High Gold reserves can be a source of trust for a country’s solvency. Central banks added 1,136 tonnes of Gold worth around $70 billion to their reserves in 2022, according to data from the World Gold Council. This is the highest yearly purchase since records began. Central banks from emerging economies such as China, India and Turkey are quickly increasing their Gold reserves.
Gold has an inverse correlation with the US Dollar and US Treasuries, which are both major reserve and safe-haven assets. When the Dollar depreciates, Gold tends to rise, enabling investors and central banks to diversify their assets in turbulent times. Gold is also inversely correlated with risk assets. A rally in the stock market tends to weaken Gold price, while sell-offs in riskier markets tend to favor the precious metal.
The price can move due to a wide range of factors. Geopolitical instability or fears of a deep recession can quickly make Gold price escalate due to its safe-haven status. As a yield-less asset, Gold tends to rise with lower interest rates, while higher cost of money usually weighs down on the yellow metal. Still, most moves depend on how the US Dollar (USD) behaves as the asset is priced in dollars (XAU/USD). A strong Dollar tends to keep the price of Gold controlled, whereas a weaker Dollar is likely to push Gold prices up.
The latest US Employment Situation report by the Bureau of Labor Statistics (BLS) last Fri (7 Mar) was weaker than expected as jobs creation came in below projections with a surprise uptick in the unemployment rate while wage growth was within estimates, UOB Group's Senior Economist Alvin Liew notes.
US reports a slightly weaker-than-expected jobs creation
"The US reported a slightly weaker-than-expected jobs creation at 151,000 in Feb (versus Bloomberg est 160,000) while unemployment rate also surprised with an uptick to 4.1% (from 4.0% in January). Job creation was still broad-based, but surprisingly, professional services and leisure recorded back-to-back losses, while government hiring slowed visibly as BLS reported that federal employment fell by -10,000 in February."
"After starting the year at a re-accelerating pace, wage growth continued to rise but within expectations at 0.3% m/m, 4.0% y/y in February (from 0.4% m/m, 3.9% y/y in January). "
"No change to our call as we maintain our FOMC view of only one 25-bps cut in 2Q 2025 (likely June FOMC) and then stay on hold for rest of the year at 4.25% (upper bound of Fed Funds Target Rate). Key data to watch will be Feb CPI inflation (12 March) and University of Michigan consumer confidence sentiment for Mar (14 March)."
EUR/USD is consolidating after last week's 4.4% rally. We haven't seen anything like that since the early days of the Covid pandemic in March 2020. As we discussed Friday, the narrative of independent US and European stories stands to lift FX volatility, ING's FX analyst Chris Turner notes.
EUR/USD to consolidate in the 1.0770-1.0850 area
"Away from the peace discussions in Saudi Arabia this week, the focus will be on German CDU leader Friedrich Merz and his ability to build a coalition of the fiscal willing to get the EUR500bn infrastructure fund through the current parliament. He is currently in discussions with the Greens and reports suggest a vote could take place in the lower house Bundestag on 18 March, before the upper house Bundesrat seals the deal on the 21st. Headlines on whether the Greens are playing ball this week could trigger some volatility in the euro."
"In terms of European data, today sees the March Sentix Investor confidence survey. And with little other data this week, the focus will be back to European Central Bank speakers. Our house call is that the ECB will pause its easing cycle in April. But the market still prices 17bp of rate cuts for that meeting. Expect the doves and hawks to do battle in the press over the need for an April cut, with today's input coming from the hawkish Joachim Nagel in a speech at 14CET today."
"We favour a little EUR/USD consolidation in the 1.0770-1.0850 area at the start of the week and suspect that another leg higher will have to come from ECB speakers or significant progress in Saudi Arabia rather than the US macro/rate side."
Silver price may test the primary support at the nine-day EMA of $32.21.
The 14-day RSI remains above the 50 mark, confirming a bullish bias.
A successful return to the ascending channel would further reinforce the positive outlook.
Silver price (XAG/USD) remains subdued for the third successive day, trading around $32.40 during the European hours on Monday. Technical analysis on the daily chart indicates a weakening bullish bias, with the grey metal breaking below an ascending channel pattern.
However, Silver price remains above the nine-day and 50-day Exponential Moving Averages (EMAs), signaling that short-term momentum is stronger. Additionally, the 14-day Relative Strength Index (RSI) is positioned above the 50 mark, confirming the bullish bias is in play.
A successful return to the ascending channel would strengthen the bullish outlook, supporting Silver price in testing the four-month high of $33.40, recorded on February 14. A breakout above this level could drive the metal price toward the channel's upper boundary at $34.20.
To the downside, the XAG/USD pair may find initial support at the nine-day EMA of $32.21. A break below this level could weaken short-term price momentum, pushing Silver's price toward the $31.61 support level. Further downside support is seen at the two-month low of $30.70, recorded on February 3.
XAG/USD: Daily Chart
Silver FAQs
Silver is a precious metal highly traded among investors. It has been historically used as a store of value and a medium of exchange. Although less popular than Gold, traders may turn to Silver to diversify their investment portfolio, for its intrinsic value or as a potential hedge during high-inflation periods. Investors can buy physical Silver, in coins or in bars, or trade it through vehicles such as Exchange Traded Funds, which track its price on international markets.
Silver prices can move due to a wide range of factors. Geopolitical instability or fears of a deep recession can make Silver price escalate due to its safe-haven status, although to a lesser extent than Gold's. As a yieldless asset, Silver tends to rise with lower interest rates. Its moves also depend on how the US Dollar (USD) behaves as the asset is priced in dollars (XAG/USD). A strong Dollar tends to keep the price of Silver at bay, whereas a weaker Dollar is likely to propel prices up. Other factors such as investment demand, mining supply – Silver is much more abundant than Gold – and recycling rates can also affect prices.
Silver is widely used in industry, particularly in sectors such as electronics or solar energy, as it has one of the highest electric conductivity of all metals – more than Copper and Gold. A surge in demand can increase prices, while a decline tends to lower them. Dynamics in the US, Chinese and Indian economies can also contribute to price swings: for the US and particularly China, their big industrial sectors use Silver in various processes; in India, consumers’ demand for the precious metal for jewellery also plays a key role in setting prices.
Silver prices tend to follow Gold's moves. When Gold prices rise, Silver typically follows suit, as their status as safe-haven assets is similar. The Gold/Silver ratio, which shows the number of ounces of Silver needed to equal the value of one ounce of Gold, may help to determine the relative valuation between both metals. Some investors may consider a high ratio as an indicator that Silver is undervalued, or Gold is overvalued. On the contrary, a low ratio might suggest that Gold is undervalued relative to Silver.
AUD/JPY struggled as the Bank of Japan is widely expected to raise rates further this year.
The BoJ’s hawkish stance is reinforced by a 1.8% decline in real cash earnings, reflecting persistent inflation.
The AUD found support from stronger-than-expected GDP growth and robust trade data from Australia.
AUD/JPY pares its daily losses, hovering around 93.30 during European trading hours on Monday. The currency cross faced pressure as the Bank of Japan (BoJ) is widely expected to hike rates further this year as part of its monetary policy normalization.
Investor expectations for another BoJ rate hike were reinforced by data released earlier on Monday, showing a 1.8% decline in real cash earnings due to persistent inflation. Additionally, optimism that last year’s substantial wage hikes will continue this year supports the case for further policy tightening. This has driven Japanese government bond (JGB) yields higher, narrowing the rate differential between Japan and other economies, and ultimately benefiting the lower-yielding JPY.
The Australian Dollar (AUD) received support from stronger-than-expected GDP growth and trade data from Australia released last week. On the monetary policy front, the latest Reserve Bank of Australia (RBA) Meeting Minutes indicated caution regarding further interest rate cuts, clarifying that February’s rate reduction does not signal a commitment to continued easing.
The AUD/JPY cross may face challenges as rising global trade tensions dampened investors’ risk appetite. China's retaliatory tariffs on certain US agricultural products went into effect on Monday, in response to last week's US tariff increase from 10% to 20% on Chinese imports, given China’s role as Australia’s largest trading partner.
Moreover, China announced on Saturday that it will impose a 100% tariff on Canadian rapeseed oil, oil cakes, and peas, along with a 25% levy on aquatic products and pork from Canada. he move comes as retaliation against tariffs introduced by Canada in October, escalating trade tensions. This marks a new front in a broader trade conflict largely driven by US President Donald Trump's tariff policies.
Tariffs FAQs
Tariffs are customs duties levied on certain merchandise imports or a category of products. Tariffs are designed to help local producers and manufacturers be more competitive in the market by providing a price advantage over similar goods that can be imported. Tariffs are widely used as tools of protectionism, along with trade barriers and import quotas.
Although tariffs and taxes both generate government revenue to fund public goods and services, they have several distinctions. Tariffs are prepaid at the port of entry, while taxes are paid at the time of purchase. Taxes are imposed on individual taxpayers and businesses, while tariffs are paid by importers.
There are two schools of thought among economists regarding the usage of tariffs. While some argue that tariffs are necessary to protect domestic industries and address trade imbalances, others see them as a harmful tool that could potentially drive prices higher over the long term and lead to a damaging trade war by encouraging tit-for-tat tariffs.
During the run-up to the presidential election in November 2024, Donald Trump made it clear that he intends to use tariffs to support the US economy and American producers. In 2024, Mexico, China and Canada accounted for 42% of total US imports. In this period, Mexico stood out as the top exporter with $466.6 billion, according to the US Census Bureau. Hence, Trump wants to focus on these three nations when imposing tariffs. He also plans to use the revenue generated through tariffs to lower personal income taxes.
The Pound Sterling grips gains above 1.2900 against the US Dollar as investors expect Trump's policies could slow down the US growth momentum.
Fed’s Powell reiterated the central bank needs more clarity before adjusting the monetary policy.
BoE’s Mann argues against the gradual and cautionary monetary policy easing approach.
The Pound Sterling (GBP) clings to gains slightly above 1.2900 against the US Dollar (USD) in Monday’s European session. The GBP/USD pair strengthens as the US Dollar struggles to gain ground amid growing concerns over the United States (US) economic outlook. The US Dollar Index (DXY), which tracks the Greenback’s value against six major currencies, trades cautiously near the four-month low of 103.50.
Market participants have become increasingly worried over US economic prospects after comments from US President Donald Trump on Friday indicated that his “American First” policies could lead to economic turbulence in the near term.
US President Trump refrained from guiding the impact of his policies on the economy but said in the interview with Fox News that there is a “period of transition”, because what we are doing is very “big”. His comments came after being asked whether his policies could lead to a recession in the economy.
Donald Trump reiterated that reciprocal tariffs will be announced on April 2. Last week, Trump imposed 25% tariffs on imports from Canada and Mexico but exempted many products that come under the purview of the United States-Mexico-Canada Agreement (USMCA) for a month. He also increased surcharges on Chinese imports to 20% by imposing an additional 10%.
Market experts continue to believe that Trump’s tariff policies would be inflationary for the economy, but they have changed their perception of its impact on the economic outlook. At one point when Trump’s agenda was expected to accelerate economic expansion, it is now anticipated to fracture the economy. This has led to global brokerages revising their growth forecasts for the US economy. Goldman Sachs has downgraded its Q4 2025 Gross Domestic Product (GDP) growth forecast to 1.7%, from 2.2% previously anticipated, and raised its 12-month recession probability to 20% from 15%.
Investors also expect the Federal Reserve (Fed) would be forced to resume the policy-easing cycle as early as June. However, Fed Chair Jerome Powell reiterated in an economic forum at the University of Chicago Booth School on Friday that the interest rate policy is in “good shape” and the central bank wants clarity on Trump’s policies before making any monetary policy adjustment.
Daily digest market movers: Pound Sterling trades lower against its peers
The Pound Sterling underperforms its peers at the start of the week as Bank of England (BoE) Monetary Policy Committee (MPC) member Catherine Mann rebutted the need for a “gradual and cautious” monetary policy easing approach, as guided by a majority of BoE officials in the February monetary policy meeting and testimony before Parliament’s treasury committee on Wednesday, due to deepening economic volatility across the globe in her speech on Thursday.
Mann argued against the moderate monetary expansion approach amid significant volatility in global markets. She also said that the founding premise for a gradualist approach to monetary policy is “no longer valid” due to “substantial volatility” coming from financial markets, especially from “cross-border spillovers”.
A day before Mann’s speech, four BoE officials, including Governor Andrew Bailey, endorsed a gradual path for “removing monetary policy restrictiveness” as the inflation persistence is less likely to fade “on its own accord”.
It is worth noting that Catherine Mann was one of two BoE officials who voted for a larger-than-usual rate cut of 50 basis points (bps) in the interest rate decision in February.
This week, investors will keenly focus on the US JOLTS Job Openings and United Kingdom (UK) monthly GDP data for January, and the US Consumer Price Index (CPI) data for February, which will influence market speculation for the Fed and the BoE’s monetary policy outlook. At the moment, traders expect the BoE to cut interest rates two times more this year.
Technical Analysis: Pound Sterling wobbles around 61.8% Fibo retracement at 1.2930
The Pound Sterling strives to break above the 61.8% Fibonacci retracement plotted from the late September high to mid-January low around 1.2930 on Friday. The long-term outlook of the GBP/USD pair has turned bullish as it holds above the 200-day Exponential Moving Average (EMA), which is around 1.2690.
The 14-day Relative Strength Index (RSI) climbs above 70.00, suggesting a strong bullish momentum.
Looking down, the 50% Fibo retracement at 1.2767 and the 38.2% Fibo retracement at 1.2608 will act as key support zones for the pair. On the upside, the psychological 1.3000 level will act as a key resistance zone.
Pound Sterling FAQs
The Pound Sterling (GBP) is the oldest currency in the world (886 AD) and the official currency of the United Kingdom. It is the fourth most traded unit for foreign exchange (FX) in the world, accounting for 12% of all transactions, averaging $630 billion a day, according to 2022 data. Its key trading pairs are GBP/USD, also known as ‘Cable’, which accounts for 11% of FX, GBP/JPY, or the ‘Dragon’ as it is known by traders (3%), and EUR/GBP (2%). The Pound Sterling is issued by the Bank of England (BoE).
The single most important factor influencing the value of the Pound Sterling is monetary policy decided by the Bank of England. The BoE bases its decisions on whether it has achieved its primary goal of “price stability” – a steady inflation rate of around 2%. Its primary tool for achieving this is the adjustment of interest rates. When inflation is too high, the BoE will try to rein it in by raising interest rates, making it more expensive for people and businesses to access credit. This is generally positive for GBP, as higher interest rates make the UK a more attractive place for global investors to park their money. When inflation falls too low it is a sign economic growth is slowing. In this scenario, the BoE will consider lowering interest rates to cheapen credit so businesses will borrow more to invest in growth-generating projects.
Data releases gauge the health of the economy and can impact the value of the Pound Sterling. Indicators such as GDP, Manufacturing and Services PMIs, and employment can all influence the direction of the GBP. A strong economy is good for Sterling. Not only does it attract more foreign investment but it may encourage the BoE to put up interest rates, which will directly strengthen GBP. Otherwise, if economic data is weak, the Pound Sterling is likely to fall.
Another significant data release for the Pound Sterling is the Trade Balance. This indicator measures the difference between what a country earns from its exports and what it spends on imports over a given period. If a country produces highly sought-after exports, its currency will benefit purely from the extra demand created from foreign buyers seeking to purchase these goods. Therefore, a positive net Trade Balance strengthens a currency and vice versa for a negative balance.
08:00
Austria Industrial Production (YoY) rose from previous -9.6% to 0.5% in December
The NZD/USD pair may face challenges as escalating global trade tensions weaken investor risk appetite.
China's retaliatory tariffs of up to 15% on select U.S. agricultural products took effect on Monday.
San Francisco Fed President Mary Daly cautioned that growing business uncertainty could dampen demand in the US economy.
NZD/USD gains ground after registering losses in the previous session, trading around 0.5730 during the early European hours on Monday. However, the upside of the NZD/USD pair could be limited as rising global trade tensions dampened investors’ risk appetite.
China's retaliatory tariffs of up to 15% on certain US agricultural products went into effect on Monday, in response to last week's US tariff increase from 10% to 20% on Chinese imports, given China’s role as New Zealand’s largest trading partner.
Additionally, the NZD faces headwinds following disappointing Chinese Consumer Price Index (CPI) data for February released on Saturday. China’s Consumer Price Index fell by 0.7% year-over-year in February, exceeding market expectations of a 0.5% decline and reversing the 0.5% increase recorded in the previous month. On a monthly basis, CPI inflation stood at -0.2% in February, down from January’s 0.7% and softer than the expected -0.1%.
On Friday, the US Bureau of Labor Statistics (BLS) showed that Nonfarm Payrolls (NFP) rose by 151,000 in February, falling short of the expected 160,000. January’s job growth was also revised downward to 125,000 from the previously reported 143,000.
San Francisco Fed President Mary Daly said late Sunday that increasing uncertainty among businesses could weaken demand in the US economy but does not warrant a change in interest rates. Daly noted that business leaders in her district are expressing growing concerns about the economy and policy, which research indicates could dampen demand.
New Zealand Dollar FAQs
The New Zealand Dollar (NZD), also known as the Kiwi, is a well-known traded currency among investors. Its value is broadly determined by the health of the New Zealand economy and the country’s central bank policy. Still, there are some unique particularities that also can make NZD move. The performance of the Chinese economy tends to move the Kiwi because China is New Zealand’s biggest trading partner. Bad news for the Chinese economy likely means less New Zealand exports to the country, hitting the economy and thus its currency. Another factor moving NZD is dairy prices as the dairy industry is New Zealand’s main export. High dairy prices boost export income, contributing positively to the economy and thus to the NZD.
The Reserve Bank of New Zealand (RBNZ) aims to achieve and maintain an inflation rate between 1% and 3% over the medium term, with a focus to keep it near the 2% mid-point. To this end, the bank sets an appropriate level of interest rates. When inflation is too high, the RBNZ will increase interest rates to cool the economy, but the move will also make bond yields higher, increasing investors’ appeal to invest in the country and thus boosting NZD. On the contrary, lower interest rates tend to weaken NZD. The so-called rate differential, or how rates in New Zealand are or are expected to be compared to the ones set by the US Federal Reserve, can also play a key role in moving the NZD/USD pair.
Macroeconomic data releases in New Zealand are key to assess the state of the economy and can impact the New Zealand Dollar’s (NZD) valuation. A strong economy, based on high economic growth, low unemployment and high confidence is good for NZD. High economic growth attracts foreign investment and may encourage the Reserve Bank of New Zealand to increase interest rates, if this economic strength comes together with elevated inflation. Conversely, if economic data is weak, NZD is likely to depreciate.
The New Zealand Dollar (NZD) tends to strengthen during risk-on periods, or when investors perceive that broader market risks are low and are optimistic about growth. This tends to lead to a more favorable outlook for commodities and so-called ‘commodity currencies’ such as the Kiwi. Conversely, NZD tends to weaken at times of market turbulence or economic uncertainty as investors tend to sell higher-risk assets and flee to the more-stable safe havens.
Germany’s industrial sector witnessed an impressive upturn in January, according to the latest data published by Destatis on Monday.
In the Eurozone’s economic powerhouse, Industrial Output jumped 2% MoM, the federal statistics authority Destatis said in figures adjusted for seasonal and calendar effects, against the anticipated 1.5% advance and a revised 1.5% decline in December.
German Industrial Production dropped 1.6% year-over-year (YoY) in January versus December’s -2.2% revision.
Separately, Germany’s Trade Balance for January came in at EUR16 billion versus EUR21 billion expected and EUR20.7 billion previous.
EUR/USD reaction to the German Industrial Production data
EUR/USD remains unimpressed by mixed German data, trading modestly flat on the day at 1.0835 at the press time.
Euro PRICE Today
The table below shows the percentage change of Euro (EUR) against listed major currencies today. Euro was the weakest against the Swiss Franc.
USD
EUR
GBP
JPY
CAD
AUD
NZD
CHF
USD
-0.06%
0.00%
-0.13%
-0.04%
-0.24%
-0.17%
-0.16%
EUR
0.06%
0.03%
-0.08%
0.02%
-0.09%
-0.13%
-0.22%
GBP
-0.01%
-0.03%
-0.17%
-0.03%
-0.12%
-0.21%
-0.18%
JPY
0.13%
0.08%
0.17%
0.08%
-0.06%
-0.12%
0.04%
CAD
0.04%
-0.02%
0.03%
-0.08%
-0.25%
-0.12%
-0.15%
AUD
0.24%
0.09%
0.12%
0.06%
0.25%
-0.04%
-0.07%
NZD
0.17%
0.13%
0.21%
0.12%
0.12%
0.04%
0.08%
CHF
0.16%
0.22%
0.18%
-0.04%
0.15%
0.07%
-0.08%
The heat map shows percentage changes of major currencies against each other. The base currency is picked from the left column, while the quote currency is picked from the top row. For example, if you pick the Euro from the left column and move along the horizontal line to the US Dollar, the percentage change displayed in the box will represent EUR (base)/USD (quote).
07:02
Sweden Industrial Production Value (MoM) fell from previous 5.7% to -7.6% in January
07:02
Germany Industrial Production n.s.a. w.d.a. (YoY) up to -1.6% in January from previous -3.1%
07:01
Sweden Industrial Production Value (YoY) dipped from previous 9% to -2.1% in January
07:00
Germany Imports (MoM) down to 1.2% in January from previous 2.1%
07:00
Germany Industrial Production s.a. (MoM) came in at 2%, above expectations (1.5%) in January
07:00
Germany Exports (MoM): -2.5% (January) vs previous 2.9%
07:00
Sweden New Orders Manufacturing (YoY) climbed from previous 5.8% to 16.7% in January
WTI remains on the defensive around $66.45 in Monday’s early European session.
Trump’s tariff threats continue to undermine the WTI price.
Softer Chinese CPI inflation contributes to the WTI’s downside.
West Texas Intermediate (WTI), the US crude oil benchmark, is trading around $66.45 during the early European session on Monday. The WTI price remains under selling pressure amid concern about the impact of US import tariffs on global economic growth and the risk-off mood.
US President Donald Trump issued an executive order last week exempting goods from both Canada and Mexico under a North American trade agreement, known as USMCA, while raising taxes on Chinese goods. China retaliated against the US and Canada with tariffs on agricultural products, per Reuters. The tariffs were announced by the Commerce Ministry and scheduled to take effect on March 20. Tariff uncertainty under the Trump administration continues to undermine the WTI price in the near term.
Concerns about US growth also weigh on the WTI price. The US February Nonfarm Payrolls (NFP) data came in weaker than expected, suggesting that the Federal Reserve (Fed) remained on track to cut interest rates multiple times this year. Traders pushed their bets on a start to Fed rate cuts to June, from May before the report, but still expect a total of three cuts in 2025.
Weak economic data from China contributes to the WTI’s downside as China is the top consumer of oil in the world. Data released by the National Bureau of Statistics (NBS) on Sunday showed that China's CPI in February missed expectations and fell at the sharpest pace since January 2024. The CPI fell 0.7% in February from a year earlier, reversing January's 0.5% increase.
WTI Oil FAQs
WTI Oil is a type of Crude Oil sold on international markets. The WTI stands for West Texas Intermediate, one of three major types including Brent and Dubai Crude. WTI is also referred to as “light” and “sweet” because of its relatively low gravity and sulfur content respectively. It is considered a high quality Oil that is easily refined. It is sourced in the United States and distributed via the Cushing hub, which is considered “The Pipeline Crossroads of the World”. It is a benchmark for the Oil market and WTI price is frequently quoted in the media.
Like all assets, supply and demand are the key drivers of WTI Oil price. As such, global growth can be a driver of increased demand and vice versa for weak global growth. Political instability, wars, and sanctions can disrupt supply and impact prices. The decisions of OPEC, a group of major Oil-producing countries, is another key driver of price. The value of the US Dollar influences the price of WTI Crude Oil, since Oil is predominantly traded in US Dollars, thus a weaker US Dollar can make Oil more affordable and vice versa.
The weekly Oil inventory reports published by the American Petroleum Institute (API) and the Energy Information Agency (EIA) impact the price of WTI Oil. Changes in inventories reflect fluctuating supply and demand. If the data shows a drop in inventories it can indicate increased demand, pushing up Oil price. Higher inventories can reflect increased supply, pushing down prices. API’s report is published every Tuesday and EIA’s the day after. Their results are usually similar, falling within 1% of each other 75% of the time. The EIA data is considered more reliable, since it is a government agency.
OPEC (Organization of the Petroleum Exporting Countries) is a group of 12 Oil-producing nations who collectively decide production quotas for member countries at twice-yearly meetings. Their decisions often impact WTI Oil prices. When OPEC decides to lower quotas, it can tighten supply, pushing up Oil prices. When OPEC increases production, it has the opposite effect. OPEC+ refers to an expanded group that includes ten extra non-OPEC members, the most notable of which is Russia.
Here is what you need to know on Monday, March 10:
The US Dollar (USD) Index fell more than 3% last week and registered its largest one-week loss since November 2022. The economic calendar will not feature any high-impact data releases on Monday, allowing investors to remain focused on geopolitics and headlines surrounding US President Donald Trump's trade policies.
The USD suffered large losses against its major rivals to begin the month of March as the disappointing macroeconomic data releases, combined with the Trump administration's tariffs, revived fears over an economic downturn in the US. Early Monday, the USD Index trades marginally lower on the day below 104.00, while US stock index futures lose between 0.4% and 0.6%.
US Dollar PRICE Last 7 days
The table below shows the percentage change of US Dollar (USD) against listed major currencies last 7 days. US Dollar was the weakest against the Euro.
USD
EUR
GBP
JPY
CAD
AUD
NZD
CHF
USD
-4.29%
-2.62%
-1.89%
-0.58%
-1.79%
-2.22%
-2.69%
EUR
4.29%
1.62%
2.29%
3.67%
2.50%
1.97%
1.49%
GBP
2.62%
-1.62%
0.74%
2.02%
0.87%
0.35%
-0.13%
JPY
1.89%
-2.29%
-0.74%
1.55%
0.16%
-0.28%
-0.81%
CAD
0.58%
-3.67%
-2.02%
-1.55%
-1.06%
-1.64%
-2.11%
AUD
1.79%
-2.50%
-0.87%
-0.16%
1.06%
-0.52%
-0.99%
NZD
2.22%
-1.97%
-0.35%
0.28%
1.64%
0.52%
-0.48%
CHF
2.69%
-1.49%
0.13%
0.81%
2.11%
0.99%
0.48%
The heat map shows percentage changes of major currencies against each other. The base currency is picked from the left column, while the quote currency is picked from the top row. For example, if you pick the US Dollar from the left column and move along the horizontal line to the Japanese Yen, the percentage change displayed in the box will represent USD (base)/JPY (quote).
On Friday, the data published by the US Bureau of Labor Statistics showed that Nonfarm Payrolls rose by 151,000 in February. This reading came in below the market expectation of 160,000. Other details of the employment report showed that the Unemployment Rate edged higher to 4.1% from 4% in January, while the Participation Rate declined to 62.4% from 62.6% in the same period. In his last public appearance before the March policy meeting, Federal Reserve (Fed) Chairman Jerome Powell noted on Friday that the uncertainty around the Trump administration's policies are high and repeated that they can maintain policy restraint for longer if inflation progress stalls or that they can ease the policy if the labor market unexpectedly weakens.
EUR/USD preserved its bullish momentum and gained more than 4% in the previous week. The pair stays in a consolidation phase at around 1.0850 in the European morning on Monday.
GBP/USD benefited from the broad-based USD weakness and rose more than 2.5% last week. The Bank of England (BoE) will release its Quarterly Bulletin later in the day. At the time of press, the pair was trading virtually unchanged on the day at around 1.2920.
Gold registered weekly gains but struggled to gather bullish momentum after reclaiming $2,900. XAU/USD holds steady near $2,910 to begin the European session.
USD/CAD gained traction and snapped a three-day losing streak on Friday. The pair fluctuates in a tight channel slightly above 1.4350 in the European morning on Monday. On Wednesday, the Bank of Canada (BoC) will announce monetary policy decisions. Meanwhile, Trump told Fox News over the weekend that tariffs on some imports from Canada and Mexico planned for April 2 could go up.
USD/JPY stays on the back foot and trades in negative territory below 148.00 to begin the new week. The data from Japan showed earlier in the day that Labor Cash Earnings rose by 2.8% on a yearly basis in January, following the 4.4% increase recorded in December and falling short of the market expectation of 3.2%.
Tariffs FAQs
Tariffs are customs duties levied on certain merchandise imports or a category of products. Tariffs are designed to help local producers and manufacturers be more competitive in the market by providing a price advantage over similar goods that can be imported. Tariffs are widely used as tools of protectionism, along with trade barriers and import quotas.
Although tariffs and taxes both generate government revenue to fund public goods and services, they have several distinctions. Tariffs are prepaid at the port of entry, while taxes are paid at the time of purchase. Taxes are imposed on individual taxpayers and businesses, while tariffs are paid by importers.
There are two schools of thought among economists regarding the usage of tariffs. While some argue that tariffs are necessary to protect domestic industries and address trade imbalances, others see them as a harmful tool that could potentially drive prices higher over the long term and lead to a damaging trade war by encouraging tit-for-tat tariffs.
During the run-up to the presidential election in November 2024, Donald Trump made it clear that he intends to use tariffs to support the US economy and American producers. In 2024, Mexico, China and Canada accounted for 42% of total US imports. In this period, Mexico stood out as the top exporter with $466.6 billion, according to the US Census Bureau. Hence, Trump wants to focus on these three nations when imposing tariffs. He also plans to use the revenue generated through tariffs to lower personal income taxes.
GBP/JPY faces some selling pressure to near 190.60 in Monday’s early European session.
BoJ's hawkish monetary policy outlook and safe haven demand underpin the Japanese Yen.
BoE Bailey endorsed a gradual path for “removing monetary policy restrictiveness.”
The GBP/JPY cross attracts some sellers to around 190.60 during the early European trading hours on Monday. The Japanese Yen (JPY) gathers strength against the Pound Sterling (GBP) amid the hawkish expectations of the Bank of Japan (BoJ) and the safe-haven demand.
Hawkish signals from the BoJ were key support for the JPY after Deputy Governor Shinichi Uchida said that the Japanese central bank did intend to raise interest rates further. Still, Uchida ruled out a hike at the BOJ’s upcoming meeting in March.
Furthermore, the escalating concern over a global trade war further boosts the JPY's relative safe-haven status and creates a headwind for GBP/JPY. Late Sunday, US Commerce Secretary Howard Lutnick said that the 25% tariffs on steel and aluminum imports, set to take effect on Wednesday, are unlikely to be postponed.
The Bank of England (BoE) governor Andrew Bailey said the bank will consider further rate cuts but will take "a gradual and careful approach” as the inflation persistence is less likely to fade on its own accord. Traders await forecasts of the Office for Budget Responsibility (OBR) on March 26, at a time when Finance Minister Rachel Reeves is pressured to clarify how she would balance the books without breaking her own fiscal rules.
Japanese Yen FAQs
The Japanese Yen (JPY) is one of the world’s most traded currencies. Its value is broadly determined by the performance of the Japanese economy, but more specifically by the Bank of Japan’s policy, the differential between Japanese and US bond yields, or risk sentiment among traders, among other factors.
One of the Bank of Japan’s mandates is currency control, so its moves are key for the Yen. The BoJ has directly intervened in currency markets sometimes, generally to lower the value of the Yen, although it refrains from doing it often due to political concerns of its main trading partners. The BoJ ultra-loose monetary policy between 2013 and 2024 caused the Yen to depreciate against its main currency peers due to an increasing policy divergence between the Bank of Japan and other main central banks. More recently, the gradually unwinding of this ultra-loose policy has given some support to the Yen.
Over the last decade, the BoJ’s stance of sticking to ultra-loose monetary policy has led to a widening policy divergence with other central banks, particularly with the US Federal Reserve. This supported a widening of the differential between the 10-year US and Japanese bonds, which favored the US Dollar against the Japanese Yen. The BoJ decision in 2024 to gradually abandon the ultra-loose policy, coupled with interest-rate cuts in other major central banks, is narrowing this differential.
The Japanese Yen is often seen as a safe-haven investment. This means that in times of market stress, investors are more likely to put their money in the Japanese currency due to its supposed reliability and stability. Turbulent times are likely to strengthen the Yen’s value against other currencies seen as more risky to invest in.
USD remains under some selling pressure for the fifth straight day on Monday.
Fed rate cut bets drag the US bond yields lower and undermine the Greenback.
The recent break below the 200-day SMA supports prospects for further losses.
The US Dollar Index (DXY), which tracks the Greenback against a basket of currencies, adds to last week's heavy losses and attracts some follow-through sellers for the fifth successive day on Monday. The downward trajectory drags the index to its lowest level since early November, around the 103.45 region, during the Asian session and validates the recent breakdown below the very important 200-day Simple Moving Average (SMA).
The weaker-than-expected US monthly employment details released on Friday reaffirmed market bets that the Federal Reserve (Fed) will cut interest rates multiple times this year, which triggers a fresh leg down in the US Treasury bond yields. Apart from this, worries that US President Donald Trump's trade policies might slow the US economic activity exert some downward pressure on the USD.
That said, the Relative Strength Index (RSI) on the daily chart has slipped below the 30 mark and points to slightly oversold conditions and warrants caution for bearish traders. This, in turn, makes it prudent to wait for some near-term consolidation or a modest bounce before positioning further losses. Any attempted recovery beyond the 104.00 mark could be seen as a selling opportunity near the 104.40 area.
This, in turn, should keep a lid on the USD near the 105.00 psychological mark, or the 200-day SMA. The latter should act as a key pivotal point, which if cleared decisively could suggest that the USD has formed a near-term bottom and trigger a short-covering rally towards the 105.75-105.80 region en route to the 106.00-106.10 horizontal support breakpoint, now turned resistance.
On the flip side, acceptance below the 103.40-103.35 area, or the November 2024 swing low, would be seen as a fresh trigger for bearish traders and drag the USD towards the 103.00 round figure. The downward trajectory could extend further towards the next relevant support near the 102.50-102.45 region before the index weakens below the 102.00 mark, towards testing the 101.85-101.80 support zone.
US Dollar Index (DXY) daily chart
US Dollar PRICE This month
The table below shows the percentage change of US Dollar (USD) against listed major currencies this month. US Dollar was the strongest against the Canadian Dollar.
USD
EUR
GBP
JPY
CAD
AUD
NZD
CHF
USD
-3.95%
-2.30%
-1.33%
-0.55%
-1.20%
-1.47%
-2.27%
EUR
3.95%
1.71%
2.74%
3.55%
2.85%
2.58%
1.74%
GBP
2.30%
-1.71%
0.99%
1.80%
1.12%
0.85%
0.03%
JPY
1.33%
-2.74%
-0.99%
0.82%
0.12%
-0.15%
-0.95%
CAD
0.55%
-3.55%
-1.80%
-0.82%
-0.68%
-0.93%
-1.74%
AUD
1.20%
-2.85%
-1.12%
-0.12%
0.68%
-0.26%
-1.10%
NZD
1.47%
-2.58%
-0.85%
0.15%
0.93%
0.26%
-0.81%
CHF
2.27%
-1.74%
-0.03%
0.95%
1.74%
1.10%
0.81%
The heat map shows percentage changes of major currencies against each other. The base currency is picked from the left column, while the quote currency is picked from the top row. For example, if you pick the US Dollar from the left column and move along the horizontal line to the Japanese Yen, the percentage change displayed in the box will represent USD (base)/JPY (quote).
05:30
Netherlands, The Manufacturing Output (MoM) increased to 1% in January from previous -1%
USD/CHF struggles as the US Dollar weakens amid growing concerns over a potential slowdown in the US economy.
The Swiss Franc gains strength as trade tensions rise following China’s new tariffs of 10–15% on US agricultural goods.
The Swiss National Bank is expected to implement a rate cut in March, with the possibility of another in June.
The USD/CHF pair continues its decline for the third consecutive day and is trading around 0.8790 during Monday’s Asian session. The US Dollar (USD) faces headwinds amid growing concerns about a potential slowdown in the US economy. However, further downside may be limited as US Treasury yields rise.
The US Dollar Index (DXY), which tracks the USD against six major currencies, has fallen for the fifth straight session and is hovering around 103.90. Meanwhile, 2- and 10-year yields on US Treasury bonds are standing at 3.98% and 4.28%, respectively, at the time of writing.
Safe-haven demand for the Swiss Franc (CHF) strengthens as trade tensions between the US and China escalate. In response to US President Donald Trump’s latest tariff hike on Chinese imports, Beijing has imposed new tariffs of 10–15% on select US agricultural goods, effective Monday.
Further fueling trade tensions, China announced a 100% tariff on Canadian agricultural goods in retaliation for tariffs imposed by Canada in October, further intensifying the broader trade conflict shaped by Trump’s tariff policies.
Additionally, US Commerce Secretary Howard Lutnick stated late Sunday that Trump’s planned 25% tariffs on steel and aluminum imports—set to take effect Wednesday—are unlikely to be delayed, according to Bloomberg.
Switzerland's inflation rate eased to 0.3% in February, the lowest since April 2021, down from 0.4% in January. Meanwhile, the Swiss economy grew by 0.2% in Q4 2024, slowing from 0.4% in Q3 and marking its weakest expansion since Q2 2023. These trends have fueled speculation of further rate cuts by the Swiss National Bank (SNB), with markets expecting one in March and potentially another in June.
Swiss Franc FAQs
The Swiss Franc (CHF) is Switzerland’s official currency. It is among the top ten most traded currencies globally, reaching volumes that well exceed the size of the Swiss economy. Its value is determined by the broad market sentiment, the country’s economic health or action taken by the Swiss National Bank (SNB), among other factors. Between 2011 and 2015, the Swiss Franc was pegged to the Euro (EUR). The peg was abruptly removed, resulting in a more than 20% increase in the Franc’s value, causing a turmoil in markets. Even though the peg isn’t in force anymore, CHF fortunes tend to be highly correlated with the Euro ones due to the high dependency of the Swiss economy on the neighboring Eurozone.
The Swiss Franc (CHF) is considered a safe-haven asset, or a currency that investors tend to buy in times of market stress. This is due to the perceived status of Switzerland in the world: a stable economy, a strong export sector, big central bank reserves or a longstanding political stance towards neutrality in global conflicts make the country’s currency a good choice for investors fleeing from risks. Turbulent times are likely to strengthen CHF value against other currencies that are seen as more risky to invest in.
The Swiss National Bank (SNB) meets four times a year – once every quarter, less than other major central banks – to decide on monetary policy. The bank aims for an annual inflation rate of less than 2%. When inflation is above target or forecasted to be above target in the foreseeable future, the bank will attempt to tame price growth by raising its policy rate. Higher interest rates are generally positive for the Swiss Franc (CHF) as they lead to higher yields, making the country a more attractive place for investors. On the contrary, lower interest rates tend to weaken CHF.
Macroeconomic data releases in Switzerland are key to assessing the state of the economy and can impact the Swiss Franc’s (CHF) valuation. The Swiss economy is broadly stable, but any sudden change in economic growth, inflation, current account or the central bank’s currency reserves have the potential to trigger moves in CHF. Generally, high economic growth, low unemployment and high confidence are good for CHF. Conversely, if economic data points to weakening momentum, CHF is likely to depreciate.
As a small and open economy, Switzerland is heavily dependent on the health of the neighboring Eurozone economies. The broader European Union is Switzerland’s main economic partner and a key political ally, so macroeconomic and monetary policy stability in the Eurozone is essential for Switzerland and, thus, for the Swiss Franc (CHF). With such dependency, some models suggest that the correlation between the fortunes of the Euro (EUR) and the CHF is more than 90%, or close to perfect.
Gold price extends its sideways consolidative price move during the Asian session on Monday.
Worries about Trump‘s trade policies and Fed rate cut bets continue to support the commodity.
The USD languishes near a multi-month low and further acts as a tailwind for the XAU/USD pair.
Gold price (XAU/USD) continues with its struggle to gain any meaningful traction during the Asian session on Monday and remains confined in a familiar range held over the past week or so. The downside, however, remains cushioned amid fears of a global trade conflict, which continues to offer support to the safe-haven bullion. Furthermore, the growing acceptance that the Federal Reserve (Fed) will cut interest rates multiple times this year, bolstered by Friday's weaker US jobs data, turns out to be another factor acting as a tailwind for the non-yielding yellow metal.
Apart from this, worries that Trump's trade policies will hit US economic activity keep the US Dollar (USD) depressed near its lowest level since November and suggest that the path of least resistance for the Gold price is to the upside. That said, the lack of any buying interest warrants some caution before placing fresh bullish bets around the XAU/USD pair and positioning for the resumption of the strong uptrend from the December 2024 low. Nevertheless, the fundamental backdrop suggests that any corrective slide could be seen as a buying opportunity and remain limited.
Daily Digest Market Movers: Gold price bulls remain on the sidelines despite a combination of supporting factors
The uncertainty surrounding US President Donald Trump's trade policies keeps investors on the edge and continues to act as a tailwind for the Gold price at the start of a new week. Moreover, investors remain worried that Trump's protectionist tariffs could slow the US economic growth and force the Federal Reserve to resume its rate-cutting cycle in June.
In fact, Trump took another pivot on his tariff agenda and said that impending tariffs on Canada may or may not come on Monday, or on Tuesday. This comes a day after the Trump administration temporarily waived off the 25% steep tariffs on goods from Canada and Mexico that comply with the US–Mexico–Canada Agreement for a month.
Fed Chair Jerome Powell said on Friday that the uncertainty around Trump Administration policies and their economic effects remains high. Separately, San Francisco Fed President Mary Daly said late Sunday that rising uncertainty among businesses could dampen demand in the US economy but does not justify a change in the interest rates policy.
Adding to this, the US monthly employment details released on Friday showed that the US labor market in the world's largest economy slowed last month and reaffirmed bets for further policy easing by the Fed. The headline Nonfarm Payrolls print came in to show that the economy added 151K jobs in February against the 160K consensus forecast.
Moreover, the previous month's reading was revised down to 125K from 143K reported originally. Additional details of the report showed that the Unemployment Rate unexpectedly edged higher to 4.1% from 4.0% in January. This, to a larger extent, overshadowed a rise in the Average Hourly Earnings to 4% from 3.9% in January (revised from 4.1%).
Traders are now pricing in about three rate cuts of 25 basis points each by the Fed by the end of this year. This, in turn, triggers a fresh leg down in the US Treasury bond yields, which keeps the USD bulls on the defensive. Despite the supporting factors, the non-yielding precious metal has been struggling to attract meaningful buyers, warranting caution for bulls.
Gold price could aim towards challenging the all-time peak once the $2,930 immediate hurdle is cleared decisively
From a technical perspective, the Gold price has been showing some resilience below the $2,900 mark. Moreover, oscillators on the daily chart – though they have been losing traction – are still holding in positive territory. That said, the recent repeated failures to make it through the $2,925-2,930 supply zone make it prudent to wait for strong follow-through buying before placing fresh bullish bets. The XAU/USD might then aim to challenge the all-time peak, around the $2,956 region touched on February 24.
On the flip side, acceptance below the $2,900-2,895 horizontal zone might prompt some technical selling and drag the Gold price to the $2,860-2,858 horizontal zone. The downward trajectory could extend further towards the February 28 swing low, around the $2,833-2,832 area, before the XAU/USD eventually drops to the $2,800 round-figure mark.
Gold FAQs
Gold has played a key role in human’s history as it has been widely used as a store of value and medium of exchange. Currently, apart from its shine and usage for jewelry, the precious metal is widely seen as a safe-haven asset, meaning that it is considered a good investment during turbulent times. Gold is also widely seen as a hedge against inflation and against depreciating currencies as it doesn’t rely on any specific issuer or government.
Central banks are the biggest Gold holders. In their aim to support their currencies in turbulent times, central banks tend to diversify their reserves and buy Gold to improve the perceived strength of the economy and the currency. High Gold reserves can be a source of trust for a country’s solvency. Central banks added 1,136 tonnes of Gold worth around $70 billion to their reserves in 2022, according to data from the World Gold Council. This is the highest yearly purchase since records began. Central banks from emerging economies such as China, India and Turkey are quickly increasing their Gold reserves.
Gold has an inverse correlation with the US Dollar and US Treasuries, which are both major reserve and safe-haven assets. When the Dollar depreciates, Gold tends to rise, enabling investors and central banks to diversify their assets in turbulent times. Gold is also inversely correlated with risk assets. A rally in the stock market tends to weaken Gold price, while sell-offs in riskier markets tend to favor the precious metal.
The price can move due to a wide range of factors. Geopolitical instability or fears of a deep recession can quickly make Gold price escalate due to its safe-haven status. As a yield-less asset, Gold tends to rise with lower interest rates, while higher cost of money usually weighs down on the yellow metal. Still, most moves depend on how the US Dollar (USD) behaves as the asset is priced in dollars (XAU/USD). A strong Dollar tends to keep the price of Gold controlled, whereas a weaker Dollar is likely to push Gold prices up.
EUR/USD weakens to around 1.0830 in Monday’s early European, down 0.15% on the day.
The positive bias of the pair prevails above the 100-day EMA, but the overbought RSI condition might cap its upside.
The immediate resistance level emerges at 1.0900; the first downside target to watch is 1.0712.
The EUR/USD pair loses momentum to around 1.0835 during the early European session on Monday. The concerns over a global trade war exert some selling pressure on riskier assets like the Euro (EUR). Investors brace for the German Industrial Production for January and Eurozone Sentix Investor Confidence for fresh impetus.
According to the daily chart, the constructive outlook of EUR/USD remains intact as the major pair holds above the key 100-day Exponential Moving Averages (EMA). However, the 14-day Relative Strength Index (RSI) stands above the midline near 71.30, indicating the overbought RSI condition. This suggests that further consolidation cannot be ruled out before positioning for any near-term EUR/USD appreciation.
The 1.0900 psychological level acts as an immediate resistance level for the major pair. A decisive break above this level could see a rally to 1.0936, a high of November 5, 2024. The crucial upside barrier emerges at 1.1000, the round figure.
On the flip side, the initial support level is located at 1.0712, the low of November 7, 2024. A breach of this level could expose 1.0544, the 100-day EMA. Further south, the next contention level to watch is 1.0360, the low of February 28.
EUR/USD daily chart
Euro FAQs
The Euro is the currency for the 19 European Union countries that belong to the Eurozone. It is the second most heavily traded currency in the world behind the US Dollar. In 2022, it accounted for 31% of all foreign exchange transactions, with an average daily turnover of over $2.2 trillion a day. EUR/USD is the most heavily traded currency pair in the world, accounting for an estimated 30% off all transactions, followed by EUR/JPY (4%), EUR/GBP (3%) and EUR/AUD (2%).
The European Central Bank (ECB) in Frankfurt, Germany, is the reserve bank for the Eurozone. The ECB sets interest rates and manages monetary policy. The ECB’s primary mandate is to maintain price stability, which means either controlling inflation or stimulating growth. Its primary tool is the raising or lowering of interest rates. Relatively high interest rates – or the expectation of higher rates – will usually benefit the Euro and vice versa. The ECB Governing Council makes monetary policy decisions at meetings held eight times a year. Decisions are made by heads of the Eurozone national banks and six permanent members, including the President of the ECB, Christine Lagarde.
Eurozone inflation data, measured by the Harmonized Index of Consumer Prices (HICP), is an important econometric for the Euro. If inflation rises more than expected, especially if above the ECB’s 2% target, it obliges the ECB to raise interest rates to bring it back under control. Relatively high interest rates compared to its counterparts will usually benefit the Euro, as it makes the region more attractive as a place for global investors to park their money.
Data releases gauge the health of the economy and can impact on the Euro. Indicators such as GDP, Manufacturing and Services PMIs, employment, and consumer sentiment surveys can all influence the direction of the single currency. A strong economy is good for the Euro. Not only does it attract more foreign investment but it may encourage the ECB to put up interest rates, which will directly strengthen the Euro. Otherwise, if economic data is weak, the Euro is likely to fall. Economic data for the four largest economies in the euro area (Germany, France, Italy and Spain) are especially significant, as they account for 75% of the Eurozone’s economy.
Another significant data release for the Euro is the Trade Balance. This indicator measures the difference between what a country earns from its exports and what it spends on imports over a given period. If a country produces highly sought after exports then its currency will gain in value purely from the extra demand created from foreign buyers seeking to purchase these goods. Therefore, a positive net Trade Balance strengthens a currency and vice versa for a negative balance.
05:01
Japan Leading Economic Index came in at 108 below forecasts (108.4) in January
05:00
Japan Coincident Index: 116.2 (January) vs previous 116.4
05:00
Japan Current Account n.s.a. below expectations (¥-230.5B) in January: Actual (¥-257.6B)
04:59
Japan Current Account n.s.a. above forecasts (¥-230.5B) in January: Actual (¥3343B)
Gold prices remained broadly unchanged in India on Monday, according to data compiled by FXStreet.
The price for Gold stood at 8,166.96 Indian Rupees (INR) per gram, broadly stable compared with the INR 8,159.95 it cost on Friday.
The price for Gold was broadly steady at INR 95,257.87 per tola from INR 95,176.09 per tola on friday.
Unit measure
Gold Price in INR
1 Gram
8,166.96
10 Grams
81,669.64
Tola
95,257.87
Troy Ounce
254,022.90
2025 Gold Forecast Guide [PDF]
Download your free copy of the 2025 Gold Forecast
FXStreet calculates Gold prices in India by adapting international prices (USD/INR) to the local currency and measurement units. Prices are updated daily based on the market rates taken at the time of publication. Prices are just for reference and local rates could diverge slightly.
Gold FAQs
Gold has played a key role in human’s history as it has been widely used as a store of value and medium of exchange. Currently, apart from its shine and usage for jewelry, the precious metal is widely seen as a safe-haven asset, meaning that it is considered a good investment during turbulent times. Gold is also widely seen as a hedge against inflation and against depreciating currencies as it doesn’t rely on any specific issuer or government.
Central banks are the biggest Gold holders. In their aim to support their currencies in turbulent times, central banks tend to diversify their reserves and buy Gold to improve the perceived strength of the economy and the currency. High Gold reserves can be a source of trust for a country’s solvency. Central banks added 1,136 tonnes of Gold worth around $70 billion to their reserves in 2022, according to data from the World Gold Council. This is the highest yearly purchase since records began. Central banks from emerging economies such as China, India and Turkey are quickly increasing their Gold reserves.
Gold has an inverse correlation with the US Dollar and US Treasuries, which are both major reserve and safe-haven assets. When the Dollar depreciates, Gold tends to rise, enabling investors and central banks to diversify their assets in turbulent times. Gold is also inversely correlated with risk assets. A rally in the stock market tends to weaken Gold price, while sell-offs in riskier markets tend to favor the precious metal.
The price can move due to a wide range of factors. Geopolitical instability or fears of a deep recession can quickly make Gold price escalate due to its safe-haven status. As a yield-less asset, Gold tends to rise with lower interest rates, while higher cost of money usually weighs down on the yellow metal. Still, most moves depend on how the US Dollar (USD) behaves as the asset is priced in dollars (XAU/USD). A strong Dollar tends to keep the price of Gold controlled, whereas a weaker Dollar is likely to push Gold prices up.
(An automation tool was used in creating this post.)
Silver price declines as softer economic data from China fuel demand concerns.
China’s Producer Price Index fell 2.2% YoY, underscoring persistent deflationary pressures in the country’s industrial sector.
The downside risks for the safe-haven metal remain limited as trade tensions intensify following China’s 100% tariff on Canadian imports.
Silver price (XAG/USD) extends its losing streak for a third consecutive session, trading around $32.40 per troy ounce during Asian hours on Monday. The prices of the grey metal depreciate as softer economic data from China fuel demand concerns.
China’s Producer Price Index (PPI) dropped 2.2% year-over-year, following a 2.3% decline in the previous two months. This represents the slowest contraction since August 2024 but highlights persistent deflationary pressures in China's industrial sector, where Silver demand is significant.
Moreover, China’s Consumer Price Index (CPI) fell 0.7% year-over-year in February, exceeding market expectations of a 0.5% decline and reversing the previous month’s 0.5% increase. This marks the first instance of consumer deflation since January 2024.
However, downside risks for the safe-haven metal appear limited as trade tensions escalate. On Saturday, China announced a 100% tariff on Canadian agricultural goods in retaliation for tariffs imposed by Canada in October, further intensifying the broader trade conflict shaped by Trump’s tariff policies.
Last week, President Trump’s 25% tariffs on Canadian and Mexican imports took effect. However, on Thursday, a one-month exemption was introduced for goods meeting North American trade pact standards, offering some temporary relief.
Additionally, safe-haven demand for Silver could strengthen amid rising concerns over the US economy. San Francisco Fed President Mary Daly stated late Sunday that growing uncertainty among businesses could weigh on economic demand. Daly noted that business leaders in her district are increasingly worried about economic conditions and policy, which research suggests may dampen overall demand.
Silver FAQs
Silver is a precious metal highly traded among investors. It has been historically used as a store of value and a medium of exchange. Although less popular than Gold, traders may turn to Silver to diversify their investment portfolio, for its intrinsic value or as a potential hedge during high-inflation periods. Investors can buy physical Silver, in coins or in bars, or trade it through vehicles such as Exchange Traded Funds, which track its price on international markets.
Silver prices can move due to a wide range of factors. Geopolitical instability or fears of a deep recession can make Silver price escalate due to its safe-haven status, although to a lesser extent than Gold's. As a yieldless asset, Silver tends to rise with lower interest rates. Its moves also depend on how the US Dollar (USD) behaves as the asset is priced in dollars (XAG/USD). A strong Dollar tends to keep the price of Silver at bay, whereas a weaker Dollar is likely to propel prices up. Other factors such as investment demand, mining supply – Silver is much more abundant than Gold – and recycling rates can also affect prices.
Silver is widely used in industry, particularly in sectors such as electronics or solar energy, as it has one of the highest electric conductivity of all metals – more than Copper and Gold. A surge in demand can increase prices, while a decline tends to lower them. Dynamics in the US, Chinese and Indian economies can also contribute to price swings: for the US and particularly China, their big industrial sectors use Silver in various processes; in India, consumers’ demand for the precious metal for jewellery also plays a key role in setting prices.
Silver prices tend to follow Gold's moves. When Gold prices rise, Silver typically follows suit, as their status as safe-haven assets is similar. The Gold/Silver ratio, which shows the number of ounces of Silver needed to equal the value of one ounce of Gold, may help to determine the relative valuation between both metals. Some investors may consider a high ratio as an indicator that Silver is undervalued, or Gold is overvalued. On the contrary, a low ratio might suggest that Gold is undervalued relative to Silver.
WTI edges lower amid worries that Trump’s trade tariffs would impact fuel demand.
OPEC+ will proceed with oil output hikes from April, further weighing on Oil prices.
Trump’s threat to impose more sanctions on Russia and a weaker USD lend support.
West Texas Intermediate (WTI) US Crude Oil prices struggle to capitalize on Friday's modest gains and attract fresh sellers at the start of a new week. The commodity currently trades just below mid-$66.00s, down nearly 0.60% for the day, and seems vulnerable to slide further.
Investors remain worried about the potential economic fallout from US President Donald Trump's trade tariffs and their impact on fuel demand. Furthermore, the Organization of the Petroleum Exporting Countries and its allies – collectively known as OPEC+ – said it will proceed with oil output hikes from April. This, in turn, is seen as a key factor weighing on Crude Oil prices.
The downside for the black liquid, however, seems limited in the wake of Trump's warning that the US would increase sanctions on Russia if the latter fails to reach a ceasefire with Ukraine. However, two people familiar with the matter told Reuters that the US is also studying ways to ease sanctions on Russia’s energy sector if the latter agrees to end its prolonged war with Ukraine.
Meanwhile, the weaker US jobs report released on Friday reaffirmed market bets that the Federal Reserve (Fed) remains on track to cut interest rates multiple times this year. This keeps the US Dollar (USD) depressed near its lowest level since November, which should act as a tailwind for USD-denominated commodities and contribute to limiting losses for Crude Oil prices.
WTI Oil FAQs
WTI Oil is a type of Crude Oil sold on international markets. The WTI stands for West Texas Intermediate, one of three major types including Brent and Dubai Crude. WTI is also referred to as “light” and “sweet” because of its relatively low gravity and sulfur content respectively. It is considered a high quality Oil that is easily refined. It is sourced in the United States and distributed via the Cushing hub, which is considered “The Pipeline Crossroads of the World”. It is a benchmark for the Oil market and WTI price is frequently quoted in the media.
Like all assets, supply and demand are the key drivers of WTI Oil price. As such, global growth can be a driver of increased demand and vice versa for weak global growth. Political instability, wars, and sanctions can disrupt supply and impact prices. The decisions of OPEC, a group of major Oil-producing countries, is another key driver of price. The value of the US Dollar influences the price of WTI Crude Oil, since Oil is predominantly traded in US Dollars, thus a weaker US Dollar can make Oil more affordable and vice versa.
The weekly Oil inventory reports published by the American Petroleum Institute (API) and the Energy Information Agency (EIA) impact the price of WTI Oil. Changes in inventories reflect fluctuating supply and demand. If the data shows a drop in inventories it can indicate increased demand, pushing up Oil price. Higher inventories can reflect increased supply, pushing down prices. API’s report is published every Tuesday and EIA’s the day after. Their results are usually similar, falling within 1% of each other 75% of the time. The EIA data is considered more reliable, since it is a government agency.
OPEC (Organization of the Petroleum Exporting Countries) is a group of 12 Oil-producing nations who collectively decide production quotas for member countries at twice-yearly meetings. Their decisions often impact WTI Oil prices. When OPEC decides to lower quotas, it can tighten supply, pushing up Oil prices. When OPEC increases production, it has the opposite effect. OPEC+ refers to an expanded group that includes ten extra non-OPEC members, the most notable of which is Russia.
USD/CAD may appreciate due to persistent trade uncertainties following China’s 100% tariff on Canadian imports.
Canadian Prime Minister Mark Carney may call an early election, possibly by late April or early May 2025.
The US Dollar struggles amid worries about a potential slowdown in the US economy.
USD/CAD remains steady after registering gains in the previous session, trading around 1.4360 during the Asian hours on Monday. The Canadian Dollar (CAD) may face headwinds due to ongoing trade uncertainties.
On Saturday, China announced that it will impose a 100% tariff on Canadian rapeseed oil, oil cakes, and peas, along with a 25% levy on aquatic products and pork from Canada. This move, in response to tariffs introduced by Canada in October, intensifies trade tensions and adds another dimension to the broader trade conflict largely driven by Trump's tariff policies. The new tariffs are set to take effect on March 20.
Last week, President Trump’s 25% tariffs on Canadian and Mexican imports took effect. However, on Thursday, a one-month exemption was introduced for goods that comply with North American trade pact standards, providing some relief.
Amidst this backdrop, speculation is growing that Canadian Prime Minister Mark Carney could call an election as early as Monday. While Canada’s next federal election is scheduled for October 20, 2025, an early call remains possible, potentially by late April or early May 2025.
US Commerce Secretary Howard Lutnick stated late Sunday that the 25% tariffs on steel and aluminum imports, scheduled to take effect on Wednesday, are unlikely to be delayed. Ordered by US President Donald Trump in February, the tariffs apply to imports from major foreign suppliers, including Canada and Mexico, and cover finished metal products, according to Bloomberg.
The US Dollar (USD) faces downward pressure due to concerns over a potential slowdown in the United States (US) economy. However, the downside of the Greenback could be limited as the US Treasury yields rise.
The US Dollar Index (DXY), which measures the US Dollar against six major currencies, is losing ground for the fifth consecutive day, is trading around 103.80 with 2- and 10-year yields on US Treasury bonds standing at 3.97% and 4.28%, respectively, at the time of writing.
Canadian Dollar FAQs
The key factors driving the Canadian Dollar (CAD) are the level of interest rates set by the Bank of Canada (BoC), the price of Oil, Canada’s largest export, the health of its economy, inflation and the Trade Balance, which is the difference between the value of Canada’s exports versus its imports. Other factors include market sentiment – whether investors are taking on more risky assets (risk-on) or seeking safe-havens (risk-off) – with risk-on being CAD-positive. As its largest trading partner, the health of the US economy is also a key factor influencing the Canadian Dollar.
The Bank of Canada (BoC) has a significant influence on the Canadian Dollar by setting the level of interest rates that banks can lend to one another. This influences the level of interest rates for everyone. The main goal of the BoC is to maintain inflation at 1-3% by adjusting interest rates up or down. Relatively higher interest rates tend to be positive for the CAD. The Bank of Canada can also use quantitative easing and tightening to influence credit conditions, with the former CAD-negative and the latter CAD-positive.
The price of Oil is a key factor impacting the value of the Canadian Dollar. Petroleum is Canada’s biggest export, so Oil price tends to have an immediate impact on the CAD value. Generally, if Oil price rises CAD also goes up, as aggregate demand for the currency increases. The opposite is the case if the price of Oil falls. Higher Oil prices also tend to result in a greater likelihood of a positive Trade Balance, which is also supportive of the CAD.
While inflation had always traditionally been thought of as a negative factor for a currency since it lowers the value of money, the opposite has actually been the case in modern times with the relaxation of cross-border capital controls. Higher inflation tends to lead central banks to put up interest rates which attracts more capital inflows from global investors seeking a lucrative place to keep their money. This increases demand for the local currency, which in Canada’s case is the Canadian Dollar.
Macroeconomic data releases gauge the health of the economy and can have an impact on the Canadian Dollar. Indicators such as GDP, Manufacturing and Services PMIs, employment, and consumer sentiment surveys can all influence the direction of the CAD. A strong economy is good for the Canadian Dollar. Not only does it attract more foreign investment but it may encourage the Bank of Canada to put up interest rates, leading to a stronger currency. If economic data is weak, however, the CAD is likely to fall.
NZD/USD loses ground to near 0.5710 in Monday’s Asian session.
China's deflationary pressures deepen in February, weighing on the Kiwi.
Concerns about the US economic outlook after weaker US employment data might cap the pair’s downside.
The NZD/USD pair edges higher to around 0.5715 during the Asian trading hours on Monday. The softer-than-expect Chinese inflation data weighs on the New Zealand Dollar (NZD). The US Consumer Price Index (CPI) inflation data for February will be the highlight on Tuesday.
China's CPI in February missed expectations and fell at the sharpest pace since January 2024. The CPI fell 0.7% in February from a year earlier, reversing January's 0.5% increase, data from the National Bureau of Statistics (NBS) showed on Sunday.
"China's economy still faces deflationary pressure. While sentiment was improved by the developments in the technology space, domestic demand remains weak," said Zhiwei Zhang, president and chief economist at Pinpoint Asset Management. The sluggish household demand and weak consumption have raised concern about the world's second-largest economy, which exerts some selling pressure on the China-proxy Kiwi as China is a major trading partner to New Zealand.
The weaker-than-expected US February Nonfarm Payrolls (NFP) data suggested that the Federal Reserve (Fed) remained on track to cut interest rates multiple times this year. This, in turn, might undermine the Greenback and create a tailwind for NZD/USD. Financial markets expect the central bank to resume rate cuts in June, though much would depend on inflation.
San Francisco Fed President Mary Daly on Friday highlighted the growing uncertainty among businesses but said with the economy and interest rates being in a "good place," the Fed should not make any reactionary moves. Meanwhile, Fed Chairman Jerome Powell said Friday that the US central bank can wait to see how President Donald Trump’s aggressive policy actions play out before it moves again on interest rates. Powell added that policy uncertainty makes it difficult for the US central bank to enact policy adjustments.
New Zealand Dollar FAQs
The New Zealand Dollar (NZD), also known as the Kiwi, is a well-known traded currency among investors. Its value is broadly determined by the health of the New Zealand economy and the country’s central bank policy. Still, there are some unique particularities that also can make NZD move. The performance of the Chinese economy tends to move the Kiwi because China is New Zealand’s biggest trading partner. Bad news for the Chinese economy likely means less New Zealand exports to the country, hitting the economy and thus its currency. Another factor moving NZD is dairy prices as the dairy industry is New Zealand’s main export. High dairy prices boost export income, contributing positively to the economy and thus to the NZD.
The Reserve Bank of New Zealand (RBNZ) aims to achieve and maintain an inflation rate between 1% and 3% over the medium term, with a focus to keep it near the 2% mid-point. To this end, the bank sets an appropriate level of interest rates. When inflation is too high, the RBNZ will increase interest rates to cool the economy, but the move will also make bond yields higher, increasing investors’ appeal to invest in the country and thus boosting NZD. On the contrary, lower interest rates tend to weaken NZD. The so-called rate differential, or how rates in New Zealand are or are expected to be compared to the ones set by the US Federal Reserve, can also play a key role in moving the NZD/USD pair.
Macroeconomic data releases in New Zealand are key to assess the state of the economy and can impact the New Zealand Dollar’s (NZD) valuation. A strong economy, based on high economic growth, low unemployment and high confidence is good for NZD. High economic growth attracts foreign investment and may encourage the Reserve Bank of New Zealand to increase interest rates, if this economic strength comes together with elevated inflation. Conversely, if economic data is weak, NZD is likely to depreciate.
The New Zealand Dollar (NZD) tends to strengthen during risk-on periods, or when investors perceive that broader market risks are low and are optimistic about growth. This tends to lead to a more favorable outlook for commodities and so-called ‘commodity currencies’ such as the Kiwi. Conversely, NZD tends to weaken at times of market turbulence or economic uncertainty as investors tend to sell higher-risk assets and flee to the more-stable safe havens.
The Japanese Yen continues to draw support from bets for more BoJ rate hikes.
The narrowing US-Japan rate differential further benefits the lower-yielding JPY.
Expectations that the Fed will resume its rate-cutting cycle undermine the USD.
The Japanese Yen (JPY) attracts fresh buyers at the start of a new week and moves back closer to its highest level since October touched against a broadly weaker US Dollar (USD) on Friday. Data released during the Asian session on Monday showed that the base pay in Japan surged to a 32-year high in January, while real cash earnings fell 1.8% on the back of persistent inflation. This comes on top of a growing confidence that bumper wage hikes seen last year will continue this year and backs the case for further interest rate hikes by the Bank of Japan (BoJ), which, in turn, is seen underpinning the JPY.
Meanwhile, hawkish BoJ expectations continue to push Japanese government bond (JGB) yields higher. The resultant narrowing of the rate differential in Japan and other countries turn out to be another factor driving flows towards the lower-yielding JPY. The USD, on the other hand, languishes near a multi-month low amid rising bets that the Federal Reserve (Fed) will cut interest rates multiple times this year, bolstered by weaker US jobs report on Friday. This contributes to the offered tone surrounding the USD/JPY pair and supports prospects for a further near-term depreciating move.
Japanese Yen is underpinned by hawkish BoJ expectations
Japan's labor ministry reported Monday that Base pay rose by 3.1% in January from a year earlier – representing the largest advance since October 1992. Additional details revealed that growth in nominal wages slowed from 4.4% in December to 2.8% – marking the lowest reading in three months.
Meanwhile, real cash earnings ended two straight months of gains and fell 1.8% in January, reflecting the impact of persistent inflation. This, along with expectations that another substantial pay hike in Japan will fuel demand-driven inflation, should allow the Bank of Japan to hike interest rates further.
Japan's UA Zensen – a labour union group representing retail, restaurant, and other industry unions – said that its member unions are seeking an average wage hike of 6.11% for their full-time employees in the 2025 wage negotiations. For part-time workers, wage increases asked for averaged at 7.16%.
The yield on the benchmark 10-year Japanese government bond rose to its highest level since June 2009 and provided a fresh lift to the Japanese Yen during the Asian session on Monday. Apart from this, the prevalent US Dollar selling bias drags the USD/JPY pair back closer to the 147.00 round figure.
The USD languishes near a multi-month low touched in reaction to weaker US employment details on Friday, which suggested that the labor market in the world's largest economy slowed in February. The headline Nonfarm Payrolls showed that the economy added 151K jobs in February vs. the 160K forecast.
Adding to this, the previous month's reading was revised down to 125K from 143K reported originally. This was accompanied by an unexpected uptick in the Unemployment Rate to 4.1% and overshadowed by a rise in the Average Hourly Earnings to 4% from 3.9% in January (revised from 4.1%).
This comes amid worries that the uncertainty over US President Donald Trump's trade policies could slow economic activity in the US and force the Federal Reserve to resume its rate-cutting cycle in June. Moreover, traders are pricing in about three rate cuts of 25 basis points each this year.
Fed Chair Jerome Powell said on Friday that the US central bank can maintain policy restraint for longer if inflation progress stalls or eases if the labor market unexpectedly weakens or inflation falls more than expected. This, however, does little to lend any support to the USD or the USD/JPY pair.
Trump took another pivot on his tariff agenda and said that impending tariffs on Canada may or may not come on Monday, or on Tuesday. This comes hours after the Trump administration temporarily waived tariffs on goods that comply with the US–Mexico–Canada Agreement for a month.
Furthermore, US Commerce Secretary Howard Lutnick said late Sunday that the 25% tariffs on steel and aluminum imports, set to take effect on Wednesday, are unlikely to be postponed. This keeps investors on the edge, underpinning the safe-haven JPY and weighing on the USD/JPY pair.
USD/JPY bears are awaiting a break below the 147.00 mark
From a technical perspective, a sustained break and acceptance below the 147.00 mark would be seen as a fresh trigger for the USD/JPY bears and set the stage for an extension of a two-month-old downtrend. That said, the Relative Strength Index (RSI) on the daily chart is on the verge of breaking into oversold territory. Hence, it will be prudent to wait for some near-term consolidation or a modest bounce before positioning for any further depreciation.
Nevertheless, the USD/JPY pair seems vulnerable to weakening further below the 146.50 intermediate support and testing the 146.00 round figure. Some follow-through selling should pave the way for a fall towards the 145.25-145.20 zone en route to the 145.00 psychological mark and the next relevant support near the 144.80-144.75 region.
On the flip side, an attempted recovery might now confront stiff resistance near the 148.00 mark. Any further move up might be seen as a selling opportunity and remain capped near the 148.65-148.70 region. A sustained strength beyond the latter, however, could trigger a short-covering rally and lift the USD/JPY pair above the 149.00 mark, towards the 149.80-149.85 area en route to the 150.00 psychological mark and the 150.35-150.40 supply zone.
Economic Indicator
Labor Cash Earnings (YoY)
This indicator, released by the Ministry of Health, Labor and Welfare, shows the average income, before taxes, per regular employee. It includes overtime pay and bonuses but it doesn't take into account earnings from holding financial assets nor capital gains. Higher income puts upward pressures on consumption, and is inflationary for the Japanese economy. Generally, a higher-than-expected reading is bullish for the Japanese Yen (JPY), while a below-the-market consensus result is bearish.
Read more.
Last release:Sun Mar 09, 2025 23:30
Frequency:Monthly
Actual:2.8%
Consensus:3.2%
Previous:4.8%
Source:Ministry of Economy, Trade and Industry of Japan
The Australian Dollar gains momentum as investors react to concerns over a potential slowdown in the US economy.
The AUD finds support from stronger-than-expected GDP growth and robust trade data from Australia.
San Francisco Fed President Mary Daly noted that rising uncertainty among businesses could dampen demand in the US economy.
The Australian Dollar (AUD) rebounded on Monday, recovering losses from the previous two sessions against the US Dollar (USD). The AUD/USD pair's upward movement was primarily driven by concerns over a potential slowdown in the US economy.
The Aussie Dollar also received support from stronger-than-expected GDP growth and trade data from Australia released last week. On the monetary policy front, the latest Reserve Bank of Australia (RBA) Meeting Minutes indicated caution regarding further interest rate cuts, clarifying that February’s rate reduction does not signal a commitment to continued easing.
However, the AUD may have faced downward pressure following disappointing Chinese Consumer Price Index (CPI) data for February, given China’s role as Australia’s largest trading partner, released on Saturday.
Moreover, China announced on Saturday that it will impose a 100% tariff on Canadian rapeseed oil, oil cakes, and peas, along with a 25% levy on aquatic products and pork from Canada. The move comes as retaliation against tariffs introduced by Canada in October, escalating trade tensions. This marks a new front in a broader trade conflict largely driven by US President Donald Trump's tariff policies. The tariffs are set to take effect on March 20.
Australian Dollar appreciates as US Dollar declines amid concerns over US economy
The US Dollar Index (DXY), which measures the US Dollar against six major currencies, is losing ground for the fifth consecutive day, trading around 103.80 at the time of writing. However, the downside of the Greenback could be limited as the US Treasury yields rise.
The US Bureau of Labor Statistics (BLS) showed on Friday that Nonfarm Payrolls (NFP) increased by 151,000 in February, falling short of the expected 160,000. January’s job growth was also revised downward to 125,000 from the previously reported 143,000.
San Francisco Fed President Mary Daly stated late Sunday that increasing uncertainty among businesses could weaken demand in the US economy but does not warrant a change in interest rates. Daly noted that business leaders in her district are expressing growing concerns about the economy and policy, which research indicates could dampen demand.
US Commerce Secretary Howard Lutnick stated on Sunday that the 25% tariffs, imposed by President Donald Trump in February, on steel and aluminum imports, set to take effect on Wednesday, are unlikely to be postponed, according to Bloomberg. While US steelmakers have urged Trump to maintain the tariffs, businesses reliant on these materials may face increased costs.
President Trump stated on Sunday that he anticipates a positive outcome from the US discussions with Ukrainian officials in Saudi Arabia. Trump also mentioned that his administration has considered lifting an intelligence pause on Ukraine, is evaluating various aspects of tariffs on Russia, and is not worried about military exercises involving Russia, China, and Iran, according to Reuters.
Australia’s GDP grew by 0.6% quarter-over-quarter in the fourth quarter of 2024, surpassing Q3’s 0.3% expansion and beating market expectations of 0.5%. On an annual basis, GDP climbed to 1.3% in Q4 from 0.8% in the prior quarter.
Australia’s trade surplus rose to 5,620 million in January, surpassing the expected 5,500 million and improving from the previous 4,924 million (revised from 5,085 million). Exports climbed 1.3% month-over-month from the prior month, reaching an 11-month high driven by non-monetary gold. Meanwhile, imports declined by 0.3% MoM, following a sharp 5.9% increase in the previous month, according to the Australian Bureau of Statistics.
Reserve Bank of Australia (RBA) Deputy Governor Andrew Hauser highlighted that global trade uncertainty is at a 50-year high. Hauser warned that uncertainty stemming from US President Donald Trump's tariffs could prompt businesses and households to delay planning and investment, potentially weighing on economic growth.
China’s Consumer Price Index fell by 0.7% year-over-year in February, exceeding market expectations of a 0.5% decline and reversing the 0.5% increase recorded in the previous month. This marks the first instance of consumer deflation since January 2024, driven by weakening seasonal demand after the Spring Festival in late January. On a monthly basis, CPI inflation stood at -0.2% in February, down from January’s 0.7% and softer than the expected -0.1%.
China's Producer Price Index (PPI) declined by 2.2% year-over-year in February, slightly exceeding market expectations of a 2.1% drop. This follows a 2.3% decrease in the previous two months and represents the slowest decline since August 2024.
Technical Analysis: Australian Dollar tests nine-day EMA near 0.6300
AUD/USD is trading near 0.6320 on Monday, with technical analysis of the daily chart indicating the pair remains slightly above the nine-day Exponential Moving Average (EMA), suggesting strengthening short-term momentum. Additionally, the 14-day Relative Strength Index (RSI) stays above 50, reinforcing a bullish outlook.
On the upside, the first resistance appears at the psychological level of 0.6400, followed by the three-month high of 0.6408, recorded on February 21.
The immediate support for AUD/USD is at the nine-day EMA of 0.6301. A break below this key level could trigger further declines, potentially retesting the five-week low of 0.6187, recorded on March 5.
AUD/USD: Daily Chart
Australian Dollar PRICE Today
The table below shows the percentage change of Australian Dollar (AUD) against listed major currencies today. Australian Dollar was the strongest against the US Dollar.
USD
EUR
GBP
JPY
CAD
AUD
NZD
CHF
USD
-0.15%
-0.04%
-0.27%
-0.08%
-0.18%
-0.03%
-0.19%
EUR
0.15%
0.07%
-0.13%
0.08%
0.06%
0.09%
-0.16%
GBP
0.04%
-0.07%
-0.27%
-0.02%
-0.01%
-0.03%
-0.16%
JPY
0.27%
0.13%
0.27%
0.19%
0.15%
0.16%
0.15%
CAD
0.08%
-0.08%
0.02%
-0.19%
-0.15%
0.05%
-0.14%
AUD
0.18%
-0.06%
0.00%
-0.15%
0.15%
0.04%
-0.16%
NZD
0.03%
-0.09%
0.03%
-0.16%
-0.05%
-0.04%
-0.09%
CHF
0.19%
0.16%
0.16%
-0.15%
0.14%
0.16%
0.09%
The heat map shows percentage changes of major currencies against each other. The base currency is picked from the left column, while the quote currency is picked from the top row. For example, if you pick the Australian Dollar from the left column and move along the horizontal line to the US Dollar, the percentage change displayed in the box will represent AUD (base)/USD (quote).
Australian Dollar FAQs
One of the most significant factors for the Australian Dollar (AUD) is the level of interest rates set by the Reserve Bank of Australia (RBA). Because Australia is a resource-rich country another key driver is the price of its biggest export, Iron Ore. The health of the Chinese economy, its largest trading partner, is a factor, as well as inflation in Australia, its growth rate and Trade Balance. Market sentiment – whether investors are taking on more risky assets (risk-on) or seeking safe-havens (risk-off) – is also a factor, with risk-on positive for AUD.
The Reserve Bank of Australia (RBA) influences the Australian Dollar (AUD) by setting the level of interest rates that Australian banks can lend to each other. This influences the level of interest rates in the economy as a whole. The main goal of the RBA is to maintain a stable inflation rate of 2-3% by adjusting interest rates up or down. Relatively high interest rates compared to other major central banks support the AUD, and the opposite for relatively low. The RBA can also use quantitative easing and tightening to influence credit conditions, with the former AUD-negative and the latter AUD-positive.
China is Australia’s largest trading partner so the health of the Chinese economy is a major influence on the value of the Australian Dollar (AUD). When the Chinese economy is doing well it purchases more raw materials, goods and services from Australia, lifting demand for the AUD, and pushing up its value. The opposite is the case when the Chinese economy is not growing as fast as expected. Positive or negative surprises in Chinese growth data, therefore, often have a direct impact on the Australian Dollar and its pairs.
Iron Ore is Australia’s largest export, accounting for $118 billion a year according to data from 2021, with China as its primary destination. The price of Iron Ore, therefore, can be a driver of the Australian Dollar. Generally, if the price of Iron Ore rises, AUD also goes up, as aggregate demand for the currency increases. The opposite is the case if the price of Iron Ore falls. Higher Iron Ore prices also tend to result in a greater likelihood of a positive Trade Balance for Australia, which is also positive of the AUD.
The Trade Balance, which is the difference between what a country earns from its exports versus what it pays for its imports, is another factor that can influence the value of the Australian Dollar. If Australia produces highly sought after exports, then its currency will gain in value purely from the surplus demand created from foreign buyers seeking to purchase its exports versus what it spends to purchase imports. Therefore, a positive net Trade Balance strengthens the AUD, with the opposite effect if the Trade Balance is negative.
The Indian Rupee weakens in Monday’s Asian session.
Ongoing outflows from Indian stocks and the threat of a global trade war undermine the INR.
Lower crude oil prices and RBI intervention might help limit INR’s losses.
The Indian Rupee (INR) trades with negative bias on Monday. The local currency remains on the defensive amid persistent outflows from local stocks, ongoing economic uncertainty and trade tariff concerns. Foreign investors have withdrawn almost $15 billion from Indian shares so far this year, putting outflows on track to surpass the record $17 billion registered in 2022. The selloff has wiped out $1.3 trillion from India’s market value.
However, a fall in crude oil prices might help limit the INR’s losses as India is the world's third-largest oil consumer. Additionally, the Reserve Bank of India (RBI) is expected to continue defending the INR, with the government expressing confidence that the central bank’s intervention would stagger the pace of the slide. This, in turn, might cap the upside for the pair. In the absence of the top-tier economic data releases from the US and India on Monday, the USD/INR pair will be influenced by the USD.
Indian Rupee remains weak on global uncertainty and persistent outflows
RBI said last week that it will infuse $21 billion in Rupee liquidity into the banking system in a bid to ease lending conditions and boost economic growth.
The US Nonfarm Payrolls (NFP) rose by 151K in February, compared to the 125K increase (revised from 143K) seen in January, according to the US Bureau of Labor Statistics (BLS) on Friday. This figure came in weaker than the market expectation of 160K.
The Unemployment Rate in the US edged higher to 4.1% in February from 4.0% in January. The annual wage inflation, as measured by the change in the Average Hourly Earnings, climbed to 4.0% from 3.9% (revised from 4.1%).
San Francisco Fed President Mary Daly said late Sunday that rising uncertainty among businesses could dampen demand in the US economy but does not justify a change in interest rates.
Fed Chair Jerome Powell noted on Friday, warning that policy uncertainty makes it difficult for the US central bank to enact policy adjustments.
Fed Governor Adriana Kugler stated that whiplash trade policies could do a lot of damage, including pinning inflation at a persistently higher level.
USD/INR paints a positive picture despite consolidation in the near term
The Indian Rupee trades in a negative territory on the day. The constructive outlook of the USD/INR pair remains in place, characterized by the price holding above the key 100-day Exponential Moving Average (EMA) on the daily timeframe. The upward momentum is supported by the 14-day Relative Strength Index (RSI), which stands above the midline near 55.0, showing signs of bullish demand.
The immediate resistance level for USD/INR emerges at 87.53, the high of February 28. A decisive break above this level could draw in buying pressure to an all-time high near 88.00, en route to 88.50.
On the other hand, the first downside target to watch is 86.48, the low of February 21. Extended downswings can drag the pair lower to 86.14, the low of January 27, followed by 85.60, the low of January 6.
Indian Rupee FAQs
The Indian Rupee (INR) is one of the most sensitive currencies to external factors. The price of Crude Oil (the country is highly dependent on imported Oil), the value of the US Dollar – most trade is conducted in USD – and the level of foreign investment, are all influential. Direct intervention by the Reserve Bank of India (RBI) in FX markets to keep the exchange rate stable, as well as the level of interest rates set by the RBI, are further major influencing factors on the Rupee.
The Reserve Bank of India (RBI) actively intervenes in forex markets to maintain a stable exchange rate, to help facilitate trade. In addition, the RBI tries to maintain the inflation rate at its 4% target by adjusting interest rates. Higher interest rates usually strengthen the Rupee. This is due to the role of the ‘carry trade’ in which investors borrow in countries with lower interest rates so as to place their money in countries’ offering relatively higher interest rates and profit from the difference.
Macroeconomic factors that influence the value of the Rupee include inflation, interest rates, the economic growth rate (GDP), the balance of trade, and inflows from foreign investment. A higher growth rate can lead to more overseas investment, pushing up demand for the Rupee. A less negative balance of trade will eventually lead to a stronger Rupee. Higher interest rates, especially real rates (interest rates less inflation) are also positive for the Rupee. A risk-on environment can lead to greater inflows of Foreign Direct and Indirect Investment (FDI and FII), which also benefit the Rupee.
Higher inflation, particularly, if it is comparatively higher than India’s peers, is generally negative for the currency as it reflects devaluation through oversupply. Inflation also increases the cost of exports, leading to more Rupees being sold to purchase foreign imports, which is Rupee-negative. At the same time, higher inflation usually leads to the Reserve Bank of India (RBI) raising interest rates and this can be positive for the Rupee, due to increased demand from international investors. The opposite effect is true of lower inflation.
On Monday, the People’s Bank of China (PBOC) set the USD/CNY central rate for the trading session ahead at 7.1733 as compared to Friday's fix of 7.1705 and 7.2355 Reuters estimates.
PBOC FAQs
The primary monetary policy objectives of the People's Bank of China (PBoC) are to safeguard price stability, including exchange rate stability, and promote economic growth. China’s central bank also aims to implement financial reforms, such as opening and developing the financial market.
The PBoC is owned by the state of the People's Republic of China (PRC), so it is not considered an autonomous institution. The Chinese Communist Party (CCP) Committee Secretary, nominated by the Chairman of the State Council, has a key influence on the PBoC’s management and direction, not the governor. However, Mr. Pan Gongsheng currently holds both of these posts.
Unlike the Western economies, the PBoC uses a broader set of monetary policy instruments to achieve its objectives. The primary tools include a seven-day Reverse Repo Rate (RRR), Medium-term Lending Facility (MLF), foreign exchange interventions and Reserve Requirement Ratio (RRR). However, The Loan Prime Rate (LPR) is China’s benchmark interest rate. Changes to the LPR directly influence the rates that need to be paid in the market for loans and mortgages and the interest paid on savings. By changing the LPR, China’s central bank can also influence the exchange rates of the Chinese Renminbi.
Yes, China has 19 private banks – a small fraction of the financial system. The largest private banks are digital lenders WeBank and MYbank, which are backed by tech giants Tencent and Ant Group, per The Straits Times. In 2014, China allowed domestic lenders fully capitalized by private funds to operate in the state-dominated financial sector.
US President Donald Trump said late Sunday that a government shutdown is a possibility if the House of Representatives fails to pass a temporary funding bill. However, he remains optimistic that the measure will be approved.
Congressional negotiators have released a bill that, if passed, will avert a partial government shutdown during Trump's first 100 days in office.
Market reaction
At the time of press, the US Dollar Index (DXY) was down 0.13% on the day at 103.70.
US Dollar FAQs
The US Dollar (USD) is the official currency of the United States of America, and the ‘de facto’ currency of a significant number of other countries where it is found in circulation alongside local notes. It is the most heavily traded currency in the world, accounting for over 88% of all global foreign exchange turnover, or an average of $6.6 trillion in transactions per day, according to data from 2022. Following the second world war, the USD took over from the British Pound as the world’s reserve currency. For most of its history, the US Dollar was backed by Gold, until the Bretton Woods Agreement in 1971 when the Gold Standard went away.
The most important single factor impacting on the value of the US Dollar is monetary policy, which is shaped by the Federal Reserve (Fed). The Fed has two mandates: to achieve price stability (control inflation) and foster full employment. Its primary tool to achieve these two goals is by adjusting interest rates. When prices are rising too quickly and inflation is above the Fed’s 2% target, the Fed will raise rates, which helps the USD value. When inflation falls below 2% or the Unemployment Rate is too high, the Fed may lower interest rates, which weighs on the Greenback.
In extreme situations, the Federal Reserve can also print more Dollars and enact quantitative easing (QE). QE is the process by which the Fed substantially increases the flow of credit in a stuck financial system. It is a non-standard policy measure used when credit has dried up because banks will not lend to each other (out of the fear of counterparty default). It is a last resort when simply lowering interest rates is unlikely to achieve the necessary result. It was the Fed’s weapon of choice to combat the credit crunch that occurred during the Great Financial Crisis in 2008. It involves the Fed printing more Dollars and using them to buy US government bonds predominantly from financial institutions. QE usually leads to a weaker US Dollar.
Quantitative tightening (QT) is the reverse process whereby the Federal Reserve stops buying bonds from financial institutions and does not reinvest the principal from the bonds it holds maturing in new purchases. It is usually positive for the US Dollar.
Gold price drifts higher to around $2,915 in Monday’s early Asian session.
Global uncertainty and Trump’s tariff threats support the Gold price.
The weaker US February job reports drag the US Dollar lower.
Gold price ( XAU/USD) attracts some buyers to around $2,915 during the early Asian session on Monday. Global uncertainty and the threat of a global trade war by US President Donald Trump provide some support to the precious metal.
Last week, US President Donald Trump on Thursday issued an executive order exempting goods from both Canada and Mexico under a North American trade agreement, known as USMCA, two days after imposing them. However, US Commerce Secretary Howard Lutnick said late Sunday that the 25% tariffs on steel and aluminum imports, set to take effect on Wednesday, are unlikely to be postponed. The uncertainty surrounding Trump’s tariff policies is likely to boost safe-haven flows, benefiting the Gold price in the near term.
Furthermore, the labor market in the United States (US) slowed last month. The report suggested that the Federal Reserve (Fed) remained on track to cut interest rates multiple times this year. This, in turn, weighs on the US Dollar (USD) and lifts the USD-denominated commodity price.
Data released by the US Bureau of Labor Statistics (BLS) on Friday revealed that the US Nonfarm Payrolls (NFP) increased by 151,000 in February, followed by the 125,000 increase (revised from 143,000) reported in January. This figure came in weaker than the market expectation of 160,000.
Meanwhile, the Unemployment Rate ticked higher to 4.1% from 4.0% in January, while the annual wage inflation, as measured by the change in the Average Hourly Earnings, climbed to 4.0% from 3.9% (revised from 4.1%).
Gold FAQs
Gold has played a key role in human’s history as it has been widely used as a store of value and medium of exchange. Currently, apart from its shine and usage for jewelry, the precious metal is widely seen as a safe-haven asset, meaning that it is considered a good investment during turbulent times. Gold is also widely seen as a hedge against inflation and against depreciating currencies as it doesn’t rely on any specific issuer or government.
Central banks are the biggest Gold holders. In their aim to support their currencies in turbulent times, central banks tend to diversify their reserves and buy Gold to improve the perceived strength of the economy and the currency. High Gold reserves can be a source of trust for a country’s solvency. Central banks added 1,136 tonnes of Gold worth around $70 billion to their reserves in 2022, according to data from the World Gold Council. This is the highest yearly purchase since records began. Central banks from emerging economies such as China, India and Turkey are quickly increasing their Gold reserves.
Gold has an inverse correlation with the US Dollar and US Treasuries, which are both major reserve and safe-haven assets. When the Dollar depreciates, Gold tends to rise, enabling investors and central banks to diversify their assets in turbulent times. Gold is also inversely correlated with risk assets. A rally in the stock market tends to weaken Gold price, while sell-offs in riskier markets tend to favor the precious metal.
The price can move due to a wide range of factors. Geopolitical instability or fears of a deep recession can quickly make Gold price escalate due to its safe-haven status. As a yield-less asset, Gold tends to rise with lower interest rates, while higher cost of money usually weighs down on the yellow metal. Still, most moves depend on how the US Dollar (USD) behaves as the asset is priced in dollars (XAU/USD). A strong Dollar tends to keep the price of Gold controlled, whereas a weaker Dollar is likely to push Gold prices up.
EUR/USD remains near its four-month high of 1.0888, reached on Friday.
The US Dollar struggles amid worries about a potential slowdown in the US economy.
The Euro gained support from Germany’s fiscal reforms, with major political parties planning to revise the debt brake.
EUR/USD started the week on a positive note, trading around 1.0860 during Monday’s Asian session. The pair’s upward movement is largely driven by concerns over a potential slowdown in the United States (US) economy. San Francisco Fed President Mary Daly said late Sunday that rising uncertainty among businesses could dampen demand in the US economy but does not justify a change in interest rates.
On Friday, data from the US Bureau of Labor Statistics (BLS) showed that Nonfarm Payrolls (NFP) increased by 151,000 in February, falling short of the expected 160,000. January’s job growth was also revised downward to 125,000 from the previously reported 143,000. The weaker-than-expected labor market data could weigh on the US Dollar (USD), providing a tailwind for the EUR/USD pair.
Meanwhile, US Commerce Secretary Howard Lutnick stated on Sunday that the 25% tariffs, imposed by President Donald Trump in February, on steel and aluminum imports, set to take effect on Wednesday, are unlikely to be postponed, according to Bloomberg. While US steelmakers have urged Trump to maintain the tariffs, businesses reliant on these materials may face increased costs. This could dampen market sentiment, supporting the US Dollar and potentially capping EUR/USD’s upside.
The Euro (EUR) found support from Germany’s fiscal reforms, as the country’s major political parties announced plans to revise the debt brake. The proposed changes aim to increase defense spending and fund a €500 billion infrastructure initiative to stimulate economic growth. Additionally, European leaders agreed to a substantial boost in defense spending to strengthen the continent’s military capabilities.
On the monetary policy front, the European Central Bank (ECB) delivered a widely expected 25 basis points (bps) rate cut and acknowledged that policy is becoming less restrictive, hinting at a potential pause in further reductions. Market participants anticipate one or two additional 25bps rate cuts later this year.
Euro FAQs
The Euro is the currency for the 19 European Union countries that belong to the Eurozone. It is the second most heavily traded currency in the world behind the US Dollar. In 2022, it accounted for 31% of all foreign exchange transactions, with an average daily turnover of over $2.2 trillion a day. EUR/USD is the most heavily traded currency pair in the world, accounting for an estimated 30% off all transactions, followed by EUR/JPY (4%), EUR/GBP (3%) and EUR/AUD (2%).
The European Central Bank (ECB) in Frankfurt, Germany, is the reserve bank for the Eurozone. The ECB sets interest rates and manages monetary policy. The ECB’s primary mandate is to maintain price stability, which means either controlling inflation or stimulating growth. Its primary tool is the raising or lowering of interest rates. Relatively high interest rates – or the expectation of higher rates – will usually benefit the Euro and vice versa. The ECB Governing Council makes monetary policy decisions at meetings held eight times a year. Decisions are made by heads of the Eurozone national banks and six permanent members, including the President of the ECB, Christine Lagarde.
Eurozone inflation data, measured by the Harmonized Index of Consumer Prices (HICP), is an important econometric for the Euro. If inflation rises more than expected, especially if above the ECB’s 2% target, it obliges the ECB to raise interest rates to bring it back under control. Relatively high interest rates compared to its counterparts will usually benefit the Euro, as it makes the region more attractive as a place for global investors to park their money.
Data releases gauge the health of the economy and can impact on the Euro. Indicators such as GDP, Manufacturing and Services PMIs, employment, and consumer sentiment surveys can all influence the direction of the single currency. A strong economy is good for the Euro. Not only does it attract more foreign investment but it may encourage the ECB to put up interest rates, which will directly strengthen the Euro. Otherwise, if economic data is weak, the Euro is likely to fall. Economic data for the four largest economies in the euro area (Germany, France, Italy and Spain) are especially significant, as they account for 75% of the Eurozone’s economy.
Another significant data release for the Euro is the Trade Balance. This indicator measures the difference between what a country earns from its exports and what it spends on imports over a given period. If a country produces highly sought after exports then its currency will gain in value purely from the extra demand created from foreign buyers seeking to purchase these goods. Therefore, a positive net Trade Balance strengthens a currency and vice versa for a negative balance.
GBP/USD attracts some follow-through buying on Monday amid a bearish US Dollar.
Bets that the Fed will cut rates multiple times in 2025 continue to weigh on the buck.
Expectations for a slow BoE rate-cutting cycle underpin the GBP and support the pair.
The GBP/USD pair kicks off the new week on a positive move and trades around the 1.2940-1.2945 region during the Asian session, or a four-month high touched on Friday. Moreover, the bearish sentiment surrounding the US Dollar (USD) supports prospects for an extension of last week's breakout momentum above the very important 200-day Simple Moving Average (SMA).
In fact, the USD Index (DXY), which tracks the Greenback against a basket of currencies, hangs near its lowest level since early November touched in reaction to weaker US monthly employment details on Friday. The headline Nonfarm Payrolls (NFP) print showed that the US economy added 151K jobs in February, less than consensus estimates. Adding to this, the previous month's reading was revised down to 125K and the Unemployment Rate unexpectedly edged higher to 4.1% from 4.0% in January.
This comes on top of worries that US President Donald Trump's policies will hit economic activity in the US and suggests that the Federal Reserve (Fed) remains on track to cut interest rates multiple times this year. The markets are currently pricing in about three rate cuts of 25 bps each this year, which continues to weigh on the buck and supports the GBP/USD pair. The USD bulls failed to gain any respite from Fed Chair Jerome Powell's comments that the US central bank is in no rush to cut rates.
The British Pound (GBP), on the other hand, is underpinned by expectations that the Bank of England (BoE) will cut rates more slowly than other central banks, including the Fed. This turns out to be another factor that contributes to the bid tone around the GBP/USD pair and validates the positive outlook. In the absence of any relevant market-moving economic releases, either from the UK or the US, the USD will continue to influence spot prices and allow traders to grab short-term opportunities.
Pound Sterling FAQs
The Pound Sterling (GBP) is the oldest currency in the world (886 AD) and the official currency of the United Kingdom. It is the fourth most traded unit for foreign exchange (FX) in the world, accounting for 12% of all transactions, averaging $630 billion a day, according to 2022 data. Its key trading pairs are GBP/USD, also known as ‘Cable’, which accounts for 11% of FX, GBP/JPY, or the ‘Dragon’ as it is known by traders (3%), and EUR/GBP (2%). The Pound Sterling is issued by the Bank of England (BoE).
The single most important factor influencing the value of the Pound Sterling is monetary policy decided by the Bank of England. The BoE bases its decisions on whether it has achieved its primary goal of “price stability” – a steady inflation rate of around 2%. Its primary tool for achieving this is the adjustment of interest rates. When inflation is too high, the BoE will try to rein it in by raising interest rates, making it more expensive for people and businesses to access credit. This is generally positive for GBP, as higher interest rates make the UK a more attractive place for global investors to park their money. When inflation falls too low it is a sign economic growth is slowing. In this scenario, the BoE will consider lowering interest rates to cheapen credit so businesses will borrow more to invest in growth-generating projects.
Data releases gauge the health of the economy and can impact the value of the Pound Sterling. Indicators such as GDP, Manufacturing and Services PMIs, and employment can all influence the direction of the GBP. A strong economy is good for Sterling. Not only does it attract more foreign investment but it may encourage the BoE to put up interest rates, which will directly strengthen GBP. Otherwise, if economic data is weak, the Pound Sterling is likely to fall.
Another significant data release for the Pound Sterling is the Trade Balance. This indicator measures the difference between what a country earns from its exports and what it spends on imports over a given period. If a country produces highly sought-after exports, its currency will benefit purely from the extra demand created from foreign buyers seeking to purchase these goods. Therefore, a positive net Trade Balance strengthens a currency and vice versa for a negative balance.
President of the Federal Reserve Bank of San Francisco, Mary Daly, said late Sunday that rising uncertainty among businesses could dampen demand in the US economy but does not justify a change in interest rates.
Key quotes
Business leaders in her district report heightened uncertainty about the economy and policy, which research suggests can reduce demand.
Federal Open Market Committee (FOMC) does not need to adjust rates when it meets next week.
Believes current interest rates are appropriate.
Believes the economy remains strong.
Market reaction
At the time of press, the US Dollar Index (DXY) was down 0.13% on the day at 103.70.
Fed FAQs
Monetary policy in the US is shaped by the Federal Reserve (Fed). The Fed has two mandates: to achieve price stability and foster full employment. Its primary tool to achieve these goals is by adjusting interest rates. When prices are rising too quickly and inflation is above the Fed’s 2% target, it raises interest rates, increasing borrowing costs throughout the economy. This results in a stronger US Dollar (USD) as it makes the US a more attractive place for international investors to park their money. When inflation falls below 2% or the Unemployment Rate is too high, the Fed may lower interest rates to encourage borrowing, which weighs on the Greenback.
The Federal Reserve (Fed) holds eight policy meetings a year, where the Federal Open Market Committee (FOMC) assesses economic conditions and makes monetary policy decisions. The FOMC is attended by twelve Fed officials – the seven members of the Board of Governors, the president of the Federal Reserve Bank of New York, and four of the remaining eleven regional Reserve Bank presidents, who serve one-year terms on a rotating basis.
In extreme situations, the Federal Reserve may resort to a policy named Quantitative Easing (QE). QE is the process by which the Fed substantially increases the flow of credit in a stuck financial system. It is a non-standard policy measure used during crises or when inflation is extremely low. It was the Fed’s weapon of choice during the Great Financial Crisis in 2008. It involves the Fed printing more Dollars and using them to buy high grade bonds from financial institutions. QE usually weakens the US Dollar.
Quantitative tightening (QT) is the reverse process of QE, whereby the Federal Reserve stops buying bonds from financial institutions and does not reinvest the principal from the bonds it holds maturing, to purchase new bonds. It is usually positive for the value of the US Dollar.
US President Donald Trump said on Sunday that he expects a good outcome of US talks with Ukrainian officials in Saudi Arabia, per Reuters. Trump added that the administration has discussed lifting an intelligence pause on Ukraine, that they are looking at a lot of things with respect to tariffs on Russia and that they are not concerned about military exercises involving Russia, China and Iran.
Key quotes
Looking at a lot of things with respect to tariffs on Russia.
Going to make a lot of progress this week.
I think funding the continuing resolution is going to get passed.
Market reaction
At the press time, the USD/RUB pair is down 0.29% on the day to trade at 89.75.
Tariffs FAQs
Tariffs are customs duties levied on certain merchandise imports or a category of products. Tariffs are designed to help local producers and manufacturers be more competitive in the market by providing a price advantage over similar goods that can be imported. Tariffs are widely used as tools of protectionism, along with trade barriers and import quotas.
Although tariffs and taxes both generate government revenue to fund public goods and services, they have several distinctions. Tariffs are prepaid at the port of entry, while taxes are paid at the time of purchase. Taxes are imposed on individual taxpayers and businesses, while tariffs are paid by importers.
There are two schools of thought among economists regarding the usage of tariffs. While some argue that tariffs are necessary to protect domestic industries and address trade imbalances, others see them as a harmful tool that could potentially drive prices higher over the long term and lead to a damaging trade war by encouraging tit-for-tat tariffs.
During the run-up to the presidential election in November 2024, Donald Trump made it clear that he intends to use tariffs to support the US economy and American producers. In 2024, Mexico, China and Canada accounted for 42% of total US imports. In this period, Mexico stood out as the top exporter with $466.6 billion, according to the US Census Bureau. Hence, Trump wants to focus on these three nations when imposing tariffs. He also plans to use the revenue generated through tariffs to lower personal income taxes.
Giao dịch trên thị trường tài chính (đặc biệt là giao dịch sử dụng các công cụ biên) mở ra những cơ hội lớn và tạo điều kiện cho các nhà đầu tư sẵn sàng mạo hiểm để thu lợi nhuận, tuy nhiên nó mang trong mình nguy cơ rủi ro khá cao. Chính vì vậy trước khi tiến hành giao dịch cần phải xem xét mọi mặt vấn đề chấp nhận tiến hành giao dịch cụ thể xét theo quan điểm của nguồn lực tài chính sẵn có và mức độ am hiểu thị trường tài chính.
Sử dụng thông tin: sử dụng toàn bộ hay riêng biệt các dữ liệu trên trang web của công ty TeleTrade như một nguồn cung cấp thông tin nhất định. Việc sử dụng tư liệu từ trang web cần kèm theo liên kết đến trang teletrade.vn. Việc tự động thu thập số liệu cũng như thông tin từ trang web TeleTrade đều không được phép.
Nhấn nút "Đăng ký" để nhận thông báo về chương trình khuyến mãi và Bonus
Cảm ơn bạn đã ghé thăm teletrade.org!
Thông tin trên trang web này có thể không tuân thủ luật pháp của quốc gia nơi bạn sống.
Vẫn xem thông tin.
Tôi xác nhận rằng các tài liệu trên trang web này không dành cho cư dân EU và tôi có thể không có quyền đăng ký tài khoản bên teletrade.org, nhưng tôi vẫn muốn tiếp tục.