- Phân tích
- Tin tức và các công cụ
- Tin tức thị trường
Tin tức thì trường
On Monday, US President Donald Trump expanded his steel and aluminum tariffs to cover all imports, effectively canceling deals with the European Union, the United Kingdom, Japan, and others.
According to a White House official, the new executive order builds off the 25% tariff on steel and the 10% tariff the first Trump administration imposed in 2018 by raising duties, closing loopholes, and eliminating exemptions.
Market reaction
The US Dollar attracts some buyers following this headline. At the press time, the DXY is up 0.05% on the day to trade at 108.37.
Tariffs FAQs
Tariffs are customs duties levied on certain merchandise imports or a category of products. Tariffs are designed to help local producers and manufacturers be more competitive in the market by providing a price advantage over similar goods that can be imported. Tariffs are widely used as tools of protectionism, along with trade barriers and import quotas.
Although tariffs and taxes both generate government revenue to fund public goods and services, they have several distinctions. Tariffs are prepaid at the port of entry, while taxes are paid at the time of purchase. Taxes are imposed on individual taxpayers and businesses, while tariffs are paid by importers.
There are two schools of thought among economists regarding the usage of tariffs. While some argue that tariffs are necessary to protect domestic industries and address trade imbalances, others see them as a harmful tool that could potentially drive prices higher over the long term and lead to a damaging trade war by encouraging tit-for-tat tariffs.
During the run-up to the presidential election in November 2024, Donald Trump made it clear that he intends to use tariffs to support the US economy and American producers. In 2024, Mexico, China and Canada accounted for 42% of total US imports. In this period, Mexico stood out as the top exporter with $466.6 billion, according to the US Census Bureau. Hence, Trump wants to focus on these three nations when imposing tariffs. He also plans to use the revenue generated through tariffs to lower personal income taxes.
- EUR/USD lost another 0.3% on Monday, falling back into 1.0300.
- US President Trump signed off on sweeping tariffs late Monday.
- US inflation data to dominate market flows this week.
EUR/USD declined around one-third of one percent on Monday, falling back into the 1.0300 handle as market sentiment takes a knee. Investors are awaiting clearer signals from central bank policymakers, but a fresh batch of executive orders from US President Donald Trump regarding tariffs make the outlook murkier.
Read more: US President Donald Trump signs off on 25% tariffs on steel and aluminum
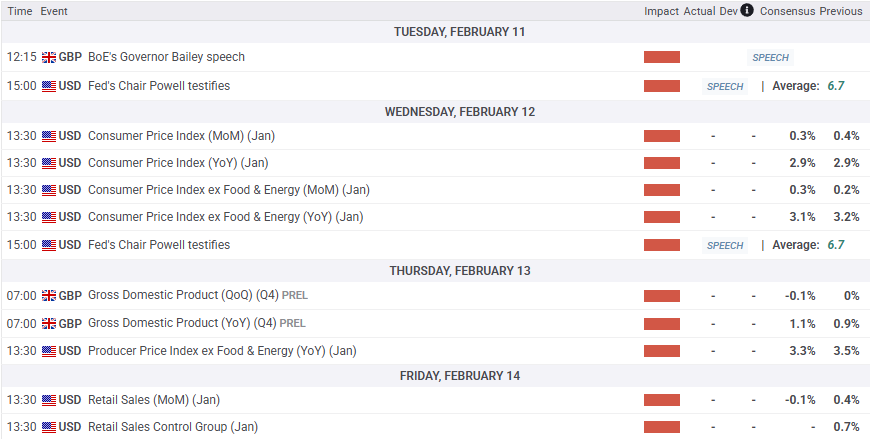
European data is broadly limited this week; an appearance from European Central Bank (ECB) President Christine Lagarde failed to move the needle in any meaningful way, a routine outing that has become the norm for talking points from ECB policymakers. Federal Reserve (Fed) Chair Jerome Powell will be giving his latest testimony to the US Senate Banking Committee. Fed Chair Powell is expected to face questions about how the Fed will react to the ebb and flow of President Trump’s tariff threats.
German final Harmonized Index of Consumer Prices for the year ended January are due on Thursday, alongside pan-EU Gross Domestic Product figures for the fourth quarter slated for Friday. Neither datapoint is expected to move much.
The key datapoints this week will be US Consumer Price Index (CPI) inflation slated for Wednesday, and US Producer Price Index (PPI) due on Thursday.

EUR/USD price forecast
Three straight down days for EUR/USD has put the pair in pace to rediscover recent technical lows. Fiber flubbed a technical recovery above the 50-day Exponential Moving Average (EMA) in late January, and bids have been on a steady grind lower ever since. The 1.0200 handle is up next as the bears slowly crush bulls out of the picture.
EUR/USD daily chart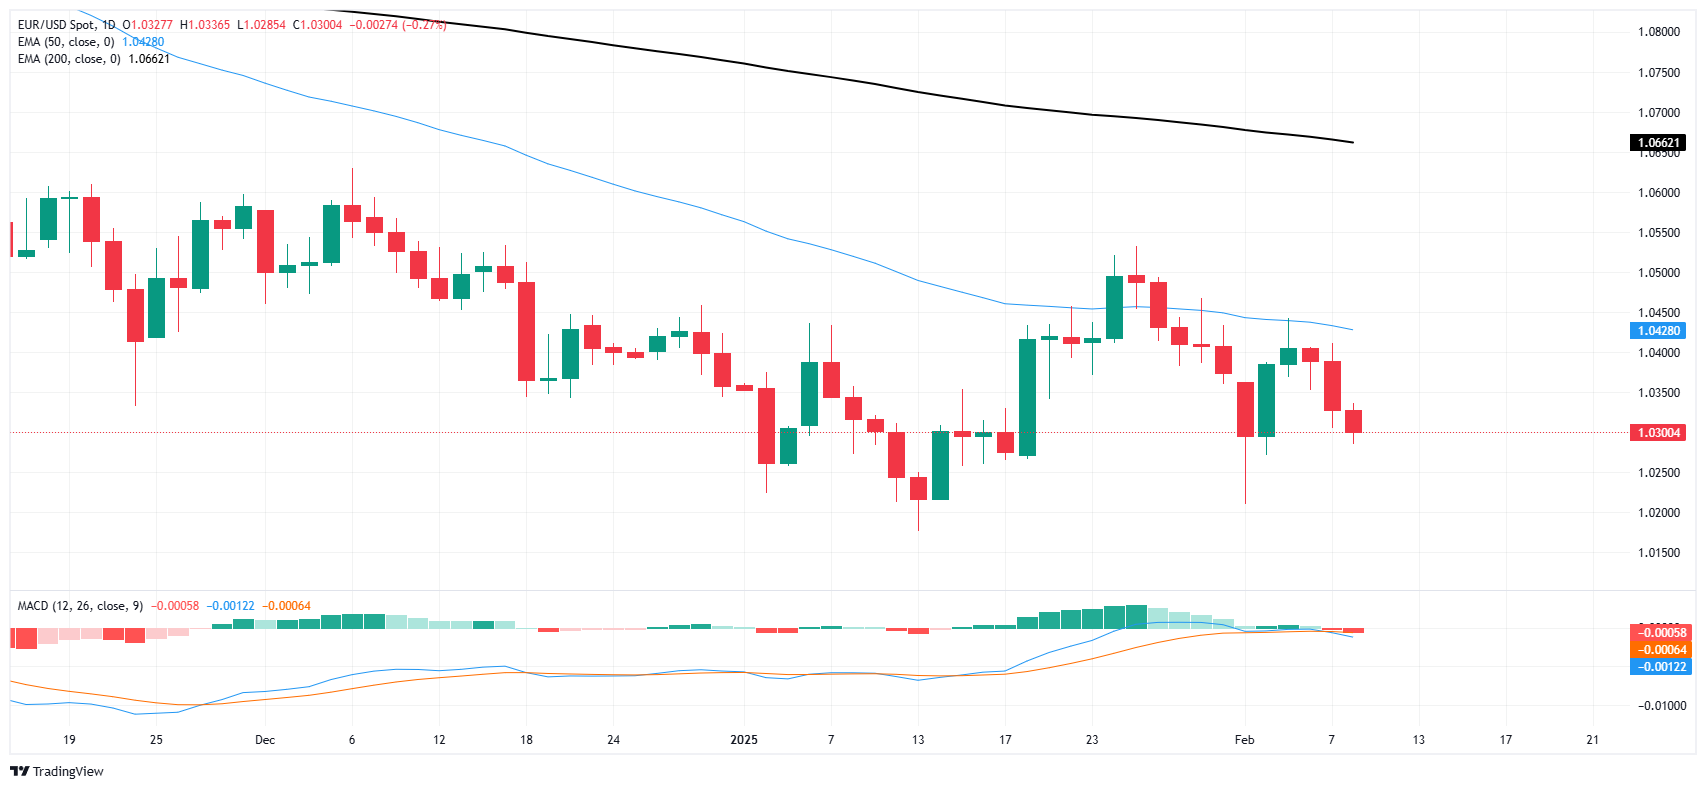
Euro FAQs
The Euro is the currency for the 19 European Union countries that belong to the Eurozone. It is the second most heavily traded currency in the world behind the US Dollar. In 2022, it accounted for 31% of all foreign exchange transactions, with an average daily turnover of over $2.2 trillion a day. EUR/USD is the most heavily traded currency pair in the world, accounting for an estimated 30% off all transactions, followed by EUR/JPY (4%), EUR/GBP (3%) and EUR/AUD (2%).
The European Central Bank (ECB) in Frankfurt, Germany, is the reserve bank for the Eurozone. The ECB sets interest rates and manages monetary policy. The ECB’s primary mandate is to maintain price stability, which means either controlling inflation or stimulating growth. Its primary tool is the raising or lowering of interest rates. Relatively high interest rates – or the expectation of higher rates – will usually benefit the Euro and vice versa. The ECB Governing Council makes monetary policy decisions at meetings held eight times a year. Decisions are made by heads of the Eurozone national banks and six permanent members, including the President of the ECB, Christine Lagarde.
Eurozone inflation data, measured by the Harmonized Index of Consumer Prices (HICP), is an important econometric for the Euro. If inflation rises more than expected, especially if above the ECB’s 2% target, it obliges the ECB to raise interest rates to bring it back under control. Relatively high interest rates compared to its counterparts will usually benefit the Euro, as it makes the region more attractive as a place for global investors to park their money.
Data releases gauge the health of the economy and can impact on the Euro. Indicators such as GDP, Manufacturing and Services PMIs, employment, and consumer sentiment surveys can all influence the direction of the single currency. A strong economy is good for the Euro. Not only does it attract more foreign investment but it may encourage the ECB to put up interest rates, which will directly strengthen the Euro. Otherwise, if economic data is weak, the Euro is likely to fall. Economic data for the four largest economies in the euro area (Germany, France, Italy and Spain) are especially significant, as they account for 75% of the Eurozone’s economy.
Another significant data release for the Euro is the Trade Balance. This indicator measures the difference between what a country earns from its exports and what it spends on imports over a given period. If a country produces highly sought after exports then its currency will gain in value purely from the extra demand created from foreign buyers seeking to purchase these goods. Therefore, a positive net Trade Balance strengthens a currency and vice versa for a negative balance.
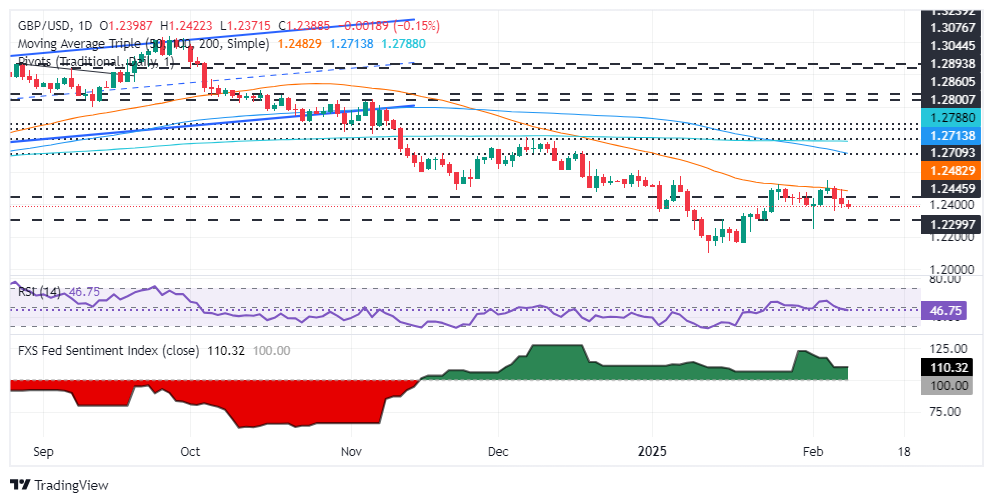
- GBP/USD fell another third of a percent of Monday.
- Market sentiment is due for another knockback as fresh tariff threats surface.
- BoE Bailey, Fed Powell, US CPI inflation, and UK GDP all on the docket.
GBP/USD sunk for a third straight trading day on Monday, kicking off the new trading week on the backfoot and slipping back below the 1.2400 handle, shedding one-third of one percent in the process. US President Donald Trump renewed his vigor to kick off a US vs everybody else trade war late Monday, slapping a 25% tariff on all imported steel and aluminum into the US.
Read more: US President Donald Trump signs off on 25% tariffs on steel and aluminum
Bank of England (BoE) Governor Andrew Bailey is due to give a keynote speech on Tuesday. Cable traders will be keeping an eye on the BoE head following the UK central bank’s rate cut last week, looking to nail down any hints of forward guidance on where the BoE could be heading next. Federal Reserve (Fed) Chair Jerome Powell follows up with an appearance of his own, testifying before the US Senate Banking Committee on Tuesday.
The key datapoints this week will be US Consumer Price Index (CPI) inflation slated for Wednesday, as well as UK Gross Domestic Product (GDP) and US Producer Price Index (PPI), both due on Thursday.
GBP/USD price forecast
GBP/USD has chalked in a second straight rejection from the 50-day Exponential Moving Average (EMA) near 1.2500, setting the stage for a continued decline. Price action is tilting back toward the 1.2300 handle, and near-term momentum has shifted firmly bearish. Cable has printed three straight down days after failing to recapture the 1.2500 level, and the bullish recovery from January’s lows near 1.2100 has officially run out of steam.
GBP/USD daily chart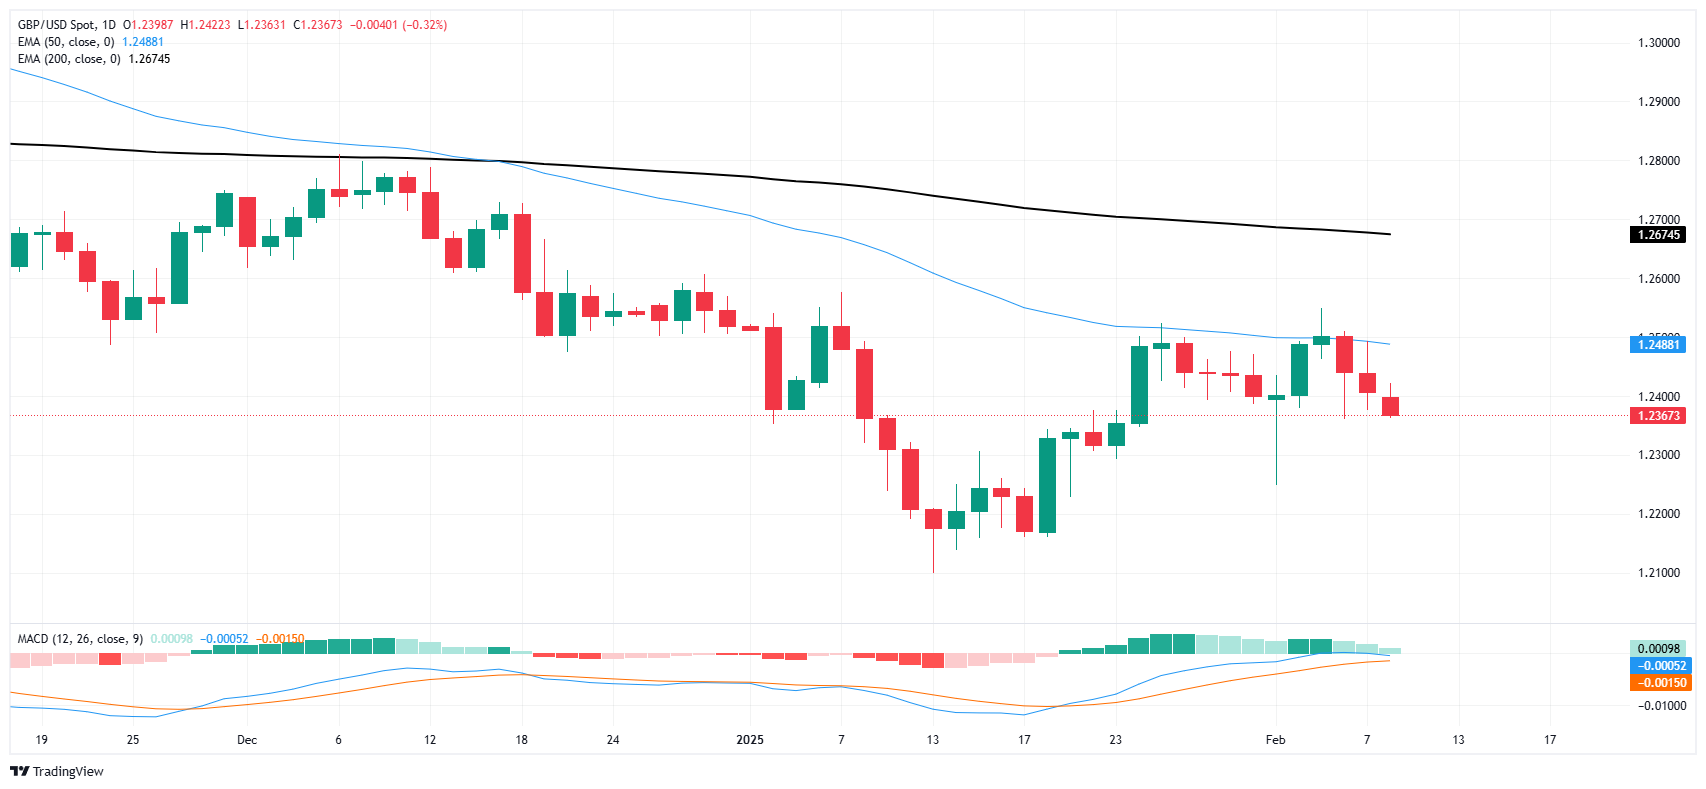
Pound Sterling FAQs
The Pound Sterling (GBP) is the oldest currency in the world (886 AD) and the official currency of the United Kingdom. It is the fourth most traded unit for foreign exchange (FX) in the world, accounting for 12% of all transactions, averaging $630 billion a day, according to 2022 data. Its key trading pairs are GBP/USD, also known as ‘Cable’, which accounts for 11% of FX, GBP/JPY, or the ‘Dragon’ as it is known by traders (3%), and EUR/GBP (2%). The Pound Sterling is issued by the Bank of England (BoE).
The single most important factor influencing the value of the Pound Sterling is monetary policy decided by the Bank of England. The BoE bases its decisions on whether it has achieved its primary goal of “price stability” – a steady inflation rate of around 2%. Its primary tool for achieving this is the adjustment of interest rates. When inflation is too high, the BoE will try to rein it in by raising interest rates, making it more expensive for people and businesses to access credit. This is generally positive for GBP, as higher interest rates make the UK a more attractive place for global investors to park their money. When inflation falls too low it is a sign economic growth is slowing. In this scenario, the BoE will consider lowering interest rates to cheapen credit so businesses will borrow more to invest in growth-generating projects.
Data releases gauge the health of the economy and can impact the value of the Pound Sterling. Indicators such as GDP, Manufacturing and Services PMIs, and employment can all influence the direction of the GBP. A strong economy is good for Sterling. Not only does it attract more foreign investment but it may encourage the BoE to put up interest rates, which will directly strengthen GBP. Otherwise, if economic data is weak, the Pound Sterling is likely to fall.
Another significant data release for the Pound Sterling is the Trade Balance. This indicator measures the difference between what a country earns from its exports and what it spends on imports over a given period. If a country produces highly sought-after exports, its currency will benefit purely from the extra demand created from foreign buyers seeking to purchase these goods. Therefore, a positive net Trade Balance strengthens a currency and vice versa for a negative balance.
US President Donald Trump kicked off the next leg of his ongoing trade war spat with functionally all of the US' closest trading partners and allies, imposing a sweeping 25% tariff on all steel and aluminum imports into the US. The White House noted that President Trump has done away with exclusions on import taxes entirely, and stated that the Trump administration would be looking at further action on microchips and vehicles in the days and weeks to come.
Key highlights
- Trump uses proclamations to apply tariffs on all steel and aluminum imports, and raise them to 25% from 10%.
- Actions will expand tariffs to downstream products, not just raw materials.
- White House says no exemptions on tariff goods, Trump says no exemptions except for maybe Australia.
- Trump says his administration will look into tariffs on automobiles, microchips, and pharmaceuticals next.
Tariffs FAQs
Tariffs are customs duties levied on certain merchandise imports or a category of products. Tariffs are designed to help local producers and manufacturers be more competitive in the market by providing a price advantage over similar goods that can be imported. Tariffs are widely used as tools of protectionism, along with trade barriers and import quotas.
Although tariffs and taxes both generate government revenue to fund public goods and services, they have several distinctions. Tariffs are prepaid at the port of entry, while taxes are paid at the time of purchase. Taxes are imposed on individual taxpayers and businesses, while tariffs are paid by importers.
There are two schools of thought among economists regarding the usage of tariffs. While some argue that tariffs are necessary to protect domestic industries and address trade imbalances, others see them as a harmful tool that could potentially drive prices higher over the long term and lead to a damaging trade war by encouraging tit-for-tat tariffs.
During the run-up to the presidential election in November 2024, Donald Trump made it clear that he intends to use tariffs to support the US economy and American producers. In 2024, Mexico, China and Canada accounted for 42% of total US imports. In this period, Mexico stood out as the top exporter with $466.6 billion, according to the US Census Bureau. Hence, Trump wants to focus on these three nations when imposing tariffs. He also plans to use the revenue generated through tariffs to lower personal income taxes.
- USD/CAD gains ground to around 1.4320 in Monday’s late American session.
- Trump tariff threats weigh on the Canadian Dollar.
- Investors brace for Fed Chair Jerome Powell’s semi-annual testimony on Tuesday.
The USD/CAD pair gathers strength to near 1.4320 during the late American session on Monday. The US Dollar (USD) edges higher amid economic uncertainty and tariff concerns. Federal Reserve (Fed) Chair Jerome Powell’s semi-annual testimony will take center stage later on Tuesday.
Trump stated on Sunday that he plans to impose 25% tariffs on all steel and aluminum imports into the US, on top of existing metals duties. This move came after he said on Friday he plans to announce reciprocal tariffs on many countries by Monday or Tuesday, without specifying which countries.
The concerns about the impact of any new trade levies exert some selling pressure on the commodities-linked Loonie as Canada is a major exporter of steel and aluminium to the US.
Traders anticipate the Fed will cut interest rates j just one time this year, down from earlier bets on two rate cuts starting in June, after the report showed that the labor market remains strong and a closely-watched survey showed an increase in consumers' inflation expectations.
Fed’s Powell is set to testify before the Senate Banking Committee on Tuesday and to the House Financial Services panel on the following day. The cautious stance of the Fed is likely to underpin the USD against the Canadian Dollar (CAD).
Canadian Dollar FAQs
The key factors driving the Canadian Dollar (CAD) are the level of interest rates set by the Bank of Canada (BoC), the price of Oil, Canada’s largest export, the health of its economy, inflation and the Trade Balance, which is the difference between the value of Canada’s exports versus its imports. Other factors include market sentiment – whether investors are taking on more risky assets (risk-on) or seeking safe-havens (risk-off) – with risk-on being CAD-positive. As its largest trading partner, the health of the US economy is also a key factor influencing the Canadian Dollar.
The Bank of Canada (BoC) has a significant influence on the Canadian Dollar by setting the level of interest rates that banks can lend to one another. This influences the level of interest rates for everyone. The main goal of the BoC is to maintain inflation at 1-3% by adjusting interest rates up or down. Relatively higher interest rates tend to be positive for the CAD. The Bank of Canada can also use quantitative easing and tightening to influence credit conditions, with the former CAD-negative and the latter CAD-positive.
The price of Oil is a key factor impacting the value of the Canadian Dollar. Petroleum is Canada’s biggest export, so Oil price tends to have an immediate impact on the CAD value. Generally, if Oil price rises CAD also goes up, as aggregate demand for the currency increases. The opposite is the case if the price of Oil falls. Higher Oil prices also tend to result in a greater likelihood of a positive Trade Balance, which is also supportive of the CAD.
While inflation had always traditionally been thought of as a negative factor for a currency since it lowers the value of money, the opposite has actually been the case in modern times with the relaxation of cross-border capital controls. Higher inflation tends to lead central banks to put up interest rates which attracts more capital inflows from global investors seeking a lucrative place to keep their money. This increases demand for the local currency, which in Canada’s case is the Canadian Dollar.
Macroeconomic data releases gauge the health of the economy and can have an impact on the Canadian Dollar. Indicators such as GDP, Manufacturing and Services PMIs, employment, and consumer sentiment surveys can all influence the direction of the CAD. A strong economy is good for the Canadian Dollar. Not only does it attract more foreign investment but it may encourage the Bank of Canada to put up interest rates, leading to a stronger currency. If economic data is weak, however, the CAD is likely to fall.
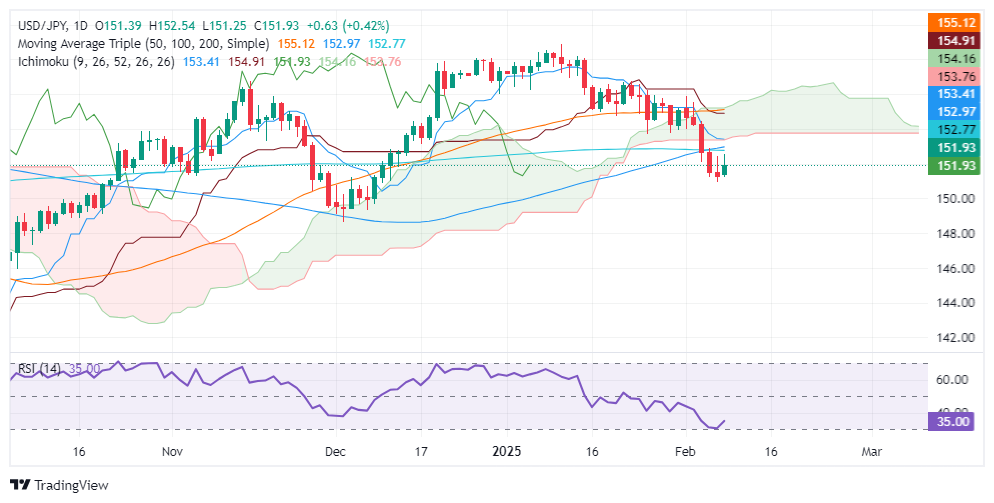
- USD/JPY up 0.39%, still below key 152.00 level amidst ongoing bearish momentum.
- Technical indicators point to downtrend; pair below 200-day SMA and Ichimoku Cloud.
- Key supports at 150.00 and 148.64; breaching these could lead to significant downside.
The USD/JPY recovered some ground on Monday and finished the session on a higher note, registering gains of 0.39% but closing below the 152.00 figure. As Tuesday’s Asian session begins, the pair is virtually unchanged, but set to extend its losses as bulls failed to reclaim the 200-day Simple Moving Average (SMA) at 152.76
USD/JPY Price Forecast: Technical outlook
The USD/JPY downtrend remains after tumbling below the 200-day SMA and the Ichimoku Cloud (Kumo). Monday’s price action registered a daily high at 152.53 before slumping below the 152.00 mark, opening the door for further downside.
Momentum remains bearish, as the Relative Strength Index (RSI) depicts. Therefore, the USD/JPY might extend its losses.
The first support would be the 150.00 figure. A breach of the latter will expose the December 3 latest cycle low of 148.64, followed by the September 30 at 141.65.
However, if buyers reclaim 152.00, they must drive the USD/JPY above the 200-day SMA and the 153.00 mark.
USD/JPY Price Chart – Daily
Japanese Yen FAQs
The Japanese Yen (JPY) is one of the world’s most traded currencies. Its value is broadly determined by the performance of the Japanese economy, but more specifically by the Bank of Japan’s policy, the differential between Japanese and US bond yields, or risk sentiment among traders, among other factors.
One of the Bank of Japan’s mandates is currency control, so its moves are key for the Yen. The BoJ has directly intervened in currency markets sometimes, generally to lower the value of the Yen, although it refrains from doing it often due to political concerns of its main trading partners. The BoJ ultra-loose monetary policy between 2013 and 2024 caused the Yen to depreciate against its main currency peers due to an increasing policy divergence between the Bank of Japan and other main central banks. More recently, the gradually unwinding of this ultra-loose policy has given some support to the Yen.
Over the last decade, the BoJ’s stance of sticking to ultra-loose monetary policy has led to a widening policy divergence with other central banks, particularly with the US Federal Reserve. This supported a widening of the differential between the 10-year US and Japanese bonds, which favored the US Dollar against the Japanese Yen. The BoJ decision in 2024 to gradually abandon the ultra-loose policy, coupled with interest-rate cuts in other major central banks, is narrowing this differential.
The Japanese Yen is often seen as a safe-haven investment. This means that in times of market stress, investors are more likely to put their money in the Japanese currency due to its supposed reliability and stability. Turbulent times are likely to strengthen the Yen’s value against other currencies seen as more risky to invest in.
Australian Prime Minister Anthony Albanese said on Tuesday, per Reuters, that US President Donald Trump has agreed to consider an exemption for Australia over steel and aluminum tariffs.
"It was a very constructive and warm discussion... with President Trump," said Albanese during a media conference after his phone conversation with Trump.
On Sunday, Trump said that he will introduce new 25% tariffs on all steel and aluminum imports into the US, on top of existing metals duties.
Market reaction
At the press time, the AUD/USD pair is up 0.05% on the day to trade at 0.6281.
Tariffs FAQs
Tariffs are customs duties levied on certain merchandise imports or a category of products. Tariffs are designed to help local producers and manufacturers be more competitive in the market by providing a price advantage over similar goods that can be imported. Tariffs are widely used as tools of protectionism, along with trade barriers and import quotas.
Although tariffs and taxes both generate government revenue to fund public goods and services, they have several distinctions. Tariffs are prepaid at the port of entry, while taxes are paid at the time of purchase. Taxes are imposed on individual taxpayers and businesses, while tariffs are paid by importers.
There are two schools of thought among economists regarding the usage of tariffs. While some argue that tariffs are necessary to protect domestic industries and address trade imbalances, others see them as a harmful tool that could potentially drive prices higher over the long term and lead to a damaging trade war by encouraging tit-for-tat tariffs.
During the run-up to the presidential election in November 2024, Donald Trump made it clear that he intends to use tariffs to support the US economy and American producers. In 2024, Mexico, China and Canada accounted for 42% of total US imports. In this period, Mexico stood out as the top exporter with $466.6 billion, according to the US Census Bureau. Hence, Trump wants to focus on these three nations when imposing tariffs. He also plans to use the revenue generated through tariffs to lower personal income taxes.
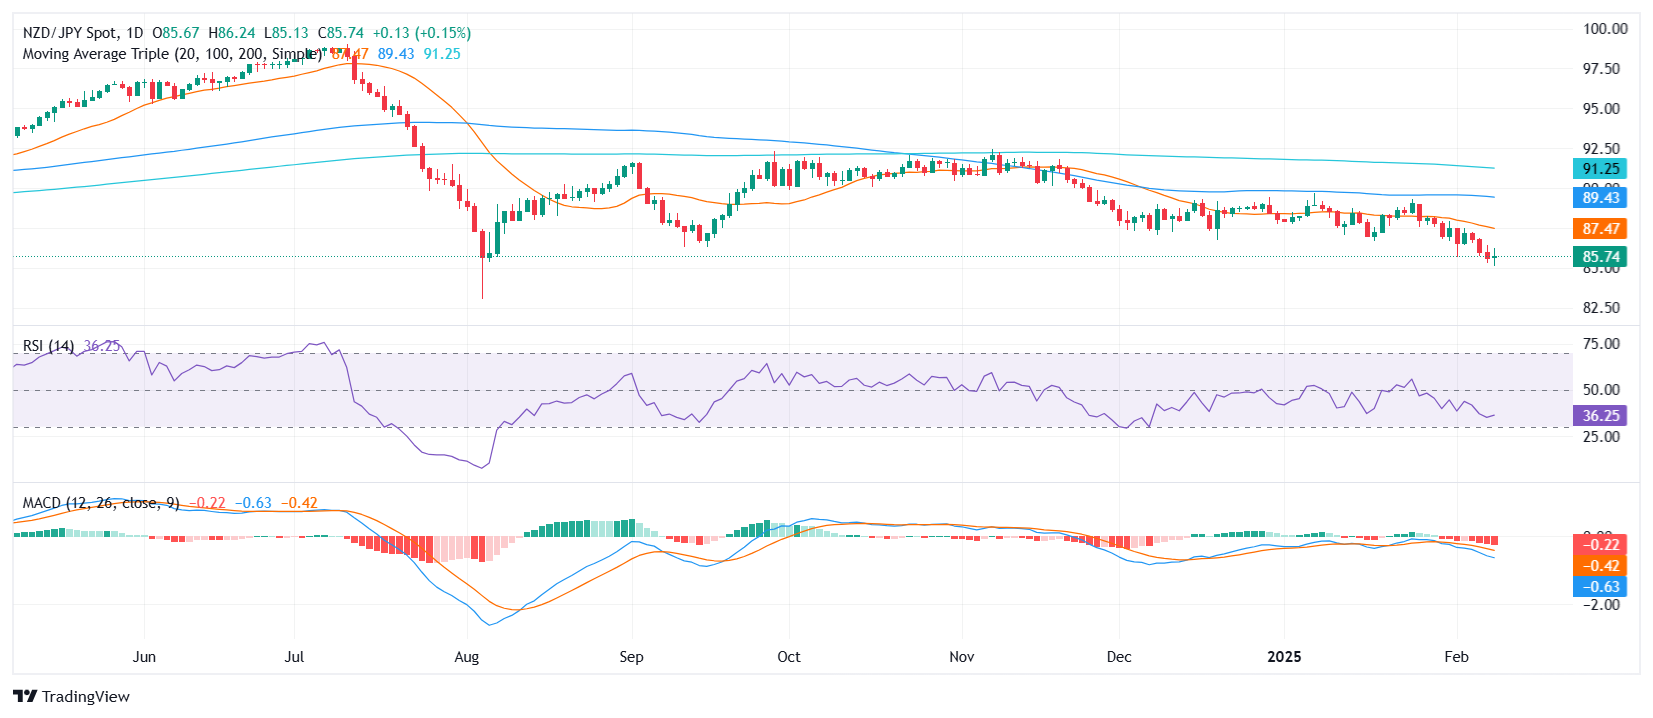
- NZD/JPY rises 0.18% on Monday, trading near 85.75 after recent losses.
- Technical indicators point to a fragile recovery, with momentum still favoring the downside.
- The pair remains well below the 20-day SMA at 87.50, limiting upside potential.
The NZD/JPY pair edged higher on Monday, gaining 0.15% to trade around 85.75, but its broader bearish trend remains intact. Despite the mild rebound, the pair continues to struggle below key resistance levels, with sellers keeping control in the bigger picture.
Technical readings suggest a tentative recovery but with downside risks still present. The Relative Strength Index (RSI) has risen to 36, indicating a slight improvement in buying interest, though it remains in negative territory. Meanwhile, the Moving Average Convergence Divergence (MACD) histogram is printing rising red bars, reinforcing that bearish momentum is not yet fully exhausted.
For the pair to establish a more constructive outlook, a move above the 20-day SMA at 87.50 is required. Until that happens, sellers may look to challenge immediate support at 85.30, with a potential move toward 84.80 if bearish pressure intensifies.
NZD/JPY daily chart
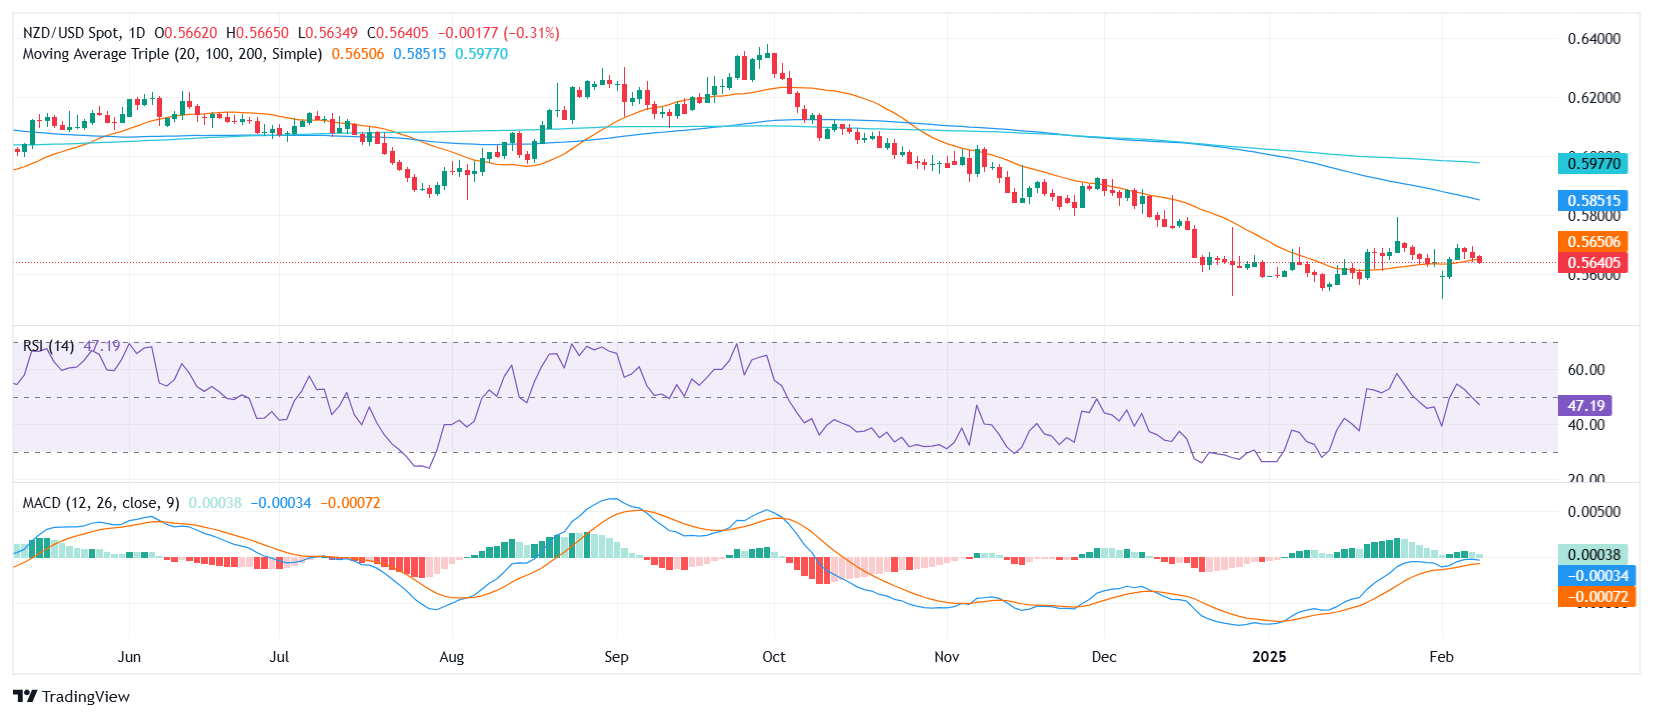
- NZD/USD dips 0.30% on Monday, trading near 0.5640 amid renewed downside pressure.
- The pair is testing support at the 20-day SMA, a key threshold for short-term direction.
- RSI declines in negative territory, while MACD histogram shows weakening bullish momentum.
The NZD/USD pair saw a mild decline on Monday, slipping to 0.5640 as selling pressure persisted. Despite previous attempts to hold above the 20-day Simple Moving Average (SMA), the pair remains vulnerable, with a decisive breakdown of this level likely to accelerate downside risks.
Technical indicators highlight fading bullish momentum. The Relative Strength Index (RSI) has declined sharply to 47, dipping back into negative territory, which suggests a weakening recovery attempt. Meanwhile, the Moving Average Convergence Divergence (MACD) histogram prints decreasing green bars, reinforcing a slowdown in buying interest.
With the 20-day SMA around 0.5650 acting as a pivotal level, a confirmed break below this mark could push NZD/USD toward the next support at 0.5610. On the flip side, a bounce above 0.5675 would help stabilize sentiment and keep buyers engaged in the short term.
NZD/USD daily chart
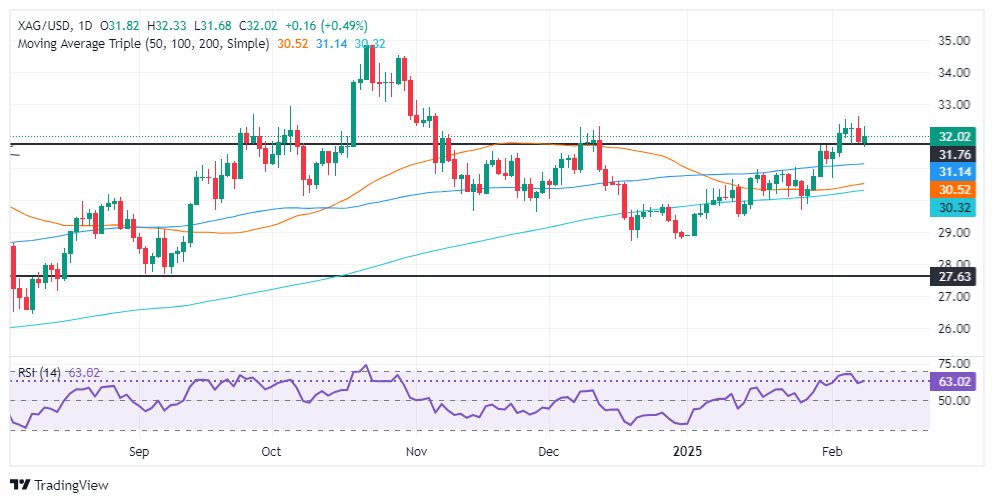
- Silver's (XAG/USD) ascends as traders gravitate towards safe-haven assets.
- Technical outlook positive; Silver targets next resistance at $32.64 with potential to breach $33.00.
- Downside risks remain if Silver falls below $32.00, with potential support at the 100-day SMA of $31.11.
Silver prices advanced on safe-haven demand on Monday, rising 0.90% and reclaiming $32.00 per troy ounce at the time of writing.
Precious metals continued to perform positively on Monday after US President Donald Trump applied 25% tariffs on all aluminum and steel imports. This prompted traders to seek the safety of haven assets like Silver, Gold, and the US Dollar.
XAG/USD Price Forecast: Technical outlook
The grey metal remains consolidated despite trading with a bullish bias on Monday. Momentum favors further upside as the Relative Strength Index (RSI) remains above its 50 neutral lines, opening the door for additional gains.
If buyers clear the February 7 daily high of $32.64, it could pave the way for challenging the psychological $33.00 mark. The following key upside target would be the October 30 swing high at $34.51, followed by the October 23 peak at $34.86.
Conversely, if XAG/USD reaches a daily close below $32.00, it could pave the way for a retracement, as the non-yielding metal would face back-to-back bearish candles. If XAG/USD drops below $31.50 look get a test of the 100-day Simple Moving Average (SMA) at $31.11, ahead of $30.00.
XAG/USD Price Chart – Daily
Silver FAQs
Silver is a precious metal highly traded among investors. It has been historically used as a store of value and a medium of exchange. Although less popular than Gold, traders may turn to Silver to diversify their investment portfolio, for its intrinsic value or as a potential hedge during high-inflation periods. Investors can buy physical Silver, in coins or in bars, or trade it through vehicles such as Exchange Traded Funds, which track its price on international markets.
Silver prices can move due to a wide range of factors. Geopolitical instability or fears of a deep recession can make Silver price escalate due to its safe-haven status, although to a lesser extent than Gold's. As a yieldless asset, Silver tends to rise with lower interest rates. Its moves also depend on how the US Dollar (USD) behaves as the asset is priced in dollars (XAG/USD). A strong Dollar tends to keep the price of Silver at bay, whereas a weaker Dollar is likely to propel prices up. Other factors such as investment demand, mining supply – Silver is much more abundant than Gold – and recycling rates can also affect prices.
Silver is widely used in industry, particularly in sectors such as electronics or solar energy, as it has one of the highest electric conductivity of all metals – more than Copper and Gold. A surge in demand can increase prices, while a decline tends to lower them. Dynamics in the US, Chinese and Indian economies can also contribute to price swings: for the US and particularly China, their big industrial sectors use Silver in various processes; in India, consumers’ demand for the precious metal for jewellery also plays a key role in setting prices.
Silver prices tend to follow Gold's moves. When Gold prices rise, Silver typically follows suit, as their status as safe-haven assets is similar. The Gold/Silver ratio, which shows the number of ounces of Silver needed to equal the value of one ounce of Gold, may help to determine the relative valuation between both metals. Some investors may consider a high ratio as an indicator that Silver is undervalued, or Gold is overvalued. On the contrary, a low ratio might suggest that Gold is undervalued relative to Silver.
- The pair recovered after a weak opening near 0.6235.
- Investors shrugged off Trump’s tariff threats on China.
- Softer US Dollar data bolstered the Aussie rebound.
The Australian Dollar (AUD) bounces back strongly to near 0.6290 after a weak opening around 0.6235 on Monday. The AUD/USD pair attracts significant bids as investors shrug off fears linked to United States (US) President Donald Trump’s tariff threats on Chinese imports.
Markets will now focus on Jerome Powell’s testimony before the US Congress on Tuesday and inflation data from the US on Wednesday.
Daily digest market movers: Aussie recovers as risk sentiment shifts
- Over the weekend, President Trump threatened to raise 25% tariffs on steel and aluminum imports globally, but market participants now view these threats as a negotiation tactic.
- Accelerated Chinese Consumer Price Index (CPI) data for January surprised markets, with year-on-year growth at 0.5% (versus the expected 0.4%) and a monthly increase of 0.7%, reinforcing the view of the AUD as a proxy for the Chinese Yuan given Australia’s trade ties.
- Trump’s imposition of a 25% duty on imports from Canada and Mexico was delayed by a month, offering temporary relief and prompting a quick sell-off in the US Dollar. Meanwhile, a 10% tariff on Chinese imports remains, sparking fears of retaliatory measures from Beijing.
- Recent Q4 Consumer Price Index (CPI) figures in Australia show headline inflation at 2.5% YoY, down from 2.8%, and the trimmed mean CPI fell to a three-year low of 3.2%. These softer inflation figures have raised expectations of a 25 basis point rate cut by the Reserve Bank of Australia (RBA) in February which acts as a roof for the pair’s upside.
- Dovish hints on Tuesday’s testimony from Jerome Powell or weak CPI data from the US on Wednesday might add momentum to the pair.
AUD/USD technical outlook: Bulls build momentum above 20-day SMA
The AUD/USD pair rose by 0.67% to 0.6290 on Monday, rebounding from a weak opening near 0.6235. Technical indicators suggest a promising short-term recovery: the pair surged past the 20-day Simple Moving Average (SMA) at approximately 0.6230, establishing a key support level.
The Relative Strength Index (RSI) is at 58, indicating growing bullish momentum, while the MACD histogram prints flat green bars, reflecting a gradual build in upward pressure.
Although the market remains cautious due to lingering tariff uncertainties and mixed US data, the recent rebound suggests that the Aussie could continue to benefit if key resistance levels, particularly around 0.6300 and 0.6400, are breached.
US-China Trade War FAQs
Generally speaking, a trade war is an economic conflict between two or more countries due to extreme protectionism on one end. It implies the creation of trade barriers, such as tariffs, which result in counter-barriers, escalating import costs, and hence the cost of living.
An economic conflict between the United States (US) and China began early in 2018, when President Donald Trump set trade barriers on China, claiming unfair commercial practices and intellectual property theft from the Asian giant. China took retaliatory action, imposing tariffs on multiple US goods, such as automobiles and soybeans. Tensions escalated until the two countries signed the US-China Phase One trade deal in January 2020. The agreement required structural reforms and other changes to China’s economic and trade regime and pretended to restore stability and trust between the two nations. However, the Coronavirus pandemic took the focus out of the conflict. Yet, it is worth mentioning that President Joe Biden, who took office after Trump, kept tariffs in place and even added some additional levies.
The return of Donald Trump to the White House as the 47th US President has sparked a fresh wave of tensions between the two countries. During the 2024 election campaign, Trump pledged to impose 60% tariffs on China once he returned to office, which he did on January 20, 2025. With Trump back, the US-China trade war is meant to resume where it was left, with tit-for-tat policies affecting the global economic landscape amid disruptions in global supply chains, resulting in a reduction in spending, particularly investment, and directly feeding into the Consumer Price Index inflation.
- The Canadian Dollar stuck to familiar levels on Monday.
- Data from Canada remains thin throughout the trading week.
- US inflation data will dominate this week, as will trade war headlines.
The Canadian Dollar (CAD) stuck to familiar technicals levels on Monday, grinding sideways within a familiar range against the Greenback. Momentum supporting the Loonie has evaporated, leaving the CAD to continue struggling against markets that are splitting the difference between risk-off and risk-on sentiment, leaving USD/CAD strung along the midrange.
Canada is almost entirely absent from the economic data docket this week. Markets will largely be focused on an appearance from Federal Reserve (Fed) Chair Jerome Powell, US Consumer Price Index (CPI) inflation, and US Producer Price Index (PPI) inflation, in that order, beginning on Tuesday and running through the midweek.
Daily digest market movers: Canadian Dollar trudges along familiar groove
- The Canadian Dollar is mostly treading water against the US Dollar, holding tight to recent technical levels.
- Fed Chair Powell’s first Senate testimony since Donald Trump returned to the White House is due on Tuesday.
- US inflation data will be the key prints this week; US Consumer Price Index (CPI) inflation is due on Wednesday, followed by US Producer Price Index (PPI) inflation on Thursday.
- Backdated Canadian Building Permits figures from December are due on Tuesday, and although the figure is forecast to recover from November’s contraction, the figures are exceedingly out of date and of little matter to front-end markets.
- USD/CAD is doomed to continue swirling around a rough lateral channel.
Canadian Dollar price forecast
The Canadian Dollar has slowed down after a tense tumble and bounce from multi-decade lows in recent weeks. USD/CAD surged into the 1.4800 handle for the first time since the early aughts, but the pair’s recovery only dragged bids back into familiar technical levels and no further. The Loonie remains hampered by the 1.4300 handle against the Greenback, a coincidence level that lines up perfectly with a middling 50-day Exponential Moving Average (EMA).
USD/CAD daily chart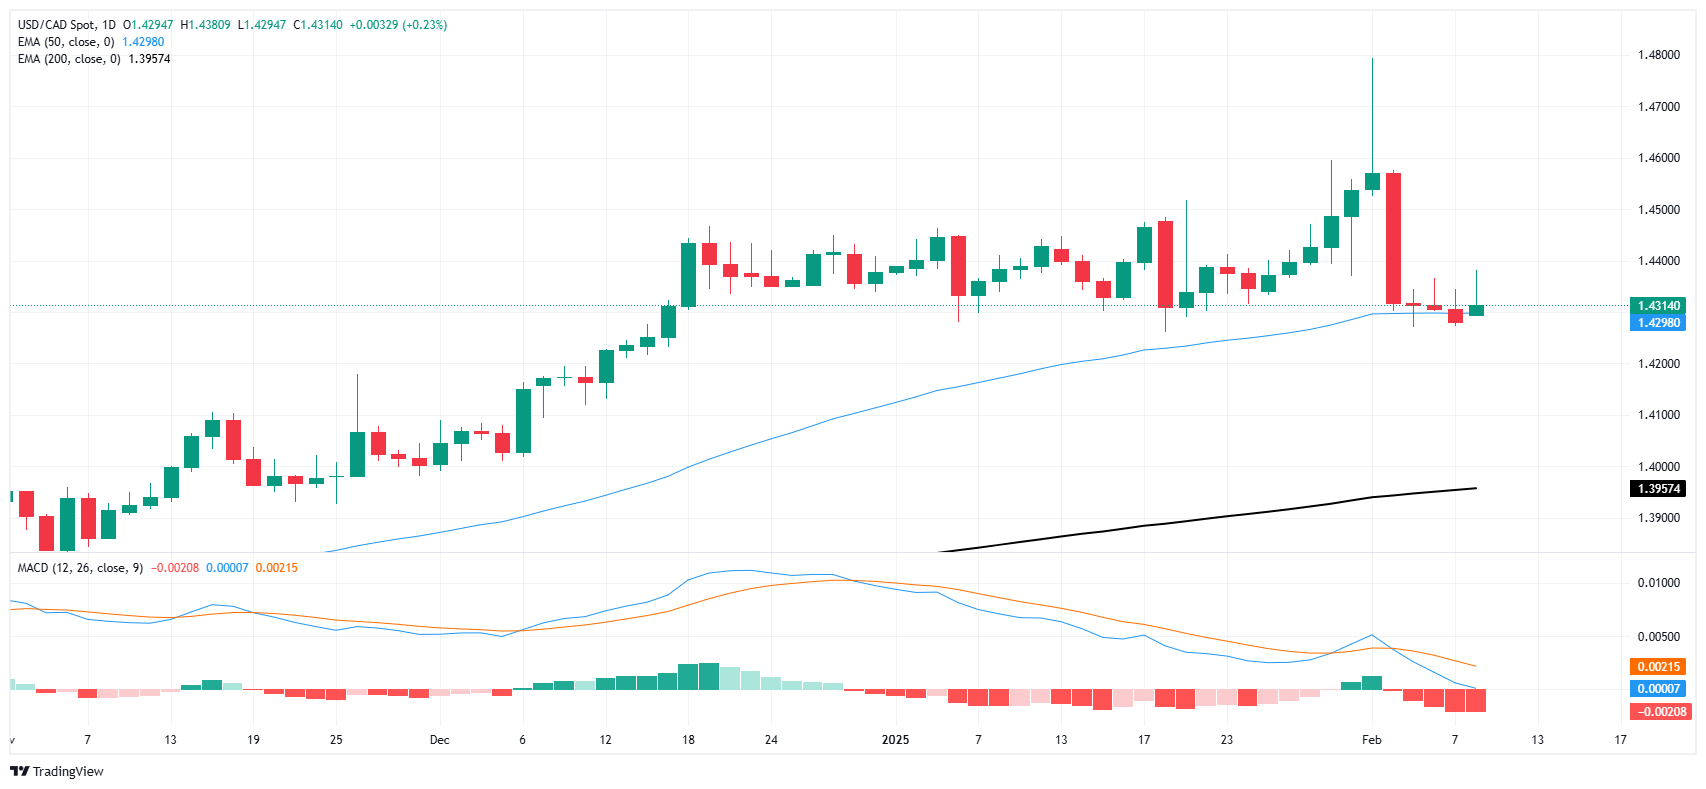
Canadian Dollar FAQs
The key factors driving the Canadian Dollar (CAD) are the level of interest rates set by the Bank of Canada (BoC), the price of Oil, Canada’s largest export, the health of its economy, inflation and the Trade Balance, which is the difference between the value of Canada’s exports versus its imports. Other factors include market sentiment – whether investors are taking on more risky assets (risk-on) or seeking safe-havens (risk-off) – with risk-on being CAD-positive. As its largest trading partner, the health of the US economy is also a key factor influencing the Canadian Dollar.
The Bank of Canada (BoC) has a significant influence on the Canadian Dollar by setting the level of interest rates that banks can lend to one another. This influences the level of interest rates for everyone. The main goal of the BoC is to maintain inflation at 1-3% by adjusting interest rates up or down. Relatively higher interest rates tend to be positive for the CAD. The Bank of Canada can also use quantitative easing and tightening to influence credit conditions, with the former CAD-negative and the latter CAD-positive.
The price of Oil is a key factor impacting the value of the Canadian Dollar. Petroleum is Canada’s biggest export, so Oil price tends to have an immediate impact on the CAD value. Generally, if Oil price rises CAD also goes up, as aggregate demand for the currency increases. The opposite is the case if the price of Oil falls. Higher Oil prices also tend to result in a greater likelihood of a positive Trade Balance, which is also supportive of the CAD.
While inflation had always traditionally been thought of as a negative factor for a currency since it lowers the value of money, the opposite has actually been the case in modern times with the relaxation of cross-border capital controls. Higher inflation tends to lead central banks to put up interest rates which attracts more capital inflows from global investors seeking a lucrative place to keep their money. This increases demand for the local currency, which in Canada’s case is the Canadian Dollar.
Macroeconomic data releases gauge the health of the economy and can have an impact on the Canadian Dollar. Indicators such as GDP, Manufacturing and Services PMIs, employment, and consumer sentiment surveys can all influence the direction of the CAD. A strong economy is good for the Canadian Dollar. Not only does it attract more foreign investment but it may encourage the Bank of Canada to put up interest rates, leading to a stronger currency. If economic data is weak, however, the CAD is likely to fall.
The US Dollar maintained its bullish bias at the start of the new trading week, as investors remained concerned about the likelihood of a global trade war ahead of Chief Powell’s key testimony.
Here is what you need to know on Tuesday, February 11:
The US Dollar Index (DXY) extended its recovery north of the 108.00 hurdle amid tariff concerns and despite the downward bias in US yields. Chair Powell’s semi-annual testimony grabs all the attention seconded by the NFIB Business Optimism Index and the speeches by the Fed’s Hammack, Bowman and Williams.
EUR/USD extended its leg lower and revisited the sub-1.0300 region on the back of further threats of US tariffs and the stronger Greenback. The ECB’s Schnabel is due to speak.
GBP/USD traded with a bearish bias and retested the area of multi-day lows near 1.2360. The BRC Retail Sales Monitor will be released prior to speeches by the BoE’s Mann and Bailey.
USD/JPY regained some extra traction on Monday, reclaiming the area above the 152.00 barrier following Friday’s two-month lows.
AUD/USD reversed two consecutive daily pullbacks and continued to retarget the key resistance area around 0.6300. The Westpac Consumer Confidence will be published seconded by the Business Confidence gauge by NAB.
Prices of WTI added to Friday’s retracement and surpassed the $72.00 mark per barrel despite the strong Dollar and threats of further tariffs.
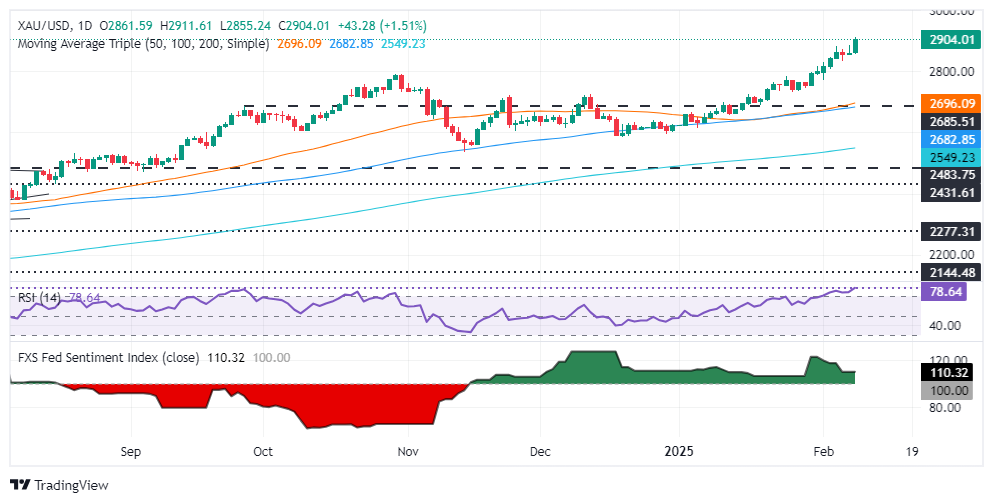
Prices of Gold reached an all-time peak past the $2,900 mark per ounce troy as the implementation of further tariffs could spark a global trade war. Silver prices followed suit and reclaimed the area beyond the $32.00 mark per ounce.
- Gold reaches new high as US 25% tariffs on steel and aluminum stoke fears of global economic slowdown and inflation.
- Market sentiment remains unexpectedly positive, with Wall Street up and the US Dollar strengthening alongside Gold.
- Upcoming testimony from Fed Chair Jerome Powell and key US economic reports to influence gold's next moves.
Gold price rallied sharply and set a record high above $2,900 on Monday after the President of the United States (US), Donald Trump, enacted tariffs of 25% on base metals. Traders seeking safety pushed the non-yielding metal higher amid fears that Trump trade policies could derail the global economy and drive inflation higher.
The XAU/USD pair trades at $2,905 after hitting an all-time high of $2,911. On Sunday, Trump said that steel and aluminum imports into the US are set to be hit by 25% duties, including proceeds from Canada, the United Arab Emirates (UAE) and Mexico. This pushed Gold prices higher, with bulls finally clearing the $2,900 barrier and setting their sights on $3,000 a troy ounce.
Despite this, the market mood remains positive as Wall Street remains in positive territory. The Greenback also climbs alongside Gold, while US Treasury bond yields remain steady, which is usually a headwind for the prices of precious metals.
Bullion has also benefited from central bank demand. The World Gold Council (WGC) revealed that banks bought more than 1,000 tons for the third year in a row in 2024. After Trump’s victory, purchases by central banks grew over 54% YoY to 333 tons, the WGC calculated.
Despite this, Federal Reserve (Fed) officials are turning slightly cautious, which has kept Gold prices from appreciating sharply. Fed Chairman Jerome Powell's testimony in the US Congress will be scrutinized by traders. Any hawkish hints could weigh on the yellow metal.
The US economic docket will feature Fed speakers, inflation figures, employment data and Retail Sales.
Daily digest market movers: Gold price poised to hit $3,000
- The US 10-year Treasury bond yield stays firm at 4.489%.
- US real yields, which correlate inversely to Bullion prices, drop one basis point to 2.055%, a tailwind for XAU/USD.
- The New York Fed Survey of Consumer Expectations indicated that US consumers anticipate inflation to stay at 3% in the near term. Additionally, long-term expectations for five years from now have risen, with consumers now expecting prices to increase to 3% in December, up from a previous expectation of 2.7%.
- Last week, US employment data was mixed, though the dip in the Unemployment Rate hints at the strength of the labor market. This might prevent the Fed from cutting rates soon.
- Money market fed funds rate futures are pricing in 39 basis points of easing by the Federal Reserve in 2025.
XAU/USD technical outlook: Gold prices set to challenge $2,900
Gold’s uptrend is set to extend unless a daily close below $2,900 happens, which could pave the way for a pullback. Momentum remains bullish as the Relative Strength Index (RSI) is overbought, though as long as it remains below the most extreme reading of 80, bulls could still push prices higher.
The next resistance would be the psychological figure of $2,950, followed by $3,000. Conversely, if XAU/USD tumbles below $2,900, the first support would be $2,850, ahead of the October 31 swing high of $2,790. Further weakness is seen at the January 27 swing low of $2,730.
Gold FAQs
Gold has played a key role in human’s history as it has been widely used as a store of value and medium of exchange. Currently, apart from its shine and usage for jewelry, the precious metal is widely seen as a safe-haven asset, meaning that it is considered a good investment during turbulent times. Gold is also widely seen as a hedge against inflation and against depreciating currencies as it doesn’t rely on any specific issuer or government.
Central banks are the biggest Gold holders. In their aim to support their currencies in turbulent times, central banks tend to diversify their reserves and buy Gold to improve the perceived strength of the economy and the currency. High Gold reserves can be a source of trust for a country’s solvency. Central banks added 1,136 tonnes of Gold worth around $70 billion to their reserves in 2022, according to data from the World Gold Council. This is the highest yearly purchase since records began. Central banks from emerging economies such as China, India and Turkey are quickly increasing their Gold reserves.
Gold has an inverse correlation with the US Dollar and US Treasuries, which are both major reserve and safe-haven assets. When the Dollar depreciates, Gold tends to rise, enabling investors and central banks to diversify their assets in turbulent times. Gold is also inversely correlated with risk assets. A rally in the stock market tends to weaken Gold price, while sell-offs in riskier markets tend to favor the precious metal.
The price can move due to a wide range of factors. Geopolitical instability or fears of a deep recession can quickly make Gold price escalate due to its safe-haven status. As a yield-less asset, Gold tends to rise with lower interest rates, while higher cost of money usually weighs down on the yellow metal. Still, most moves depend on how the US Dollar (USD) behaves as the asset is priced in dollars (XAU/USD). A strong Dollar tends to keep the price of Gold controlled, whereas a weaker Dollar is likely to push Gold prices up.
- The US Dollar Index trades lower near 108.30 as market sentiment remains cautious.
- Trump confirms 25% tariffs on steel and aluminum imports but provides no clear implementation timeline.
- Investors await Powell’s testimony for further clues on the Federal Reserve’s policy outlook.
- US CPI data from January is also due this week.
The US Dollar Index (DXY), which measures the value of the US Dollar against a basket of currencies, is trading softer near 108.30 as investors react to mixed economic data and fresh tariff concerns. Market participants are also turning their focus to Federal Reserve (Fed) Chair Jerome Powell’s upcoming testimony before Congress for guidance on future interest rate policy.
Daily digest market movers: US Dollar weakens as investors assess tariff risks and Powell's testimony
- Trump announces a 25% tariff on steel and aluminum imports, raising concerns over inflation and global trade tensions.
- Gold soars to record highs as safe-haven demand increases amid economic uncertainty and potential trade wars.
- CME FedWatch Tool shows 90% probability of unchanged interest rates at the Fed’s March 19 meeting.
- US 10-year yield rises to 4.50%, recovering from last week's yearly low.
- Markets anticipate Powell’s testimony on Tuesday, expecting insights into future monetary policy and interest rate adjustments.
- Wednesday’s Consumer Price Index (CPI) data from January will also be closely followed by markets.
DXY technical outlook: Bearish bias grows as sellers maintain pressure
The US Dollar Index remains under pressure, struggling to hold above 108.00 as sellers continue to dominate. The Relative Strength Index (RSI) remains below 50, indicating growing bearish momentum, while the DXY holds above the 20-day Simple Moving Average (SMA) at 108.50.
Meanwhile, the Moving Average Convergence Divergence (MACD) indicator continues to show increasing bearish momentum. Sustained selling pressure could lead to a retest of the 107.00 psychological level, with potential downside risks if bearish momentum accelerates.
Tariffs FAQs
Tariffs are customs duties levied on certain merchandise imports or a category of products. Tariffs are designed to help local producers and manufacturers be more competitive in the market by providing a price advantage over similar goods that can be imported. Tariffs are widely used as tools of protectionism, along with trade barriers and import quotas.
Although tariffs and taxes both generate government revenue to fund public goods and services, they have several distinctions. Tariffs are prepaid at the port of entry, while taxes are paid at the time of purchase. Taxes are imposed on individual taxpayers and businesses, while tariffs are paid by importers.
There are two schools of thought among economists regarding the usage of tariffs. While some argue that tariffs are necessary to protect domestic industries and address trade imbalances, others see them as a harmful tool that could potentially drive prices higher over the long term and lead to a damaging trade war by encouraging tit-for-tat tariffs.
During the run-up to the presidential election in November 2024, Donald Trump made it clear that he intends to use tariffs to support the US economy and American producers. In 2024, Mexico, China and Canada accounted for 42% of total US imports. In this period, Mexico stood out as the top exporter with $466.6 billion, according to the US Census Bureau. Hence, Trump wants to focus on these three nations when imposing tariffs. He also plans to use the revenue generated through tariffs to lower personal income taxes.
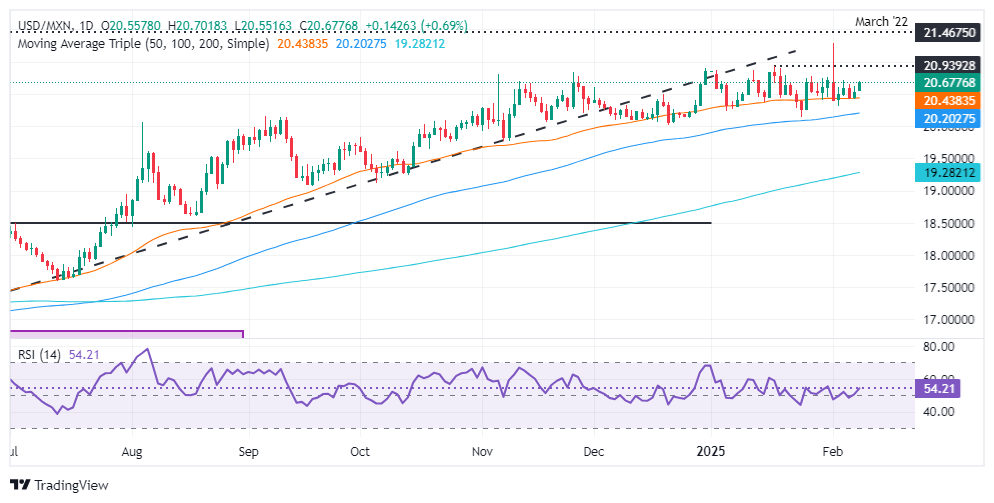
- Mexican Peso weighed down by steek and aluminum tariffs enacted by The White House.
- Mexican automobile production and exports declined, creating a headwind for the emerging market currency.
- USD/MXN traders eye testimony from Fed Chair Jerome Powell on Tuesday.
The Mexican Peso depreciated against the US Dollar on Monday after US President Donald Trump decided to apply 25% tariffs on aluminum and steel imports into the United States (US), including Mexico and Canada. At the time of writing, the USD/MXN trades at 20.67, a gain of 0.66%.
On Sunday, Trump stated that he would apply tariffs on base metals. He added that reciprocal tariffs could be enacted as soon as Tuesday or Wednesday and that the tariffs would address the deficit.
The USD/MXN jumped on those remarks, extending its gains during the North American session. Meanwhile, the market mood remained upbeat, as depicted by US equities trading with gains.
Mexican data revealed that auto production dipped and exports plummeted for the third consecutive month in January, according to the Instituto Nacional de Estadistica Geografia e Informatica (INEGI).
Earlier, Banxico Governor Victoria Rodriguez Ceja was dovish, revealing that the Central Bank could cut rates of the same magnitude as in February, adding that the job of bringing inflation to the 3% goal has not concluded.
Mexican Industrial Production for December is expected to remain unchanged at 0.1% MoM. US Federal Reserve (Fed) Chair Jerome Powell will cross the wires in the US for his semi-annual testimony at the US Congress. US inflation data on the consumer and producer side and retail sales will also update the status of the US economy.
Daily digest market movers: Mexican data failed to cap Peso’s fall spurred by Trump’s rhetoric
- Mexico’s Auto Exports plunged from -5.8% YoY to -13.7% in January. Production dipped from 4.2% to 1.7% YoY.
- Banxico’s Rodriguez added that Mexico’s role in US production chains allowed American consumers access to products at competitive prices. She said the central bank remains attentive to what might happen in March after the 30-day grace period provided by Trump.
- She added that despite being volatile, the Mexican Peso market has operated in an orderly way.
- The New York Fed Survey of Consumer Expectations revealed that US consumers expect inflation to remain at 3%. For five years, prices are expected to edge up from 2.7% to 3% in December.
- Trade disputes between the US and Mexico remain in the boiler room. Although the countries found common ground previously, USD/MXN traders should know that there is a 30-day pause and that tensions could arise toward the end of February.
- Money market fed funds rate futures are pricing in 39 basis points (bps) of easing by the Fed in 2025.
USD/MXN technical outlook: Mexican Peso poised for further losses
The USD/MXN uptrend remains in place, but the exotic pair could remain sideways in the short term, trading within the 20.30 – 20.70 area. Momentum remains bullish, as depicted by the Relative Strength Index (RSI), but buyers need to push prices above 20.70, so they could target higher prices.
The next resistance would be the January 17 daily peak at 20.90 before testing the 21.00 figure and the year-to-date (YTD) high at 21.29. Conversely, a drop below the 50-day Simple Moving average (SMA) at 20.57 could clear the path toward the 100-day SMA at 20.22. On further weakness, look for a test of 20.00.
Mexican Peso FAQs
The Mexican Peso (MXN) is the most traded currency among its Latin American peers. Its value is broadly determined by the performance of the Mexican economy, the country’s central bank’s policy, the amount of foreign investment in the country and even the levels of remittances sent by Mexicans who live abroad, particularly in the United States. Geopolitical trends can also move MXN: for example, the process of nearshoring – or the decision by some firms to relocate manufacturing capacity and supply chains closer to their home countries – is also seen as a catalyst for the Mexican currency as the country is considered a key manufacturing hub in the American continent. Another catalyst for MXN is Oil prices as Mexico is a key exporter of the commodity.
The main objective of Mexico’s central bank, also known as Banxico, is to maintain inflation at low and stable levels (at or close to its target of 3%, the midpoint in a tolerance band of between 2% and 4%). To this end, the bank sets an appropriate level of interest rates. When inflation is too high, Banxico will attempt to tame it by raising interest rates, making it more expensive for households and businesses to borrow money, thus cooling demand and the overall economy. Higher interest rates are generally positive for the Mexican Peso (MXN) as they lead to higher yields, making the country a more attractive place for investors. On the contrary, lower interest rates tend to weaken MXN.
Macroeconomic data releases are key to assess the state of the economy and can have an impact on the Mexican Peso (MXN) valuation. A strong Mexican economy, based on high economic growth, low unemployment and high confidence is good for MXN. Not only does it attract more foreign investment but it may encourage the Bank of Mexico (Banxico) to increase interest rates, particularly if this strength comes together with elevated inflation. However, if economic data is weak, MXN is likely to depreciate.
As an emerging-market currency, the Mexican Peso (MXN) tends to strive during risk-on periods, or when investors perceive that broader market risks are low and thus are eager to engage with investments that carry a higher risk. Conversely, MXN tends to weaken at times of market turbulence or economic uncertainty as investors tend to sell higher-risk assets and flee to the more-stable safe havens.
- The Dow Jones found thin gains on Monday ahead of trade war headlines.
- Tech rally has stalled after last batch of earnings came in mixed.
- Fed Chair Powell back on the calendar, as well as US inflation data.
The Dow Jones Industrial Average (DJIA) found a slim foothold on Monday despite some volatility in the pre-market. The United States (US) Federal Reserve (Fed) is back in news circulation this week, with Fed Chair Jerome Powell set to testify before the US Senate Banking Committee on Tuesday. US Consumer Price Index (CPI) and Producer Price Index (PPI) inflation metrics are slated for Wednesday and Thursday, respectively.
US President Donald Trump is expected to sign another batch of sweeping executive orders on Monday afternoon. Some of those orders are expected to focus on a fresh batch of tariff threats, this time focusing on a flat import tax on all foreign-sourced steel and aluminum into the US. While a threat to US market stability, investors are largely brushing off the trade war rhetoric after President Trump functionally waffled on nearly all of his trade war threats just last week, though a tit-for-tat spat of tariffs on Chinese goods are still in place.
Fed Chair Powell’s testimony this Tuesday will be the Fed head’s first appearance before the Senate since Donald Trump took office, and questions are expected to largely focus on Trump’s tariff policies and how they impact the Fed’s decision framework. Multiple iterations of whether Fed Chair Powell will acquiesce to requests from the Trump administration, ranging from arbitrary rate adjustments at the behest of the President to whether Powell would vacate his position if asked by Donald Trump, are expected.
Key US inflation data is due this week, with US CPI inflation on Wednesday and PPI producer-level inflation slated for Thursday. The New York Fed noted on Monday that consumer inflation expectations have become anchored around the 3% level, frustratingly higher than the central bank’s 2% target. The NY Fed also highlighted an overall decline in consumer expectations of increased spending going forward, though debt-laden consumers did acknowledge an overall easing in credit access.
Dow Jones news
The Dow Jones was relatively even-keeled on Monday, with about half of the equity board in the green. American Express (AXP) fell around 3% to $307 per share after the credit company softened its earnings growth outlook for the first quarter. McDonald’s (MCD) rose nearly 4% to $306 per share on Monday despite a miss in quarterly earnings, with investors noting that the overall pace of new locations has been on the rise and is expected to contribute to aggregate earnings in 2025.
Dow Jones price forecast
The Dow Jones remains pinned near 44,350 after last week’s late bearish push. Price action remains crimped below the 45,000 handle, and momentum is getting squeezed into a middling congestion pattern.
A near-term technical floor is getting priced in at the 50-day Exponential Moving Average (EMA) near 43,750. Both bulls and bears appear to have run out of gas for the time being, but the Dow Jones is still trading close to record highs just beyond 45,000.
Dow Jones daily chart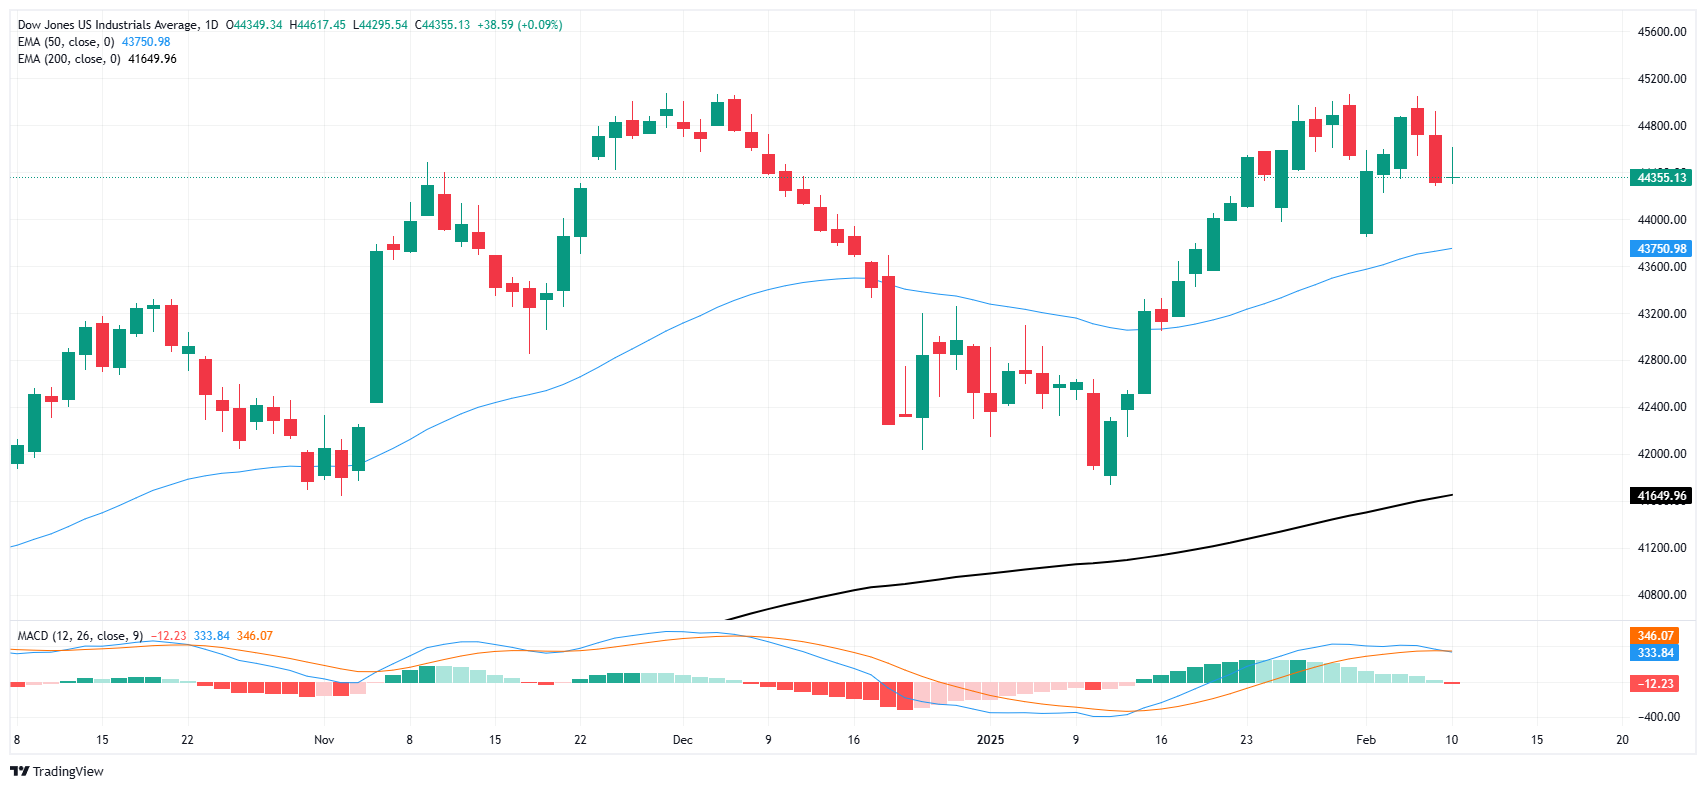
Dow Jones FAQs
The Dow Jones Industrial Average, one of the oldest stock market indices in the world, is compiled of the 30 most traded stocks in the US. The index is price-weighted rather than weighted by capitalization. It is calculated by summing the prices of the constituent stocks and dividing them by a factor, currently 0.152. The index was founded by Charles Dow, who also founded the Wall Street Journal. In later years it has been criticized for not being broadly representative enough because it only tracks 30 conglomerates, unlike broader indices such as the S&P 500.
Many different factors drive the Dow Jones Industrial Average (DJIA). The aggregate performance of the component companies revealed in quarterly company earnings reports is the main one. US and global macroeconomic data also contributes as it impacts on investor sentiment. The level of interest rates, set by the Federal Reserve (Fed), also influences the DJIA as it affects the cost of credit, on which many corporations are heavily reliant. Therefore, inflation can be a major driver as well as other metrics which impact the Fed decisions.
Dow Theory is a method for identifying the primary trend of the stock market developed by Charles Dow. A key step is to compare the direction of the Dow Jones Industrial Average (DJIA) and the Dow Jones Transportation Average (DJTA) and only follow trends where both are moving in the same direction. Volume is a confirmatory criteria. The theory uses elements of peak and trough analysis. Dow’s theory posits three trend phases: accumulation, when smart money starts buying or selling; public participation, when the wider public joins in; and distribution, when the smart money exits.
There are a number of ways to trade the DJIA. One is to use ETFs which allow investors to trade the DJIA as a single security, rather than having to buy shares in all 30 constituent companies. A leading example is the SPDR Dow Jones Industrial Average ETF (DIA). DJIA futures contracts enable traders to speculate on the future value of the index and Options provide the right, but not the obligation, to buy or sell the index at a predetermined price in the future. Mutual funds enable investors to buy a share of a diversified portfolio of DJIA stocks thus providing exposure to the overall index.
European Central Bank (ECB) President Christine Lagarde noted during Monday's US market session that risks to inflation exist on both sides of the line, and reminded markets that European inflation metrics should return to the ECB's target range sometime this year.
Key highlights
The conditions for a recovery remain in place.
Inflation is set to return to our 2% medium-term target in the course of this year.
Risks on both the upside and the downside.
The inflation outlook is more uncertain due to trade friction.
Wage growth is moderating as expected.
The frequency of shocks is likely to remain high in the future.
Europe has immense challenges, but solutions are within reach.
Despite new all-time highs, macro funds actually liquidated some Gold length last week, TDS’ Senior Commodity Strategist Daniel Ghali notes.
Macro fund buying activity is a critical to the upswing in prices
“Outflows from Western macro funds likely coincided with the sharp rise in the dollar at the turn-of-the-week. Interestingly, although the broad dollar sharply reversed by Tuesday, macro funds had failed to reacquire their lost length by then, whereas concurrent CTA buying activity over the past week more than offset liquidations from this cohort.”
“Importantly, this left macro funds with additional ammo to chase the rally in Gold prices. Considering that CTAs effectively hold their 'max long' position size and that risk parity funds' deleveraging risks are limited by the diversification benefit offered to stocks by bonds, macro fund buying activity is a critical component to the continued upswing in prices.”
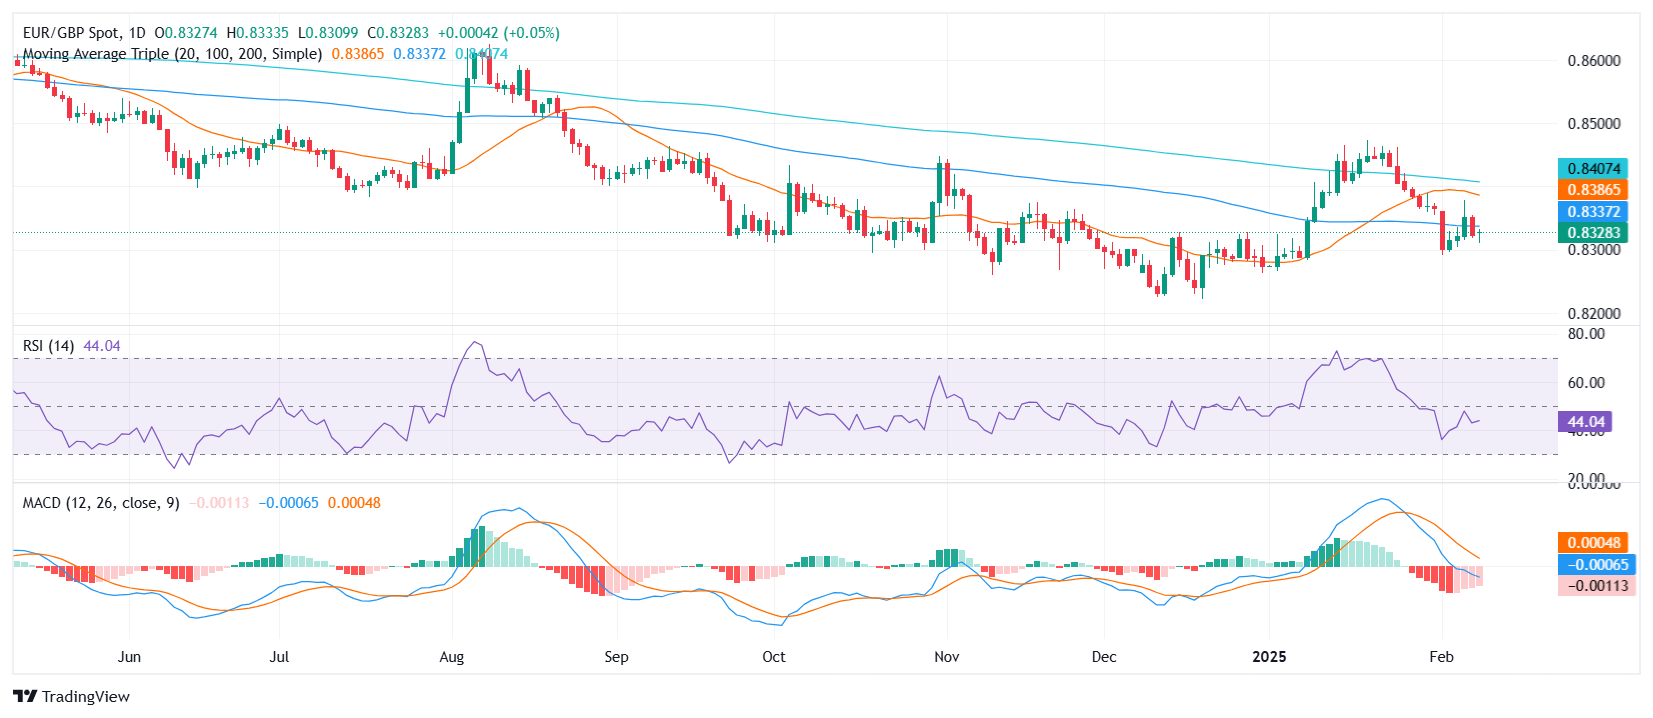
- EUR/GBP edges up to 0.8330 on Monday but remains below key resistance.
- Last week's failure to hold above the 100-day SMA continues to weigh on sentiment.
The EUR/GBP pair saw a mild uptick on Monday, rising to 0.8330, but remains under pressure as it struggles to reclaim the 100-day Simple Moving Average (SMA). The inability to hold above this level last week has further dampened sentiment, keeping the broader outlook tilted to the downside.
Technical readings suggest that momentum remains weak despite the recent rebound. The Relative Strength Index (RSI) has climbed to 44, signaling some buying interest but still residing in negative territory. Meanwhile, the Moving Average Convergence Divergence (MACD) histogram remains flat with green bars, indicating a lack of strong directional bias.
Unless EUR/GBP manages to reclaim the 100-day SMA, currently acting as resistance, further downside risks persist. Immediate support lies at 0.8300, with a break lower exposing 0.8275. On the upside, a decisive move above 0.8350 could provide the bulls with a chance to regain control and target 0.8380.
EUR/GBP daily chart
- GBP/USD edges down after Trump's new tariffs on aluminum and steel, hinting at further measures.
- Market eyes key events: Fed Chair Powell's testimony and upcoming US inflation data.
- BoE's Catherine Mann speech eyed after shifting from hawkish to favoring substantial rate cuts.
The British Pound retreats during the North American session as the Greenback post solid gains after US President Donald Trump said he would impose tariffs on base metals. The GBP/USD trades at 1.2385. down 0.16%.
British Pound drops after new US tariff announcements, Central Bank speeches up next
Market sentiment is upbeat despite Trump’s tariff rhetoric, who said on Sunday that they would impose 25% tariffs on aluminum and steel. Furthermore, he added that reciprocal tariffs could be levied as soon as Tuesday or Wednesday.
An absent economic docket leaves traders adrift to comments of Central Bank speakers like Catherine Mann of the Bank of England (BoE) on February 11, who voted for a 50-basis points (bps) rate cut last week, after being one of the most hawkish members of the BoE.
Across the pond, traders are eyeing Federal Reserve Chair Jerome Powell's testimony at the US Congress on Tuesday. In addition, US inflation figures are expected to remain near the 3% threshold, while Retail Sales are expected to show a minimal contraction in January.
GBP/USD Price Analysis: Technical outlook
From a technical standpoint, the GBP/USD remains biased downward after the pair hit a daily high of 1.2421; buyers failed to cling to gains above 1.2400. On further weakness, the pair might test the February 6 low of 1.2359, followed by the February 3 daily low of 1.2249.
Conversely, a daily close above 1.2400 could allow the 50-day Simple Moving Average (SMA) to be tested at 1.2486 ahead of the 1.2500 mark.
Pound Sterling FAQs
The Pound Sterling (GBP) is the oldest currency in the world (886 AD) and the official currency of the United Kingdom. It is the fourth most traded unit for foreign exchange (FX) in the world, accounting for 12% of all transactions, averaging $630 billion a day, according to 2022 data. Its key trading pairs are GBP/USD, also known as ‘Cable’, which accounts for 11% of FX, GBP/JPY, or the ‘Dragon’ as it is known by traders (3%), and EUR/GBP (2%). The Pound Sterling is issued by the Bank of England (BoE).
The single most important factor influencing the value of the Pound Sterling is monetary policy decided by the Bank of England. The BoE bases its decisions on whether it has achieved its primary goal of “price stability” – a steady inflation rate of around 2%. Its primary tool for achieving this is the adjustment of interest rates. When inflation is too high, the BoE will try to rein it in by raising interest rates, making it more expensive for people and businesses to access credit. This is generally positive for GBP, as higher interest rates make the UK a more attractive place for global investors to park their money. When inflation falls too low it is a sign economic growth is slowing. In this scenario, the BoE will consider lowering interest rates to cheapen credit so businesses will borrow more to invest in growth-generating projects.
Data releases gauge the health of the economy and can impact the value of the Pound Sterling. Indicators such as GDP, Manufacturing and Services PMIs, and employment can all influence the direction of the GBP. A strong economy is good for Sterling. Not only does it attract more foreign investment but it may encourage the BoE to put up interest rates, which will directly strengthen GBP. Otherwise, if economic data is weak, the Pound Sterling is likely to fall.
Another significant data release for the Pound Sterling is the Trade Balance. This indicator measures the difference between what a country earns from its exports and what it spends on imports over a given period. If a country produces highly sought-after exports, its currency will benefit purely from the extra demand created from foreign buyers seeking to purchase these goods. Therefore, a positive net Trade Balance strengthens a currency and vice versa for a negative balance.
- USD/CAD is still 0.35% higher after falling from the intraday high amid fears of Trump’s tariff threats.
- The Canadian economy is expected to be biggest casualty of Trump’s decision to impose 25% tariffs on steel and aluminum from all nations.
- Investors await the Fed Powell’s testimony for fresh interest rate outlook.
The USD/CAD pair surrenders a majority of intraday gains and falls back to near 1.4340 from the intraday high of 1.4380, but is still 0.35% higher in Monday’s North American session. The outlook of the Loonie pair remains firm on widening troubles for the Canadian Dollar (CAD).
Over the weekend, United States (US) President Donald Trump said that he will impose 25% tariffs on imports of steel and aluminum from all nations and reciprocal tariffs over those nations where he finds unfair trade practices. The scenario of tariff imposition on the above-mentioned metals is unfavorable for the Canadian Dollar, given that Canada is the leading exporter of aluminum to the US.
The impact of Trump’s tariffs on metals will also come on trading partners, such as Brazil, Vietnam, Mexico and South Korea.
Last week, the Canadian Dollar attempted to gain ground after President Trump postponed 25% tariffs on all imports from Canada and Mexico after they agrees to cooperate on crime enforcement at borders. Also, surprisingly upbeat Canadian employment data for January offered support to the domestic currency.
Meanwhile, the US Dollar (USD) rises as renewed Trump’s tariff threats have increased its safe-haven appeal. The US Dollar Index (DXY), which tracks the Greenback’s value against six major currencies, trades 0.2% higher around 108.30.
The next trigger for the US Dollar will be the Fed Chair Jerome Powell’s testimony before the Congress on Tuesday and Wednesday. Investors will pay close attention to Powell’s commentary on potential Trump tariffs and their impact on inflation and the monetary policy outlook.
Canadian Dollar FAQs
The key factors driving the Canadian Dollar (CAD) are the level of interest rates set by the Bank of Canada (BoC), the price of Oil, Canada’s largest export, the health of its economy, inflation and the Trade Balance, which is the difference between the value of Canada’s exports versus its imports. Other factors include market sentiment – whether investors are taking on more risky assets (risk-on) or seeking safe-havens (risk-off) – with risk-on being CAD-positive. As its largest trading partner, the health of the US economy is also a key factor influencing the Canadian Dollar.
The Bank of Canada (BoC) has a significant influence on the Canadian Dollar by setting the level of interest rates that banks can lend to one another. This influences the level of interest rates for everyone. The main goal of the BoC is to maintain inflation at 1-3% by adjusting interest rates up or down. Relatively higher interest rates tend to be positive for the CAD. The Bank of Canada can also use quantitative easing and tightening to influence credit conditions, with the former CAD-negative and the latter CAD-positive.
The price of Oil is a key factor impacting the value of the Canadian Dollar. Petroleum is Canada’s biggest export, so Oil price tends to have an immediate impact on the CAD value. Generally, if Oil price rises CAD also goes up, as aggregate demand for the currency increases. The opposite is the case if the price of Oil falls. Higher Oil prices also tend to result in a greater likelihood of a positive Trade Balance, which is also supportive of the CAD.
While inflation had always traditionally been thought of as a negative factor for a currency since it lowers the value of money, the opposite has actually been the case in modern times with the relaxation of cross-border capital controls. Higher inflation tends to lead central banks to put up interest rates which attracts more capital inflows from global investors seeking a lucrative place to keep their money. This increases demand for the local currency, which in Canada’s case is the Canadian Dollar.
Macroeconomic data releases gauge the health of the economy and can have an impact on the Canadian Dollar. Indicators such as GDP, Manufacturing and Services PMIs, employment, and consumer sentiment surveys can all influence the direction of the CAD. A strong economy is good for the Canadian Dollar. Not only does it attract more foreign investment but it may encourage the Bank of Canada to put up interest rates, leading to a stronger currency. If economic data is weak, however, the CAD is likely to fall.
- USD/JPY advances to near 152.00 at the expense of the Japanese Yen.
- US President Trump announces that he is prepared to impose 25% tariffs on imports of steel and aluminum.
- Investors will pay close attention to Fed Powell’s testimony on Tuesday and Wednesday.
The USD/JPY pair attracts strong bids near the two-month low of 151.00 and bounces back to near 152.00 at the start of the week. The asset strengthens as the Japanese Yen (JPY) weakens across the board after the release of the weak Japan Current Account data for Japan.
Japanese Yen PRICE Today
The table below shows the percentage change of Japanese Yen (JPY) against listed major currencies today. Japanese Yen was the strongest against the Canadian Dollar.
| USD | EUR | GBP | JPY | CAD | AUD | NZD | CHF | |
|---|---|---|---|---|---|---|---|---|
| USD | 0.04% | 0.05% | 0.36% | 0.36% | -0.12% | 0.07% | 0.08% | |
| EUR | -0.04% | 0.08% | 0.45% | 0.44% | -0.16% | 0.11% | 0.12% | |
| GBP | -0.05% | -0.08% | 0.21% | 0.33% | -0.24% | 0.03% | 0.04% | |
| JPY | -0.36% | -0.45% | -0.21% | -0.01% | -0.39% | -0.27% | -0.24% | |
| CAD | -0.36% | -0.44% | -0.33% | 0.01% | -0.46% | -0.33% | -0.32% | |
| AUD | 0.12% | 0.16% | 0.24% | 0.39% | 0.46% | 0.28% | 0.29% | |
| NZD | -0.07% | -0.11% | -0.03% | 0.27% | 0.33% | -0.28% | 0.00% | |
| CHF | -0.08% | -0.12% | -0.04% | 0.24% | 0.32% | -0.29% | -0.01% |
The heat map shows percentage changes of major currencies against each other. The base currency is picked from the left column, while the quote currency is picked from the top row. For example, if you pick the Japanese Yen from the left column and move along the horizontal line to the US Dollar, the percentage change displayed in the box will represent JPY (base)/USD (quote).
The Ministry of Japan reported that the Current Account balance was 1,077.3 billion Yen, almost one-third of November’s reading of 3,352.5 billion Yen.
The Japanese Yen was outperforming its peers last week on firming speculation that the Bank of Japan (BoJ) will raise interest rates further, a scenario that will reduce interest rate differentials with other central banks.
Meanwhile, the US Dollar (USD) is slightly higher amid a risk-aversion mood on renewed fears of a global trade war. On the weekend, United States (US) President Donald Trump threatened to impose 25% tariffs on all imports of steel and aluminum and reciprocal tariffs over nations where he sees unfair trade practices.
The US Dollar Index (DXY), which tracks the Greenback’s value against six major currencies, is 0.1% higher, around 108.20, but has dropped from the intraday high of 108.50.
Investors worry that Trump’s international agenda will impact the US economy and cause inflation. This scenario would force Federal Reserve (Fed) policymakers to maintain a cautious stance on interest rates for longer.
For more guidance on the monetary policy outlook, investors will focus on Fed Chair Jerome Powell’s testimony before the Congress on Tuesday and Wednesday.
Japanese Yen FAQs
The Japanese Yen (JPY) is one of the world’s most traded currencies. Its value is broadly determined by the performance of the Japanese economy, but more specifically by the Bank of Japan’s policy, the differential between Japanese and US bond yields, or risk sentiment among traders, among other factors.
One of the Bank of Japan’s mandates is currency control, so its moves are key for the Yen. The BoJ has directly intervened in currency markets sometimes, generally to lower the value of the Yen, although it refrains from doing it often due to political concerns of its main trading partners. The BoJ ultra-loose monetary policy between 2013 and 2024 caused the Yen to depreciate against its main currency peers due to an increasing policy divergence between the Bank of Japan and other main central banks. More recently, the gradually unwinding of this ultra-loose policy has given some support to the Yen.
Over the last decade, the BoJ’s stance of sticking to ultra-loose monetary policy has led to a widening policy divergence with other central banks, particularly with the US Federal Reserve. This supported a widening of the differential between the 10-year US and Japanese bonds, which favored the US Dollar against the Japanese Yen. The BoJ decision in 2024 to gradually abandon the ultra-loose policy, coupled with interest-rate cuts in other major central banks, is narrowing this differential.
The Japanese Yen is often seen as a safe-haven investment. This means that in times of market stress, investors are more likely to put their money in the Japanese currency due to its supposed reliability and stability. Turbulent times are likely to strengthen the Yen’s value against other currencies seen as more risky to invest in.
The Pound Sterling (GBP) is a moderate outperformer on the session after dipping modestly in line with its peers in light trade overnight, Scotiabank's Chief FX Strategist Shaun Osborne notes.
GBP is little changed on the day
"Sterling is being afforded a little protection from its relatively low trade exposure to the US amid the focus on tariffs while the market’s swift revision of BoE rate cut expectations following last week’s cut and apparent dovish tilt to the voting split is also providing some support. Market pricing for a follow-up cut in March has weakened significantly following BoE messaging that policy settings needed to remain restrictive."
"Spot’s recovery from last week’s low settled around the 1.24 point at the end of last week and this area may remain an anchor for the GBP in the short run as markets try and determine a stronger sense of direction. Support is 1.2360. Resistance is 1.2490/00."
The Euro (EUR) traded defensively Friday as President Trump announced that reciprocal tariffs were coming soon, Scotiabank's Chief FX Strategist Shaun Osborne notes.
EUR is trading softer on the day
"The EUR has lost a little more ground over the weekend but—after the president highlighted autos as a target last week—the EUR can perhaps breathe a small sigh of relief that this round of tariff threats may only affect relatively limited German exports of steel to the US. Note that the EU offered tariff concessions on autos last Friday."
"Spot losses steadied in the upper 1.02 area overnight, representing a roughly 50% retracement of the sharp jump higher last week from 1.0140. The EUR may consolidate in the short run above minor support at 1.0280 but below stiffer resistance in the 1.0350/75 zone (40-day MA at 1.0370)."
The Canadian Dollar (CAD) has softened in response to news of reciprocal tariffs on imported steel and aluminum to the US. Canada is one of the US’ top suppliers, particularly for quality grades, with sales representing about 5% of total exports to the US, Scotiabank's Chief FX Strategist Shaun Osborne notes.
CAD underperforms on the day
"There are meaningful consequences for both countries. The CAD slipped back to the upper 1.43s in early Asian trade but has since recovered about half of that loss to steady in the low/mid-1.43s as markets await developments. Friday’s Canadian employment report reflected another decent gain in jobs in January and a very solid (0.9%) rise in hours worked across the economy which suggests firm growth momentum in early 2025 despite the hyper-focus on tariffs."
"While tariff concerns remain paramount for policymakers right now, evidence of very firm growth momentum late last year and into Q1 suggest the Bank can afford to await developments before judging whether more accommodation is needed. Odds of a March cut have been pared back to 60/65% or so—this time last week, market pricing was veering towards the chance of an off-cycle cut. USDCAD continues to trade close to, but a little below, estimated fair value (1.4387 today)."
"Chart signals wound up net bearish for the USD over last week. Spot developed a bearish 'engulfing' line on the weekly candle chart and a key reversal week in 'regular' chart analysis. Noted support at 1.4250/75 remains relevant for the USD as the recent lows for the USD coincide with the 38.2% retracement of the USD’s Sep/Jan rally (1.4260). A push below the upper 1.42 area targets a further USD drop to the 1.40/1.41 area. Resistance is 1.4375/80, where the USD topped out overnight, and 1.4450/75."
USD/JPY rose this morning, tracking the rise in USD on tariff concerns. USD/JPY was last seen at 152.04 levels, OCBC’s FX analysts Frances Cheung and Christopher Wong note.
Rebound risks likely in the interim
“Trump announced plan to impose 25% tariff on all steel and aluminium imports and mentioned introducing reciprocal tariffs on all nations. This may imply that Japan maybe implicated. When it comes to automobile, Japanese cars are amongst the top 5 most popular in US and Korean cars make it to the top 10 list. On agricultural products, Japan has a high tariff rate of 204.3% for rice and 23.3% for meat.”
“The risk is a direct tariff hit on Japanese goods and JPY may come under pressure in this scenario. Bearish momentum on daily chart intact while RSI is turning higher from near oversold conditions. Rebound risks likely in the interim. Resistance at 152.70/80 levels (100, 200 DMAs), 154.30 levels. Support at 151.50 (38.2% fibo retracement of Sep low to Jan high), 150 levels.”
The US Dollar (USD) starts the week a little firmer overall from Friday but well of its best overnight levels. Comments from President Trump over the weekend confirmed that reciprocal tariffs would be announced on steel and aluminum imports in the next few days. The president indicated on Friday reciprocal tariffs in some form were coming, Scotiabank’s Chief FX Strategist Shaun Osborne notes.
USD mixed on reciprocal steel and aluminum tariff news
“The CAD and MXN are a little softer in response—as both Canada and Mexico are major suppliers to the US, along with Brazil. The JPY is also underperforming on the session. The USD is trading mixed overall after failing to hold early session gains. Global stocks are higher and fixed income is steady to marginally softer. Markets have taken the latest tariff salvo pretty much in their stride after the volatility triggered by last weekend’s tariff news. Details remain limited and Australia has already announced that it will ask for an exemption.”
“Investors are perhaps cautious about what the ultimate ‘bite’ of these tariffs will be. The USD is certainly struggling to make meaningful headway and that may fuel speculation that the tariff risk premium is largely—though perhaps not yet fully—priced into FX at this point. The USD remains quite richly-priced from a broader point of view. While most attention was on the US NFP data last week, the sharp jump in U. Michigan 1Y inflation expectations from 3.3% to 4.3% caught the eye.”
“Some of that likely represents the partisan split that has emerged in survey data recently but Fed officials have singled out inflation expectations as something they would be sensitive to. The NY Fed’s inflation expectations gauge is released at 11ET. Inflation (CPI, PPI, Import Prices) data dominate the rest of the week’s economic calendar. Fed Chair Powell testifies at the Senate Banking Committee at 10ET Tuesday (and House Financial Services Committee Wednesday).”
- The US Dollar trades fairly muted after more tariff comments from US President Donald Trump
- A 25% levy on all steel and aluminum imports from all countries will be applied.
- The US Dollar Index (DXY) is going nowhere and trades around 108.00.
The US Dollar Index (DXY), which tracks the performance of the US Dollar against six major currencies, is broadly flat to a touch softer and trades around 108.00 at the time of writing on Monday after again a headline-filled weekend. United States (US) President Donald Trump announced 25% steel and aluminum tariffs for all countries importing into the US. Also, plans for reciprocal tariffs are on the table, which would increase US import duties to match those imposed by the country’s other trading partners.
Besides the tariff headlines, otherwise, it will be a very calm start of the week on the economic calendar. Traders will want to focus on Federal Reserve (Fed) Chair Jerome Powell’s semi-annual testimony at Capitol Hill on Tuesday and Wednesday. Traders will look for fresh clues about the path forward for US monetary policy, while Powell is likely to highlight the resilient economy as a key reason central bankers are in no rush to cut borrowing costs further.
Daily digest market movers: No clear projections
- Besides the headlines from US President Donald Trump on reciprocal tariffs and steel and aluminum import tariffs, no real timelines or dates were given, Bloomberg reports.
- The US Treasury is auctioning a 3-month and a 6-month bill at 16:30 GMT.
- Equities are not impressed by President Trump’s announcement of more tariffs. All major indices are trading in the green on Monday.
- The CME FedWatch tool projects a 93.5% chance that the Fed will keep interest rates unchanged at its next meeting on March 19.
- The US 10-year yield is trading around 4.49%, recovering further from its fresh yearly low of 4.40% printed last week.
US Dollar Index Technical Analysis: No interest
The US Dollar Index (DXY) is not breaking any pots this Monday and is not included in the safe-haven flight away from tariffs. Only Gold looks to be the big winner in this case. Meanwhile, US yields are a touch higher, though not enough to really fuel a stronger US Dollar, while traders are assessing what to do next with all these additional tariff announcements.
On the upside, the first barrier at 109.30 (July 14, 2022, high and rising trendline) was briefly surpassed but did not hold last week. Once that level is reclaimed, the next level to hit before advancing further remains at 110.79 (September 7, 2022, high).
On the downside, the October 3, 2023, high at 107.35 is still acting as strong support after several tests last week. In case more downside occurs, look for 106.52 (April 16, 2024, high) or even 105.98 (resistance in June 2024 and 100-day Simple Moving Average) as better support levels.
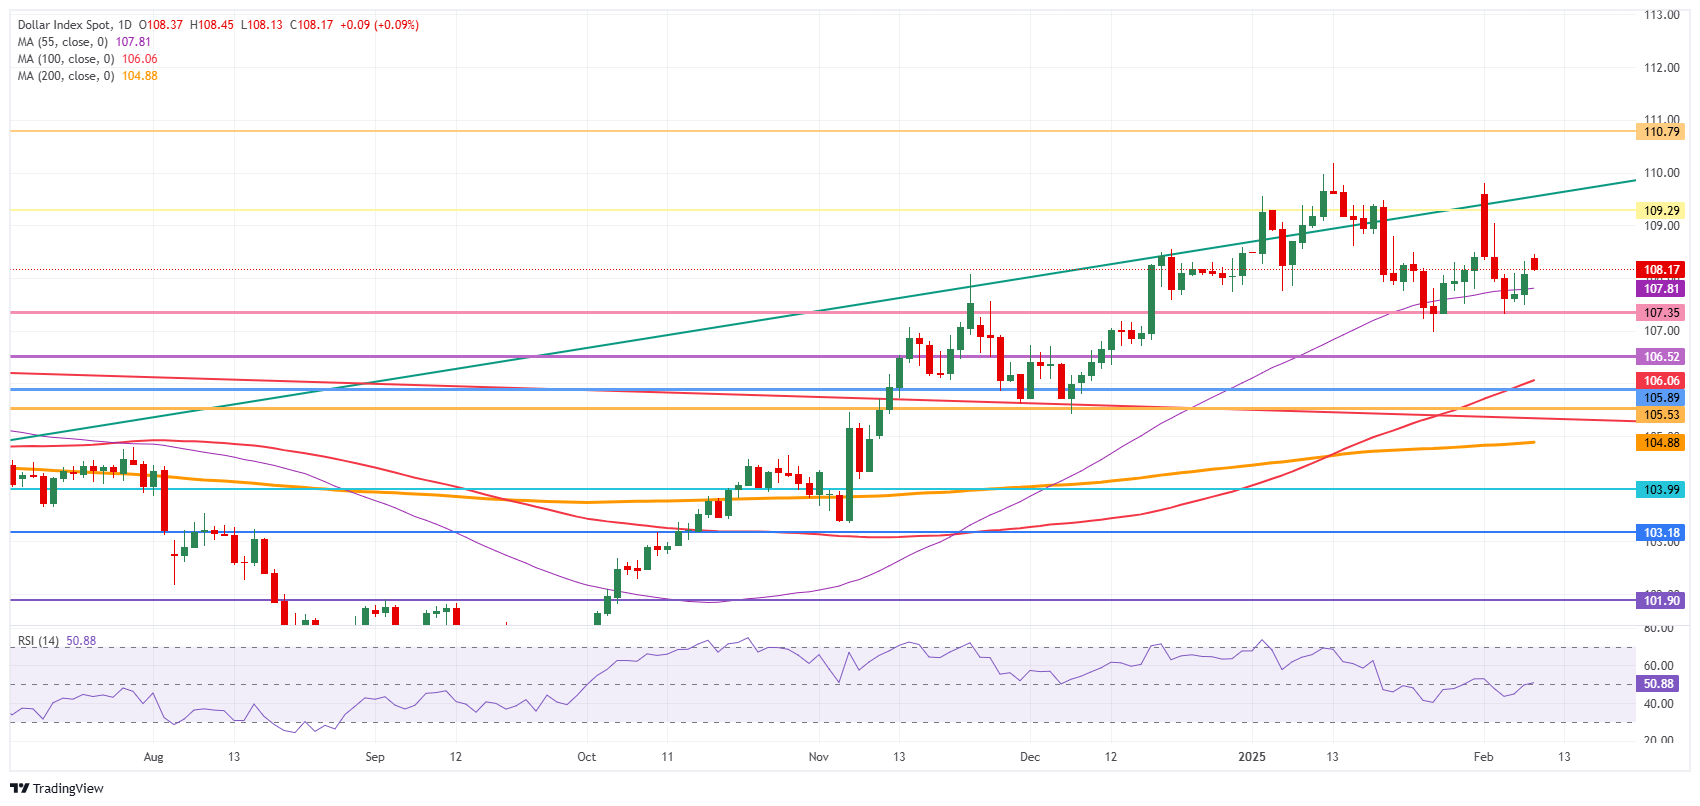
US Dollar Index: Daily Chart
US Dollar FAQs
The US Dollar (USD) is the official currency of the United States of America, and the ‘de facto’ currency of a significant number of other countries where it is found in circulation alongside local notes. It is the most heavily traded currency in the world, accounting for over 88% of all global foreign exchange turnover, or an average of $6.6 trillion in transactions per day, according to data from 2022. Following the second world war, the USD took over from the British Pound as the world’s reserve currency. For most of its history, the US Dollar was backed by Gold, until the Bretton Woods Agreement in 1971 when the Gold Standard went away.
The most important single factor impacting on the value of the US Dollar is monetary policy, which is shaped by the Federal Reserve (Fed). The Fed has two mandates: to achieve price stability (control inflation) and foster full employment. Its primary tool to achieve these two goals is by adjusting interest rates. When prices are rising too quickly and inflation is above the Fed’s 2% target, the Fed will raise rates, which helps the USD value. When inflation falls below 2% or the Unemployment Rate is too high, the Fed may lower interest rates, which weighs on the Greenback.
In extreme situations, the Federal Reserve can also print more Dollars and enact quantitative easing (QE). QE is the process by which the Fed substantially increases the flow of credit in a stuck financial system. It is a non-standard policy measure used when credit has dried up because banks will not lend to each other (out of the fear of counterparty default). It is a last resort when simply lowering interest rates is unlikely to achieve the necessary result. It was the Fed’s weapon of choice to combat the credit crunch that occurred during the Great Financial Crisis in 2008. It involves the Fed printing more Dollars and using them to buy US government bonds predominantly from financial institutions. QE usually leads to a weaker US Dollar.
Quantitative tightening (QT) is the reverse process whereby the Federal Reserve stops buying bonds from financial institutions and does not reinvest the principal from the bonds it holds maturing in new purchases. It is usually positive for the US Dollar.
US Dollar (USD) drifted higher on tariff headlines. Trump just announced plans to impose 25% tariffs on steel and aluminium imports (no mention of effective date) and last Fri, he spoke about introducing reciprocal tariffs this week. DXY was last seen at 108.12 levels, OCBC's FX analysts Frances Cheung and Christopher Wong note.
Bearish momentum on daily chart intact
"Not forgetting that China tariffs on US goods come into effect today, we cannot rule out further deterioration in US-China trade tensions. US data was mixed last Fri – labour market report was on net positive though there are signs of it softening slowly while University of Michigan sentiment fell but inflation expectations rose."
"Bearish momentum on daily chart intact while RSI continued to rise. Rebound risk not ruled out. Resistance at 108.40 (21 DMA), 110.00/20 levels (previous high). Support at 107.80 (50 DMA, 23.6% fibo retracement of Oct low to Jan high), 107 levels."
"In terms of US data/event this week, CPI (Wed), Powell’s semi-annual testimony to lawmakers (Tue, Wed), PPI (Thu), retail sales and IP (Fri) will be closely watched. Markets are pricing about cumulative 36bps of cut for this year with the next cut only fully priced in around Sep-2025 meeting. Softer US data (i.e. CPI) can lead to dovish repricing, and this can weigh on USD. But the recent headline on reciprocal tariffs suggests that risk-off trades may take precedence."
LME Auminium was steady this morning after Trump announced plans to impose 25% tariffs on all imports of Steel and Aluminium into the US. The US imports significant volumes of Aluminium and Steel from Canada, ING's commodity experts Ewa Manthey and Warren Patterson note.
US president imposes tariffs on imported Aluminium and Steel
"In 2023, net US Aluminium imports were 44% of its total consumption, with Canada the biggest supplier, accounting for 56% of imports. Meanwhile, around 30% of Steel imports into the US arrived from Canada. Only last week, Trump delayed plans to hit Canada and Mexico with general import duties of 25%."
"With Trump back in the White House, uncertainty and unpredictability are running high. Prolonged trade conflict would slow global growth and hurt demand for industrial metals. In 2018, the US president imposed a 10% duty on imported Aluminium and a 25% tariff on imported Steel to promote domestic metal production."
"The duties on Canada and Mexico were lifted a year later after a new free trade agreement between the two countries and the US."
US Dollar (USD) could edge higher but is unlikely to break above 7.3300. In the longer run, outlook remains mixed, but USD is likely to trade in a narrower range of 7.2500/7.3300, UOB Group's FX analysts Quek Ser Leang and Peter Chia note.
USD is likely to trade in a narrower range of 7.2500/7.3300
24-HOUR VIEW: "We indicated last Friday that 'momentum indicators remain neutral, and we continue to expect range trading, probably in a range of 7.2700/7.3000.' However, USD traded in a higher range between 7.2830 and 7.3111. The price action has resulted in a slight increase in upward momentum. Today, USD could edge higher, but as momentum is not strong, it is unlikely to break above 7.3300. Support is at 7.3000, followed by 7.2920."
1-3 WEEKS VIEW: "We highlighted last Friday (07 Feb, spot at 7.2865) that 'while the outlook remains mixed, the decreasing volatility over the past couple of days suggests USD could trade in a narrower range of 7.2500/7.3300.' There is no change in our view."
Gold rose to a fresh record high following Trump's new tariff announcement. Gold is already up more than 10% year-to-date, having hit a series of consecutive record highs along the way. Tariff concerns that risk higher inflation and slower economic growth are spurring demand for safe haven assets like Gold, ING's commodity experts Ewa Manthey and Warren Patterson note.
China's central bank expands its Gold reserves
"Meanwhile, China's central bank expanded its Gold reserves for a third month in January. Gold held by the People's Bank of China rose to 73.5 million troy ounces in January, from 73.3 million in the previous month. Last week, data from the World Gold Council (WGC) showed that central banks’ buying last year exceeded 1,000 tons for the third year in a row, accelerating sharply in the fourth quarter to 333 tons and bringing the net annual total to 1,045 tons."
"Gold’s rally in 2024 was driven by central bank buying, especially from China. Central banks are still buying and will probably continue to do so as geopolitical tensions and the economic climate continue to push them to increase their allocation towards safe haven assets."
"The latest positioning data from the CFTC shows that speculators increased their net longs of COMEX copper by 1,674 to 17,197 lots as of 4 February. In precious metals, managed money net longs in COMEX Gold decreased marginally by 366 lots for a second consecutive week to 230,226 lots over the last reporting week. The move was fuelled by rising gross long and gross shorts by 12,202 lots and 12,568 lots for the reporting week. In contrast, speculators increased net longs of silver by 11,052 lots to 37,370 lots (the highest since the last week of October) as of Tuesday, following an increase in gross longs by 10,178 lots to 57,040 lots."
- Silver price rallies to near $32.30 amid an increase in its safe-haven demand.
- US President Trump is poised to raise 25% tariffs on all imports of steel and aluminum.
- The safe-haven appeal of the US Dollar fades.
Silver price (XAG/USD) soars to near $32.30 in Monday’s European session. The white metal strengthens as investors turn risk-averse after United States (US) President Donald Trump threatens to raise 25% tariffs on imports of steel and aluminum and reciprocal tariffs over nations where he sees unfair trade practices.
Technically, the scenario of heightened global tensions improves the safe-haven bid of precious metals, such as Silver.
The appeal of the US Dollar (USD) also strengthened after Trump’s tariff warnings on metals, but later, it surrendered its entire gains. The US Dollar Index (DXY), which tracks the Greenback’s value against six major currencies, retreats to near 108.10 from the intraday high around 108.50 and is almost flat at press time. The Silver price has also benefitted from the retracement in the US Dollar.
President Trump’s tariff threats have renewed fears of a global trade war. However, a league of market participants still believe that Trump is using tariffs as a tool to have better negotiations against the US’s trading partners.
Going forward, investors will focus on Federal Reserve (Fed) Chair Jerome Powell’s testimony before the House of Representatives on Tuesday and Wednesday. They will look for cues about how long the Fed will keep interest rates in the current range of 4.25%- 4.500%.
Silver technical analysis
Silver price strives to break above the immediate resistance of $32.50, which is plotted from the December 9 high. The outlook of the white metal remains bullish as the 20-day Exponential Moving Average (EMA) is sloping higher near $30.90.
The 14-day Relative Strength Index (RSI) oscillates in the 60.00-80.00 range, suggesting that the momentum is bullish.
Looking down, the upward-sloping trendline from the August 8 low of $26.45 will be the key support for the Silver price around $29.50. While, the October 31 high of $33.90 will be the key barrier.
Silver daily chart
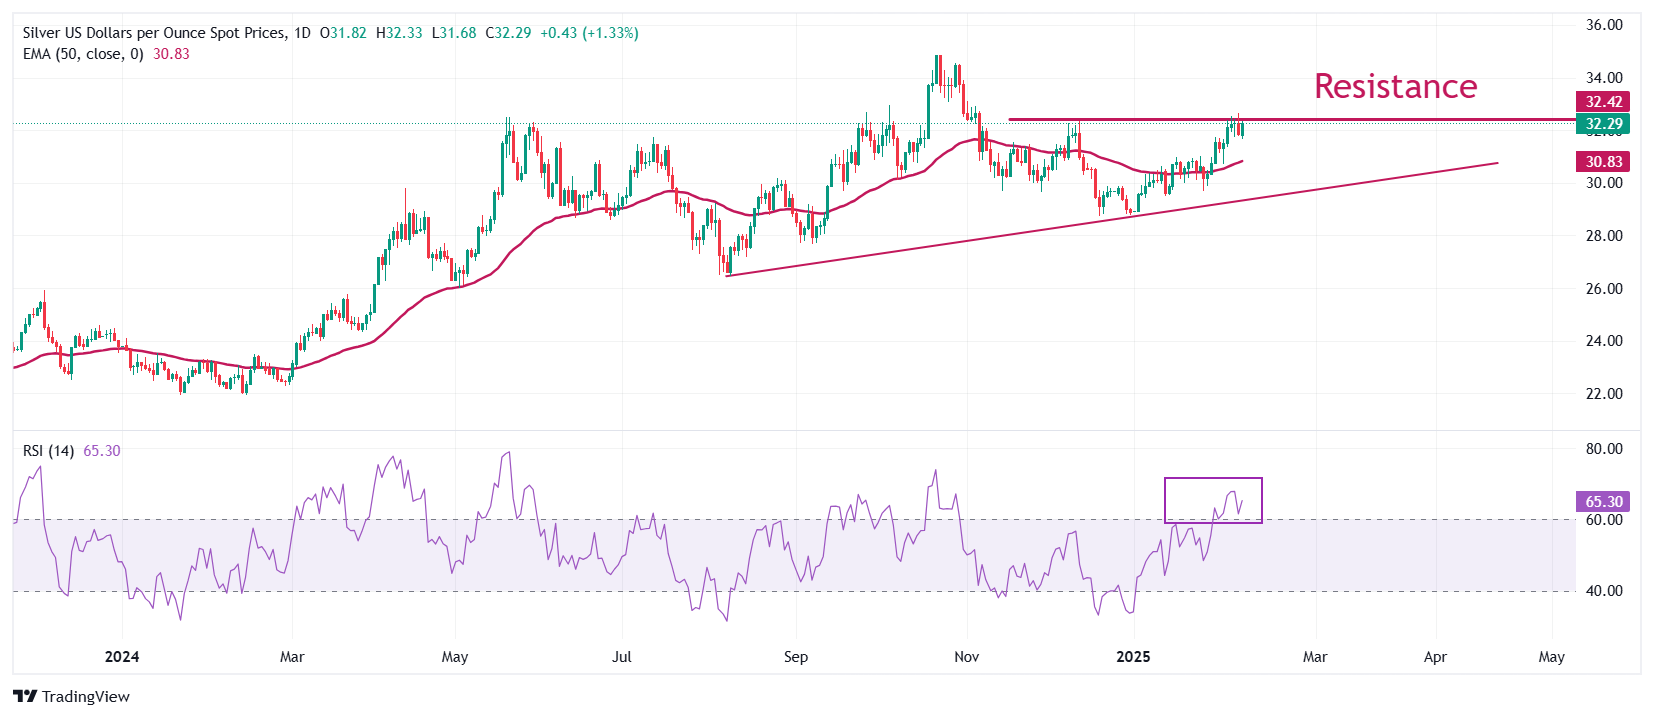
Silver FAQs
Silver is a precious metal highly traded among investors. It has been historically used as a store of value and a medium of exchange. Although less popular than Gold, traders may turn to Silver to diversify their investment portfolio, for its intrinsic value or as a potential hedge during high-inflation periods. Investors can buy physical Silver, in coins or in bars, or trade it through vehicles such as Exchange Traded Funds, which track its price on international markets.
Silver prices can move due to a wide range of factors. Geopolitical instability or fears of a deep recession can make Silver price escalate due to its safe-haven status, although to a lesser extent than Gold's. As a yieldless asset, Silver tends to rise with lower interest rates. Its moves also depend on how the US Dollar (USD) behaves as the asset is priced in dollars (XAG/USD). A strong Dollar tends to keep the price of Silver at bay, whereas a weaker Dollar is likely to propel prices up. Other factors such as investment demand, mining supply – Silver is much more abundant than Gold – and recycling rates can also affect prices.
Silver is widely used in industry, particularly in sectors such as electronics or solar energy, as it has one of the highest electric conductivity of all metals – more than Copper and Gold. A surge in demand can increase prices, while a decline tends to lower them. Dynamics in the US, Chinese and Indian economies can also contribute to price swings: for the US and particularly China, their big industrial sectors use Silver in various processes; in India, consumers’ demand for the precious metal for jewellery also plays a key role in setting prices.
Silver prices tend to follow Gold's moves. When Gold prices rise, Silver typically follows suit, as their status as safe-haven assets is similar. The Gold/Silver ratio, which shows the number of ounces of Silver needed to equal the value of one ounce of Gold, may help to determine the relative valuation between both metals. Some investors may consider a high ratio as an indicator that Silver is undervalued, or Gold is overvalued. On the contrary, a low ratio might suggest that Gold is undervalued relative to Silver.
US Dollar (USD) is likely to trade in a range, probably between 151.10 and 152.70. In the longer run, USD outlook remains negative; the level to monitor is 150.00, UOB Group's FX analysts Quek Ser Leang and Peter Chia note.
USD outlook remains negative
24-HOUR VIEW: "After USD plummeted last Thursday, we indicated on Friday that 'while further USD weakness is not ruled out, deeply oversold conditions suggest that any decline may not reach 150.60 (minor support is at 151.00).' We pointed out that 'resistance levels are at 151.80 and 152.50.' USD subsequently swung between 150.93 and 152.41, closing largely unchanged at 151.40 (-0.03%). There has been no increase in either downward or upward momentum. Today, USD is likely to trade in a range, probably between 151.10 and 152.70."
1-3 WEEKS VIEW: "Our update from last Friday (07 Feb, spot at 151.10) is still valid. As pointed, 'USD outlook remains negative, and the level to monitor is 150.00.' We will maintain our negative view as long as 153.30 (no change in ‘strong resistance’ level) is not breached."
In crude oil, prices rose in the early trading session today, with ICE Brent and NYMEX WTI moving above $75/bbl and $71/bbl respectively, ING's FX analyst Chris Turner notes.
Oil market sees a second straight session of gains
"The oil market saw a second straight session of gains as the US president announced more tariffs on Sunday. Oil prices are also receiving short-term support as the US imposed sanctions on an international network facilitating the shipment of Iranian crude to China last week."
"Meanwhile, drilling activity in the US recovered marginally over the last week. The latest rig data from Baker Hughes shows that the number of active US oil rigs increased by one over the week to 480 as of 7 February 2025. However, despite the weekly increase, the oil rig count is still down by 19 compared to this time last year. The total rig count (oil and gas combined) stood at 586 over the reporting week, up from 582 a week earlier."
"The recent positioning data shows that speculators decreased their net long in ICE Brent by 17,981 lots over the last reporting week to 289,723 lots as of last Tuesday. This was the first weekly decline reported since 31 December 2024. The move was predominantly driven by gross longs falling by 24,308 lots to 372,368 lots. For NYMEX WTI, speculators sold 51,252 lots for a second week straight over the reporting week, leaving them with a net long of 140,540 lots – the lowest since the week ending 10 December 2024."
EUR/GBP is offered again this morning as the market is dominated once more by the tariff story, ING's FX analyst Chris Turner notes.
GBP/USD to go to the lower end of the 1.2250-2500 trading range
"Here, the market expects the EU to have more to lose than the UK on tariffs. We cannot rule out another drop in EUR/GBP to the 0.8250 area should tariffs hit Europe in the early part of this week. However, tomorrow could see the focus flip back to the Bank of England easing cycle."
"Here, former arch-hawk – potentially now arch-dove – Catherine Mann delivers a speech on the UK outlook. Understanding why she voted for a 50bp rate cut last week could shed light on whether others will want to follow suit. A soft fourth quarter UK GDP figure out on Thursday could also add to a dovish narrative."
"GBP/USD should be the focus for any sterling downside, however. We favour GBP/USD heading down towards the lower end of a 1.2250-2500 trading range."
New Zealand Dollar (NZD) is expected to trade in a range between 0.5625 and 0.5680. In the longer run, there has been a tentative buildup in momentum; NZD could rise gradually to 0.5725, UOB Group's FX analysts Quek Ser Leang and Peter Chia note.
NZD can rise gradually to 0.5725
24-HOUR VIEW: "We highlighted last Friday that 'upward momentum has not increased much, but there is a chance for NZD to edge higher.' However, we pointed out that it 'is unlikely to be able to break above 0.5705.' Our expectations did not materialise as NZD traded between 0.5643 and 0.5694, closing lower by 0.34% at 0.5656. The current price movements are likely part of a range trading phase. Today, we expect NZD to trade between 0.5625 and 0.5680."
1-3 WEEKS VIEW: "We continue to hold the same view as last Thursday (06 Feb, spot at 0.5685), wherein 'there has been a tentative buildup in momentum, and NZD could rise gradually to 0.5725.' On the downside, if NZD breaks below 0.5615 (no change in ‘strong support’ level), it would mean that it is likely to trade in a range instead of edging higher."
Friday's relatively strong US job report numbers and the broadening of US tariffs are keeping the dollar supported. On the former, the jobs report has seen expectations of Federal Reserve easing this year pared back to just 35bp. Those Fed easing expectations could narrow even further this week. Another 0.3% core month-on-month CPI reading on Wednesday will not help the disinflation story and we'll also get to hear from Fed Chair Jerome Powell in his semi-annual monetary policy testimony to Congress on Tuesday and Wednesday. It is hard to see why Powell would want to push a more dovish narrative right now, ING's FX analyst Chris Turner notes.
DXY to edge towards the top of a 108-109 trading range
"When it comes to tariffs, it's hard to keep up with developments. We've had the threat of tariffs against Canada and Mexico seemingly for the strategic domestic agenda of fentanyl and immigration. Tariffs against China have already gone into place. Over the weekend a new set of 25% tariffs were announced on steel and aluminium tariffs. In the frame here again are Canada, Mexico, and China plus Brazil, South Korea and Germany too. These tariffs could be seen to fall under the category of protecting critical industries."
"But it also seems that, over the next couple of days, we might see the imposition of 'reciprocal' tariffs – i.e., trying to level the playing field on trade. We had thought that these might come in during the second quarter after the Commerce Department delivers its report on why the US runs perennial trade deficits. If these reciprocal tariffs come in this week against those countries who have a higher tariff rate than the US, then it may be countries like Brazil, India and Korea who are most exposed. That said, reports have also suggested that reciprocal tariffs could impact everyone, and the auto sector has been highlighted as well."
"Needless to say, much uncertainty about the nature, timing and magnitude of these tariffs looks likely to keep the dollar supported this week. The main threat to long dollar positions could be a re-assessment of European prospects should any expectations of a Russia-Ukraine ceasefire grow later this week. However, for the time being, we doubt investors will want to let go of overweight positions in the dollar and we can see DXY edging towards the top of a 108-109 trading range through the early part of this week."
- AUD/USD recovers sharply to near 0.6280 as investors digest US Trump’s tariff threats quickly.
- Hot China’s CPI report has also boosted demand for the Australian Dollar.
- This week, investors will focus on the US CPI and the Fed Powell’s testimony before Congress.
The AUD/USD bounces back strongly to near 0.6280 and turns positive after a weak opening near 0.6235 in Monday’s European session. The Aussie pair attracts significant bids as investors shrug off fears associated with United States (US) President Donald Trump’s tariff threats.
Over the weekend, President Trump threatened to raise 25% tariffs on imports of steel and aluminum from all nations and reciprocal tariffs on nations where he sees unfair trade practices. The impact of Trump’s international agenda was visible on the market sentiment as investors rushed to the safe-haven fleet. The US Dollar Index (DXY), which gauges the Greenback’s value against six major currencies, had a strong opening to near 108.50 but later on, gives up the majority of intraday gains and drops to near 108.20.
Market participants have started anticipating that Trump’s tariff threats are more a negotiation tool to gain an upper hand for closing better deals.
Another reason behind strength in the Australian Dollar (AUD) is faster-than-expected acceleration in the China Consumer Price Index (CPI) data for January. Year-on-year CPI rose by 0.5%, faster than expectations of 0.4% and the former reading of 0.1%. On month, the CPI grew by 0.7% after remaining flat in December but was slower than estimates of 0.8%.
The Australian Dollar (AUD) is a liquid proxy to Chinese Yuan (CNY), being Australia a major trading partner of China.
This week, the major trigger for the US Dollar (USD) will be the Federal Reserve (Fed) Chair Jerome Powell’s testimony before Congress on Tuesday-Wednesday and the US CPI data on Wednesday.
Australian Dollar FAQs
One of the most significant factors for the Australian Dollar (AUD) is the level of interest rates set by the Reserve Bank of Australia (RBA). Because Australia is a resource-rich country another key driver is the price of its biggest export, Iron Ore. The health of the Chinese economy, its largest trading partner, is a factor, as well as inflation in Australia, its growth rate and Trade Balance. Market sentiment – whether investors are taking on more risky assets (risk-on) or seeking safe-havens (risk-off) – is also a factor, with risk-on positive for AUD.
The Reserve Bank of Australia (RBA) influences the Australian Dollar (AUD) by setting the level of interest rates that Australian banks can lend to each other. This influences the level of interest rates in the economy as a whole. The main goal of the RBA is to maintain a stable inflation rate of 2-3% by adjusting interest rates up or down. Relatively high interest rates compared to other major central banks support the AUD, and the opposite for relatively low. The RBA can also use quantitative easing and tightening to influence credit conditions, with the former AUD-negative and the latter AUD-positive.
China is Australia’s largest trading partner so the health of the Chinese economy is a major influence on the value of the Australian Dollar (AUD). When the Chinese economy is doing well it purchases more raw materials, goods and services from Australia, lifting demand for the AUD, and pushing up its value. The opposite is the case when the Chinese economy is not growing as fast as expected. Positive or negative surprises in Chinese growth data, therefore, often have a direct impact on the Australian Dollar and its pairs.
Iron Ore is Australia’s largest export, accounting for $118 billion a year according to data from 2021, with China as its primary destination. The price of Iron Ore, therefore, can be a driver of the Australian Dollar. Generally, if the price of Iron Ore rises, AUD also goes up, as aggregate demand for the currency increases. The opposite is the case if the price of Iron Ore falls. Higher Iron Ore prices also tend to result in a greater likelihood of a positive Trade Balance for Australia, which is also positive of the AUD.
The Trade Balance, which is the difference between what a country earns from its exports versus what it pays for its imports, is another factor that can influence the value of the Australian Dollar. If Australia produces highly sought after exports, then its currency will gain in value purely from the surplus demand created from foreign buyers seeking to purchase its exports versus what it spends to purchase imports. Therefore, a positive net Trade Balance strengthens the AUD, with the opposite effect if the Trade Balance is negative.
Slight increase in momentum suggests downward bias in Australian Dollar (AUD), but it is not expected to breach 0.6200. In the longer run, if AUD closes above 0.6310, it could trigger an advance to 0.6355, UOB Group's FX analysts Quek Ser Leang and Peter Chia note.
Slight increase in momentum suggests downward bias
24-HOUR VIEW: "When AUD was at 0.6285 last Friday, we pointed that it 'is facing mild upward pressure, and it could test 0.6310.' However, AUD rose less than expected to 0.6303 before easing. AUD closed at 0.6277 (-0.11%) and traded on a soft note after opening today. The slight increase in downward momentum suggests downward bias in AUD today, but we do not expect a breach of the strong support at 0.6200. Resistance is at 0.6275, followed by 0.6300."
1-3 WEEKS VIEW: "Last Thursday (06 Feb, spot at 0.6280), we noted that 'upward momentum is beginning to build, and if AUD closes above 0.6310, it could trigger an advance to 0.6355.' AUD rose to 0.6303 on Friday before easing. There has been no further increase in upward momentum, but only a breach of 0.6200 (no change in ‘strong support’ level) would indicate the likelihood of AUD breaking clearly above 0.6310 has faded."
European natural gas prices rose to a two-year high amid colder temperatures and tightnening storage facilities, ING's commodity experts Ewa Manthey and Warren Patterson note.
Gas stockpiles are already at their lowest
"Prices rose more 4% this morning, hitting the highest level seen since February 2023. Stockpiles are already at their lowest for this time of year since the energy crisis in 2022. Inventories are only 49% full compared with 67% at the same time last year."
The Pound Sterling (GBP) could weaken; any decline is not expected to reach the major support at 1.2310. For the time being, GBP is likely to trade in a 1.2310/1.2550 range, UOB Group's FX analysts Quek Ser Leang and Peter Chia note.
GBP is not expected to reach the major support at 1.2310
24-HOUR VIEW: "We indicated last Friday that the outlook for GBP 'is mixed'. We were of the view that it could trade in a choppy manner, likely between 1.2390 and 1.2500.' In NY trade, GBP popped to a high of 1.2490 and then plummeted to 1.2377. There has been a tentative buildup in momentum, but while GBP could weaken today, any decline is not expected to reach the major support at 1.2310 (minor support is at 1.2350). Resistance is at 1.2435; a breach of 1.2465 would indicate that GBP is not weakening further."
1-3 WEEKS VIEW: "Last Friday (09 Feb, spot at 1.2440), we indicated that 'for the time being, GBP is likely to trade in a 1.2310/1.2550 range.' There is no change in our view."
The repricing of the Fed cycle after the strong US jobs data has seen EUR:USD two-year swap rate differentials widen back out beyond 190bp. We expect those differentials to stay near 200bp for most of the year and to keep EUR/USD under pressure. Equally, Friday's release of the European Central Bank's staff paper into the neutral interest rate had little impact on the pricing of the ECB cycle, ING's FX analyst Chris Turner notes.
A move back to 1.0225 is possible
"The threat of tariffs coming to Europe this week has seen EUR/USD drop close to 1.03 again. A move back to 1.0225 is possible if the 'reciprocal' tariffs claw in the EU or some of the major European countries. And Wednesday's US CPI release is another negative event risk for EUR/USD."
"If it can survive the tariff risk and the CPI, the run-up into Friday could look a little better for EUR/USD as investors turn their attention to the Munich security conference. Here we are expecting to hear more about the US proposed ceasefire deal in the Russia-Ukraine conflict. A surprise deal would certainly be a positive for the European currency complex."
- The Pound Sterling recovers above 1.2400 against the US Dollar even though investors are cautious about US President Trump’s threat to raise tariffs on metals.
- BoE’s Pill sees strong wage growth as a major reason behind cautious interest rate guidance.
- Investors await BoE Bailey’s speech on Tuesday and Fed Powell’s testimony on Tuesday and Wednesday.
The Pound Sterling (GBP) ticks higher to near 1.2415 against the US Dollar (USD) in Monday’s European session. The GBP/USD pair is marginally higher even though the US Dollar Index (DXY), which tracks the Greenback’s value against six major currencies, is up almost 0.2%, which indicates significant strength in the Pound Sterling.
The DXY Index gains as investors turn cautious about renewed global trade war tensions. US President Donald Trump threatened to raise 25% tariffs on steel and aluminum imports and impose reciprocal tariffs on nations he saw as engaging in unfair trade practices.
Market experts believe that the impact of a global trade war will be inflationary for the US economy. Such a scenario would be favorable for the US Dollar, as Federal Reserve (Fed) policymakers would be forced to hold interest rates at their current levels for longer. According to the CME FedWatch tool, the Fed is expected to keep interest rates steady in the policy meetings in March and May, and the likelihood of a 25 basis point (bps) interest rate reduction in the June meeting is 50%.
Going forward, investors will focus on Fed Chair Jerome Powell’s testimony before the Congress on Tuesday and Wednesday. Investors would like to know the impact of Trump’s tariffs on the economy and the monetary policy outlook.
On the economic data front, the Consumer Price Index (CPI) data for January is scheduled to be released on Wednesday.
Daily digest market movers: Pound Sterling gains against all its major peers
- The Pound Sterling outperforms its major peers at the start of the week as investors start digesting the Bank of England’s (BoE) dovish tone on the interest rate outlook and downwardly revised Gross Domestic Product (GDP) forecasts for the year.
- BoE Governor Andrew Bailey guided a “gradual and cautious” outlook for the monetary policy in the press conference after the central bank decided to cut interest rates by 25 bps to 4.5% last week. Bailey’s cautious stance on the interest rate outlook was based on expectations that United Kingdom (UK) inflationary pressures could accelerate to 3.7% in the third quarter due to higher energy prices before returning to the 2% path.
- However, investors took Monetary Policy Committee (MPC) member Catherine Mann’s vote for a 50-basis interest rate reduction, who has been an outspoken hawk, as an ultra-dovish stance on the policy outlook. Market participants expect Mann’s call for a bigger interest rate cut was based on her concerns over the economic outlook. The BoE halved its GDP Growth forecasts to 0.75% for the year.
- On Friday, comments from BoE Chief Economist Huw Pill indicated that strong wage growth is the major reason behind the cautious interest rate stance. "I think strong wage growth is a reason for caution, for carefulness in the way we proceed with removing monetary policy restriction and cutting bank rate,” Pill said.
- In the three months ending November, Average Earnings excluded bonuses accelerated to 5.6%, the highest figure seen since June 2024.
- Going forward, the next trigger for the British currency will be influenced by Andrew Bailey’s speech at the University of Chicago Booth School of Business in London on Tuesday.
Technical Analysis: Pound Sterling rises above 1.2400

The Pound Sterling moves higher above 1.2400 against the US Dollar on Monday. However, the outlook for the GBP/USD pair remains weak as the 50-day Exponential Moving Average (EMA) continues to as resistance around 1.2500.
The 14-day Relative Strength Index (RSI) oscillates inside the 40.00-60.00 range, suggesting a sideways trend.
Looking down, the January 13 low of 1.2100 and the October 2023 low of 1.2050 will act as key support zones for the pair. On the upside, the December 30 high of 1.2607 will act as key resistance.
Pound Sterling FAQs
The Pound Sterling (GBP) is the oldest currency in the world (886 AD) and the official currency of the United Kingdom. It is the fourth most traded unit for foreign exchange (FX) in the world, accounting for 12% of all transactions, averaging $630 billion a day, according to 2022 data. Its key trading pairs are GBP/USD, also known as ‘Cable’, which accounts for 11% of FX, GBP/JPY, or the ‘Dragon’ as it is known by traders (3%), and EUR/GBP (2%). The Pound Sterling is issued by the Bank of England (BoE).
The single most important factor influencing the value of the Pound Sterling is monetary policy decided by the Bank of England. The BoE bases its decisions on whether it has achieved its primary goal of “price stability” – a steady inflation rate of around 2%. Its primary tool for achieving this is the adjustment of interest rates. When inflation is too high, the BoE will try to rein it in by raising interest rates, making it more expensive for people and businesses to access credit. This is generally positive for GBP, as higher interest rates make the UK a more attractive place for global investors to park their money. When inflation falls too low it is a sign economic growth is slowing. In this scenario, the BoE will consider lowering interest rates to cheapen credit so businesses will borrow more to invest in growth-generating projects.
Data releases gauge the health of the economy and can impact the value of the Pound Sterling. Indicators such as GDP, Manufacturing and Services PMIs, and employment can all influence the direction of the GBP. A strong economy is good for Sterling. Not only does it attract more foreign investment but it may encourage the BoE to put up interest rates, which will directly strengthen GBP. Otherwise, if economic data is weak, the Pound Sterling is likely to fall.
Another significant data release for the Pound Sterling is the Trade Balance. This indicator measures the difference between what a country earns from its exports and what it spends on imports over a given period. If a country produces highly sought-after exports, its currency will benefit purely from the extra demand created from foreign buyers seeking to purchase these goods. Therefore, a positive net Trade Balance strengthens a currency and vice versa for a negative balance.
Euro (EUR) continued to trade under pressure on tariff concerns – be it universal tariffs, reciprocal tariffs or tariffs on European autos. EUR was last at 1.0325 levels, OCBC’s FX analysts Frances Cheung and Christopher Wong note.
Bullish momentum on daily chart fades
“Last week, Trump told the BBC that tariffs on EU goods imported into the US could happen ‘pretty soon’, although he would not give a timeline. He added that ‘They don't take our cars, they don't take our farm products, they take almost nothing and we take everything from them.”
“Millions of cars, tremendous amounts of food and farm products’. Over the weekend, there were reports that EU is considering to lower import tariff on American cars closer to the US rate of 2.5%, from current 10%. That said, the uncertainty on tariffs may still weigh on EUR for now.”
“Bullish momentum on daily chart faded while RSI fell. Risks to the downside. Support at 1.0240, 1.0140/80 levels (recent low). Resistance at 1.0360 (21 DMA), 1.0410 (50 DMA).”
Scope for EUR to weaken further; any decline is unlikely to reach the major support at 1.0250. In the longer run, outlook is unclear; EUR could trade in a broad range of 1.0250/1.0490 for the time being, UOB Group’s FX analysts Quek Ser Leang and Peter Chia note.
EUR is unlikely to reach the major support at 1.0250
24-HOUR VIEW: “We expected EUR to trade in a 1.0355/1.0415 range last Friday. Our expectation was incorrect, as EUR fell, reaching a low of 1.0304. Downward momentum has increased, albeit not much. There is scope for EUR to weaken further today, but any decline is unlikely to reach the major support at 1.0250 (there is another support level at 1.0275). Resistance levels are at 1.0335 and 1.0365.”
1-3 WEEKS VIEW: “Our view from last Wednesday (05 Feb, spot at 1.0375) still stands. As highlighted, ‘the outlook is unclear for now, and EUR could trade in a broad range of 1.0250/1.0490 for the time being’.”
- Gold pops over 1% on Monday after more tariff headlines over the weekend.
- Traders pile into the precious metal as the single safe haven to withstand tit-for-tat tariff war.
- At this pace, Gold could be on its way to hit $3,000 quite quickly.
Gold’s price (XAU/USD) pops higher and prints a fresh all-time high above $2,900 at the time of writing on Monday. The move comes after United States (US) President Donald Trump said he would announce "reciprocal tariffs" on many countries on Tuesday or Wednesday, adding to increasing uncertainty in global financial markets. On Sunday, US President Trump said a 25% levy would apply for all steel and aluminum imports into the US, but did not say when they would be applied.
Meanwhile, traders will focus on Federal Reserve (Fed) Chair Jerome Powell’s semi-annual testimony to lawmakers on Tuesday and Wednesday for fresh clues about the path forward for US monetary policy. Powell is likely to highlight the resilient economy as a key reason central bankers are in no rush to cut borrowing costs further. This is a tail risk for Gold as, in theory, it would be a bearish element for bullion.
Daily digest market movers: Too expensive
- Several sources are reporting concerns in China about the current price of Gold. Several Chinese market participants are apparently halting their Gold buying programs for now because prices in the precious metal are too elevated, Bloomberg reports.
- President Trump also flagged plans for reciprocal tariffs, which would increase US import duties to match those imposed by the country’s other trading partners.
- The CME FedWatch tool shows a 93.5% chance that interest rates will remain unchanged in March, compared to a slim 6.5% chance of a 25 basis point (bos) rate cut.
Technical Analysis: Gold stretching higher on Monday
It's a new week, and the Gold price is already rallying over 1% and printing a fresh all-time high in early trading. Risks with the headline from President Trump are that they will start to be priced in by the time the US session gets underway. The path is quite straightforward, with $3,000 nearing quickly, though quick profit-taking could be just around the corner.
The Pivot Point level on Monday is the first nearby support at $2,866, followed by the S1 support at $2,846. From there, S2 support should come in at $2,832. In case of a correction, the bigger $2,790 level (October 31, 2024, high) should be able to catch any falling knives.
On the upside, the R1 resistance comes in at $2,881, which was already broken earlier this Monday. In case the rally follows through in the European and US sessions, the $2,900 level, which is the confluence of a big figure and the R2 resistance, will be tested for a break to the upside.

XAU/USD: Daily Chart
- Eurozone investors’ morale improves in February.
- EUR/USD stays better bid above 1.0300 after the Eurozone data.
The Eurozone Sentix Investor Confidence Index improved to -12.7 in February following January’s -17.7, the latest survey showed on Monday.
The Current Situation gauge for the bloc rebounded to -25.5 in February from -29.5 in January.
Sentix said, “Germany's recessionary economy is hanging like a lead weight on the Eurozone.”
"It is precisely from here that there is now hope for improvement," it added.
Market reaction to the Eurozone Sentix data
EUR/USD holds its bounce above 1.0300 after the Eurozone data. As of writing, EUR/USD is trading 0.04% higher on the day at around 1.0330.
Silver prices (XAG/USD) rose on Monday, according to FXStreet data. Silver trades at $32.26 per troy ounce, up 1.25% from the $31.87 it cost on Friday.
Silver prices have increased by 11.66% since the beginning of the year.
| Unit measure | Silver Price Today in USD |
|---|---|
| Troy Ounce | 32.26 |
| 1 Gram | 1.04 |
The Gold/Silver ratio, which shows the number of ounces of Silver needed to equal the value of one ounce of Gold, stood at 89.88 on Monday, up from 89.78 on Friday.
Silver FAQs
Silver is a precious metal highly traded among investors. It has been historically used as a store of value and a medium of exchange. Although less popular than Gold, traders may turn to Silver to diversify their investment portfolio, for its intrinsic value or as a potential hedge during high-inflation periods. Investors can buy physical Silver, in coins or in bars, or trade it through vehicles such as Exchange Traded Funds, which track its price on international markets.
Silver prices can move due to a wide range of factors. Geopolitical instability or fears of a deep recession can make Silver price escalate due to its safe-haven status, although to a lesser extent than Gold's. As a yieldless asset, Silver tends to rise with lower interest rates. Its moves also depend on how the US Dollar (USD) behaves as the asset is priced in dollars (XAG/USD). A strong Dollar tends to keep the price of Silver at bay, whereas a weaker Dollar is likely to propel prices up. Other factors such as investment demand, mining supply – Silver is much more abundant than Gold – and recycling rates can also affect prices.
Silver is widely used in industry, particularly in sectors such as electronics or solar energy, as it has one of the highest electric conductivity of all metals – more than Copper and Gold. A surge in demand can increase prices, while a decline tends to lower them. Dynamics in the US, Chinese and Indian economies can also contribute to price swings: for the US and particularly China, their big industrial sectors use Silver in various processes; in India, consumers’ demand for the precious metal for jewellery also plays a key role in setting prices.
Silver prices tend to follow Gold's moves. When Gold prices rise, Silver typically follows suit, as their status as safe-haven assets is similar. The Gold/Silver ratio, which shows the number of ounces of Silver needed to equal the value of one ounce of Gold, may help to determine the relative valuation between both metals. Some investors may consider a high ratio as an indicator that Silver is undervalued, or Gold is overvalued. On the contrary, a low ratio might suggest that Gold is undervalued relative to Silver.
(An automation tool was used in creating this post.)
- GBP/JPY rebounds after retesting a multi-month low at the start of a new week.
- The strong recovery is sponsored by the emergence of selling around the JPY.
- The divergent BoJ-BoE expectations might cap any further gains for the cross.
The GBP/JPY cross stages a goodish intraday recovery from the 187.00 neighborhood, or its lowest level since September 2024 retested earlier this Monday and builds on its ascent through the first half of the European session. Spot prices advance to the 189.00 mark in the last hour and for now, seem to have snapped a three-day losing streak.
US President Donald Trump's fresh tariff threats revive fears that Japan would also be an eventual target of new US levies, which, in turn, undermines the Japanese Yen (JPY) and prompts some short-covering around the GBP/JPY cross. However, hawkish Bank of Japan (BoJ) expectations and concerns about a global trade war hold back bearish traders from placing aggressive bets around the safe-haven JPY.
Kazuhiro Masaki, Director General of the BoJ's monetary affairs department, said last Thursday that the central bank will continue to raise interest rates if underlying inflation accelerates toward its 2% target as projected. This comes on top of data showing that Japan’s inflation-adjusted real wages rose for the second straight month and backs the case for further tightening by the Japanese central bank.
This marks a big divergent in comparison to the Bank of England's (BoE) gloomy outlook, which, in turn, should contribute to capping the GBP/JPY cross. The UK central bank lowered its benchmark interest rate by 25 basis points last week and downgraded the growth forecast for 2025. Moreover, BoE Governor Andrew Bailey said that the central bank expects to make further rate cuts this year.
In the absence of any relevant economic data, the aforementioned fundamental backdrop makes it prudent to wait for strong follow-through buying before confirming that the GBP/JPY cross has bottomed out in the near term. Traders now look forward to BoE Governor Andrew Bailey's speech on Tuesday, which will play a key role in influencing the British Pound (GBP) and provide a fresh impetus.
Pound Sterling FAQs
The Pound Sterling (GBP) is the oldest currency in the world (886 AD) and the official currency of the United Kingdom. It is the fourth most traded unit for foreign exchange (FX) in the world, accounting for 12% of all transactions, averaging $630 billion a day, according to 2022 data. Its key trading pairs are GBP/USD, also known as ‘Cable’, which accounts for 11% of FX, GBP/JPY, or the ‘Dragon’ as it is known by traders (3%), and EUR/GBP (2%). The Pound Sterling is issued by the Bank of England (BoE).
The single most important factor influencing the value of the Pound Sterling is monetary policy decided by the Bank of England. The BoE bases its decisions on whether it has achieved its primary goal of “price stability” – a steady inflation rate of around 2%. Its primary tool for achieving this is the adjustment of interest rates. When inflation is too high, the BoE will try to rein it in by raising interest rates, making it more expensive for people and businesses to access credit. This is generally positive for GBP, as higher interest rates make the UK a more attractive place for global investors to park their money. When inflation falls too low it is a sign economic growth is slowing. In this scenario, the BoE will consider lowering interest rates to cheapen credit so businesses will borrow more to invest in growth-generating projects.
Data releases gauge the health of the economy and can impact the value of the Pound Sterling. Indicators such as GDP, Manufacturing and Services PMIs, and employment can all influence the direction of the GBP. A strong economy is good for Sterling. Not only does it attract more foreign investment but it may encourage the BoE to put up interest rates, which will directly strengthen GBP. Otherwise, if economic data is weak, the Pound Sterling is likely to fall.
Another significant data release for the Pound Sterling is the Trade Balance. This indicator measures the difference between what a country earns from its exports and what it spends on imports over a given period. If a country produces highly sought-after exports, its currency will benefit purely from the extra demand created from foreign buyers seeking to purchase these goods. Therefore, a positive net Trade Balance strengthens a currency and vice versa for a negative balance.
- AUD/JPY appreciates due to rising concerns that Japan may face Trump's trade tariffs.
- The Japanese Yen may regain ground amid the increased likelihood of the BoJ rate hikes again this year.
- The AUD may face challenges as China's retaliatory tariffs on certain US exports have come into effect.
The AUD/JPY cross halts its three-day losing streak, trading around 95.50 during European hours on Monday. This upward movement could be linked to concerns that Japan might become a target for US President Donald Trump's trade tariffs.
On Sunday, President Trump announced, while speaking to reporters on Air Force One, his plan to impose a 25% tariff on all steel and aluminum imports, without specifying which countries would be affected. He also mentioned that additional reciprocal tariffs would be imposed by midweek and quickly implemented, reflecting the tariff rates of each country, according to Reuters.
On Friday, during a press conference with Japanese Prime Minister Shigeru Ishiba, President Trump reaffirmed his commitment to addressing the US trade deficit with Japan, which is around $65 billion annually. He also highlighted Japan's pledge to double its defense spending by 2027 compared to his first term. Additionally, Japan is set to begin importing new shipments of American liquefied natural gas.
However, the positive movement of the AUD/JPY pair may face limitations as the Japanese Yen (JPY) could strengthen amid growing expectations that the Bank of Japan (BoJ) might raise interest rates again this year. An increase in Japanese government bond (JGB) yields could further support the lower-yielding JPY.
Moreover, downside risks for the AUD/JPY pair might arise from potential challenges faced by the Australian Dollar (AUD), given Australia's close economic ties with China, amid escalating concerns over the US-China trade war. A new US levy on Chinese imports took effect last week, while China's retaliatory tariffs on certain US exports started this Monday.
Market participants are increasingly confident that the Reserve Bank of Australia (RBA) will cut its 4.35% cash rate at its upcoming meeting later in February, with a 95% probability of a reduction to 4.10%. This expectation follows data indicating that underlying inflation has moderated faster than the RBA had anticipated, leading several major Australian banks to move their forecast for the first rate cut from May to February.
Tariffs FAQs
Tariffs are customs duties levied on certain merchandise imports or a category of products. Tariffs are designed to help local producers and manufacturers be more competitive in the market by providing a price advantage over similar goods that can be imported. Tariffs are widely used as tools of protectionism, along with trade barriers and import quotas.
Although tariffs and taxes both generate government revenue to fund public goods and services, they have several distinctions. Tariffs are prepaid at the port of entry, while taxes are paid at the time of purchase. Taxes are imposed on individual taxpayers and businesses, while tariffs are paid by importers.
There are two schools of thought among economists regarding the usage of tariffs. While some argue that tariffs are necessary to protect domestic industries and address trade imbalances, others see them as a harmful tool that could potentially drive prices higher over the long term and lead to a damaging trade war by encouraging tit-for-tat tariffs.
During the run-up to the presidential election in November 2024, Donald Trump made it clear that he intends to use tariffs to support the US economy and American producers. In 2024, Mexico, China and Canada accounted for 42% of total US imports. In this period, Mexico stood out as the top exporter with $466.6 billion, according to the US Census Bureau. Hence, Trump wants to focus on these three nations when imposing tariffs. He also plans to use the revenue generated through tariffs to lower personal income taxes.
European Central Bank (ECB) Vice President Luis de Guindos said on Monday, “it is very important to avoid a trade war.”
Additional quotes
We need a prudent and intelligent approach regarding latest tariffs announcement.
Need to keep a clear head
Our analysis on tariffs is that it leads to impact on supply.
The impact on inflation is less clear.
Have to take into account all factors on monetary policy.
Market reaction
These comments fail to move a needle around the Euro, with EUR/USD down 0.08% on the day to trade near 1.0320.
- USD/CAD tests the primary barrier at the nine-day EMA of 1.4362.
- The market sentiment remains neutral as the pair consolidates within a rectangular pattern.
- The psychological level of 1.4300 appears as the initial support.
The USD/CAD pair ends its four-day losing streak, trading around 1.4350 during Monday's European session. The daily chart's technical analysis suggests uncertainty among buyers and sellers regarding the asset's long-term direction as the pair consolidates within a rectangular pattern.
However, the USD/CAD pair remains below the nine- and 14-day Exponential Moving Averages (EMAs), underscoring bearish sentiment and indicating weak short-term price action. This positioning reflects ongoing selling interest and suggests further downside risks.
Additionally, the 14-day Relative Strength Index (RSI) remains below the 50 mark, indicating continued negative momentum and reinforcing the bearish outlook.
On the downside, immediate support appears at the psychological level of 1.4300, followed by the rectangle's lower threshold at 1.4280. A break below this support zone could strengthen the bearish bias and exert downward pressure on the USD/CAD pair, potentially pushing it toward the psychological level of 1.4200.
The USD/CAD pair encounters initial resistance at the nine-day EMA of 1.4362, followed by the 14-day EMA at 1.4373. A break above these levels could enhance short-term price momentum and support the pair in testing the rectangle's upper threshold at 1.4520.
USD/CAD: Daily Chart

Canadian Dollar PRICE Today
The table below shows the percentage change of Canadian Dollar (CAD) against listed major currencies today. Canadian Dollar was the weakest against the British Pound.
| USD | EUR | GBP | JPY | CAD | AUD | NZD | CHF | |
|---|---|---|---|---|---|---|---|---|
| USD | 0.16% | -0.04% | 0.58% | 0.36% | 0.04% | 0.14% | 0.17% | |
| EUR | -0.16% | -0.13% | 0.55% | 0.32% | -0.12% | 0.07% | 0.09% | |
| GBP | 0.04% | 0.13% | 0.51% | 0.42% | 0.01% | 0.21% | 0.22% | |
| JPY | -0.58% | -0.55% | -0.51% | -0.27% | -0.48% | -0.44% | -0.41% | |
| CAD | -0.36% | -0.32% | -0.42% | 0.27% | -0.29% | -0.24% | -0.23% | |
| AUD | -0.04% | 0.12% | -0.01% | 0.48% | 0.29% | 0.19% | 0.21% | |
| NZD | -0.14% | -0.07% | -0.21% | 0.44% | 0.24% | -0.19% | 0.00% | |
| CHF | -0.17% | -0.09% | -0.22% | 0.41% | 0.23% | -0.21% | -0.01% |
The heat map shows percentage changes of major currencies against each other. The base currency is picked from the left column, while the quote currency is picked from the top row. For example, if you pick the Canadian Dollar from the left column and move along the horizontal line to the US Dollar, the percentage change displayed in the box will represent CAD (base)/USD (quote).
- EUR/USD recovers intraday losses and rebounds above 1.0300, but renewed fears of US President Trump’s tariffs keep the outlook uncertain.
- US President Trump is poised to impose 25% tariffs on all aluminum and steel imports.
- Investors await ECB Lagarde’s speech on Monday and Fed Powell’s testimony on Tuesday and Wednesday.
EUR/USD recovers above 1.0300 in Monday’s European session after a weak opening around 1.0280. The major currency opened on a weak note as investors rushed to the safe-haven fleet on renewed United States (US) President Donald Trump’s tariff fears. The US Dollar Index (DXY), which tracks the Greenback’s value against six major currencies, gives up some of its intraday gains but is still 0.15% higher, around 108.25.
Over the weekend, President Trump threatened to raise 25% tariffs on imports of steel and aluminum, as well as reciprocal tariffs on those nations where he saw unfair trade practices. The biggest casualty of Trump’s decision of 25% tariffs on metals is expected to be Canada, the largest exporter of aluminum to the US. The pressure of higher levies on metals will also be borne by Mexico, Brazil, Vietnam, and South Korea, leading exporters to the US.
The impact of reciprocal tariffs is expected to be lethal on the Eurozone, which charges 10% tariffs on automobile imports from the US and pays 2.5% import duty for domestic autos supplied to it. Such a scenario will be unfavorable for the Euro (EUR), which is already vulnerable due to growing economic contraction risks and inflation undershooting the European Central Bank’s (ECB) target of 2%.
Last week, analysts at Macquarie warned that a US tariff bomb would likely find “fertile ground in the EU,” escalating unresolved issues rapidly into trade tensions, given that “Europe is target-rich”.
The ECB is about to continue reducing interest rates, and a few policymakers have also warned that the central bank might need to go below the neutral rate as the Eurozone economy is not strong enough to support inflation at 2%.
Economists at the ECB have predicted that the bank's so-called neutral rate will probably be between 1.75% and 2.25%.
In Monday’s session, investors will focus on ECB President Christine Lagarde’s speech at the European Parliament at 14:00 GMT. Lagarde will participate in the plenary debate on ECB Annual Report 2023.
Daily digest market movers: EUR/USD faces pressure as USD’s safe-haven appeal increases
- In addition to dismal market sentiment, the US Dollar’s (USD) outperformance is also driven by growing expectations that the Federal Reserve (Fed) will keep interest rates in the current range of 4.25%-4.50% for the entire year.
- Strategists at Macquarie said, "Our updated view is for no change in the fed funds rate during 2025, with it likely to remain in the 4.25 to 4.5% range. Previously we had suggested there would be just one further 25 bps cut in either March or May." Analysts have revised their expectations for the Fed’s monetary policy outlook after the release of the upbeat US Nonfarm Payrolls (NFP) report for January.
- The US NFP report showed that the economy added 143K jobs in January, fewer than 307K in December, which were revised higher from 256K. Analysts at Macquarie argued that upward revisions to recent payroll months point to an even "steeper trend acceleration".
- Meanwhile, the Unemployment Rate decreased to 4% from the estimates and the prior release of 4.1%. Average Hourly Earnings surprisingly accelerated to 4.1% on the year and rose at a robust pace of 0.5% on the month.
- This week, the major trigger for the US Dollar will be the Consumer Price Index (CPI) data for January, which will be released on Wednesday. Investors will also pay close attention to Fed Chair Jerome Powell’s testimony before the Congress on Tuesday and Wednesday.
Technical Analysis: EUR/USD struggles around 1.0300
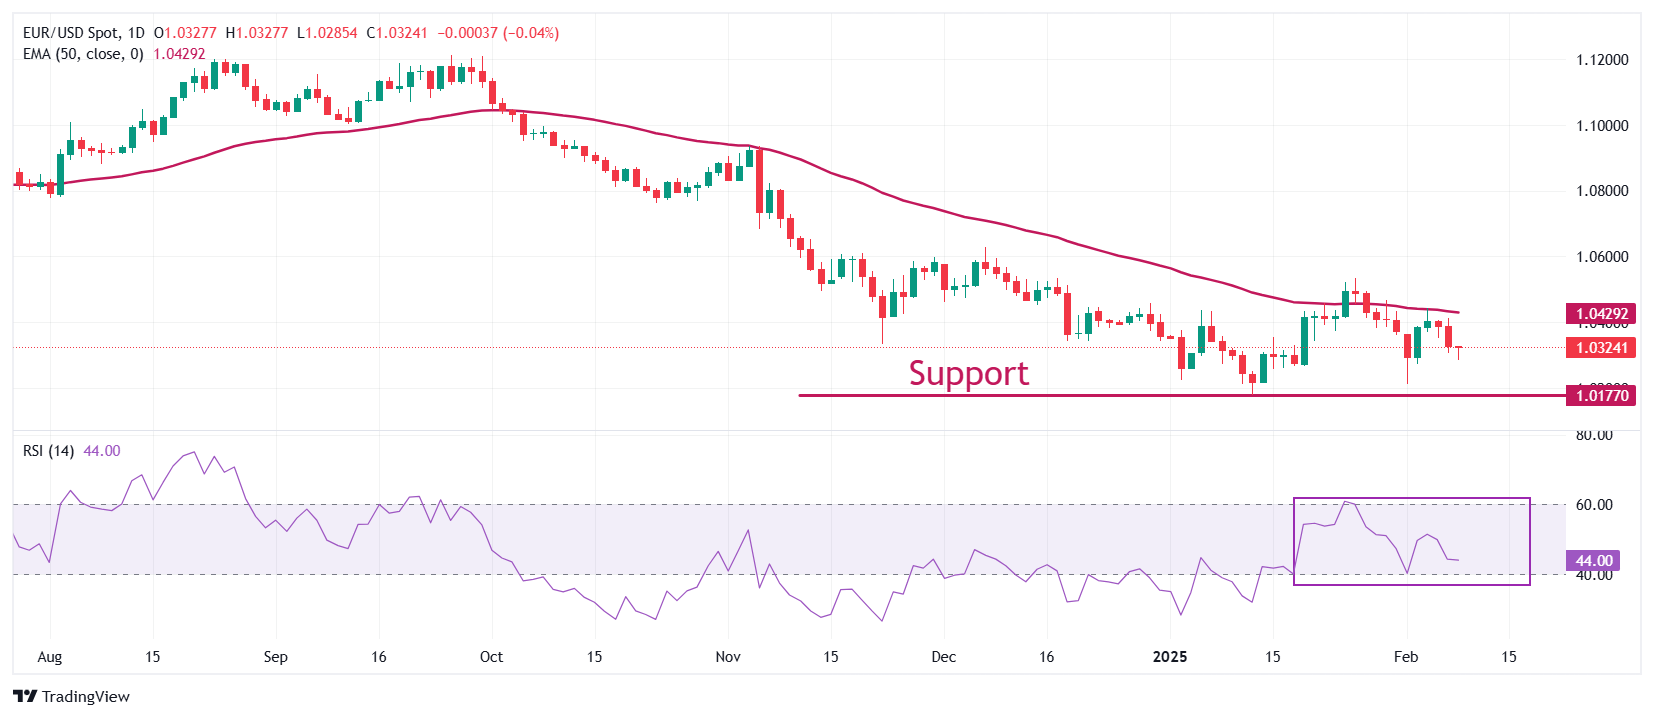
EUR/USD stays under pressure at around 1.0300 in European trading hours on Monday. The major currency pair declined after facing pressure near the 50-day Exponential Moving Average (EMA) around 1.0436 last week, suggesting that the overall trend is still bearish.
The 14-day Relative Strength Index (RSI) oscillates in the 40.00-60.00 range, indicating a short-term sideways trend.
Looking down, the January 13 low of 1.0177 and the round-level support of 1.0100 will act as major support zones for the pair. Conversely, the psychological resistance of 1.0500 will be the key barrier for the Euro bulls.
Euro FAQs
The Euro is the currency for the 19 European Union countries that belong to the Eurozone. It is the second most heavily traded currency in the world behind the US Dollar. In 2022, it accounted for 31% of all foreign exchange transactions, with an average daily turnover of over $2.2 trillion a day. EUR/USD is the most heavily traded currency pair in the world, accounting for an estimated 30% off all transactions, followed by EUR/JPY (4%), EUR/GBP (3%) and EUR/AUD (2%).
The European Central Bank (ECB) in Frankfurt, Germany, is the reserve bank for the Eurozone. The ECB sets interest rates and manages monetary policy. The ECB’s primary mandate is to maintain price stability, which means either controlling inflation or stimulating growth. Its primary tool is the raising or lowering of interest rates. Relatively high interest rates – or the expectation of higher rates – will usually benefit the Euro and vice versa. The ECB Governing Council makes monetary policy decisions at meetings held eight times a year. Decisions are made by heads of the Eurozone national banks and six permanent members, including the President of the ECB, Christine Lagarde.
Eurozone inflation data, measured by the Harmonized Index of Consumer Prices (HICP), is an important econometric for the Euro. If inflation rises more than expected, especially if above the ECB’s 2% target, it obliges the ECB to raise interest rates to bring it back under control. Relatively high interest rates compared to its counterparts will usually benefit the Euro, as it makes the region more attractive as a place for global investors to park their money.
Data releases gauge the health of the economy and can impact on the Euro. Indicators such as GDP, Manufacturing and Services PMIs, employment, and consumer sentiment surveys can all influence the direction of the single currency. A strong economy is good for the Euro. Not only does it attract more foreign investment but it may encourage the ECB to put up interest rates, which will directly strengthen the Euro. Otherwise, if economic data is weak, the Euro is likely to fall. Economic data for the four largest economies in the euro area (Germany, France, Italy and Spain) are especially significant, as they account for 75% of the Eurozone’s economy.
Another significant data release for the Euro is the Trade Balance. This indicator measures the difference between what a country earns from its exports and what it spends on imports over a given period. If a country produces highly sought after exports then its currency will gain in value purely from the extra demand created from foreign buyers seeking to purchase these goods. Therefore, a positive net Trade Balance strengthens a currency and vice versa for a negative balance.
- NZD/USD experiences a technical upward correction despite increased risk aversion.
- The NZD faced challenges as China's retaliatory tariffs on certain US exports have come into effect.
- The US Dollar received support from the rising cautious mood surrounding the Fed’s policy outlook.
NZD/USD trims its recent losses, trading around 0.5660 during the early European hours on Monday. However, the pair could face challenges again amid escalating trade war concerns. US President Donald Trump told reporters aboard Air Force One that he plans to impose a 25% tariff on all steel and aluminum imports without specifying the affected countries.
President Trump also stated that additional reciprocal tariffs would be unveiled by midweek, set to take effect almost immediately, matching the tariff rates imposed by each country, according to Reuters.
The New Zealand Dollar also weakened amid growing concerns over the US-China trade war, given New Zealand's close economic ties with China. A new US levy on Chinese imports took effect last week, while China's retaliatory tariffs on certain US exports began this Monday.
The US Dollar Index (DXY), which measures the US Dollar’s value against six major currencies, maintains its position above 108.00 at the time of writing. The Greenback receives support as the US Federal Reserve (Fed) is now expected to keep interest rates steady this year, following January’s jobs report released on Friday, which indicated slowing job growth but a lower Unemployment Rate.
Federal Reserve (Fed) Bank of Chicago President Austan Goolsbee mentioned on Friday that inconsistent policy approaches from the US government cause a high level of economic uncertainty that makes it difficult for the Fed to draw a bead on where the economy, and inflation specifically, are likely heading.
Meanwhile, Fed Board of Governors member Adriana Kugler noted that US growth and economic activity remain healthy overall, but noted that progress toward the Fed's inflation goals has been somewhat lopsided, per Reuters.
US-China Trade War FAQs
Generally speaking, a trade war is an economic conflict between two or more countries due to extreme protectionism on one end. It implies the creation of trade barriers, such as tariffs, which result in counter-barriers, escalating import costs, and hence the cost of living.
An economic conflict between the United States (US) and China began early in 2018, when President Donald Trump set trade barriers on China, claiming unfair commercial practices and intellectual property theft from the Asian giant. China took retaliatory action, imposing tariffs on multiple US goods, such as automobiles and soybeans. Tensions escalated until the two countries signed the US-China Phase One trade deal in January 2020. The agreement required structural reforms and other changes to China’s economic and trade regime and pretended to restore stability and trust between the two nations. However, the Coronavirus pandemic took the focus out of the conflict. Yet, it is worth mentioning that President Joe Biden, who took office after Trump, kept tariffs in place and even added some additional levies.
The return of Donald Trump to the White House as the 47th US President has sparked a fresh wave of tensions between the two countries. During the 2024 election campaign, Trump pledged to impose 60% tariffs on China once he returned to office, which he did on January 20, 2025. With Trump back, the US-China trade war is meant to resume where it was left, with tit-for-tat policies affecting the global economic landscape amid disruptions in global supply chains, resulting in a reduction in spending, particularly investment, and directly feeding into the Consumer Price Index inflation.
EUR/GBP loses traction to around 0.8315 in Monday’s early European session.
The BoE said it would be careful about further moves in the face of an expected inflation spike and global economic uncertainty.
The BoE pledges a gradual approach after the quarter-point rate cut
The EUR/GBP cross trades in negative territory near 0.8315 during the early European session on Monday. The concerns about the threat of possible US tariffs on the Eurozone undermine the Euro (EUR). Later on Wednesday, investors await the European Central Bank’s (ECB) President Christine Lagarde speech for fresh impetus.
US President Donald Trump said on Friday that there would be an announcement later in the week about reciprocal tariffs on all countries that tax imports from the US, but he did not specify which countries would be targeted or if there would be any exemptions. Late Sunday, German Chancellor Olaf Scholz stated that the European Union (EU) can act "in an hour" if Trump slaps threatened tariffs on the bloc. Any signs of an escalating trade war between the US and the Eurozone could drag the shared currency lower.
Additionally, the rising expectation that the ECB will further cut the interest rates contributes to the EUR’s downside. The ECB policymaker, Boris Vujcic, said that anticipation for three more rate reductions this year are reasonable, even though it will take until the start of the second quarter to know with more certainty if they’ll materialize.
The Bank of England (BoE) Governor Andrew Bailey guided a cautious and gradual rate-cut approach, and he warned that inflation could temporarily rise to near 3.7% in the third quarter of the year before falling back to the 2% path due to higher energy prices.
Euro FAQs
The Euro is the currency for the 19 European Union countries that belong to the Eurozone. It is the second most heavily traded currency in the world behind the US Dollar. In 2022, it accounted for 31% of all foreign exchange transactions, with an average daily turnover of over $2.2 trillion a day. EUR/USD is the most heavily traded currency pair in the world, accounting for an estimated 30% off all transactions, followed by EUR/JPY (4%), EUR/GBP (3%) and EUR/AUD (2%).
The European Central Bank (ECB) in Frankfurt, Germany, is the reserve bank for the Eurozone. The ECB sets interest rates and manages monetary policy. The ECB’s primary mandate is to maintain price stability, which means either controlling inflation or stimulating growth. Its primary tool is the raising or lowering of interest rates. Relatively high interest rates – or the expectation of higher rates – will usually benefit the Euro and vice versa. The ECB Governing Council makes monetary policy decisions at meetings held eight times a year. Decisions are made by heads of the Eurozone national banks and six permanent members, including the President of the ECB, Christine Lagarde.
Eurozone inflation data, measured by the Harmonized Index of Consumer Prices (HICP), is an important econometric for the Euro. If inflation rises more than expected, especially if above the ECB’s 2% target, it obliges the ECB to raise interest rates to bring it back under control. Relatively high interest rates compared to its counterparts will usually benefit the Euro, as it makes the region more attractive as a place for global investors to park their money.
Data releases gauge the health of the economy and can impact on the Euro. Indicators such as GDP, Manufacturing and Services PMIs, employment, and consumer sentiment surveys can all influence the direction of the single currency. A strong economy is good for the Euro. Not only does it attract more foreign investment but it may encourage the ECB to put up interest rates, which will directly strengthen the Euro. Otherwise, if economic data is weak, the Euro is likely to fall. Economic data for the four largest economies in the euro area (Germany, France, Italy and Spain) are especially significant, as they account for 75% of the Eurozone’s economy.
Another significant data release for the Euro is the Trade Balance. This indicator measures the difference between what a country earns from its exports and what it spends on imports over a given period. If a country produces highly sought after exports then its currency will gain in value purely from the extra demand created from foreign buyers seeking to purchase these goods. Therefore, a positive net Trade Balance strengthens a currency and vice versa for a negative balance.
French Foreign Minister Jean-Noel Barrot said on Monday, the European Union (EU) will respond to US President Donald Trump's latest tariffs announcement.
Key quotes
“France and its European partners should not hesitate to defend their interests in the face of the US tariff threats.”
“The European Commission will decide on the sectors that will be affected by a response.”
"It (the Commission) is ready to push the trigger when the time has come. Now this time has come. It is in no-one's interest to start a commercial war with the European Union.”
Market reaction
At the time of writing, EUR/USD sheds 0.10% on the day to trade at around 1.0315.
Here is what you need to know on Monday, February 10:
The US Dollar stays resilient against its major rivals on Monday as markets assess the latest headlines surrounding US President Donald Trump's tariff policy. The economic calendar will not feature any high-impact data releases. Later in the day, European Central Bank (ECB) President Christine Lagarde will deliver the Annual Report at the European Parliament.
US Dollar PRICE Today
The table below shows the percentage change of US Dollar (USD) against listed major currencies today. US Dollar was the strongest against the Japanese Yen.
| USD | EUR | GBP | JPY | CAD | AUD | NZD | CHF | |
|---|---|---|---|---|---|---|---|---|
| USD | 0.06% | -0.12% | 0.38% | 0.31% | -0.08% | -0.01% | 0.17% | |
| EUR | -0.06% | -0.11% | 0.45% | 0.36% | -0.14% | 0.01% | 0.19% | |
| GBP | 0.12% | 0.11% | 0.40% | 0.44% | -0.03% | 0.12% | 0.30% | |
| JPY | -0.38% | -0.45% | -0.40% | -0.11% | -0.39% | -0.39% | -0.21% | |
| CAD | -0.31% | -0.36% | -0.44% | 0.11% | -0.36% | -0.34% | -0.18% | |
| AUD | 0.08% | 0.14% | 0.03% | 0.39% | 0.36% | 0.15% | 0.33% | |
| NZD | 0.00% | -0.01% | -0.12% | 0.39% | 0.34% | -0.15% | 0.17% | |
| CHF | -0.17% | -0.19% | -0.30% | 0.21% | 0.18% | -0.33% | -0.17% |
The heat map shows percentage changes of major currencies against each other. The base currency is picked from the left column, while the quote currency is picked from the top row. For example, if you pick the US Dollar from the left column and move along the horizontal line to the Japanese Yen, the percentage change displayed in the box will represent USD (base)/JPY (quote).
Following the mixed labor market data, the USD Index closed modestly higher on Friday. Nonfarm Payrolls (NFP) in the US rose by 143,000 in January, missing the market expectation for an increase of 170,000. On a positive note, November's increase of 256,000 got revised higher to 307,000 and the Unemployment Rate edged lower to 4.1% from 4% in December.
Meanwhile, President Trump said on Friday that he will announce "reciprocal tariffs" on many countries this Tuesday or Wednesday. Over the weekend, Trump also noted that he plans to impose 25% tariffs on all steel and aluminum imports into the US. The USD Index opened with a small bullish gap and was last seen trading marginally higher on the day, slightly above 108.20. Wall Street's main indexes suffered large losses on Friday. Early Monday, US stock index futures rise between 0.1% and 0.4%. Federal Reserve (Fed) Chairman Jerome Powell will testify before the Senate Banking Committee on Tuesday and before the House Financial Services Committee on Wednesday.
Tariffs FAQs
Tariffs are customs duties levied on certain merchandise imports or a category of products. Tariffs are designed to help local producers and manufacturers be more competitive in the market by providing a price advantage over similar goods that can be imported. Tariffs are widely used as tools of protectionism, along with trade barriers and import quotas.
Although tariffs and taxes both generate government revenue to fund public goods and services, they have several distinctions. Tariffs are prepaid at the port of entry, while taxes are paid at the time of purchase. Taxes are imposed on individual taxpayers and businesses, while tariffs are paid by importers.
There are two schools of thought among economists regarding the usage of tariffs. While some argue that tariffs are necessary to protect domestic industries and address trade imbalances, others see them as a harmful tool that could potentially drive prices higher over the long term and lead to a damaging trade war by encouraging tit-for-tat tariffs.
During the run-up to the presidential election in November 2024, Donald Trump made it clear that he intends to use tariffs to support the US economy and American producers. In 2024, Mexico, China and Canada accounted for 42% of total US imports. In this period, Mexico stood out as the top exporter with $466.6 billion, according to the US Census Bureau. Hence, Trump wants to focus on these three nations when imposing tariffs. He also plans to use the revenue generated through tariffs to lower personal income taxes.
Despite losing more than 0.5% on Friday, EUR/USD ended the previous week in positive territory. The pair holds steady above 1.0300 in the early European morning.
AUD/USD started the week under bearish pressure on Trump’s announcement of imposing new 25% tariffs on all steel and aluminum imports into the US and declined below 0.6250. In response, Australian Trade Minister Don Farrell said Monday that Australian steel and aluminum is creating "thousands of good-paying American jobs" adding that they are key for our their shared defense interests. The pair regains its traction to begin the European session and trades flat on the day above 0.6270.
GBP/USD registered losses on Thursday and Friday but managed to post weekly gains. The pair holds its ground early Monday and fluctuates above 1.2400.
USD/JPY declined sharply and lost more than 2% in the previous week. The pair stages a rebound toward 152.00 early Monday. During a news conference with Japanese Prime Minister Shigeru Ishiba on Friday, Trump said that he intends to "work out" the US' trade deficit with Japan, which currently sits around $65 billion per year.
Gold preserves its bullish momentum to begin the new week, after having gained more than 2% last week. XAU/USD was last seen trading at a new record-high near $2,890.
Gold FAQs
Gold has played a key role in human’s history as it has been widely used as a store of value and medium of exchange. Currently, apart from its shine and usage for jewelry, the precious metal is widely seen as a safe-haven asset, meaning that it is considered a good investment during turbulent times. Gold is also widely seen as a hedge against inflation and against depreciating currencies as it doesn’t rely on any specific issuer or government.
Central banks are the biggest Gold holders. In their aim to support their currencies in turbulent times, central banks tend to diversify their reserves and buy Gold to improve the perceived strength of the economy and the currency. High Gold reserves can be a source of trust for a country’s solvency. Central banks added 1,136 tonnes of Gold worth around $70 billion to their reserves in 2022, according to data from the World Gold Council. This is the highest yearly purchase since records began. Central banks from emerging economies such as China, India and Turkey are quickly increasing their Gold reserves.
Gold has an inverse correlation with the US Dollar and US Treasuries, which are both major reserve and safe-haven assets. When the Dollar depreciates, Gold tends to rise, enabling investors and central banks to diversify their assets in turbulent times. Gold is also inversely correlated with risk assets. A rally in the stock market tends to weaken Gold price, while sell-offs in riskier markets tend to favor the precious metal.
The price can move due to a wide range of factors. Geopolitical instability or fears of a deep recession can quickly make Gold price escalate due to its safe-haven status. As a yield-less asset, Gold tends to rise with lower interest rates, while higher cost of money usually weighs down on the yellow metal. Still, most moves depend on how the US Dollar (USD) behaves as the asset is priced in dollars (XAU/USD). A strong Dollar tends to keep the price of Gold controlled, whereas a weaker Dollar is likely to push Gold prices up.
- USD/CHF gains ground to near 0.9110 in Monday’s early European session.
- The upbeat US employment data for January supports the US Dollar.
- The uncertainty and ongoing Middle East geopolitical tensions could boost the safe-haven currency like the CHF.
The USD/CHF pair gathers strength to around 0.9110 during the early European session on Monday. The US Federal Reserve (Fed) is expected to keep interest rates hold this year after the US January employment data, supporting the Greenback. Fed's Chair Powell testifies will be the highlight on Tuesday. Later on Wednesday, US Consumer Price Index (CPI) inflation data will be in focus.
The US Dollar Index (DXY), which measures the USD against six other units, currently trades near 108.20, gaining 0.14% on the day. The US economy created 143K new jobs in January, missing economists' estimates of 170K jobs. However, the Unemployment Rate declined to 4.0% in January from 4.1% in December.
Furthermore, analysts said that tariff policies by the Trump administration could be inflationary and put further pressure on the Fed to keep interest rates elevated. Markets are pricing in 36 basis points (bps) of cuts this year, down from 42 bps after an upbeat payrolls report on Friday. This, in turn, contributes to the USD’s upside.
The Swiss Franc (CHF) could appreciate in the coming months as the Swiss National Bank (SNB) is unlikely to return to negative interest rates, Commerzbank analyst Michael Pfister said in a note. The SNB might end its rate-cutting cycle with a policy rate of 0.0%, compared with 0.5% currently. Meanwhile, the global economic uncertainty and the ongoing geopolitical tensions in the Middle East could boost the safe-haven flows, benefiting the CHF.
Swiss Franc FAQs
The Swiss Franc (CHF) is Switzerland’s official currency. It is among the top ten most traded currencies globally, reaching volumes that well exceed the size of the Swiss economy. Its value is determined by the broad market sentiment, the country’s economic health or action taken by the Swiss National Bank (SNB), among other factors. Between 2011 and 2015, the Swiss Franc was pegged to the Euro (EUR). The peg was abruptly removed, resulting in a more than 20% increase in the Franc’s value, causing a turmoil in markets. Even though the peg isn’t in force anymore, CHF fortunes tend to be highly correlated with the Euro ones due to the high dependency of the Swiss economy on the neighboring Eurozone.
The Swiss Franc (CHF) is considered a safe-haven asset, or a currency that investors tend to buy in times of market stress. This is due to the perceived status of Switzerland in the world: a stable economy, a strong export sector, big central bank reserves or a longstanding political stance towards neutrality in global conflicts make the country’s currency a good choice for investors fleeing from risks. Turbulent times are likely to strengthen CHF value against other currencies that are seen as more risky to invest in.
The Swiss National Bank (SNB) meets four times a year – once every quarter, less than other major central banks – to decide on monetary policy. The bank aims for an annual inflation rate of less than 2%. When inflation is above target or forecasted to be above target in the foreseeable future, the bank will attempt to tame price growth by raising its policy rate. Higher interest rates are generally positive for the Swiss Franc (CHF) as they lead to higher yields, making the country a more attractive place for investors. On the contrary, lower interest rates tend to weaken CHF.
Macroeconomic data releases in Switzerland are key to assessing the state of the economy and can impact the Swiss Franc’s (CHF) valuation. The Swiss economy is broadly stable, but any sudden change in economic growth, inflation, current account or the central bank’s currency reserves have the potential to trigger moves in CHF. Generally, high economic growth, low unemployment and high confidence are good for CHF. Conversely, if economic data points to weakening momentum, CHF is likely to depreciate.
As a small and open economy, Switzerland is heavily dependent on the health of the neighboring Eurozone economies. The broader European Union is Switzerland’s main economic partner and a key political ally, so macroeconomic and monetary policy stability in the Eurozone is essential for Switzerland and, thus, for the Swiss Franc (CHF). With such dependency, some models suggest that the correlation between the fortunes of the Euro (EUR) and the CHF is more than 90%, or close to perfect.
- GBP/USD struggles to capitalize on intraday uptick amid a modest USD strength.
- The divergent Fed-BoE outlook further contributes to capping the currency pair.
- The setup seems tilted in favor of bears and supports prospects for deeper losses.
The GBP/USD pair rebounds a few pips from the Asian session low and currently trades around the 1.2400 round-figure mark, nearly unchanged for the day. The upside, however, remains capped in the wake of a modest US Dollar (USD) strength, which, in turn, warrants some caution for bullish traders.
US President Donald Trump's fresh tariff threats boost demand for the traditional safe-haven Greenback. Meanwhile, the upbeat US employment details released on Friday, along with expectations that Trump's protectionist policies would reignite inflation, should allow the Federal Reserve (Fed) to hold rates steady and lend additional support to the USD. Apart from this, the Bank of England's (BoE) gloomy outlook should contribute to capping the GBP/USD pair.
Even from a technical perspective, the recent repeated failures near the 50-day Simple Moving Average (SMA) suggest that the path of least resistance for the GBP/USD pair is to the downside. Hence, any subsequent move up could be seen as a selling opportunity and remain capped near the 1.2500 psychological mark. The latter should act as a key pivotal point for short-term traders, which if cleared decisively should pave the way for additional near-term gains.
The GBP/USD pair might then accelerate the positive move towards the 1.2575-1.2580 region en route to the 1.2600 round figure. The momentum could extend further towards the 1.2645-1.2650 intermediate hurdle, above which spot prices could aim to challenge the 100-day SMA, currently pegged near the 1.2715-1.2720 region.
On the flip side, weakness below the 1.2375-1.2370 immediate support could make the GBP/USD pair vulnerable to weaken further below the 1.2300 round figure, towards testing last week's swing low, around mid-1.2200s. Some follow-through selling should pave the way for a fall toward the next relevant support near the 1.2175 region.
GBP/USD daily chart
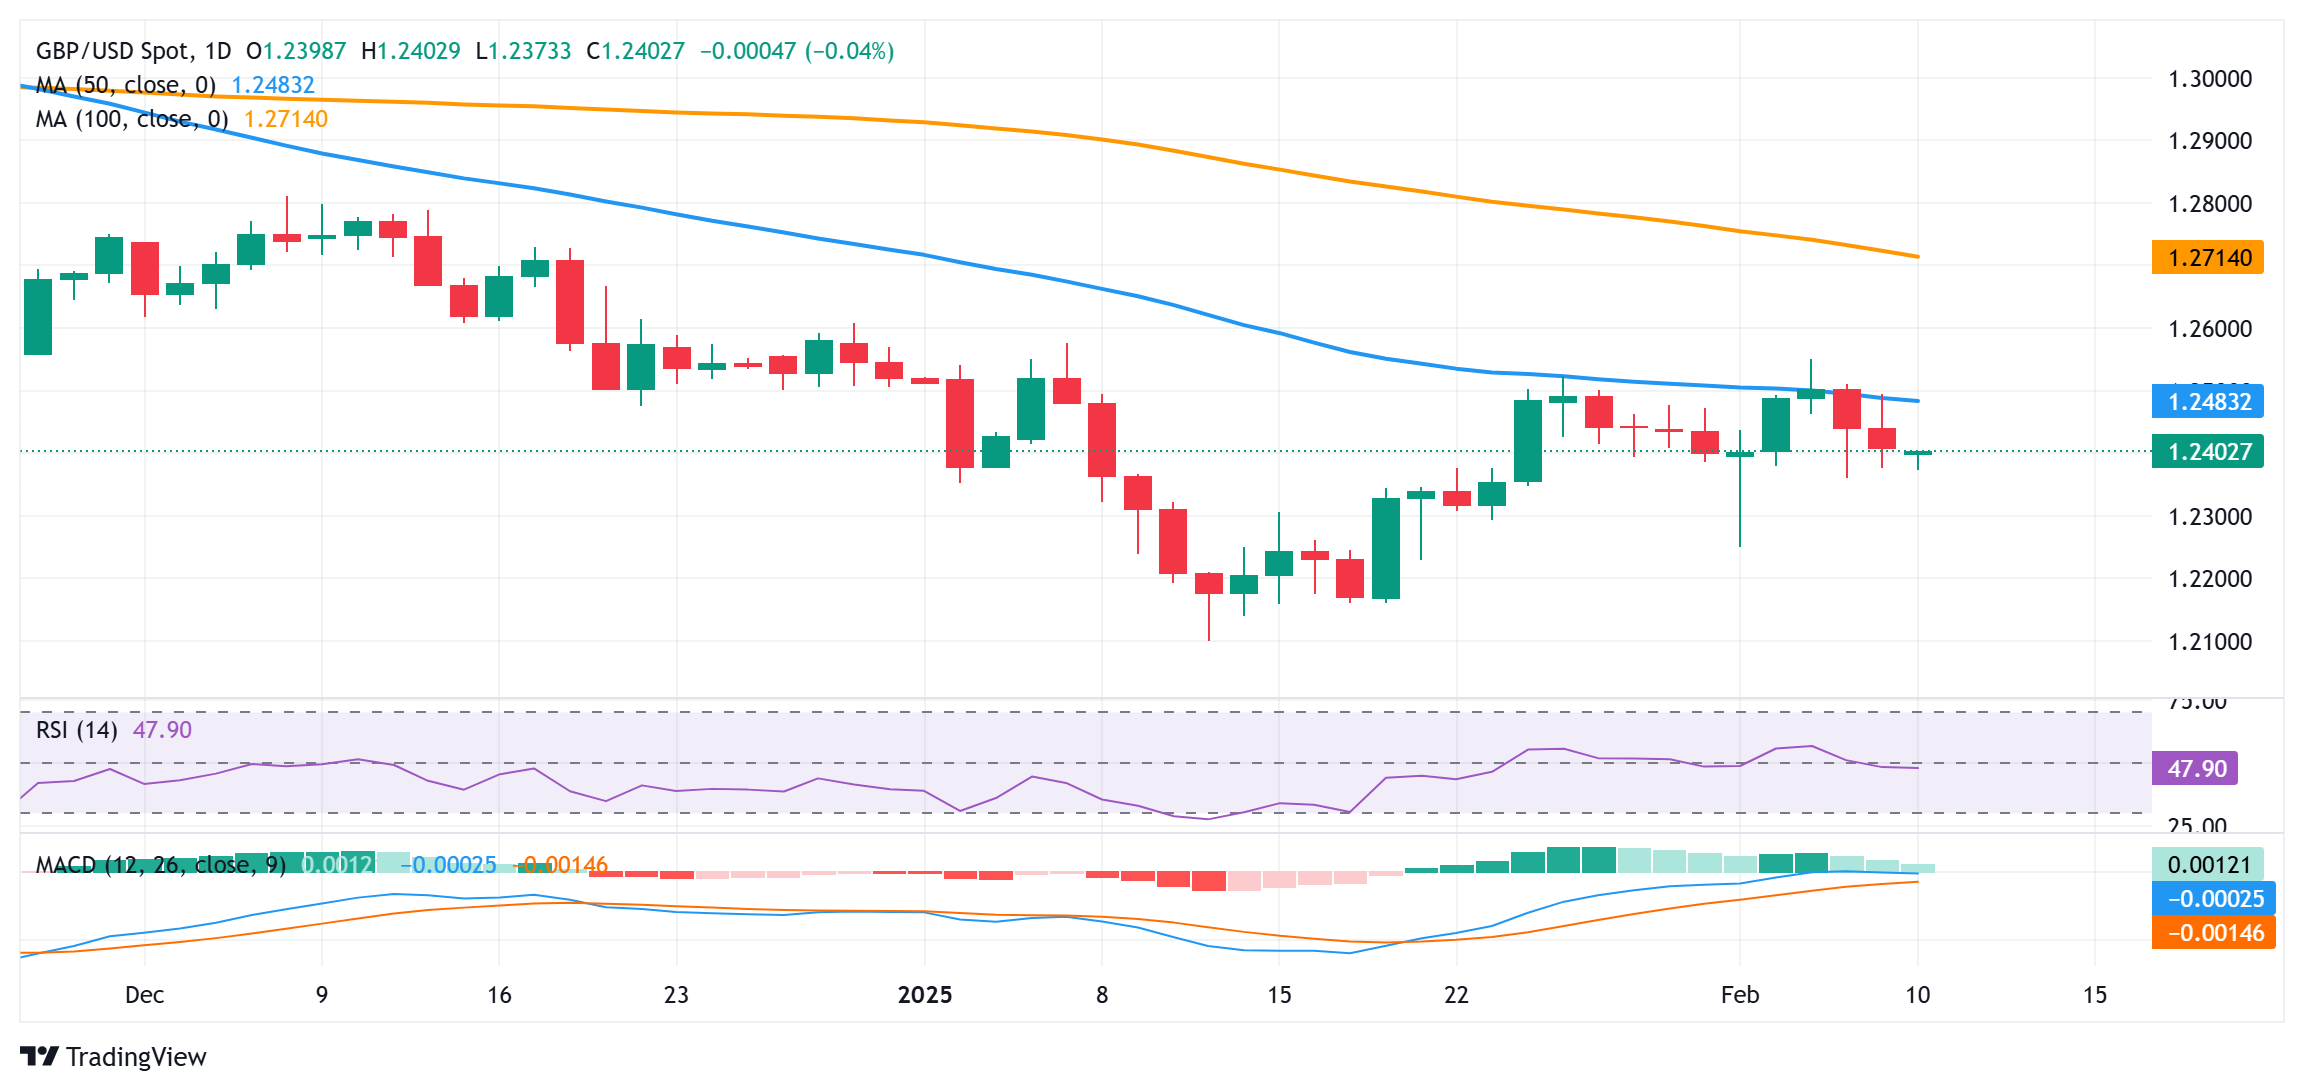
Pound Sterling FAQs
The Pound Sterling (GBP) is the oldest currency in the world (886 AD) and the official currency of the United Kingdom. It is the fourth most traded unit for foreign exchange (FX) in the world, accounting for 12% of all transactions, averaging $630 billion a day, according to 2022 data. Its key trading pairs are GBP/USD, also known as ‘Cable’, which accounts for 11% of FX, GBP/JPY, or the ‘Dragon’ as it is known by traders (3%), and EUR/GBP (2%). The Pound Sterling is issued by the Bank of England (BoE).
The single most important factor influencing the value of the Pound Sterling is monetary policy decided by the Bank of England. The BoE bases its decisions on whether it has achieved its primary goal of “price stability” – a steady inflation rate of around 2%. Its primary tool for achieving this is the adjustment of interest rates. When inflation is too high, the BoE will try to rein it in by raising interest rates, making it more expensive for people and businesses to access credit. This is generally positive for GBP, as higher interest rates make the UK a more attractive place for global investors to park their money. When inflation falls too low it is a sign economic growth is slowing. In this scenario, the BoE will consider lowering interest rates to cheapen credit so businesses will borrow more to invest in growth-generating projects.
Data releases gauge the health of the economy and can impact the value of the Pound Sterling. Indicators such as GDP, Manufacturing and Services PMIs, and employment can all influence the direction of the GBP. A strong economy is good for Sterling. Not only does it attract more foreign investment but it may encourage the BoE to put up interest rates, which will directly strengthen GBP. Otherwise, if economic data is weak, the Pound Sterling is likely to fall.
Another significant data release for the Pound Sterling is the Trade Balance. This indicator measures the difference between what a country earns from its exports and what it spends on imports over a given period. If a country produces highly sought-after exports, its currency will benefit purely from the extra demand created from foreign buyers seeking to purchase these goods. Therefore, a positive net Trade Balance strengthens a currency and vice versa for a negative balance.
- EUR/JPY appreciates traders expect Japan to face Trump's trade tariffs.
- President Trump reaffirmed his commitment to address the US trade deficit with Japan.
- German Chancellor Olaf Scholz stated that the EU could react “within an hour” if the US imposes the proposed tariffs.
EUR/JPY halts its three-day losing streak, trading around 156.70 during the Asian session on Monday. The upside of the currency cross could be attributed to worries that Japan would also be an eventual target of US President Donald Trump's trade tariffs.
President Trump told reporters aboard Air Force One on Sunday that he plans to impose a 25% tariff on all steel and aluminum imports, without specifying the affected countries. Trump also stated that additional reciprocal tariffs would be unveiled by midweek and implemented almost immediately, mirroring the tariff rates set by each country, according to Reuters.
During a news conference on Friday with Japanese Prime Minister Shigeru Ishiba, US President Donald Trump reaffirmed his commitment to addressing the US trade deficit with Japan, which currently stands at approximately $65 billion per year. Trump also noted Japan's pledge to double its defense spending by 2027 compared to his first term. Additionally, Japan is set to start importing new shipments of American liquefied natural gas.
The Japanese Yen (JPY) may strengthen due to rising expectations of the Bank of Japan (BoJ) raising interest rates again this year. An increase in Japanese government bond (JGB) yields could further support the lower-yielding JPY.
However, the upside of the EUR/JPY cross could be restrained amid rising concerns over potential deflationary pressures in the Eurozone due to expected US tariffs have intensified odds of deeper ECB rate cuts, with markets now predicting the deposit rate could fall to 1.87% by December.
In response to Trump’s announcement of new tariff plans, German Chancellor Olaf Scholz stated that the European Union (EU) could react “within an hour” if the US imposes the proposed tariffs. Separately, Bernd Lange, head of the European Parliament’s trade committee, suggested that to avoid a trade war, the EU is open to reducing its 10% import tax on vehicles to a rate closer to the 2.5% tariff imposed by the US.
Tariffs FAQs
Tariffs are customs duties levied on certain merchandise imports or a category of products. Tariffs are designed to help local producers and manufacturers be more competitive in the market by providing a price advantage over similar goods that can be imported. Tariffs are widely used as tools of protectionism, along with trade barriers and import quotas.
Although tariffs and taxes both generate government revenue to fund public goods and services, they have several distinctions. Tariffs are prepaid at the port of entry, while taxes are paid at the time of purchase. Taxes are imposed on individual taxpayers and businesses, while tariffs are paid by importers.
There are two schools of thought among economists regarding the usage of tariffs. While some argue that tariffs are necessary to protect domestic industries and address trade imbalances, others see them as a harmful tool that could potentially drive prices higher over the long term and lead to a damaging trade war by encouraging tit-for-tat tariffs.
During the run-up to the presidential election in November 2024, Donald Trump made it clear that he intends to use tariffs to support the US economy and American producers. In 2024, Mexico, China and Canada accounted for 42% of total US imports. In this period, Mexico stood out as the top exporter with $466.6 billion, according to the US Census Bureau. Hence, Trump wants to focus on these three nations when imposing tariffs. He also plans to use the revenue generated through tariffs to lower personal income taxes.
FX option expiries for Feb 10 NY cut at 10:00 Eastern Time via DTCC can be found below.
EUR/USD: EUR amounts
- 1.0150 998m
- 1.0250 2.9b
- 1.0260 992m
- 1.0300 1.5b
- 1.0350 1.2b
- 1.0375 920m
- 1.0400 3b
- 1.0425 866m
- 1.0450 4.1b
USD/JPY: USD amounts
- 151.00 606m
- 153.00 787m
- 153.50 1.2b
- 154.00 748m
USD/CHF: USD amounts
- 0.9100 600m
AUD/USD: AUD amounts
- 0.6350 547m
- 0.6405 759m
USD/CAD: USD amounts
- 1.4175 1.2b
- 1.4400 845m
- 1.4425 1.5b
- 1.4500 660m
EUR/GBP: EUR amounts
- 0.8345 473m
- EUR/USD trades in a negative territory near 1.0310 in Monday’s Asian session.
- The uncertainty and trade war threat underpin the US Dollar broadly.
- The dovish stance of the ECB and the signal of several interest rate cuts weigh on the shared currency.
The EUR/USD pair drifts lower to around 1.0310 during the Asian session on Monday, pressured by the stronger Greenback. Later on Monday, the Eurozone Sentix Investor Confidence for February and the speech from the ECB's President Christine Lagarde will be in the spotlight.
Trump said on Friday that he plans to announce reciprocal tariffs on many countries by Tuesday or Wednesday, without specifying which countries. The move adds to jitters over a global trade war, supporting the safe-haven currency like the US Dollar (USD).
"The immediate concern, however, might not be inflation, as there could be counter effects such as demand slowdown. The bigger concern is the uncertainty and the shift towards a more protectionist world,” said Charu Chanana, chief investment strategist at Saxo.
Across the pond, the rising speculation of more rate cuts from the European Central Bank (ECB) amid weak economic growth is likely to weigh on the Euro (EUR) against the USD. The ECB Governing Council member Boris Vujcic said that expectations for three more rate reductions this year are reasonable, even though it will take until the start of the second quarter to know with more certainty if they’ll materialize, according to Governing Council member Boris Vujcic.
Traders will closely watch the developments surrounding tariff policies by US President Donald Trump, as he has repeatedly threatened against Europe. JPMorgan economist Nora Szentivanyi said "the motivation, objectives, timing, and tariff rates are all unclear.” Nonetheless, the European Commission noted that it would retaliate 'firmly' against any US-imposed tariffs.
Euro FAQs
The Euro is the currency for the 19 European Union countries that belong to the Eurozone. It is the second most heavily traded currency in the world behind the US Dollar. In 2022, it accounted for 31% of all foreign exchange transactions, with an average daily turnover of over $2.2 trillion a day. EUR/USD is the most heavily traded currency pair in the world, accounting for an estimated 30% off all transactions, followed by EUR/JPY (4%), EUR/GBP (3%) and EUR/AUD (2%).
The European Central Bank (ECB) in Frankfurt, Germany, is the reserve bank for the Eurozone. The ECB sets interest rates and manages monetary policy. The ECB’s primary mandate is to maintain price stability, which means either controlling inflation or stimulating growth. Its primary tool is the raising or lowering of interest rates. Relatively high interest rates – or the expectation of higher rates – will usually benefit the Euro and vice versa. The ECB Governing Council makes monetary policy decisions at meetings held eight times a year. Decisions are made by heads of the Eurozone national banks and six permanent members, including the President of the ECB, Christine Lagarde.
Eurozone inflation data, measured by the Harmonized Index of Consumer Prices (HICP), is an important econometric for the Euro. If inflation rises more than expected, especially if above the ECB’s 2% target, it obliges the ECB to raise interest rates to bring it back under control. Relatively high interest rates compared to its counterparts will usually benefit the Euro, as it makes the region more attractive as a place for global investors to park their money.
Data releases gauge the health of the economy and can impact on the Euro. Indicators such as GDP, Manufacturing and Services PMIs, employment, and consumer sentiment surveys can all influence the direction of the single currency. A strong economy is good for the Euro. Not only does it attract more foreign investment but it may encourage the ECB to put up interest rates, which will directly strengthen the Euro. Otherwise, if economic data is weak, the Euro is likely to fall. Economic data for the four largest economies in the euro area (Germany, France, Italy and Spain) are especially significant, as they account for 75% of the Eurozone’s economy.
Another significant data release for the Euro is the Trade Balance. This indicator measures the difference between what a country earns from its exports and what it spends on imports over a given period. If a country produces highly sought after exports then its currency will gain in value purely from the extra demand created from foreign buyers seeking to purchase these goods. Therefore, a positive net Trade Balance strengthens a currency and vice versa for a negative balance.
Gold prices rose in India on Monday, according to data compiled by FXStreet.
The price for Gold stood at 8,129.78 Indian Rupees (INR) per gram, up compared with the INR 8,083.86 it cost on Friday.
The price for Gold increased to INR 94,824.19 per tola from INR 94,288.59 per tola on friday.
| Unit measure | Gold Price in INR |
|---|---|
| 1 Gram | 8,129.78 |
| 10 Grams | 81,297.83 |
| Tola | 94,824.19 |
| Troy Ounce | 252,864.70 |
FXStreet calculates Gold prices in India by adapting international prices (USD/INR) to the local currency and measurement units. Prices are updated daily based on the market rates taken at the time of publication. Prices are just for reference and local rates could diverge slightly.
Gold FAQs
Gold has played a key role in human’s history as it has been widely used as a store of value and medium of exchange. Currently, apart from its shine and usage for jewelry, the precious metal is widely seen as a safe-haven asset, meaning that it is considered a good investment during turbulent times. Gold is also widely seen as a hedge against inflation and against depreciating currencies as it doesn’t rely on any specific issuer or government.
Central banks are the biggest Gold holders. In their aim to support their currencies in turbulent times, central banks tend to diversify their reserves and buy Gold to improve the perceived strength of the economy and the currency. High Gold reserves can be a source of trust for a country’s solvency. Central banks added 1,136 tonnes of Gold worth around $70 billion to their reserves in 2022, according to data from the World Gold Council. This is the highest yearly purchase since records began. Central banks from emerging economies such as China, India and Turkey are quickly increasing their Gold reserves.
Gold has an inverse correlation with the US Dollar and US Treasuries, which are both major reserve and safe-haven assets. When the Dollar depreciates, Gold tends to rise, enabling investors and central banks to diversify their assets in turbulent times. Gold is also inversely correlated with risk assets. A rally in the stock market tends to weaken Gold price, while sell-offs in riskier markets tend to favor the precious metal.
The price can move due to a wide range of factors. Geopolitical instability or fears of a deep recession can quickly make Gold price escalate due to its safe-haven status. As a yield-less asset, Gold tends to rise with lower interest rates, while higher cost of money usually weighs down on the yellow metal. Still, most moves depend on how the US Dollar (USD) behaves as the asset is priced in dollars (XAU/USD). A strong Dollar tends to keep the price of Gold controlled, whereas a weaker Dollar is likely to push Gold prices up.
(An automation tool was used in creating this post.)
- Gold price continues to attract safe-haven flows amid persistent worries about Trump’s trade tariffs.
- Mostly upbeat US jobs data and inflationary concerns could allow the Fed to hold interest rates steady.
- A modest US Dollar strength might further contribute to capping the upside for the XAU/USD pair.
Gold price (XAU/USD) kicks off the new week on a positive note and remains well within striking distance of the all-time high touched on Friday amid persistent worries about US President Donald Trump's trade policies. In fact, Trump said on Sunday that he will announce new 25% tariffs on all steel and aluminum imports into the US, sparking concerns about a global trade war and underpinning the safe-haven precious metal.
Meanwhile, expectations that Trump's protectionist policies would reignite inflation turn out to be another factor that benefits the Gold price, which is seen as a hedge against rising prices. That said, mostly upbeat US employment details released on Friday and inflationary concerns should allow the Federal Reserve (Fed) to stick to its hawkish bias. This, along with modest US Dollar (USD) strength, might cap the non-yielding yellow metal.
Gold price attracts buyers in reaction to US President Donald Trump’s fresh tariff threats
- US President Donald Trump said on Sunday he will introduce new 25% tariffs on all steel and aluminum imports into the US. Trump added that he would announce reciprocal tariffs on all countries and match their tariff rates, bolstering the safe-haven Gold price at the start of a new week.
- Russian Deputy Foreign Minister Galuzin said there are no satisfactory proposals to start talks on Ukraine, and that statements from the West and Ukraine are nothing but buzz-building. US Vice President JD Vance is supposedly headed to Germany this week to lay out details of the US proposal.
- Investors remain worried that Trump's trade policies could put upward pressure on inflation in the US. This, along with the upbeat US Nonfarm Payrolls (NFP) report released on Friday, could limit the scope for the Federal Reserve to ease further and might cap the non-yielding yellow metal.
- The closely-watched US monthly jobs data showed that the world's largest economy added 143K jobs in January compared to 170K anticipated and the previous month's upwardly revised reading of 307K. This, however, was offset by an unexpected dip in the Unemployment Rate to 4.0%.
- Minneapolis Fed President Neel Kashkari said on Friday that he would move towards supporting further rate cuts if they see good inflation data and the labor market stays strong. Kashkari added that we are in a good place to sit here until we get more information on the Trump administration's policies.
- Chicago Fed President Austan Goolsbee noted that inconsistent policy approaches from the US government cause a high level of economic uncertainty that makes it difficult for policymakers to draw a bead on where the economy, and inflation specifically, is likely heading.
- Meanwhile, Fed Board of Governors member Adriana Kugler said that US growth and economic activity remain healthy overall, but noted that progress toward the 2% inflation goal has been somewhat lopsided. Recent progress on inflation is slow and uneven, Kugler added.
- A modest US Dollar strength might hold back traders from placing aggressive bullish bets around the commodity. Traders now look to Fed Chair Jerome Powell's semi-annual congressional testimony and the US consumer inflation figures for a fresh directional impetus.
Gold price needs to consolidate before the next leg up amid an overbought daily RSI

From a technical perspective, the Relative Strength Index (RSI) on the daily chart is still flashing overbought conditions, warranting caution for bullish traders. This makes it prudent to wait for some near-term consolidation or a modest pullback before positioning for an extension of the Gold price’s well-established uptrend. Hence, any subsequent move up is likely to confront some barrier near the $2,886-2,887 region, or the all-time peak, ahead of the $2,900 mark.
Meanwhile, any corrective slide below the $2,855-2,854 immediate support could be seen as a buying opportunity. This, in turn, should help limit losses for the Gold price near the $2,834 region. Some follow-through selling, however, could drag the XAU/USD further toward the next relevant support near the $2,815-2,814 area en route to the $2,800 round-figure mark.
Gold FAQs
Gold has played a key role in human’s history as it has been widely used as a store of value and medium of exchange. Currently, apart from its shine and usage for jewelry, the precious metal is widely seen as a safe-haven asset, meaning that it is considered a good investment during turbulent times. Gold is also widely seen as a hedge against inflation and against depreciating currencies as it doesn’t rely on any specific issuer or government.
Central banks are the biggest Gold holders. In their aim to support their currencies in turbulent times, central banks tend to diversify their reserves and buy Gold to improve the perceived strength of the economy and the currency. High Gold reserves can be a source of trust for a country’s solvency. Central banks added 1,136 tonnes of Gold worth around $70 billion to their reserves in 2022, according to data from the World Gold Council. This is the highest yearly purchase since records began. Central banks from emerging economies such as China, India and Turkey are quickly increasing their Gold reserves.
Gold has an inverse correlation with the US Dollar and US Treasuries, which are both major reserve and safe-haven assets. When the Dollar depreciates, Gold tends to rise, enabling investors and central banks to diversify their assets in turbulent times. Gold is also inversely correlated with risk assets. A rally in the stock market tends to weaken Gold price, while sell-offs in riskier markets tend to favor the precious metal.
The price can move due to a wide range of factors. Geopolitical instability or fears of a deep recession can quickly make Gold price escalate due to its safe-haven status. As a yield-less asset, Gold tends to rise with lower interest rates, while higher cost of money usually weighs down on the yellow metal. Still, most moves depend on how the US Dollar (USD) behaves as the asset is priced in dollars (XAU/USD). A strong Dollar tends to keep the price of Gold controlled, whereas a weaker Dollar is likely to push Gold prices up.
Tariffs FAQs
Tariffs are customs duties levied on certain merchandise imports or a category of products. Tariffs are designed to help local producers and manufacturers be more competitive in the market by providing a price advantage over similar goods that can be imported. Tariffs are widely used as tools of protectionism, along with trade barriers and import quotas.
Although tariffs and taxes both generate government revenue to fund public goods and services, they have several distinctions. Tariffs are prepaid at the port of entry, while taxes are paid at the time of purchase. Taxes are imposed on individual taxpayers and businesses, while tariffs are paid by importers.
There are two schools of thought among economists regarding the usage of tariffs. While some argue that tariffs are necessary to protect domestic industries and address trade imbalances, others see them as a harmful tool that could potentially drive prices higher over the long term and lead to a damaging trade war by encouraging tit-for-tat tariffs.
During the run-up to the presidential election in November 2024, Donald Trump made it clear that he intends to use tariffs to support the US economy and American producers. In 2024, Mexico, China and Canada accounted for 42% of total US imports. In this period, Mexico stood out as the top exporter with $466.6 billion, according to the US Census Bureau. Hence, Trump wants to focus on these three nations when imposing tariffs. He also plans to use the revenue generated through tariffs to lower personal income taxes.
- Silver price could further rise as the daily chart analysis suggests a persistent bullish bias.
- The pair may retest its three-month high of $32.65, reached on February 7.
- The nine-day EMA of $31.71 acts as immediate support.
Silver price (XAG/USD) rebounds from recent declines, hovering near $32.00 per troy ounce during Monday's Asian session. A daily chart analysis indicates a sustained bullish trend, with the metal price advancing within an ascending channel.
The XAG/USD pair remains above the nine-day and 14-day Exponential Moving Averages (EMAs), signaling strong short-term momentum. Additionally, the 14-day Relative Strength Index (RSI) stays above the 50 mark, further supporting the prevailing bullish sentiment.
Silver price could encounter initial resistance at its three-month high of $32.65, last tested on February 7, aligning with the upper boundary of the ascending channel. A decisive breakout above this level could strengthen the bullish trend, potentially driving the XAG/USD pair toward the psychological mark of $33.00.
On the downside, support is found at the nine-day EMA at $31.71, followed by the 14-day EMA at $31.44, and the ascending channel’s lower boundary at $31.10. A breach below this key support zone could weaken the bullish outlook, exposing the XAG/USD pair to further downside toward its five-month low of $28.74, recorded on December 19.
XAG/USD: Daily Chart
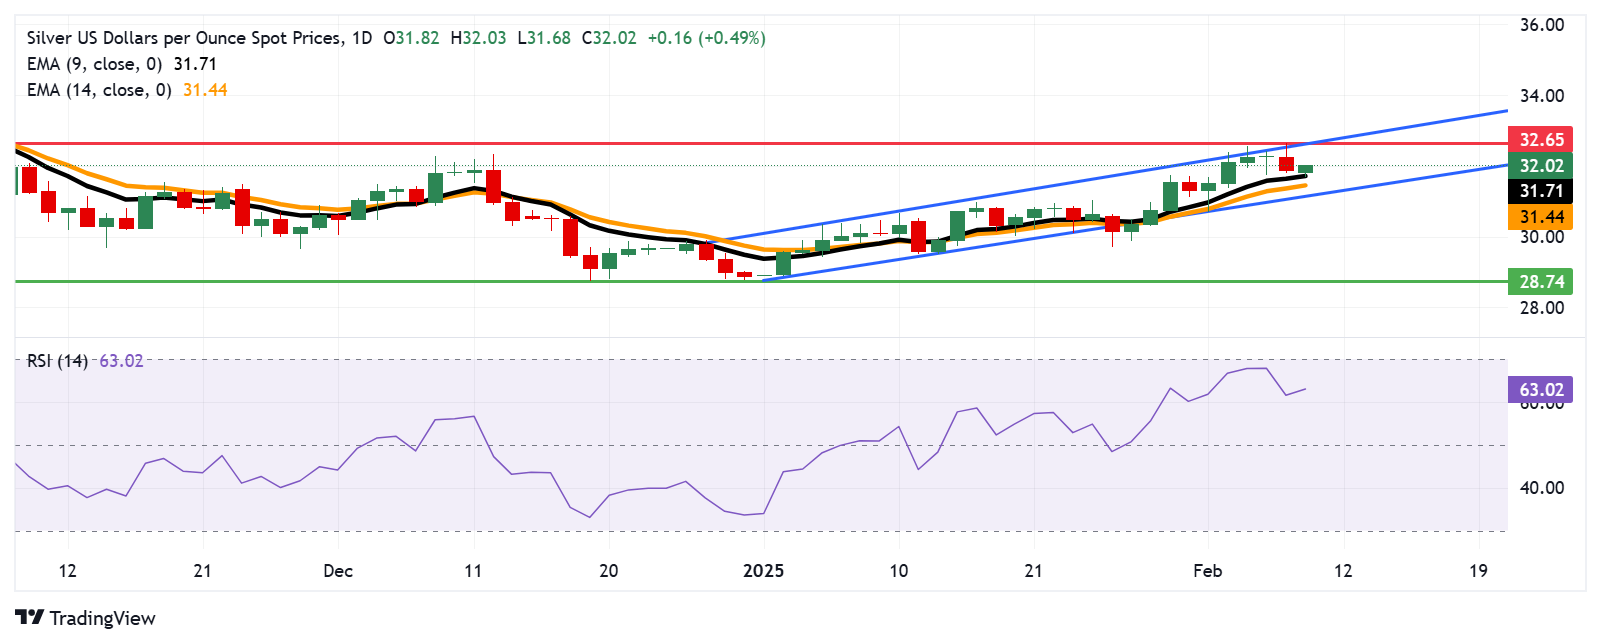
Silver FAQs
Silver is a precious metal highly traded among investors. It has been historically used as a store of value and a medium of exchange. Although less popular than Gold, traders may turn to Silver to diversify their investment portfolio, for its intrinsic value or as a potential hedge during high-inflation periods. Investors can buy physical Silver, in coins or in bars, or trade it through vehicles such as Exchange Traded Funds, which track its price on international markets.
Silver prices can move due to a wide range of factors. Geopolitical instability or fears of a deep recession can make Silver price escalate due to its safe-haven status, although to a lesser extent than Gold's. As a yieldless asset, Silver tends to rise with lower interest rates. Its moves also depend on how the US Dollar (USD) behaves as the asset is priced in dollars (XAG/USD). A strong Dollar tends to keep the price of Silver at bay, whereas a weaker Dollar is likely to propel prices up. Other factors such as investment demand, mining supply – Silver is much more abundant than Gold – and recycling rates can also affect prices.
Silver is widely used in industry, particularly in sectors such as electronics or solar energy, as it has one of the highest electric conductivity of all metals – more than Copper and Gold. A surge in demand can increase prices, while a decline tends to lower them. Dynamics in the US, Chinese and Indian economies can also contribute to price swings: for the US and particularly China, their big industrial sectors use Silver in various processes; in India, consumers’ demand for the precious metal for jewellery also plays a key role in setting prices.
Silver prices tend to follow Gold's moves. When Gold prices rise, Silver typically follows suit, as their status as safe-haven assets is similar. The Gold/Silver ratio, which shows the number of ounces of Silver needed to equal the value of one ounce of Gold, may help to determine the relative valuation between both metals. Some investors may consider a high ratio as an indicator that Silver is undervalued, or Gold is overvalued. On the contrary, a low ratio might suggest that Gold is undervalued relative to Silver.
Responding to US President Donald Trump’s announcement of imposing new 25% tariffs on all steel and aluminum imports into the US, Australian Trade Minister Don Farrell said Monday that "Australian steel and aluminium is creating thousands of good-paying American jobs, and are key for our shared defence interests.”
Farrell is looking to secure a similar exemption from tariffs it won during the previous Trump presidency in 2018.
Market reaction
AUD/USD is trimming losses to trade near 0.6265, as of writing. The pair is still down 0.10% on the day.
Tariffs FAQs
Tariffs are customs duties levied on certain merchandise imports or a category of products. Tariffs are designed to help local producers and manufacturers be more competitive in the market by providing a price advantage over similar goods that can be imported. Tariffs are widely used as tools of protectionism, along with trade barriers and import quotas.
Although tariffs and taxes both generate government revenue to fund public goods and services, they have several distinctions. Tariffs are prepaid at the port of entry, while taxes are paid at the time of purchase. Taxes are imposed on individual taxpayers and businesses, while tariffs are paid by importers.
There are two schools of thought among economists regarding the usage of tariffs. While some argue that tariffs are necessary to protect domestic industries and address trade imbalances, others see them as a harmful tool that could potentially drive prices higher over the long term and lead to a damaging trade war by encouraging tit-for-tat tariffs.
During the run-up to the presidential election in November 2024, Donald Trump made it clear that he intends to use tariffs to support the US economy and American producers. In 2024, Mexico, China and Canada accounted for 42% of total US imports. In this period, Mexico stood out as the top exporter with $466.6 billion, according to the US Census Bureau. Hence, Trump wants to focus on these three nations when imposing tariffs. He also plans to use the revenue generated through tariffs to lower personal income taxes.
- USD/CAD appreciates as Trump announced plans to impose a 25% tariff on all steel and aluminum imports.
- The Canadian Dollar faces challenges as Canada is a major supplier of steel and aluminum to the US.
- The US Dollar gained support after January’s job report heightened the cautious mood surrounding the Fed’s policy outlook.
The USD/CAD pair breaks its four-day losing streak, trading around 1.4350 during the Asian session on Monday. This upside movement could be attributed to escalating trade tensions following recent remarks from US President Donald Trump.
President Trump told reporters aboard Air Force One on Sunday that he plans to impose a 25% tariff on all steel and aluminum imports, without specifying the affected countries. Trump also stated that additional reciprocal tariffs would be unveiled by midweek and implemented almost immediately, mirroring the tariff rates set by each country, according to Reuters.
The Canadian Dollar (CAD) faced downward pressure as Canada is a major supplier of steel to the United States (US). Furthermore, Canada, with its abundant hydropower resources, accounted for 79% of total US primary aluminum imports in the first 11 months of 2024.
"Canadian steel and aluminum support key industries in the US, from defense to shipbuilding and auto manufacturing," Canadian Innovation Minister François-Philippe Champagne posted on X. "We will continue to stand up for Canada, our workers, and our industries," per Reuters.
On Friday, the Canadian Dollar gained ground after stronger-than-expected employment data for January, causing USD/CAD to pull back. The Canadian labor market showed resilience, adding 76,000 jobs in January—far surpassing the expected 25,000, though still below December’s 91,000. The unemployment rate dropped to 6.6%, beating forecasts of 6.8% and improving from the previous 6.7%.
Meanwhile, January’s jobs report in the US indicated slowing job growth but a lower unemployment rate, which increased the likelihood of the US Federal Reserve (Fed) keeping interest rates steady this year. This supported the US Dollar (USD) and limited the downside for the USD/CAD pair.
US Bureau of Labor Statistics (BLS) reported that Nonfarm Payrolls (NFP) rose by 143,000 in January, significantly below December’s revised figure of 307,000 and below market expectations of 170,000. However, the unemployment rate edged down to 4% in January from 4.1% in December.
Canadian Dollar FAQs
The key factors driving the Canadian Dollar (CAD) are the level of interest rates set by the Bank of Canada (BoC), the price of Oil, Canada’s largest export, the health of its economy, inflation and the Trade Balance, which is the difference between the value of Canada’s exports versus its imports. Other factors include market sentiment – whether investors are taking on more risky assets (risk-on) or seeking safe-havens (risk-off) – with risk-on being CAD-positive. As its largest trading partner, the health of the US economy is also a key factor influencing the Canadian Dollar.
The Bank of Canada (BoC) has a significant influence on the Canadian Dollar by setting the level of interest rates that banks can lend to one another. This influences the level of interest rates for everyone. The main goal of the BoC is to maintain inflation at 1-3% by adjusting interest rates up or down. Relatively higher interest rates tend to be positive for the CAD. The Bank of Canada can also use quantitative easing and tightening to influence credit conditions, with the former CAD-negative and the latter CAD-positive.
The price of Oil is a key factor impacting the value of the Canadian Dollar. Petroleum is Canada’s biggest export, so Oil price tends to have an immediate impact on the CAD value. Generally, if Oil price rises CAD also goes up, as aggregate demand for the currency increases. The opposite is the case if the price of Oil falls. Higher Oil prices also tend to result in a greater likelihood of a positive Trade Balance, which is also supportive of the CAD.
While inflation had always traditionally been thought of as a negative factor for a currency since it lowers the value of money, the opposite has actually been the case in modern times with the relaxation of cross-border capital controls. Higher inflation tends to lead central banks to put up interest rates which attracts more capital inflows from global investors seeking a lucrative place to keep their money. This increases demand for the local currency, which in Canada’s case is the Canadian Dollar.
Macroeconomic data releases gauge the health of the economy and can have an impact on the Canadian Dollar. Indicators such as GDP, Manufacturing and Services PMIs, employment, and consumer sentiment surveys can all influence the direction of the CAD. A strong economy is good for the Canadian Dollar. Not only does it attract more foreign investment but it may encourage the Bank of Canada to put up interest rates, leading to a stronger currency. If economic data is weak, however, the CAD is likely to fall.
- WTI scales higher for the second straight day amid worries that Iran's oil supply could be disrupted.
- Concerns that Trump’s trade tariffs will hamper global growth and temper fuel demand cap gains.
- A modest USD strength further contributes to keeping a lid on the upside for Crude Oil prices.
West Texas Intermediate (WTI) US Crude Oil prices gain some positive traction for the second successive day on Monday and move away from the lowest level since December 30, around the $70.30-$70.25 area touched last week. The commodity currently trades around the $71.25 region, up over 0.60% for the day, though it lacks bullish conviction amid mixed fundamental cues.
US President Donald Trump's administration issued a fresh round of sanctions targeting several individuals and vessels involved in the sale and transportation of Iranian crude to China. Adding to this, Trump said that he would return to a maximum-pressure approach to Iran and seek to reduce Iranian oil exports to zero. This, in turn, fuels concern that Iran's oil supply could be disrupted and acts as a tailwind for the black liquid.
That said, worries that Trump's trade tariffs could dampen global economic growth and dent energy demand keep a lid on any gains for Crude Oil prices. In fact, Trump threatened on Sunday he would announce additional 25% tariffs on all steel and aluminum imports into the US, and will also announce reciprocal duties over what he sees as unfair trading practices. This comes on top of the escalating US-China trade war and warrants caution for bulls.
Apart from this, a modest US Dollar (USD) strength, bolstered by expectations that Trump's protectionist policies would boost inflation and limit the scope for the Federal Reserve (Fed) to ease further, might contribute to capping Crude Oil prices. Hence, it will be prudent to wait for strong follow-through buying before confirming that the recent downfall witnessed over the past three weeks or so has run its course and placing bullish bets around the commodity.
WTI Oil FAQs
WTI Oil is a type of Crude Oil sold on international markets. The WTI stands for West Texas Intermediate, one of three major types including Brent and Dubai Crude. WTI is also referred to as “light” and “sweet” because of its relatively low gravity and sulfur content respectively. It is considered a high quality Oil that is easily refined. It is sourced in the United States and distributed via the Cushing hub, which is considered “The Pipeline Crossroads of the World”. It is a benchmark for the Oil market and WTI price is frequently quoted in the media.
Like all assets, supply and demand are the key drivers of WTI Oil price. As such, global growth can be a driver of increased demand and vice versa for weak global growth. Political instability, wars, and sanctions can disrupt supply and impact prices. The decisions of OPEC, a group of major Oil-producing countries, is another key driver of price. The value of the US Dollar influences the price of WTI Crude Oil, since Oil is predominantly traded in US Dollars, thus a weaker US Dollar can make Oil more affordable and vice versa.
The weekly Oil inventory reports published by the American Petroleum Institute (API) and the Energy Information Agency (EIA) impact the price of WTI Oil. Changes in inventories reflect fluctuating supply and demand. If the data shows a drop in inventories it can indicate increased demand, pushing up Oil price. Higher inventories can reflect increased supply, pushing down prices. API’s report is published every Tuesday and EIA’s the day after. Their results are usually similar, falling within 1% of each other 75% of the time. The EIA data is considered more reliable, since it is a government agency.
OPEC (Organization of the Petroleum Exporting Countries) is a group of 12 Oil-producing nations who collectively decide production quotas for member countries at twice-yearly meetings. Their decisions often impact WTI Oil prices. When OPEC decides to lower quotas, it can tighten supply, pushing up Oil prices. When OPEC increases production, it has the opposite effect. OPEC+ refers to an expanded group that includes ten extra non-OPEC members, the most notable of which is Russia.
- USD/CNH extends the rally to near 7.3140 in Monday’s Asian session.
- The positive view of the pair prevails above the key 100-day EMA with the bullish RSI indicator.
- The first upside barrier is seen at 7.3595; the initial support level is located at 7.2688.
The USD/CNH pair gains ground to around 7.3140 during the Asian trading hours on Monday. The US Dollar (USD) edges higher after US President Donald Trump said that he plans to announce reciprocal tariffs on many countries by Monday or Tuesday, without specifying which countries. Additionally, Trump stated on Sunday that he was set to impose new 25% tariffs on all steel and aluminum imports.
According to the daily chart, the bullish outlook of USD/CNH remains intact, with the price holding above the key 100-period Exponential Moving Average (EMA). The upward momentum is supported by the Relative Strength Index (RSI), which stands above the midline near 55.00, suggesting the path of least resistance is to the upside.
The upper boundary of the Bollinger Band of 7.3595 acts as an upside barrier for the pair. A decisive break above this level could pave the way to 7.3673, the high of February 3.
On the flip side, the initial support level for USD/CNH emerges at 7.2688, the low of February 5. Extended losses could see a drop to 7.2568, the 100-day EMA. The additional downside filter to watch is 7.2320, the lower limit of the Bollinger Band.
USD/CNH daily chart
US-China Trade War FAQs
Generally speaking, a trade war is an economic conflict between two or more countries due to extreme protectionism on one end. It implies the creation of trade barriers, such as tariffs, which result in counter-barriers, escalating import costs, and hence the cost of living.
An economic conflict between the United States (US) and China began early in 2018, when President Donald Trump set trade barriers on China, claiming unfair commercial practices and intellectual property theft from the Asian giant. China took retaliatory action, imposing tariffs on multiple US goods, such as automobiles and soybeans. Tensions escalated until the two countries signed the US-China Phase One trade deal in January 2020. The agreement required structural reforms and other changes to China’s economic and trade regime and pretended to restore stability and trust between the two nations. However, the Coronavirus pandemic took the focus out of the conflict. Yet, it is worth mentioning that President Joe Biden, who took office after Trump, kept tariffs in place and even added some additional levies.
The return of Donald Trump to the White House as the 47th US President has sparked a fresh wave of tensions between the two countries. During the 2024 election campaign, Trump pledged to impose 60% tariffs on China once he returned to office, which he did on January 20, 2025. With Trump back, the US-China trade war is meant to resume where it was left, with tit-for-tat policies affecting the global economic landscape amid disruptions in global supply chains, resulting in a reduction in spending, particularly investment, and directly feeding into the Consumer Price Index inflation.
| Raw materials | Closed | Change, % |
|---|---|---|
| Silver | 31.802 | -1.25 |
| Gold | 2861.66 | 0.2 |
| Palladium | 965.87 | -1.28 |
- The Indian Rupee weakens in Monday’s Asian session.
- US Dollar demand, sustained portfolio outflows, and rising global uncertainty continue to undermine the INR.
- RBI intervention might cap the downside for the local currency.
The Indian Rupee (INR) declines on Monday, pressured by increased US Dollar (USD) demand, possibly linked to the non-deliverable forwards market. Additionally, sustained foreign portfolio investors (FPI) outflows, the concern about an economic slowdown in India, and the uncertainty of US President Donald Trump’s tariff policies contribute to the INR's downside.
However, USD sales by state-run banks, though most likely on behalf of the Reserve Bank of India (RBI), might help limit the local currency’s losses. In the absence of the top-tier economic data releases from the US and India on Monday, the USD/INR pair will be influenced by the USD.
Indian Rupee remains vulnerable amid multiple headwinds
- The Reserve Bank of India’s (RBI) Monetary Policy Committee (MPC) decided to cut the policy repo rate by 25 basis points (bps) to 6.25% for the first time in nearly five years.
- RBI Governor Sanjay Malhotra said the central bank was keeping its policy stance "neutral," which would open more space to support growth, signaling further rate cuts.
- The RBI forecasts headline inflation for FY25 at 4.8%, while the projection for FY26 remains unchanged at 4.2%.
- The Indian central bank estimates real GDP growth for the next year to be at about 6.7% for the first quarter (Q1), 6.7% for Q2, 7% for Q3, and 6.5% for Q4.
- US President Donald Trump said on Friday he plans to announce reciprocal tariffs on many countries by Monday or Tuesday, to take effect almost immediately, per Reuters.
- The US Nonfarm Payrolls (NFP) rose by 143K in January, compared to the 307K increase (revised from 256,000) seen in December, according to the US Bureau of Labor Statistics (BLS) on Friday. This figure came in below the market expectation of 170K.
- The Unemployment Rate ticked lower to 4% in January from 4.1% in December. The Average Hourly Earnings climbed 4.1% YoY in January, surpassing the market expectation of 3.8%.
USD/INR maintains a constructive view, overbought RSI warrants caution for bulls
The Indian Rupee trades on a weaker note on the day. The USD/INR pair paints a positive picture on the daily chart, characterized by the price holding above the key 100-day Exponential Moving Average (EMA).
Nonetheless, the overbought 14-day Relative Strength Index (RSI) beyond the 70.00 mark warrants caution for bullish traders, potentially signaling a temporary weakness or further consolidation in the near term.
An all-time high of 87.62 acts as an immediate resistance level for USD/INR. Bullish candlesticks and buying pressure above this level might attract bulls aiming for the 88.00 psychological level.
On the other hand, the first downside target to watch is the 87.05-87.00 regions, representing the low of February 5 and the round mark. Consistent trading below the mentioned level, the bears could take control and drag the pair down to 86.51, the low of February 3.
Indian Rupee FAQs
The Indian Rupee (INR) is one of the most sensitive currencies to external factors. The price of Crude Oil (the country is highly dependent on imported Oil), the value of the US Dollar – most trade is conducted in USD – and the level of foreign investment, are all influential. Direct intervention by the Reserve Bank of India (RBI) in FX markets to keep the exchange rate stable, as well as the level of interest rates set by the RBI, are further major influencing factors on the Rupee.
The Reserve Bank of India (RBI) actively intervenes in forex markets to maintain a stable exchange rate, to help facilitate trade. In addition, the RBI tries to maintain the inflation rate at its 4% target by adjusting interest rates. Higher interest rates usually strengthen the Rupee. This is due to the role of the ‘carry trade’ in which investors borrow in countries with lower interest rates so as to place their money in countries’ offering relatively higher interest rates and profit from the difference.
Macroeconomic factors that influence the value of the Rupee include inflation, interest rates, the economic growth rate (GDP), the balance of trade, and inflows from foreign investment. A higher growth rate can lead to more overseas investment, pushing up demand for the Rupee. A less negative balance of trade will eventually lead to a stronger Rupee. Higher interest rates, especially real rates (interest rates less inflation) are also positive for the Rupee. A risk-on environment can lead to greater inflows of Foreign Direct and Indirect Investment (FDI and FII), which also benefit the Rupee.
Higher inflation, particularly, if it is comparatively higher than India’s peers, is generally negative for the currency as it reflects devaluation through oversupply. Inflation also increases the cost of exports, leading to more Rupees being sold to purchase foreign imports, which is Rupee-negative. At the same time, higher inflation usually leads to the Reserve Bank of India (RBI) raising interest rates and this can be positive for the Rupee, due to increased demand from international investors. The opposite effect is true of lower inflation.
- The Japanese Yen is pressured by renewed worries about Trump’s trade tariffs.
- A modest USD strength provides a goodish lift to the USD/JPY pair on Monday.
- The divergent BoJ-Fed policy expectations should help limit deeper JPY losses.
The Japanese Yen (JPY) attracts some sellers at the start of a new week as US President Donald Trump's tariff threats revive fears that Japan would also be an eventual target of new US levies. Apart from this, a modest US Dollar (USD) strength, lifts the USD/JPY pair to the 152.00 mark during the Asian session. Against the backdrop of the upbeat US jobs report released on Friday, expectations that Trump's policies could boost inflation and limit the scope for the Federal Reserve (Fed) to ease policy provide a modest lift to the Greenback.
Any meaningful JPY depreciation, however, seems elusive in the wake of the growing acceptance that the Bank of Japan (BoJ) will hike interest rates again this year, which continues to push Japanese government bond (JGB) yields higher. The resultant narrowing of the rate differential between Japan and other major central banks should, in turn, limit the downside for the lower-yielding JPY. Hence, it will be prudent to wait for strong follow-through JPY selling before confirming that the USD/JPY pair has bottomed out in the near term.
Japanese Yen bulls turn cautious amid Trump’s fresh tariff threats
- US President Donald Trump said on Sunday that he will announce an additional 25% tariffs on all steel and aluminum imports into the US, and will also announce reciprocal duties over what he sees as unfair trading practices.
- Worries that Trump's protectionist policies would put upward pressure on inflation, along with Friday's upbeat US job data, should allow the Federal Reserve to keep rates on hold, which, in turn, boosts the US Dollar.
- The closely-watched US Nonfarm Payrolls (NFP) report showed that the Unemployment Rate declined to 4% from 4.1% and Average Hourly Earnings rose more than expected by 4.1% during the reported month.
- Other details of the publication revealed that the number of employed people rose by 143,000 in January compared to the 170,000 expected and the 307,000 increase (revised from 256,000) recorded in the previous month.
- The International Monetary Fund (IMF) warned last week that Japan should remain alert to potential spillover effects from rising volatility in global markets that could affect liquidity conditions for its financial institutions.
- The IMF added that Japan needs to be vigilant about monitoring any fallout from the Bank of Japan's rate hikes, such as an increase in the government's debt-servicing costs and a possible jump in corporate bankruptcies.
- Kazuhiro Masaki, Director General of the BoJ's monetary affairs department, said last Thursday that the central bank will continue to raise interest rates if underlying inflation accelerates toward its 2% target as projected.
- This comes on top of data showing that Japan’s inflation-adjusted real wages rose 0.6% year-on-year in December – marking the second consecutive monthly gain – and backs the case for further tightening by the BoJ.
- The view was echoed in the Summary of Opinions from the BoJ's January meeting, which revealed that board members had discussed the likelihood of raising interest rates further and should support the Japanese Yen.
USD/JPY could face stiff resistance near the 152.45-152.50 confluence
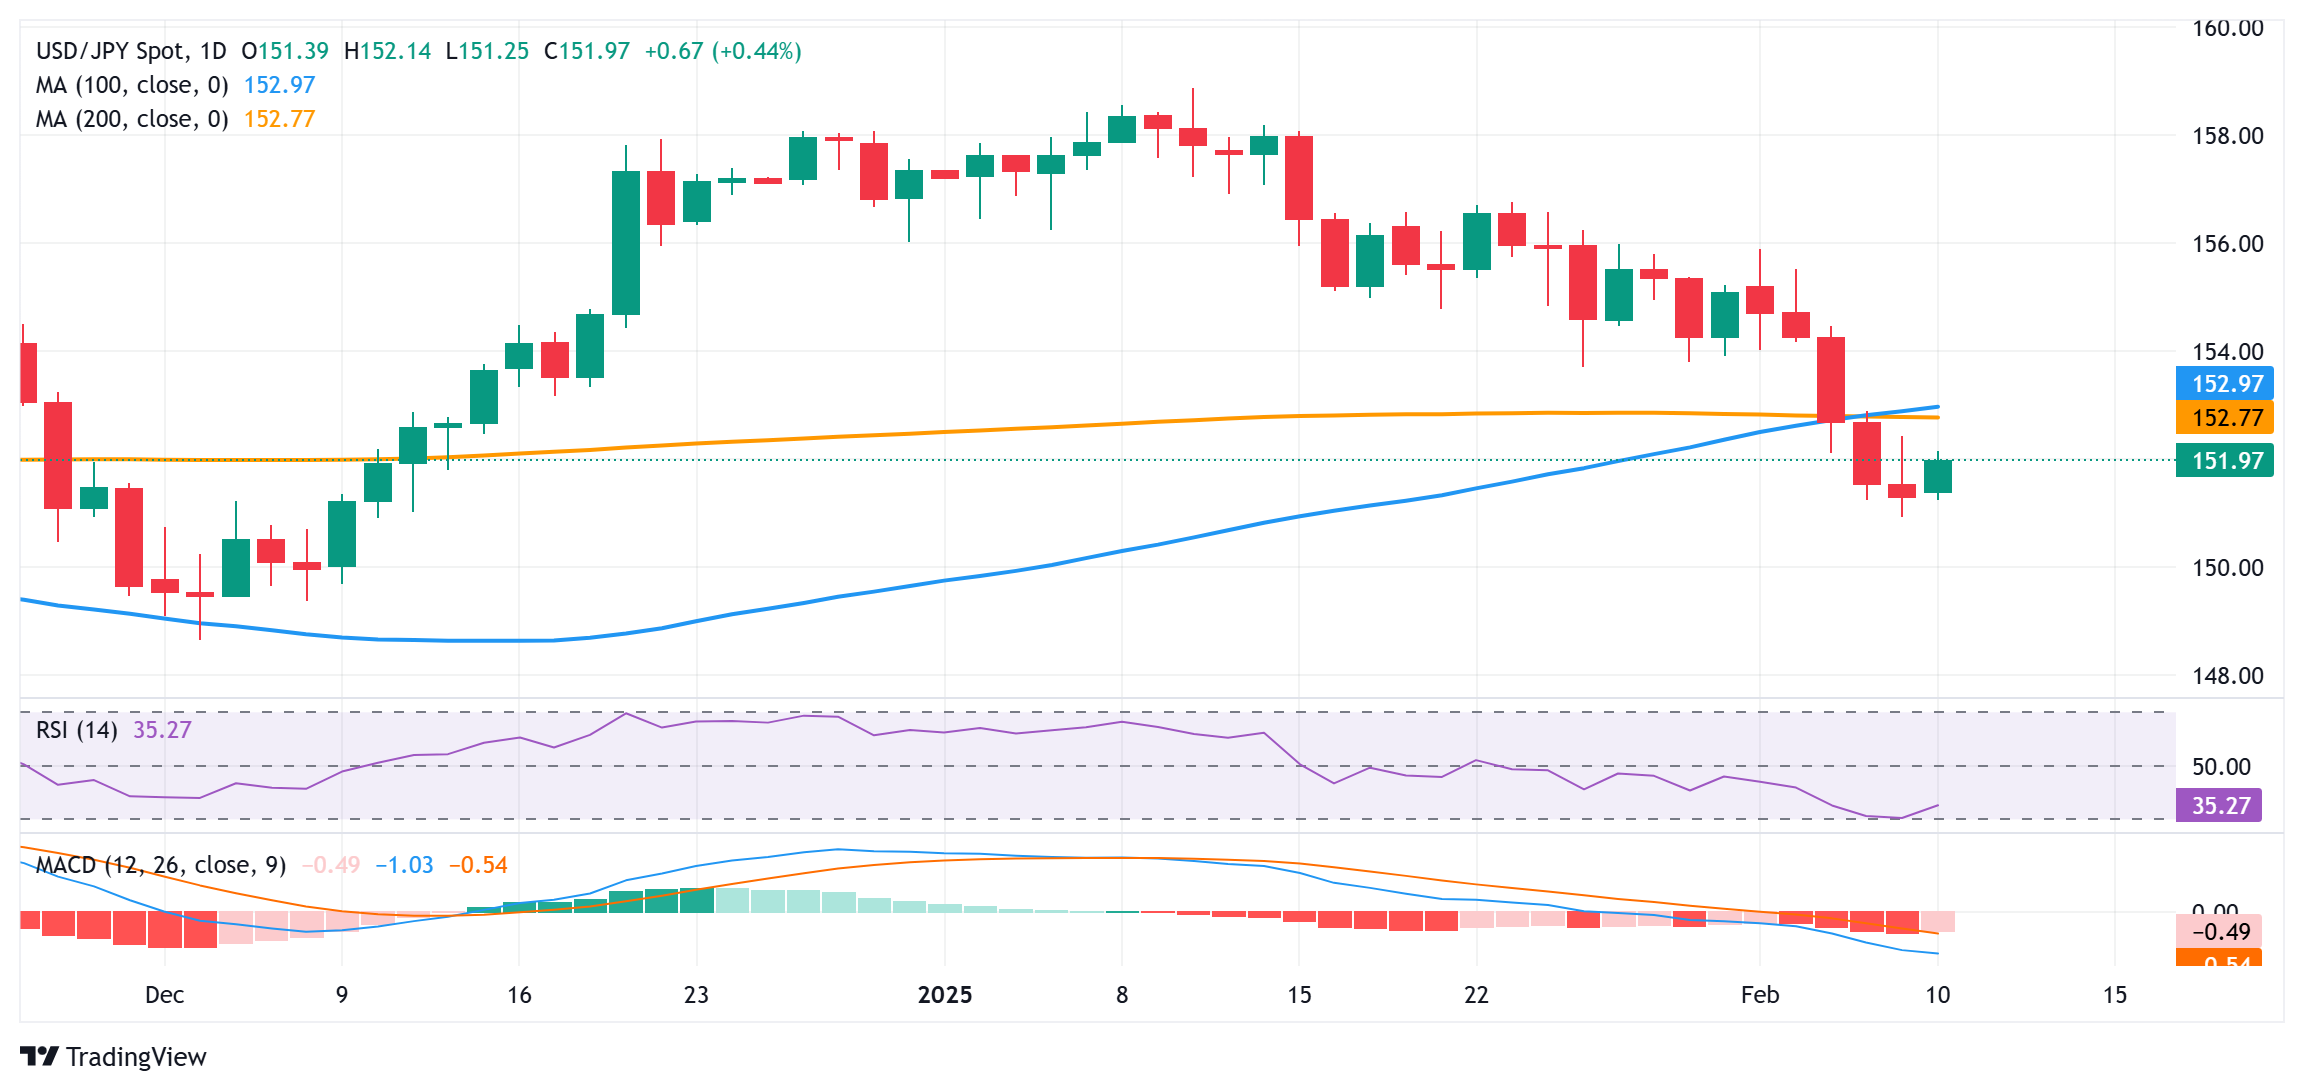
Technical indicators on the daily chart are holding deep in negative territory and are still away from being in the oversold zone. Apart from this, last week's breakdown below the 152.50-152.45 confluence – comprising the 100- and the 200-day Simple Moving Averages (SMAs) – favors bearish traders. Hence, any subsequent move-up is more likely to attract fresh sellers and remain capped near the said confluence support breakpoint. Some follow-through buying, however, might trigger a short-covering move and allow the USD/JPY pair to reclaim the 153.00 round figure.
On the flip side, the Asian session low, around the 151.25 area, now seems to protect the immediate downside ahead of the 151.00-150.95 area, or the lowest level since December 10 touched on Friday. Acceptance below the latter could drag the USD/JPY pair below the 150.55-150.50 intermediate support, toward the 150.00 psychological mark. The downward trajectory could extend further towards the 149.60 horizontal support en route to the 149.00 mark and the December swing low, around the 148.65 region.
Japanese Yen FAQs
The Japanese Yen (JPY) is one of the world’s most traded currencies. Its value is broadly determined by the performance of the Japanese economy, but more specifically by the Bank of Japan’s policy, the differential between Japanese and US bond yields, or risk sentiment among traders, among other factors.
One of the Bank of Japan’s mandates is currency control, so its moves are key for the Yen. The BoJ has directly intervened in currency markets sometimes, generally to lower the value of the Yen, although it refrains from doing it often due to political concerns of its main trading partners. The BoJ ultra-loose monetary policy between 2013 and 2024 caused the Yen to depreciate against its main currency peers due to an increasing policy divergence between the Bank of Japan and other main central banks. More recently, the gradually unwinding of this ultra-loose policy has given some support to the Yen.
Over the last decade, the BoJ’s stance of sticking to ultra-loose monetary policy has led to a widening policy divergence with other central banks, particularly with the US Federal Reserve. This supported a widening of the differential between the 10-year US and Japanese bonds, which favored the US Dollar against the Japanese Yen. The BoJ decision in 2024 to gradually abandon the ultra-loose policy, coupled with interest-rate cuts in other major central banks, is narrowing this differential.
The Japanese Yen is often seen as a safe-haven investment. This means that in times of market stress, investors are more likely to put their money in the Japanese currency due to its supposed reliability and stability. Turbulent times are likely to strengthen the Yen’s value against other currencies seen as more risky to invest in.
Tariffs FAQs
Tariffs are customs duties levied on certain merchandise imports or a category of products. Tariffs are designed to help local producers and manufacturers be more competitive in the market by providing a price advantage over similar goods that can be imported. Tariffs are widely used as tools of protectionism, along with trade barriers and import quotas.
Although tariffs and taxes both generate government revenue to fund public goods and services, they have several distinctions. Tariffs are prepaid at the port of entry, while taxes are paid at the time of purchase. Taxes are imposed on individual taxpayers and businesses, while tariffs are paid by importers.
There are two schools of thought among economists regarding the usage of tariffs. While some argue that tariffs are necessary to protect domestic industries and address trade imbalances, others see them as a harmful tool that could potentially drive prices higher over the long term and lead to a damaging trade war by encouraging tit-for-tat tariffs.
During the run-up to the presidential election in November 2024, Donald Trump made it clear that he intends to use tariffs to support the US economy and American producers. In 2024, Mexico, China and Canada accounted for 42% of total US imports. In this period, Mexico stood out as the top exporter with $466.6 billion, according to the US Census Bureau. Hence, Trump wants to focus on these three nations when imposing tariffs. He also plans to use the revenue generated through tariffs to lower personal income taxes.
- The Australian Dollar loses ground as Trump plans to impose a 25% tariff on all steel and aluminum imports.
- The AUD faced challenges as China's retaliatory tariffs on certain US exports have come into effect.
- The US Dollar received support as January’s job report reinforced the cautious mood surrounding the Fed’s policy outlook.
The Australian Dollar (AUD) remains under pressure against the US Dollar (USD) for the third consecutive day on Monday, weighed down by escalating trade war concerns. The AUD/USD pair faces downward momentum after US President Donald Trump, speaking aboard Air Force One, announced plans to impose a 25% tariff on all steel and aluminum imports without specifying the affected countries.
President Trump also stated that additional reciprocal tariffs would be unveiled by midweek, set to take effect almost immediately, matching the tariff rates imposed by each country, according to Reuters.
The Australian Dollar also weakened amid growing concerns over the US-China trade war, given Australia's close economic ties with China. A new US levy on Chinese imports took effect last week, while China's retaliatory tariffs on certain US exports began this Monday.
Last week, Trump and Chinese President Xi Jinping had been expected to negotiate a resolution after reports surfaced about a potential phone call between the two leaders. However, that call was reportedly canceled, though hopes remain that it may still take place.
Traders are increasingly confident that the Reserve Bank of Australia (RBA) will cut its 4.35% cash rate at its upcoming meeting later in February, with market expectations suggesting a 95% probability of a reduction to 4.10%. This follows data indicating that underlying inflation has moderated faster than the RBA had anticipated, prompting several major Australian banks to move their forecast for the first rate cut from May to February.
Australian Dollar declines as US Dollar advances amid a cautious Fed
- The US Dollar Index (DXY), which measures the US Dollar’s value against six major currencies, rises above 108.00 at the time of writing. The Greenback receives support as the US Federal Reserve (Fed) is now expected to keep interest rates steady this year, following January’s jobs report released on Friday, which indicated slowing job growth but a lower Unemployment Rate.
- US Nonfarm Payrolls (NFP) increased by 143,000 in January, significantly below December’s revised figure of 307,000 and the market expectation of 170,000. However, the Unemployment Rate declined slightly to 4% in January from 4.1% in December.
- US Initial Jobless Claims rose to 219K for the week ending January 31, as reported by the US Department of Labor (DOL) on Thursday. This print surpasses initial estimates of 213K and was higher than the previous week's revised tally of 208K (from 207K).
- Federal Reserve (Fed) Bank of Chicago President Austan Goolsbee mentioned on Friday that inconsistent policy approaches from the US government cause a high level of economic uncertainty that makes it difficult for the Fed to draw a bead on where the economy, and inflation specifically, are likely heading.
- Meanwhile, Fed Board of Governors member Adriana Kugler noted that US growth and economic activity remain healthy overall, but noted that progress toward the Fed's inflation goals has been somewhat lopsided, per Reuters.
- In an interview with CNBC, Minneapolis Fed President Neel Kashkari said that he would move towards supporting further rate cuts if they see good inflation data and the labor market stays strong
- China’s Consumer Price Index (CPI) grew at an annual rate of 0.5% in January, up from 0.1% in December and exceeding the market forecast of 0.4%. On a monthly basis, CPI inflation rose 0.7% in January, compared to December’s flat reading of 0%, though it fell short of the expected 0.8% increase.
- China’s Producer Price Index (PPI) declined 2.3% year-over-year in January, matching December’s drop but coming in weaker than the market consensus of a 2.1% decrease.
Technical Analysis: Australian Dollar tests 14-day EMA near 0.6250
The AUD/USD pair hovers near 0.6250 on Monday, testing the 14-day Exponential Moving Average (EMA) on the daily chart. A break below this level could weaken short-term price momentum. The 14-day Relative Strength Index (RSI) is also near the 50 mark, with further movement likely to determine a clearer directional trend.
The AUD/USD pair is testing immediate support at the 14-day EMA of 0.6253. A decisive break below this level could shift the bias bearish, potentially pushing the pair toward 0.6087—the lowest level since April 2020, recorded on February 3.
On the upside, the AUD/USD pair may explore the region around the eight-week high of 0.6330, last reached on January 24.
AUD/USD: Daily Chart
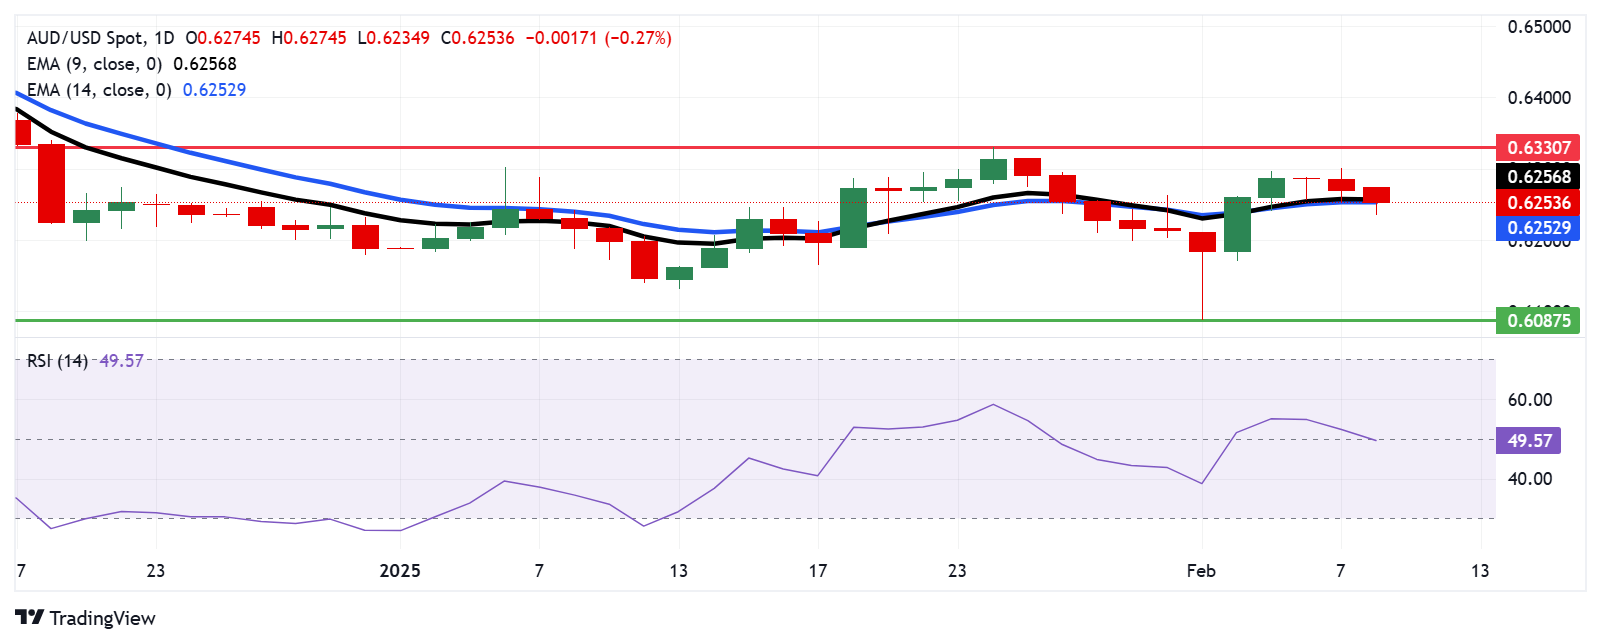
Australian Dollar PRICE Today
The table below shows the percentage change of Australian Dollar (AUD) against listed major currencies today. Australian Dollar was the weakest against the US Dollar.
| USD | EUR | GBP | JPY | CAD | AUD | NZD | CHF | |
|---|---|---|---|---|---|---|---|---|
| USD | 0.24% | 0.11% | 0.44% | 0.45% | 0.32% | 0.36% | 0.27% | |
| EUR | -0.24% | -0.07% | 0.31% | 0.32% | 0.07% | 0.21% | 0.10% | |
| GBP | -0.11% | 0.07% | 0.23% | 0.35% | 0.13% | 0.27% | 0.16% | |
| JPY | -0.44% | -0.31% | -0.23% | -0.04% | -0.05% | -0.08% | -0.17% | |
| CAD | -0.45% | -0.32% | -0.35% | 0.04% | -0.10% | -0.11% | -0.22% | |
| AUD | -0.32% | -0.07% | -0.13% | 0.05% | 0.10% | 0.14% | 0.03% | |
| NZD | -0.36% | -0.21% | -0.27% | 0.08% | 0.11% | -0.14% | -0.10% | |
| CHF | -0.27% | -0.10% | -0.16% | 0.17% | 0.22% | -0.03% | 0.10% |
The heat map shows percentage changes of major currencies against each other. The base currency is picked from the left column, while the quote currency is picked from the top row. For example, if you pick the Australian Dollar from the left column and move along the horizontal line to the US Dollar, the percentage change displayed in the box will represent AUD (base)/USD (quote).
Australian Dollar FAQs
One of the most significant factors for the Australian Dollar (AUD) is the level of interest rates set by the Reserve Bank of Australia (RBA). Because Australia is a resource-rich country another key driver is the price of its biggest export, Iron Ore. The health of the Chinese economy, its largest trading partner, is a factor, as well as inflation in Australia, its growth rate and Trade Balance. Market sentiment – whether investors are taking on more risky assets (risk-on) or seeking safe-havens (risk-off) – is also a factor, with risk-on positive for AUD.
The Reserve Bank of Australia (RBA) influences the Australian Dollar (AUD) by setting the level of interest rates that Australian banks can lend to each other. This influences the level of interest rates in the economy as a whole. The main goal of the RBA is to maintain a stable inflation rate of 2-3% by adjusting interest rates up or down. Relatively high interest rates compared to other major central banks support the AUD, and the opposite for relatively low. The RBA can also use quantitative easing and tightening to influence credit conditions, with the former AUD-negative and the latter AUD-positive.
China is Australia’s largest trading partner so the health of the Chinese economy is a major influence on the value of the Australian Dollar (AUD). When the Chinese economy is doing well it purchases more raw materials, goods and services from Australia, lifting demand for the AUD, and pushing up its value. The opposite is the case when the Chinese economy is not growing as fast as expected. Positive or negative surprises in Chinese growth data, therefore, often have a direct impact on the Australian Dollar and its pairs.
Iron Ore is Australia’s largest export, accounting for $118 billion a year according to data from 2021, with China as its primary destination. The price of Iron Ore, therefore, can be a driver of the Australian Dollar. Generally, if the price of Iron Ore rises, AUD also goes up, as aggregate demand for the currency increases. The opposite is the case if the price of Iron Ore falls. Higher Iron Ore prices also tend to result in a greater likelihood of a positive Trade Balance for Australia, which is also positive of the AUD.
The Trade Balance, which is the difference between what a country earns from its exports versus what it pays for its imports, is another factor that can influence the value of the Australian Dollar. If Australia produces highly sought after exports, then its currency will gain in value purely from the surplus demand created from foreign buyers seeking to purchase its exports versus what it spends to purchase imports. Therefore, a positive net Trade Balance strengthens the AUD, with the opposite effect if the Trade Balance is negative.
On Monday, the People’s Bank of China (PBOC) set the USD/CNY central rate for the trading session ahead at 7.1707 as compared to Friday's fix of 7.1699 and 7.3050 Reuters estimates.
PBOC FAQs
The primary monetary policy objectives of the People's Bank of China (PBoC) are to safeguard price stability, including exchange rate stability, and promote economic growth. China’s central bank also aims to implement financial reforms, such as opening and developing the financial market.
The PBoC is owned by the state of the People's Republic of China (PRC), so it is not considered an autonomous institution. The Chinese Communist Party (CCP) Committee Secretary, nominated by the Chairman of the State Council, has a key influence on the PBoC’s management and direction, not the governor. However, Mr. Pan Gongsheng currently holds both of these posts.
Unlike the Western economies, the PBoC uses a broader set of monetary policy instruments to achieve its objectives. The primary tools include a seven-day Reverse Repo Rate (RRR), Medium-term Lending Facility (MLF), foreign exchange interventions and Reserve Requirement Ratio (RRR). However, The Loan Prime Rate (LPR) is China’s benchmark interest rate. Changes to the LPR directly influence the rates that need to be paid in the market for loans and mortgages and the interest paid on savings. By changing the LPR, China’s central bank can also influence the exchange rates of the Chinese Renminbi.
Yes, China has 19 private banks – a small fraction of the financial system. The largest private banks are digital lenders WeBank and MYbank, which are backed by tech giants Tencent and Ant Group, per The Straits Times. In 2014, China allowed domestic lenders fully capitalized by private funds to operate in the state-dominated financial sector.
- GBP/USD softens to around 1.2390 in Monday’s Asian session, losing 0.14% on the day.
- Trump said he will announce reciprocal tariffs on many countries this week.
- BoE’s Bailey reiterated that a “gradual and careful approach to monetary policy remains appropriate.”
The GBP/USD pair weakens to near 1.239 during the Asian trading hours on Monday. The US Dollar climbs after US President Donald Trump promised reciprocal tariffs. The release of the US Consumer Price Index (CPI) for January will take center stage later on Wednesday.
Trump said on Friday that he would announce reciprocal tariffs on Tuesday or Wednesday on countries that tax US imports, with them going into effect 'almost immediately'.
Tariffs on UK goods exported to the US may still be on the cards, though Trump has said a deal “can be worked out." Traders will closely watch the developments surrounding more tariff policies from Trump. Any signs of escalating trade war tensions could boost the safe-haven USD.
The expectation of further rate cuts by the Bank of England (BoE) could undermine the Pound Sterling (GBP). BoE Governor Andrew Bailey said that additional rate reductions should be expected but that “we will have to judge meeting by meeting how far and how fast.". Bailey added during the press conference that economic activity is weakening and the jobs market is slowing down. Markets are currently pricing in another 50 basis points (bps) of cuts in 2025.
Pound Sterling FAQs
The Pound Sterling (GBP) is the oldest currency in the world (886 AD) and the official currency of the United Kingdom. It is the fourth most traded unit for foreign exchange (FX) in the world, accounting for 12% of all transactions, averaging $630 billion a day, according to 2022 data. Its key trading pairs are GBP/USD, also known as ‘Cable’, which accounts for 11% of FX, GBP/JPY, or the ‘Dragon’ as it is known by traders (3%), and EUR/GBP (2%). The Pound Sterling is issued by the Bank of England (BoE).
The single most important factor influencing the value of the Pound Sterling is monetary policy decided by the Bank of England. The BoE bases its decisions on whether it has achieved its primary goal of “price stability” – a steady inflation rate of around 2%. Its primary tool for achieving this is the adjustment of interest rates. When inflation is too high, the BoE will try to rein it in by raising interest rates, making it more expensive for people and businesses to access credit. This is generally positive for GBP, as higher interest rates make the UK a more attractive place for global investors to park their money. When inflation falls too low it is a sign economic growth is slowing. In this scenario, the BoE will consider lowering interest rates to cheapen credit so businesses will borrow more to invest in growth-generating projects.
Data releases gauge the health of the economy and can impact the value of the Pound Sterling. Indicators such as GDP, Manufacturing and Services PMIs, and employment can all influence the direction of the GBP. A strong economy is good for Sterling. Not only does it attract more foreign investment but it may encourage the BoE to put up interest rates, which will directly strengthen GBP. Otherwise, if economic data is weak, the Pound Sterling is likely to fall.
Another significant data release for the Pound Sterling is the Trade Balance. This indicator measures the difference between what a country earns from its exports and what it spends on imports over a given period. If a country produces highly sought-after exports, its currency will benefit purely from the extra demand created from foreign buyers seeking to purchase these goods. Therefore, a positive net Trade Balance strengthens a currency and vice versa for a negative balance.
- EUR/USD depreciates due to expected widening of interest rate gap between the United States and the Eurozone.
- President Trump announced plans to impose a 25% tariff on all steel and aluminum imports without naming the affected countries.
- German Chancellor Olaf Scholz warned that the European Union could respond “within an hour” if the US imposes the tariffs.
EUR/USD continues its losing streak for the third consecutive session, trading near 1.0310 during Asian trading hours on Monday. The pair remains under pressure as investors anticipate a widening interest rate gap between the United States (US) and the Eurozone.
The US Federal Reserve (Fed) is now expected to keep interest rates steady this year, following January’s jobs report, which indicated slowing job growth but a lower Unemployment Rate. This development supports the US Dollar and weighs on the EUR/USD pair. Meanwhile, the European Central Bank (ECB) recently cut rates and signaled the possibility of further easing in March.
On Friday, data from the US Bureau of Labor Statistics (BLS) showed that Nonfarm Payrolls (NFP) increased by 143,000 in January, significantly below December’s revised figure of 307,000 and the market expectation of 170,000. However, the Unemployment Rate declined slightly to 4% in January from 4.1% in December.
Speaking aboard Air Force One, US President Donald Trump announced plans to impose a 25% tariff on all steel and aluminum imports without specifying the affected countries. Trump also stated that additional reciprocal tariffs would be revealed by midweek, set to take effect almost immediately, matching the tariff rates imposed by each country, according to Reuters.
In response, German Chancellor Olaf Scholz stated on Sunday that the European Union (EU) could react “within an hour” if the US imposes the proposed tariffs. Separately, Bernd Lange, head of the European Parliament’s trade committee, suggested that to avoid a trade war, the EU is open to reducing its 10% import tax on vehicles to a rate closer to the 2.5% tariff imposed by the US.
Concerns over potential deflationary pressures due to expected US tariffs have intensified odds of deeper ECB rate cuts, with markets now predicting the deposit rate could fall to 1.87% by December.
Tariffs FAQs
Tariffs are customs duties levied on certain merchandise imports or a category of products. Tariffs are designed to help local producers and manufacturers be more competitive in the market by providing a price advantage over similar goods that can be imported. Tariffs are widely used as tools of protectionism, along with trade barriers and import quotas.
Although tariffs and taxes both generate government revenue to fund public goods and services, they have several distinctions. Tariffs are prepaid at the port of entry, while taxes are paid at the time of purchase. Taxes are imposed on individual taxpayers and businesses, while tariffs are paid by importers.
There are two schools of thought among economists regarding the usage of tariffs. While some argue that tariffs are necessary to protect domestic industries and address trade imbalances, others see them as a harmful tool that could potentially drive prices higher over the long term and lead to a damaging trade war by encouraging tit-for-tat tariffs.
During the run-up to the presidential election in November 2024, Donald Trump made it clear that he intends to use tariffs to support the US economy and American producers. In 2024, Mexico, China and Canada accounted for 42% of total US imports. In this period, Mexico stood out as the top exporter with $466.6 billion, according to the US Census Bureau. Hence, Trump wants to focus on these three nations when imposing tariffs. He also plans to use the revenue generated through tariffs to lower personal income taxes.
- NZD/USD attracts some sellers for the third straight day amid US-China trade war concerns.
- China’s inflation figures released over the weekend fail to provide any respite to the Kiwi.
- The divergent Fed-RBNZ expectations support prospects for a further depreciating move.
The NZD/USD pair drops to a four-day low during the Asian session on Monday, though it rebounds a few pips in the last hour and currently trades around mid-0.5600s. Spot prices, however, keep the red for the third straight day and remain vulnerable to sliding further amid worries about US-China trade tensions.
In fact, the additional US levy on China went into effect last week, while China's retaliatory tariffs on some US exports kicked off this Monday. Adding to this, US President Donald Trump said on Sunday that he will announce additional 25% tariffs on all steel and aluminum imports into the US, and will also announce reciprocal duties over what he sees as unfair trading practices. This raises the risk of a further escalation of trade war between the world's two largest economies and weighs on investors' sentiment, underpinning the safe-haven US Dollar (USD) and denting demand for the perceived riskier Kiwi.
Meanwhile, the latest development fuels worries that Trump's protectionist policies would put upward pressure on inflation in the US. This comes on top of the upbeat US monthly employment details released on Friday and could limit the scope for the Federal Reserve (Fed) to ease policy further. In fact, traders are now pricing in the possibility of just a 36 basis point rate cut by the Fed this year. This, to a larger extent, overshadows data showing that consumer inflation in China grew 0.7% month-on-month in January – its fastest rise in eleven months – compared to a flat reading in the previous month.
However, factory-gate prices continued their downward trajectory, highlighting persistent deflationary pressures in the industrial sector. This, along with the increasing likelihood that the Reserve Bank of New Zealand (RBNZ) will deliver a third consecutive supersized rate cut later this month, suggests that the path of least resistance or the NZD/USD pair remains to the downside. Hence, any attempted recovery could be seen as a selling opportunity and run the risk of fizzling out quickly. The focus now shifts to Fed Chair Jerome Powell's semi-annual congressional testimony on Tuesday and Wednesday.
New Zealand Dollar FAQs
The New Zealand Dollar (NZD), also known as the Kiwi, is a well-known traded currency among investors. Its value is broadly determined by the health of the New Zealand economy and the country’s central bank policy. Still, there are some unique particularities that also can make NZD move. The performance of the Chinese economy tends to move the Kiwi because China is New Zealand’s biggest trading partner. Bad news for the Chinese economy likely means less New Zealand exports to the country, hitting the economy and thus its currency. Another factor moving NZD is dairy prices as the dairy industry is New Zealand’s main export. High dairy prices boost export income, contributing positively to the economy and thus to the NZD.
The Reserve Bank of New Zealand (RBNZ) aims to achieve and maintain an inflation rate between 1% and 3% over the medium term, with a focus to keep it near the 2% mid-point. To this end, the bank sets an appropriate level of interest rates. When inflation is too high, the RBNZ will increase interest rates to cool the economy, but the move will also make bond yields higher, increasing investors’ appeal to invest in the country and thus boosting NZD. On the contrary, lower interest rates tend to weaken NZD. The so-called rate differential, or how rates in New Zealand are or are expected to be compared to the ones set by the US Federal Reserve, can also play a key role in moving the NZD/USD pair.
Macroeconomic data releases in New Zealand are key to assess the state of the economy and can impact the New Zealand Dollar’s (NZD) valuation. A strong economy, based on high economic growth, low unemployment and high confidence is good for NZD. High economic growth attracts foreign investment and may encourage the Reserve Bank of New Zealand to increase interest rates, if this economic strength comes together with elevated inflation. Conversely, if economic data is weak, NZD is likely to depreciate.
The New Zealand Dollar (NZD) tends to strengthen during risk-on periods, or when investors perceive that broader market risks are low and are optimistic about growth. This tends to lead to a more favorable outlook for commodities and so-called ‘commodity currencies’ such as the Kiwi. Conversely, NZD tends to weaken at times of market turbulence or economic uncertainty as investors tend to sell higher-risk assets and flee to the more-stable safe havens.
US-China Trade War FAQs
Generally speaking, a trade war is an economic conflict between two or more countries due to extreme protectionism on one end. It implies the creation of trade barriers, such as tariffs, which result in counter-barriers, escalating import costs, and hence the cost of living.
An economic conflict between the United States (US) and China began early in 2018, when President Donald Trump set trade barriers on China, claiming unfair commercial practices and intellectual property theft from the Asian giant. China took retaliatory action, imposing tariffs on multiple US goods, such as automobiles and soybeans. Tensions escalated until the two countries signed the US-China Phase One trade deal in January 2020. The agreement required structural reforms and other changes to China’s economic and trade regime and pretended to restore stability and trust between the two nations. However, the Coronavirus pandemic took the focus out of the conflict. Yet, it is worth mentioning that President Joe Biden, who took office after Trump, kept tariffs in place and even added some additional levies.
The return of Donald Trump to the White House as the 47th US President has sparked a fresh wave of tensions between the two countries. During the 2024 election campaign, Trump pledged to impose 60% tariffs on China once he returned to office, which he did on January 20, 2025. With Trump back, the US-China trade war is meant to resume where it was left, with tit-for-tat policies affecting the global economic landscape amid disruptions in global supply chains, resulting in a reduction in spending, particularly investment, and directly feeding into the Consumer Price Index inflation.
| Index | Change, points | Closed | Change, % |
|---|---|---|---|
| NIKKEI 225 | -279.51 | 38787.02 | -0.72 |
| Hang Seng | 241.92 | 21133.54 | 1.16 |
| KOSPI | -14.83 | 2521.92 | -0.58 |
| ASX 200 | -9.3 | 8511.4 | -0.11 |
| DAX | -115.42 | 21787 | -0.53 |
| CAC 40 | -34.59 | 7973.03 | -0.43 |
| Dow Jones | -444.23 | 44303.4 | -0.99 |
| S&P 500 | -57.58 | 6025.99 | -0.95 |
| NASDAQ Composite | -268.59 | 19523.4 | -1.36 |
| Pare | Closed | Change, % |
|---|---|---|
| AUDUSD | 0.62707 | 0 |
| EURJPY | 156.309 | -0.57 |
| EURUSD | 1.03283 | -0.54 |
| GBPJPY | 187.771 | -0.24 |
| GBPUSD | 1.24075 | -0.21 |
| NZDUSD | 0.56575 | -0.28 |
| USDCAD | 1.42893 | -0.1 |
| USDCHF | 0.90952 | 0.63 |
| USDJPY | 151.334 | -0.05 |
- Gold price gains momentum to around $2,865 in Monday’s early Asian session.
- Trump will announce reciprocal tariffs on many countries next week.
- China’s central bank expanded its gold reserves for a third month in January.
Gold price (XAU/USD) extends the rally to around $2,865 during the early Asian session on Monday. The precious metal edges higher as escalating trade tensions prompt investors to seek refuge in the safe-haven asset.
US President Donald Trump said on Friday that he plans to announce reciprocal tariffs on many countries by Monday or Tuesday, which will take effect almost immediately. This, in turn, provides some support to the yellow metal. Investors will closely monitor the developments surrounding trade war threat. "Central focus of the gold market continues to be the uncertainty in regard to the Trump tariff policies," said David Meger, director of metals trading at High Ridge Futures.
Furthermore, the People’s Bank of China (PBOC) added gold to its reserves in January for a third month, boosting the Gold price as China is the world's largest gold consumer. China’s gold reserves were 73.45 million fine troy ounces at the end of January, up from 73.29 million a month earlier. “The PBOC will likely continue to diversify its reserves in the longer term, given the rising geopolitical uncertainty,” said David Qu, an economist at Bloomberg Economics.
On the other hand, data released by the Labor Department on Friday suggested the labor market remains strong, which might prevent the Federal Reserve (Fed) from cutting its interest rate. The US economy added 143,000 jobs in January, compared with a rise of 170,000 expected by economists. Meanwhile, the Unemployment Rate ticked lower to 4.0% versus 4.1% prior, compared with expectations of 4.1%. Traders are now expecting the US central bank to cut interest rates just one time this year. This might lift the Greenback and weigh on the USD-denominated commodity price.
Gold FAQs
Gold has played a key role in human’s history as it has been widely used as a store of value and medium of exchange. Currently, apart from its shine and usage for jewelry, the precious metal is widely seen as a safe-haven asset, meaning that it is considered a good investment during turbulent times. Gold is also widely seen as a hedge against inflation and against depreciating currencies as it doesn’t rely on any specific issuer or government.
Central banks are the biggest Gold holders. In their aim to support their currencies in turbulent times, central banks tend to diversify their reserves and buy Gold to improve the perceived strength of the economy and the currency. High Gold reserves can be a source of trust for a country’s solvency. Central banks added 1,136 tonnes of Gold worth around $70 billion to their reserves in 2022, according to data from the World Gold Council. This is the highest yearly purchase since records began. Central banks from emerging economies such as China, India and Turkey are quickly increasing their Gold reserves.
Gold has an inverse correlation with the US Dollar and US Treasuries, which are both major reserve and safe-haven assets. When the Dollar depreciates, Gold tends to rise, enabling investors and central banks to diversify their assets in turbulent times. Gold is also inversely correlated with risk assets. A rally in the stock market tends to weaken Gold price, while sell-offs in riskier markets tend to favor the precious metal.
The price can move due to a wide range of factors. Geopolitical instability or fears of a deep recession can quickly make Gold price escalate due to its safe-haven status. As a yield-less asset, Gold tends to rise with lower interest rates, while higher cost of money usually weighs down on the yellow metal. Still, most moves depend on how the US Dollar (USD) behaves as the asset is priced in dollars (XAU/USD). A strong Dollar tends to keep the price of Gold controlled, whereas a weaker Dollar is likely to push Gold prices up.


© 2000-2026. Bản quyền Teletrade.
Trang web này được quản lý bởi Teletrade D.J. LLC 2351 LLC 2022 (Euro House, Richmond Hill Road, Kingstown, VC0100, St. Vincent and the Grenadines).
Thông tin trên trang web không phải là cơ sở để đưa ra quyết định đầu tư và chỉ được cung cấp cho mục đích làm quen.
Giao dịch trên thị trường tài chính (đặc biệt là giao dịch sử dụng các công cụ biên) mở ra những cơ hội lớn và tạo điều kiện cho các nhà đầu tư sẵn sàng mạo hiểm để thu lợi nhuận, tuy nhiên nó mang trong mình nguy cơ rủi ro khá cao. Chính vì vậy trước khi tiến hành giao dịch cần phải xem xét mọi mặt vấn đề chấp nhận tiến hành giao dịch cụ thể xét theo quan điểm của nguồn lực tài chính sẵn có và mức độ am hiểu thị trường tài chính.
Sử dụng thông tin: sử dụng toàn bộ hay riêng biệt các dữ liệu trên trang web của công ty TeleTrade như một nguồn cung cấp thông tin nhất định. Việc sử dụng tư liệu từ trang web cần kèm theo liên kết đến trang teletrade.vn. Việc tự động thu thập số liệu cũng như thông tin từ trang web TeleTrade đều không được phép.
Xin vui lòng liên hệ với pr@teletrade.global nếu có câu hỏi.
ngân hàng