LƯU Ý: Tài liệu trong nguồn cấp dữ liệu tin tức và phân tích được cập nhật tự động, tải lại trang có thể làm chậm quá trình xuất hiện tài liệu mới. Để nhận được tài liệu nhanh chóng, chúng tôi khuyên bạn nên luôn mở nguồn cấp tin tức.
Sort by topic
tất cả tin tức
Sắp xếp theo cặp tiền tệ
09.05.2024
23:56
Japan Foreign Investment in Japan Stocks rose from previous ¥-727.6B to ¥268.8B in May 3
23:55
Japan Foreign Investment in Japan Stocks dipped from previous ¥-492.4B to ¥-727.6B in April 25
23:51
Japan Foreign Investment in Japan Stocks: ¥268.8B (April 25) vs ¥-492.4B
23:51
Japan Bank Lending (YoY) meets expectations (3.1%) in April
23:51
Japan Trade Balance - BOP Basis increased to ¥491B in March from previous ¥-280.9B
23:50
Japan Current Account n.s.a. came in at ¥3398.8B, below expectations (¥3489.6B) in March
23:32
Japan Labor Cash Earnings (YoY) dipped from previous 1.8% to 0.6% in March
23:30
Japan Overall Household Spending (YoY) above forecasts (-2.4%) in March: Actual (-1.2%)
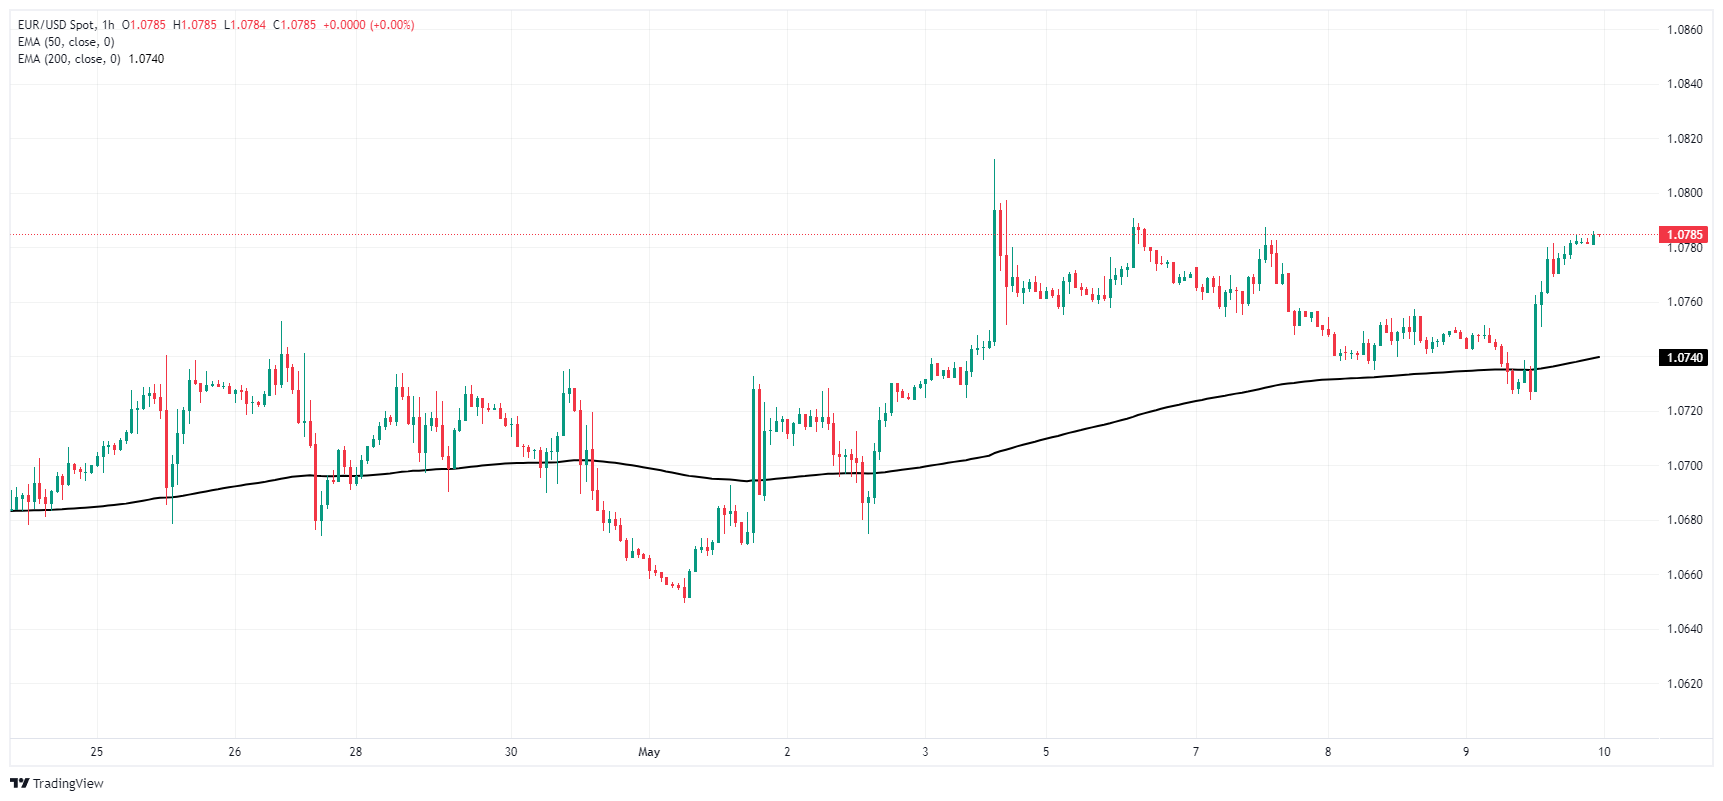
EUR/USD climbs into positive territory for the week.
Rate cut bets increase on rising US unemployment claims.
US consumer sentiment due on Friday.
EUR/USD gained ground on Thursday, finding upside on the week after the US Dollar (USD) broadly fell back after rising US Initial Jobless Claims sparked renewed hope of rate cuts from the Federal Reserve (Fed).
US Initial Jobless Claims rose to 231K for the week ended May 3, the highest number of new jobless benefits seekers week-on-week since last August. With possible signs of weakness appearing in the US job market, rate-hungry markets pivoted into risk appetite.
At current cut, the CME’s FedWatch Tool shows interest rate markets are pricing in nearly 70% odds of at least a quarter-point rate cut at the Fed’s September rate call. Rate traders are also pricing in 67% chances of a second rate cut from the Fed before the end of 2024.
Despite broad-market hopes for Fed rate trims this year, Fedspeak continues to lean into caution. San Francisco Fed President Mary C. Daly noted on Thursday that the inflation outlook remains uncertain, and recent downturns in employment data appear to be low-risk.
EUR/USD technical outlook
EUR/USD rallied on Thursday as the pair rebounds from the 200-hour Exponential Moving Average (EMA) at 1.0740, sending the pair into the green for the week, up a quarter of a percent from Monday’s early opening bids and testing 1.0790.
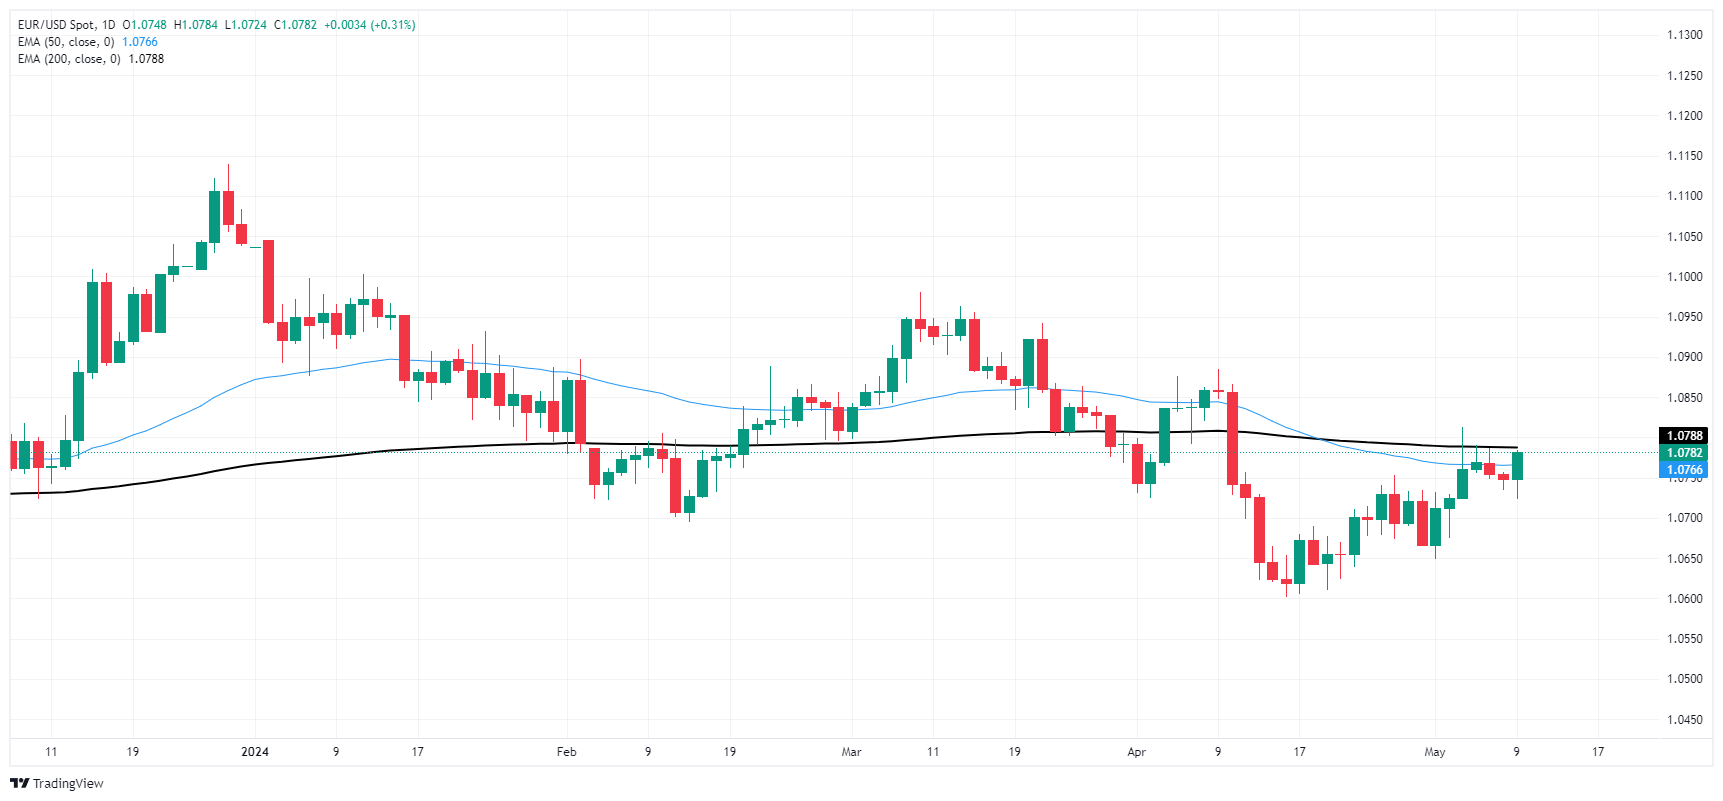
Daily candlesticks warn of stiff resistance for bullish momentum as EUR/USD approaches the 200-day EMA at 1.0788, and the pair has struggled to develop meaningful momentum, grinding from the last swing low into the 1.0600 handle.
GBP/USD trades with a mild positive bias around 1.2525 amid the weaker USD on Friday.
The BoE kept rates unchanged at 5.25% and opened the door to a rate cut sooner than expected.
Fed’s Daly said it’s difficult to make projections for policy until the central bank gets more clarity.
The GBP/USD pair posts modest gains near 1.2525 during the early Asian session on Friday. The major pair bounces off the lows of 1.2445 after the Bank of England (BoE)’s dovish hold. The attention on Friday will shift to the first reading of the UK Gross Domestic Product (GDP) for Q1 and the US Michigan Consumer Sentiment report.
The BoE kept its borrowing costs on hold at 5.25% for the sixth meeting in a row on Thursday and signaled that it could begin cutting interest rates as early as next month as inflation is “moving in the right direction.” The BoE Governor Andrew Bailey stated during the press conference that “a rate cut next month was a possibility.”, but he will wait for inflation, activity, and labor market data before making the decision. The dovish stance from the UK central bank that opened the door to future cuts in interest rates exerted some pressure on the Pound Sterling (GBP) following the monetary policy meeting.
Meanwhile, BoE Chief Economist Huw Pill said that the central bank was more confident that they would consider rate cuts over the next few meetings, although they needed more evidence. Investors have been pricing in two rate cuts this year, with the first expected in August.
On the other hand, San Francisco Fed President Mary Daly said late Thursday that uncertainty about the next few months of inflation has increased and it may take “more time” to bring inflation down to the central bank’s target. A cautious approach to setting interest rates implied that the current rates will likely stay at their current levels for longer. The divergence of policy between the BoE and the Fed is likely to weigh the Cable and cap the pair’s upside in the near term.
BusinessNZ's New Zealand Performance of Manufacturing Index (PMI) saw an uptick in April, with the seasonally-adjusted figure coming in at 48.9 compared to March's 46.8, but is still lower than February's 49.1.
New Zealand's manufacturing sector has been in contraction for 14 consecutive months, though the figures are seeing signs of improvement rather than across-the-board weakness.
As noted by BusinessNZ's Director of Advocacy Catherine Beard, "The key sub-index result of Production (50.8) returned to expansion for the first time since January 2023, as well as Employment (50.8) and Finished Stocks (50.4) also both returning to slight expansion. In contrast, New Orders (45.3) remained firmly in contraction, although showing a slight improvement from March." BusinessNZ Director, Advocacy Catherine Beard continued, "despite the small improvement in April, the proportion of negative comments again increased to 69%, compared with 65% in March and 62% in February. An overall lack of sales and orders was the dominant theme in comments, along with a struggling economy".
Market impact
NZD/USD is trading thinly into the high side in the early Friday market session, drifting into 0.6040 after finding an intraday floor near 0.5980.
About BusinessNZ's PMI
The Business NZ Performance of Manufacturing Index (PMI), released by Business NZ on a monthly basis, is a leading indicator gauging business activity in New Zealand’s manufacturing sector. The data is derived from surveys of senior executives at private-sector companies. Survey responses reflect the change, if any, in the current month compared to the previous month and can anticipate changing trends in official data series such as Gross Domestic Product (GDP), industrial production or employment.The index varies between 0 and 100, with levels of 50.0 signaling no change over the previous month. A reading above 50 indicates that the manufacturing economy is generally expanding, a bullish sign for the New Zealand Dollar (NZD). Meanwhile, a reading below 50 signals that activity among goods producers is generally declining, which is seen as bearish for NZD.
22:30
New Zealand Business NZ PMI increased to 48.9 in April from previous 47.1
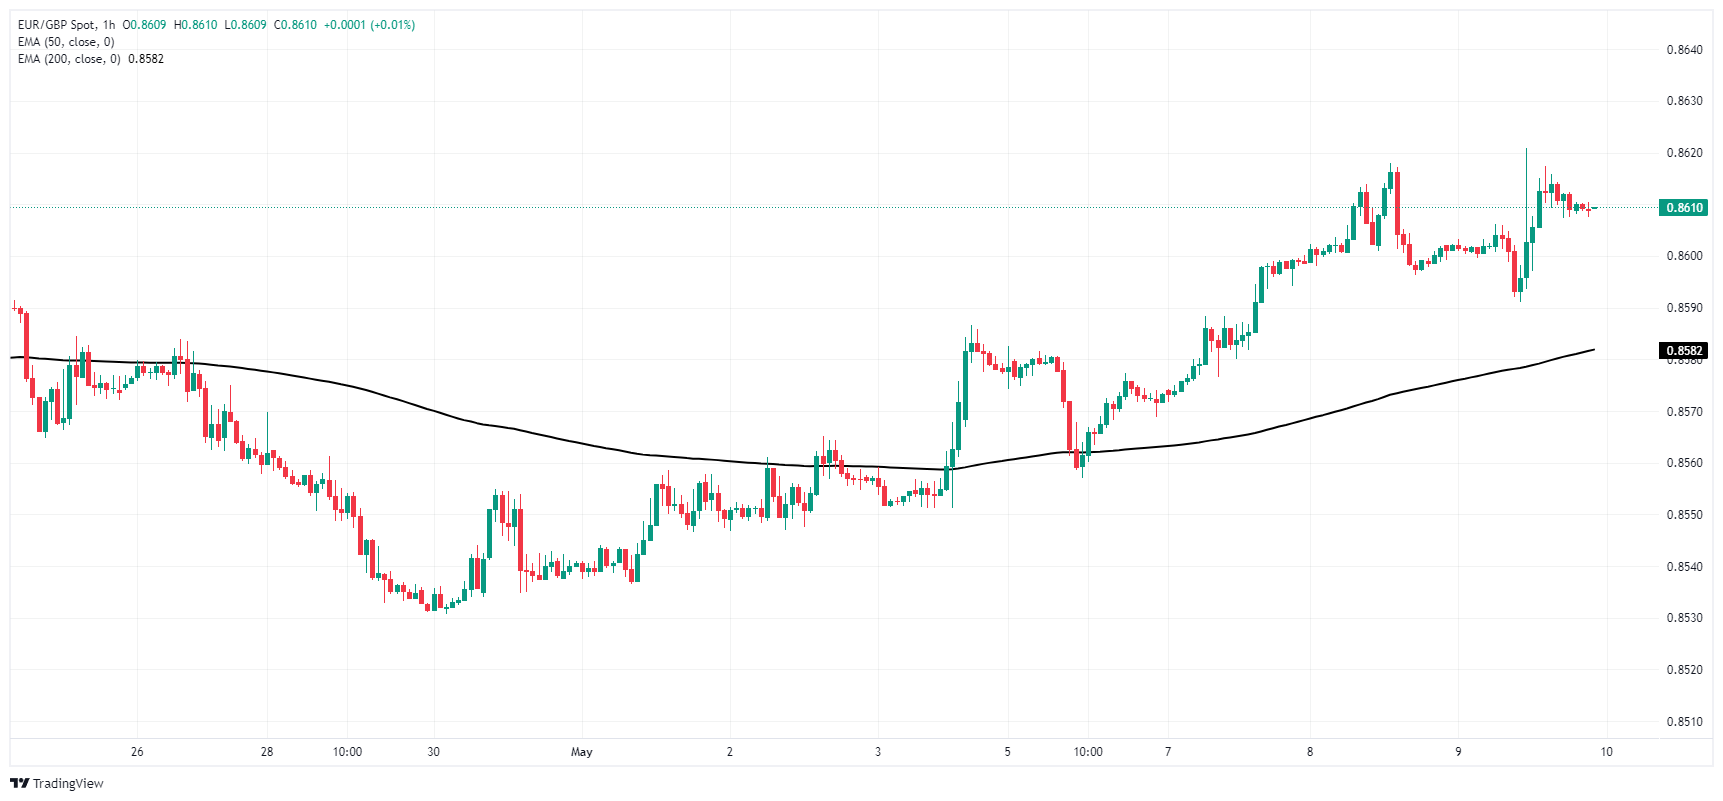
EUR/GBP jostled after BoE rate cote steps towards cuts.
Officials from both central banks insist progress is being made.
Friday to wrap up the trading week with UK GDP.
EUR/USD cycled within familiar levels on Thursday as the pair’s respective central banks compete to reaffirm markets that progress is being made on inflation, and the path towards rate cuts is coming, but not quite yet. The Bank of England (BoE) took one step closer to delivering rate cuts with a 7-to-2 vote on holding rates steady, while talking points from multiple European Central Bank (ECB) officials reiterated the message that inflation will eventually return to ECB target levels.
Of the nine voting members of the BoE’s Monetary Policy Committee (MPC), all but two voted to keep rates on hold for another meeting. Markets expected an 8-to-1 vote with Dr. Swati Dhingra broadly expected to be the lone holdout for a single quarter-point cut. Deputy Governor for Markets and Banking Sir David Ramsden joined Dr. Dhingra in voting for a 25-basis-point rate trim, bringing the BoE one step closer to pushing down interest rates.
Friday brings a fresh print of UK Gross Domestic Product (GDP), which is expected to return to growth after the previous month’s contraction. Q1 UK GDP is forecast to print at 0.4% QoQ, compared to the previous quarter’s -0.3%.
EUR/GBP technical outlook
EUR/GBP remains hung up on intraday technical congestion near 0.8600 as 0.8620 threatens to solidify into technical resistance. The pair has been drifting higher, bolstered by the rising 200-hour Exponential Moving Average (EMA) at 0.8582.
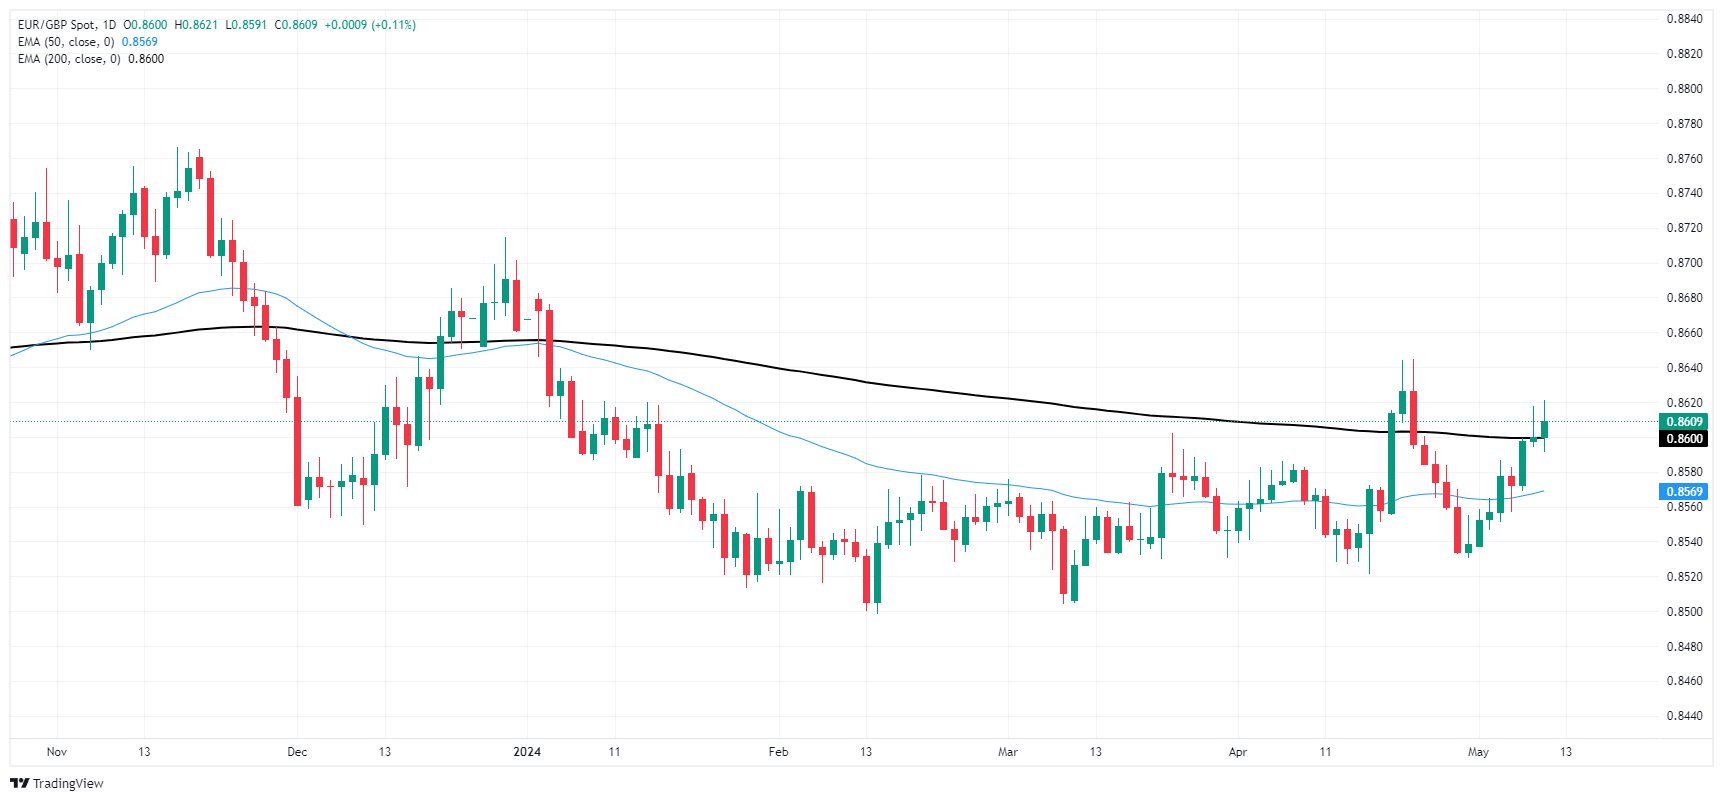
Daily candlesticks show EUR/GBP scrambling to retake the last swing high above 0.8640 as the pair grapples with keeping aloft above the 200-day EMA at 0.8599. The EUR/GBP has traded higher for all but one of the last eight consecutive days, but a bearish turnaround from here will chalk in another lower high and send the pair back down to long-term consolidation near the 0.8500 handle.
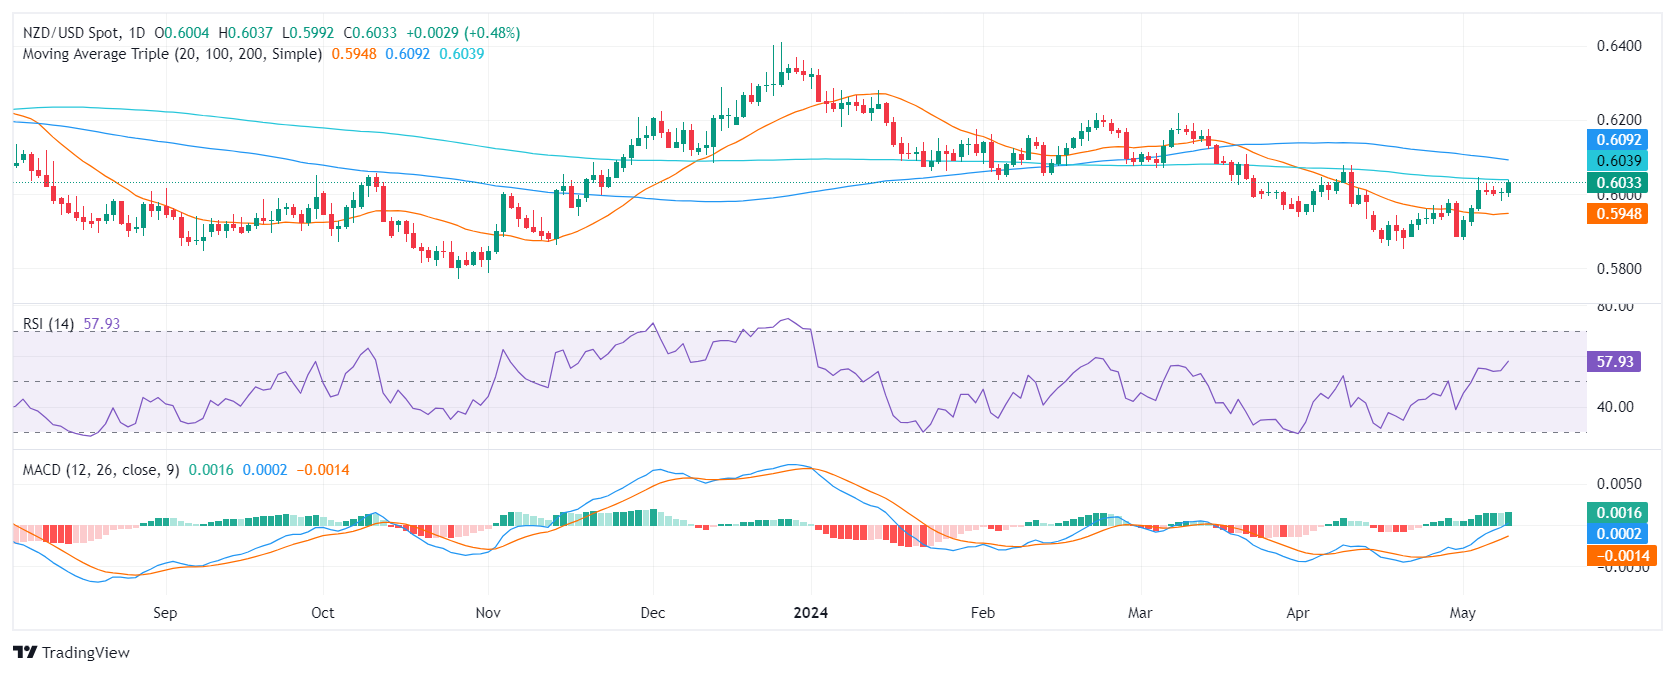
The daily RSI for the NZD/USD reveals strong buying momentum, underpinned by rising MACD green bars.
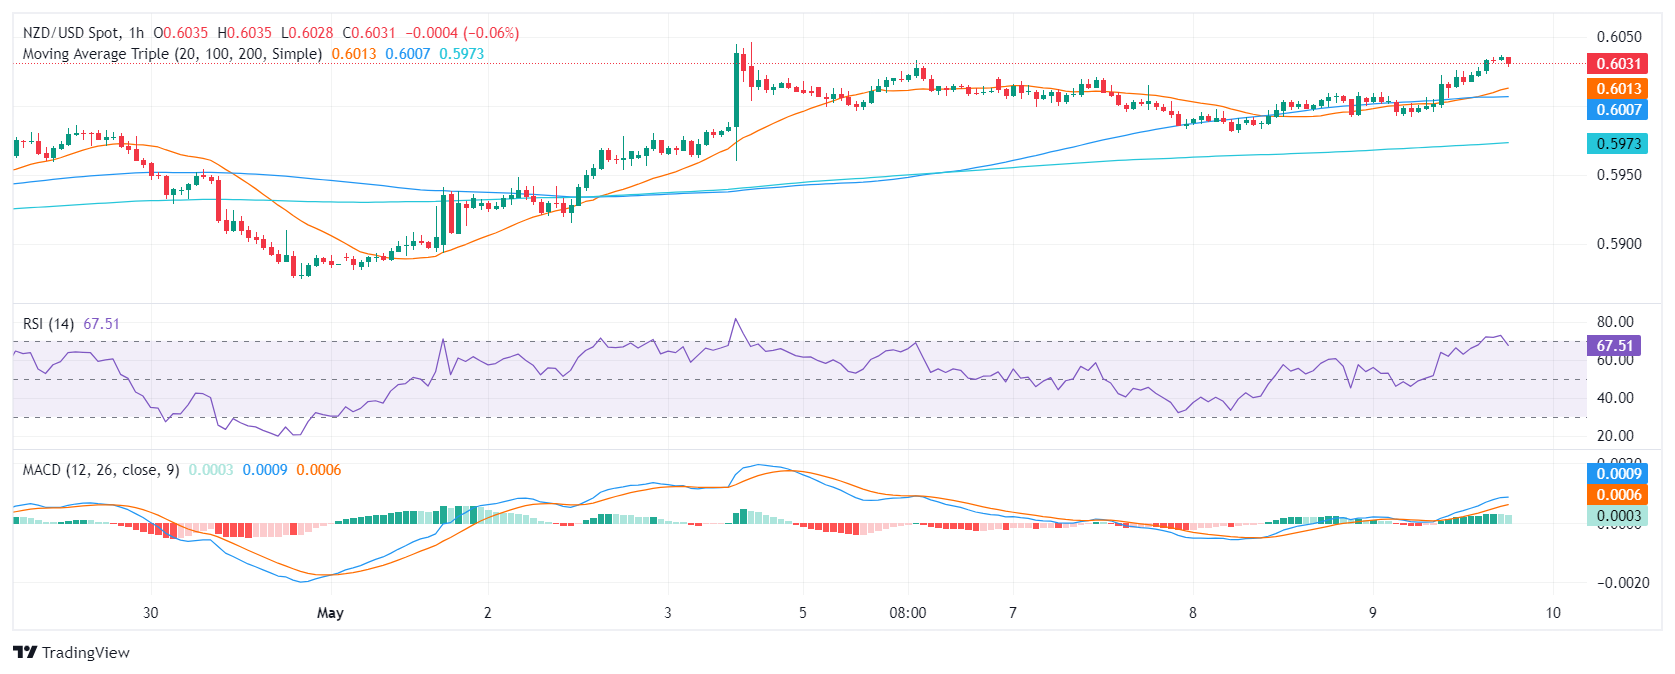
Despite slightly weakening green bars on the hourly MACD, the RSI indicates steadfast buying traction near 70.
If buyers regain the 200-day SMA, the outlook will turn positive for the pair.
The NZD/USD pair is showcasing a strong performance, rising to 0.6032 on Thursday. Despite this, an observed stagnation in hourly advances warrants attention for any short-term shift as indicators reach overbought conditions and buyers might take profits.
On the daily chart, the Relative Strength Index (RSI) shows positive momentum. Its latest reading is in positive territory. This, along with the rising green bars of the Moving Average Convergence Divergence (MACD), indicates a market predominately dominated by buyers.
NZD/USD daily chart
Turning attention to the hourly chart, the RSI still indicates strong buyer domination, hovering around 66. However, the MACD shows decreasing green bars, which could indicate slightly weaker bullish momentum compared to the daily chart. Traders shouldn’t take off the table a slight technical correction ahead of the Asian session.
NZD/USD hourly chart
Regarding the Simple Moving Averages (SMA) the pair holds above the 20-day SMA but remains below the 100 and 200-day. However, buyers are anticipated to challenge the 200-day SMA at the critical level of 0.6040 which if surpassed, could usher in stronger bullish prospects for the NZD/USD. On the contrary, sellers might step in again if the pair lacks the strength to reconquer the mentioned resistance.
AUD/USD climbs over 0.60% as US unemployment claims hit 231K, exceeding expectations, weakening the dollar.
Higher jobless claims contribute to falling US Treasury yields.
RBA holds rates; Governor Bullock's comments open to future Cash Rate adjustments.
The Australian Dollar rallied against the US Dollar on Thursday, printed gains of more than 0.60%, due to the Greenback remained offered following a softer than expected US jobs report. The AUD/USD trades back above the 0.6600 threshold and gains 0.04% as Friday’s Asian session begins.
AUD/USD gains as softer US labor data and falling Treasury yields dampen Greenback’s appeal.
US economic data was the main reason behind the poor performance of the American Dollar. The US Bureau of Labor Statistics (BLS) revealed that people filling out forms for unemployment benefits exceeded estimates. Initial Jobless Claims for the week ending May 4 rose to 231K, exceeding the estimates of 210K, and showing an increase from the previous week's figure of 209K.
Following the data, US Treasury bond yields dropped, with the 10-year benchmark note rate down almost four basis points to 4.459%. The US Dollar Index (DXY), which measures the buck’s performance against a basket of six currencies, dropped 0.25% and is at 105.23 at the time of writing.
It should be said that the latest round of US jobs data revealed in May showed signs the labor market is cooling. According to ANZ Analysts, “The data follow further falls in job openings at the end of March and the April nonfarm payrolls showing the softest growth for seven months. Not too much can be read into one round of data, but the incoming data will be watched very closely for further evidence that US labour market momentum may be slowing.”
In the meantime, San Francisco Fed President Mary Daly commented that lowering inflation to the Fed’s target would be a bumpy ride. Daly noted that the last three months of data leave policymakers uncertain about the future of inflation.
On the Aussie’s front, the Reserve Bank of Australia (RBA) 's latest monetary policy decision to hold rates unchanged sponsored a leg-down in the AUD/USD despite “not ruling anything ir or our” regarding monetary policy. However, Thursday’s price action lifted the pair to a new three-day high at 0.6621.
RBA’s Governor Michele Bullock maintained a balanced tone at the press conference. Regarding rates, she mentioned that "we might have to raise, we might not," indicating the board's contemplation of rate hikes at this meeting.
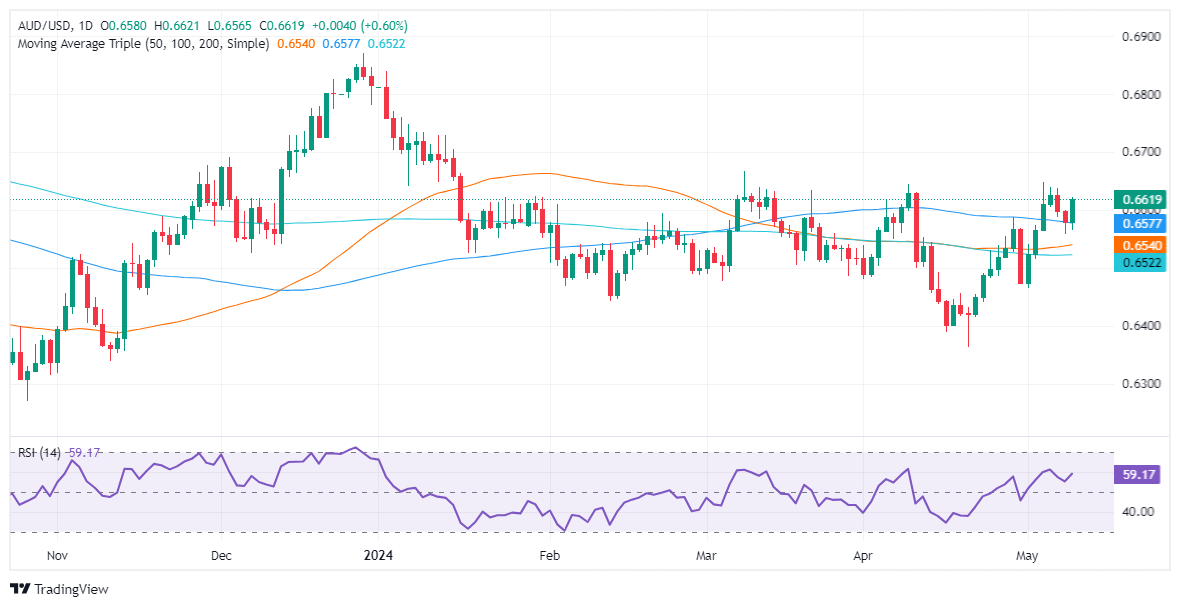
AUD/USD Price Analysis: Technical outlook
From a daily chart perspective, the pair is neutral to upward biased, despite buyers reclaiming key resistance levels like the 0.6600 figure. Nevertheless, it remains shy of testing the latest cycle high seen at 0.6667, the March 8 high, which could exacerbate a rally toward 0.6700. Once cleared, the next resistance level would be the December 28 high at 0.6871.
On the other hand, if sellers push prices below the 100-day moving average (DMA) at 0.6577, subsequent losses are awaited. The next demand level would be the 50-DMA at 0.6535, followed by the 200-DMA at 0.6515.
Australian Dollar FAQs
One of the most significant factors for the Australian Dollar (AUD) is the level of interest rates set by the Reserve Bank of Australia (RBA). Because Australia is a resource-rich country another key driver is the price of its biggest export, Iron Ore. The health of the Chinese economy, its largest trading partner, is a factor, as well as inflation in Australia, its growth rate and Trade Balance. Market sentiment – whether investors are taking on more risky assets (risk-on) or seeking safe-havens (risk-off) – is also a factor, with risk-on positive for AUD.
The Reserve Bank of Australia (RBA) influences the Australian Dollar (AUD) by setting the level of interest rates that Australian banks can lend to each other. This influences the level of interest rates in the economy as a whole. The main goal of the RBA is to maintain a stable inflation rate of 2-3% by adjusting interest rates up or down. Relatively high interest rates compared to other major central banks support the AUD, and the opposite for relatively low. The RBA can also use quantitative easing and tightening to influence credit conditions, with the former AUD-negative and the latter AUD-positive.
China is Australia’s largest trading partner so the health of the Chinese economy is a major influence on the value of the Australian Dollar (AUD). When the Chinese economy is doing well it purchases more raw materials, goods and services from Australia, lifting demand for the AUD, and pushing up its value. The opposite is the case when the Chinese economy is not growing as fast as expected. Positive or negative surprises in Chinese growth data, therefore, often have a direct impact on the Australian Dollar and its pairs.
Iron Ore is Australia’s largest export, accounting for $118 billion a year according to data from 2021, with China as its primary destination. The price of Iron Ore, therefore, can be a driver of the Australian Dollar. Generally, if the price of Iron Ore rises, AUD also goes up, as aggregate demand for the currency increases. The opposite is the case if the price of Iron Ore falls. Higher Iron Ore prices also tend to result in a greater likelihood of a positive Trade Balance for Australia, which is also positive of the AUD.
The Trade Balance, which is the difference between what a country earns from its exports versus what it pays for its imports, is another factor that can influence the value of the Australian Dollar. If Australia produces highly sought after exports, then its currency will gain in value purely from the surplus demand created from foreign buyers seeking to purchase its exports versus what it spends to purchase imports. Therefore, a positive net Trade Balance strengthens the AUD, with the opposite effect if the Trade Balance is negative.
Silver rallies, gaining nearly $1.00 to pass $28.00, fueled by falling US Treasury yields and a weaker dollar.
Bullish technicals as RSI exceeds 60, indicating room for more upward movement.
Resistance levels at $28.49 and $29.00, targeting year-to-date high of $29.79; support at $28.00 and $27.70.
Silver prices rallied sharply as US Treasury yields tumbled, and the Greenback weakened as major central banks opened the door to ease policy. At the time of writing, XAG-USD trades at $28.29, up by more than 3.50%.
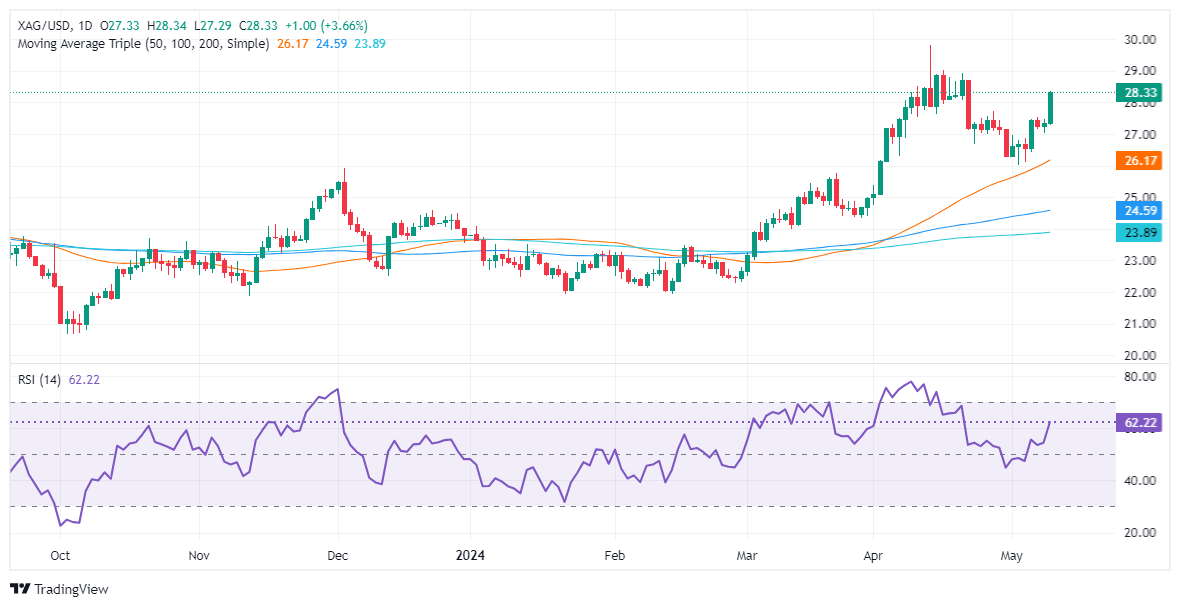
XAG/USD Price Analysis: Technical outlook
After consolidating below the latest cycle high of $27.733 witnessed on April 26, the grey metal exploded with close to $1.00 gains, clearing the $28.00 threshold, with bulls eyeing the $28.50 mark.
As wrote on May 8, “The Relative Strength Index (RSI) is in bullish territory, indicating that momentum favors bulls,” This means, the precious metal could be headed for further gains, as the RSI just punched above the 60.00 threshold with enough room before turning overbought.
If buyers reclaim the 23.6% Fib retracement at $28.49, that could pave the way to test $29.00. Once cleared, the next stop would be the year-to-date (YTD) high of $29.79, followed by the $30.00 figure.
On the flip side, if sellers drag Silver below $28.00, the immediate support would be the 38.2% Fib retracement at $27.70, followed by the 50% Fib retracement at $27.05. Once those levels are cleared, up next is the psychological $27.00 figure.
The SEK strengthened against the USD after the Riksbank's latest monetary policy decision to cut rates to 3.75%.
Officials from the Federal Reserve are expressing wary about cutting rates.
The USD traded weak on soft Jobless Claims figures.
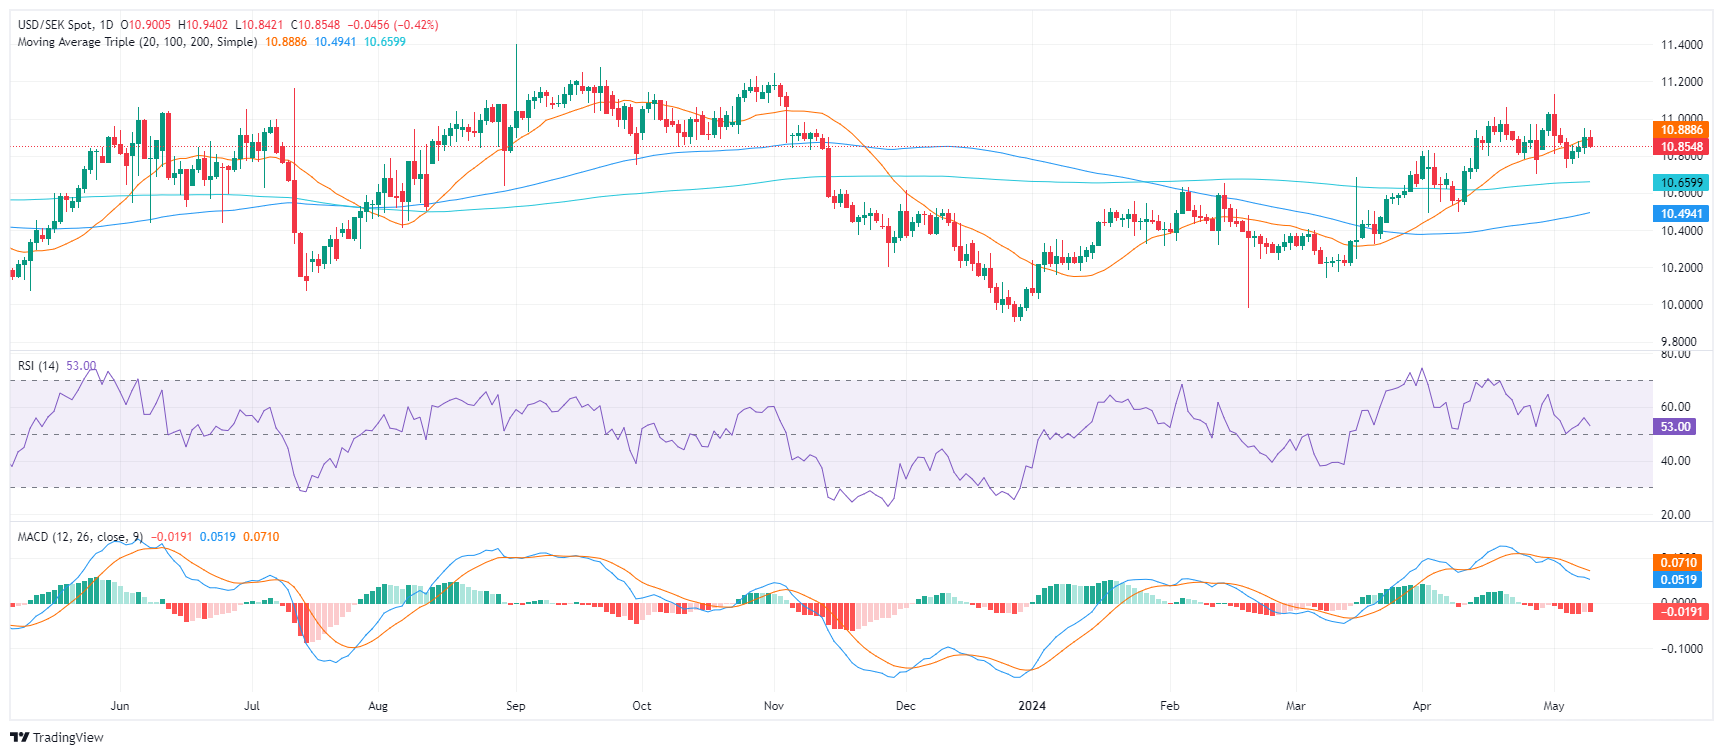
The USD/SEK pair is trading lower, indicating bearish momentum for the pair despite the persistence of inflation and robust US economic performance aiding the Dollar's recovery which fuels hawkish bets on the Federal Reserve (Fed). The SEK was seen weak on Wednesday after the Riksbank decided to cut rates to 3.75% and signaled that more cuts may be incoming.
The US Dollar faced downward pressure following the release of disappointing Initial Jobless Claims data. During the week ending May 3, the number of individuals filing for jobless benefits for the first time rose to 231K, surpassing expectations of 210K and the previous reading of 209K, revised up from 208K. This uptick in jobless claims has heightened concerns about weakening conditions in the labor market. That being said, market expectations on the Fed didn’t change, and investors are still seeing the easing cycle starting in September. All eyes will turn to next week’s inflation data from the US which may likely set the tone for the market's expectations on the Fed.
USD/SEK technical analysis
On the daily chart, the Relative Strength Index (RSI) for the USD/SEK reveals a recent move within the positive territory but it points downwards. In addition, the MACD histogram indicates rising red bars, signifying a bearish momentum. The coexistence of the RSI's positive region and the MACD's red bars demonstrates that even though bullish players dominate the market price-wise, the overall trend may be losing steam, hinting at a potential shift in market momentum.
Highlighting the recent movements, the struggle of buyers to uphold the 20-day Simple Moving Average (SMA) at 10.88 may suggest a weak short-term trend. However, the long-term scenario looks strong, considering the pair's position above the 100 and 200-day SMA.
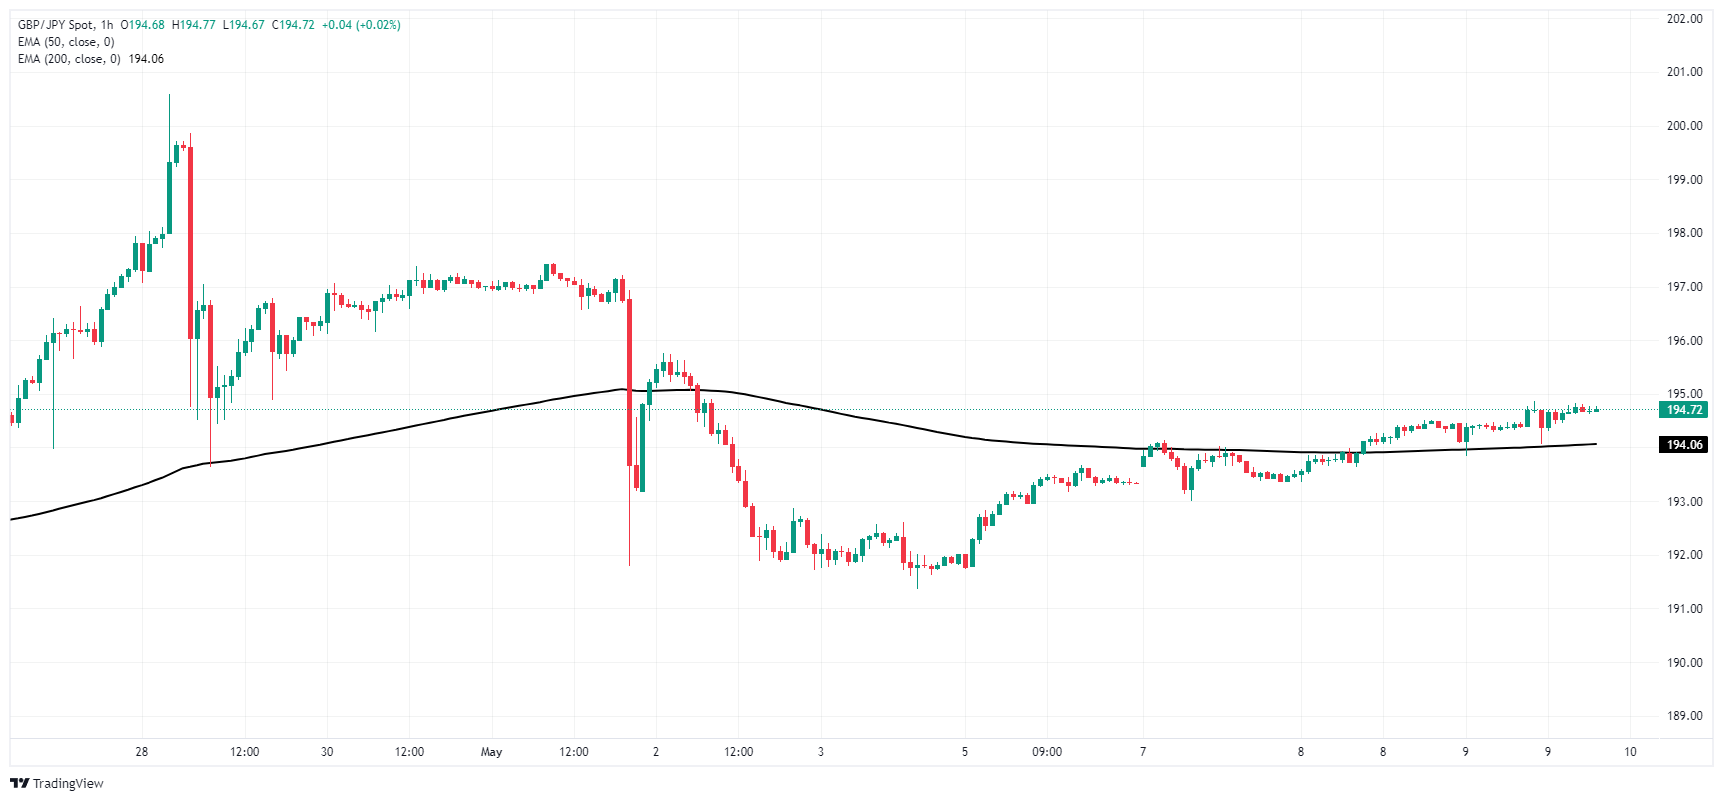
GBP/JPY holding above 194.50 as markets continue to sell Yen.
BoE still stands pat on interest rates, but officials are slowly changing camps.
Trading week to wrap up with Friday’s UK GDP print.
GBP/JPY is holding steady, churning above 194.50 as the Japanese Yen continues to soften across the board in the wake of “Yenterventions” from the Bank of Japan (BoJ). The UK’s Bank of England (BoE) held rates as markets broadly expected, but Monetary Policy Committee (MPC) votes shifted one more towards a rate cut vote.
The BoE voted 7-to-2 to keep rates in place early Thursday. Two members of the MPC voted for a rate cut, with Sir David Ramsden, Deputy Governor for Markets and Banking, joining Dr. Swati Dhingra, an external MPC member of the BoE, in voting for a 25-basis-point cut. Markets initially expected an 8-to-1 vote outcome, with Dr. Dhingra expected to be the singular rate dove.
Friday’s UK Gross Domestic Product (GDP) will round out the trading week, with markets forecasting a rebound in quarterly UK growth figures. Q1 UK GDP is expected to climb 0.4% QoQ, compared to the previous quarter’s -0.3% contraction.
Further public appearances on Friday from BoE policymakers, including BoE Chief Economist Huw Pill and Dr. Dhingra, are expected throughout the day.
GBP/JPY technical outlook
The Guppy is slowly churning further into bullish territory above the 200-hour Exponential Moving Average (EMA) near the 194.00 handle. The pair is building up a short-term price floor from 194.50 as the pair makes a break for 195.00. GBP/JPY is up around 1.8% since hitting a near-term price floor below 191.50 following last week’s 3% tumble from the 197.50 region.
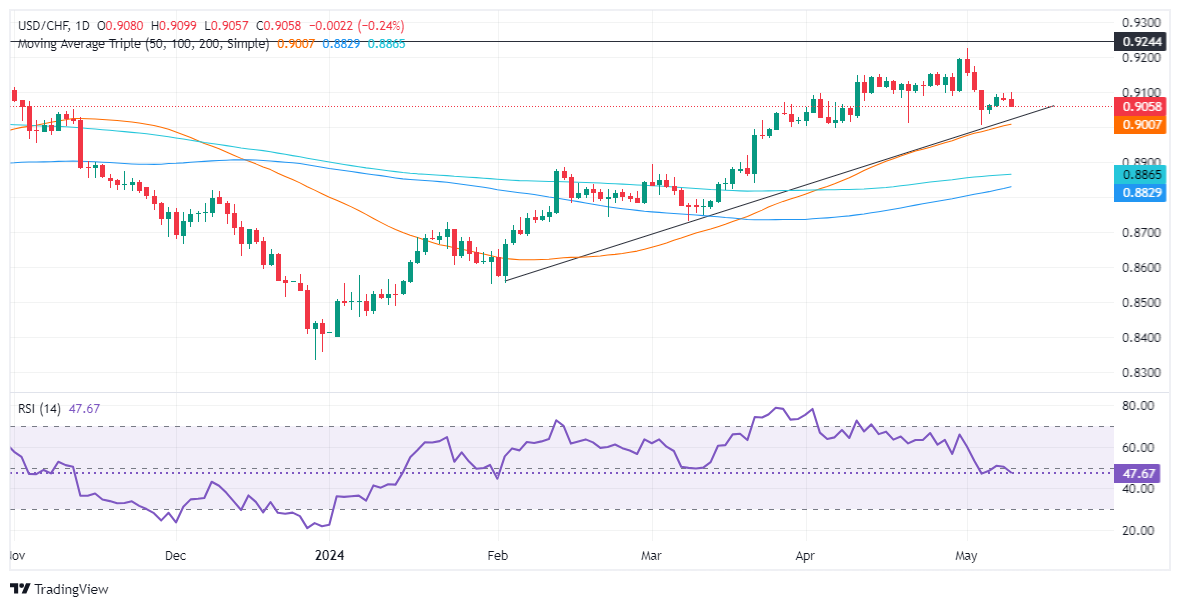
USD/CHF falls 0.16%, trading below 0.9100 due to broader US dollar weakness.
Technicals show neutral to upward bias; recent bearish RSI indicates loss of upward momentum.
Key support at 0.9006 (50-day MA and support trendline); resistance at 0.9100 and 0.9174.
The USD/CHF extended its losses for two straight days and is down some 0.16%, courtesy of broad US Dollar weakness, undermined by lower US Treasury yields. The major trades at 0.9064 after hitting a high shy of 0.9100.
USD/CHF Price Analysis: Technical outlook
The daily chart depicts the USD/CHF as neutral to upward biased, despite buyers losing momentum, as shown by the Relative Strength Index (RSI) shifting bearish. Although the pair has lost some 1.80% after hitting a year-to-date (YTD) high of 0.9224, solid support seen at the confluence of the 50-day moving average and a support trendline at around 0.9006/30 might cap the pair’s drop.
Looking at the potential for a bullish continuation, the USD/CHF could see a positive turn if it manages to climb above 0.9100. Once this level is breached, the next immediate resistance level to watch out for would be May 2 high at 0.9174, with a further test at 0.9200.
On the other hand, if bears push prices below 0.9000, that will confirm the ‘evening star’ chart pattern and exacerbate a drop toward the 200-DMA at 0.8887, ahead of the 100-DMA at 0.8829.
USD/CHF Price Action – Daily Chart
USD/CHF
Overview
Today last price
0.906
Today Daily Change
-0.0020
Today Daily Change %
-0.22
Today daily open
0.908
Trends
Daily SMA20
0.9116
Daily SMA50
0.9003
Daily SMA100
0.8824
Daily SMA200
0.8863
Levels
Previous Daily High
0.9096
Previous Daily Low
0.9074
Previous Weekly High
0.9225
Previous Weekly Low
0.9006
Previous Monthly High
0.9195
Previous Monthly Low
0.8998
Daily Fibonacci 38.2%
0.9082
Daily Fibonacci 61.8%
0.9087
Daily Pivot Point S1
0.907
Daily Pivot Point S2
0.9061
Daily Pivot Point S3
0.9048
Daily Pivot Point R1
0.9093
Daily Pivot Point R2
0.9106
Daily Pivot Point R3
0.9116
19:01
Mexico Central Bank Interest Rate in line with expectations (11%)
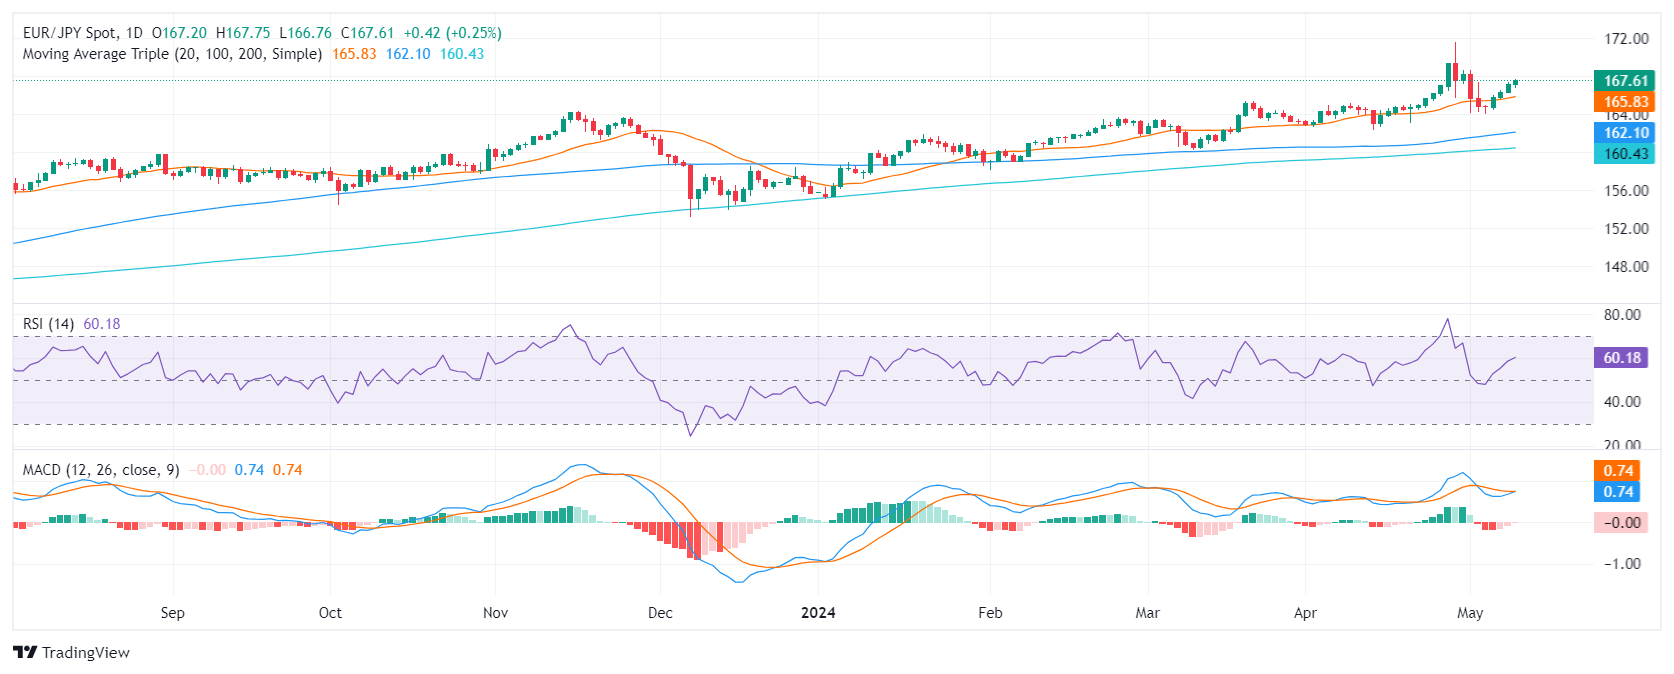
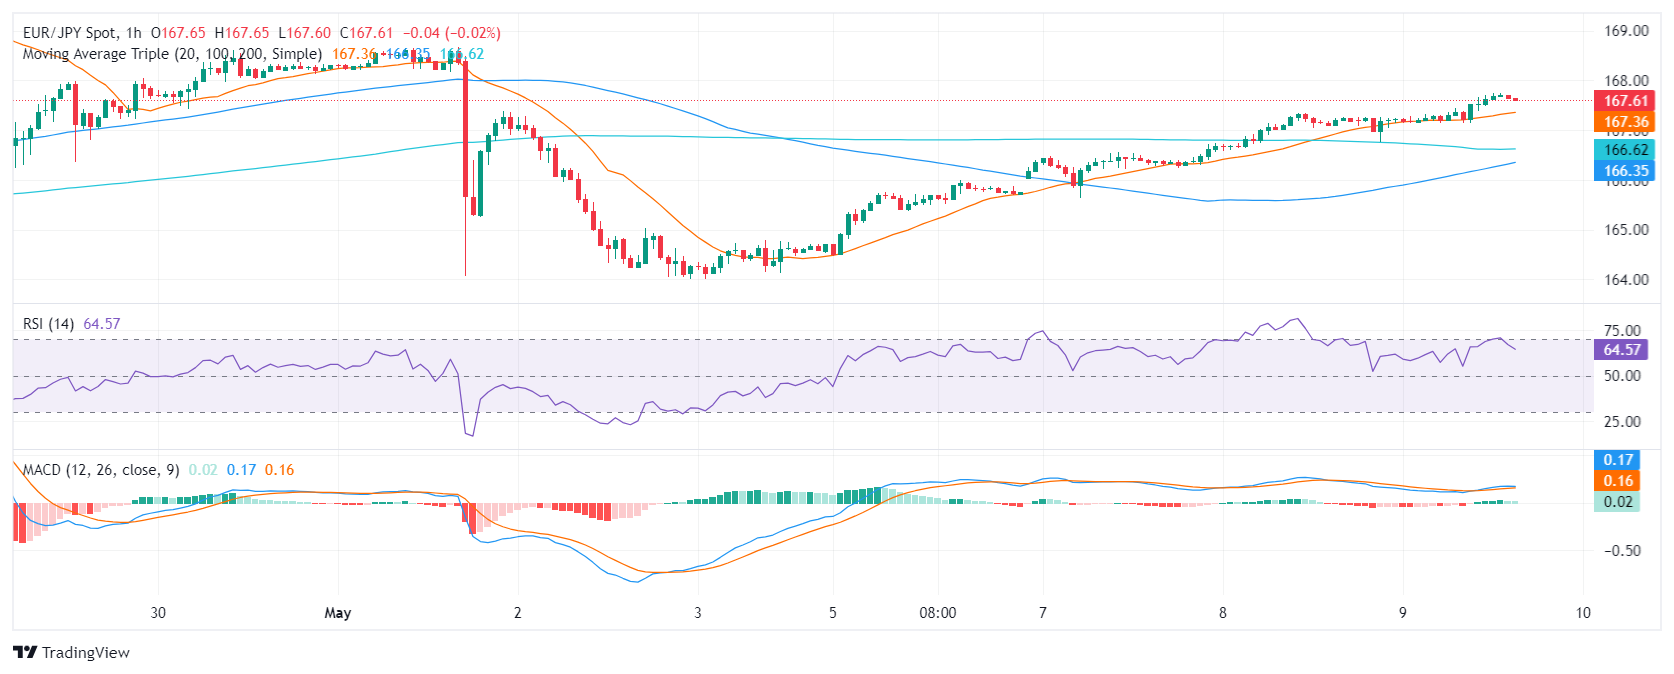
The daily chart reveals the RSI steady in positive zone, showing consistent bullish momentum.
On the hourly chart, RSI and MACD persist in positive territory, indicating robust buying traction.
If the bears don’t show up, the pair may be poised for a retest of the cycle highs above 170.00.
The EUR/JPY pair is steadily maintaining its upward trajectory, with a decisive rise to 167.64 in Thursday's session. Buyers consolidate near cycle highs while bears are nowhere to be seen.
On the daily chart, the Relative Strength Index (RSI) is noted in the positive territory. A consistent upward trend has unfolded over recent sessions, with the current RSI value at 59.8, showcasing continuous bullish momentum. Concurrently, the Moving Average Convergence Divergence (MACD) shows red bars decreasing in length, which suggests the decelerating negative momentum.
EUR/JPY Daily Chart
Ensuing examination of the hourly chart demonstrates a parallel bullish outlook. The hourly RSI values persistently float around the positive territory, with the recent reading at 64 seeming to consolidating after hitting overbought conditions. Additionally, the hourly MACD represents flat green bars, indicating steady positive momentum.
EUR/JPY Hourly Chart
Upon observing the Simple Moving Average (SMA), the EUR/JPY pair remains in a visibly secure territory. Both short- and long-term SMAs convey a sustained upward trajectory, indicating pronounced bullish momentum. Specifically, the pair secures its position above the 20, 100, and 200-day SMA, conveying a consistent bullish outlook.
Mary C. Daly, President of the Federal Reserve (Fed) Bank of San Francisco, highlighted the uncertainty facing the Fed while participating in a fireside chat at George Mason University in Virginia.
Key highlights
The last three months has left considerable uncertainty about the next few months of inflation.
There is considerable uncertainty about inflation in the next three months.
Daly is getting different signals from firms who say consumers seem to be getting choosy but input prices are not yet receding.
The balance sheet offers no signal about monetary policy.
Currently no evidence that the labor market is approaching a worrisome position.
Fed's Daly sees a really healthy labor market and inflation that is too high.
Risks to employment and inflation goals are balanced.
Fed policy is restrictive but it may still take time to bring inflation down.
A data-driven sell-off prompted the USD Index (DXY) to give away part of its recent advance amidst lower yields across the curve. The BoE kept rates unchanged and opened the door to a rate cut sooner than anticipated, reinforcing the policy divergence between the Fed and its G10 peers.
Here is what you need to know on Friday, May 10:
The USD Index (DXY) corrected lower and set aside three daily advances in a row against the backdrop of diminishing yields. On May 10, the preliminary Michigan Consumer Sentiment will take centre stage along with speeches by Fed’s Bowman, Goolsbee and Barr.
EUR/USD regained some balance along with the better tone in the broader risk-linked space. The ECB will publish its Accounts of the April meeting on May 10.
GBP/USD charted modest gains beyond 1.2500 the figure after the BoE’s dovish hold sent the pair to fresh lows near 1.2440. A busy UK calendar will show GDP figures on May 10 seconded by Industrial and Manufacturing Production, Construction Output, Balance of Trade, the NIESR Monthly GDP Tracker and the speech by BoE’s Pill.
USD/JPY navigated an irresolute range around 155.50, maintaining its weekly positive performance well and sound. On May 10, Household Spending is due followed by Bank Lending, Foreign Bond Investment and the Eco Watchers Survey.
AUD/USD set aside a two-session negative streak and reclaimed the area above the 0.6600 hurdle amidst the generalized improvement in the risk complex. The next data release in Australia will be the Wage Price Index on May 15.
Prices of WTI dropped slightly after the move to the vicinity of the $80.00 mark per barrel lacked follow through.
Prices of Gold rose markedly to multi-day highs near the $2,340 area on the back of the weaker dollar and lower US yields. Silver followed suit and went up more than 3% past the $28.00 mark per ounce, or two-week highs.
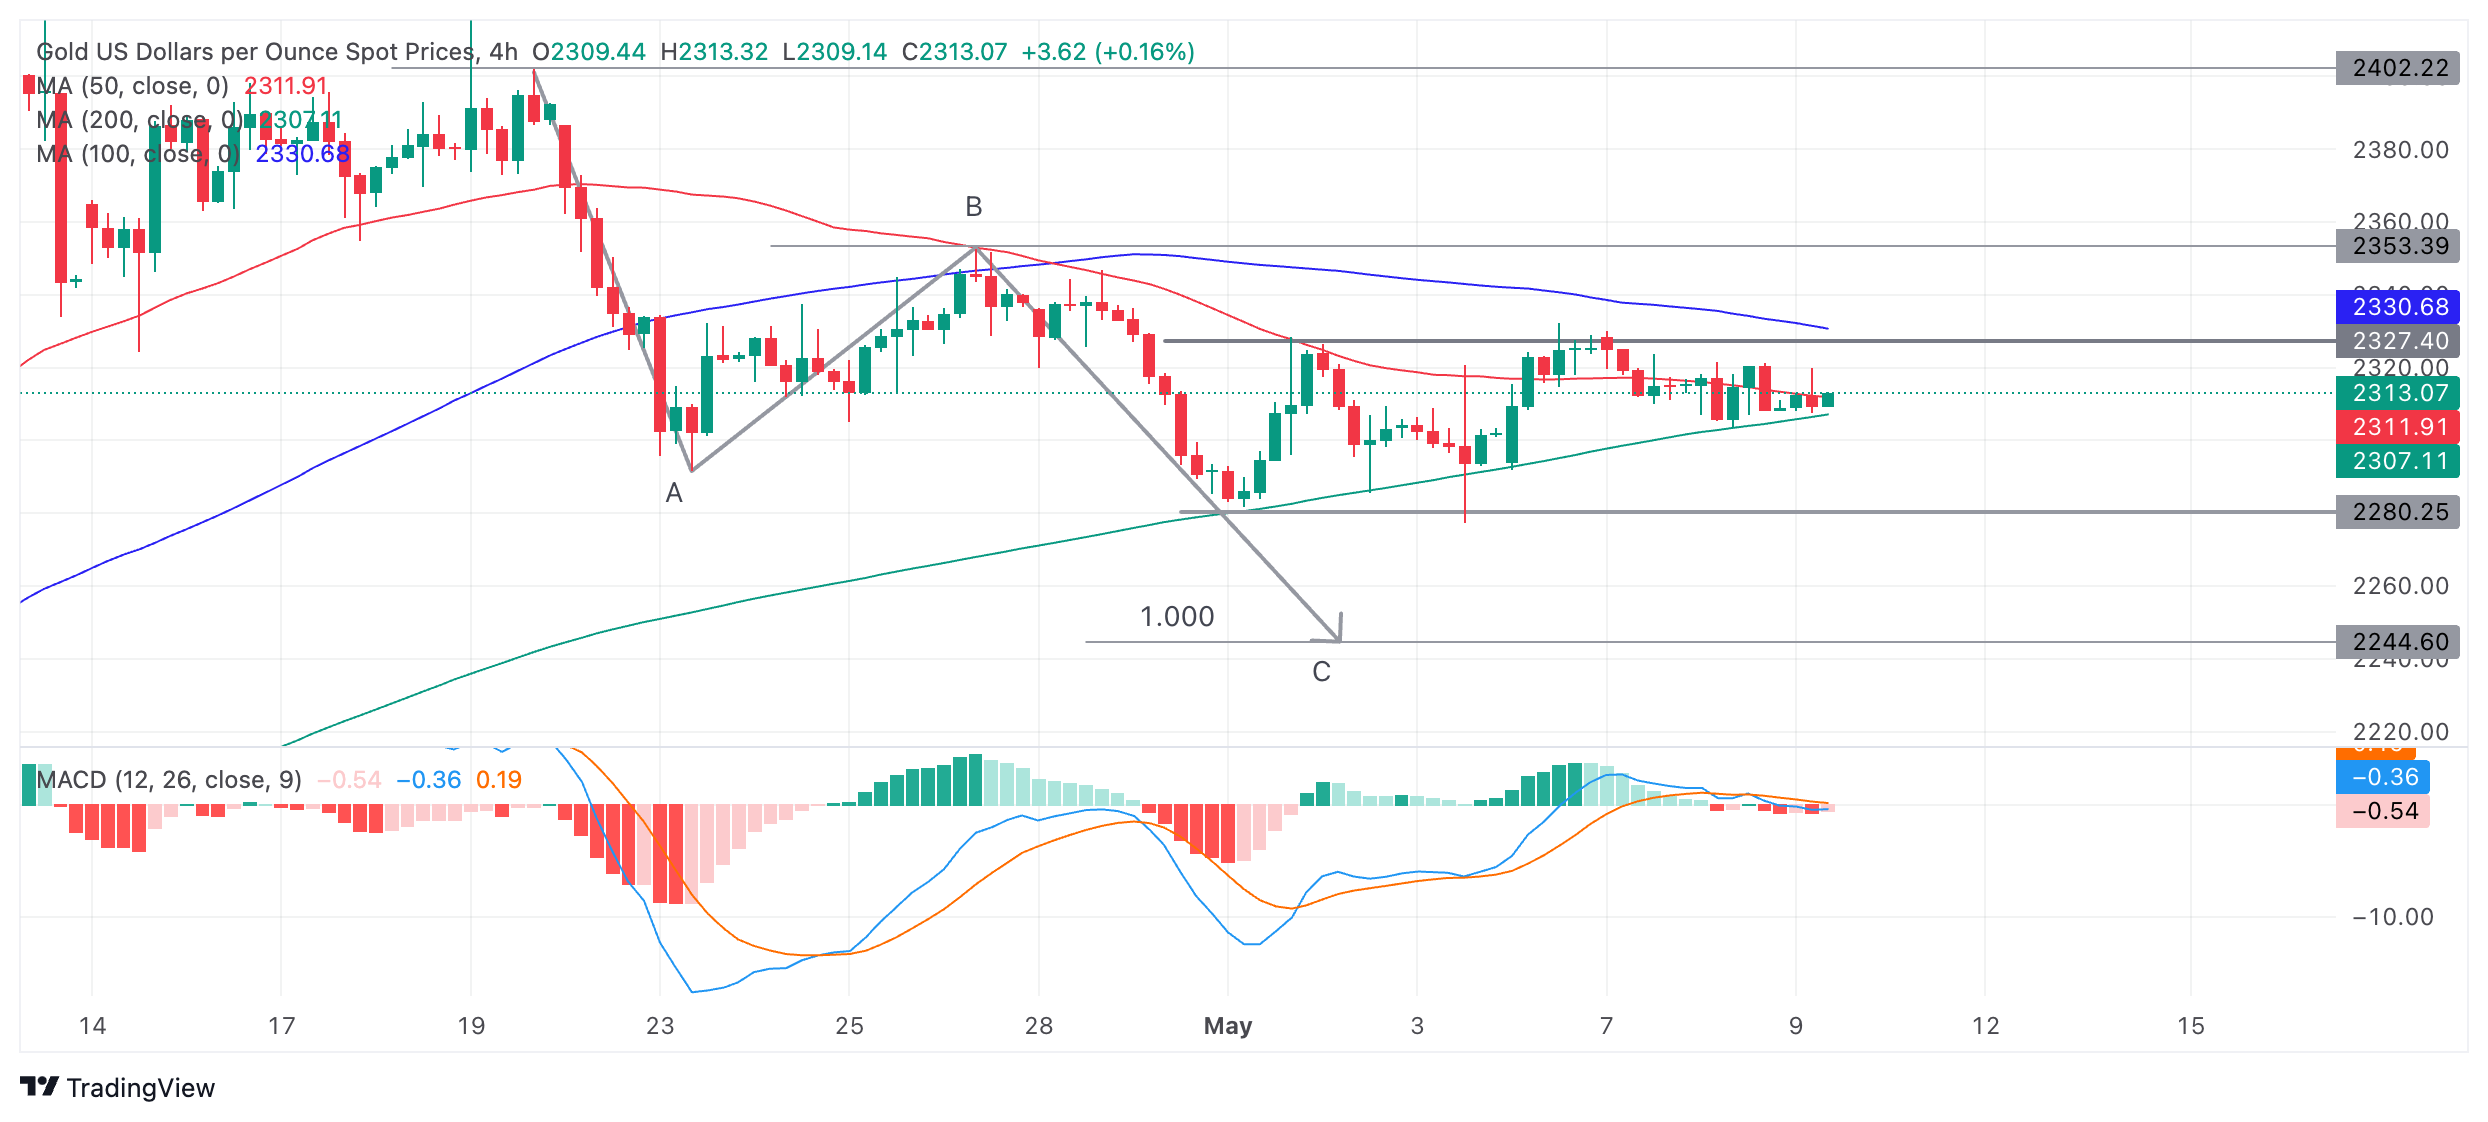
Gold rebounds above $2,330, fueled by drop in US Treasury yields, weaker Greenback.
Unemployment claims increase, which pressures Fed to achieve its dual mandate goals and possibly cut rates sooner.
Fed officials reflect mixed views on economy's health and monetary policy direction.
Gold price resumed its uptrend on Thursday and climbed more than 1% as US Treasury yields dropped, undermining the Greenback's appetite. Labor market data from the United States (US) was softer, increasing the chances for a rate cut by the Federal Reserve (Fed) despite dealing with inflationary pressure.
The XAU/USD trades above the $2,330 area after bouncing off daily lows at $2,306. On Thursday, the US Bureau of Labor Statistics (BLS) revealed the number of Americans filing for unemployment benefits increased above estimates and the previous report, an indication the economy is losing strength. This might influence the Fed in future monetary policy decisions after acknowledging that they are focused on their dual mandate — full employment and inflation.
Meanwhile, a slew of Fed officials had crossed the newswires during the week. On Monday, Richmond Fed President Thomas Barkin commented that recent data has been “disappointing,” adding that the job is not done. Elsewhere, New York Fed President John Williams noted that consumers are still spending, adding that the economy remains healthy despite growing more slowly.
On Tuesday, Neel Kashkari of the Minneapolis Fed noted that the most likely scenario is to hold interest rates where they are in 2024, adding that inflation progress has stalled. Yesterday, it was Boston Fed President Susan Collins' turn. She stated that she’s optimistic that inflation could be brought to the 2% goal, adding that current monetary policy is well-positioned and “moderately restrictive.”
Daily digest market movers: Gold strengthens as US data increases Fed rate cut hopes
Gold prices fell amid lower US Treasury yields and a strong US Dollar. The US 10-year Treasury note is yielding 4.457%, down four basis points (bps) from its opening level. The US Dollar Index (DXY), which tracks the Greenback's performance against six other currencies, dives 0.25% to 105.25.
US Department of Labor reported that Initial Jobless Claims for the week ending May 4 rose to 231K, exceeding the estimates of 210K and showing an increase from the previous week's figure of 209K. The uptick in jobless claims suggests a cooling US labor market.
Softer-than-expected labor market figures, as shown by last month’s US employment report and unemployment claims data, may exert pressure on the Fed. Officials recognized that the risks to achieving the Fed's dual mandate of fostering maximum employment and price stability have become more balanced over the past year.
Gold has advanced more than 12% so far in 2024, courtesy of expectations that major central banks will begin to reduce rates. Renewed fears that the Middle East conflict could resume between Israel and Hamas can sponsor a leg up in XAU/USD prices.
According to Reuters, the People’s Bank of China (PBoC) continued to accumulate Gold for the 18th straight month, adding 60,000 troy ounces to its reserves amid higher prices.
After the data release, Fed rate cut probabilities increased from around 33 basis points (bps) to 38 bps points of rate cuts toward the end of 2024.
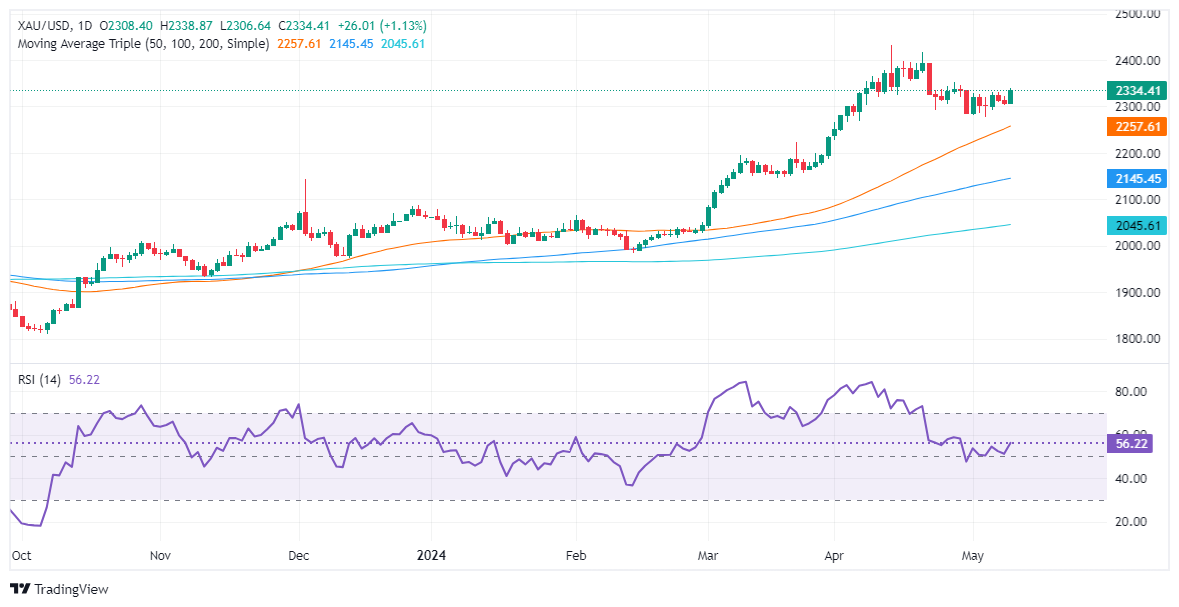
Technical analysis: Gold price resumes its uptrend, climbs above $2,330
Gold remains bullishly biased, even though it retreated some 6% from its all-time high of $2,431, hit on April 12. Momentum shows that buyers are gathering steam, which is visible in the Relative Strength Index (RSI) shifting bullish since the start of May.
That said, XAU/USD buyers need to clear the April 26 high, the latest cycle high at $2,352. Once surpassed, that would expose the $2,400 figure. A breach of the latter will accelerate the rally toward April’s 19 high at $2,417 before challenging the all-time high of $2,431.
Conversely, further losses are seen if Gold slides beneath the $2,300 mark. The next support would be the 50-day Simple Moving Average (SMA) at $2,249.
Gold FAQs
Gold has played a key role in human’s history as it has been widely used as a store of value and medium of exchange. Currently, apart from its shine and usage for jewelry, the precious metal is widely seen as a safe-haven asset, meaning that it is considered a good investment during turbulent times. Gold is also widely seen as a hedge against inflation and against depreciating currencies as it doesn’t rely on any specific issuer or government.
Central banks are the biggest Gold holders. In their aim to support their currencies in turbulent times, central banks tend to diversify their reserves and buy Gold to improve the perceived strength of the economy and the currency. High Gold reserves can be a source of trust for a country’s solvency. Central banks added 1,136 tonnes of Gold worth around $70 billion to their reserves in 2022, according to data from the World Gold Council. This is the highest yearly purchase since records began. Central banks from emerging economies such as China, India and Turkey are quickly increasing their Gold reserves.
Gold has an inverse correlation with the US Dollar and US Treasuries, which are both major reserve and safe-haven assets. When the Dollar depreciates, Gold tends to rise, enabling investors and central banks to diversify their assets in turbulent times. Gold is also inversely correlated with risk assets. A rally in the stock market tends to weaken Gold price, while sell-offs in riskier markets tend to favor the precious metal.
The price can move due to a wide range of factors. Geopolitical instability or fears of a deep recession can quickly make Gold price escalate due to its safe-haven status. As a yield-less asset, Gold tends to rise with lower interest rates, while higher cost of money usually weighs down on the yellow metal. Still, most moves depend on how the US Dollar (USD) behaves as the asset is priced in dollars (XAU/USD). A strong Dollar tends to keep the price of Gold controlled, whereas a weaker Dollar is likely to push Gold prices up.
US Jobless Claims hit highest number since last August.
Markets are pinning hopes on rate cuts from Fed.
The Dow Jones Industrial Average (DJIA) found further gains on Thursday as investors bet on Fed rate cuts to come after US Initial Jobless Claims rose to a multi-month high. Federal Reserve (Fed) officials have been pushing down on rate cut expectations recently as Fedspeak talks down the chances of rate cuts without inflation making further progress to the Fed’s 2% target and signs of slack in the US job market.
US Initial Jobless Claims rose to 231K for the week ended May 3, hitting the highest week-on-week number of new jobless benefits seekers since last August. The previous week’s Initial Jobless Claims were also revised slightly higher to 209K from the initial print of 208K. Rising unemployment claims is helping rate-cut-hungry markets step up hopes that the Fed will get pushed towards the rate cut table sooner rather than later.
Dow Jones news
All but five of the individual securities that comprise the Dow Jones Industrial Average are in the green on Thursday, with Caterpillar Inc. (CAT) leading the charge higher. Caterpillar is up over 2% on the day, trading into $351.46 per share. Analysts have raised forecasts for the company’s stock, with expectations ranging from $380.00 to $435.00 per share as the company diversifies further into energy and mining markets.
On the low side, Salesforce Inc. (CRM) is down -1.6%, falling below $275.00 per share as traders reconsider their earlier bets on the cloud computing company. IBM follows hot on Salesforce’s heels, backsliding -1.0% on Thursday, falling to $166.40 per share.
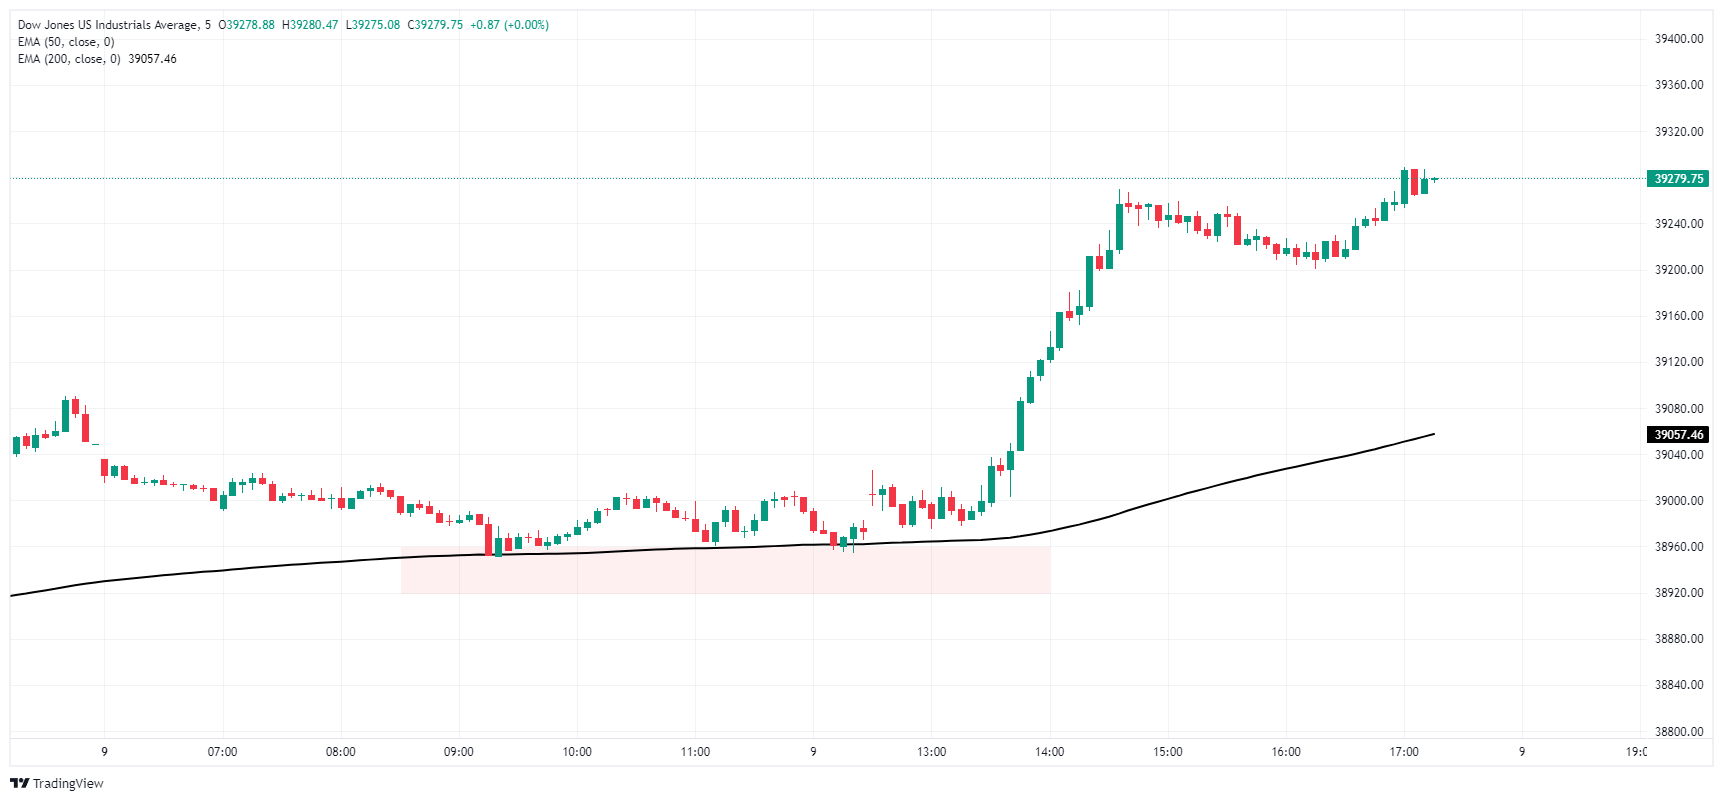
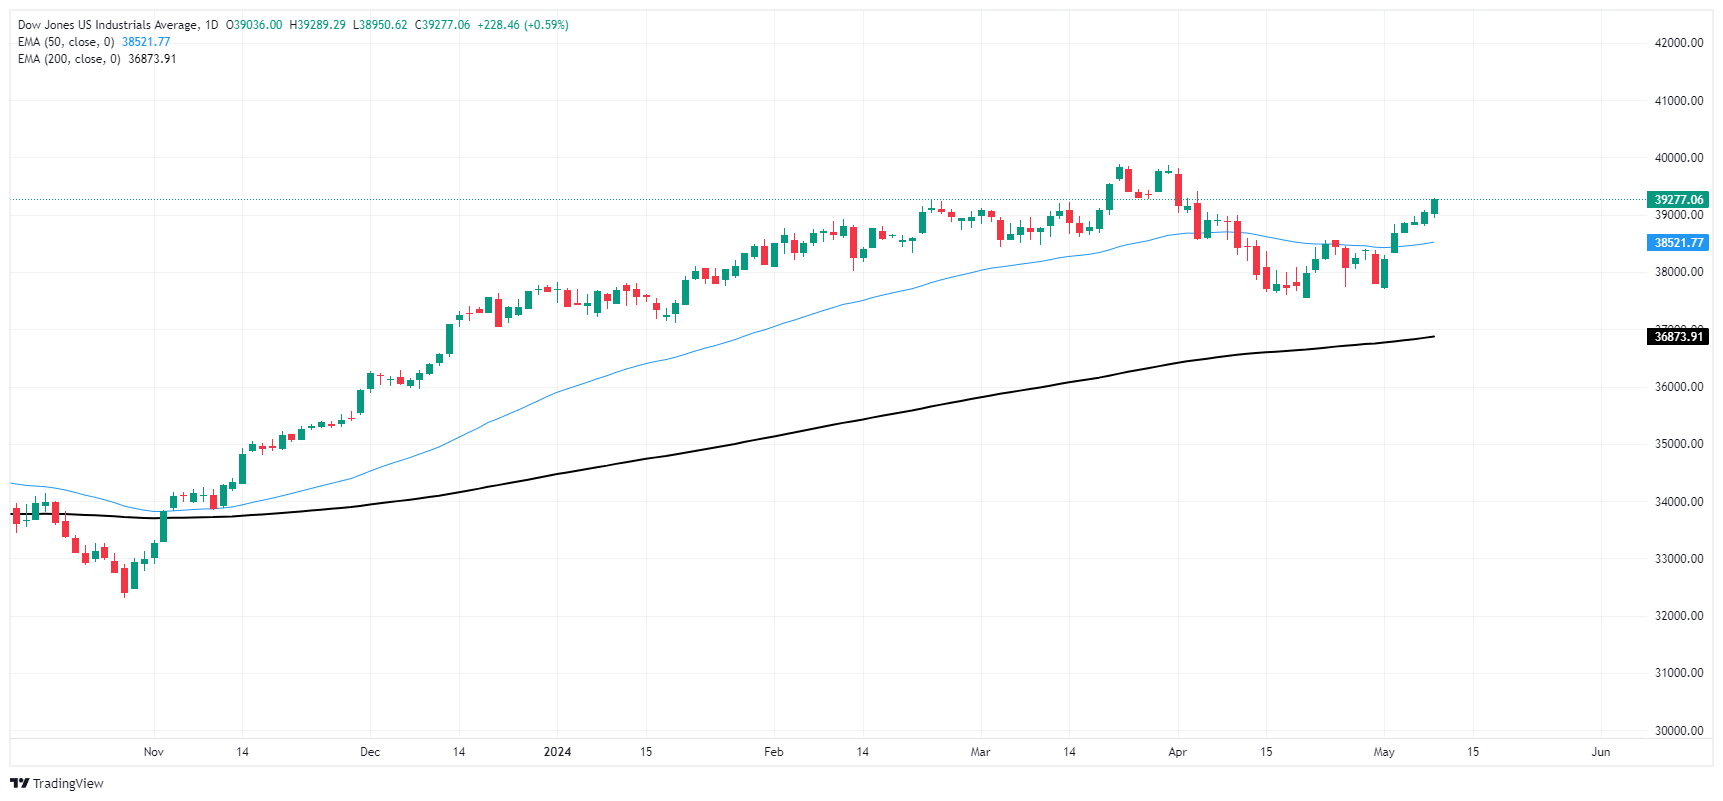
Dow Jones technical outlook
The Dow Jones is up over 225 points on Thursday, climbing six-tenths of a percent as the major equity index grinds its way back to record highs approaching 40,000.00. The index found an early price floor near 38,950.00, and the DJIA is trading above 39,250.00.
The Dow Jones is on pace to close a sixth consecutive trading day in the green, climbing over 4% from the immediate bottom near 37,708.00. The index’s last swing low is priced in near 37,600.00, and the DJIA is up nearly 6.5% from the 200-day Exponential Moving Average (EMA) at 36,897.69.
Dow Jones five minute chart
Dow Jones daily chart
Dow Jones FAQs
The Dow Jones Industrial Average, one of the oldest stock market indices in the world, is compiled of the 30 most traded stocks in the US. The index is price-weighted rather than weighted by capitalization. It is calculated by summing the prices of the constituent stocks and dividing them by a factor, currently 0.152. The index was founded by Charles Dow, who also founded the Wall Street Journal. In later years it has been criticized for not being broadly representative enough because it only tracks 30 conglomerates, unlike broader indices such as the S&P 500.
Many different factors drive the Dow Jones Industrial Average (DJIA). The aggregate performance of the component companies revealed in quarterly company earnings reports is the main one. US and global macroeconomic data also contributes as it impacts on investor sentiment. The level of interest rates, set by the Federal Reserve (Fed), also influences the DJIA as it affects the cost of credit, on which many corporations are heavily reliant. Therefore, inflation can be a major driver as well as other metrics which impact the Fed decisions.
Dow Theory is a method for identifying the primary trend of the stock market developed by Charles Dow. A key step is to compare the direction of the Dow Jones Industrial Average (DJIA) and the Dow Jones Transportation Average (DJTA) and only follow trends where both are moving in the same direction. Volume is a confirmatory criteria. The theory uses elements of peak and trough analysis. Dow’s theory posits three trend phases: accumulation, when smart money starts buying or selling; public participation, when the wider public joins in; and distribution, when the smart money exits.
There are a number of ways to trade the DJIA. One is to use ETFs which allow investors to trade the DJIA as a single security, rather than having to buy shares in all 30 constituent companies. A leading example is the SPDR Dow Jones Industrial Average ETF (DIA). DJIA futures contracts enable traders to speculate on the future value of the index and Options provide the right, but not the obligation, to buy or sell the index at a predetermined price in the future. Mutual funds enable investors to buy a share of a diversified portfolio of DJIA stocks thus providing exposure to the overall index.
17:07
United States 30-Year Bond Auction dipped from previous 4.671% to 4.635%
US Dollar faces pressure post the release of disappointing Initial Jobless Claims, amplifying fears regarding the US labor market's health.
Markets look toward ongoing data for clearer direction, the Fed's hawkish stance could change with continued releases of soft data.
All eyes are now on next week’s CPI data.
The US Dollar Index (DXY) is trading at 105.35, slightly down. Despite signals of persistently high inflation acknowledged by Federal Reserve (Fed) Chair Jerome Powell and a recent hawkish stance from the Fed, the Dollar seems to be under mild downward pressure on Thursday due to the report of weak Initial Jobless Claims figures
While the US economy is grappling with sustained inflation and mixed signals from its economic activity, Fed Chair Jerome Powell hinted that cuts might be delayed. As for now, the recent weak Nonfarm Payrolls report did not convince Fed officials, who remain hawkish. The USD dynamics will be set by the incoming data and how the central bank’s members take it.
Daily digest market movers: DXY struggles with Initial Jobless Claims data weighing, Fed officials continue to impact market expectations
US Dollar weakened after heavier-than-anticipated Initial Jobless Claims data, marking 231K applications, overshooting 210K forecast and increased jobless claims underscore anxiety over potential labor market weakness in the US.
Lack of significant US economic data this week turns investor focus on Fed speakers, which continues attaching to the Fed rhetoric with a slight hawkish twist.
Upcoming week’s Producer and Consumer inflation data will be crucial, where higher-than-projected figures could minimize rate cut probabilities this year.
While Fed officers maintain caution against rate cuts, the market predicts 10% chance of a June rate cut, 33% in July, 85% in September, and have already priced in November’s cut.
DXY technical analysis: DXY bulls get stuck below the 20-day SMA
The daily Relative Strength Index (RSI) is on a negative slope, although in positive territory. This indicates that the current buying momentum is losing strength, while the Moving Average Convergence Divergence (MACD) printing flat red bars suggests short-term bearish momentum. Since the MACD remains flat, however, this also indicates a lack of strong selling pressure for now.
Regarding its Simple Moving Averages (SMAs), the DXY is below the 20-day SMA, hinting at a short-term bearish bias. However, it maintains a position above the 100 and 200-day SMAs, which typically denote a longer-term bullish trend. This suggests that the bulls retain control over the broader trend, despite recent setbacks.
US Dollar FAQs
The US Dollar (USD) is the official currency of the United States of America, and the ‘de facto’ currency of a significant number of other countries where it is found in circulation alongside local notes. It is the most heavily traded currency in the world, accounting for over 88% of all global foreign exchange turnover, or an average of $6.6 trillion in transactions per day, according to data from 2022. Following the second world war, the USD took over from the British Pound as the world’s reserve currency. For most of its history, the US Dollar was backed by Gold, until the Bretton Woods Agreement in 1971 when the Gold Standard went away.
The most important single factor impacting on the value of the US Dollar is monetary policy, which is shaped by the Federal Reserve (Fed). The Fed has two mandates: to achieve price stability (control inflation) and foster full employment. Its primary tool to achieve these two goals is by adjusting interest rates. When prices are rising too quickly and inflation is above the Fed’s 2% target, the Fed will raise rates, which helps the USD value. When inflation falls below 2% or the Unemployment Rate is too high, the Fed may lower interest rates, which weighs on the Greenback.
In extreme situations, the Federal Reserve can also print more Dollars and enact quantitative easing (QE). QE is the process by which the Fed substantially increases the flow of credit in a stuck financial system. It is a non-standard policy measure used when credit has dried up because banks will not lend to each other (out of the fear of counterparty default). It is a last resort when simply lowering interest rates is unlikely to achieve the necessary result. It was the Fed’s weapon of choice to combat the credit crunch that occurred during the Great Financial Crisis in 2008. It involves the Fed printing more Dollars and using them to buy US government bonds predominantly from financial institutions. QE usually leads to a weaker US Dollar.
Quantitative tightening (QT) is the reverse process whereby the Federal Reserve stops buying bonds from financial institutions and does not reinvest the principal from the bonds it holds maturing in new purchases. It is usually positive for the US Dollar.
Bank of England (BoE) Chief Economist Huw Pill signaled to markets that the UK's central bank will be considering rate cuts over the next few meetings, provided there are no "big disturbances" in the economy. BoE's Pill spoke during a virtual question and answer period regarding the BoE's Monetary Policy Report.
Key highlights
In the absence of big disturbances to the economy, we will be thinking about cutting rates over the next few meetings.
Global rate moves may be less synchronized.
We are confident we can start to reduce policy restriction, but we're not there yet.
There are some signs UK economic activity is recovering.
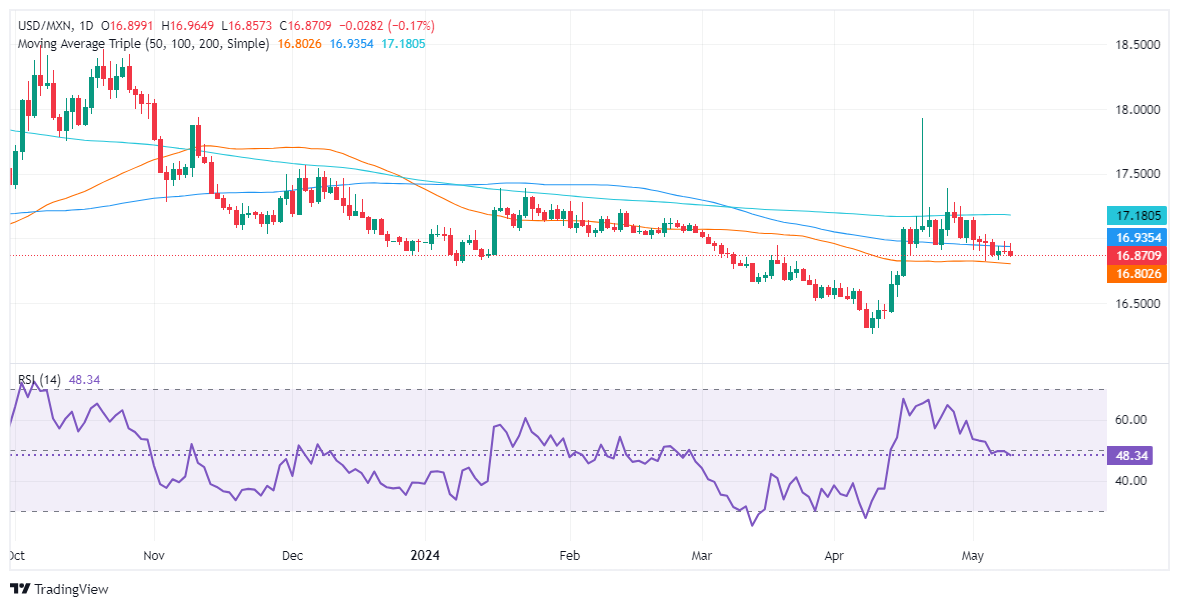
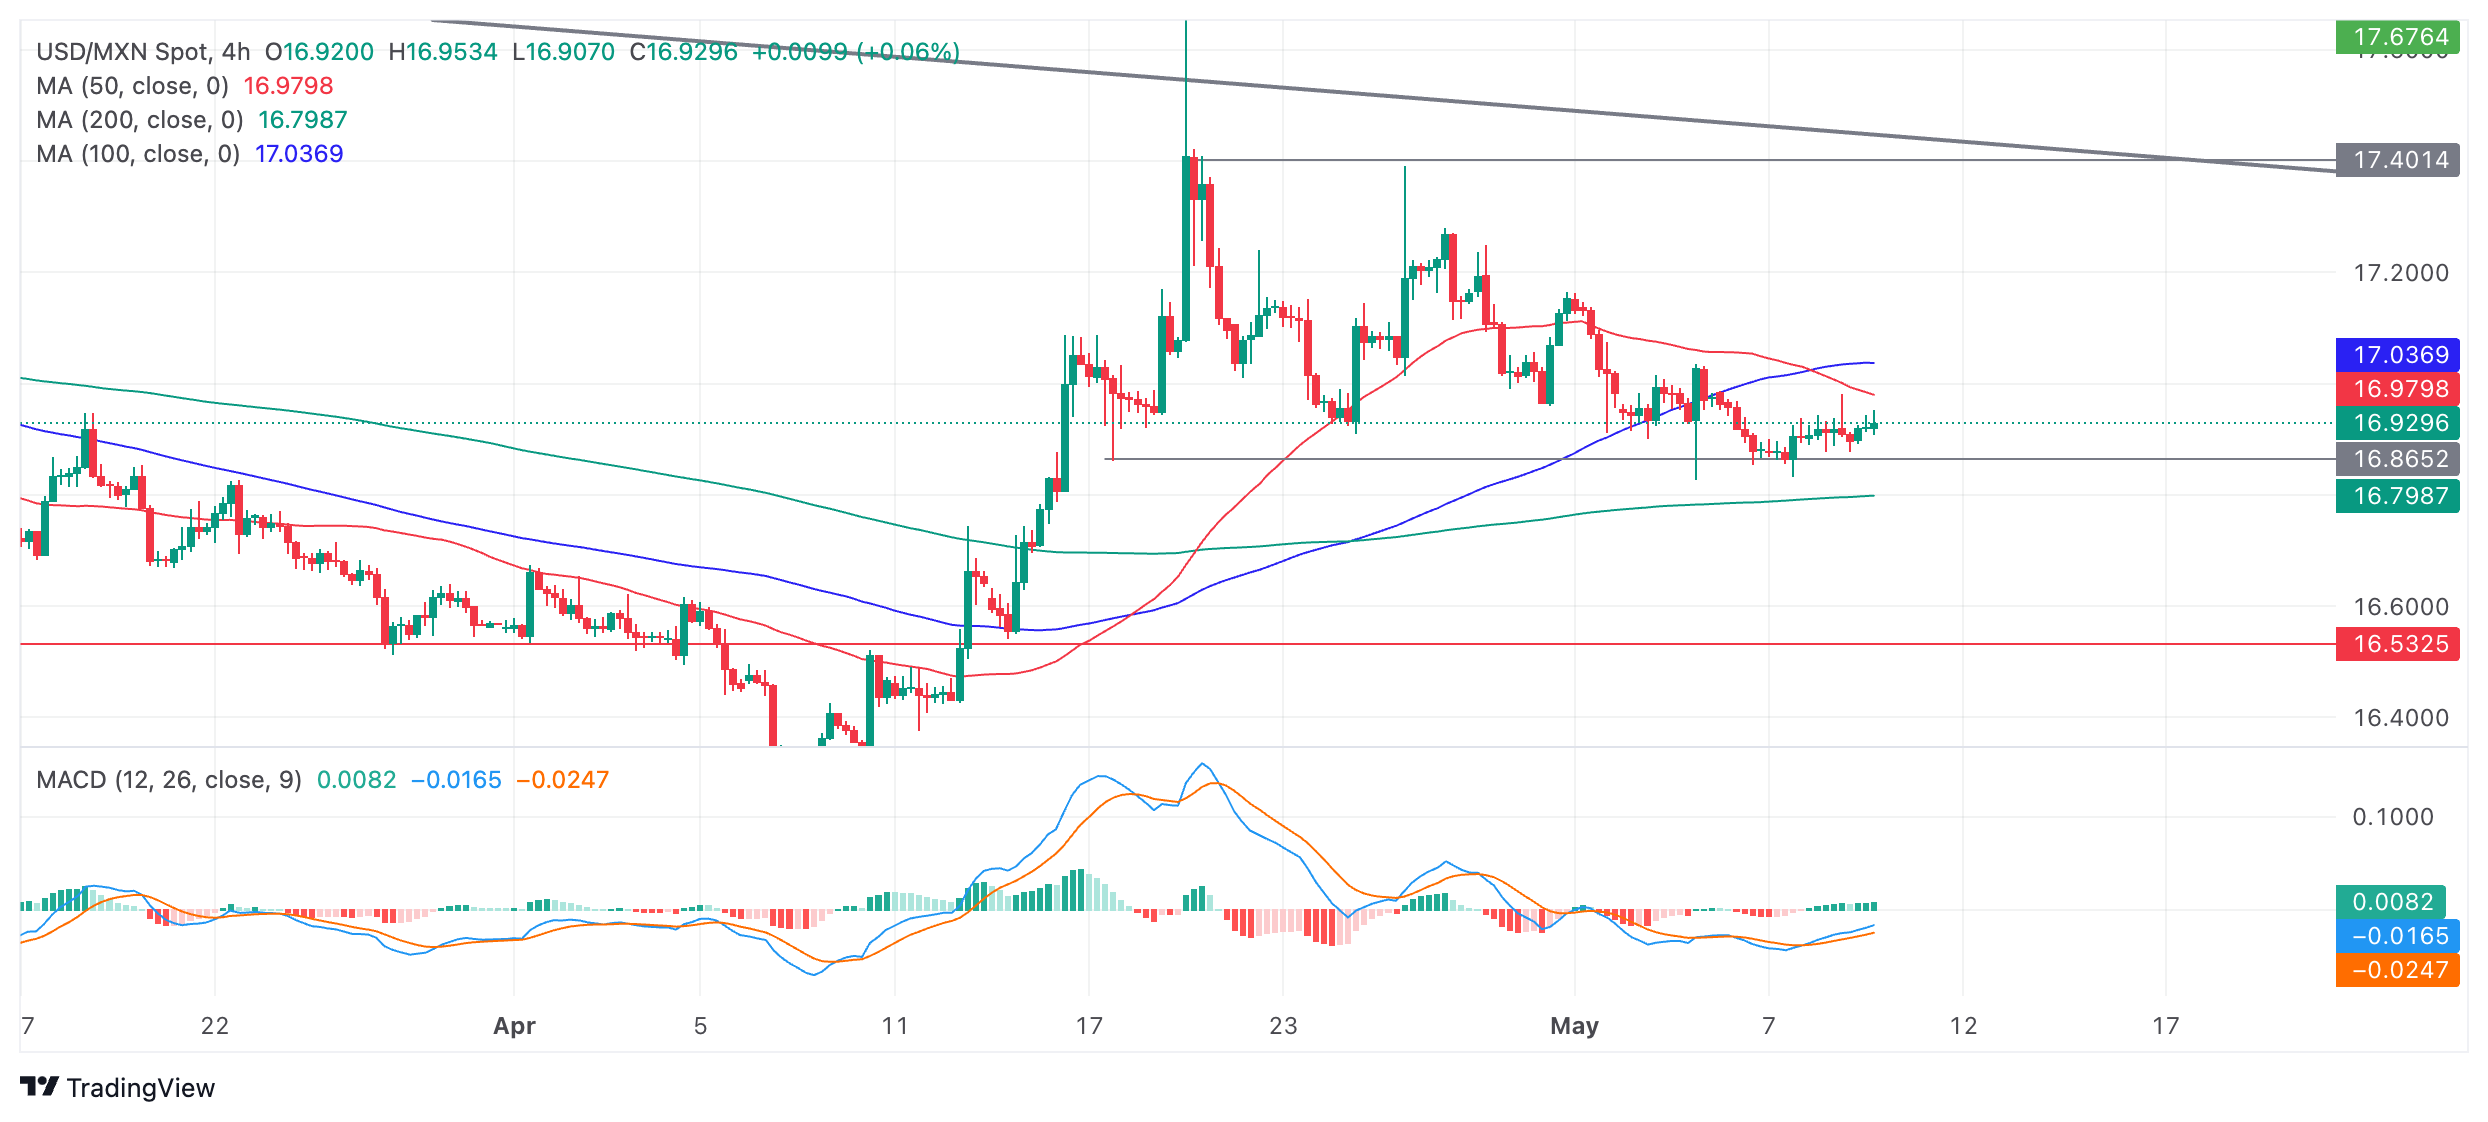
Mexican Peso strengthens as the USD/MXN drops 0.21%, following April’s hot inflation report
Consumer Price Index data shows prices remain above Banxico’s target range, hinting it may hold rates at 11.00%.
USD/MXN traders’ eye upcoming decisions from Banxico and its updates to economic projections.
The Mexican Peso appreciated against the US Dollar after the latest inflation data increasing the likelihood that the Bank of Mexico (Banxico) will keep rates unchanged. Headline figures on a monthly and annual basis exceeded forecasts, but underlying measures edged slightly lower. The USD/MXN trades at 16.86, down 0.21%.
Mexico’s economic docket revealed that the Consumer Price Index (CPI) for April showed that prices remain above Banxico’s 3% plus or minus 1% goal, which would likely prevent the Mexican central bank from continuing to ease policy.
Looking ahead, Banxico, under the leadership of Governor Victoria Rodriguez Ceja, is expected to keep rates unchanged at 11.00% by most analysts as inflation reaccelerated last month. However, it's crucial to note that Mexico’s economy has shown signs of weakness, largely due to the economic slowdown in the United States (US). This factor could significantly influence the future of the Mexican Peso.
Therefore, USD/MXN traders should watch Banxico’s Governing Council's decision and the update on economic projections.
Across the border, the US jobs market continued to show signs of cooling, with the number of Americans filling out unemployment benefits crushing estimates. Later, San Francisco Fed President Mary Daly will cross the newswires.
Daily digest market movers: Inflation in Mexico rises ahead of Banxico’s decision
Mexican Core CPI in April increased by 0.21% MoM, below the expected 0.24% and significantly lower than the previous month's increase of 0.44%. Meanwhile, headline CPI moderated to 0.20%, slightly above the forecast of 0.19% but below the prior month's 0.29%.
On an annual basis, underlying inflation rose by 4.37%, below estimates of 4.40% and March’s 4.55%. Headline inflation ticked up to 4.65%, up from 4.42%, exceeding forecasts of 4.63%.
Most bank analysts predict that Banxico will keep interest rates steady with a unanimous decision expected from the Governing Council. However, future meetings are anticipated to be more contentious, potentially leading to divided votes. This expectation arises from comments by two Deputy Governors, Irene Espinosa and Jonathan Heath, who have stated that inflation is still elevated, necessitating that interest rates stay put.
US Department of Labor revealed that Initial Jobless Claims for the week ending May 4 increased by 231K, above estimates of 210K, up from the previous week's 209K.
US labor market continues to cool. April’s Nonfarm Payrolls and the release of the latest unemployment claims data can put pressure on Fed officials, who acknowledged that risks to achieving its dual mandate on employment and inflation “moved toward better balance over the past year.”
Data from the futures market see odds for a quarter percentage point Fed rate cut in September at 86%, versus 55% ahead of last week’s FOMC decision.
The USD/MXN remains biased to the downside, showcasinging the Peso’s strength as sellers remain in charge. Momentum depicted by the Relative Strength Index (RSI) in bearish territory hints that the exotic pair can be testing the 50-day Simple Moving Average (SMA) at 16.79, which is the immediate support level in the short term.
Once cleared, the USD/MXN would test the 2023 low of 16.62, followed by the current year-to-date low of 16.25.
On the other hand, if buyers claim the 100-day SMA at 16.93, that could sponsor a leg up to the 17.00 psychological level. A breach of the latter would expose the 200-day SMA at 17.17, followed by the January 23 swing high of 17.38 and the year-to-date high of 17.92.
Mexican Peso FAQs
The Mexican Peso (MXN) is the most traded currency among its Latin American peers. Its value is broadly determined by the performance of the Mexican economy, the country’s central bank’s policy, the amount of foreign investment in the country and even the levels of remittances sent by Mexicans who live abroad, particularly in the United States. Geopolitical trends can also move MXN: for example, the process of nearshoring – or the decision by some firms to relocate manufacturing capacity and supply chains closer to their home countries – is also seen as a catalyst for the Mexican currency as the country is considered a key manufacturing hub in the American continent. Another catalyst for MXN is Oil prices as Mexico is a key exporter of the commodity.
The main objective of Mexico’s central bank, also known as Banxico, is to maintain inflation at low and stable levels (at or close to its target of 3%, the midpoint in a tolerance band of between 2% and 4%). To this end, the bank sets an appropriate level of interest rates. When inflation is too high, Banxico will attempt to tame it by raising interest rates, making it more expensive for households and businesses to borrow money, thus cooling demand and the overall economy. Higher interest rates are generally positive for the Mexican Peso (MXN) as they lead to higher yields, making the country a more attractive place for investors. On the contrary, lower interest rates tend to weaken MXN.
Macroeconomic data releases are key to assess the state of the economy and can have an impact on the Mexican Peso (MXN) valuation. A strong Mexican economy, based on high economic growth, low unemployment and high confidence is good for MXN. Not only does it attract more foreign investment but it may encourage the Bank of Mexico (Banxico) to increase interest rates, particularly if this strength comes together with elevated inflation. However, if economic data is weak, MXN is likely to depreciate.
As an emerging-market currency, the Mexican Peso (MXN) tends to strive during risk-on periods, or when investors perceive that broader market risks are low and thus are eager to engage with investments that carry a higher risk. Conversely, MXN tends to weaken at times of market turbulence or economic uncertainty as investors tend to sell higher-risk assets and flee to the more-stable safe havens.
Canadian Dollar propped up by broad-market, risk-on sentiment.
Canada has a resilient financial system, says BoC Macklem.
Canadian labor numbers slated to print on Friday.
The Canadian Dollar (CAD) found some bids on Thursday after investors’ risk-appetite stepped up, bolstering markets out of safe-havens like the US Dollar (USD). The Greenback is broadly softer on the day, and CAD traders are finding fresh buying momentum.
The Bank of Canada (BoC) delivered its latest Financial System Review during Thursday’s American market session. BoC Governor Tiff Macklem assured market participants that the Canadian financial system remains “resilient” overall, the BoC head noted that signs of stress are increasing. BoC Deputy Governor Carolyn Rogers also noted that while the number of small businesses reporting insolvencies has increased, the BoC doesn’t see this having broader implications for the Canadian economy.
Daily digest market movers: Canadian Dollar climbs again as BoC talks down risks
BoC Gov Macklem:
Canadian financial system remains resilient.
Market expectations about timing of rate cuts could introduce volatility.
Financial institutions adjusting to higher rates presents a risk to financial stability.
Indicators of financial stress have risen.
BoC Deputy Gov Rogers:
The number of smaller firms filing for insolvency have increased, but could just mean normalization after years of below-average filings.
Crude Oil markets remain tepid, crimping upside potential in CAD.
Friday will close out the trading week with Canadian labor figures.
The Canadian Unemployment Rate is expected to tick higher to 6.2% from 6.1%.
April’s Canadian Net Change in Employment is expected to show a net increase of 18K new jobs additions, up from the previous month’s -2.2K decline.
Canadian Dollar price today
The table below shows the percentage change of Canadian Dollar (CAD) against listed major currencies today. Canadian Dollar was the strongest against the Japanese Yen.
USD
EUR
GBP
CAD
AUD
JPY
NZD
CHF
USD
-0.22%
-0.07%
-0.24%
-0.39%
0.19%
-0.22%
-0.06%
EUR
0.22%
0.15%
-0.02%
-0.16%
0.37%
0.00%
0.16%
GBP
0.06%
-0.15%
-0.16%
-0.31%
0.22%
-0.14%
0.01%
CAD
0.25%
0.04%
0.19%
-0.14%
0.43%
0.04%
0.19%
AUD
0.39%
0.15%
0.31%
0.13%
0.52%
0.16%
0.30%
JPY
-0.20%
-0.37%
-0.21%
-0.39%
-0.51%
-0.34%
-0.22%
NZD
0.21%
0.00%
0.15%
-0.04%
-0.18%
0.39%
0.14%
CHF
0.08%
-0.14%
0.01%
-0.17%
-0.31%
0.22%
-0.14%
The heat map shows percentage changes of major currencies against each other. The base currency is picked from the left column, while the quote currency is picked from the top row. For example, if you pick the Euro from the left column and move along the horizontal line to the Japanese Yen, the percentage change displayed in the box will represent EUR (base)/JPY (quote).
Technical analysis: Canadian Dollar claws back further ground from receding Greenback
The Canadian Dollar is broadly higher on Thursday, extending a rebound that started midweek. The Canadian Dollar is up around a third of a percent against the US Dollar, and climbed four-tenths of a percent against the Japanese Yen (JPY).
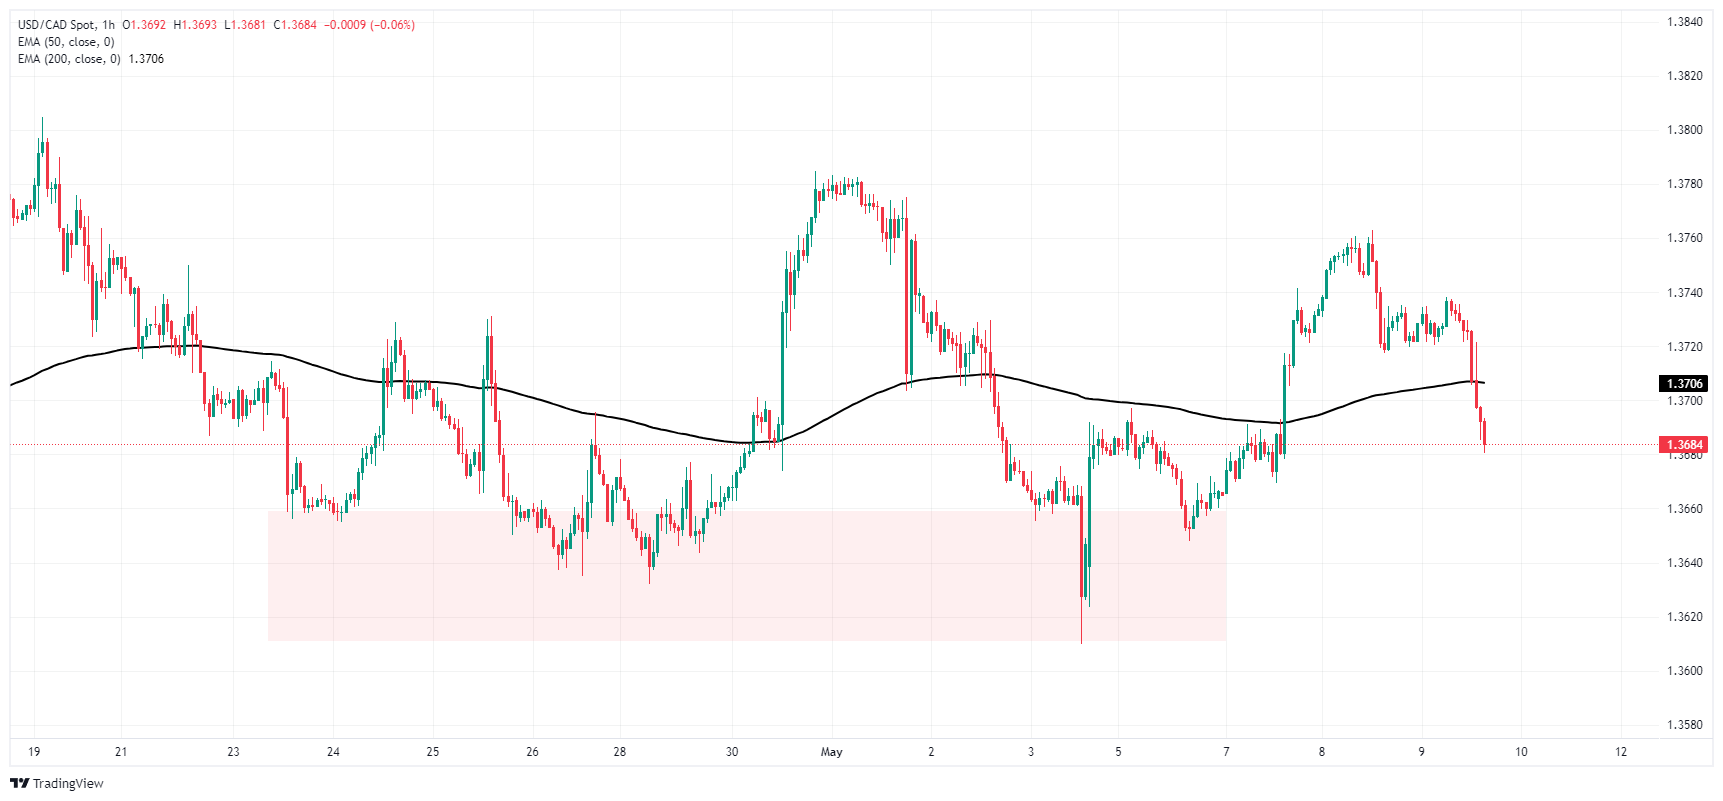
USD/CAD was dragged lower on the day, falling back below the 200-hour Exponential Moving Average (EMA) at 1.3708, and is approaching a near-term supply zone between 1.3660 and 1.3610. This week’s bullish swing fumbled from 1.3760, and swing highs are having a difficult time establishing footholds.
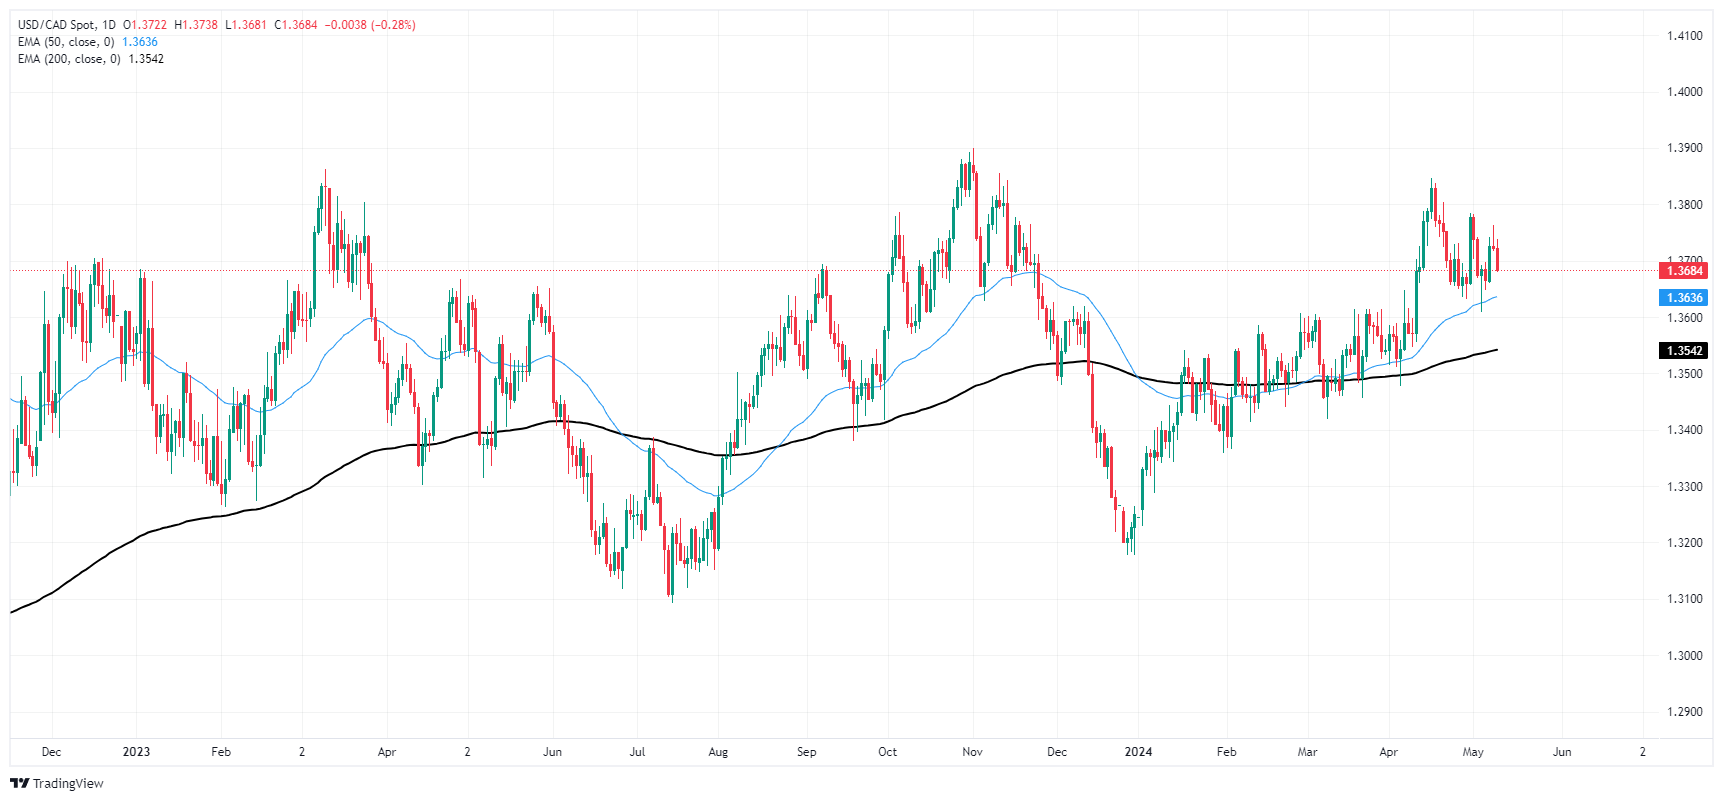
Daily candlesticks continue to trade north of 1.3650 as the pair finds support from the 50-day EMA at 1.3636. Despite a near-term bearish tilt pulling the pair down from the last swing high into 1.3850, the pair is still up on the year, trading up 3.3% from 2024’s opening bids of 1.3246.
USD/CAD hourly chart
USD/CAD daily chart
Canadian Dollar FAQs
The key factors driving the Canadian Dollar (CAD) are the level of interest rates set by the Bank of Canada (BoC), the price of Oil, Canada’s largest export, the health of its economy, inflation and the Trade Balance, which is the difference between the value of Canada’s exports versus its imports. Other factors include market sentiment – whether investors are taking on more risky assets (risk-on) or seeking safe-havens (risk-off) – with risk-on being CAD-positive. As its largest trading partner, the health of the US economy is also a key factor influencing the Canadian Dollar.
The Bank of Canada (BoC) has a significant influence on the Canadian Dollar by setting the level of interest rates that banks can lend to one another. This influences the level of interest rates for everyone. The main goal of the BoC is to maintain inflation at 1-3% by adjusting interest rates up or down. Relatively higher interest rates tend to be positive for the CAD. The Bank of Canada can also use quantitative easing and tightening to influence credit conditions, with the former CAD-negative and the latter CAD-positive.
The price of Oil is a key factor impacting the value of the Canadian Dollar. Petroleum is Canada’s biggest export, so Oil price tends to have an immediate impact on the CAD value. Generally, if Oil price rises CAD also goes up, as aggregate demand for the currency increases. The opposite is the case if the price of Oil falls. Higher Oil prices also tend to result in a greater likelihood of a positive Trade Balance, which is also supportive of the CAD.
While inflation had always traditionally been thought of as a negative factor for a currency since it lowers the value of money, the opposite has actually been the case in modern times with the relaxation of cross-border capital controls. Higher inflation tends to lead central banks to put up interest rates which attracts more capital inflows from global investors seeking a lucrative place to keep their money. This increases demand for the local currency, which in Canada’s case is the Canadian Dollar.
Macroeconomic data releases gauge the health of the economy and can have an impact on the Canadian Dollar. Indicators such as GDP, Manufacturing and Services PMIs, employment, and consumer sentiment surveys can all influence the direction of the CAD. A strong economy is good for the Canadian Dollar. Not only does it attract more foreign investment but it may encourage the Bank of Canada to put up interest rates, leading to a stronger currency. If economic data is weak, however, the CAD is likely to fall.
15:43
United States 4-Week Bill Auction dipped from previous 5.275% to 5.27%
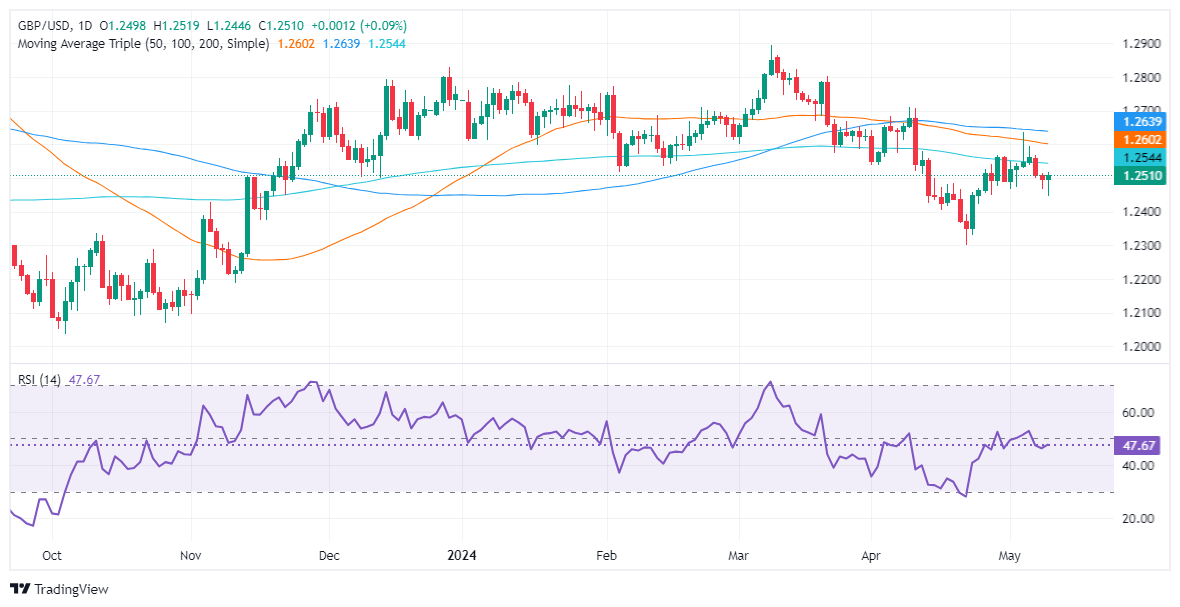
GBP/USD has been trading volatile after the BoE’s decision; stands above 1.2500.
BoE’s Bailey sounded dovish after stating they would need to lower rates below what’s priced in.
Thursday’s price action is forming a ‘hammer,’ hinting further upside is seen.
The Pound Sterling erased some of its earlier losses against the US Dollar and edged up by 0.03% after the Bank of England’s (BoE) monetary policy decision. The GBP/USD traded at 1.2503 after hitting a low of 1.2445.
Earlier, the BoE held rates unchanged in a 7-2 split vote, with David Ramsden and Swati Dhingra voting for a quarter of a percentage point. After releasing its monetary policy statement, the BoE hosted a press conference. BoE Governor Andrew Bailey stated the central bank would need to cut rates more than it is currently priced by market rates.
Given the fundamental backdrop, the GBP/USD remains neutral with a downward bias, with the pair failing to crack the 200-day moving average (DMA) decisively. Even though momentum favors sellers, as depicted by the Relative Strength Index (RSI) being in bearish territory, they would also need to push the exchange rate back below 1.2500.
In that outcome, the GBP/USD next support would be the May 9 low of 1.2445, followed by the 1.2400 figure. Below this level, the next major support level emerges at the year-to-date (YTD) low of 1.2299.
It should be said that today’s price action is forming a ‘hammer.’ With that said, if buyers clear the 200-DMA at 1.2542, the next resistance would be the confluence of the May 6 high and the 50-DMA at around 1.2594/1.2600. Once cleared, the 100-DMA at 1.2634 would follow.
The Bank of Canada (BoC) published its Financial System Review (FSR) on Thursday.
Key Quotes from BoC Governor Tiff Macklem:
Canada's financial system remains resilient. There could be volatility in global markets as expectations shift about the scope and timing of rate cuts. Adjustment by financial institutions to higher rates and possible shocks has some way to go, presents risks to financial stability. Some indicators of financial stress have risen; the valuations of some financial assets appear to have become stretched. This increases the risk of a sharp correction that could generate system-wide stress.
Highlights from BoC Senior Deputy Governor Carolyn Rogers:
The financial health of large businesses appears solid, but smaller businesses are showing more signs of financial stress. Overall, evidence suggests households can continue servicing debt at higher rates. An increase in insolvency filings by smaller firms could be a normalization after years of below-average filings as pandemic supports expire. In non-bank financial sector, some firms are increasing their use of leverage to fund trading activities; which makes them more vulnerable to large market swings Overall credit performance of canadian banks remains strong.
14:30
United States EIA Natural Gas Storage Change below forecasts (87B) in May 3: Actual (79B)
USD/CAD drops sharply to 1.3700 due to multiple headwinds.
A significant fall in the US Dollar and higher Oil prices weigh on the Lonnie asset.
The Canadian Employment data will impact BoE’s rate-cut prospects.
The USD/CAD pair falls sharply to the round-level support of 1.3700 in Thursday’s early American session. The Loonie asset faces selling pressure due to multiple headwinds such as sharp fall in the US Dollar after higher-than-expected Initial Jobless Claims (IJC) for the week ending May 3 and a strong recovery in the Oil price that strengthens the Canadian Dollar.
The S&P 500 has opened on a cautiously optimistic note. The 500-stocks basket was expected to open on a negative note due to weak S&P 500 futures. Overnight futures recovered sharply after the United States Department of Labor reported a significant rise in jobless claims, suggesting an improvement in investors’ risk-appetite.
Individuals claiming jobless benefits were 231K, significantly higher than the consensus of 210K and the prior reading of 209K, upwardly revised from 208K. This has raised concerns over the labor market maintaining its strength in the longer term. Also, it signals the deepening consequences of higher interest rates by the Federal Reserve (Fed). For April month, Nonfarm Payrolls (NFP) missed estimates by a wide margin.
However, Fed policymakers continue to support keeping interest rates at their current levels for long enough until they get convinced that inflation will sustainably return to the desired rate of 2%. On Tuesday, Minneapolis Fed Bank President Neel Kashkari said weakness in the job market could justify a rate-cut move.
Meanwhile, the Oil price has recovered sharply due to a drawdown in US oil stockpiles for the week ending May 3. The US Energy Information Administration (EIA) reported on Wednesday that crude inventories were lower by 1.362 million barrels after rising significantly to 7.265 million barrels last week. It is worth noting that Canada is the leading exporter of Oil to the United States, and higher Oil prices strengthen the Canadian Dollar.
Going forward, the Canadian Dollar will dance to the tunes of the Employment data for April, which will be published on Friday. The Canadian job market is estimated to have expanded by fresh 20K payrolls against a drawdown of 2.2K. The Unemployment Rate is anticipated to have risen to 6.2% from 6.1%. The labor market data will significantly influence the Bank of Canada’s (BoC) interest rate outlook.
Economic Indicator
Net Change in Employment
The Net Change in Employment released by Statistics Canada is a measure of the change in the number of people in employment in Canada. Generally speaking, a rise in this indicator has positive implications for consumer spending and indicates economic growth. Therefore, a high reading is seen as bullish for the Canadian Dollar (CAD), while a low reading is seen as bearish.
Canada’s labor market statistics tend to have a significant impact on the Canadian dollar, with the Employment Change figure carrying most of the weight. There is a significant correlation between the amount of people working and consumption, which impacts inflation and the Bank of Canada’s rate decisions, in turn moving the C$. Actual figures beating consensus tend to be CAD bullish, with currency markets usually reacting steadily and consistently in response to the publication.
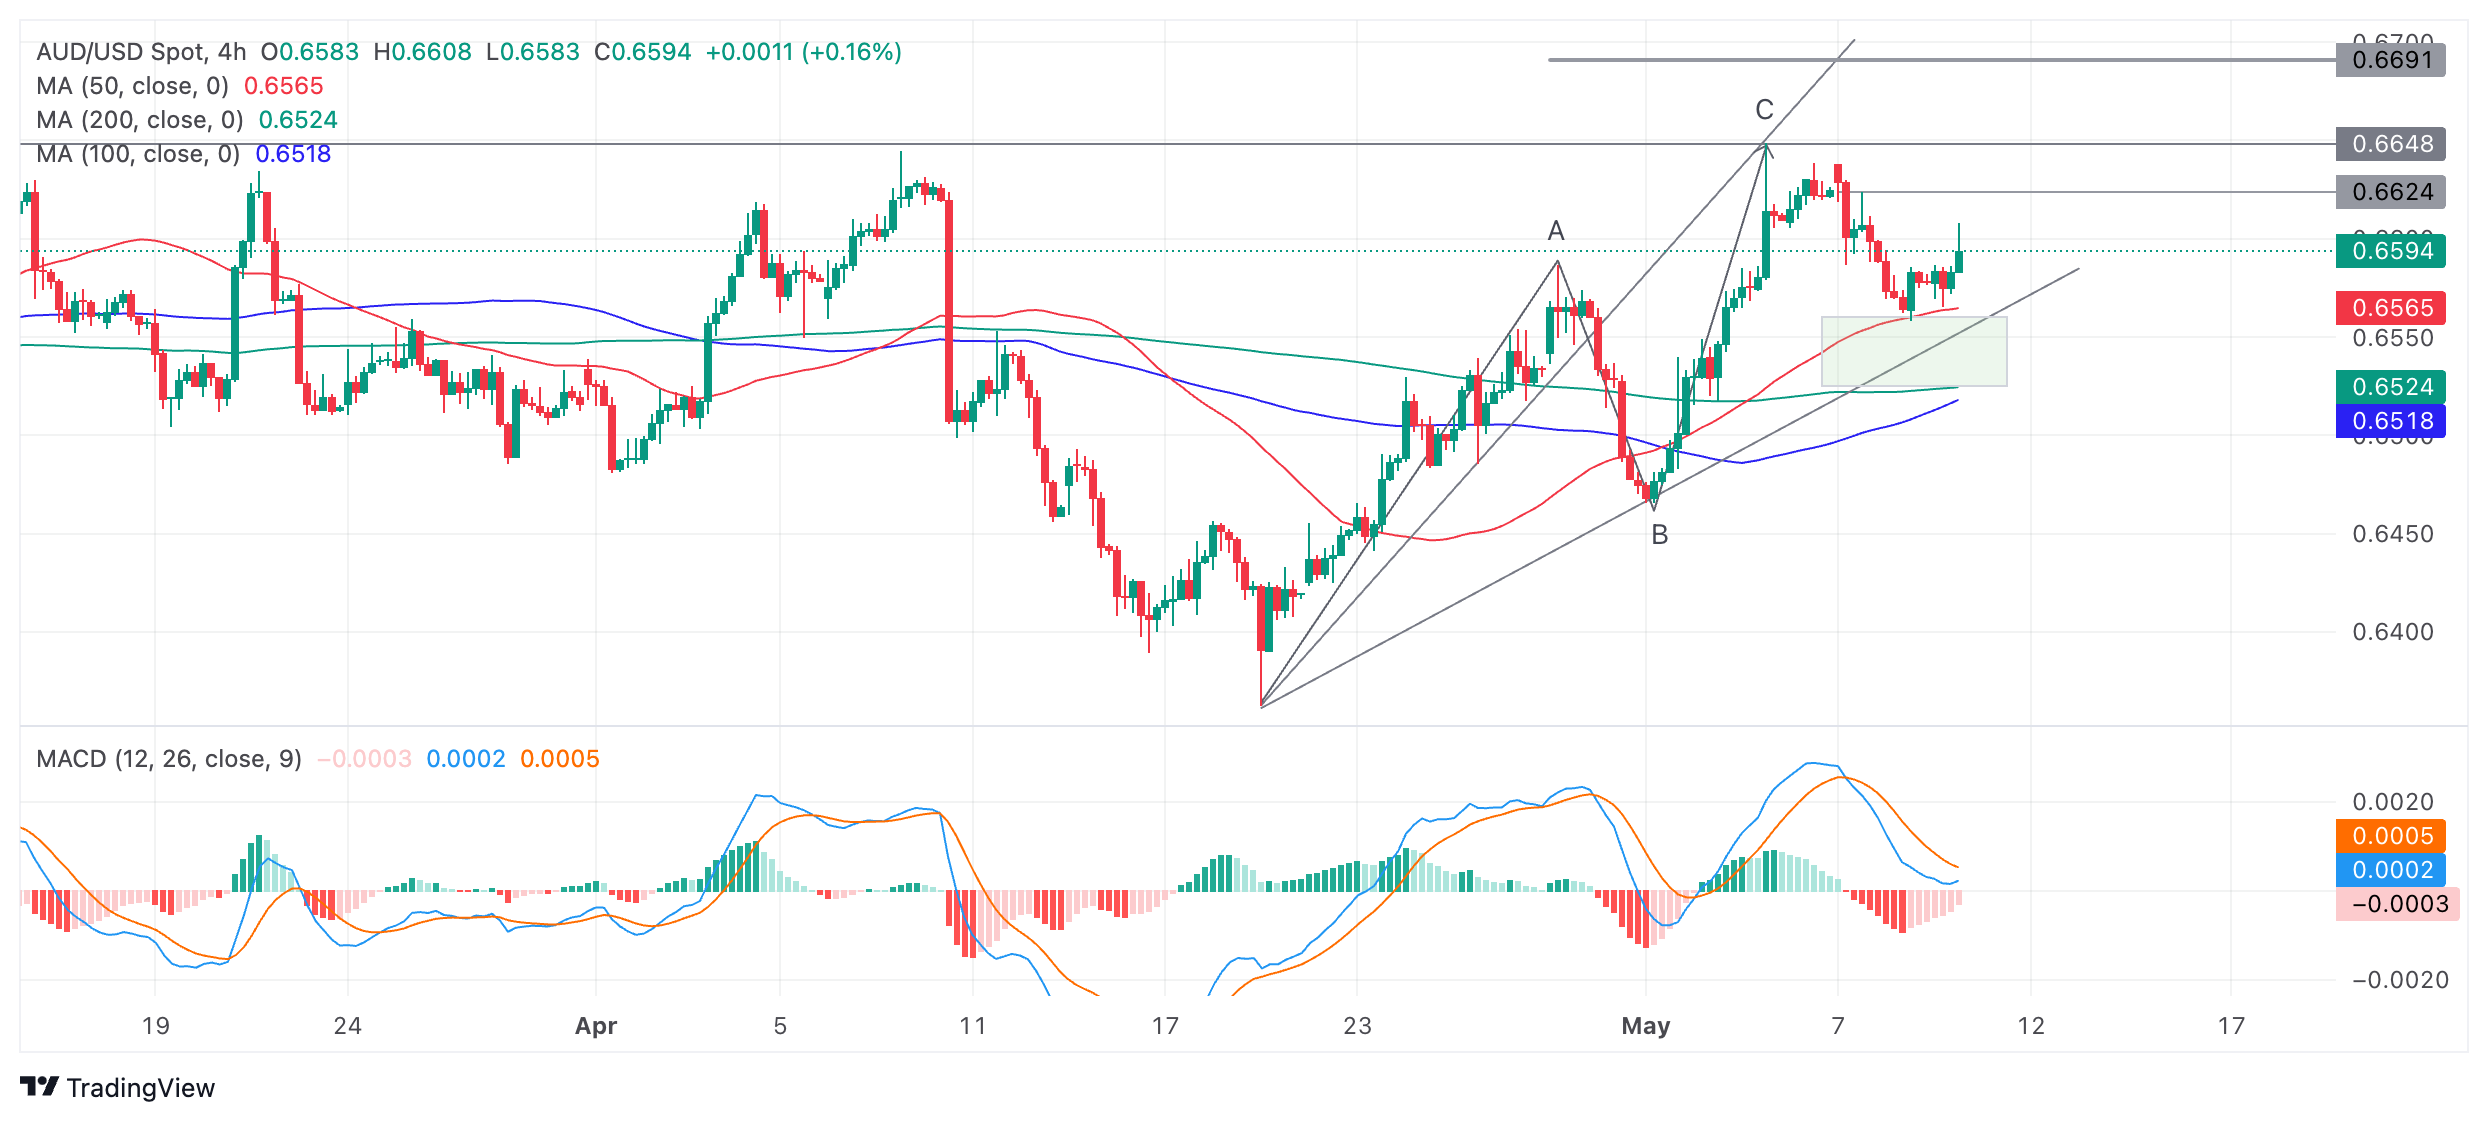
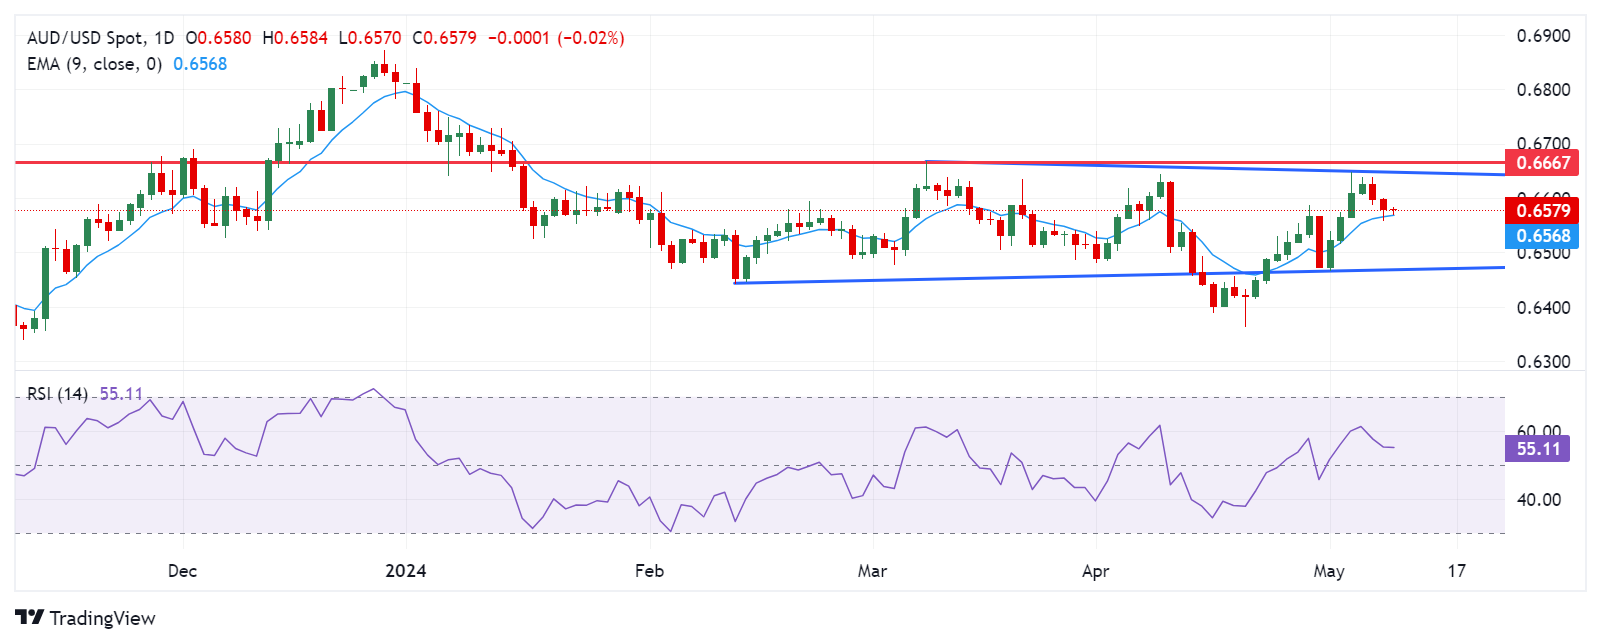
AUD/USD is probably resuming its short-term uptrend after completing a correction.
A break above 0.6624 would help confirm the bullish case.
AUD/USD may have formed a Measured Move with a final target at around 0.6690.
AUD/USD is trading in the 0.6590s on Thursday after finding support from the 50 Simple Moving Average (SMA) and mounting a recovery.
The pair is probably resuming its short-term uptrend, evidenced by the rising sequence of peaks and troughs since the April 19 lows, visible on the 4-hour chart
AUD/USD 4-hour Chart
Given the old trader’s adage that “the trend is your friend” the resumption of the uptrend suggests AUD/USD will continue higher.
A break above the 0.6608 and then the 0.6624 highs would provide more confirmation that the uptrend was resuming. The next upside targets for the uptrend lie at the 0.6649 resistance level of the May 3 high and then at a target at around 0.6680-90.
The second target is generated by a possible Measured Move pattern that AUD/USD has formed since the April 19 lows. These patterns are like large zig-zags composed of three waves, labeled A, B and C on the chart. The general expectation is that wave C will be either the same length as A or a Fibonacci 0.681 of A.
Wave C has already reached the Fibonacci 0.681 target of the Measured Move at the May 3 highs, however, there is a chance it could go all the way to the second target where C=A at 0.6690.
The Moving Average Convergence Divergence (MACD) momentum indicator is painting red histogram bars indicating a negative bias. This suggests price might be vulnerable to more downside. It is possible the correction from the May 3 highs may have further to run before the uptrend properly resumes.
The rectangular pale green zone drawn on the chart just above the lower trendline is likely to continue providing a cushion of support for price. From there price will probably resume its uptrend. A break below the trendline, however, would be a bearish sign, suggesting a potential reversal of the trend.
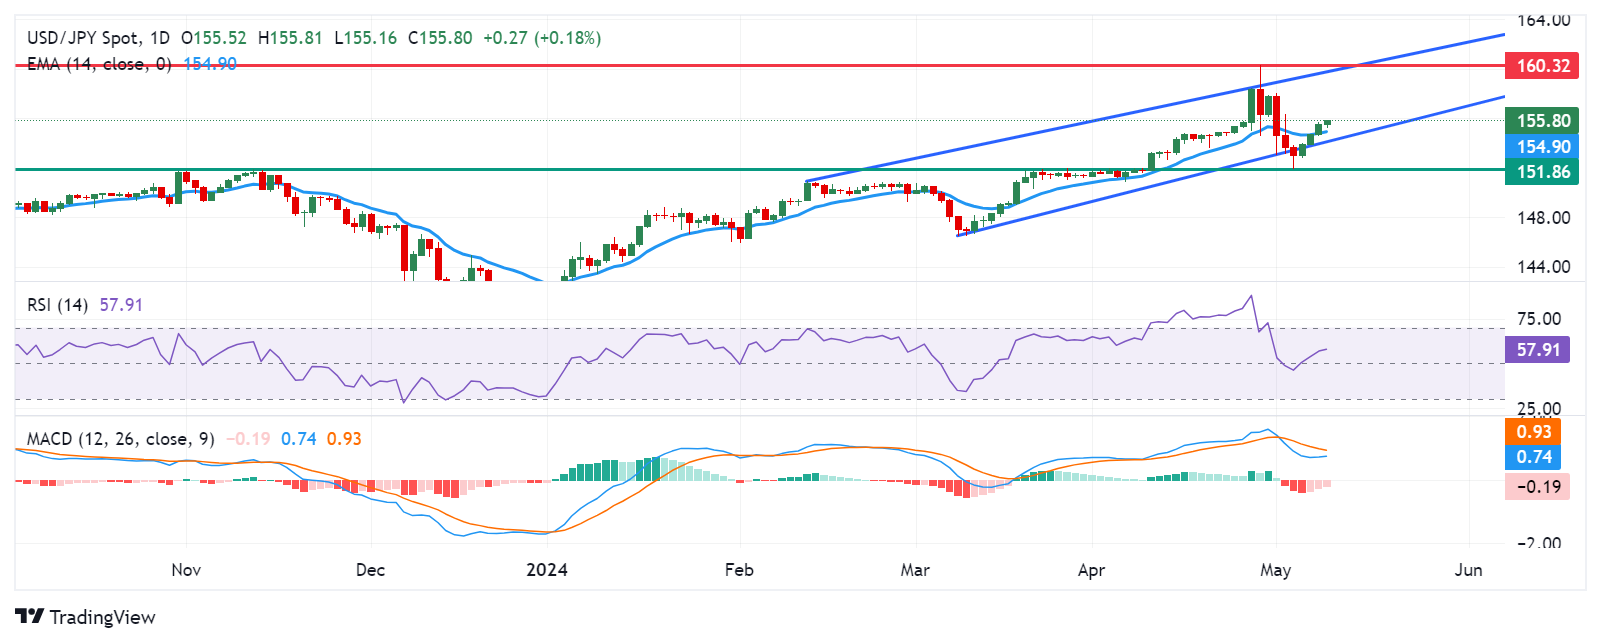
USD/JPY pushes relentlessly higher as market forces overcome intervention attempts.
The US Dollar is strengthening across the board as interest rates in the US diverge from the global trend.
Weak Japanese wage data puts a dent in BoJ plan to hike interest rates to prop up the Yen.
USD/JPY is trading up two-tenths of a percent in the 155.80s on Thursday as the US Dollar (USD) continues its recovery rally from the May 3 lows.
The strength of the Dollar is broad-based although USD/JPY is rising faster than the US Dollar Index (DXY) – perhaps because the Japanese Yen (JPY) is depreciating more than most currencies following the release of weak wage data from Japan.
A lack of inflationary pressures in Japan mean the Bank of Japan (BoJ) cannot raise interest rates to support the Yen and this combined with the outlook for higher interest rates in the US due to strong economic activity, suggest a bullish outlook for USD/JPY.
Everything is relative
The most recent comments from Federal Reserve (Fed) officials suggest they are in favor of keeping interest rates higher for longer due to stubbornly high inflation. This is one of the factors supporting the Greenback, as higher interest rates strengthen a currency because they generate greater foreign capital inflows.
Another factor supporting the USD is the divergence that the Fed’s stance opens up with other major central banks.
“The relative story continues to push the (US) Dollar higher. Given the absence of any topline US economic data, we chalk these gains up to developments in the rest of the world. With FX, it’s always about the relative story and here, other central banks have so far shown an unwillingness to be as hawkish as the Fed. First, the RBA delivered a neutral hold. Then, the Riksbank delivered a 25 bps cut, becoming the second major central bank to cut rates (after Switzerland). Who’s next?” Says Brown Brothers Harriman in a note on Thursday.
Since this was written, the Bank of England (BoE) has reported a dovish hold, with two board members dissenting – up from one last time – and voting for a rate cut instead. The decision sent GBP/USD lower and the Pound Sterling (GBP) depreciated against the USD.
US growth is sound
The expectation the Fed will need to keep interest rates higher for longer is backed not just by “jawboning” but by a relatively strong outlook for US growth.
US economic growth in Q2 remains robust according to various nowcasting models that give real time estimates for growth.
“The Atlanta Fed’s GDPNow model is tracking Q2 growth at 4.2% SAAR and will be updated next Wednesday after the data. Elsewhere, the New York Fed’s Nowcast model is tracking Q2 growth at 2.2% SAAR and will be updated tomorrow,” says BBH.
The models suggest continued inflationary pressures from economic activity which will further delay the decision to cut interest rates, keeping demand robust for USD.
Japanese Yen hampered by weak data
USD/JPY’s bullish outlook is further encouraged by a debilitated JPY which remains handicapped by poor data.
Japan nominal Cash Earnings data in March came out well below estimates at 0.6% year-over-year (vs.1.4% forecast) and below the previous month’s 1.5%. Real Cash Earnings, meanwhile, fell 2.5% YoY when a drop of 1.4% had been expected and a fall of 1.8% was registered in February.
The data was the weakest reading for real Cash Earnings since November and suggests very little in the way of wage pressures.
Given the BoJ’s focus on trying to raise wages to escape the deflation spiral the data suggests, “the BOJ’s tightening process will be gradual,” according to BBH.
“..we doubt the BOJ will tighten more than is currently priced-in (30bps of hikes in 2024). First, underlying inflation in Japan is in a firm downtrend..” Says BBH.
As many analysts have already pointed out, unless the Japanese authorities can combine direct intervention to prop up the Yen with interest rate hikes they do not have the firepower to beat market forces and USD/JPY will continue to rise.
As such, Bank of Japan’s Governor Kazuo Ueda’s recent warnings that a policy response might be needed if foreign exchange rates affect the inflation trend, seem like a hollow threat because he does not have the data behind him to back up his words with actions.
12:30
United States Continuing Jobless Claims came in at 1.785M, below expectations (1.79M) in April 26
12:30
United States Initial Jobless Claims came in at 231K, above expectations (210K) in May 3
12:30
United States Initial Jobless Claims 4-week average up to 215K in May 3 from previous 210K
12:00
Mexico Headline Inflation came in at 0.2%, above expectations (0.19%) in April
12:00
Mexico 12-Month Inflation came in at 4.65%, above expectations (4.63%) in April
12:00
Mexico Core Inflation below expectations (0.24%) in April: Actual (0.21%)
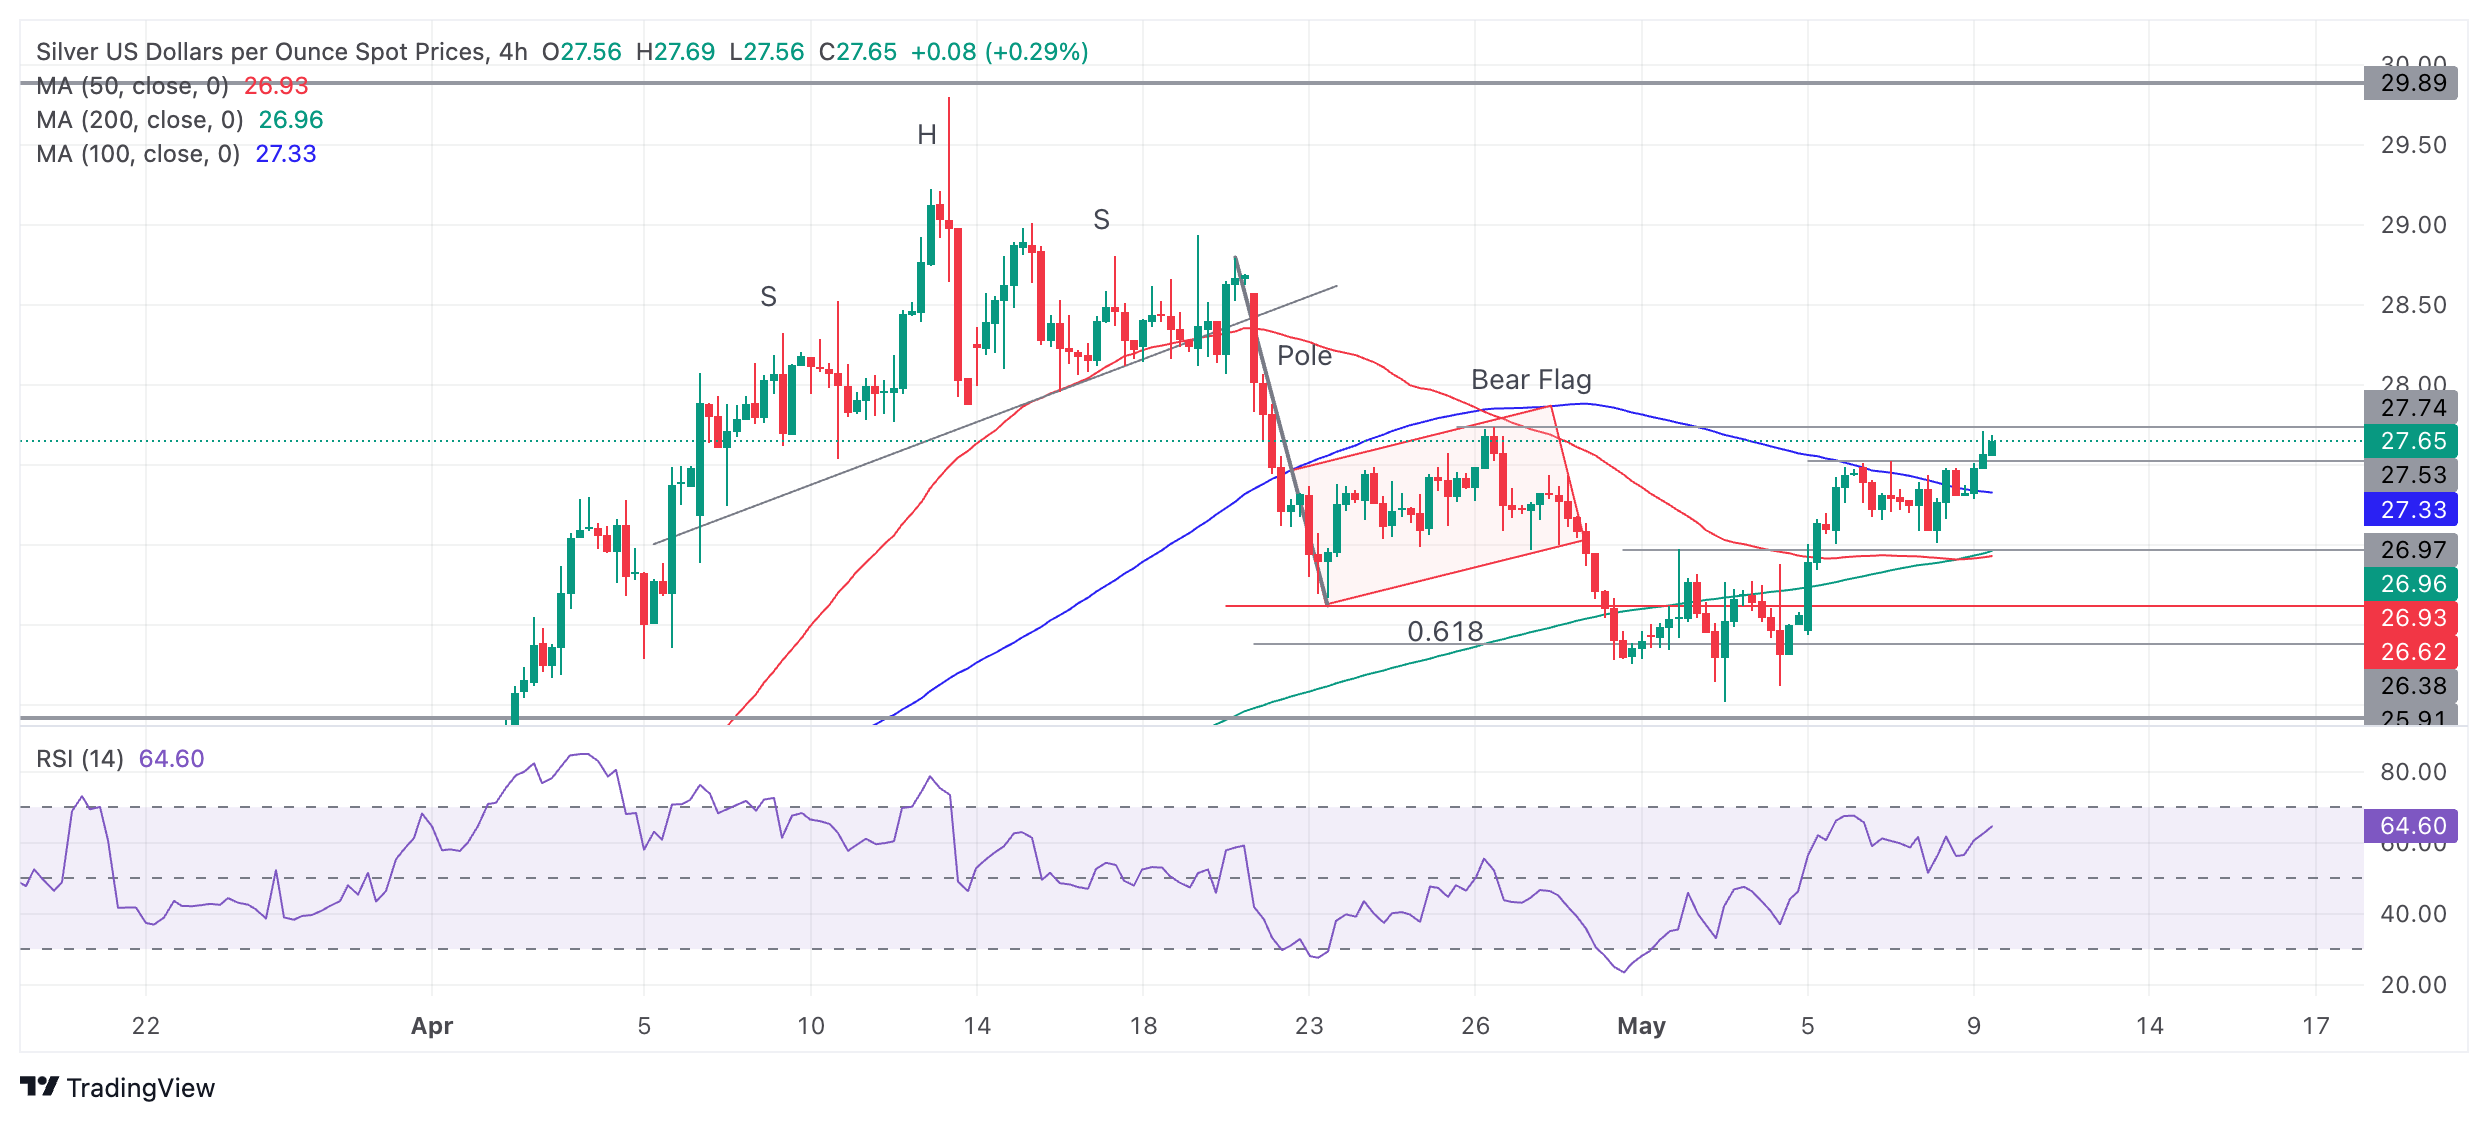
Silver price has probably reversed its short-term downtrend and begun a new uptrend.
It has broken above the May 7 highs – a key sign the short-term trend has reversed.
The possibility now exists for the precious metal to rise back up towards the $30.00 mark.
Silver (XAG/USD) price might well have changed trend in the short-term after breaking above the key May 7 highs at $27.51.
The change of trend is significant because of the old saying that “the trend is your friend” – the environment now probably favors longs over shorts.
4-hour Chart
Silver has risen strongly since bottoming at the beginning of May. It has broken above the last higher low of the downtrend and breached all the major moving averages – the 50, 100 and 200 Simple Moving Averages (SMA). Bullish momentum has been strong during the up move. The sequence of higher highs and higher lows – of peaks and troughs – is now also rising rather than falling.
The break above the May 7 highs now signals the likelihood of a continuation higher. The first upside target lies at $27.74, and this has almost been met. The next target after that lies at around $28.80 where the consolidation that formed the multiple Head and Shoulders price pattern in the first half of April is concentrated. Beyond that there is the possibility of a retest of the $30.00 long-term range highs.
11:01
United Kingdom BoE Interest Rate Decision in line with forecasts (5.25%)
11:00
United Kingdom BoE MPC Vote Rate Hike meets forecasts (0)
11:00
United Kingdom BoE MPC Vote Rate Unchanged came in at 7, below expectations (8)
11:00
South Africa Manufacturing Production Index (YoY) declined to -6.4% in March from previous 4.1%
EUR/USD falls sharply to 1.0730 as the US Dollar recovers on the Fed’s hawkish interest-rate guidance.
Fed’s Collins joins Kashkari to support keeping interest rates steady for a longer period.
The ECB is expected to deliver three rate cuts this year.
EUR/USD extends its losing spell for the third trading session on Thursday. The major currency pair is on the back foot due to firm speculation that the European Central Bank (ECB) will start lowering its interest rates in June. A sharp decline in the Eurozone inflation has allowed ECB policymakers to consider that prospect.
Most ECB policymakers also expect that the rate-cut cycle will continue beyond June as inflation is on course to return to the desired rate of 2%, and the service inflation doesn’t seem stubborn anymore. Services inflation softened to 3.7% in April after remaining steady at 4.0% for five straight months. Traders are pricing in three rate cuts by the ECB this year.
Contrary to the majority of ECB policymakers, who broadly agree over expectations of reducing interest rates from June, one of its Governing Council members and Governor of Austria's central bank, Robert Holzmann, said in Wednesday's early New York session that he doesn't see a reason to cut key interest rates "too quickly or too strongly," Reuters reported.
Daily digest market movers: EUR/USD drops as US Dollar advances
EUR/USD extends its correction to 1.0730 as investors turn risk-averse. The market sentiment turns downbeat as US Federal Reserve (Fed) policymakers maintain hawkish guidance on interest rates.
On Wednesday, Boston Fed Bank President Susan Collins favored for interest rates remaining steady at their current levels until she gets greater confidence that inflation will sustainably return to the desired rate of 2%. Collins added that “A slowdown in activity will be needed to ensure that demand is better aligned with supply for inflation to return durably.” Her comments indicated that the US economic outlook is strong even though interest rates remain higher for a longer period.
Apart from Collins, Minneapolis Fed Bank President Neel Kashkari also remained lean towards maintaining the current interest rate framework as it is for the entire year. Kashkari remains concerned over stalling progress in inflation declining to 2% amid a strong housing market. When asked about an interest rate cut, Kashkari said weakness in the job market could justify it.
Amid dismal market sentiment, the appeal for safe-haven assets such as the US Dollar (USD) and bond yields has improved. The US Dollar Index (DXY), which tracks the US Dollar’s value against six major currencies, moves higher to 105.70. 10-year US Treasury yields jump to 4.52%.
This week, investors look at Fed speakers to project forward moves in the US Dollar due to the absence of top-tier US economic data. However, next week, the major trigger will be producer and consumer inflation data.. Hot inflation numbers would diminish prospects of rate cuts this year.
Technical Analysis: EUR/USD falls to near 1.0730
EUR/USD continues its losing streak for the third trading day in a row. The major currency pair drops to near the 20-day Exponential Moving Average (EMA), which trades around 1.0732, suggesting that the near-term outlook has turned uncertain.
The shared currency pair exhibits a sharp volatility contraction due to a Symmetrical Triangle formation on a daily timeframe. The upward-sloping border of the triangle pattern is plotted from October 3 low at 1.0448 and the downward-sloping border is placed from December 28 high around 1.1140.
The 14-period Relative Strength Index (RSI) oscillates inside the 40.00-60.00 range, suggesting indecisiveness among market participants.
Euro FAQs
The Euro is the currency for the 20 European Union countries that belong to the Eurozone. It is the second most heavily traded currency in the world behind the US Dollar. In 2022, it accounted for 31% of all foreign exchange transactions, with an average daily turnover of over $2.2 trillion a day. EUR/USD is the most heavily traded currency pair in the world, accounting for an estimated 30% off all transactions, followed by EUR/JPY (4%), EUR/GBP (3%) and EUR/AUD (2%).
The European Central Bank (ECB) in Frankfurt, Germany, is the reserve bank for the Eurozone. The ECB sets interest rates and manages monetary policy. The ECB’s primary mandate is to maintain price stability, which means either controlling inflation or stimulating growth. Its primary tool is the raising or lowering of interest rates. Relatively high interest rates – or the expectation of higher rates – will usually benefit the Euro and vice versa. The ECB Governing Council makes monetary policy decisions at meetings held eight times a year. Decisions are made by heads of the Eurozone national banks and six permanent members, including the President of the ECB, Christine Lagarde.
Eurozone inflation data, measured by the Harmonized Index of Consumer Prices (HICP), is an important econometric for the Euro. If inflation rises more than expected, especially if above the ECB’s 2% target, it obliges the ECB to raise interest rates to bring it back under control. Relatively high interest rates compared to its counterparts will usually benefit the Euro, as it makes the region more attractive as a place for global investors to park their money.
Data releases gauge the health of the economy and can impact on the Euro. Indicators such as GDP, Manufacturing and Services PMIs, employment, and consumer sentiment surveys can all influence the direction of the single currency. A strong economy is good for the Euro. Not only does it attract more foreign investment but it may encourage the ECB to put up interest rates, which will directly strengthen the Euro. Otherwise, if economic data is weak, the Euro is likely to fall. Economic data for the four largest economies in the euro area (Germany, France, Italy and Spain) are especially significant, as they account for 75% of the Eurozone’s economy.
Another significant data release for the Euro is the Trade Balance. This indicator measures the difference between what a country earns from its exports and what it spends on imports over a given period. If a country produces highly sought after exports then its currency will gain in value purely from the extra demand created from foreign buyers seeking to purchase these goods. Therefore, a positive net Trade Balance strengthens a currency and vice versa for a negative balance.
USD/CAD grinds between firm US Dollar and recovery in the Oil price.
Oil recovers on sharp drawdown in US oil stockpiles.
The Canadian Dollar will be guided by the Employment data for April.
The USD/CAD pair consolidates in a tight range above the round-level support of 1.3700 in Thursday’s European session after correcting from its weekly high of 1.3760. The Loonie asset struggles for direction as the firm US Dollar keeps the downside supported, while strength in the Canadian Dollar due to a sharp recovery in the Oil price restricts the upside.
The US Dollar Index (DXY), which tracks the US Dollar’s value against six major currencies, rises to 105.60. The appeal for the US Dollar improves as Federal Reserve (Fed) policymakers see interest rates remaining unchanged at their current levels for a longer period due to a surprise rise in inflation readings in the last few months.
Meanwhile, sharp Oil price recovery due to a larger-than-expected drawdown in the US oil inventory for the week ending May 3 has boosted demand for the Canadian Dollar. It is worth noting that Canada is the leading exporter of Oil to the United States and higher Oil prices support the Canadian Dollar.
Going forward, investors will focus on the Canada’s Employment data for April, which will be announced on Friday. The Canadian job market is estimated to have expanded by fresh 20K payrolls against a drawdown of 2.2K. The Unemployment Rate is anticipated to have risen to 6.2% from 6.1%. The labor market data will significantly influence the Bank of Canada’s (BoC) interest rate outlook.
USD/CAD recovers strongly after discovering buying interest near the upward-sloping border of the Ascending Triangle formation on a daily timeframe, which is plotted from December 27 low at 1.3178. The horizontal resistance of the above-mentioned chart pattern is placed from November 1 high around 1.3900.
The 20-day Exponential Moving Average (EMA) near 1.3700 continues to provide support to the US Dollar bulls.
The 14-period Relative Strength Index (RSI) oscillates in the 40.00-60.00 range, suggesting indecisiveness among investors.
Fresh buying opportunity would emerge if the asset breaks above April 30 high at 1.3785. This would drive the asset towards April 17 high at 1.3838, followed by the round-level resistance of 1.3900.
In an alternate scenario, a breakdown below May 3 low around 1.3600 will expose the asset to the April 9 low around 1.3547 and the psychological support of 1.3500.
USD/CAD daily chart
Economic Indicator
Net Change in Employment
The Net Change in Employment released by Statistics Canada is a measure of the change in the number of people in employment in Canada. Generally speaking, a rise in this indicator has positive implications for consumer spending and indicates economic growth. Therefore, a high reading is seen as bullish for the Canadian Dollar (CAD), while a low reading is seen as bearish.
Canada’s labor market statistics tend to have a significant impact on the Canadian dollar, with the Employment Change figure carrying most of the weight. There is a significant correlation between the amount of people working and consumption, which impacts inflation and the Bank of Canada’s rate decisions, in turn moving the C$. Actual figures beating consensus tend to be CAD bullish, with currency markets usually reacting steadily and consistently in response to the publication.
Gold price rises slightly as geopolitical risks heighten and Chinese trade data rebounds.
The World Gold Council publishes its monthly report, highlighting Asian demand and central bank buying.
Gold pulls back from resistance and returns to trading within a developing range.
Gold price (XAU/USD) is trading marginally higher on Thursday, exchanging hands in the $2,310s at the time of writing, after better-than-expected trade data from China, a major market for Gold, and the publication of a report by the World Gold Council (WGC) highlighting continued demand from central banks and Asian buyers.
A stalemate in ceasefire talks between Israel and Hamas after Israel’s continued incursions into Rafah, and reports of a worsening situation on the frontline for Ukraine add further upside pressure from geopolitical risk, which benefits Gold as a safe-haven.
Gold price rises on China data, outlook for demand
Gold price ticks up on Thursday after Chinese trade data showed a greater-than-expected rise in Chinese exports of 1.5% year-over-year in April, rebounding from a 7.5% drop a month earlier. According to the data, imports rose 8.4%, beating the 5.4% forecast and the previous 1.9% drop. China is a key player in the global market for Gold so strong economic data from the country impacts its valuation.
Asian demand was also a factor highlighted by the WGC, a respected barometer of the global Gold market, which published its latest report and the outlook for the future regarding the Gold market in April.
WGC’s report noted that whilst Indian demand fell and the Gold futures market showed flatlining uptake, Chinese demand and US ETF flows turned positive, “joining strong demand for Asian ETFs.”
The importance of central banks as key buyers was highlighted, as was geopolitical risk.
“Gold hit new all-time highs in April but pulled back by month-end: Chinese buying and central banks appear to be major drivers of support,” according to the report.
Regarding the outlook, WGC stated that “Stagflation risks are on the rise: growth looks fragile while inflation remains problematic. Asian investors may continue to draw attention.”
Outlook for interest rates caps upside
Gold price may continue to struggle to gain traction, however, as investors continue to expect relatively high interest rates in the US going forward, which is likely to reduce the attractiveness of non-yielding Gold.
Although last week’s US Nonfarm Payrolls data showed a weakening in the US labor market that suggested the Federal Reserve (Fed) might cut interest rates sooner than had been anticipated, commentary from Fed officials since, shows a continued reluctance to lower interest rates.
On Wednesday, Boston Fed President Susan Collins said it looked like inflation would take “longer than previously thought” to come back down, suggesting that the Fed would need to keep interest rates restrictively high for longer.
Meanwhile, Minneapolis Fed President Neel Kashkari said interest rates would likely have to remain at current levels for an “extended period” in order to beat inflation back down.
A market-based gauge of the probabilities of future interest rate decisions by the Fed, the CME FedWatch tool, meanwhile, places the odds of rate cuts in September or earlier at 65% (down from 85% a week ago) and 78% in November. The probabilities in November had previously been almost 100%.
Technical Analysis: Gold price pulls back from resistance at top of range
Gold price (XAU/USD) has retested and pulled back from the ceiling of a mini-range at around $2,326. It is currently finding support from both the 200 and 50 Simple Moving Average (SMA) on the 4-hour chart, in the $2,310s.
XAU/USD 4-hour Chart
The Moving Average Convergence Divergence (MACD) indicator is mildly negative, painting red bars on the histogram. Further, the MACD line has crossed below the signal line, giving a sell signal.
Price could potentially fall back down to the base of the range at around $2,280.
The bullish Gold price trend on both the medium and long-term charts (daily and weekly), overall add a supportive backdrop.
As such, a decisive break out of the top of the range would signal a likely move up to a conservative target at $2,353 – the top of wave B and the 0.681 Fibonacci extension of the height of the range extrapolated higher. In a bullish case, it could even possibly hit $2,370.
A decisive break would be one characterized by a longer-than-average green candlestick that pierces above the range ceiling, and closes near its high; or three green candlesticks in a row that pierce above the respective level.
Measured Move, unfinished business
Gold price is potentially still in the middle of unfolding a bearish Measured Move price pattern which began on April 19.
Measured Moves are zig-zag type patterns composed of three waves labeled A, B and C, with C usually equalling the length of A or a Fibonnaci 0.681 of A. Price has fallen to the conservative estimate for wave C at $2,286, the Fibonacci 0.681 of wave A.
Wave C could still go lower, however, and reach the 100% extrapolation of A at $2,245. Such a move would be confirmed by a decisive break below the range and the May 3 low at $2,277.
Gold FAQs
Gold has played a key role in human’s history as it has been widely used as a store of value and medium of exchange. Currently, apart from its shine and usage for jewelry, the precious metal is widely seen as a safe-haven asset, meaning that it is considered a good investment during turbulent times. Gold is also widely seen as a hedge against inflation and against depreciating currencies as it doesn’t rely on any specific issuer or government.
Central banks are the biggest Gold holders. In their aim to support their currencies in turbulent times, central banks tend to diversify their reserves and buy Gold to improve the perceived strength of the economy and the currency. High Gold reserves can be a source of trust for a country’s solvency. Central banks added 1,136 tonnes of Gold worth around $70 billion to their reserves in 2022, according to data from the World Gold Council. This is the highest yearly purchase since records began. Central banks from emerging economies such as China, India and Turkey are quickly increasing their Gold reserves.
Gold has an inverse correlation with the US Dollar and US Treasuries, which are both major reserve and safe-haven assets. When the Dollar depreciates, Gold tends to rise, enabling investors and central banks to diversify their assets in turbulent times. Gold is also inversely correlated with risk assets. A rally in the stock market tends to weaken Gold price, while sell-offs in riskier markets tend to favor the precious metal.
The price can move due to a wide range of factors. Geopolitical instability or fears of a deep recession can quickly make Gold price escalate due to its safe-haven status. As a yield-less asset, Gold tends to rise with lower interest rates, while higher cost of money usually weighs down on the yellow metal. Still, most moves depend on how the US Dollar (USD) behaves as the asset is priced in dollars (XAU/USD). A strong Dollar tends to keep the price of Gold controlled, whereas a weaker Dollar is likely to push Gold prices up.
10:02
Ireland HICP (YoY) meets expectations (1.6%) in April
10:02
Ireland HICP (MoM) meets expectations (0.2%) in April
10:02
Ireland Consumer Price Index (YoY) dipped from previous 2.9% to 2.6% in April
10:01
Ireland Consumer Price Index (MoM) declined to 0.2% in April from previous 0.5%
09:09
Spain 5-y Bond Auction up to 2.974% from previous 2.848%
The Pound Sterling skids below 1.2500 ahead of the Bank of England’s decision.
Investors expect that the BoE could provide a concrete timeframe for rate cuts.
Fed policymakers are not comfortable with rate-cut projections for this year.
The Pound Sterling (GBP) extends its downside to 1.2470 against the US Dollar (USD) in Thursday’s London session. The GBP/USD pair is under pressure amid caution ahead of the Bank of England’s (BoE) interest rate decision, which will be announced at 11:00 GMT, and dismal market mood.
The BoE is widely anticipated to keep borrowing rates steady at 5.25% for the sixth time straight, which makes the interest rate guidance a crucial trigger for the next move in the Pound Sterling.
Financial markets expect that the BoE could turn slightly dovish on the interest rate outlook as consistently easing United Kingdom (UK) price pressures suggest that inflation is on course to return sustainably to the desired rate of 2%. The BoE is expected to remain vigilant on wage growth, which is almost double the rate required for inflation to return to the 2% target.
Investors expect eight of the nine-member-led Monetary Policy Committee (MPC) will support keeping interest rates steady, while policymaker Swati Dhingra is likely to continue with her rate-cut stance. Traders remain divided over BoE Deputy Governor Dave Ramsden’s stance on interest rates, as he remained quite optimistic about progress in the disinflation process in his latest commentary in April.
The Pound Sterling remains on the back foot as the market sentiment turns cautious due to hawkish interest rate guidance from Federal Reserve (Fed) policymakers. S&P 500 futures have posted some losses in the Asian session, exhibiting a decline in investors’ risk appetite. The overall scenario has improved the US Dollar’s appeal. The US Dollar Index (DXY), which tracks the Greenback’s value against six major currencies, holds gains near 105.60.
On Wednesday, Boston Fed Bank President Susan Collins said that surprise upticks in recent inflation and activity readings suggest that the central bank needs to maintain interest rates at their current levels until they get greater confidence that inflation will sustainably return to the 2% target. Collins added, “A slowdown in activity will be needed to ensure that demand is better aligned with supply for inflation to return durably,” Reuters reported.
This week, Minneapolis Fed Bank President Neel Kashkari also emphasized the need to keep interest rates at their current levels for the entire year. Kashkari cited concerns over stalling progress in disinflation due to housing market strength.
Investors remain leaning towards interest rate guidance from Fed speakers due to the absence of tier-1 United States economic data.
On the UK front, investors await the March month and preliminary Q1 Gross Domestic Product (GDP) data, which will be published on Friday. Economists expect that the UK economy expanded by 0.4% in the January-March period after contracting by 0.3% in the last quarter of 2023. This suggests that the technical recession in the second half of 2023 was shallow.
Apart from the GDP data, investors will also focus on the monthly factory and preliminary Q1 Total Business Investment data. The factory data provides cues about overall demand from the domestic and the overseas market.
Technical Analysis: Pound Sterling slips below 20-day EMA
The Pound Sterling extends its losing streak for the third trading session on Thursday. The GBP/USD is under pressure due to multiple headwinds. The Cable resumes its downside journey after facing strong resistance above the neckline of the Head and Shoulder (H&S) chart pattern formed on a daily timeframe. On April 12, the pair fell sharply after breaking below the neckline of the H&S pattern plotted from December 8 low around 1.2500.
The near-term outlook is uncertain as the asset has dropped below the 20-day Exponential Moving Average (EMA), which trades around 1.2510.
The 14-period Relative Strength Index (RSI) oscillates in the 40.00-60.00 range, suggesting indecisiveness among market participants.
Pound Sterling FAQs
The Pound Sterling (GBP) is the oldest currency in the world (886 AD) and the official currency of the United Kingdom. It is the fourth most traded unit for foreign exchange (FX) in the world, accounting for 12% of all transactions, averaging $630 billion a day, according to 2022 data. Its key trading pairs are GBP/USD, aka ‘Cable’, which accounts for 11% of FX, GBP/JPY, or the ‘Dragon’ as it is known by traders (3%), and EUR/GBP (2%). The Pound Sterling is issued by the Bank of England (BoE).
The single most important factor influencing the value of the Pound Sterling is monetary policy decided by the Bank of England. The BoE bases its decisions on whether it has achieved its primary goal of “price stability” – a steady inflation rate of around 2%. Its primary tool for achieving this is the adjustment of interest rates. When inflation is too high, the BoE will try to rein it in by raising interest rates, making it more expensive for people and businesses to access credit. This is generally positive for GBP, as higher interest rates make the UK a more attractive place for global investors to park their money. When inflation falls too low it is a sign economic growth is slowing. In this scenario, the BoE will consider lowering interest rates to cheapen credit so businesses will borrow more to invest in growth-generating projects.
Data releases gauge the health of the economy and can impact the value of the Pound Sterling. Indicators such as GDP, Manufacturing and Services PMIs, and employment can all influence the direction of the GBP. A strong economy is good for Sterling. Not only does it attract more foreign investment but it may encourage the BoE to put up interest rates, which will directly strengthen GBP. Otherwise, if economic data is weak, the Pound Sterling is likely to fall.
Another significant data release for the Pound Sterling is the Trade Balance. This indicator measures the difference between what a country earns from its exports and what it spends on imports over a given period. If a country produces highly sought-after exports, its currency will benefit purely from the extra demand created from foreign buyers seeking to purchase these goods. Therefore, a positive net Trade Balance strengthens a currency and vice versa for a negative balance.
AUD/JPY gains ground as RBA is expected to maintain higher rates for an extended period.
The fear of Japan’s intervention could limit the advance of the pair.
Australian Retail Sales (Q1) declined 0.4% in Q1, swinging from the previous quarter’s 0.4% growth.
AUD/JPY continues its winning streak that began on May 2, trading around 102.50 during the European session on Thursday. However, the fear of intervention from the Japanese authorities is expected to cap the AUD/JPY cross's upward movement.
Japan's 10-year government bond yield has surged to around 0.9%, approaching six-month highs in response to the summary of the Bank of Japan's (BoJ) April policy meeting. During the meeting, the board acknowledged upside risks to inflation and deliberated scenarios that could necessitate further interest rate hikes. This statement underscored BoJ Governor Kazuo Ueda's recent remarks hinting at the possibility of multiple rate increases in the upcoming months.
On the AUD front, Australian Retail Sales (QoQ), which measures the volume of goods sold by retailers in Australia, saw a decline of 0.4% in the first quarter of 2024. This represents a reversal from the 0.4% growth observed in the fourth quarter of 2023.
The Australian Dollar (AUD) may encounter challenges due to the Reserve Bank of Australia (RBA)'s less hawkish stance, particularly following the Monthly Consumer Price Index (YoY) for March, which surged to 3.5%, surpassing the expected reading of 3.4%.
The RBA acknowledged a recent halt in progress toward controlling inflation, maintaining a stance of keeping options open. RBA Governor Michele Bullock emphasized the importance of remaining vigilant regarding inflation risks. Bullock believes that current interest rates are suitably positioned to guide inflation back within its target range of 2-3% by the second half of 2025 and to the midpoint by 2026.
The Mexican Peso edges lower prior to key inflation data and the Banxico May policy meeting.
The Bank of Mexico is expected to keep rates unchanged but there is a risk of a revision to its forecasts.
USD/MXN continues bumping along the bottom of a short-term range.
The Mexican Peso (MXN) is trading down about a quarter of a percent against US Dollar (USD) on Thursday ahead of key inflation data and the Bank of Mexico (Banxico) policy meeting, scheduled for later in the day.
The overall consensus from the analyst community is that Banxico will leave interest rates unchanged at 11.00% after cutting it in March. Lower interest rates are negative for a currency whilst higher rates are positive as they attract more foreign capital inflows.
USD/MXN is exchanging hands at 16.94, EUR/MXN at 18.20 and GBP/MXN at 21.15, at the time of publication.
Mexican Peso edges down on “super” Thursday
The Mexican Peso edges lower on Thursday ahead of key inflation data for April, scheduled at 12:00 GMT, and then the Banxico May monetary policy meeting a few hours later at 19:00 GMT.
Higher inflation forces central banks to keep interest rates high, which strengthens currencies as it attracts greater inflows of foreign capital. The opposite is true of lower inflation.
April’s Mexican headline Inflation is expected to rise to 4.63% year-over-year (YoY) but decline to 0.19% month-over-month (MoM), from 4.42% and 0.29%, respectively, the previous month.
The core inflation rate is forecast to decline to 4.40% YoY and 0.24% MoM.
If either deviates substantially from expectations, but especially core inflation – which is thought to be more accurate – the Mexican Peso could experience volatility.
Consensus is for Banxico to stick to policy status quo
At its previous March meeting, Banxico cut interest rates from 11.25% to 11.00% but said further rate cuts would be data dependent. In the time since, neither inflation nor growth have shown any further substantial declines – in fact growth in Q1 was slightly higher-than-expected.
In addition, Deputy Banxico Governor Jonathan Heath said in April that the central bank would probably hit pause on cutting interest rates in May due to strong Q1 growth.
Commerzbank does not expect Banxico to cut interest rates but sees a possibility it may revise up its exceedingly low inflation forecasts for the second half of 2024, which appear “optimistic” given the data so far. That said, its forecasts for Q1 were accurate.
“..the question of whether there will be a pronounced cycle of rate cuts is more likely to depend on whether inflation will continue to follow Banxico's forecast in the coming quarters. This is because it expects the year-on-year rate to fall quite significantly in the coming quarters; for example, the core rate is expected to average only 3.5% year-on-year in the fourth quarter (compared to 4.57% in March),” says Commerzbank FX Analyst Michael Pfister.
Overall, a slowdown in economic growth is likely to be the main driver for Banxico eventually cutting interest rates, according to Commerzbank.
“To sum up, inflation argues against significant rate cuts, but slowing growth suggests that a slight correction in rates is likely - especially if Banxico revises downward its rather optimistic growth forecast of 2.8% for this year on Thursday,” says Pfister.
Banxico to hold – Wells Fargo
Wells Fargo also expects Banxico to leave interest rates unchanged.
It points out that inflation has not really shifted lower since the March meeting, and “..services inflation remains elevated, edging up to 5.37%. Meanwhile, stubborn U.S. inflation has seen the expected timing for Fed easing pushed back over the past several weeks.”
“Considering still-elevated domestic inflation, an initial Fed rate cut that is likely still several months away, and some sensitivity to the possibility of a weaker Mexican currency, we believe Banxico policymakers will opt to hold their policy rate steady at 11.00% next week,” Wells Fargo concludes.
Technical Analysis: USD/MXN on the floor of short-term range
USD/MXN – the cost of one US Dollar in Mexican Pesos – continues to bump along the bottom of a short-term range, with a floor at 16.86 and a ceiling at 17.40.
USD/MXN 4-hour Chart
The short-term trend is sideways, and given the old adage that the “trend is your friend”, it is expected to continue, suggesting the next move may be an oscillation higher.
The Moving Average Convergence Divergence (MACD) momentum indicator has crossed above its signal line, suggesting an increased chance of an up move evolving. The signal is enhanced by the fact that the MACD is more reliable in sideways trending markets.
A rise up within the range could take the USD/MXN to the 50 Simple Moving Average (SMA) on the 4-hour chart at 16.97, followed by the lower high at 17.15. A clear break above the zone of resistance around 17.15-17.18 might see further gains up towards the range highs again.
A decisive breakout of the range – either below the floor at 16.86, or the ceiling at 17.40 – would change the directional bias of the pair.
Given the overall bearish backdrop in the medium and long-term, odds favor a breakdown from the range.
A break below the range floor could see further downside to a target at 16.50, followed by the April 9 low at 16.26.
On the other side, a break above the top would activate an upside target first at 17.67, piercing a long-term trendline and then possibly reaching a further target at around 18.15.
A decisive break would be one characterized by a longer-than-average green or red daily candlestick that pierces above or below the range high or low, and that closes near its high or low for the period; or three green/red candlesticks in a row that pierce above/below the respective levels.
Banxico FAQs
The Bank of Mexico, also known as Banxico, is the country’s central bank. Its mission is to preserve the value of Mexico’s currency, the Mexican Peso (MXN), and to set the monetary policy. To this end, its main objective is to maintain low and stable inflation within target levels – at or close to its target of 3%, the midpoint in a tolerance band of between 2% and 4%.
The main tool of the Banxico to guide monetary policy is by setting interest rates. When inflation is above target, the bank will attempt to tame it by raising rates, making it more expensive for households and businesses to borrow money and thus cooling the economy. Higher interest rates are generally positive for the Mexican Peso (MXN) as they lead to higher yields, making the country a more attractive place for investors. On the contrary, lower interest rates tend to weaken MXN. The rate differential with the USD, or how the Banxico is expected to set interest rates compared with the US Federal Reserve (Fed), is a key factor.
Banxico meets eight times a year, and its monetary policy is greatly influenced by decisions of the US Federal Reserve (Fed). Therefore, the central bank’s decision-making committee usually gathers a week after the Fed. In doing so, Banxico reacts and sometimes anticipates monetary policy measures set by the Federal Reserve. For example, after the Covid-19 pandemic, before the Fed raised rates, Banxico did it first in an attempt to diminish the chances of a substantial depreciation of the Mexican Peso (MXN) and to prevent capital outflows that could destabilize the country.
USD/JPY could test the psychological level of 156.00 followed by the upper boundary of the ascending channel.
The bullish trend would be confirmed if the MACD line crosses over the signal line.
The 14-day EMA at 154.89 appears as the immediate support.
USD/JPY continues its winning streak for the fourth successive session, trading around 155.80 during the Asian hours on Thursday. The pair is consolidating within the ascending channel, with the 14-day Relative Strength Index (RSI) positioned above the 50-level, indicating a bullish bias.
Additionally, the momentum indicator Moving Average Convergence Divergence (MACD) line is positioned above the centerline and shows convergence below the signal line. If the MACD line crosses over the signal line, suggest a signal to buy as confirmation of a bullish trend.
The USD/JPY pair could find resistance around the psychological level of 156.00. A break above this level could lead the pair to test the upper boundary of the ascending channel around the level of 159.70.
On the downside, the 14-day Exponential Moving Average (EMA) at 154.89 appears as the immediate support, followed by the lower boundary of the ascending channel around the psychological level of 154.00. A break below this level could lead the pair to retest May’s low at 151.86 recorded on May 3.
USD/CHF drifts higher to 0.9085 in Thursday’s European session.
The hawkish comments from many Fed policymakers support the US Dollar (USD).
The Swiss Unemployment Rate fell to 2.3% MoM in April from 2.4% in March, the lowest level in four months.
The USD/CHF pair trades on a stronger note around 0.9085 during the early European session on Thursday. The modest rebound of the Greenback, supported by the hawkish comments from the US Federal Reserve (Fed) officials provides some support to the pair. Investors will monitor the Fed’s Daly’s speech later on Thursday amid the lack of top-tier economic data release from the US and Switzerland.
Several Fed policymakers delivered hawkish messages this week, bolstering the US Dollar (USD). Boston Fed President Susan Collins said on Wednesday that it will take longer than previously thought to bring inflation down to the Fed 2% target, adding that the rate will likely stay higher for longer. Meanwhile, both New York Fed President John Williams and Minneapolis Fed President Neel Kashkari noted that they prefer to hold the rate at the current levels for longer.
The Fed's Williams stated on Monday that monetary policy is in a good place, but they have the time to collect more data. The Fed's Kashkari said on Tuesday that he believes rates will likely need to be held at current levels for an "extended period." He also didn't rule out a hike if inflation stalls near 3%. This, in turn, lifts the Greenback broadly and creates a tailwind for the USD/CHF pair.
On the Swiss front, the nation’s Unemployment Rate fell to 2.3% MoM in April from 2.4% in March, the lowest level in four months, according to the State Secretariat for Economic Affairs on Tuesday.
Apart from this, market players will focus on the developments surrounding the geopolitical tensions in the Middle East. The US expects that discussions on a Gaza ceasefire will be able to close the gap between Israel and Hamas. The US Central Intelligence Agency Director William Burns visited Israel on Wednesday and spoke with Israeli Prime Minister Benjamin Netanyahu, per Reuters. If the uncertainties and geopolitical risks remain, this could lift the Swiss Franc (CHF), a traditional safe-haven currency.
The US Dollar (USD) exhibits strength against its rivals in Thursday’s early London session as Federal Reserve (Fed) policymakers remain convinced about resilient United States economic prospects and lack confidence that inflation will decline to the desired rate of 2%.
On Wednesday, Boston Fed Bank President Susan Collins said the economy needs to cool down for inflation to return to 2%. Collins said recent upward surprises in price pressures and economic activity suggest that interest rates should remain at their current levels until they get greater confidence that inflation will sustainably return to 2%.
Interest rates by the Fed remaining higher for a longer period is a favorable scenario for the US Dollar and bond yields. The US Dollar Index (DXY), which tracks the Greenback’s value against six major currencies, clings to gains near 105.50. 10-year US Treasury yields jump to 4.51%.
In the Asian trading hours, hawkish guidance on interest rates from Bank of Japan’s (BoJ) Summary of Opinions (SOP) failed to impact strength in the USD/JPY pair. The major looks set to extend its upside towards 156.00. BoJ policymakers flagged upside risks to inflation and discussed possible rate hike scenarios. However, investors see little scope for more hikes amid less confidence over sustained wage growth.
US Dollar PRICE Today
The table below shows the percentage change of US Dollar (USD) against listed major currencies today. US Dollar was the strongest against the Euro.
USD
EUR
GBP
JPY
CAD
AUD
NZD
CHF
USD
-0.06%
-0.11%
-0.12%
-0.08%
-0.12%
-0.09%
-0.07%
EUR
0.06%
-0.04%
-0.07%
-0.01%
-0.04%
-0.00%
-0.00%
GBP
0.11%
0.04%
0.00%
0.02%
0.00%
0.03%
0.05%
JPY
0.12%
0.07%
0.00%
0.06%
-0.00%
0.07%
0.08%
CAD
0.08%
0.00%
-0.02%
-0.06%
-0.03%
-0.00%
0.00%
AUD
0.12%
0.04%
-0.01%
0.00%
0.03%
0.03%
0.04%
NZD
0.09%
0.00%
-0.03%
-0.07%
0.00%
-0.03%
0.01%
CHF
0.07%
0.00%
-0.05%
-0.08%
-0.01%
-0.04%
-0.01%
The heat map shows percentage changes of major currencies against each other. The base currency is picked from the left column, while the quote currency is picked from the top row. For example, if you pick the US Dollar from the left column and move along the horizontal line to the Japanese Yen, the percentage change displayed in the box will represent USD (base)/JPY (quote).
EUR/USD seems feeble near 1.0740. The pair falls on backfoot amid firm US Dollar. The major currency pair is expected to be driven by market sentiment due to the absence of top-tier Eurozone economic data.
GBP/USD trades close to the weekly low below 1.2500 amid caution ahead of the Bank of England’s (BoE) interest rate decision. The BoE is widely anticipated to keep interest rates steady at 5.25% for the sixth time in a row. Therefore, the major focus of investors will be on fresh cues about when it could start reducing interest rates. BoE Deputy Governor Dave Ramsden remained confident over inflation returning to 2% and staying there for the next three years. He is expected to join policymaker Swati Dhingra and vote for a rate cut.
Gold price rises to $2,315. The precious metal is broadly sideways in the $2,300-$2,320 range. The downside remains supported due to geopolitical uncertainty, while higher bond yields limit the upside.
AUD/USD remains on the backfoot near 0.6570 due to weakness in the Australian Dollar. The Antipodean is under pressure as the Reserve Bank of Australia (RBA) doesn’t think that it is necessary to tighten policy further. The RBA could get inflation back to 2% with the current level of interest rates.
The Bank of England (BoE) announces its interest rate decision at the end of its eight scheduled meetings per year. If the BoE is hawkish about the inflationary outlook of the economy and raises interest rates it is usually bullish for the Pound Sterling (GBP). Likewise, if the BoE adopts a dovish view on the UK economy and keeps interest rates unchanged, or cuts them, it is seen as bearish for GBP.
UK central bank is seen keeping its policy rate intact at 5.25%.
Bank of England is seen reducing its rates by 75 bps this year.
GBP/USD should maintain its recent familiar range in the wake of the event.
The Bank of England (BoE) is set to hold its policy rate flat for a sixth meeting in a row on Thursday amid persistent disinflationary pressure in the UK and investors’ repricing of interest rate reductions earlier than anticipated.
Bank of England could lean toward dovish hold
It's anticipated that the Bank of England will maintain the benchmark interest rate at 5.25% after its policy meeting on Thursday at 11:00 GMT. Alongside the policy rate announcement, the bank will release the Monetary Policy Minutes and the Monetary Policy Report, followed by a press conference held by Governor Andrew Bailey.
Although initially anticipated to trail behind the Federal Reserve (Fed) and the European Central Bank (ECB) in initiating their easing measures, the Bank of England (BoE) now appears poised to begin reducing interest rates sooner than expected due to mounting disinflationary pressures.
Furthermore, investors widely anticipate a cut in the Bank of England's interest rates, potentially occurring in August or September, with around a 70% chance of a subsequent decrease in December.
In March, disinflationary trends in the UK accelerated, with the headline Consumer Price Index (CPI) increasing by 3.2% (down from 3.4%) and the core CPI, which excludes food and energy costs, rising by 4.2% (down from 4.5%).
Indeed, the most recent inflation data from the UK seems to challenge the Bank of England's narrative of "higher for longer." Regarding the upcoming event, it is widely expected that the central bank will keep rates unchanged, with the possibility of extending its cautious approach.
During a recent event held by the Institute of International Finance, Governor Andrew Bailey stated that the upcoming inflation figures are anticipated to demonstrate a significant decrease, while he also hinted at some loosening of the labour market.
Back to inflation, the latest BoE’s Decision Maker Panel survey (DMP) conducted between March 8 and 22 showed that one-year ahead CPI inflation expectations decreased to 3.2%, dropping from 3.3% in February. Similarly, three-year-ahead CPI inflation expectations declined to 2.7% over the three months leading to March. Expected year-ahead wage growth, measured on a three-month moving average, also decreased to 4.9%. Consequently, firms anticipate a 1.5 percentage point decrease in their wage growth over the next 12 months based on three-month averages.
At the BoE’s March 21 gathering, Governor Andrew Bailey remarked that it was justifiable for financial markets to anticipate interest rate reductions, expressing optimism regarding the trajectory of inflation. Bailey also indicated that it was reasonable for markets to anticipate two or three rate cuts this year. While refraining from explicitly endorsing the market curve, he acknowledged: "I'm not going to endorse the market curve, but I think that it's reasonable that markets are taking that view, given the way inflation has performed."
Ahead of the BoE gathering, analysts at TD Securities argued: “The BoE will likely stand pat at its May meeting, as wage and inflation data is a bit too sticky to warrant a cut just yet. We see a repeat in language and another 8-1 vote, though the risks are marginally skewed to another dovish dissenter joining Dhingra. We also do not look for any major changes to the projections, though the Year 2 inflation forecast could be lower.”
In the same vein, strategists at Danske Bank noted: “We expect the Bank of England (BoE) to keep the bank rate unchanged at 5.25% on May 9, which is in line with consensus and current market pricing. Overall, we expect the MPC to soften its communication, priming the markets for an imminent start to a cutting cycle. We expect the first 25 bps cut in June.”
How will the BoE interest rate decision impact GBP/USD?
Despite inflation continuing to trend lower in March, the central bank is unlikely to change its tone to a more relaxed one and hence give a more solid signal towards the potential timing of the interest rate reduction. While surprises have been practically ruled out, the British Pound is seen maintaining its current familiar range for the time being.
Under such circumstances, GBP/USD needs to convincingly clear the critical 200-day Simple Moving Average (SMA) at 1.2545 to allow for the continuation of the ongoing recovery, which started around yearly lows in the 1.2300 neighbourhood recorded on April 22. FXStreet Senior Analyst Pablo Piovano suggests:, "Further gains may lead Cable to revisit the May peak of 1.2634 (May 3), an area that appears to be reinforced by the provisional 100-day SMA at 1.2640. Further up comes the 2024 top of 1.2893 (March 8). Surpassing this level could propel GBP/USD towards the psychological milestone of 1.3000 in the first instance.”
On the flip side, Pablo highlights that "the resurgence of the selling bias could prompt some corrective moves in the short-term horizon. That said, an immediate contention aligns at the 2024 bottom of 1.2299 (April 22). The breach of this region exposes further weakness, although the next support is not expected to emerge until the October 2023 low of 1.2037 (October 4).
Economic Indicator
BoE Interest Rate Decision
The Bank of England (BoE) announces its interest rate decision at the end of its eight scheduled meetings per year. If the BoE is hawkish about the inflationary outlook of the economy and raises interest rates it is usually bullish for the Pound Sterling (GBP). Likewise, if the BoE adopts a dovish view on the UK economy and keeps interest rates unchanged, or cuts them, it is seen as bearish for GBP.
The Bank of England (BoE) decides monetary policy for the United Kingdom. Its primary goal is to achieve ‘price stability’, or a steady inflation rate of 2%. Its tool for achieving this is via the adjustment of base lending rates. The BoE sets the rate at which it lends to commercial banks and banks lend to each other, determining the level of interest rates in the economy overall. This also impacts the value of the Pound Sterling (GBP).
When inflation is above the Bank of England’s target it responds by raising interest rates, making it more expensive for people and businesses to access credit. This is positive for the Pound Sterling because higher interest rates make the UK a more attractive place for global investors to park their money. When inflation falls below target, it is a sign economic growth is slowing, and the BoE will consider lowering interest rates to cheapen credit in the hope businesses will borrow to invest in growth-generating projects – a negative for the Pound Sterling.
In extreme situations, the Bank of England can enact a policy called Quantitative Easing (QE). QE is the process by which the BoE substantially increases the flow of credit in a stuck financial system. QE is a last resort policy when lowering interest rates will not achieve the necessary result. The process of QE involves the BoE printing money to buy assets – usually government or AAA-rated corporate bonds – from banks and other financial institutions. QE usually results in a weaker Pound Sterling.
Quantitative tightening (QT) is the reverse of QE, enacted when the economy is strengthening and inflation starts rising. Whilst in QE the Bank of England (BoE) purchases government and corporate bonds from financial institutions to encourage them to lend; in QT, the BoE stops buying more bonds, and stops reinvesting the principal maturing on the bonds it already holds. It is usually positive for the Pound Sterling.
EUR/GBP trades on a stronger note for three straight days near 0.8605 on Thursday.
The BOE is anticipated to keep its main interest rate at a 16-year high of 5.25% at its May meeting on Thursday.
ECB’s Wunsch said he sees a path for the first-rate cuts this year, although the outlook remains foggy.
The EUR/GBP cross extends its upside around 0.8605 during the early Europen trading hours on Thursday. The cross edges higher for the third consecutive day ahead of the Bank of England (BoE) interest rate decision. Traders are betting the Bank of England (BoE) could cut the interest rate before the European Central Bank (ECB), which weighs on the Pound Sterling (GBP) against the Euro (EUR).
The Bank of England (BOE) is anticipated to keep its main interest rate at a 16-year high at 5.25% at its May meeting on Thursday. Investors will take more cues from BoE Governor Andrew Bailey's speech about the timing of cutting the interest rate. BoE’s Bailey said last week that rate cuts were in play at future meetings as inflationary risks have eased.
These remarks have prompted the expectation that the BoE will lower its borrowing costs before the ECB, which exerts some selling pressure on the Cable. Research director at XTB Trading Group, Kathleen Brooks, noted that “the market is expecting the first rate cut from the BOE between June and August.”
On the Euro front, the attention will shift to the ECB Monetary Policy Meeting Accounts on Friday, which might offer some hints about the economic outlook and the interest rate trajectory. The ECB policymaker Pierre Wunsch said on Wednesday that he sees a path for the first-rate cuts this year, although the outlook remains foggy. He further stated that he expects the central bank to cut 50 basis points (bps), but it will depend on incoming economic data.
GBP/USD extends losses ahead of the interest rate decision by BoE on Thursday.
BoE is expected to maintain its policy rate at 5.25% until September.
The US Dollar is strengthening on the expectations of the Fed keeping higher rates for an extended period.
GBP/USD extends its losing streak for the third successive session, trading around 1.2490 during the Asian session on Thursday. Thursday brings the Bank of England (BoE) interest rate decision, with expectations of maintaining interest rate at 5.25%.
Investor expectations regarding potential interest rate cuts by the Bank of England (BoE) have been delayed until September, amid concerns about strong wage growth in the United Kingdom (UK). This wage growth is contributing to core inflation, which is the central bank's preferred inflation measure. The annual inflation rate dropped to 3.2% in March, down from 3.4% in February. However, it stayed slightly above the market expectation of 3.1%. This marked the lowest rate since September 2021.
Across the pond, the US Dollar (USD) is gaining ground due to the expectations of the Federal Reserve (Fed) maintaining higher interest rates. Additionally, the higher US Treasury yields support for the US Dollar (USD), undermining the GBP/USD pair.
From the Federal Reserve (Fed), Boston Fed President Susan Collins emphasized on Wednesday the importance of a period of moderation in the US economy to achieve the central bank's 2% inflation target. On Tuesday, Minneapolis Fed President Neel Kashkari said that the prevailing expectation is for rates to stay unchanged for a considerable period, as per Reuters reports.
GBP/USD
Overview
Today last price
1.2491
Today Daily Change
-0.0007
Today Daily Change %
-0.06
Today daily open
1.2498
Trends
Daily SMA20
1.2482
Daily SMA50
1.2604
Daily SMA100
1.264
Daily SMA200
1.2545
Levels
Previous Daily High
1.2516
Previous Daily Low
1.2468
Previous Weekly High
1.2635
Previous Weekly Low
1.2466
Previous Monthly High
1.2709
Previous Monthly Low
1.23
Daily Fibonacci 38.2%
1.2486
Daily Fibonacci 61.8%
1.2497
Daily Pivot Point S1
1.2472
Daily Pivot Point S2
1.2446
Daily Pivot Point S3
1.2424
Daily Pivot Point R1
1.252
Daily Pivot Point R2
1.2542
Daily Pivot Point R3
1.2568
05:01
Japan Leading Economic Index above forecasts (111) in March: Actual (111.4)
05:01
Japan Coincident Index up to 113.9 in March from previous 111.6
NZD/USD gains ground after Chinese import shows rise in April.
RBNZ indicated a delay in any potential rate cut until 2025.
The higher US Treasury yields are contributing support for the US Dollar.
NZD/USD has extended its gains for the second consecutive session, trading around 0.6010 during the Asian session on Thursday. The New Zealand Dollar (NZD) gains ground after the release of the Chinese data on Thursday, given the close trade relationship between New Zealand and China.
Chinese Imports (YoY) surged by 8.4% in April, surpassing forecasts of 5.4%. Additionally, Exports grew by 1.5%, higher than the anticipated 1.0% gain projected by analysts. These latest figures brought a positive surprise amidst concerns of potential additional tariffs on Chinese goods by the US. However, Trade Balance USD increased to $72.35 billion from March’s reading of $58.55 billion, slightly below the expected $76.7 billion.
In New Zealand, the Reserve Bank of New Zealand (RBNZ) indicated a delay in any potential move toward monetary easing until 2025. The RBNZ cited higher-than-anticipated inflation pressures in the first quarter as a reason for this stance. Such a decision could provide support for the New Zealand Dollar (NZD).
On the US Dollar’s (USD) front, the expectations of the Federal Reserve (Fed) to keep higher interest rates for an extended period, pushing the US Treasury yields higher. This supports the US Dollar (USD), limiting the advance of the NZD/USD pair.
Additionally, hawkish remarks from Federal Reserve officials have strengthened the Greenback. According to a Reuters report, Federal Reserve Bank of Boston President Susan Collins emphasized on Wednesday the importance of a period of moderation in the US economy to achieve the central bank's 2% inflation target.
Moreover, Minneapolis Fed President Neel Kashkari stated on Tuesday that the prevailing expectation is for rates to stay unchanged for a considerable period. Although the likelihood of rate hikes is low, it is not completely ruled out.
Gold price holds positive ground in Thursday’s Asian session.
The rise in global gold demand, persistent central bank purchasing, and safe-haven flows might continue to boost the precious metal.
Investors will monitor the US weekly Initial Jobless Claims and the Fed’s Daly’s speech on Thursday.
Gold price (XAU/USD) trades with a positive bias on Thursday amid the absence of top-tier economic data releases at mid-week. However, multiple headwinds, such as the firmer US Dollar (USD) and the hawkish comments from the US Federal Reserve (Fed) are likely to cap the upside of the precious metal in the near term.
On the other hand, the growth in global gold demand was mainly driven by strong over-the-counter market investment, persistent central bank purchasing, and rising demand from Asian buyers, including China and India, per the WGC's most recent report. Furthermore, the risk-averse environment and the uncertainties surrounding geopolitical tensions in the Middle East might boost traditional safe-haven assets like gold.
Gold traders await some fresh catalysts. The US weekly Initial Jobless Claims is due on Thursday. Also, San Francisco Fed President Mary Daly, in the dovish wing of the US central bank, is set to speak later in the day. The dovish remarks from Fed officials might cap the downside of the gold price for the time being.
Boston Fed President Susan Collins said it will take longer than previously thought to bring inflation down to the 2% target, emphasizing that the rate will likely stay higher for longer.
New York Fed president John Williams and Minneapolis Fed president Neel Kashkari also indicated that they favor holding rates at current levels for longer.
Investors have priced in a nearly 55% chance of a quarter-percentage-point rate cut from the Fed in September, down from 85% before the US employment report last week, according to CME's FedWatch Tool.
The first reading of the University of Michigan Consumer Sentiment Index is expected to drop from 77.2 in April to 76.0 in May.
Hamas has agreed to a draft ceasefire agreement that is "far from meeting Israel's demands, according to Israeli Prime Minister Benjamin Netanyahu.
The People's Bank of China (PBoC) increased its gold reserves by 60,000 troy ounces in April, extending its streak of consecutive purchases to 18 months.
Technical Analysis: Gold price stays bullish in the longer term
The gold price edges higher on the day. The yellow metal's long-term outlook remains positive, with XAU/USD trading above the key 100-day Exponential Moving Average (EMA) on the daily chart.
In the near term, the gold price has been caught in a descending trend channel since mid-April. The consolidative theme remains intact as the 14-day Relative Strength Index (RSI) hovers around the 50-midline.
The initial support level for the precious metal is seen near the $2,300 psychological mark. The next contention level is located at the lower limit of a descending trend channel of $2,260. Extended weakness could drag XAU/USD to a low of April 1 at $2,228, followed by the $2,200 round level.
If we see enough gold demand, the yellow metal could head for a high of May 6 at $2,232. Further north, gold may draw in enough buyers to test the upper boundary of a descending trend channel at $2,345. The additional upside filter to watch is the $2,400 round mark, en route to an all-time high near $2,432.
US Dollar price today
The table below shows the percentage change of US Dollar (USD) against listed major currencies today. US Dollar was the weakest against the Australian Dollar.
USD
EUR
GBP
CAD
AUD
JPY
NZD
CHF
USD
-0.02%
-0.05%
-0.03%
-0.10%
0.08%
-0.05%
0.03%
EUR
0.02%
-0.02%
0.00%
-0.05%
0.07%
-0.01%
0.08%
GBP
0.06%
0.03%
0.03%
-0.03%
0.09%
0.02%
0.08%
CAD
0.03%
0.01%
-0.01%
-0.06%
0.11%
0.00%
0.06%
AUD
0.10%
0.05%
0.04%
0.05%
0.12%
0.04%
0.11%
JPY
-0.09%
-0.09%
-0.10%
-0.08%
-0.14%
-0.07%
-0.02%
NZD
0.03%
0.02%
-0.01%
0.01%
-0.06%
0.12%
0.07%
CHF
-0.02%
-0.08%
-0.08%
-0.06%
-0.12%
0.02%
-0.07%
The heat map shows percentage changes of major currencies against each other. The base currency is picked from the left column, while the quote currency is picked from the top row. For example, if you pick the Euro from the left column and move along the horizontal line to the Japanese Yen, the percentage change displayed in the box will represent EUR (base)/JPY (quote).
Gold FAQs
Gold has played a key role in human’s history as it has been widely used as a store of value and medium of exchange. Currently, apart from its shine and usage for jewelry, the precious metal is widely seen as a safe-haven asset, meaning that it is considered a good investment during turbulent times. Gold is also widely seen as a hedge against inflation and against depreciating currencies as it doesn’t rely on any specific issuer or government.
Central banks are the biggest Gold holders. In their aim to support their currencies in turbulent times, central banks tend to diversify their reserves and buy Gold to improve the perceived strength of the economy and the currency. High Gold reserves can be a source of trust for a country’s solvency. Central banks added 1,136 tonnes of Gold worth around $70 billion to their reserves in 2022, according to data from the World Gold Council. This is the highest yearly purchase since records began. Central banks from emerging economies such as China, India and Turkey are quickly increasing their Gold reserves.
Gold has an inverse correlation with the US Dollar and US Treasuries, which are both major reserve and safe-haven assets. When the Dollar depreciates, Gold tends to rise, enabling investors and central banks to diversify their assets in turbulent times. Gold is also inversely correlated with risk assets. A rally in the stock market tends to weaken Gold price, while sell-offs in riskier markets tend to favor the precious metal.
The price can move due to a wide range of factors. Geopolitical instability or fears of a deep recession can quickly make Gold price escalate due to its safe-haven status. As a yield-less asset, Gold tends to rise with lower interest rates, while higher cost of money usually weighs down on the yellow metal. Still, most moves depend on how the US Dollar (USD) behaves as the asset is priced in dollars (XAU/USD). A strong Dollar tends to keep the price of Gold controlled, whereas a weaker Dollar is likely to push Gold prices up.
EUR/USD could lose ground due to hawkish sentiment surrounding the Fed’s policy stance.
Fed officials indicated the likelihood of the Fed maintaining the higher rates for a longer period.
ECB may begin reducing borrowing costs as early as June.
EUR/USD could extend its losses for the third successive session, trading around 1.0750 during the Asian session on Thursday. The US Dollar (USD) appreciates amid expectations of the Federal Reserve’s (Fed) maintaining higher interest rates. Additionally, the higher US Treasury yields support for the US Dollar (USD), undermining the EUR/USD pair.
Furthermore, hawkish commentary from Federal Reserve officials has bolstered the US Dollar. According to a Reuters report, Federal Reserve Bank of Boston President Susan Collins stated on Wednesday the necessity for a period of moderation in the US economy to attain the central bank's 2% inflation target. On Tuesday, Minneapolis Fed President Neel Kashkari mentioned that the prevailing expectation is for rates to remain unchanged for a significant period. While the probability of rate hikes is minimal, it is not entirely discounted.
On the Euro front, monthly Retail Sales surged by 0.8% in March, bouncing back from the upwardly revised 0.3% decline in February. This marked the most significant increase in retail activity since September 2022, suggesting strength in the European consumer sector. Furthermore, Retail Sales (YoY) rose by 0.7% compared to the revised 0.5% drop in February, indicating the first growth in retail since September 2022 and signaling a positive shift in consumer spending trends.
However, the European Central Bank (ECB) is anticipated to initiate a reduction in borrowing costs starting in June. Chief Economist Philip Lane of the ECB, as reported by the Business Standard, stated that recent data have reinforced his belief that inflation is gradually approaching the 2% target.
China's Trade Balance for April, in Chinese Yuan terms, came in at CNY513.45 billion, widening from the previous figure of CNY415.86 billion.
Exports rose 1.5% YoY in April vs. -7.5% seen in March. The country’s imports rose 8.4% YoY in the same period vs. -1.9% registered previously.
In US Dollar terms, China’s trade surplus widened in April.
Trade Balance came in at +72.35B versus +76.7B expected and +58.55 previous.
Exports (YoY): 1.5% vs. 1.0% expected and -7.5% previous.
Imports (YoY): 8.4% vs. 5.4% expected and -1.9 last.
Market reaction
AUD/USD is holding positive ground on mixed China’s trade figures. The pair is up 0.02% on the day, trading at 0.6581, at the time of writing.
Australian Dollar FAQs
One of the most significant factors for the Australian Dollar (AUD) is the level of interest rates set by the Reserve Bank of Australia (RBA). Because Australia is a resource-rich country another key driver is the price of its biggest export, Iron Ore. The health of the Chinese economy, its largest trading partner, is a factor, as well as inflation in Australia, its growth rate and Trade Balance. Market sentiment – whether investors are taking on more risky assets (risk-on) or seeking safe-havens (risk-off) – is also a factor, with risk-on positive for AUD.
The Reserve Bank of Australia (RBA) influences the Australian Dollar (AUD) by setting the level of interest rates that Australian banks can lend to each other. This influences the level of interest rates in the economy as a whole. The main goal of the RBA is to maintain a stable inflation rate of 2-3% by adjusting interest rates up or down. Relatively high interest rates compared to other major central banks support the AUD, and the opposite for relatively low. The RBA can also use quantitative easing and tightening to influence credit conditions, with the former AUD-negative and the latter AUD-positive.
China is Australia’s largest trading partner so the health of the Chinese economy is a major influence on the value of the Australian Dollar (AUD). When the Chinese economy is doing well it purchases more raw materials, goods and services from Australia, lifting demand for the AUD, and pushing up its value. The opposite is the case when the Chinese economy is not growing as fast as expected. Positive or negative surprises in Chinese growth data, therefore, often have a direct impact on the Australian Dollar and its pairs.
Iron Ore is Australia’s largest export, accounting for $118 billion a year according to data from 2021, with China as its primary destination. The price of Iron Ore, therefore, can be a driver of the Australian Dollar. Generally, if the price of Iron Ore rises, AUD also goes up, as aggregate demand for the currency increases. The opposite is the case if the price of Iron Ore falls. Higher Iron Ore prices also tend to result in a greater likelihood of a positive Trade Balance for Australia, which is also positive of the AUD.
The Trade Balance, which is the difference between what a country earns from its exports versus what it pays for its imports, is another factor that can influence the value of the Australian Dollar. If Australia produces highly sought after exports, then its currency will gain in value purely from the surplus demand created from foreign buyers seeking to purchase its exports versus what it spends to purchase imports. Therefore, a positive net Trade Balance strengthens the AUD, with the opposite effect if the Trade Balance is negative.
03:11
China Trade Balance CNY rose from previous 415.86B to 513.45B in April
03:09
China Trade Balance USD below expectations ($76.7B) in April: Actual ($72.35B)
03:09
China Imports (YoY) came in at 8.4%, above forecasts (5.4%) in April
03:05
China Exports (YoY) came in at 1.5%, above forecasts (1%) in April
03:01
China Exports (YoY) CNY rose from previous -3.8% to 5.1% in April
USD/CAD edges higher after the hawkish remarks from the Fed officials.
The higher US Treasury yields are supporting the US Dollar.
BoC interest rate cut has moderated after Canadian business confidence reached a two-year high.
USD/CAD retraces its recent losses registered in the previous session, trading higher around 1.3730 during the Asian session on Thursday. Investor expectation of the Federal Reserve’s (Fed) maintaining higher interest rates for longer has pushed the US Treasury yields higher. This has contributed support for the US Dollar (USD), underpinning the USD/CAD pair.
Additionally, hawkish remarks from the Fed officials have bolstered the Greenback. According to a Reuters report, Federal Reserve Bank of Boston President Susan Collins said on Wednesday that a need for a period of moderation in the US economy to achieve the central bank's 2% inflation target. Collins highlighted that demand will need to ease in order to reach this goal. She expressed confidence that Fed policy is well-aligned with the current economic outlook.
On Tuesday, Minneapolis Fed President Neel Kashkari said that the prevailing expectation is for rates to stay steady for a considerable duration. Although the likelihood of rate hikes is minimal, it's not entirely ruled out.
Meanwhile, the case for a Bank of Canada (BoC) interest rate cut has moderated following the release of higher-than-expected Ivey Purchasing Managers Index (PMI) figures. Canada's seasonally-adjusted Ivey PMI for April surged to 63.0 from 57.5, surpassing the forecast of 58.1. This marked the ninth consecutive monthly increase, hitting its highest level in two years, indicating robust sentiment within the private sector. As a result, discussions regarding a potential rate cut by the Bank of Canada have moderated, reflecting the positive momentum in economic indicators.
Thursday's data docket lacks any releases related to Canada, leaving the Canadian Dollar (CAD) susceptible to broader market movements. However, Bank of Canada (BoC) Governor Tiff Macklem is scheduled to speak in Ottawa, delivering the BoC's Financial System Review. This report offers a comprehensive evaluation of financial system developments and an analysis of policy directions within the financial sector. Macklem's remarks may provide insights into the BoC's perspective on economic conditions and potential policy implications.
The Australian Dollar extends its losses due to a less hawkish stance by the RBA.
Australian Retail Sales declined in the first quarter, swinging from the previous quarter’s growth.
The US Dollar appreciated due to the sentiment of the Fed maintaining higher interest rates for an extended period.
The Australian Dollar (AUD) continues its losing streak on Thursday following the Reserve Bank of Australia (RBA)'s less hawkish stance, especially after last week's inflation data exceeded predictions. Nevertheless, the RBA acknowledged that recent progress in controlling inflation has stalled, maintaining its stance of keeping options open. The RBA opted to keep its interest rate steady at 4.35% on Tuesday.
Australian inflation increased in March, contrary to market expectations of steadiness. Furthermore, RBA Governor Michele Bullock stressed the importance of staying alert to inflation risks. Bullock believes that current interest rates are appropriately positioned to guide inflation back towards its target range of 2-3% by the second half of 2025 and to the midpoint by 2026.
The US Dollar Index (DXY), which gauges the performance of the US Dollar (USD) against six major currencies, gains ground due to the sentiment of the Federal Reserve’s (Fed) maintaining higher interest rates for longer. This has pushed the US Treasury yields higher, contributing support for the US Dollar (USD).
Daily Digest Market Movers: Australian Dollar extends losses due to less hawkish RBA
Australian Retail Sales (QoQ), measuring the volume of goods sold by retailers in Australia, declined by 0.4% in the first quarter of 2024, swinging from the 0.4% growth in the fourth quarter of 2023.
The ASX 200 Index snapped a five-day winning streak, primarily driven by a decline in heavyweight bank stocks due to regulatory concerns within the sector. The Australian market also reacted to a weak performance on Wall Street, as investors grappled with mixed corporate earnings reports and the Federal Reserve's hawkish stance on maintaining higher rates for an extended period.
Societe Generale has released a note regarding the Reserve Bank of Australia, emphasizing their view that the RBA's optimism regarding economic growth is misplaced. The institution anticipates a downturn in economic growth in Australia, with the potential for surprises on the downside. They attribute this forecast partly to the prevalent effects of RBA rate hikes filtering into the economy.
According to a Reuters report, Federal Reserve Bank of Boston President Susan Collins said on Wednesday that the need for a period of moderation in the US economy to achieve the central bank's 2% inflation target. Collins highlighted that demand will need to ease in order to reach this goal. She expressed confidence that Fed policy is well-aligned with the current economic outlook.
On Tuesday, Minneapolis Fed President Neel Kashkari said that the prevailing expectation is for rates to stay steady for a considerable duration. Although the likelihood of rate hikes is minimal, it's not entirely ruled out.
According to forecasts by analysts at Commonwealth Bank and Westpac, the RBA’s interest rate is expected to peak at its highest point at 4.35% in November 2023, then decrease to 3.10% by December 2025.
Technical Analysis: Australian Dollar remains below 0.6600
The Australian Dollar trades around 0.6580 on Thursday. The AUD/USD pair is consolidating within a symmetrical triangle pattern, with the 14-day Relative Strength Index (RSI) indicating a bullish bias by hovering above the 50-level.
Potential resistance levels for the AUD/USD pair include the psychological barrier at 0.6600, followed by the upper boundary near the major support level of 0.6650. A break above this level may lead the pair to retest March’s high of 0.6667, with further upside potential toward the psychological level of 0.6700.
On the downside, immediate support for the AUD/USD pair is expected at the nine-day Exponential Moving Average (EMA) around 0.6568. If the pair breaches below the EMA, it could face additional selling pressure, potentially targeting the region around the lower boundary of the symmetrical triangle near the level of 0.6465.
AUD/USD: Daily Chart
Australian Dollar price today
The table below shows the percentage change of the Australian Dollar (AUD) against listed major currencies today. The Australian Dollar was the weakest against the Pound Sterling.
USD
EUR
GBP
CAD
AUD
JPY
NZD
CHF
USD
0.00%
-0.01%
0.00%
-0.01%
0.12%
0.00%
0.03%
EUR
0.00%
-0.01%
0.01%
0.01%
0.09%
-0.01%
0.03%
GBP
0.01%
0.03%
0.03%
0.02%
0.09%
0.02%
0.04%
CAD
0.00%
0.00%
-0.02%
0.00%
0.12%
-0.01%
0.02%
AUD
0.01%
-0.01%
-0.02%
0.00%
0.07%
-0.01%
0.01%
JPY
-0.12%
-0.09%
-0.10%
-0.09%
-0.09%
-0.07%
-0.06%
NZD
0.00%
0.01%
0.00%
0.01%
0.00%
0.12%
0.03%
CHF
-0.03%
-0.03%
-0.04%
-0.02%
-0.03%
0.06%
-0.03%
The heat map shows percentage changes of major currencies against each other. The base currency is picked from the left column, while the quote currency is picked from the top row. For example, if you pick the Euro from the left column and move along the horizontal line to the Japanese Yen, the percentage change displayed in the box will represent EUR (base)/JPY (quote).
Australian Dollar FAQs
One of the most significant factors for the Australian Dollar (AUD) is the level of interest rates set by the Reserve Bank of Australia (RBA). Because Australia is a resource-rich country another key driver is the price of its biggest export, Iron Ore. The health of the Chinese economy, its largest trading partner, is a factor, as well as inflation in Australia, its growth rate and Trade Balance. Market sentiment – whether investors are taking on more risky assets (risk-on) or seeking safe-havens (risk-off) – is also a factor, with risk-on positive for AUD.
The Reserve Bank of Australia (RBA) influences the Australian Dollar (AUD) by setting the level of interest rates that Australian banks can lend to each other. This influences the level of interest rates in the economy as a whole. The main goal of the RBA is to maintain a stable inflation rate of 2-3% by adjusting interest rates up or down. Relatively high interest rates compared to other major central banks support the AUD, and the opposite for relatively low. The RBA can also use quantitative easing and tightening to influence credit conditions, with the former AUD-negative and the latter AUD-positive.
China is Australia’s largest trading partner so the health of the Chinese economy is a major influence on the value of the Australian Dollar (AUD). When the Chinese economy is doing well it purchases more raw materials, goods and services from Australia, lifting demand for the AUD, and pushing up its value. The opposite is the case when the Chinese economy is not growing as fast as expected. Positive or negative surprises in Chinese growth data, therefore, often have a direct impact on the Australian Dollar and its pairs.
Iron Ore is Australia’s largest export, accounting for $118 billion a year according to data from 2021, with China as its primary destination. The price of Iron Ore, therefore, can be a driver of the Australian Dollar. Generally, if the price of Iron Ore rises, AUD also goes up, as aggregate demand for the currency increases. The opposite is the case if the price of Iron Ore falls. Higher Iron Ore prices also tend to result in a greater likelihood of a positive Trade Balance for Australia, which is also positive of the AUD.
The Trade Balance, which is the difference between what a country earns from its exports versus what it pays for its imports, is another factor that can influence the value of the Australian Dollar. If Australia produces highly sought after exports, then its currency will gain in value purely from the surplus demand created from foreign buyers seeking to purchase its exports versus what it spends to purchase imports. Therefore, a positive net Trade Balance strengthens the AUD, with the opposite effect if the Trade Balance is negative.
Bank of Japan (BoJ) Governor Kazuo Ueda answered a parliamentary inquiry on Thursday. Ueda said that the Japanese central bank can adjust the degree of monetary accommodation by raising interest rates if trend inflation accelerates gradually, per Reuters.
Key quotes
“Low real rate supports economy and inflation.”
“Need to monitor FX and oil for real wages.”
“Increase rates if price trend rises as anticipated.”
“There is no clear evidence that Japan's natural rate of interest continued to fall from five years ago when it's estimated to have been around zero.”
“BoJ can adjust the degree of monetary accommodation via rate hikes if trend inflation accelerates gradually.”
Market reaction
At the time of writing, USD/JPY is trading 0.03% higher on the day to trade at 155.56.
Bank of Japan FAQs
The Bank of Japan (BoJ) is the Japanese central bank, which sets monetary policy in the country. Its mandate is to issue banknotes and carry out currency and monetary control to ensure price stability, which means an inflation target of around 2%.
The Bank of Japan has embarked in an ultra-loose monetary policy since 2013 in order to stimulate the economy and fuel inflation amid a low-inflationary environment. The bank’s policy is based on Quantitative and Qualitative Easing (QQE), or printing notes to buy assets such as government or corporate bonds to provide liquidity. In 2016, the bank doubled down on its strategy and further loosened policy by first introducing negative interest rates and then directly controlling the yield of its 10-year government bonds.
The Bank’s massive stimulus has caused the Yen to depreciate against its main currency peers. This process has exacerbated more recently due to an increasing policy divergence between the Bank of Japan and other main central banks, which have opted to increase interest rates sharply to fight decades-high levels of inflation. The BoJ’s policy of holding down rates has led to a widening differential with other currencies, dragging down the value of the Yen.
A weaker Yen and the spike in global energy prices have led to an increase in Japanese inflation, which has exceeded the BoJ’s 2% target. Still, the Bank judges that the sustainable and stable achievement of the 2% target has not yet come in sight, so any sudden change in the current policy looks unlikely.
USD/JPY gains ground near 155.60 amid a modest rebound of USD on Thursday.
Many Japanese policymakers called for for steady interest rate to avoid the risks of inflation overshoot.
Fed’s Collins emphasised the need to hold rates higher for longer to curb inflation, boosting the USD.
The USD/JPY pair trades in positive territory for the fourth consecutive day around 155.60 during the early Asian trading hours on Thursday. However, the fear of further intervention from the Bank of Japan (BoJ) is likely to cap the downside of the Japanese Yen (JPY) for the time being.
The BoJ board members decided to hold the key interest rate steady at 0% at its April monetary policy meeting. According to the Bank of Japan (BoJ) Summary of Opinions, board members turned hawkish at their April policy meeting, with many policymakers calling for a steady interest rate to avoid the risks of inflation overshoot. The statement highlighted BoJ Governor Kazuo Ueda's recent comments indicating the prospect of multiple rate rises in the coming months, as well as the possibility of an increase in short-term borrowing rates.
Early Wednesday, Japan's top currency diplomat, Masato Kanda, came with a verbal intervention, saying that he would take appropriate action if it’s necessary to prevent the JPY. Nonetheless, Kanda declined to comment on the FX intervention. The possibility of further steps from the Japanese authorities to prevent its currency might boost the JPY and cap the pair’s upside.
On the other hand, the monetary policy gap between the United States and Japan continues to support USD/JPY. Meanwhile, Boston Fed President Susan Collins stated on Wednesday that the interest rate will likely stay higher for longer, as it will take longer than previously thought to bring inflation down to target. The hawkish remarks from Fed officials lift the Greenback and act as a tailwind for the pair. Apart from this, traders will monitor the preliminary University of Michigan Consumer Sentiment Index on Friday, which is expected to drop to 76.0 in May from 77.2 in April.
The People’s Bank of China (PBoC) set the USD/CNY central rate for the trading session ahead on Thursday at 7.1028 as compared to the previous day's fix of 7.1016 and 7.2238 Reuters estimates.
Bank of Japan (BoJ) published the Summary of Opinions from its March monetary policy meeting on April 25 and 26, with the key findings noted below.
Key quotes
“One member said if trend inflation accelerates, BOJ will adjust degree of monetary easing but accommodative financial environment likely to continue for time being.”
“One member said if forecasts under quarterly report are met, interest rates might rise to levels higher than markets currently price in.”
“One member said one option would be to hike rates moderately in accordance with economic, price, financial developments, to avoid shock from abrupt policy shift.”
“One member said must hike rates at appropriate timing as likelihood of achieving our forecasts heightens.”
“One member said BoJ must deepen debate on timing, pace of future rate hike.”
“One member said extent of consumption recovery toward latter half of this year will be key in considering next policy change timing.”
“One member said if inflation overshoot continues against backdrop of weak yen, pace of policy normalisation may become faster.”
“One member said households' purchasing power remains weak so must maintain easy monetary conditions for time being.”
“One member said appropriate for BOJ to indicate, at some point, path toward reducing its bond buying.”
“One member said BOJ must proceed with shrinking its balance sheet including by reducing bond buying when right time comes.”
“One member said even if it takes a long time, BOJ must eventually eliminate its ETF holdings.”
“One member said must be mindful of upside risk to inflation as weak yen, rising crude oil prices affecting cost-push pressure.”
“One member said weak yen weighs on economy short-term, but may push up trend inflation by boosting output, income in medium-, to long-term horizon.”
“One member said must be vigilant to various upside risks to inflation, such as weak yen, fiscal stimulus and chance of stronger wage-inflation spiral.”
Market reaction
Following the BoJ’s Summary of Opinions, the USD/JPY pair is losing 0.03% on the day to trade at 155.47, as of writing.
Bank of Japan FAQs
The Bank of Japan (BoJ) is the Japanese central bank, which sets monetary policy in the country. Its mandate is to issue banknotes and carry out currency and monetary control to ensure price stability, which means an inflation target of around 2%.
The Bank of Japan has embarked in an ultra-loose monetary policy since 2013 in order to stimulate the economy and fuel inflation amid a low-inflationary environment. The bank’s policy is based on Quantitative and Qualitative Easing (QQE), or printing notes to buy assets such as government or corporate bonds to provide liquidity. In 2016, the bank doubled down on its strategy and further loosened policy by first introducing negative interest rates and then directly controlling the yield of its 10-year government bonds.
The Bank’s massive stimulus has caused the Yen to depreciate against its main currency peers. This process has exacerbated more recently due to an increasing policy divergence between the Bank of Japan and other main central banks, which have opted to increase interest rates sharply to fight decades-high levels of inflation. The BoJ’s policy of holding down rates has led to a widening differential with other currencies, dragging down the value of the Yen.
A weaker Yen and the spike in global energy prices have led to an increase in Japanese inflation, which has exceeded the BoJ’s 2% target. Still, the Bank judges that the sustainable and stable achievement of the 2% target has not yet come in sight, so any sudden change in the current policy looks unlikely.
US crude stocks fell 1.4 million barrels last week, according to the EIA.
The hopes of a ceasefire in Gaza have weighed on WTI prices in recent trading sessions.
Western Texas Intermediate (WTI), the US crude oil benchmark, is trading around $78.95 on Thursday. The black gold recovers losses after a surprise crude stock draw in the United States.
The Energy Information Administration (EIA) reported on Wednesday that crude inventories for the week ending May 3 declined by 1.4 million barrels to 459.5 million barrels from 7.3 million barrels built in the previous week. The market consensus estimated that stocks would decrease by 1.4 million barrels. A decline in oil inventories might lift the WTI prices as it’s typically a sign that demand is increasing.
The United States expects that discussions on a Gaza ceasefire will be able to close the gap between Israel and Hamas. The US Central Intelligence Agency Director William Burns visited Israel on Wednesday and spoke with Israeli Prime Minister Benjamin Netanyahu, per Reuters. The easing geopolitical tensions in the Middle East might weigh on the WTI prices.
Apart from this, the hawkish remarks from the US Federal Reserve (Fed) officials to hold the rates higher for longer boost the Greenback broadly and might cap the upside of the USD-denominated oil. Boston Fed president Susan Collins said on Wednesday that it will take longer "than previously thought" to bring inflation down.
The Organization of the Petroleum Exporting Countries (OPEC) and its allies, including Russia, known as OPEC+, will meet on June 1 to discuss its production policy. Nonetheless, Russian Deputy Prime Minister Alexander Novak stated Tuesday that there is currently no talk among OPEC+ about increasing oil supply.
Giao dịch trên thị trường tài chính (đặc biệt là giao dịch sử dụng các công cụ biên) mở ra những cơ hội lớn và tạo điều kiện cho các nhà đầu tư sẵn sàng mạo hiểm để thu lợi nhuận, tuy nhiên nó mang trong mình nguy cơ rủi ro khá cao. Chính vì vậy trước khi tiến hành giao dịch cần phải xem xét mọi mặt vấn đề chấp nhận tiến hành giao dịch cụ thể xét theo quan điểm của nguồn lực tài chính sẵn có và mức độ am hiểu thị trường tài chính.
Sử dụng thông tin: sử dụng toàn bộ hay riêng biệt các dữ liệu trên trang web của công ty TeleTrade như một nguồn cung cấp thông tin nhất định. Việc sử dụng tư liệu từ trang web cần kèm theo liên kết đến trang teletrade.vn. Việc tự động thu thập số liệu cũng như thông tin từ trang web TeleTrade đều không được phép.
Nhấn nút "Đăng ký" để nhận thông báo về chương trình khuyến mãi và Bonus
Cảm ơn bạn đã ghé thăm teletrade.org!
Thông tin trên trang web này có thể không tuân thủ luật pháp của quốc gia nơi bạn sống.
Vẫn xem thông tin.
Tôi xác nhận rằng các tài liệu trên trang web này không dành cho cư dân EU và tôi có thể không có quyền đăng ký tài khoản bên teletrade.org, nhưng tôi vẫn muốn tiếp tục.