- Phân tích
- Tin tức và các công cụ
- Tin tức thị trường
Tin tức thì trường
(raw materials / closing price /% change)
Oil 56.60 -0.16%
Gold 1249.30 -0.30%
(index / closing price / change items /% change)
Nikkei +320.99 22498.03 +1.45%
TOPIX +20.83 1786.25 +1.18%
Hang Seng +78.39 28303.19 +0.28%
CSI 300 -44.76 3971.06 -1.11%
Euro Stoxx 50 +11.56 3573.13 +0.32%
FTSE 100 -27.28 7320.75 -0.37%
DAX +46.30 13045.15 +0.36%
CAC 40 +9.51 5383.86 +0.18%
DJIA +70.57 24211.48 +0.29%
S&P 500 +7.71 2636.98 +0.29%
NASDAQ +36.47 6812.84 +0.54%
S&P/TSX +106.90 16015.68 +0.67%
(pare/closed(GMT +3)/change, %)
EUR/USD $1,1772 -0,20%
GBP/USD $1,3473 +0,60%
USD/CHF Chf0,99419 +0,44%
USD/JPY Y113,07 +0,70%
EUR/JPY Y133,31 +0,65%
GBP/JPY Y152,348 +1,30%
AUD/USD $0,7512 -0,67%
NZD/USD $0,6829 -0,74%
USD/CAD C$1,28532 +0,52%
00:00 Japan Labor Cash Earnings, YoY October 0.9% 0.8%
00:30 Australia Home Loans October -2.3% -2.5
03:00 China Trade Balance, bln November 38.2 35.00
05:00 Japan Eco Watchers Survey: Outlook November 54.9
05:00 Japan Eco Watchers Survey: Current November 52.2 52.3
07:00 Germany Current Account October 25.4
07:00 Germany Trade Balance (non s.a.), bln October 24.1
07:45 France Industrial Production, m/m October 0.6% -0.1%
09:30 United Kingdom Total Trade Balance October -2.75
09:30 United Kingdom Consumer Inflation Expectations Quarter IV 2.8%
09:30 United Kingdom Industrial Production (YoY) October 2.5% 3.5%
09:30 United Kingdom Industrial Production (MoM) October 0.7% 0%
09:30 United Kingdom Manufacturing Production (YoY) October 2.7% 3.9%
09:30 United Kingdom Manufacturing Production (MoM) October 0.4% 0.1%
13:00 United Kingdom NIESR GDP Estimate November 0.5% 0.4%
13:15 Canada Housing Starts November 222.8 221.0
13:30 Canada Capacity Utilization Rate Quarter III 85.0% 85.0%
13:30 U.S. Average workweek November 34.4 34.4
13:30 U.S. Manufacturing Payrolls November 24.0 17.0
13:30 U.S. Government Payrolls November 9.0 5.0
13:30 U.S. Private Nonfarm Payrolls November 252 190
13:30 U.S. Labor Force Participation Rate November 62.7%
13:30 U.S. Average hourly earnings November 0% 0.3%
13:30 U.S. Unemployment Rate November 4.1% 4.1%
13:30 U.S. Nonfarm Payrolls November 261 200
15:00 U.S. Wholesale Inventories October 0.1% -0.4%
15:00 U.S. Reuters/Michigan Consumer Sentiment Index (Preliminary) December 98.5 99.0
18:00 U.S. Baker Hughes Oil Rig Count December 749
The main US stock indexes have moderately grown, which was promoted by the rise in price of shares of technological and industrial companies.
The focus was also on the United States. As it became known, the number of Americans applying for new unemployment benefits fell last week, which indicates a strong labor market, which continues to tighten. Initial applications for unemployment benefits, a gauge of layoffs across the United States, fell by 2,000 to 236,000, seasonally adjusted for the week to December 2, the Ministry of Labor said. The four-week moving average, a more stable measure, fell along with the main indicator, reaching 241,500 last week. Meanwhile, the number of repeated applications also decreased, falling to 1,908,000 for the week ending November 25. Recently, the number of employees for longer periods of receiving unemployment benefits was near the lowest level since 1973, while weekly applications for unemployment benefits kept below 300,000 for more than 2.5 years, the longest period since 1970 -ies.
The cost of oil rose, restoring most of the positions lost the day before in response to reports of an unexpectedly large increase in gasoline stocks in the US. Recall, the US Energy Ministry said that oil reserves fell last week, but gasoline and distillate stocks increased, and oil production reached a new high. In the week of November 25-December 1, oil reserves fell by 5.610 million barrels to 448.103 million barrels. Analysts had expected a decrease in reserves of 3.404 million barrels.
Most components of the DOW index finished trading in the red (16 of 30). Outsider were the shares of The Coca-Cola Company (KO, -1.53%). Caterpillar Inc. was the growth leader. (CAT, + 1.70%).
Almost all sectors of the S & P index recorded an increase. The industrial goods sector grew most (+ 0.7%). The consumer goods sector showed the greatest decrease (-0.4%).
At closing:
DJIA + 0.29% 24,211.48 +70.57
Nasdaq + 0.54% 6,812.84 +36.47
S & P + 0.29% 2,636.98 +7.71
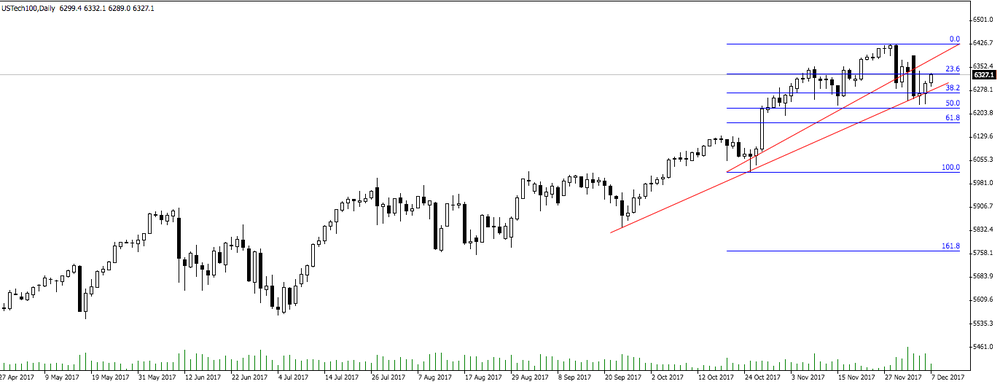
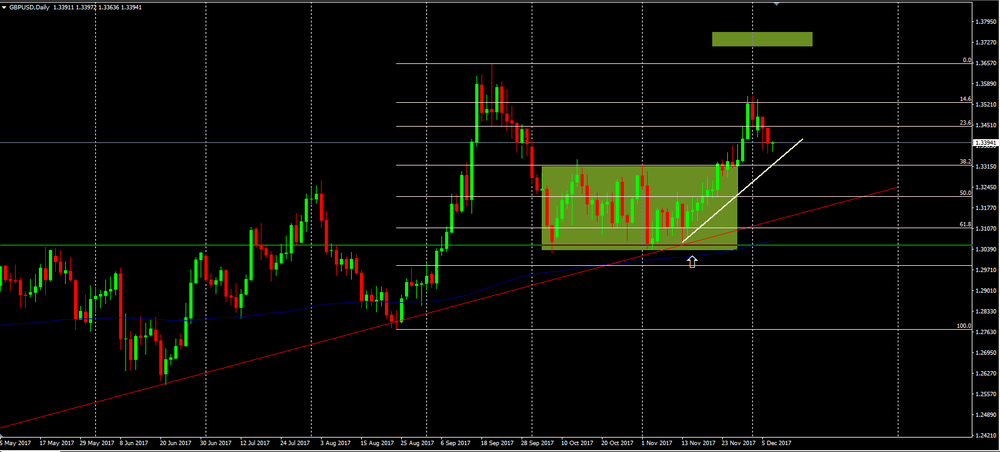
Also, we can see that the price just touched the upside trend line and it is rejecting the 38.2% of fibonacci's level.
In this scenario, we can expect a new higher high soon.
U.S. stock-index futures were mixed on Thursday as investors watched the efforts to avert a U.S. government shutdown at the end of the week as well as the latest progress on tax reform legislation.
Global Stocks:
Nikkei 22,498.03 +320.99 +1.45%
Hang Seng 28,303.19 +78.39 +0.28%
Shanghai 3,272.01 -21.96 -0.67%
S&P/ASX 5,977.72 +32.02 +0.54%
FTSE 7,341.46 -6.57 -0.09%
CAC 5,369.05 -5.30 -0.10%
DAX 12,998.58 -0.27 0.00%
Crude $56.30 (+0.61%)
Gold $1,252.50 (-0.82%)
The value of building permits rose for a second straight month, up 3.5% to $8.2 billion in October. All building components increased with the exception of the institutional component, which declined 14.3%, offsetting much of the gain from the previous month.
The value of permits for non-residential buildings increased $171.7 million to $3.3 billion in October, the second consecutive monthly gain.
The commercial component, which refers to buildings used in the trade or distribution of goods and services, was the main contributor to the 5.5% increase in the non-residential sector. Permits in Quebec for warehouses, as well as permits in Ontario for office buildings, warehouses, and recreation buildings, contributed to the rise in the value of commercial building permits in October.
(company / ticker / price / change ($/%) / volume)
| Amazon.com Inc., NASDAQ | AMZN | 1,160.00 | 7.65(0.66%) | 22237 |
| AMERICAN INTERNATIONAL GROUP | AIG | 59.98 | 0.27(0.45%) | 802 |
| Apple Inc. | AAPL | 169.55 | 0.54(0.32%) | 88260 |
| AT&T Inc | T | 36.18 | 0.07(0.19%) | 1157 |
| Barrick Gold Corporation, NYSE | ABX | 13.19 | -0.36(-2.66%) | 163776 |
| Boeing Co | BA | 278 | -0.27(-0.10%) | 3662 |
| Cisco Systems Inc | CSCO | 37.45 | 0.04(0.11%) | 4770 |
| Citigroup Inc., NYSE | C | 75.1 | -0.34(-0.45%) | 16645 |
| Exxon Mobil Corp | XOM | 82.3 | 0.02(0.02%) | 775 |
| Facebook, Inc. | FB | 176.56 | 0.50(0.28%) | 53069 |
| FedEx Corporation, NYSE | FDX | 236.4 | 0.01(0.00%) | 254 |
| Ford Motor Co. | F | 12.4 | 0.02(0.16%) | 19438 |
| Freeport-McMoRan Copper & Gold Inc., NYSE | FCX | 14.25 | -0.10(-0.70%) | 15183 |
| General Electric Co | GE | 17.71 | 0.05(0.28%) | 155631 |
| General Motors Company, NYSE | GM | 41.91 | 0.14(0.34%) | 931 |
| Goldman Sachs | GS | 245.52 | -0.43(-0.17%) | 2616 |
| Google Inc. | GOOG | 1,022.00 | 3.62(0.36%) | 2500 |
| Home Depot Inc | HD | 181 | 0.20(0.11%) | 2489 |
| Intel Corp | INTC | 43.59 | 0.14(0.32%) | 162340 |
| International Business Machines Co... | IBM | 154.04 | -0.06(-0.04%) | 2842 |
| Johnson & Johnson | JNJ | 141 | -0.06(-0.04%) | 1610 |
| JPMorgan Chase and Co | JPM | 104.64 | -0.29(-0.28%) | 4775 |
| McDonald's Corp | MCD | 173 | -0.48(-0.28%) | 871 |
| Merck & Co Inc | MRK | 55.05 | 0.70(1.29%) | 40746 |
| Microsoft Corp | MSFT | 82.8 | 0.02(0.02%) | 12711 |
| Nike | NKE | 59.71 | -0.01(-0.02%) | 1555 |
| Pfizer Inc | PFE | 35.57 | 0.01(0.03%) | 2219 |
| Procter & Gamble Co | PG | 91.21 | -0.04(-0.04%) | 1960 |
| Starbucks Corporation, NASDAQ | SBUX | 58.96 | -0.32(-0.54%) | 2422 |
| Tesla Motors, Inc., NASDAQ | TSLA | 312.01 | -1.25(-0.40%) | 20369 |
| Twitter, Inc., NYSE | TWTR | 21.16 | 0.07(0.33%) | 11127 |
| UnitedHealth Group Inc | UNH | 220.01 | 0.07(0.03%) | 2147 |
| Visa | V | 109.82 | 0.08(0.07%) | 1562 |
| Wal-Mart Stores Inc | WMT | 97 | 0.23(0.24%) | 7213 |
| Walt Disney Co | DIS | 105.85 | 0.39(0.37%) | 8723 |
| Yandex N.V., NASDAQ | YNDX | 32.4 | -0.22(-0.67%) | 6251 |
In the week ending December 2, the advance figure for seasonally adjusted initial claims was 236,000, a decrease of 2,000 from the previous week's unrevised level of 238,000. The 4-week moving average was 241,500, a decrease of 750 from the previous week's unrevised average of 242,250.
Goldman Sachs (GS) target raised to $300 from $290 at BofA/Merrill; added to US 1 List
Amazon (AMZN) target raised to $1500 from $1225 at Cowen; maintain Outperform, named a Best Idea for 2018
GBP/USD on daily time frame still remains above the consolidation zone.
In this scenario, we can expect a further bullish movement soon in order to reach new higher high.
Seasonally adjusted GDP rose by 0.6% in both the euro area (EA19) and the EU28 during the third quarter of 2017, compared with the previous quarter, according to an estimate published by Eurostat, the statistical office of the European Union. In the second quarter of 2017, GDP grew by 0.7% in both areas. Compared with the same quarter of the previous year, seasonally adjusted GDP rose by 2.6% in both the euro area and the EU28 in the third quarter of 2017, after +2.4% in both zones in the second quarter of 2017. During the third quarter of 2017, GDP in the United States increased by 0.8% compared with the previous quarter (after also +0.8% in the second quarter of 2017). Compared with the same quarter of the previous year, GDP grew by 2.3% (after +2.2% in the second quarter of 2017).
EUR/USD: 1.1600/01(679 m), 1.1750(975 m), 1.1800(1.09 b), 1.1865-75(949 m), 1.1900(551 m), 1.1950(529 m), 1.2000(609 m)
USD/JPY: 110.00(349 m), 112.00(471 m), 112.20(394 m), 114.60(590 m)
AUD/USD: 0.7500(464 m), 0.7650-55(755 m)
NZD/USD: 0.7100(397 m)
-
House prices in the last three months (September-November) were 2.4% higher than in the previous quarter (June-August). This is the fastest price growth, on this measure, since January.
-
Prices in the three months to November were 3.9% higher than in the same three months a year earlier although the annual change in November was lower than in October (4.5%).
-
House prices rose by 0.5% between October and November, following a 0.3% increase in October marking the fifth consecutive monthly rise. The average price of £226,821 is 3.2% higher than in January (£219,741).
-
Forint seen firming 2.2 pct by dec next year, Serbia's dinar shedding 0.9 pct
-
Zloty seen gaining 1.5 pct to 4.145 vs euro in next 12 months (vs 4.21 in previous poll)
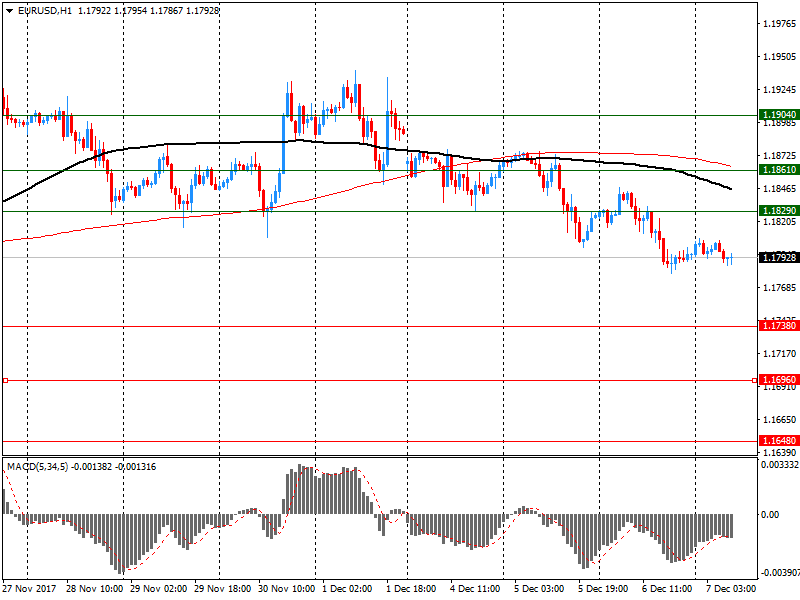
EUR/USD
Resistance levels (open interest**, contracts)
$1.1904 (5315)
$1.1861 (3738)
$1.1829 (5931)
Price at time of writing this review: $1.1793
Support levels (open interest**, contracts):
$1.1738 (3522)
$1.1796 (4966)
$1.1648 (5978)
Comments:
- Overall open interest on the CALL options and PUT options with the expiration date December, 8 is 163565 contracts (according to data from December, 6) with the maximum number of contracts with strike price $1,1500 (8828);
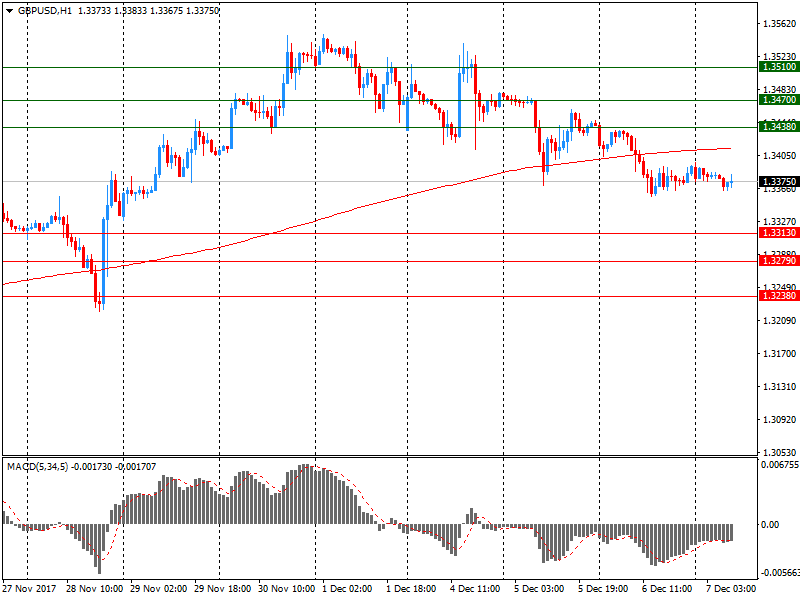
GBP/USD
Resistance levels (open interest**, contracts)
$1.3510 (2743)
$1.3470 (1873)
$1.3438 (3843)
Price at time of writing this review: $1.3375
Support levels (open interest**, contracts):
$1.3313 (1256)
$1.3279 (2108)
$1.3238 (1353)
Comments:
- Overall open interest on the CALL options with the expiration date December, 8 is 54001 contracts, with the maximum number of contracts with strike price $1,3400 (3843);
- Overall open interest on the PUT options with the expiration date December, 8 is 47792 contracts, with the maximum number of contracts with strike price $1,3000 (3933);
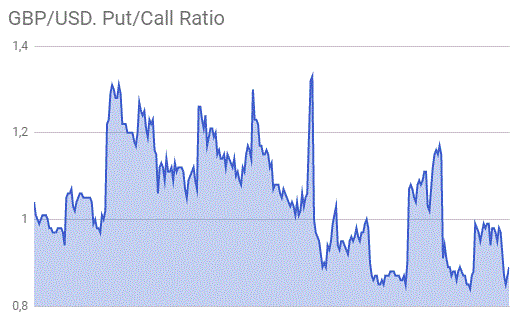
- The ratio of PUT/CALL was 0.89 versus 0.86 from the previous trading day according to data from December, 6
* - The Chicago Mercantile Exchange bulletin (CME) is used for the calculation.
** - Open interest takes into account the total number of option contracts that are open at the moment.
-
Says public holidays in oct that drove workers to take long weekends significantly contributed to fall
In trend terms, the balance on goods and services was a surplus of $644m in October 2017, a decrease of $112m on the surplus in September 2017.
In seasonally adjusted terms, the balance on goods and services was a surplus of $105m in October 2017, a decrease of $1,499m on the surplus in September 2017.
In seasonally adjusted terms, goods and services credits fell $903m (3%) to $31,871m. Non-rural goods fell $1,074m (5%) and rural goods fell $85m (2%). Non-monetary gold rose $362m (24%) and net exports of goods under merchanting rose $12m (25%). Services credits fell $118m (2%).
Registered unemployment in November 2017 - According to the State Secretariat for Economic Affairs (SECO) surveys, at the end of November 2017 there were 137'317 unemployed persons registered with the Regional Employment Centers (RAV), 2'517 more than in the previous month. The unemployment rate rose from 3.0% in October 2017 to 3.1% in the month under review. Compared with the same month of the previous year, unemployment fell by 11,911 persons (-8.0%). Youth unemployment in November 2017 Youth unemployment (aged 15-24) decreased by 335 (-2.0%) to 16,570.
In October 2017, production in industry was down by 1.4% from the previous month on a price, seasonally and working day adjusted basis according to provisional data of the Federal Statistical Office (Destatis). In September 2017, the corrected figure shows a decrease of 0.9% (primary -1.6%) from August 2017.
In October 2017, production in industry excluding energy and construction was down by 2.0%. Within industry, the production of capital goods decreased by 2.7% and the production of consumer goods by 2.6%. The production of intermediate goods showed a decrease of 1.0%. Energy production was up by 5.1% in October 2017 and the production in construction decreased by 1.3%.
European stocks finished with modest losses Wednesday, as the region's main benchmark retreated for a second day in a row. Steinhoff International Holdings NV and Saga PLC dived after troubling updates, and tech shares also fronted the losses.
U.S. stocks ended mixed on Wednesday, as weakness in the energy sector spurred some minor selling that offset a recovery in the technology sector. The S&P 500 ended essentially unchanged on the day, although it closed in slightly negative territory. That made for its fourth straight lower close, its longest losing streak since March.
Asia stocks largely steadied Thursday after European and U.S. equities overnight showed scant reaction to big stock declines a day earlier in the region. While more moderate than Wednesday, selling continued in China, South Korea and Taiwan. But Japan's Nikkei Stock Average NIK, +1.06% rebounded, rising 1.2% after Wednesday's 2% decline, the most since March.
© 2000-2026. Bản quyền Teletrade.
Trang web này được quản lý bởi Teletrade D.J. LLC 2351 LLC 2022 (Euro House, Richmond Hill Road, Kingstown, VC0100, St. Vincent and the Grenadines).
Thông tin trên trang web không phải là cơ sở để đưa ra quyết định đầu tư và chỉ được cung cấp cho mục đích làm quen.
Giao dịch trên thị trường tài chính (đặc biệt là giao dịch sử dụng các công cụ biên) mở ra những cơ hội lớn và tạo điều kiện cho các nhà đầu tư sẵn sàng mạo hiểm để thu lợi nhuận, tuy nhiên nó mang trong mình nguy cơ rủi ro khá cao. Chính vì vậy trước khi tiến hành giao dịch cần phải xem xét mọi mặt vấn đề chấp nhận tiến hành giao dịch cụ thể xét theo quan điểm của nguồn lực tài chính sẵn có và mức độ am hiểu thị trường tài chính.
Sử dụng thông tin: sử dụng toàn bộ hay riêng biệt các dữ liệu trên trang web của công ty TeleTrade như một nguồn cung cấp thông tin nhất định. Việc sử dụng tư liệu từ trang web cần kèm theo liên kết đến trang teletrade.vn. Việc tự động thu thập số liệu cũng như thông tin từ trang web TeleTrade đều không được phép.
Xin vui lòng liên hệ với pr@teletrade.global nếu có câu hỏi.

