- Phân tích
- Tin tức và các công cụ
- Tin tức thị trường
Tin tức thì trường
- USD/CAD trades on a softer note around 1.3755 in Thursday’s early Asian session.
- BoC’s governing council saw the risk that consumer spending could be significantly weaker than expected in 2025 and 2026.
- Traders will watch the weekly US Initial Jobless Claims on Thursday for some hints about the employment market outlook.
The USD/CAD pair extends its decline to near 1.3755 during the early Asian session on Thursday. The Canadian Dollar (CAD) is poised to perform well this week despite the lack of top-tier economic data released earlier this week. On Friday, traders will closely monitor the Canadian employment report for July.
The Bank of Canada (BoC) minutes from a recent meeting released Wednesday showed that members saw a risk that consumer spending would be much weaker than expected in 2025 and 2026. The minutes observed that labour market pressures had eased and that the economy was evolving largely as expected, although job creation has been slower in the working-age population.
According to the deliberations, some members were more focused on the downside risks to inflation posed by a weak economy and restrictive monetary policy, while others emphasized the upside risks of wage growth and the possibility of a housing market rebound.
The Canadian employment data will be published on Friday. The Canadian economy is expected to add 22.5K jobs in July, while the Unemployment Rate is estimated to rise to 6.5% in the same report period from 6.4% in June.
Meanwhile, the rising geopolitical tensions in the Middle East and another fall in US weekly crude oil inventories boost crude oil prices and lift the commodity-linked Loonie. It's worth noting that higher oil prices generally support the CAD lower as Canada is the leading exporter of Oil to the United States (US).
On the USD’s front, investors expect the Federal Reserve (Fed) to take more aggressive action for the interest rate before it misses the chance. Markets are pricing in a strong likelihood of that half-point rate cut in September. The expectation of deeper rate cuts might cap the upside for the US Dollar in the near term.
Traders will keep an eye on the weekly US Initial Jobless Claims on Thursday. TD Securities analysts said, “Jobless claims on Thursday is something markets will be looking for confirmation of slowing economic numbers, particularly employment.”
Canadian Dollar FAQs
The key factors driving the Canadian Dollar (CAD) are the level of interest rates set by the Bank of Canada (BoC), the price of Oil, Canada’s largest export, the health of its economy, inflation and the Trade Balance, which is the difference between the value of Canada’s exports versus its imports. Other factors include market sentiment – whether investors are taking on more risky assets (risk-on) or seeking safe-havens (risk-off) – with risk-on being CAD-positive. As its largest trading partner, the health of the US economy is also a key factor influencing the Canadian Dollar.
The Bank of Canada (BoC) has a significant influence on the Canadian Dollar by setting the level of interest rates that banks can lend to one another. This influences the level of interest rates for everyone. The main goal of the BoC is to maintain inflation at 1-3% by adjusting interest rates up or down. Relatively higher interest rates tend to be positive for the CAD. The Bank of Canada can also use quantitative easing and tightening to influence credit conditions, with the former CAD-negative and the latter CAD-positive.
The price of Oil is a key factor impacting the value of the Canadian Dollar. Petroleum is Canada’s biggest export, so Oil price tends to have an immediate impact on the CAD value. Generally, if Oil price rises CAD also goes up, as aggregate demand for the currency increases. The opposite is the case if the price of Oil falls. Higher Oil prices also tend to result in a greater likelihood of a positive Trade Balance, which is also supportive of the CAD.
While inflation had always traditionally been thought of as a negative factor for a currency since it lowers the value of money, the opposite has actually been the case in modern times with the relaxation of cross-border capital controls. Higher inflation tends to lead central banks to put up interest rates which attracts more capital inflows from global investors seeking a lucrative place to keep their money. This increases demand for the local currency, which in Canada’s case is the Canadian Dollar.
Macroeconomic data releases gauge the health of the economy and can have an impact on the Canadian Dollar. Indicators such as GDP, Manufacturing and Services PMIs, employment, and consumer sentiment surveys can all influence the direction of the CAD. A strong economy is good for the Canadian Dollar. Not only does it attract more foreign investment but it may encourage the Bank of Canada to put up interest rates, leading to a stronger currency. If economic data is weak, however, the CAD is likely to fall.
According to the Bank of Canada's (BoC) minutes from a recent meeting that was released Wednesday, the governing council saw the risk that consumer spending could be significantly weaker than expected in 2025 and 2026.
Key quotes
Spending in 2025 and 2026 could be hit by the number of households likely to be renewing their mortgages at higher rates.
Spending per person is expected to recover as rates decline but many households will still face significant debt-servicing costs.
Agreed to communicate that they would be weighing two-way inflation forecasts.
Saw less of a chance that pent-up demand would lead to a sudden rise in house prices as rates were cut.
Governing Council increasingly confident "ingredients for price stability are in place."
Downside risks to inflation now as prominent as upside risks.
Economy in excess supply, slack emerging in labor market.
GDP growth subdued, consumption weak on a per-capita basis.
Core and headline inflation within 1-3% range for several months.
Wage growth still elevated at ~4%, but expected to moderate.
Housing market imbalances persist, putting upward pressure on rents.
Future rate cuts are likely if inflation continues easing as projected.
No predetermined path for policy rate - decisions to be made meeting-by-meeting.
BoC to continue balance sheet normalization by allowing maturing bonds to roll-off.
Some expressed concerns that further weakness in jobs market could delay rebound in consumption.
Market reaction to the BoC Minutes
At the time of writing, USD/CAD was down 0.04% on the day at 1.3753.
Bank of Canada FAQs
The Bank of Canada (BoC), based in Ottawa, is the institution that sets interest rates and manages monetary policy for Canada. It does so at eight scheduled meetings a year and ad hoc emergency meetings that are held as required. The BoC primary mandate is to maintain price stability, which means keeping inflation at between 1-3%. Its main tool for achieving this is by raising or lowering interest rates. Relatively high interest rates will usually result in a stronger Canadian Dollar (CAD) and vice versa. Other tools used include quantitative easing and tightening.
In extreme situations, the Bank of Canada can enact a policy tool called Quantitative Easing. QE is the process by which the BoC prints Canadian Dollars for the purpose of buying assets – usually government or corporate bonds – from financial institutions. QE usually results in a weaker CAD. QE is a last resort when simply lowering interest rates is unlikely to achieve the objective of price stability. The Bank of Canada used the measure during the Great Financial Crisis of 2009-11 when credit froze after banks lost faith in each other’s ability to repay debts.
Quantitative tightening (QT) is the reverse of QE. It is undertaken after QE when an economic recovery is underway and inflation starts rising. Whilst in QE the Bank of Canada purchases government and corporate bonds from financial institutions to provide them with liquidity, in QT the BoC stops buying more assets, and stops reinvesting the principal maturing on the bonds it already holds. It is usually positive (or bullish) for the Canadian Dollar.
- EUR/USD floundered on Wednesday as markets remain tepid.
- Investors taking a breather after a rough rebalancing late last week.
- Despite breaking higher in recent days, Fiber bids run out of steam.
EUR/USD paddled in a tight circle on Wednesday, churning just above the 1.0900 handle as Fiber traders take a breather from recent volatility sparked by a misprint in key US data last week. EUR/USD flubbed a bullish dash for 1.1000, leaving bids hung out to dry.
Forex Today: Investors now look at weekly US labour data
The rest of the trading week sees limited meaningful economic calendar releases, leaving Federal Reserve (Fed) rate cut bets as the key market driver. Traders get a breather of high-impact data until next week, which sees US Producer Price Index (PPI) inflation next Tuesday, followed by European Gross Domestic Product (GDP) growth on Wednesday alongside US Consumer Price Index (CPI) inflation.
Rate markets have priced in roughly two-to-one odds of a 50-basis-point rate trim from the Fed on September 18, with a further two cuts expected through the rest of 2024. According to the CME’s FedWatch Tool, rate probabilities see an 83% chance of the Fed’s benchmark fed funds rate hitting 425-450 basis points by the end of December.
EUR/USD technical outlook
The EUR/USD pair has dropped from 1.1000 after a failed attempt to rise to that level. The price action is expected to fall back into a descending channel on daily candlesticks. Throughout 2024, EUR/USD has been stuck in a choppy consolidation around the 200-day Exponential Moving Average (EMA), and it looks like this trend will continue as short-term momentum turns bearish once again. Sellers are targeting the 1.0800 level, hoping to break through and test the last major low below 1.0700.
EUR/USD daily chart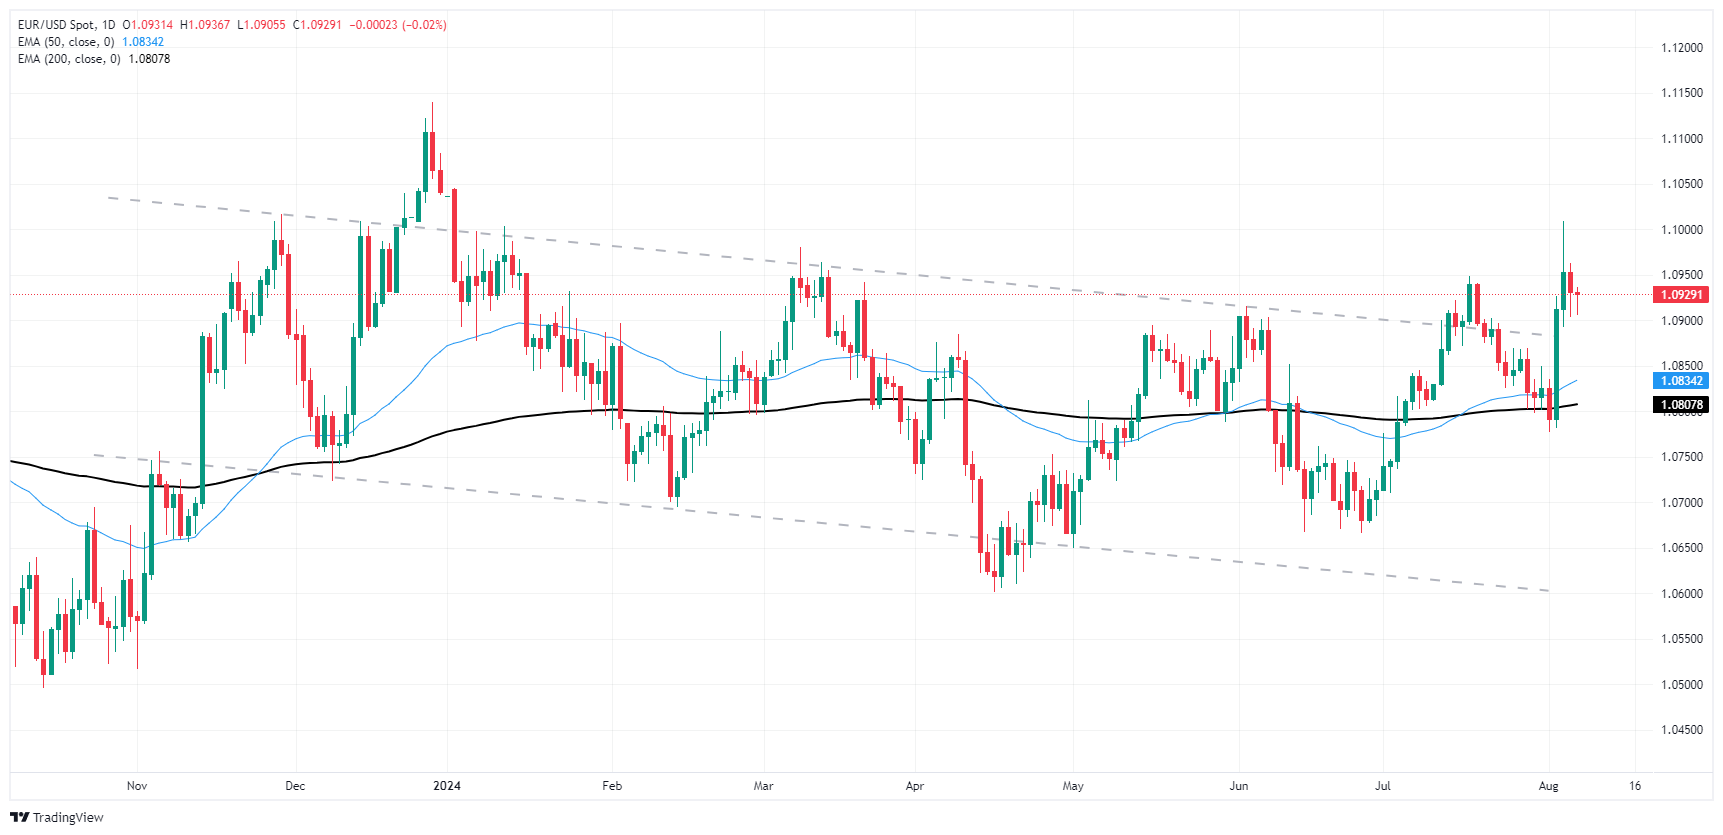
Euro FAQs
The Euro is the currency for the 20 European Union countries that belong to the Eurozone. It is the second most heavily traded currency in the world behind the US Dollar. In 2022, it accounted for 31% of all foreign exchange transactions, with an average daily turnover of over $2.2 trillion a day. EUR/USD is the most heavily traded currency pair in the world, accounting for an estimated 30% off all transactions, followed by EUR/JPY (4%), EUR/GBP (3%) and EUR/AUD (2%).
The European Central Bank (ECB) in Frankfurt, Germany, is the reserve bank for the Eurozone. The ECB sets interest rates and manages monetary policy. The ECB’s primary mandate is to maintain price stability, which means either controlling inflation or stimulating growth. Its primary tool is the raising or lowering of interest rates. Relatively high interest rates – or the expectation of higher rates – will usually benefit the Euro and vice versa. The ECB Governing Council makes monetary policy decisions at meetings held eight times a year. Decisions are made by heads of the Eurozone national banks and six permanent members, including the President of the ECB, Christine Lagarde.
Eurozone inflation data, measured by the Harmonized Index of Consumer Prices (HICP), is an important econometric for the Euro. If inflation rises more than expected, especially if above the ECB’s 2% target, it obliges the ECB to raise interest rates to bring it back under control. Relatively high interest rates compared to its counterparts will usually benefit the Euro, as it makes the region more attractive as a place for global investors to park their money.
Data releases gauge the health of the economy and can impact on the Euro. Indicators such as GDP, Manufacturing and Services PMIs, employment, and consumer sentiment surveys can all influence the direction of the single currency. A strong economy is good for the Euro. Not only does it attract more foreign investment but it may encourage the ECB to put up interest rates, which will directly strengthen the Euro. Otherwise, if economic data is weak, the Euro is likely to fall. Economic data for the four largest economies in the euro area (Germany, France, Italy and Spain) are especially significant, as they account for 75% of the Eurozone’s economy.
Another significant data release for the Euro is the Trade Balance. This indicator measures the difference between what a country earns from its exports and what it spends on imports over a given period. If a country produces highly sought after exports then its currency will gain in value purely from the extra demand created from foreign buyers seeking to purchase these goods. Therefore, a positive net Trade Balance strengthens a currency and vice versa for a negative balance.
According to two US intelligence officials, Iran and its proxies are preparing for a potential retaliation against Israel. The sources did not comment on the kind of preparations being made.
The Iranian attack would come in response to Israel last week killing the top military commander for Iran’s most powerful proxy, Hezbollah in Lebanon. The next day, Israel is widely believed to have killed Hamas’ senior leader in Tehran, which Israel has not admitted to carrying out.
US officials are confident that Hezbollah’s and Iran’s response is imminent and initial assessment predicted an early week attack, but the most recent intelligence showed any response may be delayed until Thursday or Friday, according to Al Arabiya.
Market reaction
At the time of writing, the gold price (XAU/USD) is trading 0.01% higher on the day to trade at $2,383.42.
Risk sentiment FAQs
In the world of financial jargon the two widely used terms “risk-on” and “risk off'' refer to the level of risk that investors are willing to stomach during the period referenced. In a “risk-on” market, investors are optimistic about the future and more willing to buy risky assets. In a “risk-off” market investors start to ‘play it safe’ because they are worried about the future, and therefore buy less risky assets that are more certain of bringing a return, even if it is relatively modest.
Typically, during periods of “risk-on”, stock markets will rise, most commodities – except Gold – will also gain in value, since they benefit from a positive growth outlook. The currencies of nations that are heavy commodity exporters strengthen because of increased demand, and Cryptocurrencies rise. In a “risk-off” market, Bonds go up – especially major government Bonds – Gold shines, and safe-haven currencies such as the Japanese Yen, Swiss Franc and US Dollar all benefit.
The Australian Dollar (AUD), the Canadian Dollar (CAD), the New Zealand Dollar (NZD) and minor FX like the Ruble (RUB) and the South African Rand (ZAR), all tend to rise in markets that are “risk-on”. This is because the economies of these currencies are heavily reliant on commodity exports for growth, and commodities tend to rise in price during risk-on periods. This is because investors foresee greater demand for raw materials in the future due to heightened economic activity.
The major currencies that tend to rise during periods of “risk-off” are the US Dollar (USD), the Japanese Yen (JPY) and the Swiss Franc (CHF). The US Dollar, because it is the world’s reserve currency, and because in times of crisis investors buy US government debt, which is seen as safe because the largest economy in the world is unlikely to default. The Yen, from increased demand for Japanese government bonds, because a high proportion are held by domestic investors who are unlikely to dump them – even in a crisis. The Swiss Franc, because strict Swiss banking laws offer investors enhanced capital protection.
- GBP/USD failed to spark a rebound above 1.2700 on Wednesday.
- Markets continue to price in a double Fed cut in September.
- Investors shrugged off fears of a US downturn, but bids remain tepid.
GBP/USD tested waters on the high side on Wednesday but settled the day where it started just south of the 1.2700 handle. Markets are struggling to shrug off a broad downside shock kicked off late last week after a raft of US data came in below expectations, reigniting fears of a steep US recession looming over the horizon.
Forex Today: Investors now look at weekly US labour data
Investors have recovered their balance, but recovery remains a limited affair as Cable treads water. Meaningful economic data remains limited heading through the rest of the week, leaving investors to grapple with hopes for a 50 basis point rate cut from the Federal Reserve (Fed) in September.
Cable traders will be looking ahead to next week’s UK labor figures and an update to US Producer Price Index (PPI) inflation. UK and US Consumer Price Index (CPI) inflation is also in the barrel for next week, as well as UK Gross Domestic Product (GDP) growth and US Retail Sales.
At the current cut, rate traders are pricing in roughly two-to-one odds of a 50-basis-point rate trim from the Fed on September 18, with a further two cuts expected through the rest of 2024. According to the CME’s FedWatch Tool, rate probabilities see an 83% chance of the Fed’s benchmark fed funds rate hitting 425-450 basis points by the end of December.
GBP/USD technical outlook
Cable continues to churn chart paper just north of the 200-day Exponential Moving Average (EMA) at 1.2647, but odds of a bullish technical recovery are growing thinner as bidders struggle to find a foothold. GBP/USD is down nearly 3% peak-to-trough from 12-month highs set in mid-July, and long-term position buyers will be looking for a slow-moving pattern of higher lows on daily candlesticks to keep the pair buoyed.
GBP/USD daily chart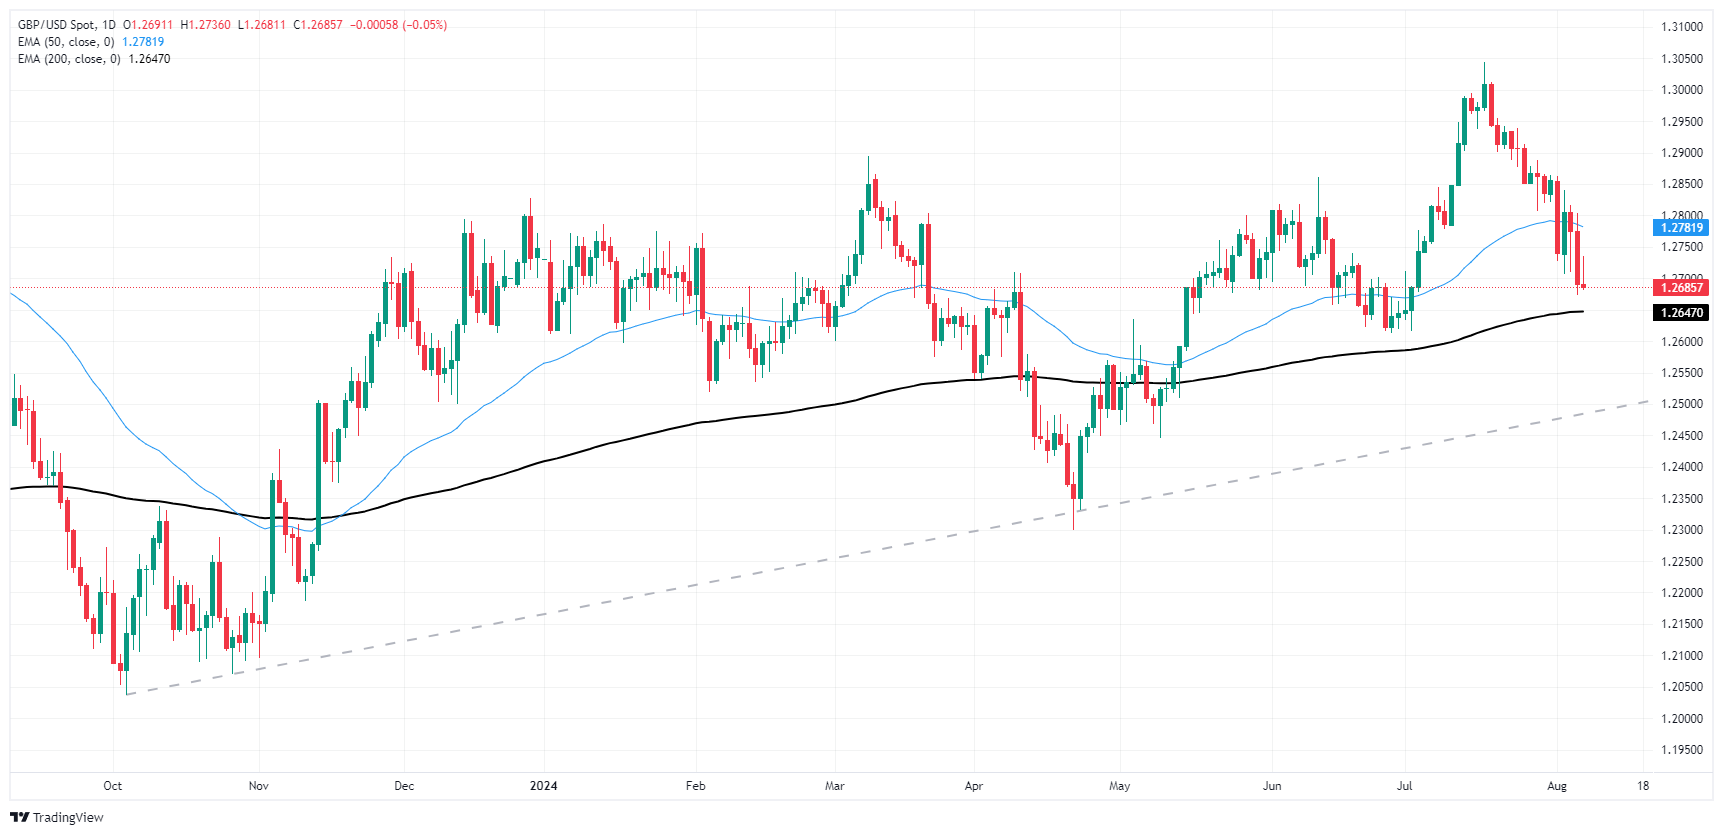
Pound Sterling FAQs
The Pound Sterling (GBP) is the oldest currency in the world (886 AD) and the official currency of the United Kingdom. It is the fourth most traded unit for foreign exchange (FX) in the world, accounting for 12% of all transactions, averaging $630 billion a day, according to 2022 data. Its key trading pairs are GBP/USD, aka ‘Cable’, which accounts for 11% of FX, GBP/JPY, or the ‘Dragon’ as it is known by traders (3%), and EUR/GBP (2%). The Pound Sterling is issued by the Bank of England (BoE).
The single most important factor influencing the value of the Pound Sterling is monetary policy decided by the Bank of England. The BoE bases its decisions on whether it has achieved its primary goal of “price stability” – a steady inflation rate of around 2%. Its primary tool for achieving this is the adjustment of interest rates. When inflation is too high, the BoE will try to rein it in by raising interest rates, making it more expensive for people and businesses to access credit. This is generally positive for GBP, as higher interest rates make the UK a more attractive place for global investors to park their money. When inflation falls too low it is a sign economic growth is slowing. In this scenario, the BoE will consider lowering interest rates to cheapen credit so businesses will borrow more to invest in growth-generating projects.
Data releases gauge the health of the economy and can impact the value of the Pound Sterling. Indicators such as GDP, Manufacturing and Services PMIs, and employment can all influence the direction of the GBP. A strong economy is good for Sterling. Not only does it attract more foreign investment but it may encourage the BoE to put up interest rates, which will directly strengthen GBP. Otherwise, if economic data is weak, the Pound Sterling is likely to fall.
Another significant data release for the Pound Sterling is the Trade Balance. This indicator measures the difference between what a country earns from its exports and what it spends on imports over a given period. If a country produces highly sought-after exports, its currency will benefit purely from the extra demand created from foreign buyers seeking to purchase these goods. Therefore, a positive net Trade Balance strengthens a currency and vice versa for a negative balance.
- Silver drops 1.38% to $26.59, pressured by strong US Dollar.
- Key support levels at $26.51 and $26.06 eyed amid bearish momentum.
- Reclaiming $27 could push silver to test resistance at $27.56 and $28.00.
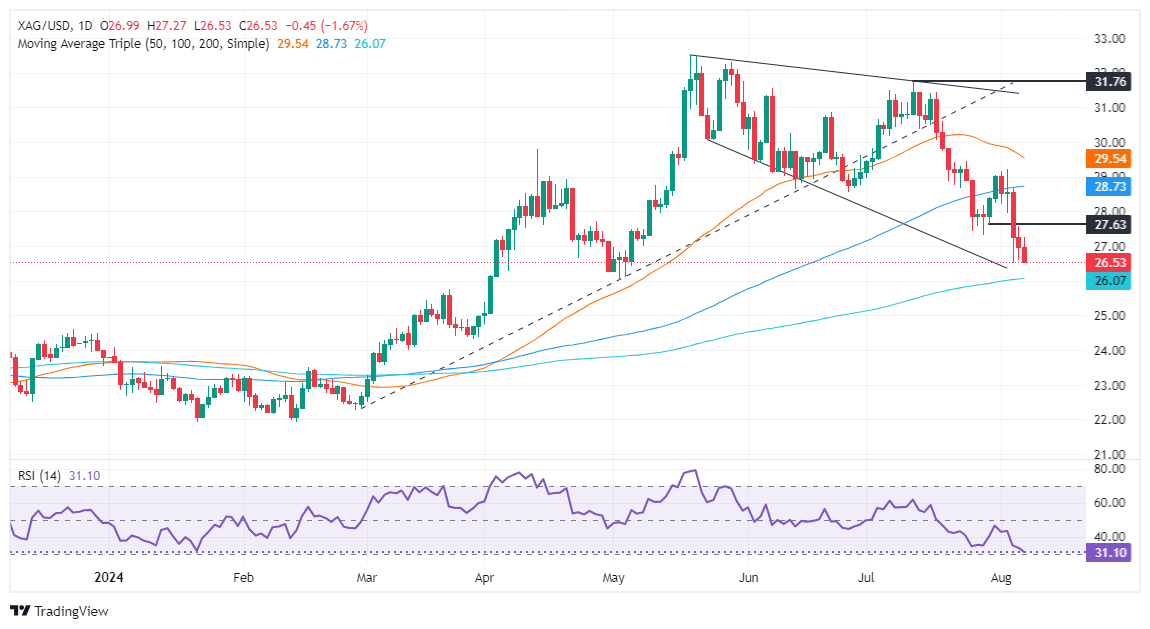
Silver's price extended its losses for the third straight day and stayed below $27.00 amid increasing geopolitical fears spurred by the Middle East conflict. Despite that, the grey metal failed to gain traction, capped by the rise of US Treasury yields and a strong US Dollar. The XAG/USD trades at $26.59, down 1.38%.
XAG/USD Price Forecast: Technical outlook
Silver's struggle to remain above $27.00 could pave the way for a deeper pullback and test key support levels. Momentum favors sellers, as the Relative Strength Index (RSI) remains in bearish territory.
The XAG/USD first support would be the August 5 low of $26.51, followed by the 200-day moving average (DMA) at $26.06. Once those levels are surpassed, the next demand zone will be the March 27 pivot low at $24.33.
Conversely, if XAG/USD makes a U-turn and buyers reclaim $27.00, this can pave the way to test the August 6 peak at $27.56. Once hurdle, the next resistance would be the $28.00 mark ahead of the August 5 high at $28.67.
XAG/USD Price Action – Daily Chart
Silver FAQs
Silver is a precious metal highly traded among investors. It has been historically used as a store of value and a medium of exchange. Although less popular than Gold, traders may turn to Silver to diversify their investment portfolio, for its intrinsic value or as a potential hedge during high-inflation periods. Investors can buy physical Silver, in coins or in bars, or trade it through vehicles such as Exchange Traded Funds, which track its price on international markets.
Silver prices can move due to a wide range of factors. Geopolitical instability or fears of a deep recession can make Silver price escalate due to its safe-haven status, although to a lesser extent than Gold's. As a yieldless asset, Silver tends to rise with lower interest rates. Its moves also depend on how the US Dollar (USD) behaves as the asset is priced in dollars (XAG/USD). A strong Dollar tends to keep the price of Silver at bay, whereas a weaker Dollar is likely to propel prices up. Other factors such as investment demand, mining supply – Silver is much more abundant than Gold – and recycling rates can also affect prices.
Silver is widely used in industry, particularly in sectors such as electronics or solar energy, as it has one of the highest electric conductivity of all metals – more than Copper and Gold. A surge in demand can increase prices, while a decline tends to lower them. Dynamics in the US, Chinese and Indian economies can also contribute to price swings: for the US and particularly China, their big industrial sectors use Silver in various processes; in India, consumers’ demand for the precious metal for jewellery also plays a key role in setting prices.
Silver prices tend to follow Gold's moves. When Gold prices rise, Silver typically follows suit, as their status as safe-haven assets is similar. The Gold/Silver ratio, which shows the number of ounces of Silver needed to equal the value of one ounce of Gold, may help to determine the relative valuation between both metals. Some investors may consider a high ratio as an indicator that Silver is undervalued, or Gold is overvalued. On the contrary, a low ratio might suggest that Gold is undervalued relative to Silver.
- NZD/JPY's strong bullish momentum continues, with technical indicators signaling a potential shift.
- The RSI is vertically up but remains in oversold terrain.
- The MACD indicator is also bullish, as the histogram is turning positive.
The NZD/JPY pair has shown a strong bullish momentum this week, with Wednesday's 2% gain towards 88.00 suggesting that the bulls are waking up.
The Moving Average Convergence Divergence (MACD) indicator is also showing signs of bullishness with the historgram printing lower red bars. On the other hand, the Relative Strength Index (RSI) has moved from 10 to 30. This suggests that the bulls are in control of the market and that further gains are likely as technically the pair is oversold so the bulls have more room to go.
NZD/JPY daily chart
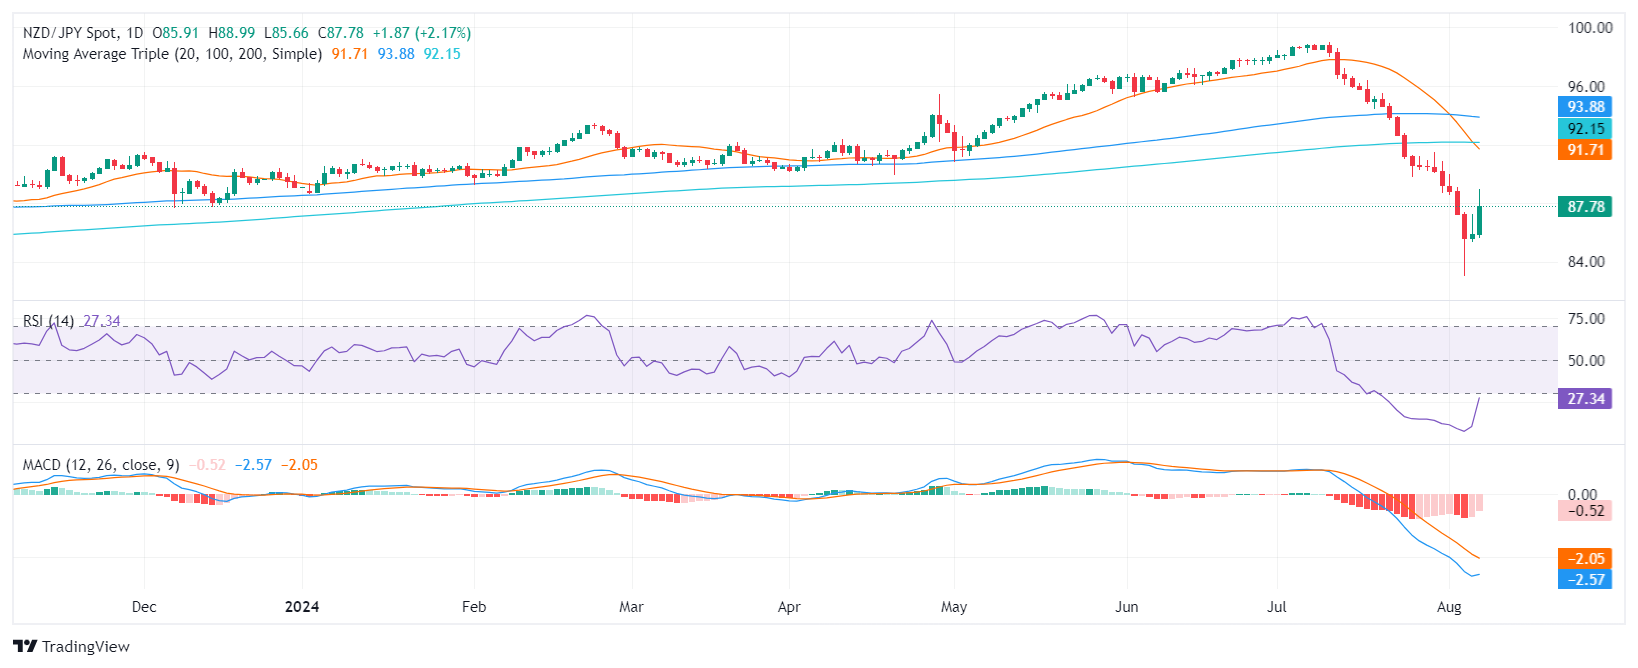
The NZD/JPY pair is consolidating above the 87.00 level, and the bulls are attempting to push the pair towards the 90.00 zone. If the bulls are successful, it could open the door to further gains towards the 91.00 zone. However, if the bears manage to push the pair below the 87.00 level, it could lead to a deeper correction to restest the 86.00 - 85.00 zone.
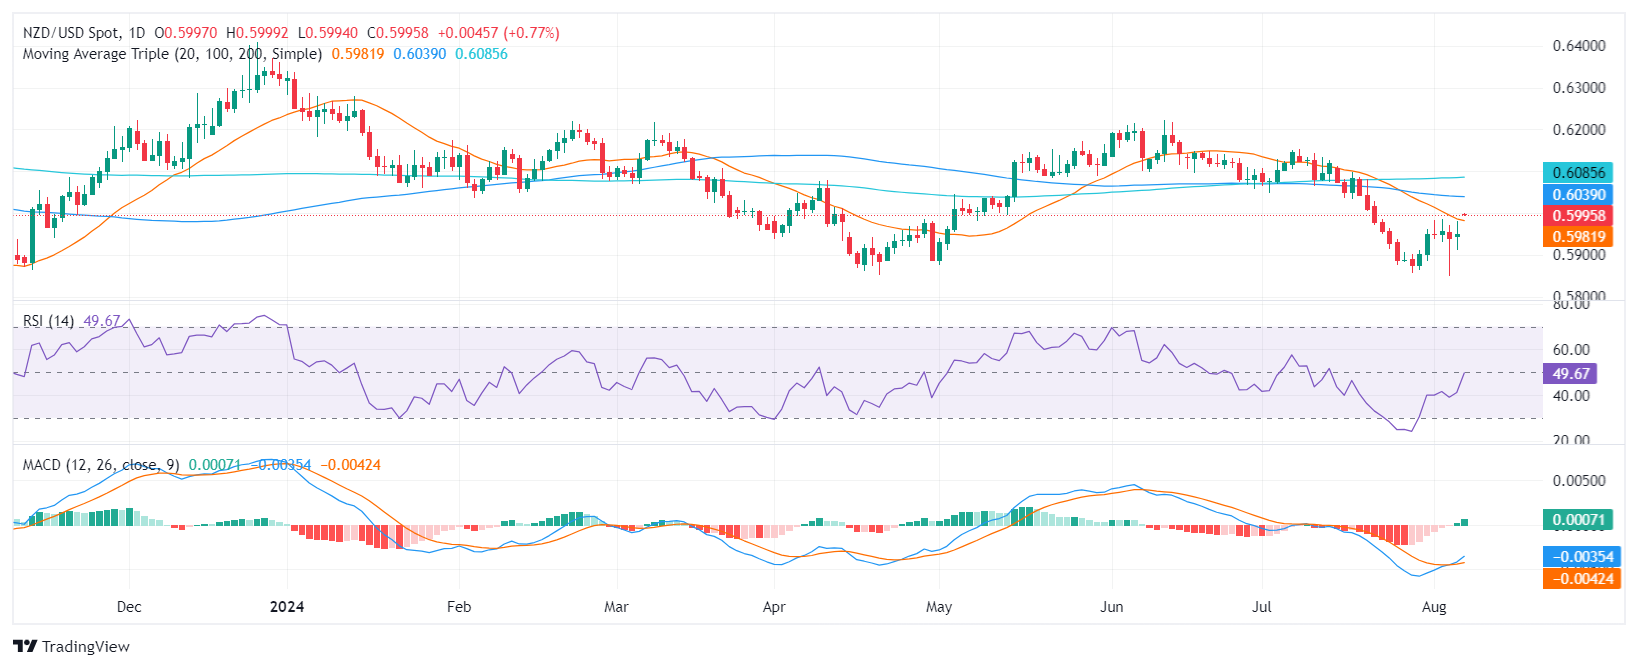
- NZD/USD extends uptrend, nearing the 0.6000 resistance level.
- RSI rises near 50, indicating a balanced market sentiment.
On Wednesday, the NZD/USD pair extended its gains rising to 0.5995 and approaching the 0.6000 level, which is a key psychological level. As the pair gained the 20-day Simple Moving Average (SMA) around 0.5980, the outlook is brightening.
The daily chart shows that the Relative Strength Index (RSI) is printing at 49, suggesting that the current uptrend is sustainable and could continue soon. The Moving Average Convergence Divergence (MACD) is also printing a rising green bar, which suggests the bulls are gathering momentum.
The NZD/USD pair is currently facing resistance at 0.6000, and a break above could open the door to a move toward 0.6050. Support is located at 0.5950 and a break below could lead to a move towards 0.5925-0.5900.
NZD/USD Daily chart
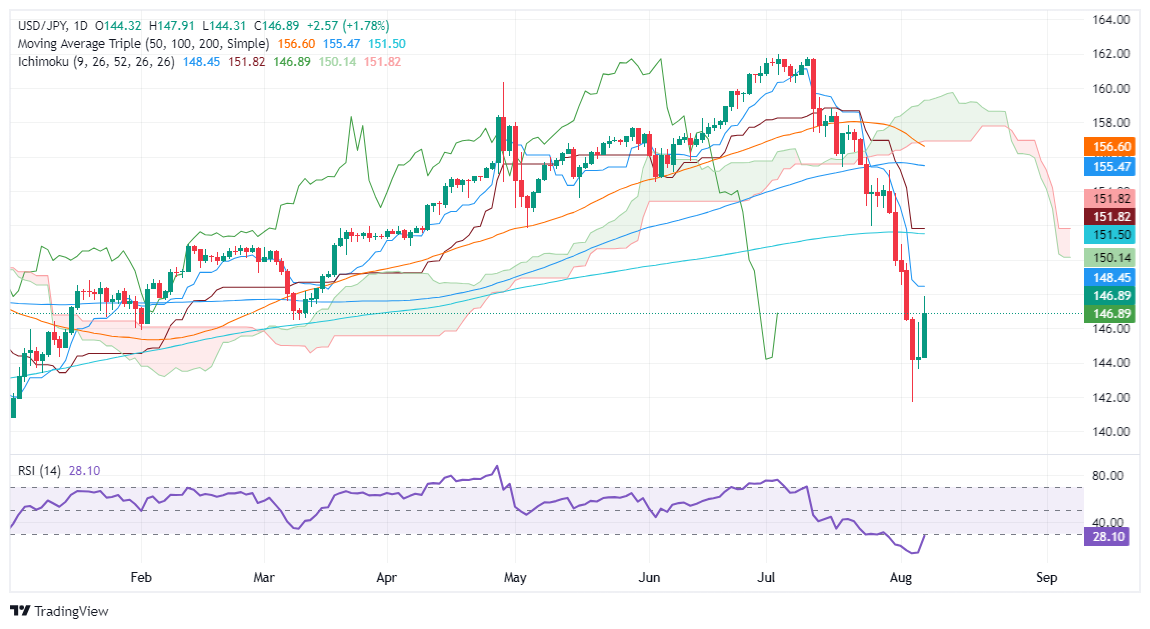
- USD/JPY surges 240+ pips, trading at 146.86, fueled by BoJ comments.
- Breaking 148.00 may target Tenkan-Sen at 148.45, then 149.00.
- Failure to hold 146.37 could lead to pullback to 146.00 and 145.00.
The USD/JPY soared late in the North American session, up by more than 1.50% or 240 plus pips, after a Bank of Japan official stated that they would not raise rates in an unstable market environment. Therefore, the pair rallied from daily lows of 144.28 and traded at 146.86 at the time of writing.
USD/JPY Price Forecast: Technical outlook
Although Tuesday’s rebound was short-lived, comments by BoJ officials spurred a U-turn on the USD/JPY, which posted a close below 144.20 on Tuesday, but it’s registering its largest gains since March 2023.
If USD/JPY extends its gains past the 148.00 figure, this could exacerbate a test of the Tenkan-Sen at 148.45. Further gains lie overhead at 149.00 before buyers can push the exchange rate toward the 200-day moving average (DMA) at 151.50.
Conversely, if sellers push the exchange rate below the August 6 high of 146.37, that will pave the way for a pullback. The next support will be the 146.00 mark, followed by the 145.00 figure. Further losses lie underneath at the August 6 low of 143.61.
USD/JPY Price Action – Daily Chart
Japanese Yen FAQs
The Japanese Yen (JPY) is one of the world’s most traded currencies. Its value is broadly determined by the performance of the Japanese economy, but more specifically by the Bank of Japan’s policy, the differential between Japanese and US bond yields, or risk sentiment among traders, among other factors.
One of the Bank of Japan’s mandates is currency control, so its moves are key for the Yen. The BoJ has directly intervened in currency markets sometimes, generally to lower the value of the Yen, although it refrains from doing it often due to political concerns of its main trading partners. The current BoJ ultra-loose monetary policy, based on massive stimulus to the economy, has caused the Yen to depreciate against its main currency peers. This process has exacerbated more recently due to an increasing policy divergence between the Bank of Japan and other main central banks, which have opted to increase interest rates sharply to fight decades-high levels of inflation.
The BoJ’s stance of sticking to ultra-loose monetary policy has led to a widening policy divergence with other central banks, particularly with the US Federal Reserve. This supports a widening of the differential between the 10-year US and Japanese bonds, which favors the US Dollar against the Japanese Yen.
The Japanese Yen is often seen as a safe-haven investment. This means that in times of market stress, investors are more likely to put their money in the Japanese currency due to its supposed reliability and stability. Turbulent times are likely to strengthen the Yen’s value against other currencies seen as more risky to invest in.
- Gold retreats beneath $2,400 as US bond yields rise.
- Israel braces for potential Hamas retaliation, elevating regional tensions.
- Asian central banks, including the People's Bank of China, hold off on physical Gold purchases.
Gold price retreats below $2,400 and erases previous gains on Wednesday late in the North American session, despite rising geopolitical tensions in the Middle East and expectations for a looser monetary policy by the Federal Reserve (Fed). The XAU/USD trades at $2,385, down 0.06%.
Geopolitical tensions remain elevated as Israel awaits Hamas retaliation due to the assassination of its leader, Ismail Haniyeh. US intelligence suggests the response could be delayed until late Thursday or Friday. Meanwhile, Egypt instructed all its airlines to avoid Iranian air space for a three-hour period on Thursday due to tension between Israel and Iran.
Given the backdrop, Gold’s losses were tempered by mood. Nevertheless, the rise in US Treasury bond yields weighed on the non-yielding metal and boosted the Greenback.
The US 10-year Treasury note is up seven basis points (bps) and yields 3.968%. The US Dollar Index (DXY), which tracks the performance of the American currency against the other six, aims up 0.27% at 103.20.
A scarce economic docket in the US keeps investors focused on Initial Jobless Claims data, revealed on Thursday. TD Securities analysts commented, “Jobless claims on Thursday is something markets will be looking for confirmation of slowing economic numbers, particularly employment.”
Meanwhile, major Asian central banks refrained from buying physical Gold. Reports from the World Gold Council hint that China didn’t buy the yellow metal for the third straight month.
Daily digest market movers: Gold price on the defensive amid risk-on mood
- Worries of a US recession had faded, shown by market mood. Despite this, traders expect the Federal Reserve (Fed) will cut interest rates by 50 basis points at the September meeting.
- Market players found some relief following the ISM Services PMI release, which revealed the economy continues to expand at a healthier pace. However, all eyes are at Initial Jobless Claims for the week ending August 3.
- Initial Jobless Claims are expected to dip from 249K to 240K, according to estimates.
- Richmond Fed President Thomas Barkin will hit the wires on Thursday.
- The Fed decided to hold rates unchanged last week but indicated that favorable data on inflation and further weakening in the labor market could prompt action.
- The CME FedWatch Tool shows the odds of a 50-basis-point interest rate cut by the Fed at the September meeting at 63.5%, down from 68% a day ago.
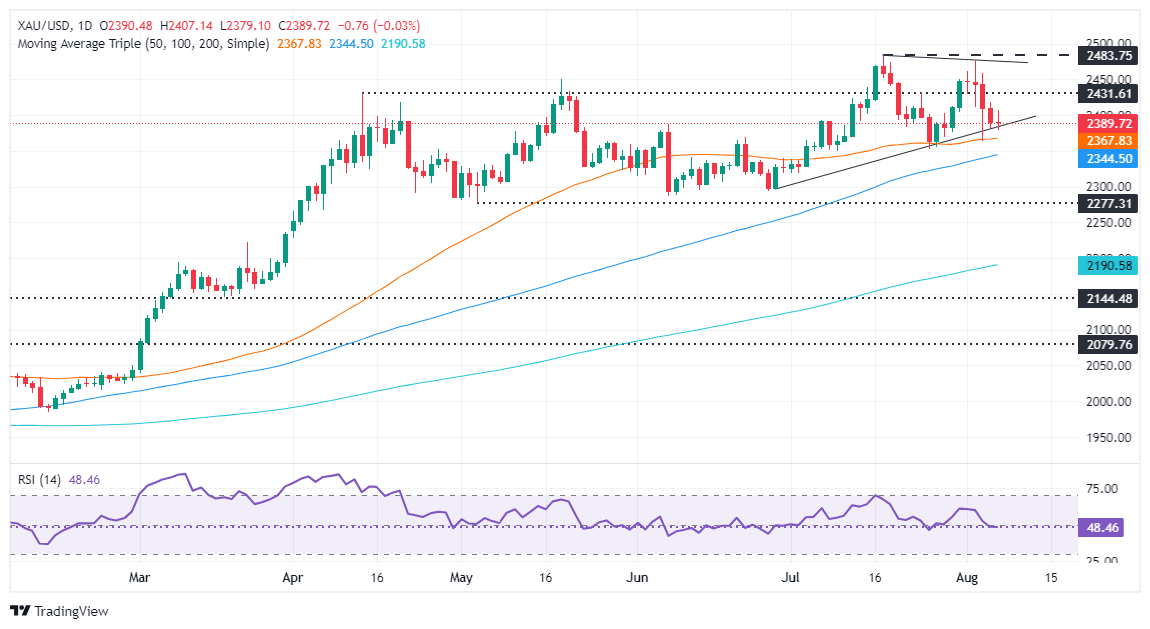
Technical analysis: Gold price looms around $2,390
Gold prices remain consolidated shy of $2,400, which could pave the way for testing the $2,300 mark in the near term. Momentum is flat, an indication that neither buyers nor sellers are in charge, based on the Relative Strength Index (RSI) that is meandering around the neutral level.
If XAU/USD continues to weaken, the next support would be the 50-day Simple Moving Average (SMA) at $2,367, ahead of the 100-day SMA at $2,344. This would be followed by a support trendline around $2,316. Once cleared, the next support would be $2,277, the May 3 low.
Conversely, if buyers reclaim $2,400, the next resistance would be the psychological $2,450 mark. A breach of the latter will expose the August 2 peak at $2,477. Followed by the all-time high at $2,483 ahead of $2,500.
Gold FAQs
Gold has played a key role in human’s history as it has been widely used as a store of value and medium of exchange. Currently, apart from its shine and usage for jewelry, the precious metal is widely seen as a safe-haven asset, meaning that it is considered a good investment during turbulent times. Gold is also widely seen as a hedge against inflation and against depreciating currencies as it doesn’t rely on any specific issuer or government.
Central banks are the biggest Gold holders. In their aim to support their currencies in turbulent times, central banks tend to diversify their reserves and buy Gold to improve the perceived strength of the economy and the currency. High Gold reserves can be a source of trust for a country’s solvency. Central banks added 1,136 tonnes of Gold worth around $70 billion to their reserves in 2022, according to data from the World Gold Council. This is the highest yearly purchase since records began. Central banks from emerging economies such as China, India and Turkey are quickly increasing their Gold reserves.
Gold has an inverse correlation with the US Dollar and US Treasuries, which are both major reserve and safe-haven assets. When the Dollar depreciates, Gold tends to rise, enabling investors and central banks to diversify their assets in turbulent times. Gold is also inversely correlated with risk assets. A rally in the stock market tends to weaken Gold price, while sell-offs in riskier markets tend to favor the precious metal.
The price can move due to a wide range of factors. Geopolitical instability or fears of a deep recession can quickly make Gold price escalate due to its safe-haven status. As a yield-less asset, Gold tends to rise with lower interest rates, while higher cost of money usually weighs down on the yellow metal. Still, most moves depend on how the US Dollar (USD) behaves as the asset is priced in dollars (XAU/USD). A strong Dollar tends to keep the price of Gold controlled, whereas a weaker Dollar is likely to push Gold prices up.
- The AUD/JPY bulls have pushed the pair higher, aiming to close the bullish engulfing pattern higher.
- The pair extended its gains but faced resistance at 96.50.
- The RSI and MACD indicate bullish momentum is building.
On Wednesday's session, the AUD/JPY pair rose by 1.80% to 95.90 continuing the upward momentum after the trend reversal of early August. The pair has extended its gains and now faces resistance at 96.50. However, the pair seems to have entered a consolidation period, and the bears remain in control.
The Relative Strength Index (RSI) is currently at 18, indicating an oversold condition. The Moving Average Convergence Divergence (MACD) is showing decreasing red bars, and the recovery of the RSI indicates a loss of bearish momentum.
AUD/JPY daily chart
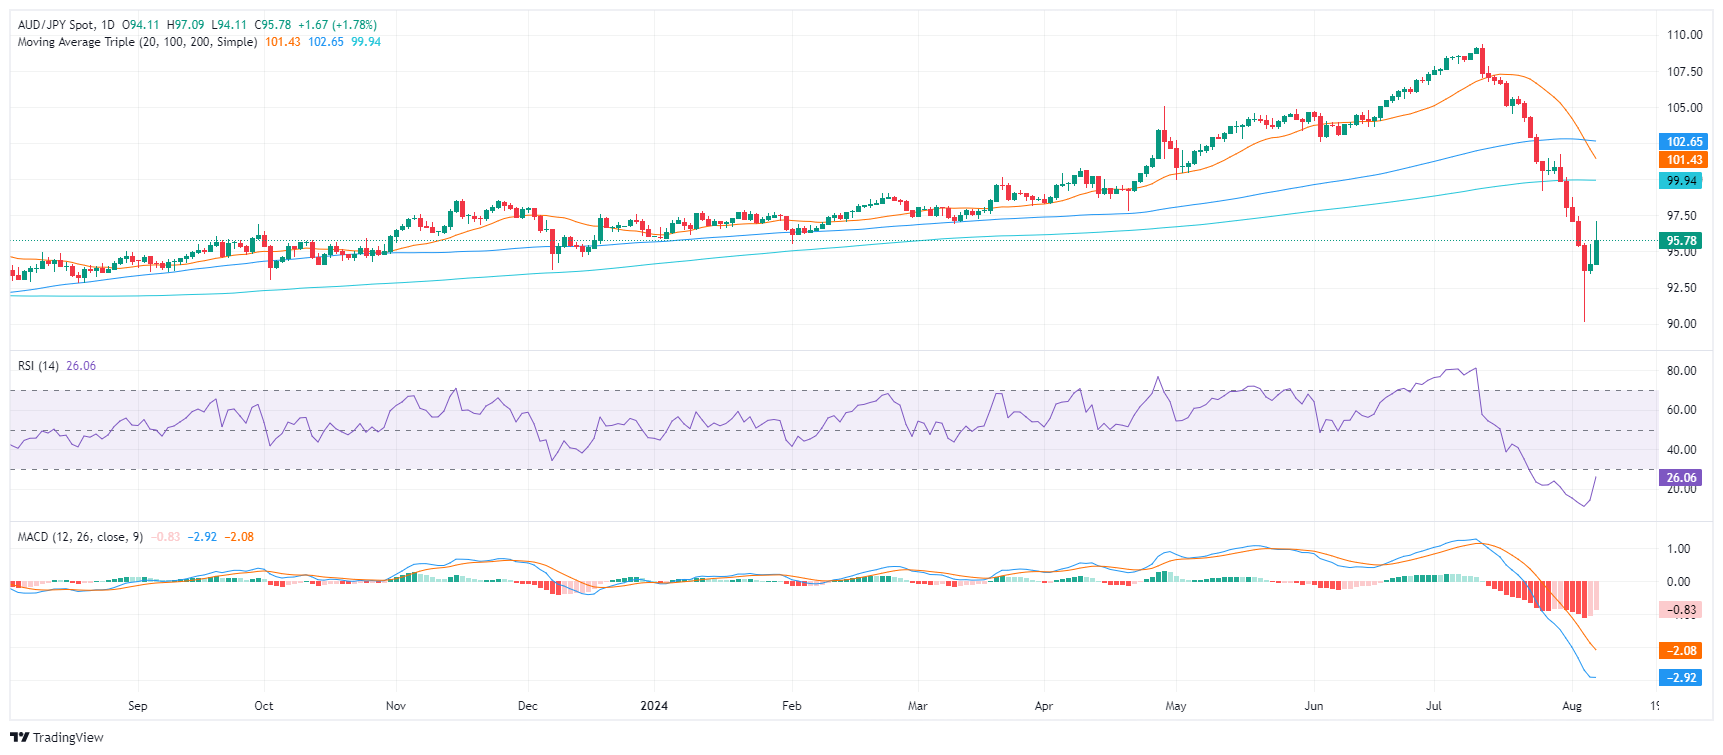
The AUD/JPY pair is currently trading below its 20,100, and 200-day Simple Moving Averages (SMA), which confirms an overall bearish outlook. A break below the 94.60 level could open the door to a further decline, with the next major support level at 94.00. On the upside, the pair faces resistance at 96.00 - 96.50. A break above might improve somewhat the negative outlook.
- AUD extends gains after RBA’s hawkish hold.
- Governor Bullock affirmed no immediate need for rate cuts.
- Investors digest Trade Balance data from China.
The AUD/USD pair is currently trading around 0.6555, up by 0.50% on Wednesday. The Australian Dollar continues to gain strength from the Reserve Bank of Australia (RBA) holding rates steady on Tuesday. Governor Bullock maintained that there is no pressing need to cut rates, securing the Australian Dollar's position.
Due to the mixed Australian economic outlook and the RBA’s hawkish stance, markets are now pricing just 25 bps of easing in 2024.
Daily digest market movers: AUD holds firm following RBA's decision
- The Reserve Bank of Australia decisively held rates at 4.35%, reinforcing that "the Board is not ruling anything in or out.” The RBA also underlined the need for vigilance toward upside risks to inflation.
- The updated macro forecasts anticipate longer-lasting inflation, with trimmed mean and headline CPI inflation predicted to hit the midpoint of the 2-3% band by December 2026 as opposed to the June 2026 estimate from the May forecasts. Markets have reacted swiftly, now pricing in only 25 bps of easing by year-end.
- Governor Bullock clarified that "the Board did consider a rate rise" and that rate cuts are "not on the agenda in the near term." She added that expectations for rate cuts are "a little ahead of themselves."
- On the data front, China's July Trade Balance, in terms of Chinese Yuan, was CNY601.98 billion, down from June's CNY703.77 billion. The country’s imports rebounded by 6.6% YoY in July from -0.6% recorded in June, while exports rose by 6.5% YoY vs. 10.7% seen in June.
- It's important to note that China is an important trade partner from Australia, and the Aussie is sensitive to Chinese data.
AUD/USD technical analysis: Bulls step in as selling pressure decelerates
The AUD/USD pair has been bearish over the past sessions, but bears seem to be taking a breather. The most immediate support and resistance seem to be around the 0.6480 and 0.6570 levels, respectively.
The Relative Strength Index (RSI) is hovering around the neutral area of the scale after hitting oversold terrain in the last sessions. However, the general decrease in value suggests a downtrend. Similarly, the Moving Average Convergence Divergence (MACD) indicator presents a series of diminishing red bars, indicating diminishing, but bearish momentum lining up with the bearish price action on the chart.
Australian Dollar FAQs
One of the most significant factors for the Australian Dollar (AUD) is the level of interest rates set by the Reserve Bank of Australia (RBA). Because Australia is a resource-rich country another key driver is the price of its biggest export, Iron Ore. The health of the Chinese economy, its largest trading partner, is a factor, as well as inflation in Australia, its growth rate and Trade Balance. Market sentiment – whether investors are taking on more risky assets (risk-on) or seeking safe-havens (risk-off) – is also a factor, with risk-on positive for AUD.
The Reserve Bank of Australia (RBA) influences the Australian Dollar (AUD) by setting the level of interest rates that Australian banks can lend to each other. This influences the level of interest rates in the economy as a whole. The main goal of the RBA is to maintain a stable inflation rate of 2-3% by adjusting interest rates up or down. Relatively high interest rates compared to other major central banks support the AUD, and the opposite for relatively low. The RBA can also use quantitative easing and tightening to influence credit conditions, with the former AUD-negative and the latter AUD-positive.
China is Australia’s largest trading partner so the health of the Chinese economy is a major influence on the value of the Australian Dollar (AUD). When the Chinese economy is doing well it purchases more raw materials, goods and services from Australia, lifting demand for the AUD, and pushing up its value. The opposite is the case when the Chinese economy is not growing as fast as expected. Positive or negative surprises in Chinese growth data, therefore, often have a direct impact on the Australian Dollar and its pairs.
Iron Ore is Australia’s largest export, accounting for $118 billion a year according to data from 2021, with China as its primary destination. The price of Iron Ore, therefore, can be a driver of the Australian Dollar. Generally, if the price of Iron Ore rises, AUD also goes up, as aggregate demand for the currency increases. The opposite is the case if the price of Iron Ore falls. Higher Iron Ore prices also tend to result in a greater likelihood of a positive Trade Balance for Australia, which is also positive of the AUD.
The Trade Balance, which is the difference between what a country earns from its exports versus what it pays for its imports, is another factor that can influence the value of the Australian Dollar. If Australia produces highly sought after exports, then its currency will gain in value purely from the surplus demand created from foreign buyers seeking to purchase its exports versus what it spends to purchase imports. Therefore, a positive net Trade Balance strengthens the AUD, with the opposite effect if the Trade Balance is negative.
The Greenback extended its weekly rebound mainly on the back of the strong resumption of selling pressure in the Japanese yen. In the meantime, bets for a half-point rate cut in September remained firm.
Here is what you need to know on Thursday, August 8:
The USD Index (DXY) added to Tuesday’s advance north of the 103.00 barrier, helped by the weaker Yen and higher US yields. Initial Jobless Claims take centre stage on August 8, seconded by Wholesale Inventories and the speech by T. Barkin (Richmond).
EUR/USD alternated gains with losses around 1.0930 following Tuesday’s marked knee-jerk. There are no scheduled releases on the euro docket on August 8.
GBP/USD managed to reverse two straight sessions of losses, regaining the 1.2700 hurdle and beyond despite the Dollar’s gains. The RICS House Price Balance is only due on August 8.
USD/JPY sharply advanced to weekly highs past the 147.00 hurdle, building on Tuesday’s acceptable gains. Bank Lending figures, weekly Foreign Bond Investment, the Eco Watchers Survey, and the BoJ Summary of Opinions are all due on August 8.
Further gains saw AUD/USD climb to multi-day tops near 0.6575, adding to the previous day’s advance. On August 8, the NAB Business Confidence will be unveiled.
Rising geopolitical jitters and another drop in US weekly crude oil inventories sent WTI prices to weekly tops near the $76.00 mark per barrel.
Prices of Gold posted decent gains around the $2,400 mark per ounce troy, leaving behind four consecutive daily declines. Silver, in the meantime, hovered around the $27.00 region per ounce, barely changing from the previous day’s close.
- The Canadian Dollar rose against key counterparts in the middle of the week.
- CAD climb comes despite pullback in Canadian Ivey PMIs.
- Canadian labor figures loom over the horizon on Friday.
The Canadian Dollar (CAD) was bolstered into the high end on Wednesday as risk sentiment improved across the FX market. The CAD climbed against the Japanese Yen and the Swiss Franc as the two currencies battle for last place during the midweek market session.
The Canadian Dollar is on pace to be one of the best-performing currencies this week despite a notable lack of meaningful Canadian economic data on the release schedule. However, Friday will deliver the latest round of Canadian employment figures.
Daily digest market movers: CAD gets a leg up from weak Greenback
- The Canadian Dollar extended into a straight day of gains as the US Dollar eases.
- Market sentiment has recovered after a brief plunge late last week and into Monday.
- July’s Canadian Ivey Purchasing Manager’s Index (PMI) fell to a six-month low of 55.3 compared to the previous month’s 62.4.
- CAD traders look ahead to the Canadian Net Change in Employment and an update to the Canadian Unemployment Rate, both due on Friday.
- Markets have rotated back into the long wait for a September rate cut from the Federal Reserve (Fed).
- Rate markets are pricing in better-than-even odds of a double cut for 50 basis points on September 18, according to CME’s FedWatch Tool.
Canadian Dollar Price Forecast: USD/CAD headed for more declines as markets settle into risk-on flows
USD/CAD bids fell into the 50-day Exponential Moving Average (EMA) at 1.3730 on Wednesday, and the pair is down 1.6% from last week’s late peak that fell just shy of 1.3950. Market sentiment is expected to keep pushing market orders through the bullish side.
As long as bidders continue to ease back into the fold, the Canadian Dollar should continue to press higher against the Greenback and drag USD/CAD down towards the 200-day Exponential Moving Average (EMA) at 1.3620.
USD/CAD daily chart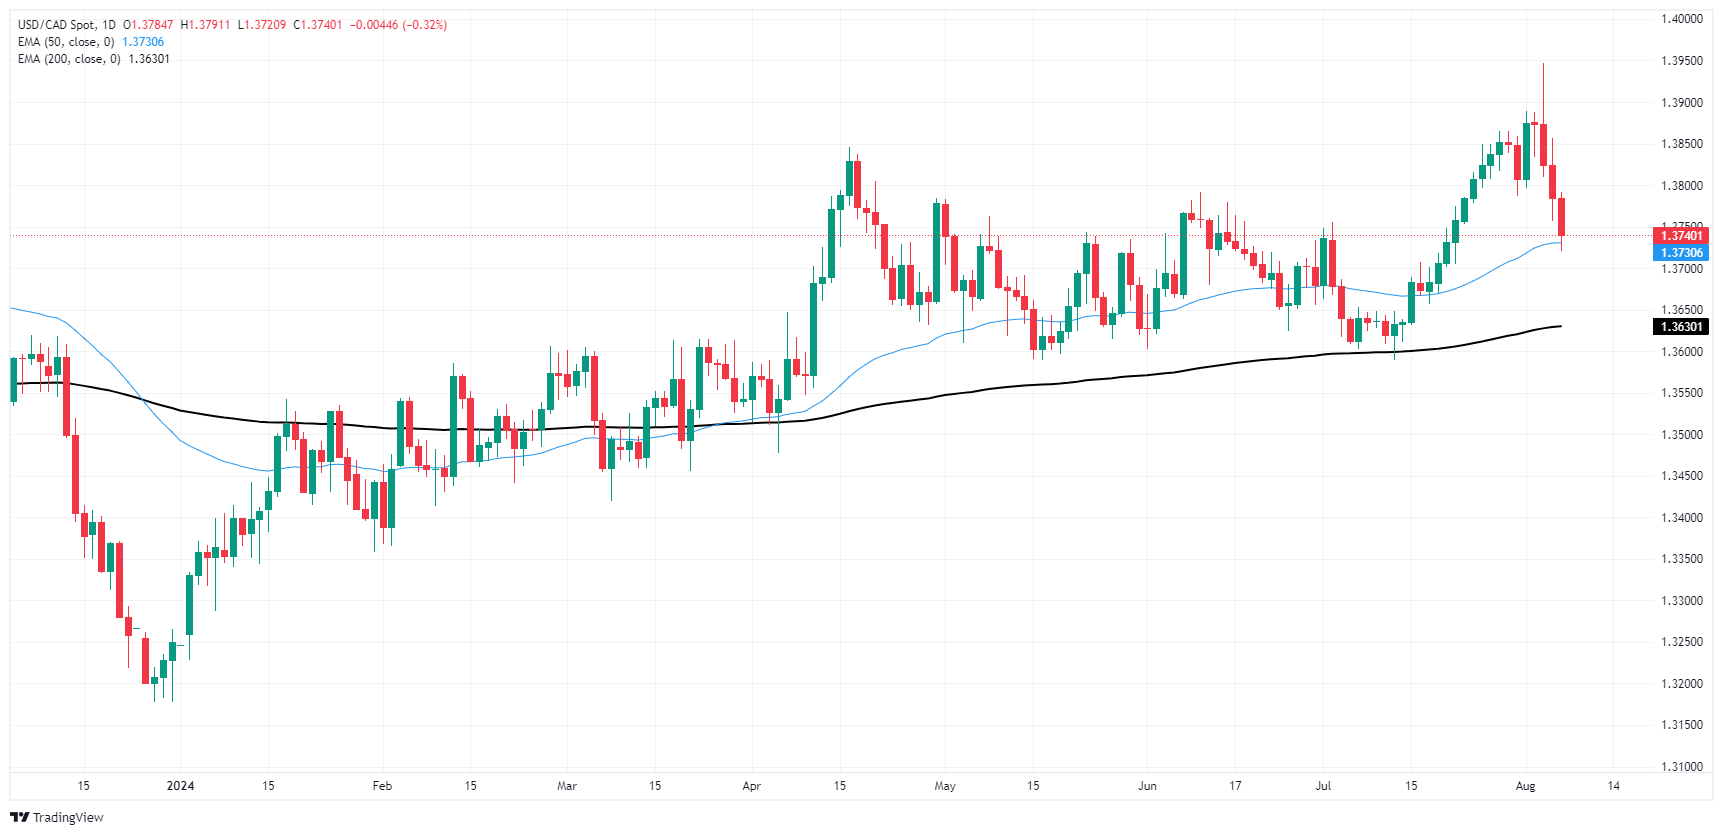
Canadian Dollar FAQs
The key factors driving the Canadian Dollar (CAD) are the level of interest rates set by the Bank of Canada (BoC), the price of Oil, Canada’s largest export, the health of its economy, inflation and the Trade Balance, which is the difference between the value of Canada’s exports versus its imports. Other factors include market sentiment – whether investors are taking on more risky assets (risk-on) or seeking safe-havens (risk-off) – with risk-on being CAD-positive. As its largest trading partner, the health of the US economy is also a key factor influencing the Canadian Dollar.
The Bank of Canada (BoC) has a significant influence on the Canadian Dollar by setting the level of interest rates that banks can lend to one another. This influences the level of interest rates for everyone. The main goal of the BoC is to maintain inflation at 1-3% by adjusting interest rates up or down. Relatively higher interest rates tend to be positive for the CAD. The Bank of Canada can also use quantitative easing and tightening to influence credit conditions, with the former CAD-negative and the latter CAD-positive.
The price of Oil is a key factor impacting the value of the Canadian Dollar. Petroleum is Canada’s biggest export, so Oil price tends to have an immediate impact on the CAD value. Generally, if Oil price rises CAD also goes up, as aggregate demand for the currency increases. The opposite is the case if the price of Oil falls. Higher Oil prices also tend to result in a greater likelihood of a positive Trade Balance, which is also supportive of the CAD.
While inflation had always traditionally been thought of as a negative factor for a currency since it lowers the value of money, the opposite has actually been the case in modern times with the relaxation of cross-border capital controls. Higher inflation tends to lead central banks to put up interest rates which attracts more capital inflows from global investors seeking a lucrative place to keep their money. This increases demand for the local currency, which in Canada’s case is the Canadian Dollar.
Macroeconomic data releases gauge the health of the economy and can have an impact on the Canadian Dollar. Indicators such as GDP, Manufacturing and Services PMIs, employment, and consumer sentiment surveys can all influence the direction of the CAD. A strong economy is good for the Canadian Dollar. Not only does it attract more foreign investment but it may encourage the Bank of Canada to put up interest rates, leading to a stronger currency. If economic data is weak, however, the CAD is likely to fall.
- Mexican Peso gains over 2%, trading at 19.18, ending a four-day decline against the Greenback.
- Mexico's economic data shows slowdown in automobile production and exports; traders focus on Thursday's inflation data and Banxico policy decision.
- Reuters poll: 12 of 22 economists expect Banxico to hold rates steady, while 10 anticipate a 25 bps cut.
- Rabobank predicts Banxico will cut rates by 25 bps, with 50 bps of easing expected by year-end.
The Mexican Peso enjoys a healthy rally on Wednesday and snapped a four-day losing streak against the Greenback following Monday’s stock market massacre. Market players cheered words from Bank of Japan’s Deputy Governor Uchida, who said the BoJ would not raise rates if markets were unstable. This boosted the emerging market currency, which would be pressured as Thursday’s docket will be busy. The USD/MXN trades at 19.18 and plunges over 2%.
Sentiment improved after Uchida’s words, as reflected by Wall Street's rise between 0.65% and 1.62%. The US Dollar Index (DXY), which measures the buck’s performance against six currencies, edged higher by 0.26% to 103.19.
Mexico’s economic docket featured Automobile Production and Exports figures on Tuesday, with data showing a slowdown in both readings. Traders shrugged off the data, yet are preparing for Thursday’s docket, which will feature July inflation data and the Bank of Mexico (Banxico) monetary policy decision.
Regarding the latter, a Reuters poll showed that 12 of 22 economists expect the Bank of Mexico to hold rates unchanged, while 10 others expect a 25-basis-point (bps) rate cut.
Analysts at Rabobank expect Banxico to lower rates by 25 bps on a 3-2 split vote and expect 50 bps of easing between now and year-end.
In the US, investors continued to price in over 100 bps of cuts by the US Federal Reserve (Fed) via the Chicago Board of Trade (CBOT) December fed funds rate futures contract. Despite that, US Treasury yields are recovering some ground, with the 10-year benchmark note rate up three and a half bps to 3.932%.
Daily digest market movers: Mexican Peso counterattacks, ahead of crucial data
- Mexico’s inflation is expected to aim up from 4.98% to 5.57% YoY, while monthly figures are expected to jump from 0.38% to 1.02% MoM.
- Core inflation is foreseen dipping from 4.13% to 4.02% YoY and rising from 0.22% to 0.29% MoM.
- On Friday, Mexico’s Industrial Production is expected to dip, which could put Banxico at a crossroads as headline inflation rises, while the economy stagnates
- Monday’s ISM Services PMI improvement from July faded fears that the US economy might hit a hard landing instead of a soft landing.
- The CME FedWatch Tool shows the odds of a 50-basis-point interest rate cut by the Fed at the September meeting at 63.5%, down from 68% a day ago.
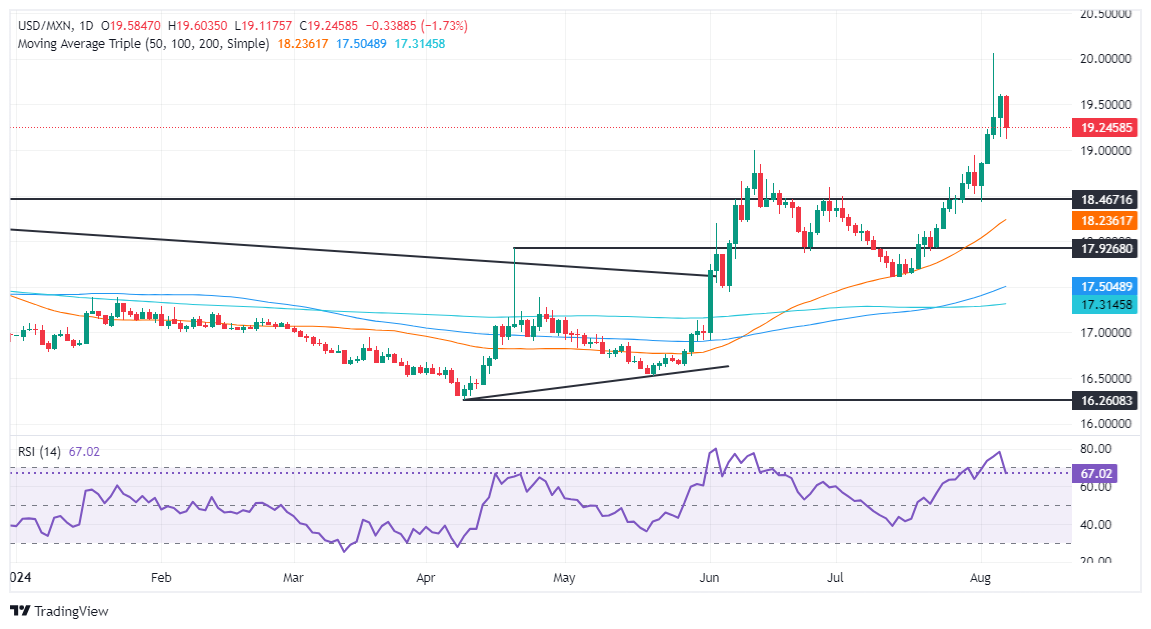
Technical analysis: Mexican Peso rebounds as USD/MXN slides beneath 19.30
Despite the ongoing correction during Wednesday's session, the USD/MXN rally remains in play. The Relative Strength Index (RSI) exited overbought conditions amid buyers' lack of effort to lift spot prices higher, yet they remain in charge and another attempt to test YTD high looms.
If USD/MXN edges above 19.50, the next stop would be 20.00. A decisive break will expose the YTD high at 20.22, followed by the 20.50 mark.
Conversely, if USD/MXN first support would be the 19.00 mark. Once cleared, this will expose the August 1 swing low of 18.42, followed by the 50-day Simple Moving Average (SMA) at 18.17.
Mexican Peso FAQs
The Mexican Peso (MXN) is the most traded currency among its Latin American peers. Its value is broadly determined by the performance of the Mexican economy, the country’s central bank’s policy, the amount of foreign investment in the country and even the levels of remittances sent by Mexicans who live abroad, particularly in the United States. Geopolitical trends can also move MXN: for example, the process of nearshoring – or the decision by some firms to relocate manufacturing capacity and supply chains closer to their home countries – is also seen as a catalyst for the Mexican currency as the country is considered a key manufacturing hub in the American continent. Another catalyst for MXN is Oil prices as Mexico is a key exporter of the commodity.
The main objective of Mexico’s central bank, also known as Banxico, is to maintain inflation at low and stable levels (at or close to its target of 3%, the midpoint in a tolerance band of between 2% and 4%). To this end, the bank sets an appropriate level of interest rates. When inflation is too high, Banxico will attempt to tame it by raising interest rates, making it more expensive for households and businesses to borrow money, thus cooling demand and the overall economy. Higher interest rates are generally positive for the Mexican Peso (MXN) as they lead to higher yields, making the country a more attractive place for investors. On the contrary, lower interest rates tend to weaken MXN.
Macroeconomic data releases are key to assess the state of the economy and can have an impact on the Mexican Peso (MXN) valuation. A strong Mexican economy, based on high economic growth, low unemployment and high confidence is good for MXN. Not only does it attract more foreign investment but it may encourage the Bank of Mexico (Banxico) to increase interest rates, particularly if this strength comes together with elevated inflation. However, if economic data is weak, MXN is likely to depreciate.
As an emerging-market currency, the Mexican Peso (MXN) tends to strive during risk-on periods, or when investors perceive that broader market risks are low and thus are eager to engage with investments that carry a higher risk. Conversely, MXN tends to weaken at times of market turbulence or economic uncertainty as investors tend to sell higher-risk assets and flee to the more-stable safe havens.
- Despite market concerns, the US economy continues to grow above trend.
- The market anticipates 100 bps of Fed easing by year's end.
- Wednesday won’t have any economic highlights, market sentiment to dictate the pace.
The US Dollar, measured by the DXY index, remained well-supported during Wednesday's session, driven primarily by selling pressure on the Japanese Yen following a cautious outlook by the Bank of Japan. The USD/JPY pair saw a significant 2% surge throughout the day, contributing to the DXY index's hold above the 103.00 point. While there won’t be any economic data highlights on Wednesday, caution and risk perception might dictate the pace of the USD.
While markets contended with potential implications of further easing from the Fed, the US economy continues to perform solidly. Growth remains above trend, suggesting a market caught up in overly aggressive easing forecasts.
Daily digest market movers: US economic performance calls into question market's aggressive easing bets
- The market remains mispriced on the extent of the Fed's easing, still fully pricing in 100 bps by year-end, a decrease from Monday's 125 bps expectations.
- The market now anticipates a near 80% likelihood of a 50 bps reduction in September, down from Monday's 90%
- Overall easing over the next 12 months is now expected between 175 to 200 bps, a reduction from the over 200 bps predicted on Monday
On the other hand, a severe US economic recession would need to materialize for the current easing path to remain feasible. Until more data is available, it remains challenging to counteract the prevailing dovish market narrative.
DXY technical outlook: Indications of improvement seen, bears take a breather
The DXY index's technical outlook is improving. Both the Relative Strength Index (RSI) and Moving Average Convergence Divergence (MACD) are currently in the red, with the RSI below the 50-point level but pointing upwards, and the MACD continuing to print lower red bars.
However, a firmly bearish outlook is confirmed by the index remaining below the 20, 100 and 200-day Simple Moving Averages (SMAs).
With this in mind, current support stands at 103.00, 102.50 and 102.20 with resistance noted at 103.50 and 104.00.
US Dollar FAQs
The US Dollar (USD) is the official currency of the United States of America, and the ‘de facto’ currency of a significant number of other countries where it is found in circulation alongside local notes. It is the most heavily traded currency in the world, accounting for over 88% of all global foreign exchange turnover, or an average of $6.6 trillion in transactions per day, according to data from 2022. Following the second world war, the USD took over from the British Pound as the world’s reserve currency. For most of its history, the US Dollar was backed by Gold, until the Bretton Woods Agreement in 1971 when the Gold Standard went away.
The most important single factor impacting on the value of the US Dollar is monetary policy, which is shaped by the Federal Reserve (Fed). The Fed has two mandates: to achieve price stability (control inflation) and foster full employment. Its primary tool to achieve these two goals is by adjusting interest rates. When prices are rising too quickly and inflation is above the Fed’s 2% target, the Fed will raise rates, which helps the USD value. When inflation falls below 2% or the Unemployment Rate is too high, the Fed may lower interest rates, which weighs on the Greenback.
In extreme situations, the Federal Reserve can also print more Dollars and enact quantitative easing (QE). QE is the process by which the Fed substantially increases the flow of credit in a stuck financial system. It is a non-standard policy measure used when credit has dried up because banks will not lend to each other (out of the fear of counterparty default). It is a last resort when simply lowering interest rates is unlikely to achieve the necessary result. It was the Fed’s weapon of choice to combat the credit crunch that occurred during the Great Financial Crisis in 2008. It involves the Fed printing more Dollars and using them to buy US government bonds predominantly from financial institutions. QE usually leads to a weaker US Dollar.
Quantitative tightening (QT) is the reverse process whereby the Federal Reserve stops buying bonds from financial institutions and does not reinvest the principal from the bonds it holds maturing in new purchases. It is usually positive for the US Dollar.
- Dow Jones extends into a second day of recovery after recent backslide.
- Markets have shrugged off recession fears, back to waiting for Fed cuts.
- Rate markets pricing in a double cut in September, two more to follow in 2024.
The Dow Jones Industrial Average (DJIA) Found further room on the high end on Wednesday as market sentiment recovers its footing and equities begin the slow climb back up after a three-day bearish plunge that kicked off last week. Indexes still remain on the low end of recent price action, but bullish recovery flows are dragging the Dow Jones back up above 39,200.00 on Wednesday.
Investors briefly became concerned about the very real chance of a broad recession within the US economy, sparked by a downside tilt to the latest batch of growth and labor figures. With the latest rough patch in the rearview mirror, markets are back to keeping hopes pinned for a September rate cut from the Federal Reserve (Fed).
At the current cut, rate traders are pricing in roughly two-to-one odds of a 50-basis-point rate trim from the Fed on September 18, with a further two cuts expected through the rest of 2024. According to the CME’s FedWatch Tool, rate probabilities see an 83% chance of the Fed’s benchmark fed funds rate hitting 425-450 basis points by the end of December.
Dow Jones news
Nearly all of the Dow Jones’ listed equities are in the green on Wednesday, with most losses concentrated in Amgen Inc. (AMGN). Amgen fell -5.33% after reporting a mixed Q2 financial outlook, but investors are hopeful that Amgen’s weight loss drug competitor to other dominant names in the burgeoning field will help bolster the drugmaker in the future.
Apple Inc. (AAPL) is on the high end for Wednesday, climbing 2.4% to $212.22 per share as the tech company’s stock recovers from a recent downside push after it was revealed that investing giant Warren Buffett had sold off shares in Apple, dragging Apple’s share of Berkshire Hathaway’s total portfolio down to 30% in Q2 2024 from 49% in Q4 2023.
Dow Jones price forecast
The Dow Jones is on pace to extend a bullish recovery from a near-term floor just below 38,500.00. Despite a three-day plunge that dragged the major index down over 6.5%, bids are stepping back into the chart to halt declines and price action continues to hold on the north side of the 200-day Exponential Moving Average (EMA) at 38,092.73.
The Dow Jones is still on the low side of all-time highs set at 41,371.38 in July, but bulls are dragging prices back towards the 50-day EMA at 39,606.00.
Dow Jones daily chart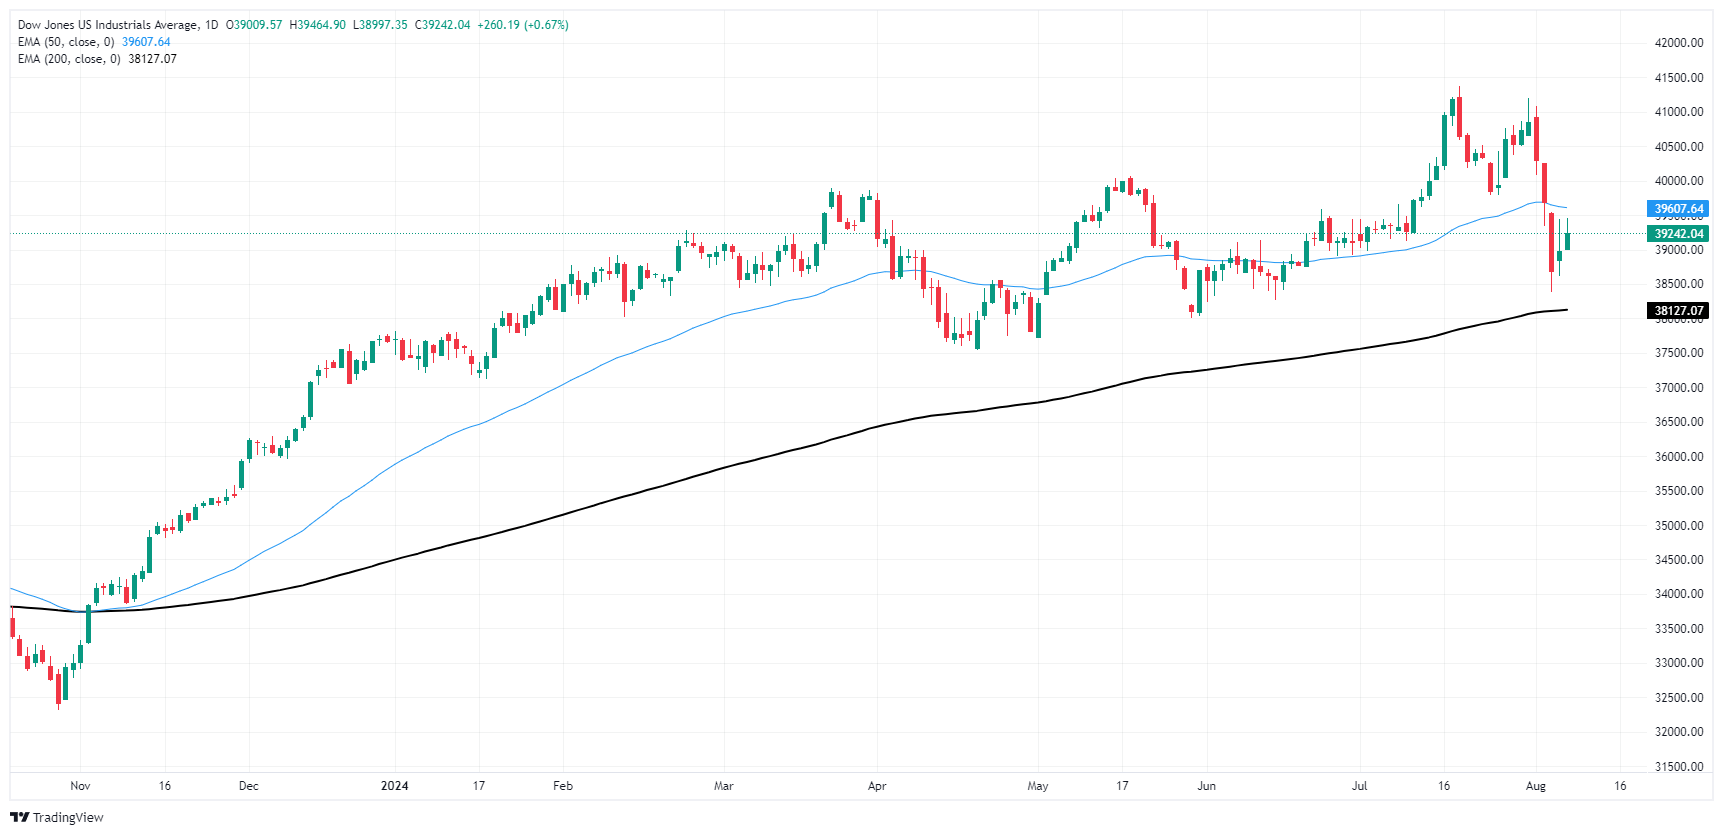
Dow Jones FAQs
The Dow Jones Industrial Average, one of the oldest stock market indices in the world, is compiled of the 30 most traded stocks in the US. The index is price-weighted rather than weighted by capitalization. It is calculated by summing the prices of the constituent stocks and dividing them by a factor, currently 0.152. The index was founded by Charles Dow, who also founded the Wall Street Journal. In later years it has been criticized for not being broadly representative enough because it only tracks 30 conglomerates, unlike broader indices such as the S&P 500.
Many different factors drive the Dow Jones Industrial Average (DJIA). The aggregate performance of the component companies revealed in quarterly company earnings reports is the main one. US and global macroeconomic data also contributes as it impacts on investor sentiment. The level of interest rates, set by the Federal Reserve (Fed), also influences the DJIA as it affects the cost of credit, on which many corporations are heavily reliant. Therefore, inflation can be a major driver as well as other metrics which impact the Fed decisions.
Dow Theory is a method for identifying the primary trend of the stock market developed by Charles Dow. A key step is to compare the direction of the Dow Jones Industrial Average (DJIA) and the Dow Jones Transportation Average (DJTA) and only follow trends where both are moving in the same direction. Volume is a confirmatory criteria. The theory uses elements of peak and trough analysis. Dow’s theory posits three trend phases: accumulation, when smart money starts buying or selling; public participation, when the wider public joins in; and distribution, when the smart money exits.
There are a number of ways to trade the DJIA. One is to use ETFs which allow investors to trade the DJIA as a single security, rather than having to buy shares in all 30 constituent companies. A leading example is the SPDR Dow Jones Industrial Average ETF (DIA). DJIA futures contracts enable traders to speculate on the future value of the index and Options provide the right, but not the obligation, to buy or sell the index at a predetermined price in the future. Mutual funds enable investors to buy a share of a diversified portfolio of DJIA stocks thus providing exposure to the overall index.
- GBP/USD climbs above 1.2700 as risk sentiment improves.
- Technical outlook: Neutral to bearish; key support at August 6 low (1.2672) and 200-DMA (1.2651).
- For bullish momentum, GBP/USD needs to hold above 1.2700 and aim for 50-DMA at 1.2785 and the 1.2800 mark.
The Pound Sterling bounced off daily/weekly lows and rose above the 1.2700 figure on Wednesday as risk appetite improved after a Bank of Japan (BoJ) official commented the BoJ wouldn’t raise rates amid market instability. Therefore, the GBP/USD trades at 1.2720 after touching a low of 1.2680.
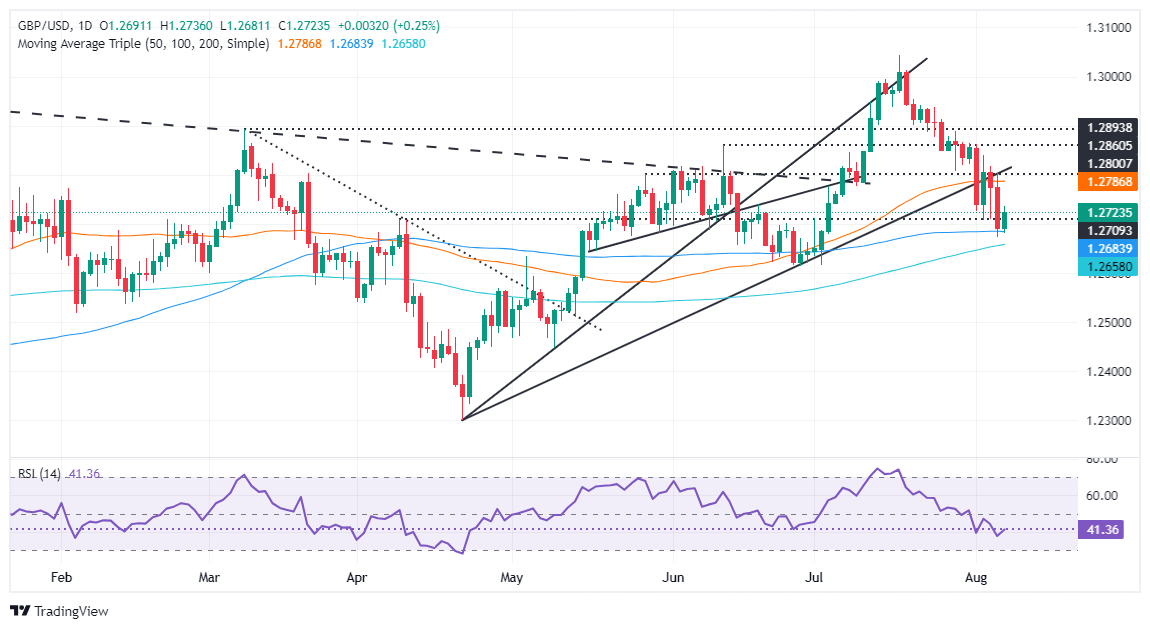
GBP/USD Price Forecast: Technical outlook
The GBP/USD is neutral to bearishly biased after diving below the 50-day moving average (DMA) at 1.2785. Sellers piercing of the latter sounded buyers’ alarms, which entered below the 1.2700 mark, yet remained in the backfoot as the Greenback strengthened.
The August 6th low at 1.2672 could be tested if GBP/USD slips under 1.2700, and losses could be deeper if it slumps beneath the 200-DMA at 1.2651.
Conversely, if buyers keep the GBP/USD above 1.2700 and lift the spot price toward the 50-DMA, that could exacerbate a test of the 1.2800 mark.
GBP/USD Price Action – Daily Chart
British Pound PRICE Today
The table below shows the percentage change of British Pound (GBP) against listed major currencies today. British Pound was the strongest against the Japanese Yen.
| USD | EUR | GBP | JPY | CAD | AUD | NZD | CHF | |
|---|---|---|---|---|---|---|---|---|
| USD | -0.02% | -0.25% | 2.21% | -0.45% | -0.62% | -1.21% | 1.68% | |
| EUR | 0.02% | -0.24% | 2.24% | -0.44% | -0.63% | -1.18% | 1.72% | |
| GBP | 0.25% | 0.24% | 2.46% | -0.20% | -0.40% | -0.90% | 1.95% | |
| JPY | -2.21% | -2.24% | -2.46% | -2.59% | -2.79% | -3.31% | -0.52% | |
| CAD | 0.45% | 0.44% | 0.20% | 2.59% | -0.18% | -0.72% | 2.15% | |
| AUD | 0.62% | 0.63% | 0.40% | 2.79% | 0.18% | -0.50% | 2.36% | |
| NZD | 1.21% | 1.18% | 0.90% | 3.31% | 0.72% | 0.50% | 2.87% | |
| CHF | -1.68% | -1.72% | -1.95% | 0.52% | -2.15% | -2.36% | -2.87% |
The heat map shows percentage changes of major currencies against each other. The base currency is picked from the left column, while the quote currency is picked from the top row. For example, if you pick the British Pound from the left column and move along the horizontal line to the US Dollar, the percentage change displayed in the box will represent GBP (base)/USD (quote).
Commodity Trading Advisors (CTAs) are finally returning to the offer in Gold markets, TDS senior commodity strategist Daniel Ghali notes.
Asia remains on a buyer's strike
“We expect systematic trend followers to shed up to -15% of their max size in today's session alone, which should weigh on prices despite the overnight rally in the Yellow Metal. This is partly related to the start of a potential round of deleveraging, but may be further exacerbated by deteriorating trend signals.”
“CTA positioning in the Yellow Metal is now significantly vulnerable to a large downtape, with algos potentially selling up to 60% of their current long position over the coming week in this scenario.”
“At the same time, additional vulnerabilities from macro funds' positions, which we still estimate as not only bloated but likely tapped out, and Shanghai traders who have now returned to the offer despite the reversal in Asian currency markets. Asia remains on a buyer's strike. Overall, the set-up in Gold may result in substantial selling activity in a liquidity vacuum.”
Finally, signs of selling exhaustion are emerging in Copper markets, TDS senior commodity strategist Daniel Ghali notes.
Trend followers may be running out of dry-powder to sell
“We still expect CTA selling activity to weigh on the Red Metal in the imminent term, likely further weighing on prices even as macro funds have completely capitulated on their net length.”
“However, CTA trend followers may be running out of dry-powder to sell, barring a significant shift in the macroeconomic outlook, with the next threshold for large-scale selling activity necessitating a break below $8400/t.”
“This points to full-blown capitulation near current prices, but the set-up in aluminium markets is still the most promising, with extreme upside asymmetry for CTA positioning risks expected over the coming week.”
The overnight fall in the value of the JPY briefly left the CHF as the best performing G10 currency over the past five sessions this morning. In our view, this is not an accolade that the SNB will have welcomed, Rabobank’s senior FX strategist Jane Foley notes.
EUR/CHF to return to the 0.95 area
“We expect that the more settled market conditions of the past 36 hours or so will allow the CHF to continue to soften as some safe haven flows reverse. These factors suggests that the CHF is likely to continue finding good support from haven flows in the coming months. For much of the first half of this year, the CHF was in a weakening trend vs. the EUR.”
“The softer CHF will have been good news for Swiss exporters. Since very late May, the value of EUR/CHF has more or less reversed all of the move higher in the first 5 months of the year. EUR/CHF trended higher in late June, buy arguably the overall impact of the SNB’s June rate cut was limited by the ECB’s policy announcement in the same month.”
“As markets settle down after the market turmoil earlier this week, we expect EUR/CHF to return to the 0.95 area. However, despite the likelihood of another SNB rate cut in September, we expect that safe haven demand will prevent EUR/CHF from trending higher medium-term. We have adjusted our EUR/CHF forecasts and expect a trading band to centre around the 0.95 to 0.96 area in the coming 12 months.
The Pound Sterling (GBP) is tracking a little higher on the day, Scotiabank’s chief FX strategist Shaun Osborne notes.
GBP bulls are moving upwards towards 1.2775
“GBP is tracking a little higher on the day but, in the absence of any data or UK developments, minor gains appear to reflect some light accumulation of long GBP positions after spot stabilized around the 1.27 point.”
“The GBP is steadying but the broader, short-term downtrend from the mid-July peak above 1.30 remains intact. Sterling may be finding support around the high 1.26 zone where the 100– and 200- day MA signals are converging (1.2684 and 1.2658 respectively). Key resistance is distant at 1.2775/80.”
The Euro (EUR) is holding a relatively tight trading range in the low 1.09 area, Scotiabank’s chief FX strategist Shaun Osborne notes.
EUR needs a break above 1.0950 to continue upwards
“German data reflected some mixed news for the economy. June Industrial Production rose a stronger than expected 1.4% in the month (although May data was revised lower) while the trade balance slipped in June with exports contracting 3.4% in the month.”
“The EUR ignored the data and continues to look relatively comfortable with the support of somewhat narrower eurozone/US yield differentials.”
“Narrow range trading reflects a consolidation in spot trends after the EUR’s rapid gains last week from below 1.08. Underlying trends remain favourable (bullish) for the EUR for now but gains may have to resume fairly quickly (towards 1.0950+) to sustain the positive backdrop. Support is 1.0875.”
The Canadian Dollar (CAD) has made a bit more progress overnight to reflect the bid for risk assets amid calmer market conditions, Scotiabank’s chief FX strategist Shaun Osborne notes.
A break below 1.3725 is possible
“My fair value estimate continues to track a little lower than spot (1.3723) this morning, suggesting that there is some additional scope for the CAD to improve. For now, however, it is important to keep in mind that the primary driver of the CAD’s performance is the risk backdrop. The BoC releases the summary of its July policy decision discussion at 13.30ET.
“The report is unlikely to have any major impact on the CAD unless there are signs that the CAD’s recent slide registered any sort of concern for policymakers.”
“After the CAD’s relentless sell-off through late July, the rebound appears—for now—to be equally unrelenting on the charts. Daily and weekly price signals are shaping up bearishly for USD/CAD and short-term signals suggest more room for CAD gains, with spot edging below the 50% retracement of the 1.36/1.3950 rally (1.3768), towards 1.3675/1.3725. Resistance is 1.3790.”
- The US Dollar recovers for a second day in a row this week.
- The BoJ dropped mixed messages on its monetary policy.
- The US Dollar index pops above 103.00 and rallies higher on Wednesday.
The US Dollar (USD) recovers as all asset classes start to head back to more normal levels. Equities are behaving quite well and are stable, volatility is easing, and safe havens such as Japanese Yen (JPY) and Swiss Franc (CHF) are easing further against the Greenback. The Japanese Yen, sinking over 1.5% against the US Dollar, is the biggest contributor to the recovery of the US Dollar Index (DXY).
On the economic front, there is a very light day ahead, which should be beneficial for markets to continue the recovery path. In the interest rate space, the 10-year Note auction from the US treasury might draw the most attention, seeing it is a substantial benchmark rate. Late on Wednesday, the United States (US) Consumer Credit Change data for June will be released.
Daily digest market movers: Dollar gears up
- Traders must have raised their eyebrows in Asian hours when comments from Bank of Japan (BoJ) member Shinichi Uchida said that the BoJ would not raise rates if markets were unstable. This pushed the Yen down by 1% against the US Dollar in an initial reaction.
- At 11:00 GMT, the Mortgage Bankers Association has released its weekly Mortgage Application Index. The previous number was at -3.9%, with this week's number coming in positive at 6.9%
- At 17:00 GMT, the US Treasury will allocate a 10-year Note in the market. Previous interest was 4.276%, while the US 10-year note currently trades around 3.90%, a substantial discount.
- US Consumer Credit Change data for June is set to be released at 19:00 GMT, with expectations for a drop to $10 billion from $11.35 billion a month earlier.
- Equity markets are on a winning streak, with both the Japanese Nikkei and Topix indexes in the green. European equities are also doing great, on average up 1%, while the US futures are just shy of 1%.
- The CME Fedwatch Tool shows a 63.5% chance of a 50 basis points (bps) interest rate cut by the Federal Reserve (Fed) in September. Another 25 bps cut is expected in November by 55.5%, while a 17.5% chance for a 50 bps cut and 27.0% for no cut are being pencilled in for that meeting.
- The US 10-year benchmark rate trades at 3.93%, shooting higher for this week, as investors flee away from bonds and back into equities.
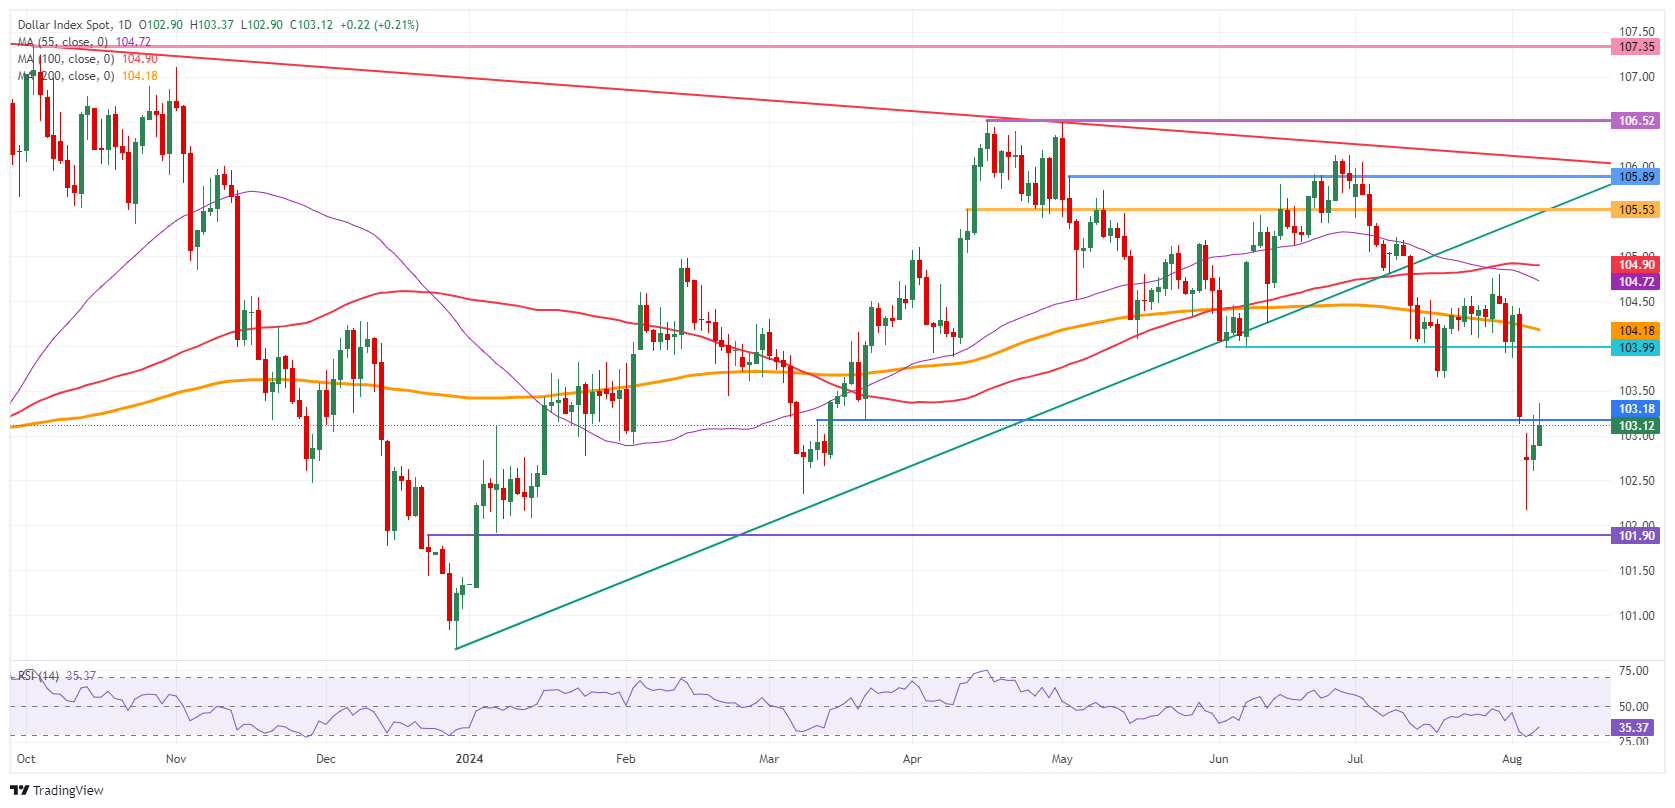
US Dollar Index Technical Analysis: The Greenback rolls on
The US Dollar Index (DXY) is continuing its recovery with some help from the Japanese Yen. TWhen looking at that specific currency cross (USD/JPY), it paints a clearly shows picture that the Yen has gained too much too quickly against the US Dollar. A full recline is not projected, though certainly more recovery could occur take place this week for the US Dollar, which would spill over into the DXY trading higher by Friday.
The three-tiered recovery is already in play, with the first resistance up at 103.18, a level held on Friday though snapped on Monday in the Asian hours, being tested on Wednesday. Once the DXY closes above that level, next up is 104.00, which was the support from June. If the DXY can make its way back above that level, the 200-day Simple Moving Average (SMA) at 104.22 is the next resistance level to look out for.
On the downside, the oversold Relative Strength Index (RSI) indicator in the daily chart should prevent the DXY from making more hefty losses. Support nearby is the March 8 low at 102.35. Once through there, pressure will start to build on 102.00 as a big psychological figure before testing 101.90, which was a pivotal level in December 2023 and January 2024.
US Dollar Index: Daily Chart
US Dollar FAQs
The US Dollar (USD) is the official currency of the United States of America, and the ‘de facto’ currency of a significant number of other countries where it is found in circulation alongside local notes. It is the most heavily traded currency in the world, accounting for over 88% of all global foreign exchange turnover, or an average of $6.6 trillion in transactions per day, according to data from 2022. Following the second world war, the USD took over from the British Pound as the world’s reserve currency. For most of its history, the US Dollar was backed by Gold, until the Bretton Woods Agreement in 1971 when the Gold Standard went away.
The most important single factor impacting on the value of the US Dollar is monetary policy, which is shaped by the Federal Reserve (Fed). The Fed has two mandates: to achieve price stability (control inflation) and foster full employment. Its primary tool to achieve these two goals is by adjusting interest rates. When prices are rising too quickly and inflation is above the Fed’s 2% target, the Fed will raise rates, which helps the USD value. When inflation falls below 2% or the Unemployment Rate is too high, the Fed may lower interest rates, which weighs on the Greenback.
In extreme situations, the Federal Reserve can also print more Dollars and enact quantitative easing (QE). QE is the process by which the Fed substantially increases the flow of credit in a stuck financial system. It is a non-standard policy measure used when credit has dried up because banks will not lend to each other (out of the fear of counterparty default). It is a last resort when simply lowering interest rates is unlikely to achieve the necessary result. It was the Fed’s weapon of choice to combat the credit crunch that occurred during the Great Financial Crisis in 2008. It involves the Fed printing more Dollars and using them to buy US government bonds predominantly from financial institutions. QE usually leads to a weaker US Dollar.
Quantitative tightening (QT) is the reverse process whereby the Federal Reserve stops buying bonds from financial institutions and does not reinvest the principal from the bonds it holds maturing in new purchases. It is usually positive for the US Dollar.
Right now, the market is pricing in around 5 rate cuts from Norges Bank over the next year. We think this is vastly overdone and see a clear upside to forward interest rates but as a consequence, also a clear downside to EUR/NOK, Nordea FX analysts note.
A clear upside to the current market pricing of rates
“While the drop in rates expectations abroad surely pulls the rate path from Norges Bank down in isolation, the deprecation of NOK more than compensate for this. The fact that NOK is currently some 4% per cent weaker than assumed by Norges Bank keeps the rate path more or less unchanged in total. It seems that the market is forgetting the weak NOK when they price in a total of 130bps cuts from Norges Bank the next year.”
“With growth picking up and inflation, while somewhat lower than expected still much higher than comfortable for Norges Bank, we just don’t see the need for Norges Bank to stimulate the economy much. At least not with NOK at this weak levels. The weakening of NOK we have witnessed lately will mean higher inflation 6-9 months out.”
“We therefore see a clear upside to the current market pricing of rates in Norway. This should in consequence also support the NOK going forward. With Norges Bank staying more hawkish than the market pricing suggest and with the Fed starting to gradually reduce rates from September, NOK should get support going forward. We see EUR/NOK at 11.50 by year end.”
New Zealand released jobs figures overnight, and the results were not as grim as consensus expected. Unemployment rose less than projected from a revised 4.4% to 4.6% in 2Q, thanks to a surprising rise in both employment and the participation rate. Private wages also rose marginally to 0.9% quarter-on-quarter, ING’s FX strategist Francesco Pesole notes.
NZD is the best-performing G10 currency
“The New Zealand Dollar (NZD) is the best-performing G10 currency this morning on the back of those figures, as markets trimmed bets on a rate cut next week, which was almost fully priced in and has a 50% implied probability.”
“We are now inclined to call for a hold by the Reserve Bank of New Zealand next week. The dovish repricing in the NZD curve is more a consequence of Fed rate expectations as the RBNZ dovish tilt and inflation/jobs data do not justify the 84bp of easing priced in by year-end. We suspect the RBNZ may want to wait for the Fed to move first, and if anything deliver a 50bp cut at the October meeting.”
“That said, next week looks close to a 50/50 call, and we think the meeting is accurately priced by the market. Either way, we remain bullish on NZD/USD on the back of a significantly improved rate differential and stabilisation in risk sentiment which should unlock upside into 0.61+ in the pair after the recent break above 0.60.”
The rebound in the EUR:USD 2-year swap spread may stall around -100bp. That would be entirely consistent with EUR/USD trading above 1.10 even when factoring in the softer risk sentiment (as measured by global stocks performance), ING’s FX strategist Francesco Pesole notes.
A break above 1.10 is the desired goal
“Markets may not take the hawkish re-adjustment in Fed expectations much further, while the same cannot be said about ECB pricing. The EUR OIS curve currently embeds 69bp of easing, which is largely a spillover from Fed pricing, as the latest inflation figures in the eurozone pointed to risks that the ECB may skip a cut in September.”
“Risks are undoubtedly skewed to 50bp as opposed to 75bp by the ECB in the three meetings until year-end. We expect EUR/USD to test 1.10 before the US CPI event next week.”
“We incidentally favour a continuation of the rebound in Norway's krone and Sweden's krona among other high-beta currencies. NOK has particularly taken a major hit from the equity selloff and has plenty of room to recover ahead of a Norges Bank meeting next week which may well fail to endorse the market’s dovish bets as policymakers may well focus on helping the battered currency.”
US and in particular European equities aren’t rebounding as fast as Japanese stocks, but global risk sentiment is indeed stabilising, which leaves room in FX to realign with the changes in rate spreads. The US Dollar (USD) is in a substantially weaker position than 10 days ago and is looking at an imminent decline against pro-cyclical currencies, ING’s FX strategist Francesco Pesole notes.
The USD is in a weaker position than 10 days ago
“From a purely macro angle, markets remain cautious about big risk-on rallies before the key US CPI risk event (next Wednesday) is cleared. That said, a stabilisation after the big correction around the weekend should be enough for most FX pairs to start reconnecting with rate spreads and fundamentals.”
“From this perspective, the dollar looks vulnerable. We believe markets may be reluctant to take the year-end Fed policy rate much above 4.50%; that’s because 100bp of easing is probably linked to US macro, with anything extra (which has now been priced out) linked to expectations for some sort of intervention by the Fed to help the stock market.”
“That means the rebound in USD 2-year OIS rates to 3.75-80% may struggle to find much more momentum, and the dollar may be left with a short-term rate advantage around 40bp lower compared to just 10 days ago. We expect this will drive the dollar lower against most pro-cyclical currencies amid a potential further stabilisation in risk sentiment and a lack of market-moving data this week.”
USD/CAD is down under 1.3800 in line with the recovery in risk assets, BBH FX analysts note.
BOC easing in the next 12 months is a headwind for CAD
We don’t expect new material information from the Bank of Canada’s (BOC) Summary of Governing Council deliberations later today (6:30pm London). At the July 24 meeting, the BOC slashed the policy rate 25bps to 4.50% but signaled more cuts are in the pipeline.
The swaps market is pricing a total of 150bps of BOC easing in the next 12 months which is a headwind for CAD. USD/CAD is down under 1.3800 in line with the recovery in risk assets.
The New Zealand Dollar (NZD) outperformed and New Zealand bonds underperformed on better-than-expected Q2 New Zealand labor market data, BBH FX analysts note.
Q2 labor market data pushed NZD higher
“Employment unexpectedly increased 0.4% q/q (consensus: -0.2%, RBNZ forecast: +0.1%) vs. -0.3% in Q1. The unemployment rate rose two ticks to 4.6% (consensus: 4.7%, RBNZ forecast: 4.6%) while the participation rate increased a tick to 71.7% (consensus: 71.3%, RBNZ forecast: 71.5%). Finally, private wages grew 0.9% q/q (consensus: 0.8%, RBNZ forecast: 0.9%) vs. 0.8% in Q1.”
“The swaps market slashed the probability of a RBNZ rate cut on August 14 to 52% from 90% earlier this week. Our base case remains for the RBNZ to start easing in October with a 25bps cut. Market pricing is more aggressive and implies almost 50bps of cuts by October.”
“We doubt the RBNZ will be as dovish as money market expects because New Zealand non-tradeable CPI inflation remains sticky and business confidence pick-up. As such, NZD/USD has room to edge higher if global financial market risk appetite does not worsen.”
A break beyond 0.8650 would be crucial to confirm further uptrend, SG FX strategists note.
A break above 0.8650 to confirm further uptrend
“EUR/GBP defended the lower limit of a multi-month channel near 0.8395/0.8380 resulting in a sharp rebound. It recently crossed above the 200-DMA and the upper band. The pair is now in vicinity to potential hurdle of 0.8620/0.8650 representing peaks of April / May.”
“A brief pullback can’t be ruled out. It would be interesting to see if the pair can defend the channel band near 0.8550, failure would mean possibility of deeper down move. A break beyond 0.8650 would be crucial to confirm further uptrend.”
- Markets are starting to calm down after the volatile ride on Monday.
- A Fed rate cut in September is fully priced in while policymakers try to calm markets.
- The RSI is back in the middle of its range, offering room for some bulls to enter the market again.
Gold’s price (XAU/USD) stabilizes below the $2,400 level on Wednesday after easing for two consecutive days at the beginning of the week following Monday’s market mayhem. The move comes with the US Dollar (USD) starting to gain strength again after several comments from the Bank of Japan (BoJ) on Wednesday morning that could leave traders rather puzzled. US yields are jumping higher, a stronger US Dollar is in play and the stock markets are behaving positively for a second day in a row. This is ideal for a cool down in Gold’s price action and room to assess what is next.
Although this soothing sentiment in markets is not ideal for the Gold price, plenty of tail risks are still to be considered. Geopolitical tensions in the Middle East could rip through the region into a full-fledged war at any moment. Lacklustre export data from China adds to the already poor performance in the region, and the People’s Bank of China (PBoC) or its government may soon take action to boost activity, export, and economic growth again. Should US yields and its interest rate differential against other currencies widen again, XAU/USD might return to its bullish pattern from earlier this year.
Daily digest market movers: Gold price at pivotal point
- Markets are further digesting and recovering from Monday’s turn of events in the different asset classes in financial markets. This Wednesday looks to be a second consecutive day of recovery this week, with several major assets heading back to their starting position pre-Monday.
- The US 10-year yield is also recovering and even returning to 4%, trading around 3.90% on Wednesday. The interest rate differentials between the United States (US) and other major countries are widening again in favor of the Greenback.
- At one point this week, the CME Fedwatch tool started pricing in emergency interest rate cuts from the US Federal Reserve (Fed). However, the Fed and its Chairman, Jerome Powell, have made it very clear on previous occasions that the central bank will not act on a single turn of events to save the day for equity markets. Concerns amongst traders on a possible Fed policy mistake are growing.
- The Lebanese group Hezbollah launched a series of drone and rocket attacks against Israel on Tuesday in retaliation for Israel’s reported killings of a top Hezbollah commander and Hamas leader last week. A counter-reaction from Israel is to be expected.
- Chinese export data showed only 7.0% growth year-over-year in July, down from 8.6% a month earlier and missing the 9.7% expected by analysts. Chinese imports rose substantially by 7.2%, above the 3.5% expected.
Technical Analysis: Gold’s bullish triangle still intact
From a technical point of view, Gold price looks to be at the right moment for a buy. Since the end of July, XAU/USD has not fallen below the 55-day Simple Moving Average (SMA), and when it did on Monday, it bounced off the moving average to the tick. With price action now back above the green ascending trend line in the chart below, a test to the upside near the all-time high of $2,483.75 is the logical next move, where a breakout could see Gold swirl to $2,600.00.
On the downside, breaking the green ascending trend line and the 55-day SMA would mean issues ahead. The 100-day SMA might still be able to catch any excursions lower at $2,344.54. If that level gives way, a wider area opens up. Gold could lose over 2% from breaking below the 100-day SMA and heading to the pivotal support held throughout spring and summer, near $2,281.28.
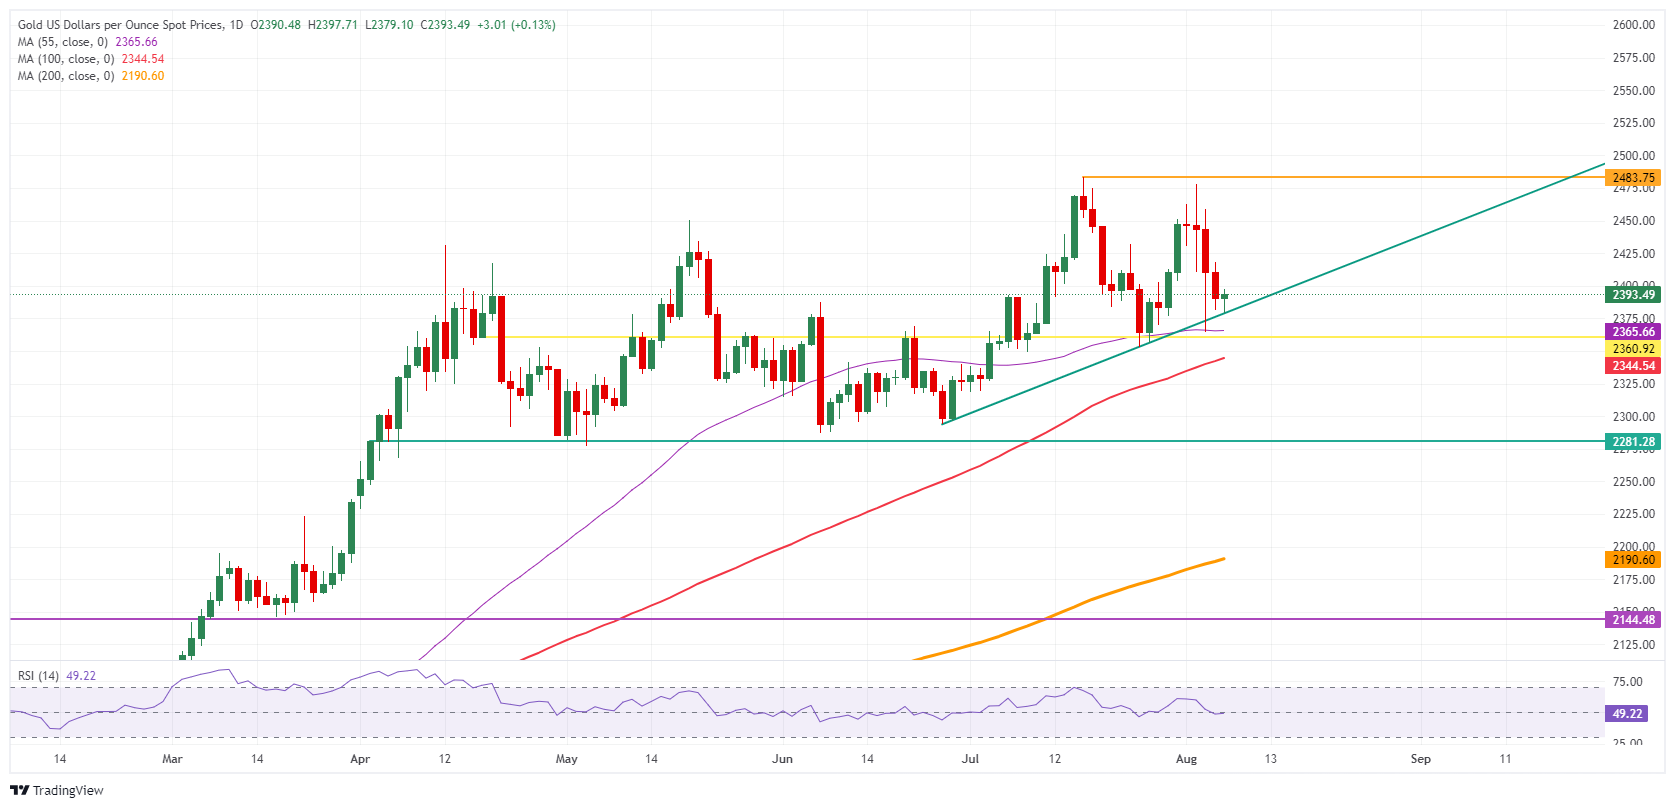
XAU/USD: Daily Chart
Gold FAQs
Gold has played a key role in human’s history as it has been widely used as a store of value and medium of exchange. Currently, apart from its shine and usage for jewelry, the precious metal is widely seen as a safe-haven asset, meaning that it is considered a good investment during turbulent times. Gold is also widely seen as a hedge against inflation and against depreciating currencies as it doesn’t rely on any specific issuer or government.
Central banks are the biggest Gold holders. In their aim to support their currencies in turbulent times, central banks tend to diversify their reserves and buy Gold to improve the perceived strength of the economy and the currency. High Gold reserves can be a source of trust for a country’s solvency. Central banks added 1,136 tonnes of Gold worth around $70 billion to their reserves in 2022, according to data from the World Gold Council. This is the highest yearly purchase since records began. Central banks from emerging economies such as China, India and Turkey are quickly increasing their Gold reserves.
Gold has an inverse correlation with the US Dollar and US Treasuries, which are both major reserve and safe-haven assets. When the Dollar depreciates, Gold tends to rise, enabling investors and central banks to diversify their assets in turbulent times. Gold is also inversely correlated with risk assets. A rally in the stock market tends to weaken Gold price, while sell-offs in riskier markets tend to favor the precious metal.
The price can move due to a wide range of factors. Geopolitical instability or fears of a deep recession can quickly make Gold price escalate due to its safe-haven status. As a yield-less asset, Gold tends to rise with lower interest rates, while higher cost of money usually weighs down on the yellow metal. Still, most moves depend on how the US Dollar (USD) behaves as the asset is priced in dollars (XAU/USD). A strong Dollar tends to keep the price of Gold controlled, whereas a weaker Dollar is likely to push Gold prices up.
China’s exports rose for the fourth straight month in Jul but the pace unexpectedly slowed, UOB Group economist Ho Woei Chen notes.
Low base to support both the export and import growth
“China’s exports rose for the fourth straight month in Jul but the pace unexpectedly slowed while imports rebounded strongly. As a result, the trade surplus narrowed to US$84.65 bn from its record high of $99.05 bn in Jun.”
“The low base effect is likely to continue to support both the export and import growth in 3Q24. For exports, the key downside risk stems from a sharper slowdown in global demand, exacerbated by risk aversion in the financial markets. Imports had a slow start to the year but measures to increase domestic consumption and industrial modernization could help boost import demand in the second half.”
“Factoring in the YTD performance, we lower our forecasts for China’s export and import growth in 2024 to 5.0% (2023: -4.6%) and 4.5% (2023: -5.5%) from 7.0% and 6.0% previously.”
Further US Dollar (USD) weakness is not ruled out, but the low near 7.0635 is solid support now. Only a breach of 7.2000 would mean that the weakness has stabilised, UOB Group FX analysts Quek Ser Leang and Lee Sue Ann notes.
Bulls push towards 7.2000
24-HOUR VIEW: “USD plunged to 7.0636 on Monday and then snapped back to close at 7.1350. Yesterday (Tuesday), we indicated that ‘the rebound in severely oversold conditions suggests instead of continuing to decline, USD is likely to trade in a 7.1100/7.1700 range.’ USD subsequently traded between 7.1339/7.1650, closing on a firm note at 7.1619 (+0.38%). The slightly firmed underlying tone suggests USD is likely to edge higher today. However, any advance is unlikely to break clearly above 7.1800. On the downside, support levels are at 7.1450 and 7.1350.”
1-3 WEEKS VIEW: “After USD plunged to 7.0636 on Monday and then rebounded, we indicated yesterday (06 Aug, spot at 7.1400) that ‘while downward momentum has slowed somewhat, only a breach of 7.2000 (no change in ‘strong resistance’ level) would mean that the weakness has stabilised.’ We added, ‘until then, further USD weakness is not ruled out, but the low near 7.0635 is solid support now.’ Our view remains unchanged.”
Еру next significant support level is some distance away at 140.80, but it remains to be seen if this level will come into view, UOB Group FX analysts Quek Ser Leang and Lee Sue Ann notes.
The next strong support is at 148.30
24-HOUR VIEW: “After USD plunged to 141.66 on Monday and snapped back up, we indicated yesterday (Tuesday) that ‘downward momentum appears to be slowing.’ We expected USD to trade in a range between 142.60 and 148.00. USD then traded in a narrower range of 143.60 and 146.36, closing little changed at 144.30 (+0.09%). Today, we continue to expect USD to trade in a range, probably between 143.50 and 146.20.”
1-3 WEEKS VIEW: “In our most recent narrative from Monday (05 Aug, spot at 145.25), we noted that ‘the weakness in USD has not stabilised.’ We pointed out that ‘the next significant support level is some distance away at 140.80, but it remains to be seen if this level will come into view.’ We continue to hold the same view. Overall, the USD weakness is intact as long as 148.30 (‘strong resistance level previously at 148.60) is not breached.”
Price action continues to suggest the New Zealand Dollar (NZD) could recover, possibly to 0.6035, UOB Group FX analysts Quek Ser Leang and Lee Sue Ann notes.
NZD can recover to 0.6035
24-HOUR VIEW: “We indicated yesterday that NZD ‘could rise, potentially reaching 0.6010.’ Our view did not turn out, as NZD traded in a range of 0.5912/0.5979, closing at 0.5954 (+0.25%). We continue to see room for NZD rise, even though any advance is unlikely to break clearly above 0.6010 (next resistance is at 0.6035). Support levels are at 0.5950 and 0.5935.”
1-3 WEEKS VIEW: “We continue to hold the same view as yesterday (06 Aug, spot at 0.5975). As highlighted, the recent price action continues to suggest NZD could recover, possibly towards 0.6035. Overall, only a breach of 0.5890 would indicate that NZD is not recovering further.”
Silver prices (XAG/USD) broadly unchanged on Wednesday, according to FXStreet data. Silver trades at $26.97 per troy ounce, broadly unchanged 0.05% from the $26.99 it cost on Tuesday.
Silver prices have increased by 13.35% since the beginning of the year.
| Unit measure | Silver Price Today in USD |
|---|---|
| Troy Ounce | 26.97 |
| 1 Gram | 0.87 |
The Gold/Silver ratio, which shows the number of ounces of Silver needed to equal the value of one ounce of Gold, stood at 88.79 on Wednesday, up from 88.59 on Tuesday.
Silver FAQs
Silver is a precious metal highly traded among investors. It has been historically used as a store of value and a medium of exchange. Although less popular than Gold, traders may turn to Silver to diversify their investment portfolio, for its intrinsic value or as a potential hedge during high-inflation periods. Investors can buy physical Silver, in coins or in bars, or trade it through vehicles such as Exchange Traded Funds, which track its price on international markets.
Silver prices can move due to a wide range of factors. Geopolitical instability or fears of a deep recession can make Silver price escalate due to its safe-haven status, although to a lesser extent than Gold's. As a yieldless asset, Silver tends to rise with lower interest rates. Its moves also depend on how the US Dollar (USD) behaves as the asset is priced in dollars (XAG/USD). A strong Dollar tends to keep the price of Silver at bay, whereas a weaker Dollar is likely to propel prices up. Other factors such as investment demand, mining supply – Silver is much more abundant than Gold – and recycling rates can also affect prices.
Silver is widely used in industry, particularly in sectors such as electronics or solar energy, as it has one of the highest electric conductivity of all metals – more than Copper and Gold. A surge in demand can increase prices, while a decline tends to lower them. Dynamics in the US, Chinese and Indian economies can also contribute to price swings: for the US and particularly China, their big industrial sectors use Silver in various processes; in India, consumers’ demand for the precious metal for jewellery also plays a key role in setting prices.
Silver prices tend to follow Gold's moves. When Gold prices rise, Silver typically follows suit, as their status as safe-haven assets is similar. The Gold/Silver ratio, which shows the number of ounces of Silver needed to equal the value of one ounce of Gold, may help to determine the relative valuation between both metals. Some investors may consider a high ratio as an indicator that Silver is undervalued, or Gold is overvalued. On the contrary, a low ratio might suggest that Gold is undervalued relative to Silver.
(An automation tool was used in creating this post.)
The Australian Dollar (AUD) could rebound; any advance is unlikely to reach 0.6600. AUD weakness from late last month has stabilised; it is likely to trade in a 0.6400/0.6600 range for the time being, UOB Group FX analysts Quek Ser Leang and Lee Sue Ann notes.
The immediate resistance is at 0.6600
24-HOUR VIEW: “Our expectation for AUD to continue to rebound yesterday did not materialise, as it traded between 0.6472 and 0.6541, closing at 0.6519 (+0.34%). The underlying tone still seems firm, and we continue expect AUD to rebound. However, any advance is unlikely to reach the major resistance at 0.6600. Support is at 0.6500, followed by 0.6480.”
1-3 WEEKS VIEW: “After holding a negative AUD view since late last month, we indicated yesterday (06 Aug, spot at 0.6510) that the weakness has stabilised. We expected AUD to trade in neutral range of 0.6400/0.6600 for the time being. Our view remains unchanged.”
Oversold decline has not stabilised; the Pound Sterling (GBP) could drop further to 1.2645. The next major support at 1.2610 is highly unlikely to come into view, UOB Group FX analysts Quek Ser Leang and Lee Sue Ann notes.
GBP may test 1.2780 in short term
24-HOUR VIEW: “We did not anticipate GBP to drop sharply to 1.2674 yesterday (we were expecting sideways trading). While the decline is oversold, it has not stabilised. Today, GBP could drop to 1.2645 before stabilisation can be expected. The next major support at 1.2610 is highly unlikely to come into view. Resistance is at 1.2710; a breach of 1.2735 would suggest that the weakness in GBP has stabilised.”
1-3 WEEKS VIEW: “We have held a negative view in GBP since 26 Jul, when it was trading at 1.2855. After GBP tested the 1.2710 level twice and rebounded, we indicated yesterday (06 Aug, spot at 1.2790) that ‘downward momentum has slowed, and there is a low confidence of a sustained break below 1.2710.’ However, GBP lurched lower in London trade, broke below 1.2710, reaching a low of 1.2674. The rejuvenated momentum indicates that the risk remains on the downside. The levels to watch are 1.2645 and 1.2610. The latter level is solid support (near June’s low). The downside risk will remain intact as long as 1.2780 (‘strong resistance’ level previously at 1.2840) is not breached.”
- Silver turns lower for the third straight day, albeit holds above a multi-month trough.
- The technical setup favors bearish traders and supports prospects for deeper losses.
- A sustained strength beyond the $ 27.55-$27.60 might trigger a short-covering rally.
Silver (XAG/USD) meets with some supply following an intraday uptick to the $27.25-$27.30 region and turns lower for the third successive day during the first half of the European session on Wednesday. The white metal, however, manages to hold its neck above a three-month low touched on Monday and currently trades around the $27.00 round-figure mark.
Against the backdrop of the recent beak down through the very important 200-day Simple Moving Average (SMA) and failures near the $29.00 mark, the emergence of fresh selling favors bearish traders. Moreover, technical indicators on the daily chart are holding deep in negative territory and are still far from being in the oversold zone. This, in turn, validates the negative outlook and suggests that the path of least resistance for the XAG/USD is to the downside.
Traders, however, might wait for some follow-through selling below the weekly low, around mid-$26.00s, before positioning for the next leg of a downfall. The XAG/USD might then accelerate the slide towards the $26.00 round figure before dropping to the next relevant support to the $25.65-$25.60 region. The downward trajectory could extend further towards challenging the $25.00 psychological mark en route to the $24.45-$24.40 horizontal support.
On the flip side, any meaningful recovery attempt is likely to confront stiff resistance near the overnight swing high, around the $27.55-$27.60 region. A sustained strength beyond, however, might trigger a short-covering rally and lift the XAG/USD beyond the $28.00 round-figure, towards challenging the 200-day SMA support-turned-resistance, currently pegged near the $28.80 area. The $29.00 mark, meanwhile, might continue to cap the upside.
Silver daily chart
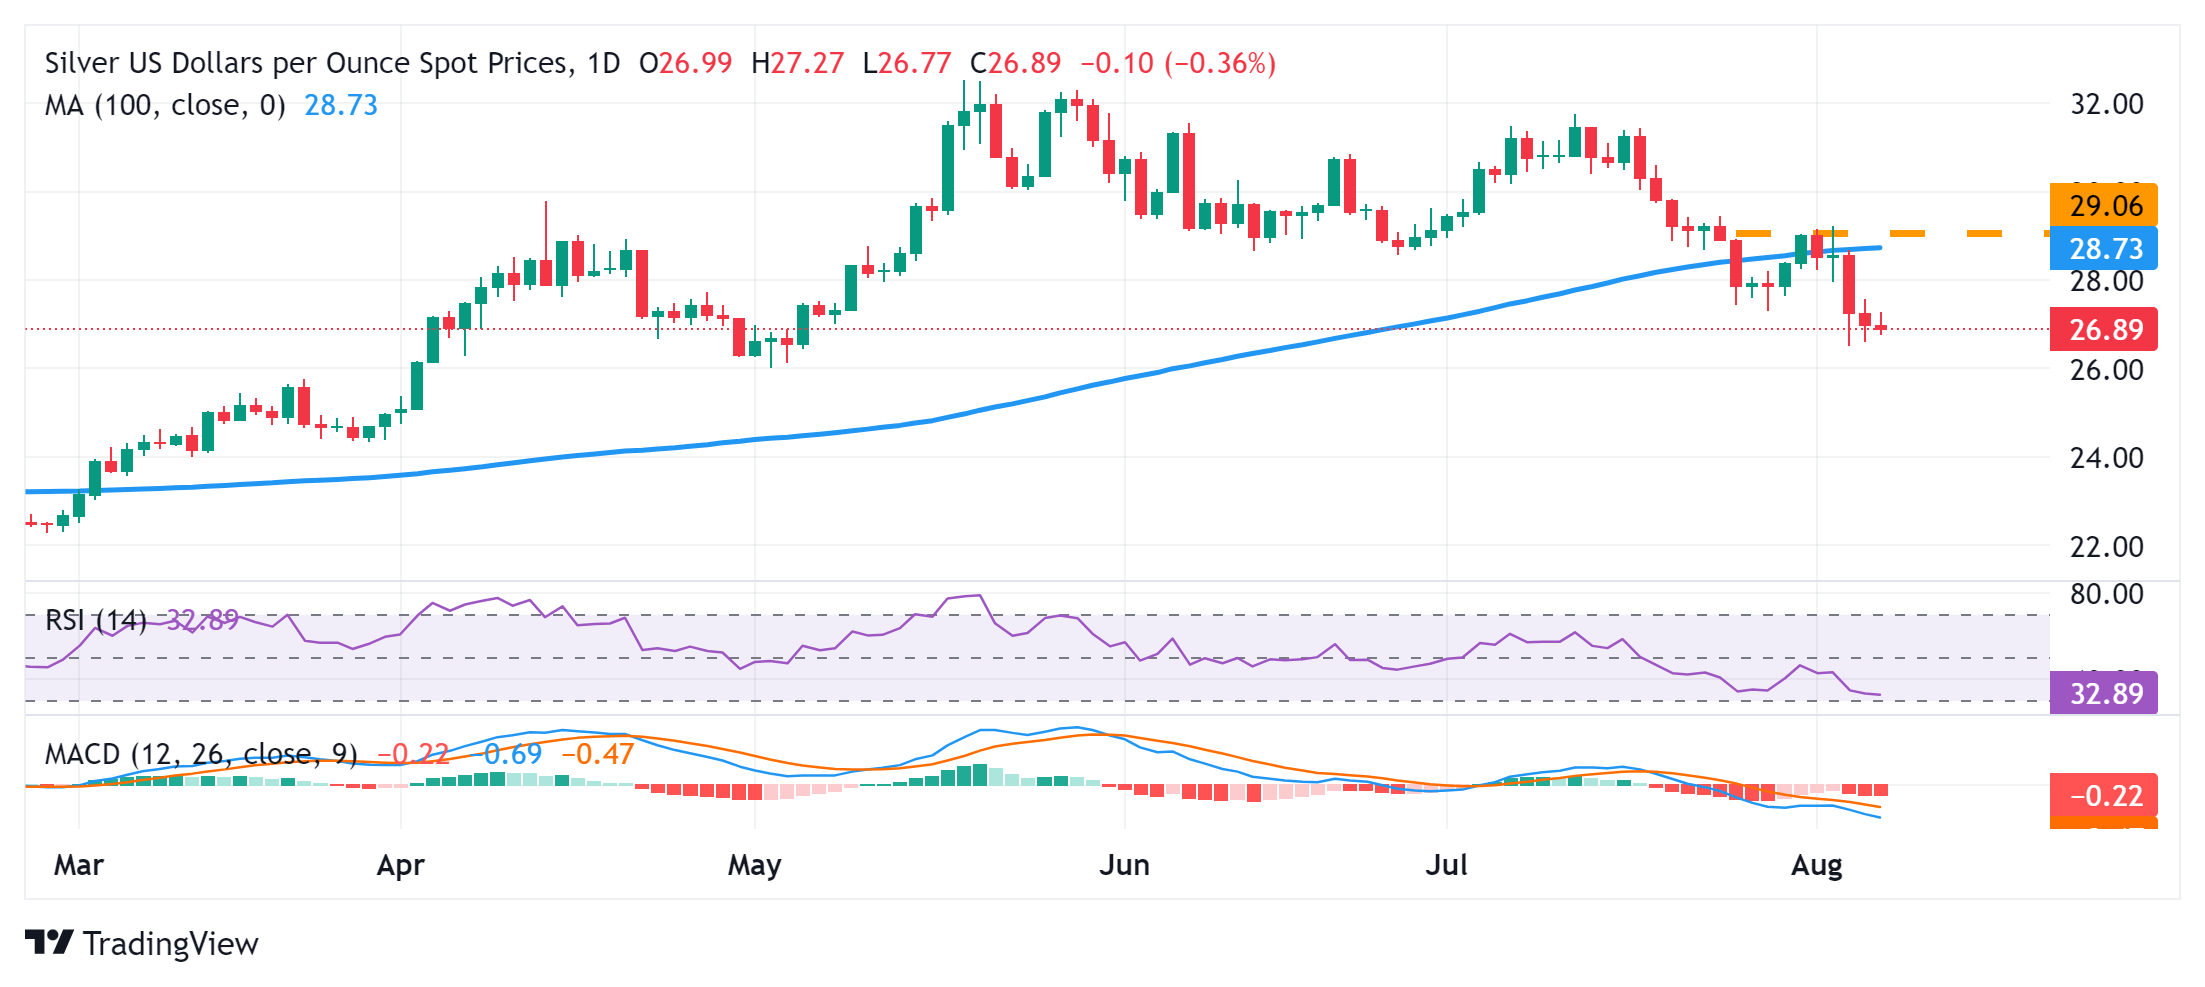
Silver FAQs
Silver is a precious metal highly traded among investors. It has been historically used as a store of value and a medium of exchange. Although less popular than Gold, traders may turn to Silver to diversify their investment portfolio, for its intrinsic value or as a potential hedge during high-inflation periods. Investors can buy physical Silver, in coins or in bars, or trade it through vehicles such as Exchange Traded Funds, which track its price on international markets.
Silver prices can move due to a wide range of factors. Geopolitical instability or fears of a deep recession can make Silver price escalate due to its safe-haven status, although to a lesser extent than Gold's. As a yieldless asset, Silver tends to rise with lower interest rates. Its moves also depend on how the US Dollar (USD) behaves as the asset is priced in dollars (XAG/USD). A strong Dollar tends to keep the price of Silver at bay, whereas a weaker Dollar is likely to propel prices up. Other factors such as investment demand, mining supply – Silver is much more abundant than Gold – and recycling rates can also affect prices.
Silver is widely used in industry, particularly in sectors such as electronics or solar energy, as it has one of the highest electric conductivity of all metals – more than Copper and Gold. A surge in demand can increase prices, while a decline tends to lower them. Dynamics in the US, Chinese and Indian economies can also contribute to price swings: for the US and particularly China, their big industrial sectors use Silver in various processes; in India, consumers’ demand for the precious metal for jewellery also plays a key role in setting prices.
Silver prices tend to follow Gold's moves. When Gold prices rise, Silver typically follows suit, as their status as safe-haven assets is similar. The Gold/Silver ratio, which shows the number of ounces of Silver needed to equal the value of one ounce of Gold, may help to determine the relative valuation between both metals. Some investors may consider a high ratio as an indicator that Silver is undervalued, or Gold is overvalued. On the contrary, a low ratio might suggest that Gold is undervalued relative to Silver.
- GBP/JPY holds gains following unexpected dovish comments from BoJ Deputy Governor Shinichi Uchida.
- BoJ’s Uchida emphasized to maintain its current level of monetary easing for the time being.
- The Japanese Yen may appreciate due to increased risk aversion amid heightened Middle East tensions.
GBP/JPY halts its losing streak that began on July 30, trading around 187.00 during the European session on Wednesday. This rebound could be linked to dovish comments from Bank of Japan (BoJ) Deputy Governor Shinichi Uchida, who stated, “We won’t raise rates when markets are unstable,” according to Reuters.
Deputy Governor Uchida also highlighted that the BoJ's interest rate strategy may adjust if market volatility affects economic forecasts, risk assessments, or projections. In light of recent market fluctuations, he stressed the importance of closely monitoring the economic and price impacts of their policies, stating, “We must maintain the current degree of monetary easing for the time being.”
The escalating geopolitical tensions in the Middle East could impact safe-haven demand and support the Japanese Yen (JPY), undermining the GBP/JPY cross. Hamas appointed Yahya Sinwar as its new leader in Gaza following the assassination of former chief Ismail Haniyeh on Tuesday, according to Reuters.
There are growing concerns about potential escalation, with Iran and its allies—Hamas and Hezbollah—pledging retaliation against Israel and the United States for the killing of the Hamas leader.
In the United Kingdom, the Halifax House Price Index increased by 2.3% year-on-year in July, up from a revised 1.9% gain in June, marking the sharpest annual growth since January. House prices rose by 0.8% MoM after remaining unchanged in June, surpassing market forecasts of a 0.3% increase.
Housing prices may continue to show a modest upward trend for the rest of 2024, supported by lower mortgage rates and the potential for further base rate reductions by the Bank of England (BoE), which could encourage homebuyers.
Meanwhile, the Pound Sterling (GBP) could face challenges following the BoE's widely anticipated 25-basis point rate cut at its August meeting. Additionally, market expectations now include the possibility of two more quarter-point rate cuts by the BoE by December.
Interest rates FAQs
Interest rates are charged by financial institutions on loans to borrowers and are paid as interest to savers and depositors. They are influenced by base lending rates, which are set by central banks in response to changes in the economy. Central banks normally have a mandate to ensure price stability, which in most cases means targeting a core inflation rate of around 2%. If inflation falls below target the central bank may cut base lending rates, with a view to stimulating lending and boosting the economy. If inflation rises substantially above 2% it normally results in the central bank raising base lending rates in an attempt to lower inflation.
Higher interest rates generally help strengthen a country’s currency as they make it a more attractive place for global investors to park their money.
Higher interest rates overall weigh on the price of Gold because they increase the opportunity cost of holding Gold instead of investing in an interest-bearing asset or placing cash in the bank. If interest rates are high that usually pushes up the price of the US Dollar (USD), and since Gold is priced in Dollars, this has the effect of lowering the price of Gold.
The Fed funds rate is the overnight rate at which US banks lend to each other. It is the oft-quoted headline rate set by the Federal Reserve at its FOMC meetings. It is set as a range, for example 4.75%-5.00%, though the upper limit (in that case 5.00%) is the quoted figure. Market expectations for future Fed funds rate are tracked by the CME FedWatch tool, which shapes how many financial markets behave in anticipation of future Federal Reserve monetary policy decisions.
The Euro (EUR) is expected to consolidate between 1.0895 and 1.0960. EUR is still positive, but it has to surpass 1.1010 before further advance to 1.1070 can be expected, UOB Group FX analysts Quek Ser Leang and Lee Sue Ann notes.
EUR to continue growing above 1.1010
24-HOUR VIEW: “Yesterday, we indicated ‘provided that EUR remains above 1.0910, it could retest the 1.1010 level before another pullback is likely.’ Our view was incorrect, as EUR pulled back directly to a low of 1.0902. EUR closed at 1.0930 (-0.20%). The current price action is likely part of a consolidation phase. Today, we expect EUR to trade between 1.0895 and 1.0960.”
1-3 WEEKS VIEW: “We indicated yesterday that EUR ‘is still positive, but it has to surpass 1.1010 before further advance to 1.1070 can be expected.’ We continue to hold the same view. On the downside, should EUR breach the ‘strong support’ at 1.0855 (no change in level from yesterday), it would mean that EUR is not ready to move above 1.1010.”
- EUR/GBP drifts lower and snaps a four-day winning streak to a multi-month peak.
- The upbeat German Industrial Production data lends support and helps limit losses.
- This week’s breakout through the crucial 200-day SMA hurdle favors bullish traders.
The EUR/GBP cross comes under some selling pressure on Wednesday and erodes a part of the previous day's strong move up back closer to a three-month peak touched earlier this week. Spot prices, however, recover a few pips from the daily low and trade with modest intraday losses, around the 0.8600 mark during the early part of the European session.
The shared currency attracted some buyers following the release of German Industrial Production data, which showed that the output in the Eurozone’s top economy increased by 1.4% MoM. The reading was better than the expected increase of 1.0% and a 2.5% drop registered in May, which, in turn, acts as a tailwind for the EUR/GBP cross. The upside, however, remains capped in the wake of the European Central Bank's (ECB) downbeat view of the Eurozone's economic prospects and overbought conditions on the daily chart.
Apart from this, a modest technical bounce in the British Pound (GBP) contributes to capping the EUR/GBP cross, which, for now, seems to have stalled a strong rally witnessed over the past four days. Meanwhile, any meaningful corrective decline still seems elusive amid the Bank of England's (BoE) first interest rate cut in more than four years, from a 16-year high to 5.0% last Thursday. This, in turn, makes it prudent to wait for strong follow-through selling before confirming that spot prices have topped out in the near term.
There isn't any relevant market-moving economic data due for release, either from the UK or Eurozone, for the rest of the week. Hence, the focus shifts to the monthly jobs report and the latest consumer inflation figures from the UK, due next Tuesday and Wednesday, respectively. Apart from this, the monthly UK GDP print on Thursday should provide some meaningful impetus to the EUR/GBP cross. From a technical perspective, Monday's breakout through the very important 200-day Simple Moving Average (SMA) favors bullish traders.
Euro FAQs
The Euro is the currency for the 20 European Union countries that belong to the Eurozone. It is the second most heavily traded currency in the world behind the US Dollar. In 2022, it accounted for 31% of all foreign exchange transactions, with an average daily turnover of over $2.2 trillion a day. EUR/USD is the most heavily traded currency pair in the world, accounting for an estimated 30% off all transactions, followed by EUR/JPY (4%), EUR/GBP (3%) and EUR/AUD (2%).
The European Central Bank (ECB) in Frankfurt, Germany, is the reserve bank for the Eurozone. The ECB sets interest rates and manages monetary policy. The ECB’s primary mandate is to maintain price stability, which means either controlling inflation or stimulating growth. Its primary tool is the raising or lowering of interest rates. Relatively high interest rates – or the expectation of higher rates – will usually benefit the Euro and vice versa. The ECB Governing Council makes monetary policy decisions at meetings held eight times a year. Decisions are made by heads of the Eurozone national banks and six permanent members, including the President of the ECB, Christine Lagarde.
Eurozone inflation data, measured by the Harmonized Index of Consumer Prices (HICP), is an important econometric for the Euro. If inflation rises more than expected, especially if above the ECB’s 2% target, it obliges the ECB to raise interest rates to bring it back under control. Relatively high interest rates compared to its counterparts will usually benefit the Euro, as it makes the region more attractive as a place for global investors to park their money.
Data releases gauge the health of the economy and can impact on the Euro. Indicators such as GDP, Manufacturing and Services PMIs, employment, and consumer sentiment surveys can all influence the direction of the single currency. A strong economy is good for the Euro. Not only does it attract more foreign investment but it may encourage the ECB to put up interest rates, which will directly strengthen the Euro. Otherwise, if economic data is weak, the Euro is likely to fall. Economic data for the four largest economies in the euro area (Germany, France, Italy and Spain) are especially significant, as they account for 75% of the Eurozone’s economy.
Another significant data release for the Euro is the Trade Balance. This indicator measures the difference between what a country earns from its exports and what it spends on imports over a given period. If a country produces highly sought after exports then its currency will gain in value purely from the extra demand created from foreign buyers seeking to purchase these goods. Therefore, a positive net Trade Balance strengthens a currency and vice versa for a negative balance.
- WTI breaks its losing streak due to rising concerns over supply constraints amid Middle East tensions.
- Hamas appointed a new leader in Gaza on Tuesday after the assassination of its former chief the previous week.
- API Weekly Crude Oil Stock reported an increase of 0.18 million barrels against the expected 0.85 million barrels.
West Texas Intermediate (WTI) crude Oil ends a four-day losing streak, trading around $72.50 per barrel on Wednesday. The Oil prices are getting support from rising concerns about supply constraints due to ongoing geopolitical tensions in the Middle East.
Hamas named Yahya Sinwar as its new leader in Gaza following the assassination of former chief Ismail Haniyeh on Tuesday. There are concerns about potential escalation in the region, with Iran and its allies—Hamas and Hezbollah—vowing retaliation against Israel and the United States for the killing of the Hamas leader, according to Reuters.
However, the potential for a rebound in Oil prices may be constrained by bearish demand sentiment. Chinese trade data showed that daily crude Oil imports in July dropped to their lowest level since September 2022 in the largest crude importer of the world.
The American Petroleum Institute (API) reported an increase of 0.18 million barrels in the Weekly Crude Oil Stock for the week ending August 2, falling short of the expected 0.85 million barrels. This follows a previous decline of 4.495 million barrels. Additionally, the US Energy Information Administration is set to release its Crude Oil Stocks Change report later in the North American session.
On Tuesday, Reuters reported that the EIA estimates global Oil inventories decreased by approximately 400,000 barrels per day (bpd) in the first half of 2024. The EIA projects stockpiles will decline by around 800,000 bpd in the second half of the year.
The Organization of the Petroleum Exporting Countries (OPEC) and other producers, including Russia (OPEC+), are sticking to their plan to gradually end voluntary production cuts starting in October. Nevertheless, a Reuters survey released on Friday showed that OPEC's oil output increased in July, even with the group's production cuts in effect.
WTI Oil FAQs
WTI Oil is a type of Crude Oil sold on international markets. The WTI stands for West Texas Intermediate, one of three major types including Brent and Dubai Crude. WTI is also referred to as “light” and “sweet” because of its relatively low gravity and sulfur content respectively. It is considered a high quality Oil that is easily refined. It is sourced in the United States and distributed via the Cushing hub, which is considered “The Pipeline Crossroads of the World”. It is a benchmark for the Oil market and WTI price is frequently quoted in the media.
Like all assets, supply and demand are the key drivers of WTI Oil price. As such, global growth can be a driver of increased demand and vice versa for weak global growth. Political instability, wars, and sanctions can disrupt supply and impact prices. The decisions of OPEC, a group of major Oil-producing countries, is another key driver of price. The value of the US Dollar influences the price of WTI Crude Oil, since Oil is predominantly traded in US Dollars, thus a weaker US Dollar can make Oil more affordable and vice versa.
The weekly Oil inventory reports published by the American Petroleum Institute (API) and the Energy Information Agency (EIA) impact the price of WTI Oil. Changes in inventories reflect fluctuating supply and demand. If the data shows a drop in inventories it can indicate increased demand, pushing up Oil price. Higher inventories can reflect increased supply, pushing down prices. API’s report is published every Tuesday and EIA’s the day after. Their results are usually similar, falling within 1% of each other 75% of the time. The EIA data is considered more reliable, since it is a government agency.
OPEC (Organization of the Petroleum Exporting Countries) is a group of 13 Oil-producing nations who collectively decide production quotas for member countries at twice-yearly meetings. Their decisions often impact WTI Oil prices. When OPEC decides to lower quotas, it can tighten supply, pushing up Oil prices. When OPEC increases production, it has the opposite effect. OPEC+ refers to an expanded group that includes ten extra non-OPEC members, the most notable of which is Russia.
- EUR/USD drifts lower for the second straight day on Wednesday amid renewed USD buying.
- The better-than-expected German Industrial Production data helps limit any further losses.
- A combination of factors caps the upside for the USD and warrants caution for bearish traders.
The EUR/USD pair remains under some selling pressure for the second straight day on Wednesday, albeit manages to hold its neck above the 1.0900 mark through the early European session. The downtick is sponsored by the emergence of some US Dollar (USD) buying, though the fundamental backdrop warrants caution before positioning for an extension of this week's pullback from the 1.1000 psychological mark, or a seven-month peak.
The US Treasury bond yields build on the overnight advance, which was their biggest rise since early June, and assist the USD to recover further from its lowest level since January touched on Monday. Adding to this, the European Central Bank's (ECB) downbeat view of the Eurozone's economic prospects continues to undermine the shared currency and exert some downward pressure on the EUR/USD pair. That said, the upbeat German macro data offers some support to spot prices and helps limit any further losses.
The latest data published by Destatis showed Germany’s industrial sector returned to expansion in June and the output in the Eurozone’s top economy increased by 1.4% MoM as against an expected increase of 1.0% and a 2.5% drop registered in May. Furthermore, a positive risk tone around the global equity markets, along with dovish Federal Reserve (Fed) expectations, caps the upside for the safe-haven buck. This, in turn, acts as a tailwind for the EUR/USD pair and warrants some caution for aggressive bearish traders.
In the absence of any relevant market-moving economic data, the aforementioned fundamental backdrop makes it prudent to wait for strong follow-through selling before confirming that spot prices have topped out in the near term. From a technical perspective, a sustained break and acceptance below the 1.0900 mark could be seen as a key trigger for bearish traders and pave the way for some meaningful downside for the EUR/USD pair. Bulls, meanwhile, might wait for a move beyond mid-1.0900s before placing fresh bets.
Economic Indicator
Industrial Production s.a. (MoM)
The Industrial Production released by the Statistisches Bundesamt Deutschland measures outputs of the German factories and mines. Changes in industrial production are widely followed as a major indicator of strength in the manufacturing sector. A high reading is seen as positive (or bullish) for the EUR, whereas a low reading is seen as negative (or bearish).
Read more.Last release: Wed Aug 07, 2024 06:00
Frequency: Monthly
Actual: 1.4%
Consensus: 1%
Previous: -2.5%
Here is what you need to know on Wednesday, August 7:
Japanese Yen remains as one of the biggest movers among major currencies on Wednesday. The economic calendar will not offer any high-impact data releases midweek and investors will continue to pay close attention to changes in risk perception, while keeping an eye on geopolitics.
Following the sharp decline seen at the beginning of the week, USD/JPY staged a rebound on Tuesday but erased its gains to end the day virtually unchanged. The pair gathers bullish momentum early Wednesday and trades at around 147.00, where it's up nearly 2% on a daily basis. Bank of Japan (BoJ) Deputy Governor Shinichi Uchida said earlier in the day that there are now more factors that require the BoJ to be more cautious with respect to the timing of the next interest rate hike. "If the market volatility changes our view on prospects for achieving the price goal, that will influence our decision on rate hike path," he added. In the Asian session on Thursday, the BoJ will publish the Summary of Opinions.
Japanese Yen PRICE Today
The table below shows the percentage change of Japanese Yen (JPY) against listed major currencies today. Japanese Yen was the weakest against the New Zealand Dollar.
| USD | EUR | GBP | JPY | CAD | AUD | NZD | CHF | |
|---|---|---|---|---|---|---|---|---|
| USD | 0.08% | -0.02% | 1.38% | -0.12% | -0.32% | -1.07% | 0.42% | |
| EUR | -0.08% | -0.09% | 1.33% | -0.20% | -0.43% | -1.14% | 0.37% | |
| GBP | 0.02% | 0.09% | 1.41% | -0.11% | -0.35% | -1.00% | 0.44% | |
| JPY | -1.38% | -1.33% | -1.41% | -1.46% | -1.69% | -2.36% | -0.93% | |
| CAD | 0.12% | 0.20% | 0.11% | 1.46% | -0.21% | -0.90% | 0.56% | |
| AUD | 0.32% | 0.43% | 0.35% | 1.69% | 0.21% | -0.65% | 0.79% | |
| NZD | 1.07% | 1.14% | 1.00% | 2.36% | 0.90% | 0.65% | 1.45% | |
| CHF | -0.42% | -0.37% | -0.44% | 0.93% | -0.56% | -0.79% | -1.45% |
The heat map shows percentage changes of major currencies against each other. The base currency is picked from the left column, while the quote currency is picked from the top row. For example, if you pick the Japanese Yen from the left column and move along the horizontal line to the US Dollar, the percentage change displayed in the box will represent JPY (base)/USD (quote).
After closing in positive territory on Tuesday, the US Dollar Index (DXY) preserves its recovery momentum and trades above 103.20 in the European session on Wednesday. Later in the American session, the US Treasury will hold a 10-year note auction. Consumer Credit Change data for June will be the only data release from the US. After rising nearly 3% on Tuesday, the 10-year US yield holds steady at around 3.9% in the European morning. Meanwhile, US stock index futures rise between 0.5% and 0.8%.
USD/CAD fell for the third consecutive trading day on Tuesday and touched a two-week low near 1.3750. The pair struggles to gain traction early Wednesday and trades at around 1.3770. Ivey Purchasing Managers Index for July will be featured in the Canadian economic docket later in the day. Additionally, the Bank of Canada (BoC) will publish the Summary of Deliberations from its July policy meeting.
Statistics New Zealand reported in the Asian session that the Unemployment Rate in New Zealand climbed to 4.6% in the second quarter from 4.3% in the first quarter. The Employment Change was up 0.4% in this period, better than the market expectation for a 0.2% decline. In the meantime, the data from China showed that the trade surplus shrank to $84.65 billion in July from $99.05 billion in June. NZD/USD gathered bullish momentum and was last trading slightly above 0.6000, rising over 0.8% on the day.
EUR/USD staged a downward correction and closed in the red on Tuesday. The pair continues to edge lower but manages to hold above 1.0900 in the European session on Wednesday.
GBP/USD lost over 0.5% on Tuesday and registered its lowest daily close in a month. The pair stays on the back foot and trades below 1.2700 in the European morning.
Gold failed to gather recovery momentum and closed below $2,400 on Tuesday. XAU/USD holds relatively stable at around $2,390 to start the European session.
Japanese Yen FAQs
The Japanese Yen (JPY) is one of the world’s most traded currencies. Its value is broadly determined by the performance of the Japanese economy, but more specifically by the Bank of Japan’s policy, the differential between Japanese and US bond yields, or risk sentiment among traders, among other factors.
One of the Bank of Japan’s mandates is currency control, so its moves are key for the Yen. The BoJ has directly intervened in currency markets sometimes, generally to lower the value of the Yen, although it refrains from doing it often due to political concerns of its main trading partners. The current BoJ ultra-loose monetary policy, based on massive stimulus to the economy, has caused the Yen to depreciate against its main currency peers. This process has exacerbated more recently due to an increasing policy divergence between the Bank of Japan and other main central banks, which have opted to increase interest rates sharply to fight decades-high levels of inflation.
The BoJ’s stance of sticking to ultra-loose monetary policy has led to a widening policy divergence with other central banks, particularly with the US Federal Reserve. This supports a widening of the differential between the 10-year US and Japanese bonds, which favors the US Dollar against the Japanese Yen.
The Japanese Yen is often seen as a safe-haven investment. This means that in times of market stress, investors are more likely to put their money in the Japanese currency due to its supposed reliability and stability. Turbulent times are likely to strengthen the Yen’s value against other currencies seen as more risky to invest in.
- USD/MXN could limit its downside amid rising US Treasury yields.
- The Mexican Peso may struggle as the Banxico may reduce borrowing costs at Thursday’s meeting.
- CME FedWatch tool suggests 67.5% odds of a 50-basis point Fed rate cut in September, up from 13.2% last week.
USD/MXN trades around 19.30 during the early European hours on Wednesday after breaking its four-day winning streak. The Mexican Peso (MXN) gains ground due to possible improved risk appetite. However, the downside of the USD/MXN pair could be limited as US Dollar (USD) advances amid rising Treasury yields.
Mexico’s Auto Exports fell by 1.6% year-on-year to 271,496 units in July, breaking a streak of twenty consecutive months of growth. This decline highlights the ongoing economic slowdown, which, along with lower inflation readings, might prompt the Bank of Mexico (Banxico) to consider lowering borrowing costs at its upcoming meeting. Traders will likely observe the inflation data before the policy decision on Thursday.
The US Dollar Index (DXY), which measures the value of the US Dollar against its six major peers, trades around 103.20 with 2-year and 10-year yields on US Treasury bonds standing at 4.00% and 3.90%, respectively, at the time of writing.
However, the upside of the USD/MXN could be retrained due to increasing odds of a relatively higher rate cut starting in September after the weaker US labor data for July raised the fear of a looming US recession. According to the CME FedWatch tool, there is now a 67.5% probability of a 50-basis point (bps) interest rate cut by the US Federal Reserve (Fed) in September, up from 13.2% a week earlier.
According to Reuters, Federal Reserve Bank of San Francisco President Mary Daly noted on Monday that “risks to the Fed's mandates are becoming more balanced and that there is openness to the possibility of cutting rates in upcoming meetings.” Additionally, Chicago Fed President Austan Goolsbee stated that the central bank is prepared to act if economic or financial conditions worsen.
Mexican Peso FAQs
The Mexican Peso (MXN) is the most traded currency among its Latin American peers. Its value is broadly determined by the performance of the Mexican economy, the country’s central bank’s policy, the amount of foreign investment in the country and even the levels of remittances sent by Mexicans who live abroad, particularly in the United States. Geopolitical trends can also move MXN: for example, the process of nearshoring – or the decision by some firms to relocate manufacturing capacity and supply chains closer to their home countries – is also seen as a catalyst for the Mexican currency as the country is considered a key manufacturing hub in the American continent. Another catalyst for MXN is Oil prices as Mexico is a key exporter of the commodity.
The main objective of Mexico’s central bank, also known as Banxico, is to maintain inflation at low and stable levels (at or close to its target of 3%, the midpoint in a tolerance band of between 2% and 4%). To this end, the bank sets an appropriate level of interest rates. When inflation is too high, Banxico will attempt to tame it by raising interest rates, making it more expensive for households and businesses to borrow money, thus cooling demand and the overall economy. Higher interest rates are generally positive for the Mexican Peso (MXN) as they lead to higher yields, making the country a more attractive place for investors. On the contrary, lower interest rates tend to weaken MXN.
Macroeconomic data releases are key to assess the state of the economy and can have an impact on the Mexican Peso (MXN) valuation. A strong Mexican economy, based on high economic growth, low unemployment and high confidence is good for MXN. Not only does it attract more foreign investment but it may encourage the Bank of Mexico (Banxico) to increase interest rates, particularly if this strength comes together with elevated inflation. However, if economic data is weak, MXN is likely to depreciate.
As an emerging-market currency, the Mexican Peso (MXN) tends to strive during risk-on periods, or when investors perceive that broader market risks are low and thus are eager to engage with investments that carry a higher risk. Conversely, MXN tends to weaken at times of market turbulence or economic uncertainty as investors tend to sell higher-risk assets and flee to the more-stable safe havens.
- USD/CAD drifts lower for the third straight day, albeit lacks follow-through.
- An uptick in Oil prices underpins the Loonie and exerts pressure on the pair.
- A goodish pickup in the USD demand to lend some support and limit losses.
The USD/CAD pair sticks to its modest intraday losses during the early European session on Wednesday and currently trades around the 1.3775-1.3770 region. Spot prices, however, manage to hold above a two-week low touched on Tuesday, warranting some caution before positioning for an extension of this week's sharp retracement slide from the vicinity of mid-1.3900s, or a nearly two-year high.
Crude Oil prices gain some positive traction and for now, seem to have snapped a four-day losing streak to the lowest level since early February. This, in turn, is seen underpinning the commodity-linked Loonie and exerting some downward pressure on the USD/CAD pair for the third straight day. That said, concerns about an economic downturn in the US and China – the world's two largest economies – act as a headwind for the black liquid.
Apart from this, a goodish pickup in the US Dollar (USD) demand, bolstered by an uptick in the US Treasury bond yields, turns out to be another factor lending some support to the USD/CAD pair. Meanwhile, a generally positive tone around the equity markets, along with dovish Federal Reserve (Fed) expectations, might hold back the USD bulls from placing aggressive bets and support prospects for some meaningful downside for spot prices.
The aforementioned mixed fundamental backdrop, however, warrants some caution before placing aggressive directional bets in the absence of any relevant market-moving US economic data on Wednesday. Traders might also prefer to wait on the sidelines ahead of the monthly Canadian employment details, due for release on Friday. In the meantime, the USD/Oil price dynamics should produce short-term trading opportunities around the USD/CAD pair.
US Dollar PRICE Today
The table below shows the percentage change of US Dollar (USD) against listed major currencies today. US Dollar was the strongest against the Japanese Yen.
| USD | EUR | GBP | JPY | CAD | AUD | NZD | CHF | |
|---|---|---|---|---|---|---|---|---|
| USD | 0.12% | -0.12% | 1.66% | -0.07% | -0.38% | -0.90% | 0.54% | |
| EUR | -0.12% | -0.25% | 1.55% | -0.20% | -0.55% | -1.03% | 0.44% | |
| GBP | 0.12% | 0.25% | 1.79% | 0.04% | -0.31% | -0.74% | 0.66% | |
| JPY | -1.66% | -1.55% | -1.79% | -1.72% | -2.06% | -2.51% | -1.12% | |
| CAD | 0.07% | 0.20% | -0.04% | 1.72% | -0.32% | -0.79% | 0.63% | |
| AUD | 0.38% | 0.55% | 0.31% | 2.06% | 0.32% | -0.42% | 0.97% | |
| NZD | 0.90% | 1.03% | 0.74% | 2.51% | 0.79% | 0.42% | 1.41% | |
| CHF | -0.54% | -0.44% | -0.66% | 1.12% | -0.63% | -0.97% | -1.41% |
The heat map shows percentage changes of major currencies against each other. The base currency is picked from the left column, while the quote currency is picked from the top row. For example, if you pick the US Dollar from the left column and move along the horizontal line to the Japanese Yen, the percentage change displayed in the box will represent USD (base)/JPY (quote).
FX option expiries for Aug 7 NY cut at 10:00 Eastern Time, via DTCC, can be found below.
EUR/USD: EUR amounts
- 1.0750 718m
- 1.0825 863m
- 1.0850 1.1b
- 1.0950 570m
GBP/USD: GBP amounts
- 1.2650 449m
- 1.2830 656m
USD/JPY: USD amounts
- 147.35 1.3b
- 149.00 600m
- 149.25 1.3b
USD/CHF: USD amounts
- 0.8555 652m
- 0.8725 480m
AUD/USD: AUD amounts
- 0.6745 861m
USD/CAD: USD amounts
- 1.3625 729m
- 1.3750 620m
- 1.3875 631m
EUR/GBP: EUR amounts
- 0.8400 557m
- 0.8485 907m
- 0.8620 669m
- AUD/USD trades in positive territory around 0.6545 in Wednesday’s early European session, gaining 0.38% on the day.
- The RBA delivered hawkish interest rate guidance, lifting the Aussie.
- Market players have raised their bets on Fed rate cuts by 50 bps in September.
The AUD/USD pair extends the recovery near 0.6545 on Wednesday during the early European trading hours. The hawkish stance from the Reserve Bank of Australia (RBA) supports the Australian Dollar (AUD) against the Greenback. Investors will take more cues from RBA Governor Michele Bullock's speech on Thursday.
The RBA left interest rates on hold at 4.35% for the sixth consecutive meeting at its August policy meeting on Tuesday. RBA’s Bullock emphasized that inflation will remain a problem for some time yet before inflation is sustainably in the target range. Bullock further stated that the Australian central bank might need to maintain interest rates higher for an extended period. The RBA’s hawkish guidance on interest rates might boost the Aussie in the near term.
Elsewhere, the National Bureau of Statistics of China will publish the country’s Consumer Price Index (CPI) and Producer Price Index (PPI) for July. The CPI inflation is expected to rise to 0.3% in July from 0.2% in June, while the PPI is estimated to fall to 0.9% in the same report period. The worse-than-expected readings could raise the fear of an economic slowdown in China and weigh on the Aussie as China is Australia's largest trading partner.
On the USD’s front, traders are now raising bets on a deeper rate cut by the Federal Reserve (Fed). According to the CME FedWatch Tool, the markets are now pricing in nearly 85% odds that the Fed will cut the rate by 50 basis points (bps) in September, up from only 11.5% last week. JPMorgan chief economist Michael Feroli noted that there is a "strong case to act before the next scheduled policy meeting on September 17-18. The rising speculation of Fed rate cuts might undermine the US Dollar and create a tailwind for AUD/USD.
Australian Dollar FAQs
One of the most significant factors for the Australian Dollar (AUD) is the level of interest rates set by the Reserve Bank of Australia (RBA). Because Australia is a resource-rich country another key driver is the price of its biggest export, Iron Ore. The health of the Chinese economy, its largest trading partner, is a factor, as well as inflation in Australia, its growth rate and Trade Balance. Market sentiment – whether investors are taking on more risky assets (risk-on) or seeking safe-havens (risk-off) – is also a factor, with risk-on positive for AUD.
The Reserve Bank of Australia (RBA) influences the Australian Dollar (AUD) by setting the level of interest rates that Australian banks can lend to each other. This influences the level of interest rates in the economy as a whole. The main goal of the RBA is to maintain a stable inflation rate of 2-3% by adjusting interest rates up or down. Relatively high interest rates compared to other major central banks support the AUD, and the opposite for relatively low. The RBA can also use quantitative easing and tightening to influence credit conditions, with the former AUD-negative and the latter AUD-positive.
China is Australia’s largest trading partner so the health of the Chinese economy is a major influence on the value of the Australian Dollar (AUD). When the Chinese economy is doing well it purchases more raw materials, goods and services from Australia, lifting demand for the AUD, and pushing up its value. The opposite is the case when the Chinese economy is not growing as fast as expected. Positive or negative surprises in Chinese growth data, therefore, often have a direct impact on the Australian Dollar and its pairs.
Iron Ore is Australia’s largest export, accounting for $118 billion a year according to data from 2021, with China as its primary destination. The price of Iron Ore, therefore, can be a driver of the Australian Dollar. Generally, if the price of Iron Ore rises, AUD also goes up, as aggregate demand for the currency increases. The opposite is the case if the price of Iron Ore falls. Higher Iron Ore prices also tend to result in a greater likelihood of a positive Trade Balance for Australia, which is also positive of the AUD.
The Trade Balance, which is the difference between what a country earns from its exports versus what it pays for its imports, is another factor that can influence the value of the Australian Dollar. If Australia produces highly sought after exports, then its currency will gain in value purely from the surplus demand created from foreign buyers seeking to purchase its exports versus what it spends to purchase imports. Therefore, a positive net Trade Balance strengthens the AUD, with the opposite effect if the Trade Balance is negative.
- NZD/USD catches aggressive bids in reaction to the upbeat employment details.
- The momentum gets an additional boost after the release of Chinese trade data.
- A positive risk tone also benefits the Kiwi, though a stronger USD might cap gains.
The NZD/USD pair builds on its strong intraday gains and climbs to over a two-week high heading into the European session on Wednesday, with bulls now building on the momentum beyond the 0.6000 psychological mark.
The New Zealand Dollar (NZD) rallied hard following the release of better-than-expected employment details, showing that the number of employed people increased by 0.4% in the second quarter. The reading was better than the 0.2% decline registered in the previous quarter and market expectations. Adding to this, the unemployment rate rose less than consensus estimates, to 4.6% from 4.4% during the January-March quarter. The upbeat data lowered the likelihood of a rate cut by the Reserve Bank of New Zealand (RBNZ) and prompted aggressive short-covering around the NZD/USD pair.
Meanwhile, Chinese trade data released this Wednesday showed an unexpected surge in imports, by the 7.2% YoY rate in July, which suggested that domestic demand remains resilient. This, along with a generally positive risk tone, pushes the NZD/USD pair higher for the second successive day. It, however, remains to be seen if bulls can capitalize on the move amid a goodish pickup in the US Dollar (USD) demand, bolstered by a further recovery in the US Treasury bond yields. Moreover, geopolitical risks could cap the optimism in the markets and act as a headwind for the NZD/USD pair.
Moving ahead, there isn't any relevant market-moving economic data due for release from the US on Wednesday. Hence, the US bond yield will play a key role in influencing the USD price dynamics. Apart from this, the broader risk sentiment might contribute to providing some impetus to the NZD/USD pair ahead of the New Zealand second quarter inflation expectations data, due for release during the Asian session on Thursday.
Economic Indicator
Employment Change
The Employment Change, released by Statistics New Zealand, is a measure of the change in the number of employed people in New Zealand. Generally speaking, a rise in this indicator has positive implications for consumer spending and is stimulative of economic growth. A higher reading is seen as bullish for the New Zealand Dollar (NZD), while a lower reading is seen as bearish.
Read more.Last release: Tue Aug 06, 2024 22:45
Frequency: Quarterly
Actual: 0.4%
Consensus: -0.2%
Previous: -0.2%
Source: Stats NZ
Statistics New Zealand releases employment data on a quarterly basis. The statistics shed a light on New Zealand’s labor market, including unemployment and employment rates, demand for labor and changes in wages and salaries. These employment indicators tend to have an impact on the country’s inflation and Reserve Bank of New Zealand’s (RBNZ) interest rate decision, eventually affecting the NZD. A better-than-expected print could turn out to be NZD bullish.
Germany’s industrial sector returned to expansion in June, the latest data published by Destatis showed on Wednesday.
Industrial output in the Eurozone’s top economy increased by 1.4% MoM, the federal statistics authority Destatis said in figures adjusted for seasonal and calendar effects, as against an expected increase of 1.0% and a 2.5% drop registered in May.
After creating havoc in the Japanese Yen markets, Bank of Japan (BoJ) Deputy Governor Shinichi Uchida is back on the wires now, via Reuters, commenting on the bank’s next policy move, the recent market volatility and the economic outlook.
Key quotes
Market volatility very large, so will keep a close eye out on moves and their impact on economy, prices.
Real interest rates remain very low and will underpin economy.
Personally think there are now more factors that require being cautious, when asked about the BoJ’s next rate hike timing.
Personally think stock markets will calm down at some point given they reflect corporate earnings, state of Japan's economy.
There is no gap in views between governor and myself, my comments reflect changes in latest market developments after last week's BoJ meeting.
Personally think there are now factors that require more caution about raising interest rates.
Market reaction
The Japanese Yen trims gains following these above comments, as USD/JPY reverses sharply from near 148.00 toward 147.00. The pair is currently trading at 147.20, still up 2.20% on the day.
- EUR/JPY holds positive ground near 161.10 in Wednesday’s early European session, up 2.12% on the day.
- The bearish picture of the cross remains intact below the 100-period EMA.
- The first upside barrier emerges at 162.18; the initial support level is located at 157.30.
The EUR/JPY cross gathers strength near 161.10, snapping the seven-day losing streak during the early European session on Wednesday. Amidst the volatile session, the Japanese Yen (JPY) loses momentum after the dovish comments from the Japanese official. On Wednesday, Bank of Japan (BoJ) Deputy Governor Shinichi Uchida said that the central bank will not hike rates when markets are unstable.
According to the 4-hour chart, the bearish outlook of EUR/JPY prevails as the cross remains below the key 100-period Exponential Moving Averages (EMA). Nonetheless, the Relative Strength Index (RSI) holds above the midline, near 53.80, suggesting that further upside in the near term looks favorable.
In the bullish event, the first upside target emerges near the upper boundary of the Bollinger Band at 162.18. The next potential resistance level is located in the 162.90-163.00 zone, portraying the confluence of a psychological level and a high of August 1. Extended gains will see a rally to the 100-period EMA at 165.07.
On the downside, the initial support level for EUR/JPY is seen at 157.30, a low of August 6. The additional downside filter to watch is the lower limit of the Bollinger Band of 156.12, followed by a low of August 5 at 154.41.
EUR/JPY 4-hour chart
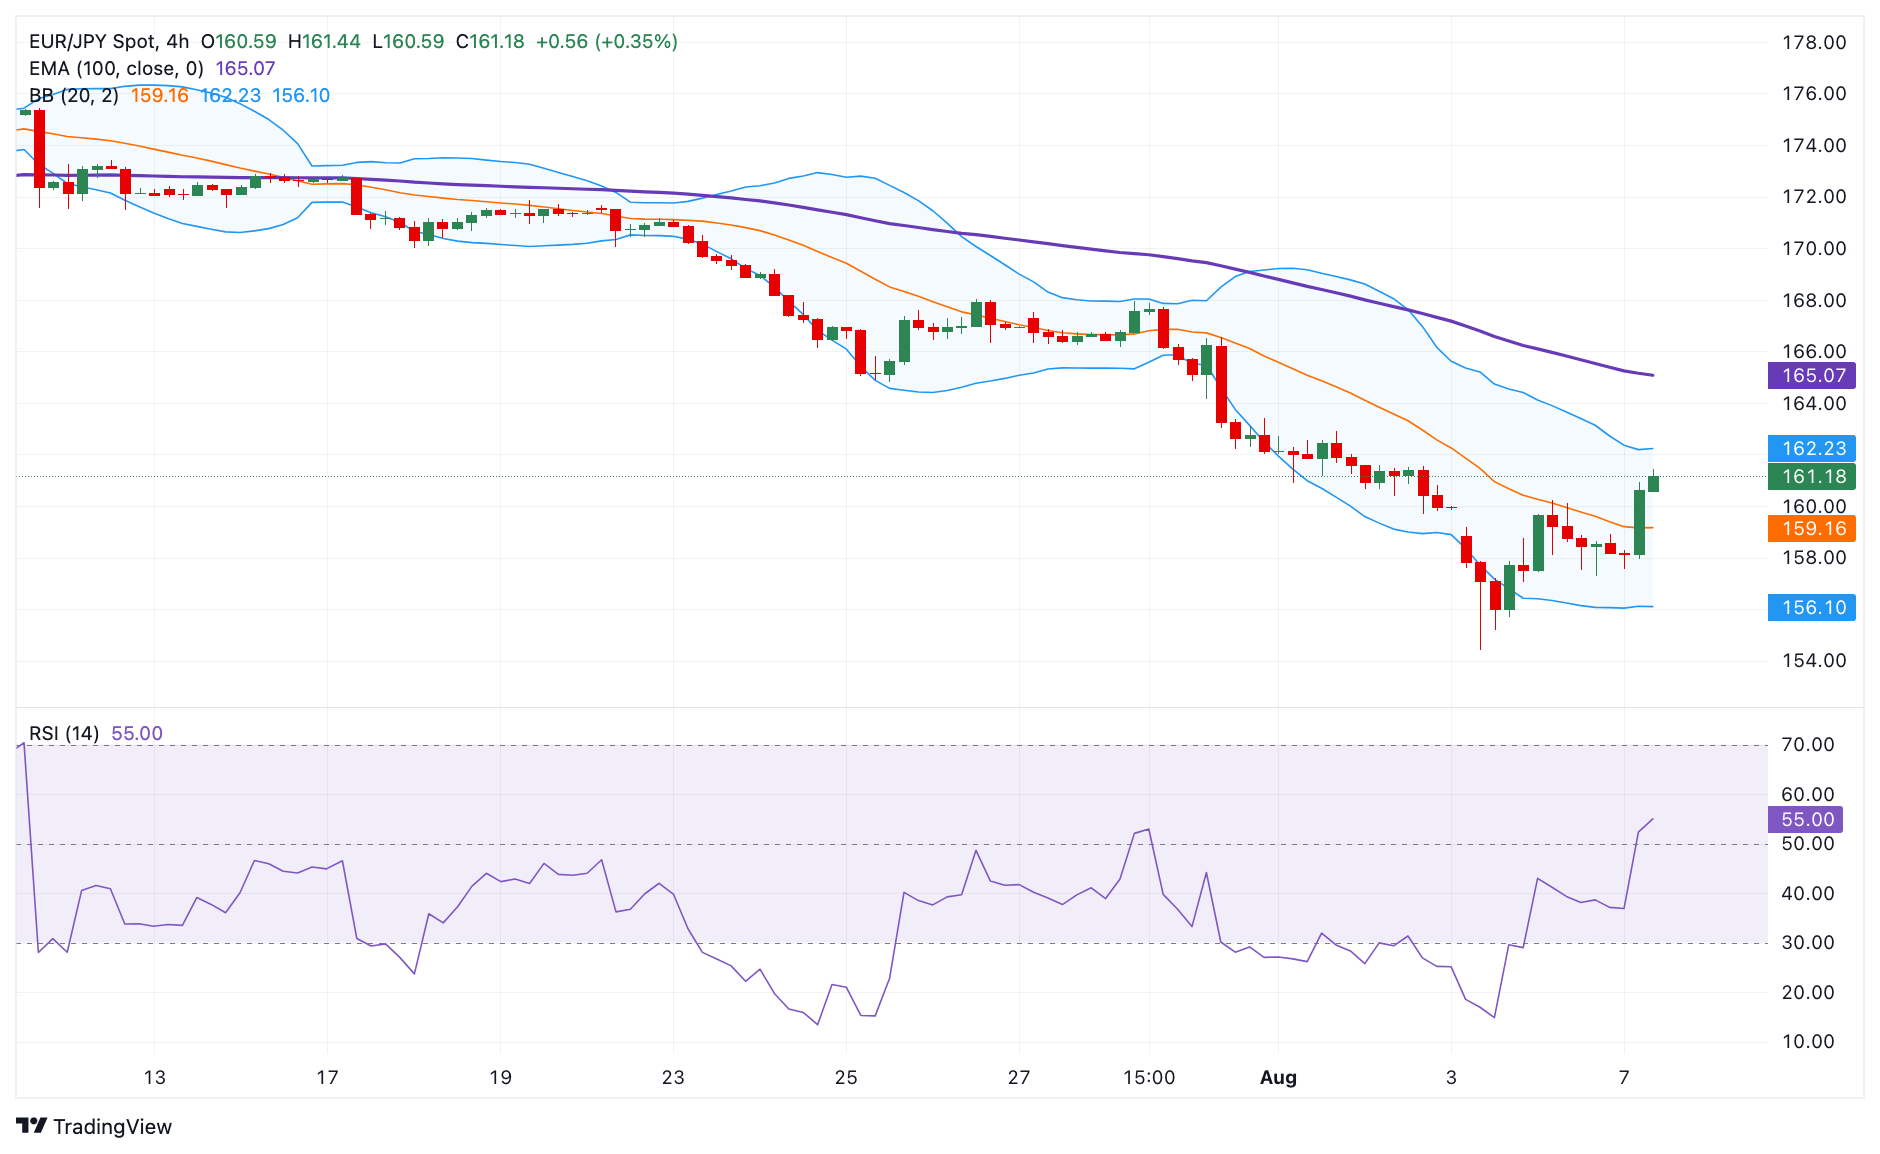
Bank of Japan FAQs
The Bank of Japan (BoJ) is the Japanese central bank, which sets monetary policy in the country. Its mandate is to issue banknotes and carry out currency and monetary control to ensure price stability, which means an inflation target of around 2%.
The Bank of Japan has embarked in an ultra-loose monetary policy since 2013 in order to stimulate the economy and fuel inflation amid a low-inflationary environment. The bank’s policy is based on Quantitative and Qualitative Easing (QQE), or printing notes to buy assets such as government or corporate bonds to provide liquidity. In 2016, the bank doubled down on its strategy and further loosened policy by first introducing negative interest rates and then directly controlling the yield of its 10-year government bonds.
The Bank’s massive stimulus has caused the Yen to depreciate against its main currency peers. This process has exacerbated more recently due to an increasing policy divergence between the Bank of Japan and other main central banks, which have opted to increase interest rates sharply to fight decades-high levels of inflation. The BoJ’s policy of holding down rates has led to a widening differential with other currencies, dragging down the value of the Yen.
A weaker Yen and the spike in global energy prices have led to an increase in Japanese inflation, which has exceeded the BoJ’s 2% target. With wage inflation becoming a cause of concern, the BoJ looks to move away from ultra loose policy, while trying to avoid slowing the activity too much.
Gold prices rose in India on Wednesday, according to data compiled by FXStreet.
The price for Gold stood at 6,461.82 Indian Rupees (INR) per gram, up compared with the INR 6,450.49 it cost on Tuesday.
The price for Gold increased to INR 75,370.05 per tola from INR 75,237.23 per tola a day earlier.
| Unit measure | Gold Price in INR |
|---|---|
| 1 Gram | 6,461.82 |
| 10 Grams | 64,619.29 |
| Tola | 75,370.05 |
| Troy Ounce | 200,981.90 |
FXStreet calculates Gold prices in India by adapting international prices (USD/INR) to the local currency and measurement units. Prices are updated daily based on the market rates taken at the time of publication. Prices are just for reference and local rates could diverge slightly.
Gold FAQs
Gold has played a key role in human’s history as it has been widely used as a store of value and medium of exchange. Currently, apart from its shine and usage for jewelry, the precious metal is widely seen as a safe-haven asset, meaning that it is considered a good investment during turbulent times. Gold is also widely seen as a hedge against inflation and against depreciating currencies as it doesn’t rely on any specific issuer or government.
Central banks are the biggest Gold holders. In their aim to support their currencies in turbulent times, central banks tend to diversify their reserves and buy Gold to improve the perceived strength of the economy and the currency. High Gold reserves can be a source of trust for a country’s solvency. Central banks added 1,136 tonnes of Gold worth around $70 billion to their reserves in 2022, according to data from the World Gold Council. This is the highest yearly purchase since records began. Central banks from emerging economies such as China, India and Turkey are quickly increasing their Gold reserves.
Gold has an inverse correlation with the US Dollar and US Treasuries, which are both major reserve and safe-haven assets. When the Dollar depreciates, Gold tends to rise, enabling investors and central banks to diversify their assets in turbulent times. Gold is also inversely correlated with risk assets. A rally in the stock market tends to weaken Gold price, while sell-offs in riskier markets tend to favor the precious metal.
The price can move due to a wide range of factors. Geopolitical instability or fears of a deep recession can quickly make Gold price escalate due to its safe-haven status. As a yield-less asset, Gold tends to rise with lower interest rates, while higher cost of money usually weighs down on the yellow metal. Still, most moves depend on how the US Dollar (USD) behaves as the asset is priced in dollars (XAU/USD). A strong Dollar tends to keep the price of Gold controlled, whereas a weaker Dollar is likely to push Gold prices up.
(An automation tool was used in creating this post.)
- USD/CHF advances as the US Dollar gains ground amid rising Treasury yields.
- The Greenback may struggle due to the rising odds of a 50-basis point Fed rate cut in September.
- Traders await the SNB’s FX Reserves data to understand the central bank’s interventions in influencing the Swiss Franc.
USD/CHF breaks its six-day losing streak, trading around 0.8590 during the Asian session on Wednesday. This upside is attributed to the improved US Dollar (USD) amid rising Treasury yields. The US Dollar Index (DXY) extends its gains for the second day, reaching 103.30 with 2-year and 10-year yields on US Treasury bonds standing at 4.02% and 3.91%, respectively, at the time of writing.
However, the rising expectations of a more aggressive rate cut starting in September after the weaker US employment data in July raised the fear of a looming US recession. This may put a cap on the upside of the USD/CHF pair. According to the CME FedWatch tool, there is now a 67.5% probability of a 50-basis point (bps) interest rate cut by the US Federal Reserve (Fed) in September, up from 13.2% a week earlier.
According to Reuters, Federal Reserve Bank of San Francisco President Mary Daly noted on Monday that “risks to the Fed's mandates are becoming more balanced and that there is openness to the possibility of cutting rates in upcoming meetings.” Additionally, Chicago Fed President Austan Goolsbee stated that the central bank is prepared to act if economic or financial conditions worsen.
In Switzerland, Real Retail Sales unexpectedly dropped by 2.2% year-on-year in June, falling short of market expectations for a 0.5% increase and following a revised 0.2% decline in May. This represents the second consecutive month of contraction in retail sales and the most significant decline since September 2023, data showed on Tuesday.
In July, the Swiss Unemployment Rate remained steady at 2.3% on a non-seasonally adjusted basis, unchanged from the previous three months. However, the seasonally adjusted jobless rate slightly increased to 2.5%, up from 2.4% previously.
Traders are likely looking out for the Foreign Currency Reserves data by the Swiss National Bank (SNB) scheduled to be released on Wednesday. This information sheds light on the SNB's activities in the currency market, particularly their efforts to influence the exchange rate of the Swiss Franc.
Swiss Franc FAQs
The Swiss Franc (CHF) is Switzerland’s official currency. It is among the top ten most traded currencies globally, reaching volumes that well exceed the size of the Swiss economy. Its value is determined by the broad market sentiment, the country’s economic health or action taken by the Swiss National Bank (SNB), among other factors. Between 2011 and 2015, the Swiss Franc was pegged to the Euro (EUR). The peg was abruptly removed, resulting in a more than 20% increase in the Franc’s value, causing a turmoil in markets. Even though the peg isn’t in force anymore, CHF fortunes tend to be highly correlated with the Euro ones due to the high dependency of the Swiss economy on the neighboring Eurozone.
The Swiss Franc (CHF) is considered a safe-haven asset, or a currency that investors tend to buy in times of market stress. This is due to the perceived status of Switzerland in the world: a stable economy, a strong export sector, big central bank reserves or a longstanding political stance towards neutrality in global conflicts make the country’s currency a good choice for investors fleeing from risks. Turbulent times are likely to strengthen CHF value against other currencies that are seen as more risky to invest in.
The Swiss National Bank (SNB) meets four times a year – once every quarter, less than other major central banks – to decide on monetary policy. The bank aims for an annual inflation rate of less than 2%. When inflation is above target or forecasted to be above target in the foreseeable future, the bank will attempt to tame price growth by raising its policy rate. Higher interest rates are generally positive for the Swiss Franc (CHF) as they lead to higher yields, making the country a more attractive place for investors. On the contrary, lower interest rates tend to weaken CHF.
Macroeconomic data releases in Switzerland are key to assessing the state of the economy and can impact the Swiss Franc’s (CHF) valuation. The Swiss economy is broadly stable, but any sudden change in economic growth, inflation, current account or the central bank’s currency reserves have the potential to trigger moves in CHF. Generally, high economic growth, low unemployment and high confidence are good for CHF. Conversely, if economic data points to weakening momentum, CHF is likely to depreciate.
As a small and open economy, Switzerland is heavily dependent on the health of the neighboring Eurozone economies. The broader European Union is Switzerland’s main economic partner and a key political ally, so macroeconomic and monetary policy stability in the Eurozone is essential for Switzerland and, thus, for the Swiss Franc (CHF). With such dependency, some models suggest that the correlation between the fortunes of the Euro (EUR) and the CHF is more than 90%, or close to perfect.
- EUR/USD trades in negative territory for the second consecutive day around 1.0915 in Wednesday’s Asian session.
- Traders expect a deeper Fed rate cut in September this year.
- The disappointing Eurozone June Retail Sales report exerts some selling pressure on the Euro.
The EUR/USD pair trades on a softer note near 1.0915 after retracing from seven-month highs of nearly 1.1008 during the Asian trading hours on Wednesday. The firmer US Dollar (USD) broadly drags the major pair lower. Investors await the release of June Trade Balance and Industrial Production from Germany, which are due later in the day.
The recovered risk sentiment and high US Treasury bond yields provide some support to the Greenback. Nonetheless, investors expect a more aggressive rate cut from the Federal Reserve (Fed) starting in September. This, in turn, might cap the USD’s upside and create a tailwind for EUR/USD. Meanwhile, the markets have priced in a 69.5% possibility of a 50 basis points (bps) Fed rate cut in September, up from 13.2% last week, according to the CME FedWatch tool.
On the US docket, the trade deficit narrowed to $73.1 billion in June as the value of exports of goods and services increased by the most since earlier this year, according to the US Census Bureau on Tuesday.
On the other hand, more sluggish evidence about the eurozone economy exerts some selling pressure on the Euro (EUR). Data released by Eurostat revealed on Tuesday that Eurozone Retail sales unexpectedly fell by 0.3% in June versus a rise of 0.5% prior. The market consensus was a 0.1% increase.
Euro FAQs
The Euro is the currency for the 20 European Union countries that belong to the Eurozone. It is the second most heavily traded currency in the world behind the US Dollar. In 2022, it accounted for 31% of all foreign exchange transactions, with an average daily turnover of over $2.2 trillion a day. EUR/USD is the most heavily traded currency pair in the world, accounting for an estimated 30% off all transactions, followed by EUR/JPY (4%), EUR/GBP (3%) and EUR/AUD (2%).
The European Central Bank (ECB) in Frankfurt, Germany, is the reserve bank for the Eurozone. The ECB sets interest rates and manages monetary policy. The ECB’s primary mandate is to maintain price stability, which means either controlling inflation or stimulating growth. Its primary tool is the raising or lowering of interest rates. Relatively high interest rates – or the expectation of higher rates – will usually benefit the Euro and vice versa. The ECB Governing Council makes monetary policy decisions at meetings held eight times a year. Decisions are made by heads of the Eurozone national banks and six permanent members, including the President of the ECB, Christine Lagarde.
Eurozone inflation data, measured by the Harmonized Index of Consumer Prices (HICP), is an important econometric for the Euro. If inflation rises more than expected, especially if above the ECB’s 2% target, it obliges the ECB to raise interest rates to bring it back under control. Relatively high interest rates compared to its counterparts will usually benefit the Euro, as it makes the region more attractive as a place for global investors to park their money.
Data releases gauge the health of the economy and can impact on the Euro. Indicators such as GDP, Manufacturing and Services PMIs, employment, and consumer sentiment surveys can all influence the direction of the single currency. A strong economy is good for the Euro. Not only does it attract more foreign investment but it may encourage the ECB to put up interest rates, which will directly strengthen the Euro. Otherwise, if economic data is weak, the Euro is likely to fall. Economic data for the four largest economies in the euro area (Germany, France, Italy and Spain) are especially significant, as they account for 75% of the Eurozone’s economy.
Another significant data release for the Euro is the Trade Balance. This indicator measures the difference between what a country earns from its exports and what it spends on imports over a given period. If a country produces highly sought after exports then its currency will gain in value purely from the extra demand created from foreign buyers seeking to purchase these goods. Therefore, a positive net Trade Balance strengthens a currency and vice versa for a negative balance.
- AUD/JPY catches aggressive bids in reaction to dovish remarks by BoJ’s Uchida.
- A positive risk tone further undermines the safe-haven JPY and lends support.
- The RBA’s hawkish stance and the upbeat Chinese import data act as a tailwind.
The AUD/JPY cross builds on this week's goodish recovery move from the vicinity of the 90.00 psychological mark, or its lowest level since May 2023 and gains positive traction for the second straight day on Wednesday. The strong intraday momentum lifts spot prices to a fresh weekly peak, around the 97.00 round figure during the Asian session and is sponsored by a combination of factors.
The Japanese Yen (JPY) comes under intense selling pressure in reaction to dovish remarks from Bank of Japan (BoJ) Deputy Governor Shinichi Uchida, saying that the central bank won't hike rates when markets are unstable. This comes on top of signs of stability in the global financial markets, which is seen as another factor undermining demand for the safe-haven JPY and lending some support to the AUD/JPY cross.
The Australian Dollar (AUD), on the other hand, continues to draw support from the Reserve Bank of Australia's (RBA) hawkish outlook on Tuesday, indicating that it will keep policy restrictive in the wake of still sticky inflation. Meanwhile, Chinese trade data released this Wednesday showed an unexpected surge in imports, by the 7.2% YoY rate in July, which suggested that domestic demand remains resilient.
Investors, however, remain worried about signs of cooling economic growth in China – the world's second-largest economy. Apart from this, geopolitical risks stemming from the ongoing conflicts in the Middle East should keep a lid on the market optimism. This, in turn, could offer some support to the JPY and cap gains for the AUD/JPY cross, warranting some caution before positioning for any further appreciating move.
Economic Indicator
Trade Balance CNY
The Trade Balance released by the General Administration of Customs of the People’s Republic of China is a balance between exports and imports of total goods and services. A positive value shows trade surplus, while a negative value shows trade deficit. It is an event that generates some volatility for the CNY. As the Chinese economy has influence on the global economy, this economic indicator would have an impact on the Forex market. In general, a high reading is seen as positive (or bullish) CNY, while a low reading is seen as negative (or bearish) for the CNY.
Read more.Last release: Wed Aug 07, 2024 03:00
Frequency: Monthly
Actual: 601.9B
Consensus: -
Previous: 703.73B
- GBP/USD edges higher due to the rising expectations of a 50-basis point rate cut by the Fed in September.
- CME FedWatch tool indicates 67.5% odds of a 50-basis point Fed rate cut in September, up from 13.2% last week.
- The British Pound may struggle due to rising odds of a quarter-basis point rate cut by the BoE in August.
GBP/USD retraces its recent losses, trading around 1.2710 during the Asian session on Wednesday. This upside could be attributed to the tepid US Dollar (USD) following the rising expectations of a more aggressive rate cut starting in September after the weaker US employment data in July raised the fear of a looming US recession.
According to the CME FedWatch tool, there is now a 67.5% probability of a 50-basis point (bps) interest rate cut by the US Federal Reserve (Fed) in September, up from 13.2% a week earlier.
According to Reuters, Federal Reserve Bank of San Francisco President Mary Daly noted on Monday that “risks to the Fed's mandates are becoming more balanced and that there is openness to the possibility of cutting rates in upcoming meetings.” Additionally, Chicago Fed President Austan Goolsbee stated that the central bank is prepared to act if economic or financial conditions worsen.
Across the pond, the Pound Sterling (GBP) faced challenges as the Bank of England (BoE) implemented a widely anticipated 25-basis point rate cut at its August meeting. Additionally, market expectations now include the possibility of two further quarter-point rate cuts by the BoE by December.
The British Pound's upside potential could be limited by a general risk aversion. Concerns about escalating Middle East conflicts were heightened after Iran-backed Hezbollah launched dozens of missiles at Israel in response to the assassination of Hamas leader Ismail Haniyeh by an Israeli airstrike in Tehran.
British Pound PRICE Today
The table below shows the percentage change of British Pound (GBP) against listed major currencies today. British Pound was the strongest against the Japanese Yen.
| USD | EUR | GBP | JPY | CAD | AUD | NZD | CHF | |
|---|---|---|---|---|---|---|---|---|
| USD | 0.16% | -0.15% | 2.00% | -0.08% | -0.55% | -0.96% | 0.73% | |
| EUR | -0.16% | -0.31% | 1.83% | -0.24% | -0.75% | -1.12% | 0.62% | |
| GBP | 0.15% | 0.31% | 2.13% | 0.07% | -0.44% | -0.76% | 0.89% | |
| JPY | -2.00% | -1.83% | -2.13% | -2.01% | -2.51% | -2.85% | -1.22% | |
| CAD | 0.08% | 0.24% | -0.07% | 2.01% | -0.49% | -0.84% | 0.83% | |
| AUD | 0.55% | 0.75% | 0.44% | 2.51% | 0.49% | -0.31% | 1.34% | |
| NZD | 0.96% | 1.12% | 0.76% | 2.85% | 0.84% | 0.31% | 1.66% | |
| CHF | -0.73% | -0.62% | -0.89% | 1.22% | -0.83% | -1.34% | -1.66% |
The heat map shows percentage changes of major currencies against each other. The base currency is picked from the left column, while the quote currency is picked from the top row. For example, if you pick the British Pound from the left column and move along the horizontal line to the US Dollar, the percentage change displayed in the box will represent GBP (base)/USD (quote).
Pound Sterling FAQs
The Pound Sterling (GBP) is the oldest currency in the world (886 AD) and the official currency of the United Kingdom. It is the fourth most traded unit for foreign exchange (FX) in the world, accounting for 12% of all transactions, averaging $630 billion a day, according to 2022 data. Its key trading pairs are GBP/USD, aka ‘Cable’, which accounts for 11% of FX, GBP/JPY, or the ‘Dragon’ as it is known by traders (3%), and EUR/GBP (2%). The Pound Sterling is issued by the Bank of England (BoE).
The single most important factor influencing the value of the Pound Sterling is monetary policy decided by the Bank of England. The BoE bases its decisions on whether it has achieved its primary goal of “price stability” – a steady inflation rate of around 2%. Its primary tool for achieving this is the adjustment of interest rates. When inflation is too high, the BoE will try to rein it in by raising interest rates, making it more expensive for people and businesses to access credit. This is generally positive for GBP, as higher interest rates make the UK a more attractive place for global investors to park their money. When inflation falls too low it is a sign economic growth is slowing. In this scenario, the BoE will consider lowering interest rates to cheapen credit so businesses will borrow more to invest in growth-generating projects.
Data releases gauge the health of the economy and can impact the value of the Pound Sterling. Indicators such as GDP, Manufacturing and Services PMIs, and employment can all influence the direction of the GBP. A strong economy is good for Sterling. Not only does it attract more foreign investment but it may encourage the BoE to put up interest rates, which will directly strengthen GBP. Otherwise, if economic data is weak, the Pound Sterling is likely to fall.
Another significant data release for the Pound Sterling is the Trade Balance. This indicator measures the difference between what a country earns from its exports and what it spends on imports over a given period. If a country produces highly sought-after exports, its currency will benefit purely from the extra demand created from foreign buyers seeking to purchase these goods. Therefore, a positive net Trade Balance strengthens a currency and vice versa for a negative balance.
- Silver gains some positive traction on Wednesday, albeit it lacks follow-through.
- The setup supports prospects for the emergence of fresh selling at higher levels.
- A sustained strength beyond mid-$27.00 could pave the way for additional gains.
Silver (XAG/USD) attracts some dip-buyers near the $26.75 region during the Asian session on Wednesday, albeit lacks bullish conviction and remains confined in the previous day's broader trading range. The white metal is currently placed just above the $27.00 mark, up around 0.35% for the day.
From a technical perspective, the recent breakdown through the 100-day Simple Moving Average (SMA) and last week's failure to find acceptance above the $29.00 mark favors bearish traders. Moreover, oscillators on the daily chart are holding deep in negative territory and are still away from being in the oversold zone. This, along with the lack of strong follow-through buying, warrants some caution before positioning for any meaningful recovery from a three-month low reached on Monday.
In the meantime, any subsequent move up is likely to confront some resistance near the $27.50 horizontal zone, above which a bout of a short-covering move could lift the XAG/USD beyond the $28.00 mark, to the $28.20 hurdle. The momentum could extend further, though is likely to remain capped near the 100-day SMA support breakpoint, near the $28.70 region. This is followed by the $29.00 round figure, which if cleared will shift the near-term bias back in favor of bullish traders.
On the flip side, the $26.60-$26.50 region now seems to have emerged as an immediate support. A convincing break below will reaffirm the negative bias and make the XAG/USD vulnerable to test the May monthly swing low, around the $26.00 mark. The next relevant support is pegged near the $25.60 horizontal zone, below which the white metal could accelerate the fall towards the $25.00 psychological mark before eventually dropping to the $24.40-$24.30 support zone.
Silver daily chart
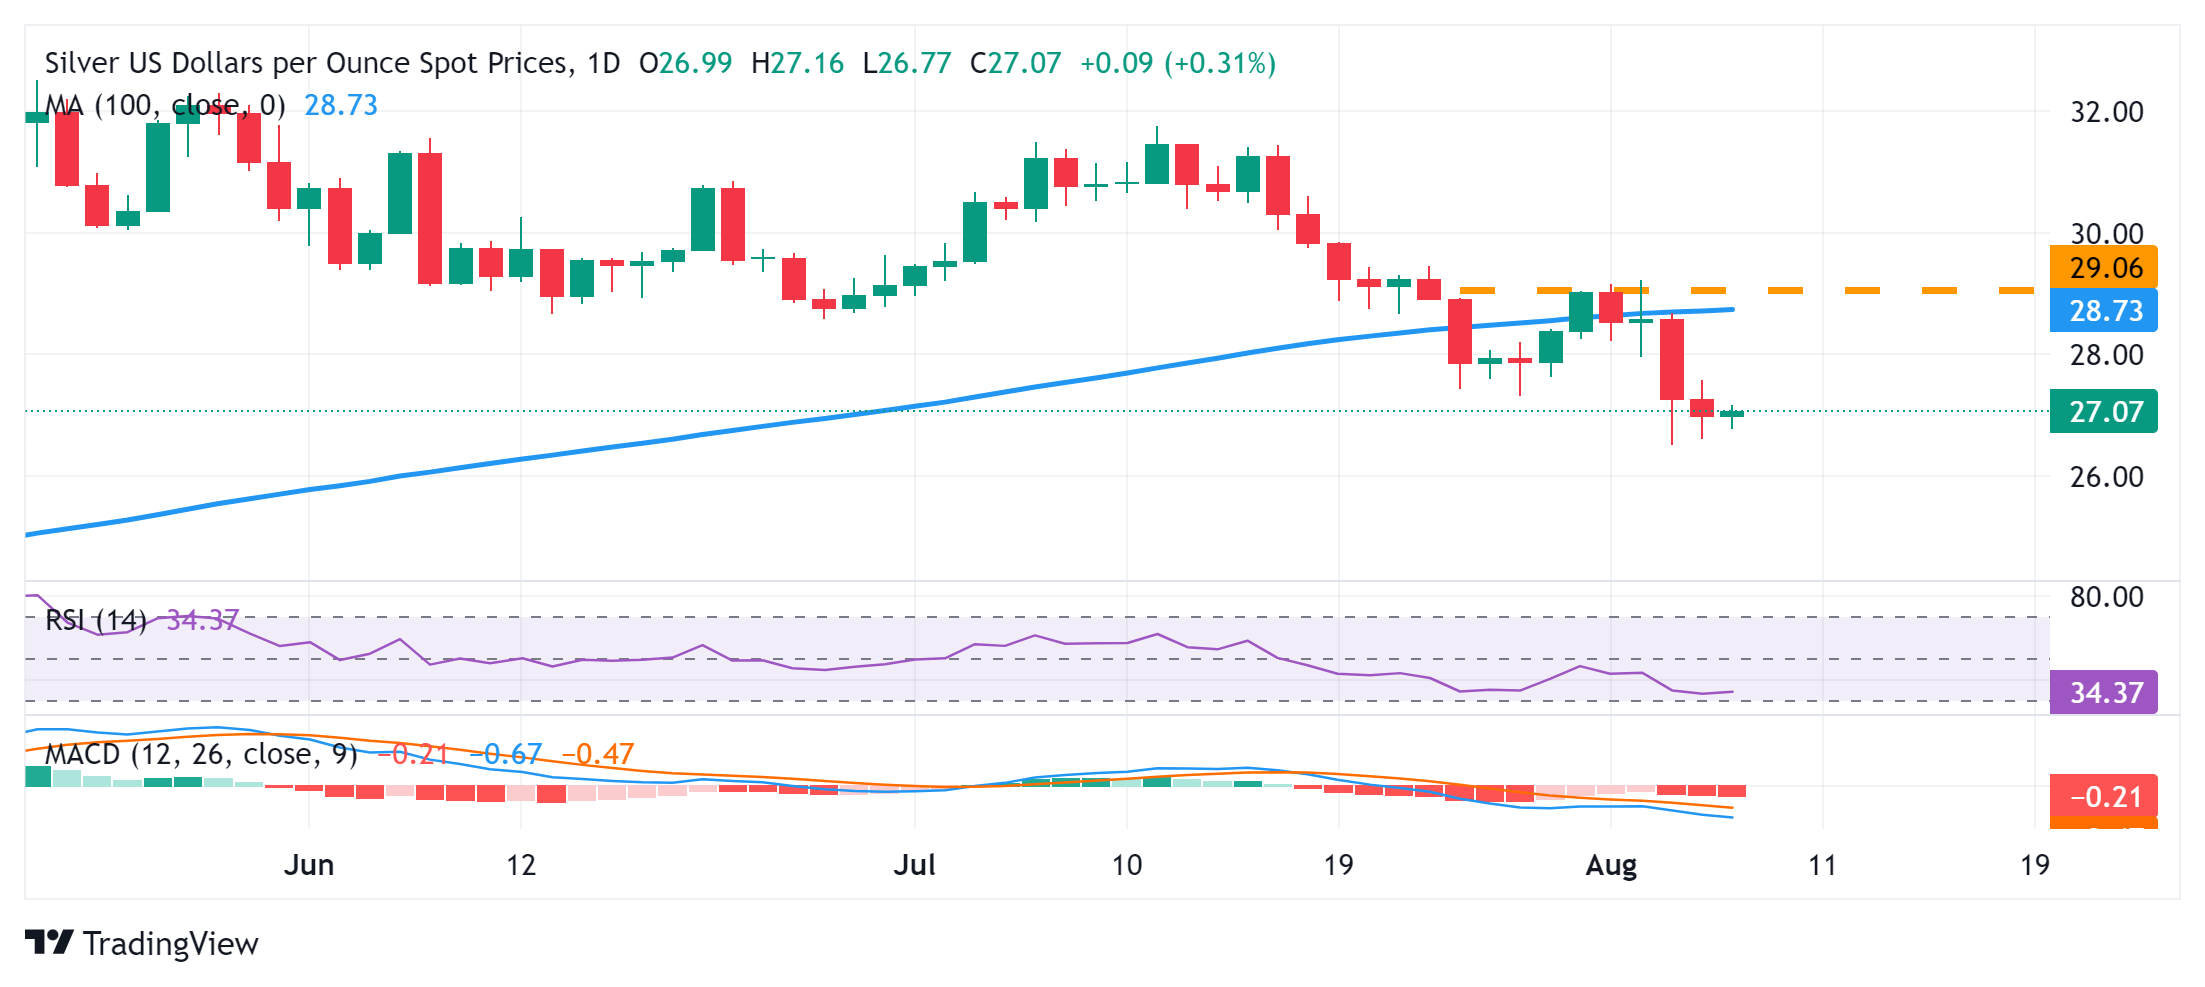
Silver FAQs
Silver is a precious metal highly traded among investors. It has been historically used as a store of value and a medium of exchange. Although less popular than Gold, traders may turn to Silver to diversify their investment portfolio, for its intrinsic value or as a potential hedge during high-inflation periods. Investors can buy physical Silver, in coins or in bars, or trade it through vehicles such as Exchange Traded Funds, which track its price on international markets.
Silver prices can move due to a wide range of factors. Geopolitical instability or fears of a deep recession can make Silver price escalate due to its safe-haven status, although to a lesser extent than Gold's. As a yieldless asset, Silver tends to rise with lower interest rates. Its moves also depend on how the US Dollar (USD) behaves as the asset is priced in dollars (XAG/USD). A strong Dollar tends to keep the price of Silver at bay, whereas a weaker Dollar is likely to propel prices up. Other factors such as investment demand, mining supply – Silver is much more abundant than Gold – and recycling rates can also affect prices.
Silver is widely used in industry, particularly in sectors such as electronics or solar energy, as it has one of the highest electric conductivity of all metals – more than Copper and Gold. A surge in demand can increase prices, while a decline tends to lower them. Dynamics in the US, Chinese and Indian economies can also contribute to price swings: for the US and particularly China, their big industrial sectors use Silver in various processes; in India, consumers’ demand for the precious metal for jewellery also plays a key role in setting prices.
Silver prices tend to follow Gold's moves. When Gold prices rise, Silver typically follows suit, as their status as safe-haven assets is similar. The Gold/Silver ratio, which shows the number of ounces of Silver needed to equal the value of one ounce of Gold, may help to determine the relative valuation between both metals. Some investors may consider a high ratio as an indicator that Silver is undervalued, or Gold is overvalued. On the contrary, a low ratio might suggest that Gold is undervalued relative to Silver.
China's Trade Balance for July, in Chinese Yuan terms, came in at CNY601.98 billion, shrinking from the previous figure of CNY703.77 billion.
Exports increased by 6.5% YoY in July vs. 10.7% seen in June. The country’s imports rebounded 6.6% YoY in the same period vs. -0.6% recorded previously.
In US Dollar terms, China’s trade surplus shrank in July.
Trade Balance came in at +84.65B versus +99B expected and +99.05B previous.
Exports (YoY): 7.0% vs. 9.7% expected and 8.6% previous.
Imports (YoY): 7.2% vs. 3.5% expected and -2.3% last.
Additional takeaways
China Jan-July USD-denominated exports +4.0% YoY.
China Jan-July USD-denominated Imports +2.8% YoY.
China July trade surplus with the US was $30.84 bln, vs $31.78 bln surplus in June.
China Jan-July trade surplus with the US. +$190.64 bln.
FX implications
AUD/USD shrugs off the narrowing of China’s trade surplus. The pair is up 0.51% on the day, trading at 0.6552, at the time of writing.
Australian Dollar FAQs
One of the most significant factors for the Australian Dollar (AUD) is the level of interest rates set by the Reserve Bank of Australia (RBA). Because Australia is a resource-rich country another key driver is the price of its biggest export, Iron Ore. The health of the Chinese economy, its largest trading partner, is a factor, as well as inflation in Australia, its growth rate and Trade Balance. Market sentiment – whether investors are taking on more risky assets (risk-on) or seeking safe-havens (risk-off) – is also a factor, with risk-on positive for AUD.
The Reserve Bank of Australia (RBA) influences the Australian Dollar (AUD) by setting the level of interest rates that Australian banks can lend to each other. This influences the level of interest rates in the economy as a whole. The main goal of the RBA is to maintain a stable inflation rate of 2-3% by adjusting interest rates up or down. Relatively high interest rates compared to other major central banks support the AUD, and the opposite for relatively low. The RBA can also use quantitative easing and tightening to influence credit conditions, with the former AUD-negative and the latter AUD-positive.
China is Australia’s largest trading partner so the health of the Chinese economy is a major influence on the value of the Australian Dollar (AUD). When the Chinese economy is doing well it purchases more raw materials, goods and services from Australia, lifting demand for the AUD, and pushing up its value. The opposite is the case when the Chinese economy is not growing as fast as expected. Positive or negative surprises in Chinese growth data, therefore, often have a direct impact on the Australian Dollar and its pairs.
Iron Ore is Australia’s largest export, accounting for $118 billion a year according to data from 2021, with China as its primary destination. The price of Iron Ore, therefore, can be a driver of the Australian Dollar. Generally, if the price of Iron Ore rises, AUD also goes up, as aggregate demand for the currency increases. The opposite is the case if the price of Iron Ore falls. Higher Iron Ore prices also tend to result in a greater likelihood of a positive Trade Balance for Australia, which is also positive of the AUD.
The Trade Balance, which is the difference between what a country earns from its exports versus what it pays for its imports, is another factor that can influence the value of the Australian Dollar. If Australia produces highly sought after exports, then its currency will gain in value purely from the surplus demand created from foreign buyers seeking to purchase its exports versus what it spends to purchase imports. Therefore, a positive net Trade Balance strengthens the AUD, with the opposite effect if the Trade Balance is negative.
- The Japanese Yen continues to lose ground following the dovish remarks from BoJ Deputy Governor Shinichi Uchida.
- BoJ’s Uchida emphasized that the central bank must maintain its current level of monetary easing for the time being.
- CME FedWatch tool suggests 67.5% odds of a 50-basis point Fed rate cut in September, up from 13.2% last week.
The Japanese Yen (JPY) extends its losses against the US Dollar (USD) for the second successive day. This downside could be attributed to the comments from Bank of Japan (BoJ) Deputy Governor Shinichi Uchida on Wednesday, “We won’t raise rates when markets are unstable,” according to Reuters.
Deputy Governor Uchida also noted that the BoJ's interest rate strategy will adapt if market volatility alters economic forecasts, risk assessments, or projections. Given recent market volatility, he emphasized the need for careful monitoring of the economic and price impacts of their policies, stating, “We must maintain the current degree of monetary easing for the time being.”
The upside potential for the USD/JPY pair may be limited as the US Dollar faces challenges, with markets anticipating a more substantial rate cut beginning in September. According to the CME FedWatch tool, there is now a 67.5% probability of a 50-basis point (bps) interest rate cut by the US Federal Reserve (Fed) in September, up from 13.2% a week earlier.
Daily Digest Market Movers: Japanese Yen weakens following remarks from BoJ’s Uchida
- Japan’s Chief Cabinet Secretary Yoshimasa Hayashi stated on Tuesday that “wage increases are expected to extend to part-timers and small businesses by autumn, supported by strong Shunto results and minimum wage hikes.” Hayashi did not provide comments on foreign exchange levels.
- Japan’s Labor Cash Earnings data showed a 4.5% year-on-year increase in average income for June, surpassing both the previous 2.0% and the expected 2.3% readings. This is the highest increase since January 1997, reinforcing Japan's transition toward a rising interest rate environment.
- According to Reuters, Federal Reserve Bank of San Francisco President Mary Daly expressed increased confidence on Monday that US inflation is moving towards the Fed's 2% target. Daly noted that “risks to the Fed's mandates are becoming more balanced and that there is openness to the possibility of cutting rates in upcoming meetings.”
- Chicago Fed President Austan Goolsbee stated on Monday that the US central bank is prepared to act if economic or financial conditions worsen. Goolsbee emphasized, "We're forward-looking about it, and so if the conditions collectively start coming in like that on the through line, there’s deterioration on any of those parts, we’re going to fix it.” according to Reuters.
- The minutes from the Bank of Japan's June meeting showed that some members expressed concerns about rising import prices due to the recent decline in the JPY, which could pose an upside risk to inflation. One member noted that cost-push inflation might intensify underlying inflation if it results in higher inflation expectations and wage increases.
- The Bank of Japan (BoJ) released the full version of its Quarterly Outlook Report on Thursday, noting that there is a possibility wages and inflation could exceed expectations. This could be accompanied by rising inflation expectations and a tight labor market.
Technical Analysis: USD/JPY rises to near 146.50
USD/JPY trades around 146.70 on Wednesday. The daily chart analysis shows that the pair continues to rise toward the nine-day Exponential Moving Average (EMA) at 148.57 level, suggesting a weakening of the bearish momentum. Additionally, the 14-day Relative Strength Index (RSI) is below 30, signaling that the currency pair is oversold and could see a short-term rebound.
Regarding support, the USD/JPY pair may test the throwback support at the 140.25 level, which was recorded in December.
In terms of resistance, the USD/JPY pair might face a barrier at the nine-day Exponential Moving Average (EMA) around 149.22. A breakout above this level could reduce bearish momentum and enable the pair to test the "throwback support turned resistance" at 154.50, followed by the 50-day EMA at 155.58.
USD/JPY: Daily Chart
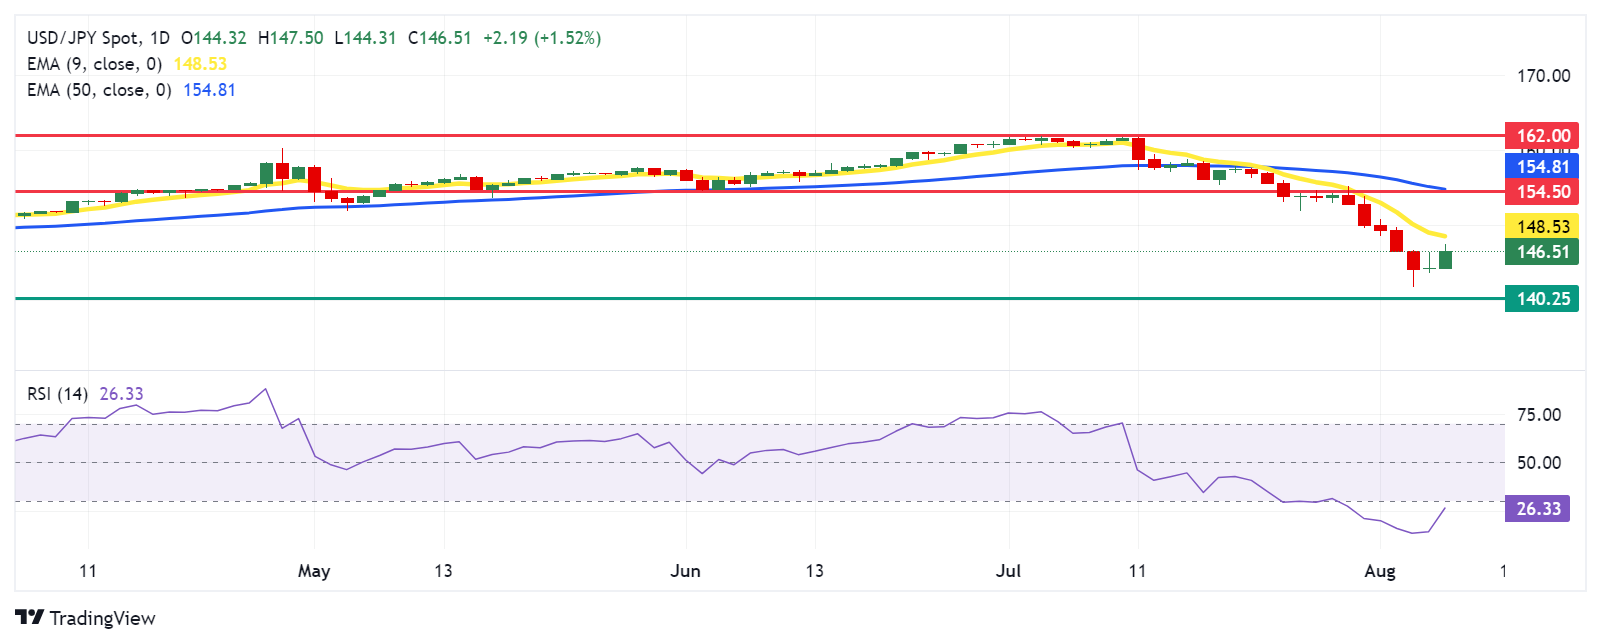
Japanese Yen PRICE Today
The table below shows the percentage change of Japanese Yen (JPY) against listed major currencies today. Japanese Yen was the weakest against the New Zealand Dollar.
| USD | EUR | GBP | JPY | CAD | AUD | NZD | CHF | |
|---|---|---|---|---|---|---|---|---|
| USD | 0.14% | -0.13% | 1.70% | -0.04% | -0.37% | -0.88% | 0.59% | |
| EUR | -0.14% | -0.27% | 1.60% | -0.18% | -0.54% | -1.02% | 0.47% | |
| GBP | 0.13% | 0.27% | 1.85% | 0.08% | -0.28% | -0.70% | 0.72% | |
| JPY | -1.70% | -1.60% | -1.85% | -1.73% | -2.09% | -2.54% | -1.12% | |
| CAD | 0.04% | 0.18% | -0.08% | 1.73% | -0.34% | -0.80% | 0.64% | |
| AUD | 0.37% | 0.54% | 0.28% | 2.09% | 0.34% | -0.42% | 1.01% | |
| NZD | 0.88% | 1.02% | 0.70% | 2.54% | 0.80% | 0.42% | 1.43% | |
| CHF | -0.59% | -0.47% | -0.72% | 1.12% | -0.64% | -1.01% | -1.43% |
The heat map shows percentage changes of major currencies against each other. The base currency is picked from the left column, while the quote currency is picked from the top row. For example, if you pick the Japanese Yen from the left column and move along the horizontal line to the US Dollar, the percentage change displayed in the box will represent JPY (base)/USD (quote).
Bank of Japan FAQs
The Bank of Japan (BoJ) is the Japanese central bank, which sets monetary policy in the country. Its mandate is to issue banknotes and carry out currency and monetary control to ensure price stability, which means an inflation target of around 2%.
The Bank of Japan has embarked in an ultra-loose monetary policy since 2013 in order to stimulate the economy and fuel inflation amid a low-inflationary environment. The bank’s policy is based on Quantitative and Qualitative Easing (QQE), or printing notes to buy assets such as government or corporate bonds to provide liquidity. In 2016, the bank doubled down on its strategy and further loosened policy by first introducing negative interest rates and then directly controlling the yield of its 10-year government bonds.
The Bank’s massive stimulus has caused the Yen to depreciate against its main currency peers. This process has exacerbated more recently due to an increasing policy divergence between the Bank of Japan and other main central banks, which have opted to increase interest rates sharply to fight decades-high levels of inflation. The BoJ’s policy of holding down rates has led to a widening differential with other currencies, dragging down the value of the Yen.
A weaker Yen and the spike in global energy prices have led to an increase in Japanese inflation, which has exceeded the BoJ’s 2% target. With wage inflation becoming a cause of concern, the BoJ looks to move away from ultra loose policy, while trying to avoid slowing the activity too much.
- The Indian Rupee recovers in Wednesday’s early Asian session.
- Possible RBI intervention to sell USD might support INR; higher crude oil prices, foreign outflows might weigh on its upside.
- Investors will closely watch the RBI’s MPC interest rate decision on Thursday, with no change in repo rate expected.
The Indian Rupee (INR) edges higher on Wednesday despite the stronger US Dollar (USD). The downside of the local currency is likely to be limited as potential intervention from the Reserve Bank of India (RBI) might prevent the local currency from volatility in the near term. However, the recovery of crude oil prices amid ongoing geopolitical tensions in the Middle East might drag the INR lower as India is the world’s third-largest consumer of oil. Additionally, the worries about foreign outflows from India and other emerging markets could weigh on the INR.
All eyes will be on the RBI’s Monetary Policy Committee (MPC) meeting on Thursday. Any indication of a dovish shift in the central bank's August meeting policy may further exert some selling pressure on the Rupee.
Daily Digest Market Movers: Indian Rupee gains ground amid multiple challenges
- The Reserve Bank of India's Monetary Policy Committee (MPC) is expected to keep the policy rate at 6.5%. Market experts believe that the RBI is likely to give up its hawkish tilt and pivot to a neutral stance on Thursday.
- "Domestic policy focus is to boost manufacturing and exports, for which one of the things that we may require is a slightly cheaper currency, but current account deficit trends have favored a less undervalued currency," said Dhiraj Nim, a FX strategist at ANZ.
- S&P Global Ratings noted on Tuesday that India stands out both on growth and external fronts amongst the South Asian countries, and the trajectory of the government's fiscal deficit will decide on the direction of sovereign ratings.
- India's economy is expected to expand by 7.0–7.2% in the current fiscal year, owing to strong economic fundamentals and the continuation of domestic policy reforms, according to Deloitte India.
- The US trade deficit narrowed to $73.1 billion in June as the value of exports of goods and services increased by the most since earlier this year, Commerce Department data showed Tuesday.
Technical analysis: USD/INR’s constructive outlook prevails
Indian Rupee trades on a weaker note on the day. The USD/INR pair keeps the bullish vibe on the daily timeframe, characterized by holding above the key 100-day Exponential Moving Average (EMA) and being underpinned by the uptrend line since June 3. The 14-day Relative Strength Index (RSI) indicates upward momentum, suggesting potential for a short-term upside.
The upside target appears at the 84.00 psychological barrier. A sustained breakout above the mentioned level could spur buyers to the next hurdle at 84.50.
On the downside, the uptrend line around 83.78 acts as an initial support level for USD/INR. A breach of this level will see a drop to the 100-day EMA at 83.49. If bearish momentum continues, look for further downside towards the 83.10-83.00 region, representing the round mark and a low of June 4.
US Dollar price today
The table below shows the percentage change of US Dollar (USD) against listed major currencies today. US Dollar was the weakest against the New Zealand Dollar.
| USD | EUR | GBP | CAD | AUD | JPY | NZD | CHF | |
| USD | 0.06% | -0.19% | -0.10% | -0.54% | 1.27% | -0.58% | 0.37% | |
| EUR | -0.07% | -0.28% | -0.16% | -0.61% | 1.17% | -0.62% | 0.33% | |
| GBP | 0.19% | 0.24% | 0.08% | -0.37% | 1.43% | -0.37% | 0.55% | |
| CAD | 0.10% | 0.15% | -0.11% | -0.43% | 1.43% | -0.49% | 0.50% | |
| AUD | 0.54% | 0.60% | 0.33% | 0.44% | 1.80% | -0.06% | 0.91% | |
| JPY | -1.29% | -1.26% | -1.44% | -1.34% | -1.85% | -1.80% | -0.87% | |
| NZD | 0.60% | 0.61% | 0.36% | 0.45% | 0.03% | 1.81% | 0.94% | |
| CHF | -0.40% | -0.34% | -0.59% | -0.51% | -0.92% | 0.90% | -0.98% |
The heat map shows percentage changes of major currencies against each other. The base currency is picked from the left column, while the quote currency is picked from the top row. For example, if you pick the Euro from the left column and move along the horizontal line to the Japanese Yen, the percentage change displayed in the box will represent EUR (base)/JPY (quote).
Indian Rupee FAQs
The Indian Rupee (INR) is one of the most sensitive currencies to external factors. The price of Crude Oil (the country is highly dependent on imported Oil), the value of the US Dollar – most trade is conducted in USD – and the level of foreign investment, are all influential. Direct intervention by the Reserve Bank of India (RBI) in FX markets to keep the exchange rate stable, as well as the level of interest rates set by the RBI, are further major influencing factors on the Rupee.
The Reserve Bank of India (RBI) actively intervenes in forex markets to maintain a stable exchange rate, to help facilitate trade. In addition, the RBI tries to maintain the inflation rate at its 4% target by adjusting interest rates. Higher interest rates usually strengthen the Rupee. This is due to the role of the ‘carry trade’ in which investors borrow in countries with lower interest rates so as to place their money in countries’ offering relatively higher interest rates and profit from the difference.
Macroeconomic factors that influence the value of the Rupee include inflation, interest rates, the economic growth rate (GDP), the balance of trade, and inflows from foreign investment. A higher growth rate can lead to more overseas investment, pushing up demand for the Rupee. A less negative balance of trade will eventually lead to a stronger Rupee. Higher interest rates, especially real rates (interest rates less inflation) are also positive for the Rupee. A risk-on environment can lead to greater inflows of Foreign Direct and Indirect Investment (FDI and FII), which also benefit the Rupee.
Higher inflation, particularly, if it is comparatively higher than India’s peers, is generally negative for the currency as it reflects devaluation through oversupply. Inflation also increases the cost of exports, leading to more Rupees being sold to purchase foreign imports, which is Rupee-negative. At the same time, higher inflation usually leads to the Reserve Bank of India (RBI) raising interest rates and this can be positive for the Rupee, due to increased demand from international investors. The opposite effect is true of lower inflation.
Japan’s Chief Cabinet Secretary Yoshimasa Hayashi declined to comment on the daily stock market moves on Wednesday.
Additional comments
Will do utmost in managing economic, fiscal policy while working with Bank of Japan.
No change in government policy to promote shift to investment to savings.
Market reaction
At press time, USD/JPY is trading 1.65% higher on the day, consolidating at around 146.70.
| Raw materials | Closed | Change, % |
|---|---|---|
| Silver | 26.92 | -1.22 |
| Gold | 238.801 | -0.96 |
| Palladium | 868.07 | 1.81 |
- GBP/JPY rallies over 400 pips intraday after BoJ Deputy Governor Uchida’s remarks.
- A positive risk tone further undermines the safe-haven JPY and remains supportive.
- The lack of follow-through buying warrants caution before placing fresh bullish bets.
The GBP/JPY cross catches aggressive bids during the Asian session on Wednesday and touches an intraday high, around the 187.25 region in reaction to dovish remarks from the Bank of Japan (BoJ) official. Spot prices, however, trim a part of strong intraday gains and currently trade around mid-186.00s, still up 1.80% for the day.
The Japanese Yen (JPY) weakens across the board after BoJ Deputy Governor Shinichi Uchida said that the central bank won't hike rates when markets are unstable, pushing the GBP/JPY cross higher. Uchida added that the interest rate path will obviously change if, as a result of market volatility, economic forecasts, views on risks and likelihood of achieving projections change.
Apart from this, a generally positive tone around the equity markets dents the JPY's relative safe-haven status against its British counterpart and offers support to the GBP/JPY cross. Investors, however, seem convinced that the BoJ will tighten monetary policy again. The bets were reaffirmed by data on Monday, which showed a rise in Japan's real wages in June for the first time in more than two years.
Furthermore, public broadcaster NHK reported that the Japanese labour ministry has decided to raise the national average minimum wage by about 5% – the biggest ever jump. This, along with geopolitical risks stemming from the ongoing conflicts in the Middle East, might hold back the JPY bears from placing aggressive bets and keep a lid on any further appreciating move for the GBP/JPY cross.
The British Pound (GBP), on the other hand, might continue to be weighed down by the Bank of England's (BoE) first interest rate cut in more than four years, from a 16-year high to 5.0% last Thursday. This further makes it prudent to wait for strong follow-through buying before confirming that the GBP/JPY cross has bottomed out near the 180.00 mark, or its lowest level since January touched on Monday.
Bank of Japan FAQs
The Bank of Japan (BoJ) is the Japanese central bank, which sets monetary policy in the country. Its mandate is to issue banknotes and carry out currency and monetary control to ensure price stability, which means an inflation target of around 2%.
The Bank of Japan has embarked in an ultra-loose monetary policy since 2013 in order to stimulate the economy and fuel inflation amid a low-inflationary environment. The bank’s policy is based on Quantitative and Qualitative Easing (QQE), or printing notes to buy assets such as government or corporate bonds to provide liquidity. In 2016, the bank doubled down on its strategy and further loosened policy by first introducing negative interest rates and then directly controlling the yield of its 10-year government bonds.
The Bank’s massive stimulus has caused the Yen to depreciate against its main currency peers. This process has exacerbated more recently due to an increasing policy divergence between the Bank of Japan and other main central banks, which have opted to increase interest rates sharply to fight decades-high levels of inflation. The BoJ’s policy of holding down rates has led to a widening differential with other currencies, dragging down the value of the Yen.
A weaker Yen and the spike in global energy prices have led to an increase in Japanese inflation, which has exceeded the BoJ’s 2% target. With wage inflation becoming a cause of concern, the BoJ looks to move away from ultra loose policy, while trying to avoid slowing the activity too much.
- A combination of factors exerts pressure on the Gold price for the fourth successive day.
- Signs of stability in the equity markets undermine the metal amid modest USD strength.
- Bets for a 50-bps Fed rate cut in September and geopolitical risks to limit further losses.
Gold price (XAU/USD) prolongs its recent pullback from the vicinity of the record high and drifts lower for the fourth straight day on Wednesday, although the downfall lacks bearish conviction. Global equity markets seem to have stabilized following the recent steep losses. This, along with a modest US Dollar (USD) strength, turns out to be a key factor exerting downward pressure on the precious metal.
Meanwhile, the incoming softer US macro data fueled concerns that the world's largest economy was slowing faster than initially expected. This comes on top of China's economic woes, which, along with escalating geopolitical tensions in the Middle East, might cap any optimism in the markets. Apart from this, dovish Federal Reserve (Fed) expectations could act as a tailwind for the non-yielding Gold price.
Daily Digest Market Movers: Gold price is undermined by positive risk tone and rebounding US bond yields-led USD uptick
- A global sell-off in the equity markets – triggered by fears of the US tipping into recession – seems to have eased amid some bargain buying and exert some pressure on the safe-haven Gold price on Wednesday.
- The US Treasury bond yields build on the overnight advance, which was their biggest rise since early June – and lend support to the US Dollar, which is further seen undermining the non-yielding yellow metal.
- Government data released on Tuesday showed that the US trade deficit fell by 2.5%, to $73.1 billion in June from $75.0 billion in May owing to a 1.5% rise in exports of aircraft and US-produced oil and gas.
- The markets are pricing in a 100% chance that the Federal Reserve will start lowering borrowing costs at the upcoming policy meeting in September and a near 70% probability of a 50-basis-point rate cut.
- This, in turn, should keep a lid on the US bond yields and the USD, which, along with geopolitical risks stemming from the ongoing conflicts in the Middle East, might act as a tailwind for the XAU/USD.
- Lebanese group Hezbollah launched a series of drone and rocket attacks against Israel on Tuesday in retaliation to Israel’s reported killings of a top Hezbollah commander and Hamas leader last week.
- The market might now move into a typical pattern of consolidation in the absence of any relevant macro data from the US and await the next major fundamental catalyst before placing fresh directional bets.
Technical Analysis: Gold price needs to find acceptance below the 50-day SMA pivotal support for bears to seize control
From a technical perspective, any subsequent decline might continue to find some support near the 50-day Simple Moving Average (SMA), pegged near the $2,368-2,367 region. This is followed by last week's swing low, around the $2,353-2,352 zone and the $2,344 area, or the 100-day SMA. Sustained weakness below the latter will be seen as a fresh trigger for bearish traders and pave the way for deeper losses. Given that oscillators on the daily chart have just started gaining negative traction, the Gold price might then accelerate the downfall towards challenging the $2,300 round figure.
On the flip side, recovery back above the $2,400 mark is likely to face some resistance near the overnight swing high, around the $2,418 region. Some follow-through buying could lift the Gold price beyond the $2,430 barrier, towards the next relevant hurdle near the $2,448-2,450 horizontal zone. The momentum could extend further towards the $2,468-2,469 region en route to the all-time peak, near the $2,483-2,484 area touched in July. Bulls might then aim to conquer the $2,500 psychological mark, which if cleared decisively will set the stage for a further near-term appreciating move.
Gold FAQs
Gold has played a key role in human’s history as it has been widely used as a store of value and medium of exchange. Currently, apart from its shine and usage for jewelry, the precious metal is widely seen as a safe-haven asset, meaning that it is considered a good investment during turbulent times. Gold is also widely seen as a hedge against inflation and against depreciating currencies as it doesn’t rely on any specific issuer or government.
Central banks are the biggest Gold holders. In their aim to support their currencies in turbulent times, central banks tend to diversify their reserves and buy Gold to improve the perceived strength of the economy and the currency. High Gold reserves can be a source of trust for a country’s solvency. Central banks added 1,136 tonnes of Gold worth around $70 billion to their reserves in 2022, according to data from the World Gold Council. This is the highest yearly purchase since records began. Central banks from emerging economies such as China, India and Turkey are quickly increasing their Gold reserves.
Gold has an inverse correlation with the US Dollar and US Treasuries, which are both major reserve and safe-haven assets. When the Dollar depreciates, Gold tends to rise, enabling investors and central banks to diversify their assets in turbulent times. Gold is also inversely correlated with risk assets. A rally in the stock market tends to weaken Gold price, while sell-offs in riskier markets tend to favor the precious metal.
The price can move due to a wide range of factors. Geopolitical instability or fears of a deep recession can quickly make Gold price escalate due to its safe-haven status. As a yield-less asset, Gold tends to rise with lower interest rates, while higher cost of money usually weighs down on the yellow metal. Still, most moves depend on how the US Dollar (USD) behaves as the asset is priced in dollars (XAU/USD). A strong Dollar tends to keep the price of Gold controlled, whereas a weaker Dollar is likely to push Gold prices up.
Bank of Japan (BoJ) Deputy Governor Shinichi Uchida expressed his view on the bank’s interest rate outlook, exchange value and the current market volatility.
Key quotes
Our interest rate path will obviously change if, as a result of market volatility, our economic forecasts, view on risks and likelihood of achieving our projection change.
Japan is not in an environment where we would be behind the curve unless we hike rates at set pace.
We won't hike rates when markets are unstable.
Personally believe US economy can achieve soft landing.
See no big change to Japan, US, economic fundamentals so market reaction to single US data appears too big.
Recent market moves are extremely volatile so watching impact of their moves on economy, prices with extreme vigilance, will respond appropriately in guiding policy.
We must maintain current degree of monetary easing for the time being.
Japan's real interest rate very low, monetary conditions very accomodative.
If economy, prices move in line with projections, it is appropriate to adjust degree of monetary easing.
Degree, speed of FX moves' impact on prices bigger than in past.
Weak yen and subsequent rise in import costs pose upside risks to inflation.
Short-term interest rate, at 0.25%, is still very low on real basis, so we continue to support economy with very loose policy.
Given rapid market volatility, we need to maintain current level of monetary easing.
Stock market volatility affects corporate activity, consumption so is important factor in guiding monetary policy.
Reversal of weak Yen means risk of inflation overshoot has diminished, which would affect our policy.
Expect Japan's consumption to stay solid.
Changes seen in Japan's labor market are structural and irreversable.
It is true over 10 years of massive monetary easing has caused various side-effects.
Our scheduled tapering of bond buying likely won't cause major changes in degree of monetary easing.
Short-term rates have bigger effect of stimulating economy than long-term rates.
Market reaction
The Japanese Yen sees a fresh bout of selling following these dovish remarks from the BoJ official, as USD/JPY storms through the roof to retest 147.50. The pair is currently trading at 146.82, still up 1.75% on the day.
- The Australian Dollar remains stronger due to the hawkish sentiment surrounding the RBA’s policy outlook.
- RBA Governor Michele Bullock stated that near-term rate cuts do not align with their current strategy.
- The US Dollar struggles as recent employment data fueled higher odds of a Fed rate cut in September.
The Australian Dollar (AUD) extends its gains against the US Dollar (USD) for the second consecutive session on Wednesday. This upside is attributed to the Reserve Bank of Australia's (RBA) monetary policy decision on Tuesday. The RBA maintained the Official Cash Rate (OCR) at 4.35% for the sixth time.
RBA Governor Michele Bullock highlighted the ongoing risk that inflation might take too long to return to target and noted that interest rates might need to remain higher for an extended period. Bullock stated that a near-term reduction in the cash rate does not align with their current strategy.
However, the second-quarter inflation data has diminished expectations for another RBA rate hike. Markets estimate an RBA rate cut in November, a move anticipated much earlier than previously forecasted for April next year.
The AUD/USD pair could further strengthen as the US Dollar receives pressure since markets expect a more aggressive rate cut starting in September after the weaker US employment data in July raised the fear of a looming US recession.
Daily Digest Market Movers: Australian Dollar advances due to hawkish RBA
- The AiG Australian Industry Index showed a slight easing in contraction in July, improving to -20.7 from the previous -25.6 reading. Despite this improvement, the index has indicated contraction for the past twenty-seven months.
- On Wednesday, Treasurer Jim Chalmers contested the RBA's view that the economy remains too robust and that large government budgets are contributing to prolonged inflation, according to Macrobusiness.
- On Tuesday, RBA Governor Michele Bullock mentioned that the board had seriously considered increasing the cash rate from 4.35% to 4.6% due to ongoing concerns about excess demand in the economy. Additionally, RBA Chief Economist Sarah Hunter noted on Wednesday that the Australian economy is performing somewhat stronger than previously anticipated by the RBA.
- According to Reuters, Federal Reserve Bank of San Francisco President Mary Daly expressed increased confidence on Monday that US inflation is moving towards the Fed's 2% target. Daly noted that “risks to the Fed's mandates are becoming more balanced and that there is openness to the possibility of cutting rates in upcoming meetings.”
- Chicago Fed President Austan Goolsbee stated on Monday that the US central bank is prepared to act if economic or financial conditions worsen. Goolsbee emphasized, "We're forward-looking about it, and so if the conditions collectively start coming in like that on the through line, there’s deterioration on any of those parts, we’re going to fix it.” according to Reuters.
- The Judo Bank Australia Composite PMI dropped to 49.9 in July from 50.2 in June, falling below the neutral 50 mark for the first time since January. The Services PMI decreased to 50.4 in July from 51.8 in June. While this represents the sixth consecutive month of expansion in services activity, the growth rate was marginal and the slowest observed in this sequence.
Technical Analysis: Australian Dollar advances to near 0.6550
The Australian Dollar trades around 0.6540 on Wednesday. The daily chart analysis shows that the AUD/USD pair has broken above the descending channel, signaling a reduction in bearish momentum. Furthermore, the 14-day Relative Strength Index (RSI) is rising from the oversold 30 level, indicating a potential for further upward movement.
In terms of support, the upper boundary of the descending channel around the level of 0.6490 could act as immediate support. A return to the descending channel could reinforce the bearish bias and exert pressure on the AUD/USD pair to test the throwback support of 0.6470 level, followed by the lower boundary of the descending channel around the level of 0.6430
On the upside, the nine-day Exponential Moving Average (EMA) at 0.6540 serves as immediate resistance, with additional resistance at the 0.6575 level, where "throwback support" has turned into resistance. A breakout above this level could push the AUD/USD pair toward a six-month high of 0.6798.
AUD/USD: Daily Chart
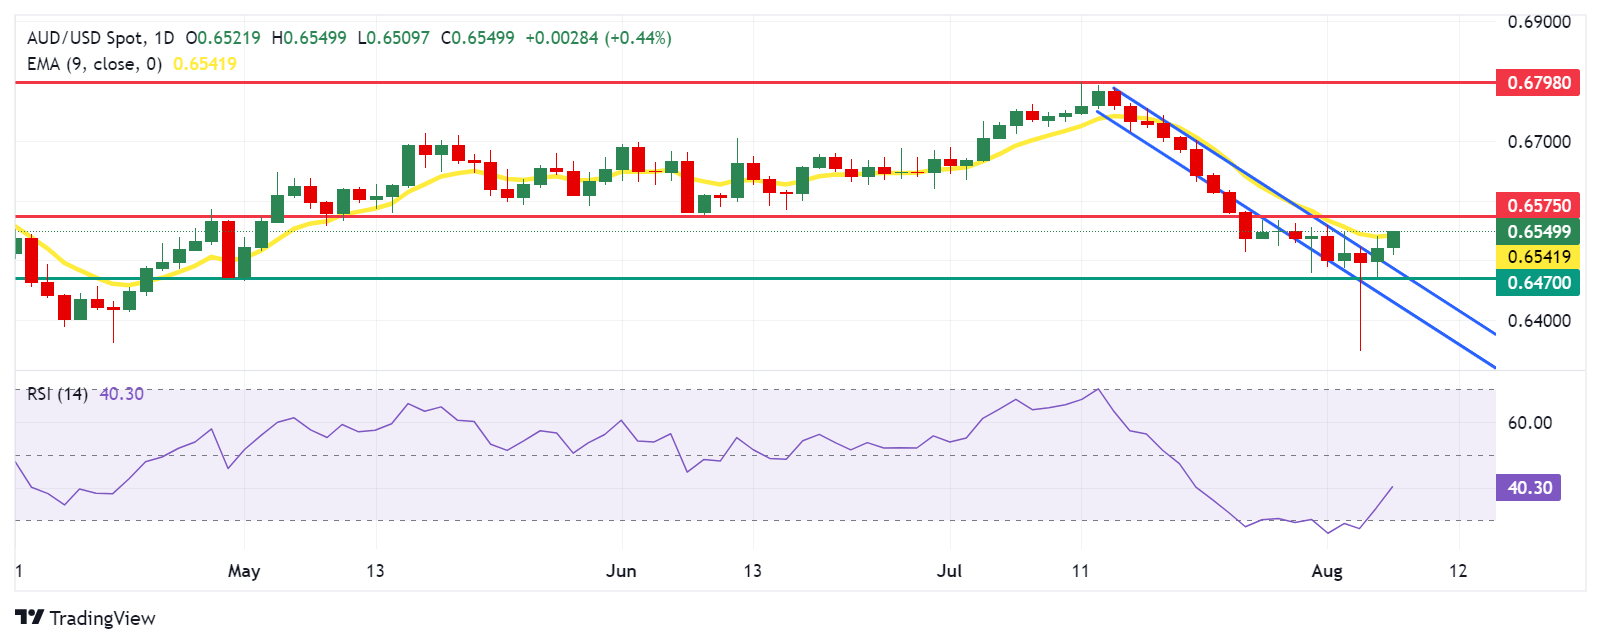
Australian Dollar PRICE Today
The table below shows the percentage change of Australian Dollar (AUD) against listed major currencies today. Australian Dollar was the strongest against the Japanese Yen.
| USD | EUR | GBP | JPY | CAD | AUD | NZD | CHF | |
|---|---|---|---|---|---|---|---|---|
| USD | 0.14% | -0.06% | 1.58% | -0.04% | -0.42% | -1.00% | 0.59% | |
| EUR | -0.14% | -0.20% | 1.39% | -0.18% | -0.60% | -1.14% | 0.46% | |
| GBP | 0.06% | 0.20% | 1.60% | 0.02% | -0.41% | -0.89% | 0.65% | |
| JPY | -1.58% | -1.39% | -1.60% | -1.49% | -1.90% | -2.39% | -0.86% | |
| CAD | 0.04% | 0.18% | -0.02% | 1.49% | -0.40% | -0.93% | 0.64% | |
| AUD | 0.42% | 0.60% | 0.41% | 1.90% | 0.40% | -0.48% | 1.07% | |
| NZD | 1.00% | 1.14% | 0.89% | 2.39% | 0.93% | 0.48% | 1.56% | |
| CHF | -0.59% | -0.46% | -0.65% | 0.86% | -0.64% | -1.07% | -1.56% |
The heat map shows percentage changes of major currencies against each other. The base currency is picked from the left column, while the quote currency is picked from the top row. For example, if you pick the Australian Dollar from the left column and move along the horizontal line to the US Dollar, the percentage change displayed in the box will represent AUD (base)/USD (quote).
Australian Dollar FAQs
One of the most significant factors for the Australian Dollar (AUD) is the level of interest rates set by the Reserve Bank of Australia (RBA). Because Australia is a resource-rich country another key driver is the price of its biggest export, Iron Ore. The health of the Chinese economy, its largest trading partner, is a factor, as well as inflation in Australia, its growth rate and Trade Balance. Market sentiment – whether investors are taking on more risky assets (risk-on) or seeking safe-havens (risk-off) – is also a factor, with risk-on positive for AUD.
The Reserve Bank of Australia (RBA) influences the Australian Dollar (AUD) by setting the level of interest rates that Australian banks can lend to each other. This influences the level of interest rates in the economy as a whole. The main goal of the RBA is to maintain a stable inflation rate of 2-3% by adjusting interest rates up or down. Relatively high interest rates compared to other major central banks support the AUD, and the opposite for relatively low. The RBA can also use quantitative easing and tightening to influence credit conditions, with the former AUD-negative and the latter AUD-positive.
China is Australia’s largest trading partner so the health of the Chinese economy is a major influence on the value of the Australian Dollar (AUD). When the Chinese economy is doing well it purchases more raw materials, goods and services from Australia, lifting demand for the AUD, and pushing up its value. The opposite is the case when the Chinese economy is not growing as fast as expected. Positive or negative surprises in Chinese growth data, therefore, often have a direct impact on the Australian Dollar and its pairs.
Iron Ore is Australia’s largest export, accounting for $118 billion a year according to data from 2021, with China as its primary destination. The price of Iron Ore, therefore, can be a driver of the Australian Dollar. Generally, if the price of Iron Ore rises, AUD also goes up, as aggregate demand for the currency increases. The opposite is the case if the price of Iron Ore falls. Higher Iron Ore prices also tend to result in a greater likelihood of a positive Trade Balance for Australia, which is also positive of the AUD.
The Trade Balance, which is the difference between what a country earns from its exports versus what it pays for its imports, is another factor that can influence the value of the Australian Dollar. If Australia produces highly sought after exports, then its currency will gain in value purely from the surplus demand created from foreign buyers seeking to purchase its exports versus what it spends to purchase imports. Therefore, a positive net Trade Balance strengthens the AUD, with the opposite effect if the Trade Balance is negative.
On Wednesday, the People’s Bank of China (PBOC) set the USD/CNY central rate for the trading session ahead at 7.1386, as against the previous day's fix of 7.1318 and 7.1481 Reuters estimates.
- WTI price rebounds near $72.50 in Wednesday’s early Asian session.
- Fear of a wider Middle East war might cap the WTI’s downside in the near term.
- Worries over Chinese demand might drag the price lower.
West Texas Intermediate (WTI), the US crude oil benchmark, is trading around $72.50 on Thursday. WTI price recovers its recent losses amid concerns about escalating geopolitical tensions in the Middle East. However, deteriorating macroeconomics might cap the upside for black gold in the near term.
Fear of a wider Middle East conflict boosts the WTI price. Iran's vow of retaliation against Israel and the US following the assassination of two militant leaders has sparked fears of a broader Middle East conflict, potentially affecting oil supplies from the region, per Reuters.
The optimistic report from the latest US Energy Information Administration (EIA) report might provide some support for the WTI price. The EIA raised its forecast for crude oil demand in the US, expecting consumption to average 20.5 million barrels per day in 2024, up from the forecast in July of 20.4 million bpd. However, the agency revised down its average oil price forecasts for this year and 2025, citing recent declines precipitated by economic concerns.
About the data, crude oil stockpiles in the United States for the week ending August 2 increased by 180K barrels, compared to -4.495 million barrels in the previous week. The market consensus estimated that stocks would decline by 4.495 million barrels, according to the American Petroleum Institute (API) on Wednesday. "Oil fundamentals are still suggesting an undersupplied oil market, with oil inventories still falling," UBS analyst Giovanni Staunovo said.
On the other hand, sluggish Chinese demand could weigh on the WTI price as China is the top largest consumer of oil in the world. The Chinese Trade Balance is due on Wednesday, and Consumer Price Index (CPI) inflation data will be released on Friday. The CPI is expected to show an increase of 0.3% YoY in July, compared to the previous reading of 0.2%. Oil traders will take cues from these reports and find trading opportunities surrounding the WTI price.
WTI Oil FAQs
WTI Oil is a type of Crude Oil sold on international markets. The WTI stands for West Texas Intermediate, one of three major types including Brent and Dubai Crude. WTI is also referred to as “light” and “sweet” because of its relatively low gravity and sulfur content respectively. It is considered a high quality Oil that is easily refined. It is sourced in the United States and distributed via the Cushing hub, which is considered “The Pipeline Crossroads of the World”. It is a benchmark for the Oil market and WTI price is frequently quoted in the media.
Like all assets, supply and demand are the key drivers of WTI Oil price. As such, global growth can be a driver of increased demand and vice versa for weak global growth. Political instability, wars, and sanctions can disrupt supply and impact prices. The decisions of OPEC, a group of major Oil-producing countries, is another key driver of price. The value of the US Dollar influences the price of WTI Crude Oil, since Oil is predominantly traded in US Dollars, thus a weaker US Dollar can make Oil more affordable and vice versa.
The weekly Oil inventory reports published by the American Petroleum Institute (API) and the Energy Information Agency (EIA) impact the price of WTI Oil. Changes in inventories reflect fluctuating supply and demand. If the data shows a drop in inventories it can indicate increased demand, pushing up Oil price. Higher inventories can reflect increased supply, pushing down prices. API’s report is published every Tuesday and EIA’s the day after. Their results are usually similar, falling within 1% of each other 75% of the time. The EIA data is considered more reliable, since it is a government agency.
OPEC (Organization of the Petroleum Exporting Countries) is a group of 13 Oil-producing nations who collectively decide production quotas for member countries at twice-yearly meetings. Their decisions often impact WTI Oil prices. When OPEC decides to lower quotas, it can tighten supply, pushing up Oil prices. When OPEC increases production, it has the opposite effect. OPEC+ refers to an expanded group that includes ten extra non-OPEC members, the most notable of which is Russia.
| Index | Change, points | Closed | Change, % |
|---|---|---|---|
| NIKKEI 225 | 3217.04 | 34675.46 | 10.23 |
| Hang Seng | -51.02 | 16647.34 | -0.31 |
| KOSPI | 80.6 | 2522.15 | 3.3 |
| ASX 200 | 31 | 7680.6 | 0.41 |
| DAX | 15.32 | 17354.32 | 0.09 |
| CAC 40 | -18.95 | 7130.04 | -0.27 |
| Dow Jones | 294.39 | 38997.66 | 0.76 |
| S&P 500 | 53.7 | 5240.03 | 1.04 |
| NASDAQ Composite | 166.77 | 16366.85 | 1.03 |
| Pare | Closed | Change, % |
|---|---|---|
| AUDUSD | 0.65185 | 0.25 |
| EURJPY | 157.848 | 0.04 |
| EURUSD | 1.09272 | -0.28 |
| GBPJPY | 183.32 | -0.36 |
| GBPUSD | 1.26911 | -0.68 |
| NZDUSD | 0.59498 | 0.14 |
| USDCAD | 1.37799 | -0.27 |
| USDCHF | 0.85071 | -0.16 |
| USDJPY | 144.429 | 0.31 |
- NZD/USD gains momentum around 0.5980 in Wednesday’s early Asian session, gaining 0.54% on the day.
- New Zealand’s Unemployment Rate ticked higher to the highest since March 2021, rising to 4.6% in Q2 vs. 4.3 prior.
- Fed’s Daly expects interest rate cuts to come as the labor market weakens.
The NZD/USD pair extends the rally near 0.5980 during the early Asian session on Wednesday. The further upside of the New Zealand Dollar (NZD) is bolstered by the upbeat New Zealand employment report. Traders trim bets on RBNZ, pivoting to rate cuts next week.
Data released by Statistics New Zealand on Wednesday showed that the country’s Unemployment Rate rose to 4.6% in the second quarter (Q2) from 4.3% in the first quarter, which is better than the estimated 4.7%. Additionally, the Employment Change increased by 0.4% in Q2 from a 0.2% decline in the previous reading. This figure came in above the market consensus of a 0.2% decrease. The better-than-expected readings have diminished the possibility of the Reserve Bank of New Zealand (RBNZ) rate cut next week, which lift the Kiwi against the USD.
On the other hand, markets expect a more aggressive rate cut starting in September after the weaker US employment data in July raised the fear of a looming US recession. San Francisco Federal Reserve President Mary Daly said on Monday that she expects rate reduction later this year, adding that progress on inflation and a clear slowdown in hiring likely will drive the central bank to some extent of policy easing. Meanwhile, Chicago Fed President Austan Goolsbee stated that if there are trouble signs with the economy, the central bank will fix it.
New Zealand Dollar FAQs
The New Zealand Dollar (NZD), also known as the Kiwi, is a well-known traded currency among investors. Its value is broadly determined by the health of the New Zealand economy and the country’s central bank policy. Still, there are some unique particularities that also can make NZD move. The performance of the Chinese economy tends to move the Kiwi because China is New Zealand’s biggest trading partner. Bad news for the Chinese economy likely means less New Zealand exports to the country, hitting the economy and thus its currency. Another factor moving NZD is dairy prices as the dairy industry is New Zealand’s main export. High dairy prices boost export income, contributing positively to the economy and thus to the NZD.
The Reserve Bank of New Zealand (RBNZ) aims to achieve and maintain an inflation rate between 1% and 3% over the medium term, with a focus to keep it near the 2% mid-point. To this end, the bank sets an appropriate level of interest rates. When inflation is too high, the RBNZ will increase interest rates to cool the economy, but the move will also make bond yields higher, increasing investors’ appeal to invest in the country and thus boosting NZD. On the contrary, lower interest rates tend to weaken NZD. The so-called rate differential, or how rates in New Zealand are or are expected to be compared to the ones set by the US Federal Reserve, can also play a key role in moving the NZD/USD pair.
Macroeconomic data releases in New Zealand are key to assess the state of the economy and can impact the New Zealand Dollar’s (NZD) valuation. A strong economy, based on high economic growth, low unemployment and high confidence is good for NZD. High economic growth attracts foreign investment and may encourage the Reserve Bank of New Zealand to increase interest rates, if this economic strength comes together with elevated inflation. Conversely, if economic data is weak, NZD is likely to depreciate.
The New Zealand Dollar (NZD) tends to strengthen during risk-on periods, or when investors perceive that broader market risks are low and are optimistic about growth. This tends to lead to a more favorable outlook for commodities and so-called ‘commodity currencies’ such as the Kiwi. Conversely, NZD tends to weaken at times of market turbulence or economic uncertainty as investors tend to sell higher-risk assets and flee to the more-stable safe havens.


© 2000-2026. Bản quyền Teletrade.
Trang web này được quản lý bởi Teletrade D.J. LLC 2351 LLC 2022 (Euro House, Richmond Hill Road, Kingstown, VC0100, St. Vincent and the Grenadines).
Thông tin trên trang web không phải là cơ sở để đưa ra quyết định đầu tư và chỉ được cung cấp cho mục đích làm quen.
Giao dịch trên thị trường tài chính (đặc biệt là giao dịch sử dụng các công cụ biên) mở ra những cơ hội lớn và tạo điều kiện cho các nhà đầu tư sẵn sàng mạo hiểm để thu lợi nhuận, tuy nhiên nó mang trong mình nguy cơ rủi ro khá cao. Chính vì vậy trước khi tiến hành giao dịch cần phải xem xét mọi mặt vấn đề chấp nhận tiến hành giao dịch cụ thể xét theo quan điểm của nguồn lực tài chính sẵn có và mức độ am hiểu thị trường tài chính.
Sử dụng thông tin: sử dụng toàn bộ hay riêng biệt các dữ liệu trên trang web của công ty TeleTrade như một nguồn cung cấp thông tin nhất định. Việc sử dụng tư liệu từ trang web cần kèm theo liên kết đến trang teletrade.vn. Việc tự động thu thập số liệu cũng như thông tin từ trang web TeleTrade đều không được phép.
Xin vui lòng liên hệ với pr@teletrade.global nếu có câu hỏi.
ngân hàng