- Phân tích
- Tin tức và các công cụ
- Tin tức thị trường
Tin tức thì trường
- NZD/USD edged higher and closed above the 20 SMA support around 0.6120.
- With the technical outlook now showing signs of bullishness, the pair tests resistance around the 0.6150 level.
On Friday, the NZD/USD saw gains of 0.40% to 0.6050, as it managed to close above the 20, 100, and 200-day Simple Moving Averages (SMA).
As for the daily technical indicators, the Relative Strength Index (RSI), now at 57, indicates an increase in buying momentum. The Moving Average Convergence Divergence (MACD) continues to register decreasing red bars which could be seen as fading bearish strength.
NZD/USD daily chart
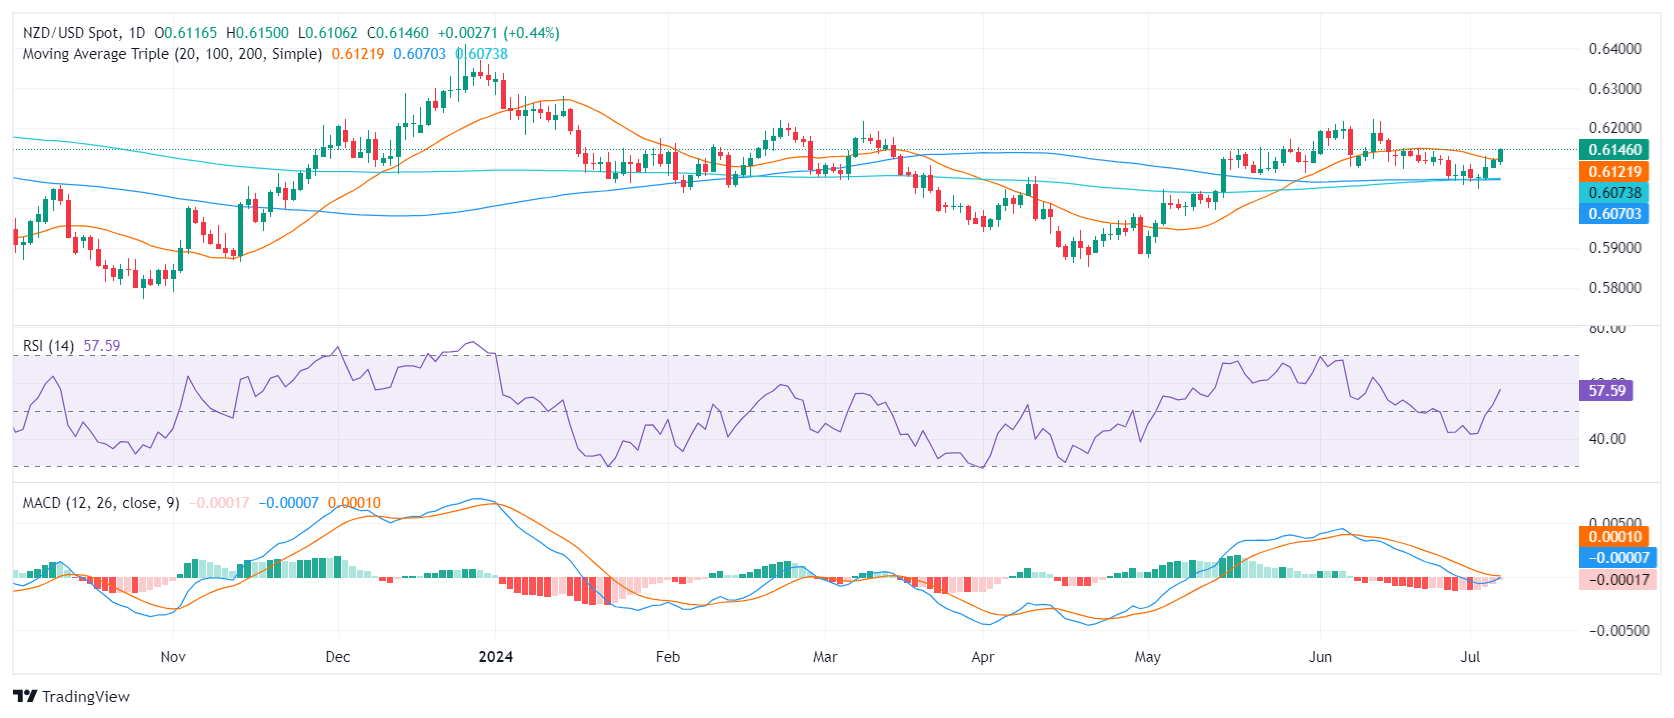
On the upside, resistance is at the 0.6150- 0.6170 zone, and above at the 0.6200 level. A firm break above these levels could be viewed as a full confirmation of the recent bearish dominance, driving the pair into bullish territory.
On the downside has immediate support near the 20-day SMA at 0.6120, and below at the crucial 0.6070 mark. If the sellers manage to drive the price lower, it will indicate strengthening selling pressure and the possibility of a deeper downward correction.
- EUR/USD clipped into 1.0840 after broad-market risk appetite rally after US NFP print.
- Sharp NFP revisions have reignited hopes for a September Fed rate cut.
- Coming up next week: Fed Chair Powell, US CPI print, German Retail Sales.
EUR/USD whipsawed after a mixed US Nonfarm Payrolls (NFP) print on Friday before settling on the high side, tapping in a peak bid near 1.3840 just ahead of the trading week’s close.
European Industrial Production fell steeper than expected on Friday, contracting -2.5% MoM in May and hobbling Fiber risk appetite. Pan-EU Retail Sales beat forecasts, printing at 0.3% YoY versus the expected 0.1%, but still eased from the previous 0.6%.
Read more: US Nonfarm Payrolls increase 206,000 in June vs. 190,000 forecast
Investors have ignored the better-than-expected Non-Farm Payrolls (NFP) report and are instead paying attention to increasing unemployment, slowing wage growth, and downward revisions to previous job reports. As a result, they are increasing their bets that the Federal Reserve will be pushed to cut interest rates sooner rather than later. The CME's FedWatch Tool shows that the rate markets are currently pricing in an almost 80% probability of at least a quarter-point rate cut on September 18. Friday's US Non-Farm Payrolls (NFP) exceeded median market forecasts by adding 206K net new jobs in June. This figure was higher than the expected 190K, but the previous month's number was revised down sharply to 218K from the initial 272K.
The growth in US Average Hourly Earnings for the year ending June slowed to the expected 3.9% year-over-year, from the previous period's 4.1%. Additionally, the US Unemployment Rate increased to 4.1%, marking the first rise since December 2021. This was slightly higher than the expected 4.0% hold forecasted by the market.
Fed Semi-Annual Policy Report: Need greater confidence before moving to rate cuts
Fiber traders will be looking out for an appearance from Federal Reserve (Fed) Chairman Jerome Powell on Tuesday, followed by final inflation figures from both the EU and the US on Thursday. Next Friday will close out next week with German Retail Sales, as well as US Producer Price Index (PPI) inflation and University of Michigan Consumer Sentiment Index survey results.
Economic Indicator
Nonfarm Payrolls
The Nonfarm Payrolls release presents the number of new jobs created in the US during the previous month in all non-agricultural businesses; it is released by the US Bureau of Labor Statistics (BLS). The monthly changes in payrolls can be extremely volatile. The number is also subject to strong reviews, which can also trigger volatility in the Forex board. Generally speaking, a high reading is seen as bullish for the US Dollar (USD), while a low reading is seen as bearish, although previous months' reviews and the Unemployment Rate are as relevant as the headline figure. The market's reaction, therefore, depends on how the market assesses all the data contained in the BLS report as a whole.
Read more.Last release: Fri Jul 05, 2024 12:30
Frequency: Monthly
Actual: 206K
Consensus: 190K
Previous: 272K
Source: US Bureau of Labor Statistics
America’s monthly jobs report is considered the most important economic indicator for forex traders. Released on the first Friday following the reported month, the change in the number of positions is closely correlated with the overall performance of the economy and is monitored by policymakers. Full employment is one of the Federal Reserve’s mandates and it considers developments in the labor market when setting its policies, thus impacting currencies. Despite several leading indicators shaping estimates, Nonfarm Payrolls tend to surprise markets and trigger substantial volatility. Actual figures beating the consensus tend to be USD bullish.
EUR/USD technical outlook
EUR/USD drifted into the high end in largely one-sided trading this week, climbing from the early week’s low bids near 1.0710. Fiber climbed 1.25% bottom-to-top through the trading week, and chalked in seven consecutive trading days in the green.
Fiber bidders have extended price action north of the 200-day Exponential Moving Average (EMA) at 1.0784, but a rough descending channel is still pricing in downside technical pressure just above 1.0860.
EUR/USD hourly chart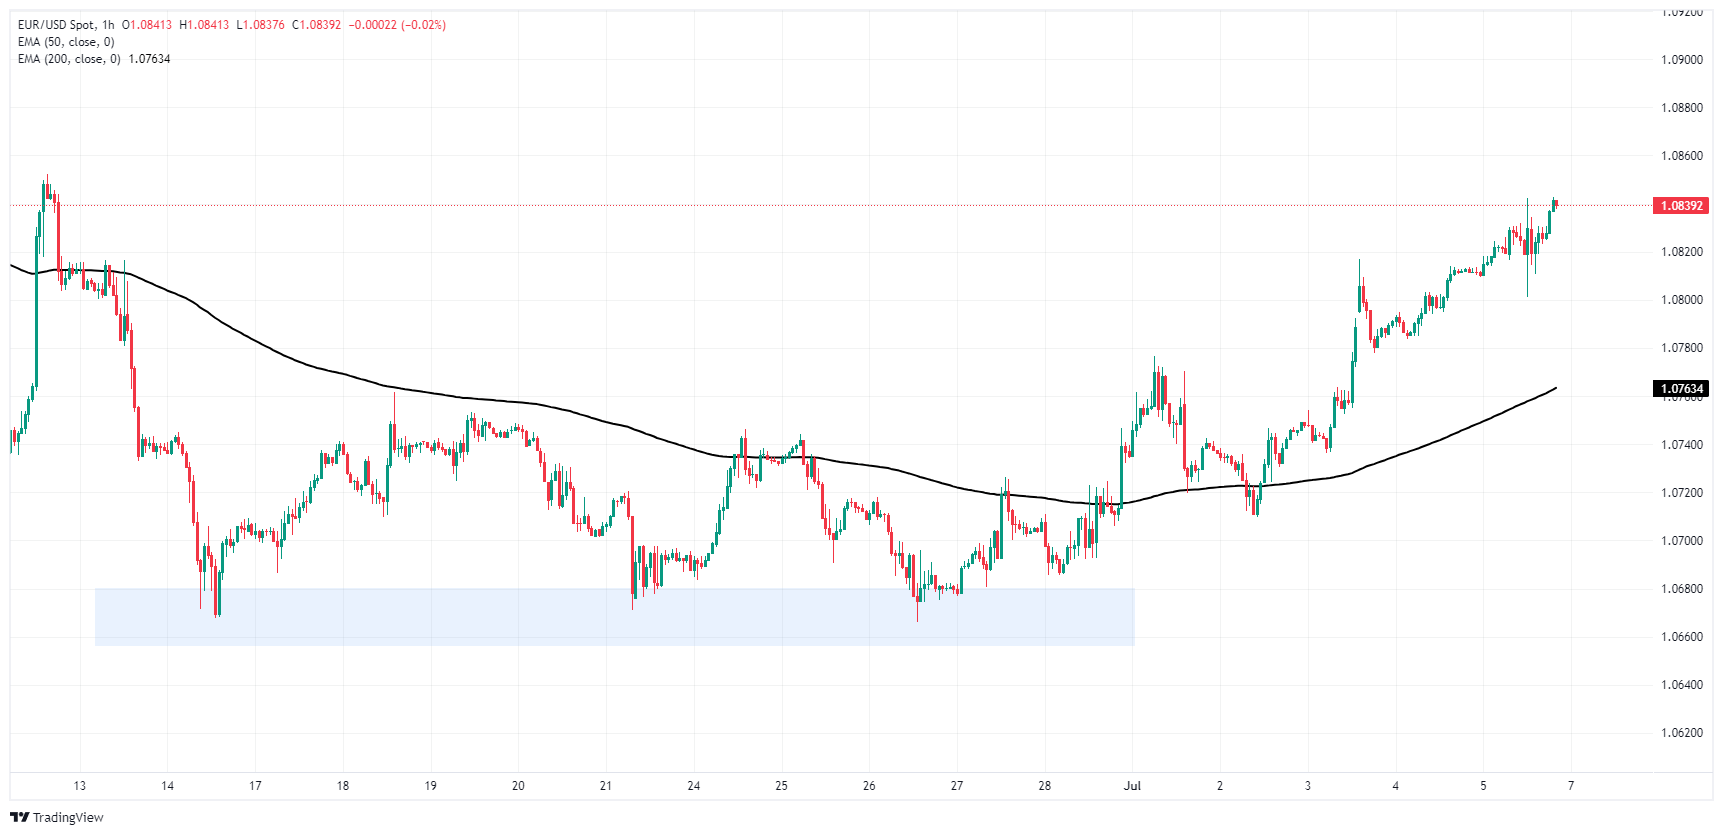
EUR/USD daily chart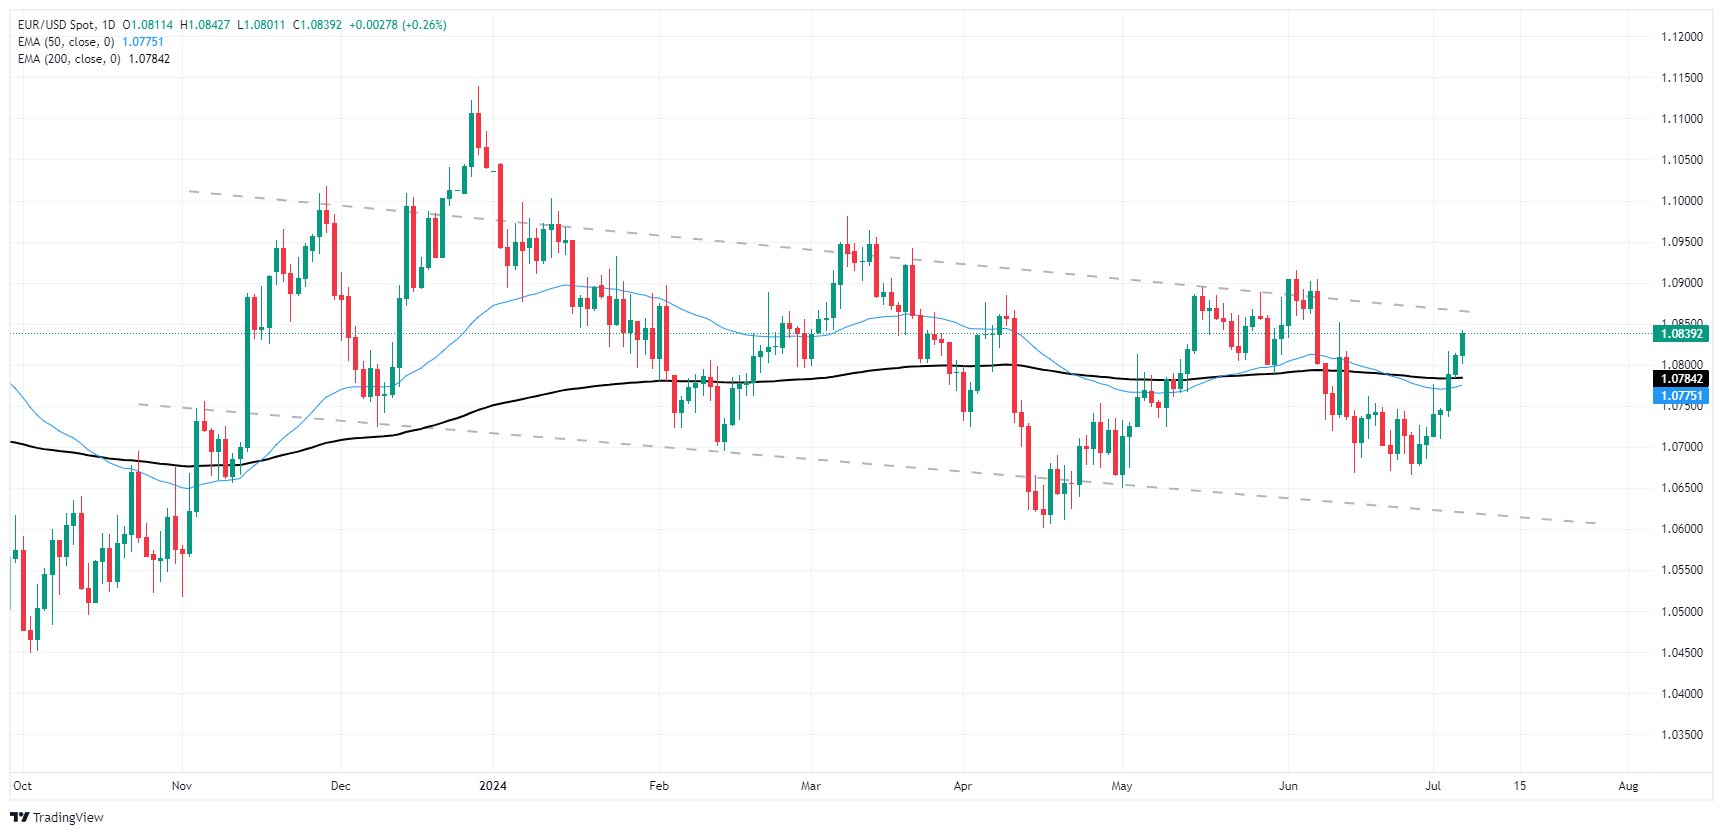
Euro FAQs
The Euro is the currency for the 20 European Union countries that belong to the Eurozone. It is the second most heavily traded currency in the world behind the US Dollar. In 2022, it accounted for 31% of all foreign exchange transactions, with an average daily turnover of over $2.2 trillion a day. EUR/USD is the most heavily traded currency pair in the world, accounting for an estimated 30% off all transactions, followed by EUR/JPY (4%), EUR/GBP (3%) and EUR/AUD (2%).
The European Central Bank (ECB) in Frankfurt, Germany, is the reserve bank for the Eurozone. The ECB sets interest rates and manages monetary policy. The ECB’s primary mandate is to maintain price stability, which means either controlling inflation or stimulating growth. Its primary tool is the raising or lowering of interest rates. Relatively high interest rates – or the expectation of higher rates – will usually benefit the Euro and vice versa. The ECB Governing Council makes monetary policy decisions at meetings held eight times a year. Decisions are made by heads of the Eurozone national banks and six permanent members, including the President of the ECB, Christine Lagarde.
Eurozone inflation data, measured by the Harmonized Index of Consumer Prices (HICP), is an important econometric for the Euro. If inflation rises more than expected, especially if above the ECB’s 2% target, it obliges the ECB to raise interest rates to bring it back under control. Relatively high interest rates compared to its counterparts will usually benefit the Euro, as it makes the region more attractive as a place for global investors to park their money.
Data releases gauge the health of the economy and can impact on the Euro. Indicators such as GDP, Manufacturing and Services PMIs, employment, and consumer sentiment surveys can all influence the direction of the single currency. A strong economy is good for the Euro. Not only does it attract more foreign investment but it may encourage the ECB to put up interest rates, which will directly strengthen the Euro. Otherwise, if economic data is weak, the Euro is likely to fall. Economic data for the four largest economies in the euro area (Germany, France, Italy and Spain) are especially significant, as they account for 75% of the Eurozone’s economy.
Another significant data release for the Euro is the Trade Balance. This indicator measures the difference between what a country earns from its exports and what it spends on imports over a given period. If a country produces highly sought after exports then its currency will gain in value purely from the extra demand created from foreign buyers seeking to purchase these goods. Therefore, a positive net Trade Balance strengthens a currency and vice versa for a negative balance.
- GBP/USD climbed above 1.2800 after US NFP figures sparked risk rally.
- Broad-market risk sentiment recovered on Friday as rate cut hopes reignite.
- Coming up next week, Fed Chair Powell appearance, US CPI, UK industrial activity.
GBP/USD rallied back over the 1.2800 handle on Friday, bolstered by a broad-market risk appetite recovery fueled by reinvigorated rate cut hopes. Investors are betting that the Federal Reserve (Fed) will be pushed further towards rate cuts in the third quarter after US Nonfarm Payrolls (NFP) labor figures gave a lopsided print, beating forecasts but carrying steep revisions to previous figures.
Read more: US Nonfarm Payrolls increase 206,000 in June vs. 190,000 forecast
The UK’s latest Parliamentary Election came and went with little market volatility. The British populace swept in the UK Labour Party’s Kier Starmer as the next Prime Minister, casting out Rishi Sunak after 14 years of Conservative Party leadership and its revolving door of leaders. GBP traders will be buckling down for the long wait to next week’s UK Industrial Production figures for May, which are expected to rebound after a firm contraction in April.
Friday’s US NFP beat median market forecasts, adding 206K net new jobs in June. While the figure handily beat the expected 190K, the previous month saw a sharp downside revision to 218K from the initial print of 272K.
US Average Hourly Earnings growth also cooled for the year ended June, easing to the expected 3.9% YoY compared to the previous period’s 4.1%. The US Unemployment Rate also ticked higher, rising to 4.1% for the first time since December of 2021. Markets had broadly forecast a hold at 4.0%.
Fed Semi-Annual Policy Report: Need greater confidence before moving to rate cuts
Investors have brushed off the above-forecast NFP print to focus on rising unemployment, cooling wages, and downside revisions to previous jobs reports to scale up bets that the Fed will get pushed towards rate cuts sooner rather than later. According to the CME’s FedWatch Tool, rate markets are pricing in nearly 80% odds of at least a quarter-point rate trim on September 18.
With Friday’s NFP over, investors will pivot to Fed Chairman Jerome Powell's appearance on Tuesday next week. Final US Consumer Price Index (CPI) figures are slated for Thursday, with Producer Price Index (PPI) inflation and the University of Michigan’s Consumer Sentiment Index in the pipeline for next Friday.
Economic Indicator
Nonfarm Payrolls
The Nonfarm Payrolls release presents the number of new jobs created in the US during the previous month in all non-agricultural businesses; it is released by the US Bureau of Labor Statistics (BLS). The monthly changes in payrolls can be extremely volatile. The number is also subject to strong reviews, which can also trigger volatility in the Forex board. Generally speaking, a high reading is seen as bullish for the US Dollar (USD), while a low reading is seen as bearish, although previous months' reviews and the Unemployment Rate are as relevant as the headline figure. The market's reaction, therefore, depends on how the market assesses all the data contained in the BLS report as a whole.
Read more.Last release: Fri Jul 05, 2024 12:30
Frequency: Monthly
Actual: 206K
Consensus: 190K
Previous: 272K
Source: US Bureau of Labor Statistics
America’s monthly jobs report is considered the most important economic indicator for forex traders. Released on the first Friday following the reported month, the change in the number of positions is closely correlated with the overall performance of the economy and is monitored by policymakers. Full employment is one of the Federal Reserve’s mandates and it considers developments in the labor market when setting its policies, thus impacting currencies. Despite several leading indicators shaping estimates, Nonfarm Payrolls tend to surprise markets and trigger substantial volatility. Actual figures beating the consensus tend to be USD bullish.
GBP/USD technical outlook
GBP/USD scaled the 1.2800 handle on Friday, extending its win streak to seven consecutive trading days. Cable has gained 1.62% from the last swing low into 1.2613. Price action halted a decline into the 200-day Exponential Moving Average (EMA) at 1.2608, and bids are poised to challenge a supply zone price in above 1.2800.
GBP/USD hourly chart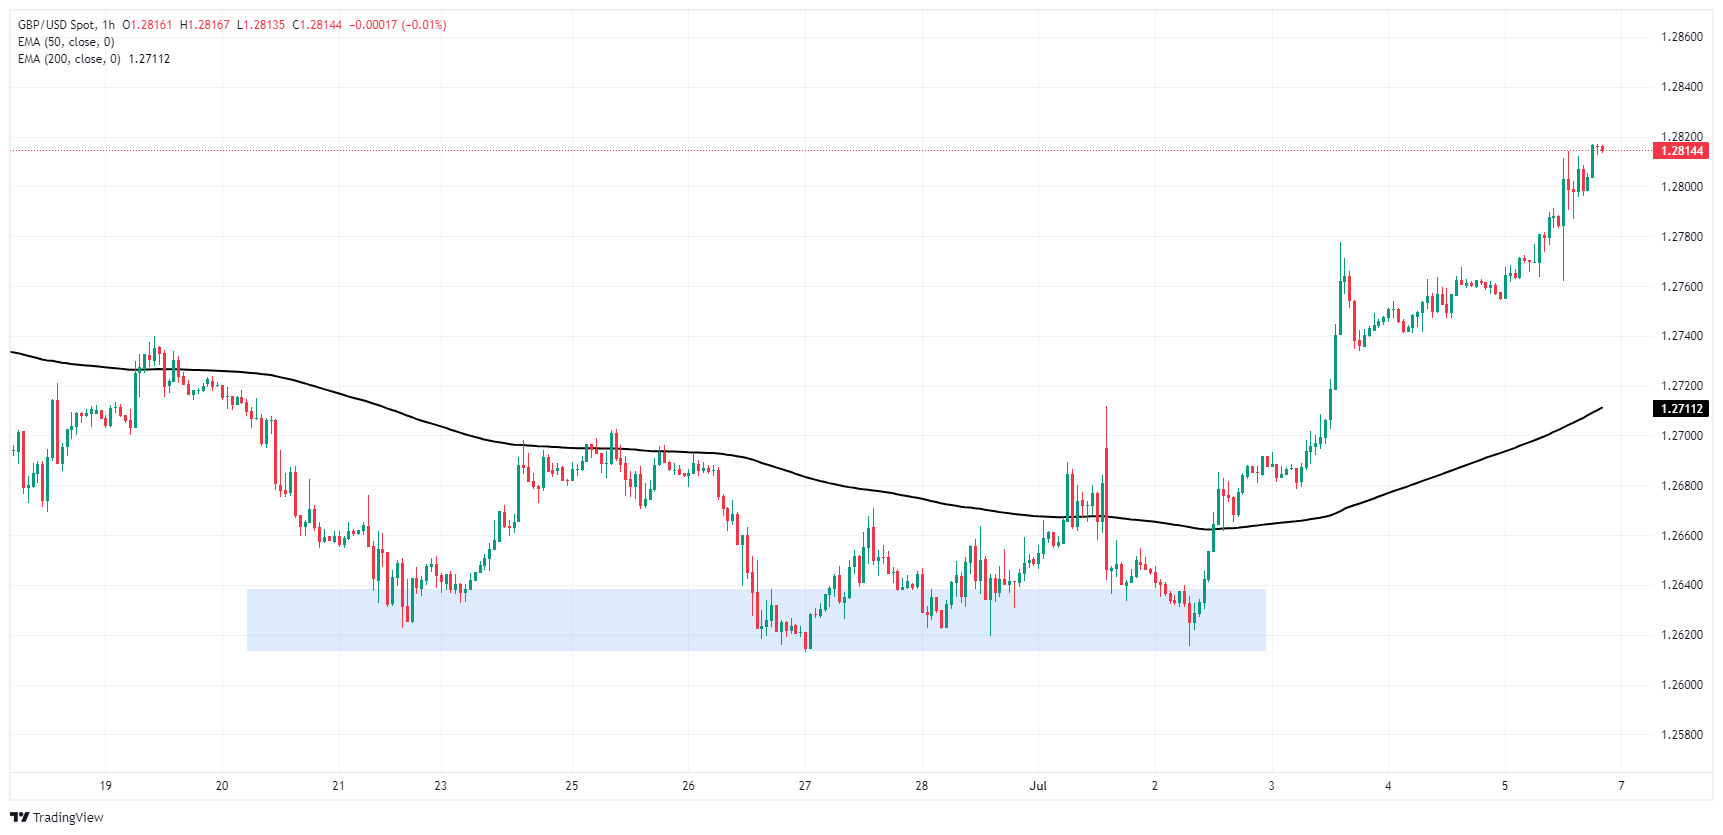
GBP/USD daily chart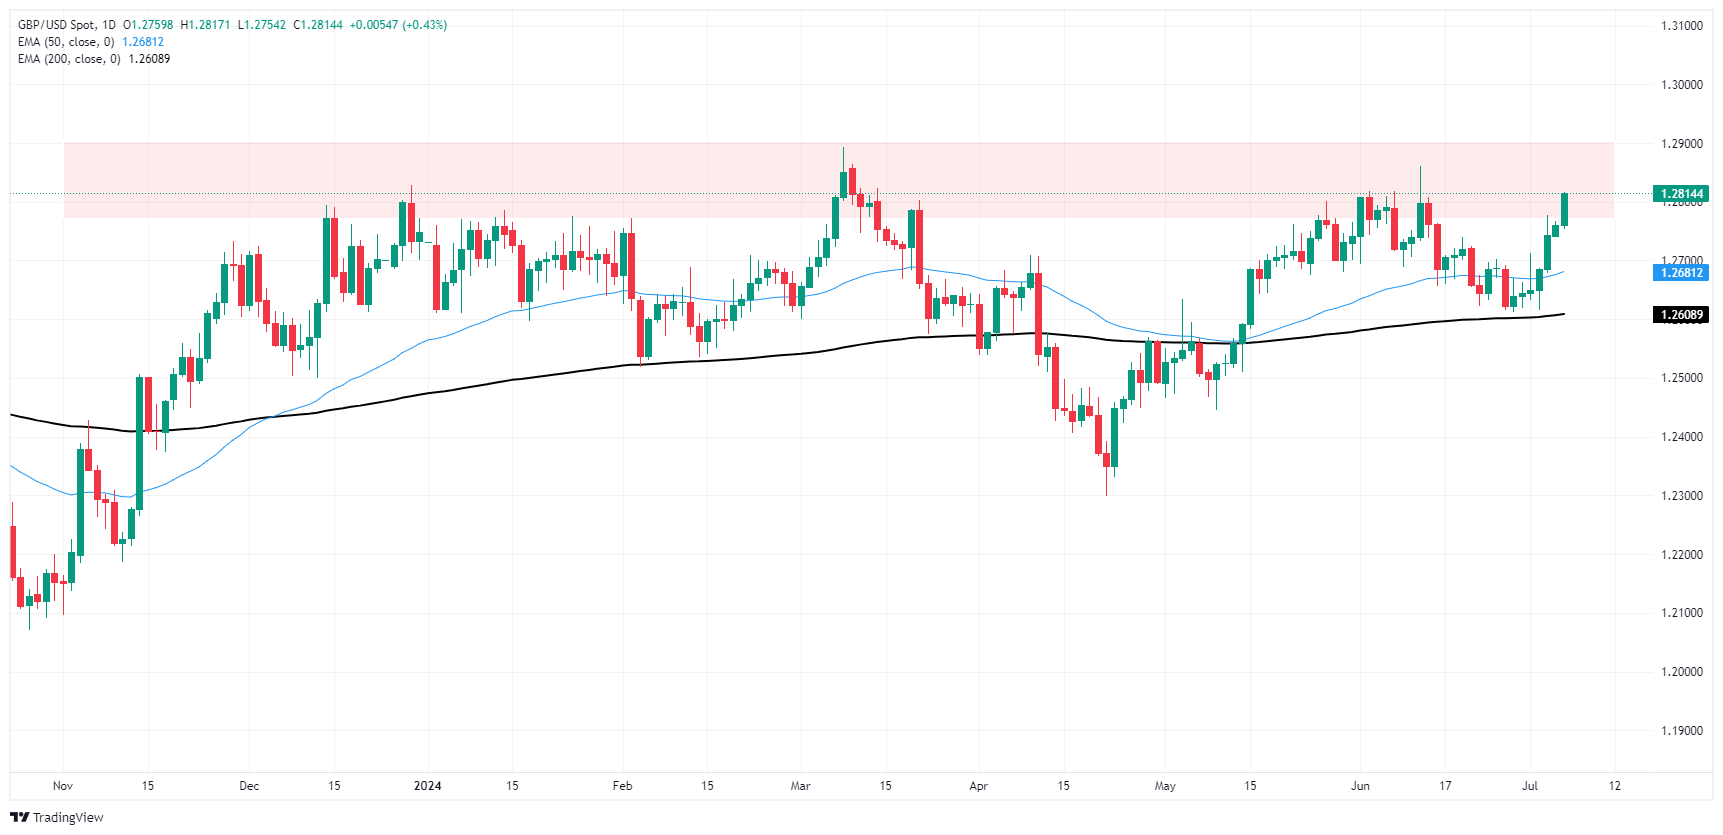
Pound Sterling FAQs
The Pound Sterling (GBP) is the oldest currency in the world (886 AD) and the official currency of the United Kingdom. It is the fourth most traded unit for foreign exchange (FX) in the world, accounting for 12% of all transactions, averaging $630 billion a day, according to 2022 data. Its key trading pairs are GBP/USD, aka ‘Cable’, which accounts for 11% of FX, GBP/JPY, or the ‘Dragon’ as it is known by traders (3%), and EUR/GBP (2%). The Pound Sterling is issued by the Bank of England (BoE).
The single most important factor influencing the value of the Pound Sterling is monetary policy decided by the Bank of England. The BoE bases its decisions on whether it has achieved its primary goal of “price stability” – a steady inflation rate of around 2%. Its primary tool for achieving this is the adjustment of interest rates. When inflation is too high, the BoE will try to rein it in by raising interest rates, making it more expensive for people and businesses to access credit. This is generally positive for GBP, as higher interest rates make the UK a more attractive place for global investors to park their money. When inflation falls too low it is a sign economic growth is slowing. In this scenario, the BoE will consider lowering interest rates to cheapen credit so businesses will borrow more to invest in growth-generating projects.
Data releases gauge the health of the economy and can impact the value of the Pound Sterling. Indicators such as GDP, Manufacturing and Services PMIs, and employment can all influence the direction of the GBP. A strong economy is good for Sterling. Not only does it attract more foreign investment but it may encourage the BoE to put up interest rates, which will directly strengthen GBP. Otherwise, if economic data is weak, the Pound Sterling is likely to fall.
Another significant data release for the Pound Sterling is the Trade Balance. This indicator measures the difference between what a country earns from its exports and what it spends on imports over a given period. If a country produces highly sought-after exports, its currency will benefit purely from the extra demand created from foreign buyers seeking to purchase these goods. Therefore, a positive net Trade Balance strengthens a currency and vice versa for a negative balance.
- AUD/JPY moderates, hovering steadily above the 108.00 mark, wrapping up a week with a 1% gain.
- Buyers are taking a breather and keeping the cross in cycle highs.
- A healthy correction shouldn’t be taken off the table.
In the trading session of Friday, the AUD/JPY pair curtailed its recent bullish momentum but managed to close the week around 108.50 level. This slight pullback, most likely an effect of traders booking profits, has not blown out the bullish shine of the pair's weekly performance, winning a close of 1%.
In the day's performance, the Relative Strength Index (RSI) for the AUDJPY settled at 80, translating into a flattening but still pointing towards an overbought scenario. This may indicate the potential of a forthcoming correction in the near term. Concurrently, the Moving Average Convergence Divergence (MACD) painted a scenario of flattening green bars, mirroring a cooling of the robust bullish momentum.
AUD/JPY daily chart
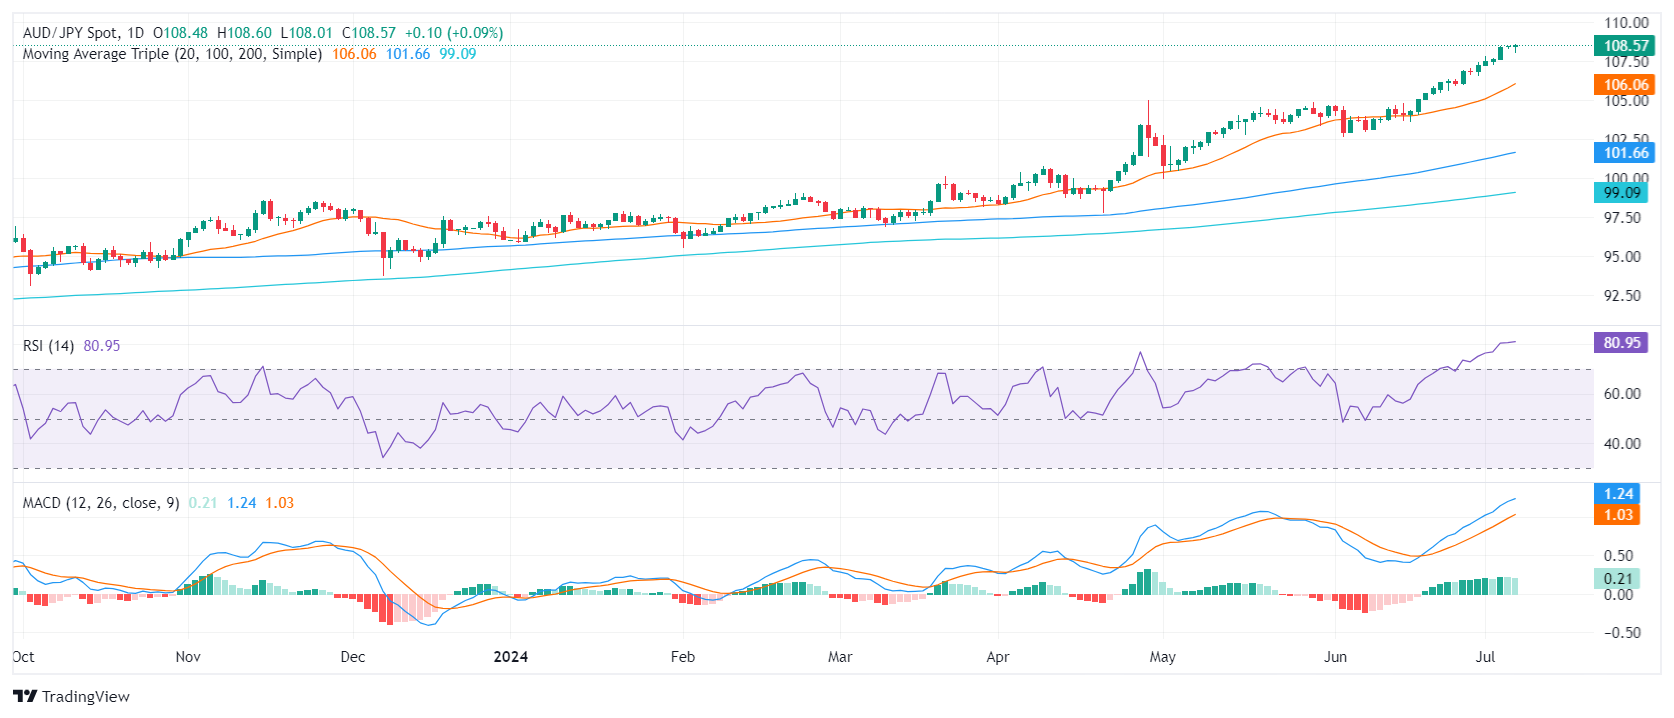
Looking at the bigger picture, the AUD/JPY pair keeps showing signs of robust bullish sentiment underpinned by its standing above the 20-day, 100-day, and 200-day Simple Moving Averages (SMAs). In the event of a corrective pressure bringing the pair could will face at the 108.00 mark and then further down at the 107.50 and 107.00 levels. Specifically, the 104.90 (20-day SMA) level could serve as an additional support line.
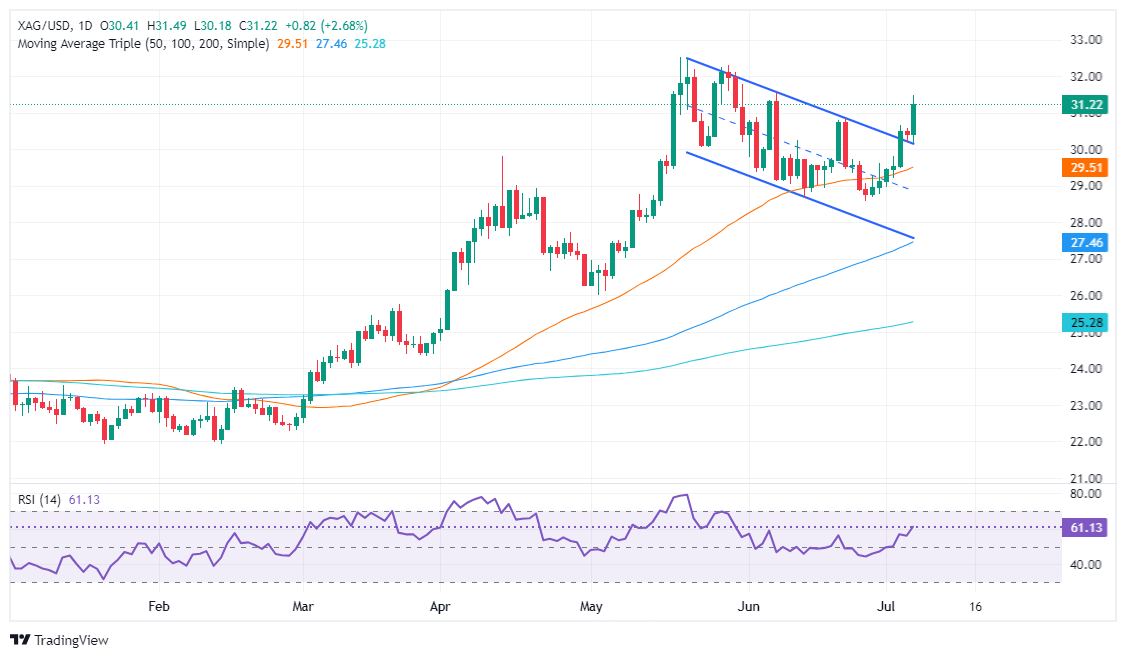
- Silver reaches $30.66, an eight-day peak, after surpassing the $30.00 resistance.
- Resistance levels: $30.84 (June 21 high) and $32.51 (YTD high).
- Support points: $29.48 (July 3 low), $29.00, $28.57 (June 26 low), $27.59 (April 15 low).
Silver soared above the June 20 high of $30.78 on Friday and extended its gains past the $31.00 figure following a weak US jobs report that lifted expectations about a possible Fed interest rate cut. Therefore, the XAG/USD climbed and traded at $31.20, a gain of 2.65%.
XAG/USD Price Analysis: Technical outlook
Silver remains bullishly biased and has cleared the ‘double bottom’ neckline at the time of writing, validating the chart pattern. Buyers are gathering momentum, as depicted by the Relative Strength Index (RSI) and the daily moving averages (DMAs) located below the price action and aiming up.
For a bullish continuation, the XAG/USD first resistance would be the $31.50 psychological mark, followed by the $32.00 figure. Up next would be the year-to-date (YTD) high of $32.51.
On the downside, if XAG/USD slips past $31.00, the first support would be the July 5 low of $30.18, ahead of $30.00. Further losses are seen below, with the July 3 low of $29.48 up next, ahead of $29.00.
XAG/USD Price Action – Daily Chart
Silver FAQs
Silver is a precious metal highly traded among investors. It has been historically used as a store of value and a medium of exchange. Although less popular than Gold, traders may turn to Silver to diversify their investment portfolio, for its intrinsic value or as a potential hedge during high-inflation periods. Investors can buy physical Silver, in coins or in bars, or trade it through vehicles such as Exchange Traded Funds, which track its price on international markets.
Silver prices can move due to a wide range of factors. Geopolitical instability or fears of a deep recession can make Silver price escalate due to its safe-haven status, although to a lesser extent than Gold's. As a yieldless asset, Silver tends to rise with lower interest rates. Its moves also depend on how the US Dollar (USD) behaves as the asset is priced in dollars (XAG/USD). A strong Dollar tends to keep the price of Silver at bay, whereas a weaker Dollar is likely to propel prices up. Other factors such as investment demand, mining supply – Silver is much more abundant than Gold – and recycling rates can also affect prices.
Silver is widely used in industry, particularly in sectors such as electronics or solar energy, as it has one of the highest electric conductivity of all metals – more than Copper and Gold. A surge in demand can increase prices, while a decline tends to lower them. Dynamics in the US, Chinese and Indian economies can also contribute to price swings: for the US and particularly China, their big industrial sectors use Silver in various processes; in India, consumers’ demand for the precious metal for jewellery also plays a key role in setting prices.
Silver prices tend to follow Gold's moves. When Gold prices rise, Silver typically follows suit, as their status as safe-haven assets is similar. The Gold/Silver ratio, which shows the number of ounces of Silver needed to equal the value of one ounce of Gold, may help to determine the relative valuation between both metals. Some investors may consider a high ratio as an indicator that Silver is undervalued, or Gold is overvalued. On the contrary, a low ratio might suggest that Gold is undervalued relative to Silver.
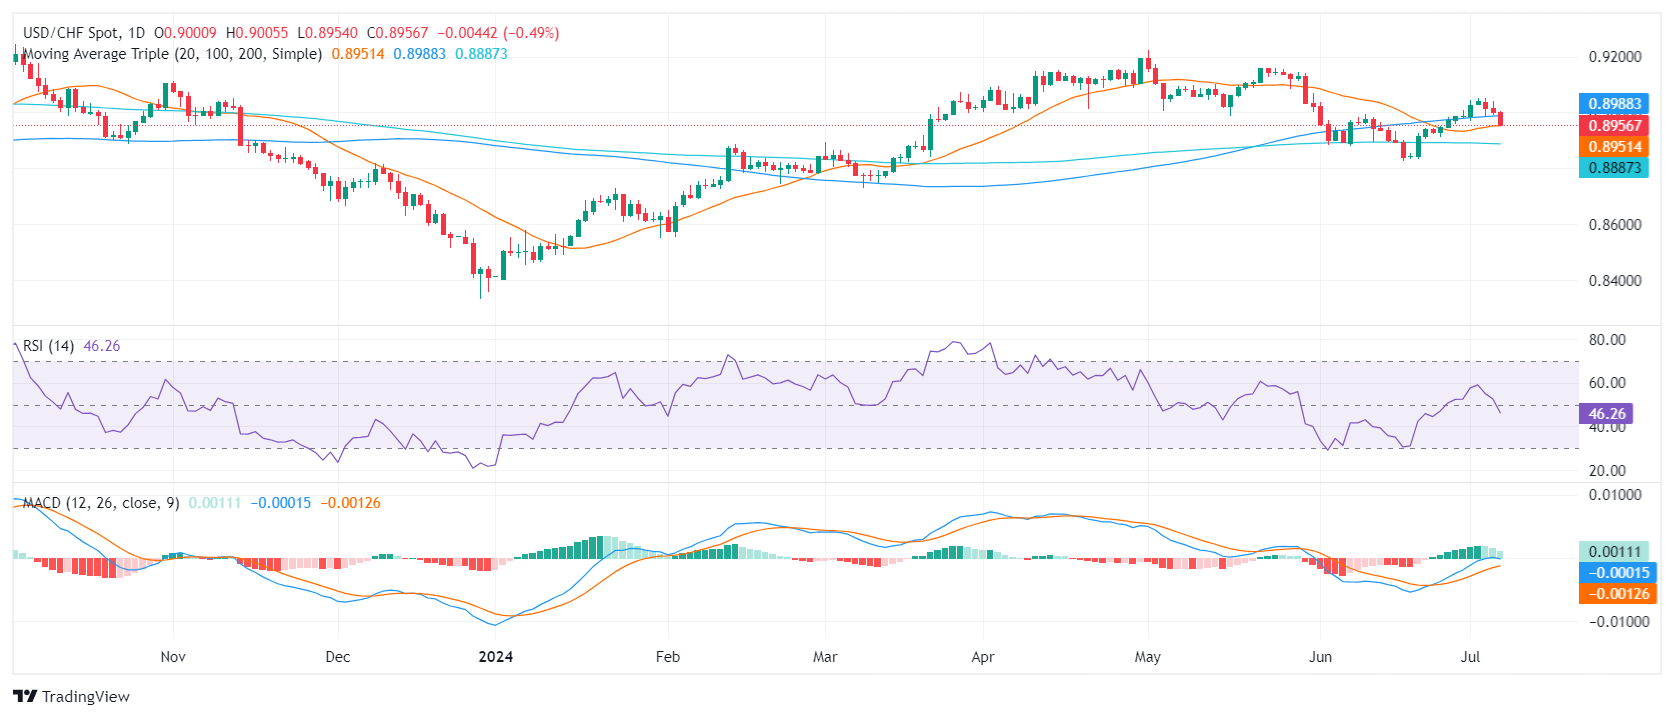
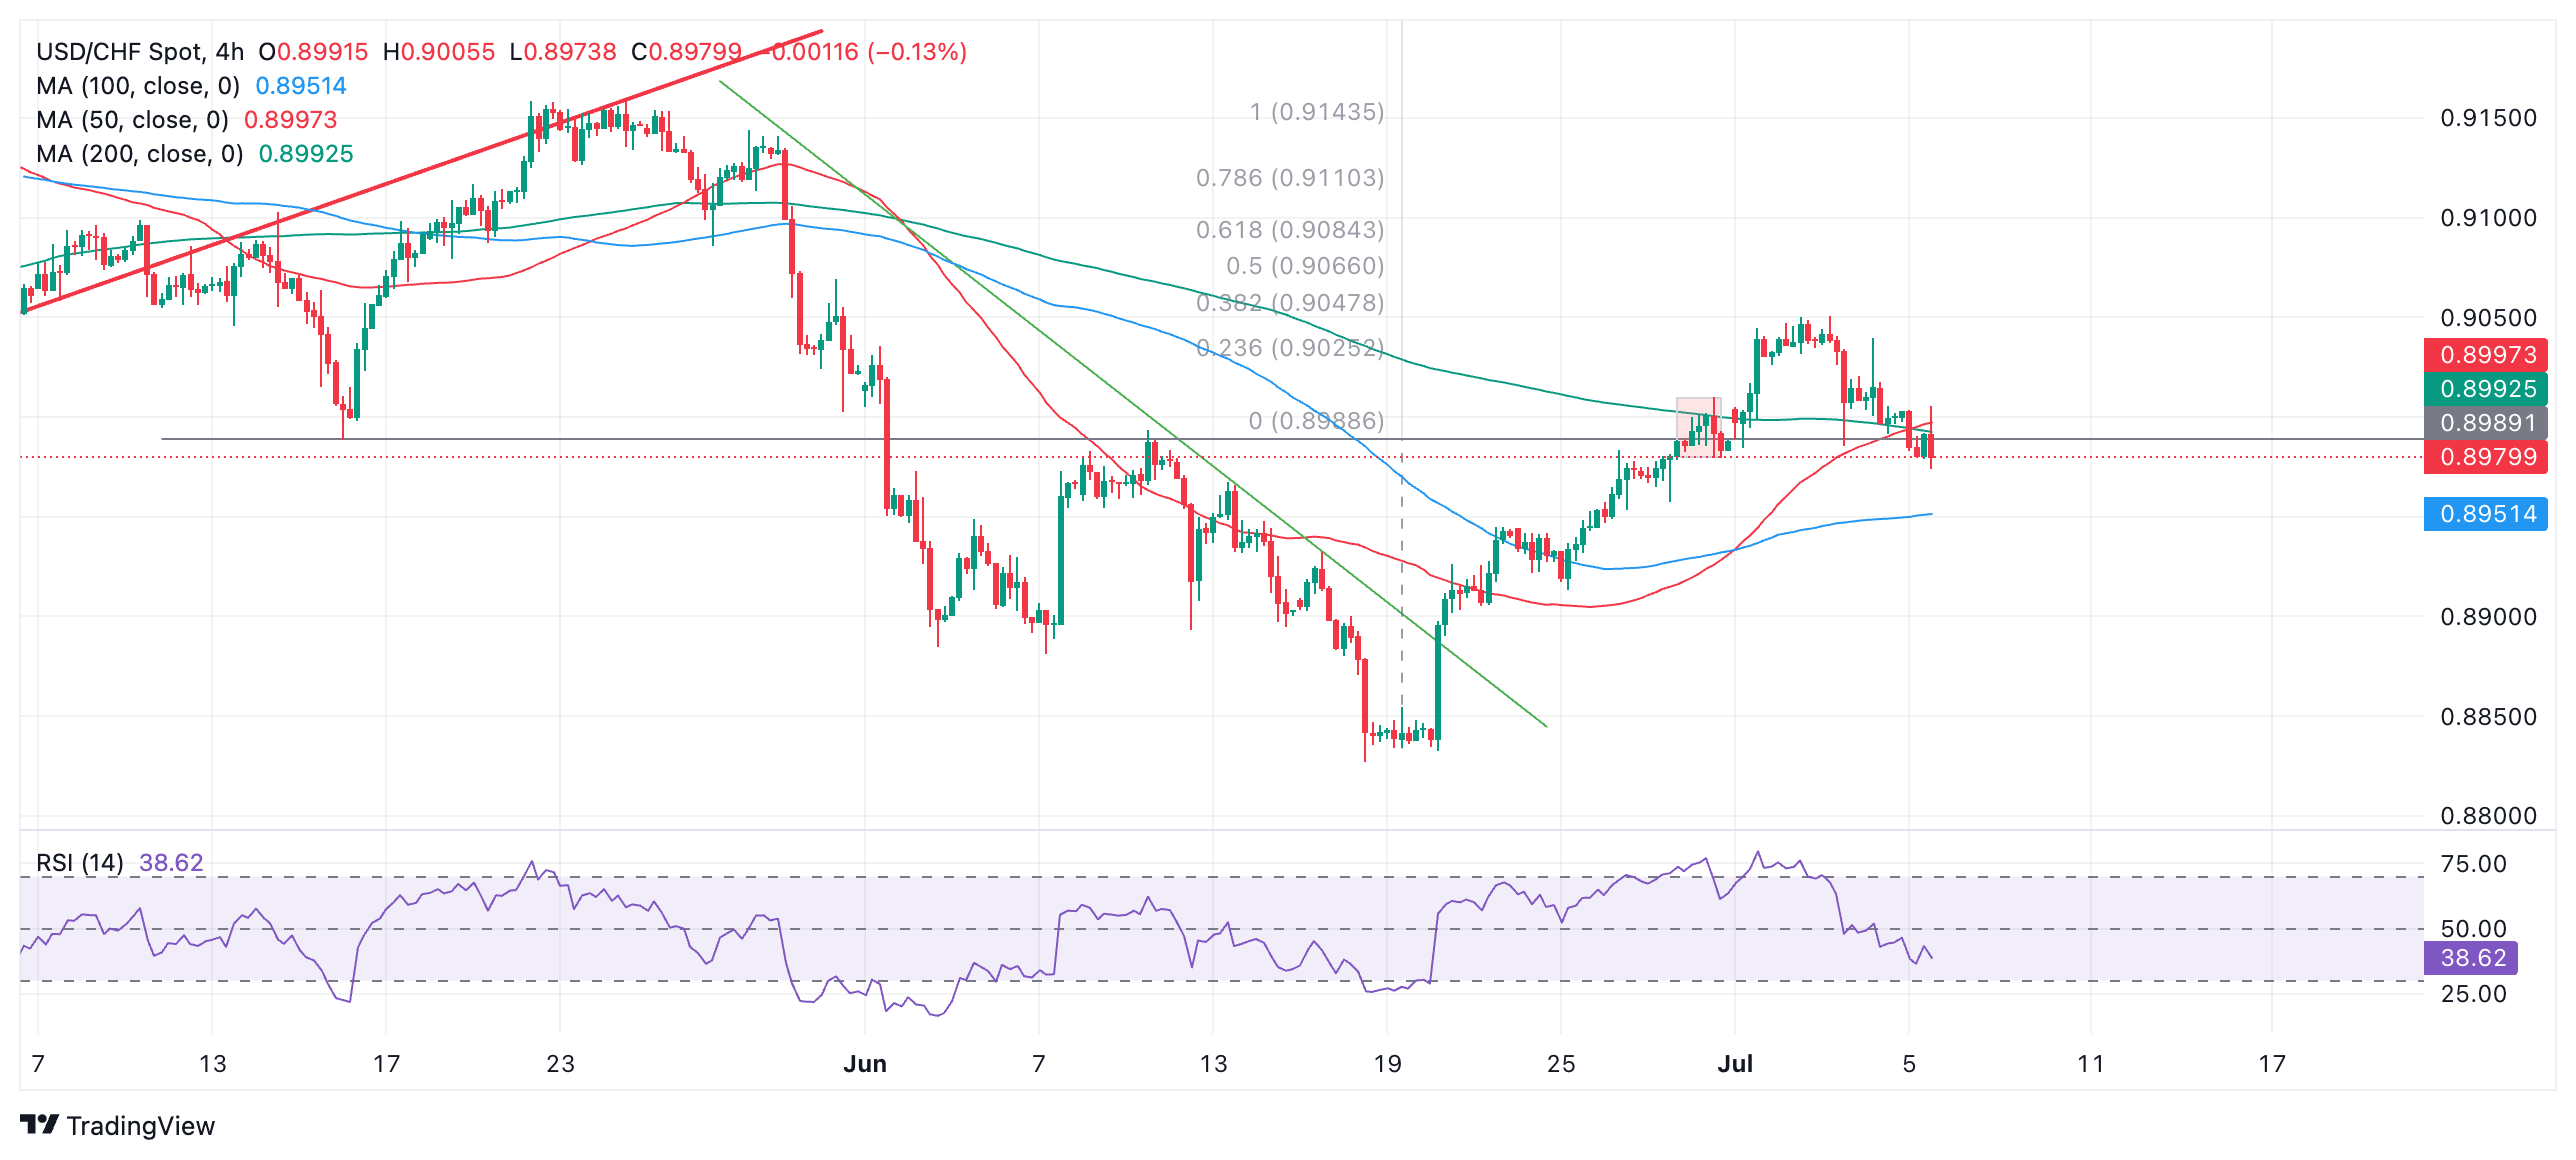
- USD/CHF continues soft following an unexpected increase in US Unemployment.
- On the positive side for the US, NFPs for June surpassed market expectations.
- With falling inflation in both countries, both the Federal Reserve and the SNB could embrace cuts.
In Friday's session, the USD/CHF pair softly sailed, with markets dumping further the USD following the release of mixed labor market data in the US.
The center of attention on Friday was the unexpected rise in the US Unemployment Rate to 4.1% from 4%, and an increase in Nonfarm Payrolls (NFP) in June by 206K, surpassing the market expectation of 190K. The rise in NFP follows a revised gain of 218K in May, down from the initially reported 272 K. As for Wage Inflation, indicated by the change in Average Hourly Earnings, decreased to 3.9% from 4.1% YoY, aligning with market forecasts.
This confirmed an overall uncertainty around the health of the labor market and substantially increased market odds for two cuts by the Federal Reserve by year-end, with the September bets reaching 90% according to the CME FedWatch tool.
On the Swiss front, market participants adjusted their expectations for a third interest-rate cut by the Swiss National Bank (SNB) in September after the inflation data announcement on Thursday which slightly declined, pushing the odds over 50%.
USD/CHF technical analysis
The technical outlook now turns somewhat negative in the short term. The currency pair ended a promising six-day streak, with the Moving Average Convergence Divergence (MACD) and Relative Strength Index (RSI), losing momentum.
The pair is expected to end the week with mild losses, and closing a dip below the Simple Moving Average (SMA) on the daily chart. Main supports now lie at the 20-day SMA at 0.8950, while the next immediate resistance has shifted to the 100-day SMA at 0.8990 (former support).
USD/CHF daily chart
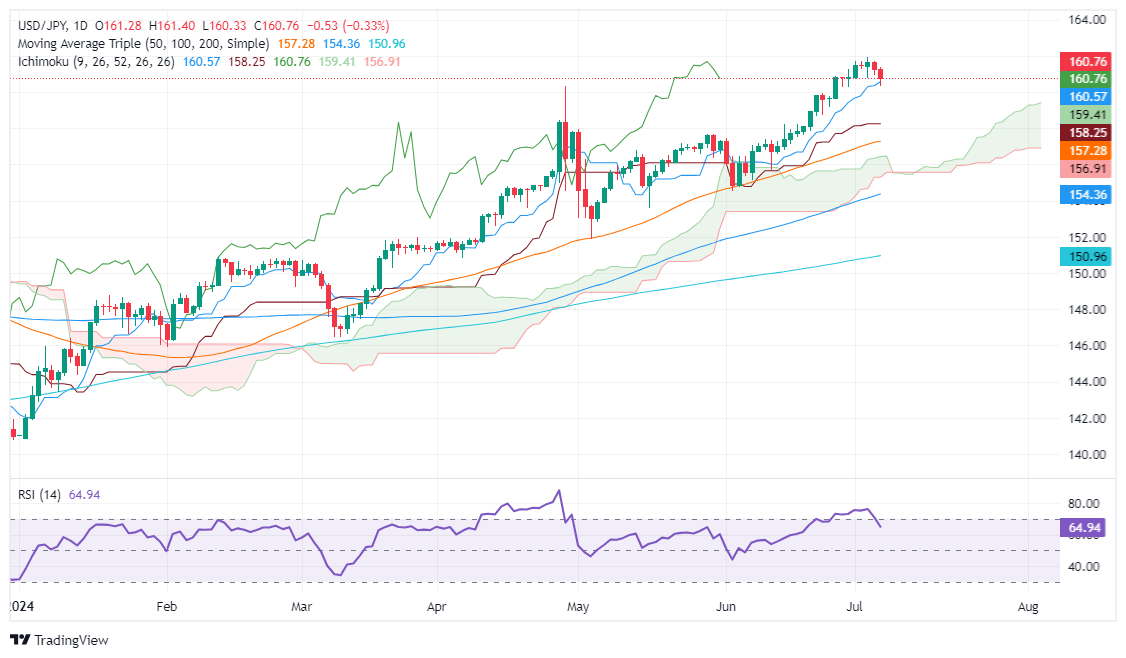
- USD/JPY drops for the second day amid signs of a weakening US labor market.
- For bullish momentum, USD/JPY needs to surpass 161.00, facing resistance at 161.70 (July 4 high), 161.95 (YTD high), and 162.00.
- Key support at 160.35 (Tenkan-Sen), 159.30 (Senkou Span A), and 158.25 (Kijun-Sen), marking possible pullback points.
The USD/JPY extended its losses to two consecutive days on Friday, as the US economy showed signs of weakness in the labor market, following a mixed US Nonfarm Payrolls report. Therefore, the pair trades at 160.72 and is down 0.34%.
USD/JPY Price Analysis: Technical outlook
The USD/JPY four-day rally stalled on Thursday, with sellers stepping in and driving the exchange rate below the 161.00 psychological level. This formed a doji in the weekly chart, hinting that higher prices could be difficult to achieve.
Given the backdrop, the pair must clear 161.00 for a bullish continuation. Once cleared, the next stop would be the July 4 high of 161.70 before testing the year-to-date (YTD) high of 161.95. Overhead resistance lies ahead, with 162.00 being the next ceiling level, before the pair aims toward the November 1986 high of 164.87.
Once the USD/JPY dropped below 161.00, the next stop would be the Tenkan-Sen at 160.35. A breach of the latter can exacerbate a pullback toward the Senkou Span A at 159.30, followed by the Kijun-Sen at 158.25.
USD/JPY Price Action – Daily Chart
Japanese Yen PRICE Today
The table below shows the percentage change of Japanese Yen (JPY) against listed major currencies today. Japanese Yen was the strongest against the Canadian Dollar.
| USD | EUR | GBP | JPY | CAD | AUD | NZD | CHF | |
|---|---|---|---|---|---|---|---|---|
| USD | -0.27% | -0.44% | -0.32% | 0.15% | -0.39% | -0.52% | -0.46% | |
| EUR | 0.27% | -0.18% | -0.03% | 0.44% | -0.12% | -0.24% | -0.21% | |
| GBP | 0.44% | 0.18% | 0.14% | 0.62% | 0.07% | -0.07% | -0.05% | |
| JPY | 0.32% | 0.03% | -0.14% | 0.47% | -0.06% | -0.21% | -0.17% | |
| CAD | -0.15% | -0.44% | -0.62% | -0.47% | -0.56% | -0.68% | -0.66% | |
| AUD | 0.39% | 0.12% | -0.07% | 0.06% | 0.56% | -0.13% | -0.07% | |
| NZD | 0.52% | 0.24% | 0.07% | 0.21% | 0.68% | 0.13% | 0.02% | |
| CHF | 0.46% | 0.21% | 0.05% | 0.17% | 0.66% | 0.07% | -0.02% |
The heat map shows percentage changes of major currencies against each other. The base currency is picked from the left column, while the quote currency is picked from the top row. For example, if you pick the Japanese Yen from the left column and move along the horizontal line to the US Dollar, the percentage change displayed in the box will represent JPY (base)/USD (quote).
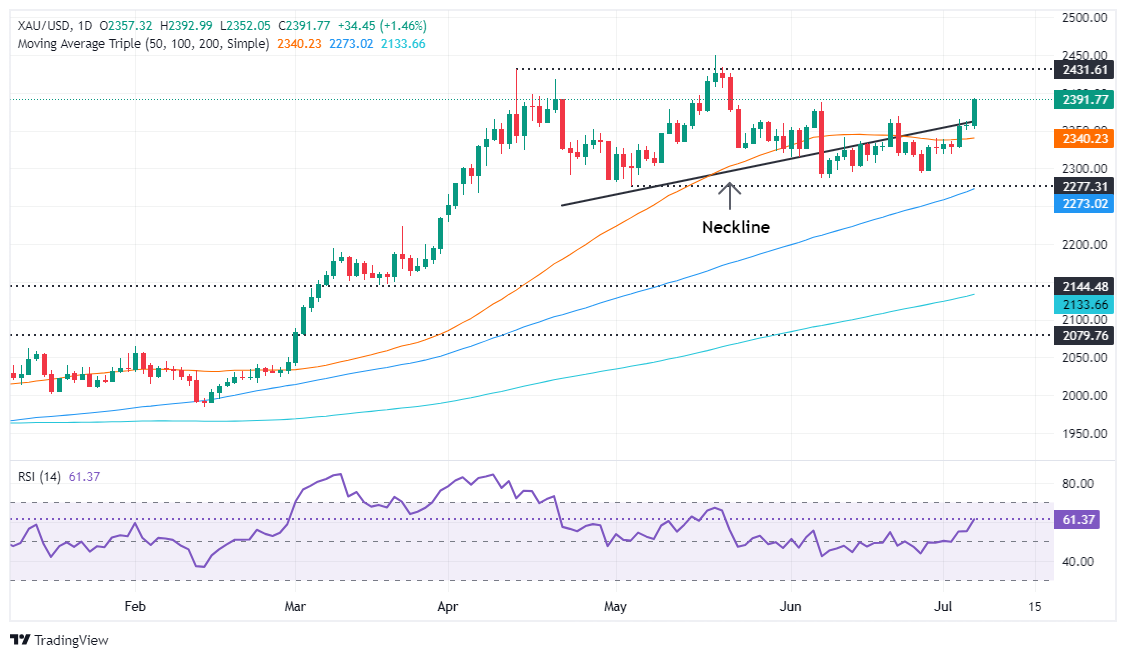
- Gold price leaped over 1% to $2,385, spurred by mixed US NFP data and heightened Fed rate cut speculation.
- June NFP surpasses forecasts, yet revisions for April and May indicate an accelerating labor market cooldown.
- US Dollar Index (DXY) declines 0.16% to 104.95; 10-year Treasury yield drops more than six basis points to 4.284%.
The Gold price rallied during the mid-North American session following the release of June’s US Nonfarm Payrolls (NFP) report, which exceeded forecasts, but two previous months’ downward revisions hinted that the labor market is cooling faster than the figures show. Therefore, traders bet that the Federal Reserve (Fed) will cut rates in September, increasing a headwind for the Greenback and a tailwind for the yellow metal.
The XAU/USD trades at $2,385 and registers gains of over 1% after bouncing off daily lows of $2,349, sponsored in part by a weaker US Dollar, which remains undermined by lower US Treasury bond yields.
The US Dollar Index (DX) is losing 0.16%, down to 104.95, while the US 10-year benchmark yield tumbles more than six basis points (bps) to 4.284%.
US NFPs for June were positive, but the data from April and May were downwardly revised, hinting that the economy added 111,000 fewer jobs than reported in those two months. Consequently, the Unemployment Rate rose a tenth in June, above consensus.
Other data from the US Bureau of Labor Statistics (BLS) revealed that Average Hourly Earnings (AHE) remained flat MoM but declined yearly.
Aside from this, geopolitics continued to play an important role in the golden metal’s path. Israeli Prime Minister Benjamin Netanyahu sent a delegation to continue negotiations on hostages and reiterated the war wouldn’t end until Israel achieves all its objectives. Meanwhile, a Hamas leader said they’re waiting for a positive response from Israel to start negotiations on the details of a deal, according to CNN.
Daily digest market movers: Gold price advances post US NFP
- US Nonfarm Payrolls increased by 206K, surpassing the estimated 190K, but April and May's figures were revised down to 108K and 218K, respectively.
- Average Hourly Earnings (AHE) declined from 4.1% to 3.9% YoY, which is in line with expectations, while the Unemployment Rate increased from 4% to 4.1%.
- On Wednesday, the Federal Open Market Committee (FOMC) revealed June’s Meeting Minutes, which showed that most participants estimated that the current policy is restrictive but had opened the door for rate increases. Policymakers acknowledged the economy is cooling and could react to unexpected economic weakness.
- According to the CME FedWatch Tool, odds for a 25-basis-point Fed rate cut in September are at 70%, up from 66% on Thursday.
- December 2024 fed funds rate futures contract implies that the Fed will ease policy by 40 basis points (bps) toward the end of the year.
Technical analysis: Gold price crushes Head-and-Shoulders neckline, aims for $2,400
Gold price has decisively broken the Head-and-Shoulders neckline, lifting spot prices near the $2,390 mark, indicating that bulls are in charge and higher prices lie ahead.
The momentum has shifted in buyers' favor as depicted by a bullish Relative Strength Index (RSI). A daily close above the June 21 high of $2,368 could open the door for a higher trading range within the $2,370-$2,400 area, with buyers targeting higher prices.
If the price breaks above $2,400, it will expose the year-to-date high of $2,450 before challenging $2,500.
On the other hand, if sellers drive the spot price below $2,350, further declines could target the $2,300 level. If this support fails, the next demand zone would be the May 3 low of $2,277, followed by the March 21 high of $2,222.
Gold FAQs
Gold has played a key role in human’s history as it has been widely used as a store of value and medium of exchange. Currently, apart from its shine and usage for jewelry, the precious metal is widely seen as a safe-haven asset, meaning that it is considered a good investment during turbulent times. Gold is also widely seen as a hedge against inflation and against depreciating currencies as it doesn’t rely on any specific issuer or government.
Central banks are the biggest Gold holders. In their aim to support their currencies in turbulent times, central banks tend to diversify their reserves and buy Gold to improve the perceived strength of the economy and the currency. High Gold reserves can be a source of trust for a country’s solvency. Central banks added 1,136 tonnes of Gold worth around $70 billion to their reserves in 2022, according to data from the World Gold Council. This is the highest yearly purchase since records began. Central banks from emerging economies such as China, India and Turkey are quickly increasing their Gold reserves.
Gold has an inverse correlation with the US Dollar and US Treasuries, which are both major reserve and safe-haven assets. When the Dollar depreciates, Gold tends to rise, enabling investors and central banks to diversify their assets in turbulent times. Gold is also inversely correlated with risk assets. A rally in the stock market tends to weaken Gold price, while sell-offs in riskier markets tend to favor the precious metal.
The price can move due to a wide range of factors. Geopolitical instability or fears of a deep recession can quickly make Gold price escalate due to its safe-haven status. As a yield-less asset, Gold tends to rise with lower interest rates, while higher cost of money usually weighs down on the yellow metal. Still, most moves depend on how the US Dollar (USD) behaves as the asset is priced in dollars (XAU/USD). A strong Dollar tends to keep the price of Gold controlled, whereas a weaker Dollar is likely to push Gold prices up.
- Dow Jones churned but went nowhere after US NFP beats forecasts.
- Despite NFP beat, steep revisions sparked rate cut hopes.
- Rebounding risk sentiment pushed other indexes higher but left Dow Jones behind.
The Dow Jones Industrial Average (DJIA) whipsawed on Friday, churning around 39,300.00 after US Nonfarm Payrolls (NFP) gave markets just enough wiggle room to reignite rate cut hopes. The broader US equity market firmly climbed on fresh expectations of a rate trim from the Federal Reserve (Fed), but the Dow Jones remained mired in technical consolidation.
Read more: US Nonfarm Payrolls increase 206,000 in June vs. 190,000 forecast
Friday’s US NFP beat median market forecasts, adding 206K net new jobs in June. While the figure handily beat the expected 190K, the previous month saw a sharp downside revision to 218K from the initial print of 272K.
US Average Hourly Earnings growth also cooled for the year ended June, easing to the expected 3.9% YoY compared to the previous period’s 4.1%. The US Unemployment Rate also ticked higher, rising to 4.1% for the first time since December of 2021. Markets had broadly forecast a hold at 4.0%.
Fed Semi-Annual Policy Report: Need greater confidence before moving to rate cuts
Investors have brushed off the above-forecast NFP print to focus on rising unemployment, cooling wages, and downside revisions to previous jobs reports to scale up bets that the Fed will get pushed towards rate cuts sooner rather than later. According to the CME’s FedWatch Tool, rate markets are pricing in nearly 80% odds of at least a quarter-point rate trim on September 18.
Economic Indicator
Nonfarm Payrolls
The Nonfarm Payrolls release presents the number of new jobs created in the US during the previous month in all non-agricultural businesses; it is released by the US Bureau of Labor Statistics (BLS). The monthly changes in payrolls can be extremely volatile. The number is also subject to strong reviews, which can also trigger volatility in the Forex board. Generally speaking, a high reading is seen as bullish for the US Dollar (USD), while a low reading is seen as bearish, although previous months' reviews and the Unemployment Rate are as relevant as the headline figure. The market's reaction, therefore, depends on how the market assesses all the data contained in the BLS report as a whole.
Read more.Last release: Fri Jul 05, 2024 12:30
Frequency: Monthly
Actual: 206K
Consensus: 190K
Previous: 272K
Source: US Bureau of Labor Statistics
America’s monthly jobs report is considered the most important economic indicator for forex traders. Released on the first Friday following the reported month, the change in the number of positions is closely correlated with the overall performance of the economy and is monitored by policymakers. Full employment is one of the Federal Reserve’s mandates and it considers developments in the labor market when setting its policies, thus impacting currencies. Despite several leading indicators shaping estimates, Nonfarm Payrolls tend to surprise markets and trigger substantial volatility. Actual figures beating the consensus tend to be USD bullish.
Dow Jones news
Despite struggling to match Friday gains posted by other major equity indexes, Dow Jones is tilted notably into the high side. Two-thirds of the DJIA’s constituent equities are in the green, with losses being led by Chevron Corp. (CVX) which fell -1.65% to $154.13 per share. Dow Inc. (DOW) trails close behind, backsliding -1.43% to $52.12 per share.
Walmart Inc. (WMT) has surged to the top of the index, climbing 2.4% on the day and challenging $70.00 per share, followed by Intel Corp. (INTC) which gained 2.2% on Friday, pushing into $32.00 per share.
Dow Jones technical outlook
The Dow Jones closes out the first trading week of July struggling to keep above 33,300.00 after a protracted week of chart churn. The index bottomed out late last week near 38,920.00, but a recovery has faced significant downside pressure, this repeated failures to break free of the week’s peak bids near 39,440.00.
The Dow Jones remains hobbled by as supply zone priced in above 39,750.00, and bidders remain unable to shoulder the equity index back above all-time peaks set above 40,000.00 in May.
Dow Jones hourly chart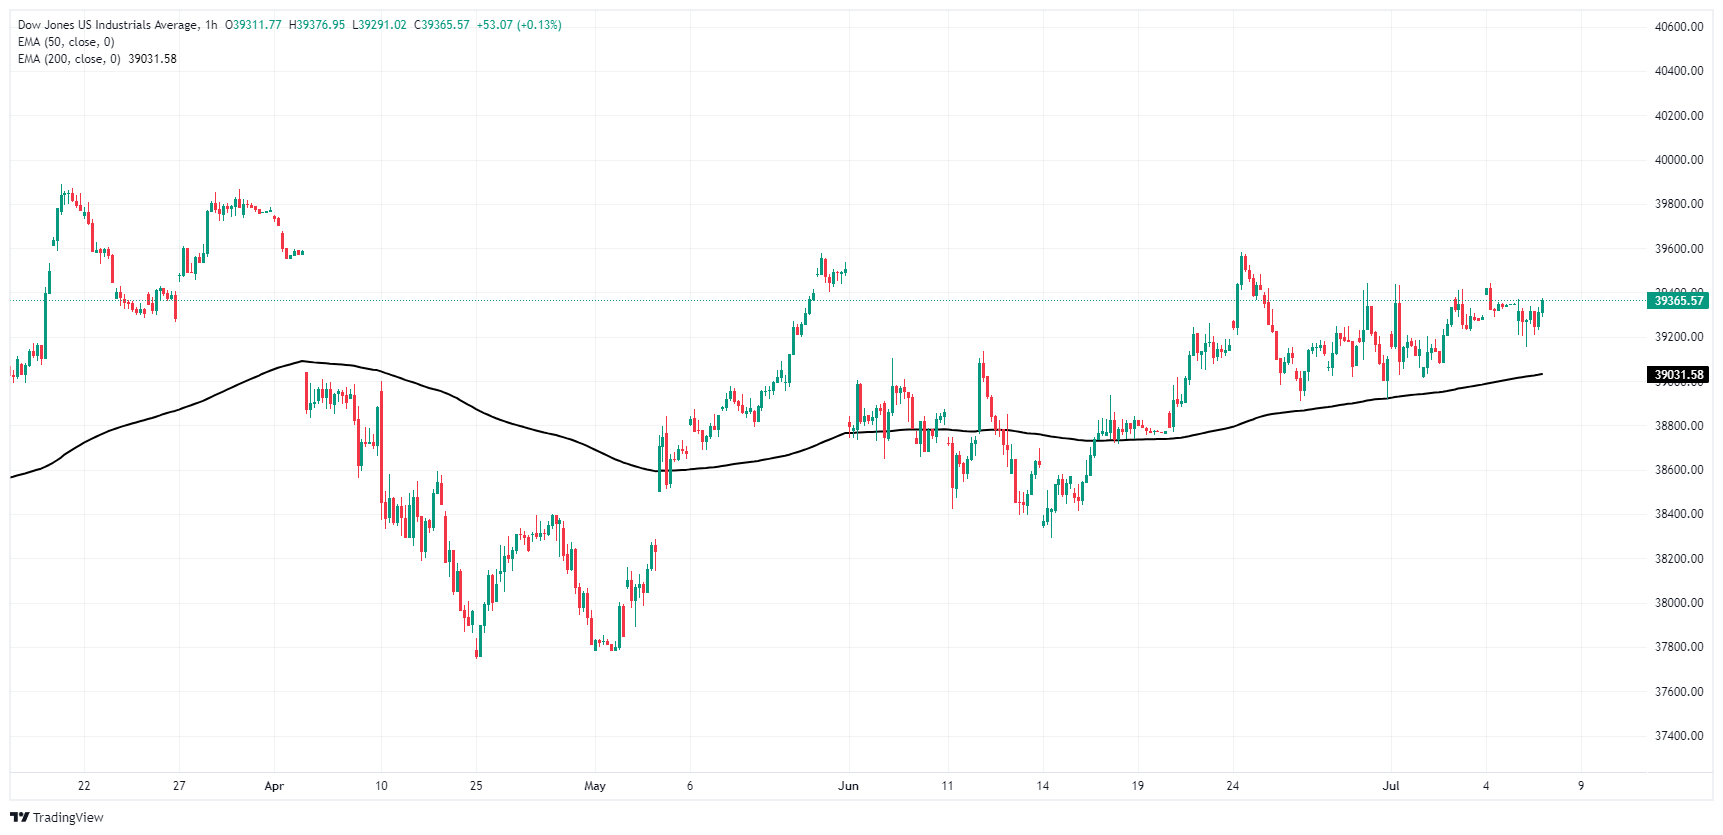
Dow Jones daily chart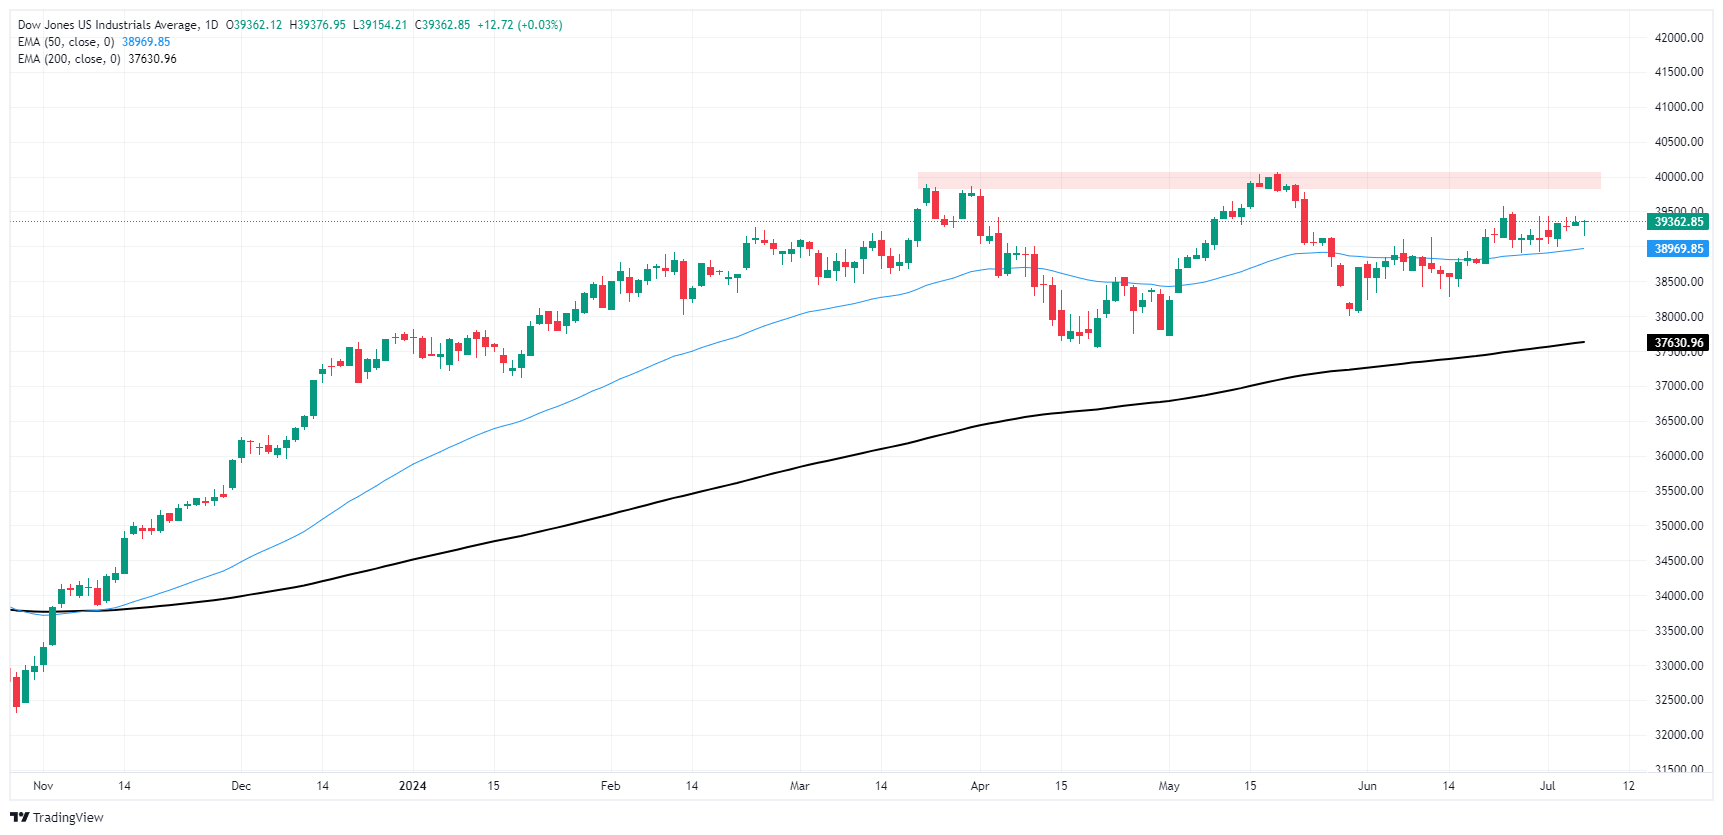
Dow Jones FAQs
The Dow Jones Industrial Average, one of the oldest stock market indices in the world, is compiled of the 30 most traded stocks in the US. The index is price-weighted rather than weighted by capitalization. It is calculated by summing the prices of the constituent stocks and dividing them by a factor, currently 0.152. The index was founded by Charles Dow, who also founded the Wall Street Journal. In later years it has been criticized for not being broadly representative enough because it only tracks 30 conglomerates, unlike broader indices such as the S&P 500.
Many different factors drive the Dow Jones Industrial Average (DJIA). The aggregate performance of the component companies revealed in quarterly company earnings reports is the main one. US and global macroeconomic data also contributes as it impacts on investor sentiment. The level of interest rates, set by the Federal Reserve (Fed), also influences the DJIA as it affects the cost of credit, on which many corporations are heavily reliant. Therefore, inflation can be a major driver as well as other metrics which impact the Fed decisions.
Dow Theory is a method for identifying the primary trend of the stock market developed by Charles Dow. A key step is to compare the direction of the Dow Jones Industrial Average (DJIA) and the Dow Jones Transportation Average (DJTA) and only follow trends where both are moving in the same direction. Volume is a confirmatory criteria. The theory uses elements of peak and trough analysis. Dow’s theory posits three trend phases: accumulation, when smart money starts buying or selling; public participation, when the wider public joins in; and distribution, when the smart money exits.
There are a number of ways to trade the DJIA. One is to use ETFs which allow investors to trade the DJIA as a single security, rather than having to buy shares in all 30 constituent companies. A leading example is the SPDR Dow Jones Industrial Average ETF (DIA). DJIA futures contracts enable traders to speculate on the future value of the index and Options provide the right, but not the obligation, to buy or sell the index at a predetermined price in the future. Mutual funds enable investors to buy a share of a diversified portfolio of DJIA stocks thus providing exposure to the overall index.
- Rising US Unemployment figures had USD facing selling pressure.
- Australia reported mixed housing data on Friday.
- Monterey divergences between the Fed and RBA might push the pair up further.
The Australian Dollar (AUD) holds its ground against the USD on Friday, which weakened following soft US Nonfarm Payrolls (NFP) figures but stands at its highest level since early January at 0.6740.
The Reserve Bank of Australia (RBA) might be one of the final G10 central banks to initiate cuts, which should continue to support the Aussie amid these conditions. Despite signs of a weakening Australian economy, persistent inflation prompts the RBA to remain hawkish, and encouraging Retail Sales data reported earlier in the week depicts a strong economic outlook.
Updated daily market movers: AUD strength holds despite sluggish housing market
- Housing loan commitments in Australia for March have risen up to 3.1% MoM, beating the expected 1.0% and a revised 1.9% from February.
- However, this may signal a boost in house prices impacting average loan sizes, rather than an increase in demand for domiciles.
- Current consumer sentiment surveys point toward sluggish buying sentiment in terms of housing.
- Across the Pacific, US NFPs revealed a rise of 206K in June, exceeding the market expectation of 190K. This followed a revised 218K increase in May.
- Nevertheless, these figures have not done much to bolster the USD, as the Unemployment Rate in the US has slightly risen to 4.1% from 4%.
- Wage inflation, measured by the change in the Average Hourly Earnings, declined to 3.9% YoY, widely expected by markets.
- On the RBA side, markets indicate a marginal 10% probability of a rate hike from the RBA before the end of the year.
- On the Fed’s side, the market is fully pricing in two rate cuts by the end of the year, subject to the ongoing labor market data and inflation figures.
Technical analysis: AUD/USD maintains momentum, bullish outlook continues
The AUD/USD pair shows no signs of losing momentum, backed by the deep positive territory of technical indicators of the Relative Strength Index (RSI) and Moving Average Convergence Divergence (MACD). As the pair reaches its January highs, the bullish outlook is more promising. However, traders should monitor if the mentioned indicators start to flag overbought conditions.
The next bullish targets are the resistances at 00.6750 and 0.6800. Concurrently, the support levels to watch are 0.6670, 0.6650 and 0.6630.
Australian Dollar FAQs
One of the most significant factors for the Australian Dollar (AUD) is the level of interest rates set by the Reserve Bank of Australia (RBA). Because Australia is a resource-rich country another key driver is the price of its biggest export, Iron Ore. The health of the Chinese economy, its largest trading partner, is a factor, as well as inflation in Australia, its growth rate and Trade Balance. Market sentiment – whether investors are taking on more risky assets (risk-on) or seeking safe-havens (risk-off) – is also a factor, with risk-on positive for AUD.
The Reserve Bank of Australia (RBA) influences the Australian Dollar (AUD) by setting the level of interest rates that Australian banks can lend to each other. This influences the level of interest rates in the economy as a whole. The main goal of the RBA is to maintain a stable inflation rate of 2-3% by adjusting interest rates up or down. Relatively high interest rates compared to other major central banks support the AUD, and the opposite for relatively low. The RBA can also use quantitative easing and tightening to influence credit conditions, with the former AUD-negative and the latter AUD-positive.
China is Australia’s largest trading partner so the health of the Chinese economy is a major influence on the value of the Australian Dollar (AUD). When the Chinese economy is doing well it purchases more raw materials, goods and services from Australia, lifting demand for the AUD, and pushing up its value. The opposite is the case when the Chinese economy is not growing as fast as expected. Positive or negative surprises in Chinese growth data, therefore, often have a direct impact on the Australian Dollar and its pairs.
Iron Ore is Australia’s largest export, accounting for $118 billion a year according to data from 2021, with China as its primary destination. The price of Iron Ore, therefore, can be a driver of the Australian Dollar. Generally, if the price of Iron Ore rises, AUD also goes up, as aggregate demand for the currency increases. The opposite is the case if the price of Iron Ore falls. Higher Iron Ore prices also tend to result in a greater likelihood of a positive Trade Balance for Australia, which is also positive of the AUD.
The Trade Balance, which is the difference between what a country earns from its exports versus what it pays for its imports, is another factor that can influence the value of the Australian Dollar. If Australia produces highly sought after exports, then its currency will gain in value purely from the surplus demand created from foreign buyers seeking to purchase its exports versus what it spends to purchase imports. Therefore, a positive net Trade Balance strengthens the AUD, with the opposite effect if the Trade Balance is negative.
- Mexican Peso hit an eight-day high of 17.99 before losing traction.
- Light economic week in Mexico; upcoming data includes May CPI, Consumer Confidence, and Banxico meeting minutes.
- US Nonfarm Payrolls exceed expectations; revisions to prior months fuel predictions of Fed easing.
The Mexican Peso was virtually flat against the US Dollar on Friday after seesawing within the 17.99 – 18.19 range. Mixed US jobs data sparked speculation that the Federal Reserve (Fed) could cut interest rates in September, sending the emerging market currency soaring before the USD/MXN trimmed its losses and traded at 18.08, posting minimal gains of 0.02%.
Wall Street trades mixed, while the Greenback stages a slim recovery against the Mexican currency. Mexico’s economic docket is empty, with traders eyeing the release of the Consumer Price Index (CPI) for May next week, along with Consumer Confidence and the Bank of Mexico’s (Banxico) last monetary policy meeting minutes.
The US Nonfarm Payrolls report for June beat estimates, though downward revisions to April and May’s figures prompted traders to increase their bets that the Fed will begin its easing cycle in September.
Additional data showed that Average Hourly Earnings (AHE) were flat monthly but dipped in the twelve months to June and the Unemployment Rate rose, according to the US Bureau of Labor Statistics (BLS).
Following the data release, US Treasury yields tumbled, with the 10-year benchmark note rate falling six-and-a-half basis points to 4.284%, a headwind for the US Dollar. Meanwhile, the US Dollar Index, which tracks the buck’s performance against six currencies, dropped 0.12% yet trimmed some earlier losses and is currently around 105.00.
According to the CME FedWatch Tool, the odds for a September 2024 cut are 70% higher than the chance a day ago of 66%.
Daily digest market movers: Mexican Peso rises further on US Dollar weakness
- Banxico’s survey showed that economists estimate the Gross Domestic Product (GDP) to end the year at 2%, down from 2.1%. They expect Banxico to cut rates from 11.00% to 10.25%, up from 10.00% projected in May.
- Some analysts in Mexico estimate the economy might slow down but dodge a recession, according to the National Statistics Agency (INEGI) Coincident Indicator. Despite that, they said reforms pushed by President Andres Manuel Lopez Obrador (AMLO), particularly the judiciary reform, could affect the country’s creditworthiness.
- US Nonfarm Payrolls grew by 206K, exceeding the estimated 190K, but April and May were revised lower from 165K to 108K and 272K to 218K, respectively.
- Average Hourly Earnings (AHE) edged lower from 4.1% to 3.9% YoY, as expected, while the Unemployment Rate rose from 4% to 4.1%.
Technical analysis: Mexican Peso stays near weekly lows, USD/MXN hovers around 18.10
The USD/MXN dropped to an eight-day low of 17.99 just to find bids that pushed the exchange rate back toward the 18.10 area. Friday’s price action is forming a Doji candle, an indication that neither buyers nor sellers are winning the battle that could keep the exotic pair trading within the 18.00-18.10 in the short term.
Momentum shows a slight recovery as the Relative Strength Index (RSI) turned flat in bullish territory after posting three days of lower readings. This confirms the USD/MXN range-bound trading.
For a bullish resumption, the USD/MXN must surpass 18.10, followed by a rally above the June 28 high of 18.59, so buyers can challenge the YTD high at 18.99. Conversely, sellers will need a drop below 18.00, which could extend the pair’s decline toward the December 5 high, which turned support at 17.56, followed by the 50-day Simple Moving Average (SMA) at 17.37.

Mexican Peso FAQs
The Mexican Peso (MXN) is the most traded currency among its Latin American peers. Its value is broadly determined by the performance of the Mexican economy, the country’s central bank’s policy, the amount of foreign investment in the country and even the levels of remittances sent by Mexicans who live abroad, particularly in the United States. Geopolitical trends can also move MXN: for example, the process of nearshoring – or the decision by some firms to relocate manufacturing capacity and supply chains closer to their home countries – is also seen as a catalyst for the Mexican currency as the country is considered a key manufacturing hub in the American continent. Another catalyst for MXN is Oil prices as Mexico is a key exporter of the commodity.
The main objective of Mexico’s central bank, also known as Banxico, is to maintain inflation at low and stable levels (at or close to its target of 3%, the midpoint in a tolerance band of between 2% and 4%). To this end, the bank sets an appropriate level of interest rates. When inflation is too high, Banxico will attempt to tame it by raising interest rates, making it more expensive for households and businesses to borrow money, thus cooling demand and the overall economy. Higher interest rates are generally positive for the Mexican Peso (MXN) as they lead to higher yields, making the country a more attractive place for investors. On the contrary, lower interest rates tend to weaken MXN.
Macroeconomic data releases are key to assess the state of the economy and can have an impact on the Mexican Peso (MXN) valuation. A strong Mexican economy, based on high economic growth, low unemployment and high confidence is good for MXN. Not only does it attract more foreign investment but it may encourage the Bank of Mexico (Banxico) to increase interest rates, particularly if this strength comes together with elevated inflation. However, if economic data is weak, MXN is likely to depreciate.
As an emerging-market currency, the Mexican Peso (MXN) tends to strive during risk-on periods, or when investors perceive that broader market risks are low and thus are eager to engage with investments that carry a higher risk. Conversely, MXN tends to weaken at times of market turbulence or economic uncertainty as investors tend to sell higher-risk assets and flee to the more-stable safe havens.
- Canadian Dollar backslides across the board after net jobs contract.
- Canada printed the second net negative jobs figure in 2024.
- Losses limited against the Greenback after sharp revisions to US NFP.
The Canadian Dollar broadly soured on Friday, getting pushed to the floorboards after Canadian Net Change in Employment printed a contraction for the second time in 2024 and missing forecasts by a wide margin. US Nonfarm Payrolls (NFP) beat forecasts, but steep revisions to previous figures helped to reignite hopes for a September rate cut.
Canada also reported a higher-than-expected increase in the Unemployment Rate. However, still rising wage pressures and increased Ivey Purchasing Managers Index (PMI) activity surveys bode poorly for future rate cuts as bellwethers of inflation pressures continue to build after the Bank of Canada (BoC) raced to cut rates in 2024.
Daily digest market movers: Canadian Dollar takes a dive as bad data sours risk-on chances
- Canadian Net Change in Employment in June sharply missed forecasts, printing at -1.4K MoM versus the previous 26.7K, far below the forecast of 22.5K.
- Canadian Unemployment Rate also ticked higher in June, rising to 6.4% from the previous 6.2%, running above the forecast for 6.3%.
- Canadian Average Hourly Wages rose 5.6% YoY in June, accelerating from the previous 5.2%.
- Canadian Ivey PMIs in June rose to 62.4 from the previous 59.1.
- US NFP net job gains handily beat forecasts, clocking in at 206K versus the forecast of 190K. However, the previous month’s figure was sharply revised lower to 218K from the initial print of 272K.
- US Average Hourly Earnings came in as expected, growing 3.9% YoY through June and cooling slightly from the previous 4.1%.
- With wage pressures easing and after-the-fact revisions chilling US NFP labor data, markets are again piling into bets of a September rate cut from the Federal Reserve (Fed). According to the CME’s FedWatch Tool, rate traders are pricing in nearly 80% odds of at least a quarter-point rate trim on September 18.
Canadian Dollar PRICE Today
The table below shows the percentage change of Canadian Dollar (CAD) against listed major currencies today. Canadian Dollar was the strongest against the US Dollar.
| USD | EUR | GBP | JPY | CAD | AUD | NZD | CHF | |
|---|---|---|---|---|---|---|---|---|
| USD | -0.13% | -0.31% | -0.24% | 0.18% | -0.20% | -0.29% | -0.26% | |
| EUR | 0.13% | -0.19% | -0.10% | 0.32% | -0.07% | -0.16% | -0.14% | |
| GBP | 0.31% | 0.19% | 0.10% | 0.52% | 0.13% | 0.03% | 0.03% | |
| JPY | 0.24% | 0.10% | -0.10% | 0.41% | 0.05% | -0.06% | -0.04% | |
| CAD | -0.18% | -0.32% | -0.52% | -0.41% | -0.39% | -0.46% | -0.47% | |
| AUD | 0.20% | 0.07% | -0.13% | -0.05% | 0.39% | -0.09% | -0.07% | |
| NZD | 0.29% | 0.16% | -0.03% | 0.06% | 0.46% | 0.09% | -0.01% | |
| CHF | 0.26% | 0.14% | -0.03% | 0.04% | 0.47% | 0.07% | 0.00% |
The heat map shows percentage changes of major currencies against each other. The base currency is picked from the left column, while the quote currency is picked from the top row. For example, if you pick the Canadian Dollar from the left column and move along the horizontal line to the US Dollar, the percentage change displayed in the box will represent CAD (base)/USD (quote).
Technical analysis: Canadian Dollar pares recent gains, snaps three-day win streak against Greenback
The Canadian Dollar (CAD) fell across the board on Friday, unceremoniously ending a three-day winning streak against the US Dollar (USD) and paring away Thursday’s gains as the CAD fell a fifth of a percent against the USD. An overall weaker US Dollar on Friday helped to limit losses, with the Canadian Dollar falling one-half of one percent against the Pound Sterling (GBP), Japanese Yen (JPY) and Swiss Franc (CHF).
USD/CAD retested 1.3650, rising from a near-term floor just above the 1.3600 handle, and bidders will be looking for a fresh break north of the 200-hour Exponential Moving Average (EMA) at 1.3666. Daily candlesticks continue to hold onto chart territory above 1.3600 as a consolidation pattern continues to build into the charts, and price action is getting squeezed by a supply zone priced in above 1.3750 and a rising 200-day EMA at 1.3591.
USD/CAD hourly chart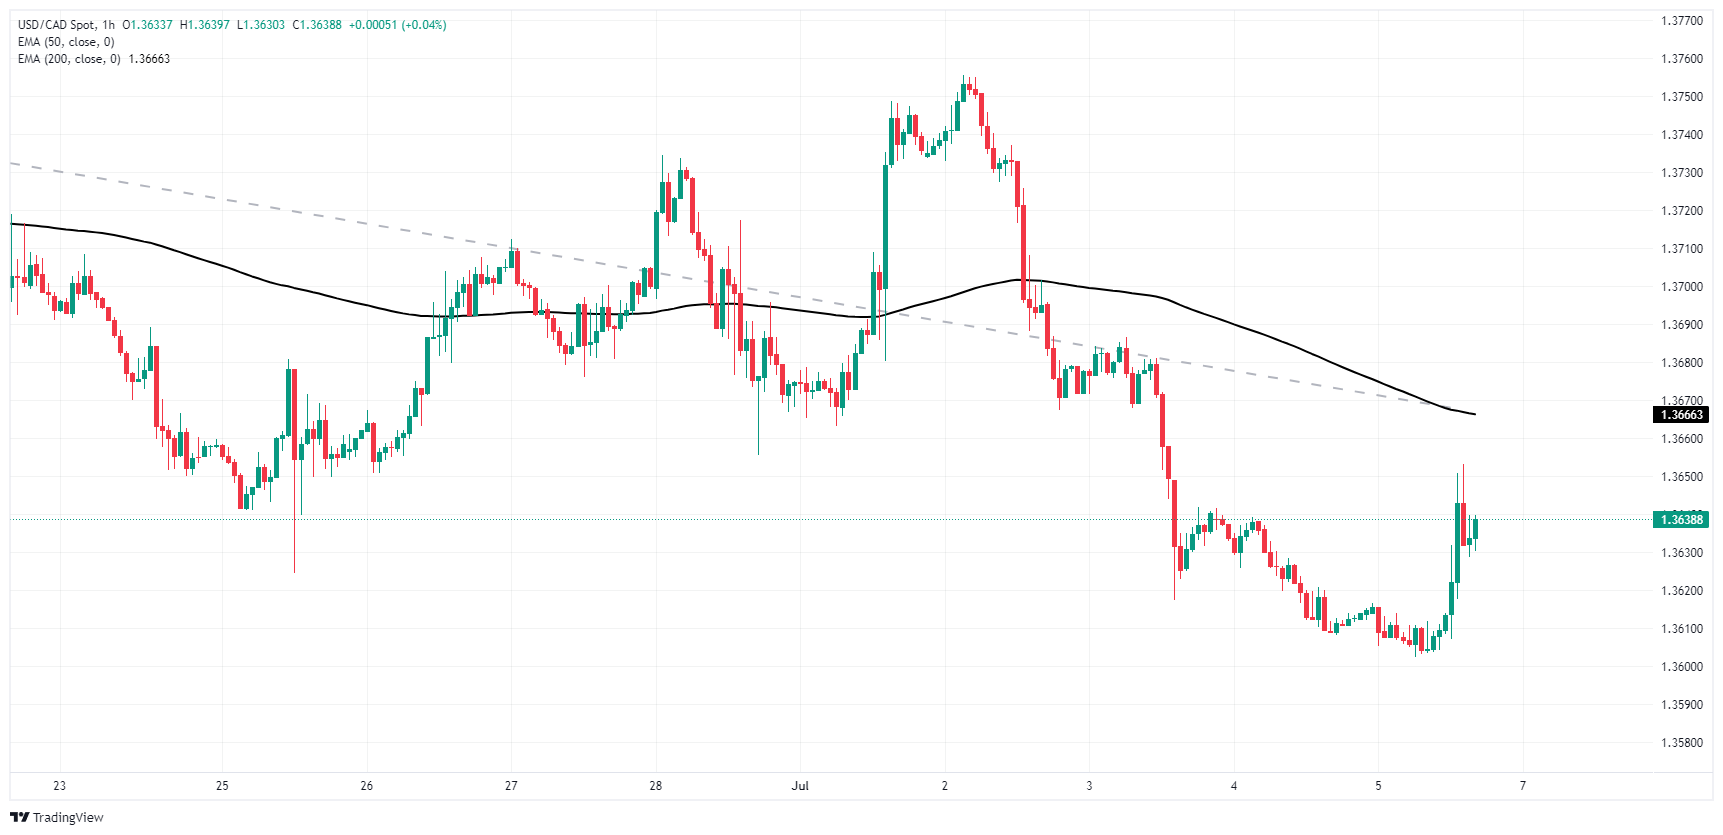
USD/CAD daily chart
Canadian Dollar FAQs
The key factors driving the Canadian Dollar (CAD) are the level of interest rates set by the Bank of Canada (BoC), the price of Oil, Canada’s largest export, the health of its economy, inflation and the Trade Balance, which is the difference between the value of Canada’s exports versus its imports. Other factors include market sentiment – whether investors are taking on more risky assets (risk-on) or seeking safe-havens (risk-off) – with risk-on being CAD-positive. As its largest trading partner, the health of the US economy is also a key factor influencing the Canadian Dollar.
The Bank of Canada (BoC) has a significant influence on the Canadian Dollar by setting the level of interest rates that banks can lend to one another. This influences the level of interest rates for everyone. The main goal of the BoC is to maintain inflation at 1-3% by adjusting interest rates up or down. Relatively higher interest rates tend to be positive for the CAD. The Bank of Canada can also use quantitative easing and tightening to influence credit conditions, with the former CAD-negative and the latter CAD-positive.
The price of Oil is a key factor impacting the value of the Canadian Dollar. Petroleum is Canada’s biggest export, so Oil price tends to have an immediate impact on the CAD value. Generally, if Oil price rises CAD also goes up, as aggregate demand for the currency increases. The opposite is the case if the price of Oil falls. Higher Oil prices also tend to result in a greater likelihood of a positive Trade Balance, which is also supportive of the CAD.
While inflation had always traditionally been thought of as a negative factor for a currency since it lowers the value of money, the opposite has actually been the case in modern times with the relaxation of cross-border capital controls. Higher inflation tends to lead central banks to put up interest rates which attracts more capital inflows from global investors seeking a lucrative place to keep their money. This increases demand for the local currency, which in Canada’s case is the Canadian Dollar.
Macroeconomic data releases gauge the health of the economy and can have an impact on the Canadian Dollar. Indicators such as GDP, Manufacturing and Services PMIs, employment, and consumer sentiment surveys can all influence the direction of the CAD. A strong economy is good for the Canadian Dollar. Not only does it attract more foreign investment but it may encourage the Bank of Canada to put up interest rates, leading to a stronger currency. If economic data is weak, however, the CAD is likely to fall.
- US Dollar extends its downward trend after ending last week with 0.85% loss.
- NFPs highlight was an unexpected rise in Unemployment.
- Markets are now seeing two cuts in 2024.
The US Dollar, represented by the DXY Index, has extended its decline, weighed down by soft labor market figures falling below 105.00 on Friday.
Amid growing signals of disinflation in the US economy, there is growing confidence in a September rate cut. However, Federal Reserve (Fed) officials continue to refrain from immediate rate cuts, maintaining a data-dependent approach, but have started to acknowledge labor market struggles.
Daily digest market movers: US Dollar sags further after lackluster labor market data
- Nonfarm Payrolls (NFP) in the US increased by 206K in June as reported by the US Bureau of Labor Statistics (BLS) on Friday.
- NFP figure exceeds the market expectation of 190K yet falls short compared to May's revised increase of 218K (adjusted from 272K).
- Unemployment Rate inched higher to 4.1% from 4%, and the Labor Force Participation Rate edged up slightly to 62.6% from 62.5%.
- Average Hourly Earnings, the key metric for wage inflation, dipped to a YoY rise of 3.9% from 4.1%, aligning with market expectations.
- Fed swaps market has resumed full pricing in two rate cuts for year-end.
- Nonetheless, those figures will depend on how Fed officials interpret ongoing labor market data and inflation figures.
DXY technical outlook: DXY continues to be plagued by challenges, now approaching 200-day SMA
After losing its hold over the 20-day Simple Moving Average (SMA), the technical outlook for the DXY Index has turned negative. Both the Relative Strength Index (RSI) and the Moving Average Convergence Divergence (MACD) indicator have dipped into the negative zone with the latter at its lowest since mid-June.
If the selling pressure persists, the 104.70 level (200-day SMA) will offer strong support.
US Dollar FAQs
The US Dollar (USD) is the official currency of the United States of America, and the ‘de facto’ currency of a significant number of other countries where it is found in circulation alongside local notes. It is the most heavily traded currency in the world, accounting for over 88% of all global foreign exchange turnover, or an average of $6.6 trillion in transactions per day, according to data from 2022. Following the second world war, the USD took over from the British Pound as the world’s reserve currency. For most of its history, the US Dollar was backed by Gold, until the Bretton Woods Agreement in 1971 when the Gold Standard went away.
The most important single factor impacting on the value of the US Dollar is monetary policy, which is shaped by the Federal Reserve (Fed). The Fed has two mandates: to achieve price stability (control inflation) and foster full employment. Its primary tool to achieve these two goals is by adjusting interest rates. When prices are rising too quickly and inflation is above the Fed’s 2% target, the Fed will raise rates, which helps the USD value. When inflation falls below 2% or the Unemployment Rate is too high, the Fed may lower interest rates, which weighs on the Greenback.
In extreme situations, the Federal Reserve can also print more Dollars and enact quantitative easing (QE). QE is the process by which the Fed substantially increases the flow of credit in a stuck financial system. It is a non-standard policy measure used when credit has dried up because banks will not lend to each other (out of the fear of counterparty default). It is a last resort when simply lowering interest rates is unlikely to achieve the necessary result. It was the Fed’s weapon of choice to combat the credit crunch that occurred during the Great Financial Crisis in 2008. It involves the Fed printing more Dollars and using them to buy US government bonds predominantly from financial institutions. QE usually leads to a weaker US Dollar.
Quantitative tightening (QT) is the reverse process whereby the Federal Reserve stops buying bonds from financial institutions and does not reinvest the principal from the bonds it holds maturing in new purchases. It is usually positive for the US Dollar.
In its Semi-Annual Monetary Policy Report published on Friday, the Federal Reserve (Fed) noted that they have seen modest further progress on inflation this year but added that they still need greater confidence before moving to rate cuts, pre Reuters.
Key takeaways
"Labor supply and demand resembles period right before the pandemic, when the labor market was relatively tight but not overheated."
"Expecting housing-related inflation pressures to gradually decline."
"Despite improvements, still significant disparities in job market."
"Financial conditions appear somewhat restrictive on balance, bank lending pace somewhat tepid."
"Financial system remains sound and resilient though parts of banks' commercial real estate portfolios are facing stress."
"Liquidity at most domestic banks remain ample."
"Valuations high relative to fundamentals in major asset classes."
Market reaction
The US Dollar Index showed no immediate reaction to this publication and was last seen losing 0.1% on the day at 105.03.
Despite Pound Sterling’s (GBP) limited reaction to the UK election result, the drop in the value of the US Dollar (USD) over the past couple of sessions has allowed the GBP to move into the position as best performing G10 currency in the year to date, senior FX strategist at Rabobank Jane Foley notes.
GBP/USD to move higher in the months ahead
“GBP has shown little reaction to the July 4 UK general election results, continuing its nonplussed stance of recent weeks. UK politics can avoid the dramas and uncertainties associated with the Brexit, Johnson and Truss periods, we expect that GBP can continue its slow grinding recovery.”
“As expected, Labour won a strong parliamentary majority. However, it only increased its share of the national vote by a small percentage. Both markets and the electorate will be watching closely to see if Labour can consolidate its power. That depends on whether it can deliver on growth and improved living standards.”
“We expect EUR/GBP to edge lower into year end and we view rallies to 0.85 as selling opportunities. Cable will likely be subjected to further bouts of USD volatility in the coming months on uncertainties connected with both US politics and Fed policy, though we expect GBP/USD to move in a moderately higher range in the months ahead.”
- GBP/USD climbs over 0.20%, after US jobs report reveals June gains but revises down April and May.
- Bullish technical outlook as GBP/USD nears key resistance at 1.2660/75.
- Resistance levels: 1.2800, 1.2894 (YTD high), 1.2900, 1.2995 (July 27, 2023, high), approaching 1.3000.
- Support points: 1.2733 (July 4 low), 1.2709 (April 8 high), 1.2700, 1.2673 (50-DMA).
The GBP/USD registered decent gains of more than 0.20% on Friday after June’s US jobs data showed the economy added more jobs than expected, though a revision lower of April and May’s figures hinted the labor market weakened further. The major trades at 1.2790, above its opening price, after hitting a daily low of 1.2752.
GBP/USD Price Analysis: Technical outlook
The GBP/USD has fluctuated around the 1.2800 psychological level during the day, threatening to achieve a daily close above crucial resistance trendlines that have so far turned support at around 1.2660/75.
Momentum remains bullish, as depicted by the Relative Strength Index (RSI), aiming higher after it pierced the 50-neutral line on June 2.
Hence, the GBP/USD path of least resistance is to the upside. Buyers achieving a daily close above 1.2800 would pave the way to challenge the year-to-date (YTD) high of 1.2894. Further upside is seen if the pair hurdles that level, with the next resistance at 1.2900, followed by a July 27, 2023, high of 1.2995 ahead of 1.3000.
For a bearish reversal, sellers will expect the exchange rate to fall below the July 4 daily low of 1.2733. This will expose April’s 8 high, which turned support at 1.2709 before exposing 1.2700. On further losses, that will expose the 50-day moving average (DMA) at 1.2673.
GBP/USD Price Action – Daily Chart
British Pound PRICE Today
The table below shows the percentage change of British Pound (GBP) against listed major currencies today. British Pound was the strongest against the Canadian Dollar.
| USD | EUR | GBP | JPY | CAD | AUD | NZD | CHF | |
|---|---|---|---|---|---|---|---|---|
| USD | -0.13% | -0.30% | -0.19% | 0.14% | -0.17% | -0.26% | -0.21% | |
| EUR | 0.13% | -0.18% | -0.09% | 0.29% | -0.06% | -0.12% | -0.10% | |
| GBP | 0.30% | 0.18% | 0.10% | 0.46% | 0.13% | 0.05% | 0.06% | |
| JPY | 0.19% | 0.09% | -0.10% | 0.36% | 0.06% | -0.05% | -0.01% | |
| CAD | -0.14% | -0.29% | -0.46% | -0.36% | -0.34% | -0.40% | -0.39% | |
| AUD | 0.17% | 0.06% | -0.13% | -0.06% | 0.34% | -0.08% | -0.04% | |
| NZD | 0.26% | 0.12% | -0.05% | 0.05% | 0.40% | 0.08% | 0.01% | |
| CHF | 0.21% | 0.10% | -0.06% | 0.00% | 0.39% | 0.04% | -0.01% |
The heat map shows percentage changes of major currencies against each other. The base currency is picked from the left column, while the quote currency is picked from the top row. For example, if you pick the British Pound from the left column and move along the horizontal line to the US Dollar, the percentage change displayed in the box will represent GBP (base)/USD (quote).
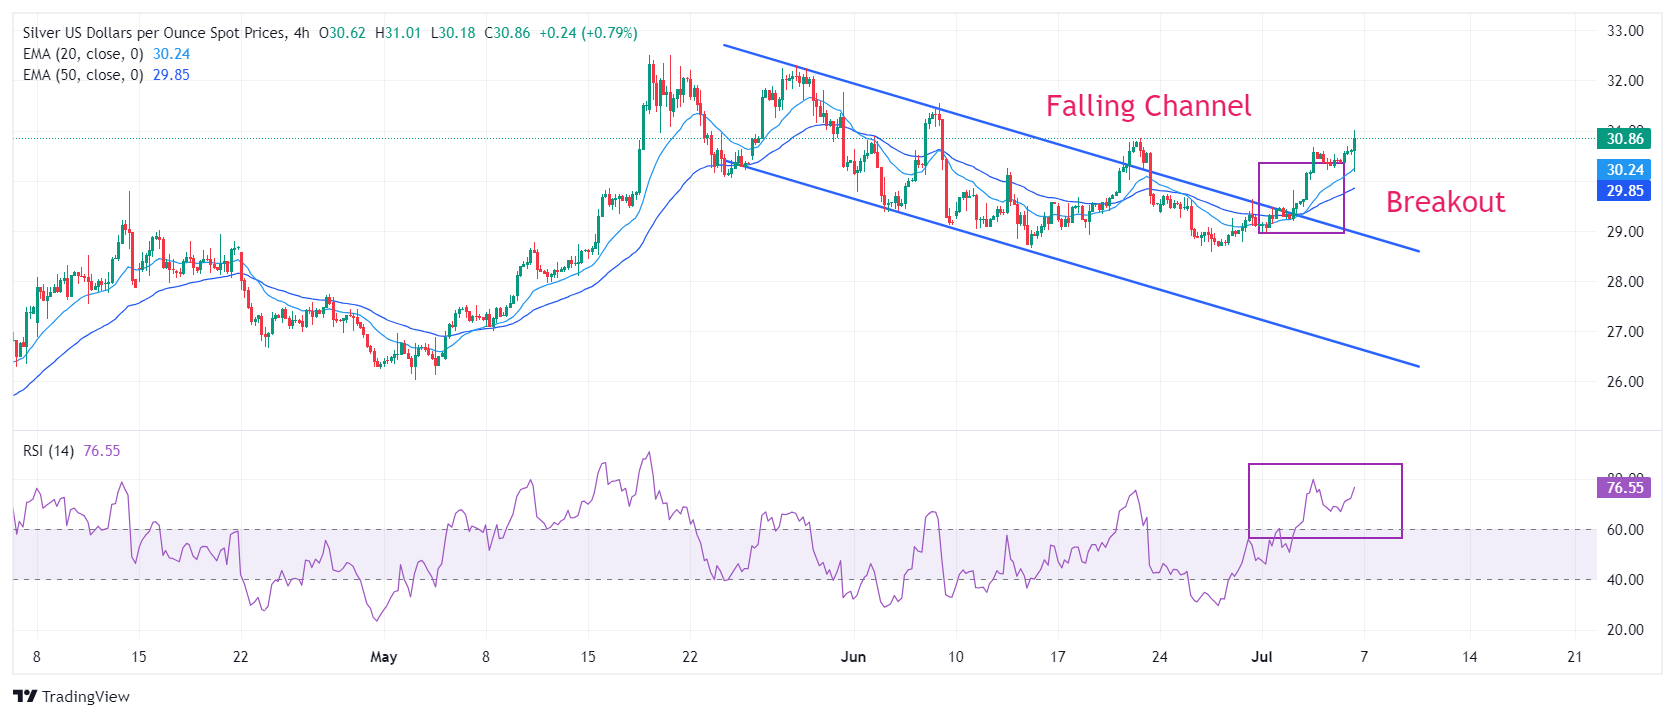
- Silver price jumps to near $31.00 as US yields decline after weak US NFP report.
- The payrolls data beats estimate but remain below May’s reading.
- Silver price strengthens after a Falling Channel breakout.
Silver price (XAG/USD) posts a fresh three-week high near $31.00 in Friday’s American session. The white metal strengthens as US bond yields weaken after the United States (US) Nonfarm Payrolls (NFP) report for June showed that the labor market lost momentum.
The Unemployment Rate rose to 4.1% from the estimates and the prior release of 4.0%. The number of individuals hired by employers came in higher at 206K from estimates of 190K but lower than the prior release of 218K, downwardly revised from 272K.
Also, Average Hourly Earnings declined expectedly in June. On month and annual basis, Average Hourly Earnings grew at a slower pace of 0.3% and 3.9%, respectively.
Soft wage data, downwardly revised payrolls and further rise in the jobless rate suggests that strength in the labor market conditions has eased further. This would boost expectations of early rate cuts by the Federal Reserve (Fed). Currently, market participants expect that the Fed will start reducing interest rates from September.
10-year US Treasury yields fall to near 4.3%. A decline in yields on interest-bearing assets reduces the opportunity cost of holding an investment in non-yielding assets, such as Silver.
The US Dollar Index (DXY), which tracks the Greenback’s value against six major currencies, remains in the bearish trajectory around 105.00.
Silver technical analysis
Silver price strengthens after a breakout of the Falling Channel formation on a four-hour timeframe. An upside break of the above-mentioned chart pattern results in a bullish reversal. A bull cross, represented by 20-and 50-day Exponential Moving Averages (EMAs) at $29.30, exhibits a bullish trend.
The 14-period Relative Strength Index (RSI) shifts into the bullish range of 60.00-80.00, indicating that momentum has shifted to the upside.
Silver four-hour chart
Silver FAQs
Silver is a precious metal highly traded among investors. It has been historically used as a store of value and a medium of exchange. Although less popular than Gold, traders may turn to Silver to diversify their investment portfolio, for its intrinsic value or as a potential hedge during high-inflation periods. Investors can buy physical Silver, in coins or in bars, or trade it through vehicles such as Exchange Traded Funds, which track its price on international markets.
Silver prices can move due to a wide range of factors. Geopolitical instability or fears of a deep recession can make Silver price escalate due to its safe-haven status, although to a lesser extent than Gold's. As a yieldless asset, Silver tends to rise with lower interest rates. Its moves also depend on how the US Dollar (USD) behaves as the asset is priced in dollars (XAG/USD). A strong Dollar tends to keep the price of Silver at bay, whereas a weaker Dollar is likely to propel prices up. Other factors such as investment demand, mining supply – Silver is much more abundant than Gold – and recycling rates can also affect prices.
Silver is widely used in industry, particularly in sectors such as electronics or solar energy, as it has one of the highest electric conductivity of all metals – more than Copper and Gold. A surge in demand can increase prices, while a decline tends to lower them. Dynamics in the US, Chinese and Indian economies can also contribute to price swings: for the US and particularly China, their big industrial sectors use Silver in various processes; in India, consumers’ demand for the precious metal for jewellery also plays a key role in setting prices.
Silver prices tend to follow Gold's moves. When Gold prices rise, Silver typically follows suit, as their status as safe-haven assets is similar. The Gold/Silver ratio, which shows the number of ounces of Silver needed to equal the value of one ounce of Gold, may help to determine the relative valuation between both metals. Some investors may consider a high ratio as an indicator that Silver is undervalued, or Gold is overvalued. On the contrary, a low ratio might suggest that Gold is undervalued relative to Silver.
The minutes of the June European Central Bank (ECB) meeting, published yesterday, showed some members did not agree with cutting rates, ING FX analyst Francesco Pesole notes.
The Euro is set to move within the 1.08/1.09
“It is increasingly clear that the June move was a consequence of a series of pre-commitments, rather than a strong intent to start an easing cycle. Indeed, the minutes confirm the centrality of data dependency at this stage, with particular focus set to be on wages, whose stickiness is keeping many EBC members on the cautious side when discussing further easing.”
”At the same time, there appears to be growing confidence in the ECB's staff economic projections by the Governing Council. Those projections remain rather optimistic on disinflation by end-2025, and will in our view justify two more rate cuts by the ECB this year. Market pricing is less dovish, at 38bp.”
“EUR/USD may move within the 1.08/1.09 range today, and we think the lingering risk of a re-widening in French bond spreads after Sunday’s second round election mean the upside remains capped.”
- USD/CAD turns volatile after the release of the US/Canada Employment report for June.
- US wage growth momentum slowed expectedly while employment numbers beat estimates.
- Canada’s labor market witnessed drawdown while Average Hourly Earnings accelerated.
The USD/CAD pair exhibits wild moves above the round-level support of 1.3600 in Friday’s American session. The Loonie asset turns volatile after the release of the United States/Canada Employment data for June.
The US Nonfarm Payrolls (NFP) report showed that labor demand remained stronger-than-expected. Number of workers hired were 206K, higher than the estimates of 190K but lower than the prior release of 272K. The Unemployment Rate rose to 4.1% from the estimates and the prior release of 4.0%.
Meanwhile, Average Hourly Earnings slowed expectedly. Annually, the wage growth momentum decelerated to 3.9% from the prior release of 4.1%. This has eased fears of price pressures remaining persistent. It would also boost expectations of early rate cuts by the Federal Reserve (Fed). Currently, financial markets expect that the Fed will start reducing interest rates from the September meeting.
The US Dollar Index (DXY), which tracks the Greenback’s value against six major currencies, remains on the backfoot near 105.00. 10-year US Treasury yields fall sharply to near 4.30%.
In Canada, the labor market faced an unexpected drawdown as 1.4K employees were laid-off. Economists expected the labor market to have witnessed addition of 22.5K payrolls lower than May’s reading of 26.7K. The Unemployment Rate rose at a faster pace to 6.4% from the estimates of 6.3% and the prior release of 6.2%.
Average Hourly Earnings grew strongly by 5.6% from the former reading of 5.2%. This would diminish expectations of subsequent rate cuts by the Bank of Canada (BoC). The BoC delivered its first rate-cut decision in June after maintaining a restrictive interest rate framework for more than four years.
Economic Indicator
Average Hourly Wages (YoY)
The Average Hourly Wages, released by Statistics Canada, measures the increase in the salaries earned by permanent employees in Canada. Generally speaking, a rise in this indicator has positive implications for consumer spending, which stimulates economic growth. Generally, a high reading is seen as bullish for the Canadian Dollar (CAD), while a low reading is seen as bearish.
Read more.Last release: Fri Jul 05, 2024 12:30
Frequency: Monthly
Actual: 5.6%
Consensus: -
Previous: 5.2%
Source: Statistics Canada
Before headlines on a possible replacement for the US Democratic candidate take centre stage again, the focus is on the first piece of hard US data for June: US payrolls. The consensus figure was 190k (the data came out at 206k) after the 218K May print (revised from 272k), ING’s analyst Francesco Pesole notes.
Downside risks for the USD are present
“The risks were skewed to a softer reading today after the big drop in the employment component of the ISM services index. To see a major repricing in Federal Reserve rate expectations to the dovish side however, we needed to see payrolls slow below 150k (which didn’t happen) considering the June Fed Dot Plot and rising perceived probability of a Trump win in November work as hawkish counterweights.”
“Over the summer months, we expect to see evidence that the US labour market is at the kind of inflection point that some Fed members like Mary Daly have referred to. We also think that other upside surprises in payrolls may have an asymmetrical, more contained market impact after recent comments by Federal Reserve Chair Jerome Powell suggested the Fed acknowledges that headline figures may overestimate the actual number.”
“We see downside risks for the dollar today, and expect Dollar Index (DXY) to move below 105.0. A substantial repricing in Fed dovish bets may give some respite to the yen, although we continue to see the likes of Norway's krone, and the Australian and New Zealand dollars as the best-positioned G10 currencies for a US-macro led rally in high-beta FX.”
- USD/CHF is falling on US Dollar weakness as data out of the US paints a picture of a cooling US economy.
- Recent services’ sector and labor-market data hint at a softness which could lead the Federal Reserve to enact Dollar-negative policies.
- The Swiss Franc, however, remains fundamentally weak as the Swiss National Bank continues lowering interest rates in Switzerland.
USD/CHF reached a four-week high of 0.9050 on July 3 before proceeding to roll over and fall. It is currently trading in the 0.8980s. The decline has been put down to US Dollar weakness more than Swiss Franc (CHF) strength. A run of poor data from the US has made it more likely the Federal Reserve (Fed) will start to ease monetary policy – a move that would weaken the US Dollar.
USD/CHF 4-hour Chart
The poor data that has started weighing on the US Dollar includes the ISM Services PMI data for June which came out at 48.8 from 53.8 previously. This was significant because the services’ sector has been singled out as a key contributing factor to the stubbornly high inflation in the US economy, which in turn has prevented the US Federal Reserve (Fed) from lowering interest rates.
However, the weak ISM Services PMI data in June indicates the sector might be beginning to cool down which could further bring down inflation more generally and allow the Fed to cut interest rates. Although lower interest rates are positive for businesses because they reduce borrowing costs, they are negative for a currency because they make it less attractive to foreign investors as a place to park their capital. Thus the data weighed on the US Dollar and USD/CHF.
Signs of a softening labor market are also weighing on the US Dollar. The Nonfarm Payrolls (NFP) report for June has shown a rise in the Unemployment Rate to 4.1% from 4.0% when no-change was expected. This is its highest since November 2021 just after the pandemic. Additionally, Initial Jobless Claims rose more than expected in late June, and Continuing Claims climbed to 1.858 million – also the highest since November 2021. The overall softer employment data, adds to the picture of a cooling economy.
Swiss Franc depreciates on lower interest rates
For any currency pair the difference between the interest rates of the two currencies, or the “interest-rate differential” is key. As such, it is not just the projection for interest rates in the US but also for Switzerland, that is a determinant of the exchange rate.
USD/CHF rose 2.5% in just two weeks at the end of June after the Swiss National Bank (SNB) decided to cut its main interest rate by 0.25% to 1.25%, at its June 20 meeting. This was the second time this year that the SNB had decided to cut its policy rate.
The chart below compares the SNB and Fed’s policy rates over the last three years. As can be seen, whilst both began raising interest rates to combat high inflation after the Covid pandemic, inflation fell back down to normal levels more quickly in Switzerland so the SNB was able to reduce interest rates earlier there. The Fed, in contrast, has yet to begin cutting interest rates in the US due to stubbornly high inflation. This has benefited the US Dollar.
-638557823300798118.png)
The recent run of weak US data, however, makes it more likely the Fed will also begin cutting interest rates at its meeting in September.
The probability of the Fed cutting its principal policy rate, the Fed Funds rate, by 0.25% to an upper limit of 5.25% by September, has increased from the mid-60s at the end of June to around 75% on Friday July 5, according to the CME FedWatch tool, which uses the price of the 30-day Fed Funds futures in its calculations
The Dollar Index (DXY) is trading lower near 105. EUR/USD is trading higher near $1.0825. USD/JPY is trading lower near 160.80, BBH FX strategists note.
Friday jobs report is key for global markets
“DXY is trading lower for the fourth straight day just below 105 as weak data and less hawkish Federal Reserve (Fed/FOMC) minutes take a toll. EUR/USD is trading higher near $1.0825 despite weak data, while the Pound Sterling is trading higher near $1.2790 after Labour’s landslide win. USD/JPY is trading lower near 160.80 after the 162 level held earlier this week.”
“Recent soft data are challenging our view that the backdrop of persistent inflation and robust growth in the U.S. remains largely in place, which has also led Fed officials to voice more concern about the economy.”
“Still, we note that weaker data in many of the major economies underscore the economic and monetary policy divergences that should continue to support the dollar. Today’s jobs report will be key for global markets.”
- The US Dollar retreats for a fourth straight day this week.
- Newswires are swamped with UK and French election news ahead of the US Employment Report.
- The US Dollar index briefly falls below 105.00 at the start of the European session.
The US Dollar (USD) dips again on Friday, painting red numbers across the board for the US Dollar against most major currencies. The main adversaries that stand out are the Swiss Franc (CHF) and the Japanese Yen (JPY), which are gaining against the Greenback. The move is evermore strange with European equities in the green at the opening bell, which could point at traders reducing their Greenback exposure ahead of the US Jobs Report.
On the US economic front, there is only one topic on the bulletin board on Friday: The US Employment report for June. The anticipations are ever high, with the lowest estimate at 140,000 against 237,000 on the upside. Any number thus below 140,000 could trigger a quite voluminous reaction in the Greenback, as the jobs market is being seen as the last man standing in an environment where all other US economic indicators are starting to soften or turn lower.
Daily digest market movers: Last man standing
- The Labour Party won a landslide victory in the UK, and Keir Starmer is on track to become the next resident at 10 Downing Street. This result is increasingly strange, given the moves to the right in Europe.
- Ahead of Sunday’s election in France, the far-right National Rally party of Marine Le Pen is no longer in the position to gain a majority, according to recent polls.
- At 12:30 GMT, the US Employment Report for June will be released:
- Nonfarm Payrolls is expected to decline to 190,000 from 272,000, with the lowest estimate at 140,000 and the highest at 237,000.
- Average Hourly Earnings are seen increasing by 0.3% in June compared with 0.4% in May.
- Unemployment Rate is expected to remain stable at 4%.
- Expect severe market reactions should the Nonfarm Payrolls number come in substantially below the lowest estimation (weaker USD) or jump above the highest (stronger USD).
- At 15:00 GMT, the Fed’s Monetary Policy Report will be released. This report is submitted semiannually to the Senate Committee on Banking, Housing, and Urban Affairs and to the House Committee on Financial Services.
- Asian stocks were unable to close the week on a high note and saw both China and Japan close negative. European equities are doing well on the back of the UK outcome and are jumping higher. The UK FTSE 100 was even up 1% at one given point before falling back to flat ahead of the US session.
- The CME Fedwatch Tool is broadly backing a rate cut in September despite recent comments from Fed officials. The odds now stand at 66.5% for a 25-basis-point cut. A rate pause stands at a 27.4% chance, while a 50-basis-point rate cut has a slim 6.1% possibility.
- The US 10-year benchmark rate trades at 4.35%, near its weekly low.
US Dollar Index Technical Analysis: Traders shun away
The US Dollar Index (DXY) falls to fresh weekly lows and tests the magic 105.00 level on Friday. In the runup to the US Nonfarm Payrolls release, traders seem to be reducing their Greenback exposure as the markets survey numbers have pencilled in high expectations for June. This could be seen as a sign that it could all end in tears, and the DXY could fall to 104.44 in a nosedive correction when the US labour market is turning softer and joins other recent US data.
On the upside, the 55-day Simple Moving Average (SMA) at 105.20 has now turned into resistance after an early test during the Asian session received a firm rejection and pushed the DXY further down again to test that 105.00 level. Should that 55-day SMA be reclaimed again, 105.53 and 105.89 are the next nearby pivotal levels. In case the Nonfarm Payrolls report was utterly strong, the red descending trend line in the chart around 106.23 and April’s peak at 106.52 could come into play.
On the downside, the risk of a nosedive move is increasing, with double support at 104.77, the confluence of the 100-day SMA and that green ascending trend line from December 2023. Should that double layer give way, the 200-day SMA at 104.44 is the gatekeeper that should catch the DXY and avoid any further declines, which could head to 104.00 as an initial stage in the correction.
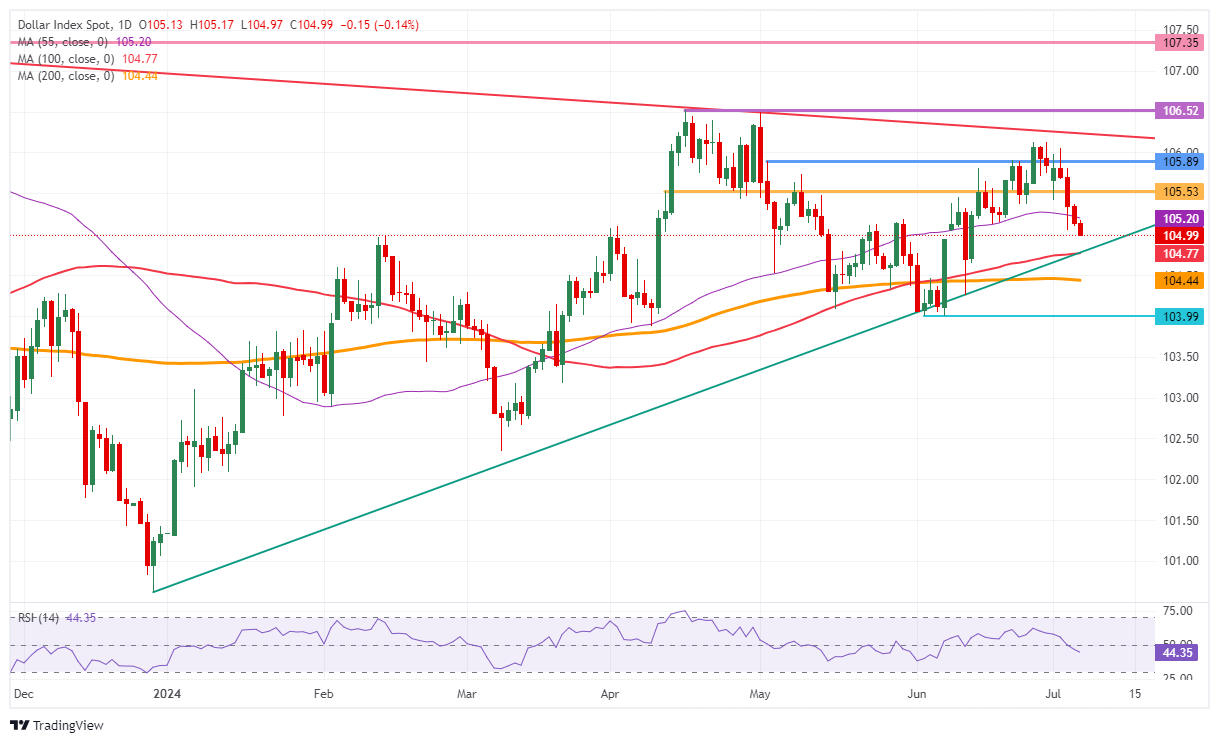
US Dollar Index: Daily Chart
US Dollar FAQs
The US Dollar (USD) is the official currency of the United States of America, and the ‘de facto’ currency of a significant number of other countries where it is found in circulation alongside local notes. It is the most heavily traded currency in the world, accounting for over 88% of all global foreign exchange turnover, or an average of $6.6 trillion in transactions per day, according to data from 2022. Following the second world war, the USD took over from the British Pound as the world’s reserve currency. For most of its history, the US Dollar was backed by Gold, until the Bretton Woods Agreement in 1971 when the Gold Standard went away.
The most important single factor impacting on the value of the US Dollar is monetary policy, which is shaped by the Federal Reserve (Fed). The Fed has two mandates: to achieve price stability (control inflation) and foster full employment. Its primary tool to achieve these two goals is by adjusting interest rates. When prices are rising too quickly and inflation is above the Fed’s 2% target, the Fed will raise rates, which helps the USD value. When inflation falls below 2% or the Unemployment Rate is too high, the Fed may lower interest rates, which weighs on the Greenback.
In extreme situations, the Federal Reserve can also print more Dollars and enact quantitative easing (QE). QE is the process by which the Fed substantially increases the flow of credit in a stuck financial system. It is a non-standard policy measure used when credit has dried up because banks will not lend to each other (out of the fear of counterparty default). It is a last resort when simply lowering interest rates is unlikely to achieve the necessary result. It was the Fed’s weapon of choice to combat the credit crunch that occurred during the Great Financial Crisis in 2008. It involves the Fed printing more Dollars and using them to buy US government bonds predominantly from financial institutions. QE usually leads to a weaker US Dollar.
Quantitative tightening (QT) is the reverse process whereby the Federal Reserve stops buying bonds from financial institutions and does not reinvest the principal from the bonds it holds maturing in new purchases. It is usually positive for the US Dollar.
AUD/USD bottomed below 0.64 on April 19 and rose above 0.67 on Thursday. Australian Dollar (AUD) bucked the depreciation in the Japanese Yen (JPY) and the Chinese Yuan (CNY), DBS Senior FX Strategist Philip Wee notes.
AUD trades above 0.67 on Friday
“AUD/USD bottomed below 0.64 on April 19 and rose above 0.67 on Thursday. The rally was impressive, considering how AUD bucked the depreciation in JPY and CNY, the currencies of its two largest trading partners. Since April 19, the currency pair has appreciated by 4.8% to 0.6726.”
“Between April and May, Australia’s CPI inflation hit a six-month high of 4% YoY, while the US’s PCE inflation fell to a three-month low of 2.6% YoY. The unemployment rate declined to 4% from 4.1% in Australia but increased to 4% from 3.9% in the US. Australia’s retail sales growth accelerated to 0.6% MoM from 0.1%, but US retail sales ex-autos contracted by the same 0.1% MoM pace for a second month.”
“Interest rate futures are not ruling out another hike by the Reserve Bank of Australia this year. Although the RBA kept the cash rate target unchanged at 4.35% at its meeting on June 18, the RBA minutes showed the committee considering a hike on upside inflation risks. Conversely, the futures market has increased the odds of a Fed cut in September to 70% from 50% last Friday.”
- NZD/USD strengthens at the US Dollar’s cost.
- Investors await the US NFP that will influence Fed rate-cut bets.
- The RBNZ is expected to keep its OCR unchanged at 5.5%.
The NZD/USD pair rises above the round-level resistance of 0.6100 in Friday’s European session. The Kiwi asset extends its winning spree for the fourth trading session on Friday. The major strengthens as the US Dollar (USD) has faced severe pressure due to weak United States (US) ISM Services PMI and the ADP Employment Change for June, which boosts expectations for Federal Reserve (Fed) to begin reducing interest rates from the September meeting.
Next major trigger that will influence market speculation for Fed rate cuts in September will be the US Nonfarm Payrolls (NFP) data for June, which will be published at 12:30 GMT. Economists expect that US employers hired 190K new workers, which were lower than 272K payrolls added in May. The Unemployment Rate is expected to remain steady at 4%.
The US Dollar Index (DXY), which tracks the Greenback’s value against six major currencies, has dropped to near 105.00.
On the Kiwi front, investors await the Reserve Bank of New Zealand’s (RBNZ) interest rate decision, which will be announced on Wednesday. The RBNZ is expected to keep its Official Cash Rate steady at 5.5%. Therefore, investors majorly focus on the interest rate outlook.
NZD/USD is on the cusp of delivering a breakout of the Falling Channel formation on a four-hour timeframe. A breakout in the above-mentioned chart formation results in a bullish reversal.
A bull cross, represented by 20-and 50-day Exponential Moving Averages (EMAs) near 0.6100, suggests that the overall trend has become bullish.
The 14-period Relative Strength Index (RSI) shifts into the bullish range of 60.00-80.00, suggesting that momentum has been shifts on the upside.
Fresh upside would appear if the asset breaks above July 3 high at 0.6130 for targets near May 28 high around 0.6170 and June 12 high of 0.6222.
However, a breakdown below April 4 high around 0.6050 would expose the asset to the psychological support of 0.6000.
NZD/USD four-hour chart
New Zealand Dollar FAQs
The New Zealand Dollar (NZD), also known as the Kiwi, is a well-known traded currency among investors. Its value is broadly determined by the health of the New Zealand economy and the country’s central bank policy. Still, there are some unique particularities that also can make NZD move. The performance of the Chinese economy tends to move the Kiwi because China is New Zealand’s biggest trading partner. Bad news for the Chinese economy likely means less New Zealand exports to the country, hitting the economy and thus its currency. Another factor moving NZD is dairy prices as the dairy industry is New Zealand’s main export. High dairy prices boost export income, contributing positively to the economy and thus to the NZD.
The Reserve Bank of New Zealand (RBNZ) aims to achieve and maintain an inflation rate between 1% and 3% over the medium term, with a focus to keep it near the 2% mid-point. To this end, the bank sets an appropriate level of interest rates. When inflation is too high, the RBNZ will increase interest rates to cool the economy, but the move will also make bond yields higher, increasing investors’ appeal to invest in the country and thus boosting NZD. On the contrary, lower interest rates tend to weaken NZD. The so-called rate differential, or how rates in New Zealand are or are expected to be compared to the ones set by the US Federal Reserve, can also play a key role in moving the NZD/USD pair.
Macroeconomic data releases in New Zealand are key to assess the state of the economy and can impact the New Zealand Dollar’s (NZD) valuation. A strong economy, based on high economic growth, low unemployment and high confidence is good for NZD. High economic growth attracts foreign investment and may encourage the Reserve Bank of New Zealand to increase interest rates, if this economic strength comes together with elevated inflation. Conversely, if economic data is weak, NZD is likely to depreciate.
The New Zealand Dollar (NZD) tends to strengthen during risk-on periods, or when investors perceive that broader market risks are low and are optimistic about growth. This tends to lead to a more favorable outlook for commodities and so-called ‘commodity currencies’ such as the Kiwi. Conversely, NZD tends to weaken at times of market turbulence or economic uncertainty as investors tend to sell higher-risk assets and flee to the more-stable safe havens.
GBP/USD rallied by 0.9% to 1.2760 yesterday from 1.2645 last Friday. Markets have warmed to the idea of the opposition Labour Party’s landslide victory. GBP was the only DXY component that appreciated (by 0.2% YTD) this year, DBS Senior FX Strategist Philip Wee notes.
GBP is the only positive DXY component this year
“Apart from a weaker USD, markets have warmed to the idea of the opposition Labour Party’s landslide victory ending years of political and economic uncertainty under the Conservative Party following the 2016 Brexit Referendum. Labour leader Keir Starmer ruled out the UK rejoining the three blocs – the EU, the single market, or the customs union – within his lifetime.”
“However, Labour may seek better trading arrangements by signing up to EU rules in specific sectors such as agriculture, food and chemicals. On monetary policy, the OIS market is pricing a 62.4% chance of the Bank of England lowering its bank rate by 25 bps to 5% at its meeting on August 1.
“This may not hurt GBP much if the USD gets dragged lower by this month’s US jobs and inflation data fuelling expectations for a Fed cut in September. By the way, GBP was the only DXY component that appreciated (by 0.2% YTD) this year.”
- Natural Gas enters its ninth straight day of red numbers.
- Gas traders are sending prices lower, with Netanyahu open for a diplomatic solution.
- The US Dollar index eases as well, with pressure building ahead of the Nonfarm Payrolls release.
Natural Gas price (XNG/USD) eases for a ninth straight day on Friday, nearly matching the correction it faced in February, which was ten days. This time, positive headlines from Israel took over when Reuters reported that Israeli Prime Minister Benjamin Netanyahu assembled a diplomatic task force that will enter into negotiations with Hamas for a ceasefire and hostage deal. Although Netanyahu quickly saw that a ceasefire deal did not mean the war had stopped, markets focused on the fact that talks were underway.
Meanwhile, the US Dollar Index (DXY), which tracks the Greenback’s value against six major currencies, eases as well on Friday, for a fourth straight day in a row this week. Traders are shunning the Greenback ahead of the June US Nonfarm Payrolls (NFP) release after US economic data this week came in softer and often missed or underperformed on estimates and consensus views. Fear is now that the NFP report might be a big miss on estimates and might turn into a nightmare later this Friday, ahead of the French elections this weekend.
Natural Gas is trading at $2.38 per MMBtu at the time of writing.
Natural Gas news and market movers: China surge already over?
- Bloomberg published a piece on Friday stating that private Gas companies in China sell Liquefied Natural Gas (LNG) import slots in new terminal facilities publicly in the open market. This means several slots are up for grabs, with importers not needing them as demand for LNG is cooling down quit rapidly.
- Takeover rumors in the LNG industry as Abu Dhabi National Oil Company (ADNOC) is considering a possible bid for Australian gas supplier Santos, according to Reuters.
- With the decline in European gas prices, volatility is declining as well, which put options traders on the bench. No significant volumes are being taken in on options betting on sudden surges or spikes in Natural Gas prices.
- The Baker Hughes US Oil Rig Count is due this evening near 17:00 GMT. The previous number was a count of 479 rigs.
Natural Gas Technical Analysis: Near but not yet
Natural Gas price might be looking interesting to dive into for some buying-the-dip, though that would, for now, only be for the venturous traders. The Relative Strength Index (RSI) is still not trading at or below the ‘oversold’ barrier and thus has more room to go. Traders will wait for the right moment to buy the dip, which could see Natural Gas prices bounce back up to $2.52 initially.
The 200-day Simple Moving Average (SMA) is the first force to reckon with on the upside, near $2.52, closely followed by the 55-day SMA at $2.61. Once back above, the pivotal level near $3.08 (March 6, 2023, high) remains key resistance after its false break last week, which is still 20% away.
The support level, which could mean some buying opportunities, is $2.28, the 100-day SMA that falls in line with the ascending trend line since mid-February. In case that level does not hold as support, look for the pivotal level near $2.13, which acted as a cap and floor in the past.
Natural Gas: Daily Chart
Natural Gas FAQs
Supply and demand dynamics are a key factor influencing Natural Gas prices, and are themselves influenced by global economic growth, industrial activity, population growth, production levels, and inventories. The weather impacts Natural Gas prices because more Gas is used during cold winters and hot summers for heating and cooling. Competition from other energy sources impacts prices as consumers may switch to cheaper sources. Geopolitical events are factors as exemplified by the war in Ukraine. Government policies relating to extraction, transportation, and environmental issues also impact prices.
The main economic release influencing Natural Gas prices is the weekly inventory bulletin from the Energy Information Administration (EIA), a US government agency that produces US gas market data. The EIA Gas bulletin usually comes out on Thursday at 14:30 GMT, a day after the EIA publishes its weekly Oil bulletin. Economic data from large consumers of Natural Gas can impact supply and demand, the largest of which include China, Germany and Japan. Natural Gas is primarily priced and traded in US Dollars, thus economic releases impacting the US Dollar are also factors.
The US Dollar is the world’s reserve currency and most commodities, including Natural Gas are priced and traded on international markets in US Dollars. As such, the value of the US Dollar is a factor in the price of Natural Gas, because if the Dollar strengthens it means less Dollars are required to buy the same volume of Gas (the price falls), and vice versa if USD strengthens.
EUR/USD started July on a firm note. Markets are less nervous due to doubts about the far-right National Rally Party gaining an absolute majority, DBS Senior FX Strategist Philip Wee notes.
ECB's wait-and-see stance supports the Euro
“EUR/USD started July on a firm note, appreciating 0.9% to 1.0812 in the first four days.”
“Markets became less nervous due to doubts about the far-right National Rally Party gaining an absolute majority at this Sunday’s second round of the French elections. The risk premium denoted by the 10Y bond yield differential between French and German bonds peaked at 82 bps on June 27 and narrowed to 67 bps yesterday, its narrowest since June 12.”
“Euro was also supported by the European Central Bank’s wait-and-see stance after its first rate cut on June 6.”
Today, a disappointing US monthly jobs report could push the Dollar Index (DXY) below 105, DBS Senior FX Strategist Philip Wee notes.
DXY falls towards and below 105
“DXY fell towards 105 in the past two days after failing thrice to break above 106 over five sessions.”
“The Federal Reserve (Fed) played down May’s stronger-than-expected nonfarm payrolls of 272k vs. 165k in April. Instead, it paid more attention to the Beveridge curve, i.e., rising job vacancies lifting May’s unemployment rate to the 4% it projected for 4Q24. Fed Chair Jerome Powell said the Fed was ready to respond if US jobs weakened unexpectedly.”
“Hence, a continued rise in unemployment above 4% in June is significant, especially if average weekly earnings growth declines below 4% YoY for the first time in three years. Consensus expects NFP to drop below 200k to 190k.”
The People’s Bank of China (PBOC) announced CGB borrowing from primary dealers earlier this week. Reportedly, the central bank identified two potential operators yesterday. Such policy change echoes the PBOC Governor's earlier speech on deepening monetary policy tools through CGB transactions, DBS Economist Samuel Tse notes.
PBOC still aims to stabilize exchange rates
“The market interprets the long-end bond borrowing as a prelude to bond sales to cool the CGB rally. From a FX perspective, higher CGB yields and a narrower spread against UST counterparts could help alleviate pressure on CNY exchange rates. Note that the PBOC still aims to stabilize exchange rates to forestall capital outflow.”
“Our core strategy of steepening is still at play. Potential long tenor bond selling matches our view that 10Y yields will likely stabilize in the near term. The 10Y CGB yield once rebounded to 2.27% this week after hitting the historical low of 2.18% following the announcement.”
“However, short-end CGB yields could head south further as monetary easing is still on the cards. Another round of RRR cuts is likely in 3Q amid an uneven recovery and slowing credit growth.”
- EUR/GBP forms a two bar reversal pattern and begins descending.
- This comes after price has filled a gap on the charts – another reversal sign.
- Evidence is building that the correction from the June 14 lows has rolled over and the intermediate downtrend is resuming.
EUR/GBP is potentially resuming its medium-term downtrend after correcting higher since the June 14 lows.
EUR/GBP Daily Chart
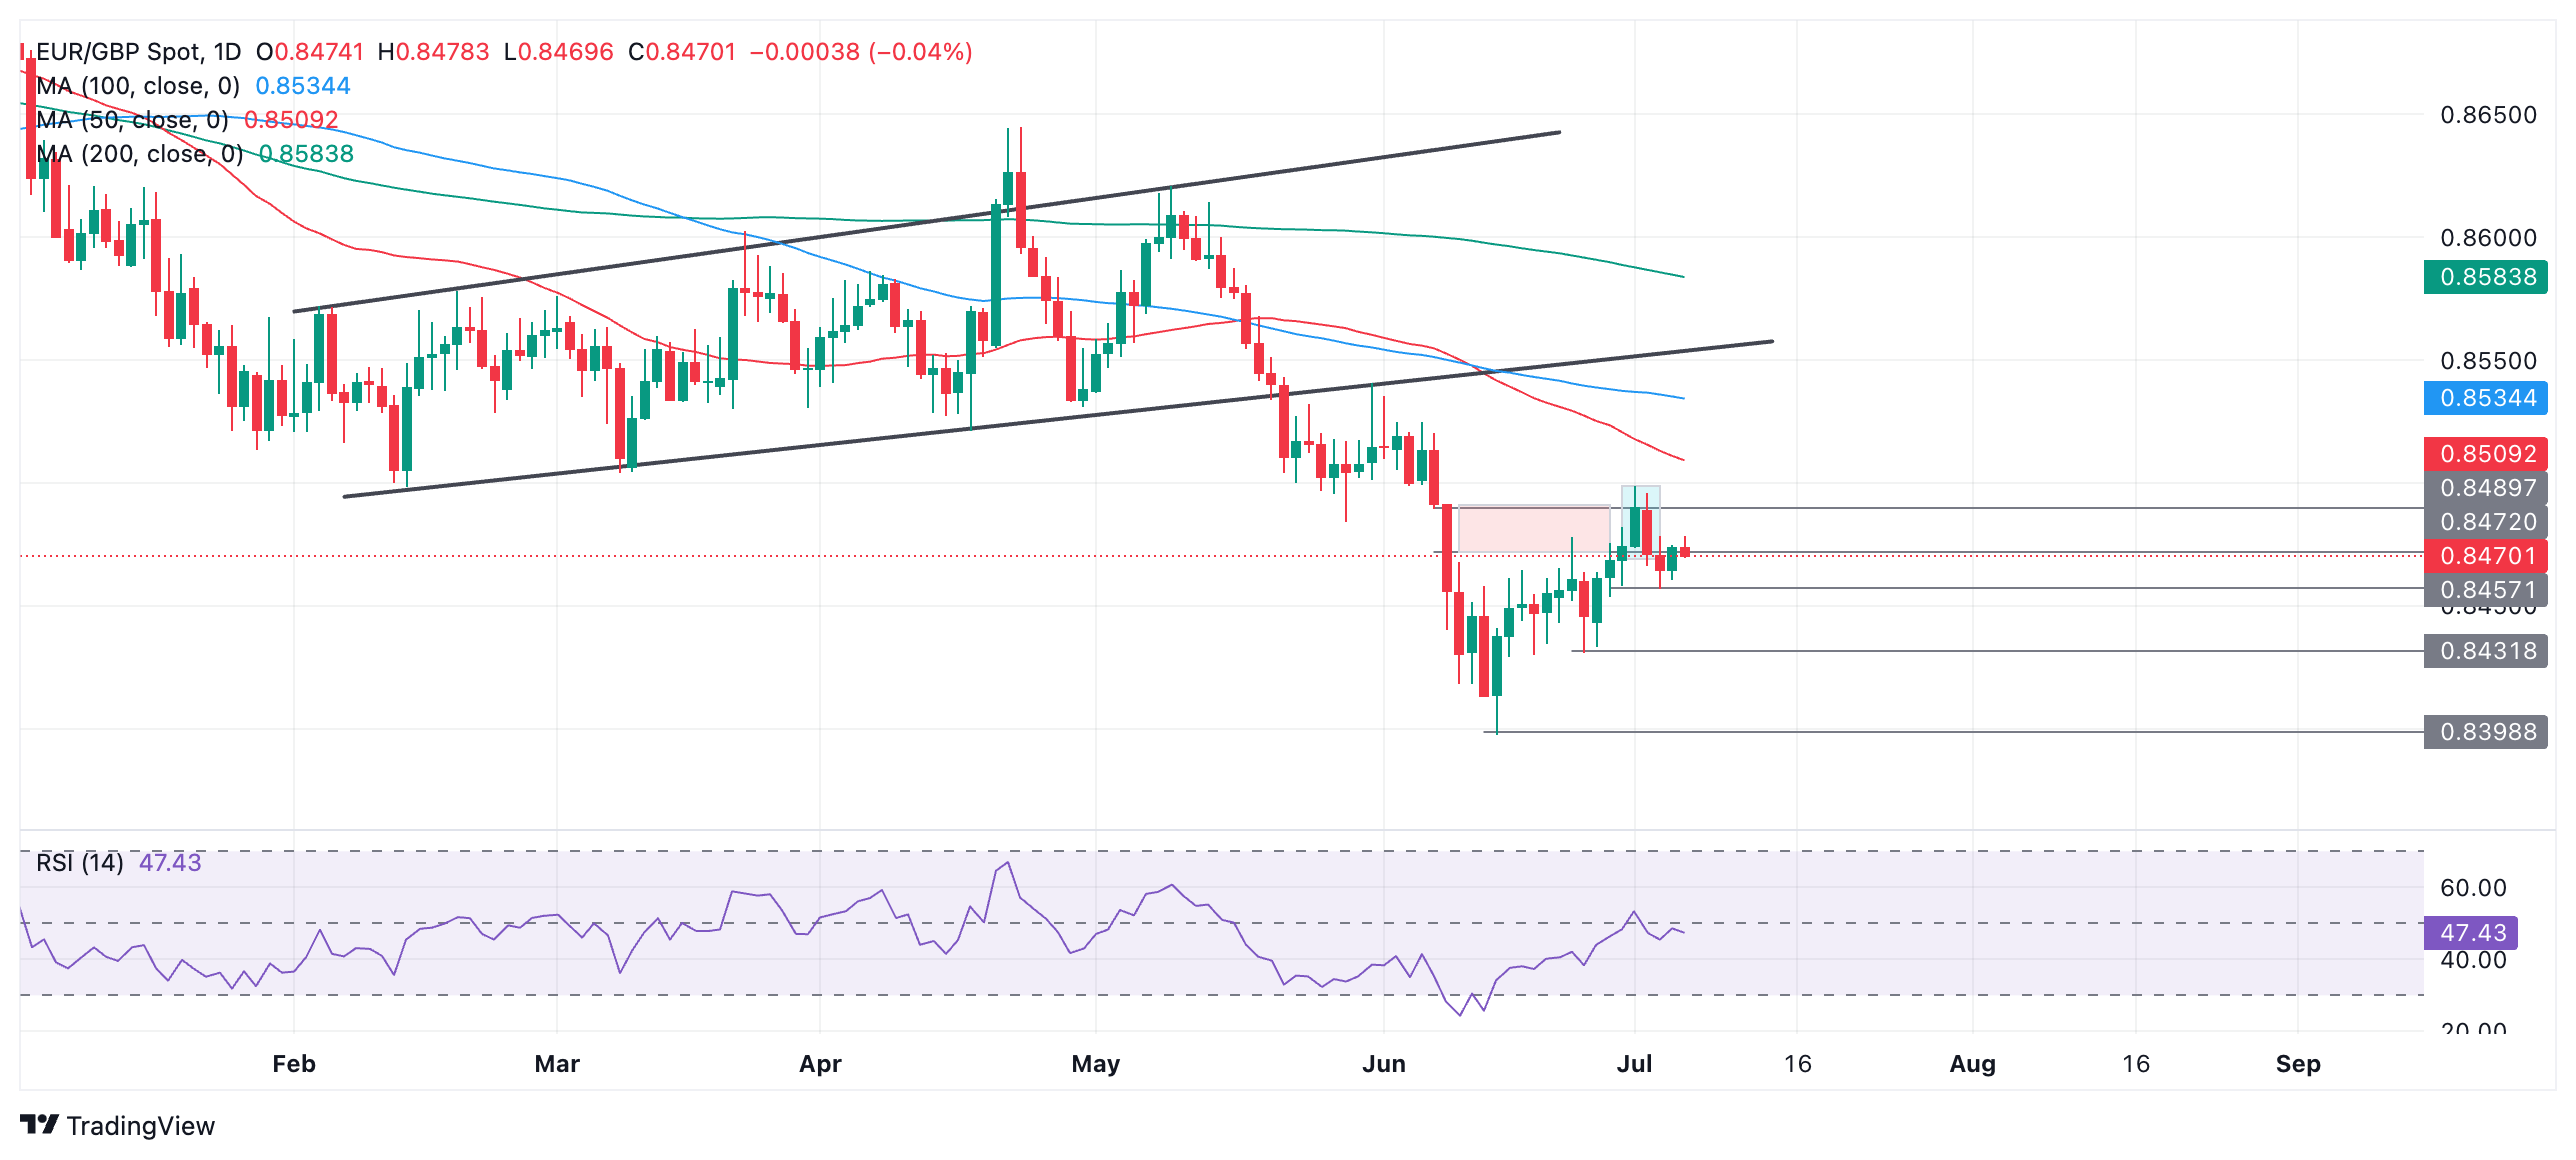
The pair has formed a two-bar reversal pattern at the peak of the correction, on July 1-2 (light blue rectangle) which is a bearish indicator. Two-bar reversals occur when price peaks and forms a green candle which is succeeded by a red candle of a similar shape and size. The fact that the day after the pattern was also bearish is further confirmation.
EUR/GBP 4-hour Chart
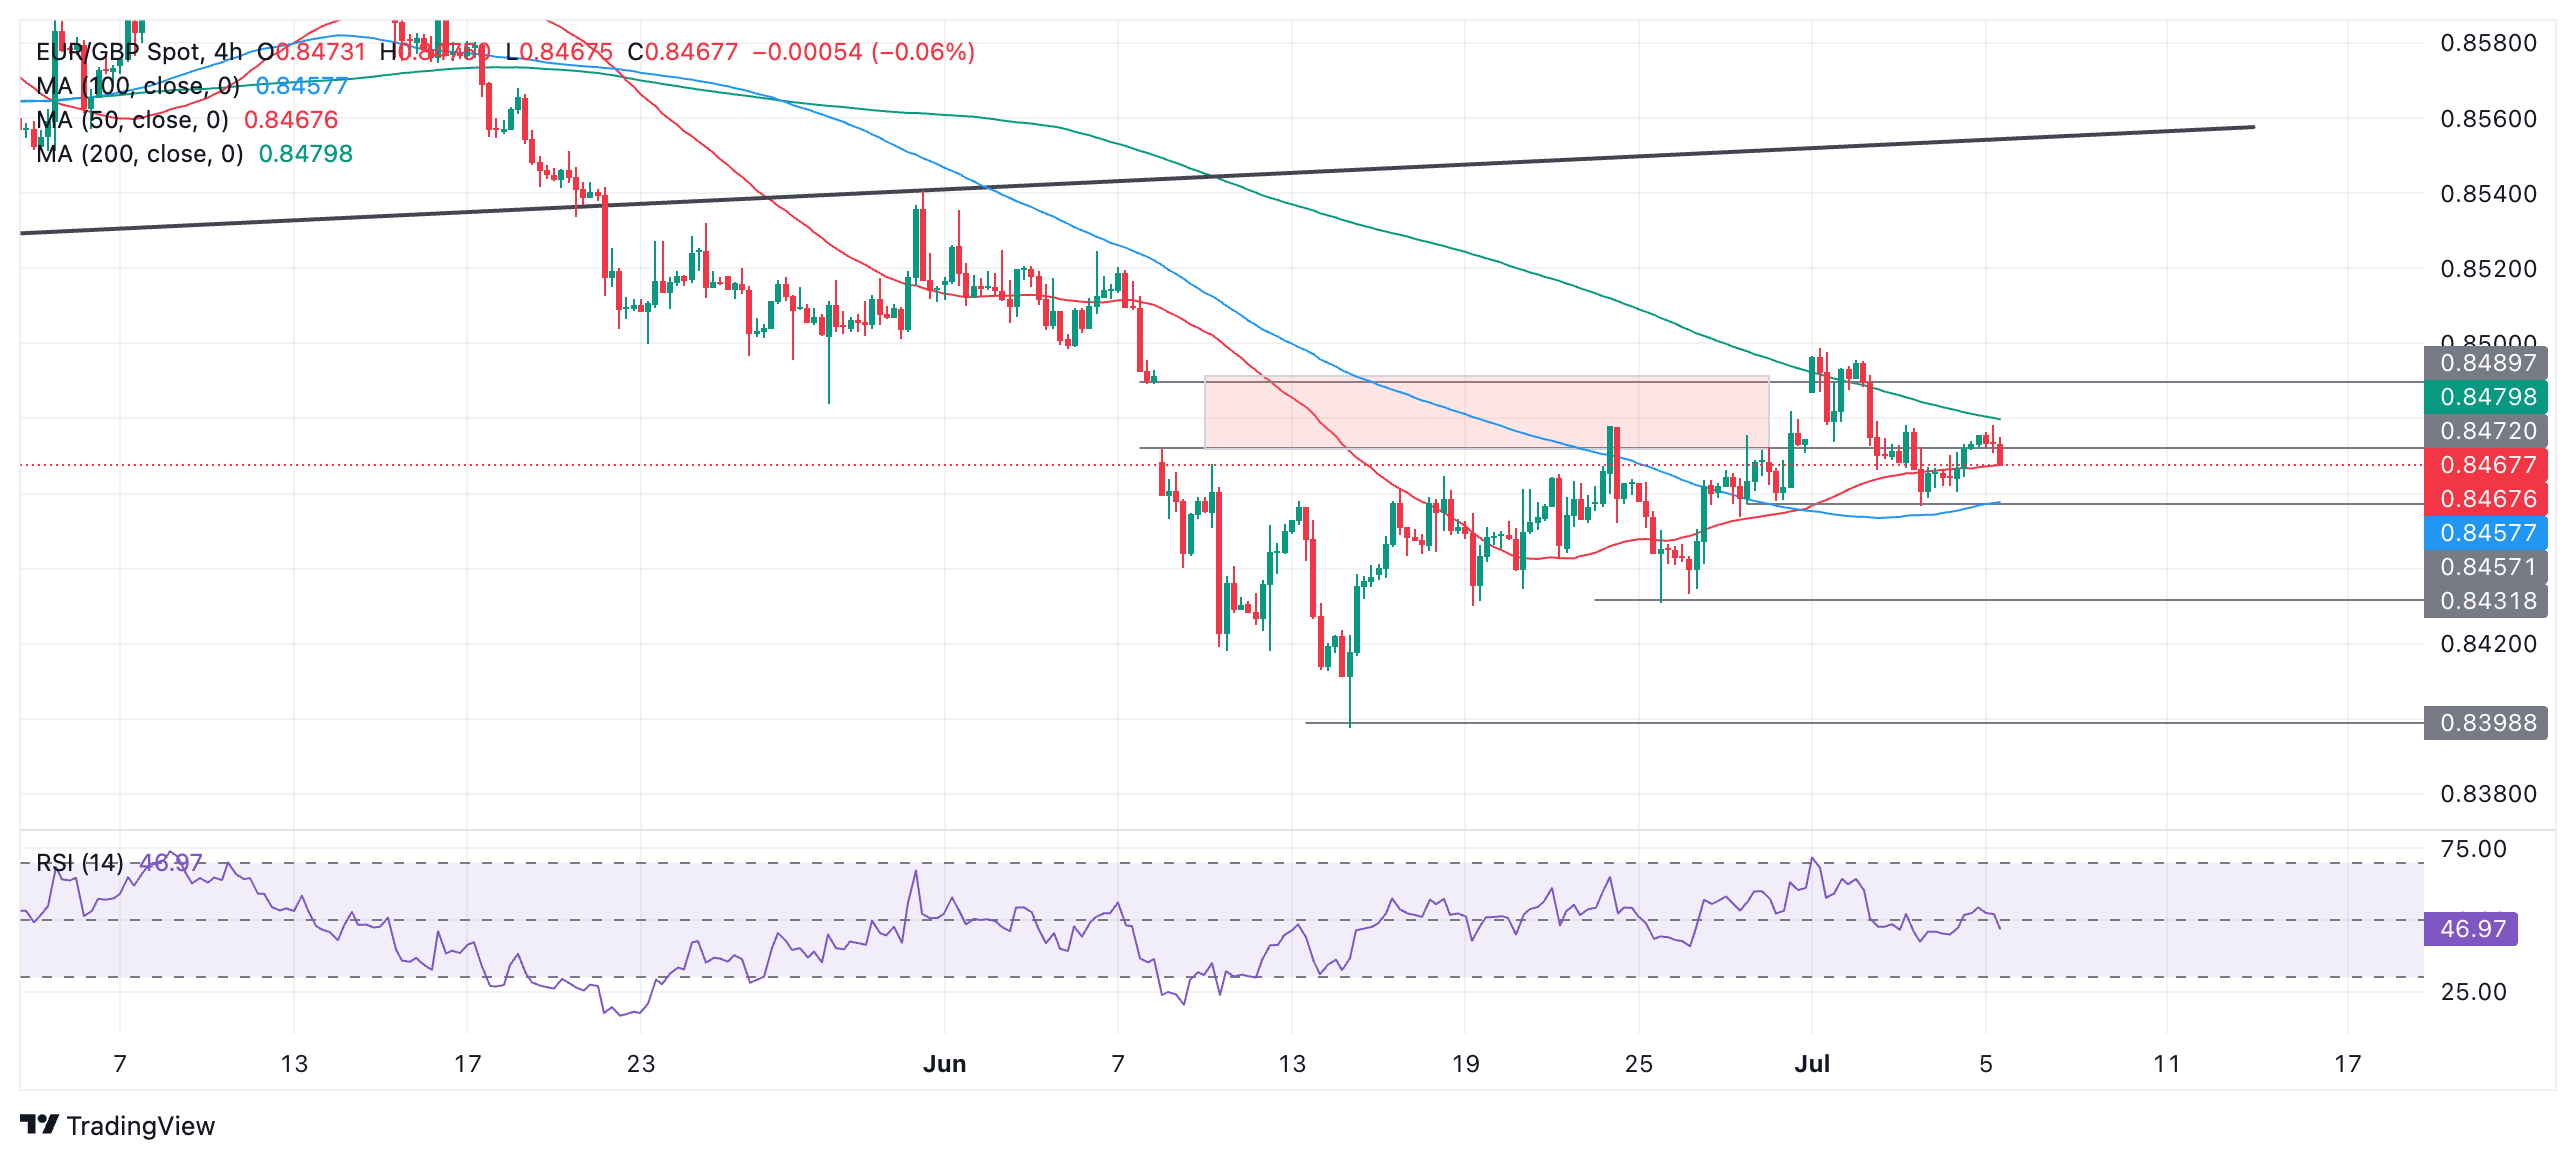
A further indication the dominant downtrend is resuming is that EUR/GBP has filled the price gap that opened between 0.8472 and 0.8490 (red shaded area). This gap can be seen on the 4-hour chart above.
It is said prices are often drawn to fill gaps and now they have there is more chance the downtrend will resume.
A break below 0.8458 (July 3 and June 28 low) would provide added bearish confirmation.
The next downside target would be the 0.8431 June 25 low.
Alternatively if the pair recovers, and breaks above 0.8499 (July 1) it could indicate a continuation of the correction higher, with the 50-day Simple Moving Average at 0.8517 providing resistance and the next target to the upside.
- The Pound Sterling performs strongly, as Keir Starmer's outright majority win as UK PM has brought stability on the political front.
- Investors expect the BoE to begin reducing interest rates from August.
- The US Dollar will dance to the tunes of US NFP data for June.
The Pound Sterling (GBP) exhibits sheer strength against major peers, except the Japanese Yen (JPY), in Friday’s London session. The British currency performs strongly as United Kingdom (UK) Prime Minister Rishi Sunak-led-Conservative Party suffered a defeat after remaining in power since 2010 from the Keir Starmer-led-Labour Party in parliamentary elections on Thursday.
Investors expect that an absolute majority of the Labour Party has significantly improved the Pound Sterling’s appeal. A political party’s outright majority win is considered favorable for its financial markets, unlike when the Tories were in power.
Also, the Pound Sterling would outperform strongly against currencies from the European Union (EU) and the United States (US), which are expected to face pressure due to political uncertainty.
On the monetary policy front, investors expect the Bank of England (BoE) to start cutting interest rates from the August meeting. The next trigger for the Pound Sterling will be the monthly Gross Domestic Product (GDP) and factory data for May, which will be published on Thursday, July 11.
Daily digest market movers: Pound Sterling gains further against the US Dollar
- The Pound Sterling extends its upside to near 1.2780 against the US Dollar (USD) in Friday’s European session. The GBP/USD pair posts a fresh three-week high and is expected to rally further towards the round-level resistance of 1.2800 amid sheer sell-off in the US Dollar.
- The US Dollar Index (DXY), which tracks the Greenback’s value against six major currencies, slides further to near the crucial support of 105.00. The US Dollar’s appeal becomes vulnerable as the confidence of investors in the Federal Reserve (Fed) to begin reducing interest rates from the September meeting has increased.
- According to the CME FedWatch tool, 30-day Federal Funds futures pricing data shows that the probability of rate cuts in September has improved to 74.4% from 64% recorded a week ago. The data also shows that the Fed will deliver subsequent rate cuts in November or December.
- In Friday’s session, investors will focus on the United States (US) Nonfarm Payrolls (NFP) data for June, which will be published at 12:30 GMT. The official labor market data will significantly influence market speculation about Fed rate cuts in September.
- The NFP report is expected to show that employers added 190K payrolls, significantly lower than the prior release of 272K. The Unemployment Rate is estimated to have remained steady at 4%. Investors will also pay attention to the Average Hourly Earnings data, which gauges wage growth momentum. Annual Average Hourly Earnings are forecasted to have decelerated to 3.9% from 4.1% in May. On a monthly basis, the wage growth measure is estimated to have risen at a slower pace of 0.3% from the prior month of 0.4%.
- Stronger-than-expected wage growth and payrolls data would weaken expectations that the Federal Reserve (Fed) will start reducing interest rates in September, while weak numbers will boost them.
Technical Analysis: Pound Sterling approaches 1.2800
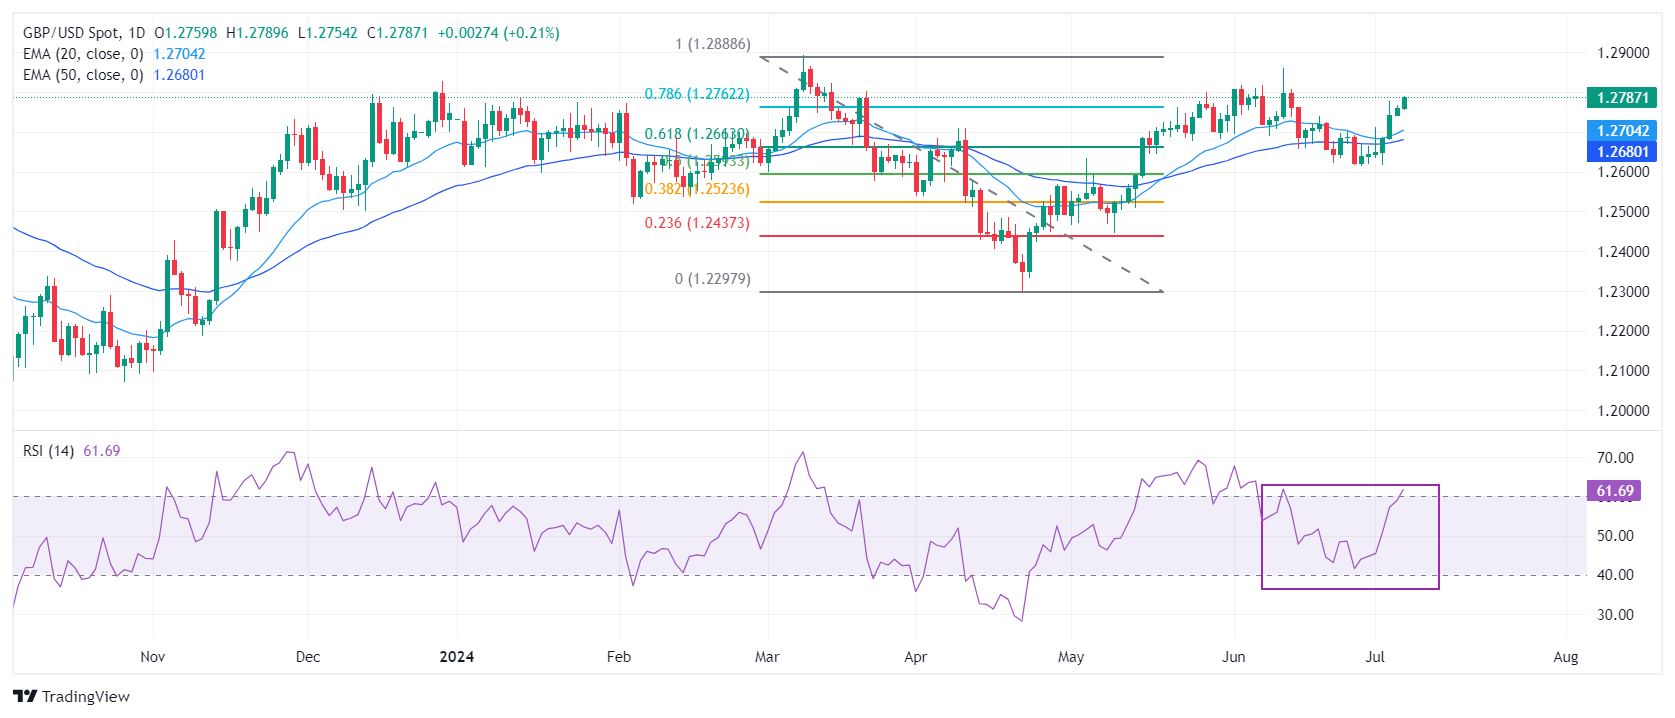
The Pound Sterling posts a fresh three-week high slightly below 1.2800 against the US Dollar. The GBP/USD pair strengthens after breaking above the 61.8% Fibonacci retracement at 1.2670, plotted from the March 8 high of 1.2900 to the April 22 low at 1.2300. The Cable has now reached the 78.6% Fibonacci retracement at 1.2770.
The pair rises above the 20-day and 50-day Exponential Moving Averages (EMAs) near 1.2695 and 1.2675, respectively, suggesting that the near-term outlook is bullish.
The 14-day Relative Strength Index (RSI) rises above 60.00. A sustained move above this level would shift momentum towards the upside.
Pound Sterling FAQs
The Pound Sterling (GBP) is the oldest currency in the world (886 AD) and the official currency of the United Kingdom. It is the fourth most traded unit for foreign exchange (FX) in the world, accounting for 12% of all transactions, averaging $630 billion a day, according to 2022 data. Its key trading pairs are GBP/USD, aka ‘Cable’, which accounts for 11% of FX, GBP/JPY, or the ‘Dragon’ as it is known by traders (3%), and EUR/GBP (2%). The Pound Sterling is issued by the Bank of England (BoE).
The single most important factor influencing the value of the Pound Sterling is monetary policy decided by the Bank of England. The BoE bases its decisions on whether it has achieved its primary goal of “price stability” – a steady inflation rate of around 2%. Its primary tool for achieving this is the adjustment of interest rates. When inflation is too high, the BoE will try to rein it in by raising interest rates, making it more expensive for people and businesses to access credit. This is generally positive for GBP, as higher interest rates make the UK a more attractive place for global investors to park their money. When inflation falls too low it is a sign economic growth is slowing. In this scenario, the BoE will consider lowering interest rates to cheapen credit so businesses will borrow more to invest in growth-generating projects.
Data releases gauge the health of the economy and can impact the value of the Pound Sterling. Indicators such as GDP, Manufacturing and Services PMIs, and employment can all influence the direction of the GBP. A strong economy is good for Sterling. Not only does it attract more foreign investment but it may encourage the BoE to put up interest rates, which will directly strengthen GBP. Otherwise, if economic data is weak, the Pound Sterling is likely to fall.
Another significant data release for the Pound Sterling is the Trade Balance. This indicator measures the difference between what a country earns from its exports and what it spends on imports over a given period. If a country produces highly sought-after exports, its currency will benefit purely from the extra demand created from foreign buyers seeking to purchase these goods. Therefore, a positive net Trade Balance strengthens a currency and vice versa for a negative balance.
In prepared remarks to an event at the Reserve Bank of India (RBI) in Mumbai on Friday, New York Federal Reserve (Fed) Bank President John Williams said on Friday, “there is still a way to go to reach 2% inflation target on a sustained basis.”
Additional takeaways
We have seen significant progress in bringing inflation back toward Fed's 2% target rate.
Fed is committed to getting the job done.
Artificial intelligence, climate change, deglobalization, financial innovations and neutral rate all pose issues.
Uncertainty will continue as a defining characteristic of monetary policy landscape for the foreseeable future.
Market reaction
These above comments fail to have any impact on the US Dollar against its major rivals, as the US Dollar Index (DXY) loses 0.16% on the day to trade at 104.96.
Fed FAQs
Monetary policy in the US is shaped by the Federal Reserve (Fed). The Fed has two mandates: to achieve price stability and foster full employment. Its primary tool to achieve these goals is by adjusting interest rates. When prices are rising too quickly and inflation is above the Fed’s 2% target, it raises interest rates, increasing borrowing costs throughout the economy. This results in a stronger US Dollar (USD) as it makes the US a more attractive place for international investors to park their money. When inflation falls below 2% or the Unemployment Rate is too high, the Fed may lower interest rates to encourage borrowing, which weighs on the Greenback.
The Federal Reserve (Fed) holds eight policy meetings a year, where the Federal Open Market Committee (FOMC) assesses economic conditions and makes monetary policy decisions. The FOMC is attended by twelve Fed officials – the seven members of the Board of Governors, the president of the Federal Reserve Bank of New York, and four of the remaining eleven regional Reserve Bank presidents, who serve one-year terms on a rotating basis.
In extreme situations, the Federal Reserve may resort to a policy named Quantitative Easing (QE). QE is the process by which the Fed substantially increases the flow of credit in a stuck financial system. It is a non-standard policy measure used during crises or when inflation is extremely low. It was the Fed’s weapon of choice during the Great Financial Crisis in 2008. It involves the Fed printing more Dollars and using them to buy high grade bonds from financial institutions. QE usually weakens the US Dollar.
Quantitative tightening (QT) is the reverse process of QE, whereby the Federal Reserve stops buying bonds from financial institutions and does not reinvest the principal from the bonds it holds maturing, to purchase new bonds. It is usually positive for the value of the US Dollar.
The UK general election result is now clear (for the benefit of US readers, many countries are able to get a definitive result within hours of voting having concluded). The result was entirely as expected by markets, with the Labour Party winning a sizable majority, UBS macro analyst Paul Donovan suggests.
UK election result is clear, France is underway
“Two larger points from the UK vote: the UK has generally avoided the prejudice politics that has emerged elsewhere (and which will be visible in France in the weekend’s elections). It also appears that the Israel-Hamas war impacted votes. In a world of social media, international events may seem more local, and have a bearing on elections that they have not traditionally had.”
“The US employment report is likely to continue to give mixed signals on the US labor market. Remember that over half the companies asked for payrolls numbers do not give any response. While the fear of unemployment seems contained, the broader picture hints at some labor market cooling.”
“European Central Bank (ECB) President Lagarde speaks again, updating markets with just how much has changed since she last spoke. On Wednesday. US President Biden is giving a television interview, but markets are not likely to react to this specifically.”
- The Mexican Peso continues rallying against the US Dollar and makes more muted gains against European counterparts.
- The Greenback is losing ground after a run of weak US economic data.
- In Europe, political risk eases, taking pressure off the Euro and the Pound.
The Mexican Peso (MXN) continues drifting higher in its most traded pairs on Friday, with gains particularly marked against the US Dollar (USD), which has weakened after a run of poor US economic data. In Europe, the Peso’s gains are more muted due to reduced political risk as elections indicate moderates holding onto power despite the rise of the far-right.
MXN gains a further boost after comments from the Deputy Governor of the Bank of Mexico (Banxico), Jonathan Heath, who said he was skeptical about interest rates falling in Mexico in the near term, comparing his stance to that of Federal Reserve (Fed) Chairman Jerome Powell.
At the time of writing, one US Dollar (USD) buys 18.07 Mexican Pesos, EUR/MXN trades at 19.57, and GBP/MXN at 23.09.
Mexican Peso rises against USD
The Mexican Peso is rising against the US Dollar for the fourth day in a row as traders digest the recent run of weak US economic data and its implications for interest rates going forward, a key driver of FX flows.
The hitherto buoyant services sector showed signs of contraction on Wednesday after ISM Services Purchasing Managers Index (PMI) data came out at 48.8, falling below the 50 level that separates growth from contraction and its lowest level since 2020.
US Jobs data showed signs of a cooling job market with Initial Jobless Claims rising and Continuing Claims hitting 1.858 million in the week ending June 22, its highest since November 2021. Investors now await June’s data for US Nonfarm Payrolls on Friday, a key data point that could further shape expectations on interest rates.
The upshot of it all is a weaker USD, as falling inflation expectations will make the Fed more inclined to cut interest rates, and lower interest rates are negative for the Dollar as they attract less foreign capital inflows.
Mexican Peso’s gains muted versus European counterparts
The Mexican Peso is making fewer gains against the Euro (EUR) and the Pound Sterling (GBP) due to easing political risk. It now seems likely that the far-right French National Rally (RN) party will not get enough seats for a majority in the second round of French elections on Sunday, which, in turn, supports the Euro.
Across the channel, meanwhile, the Pound Sterling (GBP) has been lifted slightly after the Labour Party’s landslide victory in Thursday’s general election. Some analysts have cited a more stable political climate, as well as stronger prospects for growth, as key drivers for expecting some post-election strengthening in GBP.
Technical Analysis: USD/MXN continues sliding to key low
USD/MXN continues edging lower towards the key June 24 swing low at 17.87. It is possible the pair is entering a sideways trend, although it is still a little too early to be sure.
USD/MXN 4-hour Chart
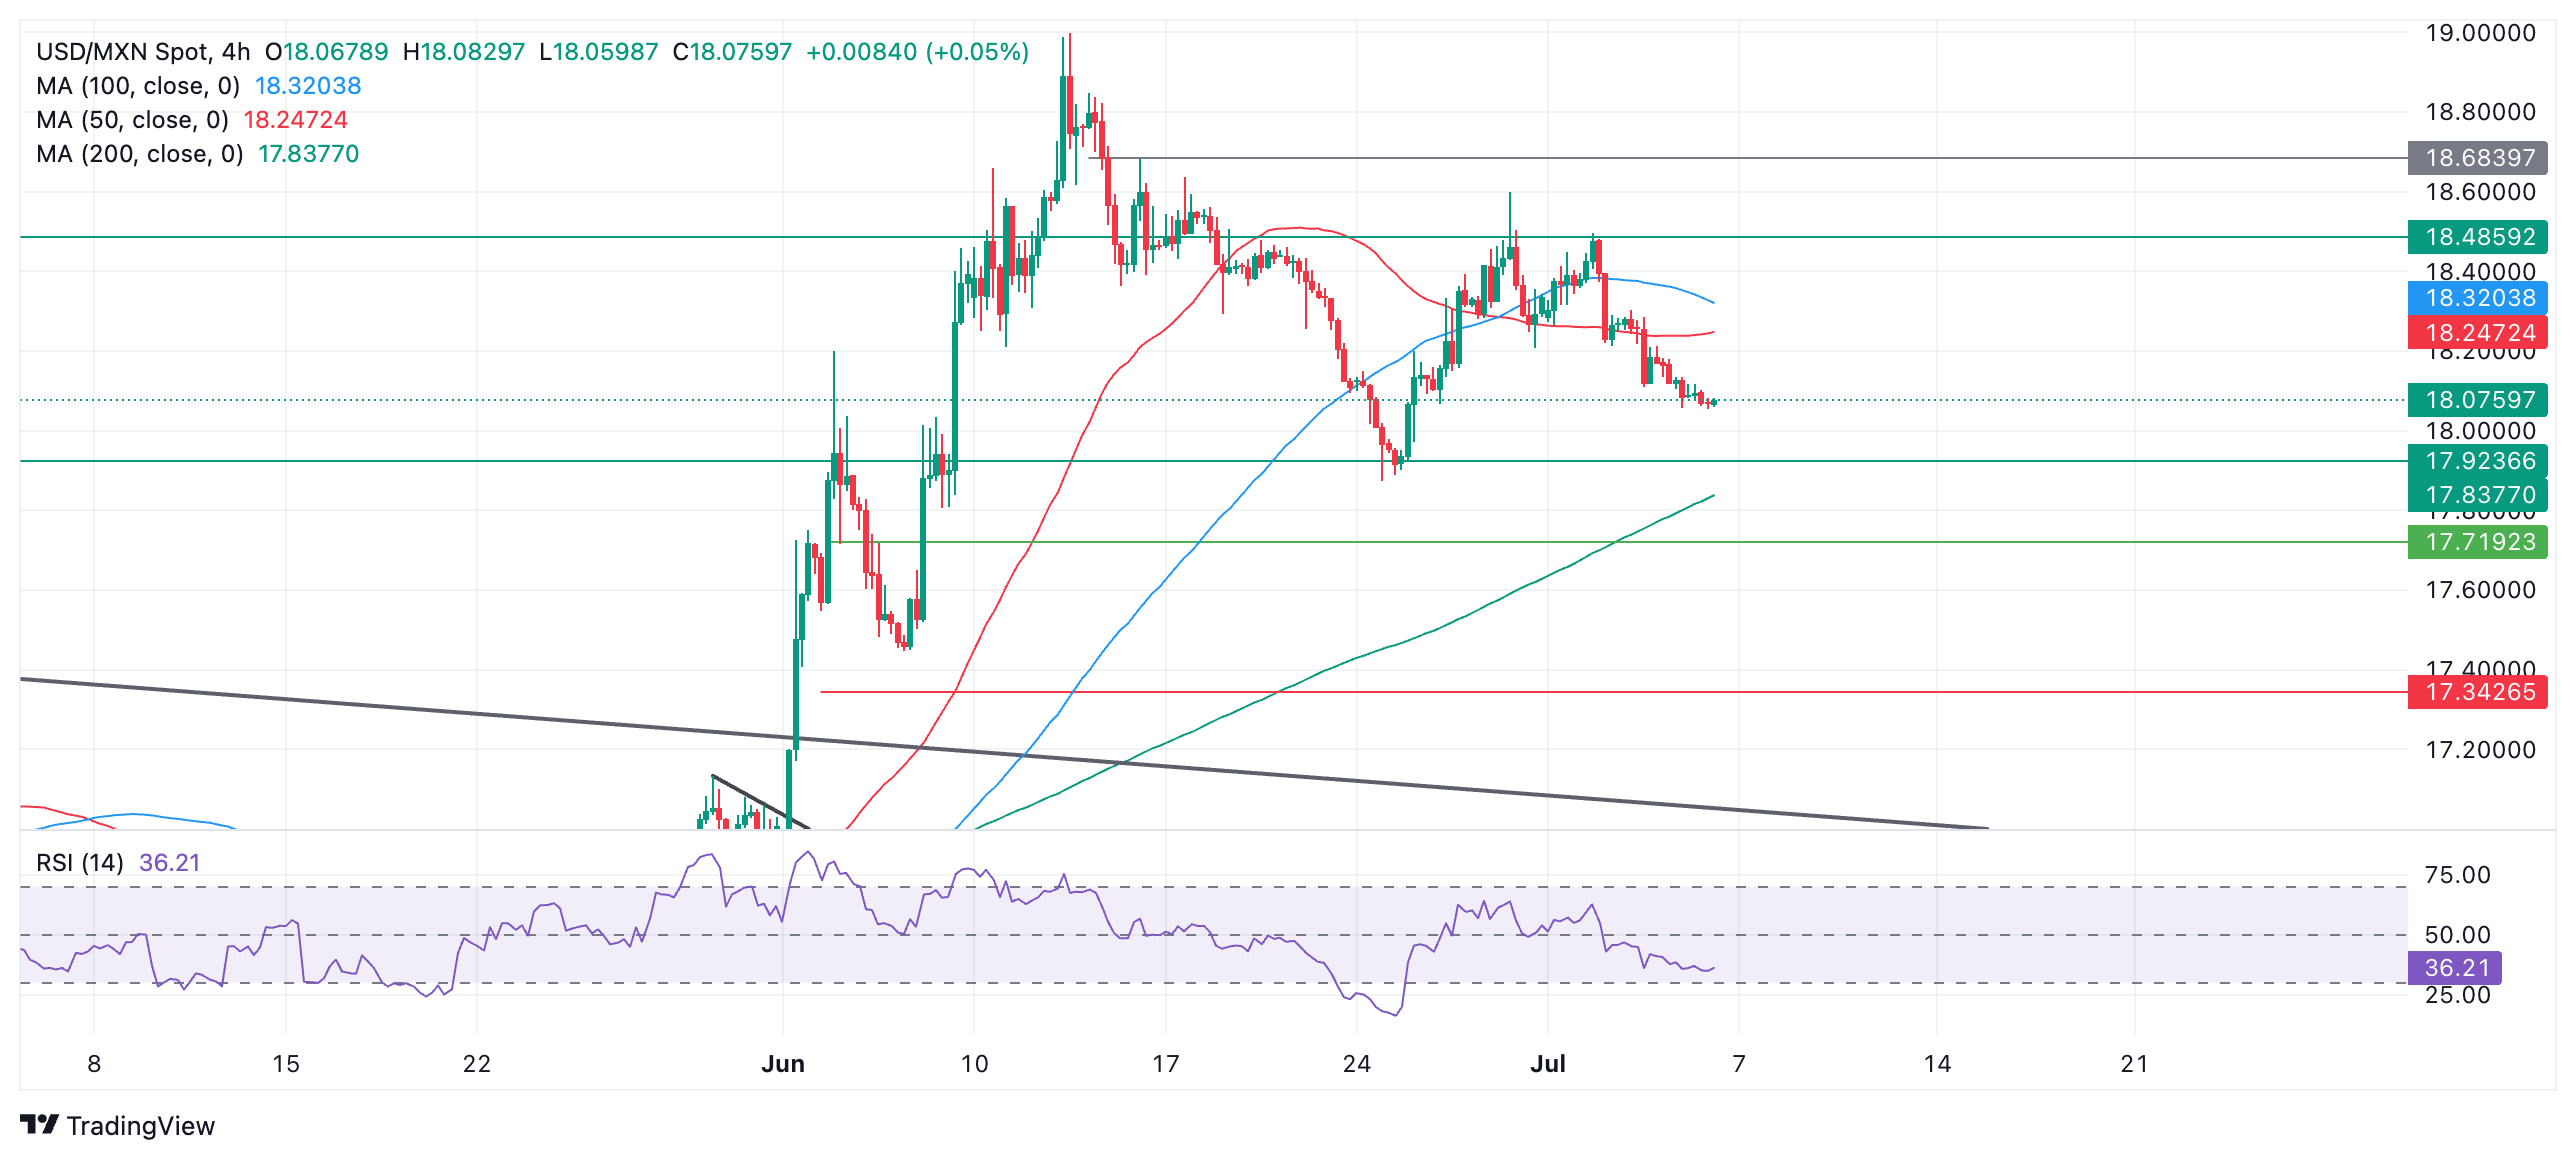
There is a chance that once the June 24 low is achieved, the pair will begin to consolidate. If it begins a leg higher, it could be a sign that the pair is entering a sideways trend. Alternatively, a decisive break below 17.87 would likely suggest a new downtrend, with the next target lying at 17.50 (50-day Simple Moving Average).
A rally back above 18.59, however, would suggest a continuation up to 18.68 (June 14 high), followed by 19.00 (June 12 high). A break above 19.00 would provide strong confirmation of a resumption of the short-and-intermediate term uptrends.
The direction of the long-term trend remains in doubt.
Economic Indicator
Nonfarm Payrolls
The Nonfarm Payrolls release presents the number of new jobs created in the US during the previous month in all non-agricultural businesses; it is released by the US Bureau of Labor Statistics (BLS). The monthly changes in payrolls can be extremely volatile. The number is also subject to strong reviews, which can also trigger volatility in the Forex board. Generally speaking, a high reading is seen as bullish for the US Dollar (USD), while a low reading is seen as bearish, although previous months' reviews and the Unemployment Rate are as relevant as the headline figure. The market's reaction, therefore, depends on how the market assesses all the data contained in the BLS report as a whole.
Read more.Next release: Fri Jul 05, 2024 12:30
Frequency: Monthly
Consensus: 190K
Previous: 272K
Source: US Bureau of Labor Statistics
America’s monthly jobs report is considered the most important economic indicator for forex traders. Released on the first Friday following the reported month, the change in the number of positions is closely correlated with the overall performance of the economy and is monitored by policymakers. Full employment is one of the Federal Reserve’s mandates and it considers developments in the labor market when setting its policies, thus impacting currencies. Despite several leading indicators shaping estimates, Nonfarm Payrolls tend to surprise markets and trigger substantial volatility. Actual figures beating the consensus tend to be USD bullish.
While the US 10-year yield is likely to trade between the two major levels of 4.137% and 4.622% in the near-term, the downside risk appears to be greater, UOB Group analyst Quek Ser Leang notes.
Further rebound is not ruled out
“In early June, the US 10-year yield fell sharply, reaching a low of 4.188%, but it did not break through the key support at the bottom of the weekly Ichimoku cloud (4.137%). The 10-year yield then rebounded, but there has been no clear increase in momentum. Note that the weekly MACD remains in negative territory.”
“While further rebound is not ruled out, the mild upward momentum suggests that any advance is highly unlikely to break clearly above 4.622%. Both the descending trendline connecting the highs of October 2023 and April 2024, and May’s high are near this significant resistance level.”
“Conversely, the bottom of the weekly Ichimoku cloud at 4.137% remains a key support level. This level has added significance as the trendline connecting the lows of April 2023 and January 2024 is not far below 4.137%. All things considered, while the 10-year yield is likely to trade between the two major levels of 4.137% and 4.622% in the near-term, the downside risk appears to be greater.”
- WTI price inches lower as recent data showed that OPEC increased production in June.
- Negotiations between Israel and Hamas showing potential for improvement exert downward pressure on Oil prices.
- US Nonfarm Payrolls are expected to show an increase of 190,000 new jobs, down from the previous reading of 272,000.
West Texas Intermediate (WTI) Oil price trades around $83.50 per barrel at the time of writing. Crude Oil prices remain tepid as recent data showed that the Organization of Petroleum Exporting Countries (OPEC) increased production in June for the second consecutive month. This indicates a potential easing of tight Oil markets in the coming months, exerting downward pressure on crude Oil prices.
On the geopolitical front, Israeli Prime Minister Benjamin Netanyahu informed US President Joe Biden on Thursday that he has decided to send a delegation to resume stalled negotiations on a hostage release deal with Hamas. A source within the Israeli negotiating team said that there is a real chance of reaching an agreement after Hamas made a revised proposal regarding the terms of the deal, as reported by Reuters. This may ease the supply threat from the Middle East, putting pressure on the Oil prices.
US Oil demand rose this week on strong summer demand expectations in the United States, the world's largest oil consumer. According to the American Automobile Association (AAA), travel during this period is projected to be 5.2% higher than in 2023, with car travel alone rising by 4.8% compared to the previous year, Reuters reports.
The weaker economic US data has led to speculation that the Federal Reserve (Fed) might consider lowering borrowing costs in 2024. Reduced borrowing costs can stimulate economic growth in the United States, potentially boosting demand for Oil and providing support for crude Oil prices.
WTI Oil FAQs
WTI Oil is a type of Crude Oil sold on international markets. The WTI stands for West Texas Intermediate, one of three major types including Brent and Dubai Crude. WTI is also referred to as “light” and “sweet” because of its relatively low gravity and sulfur content respectively. It is considered a high quality Oil that is easily refined. It is sourced in the United States and distributed via the Cushing hub, which is considered “The Pipeline Crossroads of the World”. It is a benchmark for the Oil market and WTI price is frequently quoted in the media.
Like all assets, supply and demand are the key drivers of WTI Oil price. As such, global growth can be a driver of increased demand and vice versa for weak global growth. Political instability, wars, and sanctions can disrupt supply and impact prices. The decisions of OPEC, a group of major Oil-producing countries, is another key driver of price. The value of the US Dollar influences the price of WTI Crude Oil, since Oil is predominantly traded in US Dollars, thus a weaker US Dollar can make Oil more affordable and vice versa.
The weekly Oil inventory reports published by the American Petroleum Institute (API) and the Energy Information Agency (EIA) impact the price of WTI Oil. Changes in inventories reflect fluctuating supply and demand. If the data shows a drop in inventories it can indicate increased demand, pushing up Oil price. Higher inventories can reflect increased supply, pushing down prices. API’s report is published every Tuesday and EIA’s the day after. Their results are usually similar, falling within 1% of each other 75% of the time. The EIA data is considered more reliable, since it is a government agency.
OPEC (Organization of the Petroleum Exporting Countries) is a group of 13 Oil-producing nations who collectively decide production quotas for member countries at twice-yearly meetings. Their decisions often impact WTI Oil prices. When OPEC decides to lower quotas, it can tighten supply, pushing up Oil prices. When OPEC increases production, it has the opposite effect. OPEC+ refers to an expanded group that includes ten extra non-OPEC members, the most notable of which is Russia.
Silver prices (XAG/USD) rose on Friday, according to FXStreet data. Silver trades at $30.59 per troy ounce, up 0.60% from the $30.41 it cost on Thursday.
Silver prices have increased by 28.56% since the beginning of the year.
| Unit measure | Silver Price Today in USD |
|---|---|
| Troy Ounce | 30.59 |
| 1 Gram | 0.98 |
The Gold/Silver ratio, which shows the number of ounces of Silver needed to equal the value of one ounce of Gold, stood at 77.37 on Friday, down from 77.52 on Thursday.
Silver FAQs
Silver is a precious metal highly traded among investors. It has been historically used as a store of value and a medium of exchange. Although less popular than Gold, traders may turn to Silver to diversify their investment portfolio, for its intrinsic value or as a potential hedge during high-inflation periods. Investors can buy physical Silver, in coins or in bars, or trade it through vehicles such as Exchange Traded Funds, which track its price on international markets.
Silver prices can move due to a wide range of factors. Geopolitical instability or fears of a deep recession can make Silver price escalate due to its safe-haven status, although to a lesser extent than Gold's. As a yieldless asset, Silver tends to rise with lower interest rates. Its moves also depend on how the US Dollar (USD) behaves as the asset is priced in dollars (XAG/USD). A strong Dollar tends to keep the price of Silver at bay, whereas a weaker Dollar is likely to propel prices up. Other factors such as investment demand, mining supply – Silver is much more abundant than Gold – and recycling rates can also affect prices.
Silver is widely used in industry, particularly in sectors such as electronics or solar energy, as it has one of the highest electric conductivity of all metals – more than Copper and Gold. A surge in demand can increase prices, while a decline tends to lower them. Dynamics in the US, Chinese and Indian economies can also contribute to price swings: for the US and particularly China, their big industrial sectors use Silver in various processes; in India, consumers’ demand for the precious metal for jewellery also plays a key role in setting prices.
Silver prices tend to follow Gold's moves. When Gold prices rise, Silver typically follows suit, as their status as safe-haven assets is similar. The Gold/Silver ratio, which shows the number of ounces of Silver needed to equal the value of one ounce of Gold, may help to determine the relative valuation between both metals. Some investors may consider a high ratio as an indicator that Silver is undervalued, or Gold is overvalued. On the contrary, a low ratio might suggest that Gold is undervalued relative to Silver.
(An automation tool was used in creating this post.)
The US Dollar (USD) could decline further, but it is unlikely to threaten the support at 7.2800. In the longer run, upward momentum has largely dissipated, and USD is expected to trade between 7.2700 and 7.3100 for the time being, UOB Group analysts Quek Ser Leang and Lee Sue Ann note.
USD to trade between 7.2700 and 7.3100
24-HOUR VIEW: “Yesterday, we noted that ‘downward momentum is beginning to build.’ We also indicated that USD ‘could drop to 7.2900 but is unlikely to threaten the next support at 7.2800.’ While USD subsequently dropped, it only reached a low of 7.2917. Downward has increased further, albeit not much. Today, USD could continue to decline, but the support at 7.2800 is still unlikely to come under threat. There is another support at 7.2860. On the upside, if USD breaks above 7.3030 (minor resistance is at 7.2980), it would indicate that USD is not declining further.”
1-3 WEEKS VIEW: “We continue to hold the same view as yesterday (04 Jul, spot at 7.3000). As highlighted, the recent buildup of upward momentum had largely dissipated. The current price movements are likely part of a consolidation. For the time being, we expect USD to trade between 7.2700 and 7.3100.”
- Eurozone Retail Sales rose 0.3% YoY in May vs. 0.1% forecast.
- Retail Sales in the bloc arrived at 0.1% MoM in May vs. 0.2% estimate.
Eurozone’s Retail Sales rose 0.3% YoY in May, having registered a 0.6% growth in April, the official data released by Eurostat showed on Friday. The data beat the market consensus of 0.1%.
On a monthly basis, Retail Sales in the old continent increased by 0.1% in the same period vs. April’s -0.2% and 0.2% expected.
FX implications
Mixed Eurozone data had little to no impact on the Euro. At the time of writing, the EUR/USD pair is trading at 1.0825, up 0.17% on the day.
(The title was revised on Friday at 09:04 GMT to say that "Eurozone Retail Sales rise 0.1% MoM in May vs. 0.2% expected," not YoY)
Euro FAQs
The Euro is the currency for the 20 European Union countries that belong to the Eurozone. It is the second most heavily traded currency in the world behind the US Dollar. In 2022, it accounted for 31% of all foreign exchange transactions, with an average daily turnover of over $2.2 trillion a day. EUR/USD is the most heavily traded currency pair in the world, accounting for an estimated 30% off all transactions, followed by EUR/JPY (4%), EUR/GBP (3%) and EUR/AUD (2%).
The European Central Bank (ECB) in Frankfurt, Germany, is the reserve bank for the Eurozone. The ECB sets interest rates and manages monetary policy. The ECB’s primary mandate is to maintain price stability, which means either controlling inflation or stimulating growth. Its primary tool is the raising or lowering of interest rates. Relatively high interest rates – or the expectation of higher rates – will usually benefit the Euro and vice versa. The ECB Governing Council makes monetary policy decisions at meetings held eight times a year. Decisions are made by heads of the Eurozone national banks and six permanent members, including the President of the ECB, Christine Lagarde.
Eurozone inflation data, measured by the Harmonized Index of Consumer Prices (HICP), is an important econometric for the Euro. If inflation rises more than expected, especially if above the ECB’s 2% target, it obliges the ECB to raise interest rates to bring it back under control. Relatively high interest rates compared to its counterparts will usually benefit the Euro, as it makes the region more attractive as a place for global investors to park their money.
Data releases gauge the health of the economy and can impact on the Euro. Indicators such as GDP, Manufacturing and Services PMIs, employment, and consumer sentiment surveys can all influence the direction of the single currency. A strong economy is good for the Euro. Not only does it attract more foreign investment but it may encourage the ECB to put up interest rates, which will directly strengthen the Euro. Otherwise, if economic data is weak, the Euro is likely to fall. Economic data for the four largest economies in the euro area (Germany, France, Italy and Spain) are especially significant, as they account for 75% of the Eurozone’s economy.
Another significant data release for the Euro is the Trade Balance. This indicator measures the difference between what a country earns from its exports and what it spends on imports over a given period. If a country produces highly sought after exports then its currency will gain in value purely from the extra demand created from foreign buyers seeking to purchase these goods. Therefore, a positive net Trade Balance strengthens a currency and vice versa for a negative balance.
The US Dollar (USD) could continue to trade in a range, probably between 160.80 and 161.80. Upward momentum is beginning to slow, but only a breach of 160.45 would suggest that USD is not strengthening further, UOB Group analysts Quek Ser Leang and Lee Sue Ann note.
To be sidelined in a range or to breach 160.45
24-HOUR VIEW: “We expected USD to trade in a range between 160.80 and 161.90 yesterday. USD subsequently traded in a narrower range than expected (160.93/1611.74). The price action provides no fresh clues, and we continue to expect USD to trade in a range, probably between 160.80 and 161.80.”
1-3 WEEKS VIEW: “We have expected a stronger USD since the middle of last month. Yesterday (04 Jul, spot at 161.45), we highlighted that ‘upward momentum is beginning to slow.’ However, we noted ‘only a breach of 160.45 would suggest that USD is not strengthening further.’ Our view remains unchanged.”
Chance for the New Zealand Dollar (NZD) to retest the 0.6130 level; the major resistance at 0.6150 is unlikely to come into view. With that said, recovery in NZD could extend to 0.6150, UOB Group analysts Quek Ser Leang and Lee Sue Ann note.
Recovery in NZD may extend to 0.6150
24-HOUR VIEW: “NZD surged to a high of 0.6129 on Wednesday. Yesterday (Thursday), we indicated that ‘there is a chance for NZD to retest the 0.6130 level, even though a sustained break above this level appears unlikely.’ Our view did not turn out, as NZD traded between 0.6101 and 0.6122. Today, we continue to hold the view that there is a chance for NZD to retest 0.6130. The major resistance at 0.6150 is unlikely to come into view. Support is at 0.6100 and 0.6090.”
1-3 WEEKS VIEW: “There is not much to add to our update from yesterday (04 Jul, spot at 0.6105). As indicated, the recent weakness has stabilised, and the current price movements are likely part of a recovery that has potential to extend to 0.6150. A breach of 0.6070 (no change in ‘strong support’ level) would indicate that NZD is not recovering further.”
The Australian Dollar (AUD) is likely to edge higher, and the 0.6755 level is expected to offer solid resistance. If AUD can surpass 0.6755, it could continue to rise to 0.6800, UOB Group analysts Quek Ser Leang and Lee Sue Ann note.
Above 0.6755 AUD can continue to rise to 0.6800
24-HOUR VIEW: “After AUD surged to a high of 0.6734 two days ago, we indicated yesterday that ‘the sharp rally appears to be overdone, and instead of continuing to rise, AUD is likely to trade in a sideways range of 0.6685/0.6735.’ AUD then traded between 0.6704 and 0.6732. Upward momentum has increased, albeit not much. Today, provided that AUD does not break below 0.6690, it is likely to edge higher. However, the 0.6755 level is expected to offer solid resistance.”
1-3 WEEKS VIEW: “We continue to hold the same view as yesterday (04 Jul, spot at 0.6710). As highlighted, after rising strongly two days ago, upward momentum has increased. We pointed out that there is a significant resistance at 0.6755. If AUD can surpass this level, it could continue to rise to 0.6800. We will continue to expect a higher AUD, provided that it remains above 0.6665 (no change in ‘strong support’ from yesterday).”
- Silver price receives support as weaker US data raise the odds of the Fed reducing rates in 2024.
- US Nonfarm Payrolls are expected to increase by 190,000 new jobs, down from the previous reading of 272,000.
- The potential for improvement in negotiations between Israel and Hamas may cap the upside for safe-haven Silver.
Silver price (XAG/USD) recovers its recent losses, trading around $30.60 per troy ounce during the European session on Friday. Weaker economic data from the United States (US) has sparked speculation that the Federal Reserve (Fed) might consider reducing interest rates in 2024. This has provided support for non-yielding assets such as silver.
Additionally, The Federal Reserve (Fed) Chair Jerome Powell turned slightly dovish on Tuesday. Powell said that the Fed is getting back on the disinflationary path. However, Powell wants to see further evidence before cutting interest rates as the US economy and the labor market remain strong, per Reuters.
On Wednesday, the US ISM Services PMI dropped sharply to 48.8 in June, marking the steepest decline since April 2020. Additionally, the ADP Employment report showed that US private businesses added 150,000 workers to their payrolls in June, the lowest increase in five months.
Traders await the US employment reports on Friday, which are expected to indicate a slowdown in employment growth for June. The US Nonfarm Payrolls (NFP) are forecasted to show an increase of 190,000 new jobs, down from the previous reading of 272,000. Additionally, US Average Hourly Earnings are anticipated to moderate slightly, with projections showing a decrease to 3.9% year-over-year from the prior reading of 4.1%.
On the geopolitical front, Israeli Prime Minister Benjamin Netanyahu informed US President Joe Biden on Thursday that he has decided to send a delegation to resume stalled negotiations on a hostage release deal with Hamas. A source within the Israeli negotiating team said that there is a real chance of reaching an agreement after Hamas made a revised proposal regarding the terms of the deal, as reported by Reuters. This may limit the upside of safe-haven assets like Silver.
Silver prices are being supported by increased demand for the metal in the expansion of renewable energy. Silver is a key component in solar panels and other renewable energy technologies due to its conductivity in photovoltaic cells.
Silver FAQs
Silver is a precious metal highly traded among investors. It has been historically used as a store of value and a medium of exchange. Although less popular than Gold, traders may turn to Silver to diversify their investment portfolio, for its intrinsic value or as a potential hedge during high-inflation periods. Investors can buy physical Silver, in coins or in bars, or trade it through vehicles such as Exchange Traded Funds, which track its price on international markets.
Silver prices can move due to a wide range of factors. Geopolitical instability or fears of a deep recession can make Silver price escalate due to its safe-haven status, although to a lesser extent than Gold's. As a yieldless asset, Silver tends to rise with lower interest rates. Its moves also depend on how the US Dollar (USD) behaves as the asset is priced in dollars (XAG/USD). A strong Dollar tends to keep the price of Silver at bay, whereas a weaker Dollar is likely to propel prices up. Other factors such as investment demand, mining supply – Silver is much more abundant than Gold – and recycling rates can also affect prices.
Silver is widely used in industry, particularly in sectors such as electronics or solar energy, as it has one of the highest electric conductivity of all metals – more than Copper and Gold. A surge in demand can increase prices, while a decline tends to lower them. Dynamics in the US, Chinese and Indian economies can also contribute to price swings: for the US and particularly China, their big industrial sectors use Silver in various processes; in India, consumers’ demand for the precious metal for jewellery also plays a key role in setting prices.
Silver prices tend to follow Gold's moves. When Gold prices rise, Silver typically follows suit, as their status as safe-haven assets is similar. The Gold/Silver ratio, which shows the number of ounces of Silver needed to equal the value of one ounce of Gold, may help to determine the relative valuation between both metals. Some investors may consider a high ratio as an indicator that Silver is undervalued, or Gold is overvalued. On the contrary, a low ratio might suggest that Gold is undervalued relative to Silver.
The Pound Sterling (GBP) is expected to trade in a sideways range between 1.2725 and 1.2775, but risk for GBP has shifted to the upside. Note that there is a solid resistance level at 1.2805, UOB Group analysts Quek Ser Leang and Lee Sue Ann note.
Next resistance level exists at 1.2805
24-HOUR VIEW: “Yesterday, we held the view that ‘there is room for GBP to retest the 1.2780 level before a pullback can be expected.’ Our expectation did not materialise, as GBP traded in a quiet manner between 1.2740 and 1.2764. The price movements are likely part of a sideways trading phase. Today, we expect GBP to trade in a range of 1.2725 and 1.2775.”
1-3 WEEKS VIEW: “We highlighted yesterday (04 Jul, spot at 1.2745) that ‘the risk for GBP has shifted to the upside.’ We pointed out that ‘there is a solid resistance level at 1.2805, ahead of last month’s high of 1.2860.’ There is no change in our view. The upside risk is intact as long as GBP remains above 1.2685 (‘strong support’ level was at 1.2665 yesterday).”
The Euro (EUR) is likely to edge higher. It remains to be seen if it can reach the major resistance at 1.0850, UOB Group analysts Quek Ser Leang and Lee Sue Ann note.
The next level to monitor above 1.0850 is at 1.0900
24-HOUR VIEW: “EUR soared two days ago. Yesterday, we indicated that ‘the sharp and swift rally appears to be overdone.’ We added, ‘Instead of continuing to rise, EUR is more likely to trade in a sideways range of 1.0750/1.0815.’ EUR subsequently traded between 1.0782 and 1.0813, closing at 1.0810 (+0.22%). There has been a slight increase in upward momentum. While EUR is likely to edge higher today, it remains to be seen if it can reach the major resistance at 1.0850. Should EUR break below 1.0770 (minor support is at 1.0790), it would indicate that the current mild upward pressure has faded.”
1-3 WEEKS VIEW: “Our update from yesterday (04 Jul, spot at 1.0785) remains valid. As indicated, while the increase in momentum suggests further EUR strength, it is too early to determine if it can reach the major resistance at 1.0850. All in all, we will hold a slightly positive EUR view as long as it remains above the ‘strong support’ at 1.0745 (level was at 1.0730 yesterday). Looking ahead, the next level to monitor above 1.0850 is at 1.0900.”
- Gold extends its positive run as the probability of the Federal Reserve lowering interest rates increases.
- A run of weak data from the US indicates inflationary pressures are waning, and interest rates could fall.
- The US Dollar weakens, adding a backwind to Gold, as counterparts in Europe strengthen on diminishing political risk.
Gold (XAU/USD) rises on Friday, continuing its run of positive days as investors become increasingly optimistic the Federal Reserve (Fed) will lower interest rates sooner than previously thought, and the US Dollar (USD) softens, adding a lift to Gold which is predominantly bought and sold in Dollars.
Gold rallies as interest rates expected to fall, USD weakens
Gold trades in the $2,360s on Friday, up by more than a third of a percent on the day, as bets increase that the Fed will begin cutting interest rates as soon as its meeting in September.
A string of sub-par data releases from the US has dented confidence in the economy and increased speculation the Fed will move to lower interest rates in an attempt to spur growth. Weak labor market and services sector data has particularly impacted expectations. In light of this, Friday’s key labor report, the Nonfarm Payrolls release, is being touted as a significant data point in shaping expectations.
The probability of the Fed cutting its principal policy rate, the Fed Funds rate, by 0.25% by September has increased from the mid-60s at the start of the week to 72% on Friday, according to the CME FedWatch tool, which uses the price of the 30-day Fed Funds futures in its calculations. The promise of lower interest rates, in turn, increases Gold’s attractiveness as an investment because it lowers the opportunity cost of holding a non-interest-paying asset.
Gold gets a further backwind from a weaker US Dollar, which is falling because the expectation of lower US interest reduces foreign capital inflows, as well as because of a strengthening of its major counterparts. The Pound Sterling (GBP) is edging higher on Friday after a Labour Party landslide victory in the July 4 general election brings the promise of growth and stability. The Euro (EUR) is recovering on reduced political risk as it becomes increasingly clear the French far-right National Rally party will now probably not achieve a majority in the second round of elections on Sunday.
Gold gains on broader global backdrop
Gold is probably also benefiting from generalized demand as a result of broader geopolitical and macro factors.
The ongoing conflicts in the Middle East and Ukraine, as well as the increased risk of a Trump presidency, are still factors driving nervous investors to store their wealth in Gold.
The expansion of the BRICS trading bloc and its expressed aim to de-dollarize global trade has also increased demand for Gold, which is viewed as the most realistic replacement for countries denied access to Dollar-denominated markets because of sanctions.
Set against this, however, is falling political risk in Europe, which, despite a notable swing to the far right, is likely to remain in the hands of moderate coalitions.
High central bank demand, which accounts for roughly a quarter of the Gold market, might also be easing. Much buying was driven by Asian central banks using Gold as a hedge to support their domestic currencies as they depreciated against the US Dollar when it rallied in the spring, after the Fed had to revise its expectations for policy normalization.
Technical Analysis: Gold reaches resistance
Gold has now established itself comfortably above the 50-day Simple Moving Average (SMA), overcoming a major technical milestone for the yellow metal.
It has, however, reached a resistance level at swing high of the $2,368 June 21 high. A break above this level would add further confidence to a bullish view.
XAU/USD Daily Chart
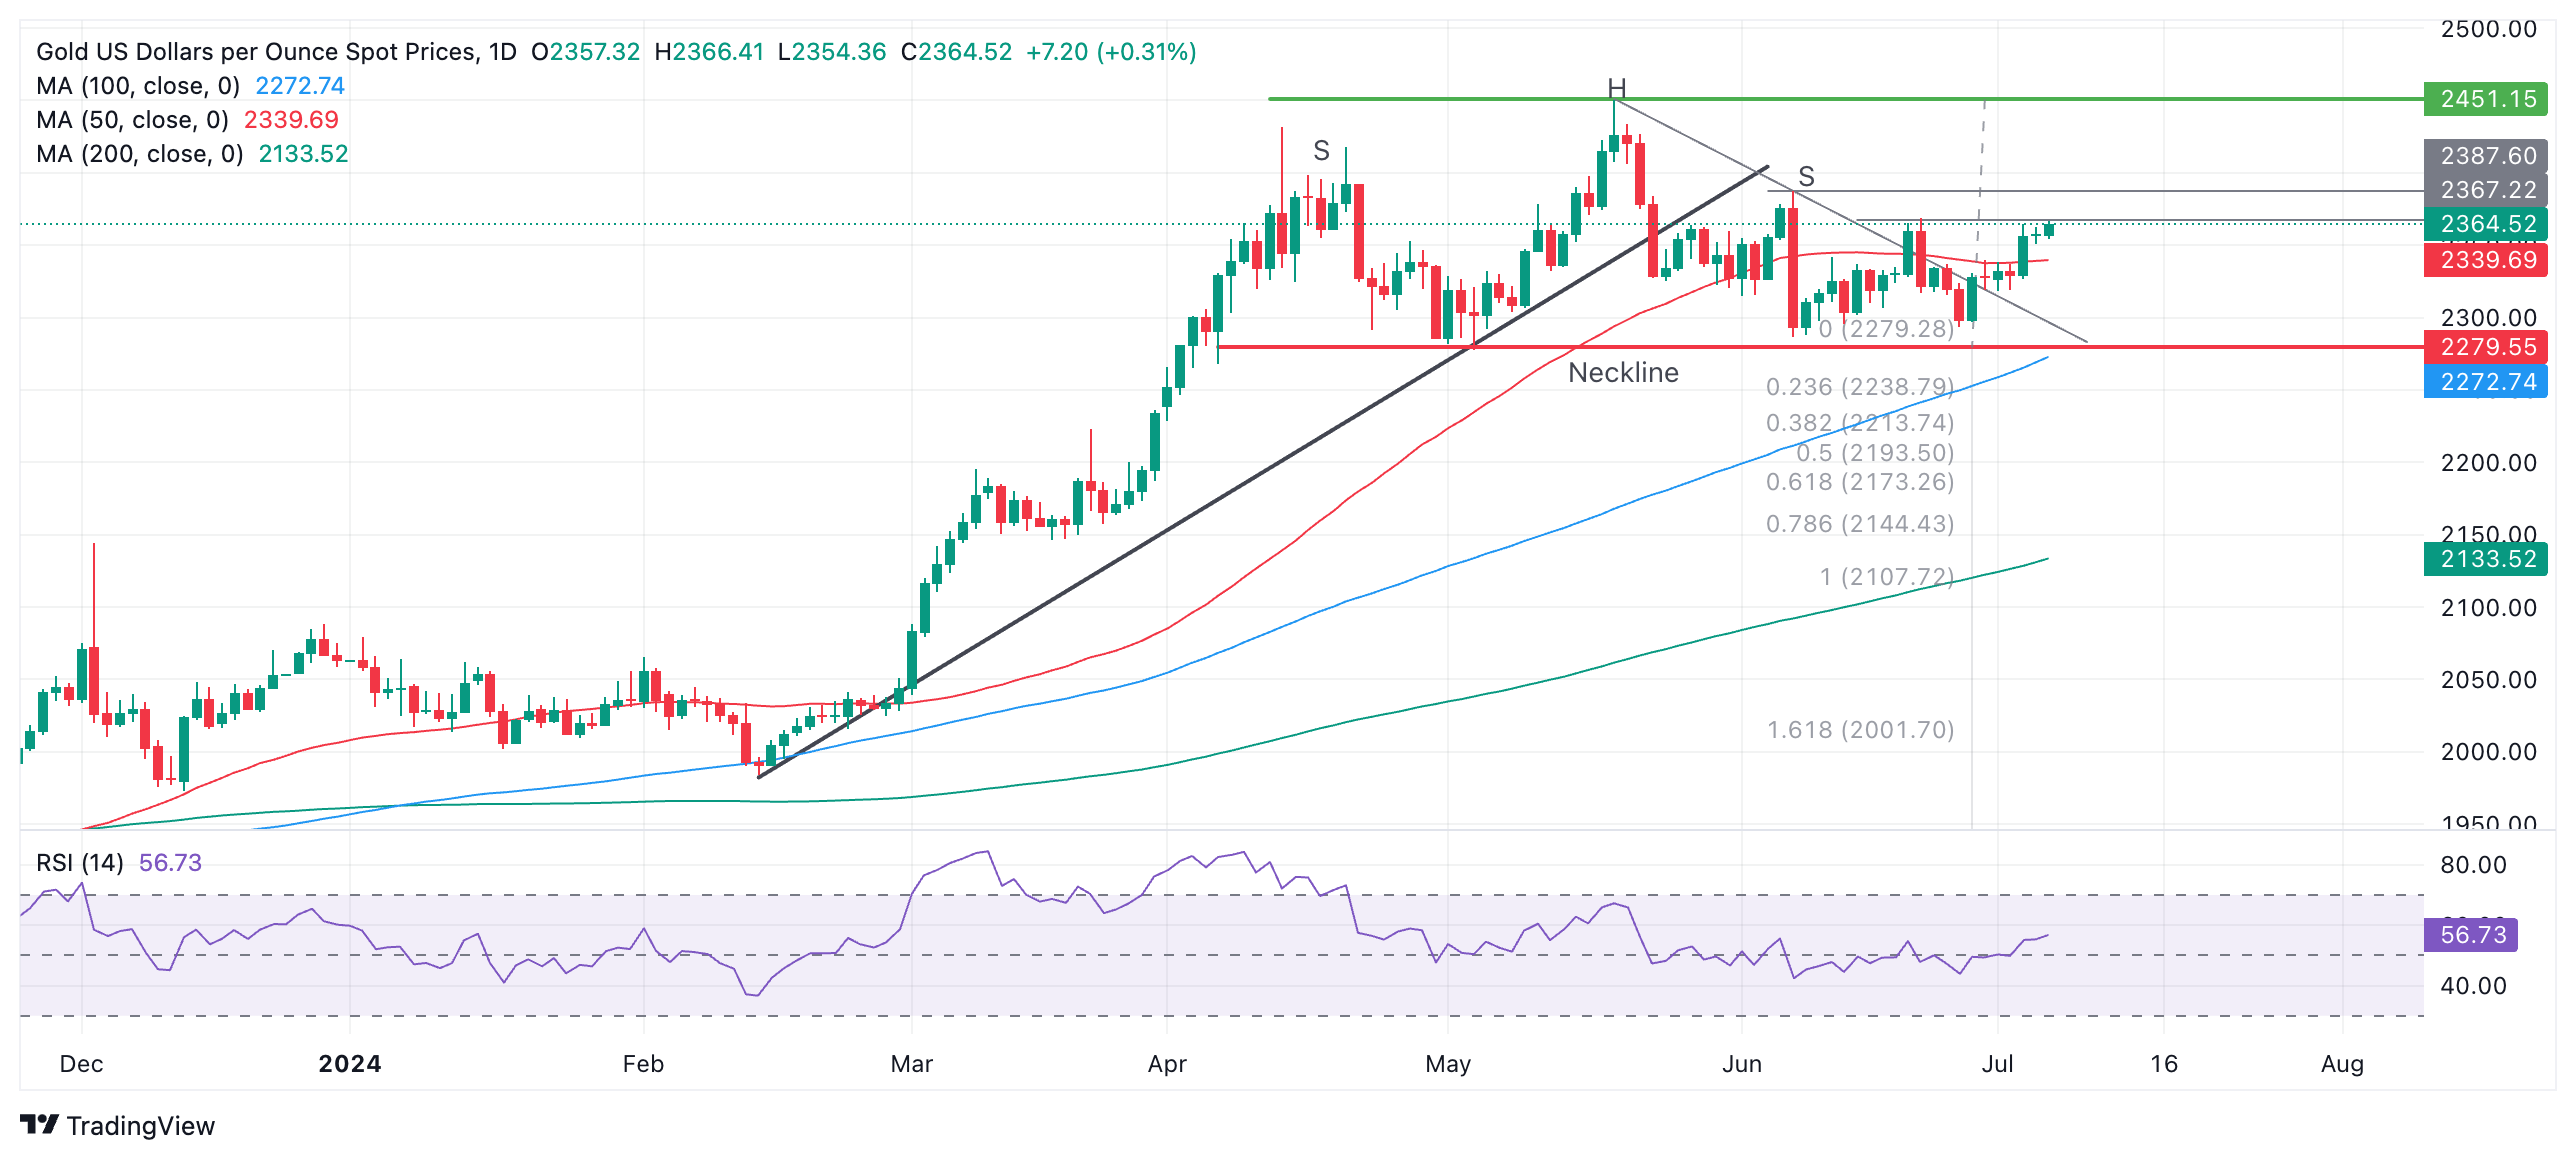
A break above the June 21 high would unlock the next target at $2,388, the June 7 high, followed by the $2,451 all-time-high.
The bearish Head & Shoulders topping pattern that was forming between April and June has been invalidated by the recent recovery, however, that said, there is still a lesser chance that a more complex topping pattern is forming instead. If so – and price suddenly falls to the pattern’s neckline at $2,279 and breaks through it – a reversal lower may still follow, with a conservative target at $2,171, the 0.618 ratio of the height of the pattern extrapolated lower.
The trend is now sideways in both the short and medium term. In the long term, Gold remains in an uptrend.
Economic Indicator
Nonfarm Payrolls
The Nonfarm Payrolls release presents the number of new jobs created in the US during the previous month in all non-agricultural businesses; it is released by the US Bureau of Labor Statistics (BLS). The monthly changes in payrolls can be extremely volatile. The number is also subject to strong reviews, which can also trigger volatility in the Forex board. Generally speaking, a high reading is seen as bullish for the US Dollar (USD), while a low reading is seen as bearish, although previous months' reviews and the Unemployment Rate are as relevant as the headline figure. The market's reaction, therefore, depends on how the market assesses all the data contained in the BLS report as a whole.
Read more.Next release: Fri Jul 05, 2024 12:30
Frequency: Monthly
Consensus: 190K
Previous: 272K
Source: US Bureau of Labor Statistics
America’s monthly jobs report is considered the most important economic indicator for forex traders. Released on the first Friday following the reported month, the change in the number of positions is closely correlated with the overall performance of the economy and is monitored by policymakers. Full employment is one of the Federal Reserve’s mandates and it considers developments in the labor market when setting its policies, thus impacting currencies. Despite several leading indicators shaping estimates, Nonfarm Payrolls tend to surprise markets and trigger substantial volatility. Actual figures beating the consensus tend to be USD bullish.
- USD/JPY falls slightly below 161.00 as the US Dollar is under pressure due to firm Fed rate-cut prospects.
- Fears of BoJ’s intervention to support the Japanese Yen have intensified.
- Investors await the US NFP report for fresh guidance on interest rates
The USD/JPY pair extends its correction to near 161.80 in Friday’s European session. The asset comes under pressure as fears of Japan’s intervention in the FX domain due to one-sided excessive moves, which have led to a sharp weakness in the Japanese Yen and a sheer sell-off in the US Dollar (USD) due to firm speculation that the Federal Reserve (Fed) to begin lowering interest rates from the September meeting.
The Japanese Yen struggles to gain ground even though Bank of Japan (BoJ) policymakers have advocated tightening monetary policy further. The weak Japanese Yen has prompted consumer inflation expectations as Japan’s exports have become competitive globally, and import costs have increased significantly.
However, a sharp contraction in Overall Household Spending in May has cast doubts over BoJ’s rate-hike path. The economic data unexpectedly declined by 1.8%. Economists forecasted that households’ purchasing power would have grown at a slower rate of 0.1% from the prior release of 0.5%.
Meanwhile, the improved probability that the Fed will start reducing interest rates in September has increased investors' risk appetite. S&P 500 futures have posted nominal gains in Asian trading hours.
The US Dollar Index (DXY), which tracks the Greenback’s value against six major currencies, has slid further and has posted a fresh three-week low to near 105.00. 10-year US Treasury yields rise to near 4.36% ahead of the United States (US) Nonfarm Payrolls (NFP) data, which will be published at 12:30 GMT.
According to expectations, 190K workers were hired in June, significantly lower than May’s reading of 272K. The Unemployment Rate is estimated to have remained steady at 4%.
Japanese Yen FAQs
The Japanese Yen (JPY) is one of the world’s most traded currencies. Its value is broadly determined by the performance of the Japanese economy, but more specifically by the Bank of Japan’s policy, the differential between Japanese and US bond yields, or risk sentiment among traders, among other factors.
One of the Bank of Japan’s mandates is currency control, so its moves are key for the Yen. The BoJ has directly intervened in currency markets sometimes, generally to lower the value of the Yen, although it refrains from doing it often due to political concerns of its main trading partners. The current BoJ ultra-loose monetary policy, based on massive stimulus to the economy, has caused the Yen to depreciate against its main currency peers. This process has exacerbated more recently due to an increasing policy divergence between the Bank of Japan and other main central banks, which have opted to increase interest rates sharply to fight decades-high levels of inflation.
The BoJ’s stance of sticking to ultra-loose monetary policy has led to a widening policy divergence with other central banks, particularly with the US Federal Reserve. This supports a widening of the differential between the 10-year US and Japanese bonds, which favors the US Dollar against the Japanese Yen.
The Japanese Yen is often seen as a safe-haven investment. This means that in times of market stress, investors are more likely to put their money in the Japanese currency due to its supposed reliability and stability. Turbulent times are likely to strengthen the Yen’s value against other currencies seen as more risky to invest in.
- EUR/USD refreshes a three-week high near 1.0830 due to multiple tailwinds.
- The Euro strengthens as the far right may fail to gain an outright majority in French elections.
- The US Dollar weakens due to multiple tailwinds, with US NFP in focus.
EUR/USD posts a fresh three-week high near 1.0830 in Friday’s European session. The major currency pair strengthens as the Euro’s outlook improves ahead of the second round of French elections, scheduled for Sunday, and sheer weakness in the US Dollar (USD).
The appeal for the Euro improves amid expectations that the Marine Le Pen-led far-right National Rally would fail to convert its victory of the first round into an absolute majority due to the tactical withdrawal of at least 200 candidates from Sunday’s legislative elections by a coalition of French President Emmanuel Macron-led entrist alliance and the left-wing.
Meanwhile, speculation for the European Central Bank (ECB) delivering subsequent rate cuts on July 18 has diminished as disinflation in the Eurozone appears to be stalling. The preliminary core Harmonized Index of Consumer Prices (HICP) that excludes volatile items grew steadily by 2.9% year-on-year in June.
On Friday, investors await the Eurozone Retail Sales data for May, which will be published at 09:00 GMT. The Retail Sales are expected to have expanded by 0.2% in the month after contracting 0.5% in April. Annually, Retail Sales are estimated to have grown marginally by 0.1% after remaining unchanged in April.
Daily digest market movers: EUR/USD strengthens at US Dollar’s costs
- EUR/USD trades comfortably above the round level of 1.0800 at the cost of the US Dollar. Growing speculation that the Federal Reserve (Fed) will start reducing interest rates from the September meeting has built significant pressure on the Greenback. The US Dollar Index (DXY), which tracks the Greenback’s value against six major currencies, has extended its losing spell for the seventh trading session and has posted a fresh three-week low near 105.00.
- Traders raised rate-cut bets for September heavily due to various factors, such as Fed Chair Jerome Powell's sheer confidence that the central bank has made considerable progress in inflation, easing labor market strength, and contraction in the Services PMI.
- The June ADP Employment Change report showed unexpectedly slowing private sector hiring. In the same period, the Services PMI showed a contraction in the sector and dropped to its lowest level in four years.
- In Friday’s session, the major trigger for the US Dollar will be the United States Nonfarm Payrolls (NFP) data for June, which will be published at 12:30 GMT. The US NFP report is expected to show that 190K new workers were hired, compared to 272K in May. The Unemployment Rate is expected to remain steady at 4.0%.
- Investors will pay close attention to Average Hourly Earnings data, a measure of wage growth that has been a major driving factor behind high inflation in the service sector. Annual Average Hourly Earnings are estimated to have decelerated to 3.9% from May’s reading of 4.1%. On monthly, the wage growth measure is expected to have grown at a slower pace of 0.3% from the prior release of 0.4%.
Technical Analysis: EUR/USD posts fresh three-week high
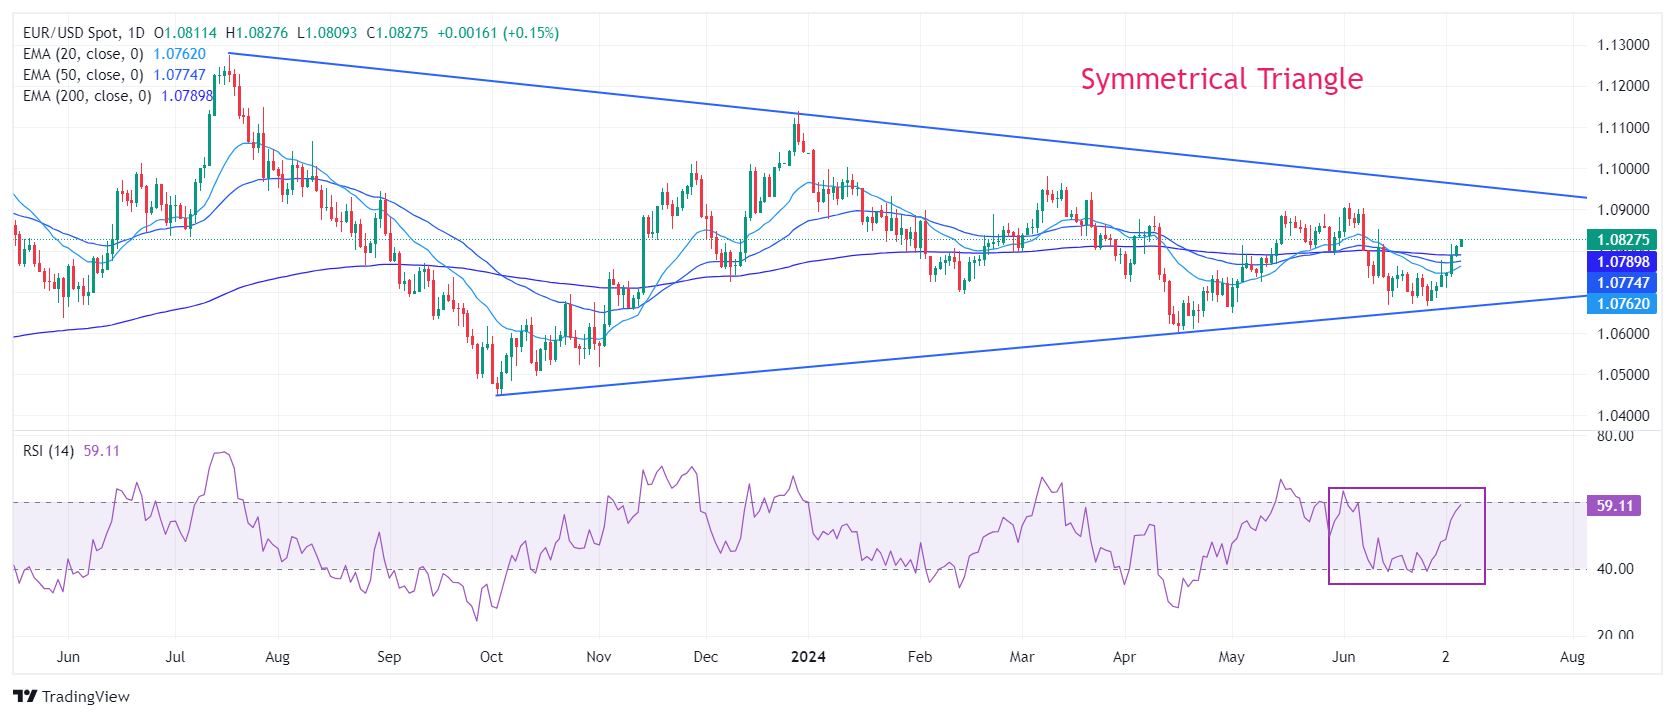
EUR/USD extends its winning spell for the seventh day on Friday. The major currency pair strengthens after stabilizing above the 20-day and 50-day Exponential Moving Averages (EMAs), which trade around 1.0750 and 1.0770, respectively. The overall trend of the shared currency pair has also strengthened as it has jumped above the 200-day EMA, which trades around 1.0800.
The Symmetrical Triangle formation on the daily timeframe exhibits a sharp volatility contraction, which indicates low volume and narrow ticks.
The 14-day Relative Strength Index (RSI) reaches 60.00. Should the bullish momentum be triggered if it breaks above this level?
Euro FAQs
The Euro is the currency for the 20 European Union countries that belong to the Eurozone. It is the second most heavily traded currency in the world behind the US Dollar. In 2022, it accounted for 31% of all foreign exchange transactions, with an average daily turnover of over $2.2 trillion a day. EUR/USD is the most heavily traded currency pair in the world, accounting for an estimated 30% off all transactions, followed by EUR/JPY (4%), EUR/GBP (3%) and EUR/AUD (2%).
The European Central Bank (ECB) in Frankfurt, Germany, is the reserve bank for the Eurozone. The ECB sets interest rates and manages monetary policy. The ECB’s primary mandate is to maintain price stability, which means either controlling inflation or stimulating growth. Its primary tool is the raising or lowering of interest rates. Relatively high interest rates – or the expectation of higher rates – will usually benefit the Euro and vice versa. The ECB Governing Council makes monetary policy decisions at meetings held eight times a year. Decisions are made by heads of the Eurozone national banks and six permanent members, including the President of the ECB, Christine Lagarde.
Eurozone inflation data, measured by the Harmonized Index of Consumer Prices (HICP), is an important econometric for the Euro. If inflation rises more than expected, especially if above the ECB’s 2% target, it obliges the ECB to raise interest rates to bring it back under control. Relatively high interest rates compared to its counterparts will usually benefit the Euro, as it makes the region more attractive as a place for global investors to park their money.
Data releases gauge the health of the economy and can impact on the Euro. Indicators such as GDP, Manufacturing and Services PMIs, employment, and consumer sentiment surveys can all influence the direction of the single currency. A strong economy is good for the Euro. Not only does it attract more foreign investment but it may encourage the ECB to put up interest rates, which will directly strengthen the Euro. Otherwise, if economic data is weak, the Euro is likely to fall. Economic data for the four largest economies in the euro area (Germany, France, Italy and Spain) are especially significant, as they account for 75% of the Eurozone’s economy.
Another significant data release for the Euro is the Trade Balance. This indicator measures the difference between what a country earns from its exports and what it spends on imports over a given period. If a country produces highly sought after exports then its currency will gain in value purely from the extra demand created from foreign buyers seeking to purchase these goods. Therefore, a positive net Trade Balance strengthens a currency and vice versa for a negative balance.
Here is what you need to know on Friday, July 5:
Following the Independence Day holiday in the US, trading conditions are starting to normalize early Friday. Eurostat will release Retail Sales data for May and later in the day the US Bureau of Labor Statistics will release the June jobs report, which will include Nonfarm Payrolls, Unemployment Rate and wage inflation figures. Statistics Canada will also publish labor market data ahead of the weekend.
The US Dollar (USD) trades under modest bearish pressure as the currency still feels the negative impact of Wednesday's disappointing data releases. The US Dollar Index closed the first four days of the week in negative territory and was last seen posting small losses near 105.00. On a weekly basis, the index was down nearly 0.8%.
US Dollar PRICE This week
The table below shows the percentage change of US Dollar (USD) against listed major currencies this week. US Dollar was the weakest against the Euro.
| USD | EUR | GBP | JPY | CAD | AUD | NZD | CHF | |
|---|---|---|---|---|---|---|---|---|
| USD | -1.05% | -1.02% | 0.03% | -0.49% | -0.96% | -0.36% | 0.04% | |
| EUR | 1.05% | -0.20% | 0.78% | 0.25% | -0.04% | 0.38% | 0.78% | |
| GBP | 1.02% | 0.20% | 0.99% | 0.46% | 0.18% | 0.58% | 0.99% | |
| JPY | -0.03% | -0.78% | -0.99% | -0.54% | -0.94% | -0.40% | 0.02% | |
| CAD | 0.49% | -0.25% | -0.46% | 0.54% | -0.43% | 0.13% | 0.53% | |
| AUD | 0.96% | 0.04% | -0.18% | 0.94% | 0.43% | 0.41% | 0.90% | |
| NZD | 0.36% | -0.38% | -0.58% | 0.40% | -0.13% | -0.41% | 0.43% | |
| CHF | -0.04% | -0.78% | -0.99% | -0.02% | -0.53% | -0.90% | -0.43% |
The heat map shows percentage changes of major currencies against each other. The base currency is picked from the left column, while the quote currency is picked from the top row. For example, if you pick the US Dollar from the left column and move along the horizontal line to the Japanese Yen, the percentage change displayed in the box will represent USD (base)/JPY (quote).
The Labour Party has officially won enough seats in the UK’s 2024 general election to have a majority in parliament, as widely anticipated. Labour Leader Keir Starmer will become the next prime minister. This development don't seem to be having a noticeable impact on Pound Sterling's valuation. At the time of press, GBP/USD was trading marginally higher on the day near 1.2800.
EUR/USD continues to edge higher after posting small gains on Thursday and trades in positive territory above 1.0800 in the European morning on Friday.
USD/CAD stays under bearish pressure and trades near 1.3600 ahead of jobs data from the US and Canada.
USD/JPY extends its correction from the multi-decade high it set near 162.00 earlier in the week and trades below 161.00 to start the European session.
Following Wednesday upsurge, Gold fluctuated in a very narrow channel and closed the day virtually unchanged. XAU/USD gains traction early Friday and trades modestly higher on the day above $2,360.
Economic Indicator
Nonfarm Payrolls
The Nonfarm Payrolls release presents the number of new jobs created in the US during the previous month in all non-agricultural businesses; it is released by the US Bureau of Labor Statistics (BLS). The monthly changes in payrolls can be extremely volatile. The number is also subject to strong reviews, which can also trigger volatility in the Forex board. Generally speaking, a high reading is seen as bullish for the US Dollar (USD), while a low reading is seen as bearish, although previous months' reviews and the Unemployment Rate are as relevant as the headline figure. The market's reaction, therefore, depends on how the market assesses all the data contained in the BLS report as a whole.
Read more.Next release: Fri Jul 05, 2024 12:30
Frequency: Monthly
Consensus: 190K
Previous: 272K
Source: US Bureau of Labor Statistics
America’s monthly jobs report is considered the most important economic indicator for forex traders. Released on the first Friday following the reported month, the change in the number of positions is closely correlated with the overall performance of the economy and is monitored by policymakers. Full employment is one of the Federal Reserve’s mandates and it considers developments in the labor market when setting its policies, thus impacting currencies. Despite several leading indicators shaping estimates, Nonfarm Payrolls tend to surprise markets and trigger substantial volatility. Actual figures beating the consensus tend to be USD bullish.
- USD/CAD depreciates as softer US data raising speculations of the Fed reducing rates in 2024.
- US Nonfarm Payrolls are forecasted to show an increase of 190,000 new jobs, down from the previous reading of 272,000.
- Canada's Net Change in Employment is expected to drop to 22.5K in June, from the prior 26.7K reading.
USD/CAD extends its losing streak for the fourth successive session, trading around 1.3610 during the early European hours on Friday. This decline is attributed the weaker US Dollar (USD), which could be attributed to softer data from the United States (US) raising speculations of the Federal Reserve (Fed) reducing interest rates in 2024.
On Wednesday, US ISM Services PMI fell sharply to 48.8 in June, marking the steepest decline since April 2020. This figure was well below market expectations of 52.5, following a reading of 53.8 in May. The ADP Employment report showed that US private businesses added 150,000 workers to their payrolls in June, the lowest increase in five months. This figure fell short of the expected 160,000 and was below the downwardly revised 157,000 in May.
Traders await the US employment reports on Friday, which are expected to show a slowdown in employment growth in June. The US Nonfarm Payrolls (NFP) are expected to show an increase of 190,000 new jobs, down from the previous reading of 272,000. US Average Hourly Earnings are anticipated to moderate slightly, projected to decrease to 3.9% year-over-year from the prior 4.1% reading.
On the CAD’s front, the modest decline in crude Oil price might limit the upside of the commodity-linked Canadian Dollar (CAD), as Canada is the major crude Oil exporter to the United States. West Texas Intermediate (WTI) Oil price trades around $83.50 per barrel at the time of writing.
Recent data showed that the Organization of Petroleum Exporting Countries (OPEC) increased production in June for the second consecutive month. This indicates a potential easing of tight Oil markets in the coming months, exerting downward pressure on crude Oil prices.
Additionally, the latest Canadian composite PMI of 47.5 signaled a contraction in private-sector output and a reduction in cost pressures, suggesting that the Bank of Canada (BoC) may lower borrowing costs. This could put pressure on the Canadian dollar and support the USD/CAD pair.
On Friday, traders await the Canadian Net Change in Employment, which is expected to drop to 22.5K in June, from the previous reading of 26.7K. Meanwhile, the Canadian Unemployment Rate is projected to tick higher to 6.3% from 6.2%.
Canadian Dollar FAQs
The key factors driving the Canadian Dollar (CAD) are the level of interest rates set by the Bank of Canada (BoC), the price of Oil, Canada’s largest export, the health of its economy, inflation and the Trade Balance, which is the difference between the value of Canada’s exports versus its imports. Other factors include market sentiment – whether investors are taking on more risky assets (risk-on) or seeking safe-havens (risk-off) – with risk-on being CAD-positive. As its largest trading partner, the health of the US economy is also a key factor influencing the Canadian Dollar.
The Bank of Canada (BoC) has a significant influence on the Canadian Dollar by setting the level of interest rates that banks can lend to one another. This influences the level of interest rates for everyone. The main goal of the BoC is to maintain inflation at 1-3% by adjusting interest rates up or down. Relatively higher interest rates tend to be positive for the CAD. The Bank of Canada can also use quantitative easing and tightening to influence credit conditions, with the former CAD-negative and the latter CAD-positive.
The price of Oil is a key factor impacting the value of the Canadian Dollar. Petroleum is Canada’s biggest export, so Oil price tends to have an immediate impact on the CAD value. Generally, if Oil price rises CAD also goes up, as aggregate demand for the currency increases. The opposite is the case if the price of Oil falls. Higher Oil prices also tend to result in a greater likelihood of a positive Trade Balance, which is also supportive of the CAD.
While inflation had always traditionally been thought of as a negative factor for a currency since it lowers the value of money, the opposite has actually been the case in modern times with the relaxation of cross-border capital controls. Higher inflation tends to lead central banks to put up interest rates which attracts more capital inflows from global investors seeking a lucrative place to keep their money. This increases demand for the local currency, which in Canada’s case is the Canadian Dollar.
Macroeconomic data releases gauge the health of the economy and can have an impact on the Canadian Dollar. Indicators such as GDP, Manufacturing and Services PMIs, employment, and consumer sentiment surveys can all influence the direction of the CAD. A strong economy is good for the Canadian Dollar. Not only does it attract more foreign investment but it may encourage the Bank of Canada to put up interest rates, leading to a stronger currency. If economic data is weak, however, the CAD is likely to fall.
- EUR/GBP trades with a mild bearish bias around 0.8475 in Friday’s early European session.
- Labour Party has won 337 seats in the parliamentary election, implying it now holds a majority in the House of Commons.
- Germany’s industrial sector contraction deepened in May.
The EUR/GBP cross trades with mild losses near 0.8475 on Friday during the early European session. The Pound Sterling (GBP) edges higher as the UK’s Labour Party led by Keir Starmer appears to be headed for a huge majority in the 2024 UK election, Reuters reported on Friday. Later in the day, Eurozone Retail Sales for May will be released.
The UK’s opposition Labour Party has won 337 seats in the parliamentary election, implying it now holds a majority in the 650-seat strong House of Commons, Reuters reported on Friday, citing broadcaster ITV. Derek Halpenny, head of FX research at MUFG Bank, believes that a Labour victory may benefit the Pound Sterling (GBP). A large majority would give Labour a strong mandate for governing and potentially lead to greater political stability.
Nonetheless, the expectation that the Bank of England (BoE) will start reducing interest rates from the August meeting might drag the Cable lower.
On the Euro front, data released by Destatis reported Friday that German Industrial Production for May came in weaker than the market expectation. The figure dropped 2.5% MoM in May from a decline of 0.1% in the previous reading. On an annual basis, the German Industrial Production fell 6.7% YoY in May
The Euro (EUR) posts modest losses in response to the weaker in outputs of the German factories. Traders will take more cues from the Eurozone Retail Sale data, which is projected to improve to 0.1% YoY in May.
Pound Sterling FAQs
The Pound Sterling (GBP) is the oldest currency in the world (886 AD) and the official currency of the United Kingdom. It is the fourth most traded unit for foreign exchange (FX) in the world, accounting for 12% of all transactions, averaging $630 billion a day, according to 2022 data. Its key trading pairs are GBP/USD, aka ‘Cable’, which accounts for 11% of FX, GBP/JPY, or the ‘Dragon’ as it is known by traders (3%), and EUR/GBP (2%). The Pound Sterling is issued by the Bank of England (BoE).
The single most important factor influencing the value of the Pound Sterling is monetary policy decided by the Bank of England. The BoE bases its decisions on whether it has achieved its primary goal of “price stability” – a steady inflation rate of around 2%. Its primary tool for achieving this is the adjustment of interest rates. When inflation is too high, the BoE will try to rein it in by raising interest rates, making it more expensive for people and businesses to access credit. This is generally positive for GBP, as higher interest rates make the UK a more attractive place for global investors to park their money. When inflation falls too low it is a sign economic growth is slowing. In this scenario, the BoE will consider lowering interest rates to cheapen credit so businesses will borrow more to invest in growth-generating projects.
Data releases gauge the health of the economy and can impact the value of the Pound Sterling. Indicators such as GDP, Manufacturing and Services PMIs, and employment can all influence the direction of the GBP. A strong economy is good for Sterling. Not only does it attract more foreign investment but it may encourage the BoE to put up interest rates, which will directly strengthen GBP. Otherwise, if economic data is weak, the Pound Sterling is likely to fall.
Another significant data release for the Pound Sterling is the Trade Balance. This indicator measures the difference between what a country earns from its exports and what it spends on imports over a given period. If a country produces highly sought-after exports, its currency will benefit purely from the extra demand created from foreign buyers seeking to purchase these goods. Therefore, a positive net Trade Balance strengthens a currency and vice versa for a negative balance.
FX option expiries for July 5 NY cut at 10:00 Eastern Time, via DTCC, can be found below
- EUR/USD: EUR amounts
- 1.0650 765m
- 1.0675 842m
- 1.0700 2.1b
- 1.0715 1.2b
- 1.0750 1b
- 1.0800 2.9b
- 1.0815 536m
- USD/JPY: USD amounts
- 160.00 587m
- 161.00 450m
- GBP/USD: GBP amounts
- 1.2605 533m
- 1.2660 436m
- 1.2770 405m
- AUD/USD: AUD amounts
- 0.6500 875m
- 0.6625 512m
- 0.6665 780m
- 0.6700 438m
- 0.6750 829m
- 0.6760 855m
- USD/CAD: USD amounts
- 1.3670 401m
- 1.3685 432m
- 1.3690 531m
- 1.3775 406m
- NZD/USD: NZD amounts
- 0.6250 437m
Germany’s industrial sector contraction deepened in May, the latest data published by Destatis showed on Friday.
Industrial output in the Eurozone’s top economy dropped by 2.5% MoM, the federal statistics authority Destatis said in figures adjusted for seasonal and calendar effects, compared with a 0.2% forecast and a 0.1% decline in April.
German Industrial Production plunged at an annual rate of 6.7% in May versus the April slump of 3.9%.
EUR/USD reaction to the German Industrial Production data
The downbeat German industrial figures fails to have any impact on the Euro, as EUR/USD continues to hold higher ground near 1.0820. The pair is up 0.12% on the day, at the press time.
Gold prices rose in India on Friday, according to data compiled by FXStreet.
The price for Gold stood at 6,344.70 Indian Rupees (INR) per gram, up compared with the INR 6,328.16 it cost on Thursday.
The price for Gold increased to INR 74,003.30 per tola from INR 73,810.43 per tola a day earlier.
| Unit measure | Gold Price in INR |
|---|---|
| 1 Gram | 6,344.70 |
| 10 Grams | 63,446.98 |
| Tola | 74,003.30 |
| Troy Ounce | 197,342.30 |
FXStreet calculates Gold prices in India by adapting international prices (USD/INR) to the local currency and measurement units. Prices are updated daily based on the market rates taken at the time of publication. Prices are just for reference and local rates could diverge slightly.
Gold FAQs
Gold has played a key role in human’s history as it has been widely used as a store of value and medium of exchange. Currently, apart from its shine and usage for jewelry, the precious metal is widely seen as a safe-haven asset, meaning that it is considered a good investment during turbulent times. Gold is also widely seen as a hedge against inflation and against depreciating currencies as it doesn’t rely on any specific issuer or government.
Central banks are the biggest Gold holders. In their aim to support their currencies in turbulent times, central banks tend to diversify their reserves and buy Gold to improve the perceived strength of the economy and the currency. High Gold reserves can be a source of trust for a country’s solvency. Central banks added 1,136 tonnes of Gold worth around $70 billion to their reserves in 2022, according to data from the World Gold Council. This is the highest yearly purchase since records began. Central banks from emerging economies such as China, India and Turkey are quickly increasing their Gold reserves.
Gold has an inverse correlation with the US Dollar and US Treasuries, which are both major reserve and safe-haven assets. When the Dollar depreciates, Gold tends to rise, enabling investors and central banks to diversify their assets in turbulent times. Gold is also inversely correlated with risk assets. A rally in the stock market tends to weaken Gold price, while sell-offs in riskier markets tend to favor the precious metal.
The price can move due to a wide range of factors. Geopolitical instability or fears of a deep recession can quickly make Gold price escalate due to its safe-haven status. As a yield-less asset, Gold tends to rise with lower interest rates, while higher cost of money usually weighs down on the yellow metal. Still, most moves depend on how the US Dollar (USD) behaves as the asset is priced in dollars (XAU/USD). A strong Dollar tends to keep the price of Gold controlled, whereas a weaker Dollar is likely to push Gold prices up.
(An automation tool was used in creating this post.)
- USD/CHF drifts lower for the third straight day amid the prevalent USD selling bias.
- Rising bets for a September Fed rate cut move continue to weigh on the Greenback.
- The downside is likely to remain limited as traders await the release of the US NFP.
The USD/CHF pair remains under some selling pressure for the third successive day and slides to a multi-day low, below the 0.9000 psychological mark during the Asian session on Friday. Bearish traders now await a sustained breakdown through the 100-day Simple Moving Average (SMA) before positioning for an extension of the recent pullback from a one-month peak touched earlier this week amid sustained US Dollar (USD) selling.
The incoming softer US macro data pointed to signs of weakness in the labor market and a loss of momentum in the economy at the end of the second quarter. This reaffirms market bets that the Federal Reserve (Fed) will start cutting rates in September and drags the USD Index (DXY), which tracks the Greenback against a basket of currencies, to over a three-week low, which, in turn, is seen as a key factor exerting downward pressure on the USD/CHF pair.
Apart from this, the decline could further be attributed to some repositioning trade ahead of the closely-watched US monthly employment details, due for release later during the North American session. The popularly known Nonfarm Payrolls (NFP) report will play a key role in influencing market expectations about future policy decisions, which, in turn, should drive the USD demand and determine the near-term trajectory for the USD/CHF pair.
Meanwhile, the Swiss Consumer Price Index (CPI), released on Thursday, declined to 1.3% YoY in June as compared to the 1.4% YoY expected. Furthermore, the core gauge ticked lower to the 1.1% yearly rate against the 1.2% anticipated, which could allow the Swiss National Bank (SNB) to ease further. Moreover, the SNB had shown readiness to intervene in the FX market, which should cap the Swiss Franc (CHF) and lend support to the USD/CHF pair.
Fed FAQs
Monetary policy in the US is shaped by the Federal Reserve (Fed). The Fed has two mandates: to achieve price stability and foster full employment. Its primary tool to achieve these goals is by adjusting interest rates. When prices are rising too quickly and inflation is above the Fed’s 2% target, it raises interest rates, increasing borrowing costs throughout the economy. This results in a stronger US Dollar (USD) as it makes the US a more attractive place for international investors to park their money. When inflation falls below 2% or the Unemployment Rate is too high, the Fed may lower interest rates to encourage borrowing, which weighs on the Greenback.
The Federal Reserve (Fed) holds eight policy meetings a year, where the Federal Open Market Committee (FOMC) assesses economic conditions and makes monetary policy decisions. The FOMC is attended by twelve Fed officials – the seven members of the Board of Governors, the president of the Federal Reserve Bank of New York, and four of the remaining eleven regional Reserve Bank presidents, who serve one-year terms on a rotating basis.
In extreme situations, the Federal Reserve may resort to a policy named Quantitative Easing (QE). QE is the process by which the Fed substantially increases the flow of credit in a stuck financial system. It is a non-standard policy measure used during crises or when inflation is extremely low. It was the Fed’s weapon of choice during the Great Financial Crisis in 2008. It involves the Fed printing more Dollars and using them to buy high grade bonds from financial institutions. QE usually weakens the US Dollar.
Quantitative tightening (QT) is the reverse process of QE, whereby the Federal Reserve stops buying bonds from financial institutions and does not reinvest the principal from the bonds it holds maturing, to purchase new bonds. It is usually positive for the value of the US Dollar.
- USD/JPY faces some selling pressure near 160.65 in Friday’s Asian session.
- The verbal intervention from Japanese authorities provides some support to the JPY.
- Rising odds of Fed rate cuts weigh on the US Dollar, while Fed’s cautious tone might cap the USD’s downside.
The USD/JPY pair atrracts some sellers around 160.65 during the Asian session on Friday. The sell-off in the pair is driven by verbal intervention from Japanese authorities and softer US Dollar (USD). The US June Nonfarm Payrolls (NFP) will be in the spotlight on Friday, which is expected to show 190K jobs added in June.
Japan’s Finance Minister Shunichi Suzuki said on Friday that the weak Japanese Yen (JPY) is pushing up import costs and having an impact on prices. Suzuki further stated that he“will closely monitor stock and forex markets with vigilance.” This verbal intervention lifts the JPY and acts as a headwind for USD/JPY.
However, any significant appreciation of JPY might be limited amid a dovish stance by the Bank of Japan (BoJ). The Japanese central bank remains reluctant to provide a detailed plan for the reduction of bond purchases and further rate hikes.
On the USD’s front, the rising odds that the US Fed will start easing the cycle in September drags the Greenback to over a three-week low around the 105.00 support level. According to the CME FedWatch Tool, financial markets are now pricing in nearly 70% odds for a 25 basis points (bps) Fed rate cut in September, up from 58.2% last Friday, according to the CME FedWatch Tool.
On the other hand, the cautious stance from the Fed officials and the June FOMC policy meeting might boost the USD. Fed officials lacked the confidence they needed to cut the interest rate, while several policymakers stated that it’s necessary to hike again if inflation were to rebound.
Japanese Yen FAQs
The Japanese Yen (JPY) is one of the world’s most traded currencies. Its value is broadly determined by the performance of the Japanese economy, but more specifically by the Bank of Japan’s policy, the differential between Japanese and US bond yields, or risk sentiment among traders, among other factors.
One of the Bank of Japan’s mandates is currency control, so its moves are key for the Yen. The BoJ has directly intervened in currency markets sometimes, generally to lower the value of the Yen, although it refrains from doing it often due to political concerns of its main trading partners. The current BoJ ultra-loose monetary policy, based on massive stimulus to the economy, has caused the Yen to depreciate against its main currency peers. This process has exacerbated more recently due to an increasing policy divergence between the Bank of Japan and other main central banks, which have opted to increase interest rates sharply to fight decades-high levels of inflation.
The BoJ’s stance of sticking to ultra-loose monetary policy has led to a widening policy divergence with other central banks, particularly with the US Federal Reserve. This supports a widening of the differential between the 10-year US and Japanese bonds, which favors the US Dollar against the Japanese Yen.
The Japanese Yen is often seen as a safe-haven investment. This means that in times of market stress, investors are more likely to put their money in the Japanese currency due to its supposed reliability and stability. Turbulent times are likely to strengthen the Yen’s value against other currencies seen as more risky to invest in.
- US Nonfarm Payrolls are expected to rise 190K in June, slowing from May’s 272K increase.
- The United States Bureau of Labor Statistics will release the Employment report at 12:30 GMT.
- The US Dollar awaits employment data after Fed Chair Jerome Powell’s dovish remarks on Tuesday.
With US Federal Reserve (Fed) Chairman Jerome Powell’s Sintra appearance out of the way, all eyes now remain on top-tier Nonfarm Payrolls (NFP) data for June, due on Friday at 12:30 GMT.
The Bureau of Labor Statistics (BLS) will release the US labor market data, which could offer cues on the timing of the Fed’s first interest-rate cut this year and the US Dollar’s (USD) next direction.
What to expect in the next Nonfarm Payrolls report?
The Nonfarm Payrolls report is set to show that the US economy created 190,000 jobs in June after having added 272,000 in May.
The Unemployment Rate will likely hold steady at 4.0% in the same period. Meanwhile, a closely-watched measure of wage inflation, Average Hourly Earnings, is seen increasing by 3.9% in the year through June following May’s growth of 4.1%.
Markets are set to analyze these key data sets closely, as they could provide a fresh guide to the possible timing of the Fed’s dovish pivot.
Markets scaled up their expectations for a Fed rate cut in September after Tuesday’s Chairman Jerome Powell’s commentary at the European Central Bank (ECB) Forum on Central Banking in Sintra.
Powell sounded quite optimistic about the recent encouraging inflation reports but said he needed more data before considering rate cuts. Markets perceived his acknowledgment of the progress in the disinflationary trend as dovish.
Meanwhile, the US private sector added 150,000 jobs in June, a modest decrease from the upwardly revised 157,000 figure in May, the ADP reported on Wednesday. The data missed the analysts’ estimates of a 160,000 job addition. It’s worth mentioning that NFP has outperformed ADP in nine out of the past ten months.
Fed Chair Powell’s dovish commentary, combined with weak US employment data, ramped up bets for a rate cut by the US central bank in September, with markets now seeing a 73% chance against a 64% probability seen early Tuesday.
Previewing the June employment situation report, BBH analysts said: “Bloomberg consensus is 190k vs. 272k in May, while its whisper number stands at 198k currently. For reference, the average gain over the past 12 months is 232k. The unemployment rate is expected to remain steady at 4.0% even as the participation rate is expected to rise a tick to 62.6%. With the labor market in better alignment, the pace of wage growth will be a bigger driver of Fed expectations. Average hourly earnings are forecast to rise 0.3% MoM, with the YoY rate expected to fall two ticks to 3.9.”
How will US June Nonfarm Payrolls affect EUR/USD?
The return of the doves smashed the US Dollar across the board alongside the US Treasury bond yields, driving the EUR/USD pair briefly above the 1.0800 threshold. Attention now turns to the US NFP report to affirm the loosening labor market conditions and the disinflationary trend in wage inflation.
A stronger-than-expected NFP headline figure, along with hot wage inflation data, could push back against the renewed bets of a September Fed rate cut, offering a fresh life to the US Dollar. This, in turn, could trigger a correction in the EUR/USD pair toward 1.0700. However, if the US employment data strongly indicates labor market slack, the Greenback could see a fresh leg down on a potential confirmation that the Fed will lower rates in September. In such a case, EUR/USD could surge past the 1.0850 level.
Dhwani Mehta, Analyst at FXStreet, offers a brief technical outlook for EUR/USD:
“The EUR/USD pair is battling at around 1.0790, where the critical 200-day Simple Moving Average (SMA) and the 100-day SMA coincide. The 14-day Relative Strength Index (RSI) sits above the 50 level, near 54, suggesting that upside potential remains intact.”
“Buyers need to find acceptance above the convergence of the 200-day and 100-day SMAs, for an extended recovery. The next topside barriers for EUR/USD will then be seen at the June 12 high of 1.0852 and the 1.0900 round figure. Conversely, the initial demand area is seen at 21-day SMA at 1.0746, below which the 1.0700 level will be tested en route to the June low of 1.0660,” Dhwani adds.
Economic Indicator
Nonfarm Payrolls
The Nonfarm Payrolls release presents the number of new jobs created in the US during the previous month in all non-agricultural businesses; it is released by the US Bureau of Labor Statistics (BLS). The monthly changes in payrolls can be extremely volatile. The number is also subject to strong reviews, which can also trigger volatility in the Forex board. Generally speaking, a high reading is seen as bullish for the US Dollar (USD), while a low reading is seen as bearish, although previous months' reviews and the Unemployment Rate are as relevant as the headline figure. The market's reaction, therefore, depends on how the market assesses all the data contained in the BLS report as a whole.
Read more.Next release: Fri Jul 05, 2024 12:30
Frequency: Monthly
Consensus: 190K
Previous: 272K
Source: US Bureau of Labor Statistics
America’s monthly jobs report is considered the most important economic indicator for forex traders. Released on the first Friday following the reported month, the change in the number of positions is closely correlated with the overall performance of the economy and is monitored by policymakers. Full employment is one of the Federal Reserve’s mandates and it considers developments in the labor market when setting its policies, thus impacting currencies. Despite several leading indicators shaping estimates, Nonfarm Payrolls tend to surprise markets and trigger substantial volatility. Actual figures beating the consensus tend to be USD bullish.
Nonfarm Payrolls FAQs
Nonfarm Payrolls (NFP) are part of the US Bureau of Labor Statistics monthly jobs report. The Nonfarm Payrolls component specifically measures the change in the number of people employed in the US during the previous month, excluding the farming industry.
The Nonfarm Payrolls figure can influence the decisions of the Federal Reserve by providing a measure of how successfully the Fed is meeting its mandate of fostering full employment and 2% inflation. A relatively high NFP figure means more people are in employment, earning more money and therefore probably spending more. A relatively low Nonfarm Payrolls’ result, on the either hand, could mean people are struggling to find work. The Fed will typically raise interest rates to combat high inflation triggered by low unemployment, and lower them to stimulate a stagnant labor market.
Nonfarm Payrolls generally have a positive correlation with the US Dollar. This means when payrolls’ figures come out higher-than-expected the USD tends to rally and vice versa when they are lower. NFPs influence the US Dollar by virtue of their impact on inflation, monetary policy expectations and interest rates. A higher NFP usually means the Federal Reserve will be more tight in its monetary policy, supporting the USD.
Nonfarm Payrolls are generally negatively-correlated with the price of Gold. This means a higher-than-expected payrolls’ figure will have a depressing effect on the Gold price and vice versa. Higher NFP generally has a positive effect on the value of the USD, and like most major commodities Gold is priced in US Dollars. If the USD gains in value, therefore, it requires less Dollars to buy an ounce of Gold. Also, higher interest rates (typically helped higher NFPs) also lessen the attractiveness of Gold as an investment compared to staying in cash, where the money will at least earn interest.
Nonfarm Payrolls is only one component within a bigger jobs report and it can be overshadowed by the other components. At times, when NFP come out higher-than-forecast, but the Average Weekly Earnings is lower than expected, the market has ignored the potentially inflationary effect of the headline result and interpreted the fall in earnings as deflationary. The Participation Rate and the Average Weekly Hours components can also influence the market reaction, but only in seldom events like the “Great Resignation” or the Global Financial Crisis.
The UK’s opposition Labour Party has won 337 seats in the parliamentary election so far, implying it now holds a majority in the 650-seat strong House of Commons, Reuters reported on Friday, citing broadcaster ITV.
326 seats are needed for a working majority in the House of Commons.
British Prime Minister Rishi Sunak conceded defeat in the national election, saying that “the Labour Party has won this general election and I have called Sir Keir Starmer to congratulate him on his victory.”
In his victory speech, Labour Party leader and the Prime Minister-elect Keir Starmer said, “today we start the next chapter -- begin the work of change, the mission of national renewal and start to rebuild our country.”
Starmer will replace Sunak as Prime Minister, ending 14 years of Conservative rule.
Market reaction
The UK election results fail to move the needle around the Pound Sterling, as GBP/USD keeps its range above 1.2750, as of writing.
- EUR/USD may test the upper boundary of the ascending channel around the level of 1.0870.
- The 14-day RSI suggests a confirmation of a bullish trend for the pair.
- The pair could find key support around the nine-day EMA at the 1.0766 level.
EUR/USD continues its winning streak for the seventh successive day, trading around 1.0820 during the Asian hours on Friday. A technical analysis of the daily chart indicates a bullish bias, with the pair oscillating within an ascending channel.
Additionally, the momentum indicator 14-day Relative Strength Index (RSI) is positioned above the 50 level, suggesting a confirmation of a bullish trend for the EUR/USD pair. Further, an increase toward the 70 level may strengthen the bullish bias for the pair.
The EUR/USD pair may encounter resistance at the upper boundary of the ascending channel around the level of 1.0870, followed by the psychological level of 1.0900. A break above the latter could strengthen the pair to revisit the three-month high of 1.0915.
On the downside, the EUR/USD pair may test the key support around the nine-day Exponential Moving Average (EMA) at 1.0766, followed by the lower boundary of the ascending channel around the level of 1.0730.
A break below the latter could exert downward pressure on the EUR/USD pair to navigate the region around the key level of 1.0670, which could act as a throwback support.
EUR/USD: Daily Chart
Euro FAQs
The Euro is the currency for the 20 European Union countries that belong to the Eurozone. It is the second most heavily traded currency in the world behind the US Dollar. In 2022, it accounted for 31% of all foreign exchange transactions, with an average daily turnover of over $2.2 trillion a day. EUR/USD is the most heavily traded currency pair in the world, accounting for an estimated 30% off all transactions, followed by EUR/JPY (4%), EUR/GBP (3%) and EUR/AUD (2%).
The European Central Bank (ECB) in Frankfurt, Germany, is the reserve bank for the Eurozone. The ECB sets interest rates and manages monetary policy. The ECB’s primary mandate is to maintain price stability, which means either controlling inflation or stimulating growth. Its primary tool is the raising or lowering of interest rates. Relatively high interest rates – or the expectation of higher rates – will usually benefit the Euro and vice versa. The ECB Governing Council makes monetary policy decisions at meetings held eight times a year. Decisions are made by heads of the Eurozone national banks and six permanent members, including the President of the ECB, Christine Lagarde.
Eurozone inflation data, measured by the Harmonized Index of Consumer Prices (HICP), is an important econometric for the Euro. If inflation rises more than expected, especially if above the ECB’s 2% target, it obliges the ECB to raise interest rates to bring it back under control. Relatively high interest rates compared to its counterparts will usually benefit the Euro, as it makes the region more attractive as a place for global investors to park their money.
Data releases gauge the health of the economy and can impact on the Euro. Indicators such as GDP, Manufacturing and Services PMIs, employment, and consumer sentiment surveys can all influence the direction of the single currency. A strong economy is good for the Euro. Not only does it attract more foreign investment but it may encourage the ECB to put up interest rates, which will directly strengthen the Euro. Otherwise, if economic data is weak, the Euro is likely to fall. Economic data for the four largest economies in the euro area (Germany, France, Italy and Spain) are especially significant, as they account for 75% of the Eurozone’s economy.
Another significant data release for the Euro is the Trade Balance. This indicator measures the difference between what a country earns from its exports and what it spends on imports over a given period. If a country produces highly sought after exports then its currency will gain in value purely from the extra demand created from foreign buyers seeking to purchase these goods. Therefore, a positive net Trade Balance strengthens a currency and vice versa for a negative balance.
- Silver is seen consolidating its recent gains to a two-week top touched on Wednesday.
- The technical setup favors bullish traders and supports prospects for a further move up.
- Dips towards the $30.00 mark might be seen as a buying opportunity and remain limited.
Silver (XAG/USD) extends its sideways consolidative price move during the Asian session on Friday and currently trades near the $30.50 area, or its highest level since June 21 touched earlier this week. Nevertheless, the white metal remains on track to register strong weekly gains as traders keenly await the release of the US Nonfarm Payrolls (NFP) report before placing fresh directional bets.
From a technical perspective, the recent goodish rebound from levels below the $28.80-$28.70 horizontal resistance breakpoint-turned-support and the subsequent move beyond the $30.00 psychological mark favors bullish traders. Moreover, the XAG/USD is holding comfortably above the key daily moving averages – 50-day, 100-day and 200-day Simple Moving Averages (SMA). This, along with the fact that oscillators on the daily chart have just started gaining positive traction, suggests that the path of least resistance for the metal is to the upside.
Some follow-through buying beyond the weekly top, around the $30.70 region touched on Wednesday, will reaffirm the positive bias and lift the XAG/USD beyond the $31.00 mark, towards the next relevant hurdle near the $31.50-$31.55 area. The upward trajectory could extend further and allow bulls to reclaim the $32.00 round figure before aiming to challenge the $32.50 region, or over a one-decade peak touched in May.
On the flip side, any meaningful corrective slide is more likely to attract fresh buyers near the $30.00 round figure. This should help limit the downside for the XAG/USD near the $29.75-$29.70 resistance-turned-support. The latter should act as a pivotal point, which if broken decisively might prompt some technical selling and accelerate the fall towards the $29.10-$29.00 region. Some follow-through selling below the $28.80-$28.70 key support zone will negate the constructive outlook and shift the near-term bias in favor of bearish traders.
Silver daily chart
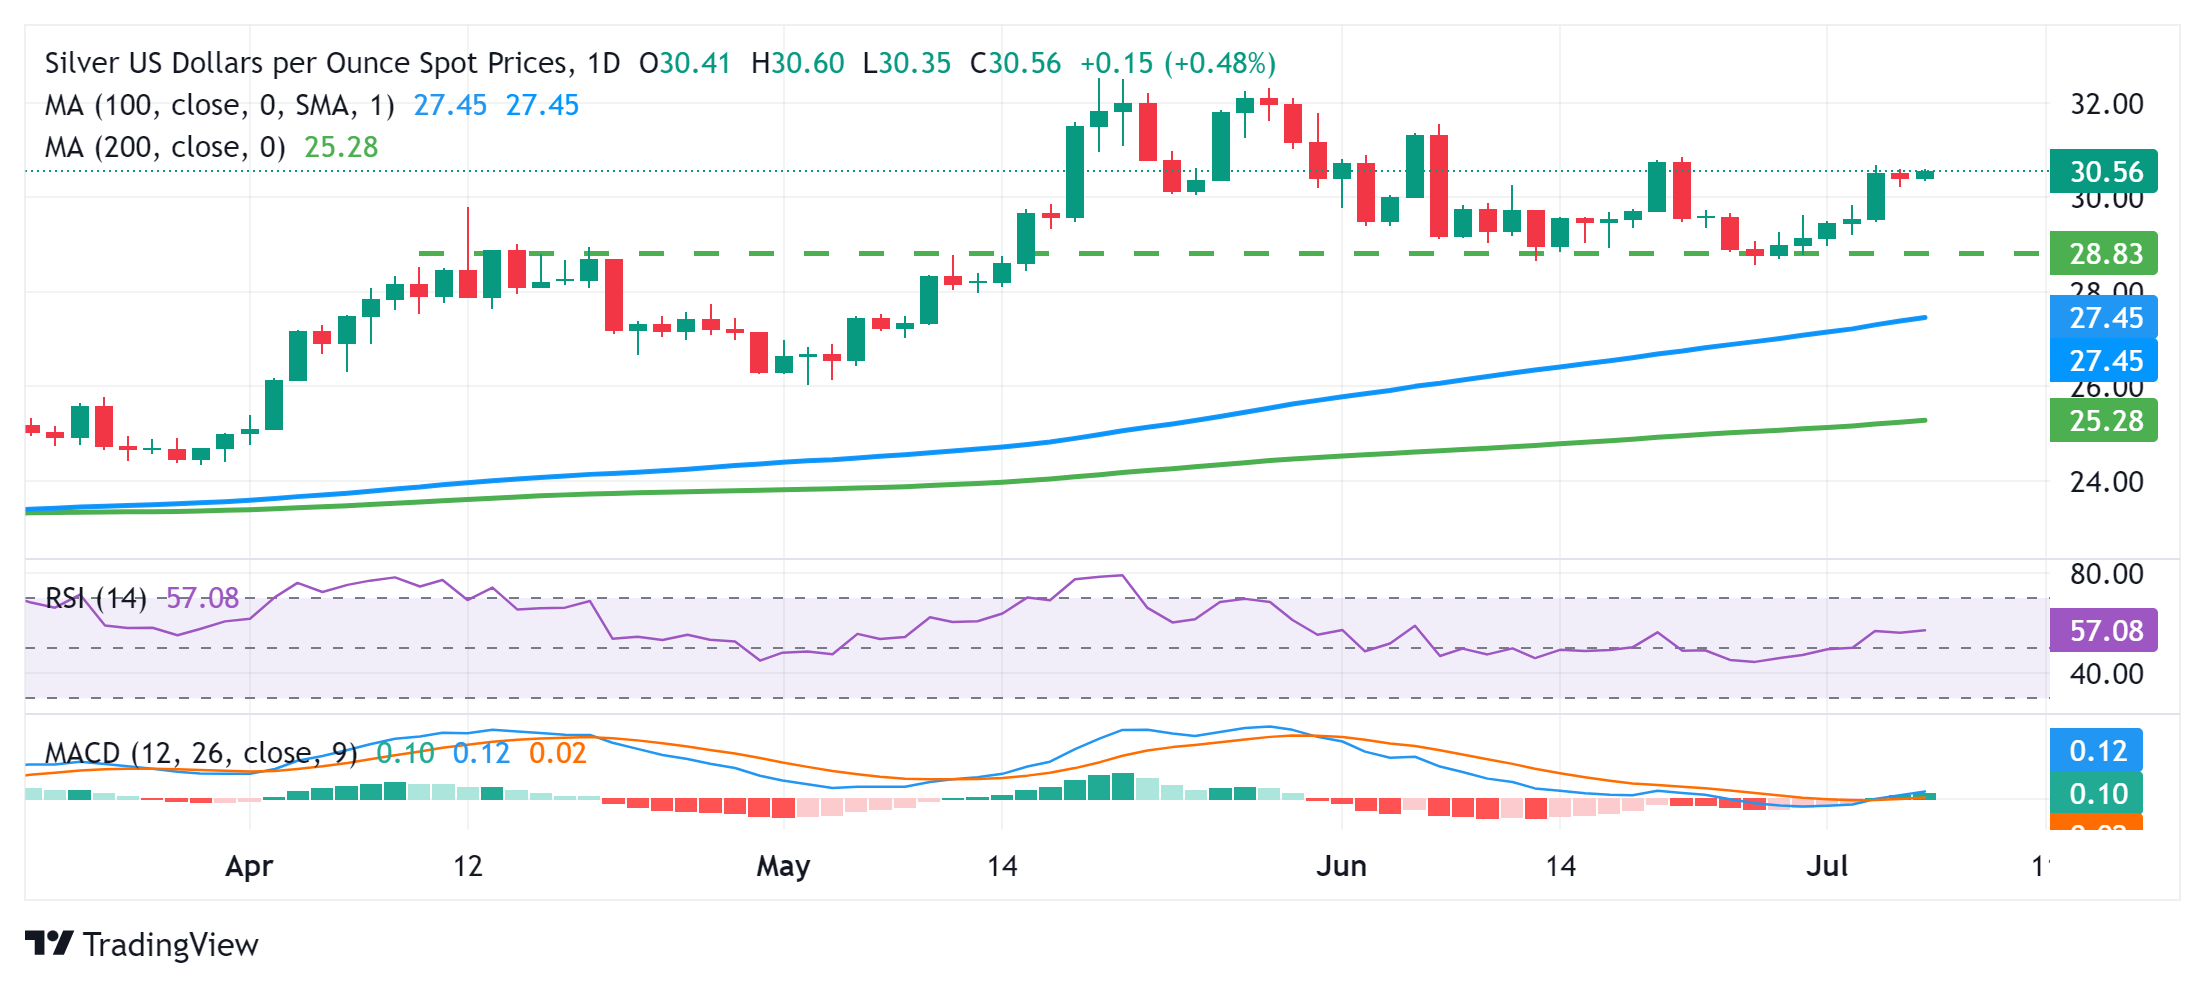
Silver FAQs
Silver is a precious metal highly traded among investors. It has been historically used as a store of value and a medium of exchange. Although less popular than Gold, traders may turn to Silver to diversify their investment portfolio, for its intrinsic value or as a potential hedge during high-inflation periods. Investors can buy physical Silver, in coins or in bars, or trade it through vehicles such as Exchange Traded Funds, which track its price on international markets.
Silver prices can move due to a wide range of factors. Geopolitical instability or fears of a deep recession can make Silver price escalate due to its safe-haven status, although to a lesser extent than Gold's. As a yieldless asset, Silver tends to rise with lower interest rates. Its moves also depend on how the US Dollar (USD) behaves as the asset is priced in dollars (XAG/USD). A strong Dollar tends to keep the price of Silver at bay, whereas a weaker Dollar is likely to propel prices up. Other factors such as investment demand, mining supply – Silver is much more abundant than Gold – and recycling rates can also affect prices.
Silver is widely used in industry, particularly in sectors such as electronics or solar energy, as it has one of the highest electric conductivity of all metals – more than Copper and Gold. A surge in demand can increase prices, while a decline tends to lower them. Dynamics in the US, Chinese and Indian economies can also contribute to price swings: for the US and particularly China, their big industrial sectors use Silver in various processes; in India, consumers’ demand for the precious metal for jewellery also plays a key role in setting prices.
Silver prices tend to follow Gold's moves. When Gold prices rise, Silver typically follows suit, as their status as safe-haven assets is similar. The Gold/Silver ratio, which shows the number of ounces of Silver needed to equal the value of one ounce of Gold, may help to determine the relative valuation between both metals. Some investors may consider a high ratio as an indicator that Silver is undervalued, or Gold is overvalued. On the contrary, a low ratio might suggest that Gold is undervalued relative to Silver.
- The Pound Sterling strengthens as UK election results are being declared, anticipating a decisive victory for Keir Starmer's Labour Party.
- UK exit polls predict the Labour Party will win 410 seats in the 650-seat House of Commons.
- The forecast for US Nonfarm Payrolls suggests an increase of 190,000 new jobs, down from the previous reading of 272,000.
The Pound Sterling (GBP) continues its winning streak on Friday. As UK election results are being declared, exit polls predict a landslide victory for Keir Starmer's Labour Party, expected to win 410 seats in the 650-seat House of Commons, while the Conservatives are projected to secure 131 seats. The outcome of the election should be clear by early Friday.
Derek Halpenny, head of FX research at MUFG Bank Ltd., suggests that a Labour landslide could be advantageous for the Pound Sterling. A substantial majority would grant Labour a strong mandate for governance, potentially leading to greater political stability.
Read More: How could the UK general election impact the Pound Sterling?
The US Dollar (USD) struggles due to softer US data, fueling speculation that the Federal Reserve (Fed) might reduce interest rates in 2024. The key highlight on Friday will be the release of US employment reports, which are expected to show a slowdown in employment growth in June. The US Nonfarm Payrolls (NFP) are expected to show an increase of 190,000 new jobs, down from the previous reading of 272,000.
Daily Digest Market Movers: Pound Sterling rises as US data raise odds of Fed rate cuts
- The ADP Employment report showed that US private businesses added 150,000 workers to their payrolls in June, the lowest increase in five months. This figure fell short of the expected 160,000 and was below the downwardly revised 157,000 in May.
- US ISM Services PMI fell sharply to 48.8 in June, marking the steepest decline since April 2020. This figure was well below market expectations of 52.5, following a reading of 53.8 in May.
- Federal Reserve Bank of Chicago President Austan Goolsbee stated on BBC Radio on Wednesday that bringing inflation back to 2% will take time and that more economic data are needed. However, on Tuesday, Fed Chair Jerome Powell said that the central bank is getting back on the disinflationary path, per Reuters.
- The Minutes from the Federal Reserve's June 11-12 monetary policy meeting, released on Wednesday, suggested that Fed officials were in a wait-and-see mode. Some participants emphasized the Committee’s data-dependent approach, with monetary policy decisions being conditional on the evolution of the economy rather than being on a preset path.
- The Pound Sterling (GBP) continues to gain ground as BoE policymakers remain concerned about persistent inflation in the UK service sector, preventing them from considering policy easing. In contrast, inflation in other sectors has significantly declined due to weak demand from both domestic and overseas markets.
Technical Analysis: Pound Sterling holds position around 1.2750
The GBP/USD pair trades around 1.2760 on Friday. The analysis of the daily chart indicates a bearish bias, with the pair consolidating within a descending channel. However, the 14-day Relative Strength Index (RSI) is above the 50 level, suggesting that any further increase could weaken the bearish outlook.
The GBP/USD pair may challenge the upper boundary of the descending channel near the 1.2780 level. A breakthrough above this level could potentially push the pair to test the June high around 1.2860.
On the downside, a significant support level is noted at the 21-day Exponential Moving Average (EMA) at 1.2701. If this level is breached, it may exert downward pressure on the GBP/USD pair toward the vicinity of the lower boundary of the descending channel, approximately around 1.2612.
GBP/USD: Daily Chart
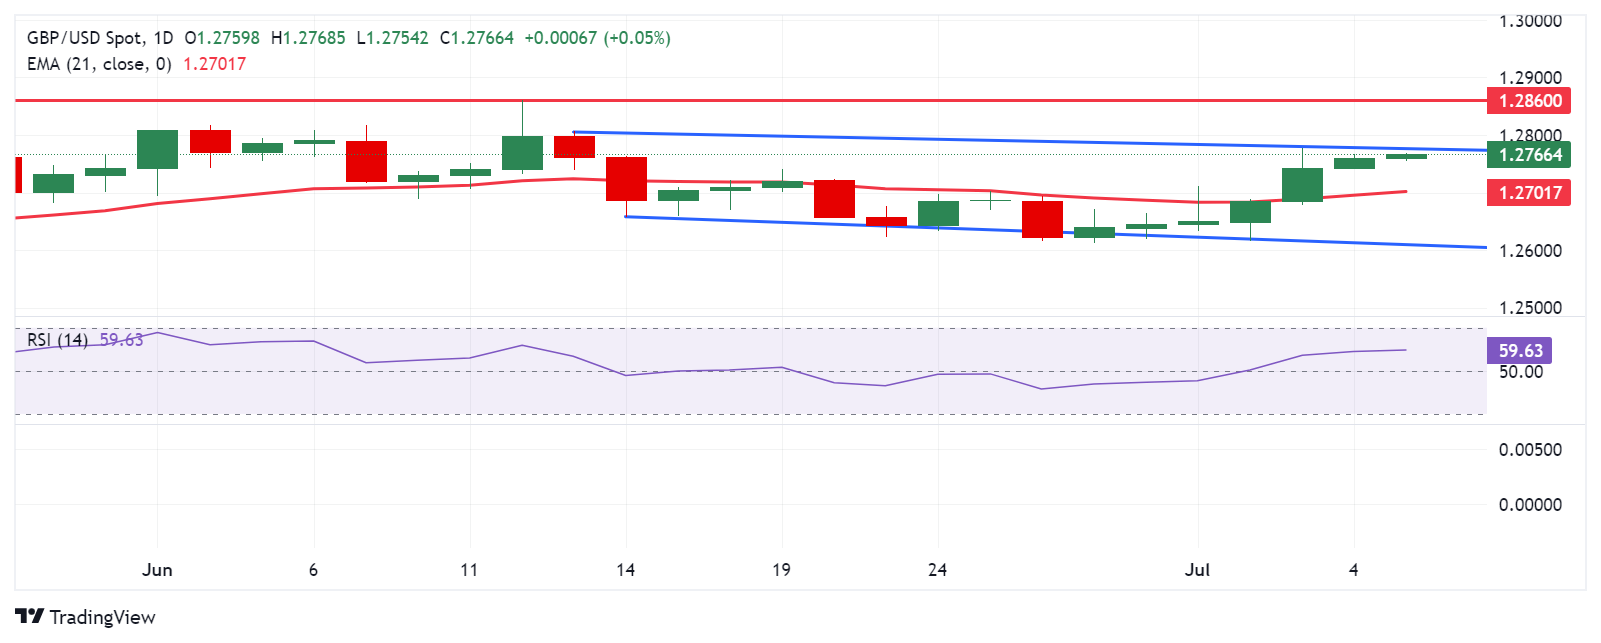
British Pound PRICE Today
The table below shows the percentage change of British Pound (GBP) against listed major currencies today. British Pound was the strongest against the US Dollar.
| USD | EUR | GBP | JPY | CAD | AUD | NZD | CHF | |
|---|---|---|---|---|---|---|---|---|
| USD | -0.11% | -0.08% | -0.42% | -0.04% | -0.14% | -0.07% | -0.17% | |
| EUR | 0.11% | 0.03% | -0.31% | 0.09% | -0.03% | 0.05% | -0.07% | |
| GBP | 0.08% | -0.03% | -0.31% | 0.07% | -0.04% | 0.02% | -0.11% | |
| JPY | 0.42% | 0.31% | 0.31% | 0.37% | 0.29% | 0.33% | 0.23% | |
| CAD | 0.04% | -0.09% | -0.07% | -0.37% | -0.12% | -0.04% | -0.17% | |
| AUD | 0.14% | 0.03% | 0.04% | -0.29% | 0.12% | 0.07% | -0.05% | |
| NZD | 0.07% | -0.05% | -0.02% | -0.33% | 0.04% | -0.07% | -0.13% | |
| CHF | 0.17% | 0.07% | 0.11% | -0.23% | 0.17% | 0.05% | 0.13% |
The heat map shows percentage changes of major currencies against each other. The base currency is picked from the left column, while the quote currency is picked from the top row. For example, if you pick the British Pound from the left column and move along the horizontal line to the US Dollar, the percentage change displayed in the box will represent GBP (base)/USD (quote).
Pound Sterling FAQs
The Pound Sterling (GBP) is the oldest currency in the world (886 AD) and the official currency of the United Kingdom. It is the fourth most traded unit for foreign exchange (FX) in the world, accounting for 12% of all transactions, averaging $630 billion a day, according to 2022 data. Its key trading pairs are GBP/USD, aka ‘Cable’, which accounts for 11% of FX, GBP/JPY, or the ‘Dragon’ as it is known by traders (3%), and EUR/GBP (2%). The Pound Sterling is issued by the Bank of England (BoE).
The single most important factor influencing the value of the Pound Sterling is monetary policy decided by the Bank of England. The BoE bases its decisions on whether it has achieved its primary goal of “price stability” – a steady inflation rate of around 2%. Its primary tool for achieving this is the adjustment of interest rates. When inflation is too high, the BoE will try to rein it in by raising interest rates, making it more expensive for people and businesses to access credit. This is generally positive for GBP, as higher interest rates make the UK a more attractive place for global investors to park their money. When inflation falls too low it is a sign economic growth is slowing. In this scenario, the BoE will consider lowering interest rates to cheapen credit so businesses will borrow more to invest in growth-generating projects.
Data releases gauge the health of the economy and can impact the value of the Pound Sterling. Indicators such as GDP, Manufacturing and Services PMIs, and employment can all influence the direction of the GBP. A strong economy is good for Sterling. Not only does it attract more foreign investment but it may encourage the BoE to put up interest rates, which will directly strengthen GBP. Otherwise, if economic data is weak, the Pound Sterling is likely to fall.
Another significant data release for the Pound Sterling is the Trade Balance. This indicator measures the difference between what a country earns from its exports and what it spends on imports over a given period. If a country produces highly sought-after exports, its currency will benefit purely from the extra demand created from foreign buyers seeking to purchase these goods. Therefore, a positive net Trade Balance strengthens a currency and vice versa for a negative balance.
- GBP/JPY attracts sellers for the second straight day, though the downside seems limited.
- Intervention fears prompt some JPY short-covering and exert pressure on spot prices.
- The BoJ’s dovish stance and the risk-on mood warrant some caution for aggressive bears.
The GBP/JPY cross drifts lower for the second straight day on Friday and moves away from its highest level since August 2008, around the 206.15 area touched earlier this week. Spot prices currently trade just above the 205.00 psychological mark, down nearly 0.35% for the day amid fears that Japanese authorities or the Bank of Japan (BoJ) might intervene in the markets to prop up the domestic currency.
In fact, Japan’s Finance Minister Shunichi Suzuki cross the wires earlier today and said that he will closely monitor stock and forex markets with vigilance, adding that a weak Japanese Yen (JPY) is having an impact on prices. That said, any meaningful JPY appreciation still seems elusive in the wake of a dovish stance adopted by the Bank of Japan (BoJ), which, so far, has been reluctant to provide a detailed plan for the reduction of bond purchases and further rate increases. Apart from this, the prevalent risk-on environment should cap the safe-haven JPY and limit losses for the GBP/JPY cross.
The British Pound (GBP), on the other hand, gets a minor boost after exit polls suggested that Britain’s main opposition Labour Party was set to win a massive majority in the UK general election. Meanwhile, the outcome sets the stage for a rate cut by the Bank of England (BoE) in August, which should act as a headwind for the Sterling and the GBP/JPY cross. Furthermore, the overbought Relative Strength Index (RSI) on the daily chart might prompt some profit-taking heading into the weekend. Nevertheless, spot prices seem poised to end in the positive territory for the fourth successive week.
Pound Sterling FAQs
The Pound Sterling (GBP) is the oldest currency in the world (886 AD) and the official currency of the United Kingdom. It is the fourth most traded unit for foreign exchange (FX) in the world, accounting for 12% of all transactions, averaging $630 billion a day, according to 2022 data. Its key trading pairs are GBP/USD, aka ‘Cable’, which accounts for 11% of FX, GBP/JPY, or the ‘Dragon’ as it is known by traders (3%), and EUR/GBP (2%). The Pound Sterling is issued by the Bank of England (BoE).
The single most important factor influencing the value of the Pound Sterling is monetary policy decided by the Bank of England. The BoE bases its decisions on whether it has achieved its primary goal of “price stability” – a steady inflation rate of around 2%. Its primary tool for achieving this is the adjustment of interest rates. When inflation is too high, the BoE will try to rein it in by raising interest rates, making it more expensive for people and businesses to access credit. This is generally positive for GBP, as higher interest rates make the UK a more attractive place for global investors to park their money. When inflation falls too low it is a sign economic growth is slowing. In this scenario, the BoE will consider lowering interest rates to cheapen credit so businesses will borrow more to invest in growth-generating projects.
Data releases gauge the health of the economy and can impact the value of the Pound Sterling. Indicators such as GDP, Manufacturing and Services PMIs, and employment can all influence the direction of the GBP. A strong economy is good for Sterling. Not only does it attract more foreign investment but it may encourage the BoE to put up interest rates, which will directly strengthen GBP. Otherwise, if economic data is weak, the Pound Sterling is likely to fall.
Another significant data release for the Pound Sterling is the Trade Balance. This indicator measures the difference between what a country earns from its exports and what it spends on imports over a given period. If a country produces highly sought-after exports, its currency will benefit purely from the extra demand created from foreign buyers seeking to purchase these goods. Therefore, a positive net Trade Balance strengthens a currency and vice versa for a negative balance.
- The Indian Rupee loses traction in Friday’s Asian session.
- Higher crude oil prices and persistent local US Dollar (USD) demand weigh on the INR.
- Investors await the US June employment data on Friday for fresh impetus.
The Indian Rupee (INR) weakens on Friday amid elevated crude oil prices and local US Dollar (USD) demand. Pressure on the Japanese Yen and Chinese Yuan had put Asian peers on the defensive in previous trading sessions, but the recent discouraging US economic data helped to alleviate the INR’s depreciation.
Market players will closely monitor the US June employment data on Friday, including Nonfarm Payrolls, Unemployment Rate, and Average Hourly Earnings. These figures might offer some hints about the Federal Reserve’s (Fed) policy rates trajectory. In the case of the weaker-than-expected reading, this could fuel the Fed rate cut expectation, which exerts some selling pressure on the Greenback.
Daily Digest Market Movers: Indian Rupee remains vulnerable amid global headwinds
- The outlook for India’s stock market performance in the coming decade is bright, buoyed by optimism about the country’s economic prospects after last month’s general election results, according to analysts citing WSJ.
- India’s statistics ministry last week raised its GDP growth forecast to 7.6% in its second revised estimate, up from 7.3% in the first advance forecast.
- The Fed officials emphasized the data-dependent approach and refrained from committing to interest rate cuts until further observation. Several policymakers stated that it’s necessary to hike again if inflation were to rebound, according to the Minutes of the FOMC meeting on June 11-12.
- Traders are now pricing in nearly 70% odds for a 25 basis points (bps) Fed rate cut in September, up from 58.2% last Friday, according to the CME FedWatch Tool.
- The US Nonfarm Payrolls is expected to show 190K jobs added in June, below the previous reading of 272K. The Unemployment Rate is projected to remain unchanged at 4%. Finally, the Average Hourly Earnings are forecast to drop to 3.9% YoY in June from 4.1% in May.
Technical analysis: USD/INR remains confined in a familiar range in the near term
The Indian Rupee trades on a weaker note on the day. The USD/INR pair keeps the bullish vibe on the daily timeframe as it holds above the key 100-day Exponential Moving Average (EMA).
However, in the near term, USD/INR has oscillated within the familiar trading range for a couple of months already. The 14-day Relative Strength Index (RSI) hovers around the 50-midline, suggesting that further consolidation is in play.
If USD strength picks up, the first bullish target will emerge at 83.65, a high of June 26. Sustained upside momentum could lift the pair up to the all-time high of 83.75 en route to the 84.00 psychological mark.
On the other hand, the initial support level for USD/INR is seen at 83.35, the 100-day EMA. Any follow-through selling could drag the pair back down to the 83.00 round figure, followed by 82.82, a low of January 12.
US Dollar price today
The table below shows the percentage change of US Dollar (USD) against listed major currencies today. US Dollar was the strongest against the Euro.
| USD | EUR | GBP | CAD | AUD | JPY | NZD | CHF | |
| USD | -0.05% | -0.07% | -0.05% | -0.18% | -0.25% | -0.10% | -0.13% | |
| EUR | 0.06% | -0.01% | 0.01% | -0.12% | -0.19% | -0.04% | -0.07% | |
| GBP | 0.08% | 0.01% | 0.03% | -0.09% | -0.18% | -0.03% | -0.05% | |
| CAD | 0.05% | -0.01% | -0.02% | -0.12% | -0.21% | -0.06% | -0.08% | |
| AUD | 0.18% | 0.11% | 0.10% | 0.11% | -0.09% | 0.06% | 0.02% | |
| JPY | 0.25% | 0.20% | 0.18% | 0.22% | 0.11% | 0.16% | 0.13% | |
| NZD | 0.09% | 0.04% | 0.03% | 0.05% | -0.08% | -0.16% | -0.02% | |
| CHF | 0.13% | 0.07% | 0.06% | 0.08% | -0.01% | -0.13% | 0.02% |
The heat map shows percentage changes of major currencies against each other. The base currency is picked from the left column, while the quote currency is picked from the top row. For example, if you pick the Euro from the left column and move along the horizontal line to the Japanese Yen, the percentage change displayed in the box will represent EUR (base)/JPY (quote).
Indian Rupee FAQs
The Indian Rupee (INR) is one of the most sensitive currencies to external factors. The price of Crude Oil (the country is highly dependent on imported Oil), the value of the US Dollar – most trade is conducted in USD – and the level of foreign investment, are all influential. Direct intervention by the Reserve Bank of India (RBI) in FX markets to keep the exchange rate stable, as well as the level of interest rates set by the RBI, are further major influencing factors on the Rupee.
The Reserve Bank of India (RBI) actively intervenes in forex markets to maintain a stable exchange rate, to help facilitate trade. In addition, the RBI tries to maintain the inflation rate at its 4% target by adjusting interest rates. Higher interest rates usually strengthen the Rupee. This is due to the role of the ‘carry trade’ in which investors borrow in countries with lower interest rates so as to place their money in countries’ offering relatively higher interest rates and profit from the difference.
Macroeconomic factors that influence the value of the Rupee include inflation, interest rates, the economic growth rate (GDP), the balance of trade, and inflows from foreign investment. A higher growth rate can lead to more overseas investment, pushing up demand for the Rupee. A less negative balance of trade will eventually lead to a stronger Rupee. Higher interest rates, especially real rates (interest rates less inflation) are also positive for the Rupee. A risk-on environment can lead to greater inflows of Foreign Direct and Indirect Investment (FDI and FII), which also benefit the Rupee.
Higher inflation, particularly, if it is comparatively higher than India’s peers, is generally negative for the currency as it reflects devaluation through oversupply. Inflation also increases the cost of exports, leading to more Rupees being sold to purchase foreign imports, which is Rupee-negative. At the same time, higher inflation usually leads to the Reserve Bank of India (RBI) raising interest rates and this can be positive for the Rupee, due to increased demand from international investors. The opposite effect is true of lower inflation.
Japan’s Finance Minister Shunichi Suzuki said on Friday that he “will closely monitor stock and forex markets with vigilance.”
Additional quotes
Weak Yen is pushing up import costs.
Weak Yen is having an impact on prices.
Market reaction
USD/JPY loses ground on the Japanese verbal intervention, currently trading at 161.00, down 0.16% on the day.
- WTI attracts some sellers on Friday and reverses a part of the previous day’s move up.
- Geopolitical tensions and forecasts of a peak summer fuel demand could lend support.
- Traders now look to the US NFP for short-term opportunities on the last day of the week.
West Texas Intermediate (WTI) US crude Oil prices tick lower during the Asian session on Friday and for now, seem to have snapped a two-day winning streak, albeit lack follow-through selling. The commodity currently trades around the $83.20-$83.15 region and remains well within the striking distance of its highest level since April 26 touched on Tuesday.
The recent data showed that members of the Organization of Petroleum Exporting Countries had increased production in June for a second consecutive month. This points a less tight Oil markets in the coming months, which, in turn, is holding back bulls from placing fresh bets and weighing on the black liquid. That said, concerns about persistent supply disruptions in the Middle East should act as a tailwind for Crude Oil prices and help limit losses.
Moreover, the latest optimism over expectations of a pick up in fuel demand in the US during the travel-heavy summer season, along with speculations about OPEC+ cuts in the third quarter, should lend some support to Crude Oil prices. Adding to this, sustained US Dollar (USD) selling bias, amid bets that the Federal Reserve (Fed) will cut rates in September, suggests that the path of least resistance for the commodity remains to the upside.
The aforementioned fundamental backdrop suggests that any subsequent downtick might still be seen as a buying opportunity, though China's economic woes warrant caution before positioning for any further gains for Crude Oil prices. Nevertheless, the black liquid remains on track to register gains for the fourth successive week as market participants now look forward to the release of the US Nonfarm Payrolls (NFP) report for a fresh impetus.
WTI Oil FAQs
WTI Oil is a type of Crude Oil sold on international markets. The WTI stands for West Texas Intermediate, one of three major types including Brent and Dubai Crude. WTI is also referred to as “light” and “sweet” because of its relatively low gravity and sulfur content respectively. It is considered a high quality Oil that is easily refined. It is sourced in the United States and distributed via the Cushing hub, which is considered “The Pipeline Crossroads of the World”. It is a benchmark for the Oil market and WTI price is frequently quoted in the media.
Like all assets, supply and demand are the key drivers of WTI Oil price. As such, global growth can be a driver of increased demand and vice versa for weak global growth. Political instability, wars, and sanctions can disrupt supply and impact prices. The decisions of OPEC, a group of major Oil-producing countries, is another key driver of price. The value of the US Dollar influences the price of WTI Crude Oil, since Oil is predominantly traded in US Dollars, thus a weaker US Dollar can make Oil more affordable and vice versa.
The weekly Oil inventory reports published by the American Petroleum Institute (API) and the Energy Information Agency (EIA) impact the price of WTI Oil. Changes in inventories reflect fluctuating supply and demand. If the data shows a drop in inventories it can indicate increased demand, pushing up Oil price. Higher inventories can reflect increased supply, pushing down prices. API’s report is published every Tuesday and EIA’s the day after. Their results are usually similar, falling within 1% of each other 75% of the time. The EIA data is considered more reliable, since it is a government agency.
OPEC (Organization of the Petroleum Exporting Countries) is a group of 13 Oil-producing nations who collectively decide production quotas for member countries at twice-yearly meetings. Their decisions often impact WTI Oil prices. When OPEC decides to lower quotas, it can tighten supply, pushing up Oil prices. When OPEC increases production, it has the opposite effect. OPEC+ refers to an expanded group that includes ten extra non-OPEC members, the most notable of which is Russia.
| Raw materials | Closed | Change, % |
|---|---|---|
| Silver | 30.386 | -0.18 |
| Gold | 235.647 | 0.01 |
| Palladium | 1016.17 | -0.52 |
- The Australian Dollar extends gains as persistently high inflation prompts the RBA to delay rate cuts.
- RBA’s Meeting Minutes suggest an upside risk for May's Consumer Price Index (CPI).
- The US Dollar struggles as the softer US data raise expectations of the Fed reducing rates in 2024.
The Australian Dollar (AUD) appreciates for the fourth successive day on Friday. This upside could be attributed to persistently high inflation is prompting the Reserve Bank of Australia (RBA) to delay potential rate cuts.
RBA’s June Meeting Minutes indicated that the "board judged the case for holding rates steady stronger than hiking." The board emphasized the need to remain vigilant regarding upside risks to inflation, noting that data suggested an upside risk for May's Consumer Price Index (CPI).
The AUD/USD pair also receives support from a weaker US Dollar (USD). The Greenback struggles due to the softer economic data from the United States (US) raising speculations of the Federal Reserve (Fed) reducing interest rates in 2024. The recovery in US Treasury yields could hold the downside of the US Dollar.
Daily Digest Market Movers: Australian Dollar appreciates due to hawkish RBA
- According to the Australian Bureau of Statistics on Thursday, Australia's trade surplus for May was A$5,773 million ($3,868 million), lower than the expected A$6,678 million and down from the previous reading of A$6,548 million.
- Australia's Retail Sales, a measure of the country's consumer spending, increased by 0.6% MoM in May, up from the previous month's 0.1% rise. This figure exceeded market expectations of a 0.2% increase.
- Judo Bank's Australia Services PMI increased to 51.2 MoM, up from the previous month's 51.0, surpassing the forecasted drop to 50.6. Meanwhile, the Composite PMI rose to 50.7 MoM, compared to 50.6 in the previous month.
- China's Services Purchasing Managers' Index (PMI) fell from 54.0 in May to 51.2 in June, according to the latest data released by Caixin on Wednesday. The market forecast was for a 53.4 figure in the reported period.
- US ISM Services PMI fell sharply to 48.8 in June, marking the steepest decline since April 2020. This figure was well below market expectations of 52.5, following a reading of 53.8 in May.
- ADP Employment report showed that US private businesses added 150,000 workers to their payrolls in June, the lowest increase in five months. This figure fell short of the expected 160,000 and was below the downwardly revised 157,000 in May.
- Federal Reserve Bank of Chicago President Austan Goolsbee stated on BBC Radio on Wednesday that bringing inflation back to 2% will take time and that more economic data are needed. However, on Tuesday, Fed Chair Jerome Powell said that the central bank is getting back on the disinflationary path, per Reuters.
Technical Analysis: Australian Dollar hovers around 0.6750
The Australian Dollar trades around 0.6730 on Friday. The analysis of the daily chart shows a rising wedge, which suggests a potential bearish reversal. Additionally, the 14-day Relative Strength Index (RSI) is slightly below the 70 level. If the RSI breaks above this level, it would suggest the asset is overbought and may experience a short-term correction.
The AUD/USD pair is likely to test the upper boundary of the rising wedge at around 0.6780, followed by the psychological level of 0.6800.
On the downside, the AUD/USD pair tests the lower boundary of the rising wedge at 0.6730, followed by the 50-day Exponential Moving Average (EMA) at 0.6635.
AUD/USD: Daily Chart
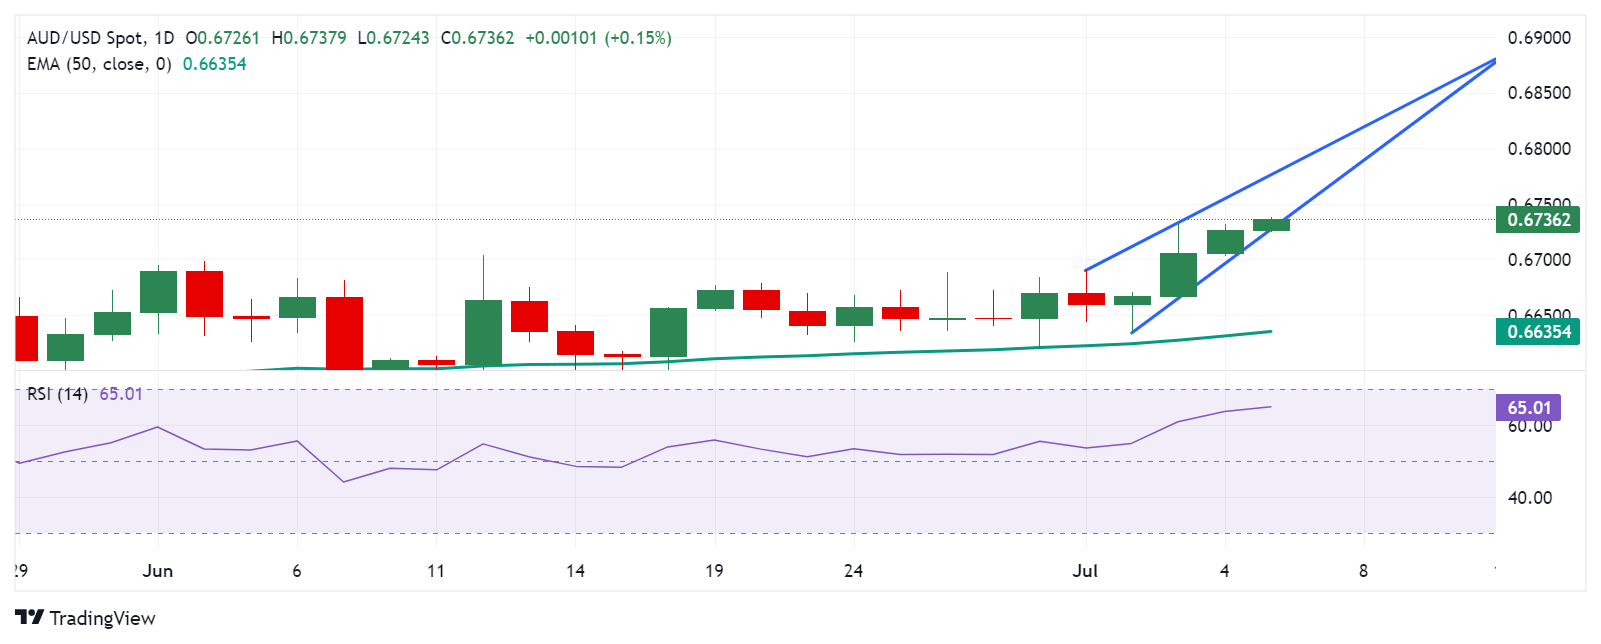
Australian Dollar PRICE Today
The table below shows the percentage change of Australian Dollar (AUD) against listed major currencies today. Australian Dollar was the strongest against the US Dollar.
| USD | EUR | GBP | JPY | CAD | AUD | NZD | CHF | |
|---|---|---|---|---|---|---|---|---|
| USD | -0.04% | -0.04% | -0.19% | -0.03% | -0.17% | -0.07% | -0.05% | |
| EUR | 0.04% | -0.01% | -0.16% | 0.02% | -0.13% | -0.02% | -0.03% | |
| GBP | 0.04% | 0.00% | -0.12% | 0.03% | -0.12% | -0.02% | -0.04% | |
| JPY | 0.19% | 0.16% | 0.12% | 0.16% | 0.03% | 0.11% | 0.12% | |
| CAD | 0.03% | -0.02% | -0.03% | -0.16% | -0.16% | -0.04% | -0.06% | |
| AUD | 0.17% | 0.13% | 0.12% | -0.03% | 0.16% | 0.10% | 0.11% | |
| NZD | 0.07% | 0.02% | 0.02% | -0.11% | 0.04% | -0.10% | -0.02% | |
| CHF | 0.05% | 0.03% | 0.04% | -0.12% | 0.06% | -0.11% | 0.02% |
The heat map shows percentage changes of major currencies against each other. The base currency is picked from the left column, while the quote currency is picked from the top row. For example, if you pick the Australian Dollar from the left column and move along the horizontal line to the US Dollar, the percentage change displayed in the box will represent AUD (base)/USD (quote).
Australian Dollar FAQs
One of the most significant factors for the Australian Dollar (AUD) is the level of interest rates set by the Reserve Bank of Australia (RBA). Because Australia is a resource-rich country another key driver is the price of its biggest export, Iron Ore. The health of the Chinese economy, its largest trading partner, is a factor, as well as inflation in Australia, its growth rate and Trade Balance. Market sentiment – whether investors are taking on more risky assets (risk-on) or seeking safe-havens (risk-off) – is also a factor, with risk-on positive for AUD.
The Reserve Bank of Australia (RBA) influences the Australian Dollar (AUD) by setting the level of interest rates that Australian banks can lend to each other. This influences the level of interest rates in the economy as a whole. The main goal of the RBA is to maintain a stable inflation rate of 2-3% by adjusting interest rates up or down. Relatively high interest rates compared to other major central banks support the AUD, and the opposite for relatively low. The RBA can also use quantitative easing and tightening to influence credit conditions, with the former AUD-negative and the latter AUD-positive.
China is Australia’s largest trading partner so the health of the Chinese economy is a major influence on the value of the Australian Dollar (AUD). When the Chinese economy is doing well it purchases more raw materials, goods and services from Australia, lifting demand for the AUD, and pushing up its value. The opposite is the case when the Chinese economy is not growing as fast as expected. Positive or negative surprises in Chinese growth data, therefore, often have a direct impact on the Australian Dollar and its pairs.
Iron Ore is Australia’s largest export, accounting for $118 billion a year according to data from 2021, with China as its primary destination. The price of Iron Ore, therefore, can be a driver of the Australian Dollar. Generally, if the price of Iron Ore rises, AUD also goes up, as aggregate demand for the currency increases. The opposite is the case if the price of Iron Ore falls. Higher Iron Ore prices also tend to result in a greater likelihood of a positive Trade Balance for Australia, which is also positive of the AUD.
The Trade Balance, which is the difference between what a country earns from its exports versus what it pays for its imports, is another factor that can influence the value of the Australian Dollar. If Australia produces highly sought after exports, then its currency will gain in value purely from the surplus demand created from foreign buyers seeking to purchase its exports versus what it spends to purchase imports. Therefore, a positive net Trade Balance strengthens the AUD, with the opposite effect if the Trade Balance is negative.
- Gold price continues with its struggle to gain any meaningful traction on Friday.
- Investors opt to wait on the sidelines ahead of the release of the US NFP report.
- September Fed rate cut bets undermine the USD and lend support to the metal.
Gold price (XAU/USD) extends its consolidative price move during the Asian session on Friday and remains well within the striking distance of the highest level since June 21 touched earlier this week. The recent softer US macro data reaffirmed market bets that the Federal Reserve (Fed) will begin cutting rates in September. This keeps the US Dollar (USD) depressed near a three-week low and turns out to be a key factor acting as a tailwind for the non-yielding yellow metal.
That said, the prevalent risk-on environment keeps a lid on any meaningful appreciating move for the safe-haven Gold price. Traders also seem reluctant to place aggressive bets and prefer to wait for the release of the US monthly employment details, due later today. The popularly known as the Nonfarm Payrolls (NFP) report will influence expectations about the Fed's future policy decision and in turn, help in determining the next leg of a directional move for the XAU/USD.
Daily Digest Market Movers: Gold price traders remain on the sidelines ahead of the US NFP report
- Expectations for an imminent start of the Federal Reserve's rate-cutting cycle in September weigh on the US Dollar for the fourth straight day on Friday and continue to lend support to the non-yielding Gold price.
- The market bets were lifted by this week's softer US macroeconomic releases, which pointed to signs of weakness in the labor market and a loss of momentum in the economy at the end of the second quarter.
- That said, hawkish signals from a slew of influential Fed officials, along with the minutes of the June FOMC policy meeting, suggest that policymakers were still not confident about bringing down lending costs.
- Furthermore, the underlying bullish sentiment across the global equity markets holds back traders from placing fresh bullish bets around the safe-haven precious metal ahead of the closely-watched US employment data.
- The popularly known Nonfarm Payrolls report is due for release later during the North American session and is expected to show that the US economy added 190K jobs in June as compared to the 272K previous.
- Meanwhile, the unemployment rate is anticipated to hold steady at 4%, while Average Hourly Earnings growth could see a modest dip, rising by the 3.9% yearly rate as compared to the 4.1% increase recorded in May.
- The crucial data will play a key role in influencing market expectations about the Fed's future policy decisions, which, in turn, will drive the USD demand and provide a fresh directional impetus to the XAU/USD.
Technical Analysis: Gold price seems poised to appreciate further while above 50-day SMA breakpoint
From a technical perspective, Wednesday's sustained breakout through the 50-day Simple Moving Average (SMA) was seen as a fresh trigger for bullish traders. Adding to this, oscillators on the daily chart have again started gaining positive traction and suggest that the path of least resistance for the Gold price is to the downside. Some follow-through buying beyond the $2,365 area will reaffirm the constructive outlook and allow the XAU/USD to reclaim the $2,400 mark. The momentum could extend further towards challenging the all-time peak, around the $2,450 zone touched in May.
On the flip side, weakness back towards the 50-day SMA resistance breakpoint, around the $2,339-2,338 region, could be seen as a buying opportunity. This is followed by support near the $2,319-2,318 area, which if broken decisively could make the Gold price vulnerable to weaken further below the $2,300 mark and test the $2,285 horizontal zone. Failure to defend the said support levels might expose the 100-day SMA, currently near the $2,258 area, and the $2,225-2,220 support before the XAU/USD eventually drops to the $2,200 round-figure mark.
Gold FAQs
Gold has played a key role in human’s history as it has been widely used as a store of value and medium of exchange. Currently, apart from its shine and usage for jewelry, the precious metal is widely seen as a safe-haven asset, meaning that it is considered a good investment during turbulent times. Gold is also widely seen as a hedge against inflation and against depreciating currencies as it doesn’t rely on any specific issuer or government.
Central banks are the biggest Gold holders. In their aim to support their currencies in turbulent times, central banks tend to diversify their reserves and buy Gold to improve the perceived strength of the economy and the currency. High Gold reserves can be a source of trust for a country’s solvency. Central banks added 1,136 tonnes of Gold worth around $70 billion to their reserves in 2022, according to data from the World Gold Council. This is the highest yearly purchase since records began. Central banks from emerging economies such as China, India and Turkey are quickly increasing their Gold reserves.
Gold has an inverse correlation with the US Dollar and US Treasuries, which are both major reserve and safe-haven assets. When the Dollar depreciates, Gold tends to rise, enabling investors and central banks to diversify their assets in turbulent times. Gold is also inversely correlated with risk assets. A rally in the stock market tends to weaken Gold price, while sell-offs in riskier markets tend to favor the precious metal.
The price can move due to a wide range of factors. Geopolitical instability or fears of a deep recession can quickly make Gold price escalate due to its safe-haven status. As a yield-less asset, Gold tends to rise with lower interest rates, while higher cost of money usually weighs down on the yellow metal. Still, most moves depend on how the US Dollar (USD) behaves as the asset is priced in dollars (XAU/USD). A strong Dollar tends to keep the price of Gold controlled, whereas a weaker Dollar is likely to push Gold prices up.
- USD/CAD trades in negative territory for the fourth consecutive day near 1.3605 in Friday’s early Asian session.
- The recent discouraging US economic data have fuelled the chance of a Fed September rate cut, weighing the US Dollar.
- Canadian Net Change in Employment is expected to decline to 22.5K versus 26.7K prior.
The USD/CAD pair trades on a negative note around 1.3605 during the early Asian session on Friday. The downtick of the pair is backed by the weaker US Dollar (USD) boardly. The release of US and Canadian employment reports will be the highlights on Friday.
Market consensus forecasts the US employment growth slowed in June, with a 190,000 increase in Nonfarm Payrolls (NFP). The Unemployment Rate is expected to remain steady at 4.0%, partially due to a forecast decline in the participation rate last month.
The recent softer US PCE inflation and weaker Services PMI have raised the chance of a Federal Reserve (Fed) September rate cut, with the markets pricing a 70% odds leading into the NFP release of that occurring. The markets also see a second rate cut in December, which is priced in around an 80% probability. This, in turn, exerts some selling pressure on the Greenback.
On the Loonie front, the Canadian Net Change in Employment is expected to drop to 22.5K from the previous reading of 26.7K. The Canadian Unemployment Rate is projected to tick higher to 6.3% from 6.2%. Meanwhile, the modest decline in crude oil price might weigh on the commodity-linked Canadian Dollar (CAD), as Canada is the major crude oil exporter to the United States.
Canadian Dollar FAQs
The key factors driving the Canadian Dollar (CAD) are the level of interest rates set by the Bank of Canada (BoC), the price of Oil, Canada’s largest export, the health of its economy, inflation and the Trade Balance, which is the difference between the value of Canada’s exports versus its imports. Other factors include market sentiment – whether investors are taking on more risky assets (risk-on) or seeking safe-havens (risk-off) – with risk-on being CAD-positive. As its largest trading partner, the health of the US economy is also a key factor influencing the Canadian Dollar.
The Bank of Canada (BoC) has a significant influence on the Canadian Dollar by setting the level of interest rates that banks can lend to one another. This influences the level of interest rates for everyone. The main goal of the BoC is to maintain inflation at 1-3% by adjusting interest rates up or down. Relatively higher interest rates tend to be positive for the CAD. The Bank of Canada can also use quantitative easing and tightening to influence credit conditions, with the former CAD-negative and the latter CAD-positive.
The price of Oil is a key factor impacting the value of the Canadian Dollar. Petroleum is Canada’s biggest export, so Oil price tends to have an immediate impact on the CAD value. Generally, if Oil price rises CAD also goes up, as aggregate demand for the currency increases. The opposite is the case if the price of Oil falls. Higher Oil prices also tend to result in a greater likelihood of a positive Trade Balance, which is also supportive of the CAD.
While inflation had always traditionally been thought of as a negative factor for a currency since it lowers the value of money, the opposite has actually been the case in modern times with the relaxation of cross-border capital controls. Higher inflation tends to lead central banks to put up interest rates which attracts more capital inflows from global investors seeking a lucrative place to keep their money. This increases demand for the local currency, which in Canada’s case is the Canadian Dollar.
Macroeconomic data releases gauge the health of the economy and can have an impact on the Canadian Dollar. Indicators such as GDP, Manufacturing and Services PMIs, employment, and consumer sentiment surveys can all influence the direction of the CAD. A strong economy is good for the Canadian Dollar. Not only does it attract more foreign investment but it may encourage the Bank of Canada to put up interest rates, leading to a stronger currency. If economic data is weak, however, the CAD is likely to fall.
The People’s Bank of China (PBOC) set the USD/CNY central rate on Friday at 7.1289, as against the previous day's fix of 7.1305 and 7.2704 Reuters estimates.
| Index | Change, points | Closed | Change, % |
|---|---|---|---|
| NIKKEI 225 | 332.89 | 40913.65 | 0.82 |
| Hang Seng | 49.71 | 18028.28 | 0.28 |
| KOSPI | 30.93 | 2824.94 | 1.11 |
| ASX 200 | 91.9 | 7831.8 | 1.19 |
| DAX | 75.95 | 18450.48 | 0.41 |
| CAC 40 | 63.7 | 7695.78 | 0.83 |
- USD/JPY trades on a stronger note near 161.40 in Friday’s early Asian session.
- The divergence of monetary policy between Japan and the US continues to undermine the JPY.
- The rising expectation of Fed rate cuts this year and the fear of FX intervention might cap the pair’s upside.
The USD/JPY pair remains strong near 161.40 on Friday during the early Asian session. The US Dollar (USD) continues to strengthen to nearly fresh 38-year highs against the Japanese Yen (JPY) amid the wide rate differential between Japan and the US. Later on Friday, traders will closely watch the US June employment data, including Nonfarm Payrolls (NFP), Unemployment Rate, and Average Hourly Earnings.
The uptick in USD/JPY raises expectations of foreign exchange (FX) intervention from Japanese authorities. “In the interim, USD/JPY will look to UST yields, US Dollar (USD) for directional cues. For USD/JPY to turn lower, that would require the USD to turn/Fed to cut or for BoJ to signal an intent to normalize urgently (rate hike or increase pace of balance sheet reduction). None of the above appears to be taking place,” said OCBC strategists Frances Cheung and Christopher Wong.
According to the Federal Open Market Committee (FOMC) meeting on June 11–12, Federal Reserve (Fed) officials emphasized the data-dependent approach and refrained from committing to interest rate cuts until further observation. Some Fed officials lacked the confidence they needed to cut the interest rate, while several policymakers stated that it’s necessary to hike again if inflation were to rebound.
Nonetheless, the upside of the Greenback might be capped as the recent softer US PCE inflation data and weaker-than-expected Services PMI fuel expectations of Fed interest rate cuts this year. Traders will take more cues from the US employment data for June later in the day. The US NFP is estimated to show 190K job additions in June, while the Unemployment Rate is forecast to remain unchanged at 4%. Finally, the Average Hourly Earnings are forecast to drop to 3.9% YoY in June from 4.1% in May.
Japanese Yen FAQs
The Japanese Yen (JPY) is one of the world’s most traded currencies. Its value is broadly determined by the performance of the Japanese economy, but more specifically by the Bank of Japan’s policy, the differential between Japanese and US bond yields, or risk sentiment among traders, among other factors.
One of the Bank of Japan’s mandates is currency control, so its moves are key for the Yen. The BoJ has directly intervened in currency markets sometimes, generally to lower the value of the Yen, although it refrains from doing it often due to political concerns of its main trading partners. The current BoJ ultra-loose monetary policy, based on massive stimulus to the economy, has caused the Yen to depreciate against its main currency peers. This process has exacerbated more recently due to an increasing policy divergence between the Bank of Japan and other main central banks, which have opted to increase interest rates sharply to fight decades-high levels of inflation.
The BoJ’s stance of sticking to ultra-loose monetary policy has led to a widening policy divergence with other central banks, particularly with the US Federal Reserve. This supports a widening of the differential between the 10-year US and Japanese bonds, which favors the US Dollar against the Japanese Yen.
The Japanese Yen is often seen as a safe-haven investment. This means that in times of market stress, investors are more likely to put their money in the Japanese currency due to its supposed reliability and stability. Turbulent times are likely to strengthen the Yen’s value against other currencies seen as more risky to invest in.
| Pare | Closed | Change, % |
|---|---|---|
| AUDUSD | 0.67256 | 0.29 |
| EURJPY | 174.298 | -0.02 |
| EURUSD | 1.08105 | 0.22 |
| GBPJPY | 205.722 | -0.11 |
| GBPUSD | 1.27599 | 0.12 |
| NZDUSD | 0.61165 | 0.21 |
| USDCAD | 1.36123 | -0.19 |
| USDCHF | 0.89984 | -0.21 |
| USDJPY | 161.23 | -0.23 |


© 2000-2024. Bản quyền Teletrade.
Trang web này được quản lý bởi Teletrade D.J. LLC 2351 LLC 2022 (Euro House, Richmond Hill Road, Kingstown, VC0100, St. Vincent and the Grenadines).
Thông tin trên trang web không phải là cơ sở để đưa ra quyết định đầu tư và chỉ được cung cấp cho mục đích làm quen.
Giao dịch trên thị trường tài chính (đặc biệt là giao dịch sử dụng các công cụ biên) mở ra những cơ hội lớn và tạo điều kiện cho các nhà đầu tư sẵn sàng mạo hiểm để thu lợi nhuận, tuy nhiên nó mang trong mình nguy cơ rủi ro khá cao. Chính vì vậy trước khi tiến hành giao dịch cần phải xem xét mọi mặt vấn đề chấp nhận tiến hành giao dịch cụ thể xét theo quan điểm của nguồn lực tài chính sẵn có và mức độ am hiểu thị trường tài chính.
Sử dụng thông tin: sử dụng toàn bộ hay riêng biệt các dữ liệu trên trang web của công ty TeleTrade như một nguồn cung cấp thông tin nhất định. Việc sử dụng tư liệu từ trang web cần kèm theo liên kết đến trang teletrade.vn. Việc tự động thu thập số liệu cũng như thông tin từ trang web TeleTrade đều không được phép.
Xin vui lòng liên hệ với pr@teletrade.global nếu có câu hỏi.
ngân hàng