- Phân tích
- Tin tức và các công cụ
- Tin tức thị trường
Tin tức thì trường
| Time | Country | Event | Period | Previous value | Forecast |
|---|---|---|---|---|---|
| 01:00 (GMT) | New Zealand | ANZ Business Confidence | May | -2.0 | |
| 06:00 (GMT) | Germany | Factory Orders s.a. (MoM) | March | 1.2% | 1.7% |
| 08:30 (GMT) | United Kingdom | Purchasing Manager Index Services | April | 56.3 | 60.1 |
| 09:00 (GMT) | Australia | RBA Assist Gov Debelle Speaks | |||
| 09:00 (GMT) | Eurozone | Retail Sales (YoY) | March | -2.9% | 9.6% |
| 09:00 (GMT) | Eurozone | Retail Sales (MoM) | March | 3% | 1.5% |
| 11:00 (GMT) | United Kingdom | Asset Purchase Facility | 875 | 875 | |
| 11:00 (GMT) | United Kingdom | BoE Interest Rate Decision | 0.1% | 0.1% | |
| 11:00 (GMT) | United Kingdom | Bank of England Minutes | |||
| 12:30 (GMT) | U.S. | Continuing Jobless Claims | April | 3660 | 3620 |
| 12:30 (GMT) | U.S. | Unit Labor Costs, q/q | Quarter I | 6% | -0.8% |
| 12:30 (GMT) | U.S. | Nonfarm Productivity, q/q | Quarter I | -4.2% | 4.3% |
| 12:30 (GMT) | U.S. | Initial Jobless Claims | May | 553 | 540 |
| 13:00 (GMT) | U.S. | FOMC Member Williams Speaks | |||
| 17:00 (GMT) | U.S. | FOMC Member Bostic Speaks | |||
| 17:00 (GMT) | U.S. | FOMC Member Mester Speaks | |||
| 22:05 (GMT) | U.S. | FOMC Member Kaplan Speak | |||
| 22:30 (GMT) | Australia | AIG Services Index | April | 58.7 | |
| 23:30 (GMT) | Japan | Labor Cash Earnings, YoY | March | -0.2% |
- Fiscal policy has been unusually stimulative and is providing a major boost to the pandemic-shocked economy
- Significant slack remains in the economy
- Oil prices, pent up demand and shipping delays will temporarily distort inflation numbers
- The most-likely outcome is that inflation will normalize close to 2%
- Says unemployment rate by year-end may be below current Fed median projection of 4.5%
- Still sees a small risk of persistent inflation outbreak despite increases anticipated this year
- Expects unusually strong job growth through the summer
- Coronavirus risks and associated restrictions continue to ease, though risk still remains
- Expects U.S. labor force participation to be rebound as schools and childcare reopen and expand hours
The
U.S. Energy Information Administration (EIA) revealed on Wednesday that crude
inventories plunged by 7.990 million barrels in the week ended April 30,
following a build of 0.090 million barrels in the previous week. Economists had
forecast a drop of 2.346 million barrels.
At
the same time, gasoline stocks rose 0.737 million barrels, while analysts had
expected a decrease of 0.652 million barrels. Distillate stocks declined by 2.896
million barrels, while analysts had forecast a draw of 1.120 million barrels.
Meanwhile, oil production in the U.S. remained unchanged at 10.900 million barrels a day.
U.S.
crude oil imports averaged 5.5 million barrels per day last week, decreased by
1.2 million barrels per day from the previous week.
The
Institute for Supply Management (ISM) reported on Wednesday that its
non-manufacturing index (NMI) came in at 62.7 in April, which was 1.0 percentage
point lower than an unrevised March reading of 63.7 percent, which was the highest
on record. The reading
pointed to the growth in the services sector for the 11th straight month.
Economists
forecast the index to increase to 64.3 last month. A reading above 50 signals
expansion, while a reading below 50 indicates contraction.
Of
the 18 manufacturing industries, 17 reported gains last month, the ISM said,
adding that respondents' comments indicated that pent-up demand was continuing,
while production-capacity constraints, material shortages, weather and
challenges in logistics and human resources continued to affect deliveries.
According
to the report, the ISM’s New Orders gauge declined 4.0 percentage points to 63.2
percent from the March reading, while its non-manufacturing Production measure
fell 6.7 percentage points to 62.7 percent and the Inventories indicator decreased
4.9 percentage points to 49.1 percent. Meanwhile, the Employment indicator rose
1.6 percentage points to 58.8 percent and the Supplier Deliveries index jumped
5.1 percentage points to 66.1 percent. Elsewhere, the Prices index went up 2.8
percentage points to 76.8 percent, indicating that prices
increased in April, and at a faster rate. This was the index's highest reading since
July 2008.
Commenting
on the data, the Chair of the ISM Services Business Survey Committee, Anthony
Nieves, noted, “The past relationship between the Services PMI and the overall
economy indicates that the Services PM for April (62.7 percent) corresponds to
a 4.7-percent increase in real gross domestic product (GDP) on an annualized
basis.”
The
latest report by IHS Markit revealed on Wednesday the seasonally adjusted final
IHS Markit U.S. Services Business Activity Index (PMI) stood at 64.7 in April,
up from 60.4 in March and higher than the earlier released “flash” estimate of 63.1.
The latest reading pointed to the fastest expansion of business activity across
the U.S. service sector since data collection began in late-2009.
Economists
had forecast the index to stay unrevised at 63.1.
According
to the report, firms linked the robust April upturn to stronger
client demand and a rise in new sales. Some companies, however, noted that
output has not yet recovered to pre-pandemic levels.
- Economy "quite a way to go" before reaching goals
- Very optimistic on growth prospects
- The employment mandate is "within sight"
- Achieving inflation goal may prove more difficult
- Pandemic has magnified longstanding inequalities, may leave unfortunate longer-lasting marks
- Long way to go before economic activity returns to pre-pandemic vibrancy
- Outlook is more positive than just a few months ago
- Expecting some further pickup of inflation in the coming months
- Risk of upward inflation spiral remote
- Would not be concerned about persistent high inflation unless saw outsized movements in financial market pricing at longer maturities or in survey-based inflation expectations
- Need an accommodative policy for some time to meet policy goals
- Conditions for "substantial further progress" will not be met for a while
U.S. stock-index futures rose on Wednesday, as tech stocks rebound after Tuesday's sell-off, triggered by a rotation out of growth into value stocks and comments from U.S. Treasury Secretary Janet Yellen on the possible need for interest rates to rise to prevent the U.S. economy from overheating.
Global Stocks:
Index/commodity | Last | Today's Change, points | Today's Change, % |
Nikkei | - | - | - |
Hang Seng | 28,417.98 | -139.16 | -0.49% |
Shanghai | - | - | - |
S&P/ASX | 7,095.80 | +27.90 | +0.39% |
FTSE | 7,011.75 | +88.58 | +1.28% |
CAC | 6,314.21 | +62.46 | +1.00% |
DAX | 15,084.55 | +228.07 | +1.54% |
Crude oil | $66.47 | +1.19% | |
Gold | $1,772.40 | -0.20% |
FXStreet notes that S&P 500 remains below 4200. Economists at Credit Suisse are looking for a potentially lengthy consolidation/corrective phase to emerge with key near-term support still seen at 4118/12.
“With a range of ‘red flags’ and overextension signals still in place as well as daily bearish momentum divergences and a bearish MACD cross lower we continue to look for the unfolding of what may be a lengthy consolidation/corrective phase.”
“Whilst resistance from the top of the price gap from yesterday at 4188/93 caps the immediate risk can stay lower with support seen at 4157/55 initially and then more importantly at 4118/12 – the late April low and lower end of the uptrend channel from early March. Below here though is needed to set a top to add weight to our corrective roadmap with support then seen next at 4086, then 4079 – the 38.2% retracement of the rally from late March.”
(company / ticker / price / change ($/%) / volume)
ALCOA INC. | AA | 39.59 | 0.52(1.33%) | 24567 |
ALTRIA GROUP INC. | MO | 47.79 | -0.06(-0.13%) | 25984 |
Amazon.com Inc., NASDAQ | AMZN | 3,332.00 | 20.13(0.61%) | 52118 |
Apple Inc. | AAPL | 128.85 | 1.00(0.78%) | 1098741 |
AT&T Inc | T | 32.06 | 0.04(0.12%) | 102326 |
Boeing Co | BA | 233.12 | -0.51(-0.22%) | 41472 |
Caterpillar Inc | CAT | 234.5 | 1.09(0.47%) | 33995 |
Chevron Corp | CVX | 107.3 | 1.19(1.12%) | 16232 |
Citigroup Inc., NYSE | C | 72.68 | 0.35(0.48%) | 20740 |
E. I. du Pont de Nemours and Co | DD | 80 | 0.50(0.63%) | 3876 |
Exxon Mobil Corp | XOM | 59.9 | 0.71(1.20%) | 116662 |
Facebook, Inc. | FB | 319.27 | 0.91(0.29%) | 92243 |
FedEx Corporation, NYSE | FDX | 305.7 | 1.42(0.47%) | 6267 |
Ford Motor Co. | F | 11.47 | 0.06(0.53%) | 623626 |
Freeport-McMoRan Copper & Gold Inc., NYSE | FCX | 39.72 | 0.50(1.27%) | 149941 |
General Electric Co | GE | 13.16 | 0.04(0.30%) | 280165 |
General Motors Company, NYSE | GM | 57.3 | 1.96(3.54%) | 990290 |
Goldman Sachs | GS | 351 | 1.16(0.33%) | 8355 |
Google Inc. | GOOG | 2,364.00 | 9.75(0.41%) | 6582 |
Hewlett-Packard Co. | HPQ | 34.14 | 0.18(0.53%) | 2200 |
Home Depot Inc | HD | 333.6 | 0.83(0.25%) | 6256 |
Intel Corp | INTC | 57.07 | 0.17(0.30%) | 75829 |
International Business Machines Co... | IBM | 146.3 | 0.55(0.38%) | 8963 |
Johnson & Johnson | JNJ | 167 | -0.77(-0.46%) | 6574 |
JPMorgan Chase and Co | JPM | 156.15 | 0.67(0.43%) | 37541 |
McDonald's Corp | MCD | 234.01 | 0.15(0.06%) | 1511 |
Merck & Co Inc | MRK | 76.14 | 0.15(0.20%) | 7884 |
Microsoft Corp | MSFT | 248.65 | 0.86(0.35%) | 526188 |
Nike | NKE | 131.81 | 0.26(0.20%) | 227485 |
Pfizer Inc | PFE | 40.16 | 0.21(0.53%) | 227920 |
Procter & Gamble Co | PG | 134.5 | -0.04(-0.03%) | 176911 |
Starbucks Corporation, NASDAQ | SBUX | 114.46 | 0.35(0.31%) | 7503 |
Tesla Motors, Inc., NASDAQ | TSLA | 681.48 | 7.88(1.17%) | 303590 |
The Coca-Cola Co | KO | 54.15 | 0.01(0.02%) | 8804 |
Twitter, Inc., NYSE | TWTR | 54.72 | 0.32(0.59%) | 123026 |
Verizon Communications Inc | VZ | 58.57 | -0.03(-0.05%) | 22379 |
Visa | V | 233 | 0.97(0.42%) | 4827 |
Wal-Mart Stores Inc | WMT | 140.98 | 0.26(0.18%) | 5353 |
Walt Disney Co | DIS | 184.7 | 0.45(0.24%) | 19809 |
Yandex N.V., NASDAQ | YNDX | 64.8 | 0.58(0.90%) | 2358 |
Downgrades before the market open
Altria (MO) downgraded to Hold from Buy at Argus
Exxon Mobil (XOM) upgraded to Buy from Hold at DZ Bank; target $67
FXStreet reports that UOB Group’s FX Strategists suggested that USD/CNH could have now moved into a consolidation range between 6.4650 and 6.5020.
24-hour view: “Our view for USD to trade sideways was incorrect as it popped up to an overnight high of 6.4912 before pulling back quickly. The pullback could extend lower but sustained decline below 6.4740 is unlikely. Resistance is at 6.4880 followed 6.4920.”
Next 1-3 weeks: “The ‘strong resistance’ level at 6.4900 was breached yesterday as USD popped to a high of 6.4912. While the negative phase is deemed to have ended, it is too soon to expect a recovery. From here, USD is expected to trade between 6.4650 and 6.5020 for period of time. Looking ahead, a clear break of 6.5020 would indicate that USD is ready for a sustained and sizeable rebound.”
The
employment report prepared by Automatic Data Processing Inc. (ADP) and Moody's
Analytics showed on Wednesday the U.S. private employers added 742,000 jobs in April.
This marked the largest advance in private-sector employment since September
2020.
Economists
had expected an increase of 800,000.
The March
number saw an upward revision to 565,000 from the originally reported 517,000.
“The
labor market continues an upward trend of acceleration and growth, posting the
strongest reading since September 2020,” noted Nela Richardson, ADP’s chief
economist. “Service providers have the most to gain as the economy reopens,
recovers and resumes normal actvities and are leading job growth in April. While
payrolls are still more than 8 million jobs short of pre-COVID-19 levels, job
gains have totaled 1.3 million in the last two months after adding only about 1
million jobs over the course of the previous five months.”
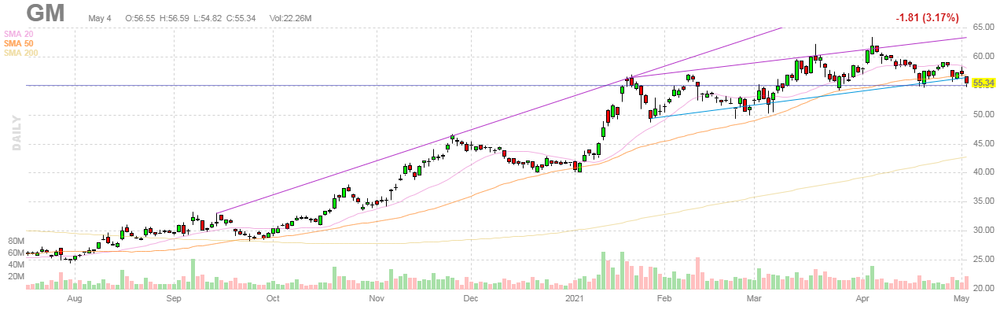
General Motors (GM) reported Q1 FY 2021 earnings of $2.25 per share (versus $0.62 per share in Q1 FY 2020), solidly beating analysts’ consensus estimate of $0.97 per share.
The company’s quarterly revenues amounted to $32.474 bln (-0.7% y/y), missing analysts’ consensus estimate of $33.150 bln.
GM rose to $57.15 (+3.27%) in pre-market trading.
| Time | Country | Event | Period | Previous value | Forecast | Actual |
|---|---|---|---|---|---|---|
| 06:30 | Switzerland | Consumer Price Index (MoM) | April | 0.3% | 0.2% | 0.2% |
| 06:30 | Switzerland | Consumer Price Index (YoY) | April | -0.2% | 0.3% | 0.3% |
| 07:50 | France | Services PMI | April | 48.2 | 50.4 | 50.3 |
| 07:55 | Germany | Services PMI | April | 51.5 | 50.1 | 49.9 |
| 08:00 | Eurozone | Services PMI | April | 49.6 | 50.3 | 50.5 |
| 09:00 | Eurozone | Producer Price Index, MoM | March | 0.5% | 1.1% | 1.1% |
| 09:00 | Eurozone | Producer Price Index (YoY) | March | 1.5% | 4.2% | 4.3% |
USD traded flat against most of its major rivals in the European session on Wednesday, as investors continued to weigh the risks of higher inflation and potential interest rate hikes after the latest comments by the U.S. Treasury Secretary Janet Yellen, while awaiting an official report on the employment situation in the U.S. for April, which is to be released tomorrow.
The U.S. Dollar Index (DXY), measuring the U.S. currency's value relative to a basket of foreign currencies, edged down 0.05% to 91.24.
In an interview with The Atlantic, U.S. Treasury Secretary Janet Yellen said Tuesday that interest rates may need to rise somewhat to prevent the U.S. economy from overheating, partially due to heavy government spending. Yellen’s comments heightened market participants’ worries about inflation. Later, however, she clarified that she was not forecasting rate increases due to potential inflation.
Investors also awaited a slew of important U.S. economic data, including the U.S. services PMI on Wednesday and April non-farm payroll reading on Friday, which are expected to provide more clues on the health of the U.S. economy. There are speculations that quick economic recovery could force the U.S. Federal Reserve to hike interest rates and to begin tapering its asset purchases sooner than expected.
FXStreet reports that the Credit Suisse analyst team believes that above 109.95/97, the USD/JPY pair should clear the way for a move back to the 110.83/97 late March high and potential downtrend.
“USD/JPY maintains its break above resistance at 109.10 and with the market having previously stabilized above the 38.2% retracement of the Q1 rally at 107.77 and with daily MACD momentum turning back into outright bullish territory, our immediate bias remains high.”
“We look for further strength to the recent highs at 109.71/78, then, more importantly, the corrective highs at 109.95/97. Above here would reinforce our upside bias further and open up strength back to the 110.83/97 late March high and potential downtrend.”
The
Mortgage Bankers Association (MBA) reported on Wednesday the mortgage
application volume in the U.S. declined 0.9 percent in the week ended April 30,
following a 2.5 percent fall in the previous week.
According
to the report, applications to purchase a home decreased 2.5 percent, while refinance
applications increased 0.1 percent.
Meanwhile, the average fixed 30-year mortgage rate edged up from 3.17 percent to 3.18 percent.
“Both
conventional and government purchase applications declined, but average loan
sizes increased for each loan type,” noted Joel Kan, an MBA economist. “This is
a sign that the competitive purchase market, driven by low housing inventory
and high demand, is pushing prices higher and weighing down on activity.”
FXStreet reports that the Canadian dollar advanced in April but it did underperform advancing less than many other G10 currencies as the USD/CAD pair fell from 1.2576 to 1.2317. On a year-to-date basis, the loonie remains the best performing currency reflecting the positive outlook – which analysts at MUFG Bank believe is justified.
“The Bank of Canada tapered its QE pace from CAD4 B per week to CAD3 B and unlike the RBA and the RBNZ, the BoC at its meeting in April was more willing to embrace a guidance indicating the prospect of a rate hike in 2022.”
“The BoC through ending certain liquidity support measures is seeing its balance sheet shrink and the rate guidance sets the BoC apart from other central banks that could see CAD continue to outperform.”
“The Canadian government also announced a further CAD100 Bof fiscal spending in its budget in April that leaves CAD set for further gains over the forecast period ahead.”
FXStreet notes that no immediate change is seen for GBP/USD with the market trapped in its neutral sideways range of the past two months. In the view of the Credit Suisse analyst team, cable would see this resolved higher only above the 1.4000/17 neighborhood.
“Our immediate focus stays slightly higher in the range with resistance seen at 1.3933 initially ahead of 1.3977 and then more importantly at the March highs at 1.4001/17.”
“Beyond the 1.4001/17 area remains needed to end the sideways range and see a more convincing base established as well as reinforce our core longer-term bullish view following the completion of a much larger base above 1.3514 late last year. We would then look a move back to the 1.4238 high initially, ahead of our first core upside target of 1.4302/77 – the 2018 highs and 50% retracement of the 2014/2020 bear trend.”
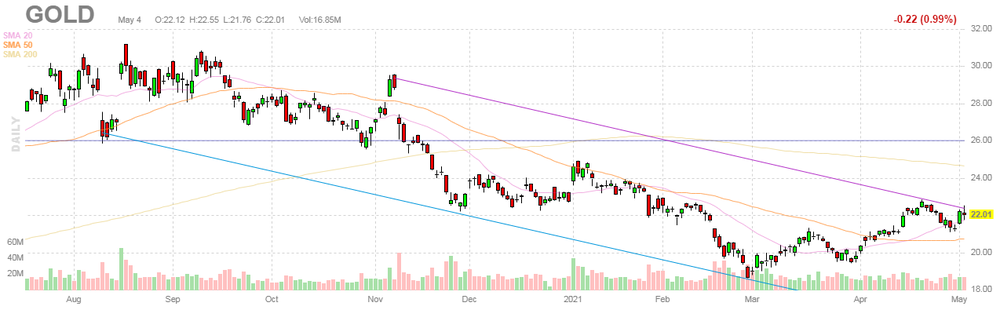
Barrick (GOLD) reported Q1 FY 2021 earnings of $0.29 per share (versus $0.16 per share in Q1 FY 2020), missing analysts’ consensus estimate of $0.31 per share.
The company’s quarterly revenues amounted to $2.956 bln (+8.6% y/y), missing analysts’ consensus estimate of $3.167 bln.
GOLD rose to $22.11 (+0.45%) in pre-market trading.
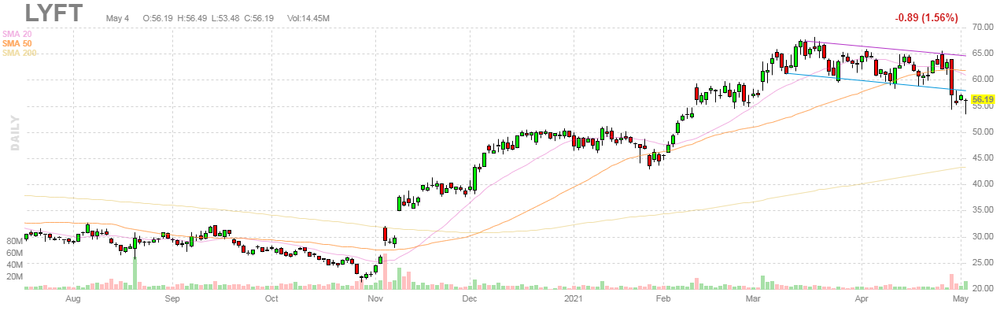
Lyft (LYFT) reported Q1 FY 2021 loss of $0.35 per share (versus -$1.31 per share in Q1 FY 2020), being better than analysts’ consensus estimate of -$0.55 per share.
The company’s quarterly revenues amounted to $0.609 bln (-36.3% y/y), beating analysts’ consensus estimate of $0.555 bln.
LYFT rose to $59.60 (+6.07%) in pre-market trading.
- Says Fed's bond-buying is an important part of monetary policy
- It is designed to help the economy recover from the pandemic impact
- Does not see higher valuations in stocks, housing market as being a significant risk to financial stability right now
- Expects inflation to rise above 2% this year but likely will be temporary
- Not going to draw a line on how high inflation could rise to prompt policy change
- Sees need for strong monetary policy support to ensure recovery
FXStreet reports that Karen Jones, Team Head FICC Technical Analysis Research at Commerzbank, expects the yellow metal to experience some weakness in the short-term.
“Gold has tested and again failed at the 55-day ma at $1797.44. This has served to reinforce the resistance here and coupled with a now negative daily RSI and a negative Elliott wave count we would allow for some near term weakness.”
“For now, we will allow for slippage to the 20-day ma at $1752. There is scope for $1724/23, the 61.8% retracement. Provided it holds there we should retry the topside once again.
“Above $1799 lies the 200-day ma at $1852 and the downtrend at $1871. We suspect that this will hold the topside for now.”
Reuters reports that the OECD's head of tax said that the chances of a global deal on how multinational companies are taxed have never been higher, although it might take until October to finalise an agreement.
"The chances of success have in my opinion never been higher because there is a real desire on all sides to wrap up this matter," Pascal Saint-Amans told the French Senate's finance committee.
He added he did not think all issues could be totally resolved by July and that it might take until October to finalise a deal.
The talks aim to make the biggest update to international rules for taxing cross-border commerce for a generation to take account of the rise of internet giants like Google and Facebook
According to estimates from Eurostat, in March 2021, industrial producer prices rose by 1.1% in the euro area and by 1.2% in the EU, compared with February 2021. In February 2021, prices increased by 0.5% in the euro area and by 0.6% in the EU.
In March 2021, compared with March 2020, industrial producer prices increased by 4.3% in the euro area and by 4.5% in the EU.
Industrial producer prices in the euro area in March 2021, compared with February 2021, increased by 2.0% in the energy sector, by 1.3% for intermediate goods, by 0.8% for non-durable consumer goods, by 0.3% for capital goods and by 0.2% for durable consumer goods. Prices in total industry excluding energy increased by 0.9%. In the EU, industrial producer prices increased by 1.9% in the energy sector, by 1.5% for intermediate goods, by 0.8% for non-durable consumer goods, by 0.3% for capital goods and by 0.2% for durable consumer goods. Prices in total industry excluding energy increased by 0.9%.
Industrial producer prices in the euro area in March 2021, compared with March 2020, increased by 10.3% in the energy sector, by 4.4% for intermediate goods, by 1.4% for durable consumer goods, by 1.1% for capital goods and by 0.4% for non-durable consumer goods. Prices in total industry excluding energy increased by 2.3%. In the EU, industrial producer prices increased by 10.9% in the energy sector, by 4.6% for intermediate goods, by 1.6% for durable consumer goods, by 1.1% for capital goods and by 0.4% for non-durable consumer goods. Prices in total industry excluding energy increased by 2.5%.
According to the latest figures released by the Society of Motor Manufacturers and Traders (SMMT), April saw an artificial 30-fold increase of new car registrations compared to the same month last year, but volumes still remained -12.9% lower than the 10-year average at just 141,583 new units. This year’s monthly total dwarfed that recorded in April 2020, when the first national lockdown effectively shut the country, and just 4,321 cars were registered.
Retail demand saw the most significant recovery, rising from just 871 registrations last April to 61,935. Click and collect supported the market for the first week and a half until dealerships could reopen on 12 April – a marked contrast from the same month last year, where Covid restrictions effectively prevented private purchases. However, April 2021’s consumer registrations were still -14.5% down on the 10 year average.
Total plug-in vehicle market share broadly followed the trend seen in recent months, accounting for just over one in eight vehicles, or 13.2%. Unusually, plug-in hybrids (PHEVs), at 6.8% of the market, were more popular than battery electric vehicles (BEVs) at 6.5%, following cuts to the Plug-in Car Grant. Monthly BEV uptake was down compared with Q1 2021 overall, however, as they had been running at 7.5% of total registrations.
According to the report from IHS Markit, growth of the eurozone private sector economy improved during April, with latest data indicating the fastest expansion since last July and the second best in over two-and-a-half years.
Eurozone PMI Composite Output Index recording 53.8, up from 53.2 in March. The index has now signalled growth for two consecutive months and latest data indicated concurrent activity gains in both manufacturing and service sectors. Goods producers continued to lead the way, with output rising at a rate little-changed on March’s survey record. Service sector output returned to growth following seven months of continuous contraction, although the gain was only marginal overall.
The IHS Markit Eurozone PMI Services Business Activity Index edged back above the crucial 50.0 no-change mark in April to signal the first growth in service sector activity since August 2020. That said, at 50.5, up from 49.6 in the previous month, the rate of expansion signalled by the index was marginal.
FXStreet reports that economists at Nordea expect EUR/USD to resume falling before long as the improving macro environment and stronger inflation signals are likely to convince at least the Fed to change course.
“The US is likely to outperform all peers growth-wise this year, which over time usually leads to a stronger USD versus other currencies as a result of the side-effects of a stronger growth pace.”
“Our view on USD interest rates could also lead to a reversal of the EUR/USD towards the second half of this year. We find it likely that we will end 2021 on clearly lower levels in EUR/USD compared to current spot, as the USD interest rates are simply more alive than EUR dittos, not least as the ECB seemingly wants to keep printing more into the economic rebound during the spring and early summer. We target 1.15-1.16 in EUR/USD.”
| Time | Country | Event | Period | Previous value | Forecast | Actual |
|---|---|---|---|---|---|---|
| 01:30 | Australia | Building Permits, m/m | March | 20.1% | 3% | 17.4% |
| 06:30 | Switzerland | Consumer Price Index (MoM) | April | 0.3% | 0.2% | 0.2% |
| 06:30 | Switzerland | Consumer Price Index (YoY) | April | -0.2% | 0.3% | 0.3% |
During today's Asian trading, the US dollar rose against the euro and the yen, but fell against the pound.
Demand for the dollar, as one of the most reliable assets, remains high amid the continued high incidence of COVID-19 in a number of countries, including India.
On the eve of the dollar fell on the statement of US Treasury Secretary Janet Yellen. She said that it is likely that interest rates will need to be raised to prevent the US economy from overheating if the budget spending programs proposed by the administration of US President Joe Biden are implemented.
Yellen also said that she is not trying to make forecasts about the policy of the Federal Reserve System (Fed), nor to make recommendations to the Fed.
Yellen's statements implied that rates would have to rise if the economy overheated, said the head of R. W. Pressprich & Co. Larry Milstein.
The ICE index, which tracks the dynamics of the dollar against six currencies (euro, swiss franc, yen, canadian dollar, pound sterling and swedish krona), rose by 0.05%.
FXStreet reports that while economists at Capital Economics expect the economic recovery in the eurozone to be slower than that in the US, they still anticipate that the MSCI EMU will outperform the MSCI USA in the remainder of the year.
“We think the rotation towards sectors that were hit hard by the pandemic, like energy and financials, will resume. We expect the gap in the performance of individual sectors between the US and eurozone to narrow as the euro-zone economy gradually reopens later this year. While a lot of good news on the economy appears to be already discounted in the US, we suspect this may not be the case in the eurozone.”
“We forecast the MSCI EMU to rise by ~3% between now and end-21. This compares with a projected increase of less than 1% for the MSCI USA.”
According to the report from the Federal Statistical Office (FSO), the consumer price index (CPI) increased by 0.2% in April 2021 compared with the previous month, reaching 100.8 points (December 2020 = 100). Inflation was +0.3% compared with the same month of the previous year.
The 0.2% increase compared with the previous month can be explained by several factors including rising prices for fruiting vegetables. Clothing also recorded a price increase, as did hotel accommodation. In contrast, prices for heating oil and berries decreased.
In April 2021, the Swiss Harmonised Index of Consumer Prices (HICP) stood at 100.79 points (base 2015 = 100). This corresponds to a rate of change of +0.3% compared with the previous month and of –0.1% compared with the same month the previous year. Due to the effects of the pandemic, the same missing price imputation techniques used for the CPI were introduced for the HICP.
EUR/USD
Resistance levels (open interest**, contracts)
$1.2106 (2039)
$1.2067 (1476)
$1.2040 (3192)
Price at time of writing this review: $1.2004
Support levels (open interest**, contracts):
$1.1981 (1037)
$1.1944 (2248)
$1.1898 (1931)
Comments:
- Overall open interest on the CALL options and PUT options with the expiration date May, 7 is 60168 contracts (according to data from May, 4) with the maximum number of contracts with strike price $1,2000 (3192);
GBP/USD
$1.4010 (1052)
$1.3971 (679)
$1.3940 (1173)
Price at time of writing this review: $1.3896
Support levels (open interest**, contracts):
$1.3824 (276)
$1.3786 (452)
$1.3761 (328)
Comments:
- Overall open interest on the CALL options with the expiration date May, 7 is 11373 contracts, with the maximum number of contracts with strike price $1,4200 (2932);
- Overall open interest on the PUT options with the expiration date May, 7 is 19095 contracts, with the maximum number of contracts with strike price $1,3700 (2038);
- The ratio of PUT/CALL was 1.68 versus 1.66 from the previous trading day according to data from May, 4
* - The Chicago Mercantile Exchange bulletin (CME) is used for the calculation.
** - Open interest takes into account the total number of option contracts that are open at the moment.
eFXdata reports that MUFG Research discusses the pound's prospects in light of the Scottish parliamentary elections on Thursday.
"The pro-independence parties of the SNP (68), Alba Party (2) and Greens (9) are expected to win 79 out of the 129 seats available.
A majority for the SNP on its own could trigger some initial pound selling by strengthening the SNP’s case to hold a fresh independence referendum. However, we share the market’s view that the negative pound reaction this week should be relatively limited...The UK government is unlikely to be sympathetic to calls to hold a fresh independence referendum during the pandemic," MUFG adds.
RTTNews reports that Statistics New Zealand said that the jobless rate in New Zealand came in at a seasonally adjusted 4.7 percent in the first quarter of 2021. That was shy of estimates for 4.9 percent, which would have been unchanged from the previous three months.
The employment change was 0.6 percent on quarter, steady from the three months prior but surpassing expectations for 0.2 percent.
The participation rate was 70.4 percent in the first quarter - beating forecasts for 70.3 percent and up from 70.2 percent in the previous quarter.
The number of unemployed people fell to 135,000 (down 5,000) as 3,000 more men were unemployed and 8,000 fewer women were unemployed.
The underutilization rate rose to 12.2 percent in the March 2021 quarter, up from 11.8 percent last quarter.
In Q1, the number of people who were underutilized rose to 366,000 (up 15,000) as 7,000 more men were underutilized and 8,000 more women were underutilized.
The employment rate rose to 67.1 percent, up from 66.8 percent last quarter.
In the first quarter, there were 15,000 more employed people than last quarter, up to 2,750,000 as 2,000 more men were employed and 14,000 more women were employed.
| Raw materials | Closed | Change, % |
|---|---|---|
| Brent | 69.6 | 2.4 |
| Silver | 26.486 | -1.43 |
| Gold | 1779.098 | -0.74 |
| Palladium | 2975.31 | 0.4 |
| Time | Country | Event | Period | Previous value | Forecast |
|---|---|---|---|---|---|
| 01:30 (GMT) | Australia | Building Permits, m/m | March | 21.6% | 3% |
| 06:30 (GMT) | Switzerland | Consumer Price Index (MoM) | April | 0.3% | 0.2% |
| 06:30 (GMT) | Switzerland | Consumer Price Index (YoY) | April | -0.2% | 0.3% |
| 07:50 (GMT) | France | Services PMI | April | 48.2 | 50.4 |
| 07:55 (GMT) | Germany | Services PMI | April | 51.5 | 50.1 |
| 08:00 (GMT) | Eurozone | Services PMI | April | 49.6 | 50.3 |
| 09:00 (GMT) | Eurozone | Producer Price Index, MoM | March | 0.5% | 1.1% |
| 09:00 (GMT) | Eurozone | Producer Price Index (YoY) | March | 1.5% | 4.2% |
| 12:15 (GMT) | U.S. | ADP Employment Report | April | 517 | 750 |
| 13:45 (GMT) | U.S. | Services PMI | April | 60.4 | 63.1 |
| 14:00 (GMT) | U.S. | ISM Non-Manufacturing | April | 63.7 | 64.3 |
| 14:30 (GMT) | U.S. | Crude Oil Inventories | April | 0.09 | -2.191 |
| 22:30 (GMT) | Canada | BOC Gov Tiff Macklem Speaks | |||
| 22:45 (GMT) | New Zealand | Building Permits, m/m | March | -18.2% | |
| 23:50 (GMT) | Japan | Monetary Policy Meeting Minutes |
| Pare | Closed | Change, % |
|---|---|---|
| AUDUSD | 0.77111 | -0.62 |
| EURJPY | 131.252 | -0.22 |
| EURUSD | 1.2011 | -0.42 |
| GBPJPY | 151.726 | 0.03 |
| GBPUSD | 1.38829 | -0.17 |
| NZDUSD | 0.71465 | -0.72 |
| USDCAD | 1.23049 | 0.24 |
| USDCHF | 0.91334 | 0.27 |
| USDJPY | 109.284 | 0.22 |


© 2000-2024. Bản quyền Teletrade.
Trang web này được quản lý bởi Teletrade D.J. LLC 2351 LLC 2022 (Euro House, Richmond Hill Road, Kingstown, VC0100, St. Vincent and the Grenadines).
Thông tin trên trang web không phải là cơ sở để đưa ra quyết định đầu tư và chỉ được cung cấp cho mục đích làm quen.
Giao dịch trên thị trường tài chính (đặc biệt là giao dịch sử dụng các công cụ biên) mở ra những cơ hội lớn và tạo điều kiện cho các nhà đầu tư sẵn sàng mạo hiểm để thu lợi nhuận, tuy nhiên nó mang trong mình nguy cơ rủi ro khá cao. Chính vì vậy trước khi tiến hành giao dịch cần phải xem xét mọi mặt vấn đề chấp nhận tiến hành giao dịch cụ thể xét theo quan điểm của nguồn lực tài chính sẵn có và mức độ am hiểu thị trường tài chính.
Sử dụng thông tin: sử dụng toàn bộ hay riêng biệt các dữ liệu trên trang web của công ty TeleTrade như một nguồn cung cấp thông tin nhất định. Việc sử dụng tư liệu từ trang web cần kèm theo liên kết đến trang teletrade.vn. Việc tự động thu thập số liệu cũng như thông tin từ trang web TeleTrade đều không được phép.
Xin vui lòng liên hệ với pr@teletrade.global nếu có câu hỏi.
ngân hàng