- Phân tích
- Tin tức và các công cụ
- Tin tức thị trường
Tin tức thì trường
- The daily indicators hint at a strengthening bullish momentum.
- Hourly indicators are consolidating after hitting overbought conditions earlier in the session.
- If the buyers regain the 100-day SMA, the bearish trend will be threatened.
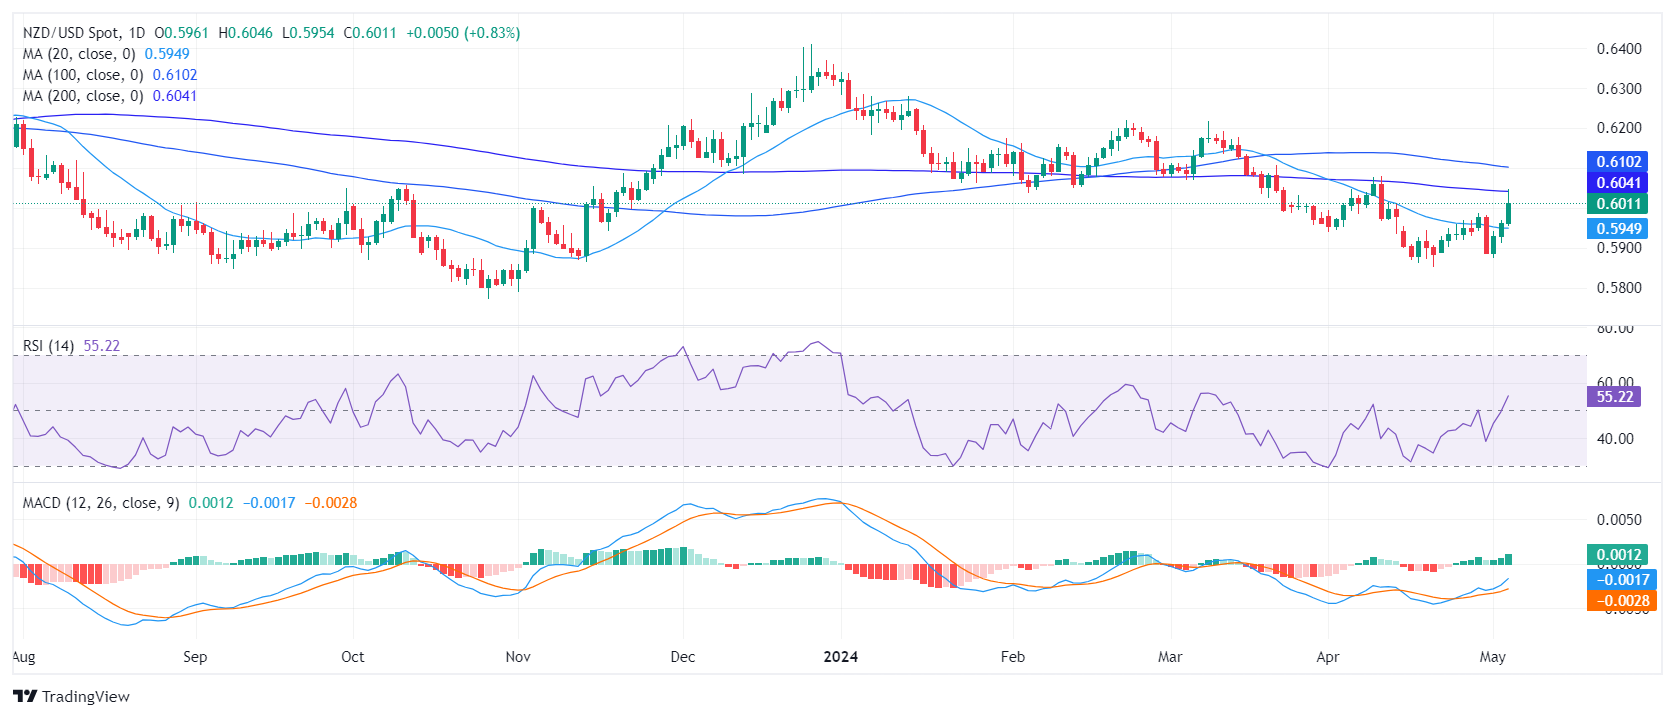
At the end of the week, the NZD/USD rallied to around 0.6050, up by 0.80%. Bullish momentum is picking up but the overall trend is still tilted in favor of the sellers. Further bullish validation is needed after the pair's unsuccessful attempt to cross a crucial 100-day Simple Moving Average (SMA) during Friday's session.
On the daily chart, the Relative Strength Index (RSI) shows a shift towards a stronger bullish trend. The last session recorded an RSI of 56, settling in positive territory. This solidifies a consistent increase in momentum in favor of buyers after being below 50 since early April.
NZD/USD daily chart
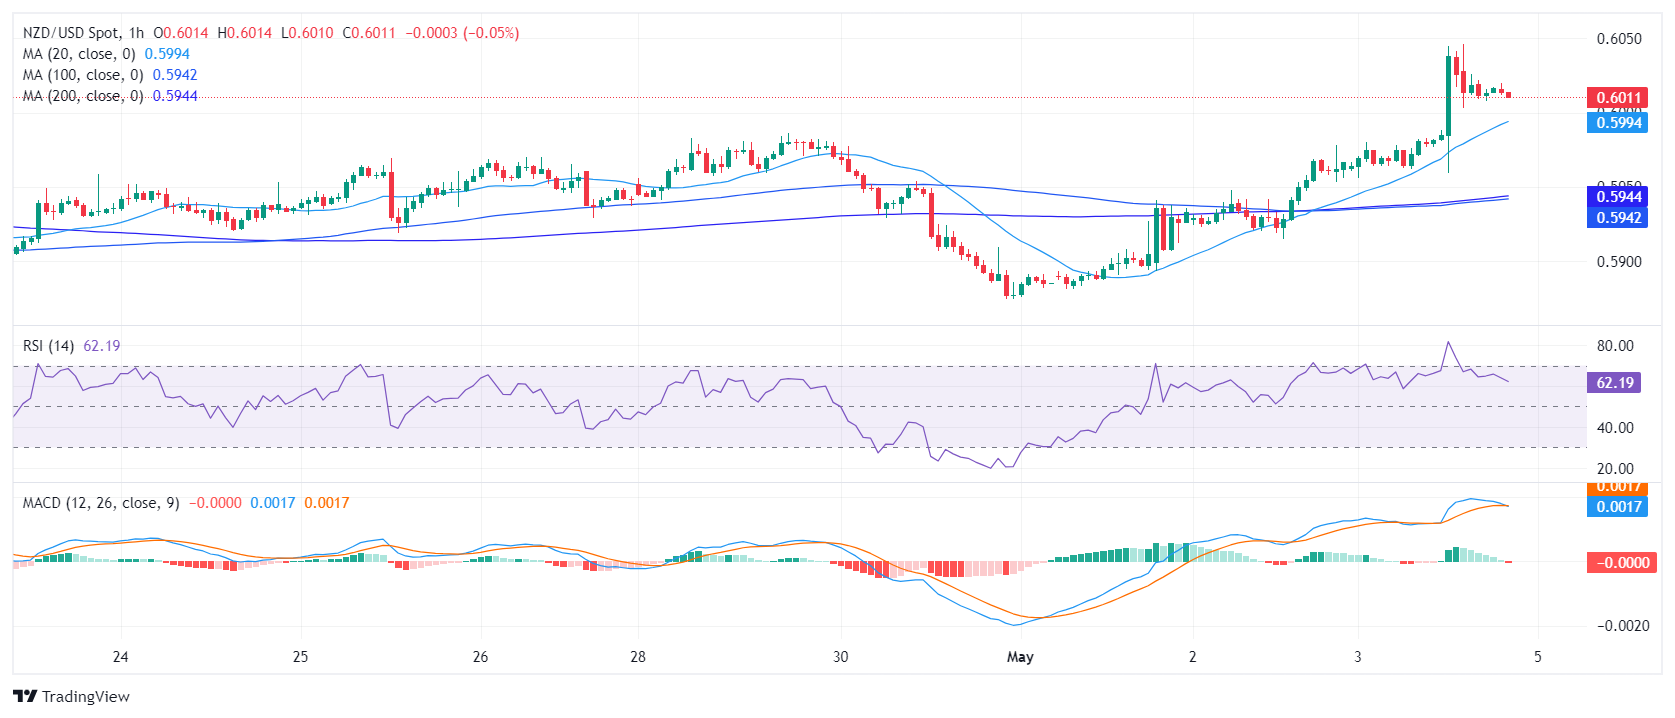
Examining the hourly chart, a similar viewpoint is observed. The RSI measures 62, but somewhat flattened after jumping above 70 earlier in the session. In addition, the Moving Average Convergence Divergence (MACD) histogram exhibited consistent red bars, signaling a potential deceleration in the bullish momentum.
NZD/USD hourly chart
Regarding the overall market trend, the NZD/USD is trading below the 100, and 200-day SMA which confirms the presence of significant downside pressure on the pair and challenges short-term buyers. Notably, the pair encountered rejection around the 100-day SMA at the 0.6100 level during Friday’s session, suggesting the buyers still need more traction to turn the outlook bullish. However, the break above the 20-day SMA definitely brightened the outlook for the short term.
- EUR/USD found a fresh high above 1.08 after NFP figures sparked rate cut hopes.
- US economic data came in broadly softer on Friday.
- Coming up next week: European Retail Sales, US consumer sentiment.
EUR/USD drove into a fresh weekly high on Friday, breaking above recent congestion after a broad miss in US Nonfarm Payrolls (NFP) labor and wages figures that reignited broad-market hopes for an accelerated path towards Federal Reserve (Fed) rate cuts.
US NFP comes in soft, hardens rate cut bets
US NFP net job additions in April printed at 175K, below the forecast 243K and falling away from the previous month’s 315K, which was revised upwards from 303K. Average Hourly Earnings grew by 0.2% MoM in April, below the forecast 0.3%.
ISM US Services Purchasing Managers Index (PMI) figures also declined, surprising markets that were expecting an uptick in forward-looking business operator sentiment. April’s ISM Services PMI printed at 49.4, a 16-month low, declining below the contractionary 50.0 level and missing the forecast print of 52.0 versus the previous 51.4.
A sticking point for rate cut hopes was ISM Services Prices Paid, which showed an increase to 59.2 MoM in April as business operating costs accelerate to the upside, climbing from 53.4.
Coming up next week, European Retail Sales figures are scheduled for Tuesday, and median market forecasts are expecting Euro area sales to grow 0.6% MoM in March after the previous month’s -0.5% decline. On the US side, next Friday’s print of the Michigan Consumer Sentiment Index will provide a key finger on the pulse of how deflated consumer expectations for the US economy are getting. May’s Michigan Consumer Sentiment Index is forecast to ease slightly to 77.0 from the previous month’s 77.2.
EUR/USD technical outlook
EUR/USD broke north of recent consolidation on Friday, ticking into a fresh weekly high of 1.0813, climbing out of a rough supply zone between 1.0740 and 1.0720. The week’s low is parked at 1.0650, etching in a near-term swing high as bidders try to knock the pair back into a bullish run.
Friday’s bullish push sent the EUR/USD into the 200-day Exponential Moving Average (EMA) at the 1.0800 handle, with a raft of late-week profit-taking pulling the pair back into 1.0760 as markets head off for the weekend.
EUR/USD hourly chart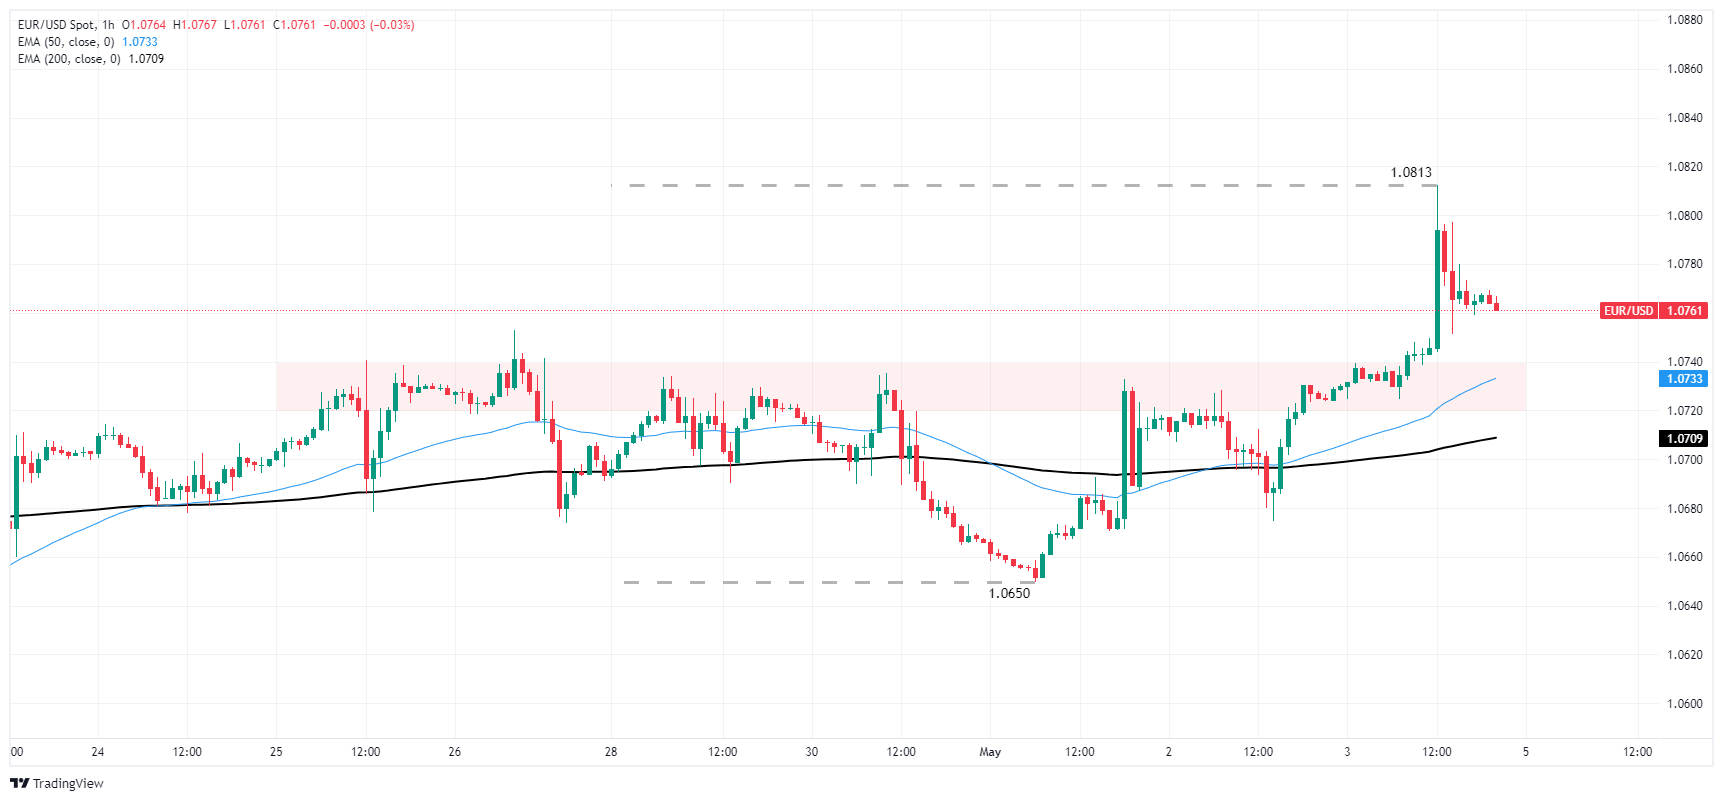
EUR/USD daily chart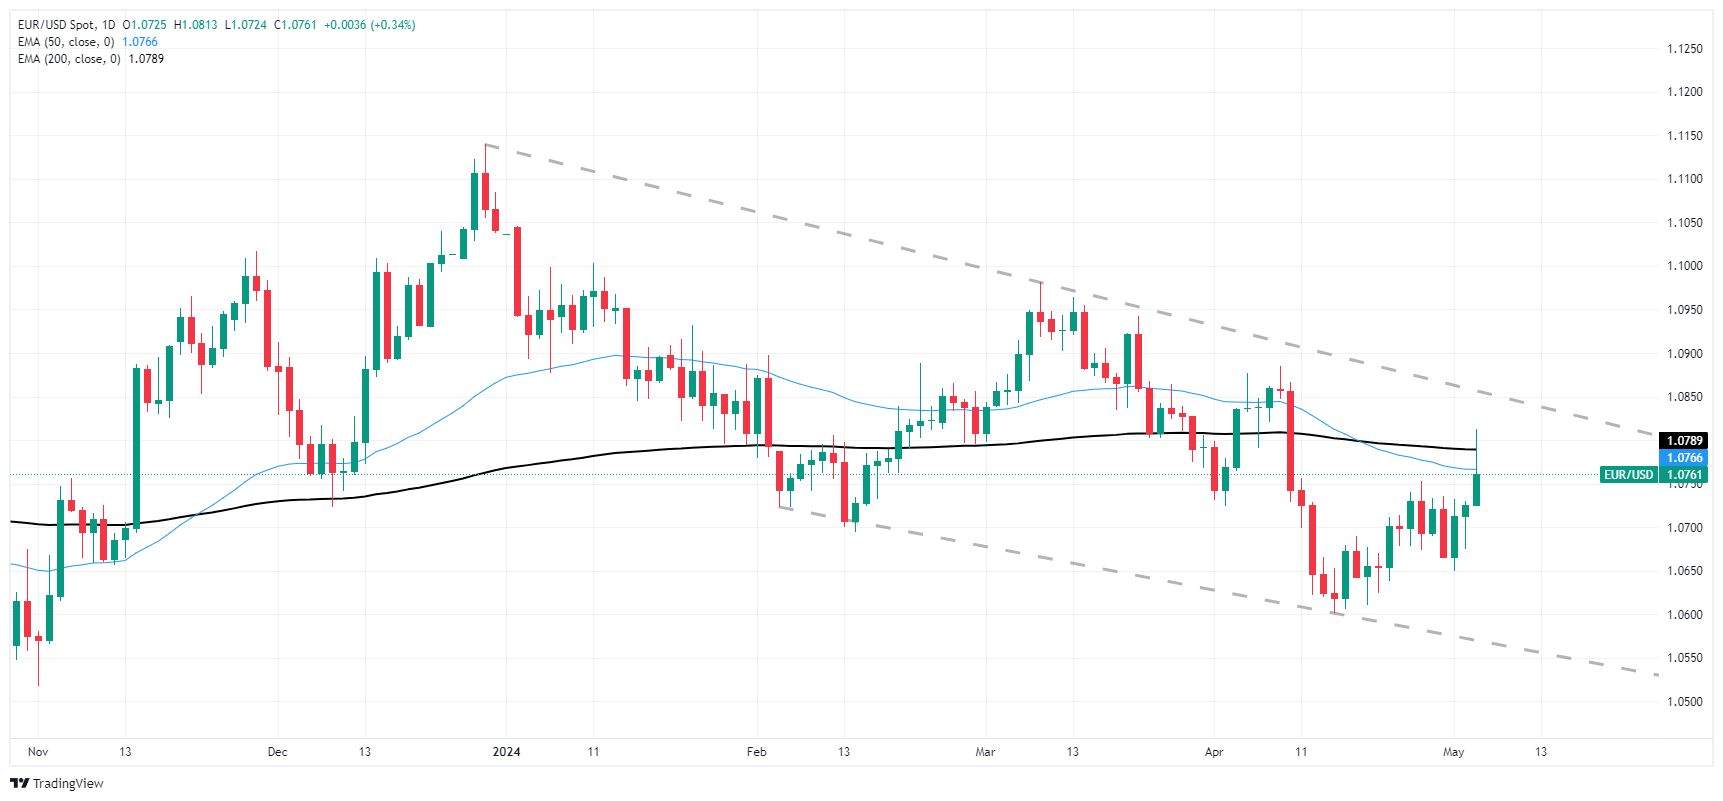
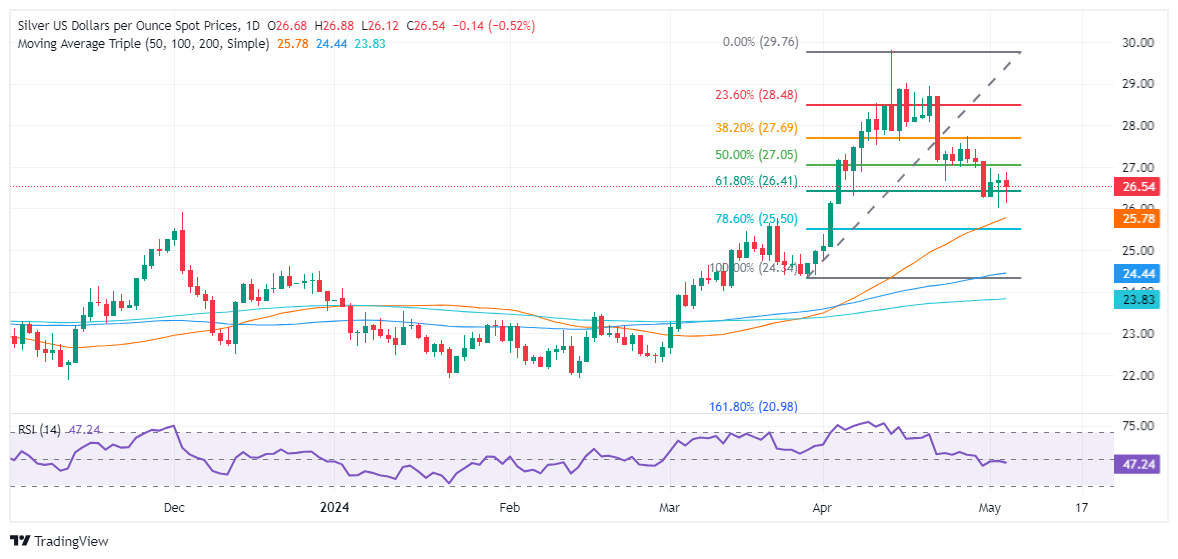
- Silver dips to $26.54, down 0.43%; 'dragonfly doji' hints at possible uptrend.
- Finds support at 61.8% Fibonacci level ($26.41); crossing $27.00 could boost bullish momentum.
- Downside risk if below May 2 low of $26.02, aiming for 50-day MA at $25.79.
Silver price uptrend continued during the week despite registering losses of around 2.40%. Nevertheless, May 2’s price action forming a ‘dragonfly doji,’ a bullish candle, alongside technical indicators suggesting that the grey metal remains bullish, could pave the way for a recovery. At the time of writing, XAG/USD trades at $26.54, down 0.43%.
XAG/USD Price Analysis: Technical outlook
As previously mentioned, Silver remains bullishly biased after posting an impressive rally that passed the $29.00 mark. It appears to have bottomed out at around the 61.8% Fibonacci retracement at $26.41, though buyers had been unable to test the $27.00 mark.
Although momentum had shifted bearishly, with the Relative Strength Index (RSI) diving below the 50-midline, upside risks remain. If buyers reclaim the $27.00 figure, that could reignite buying pressure and pave the way to challenge the next resistance level seen at the 38.2% Fibo retracement at $27.70. Once surpassed, the next step would be the 23.6% Fibo retracement at $28.49.
Nevertheless, with the RSI standing at bearish territory, sellers need to push prices below the May 2 low of $26.02. Once cleared the next stop would be the 50-day moving average (DMA) at $25.79, followed by the 78.6% Fibo retracement at $25.50.
XAU/USD Price Action – Daily Chart
- US NFP increased by 175K in April, below expectations of 243K, following March’s revised increase of 315K.
- Unemployment rose slightly to 3.9% while wage inflation decelerated.
- The odds of a cut in September by the Fed rose significantly.
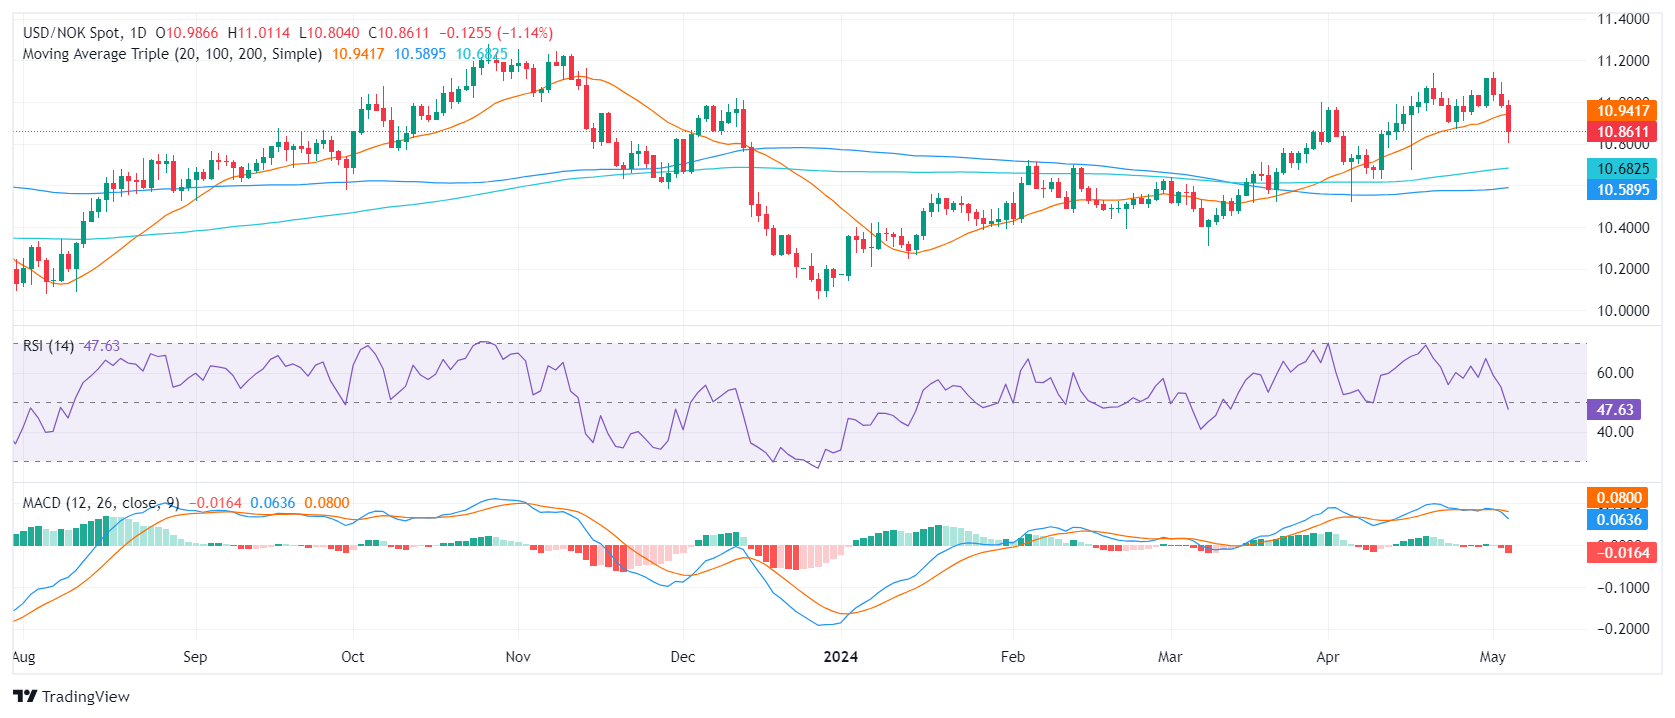
The USD/NOK pair is trading at 10.861, exhibiting a decline of 1.19% on Friday’s session. The USD faced downward pressure as markets are now betting on higher chances of a rate cut by the Federal Reserve (Fed) in September, following the report of weak Nonfarm Payrolls.
April's NFP report from the US showed a gain of 175K jobs, which was significantly below the market expectation of 243K and a decrease from March's revised figure of 315 K. This slowdown in job growth, combined with the slight rise in the unemployment rate from 3.8% to 3.9%, points towards a cooling labor market. Moreover, the wage inflation rate also dipped from 4.1% to 3.9% annually, suggesting softer wage pressures, which can influence the Federal Reserve's approach to monetary policy. The report's overall outcome, reflecting a deceleration in several key employment metrics, highlights a potentially weakening economic momentum.
This supports a more cautious monetary policy approach, aligning with the Federal Reserve's recent moves towards policy normalization and possibly setting the stage for a first cut in September which according to the CME FedWatch tool, increased above 50%.
USD/NOK technical analysis
On the daily chart, the Relative Strength Index (RSI) for the USD/NOK pair has moved into negative territory. The indicator was trending positively, nearing overbought conditions, but then reversed to bearish, signaling a tendency for a sell-off. Concurrently, the Moving Average Convergence Divergence (MACD) histogram prints red bars, confirming the presence of strong selling pressure.
Analyzing the broader outlook, it's crucial to note the USD/NOK has made significant strides today, dipping below its 20-day Simple Moving Average (SMA). However, the pair remains firmly above the 100-day and 200-day SMAs. This reveals a potentially bearish short-term trend but confirms the bullish long-term position of the USD/NOK.
USD/NOK daily chart
- GBP/JPY lethargic near 192.00 handle.
- Overactive BoJ financing reports tips hat towards FX intervention.
- Coming up next week: BoE rate call, UK GDP.
GBP/JPY is trading flat near the 192.00 handle after the Bank of Japan (BoJ) is suspected of directly intervening in FX markets to prop up the battered Japanese Yen (JPY) twice in two days earlier this week. According to disclosure reporting from the BoJ, the Japanese central bank overspent on uncategorized financing operations by around 9 trillion Yen. The massive overshoot in BoJ financing operations strongly implies direct market intervention on behalf of the Yen, though no official statements have been made in either direction.
Coming up next week, The Bank of England (BoE) delivers its latest rate call and economic outlook statement, with late next week seeing a fresh update on UK economic growth with a quarterly Gross Domestic Product (GDP) update. UK QoQ GDP is currently forecast to rebound to 0.4% versus the previous quarter.
Japanese markets return to the fold after a raft of holiday observations this week, but Japanese data releases remain limited to low-tier prints. Investors will be keeping an eye out for any official statements from the BoJ on market operations in the days to come.
GBP/JPY technical outlook
The GBP/JPY kicked off the trading week hitting a 34-year peak bid of 200.60 before strong JPY activity dragged the pair down nearly 900 pips, or -4.4%, peak-to-trough, hitting a bottom bid near 191.80, and the pair has settled into a holding pattern near that level.
Despite a recent knockdown from multi-decade highs, the Guppy remains firmly planted in bull country, with the pair still trading well above the 200-day Exponential Moving Average (EMA) at 185.70. The pair is still up nearly 7% since the start of 2024, and is still a scorching 54% from the 2020 low near 124.00.
GBP/JPY hourly chart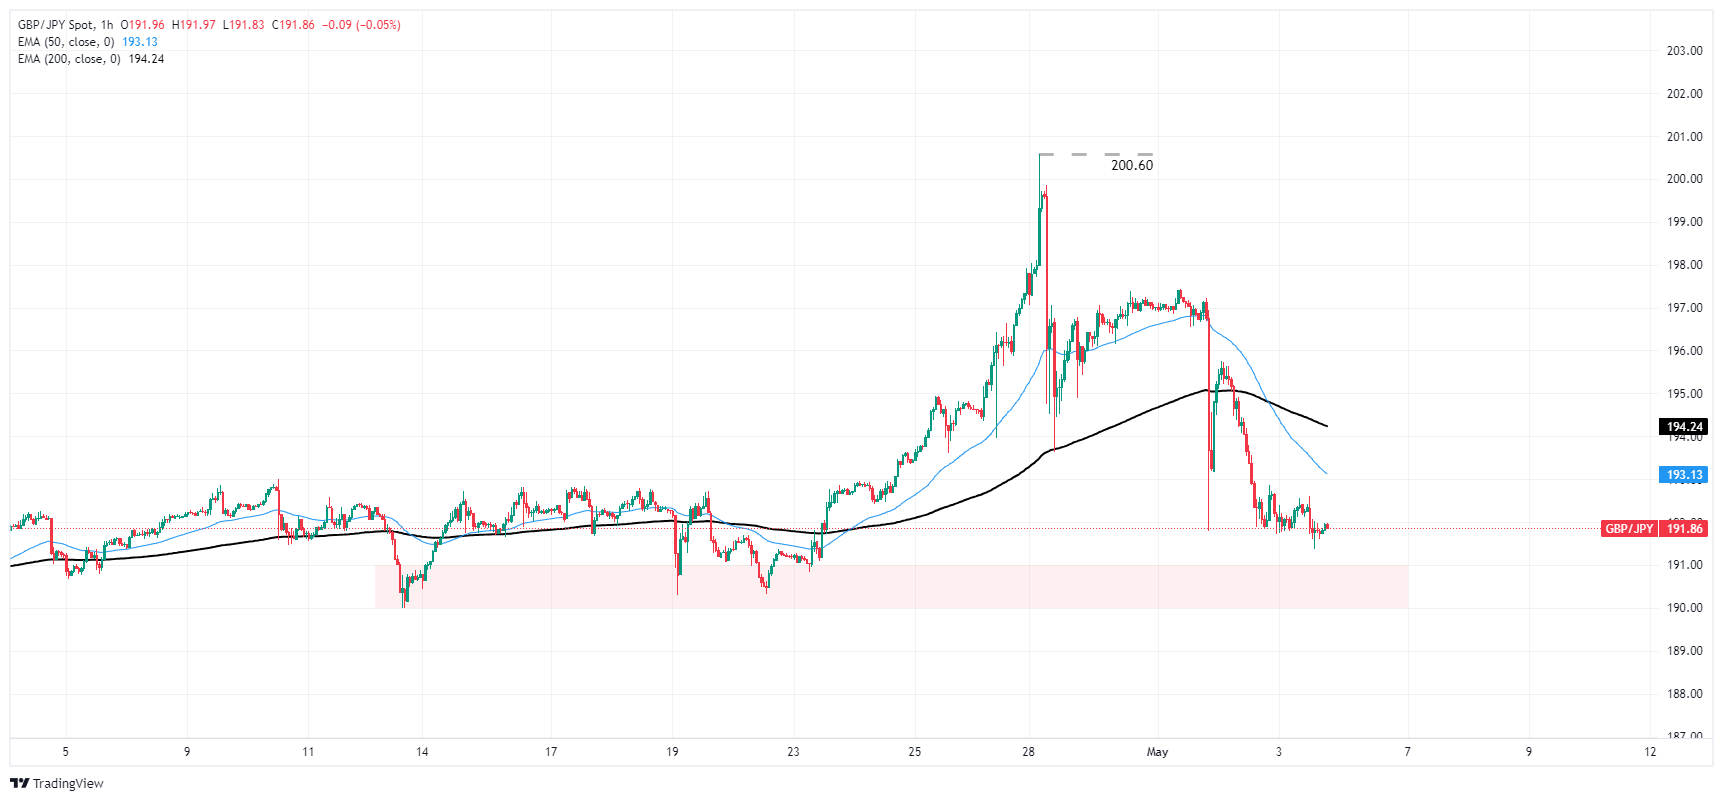
GBP/JPY daily chart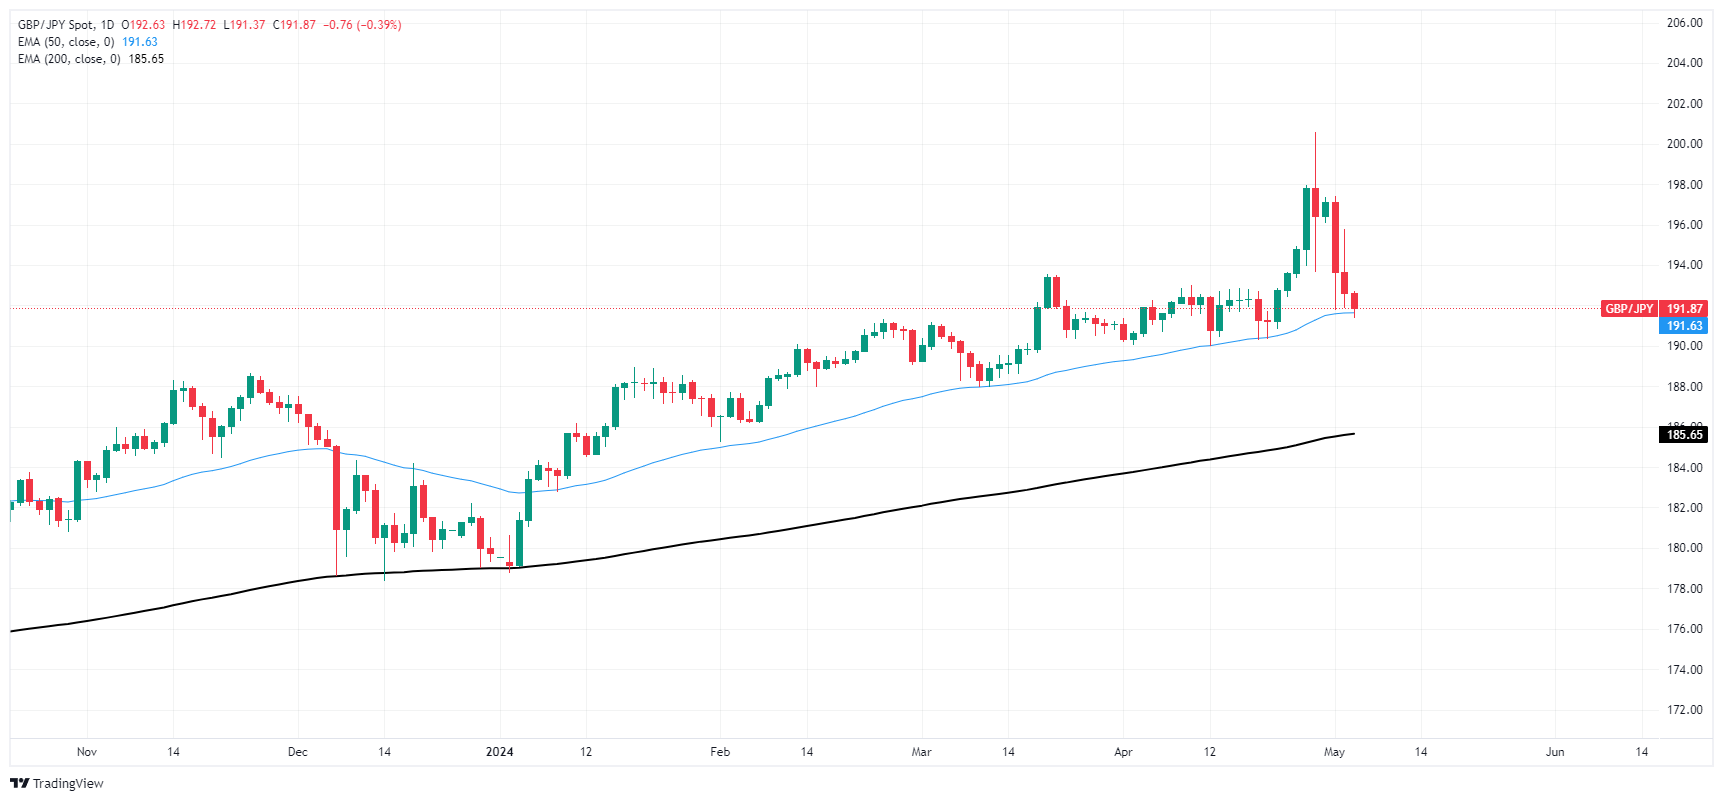
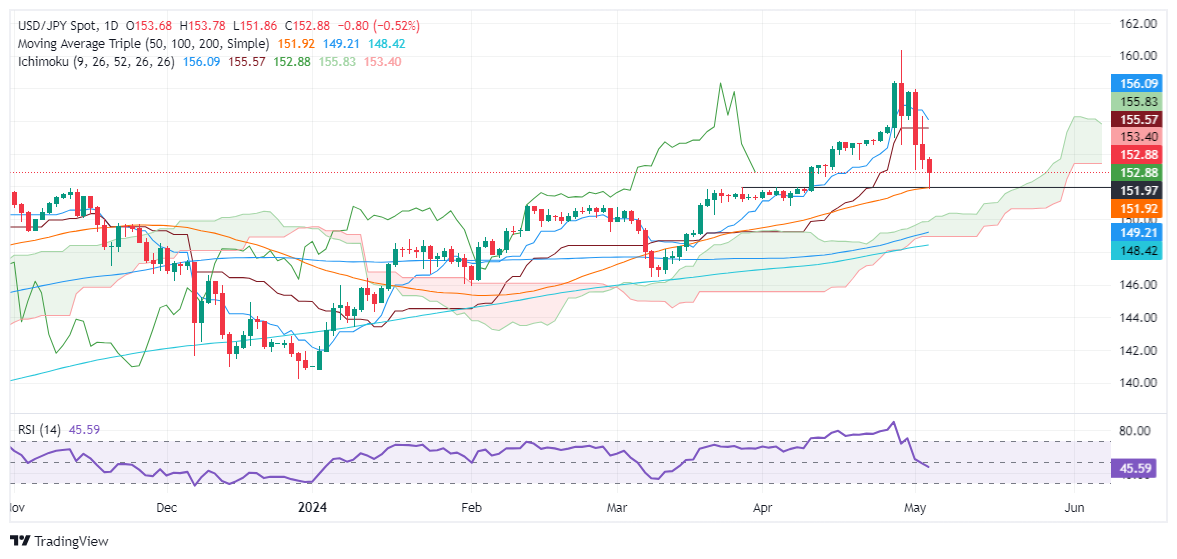
- USD/JPY drops 0.49%, extending a downtrend possibly sparked by earlier BoJ intervention.
- Bearish harami pattern observed; recovery contingent on breaking 153.00 resistance.
- Key support at 152.00; further declines may target April's low of 150.81.
The USD/JPY dropped for the third straight day and accumulated losses of more than 3.40% in the week after a suspected intervention by the Bank of Japan (BoJ) on Monday. Since then, the pair formed a two-candlestick chart pattern, a ‘bearish harami’ which reassembles an inside day, confirmed by Wednesday’s price action. That said, on Friday, the pair fell 0.49% and traded at 152.93.
USD/JPY Price Analysis: Technical outlook
Despite retreating sharply during the week, the USD/JPY is still upward biased, as shown by the daily chart. The pair registered a daily low at the confluence of October 21, 2022, low and the 50-day moving average at around 151.87/92, but buyers lifted the pair toward current exchange rates.
If buyers push prices above 153.00 and achieve a daily close above the latter, that could pave the way for further gains. The first resistance would be the Senkou Span B at 153.35, followed by the 154.00 figure. Further gains are seen once those levels are surpassed, with the next resistance seen at the confluence of the Senkou Span A and the Kijun-Sen at 155.78.
On the other hand, the first support would be the 152.00 mark, followed by the previously mentioned confluence of the 50-DMA and October’s 2022 high at 151.92/87. A breach of that level would cause the pair to dive toward April’s 5 low at 150.81.
USD/JPY Price Action – Daily Chart
- The daily RSI and MACD reflect a negative trend, hinting at increasing selling pressure.
- Hourly chart indicators echo the bearish sentiment, with RSI around the 40 level and MACD showing a lack of buying momentum.
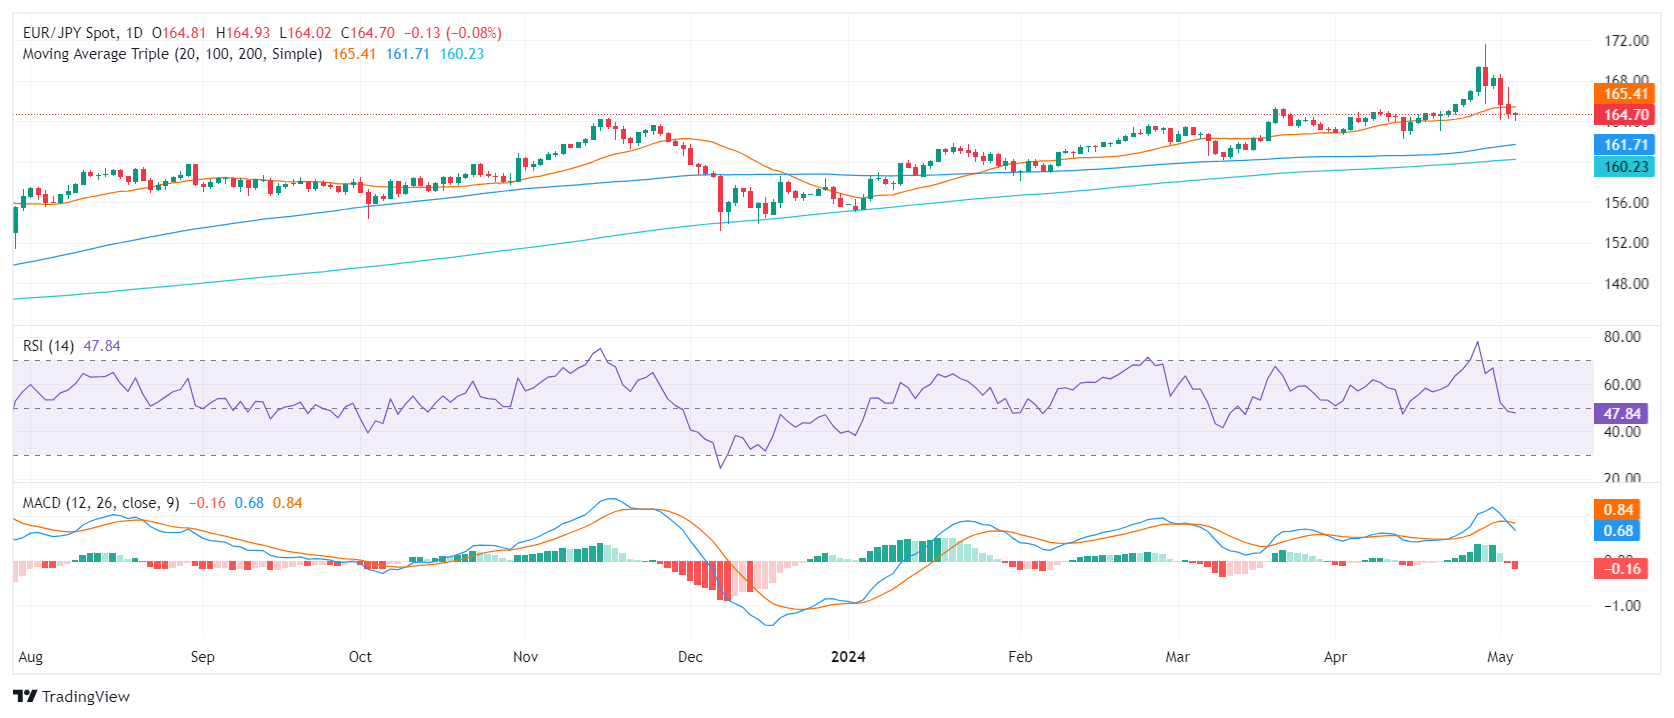
The EUR/JPY pair declined to 164.72 on Friday, reflecting subtle bears' influence with daily losses. Despite bearish signals in the daily short-term outlook, the pair's positioning above the key Simple Moving Averages (SMAs) hints at ongoing dominance by the buyers.
The daily chart reveals that the Relative Strength Index (RSI) fell into negative territory. The Moving Average Convergence Divergence (MACD) also depicts a bearish momentum with a series of rising red bars, suggesting that sellers are currently dominating the market.
EUR/JPY daily chart
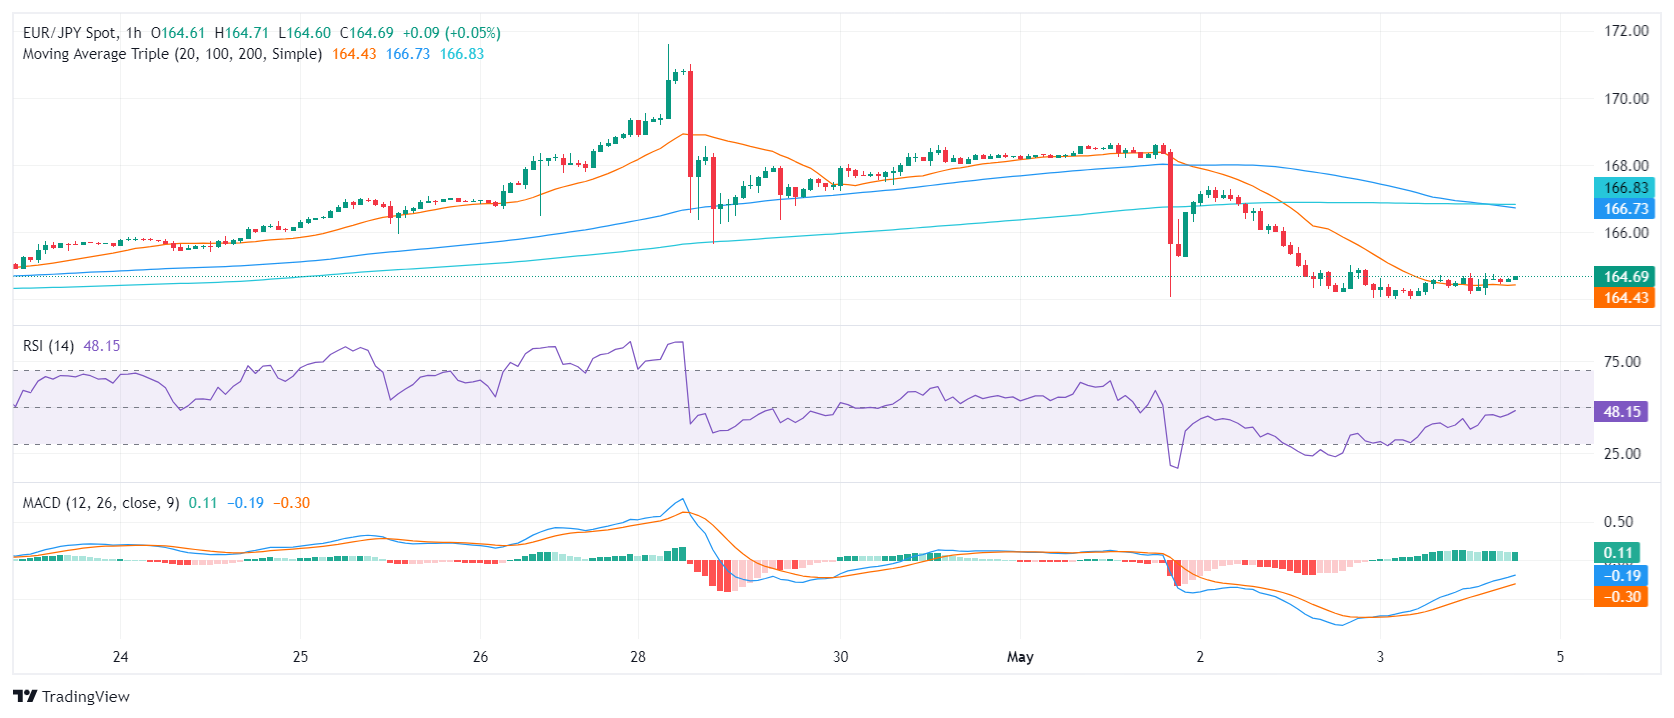
On the hourly chart, RSI continues to suggest a negative trend, hovering around the 40 levels, flirting with the oversold threshold, and showcasing the dominance of the sellers. The hourly MACD shows flat green bars, indicating a lack of strong momentum in these shorter time frames.
EUR/JPY hourly chart
Considering the overall market posture, the EUR/JPY is positioned above its longer-term Simple Moving Average (SMA) of 100, and 200-day periods. This usually signals a bullish momentum in both the medium and long term. However, the fall of the 20-day SMA means that the short-term outlook is painted with bearishness, and bears might attempt to reclaim the 100-day SMA at 161.70, which would definitely worsen the technical outlook in case of conquering.
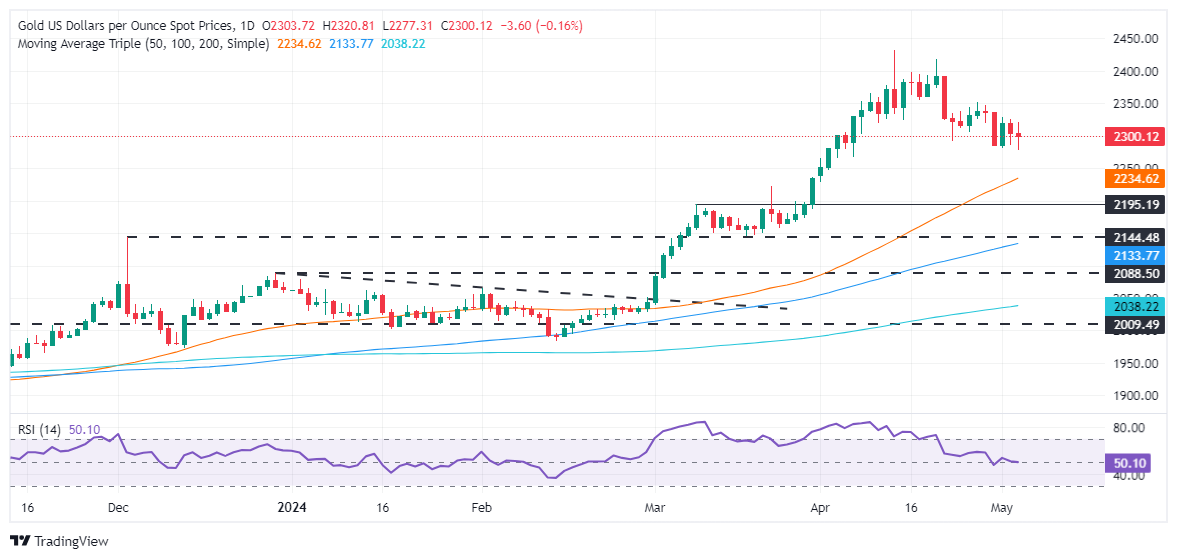
- Gold peaked at $2,310 but reversed gains, unable to surpass the May 2 high of $2,326.
- US Nonfarm Payrolls missed expectations, leading to lower real yields and diminished safe-haven appeal for Gold.
- Federal Reserve officials offer mixed signals, with Governor Bowman ready to hike rates.
Gold erased its earlier gains on Friday after the US Bureau of Labor Statistics (BLS) revealed that Nonfarm Payrolls for April missed estimates, depicting a cooling jobs market. On the release, the golden metal edged toward its daily high of $2,310 but failed to crack May 2’s high of $2,326, exacerbating a retracement to current spot prices.
The XAU/USD trades beneath the $2,300 figure, down by 0.24%. Wall Street portrays an optimistic mood, which is weighing on the safe-haven appeal of the non-yielding metal. Of note, US Treasury yields are sliding, with the 10-year benchmark note down seven basis points. US real yields which correlate inversely to Gold prices, fall six and a half basis points, from 2.219% to 2.146%.
A US “goldilocks” scenario looms following the US NFP report, as the Institute for Supply Management (ISM) showed that business activity in the services sector contracted for the first time since December 2022.
Elsewhere, a slew of Federal Reserve officials has crossed the newswires. Fed Governor Bowman was hawkish in an interview with Bloomberg Television, saying that she’s willing to hike rates if inflation stalls or reverses. Recently, Chicago Fed Austan Goolsbee added that the latest US employment report was solid, emphasizing that current monetary policy is restrictive.
Daily digest market movers: Gold dwindles around $2,300 amid falling US yields. offered US Dollar
- Gold prices remain underpinned by lower US Treasury yields and a softer US Dollar. The US 10-year Treasury note is yielding 4.506%, down seven basis points (bps) from its opening level. The US Dollar Index (DXY), which tracks the Greenback’s performance against six other currencies, edged down 0.29% and is at 105.04.
- April US Nonfarm Payrolls revealed by the Department of Labor, showed the economy added just 175,000 jobs below forecasts of 240,000 and March upward revised 315,000.
- Additional data revealed that the Unemployment Rate increased slightly from 3.8% to 3.9%. Furthermore, Average Hourly Earnings (AHE) grew by only 0.2%, falling short of the expected 0.3%.
- The ISM April Services PMI fell below the critical 50.0 mark, indicating contraction, with a reading of 49.4, which was lower than expected and below the figure for March. A detailed look into the report reveals a slowdown in the Employment subcomponent, alongside a rise in Prices Paid.
- After the data release, Fed rate cut probabilities increased, with traders expecting 38 basis points of rate cuts toward the end of the year.
- The Federal Reserve’s first-rate cut is seen in September, with odds standing at 87.30% for a 0.25% rate cut. The chances for another quarter of a rate cut in December 2024 stood at 79.01%. This means the federal funds rate would finish the year at the 4.75% - 5.00% range.
Technical analysis: Gold price drops but stays above $2,300
Gold price remains upward biased, though it has remained at around the $2,280-$2,340 range during the week. It should be said that momentum is still favoring a resumption of the uptrend, with the Relative Strength Index (RSI) standing above the 50-midline. Nevertheless, downside risks remain if XAU/USD tumbles below $2,300.
If buyers keep the yellow metal above $2,300, the first resistance would be $2,330. Once cleared, the next stop would be the April 26 high of $2,352, which could open the door to challenging $2,400. Further upside is seen at the April 19 high at $2,417 and the all-time high of $2,431.
Conversely, a bearish continuation looms if Gold sellers drive prices below $2,300, exacerbating a pullback toward the April 23 daily low of $2,291. Subsequent losses are expected, beneath the March 21 daily high, which turned support at $2,223, followed by $2,200.
Gold FAQs
Gold has played a key role in human’s history as it has been widely used as a store of value and medium of exchange. Currently, apart from its shine and usage for jewelry, the precious metal is widely seen as a safe-haven asset, meaning that it is considered a good investment during turbulent times. Gold is also widely seen as a hedge against inflation and against depreciating currencies as it doesn’t rely on any specific issuer or government.
Central banks are the biggest Gold holders. In their aim to support their currencies in turbulent times, central banks tend to diversify their reserves and buy Gold to improve the perceived strength of the economy and the currency. High Gold reserves can be a source of trust for a country’s solvency. Central banks added 1,136 tonnes of Gold worth around $70 billion to their reserves in 2022, according to data from the World Gold Council. This is the highest yearly purchase since records began. Central banks from emerging economies such as China, India and Turkey are quickly increasing their Gold reserves.
Gold has an inverse correlation with the US Dollar and US Treasuries, which are both major reserve and safe-haven assets. When the Dollar depreciates, Gold tends to rise, enabling investors and central banks to diversify their assets in turbulent times. Gold is also inversely correlated with risk assets. A rally in the stock market tends to weaken Gold price, while sell-offs in riskier markets tend to favor the precious metal.
The price can move due to a wide range of factors. Geopolitical instability or fears of a deep recession can quickly make Gold price escalate due to its safe-haven status. As a yield-less asset, Gold tends to rise with lower interest rates, while higher cost of money usually weighs down on the yellow metal. Still, most moves depend on how the US Dollar (USD) behaves as the asset is priced in dollars (XAU/USD). A strong Dollar tends to keep the price of Gold controlled, whereas a weaker Dollar is likely to push Gold prices up.
- Dow Jones gains 400-plus points as investors raise bets on rate cuts.
- US data broadly softer on key labor print.
- Tech stocks dragging Dow Jones higher.
The Dow Jones Industrial Average (DJIA) climbed 1.15% on Friday after a broad miss from US Nonfarm Payrolls (NFP) and other key labor data revealed a steep weakening in the US domestic economy, sparking increased bets of rate cuts from the Federal Reserve. The US added fewer jobs than expected in April, and the Unemployment Rate ticked higher. The ISM Services Purchasing Managers Index (PMI) also fell to a 16-month low as economic activity confirms a steepening economic slowdown.
Markets are counter-intuitively betting against the US economy, bidding equities broadly higher as economic data begins to deteriorate. According to the CME’s FedWatch Tool, rate markets now see a 64% chance of at least a quarter-point rate cut at the Fed’s September meeting.
Softer jobs and wages figures boost rate cut hopes
April’s NFP labor report showed the US added 175K net new jobs over the month, below the forecast 243K. The previous month saw an upside revision to 315K from 303K. Average Hourly Earnings in April grew by 0.2% MoM, below the expected 0.3%. ISM Services PMI unexpectedly fell to a 16-month low of 49.4, below the key contractionary 50.0 level and missing the forecast increase to 52.0 from 51.4.
The single thorn in the side of rate cut hopes came from ISM Services Prices Paid in April, which climbed back up to 59.2 from the previous 53.4 as inflationary pressures continue to plague the domestic US economy.
Dow Jones news
The Dow Jones climbed over 1% on Friday, dragged higher by a smattering of technology stocks while the downside remains relatively capped. Amgen Inc. (AMGN), a biotech firm, soared 12.5% on the day, gaining around 45 points to trade above $313.00 per share. Amgen was followed by Apple Inc. (AAPL), climbing 7% on Friday to gain 12 points and trade above $185.00 per share.
On the low side, Chevron Corp. (CVX) fell -1.12%, shedding -1.8 points and falling below $160.00 per share. McDonald’s Corp. (MCD) also shed -1.0% as forward guidance warns of declining sales. McDonald’s fell -1.0%, losing 3 points and trading into $270.00 per share.
Dow Jones technical outlook
The Dow Jones Industrial Average climbed to an early session high of 38,840.05 after markets drove higher on the US’ latest NFP labor print, gaining ground from the day’s early low bids of 38,345.60. Equities are trading into the top half of the day’s price action as the DJIA looks to wrap up Friday near 38,800.00.
Friday’s bullish momentum takes the Dow Jones back above the 50-day Exponential Moving Average (EMA) at 38,435.55. Long-term price action still rests in the hands of bulls as the DJIA trades north of the 200-day EMA at 36,800.58.
Dow Jones five-minute chart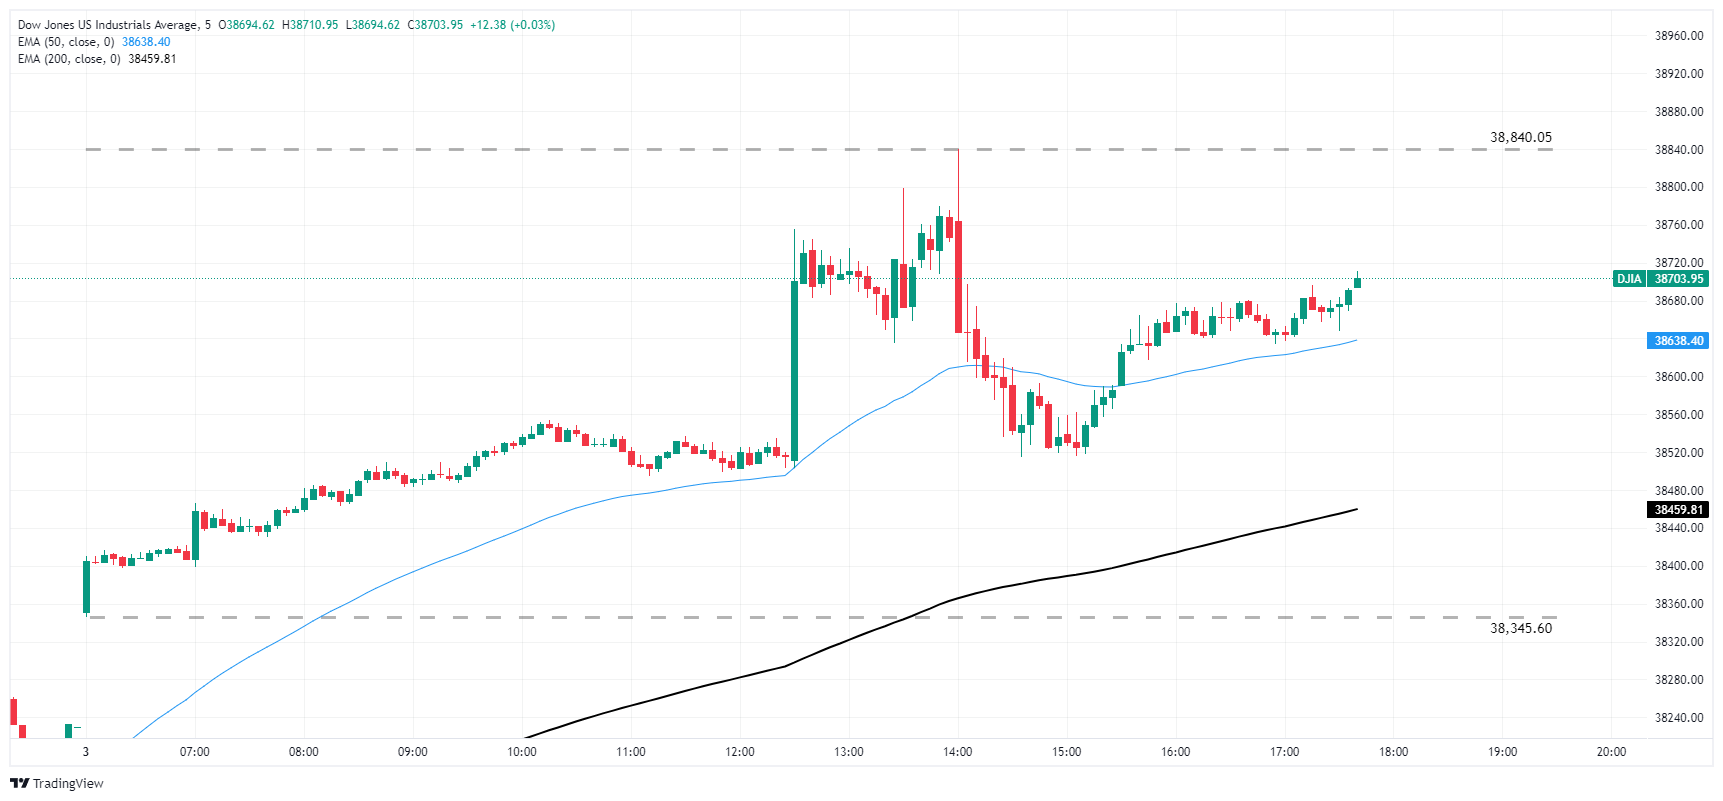
Dow Jones daily chart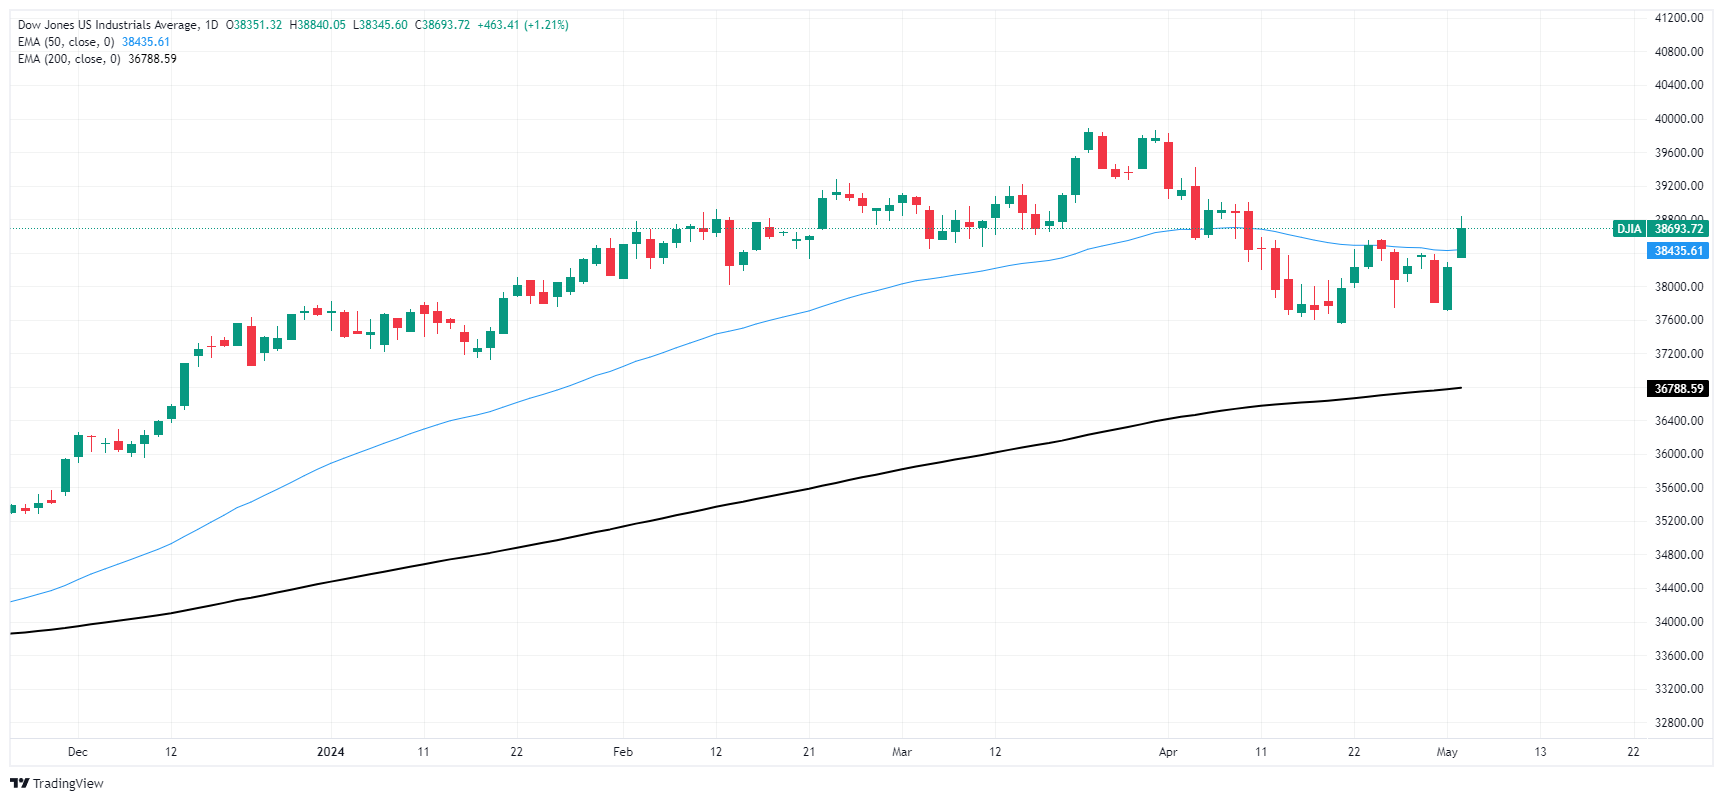
Dow Jones FAQs
The Dow Jones Industrial Average, one of the oldest stock market indices in the world, is compiled of the 30 most traded stocks in the US. The index is price-weighted rather than weighted by capitalization. It is calculated by summing the prices of the constituent stocks and dividing them by a factor, currently 0.152. The index was founded by Charles Dow, who also founded the Wall Street Journal. In later years it has been criticized for not being broadly representative enough because it only tracks 30 conglomerates, unlike broader indices such as the S&P 500.
Many different factors drive the Dow Jones Industrial Average (DJIA). The aggregate performance of the component companies revealed in quarterly company earnings reports is the main one. US and global macroeconomic data also contributes as it impacts on investor sentiment. The level of interest rates, set by the Federal Reserve (Fed), also influences the DJIA as it affects the cost of credit, on which many corporations are heavily reliant. Therefore, inflation can be a major driver as well as other metrics which impact the Fed decisions.
Dow Theory is a method for identifying the primary trend of the stock market developed by Charles Dow. A key step is to compare the direction of the Dow Jones Industrial Average (DJIA) and the Dow Jones Transportation Average (DJTA) and only follow trends where both are moving in the same direction. Volume is a confirmatory criteria. The theory uses elements of peak and trough analysis. Dow’s theory posits three trend phases: accumulation, when smart money starts buying or selling; public participation, when the wider public joins in; and distribution, when the smart money exits.
There are a number of ways to trade the DJIA. One is to use ETFs which allow investors to trade the DJIA as a single security, rather than having to buy shares in all 30 constituent companies. A leading example is the SPDR Dow Jones Industrial Average ETF (DIA). DJIA futures contracts enable traders to speculate on the future value of the index and Options provide the right, but not the obligation, to buy or sell the index at a predetermined price in the future. Mutual funds enable investors to buy a share of a diversified portfolio of DJIA stocks thus providing exposure to the overall index.
- Mexican Peso weakens close to 0.2% after disappointing US job figures and service sector contraction.
- Mexico's Gross Fixed Investment shows mixed results; Private Consumer Spending continues to grow, signaling economic strength.
- Bank of Mexico's latest poll anticipates inflation at 4.2% by 2024, with the Mexican economy expected to grow by 2.25%.
The Mexican Peso failed to hold to earlier gains versus the US Dollar on Friday after a softer-than-expected employment report in the United States (US) reignited speculation that the Federal Reserve (Fed) might lower interest rates as the jobs market weakened. Furthermore, US business activity in the services sector shows signs of contraction, which bolstered the Greenback to the detriment of the Mexican currency. The USD/MXN trades at 17.01, up by 0.20%.
Mexico’s economic schedule revealed that Gross Fixed Investment trailed in the twelve months to February data but increased in monthly figures. Further data revealed that February’s Private Consumer Spending grew in monthly and yearly figures, an indication of the economy's robustness.
Meanwhile, the Bank of Mexico (Banxico) April poll showed that private economists estimate inflation to end at 4.2% in 2024, underlying prices at 4.1%, and the economy to grow by 2.25%. Regarding the USD/MXN, analysts revised their projections downward from 18.10 to 17.
Across the border, the US Bureau of Labor Statistics (BLS) revealed that Nonfarm Payrolls in April missed the estimates and trailed the latest reading, underscoring the jobs market is cooling.
Other data revealed by the Institute for Supply Management (ISM) showed that business activity contracted for the first time since December 2022
Daily digest market movers: Mexican Peso on the back foot following soft US data
- Mexico’s Gross Fixed Investment in February rose 0.2% MoM, exceeding estimates of 0% and January’s 0.1% increase. On an annual basis, investment missed forecasts of 2.1%, dipping to 1.6% from 2.5%.
- Mexico’s Private Consumer Spending rose by 0.6% MoM in real terms. Annually, spending grew 3.9% in non-seasonally adjusted terms.
- Last week, Banxico Governor Victoria Rodriguez Ceja said the central bank would be data-dependent. However, weak GDP data could lead to a “live meeting” on May 9.
- The US Nonfarm Payrolls came in at 175K, below the consensus of 243K and trailing March’s revised 315K figure. Further data showed the Unemployment Rate ticked up from 3.8% to 3.9%, while Average Hourly Earnings (AHE) missed the 0.3% estimate to 0.2%.
- The ISM April Services PMI dipped below the 50.0 expansion/contraction threshold and came at 49.4, beneath projections and March’s reading. Digging deep into the report, the Employment subcomponent cooled, while Prices Paid increased. This could prevent the Federal Reserve from cutting rates as inflation seems to be reaccelerating.
- On Wednesday, the Fed decided to keep the fed funds rate unchanged at 5.25%-5.50 %. They acknowledged that risks to achieving the Fed’s dual mandate on employment and inflation “moved toward better balance over the past year.” Although they said there’s progress on inflation, recent data shows that it has stalled.
- Fed policymakers said they would reduce the rate of shrinking its balance sheet beginning in June. This will be done by lowering the cap from $60 billion to $25 billion for the amount of Treasury maturities not reinvested every month.
- Data from the Chicago Board of Trade (CBOT) suggests that traders expect the fed funds rate to finish 2024 at 5.045%, unchanged compared to Thursday.
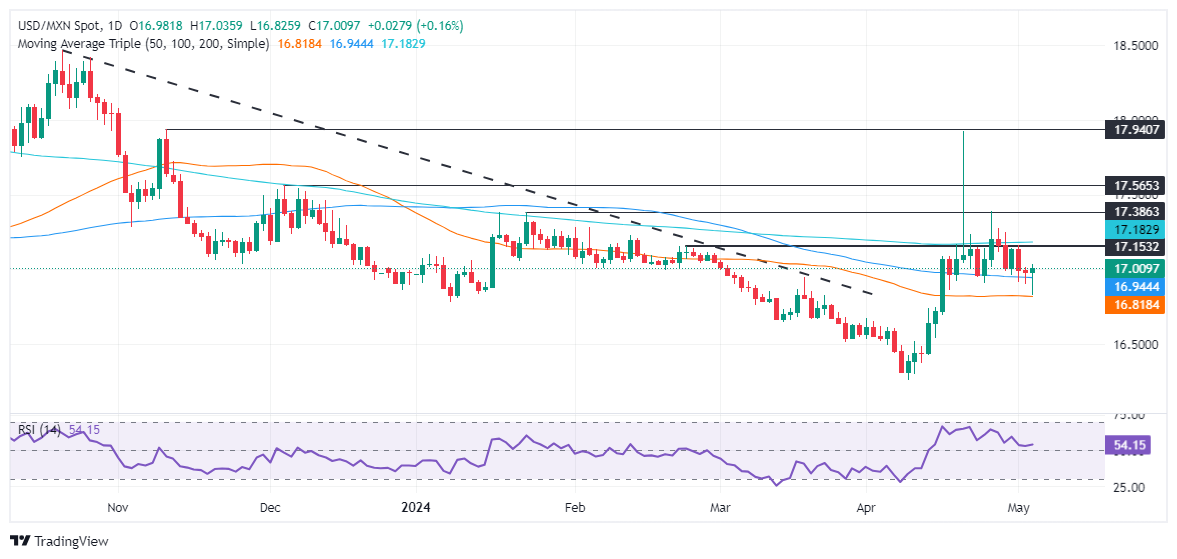
Technical analysis: Mexican Peso tumbles as USD/MXN climbs above 17.00
The USD/MXN is recovering some ground, underscoring today’s Mexican Peso weakness, following the release of macroeconomic data in the US. On its way up, the exotic pair cleared key resistance levels that shifted to support as the pair edged above the 17.00 psychological figure.
If buyers extend the rally past the 200-day Simple Moving Average at 17.17, that could pave the way to test the weekly high of 17.24. The next key resistance levels would be the January 23 swing high of 17.38 and the year-to-date high of 17.92.
Conversely, if the pair tumbles below 17.00, the first support would be the 100-day Simple Moving Average (SMA) at 16.94, followed by the 50-day SMA at 16.81. Up next would be the 2023 low of 16.62.
Mexican Peso FAQs
The Mexican Peso (MXN) is the most traded currency among its Latin American peers. Its value is broadly determined by the performance of the Mexican economy, the country’s central bank’s policy, the amount of foreign investment in the country and even the levels of remittances sent by Mexicans who live abroad, particularly in the United States. Geopolitical trends can also move MXN: for example, the process of nearshoring – or the decision by some firms to relocate manufacturing capacity and supply chains closer to their home countries – is also seen as a catalyst for the Mexican currency as the country is considered a key manufacturing hub in the American continent. Another catalyst for MXN is Oil prices as Mexico is a key exporter of the commodity.
The main objective of Mexico’s central bank, also known as Banxico, is to maintain inflation at low and stable levels (at or close to its target of 3%, the midpoint in a tolerance band of between 2% and 4%). To this end, the bank sets an appropriate level of interest rates. When inflation is too high, Banxico will attempt to tame it by raising interest rates, making it more expensive for households and businesses to borrow money, thus cooling demand and the overall economy. Higher interest rates are generally positive for the Mexican Peso (MXN) as they lead to higher yields, making the country a more attractive place for investors. On the contrary, lower interest rates tend to weaken MXN.
Macroeconomic data releases are key to assess the state of the economy and can have an impact on the Mexican Peso (MXN) valuation. A strong Mexican economy, based on high economic growth, low unemployment and high confidence is good for MXN. Not only does it attract more foreign investment but it may encourage the Bank of Mexico (Banxico) to increase interest rates, particularly if this strength comes together with elevated inflation. However, if economic data is weak, MXN is likely to depreciate.
As an emerging-market currency, the Mexican Peso (MXN) tends to strive during risk-on periods, or when investors perceive that broader market risks are low and thus are eager to engage with investments that carry a higher risk. Conversely, MXN tends to weaken at times of market turbulence or economic uncertainty as investors tend to sell higher-risk assets and flee to the more-stable safe havens.
Federal Reserve (Fed) Board of Governors member Michelle W. Bowman cautioned that there is a real risk that inflation could remain elevated for much longer than many are anticipating. Fed Board member Bowman outlined a far more cautious approach to the Fed's current inflation outlook during a speech at the Massachusetts Bankers Association Annual Convention in Key Biscayne.
Key highlights:
- It remains unclear whether further supply-side improvements will continue to lower inflation.
- Monetary policy appears to be restrictive.
- Bowman sees several upside inflation risks in outlook.
- Continues to hold that inflation should slowly move lower as long as policy holds.
- Remains willing to raise rates further if data shows inflation progress has stalled or reversed.
- Expects inflation to remain elevated for some time.
- The extent of data revisions in the past few years makes assessing the economy even more challenging.
- Geopolitical developments remain a key upside risk to inflation.
- Too-loose financial conditions remains a risk, fiscal stimulus could drive demand higher, stalling or even reversing inflation progress.
- There remains a high risk that consumer, more immigration, and tight labor market conditions could lead to persistently high inflation.
Another dreadful week for the Greenback saw the USD Index (DXY) tumble to three-week lows well south of the 105.00 support, mainly in response to the dovish tone at the FOMC event and the softer-than-expected Nonfarm Payrolls in April.
The US Dollar ended the week deeply in red territory, in line with the move lower in US yields across different time frames, although with a potential interest rate cut by the Fed in September as preferred by investors for the time being. Moving forward, the RCM/TIPP Economic Optimism Index is due on May 7 along with Consumer Credit Change. On May 8, come the weekly MBA’s Mortgage Applications and Wholesale Inventories, while Initial Jobless Claims are expected on May 9. Closing the week are the preliminary Michigan Consumer Sentiment and the Monthly Budget Statement.
EUR/USD advanced for its third week in a row, deriving renewed strength from the corrective pullback in the Greenback and the generalized better tone in the risk-associated universe. On May 6, the final HCOB Services PMI in both Germany and the broader euro area will come, ahead of Retail Sales in the bloc on May 7. On May 10, the focus of attention will be on the publication of the ECB’s Accounts.
GBP/USD added to the march north recorded in the previous week, although the move past the 1.2600 hurdle seen at the end of the week lacked follow-through. On May 7, the BRC Retail Sales Monitor will be released ahead of the S&P Global Construction PMI. May 9 will see the BoE meeting, while GDP figures, the Trade Balance, Industrial and Manufacturing Production, and the NIESR Monthly GDP Tracker are all expected at the end of the week.
USD/JPY sharply reversed four consecutive weekly advances and retreated to the sub-152.00 region against the backdrop of suspected FX intervention by the Japanese MoF. The domestic calendar includes weekly Foreign Bond Investment figures on May 6 ahead of the BoJ Summary of Opinions, Foreign Bond Investment, and the flash Coincident Index and Leading Economic Index, all expected on May 9. Finally, Household Spending, Bank Lending and the Eco Watchers Survey are due on May 10.
AUD/USD seems to have followed its own dynamics and clinched its second straight week of gains, coming in just short of the area of three-month tops. The RBA gathering due on May 7 will be the only release of note in Oz next week.
Anticipating Economic Perspectives: Voices on the Horizon
- Fed’s Goolsbee, Williams and Cook speak on May 4.
- Fed’s Williams and Barkin speaks on May 6 followed by ECB’s Nagel and SNB Jordan.
- Fed’s Kashkari and ECB’s Nagel speak on May 7.
- Fed’s Cook speaks on May 8.
- BoE’s Bailey and Pill are due to speak on May 9.
- BoE’s Pill speaks on May 10.
Central Banks: Upcoming Meetings to Shape Monetary Policies
- The BoE meets on May 9 and is widely anticipated to leave its policy rate unchanged.
- US Nonfarm Payrolls report from April underperformed, showing a lower-than-expected increase.
- The odds of a rate cut in September increased, which seems to be applying pressure on the USD.
The US Dollar Index (DXY) is visiting the 105 level with sharp losses at the end of the trading week. This comes after Friday’s report of weak US Nonfarm Payrolls (NFP) figures from April, which made markets dump the USD.
The US economy is exhibiting mixed signs of progression with robust demand and a tight labor market exhibiting slow yet significant wage growth, contributing to inflation. Federal Reserve (Fed) Chair Jerome Powell remains cautious about inflation's uncertain trajectory, emphasizing that restrictive monetary policy has curtailed economic overheating. On Friday, weak labor market figures made markets raise the odds of interest rate cuts in September.
Daily digest market movers: DXY down on weak NFPs
- US NFP report indicated an increase of 175K jobs in April, lower than the expected 243K, and a decrease from March's revised 315K growth.
- Unemployment Rate rises from 3.8% to 3.9%.
- Wage inflation, as shown by Average Hourly Earnings, fell to 3.9% YoY from 4.1%.
- Market predictions for a Fed rate reduction by September have intensified due to the weak labor market figures.
- US Treasury bond yields plunged with the 2-year yield at 4.80%, while the 5-year and 10-year yields declined to 4.50% and 4.58%, respectively.
DXY technical analysis: DXY displays an overall bullish bias despite imminent selling pressure
The technical outlook of DXY primarily mirrors a bullish dominance with a lurking bearish comeback. The Relative Strength Index (RSI) records a negative slope in negative territory, hinting at heightened selling momentum by bears. The relentless bearish push has, however, proven insufficient as the pair still trades above the 100 and 200-day Simple Moving Averages (SMAs).
Furthermore, the Moving Average Convergence Divergence (MACD) reports rising red bars, hinting that bears are gaining ground. The bearish signal should be taken seriously as the sellers pushed the index below the 20-day SMA. However, the longer-term SMAs remain as strong supports to defend the overall bullish outlook.
US Dollar FAQs
The US Dollar (USD) is the official currency of the United States of America, and the ‘de facto’ currency of a significant number of other countries where it is found in circulation alongside local notes. It is the most heavily traded currency in the world, accounting for over 88% of all global foreign exchange turnover, or an average of $6.6 trillion in transactions per day, according to data from 2022. Following the second world war, the USD took over from the British Pound as the world’s reserve currency. For most of its history, the US Dollar was backed by Gold, until the Bretton Woods Agreement in 1971 when the Gold Standard went away.
The most important single factor impacting on the value of the US Dollar is monetary policy, which is shaped by the Federal Reserve (Fed). The Fed has two mandates: to achieve price stability (control inflation) and foster full employment. Its primary tool to achieve these two goals is by adjusting interest rates. When prices are rising too quickly and inflation is above the Fed’s 2% target, the Fed will raise rates, which helps the USD value. When inflation falls below 2% or the Unemployment Rate is too high, the Fed may lower interest rates, which weighs on the Greenback.
In extreme situations, the Federal Reserve can also print more Dollars and enact quantitative easing (QE). QE is the process by which the Fed substantially increases the flow of credit in a stuck financial system. It is a non-standard policy measure used when credit has dried up because banks will not lend to each other (out of the fear of counterparty default). It is a last resort when simply lowering interest rates is unlikely to achieve the necessary result. It was the Fed’s weapon of choice to combat the credit crunch that occurred during the Great Financial Crisis in 2008. It involves the Fed printing more Dollars and using them to buy US government bonds predominantly from financial institutions. QE usually leads to a weaker US Dollar.
Quantitative tightening (QT) is the reverse process whereby the Federal Reserve stops buying bonds from financial institutions and does not reinvest the principal from the bonds it holds maturing in new purchases. It is usually positive for the US Dollar.
- Canadian Dollar falls across the board on Friday.
- Canada absent from economic calendar until next Tuesday.
- US data broadly misses the mark, particularly in terms of job gains.
The Canadian Dollar (CAD) fell across the board on Friday after US Nonfarm Payrolls (NFP) and wage data gave a wide miss on forecasts, sending the Canadian Dollar into the low end after an early spark. The US’ ISM Services Purchasing Managers Index (PMI) also fell back into contraction territory for the first time since January of 2023.
Canada has no meaningful economic data until next Tuesday’s Ivey PMIs, leaving the Canadian Dollar at the mercy of broader markets on Friday. With bad data from the US dragging down investor appetite for the Canadian Dollar, the CAD is getting battered, falling against all of its major currency peers. Crude Oil prices are also weakening on Friday, dragging the CAD even lower.
Daily digest market movers: US NFP misses mark, inflation uptick hammers CAD appetite
- US NFP shows net job additions of 175K in April, down from the forecast for 243K. The previous month saw an upside revision to 315K from 303K.
- US Average Hourly Earnings also grew 0.2% MoM in April, falling below the forecast of 0.3%.
- The US Unemployment Rate also ticked higher to 3.9% from the previous 3.8%.
- US ISM Services PMI unexpectedly fell below the 50.0 contraction level for the first time in over a year, declining to 49.4 when market forecasts were calling for a slight increase to 52.0 from the previous month’s 51.4.
- ISM Services Priced Paid accelerated to 59.2 from 53.4, keeping inflation fears close to the surface.
Canadian Dollar price today
The table below shows the percentage change of Canadian Dollar (CAD) against listed major currencies today. Canadian Dollar was the weakest against the New Zealand Dollar.
| USD | EUR | GBP | CAD | AUD | JPY | NZD | CHF | |
| USD | -0.33% | -0.05% | 0.09% | -0.62% | -0.16% | -0.84% | -0.59% | |
| EUR | 0.34% | 0.30% | 0.43% | -0.27% | 0.21% | -0.48% | -0.24% | |
| GBP | 0.04% | -0.29% | 0.14% | -0.57% | -0.11% | -0.79% | -0.51% | |
| CAD | -0.09% | -0.43% | -0.11% | -0.68% | -0.24% | -0.92% | -0.65% | |
| AUD | 0.62% | 0.27% | 0.57% | 0.70% | 0.47% | -0.21% | 0.03% | |
| JPY | 0.15% | -0.19% | 0.10% | 0.21% | -0.47% | -0.66% | -0.44% | |
| NZD | 0.82% | 0.47% | 0.78% | 0.92% | 0.22% | 0.67% | 0.25% | |
| CHF | 0.57% | 0.24% | 0.52% | 0.65% | -0.05% | 0.43% | -0.27% |
The heat map shows percentage changes of major currencies against each other. The base currency is picked from the left column, while the quote currency is picked from the top row. For example, if you pick the Euro from the left column and move along the horizontal line to the Japanese Yen, the percentage change displayed in the box will represent EUR (base)/JPY (quote).
Technical analysis: Canadian Dollar broadly softens on Friday as investors disinterested
The Canadian Dollar (CAD) slumped across the board on Friday, easing around a tenth of a percent against the US Dollar (USD) despite a bullish start to the day. A broad-market recovery for the New Zealand Dollar (NZD) sees the CAD shed a full percent against the Antipodean currency, with an additional eighth of a percent falling to the Australian Dollar (AUD). The CAD is also down around half of a percent against the Euro (EUR).
USD/CAD rallied to the top end of a recent demand zone between 1.3680 and 1.3630 after a quick descent Friday morning into 1.3610. The pair’s downside run proved to be short-lived, and bids are back to challenging chart territory near 1.3700.
USD/CAD hourly chart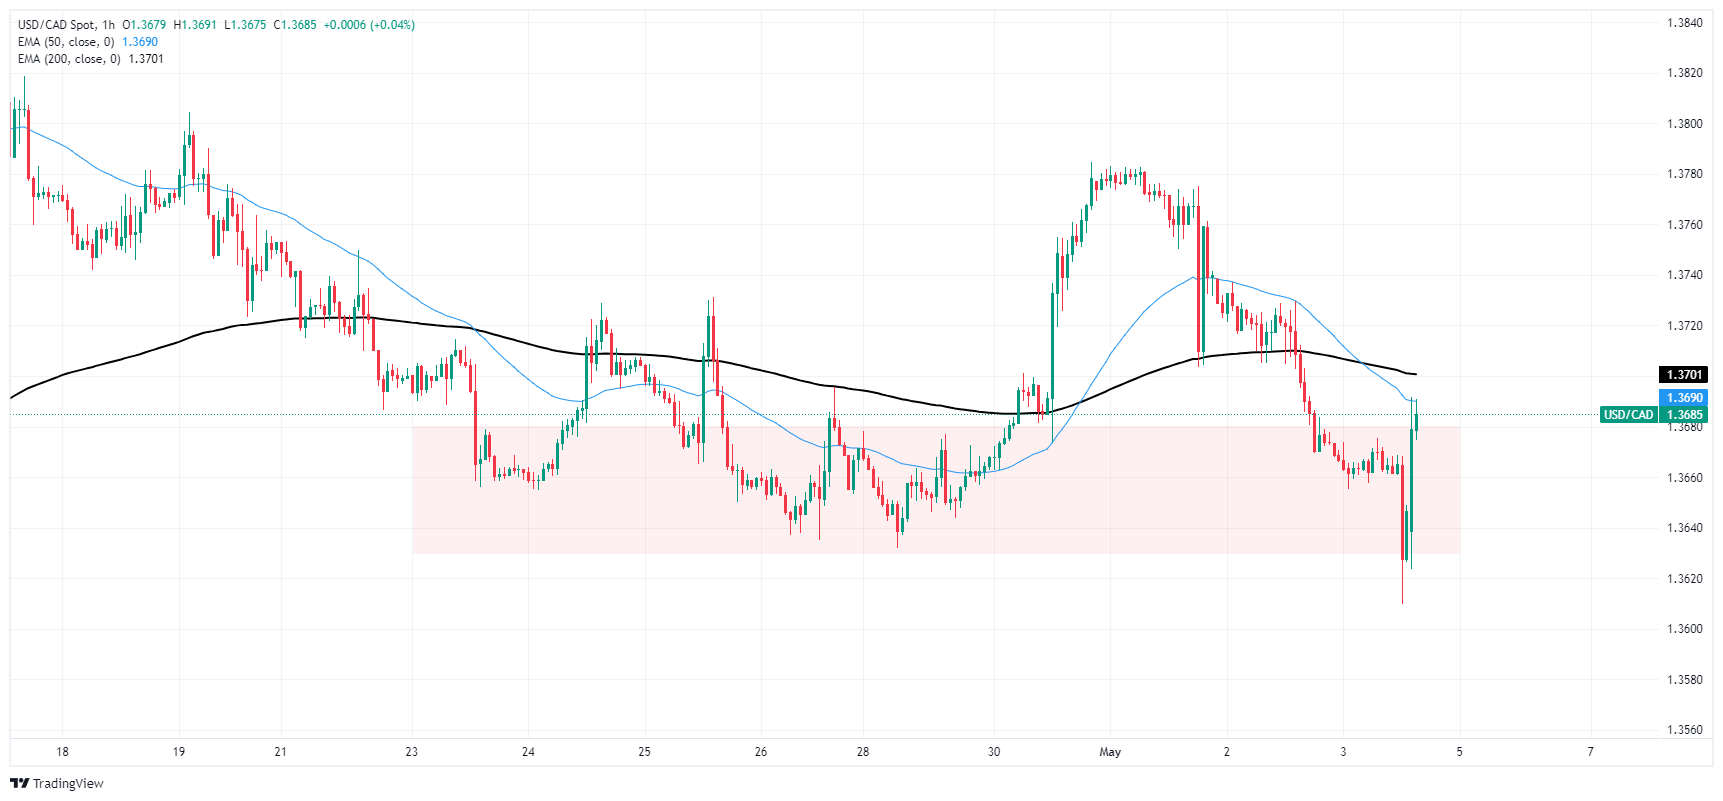
USD/CAD daily chart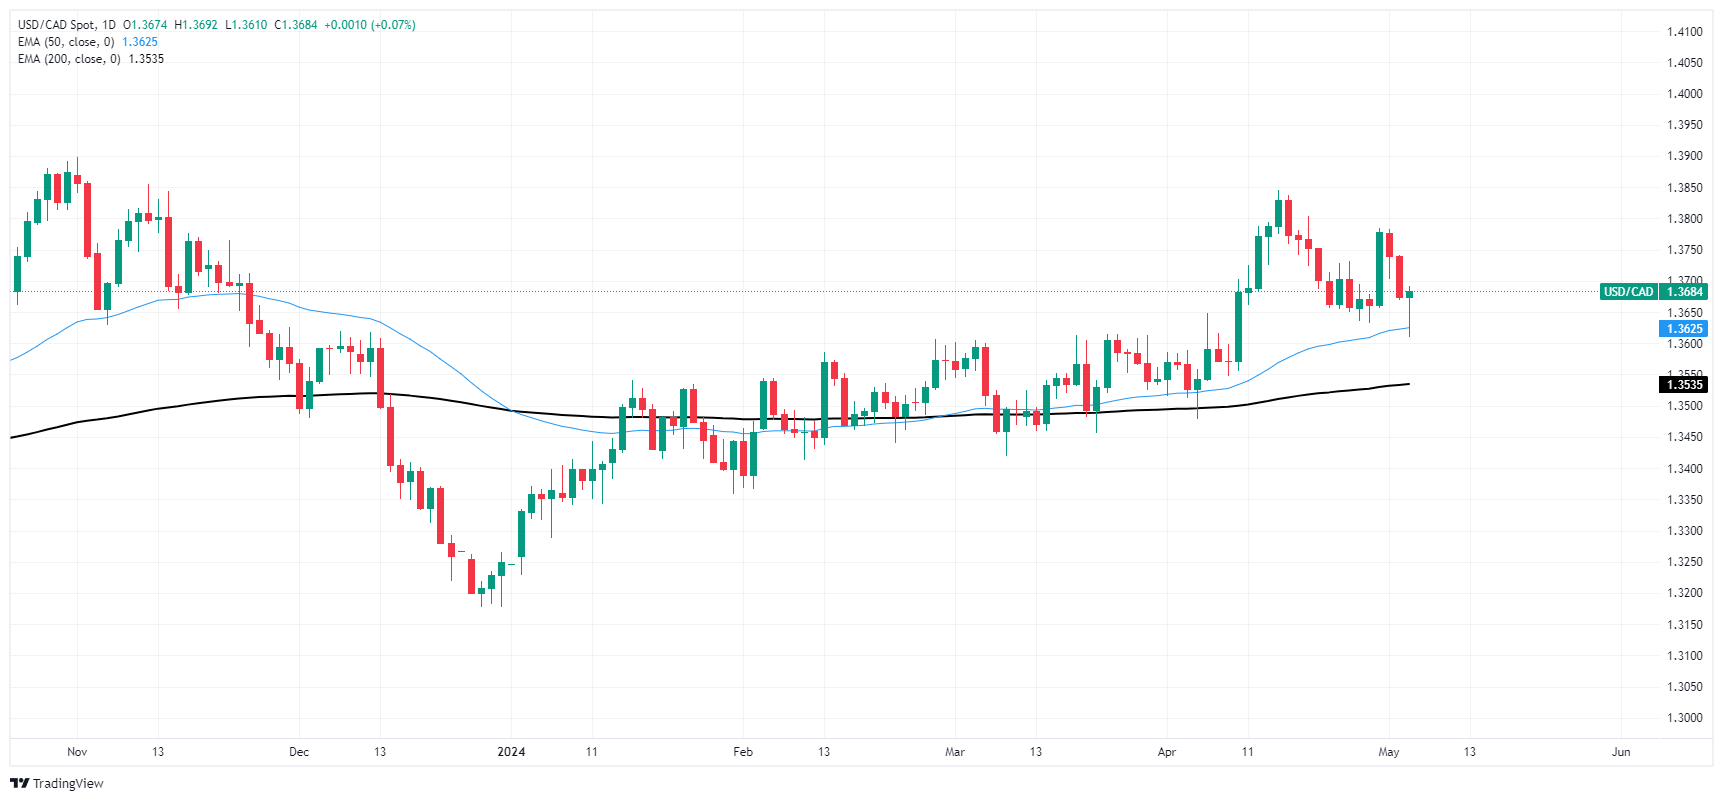
Canadian Dollar FAQs
The key factors driving the Canadian Dollar (CAD) are the level of interest rates set by the Bank of Canada (BoC), the price of Oil, Canada’s largest export, the health of its economy, inflation and the Trade Balance, which is the difference between the value of Canada’s exports versus its imports. Other factors include market sentiment – whether investors are taking on more risky assets (risk-on) or seeking safe-havens (risk-off) – with risk-on being CAD-positive. As its largest trading partner, the health of the US economy is also a key factor influencing the Canadian Dollar.
The Bank of Canada (BoC) has a significant influence on the Canadian Dollar by setting the level of interest rates that banks can lend to one another. This influences the level of interest rates for everyone. The main goal of the BoC is to maintain inflation at 1-3% by adjusting interest rates up or down. Relatively higher interest rates tend to be positive for the CAD. The Bank of Canada can also use quantitative easing and tightening to influence credit conditions, with the former CAD-negative and the latter CAD-positive.
The price of Oil is a key factor impacting the value of the Canadian Dollar. Petroleum is Canada’s biggest export, so Oil price tends to have an immediate impact on the CAD value. Generally, if Oil price rises CAD also goes up, as aggregate demand for the currency increases. The opposite is the case if the price of Oil falls. Higher Oil prices also tend to result in a greater likelihood of a positive Trade Balance, which is also supportive of the CAD.
While inflation had always traditionally been thought of as a negative factor for a currency since it lowers the value of money, the opposite has actually been the case in modern times with the relaxation of cross-border capital controls. Higher inflation tends to lead central banks to put up interest rates which attracts more capital inflows from global investors seeking a lucrative place to keep their money. This increases demand for the local currency, which in Canada’s case is the Canadian Dollar.
Macroeconomic data releases gauge the health of the economy and can have an impact on the Canadian Dollar. Indicators such as GDP, Manufacturing and Services PMIs, employment, and consumer sentiment surveys can all influence the direction of the CAD. A strong economy is good for the Canadian Dollar. Not only does it attract more foreign investment but it may encourage the Bank of Canada to put up interest rates, leading to a stronger currency. If economic data is weak, however, the CAD is likely to fall.
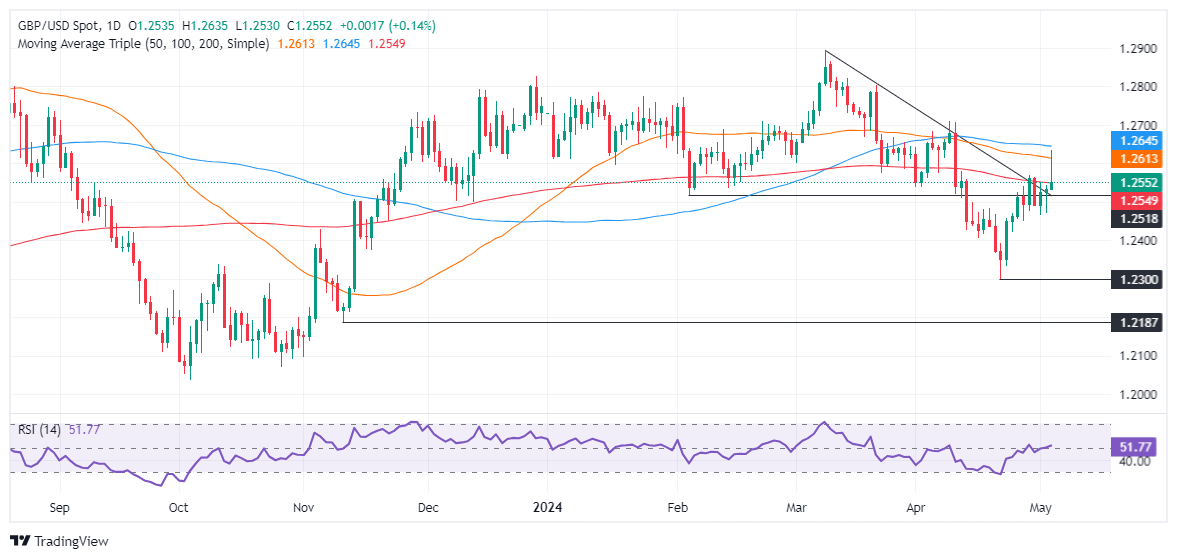
- GBP/USD down 0.06% after reaching a three-week high of 1.2634.
- RSI flattening suggests normalization of buying pressure.
- Support levels at 1.2500, 1.2474, and 1.2466; breach may test 1.2400.
- Resistance at 200-DMA, 1.2600, and DMAs at 1.2612 and 1.2644.
The Pound Sterling holds to gains versus the US Dollar yet retraced from three-week highs reached at 1.2634 following a softer than expected US Nonfarm Payrolls report. However, buyers lacked the strength to keep prices above 1.2600, opening the door for a test of the 200-day moving average (DMA). The GBP/USD trades at 1.2541, down by 0.06%.
GBP/USD Price Analysis: Technical outlook
The daily chart suggests the GBP/USD spike that breached the 50 and 100-DMA, reassembling a ‘shooting star’ opened the door for sellers to enter the market and dragged the spot price toward current levels. Even though the Relative Strength Index (RSI) suggests that buyers are in charge, it seems to shift flat, an indication of normalization.
Therefore, as GBP/USD bulls lose steam, that could pave the way for a deeper pullback. The first support seen is 1.2500. A drop below that level would expose the May 2 low at 1.2474, ahead of the latest pivot low at 1.2466. Once those two levels are surpassed, up next would be the 1.2400 psychological level.
Conversely, if buyers moved in, the first resistance would be the 200-DMA at 1.2548. Further upside is seen at 1.2600, followed by the 50 and 100-DMAs, each at 1.2612 and 1.2644, respectively.
GBP/USD Price Action – Daily Chart
Commenting on April labor market data, Federal Reserve Bank of Chicago President Austan Goolsbee told Bloomberg TV that it was a solid report with 175,000 new jobs.
Key takeaways
"We hit a bump on inflation at the start of the year."
"I don't like committing even to the next meeting."
"Fed must get comfort that recent inflation is not a sign of reacceleration."
"What happened in the job market this year has to be re-normed based on estimates of higher immigration; still trying to analyze that."
"Monetary policy is restrictive; real federal funds rate is as high as it has been in decades."
"We have to get more comfort on whether the Fed is still on a path to lower inflation."
"If the Fed remains restrictive too long, it will have to think about the employment side of the mandate; but current numbers are solid."
Market reaction
The US Dollar Index recovered from daily lows after these comments and was last seen losing 0.25% on the day at 105.06.
- Silver price has broken out of a Bear Flag pattern and met its conservative target.
- Support from a long-term support and resistance level at around $25.80 is likely to provide a floor for the sell-off.
- Despite the sell-off, the ultimate target at $25.50 for the bearish pattern has yet to be reached.
Silver (XAG/USD) price has broken out of the Bear Flag continuation price pattern it has formed on the 4-hour chart, declined and reached the conservative target for the pattern. After a bounce it has once again fallen. The precious metal looks weak in the short-term.
4-hour Chart
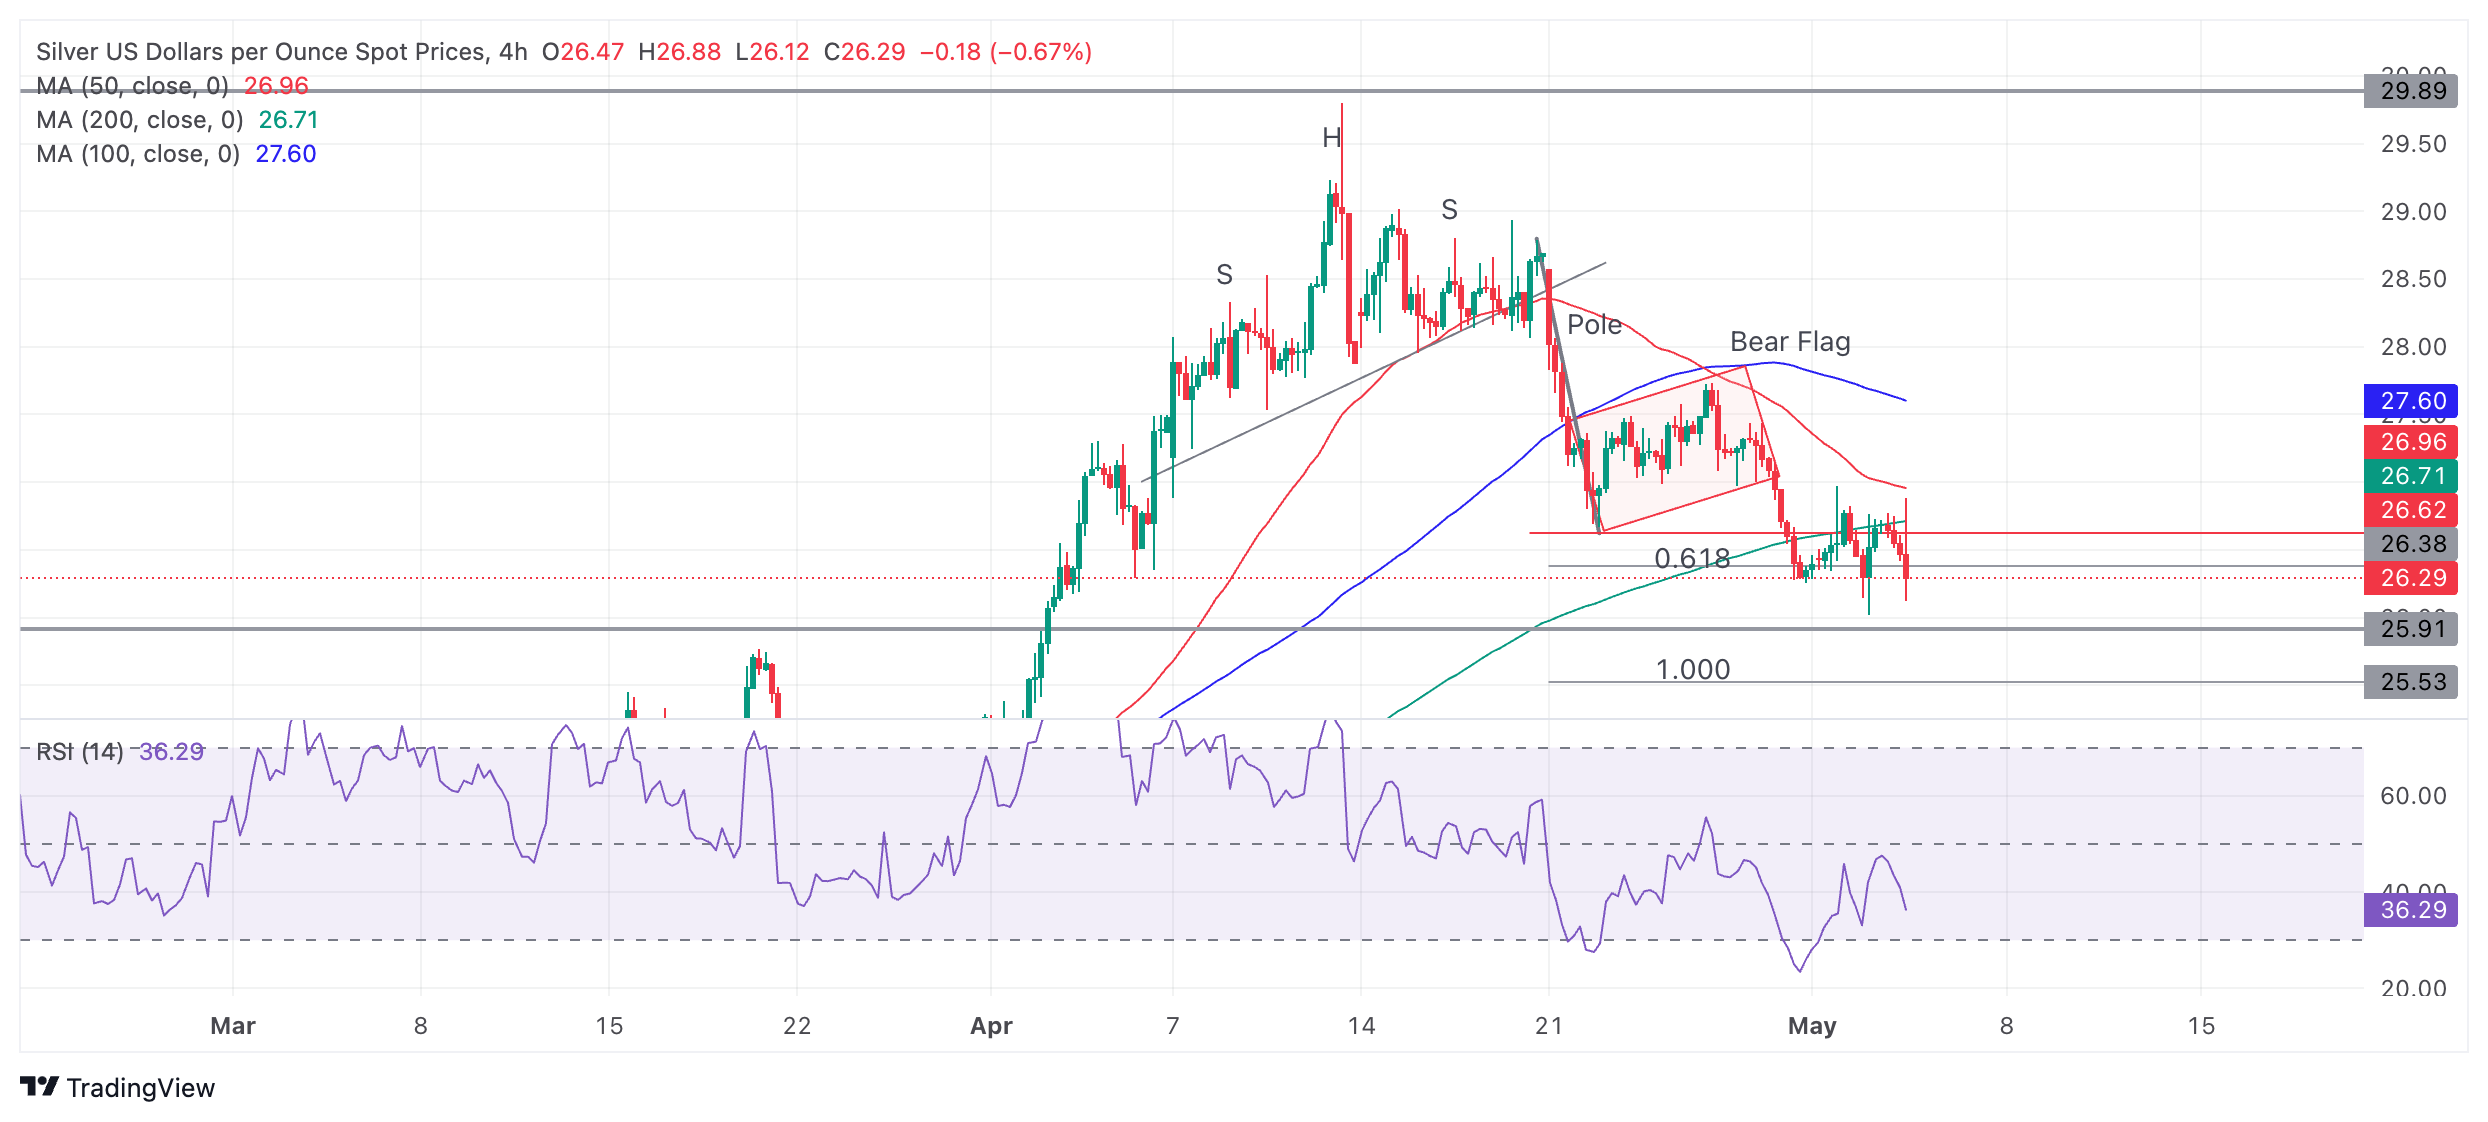
According to technical analysis theory, the expected move down from a Bear Flag is equal to the length of the preceding “pole” which in this case is the decline between April 19-23.
This gives an eventual target of around $25.50. The Fibonacci 0.618 ratio of the pole provides a conservative target at roughly $26.30 which has already been met.
Tough support from a long-term upper range boundary line at about $25.80, however, is likely to offer support.
In February Silver price started rallying up to the top of a 4-year consolidation close to $30.00. After reaching just shy of this resistance level it formed a multiple shouldered Head and Shoulders (H&S) topping pattern in mid-April.
Silver price then declined to the initial target for the H&S pattern at $26.70 and bounced. Since then it has been consolidating. The sell-off and the consolidation taken together formed a bear flag pattern, which has now broken to the downside.
- US ISM Services PMI dropped into the contraction territory below 50 in April.
- US Dollar Index stays in negative territory below 105.00.
Business activity in the US service sector contracted in April, with the ISM Services PMI edging lower to 49.4 from 51.4. in March. This reading came in below the market expectation of 52.0.
Other details of the report showed that the Prices Paid Index, the inflation component, climbed to 59.2 from 53.4, while the Employment Index dropped to 45.9 from 48.5.
Assessing the survey's findings, "the decline in the composite index in April is a result of lower business activity, slower new orders growth, faster supplier deliveries and the continued contraction in employment,” said Anthony Nieves, Chair of the Institute for Supply Management Services Business Survey Committee, and continued:
"Survey respondents indicated that overall business is generally slowing, with rates varying by company and industry. Employment challenges continue to be primarily due to difficulties in backfilling positions and/or controlling labor expenses. The majority of respondents indicate that inflation and geopolitical issues remain concerns."
Market reaction
The US Dollar Index stays under bearish pressure after this report and was last seen losing 0.4% on the day at 104.90.
- Silver price plunges to $26 despite a sell-off in the US Dollar and bond yields.
- The US NFP report for April exhibited weak labor demand and soft wage growth.
- Weak labor demand will boost Fed rate cut prospects for September.
Silver price (XAG/USD) reverses gains and falls sharply to $26.00 despite the United States Nonfarm Payrolls (NFP) data for April turned out weaker than expected. The US NFP report showed that employers hired 175K job-seekers, weaker than the consensus of 243K and the prior reading of 315K, upwardly revised from 303K. The Unemployment Rate rises to 3.9% while investors forecasted it to remain steady at 3.8%.
The Average Hourly Earnings, which feeds the consumer spending and eventually reflects the inflation outlook, softened to 3.9%. Investors forecasted the wage growth to decelerate to 4.0% from March’s reading of 4.1%. Monthly wage growth data grew at a slower pace of 0.2%, against the estimates and the prior reading of 0.3%.
Weak labor demand and soft wage growth would force the Federal Reserve (Fed) to unwind its restrictive policy framework earlier, which it has been maintaining for almost two years. Currently, investors expect that the Fed will start reducing interest rates from the September meeting. The situation is unfavorable for the US Dollar and Treasury yields. The US Dollar Index (DXY), which tracks the Greenback’s value against six major currencies, prints a fresh three-week low around 104.50. 10-year US Treasury Yields weaken to 4.49%.
Generally, lower yields on interest-bearing assets weigh on non-yielding assets such as Silver as they reduce the opportunity cost of holding investment in them. Therefore, the Silver price could reverse losses ahead.
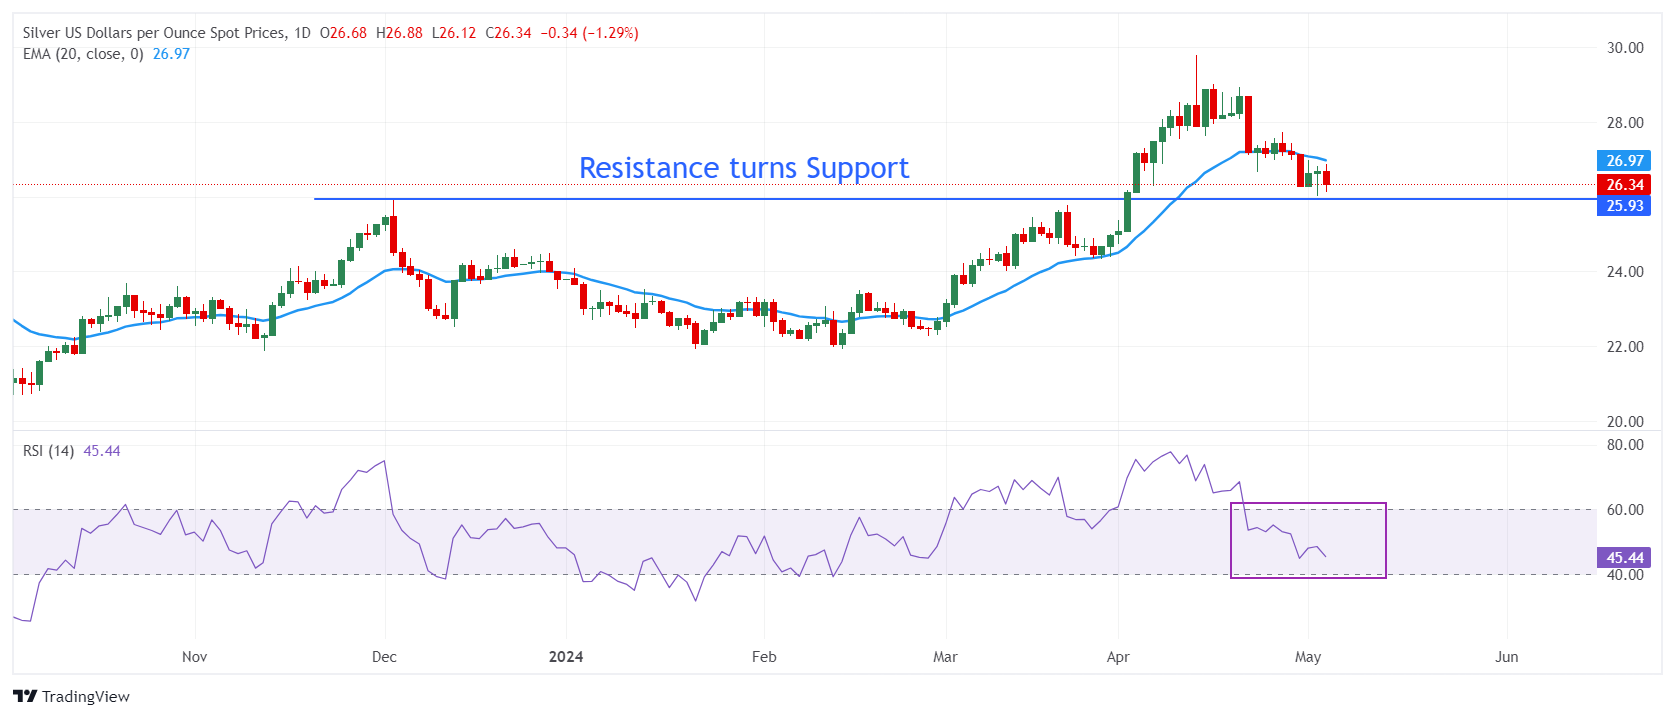
Silver technical analysis
Silver price declines to near the horizontal support plotted from 14 April 2023 high around $26.09 on a daily timeframe. The above-mentioned support was earlier a major resistance for the Silver price bulls. The uncertainty over Silver’s near-term outlook deepens as it has slipped below the 20-period Exponential Moving Average (EMA), which trades around $27.20.
The 14-period Relative Strength Index (RSI) slips into the 40.00-60.00, suggesting that the bullish momentum has faded. However, the long-term outlook is still stable.
Silver daily chart
- The US Dollar Index has been trading in a rising channel for several months.
- After touching the top of the channel it reversed course and started to fall towards the lower channel line.
- Price is close to support and the RSI is oversold signaling a likely pause in the downmove.
The US Dollar Index price (DXY) is declining within a multi-month long rising channel after touching the top borderline and rolling over.
Given price tends to oscillate within a channel the Dollar Index is probably in the midst of a down-leg which means there is a good chance it could continue falling to the lower borderline before probably bouncing and resuming its trend higher.
Dollar Index 4-hour Chart
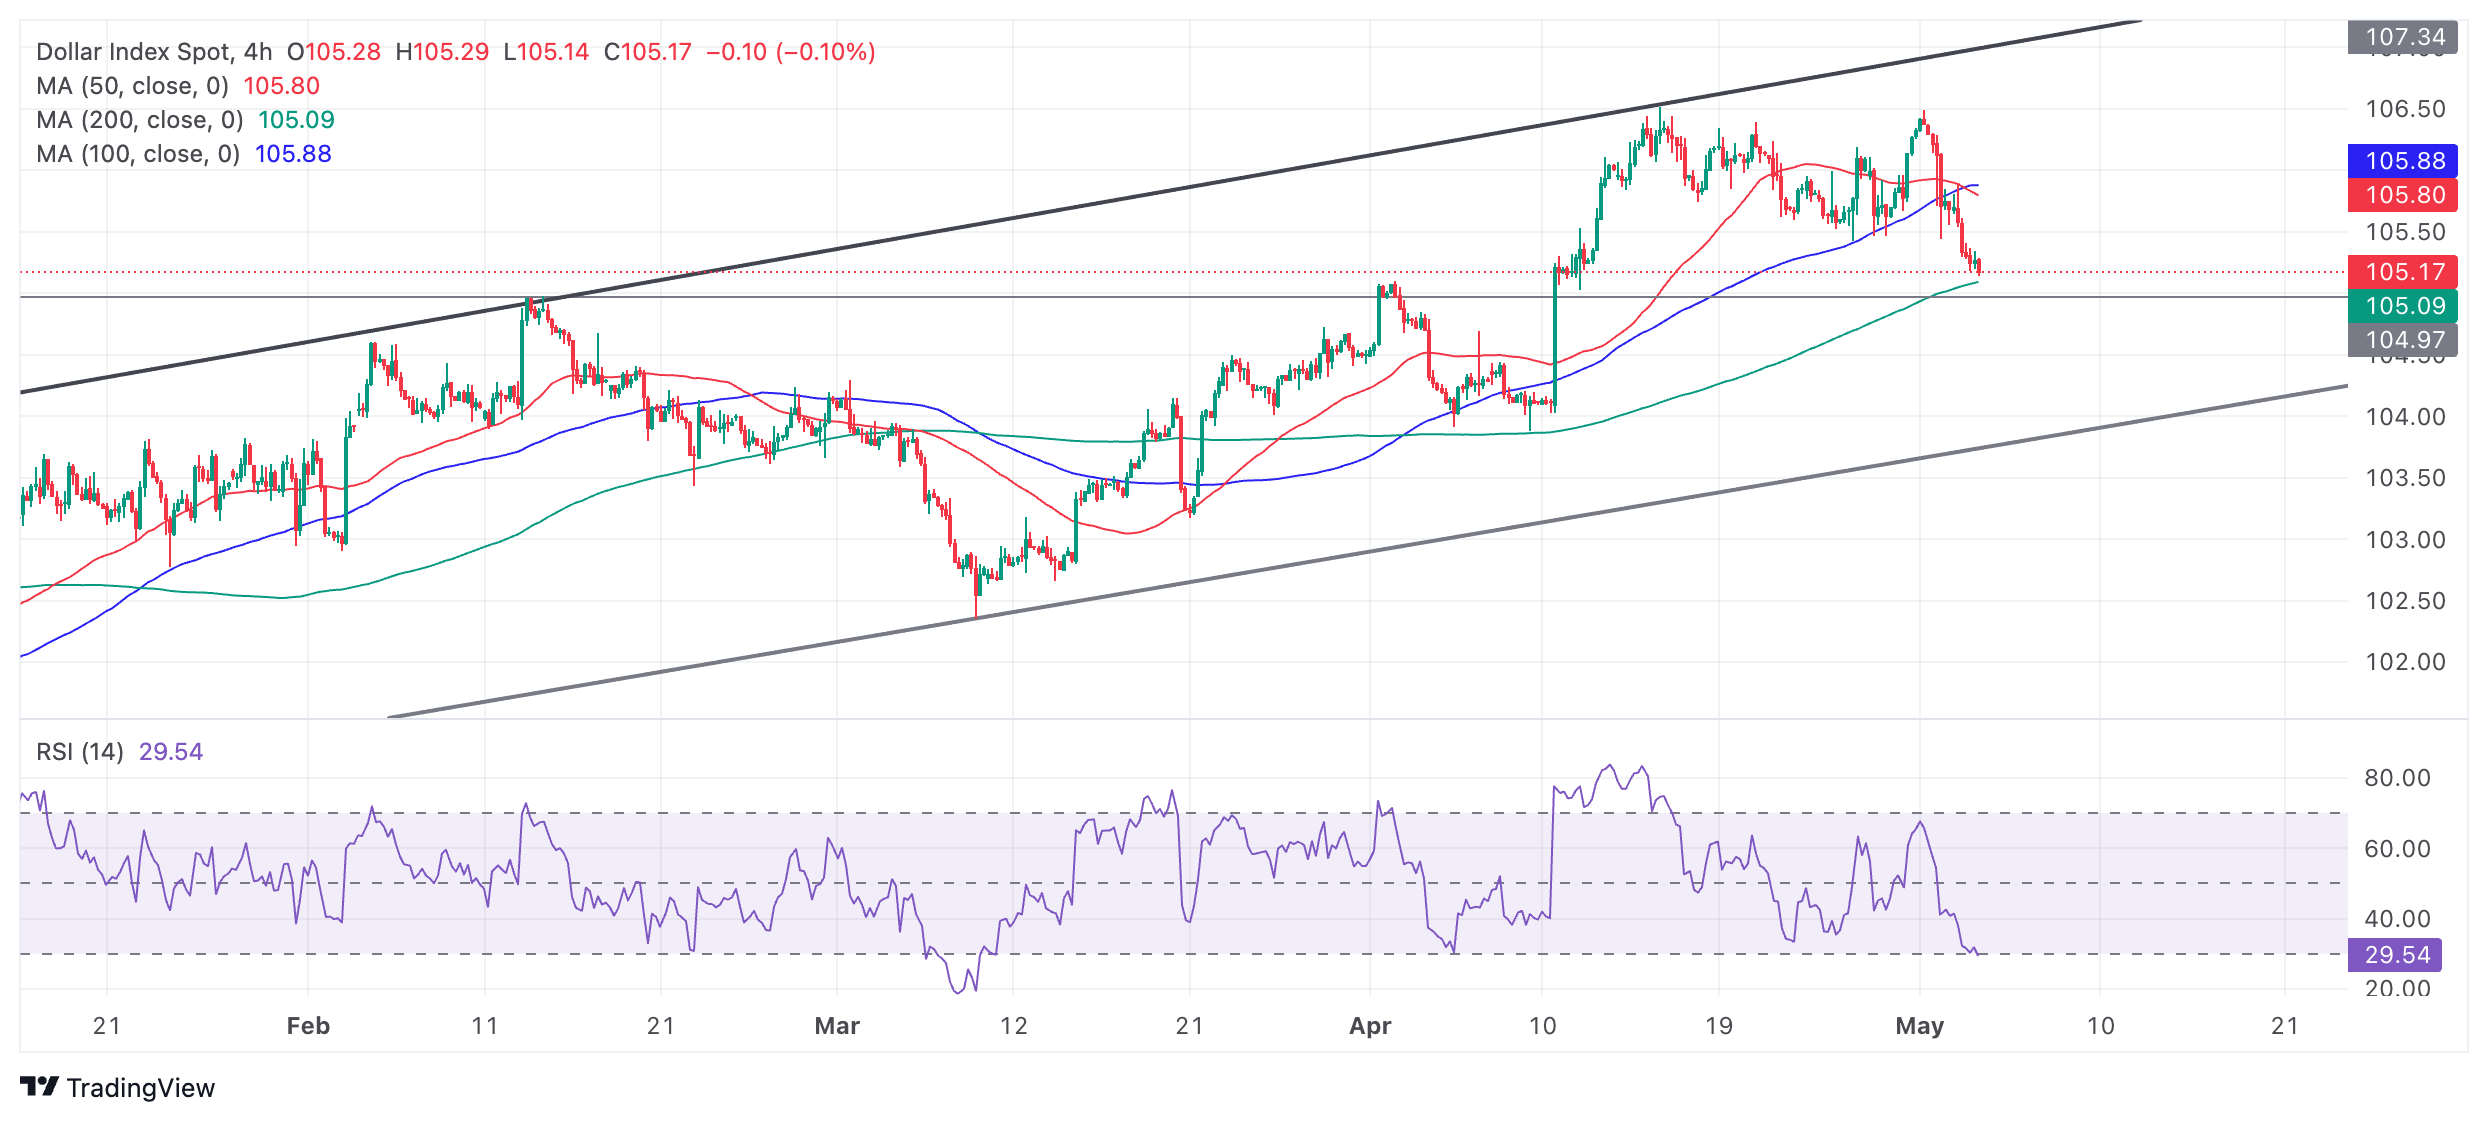
Dollar Index price is now falling close to a sturdy support level at 104.97 composed of several old peaks occurring at that height. The green 200 Simple Moving Average (SMA) also lies close at 105.09 and will probably offer support.
The probability price could find a floor is increased by the fact that the Relative Strength Index (RSI) is potentially signaling oversold – depending on the close of the current bar. If it does, then this will indicate a higher chance price could find a floor and consolidate. When RSI enters oversold it is a signal for traders not to add to their short positions.
A decisive break below the support level at 104.97 would signal a continuation down to a possible target at the lower channel line, at that point, in the vicinity of 104.00.
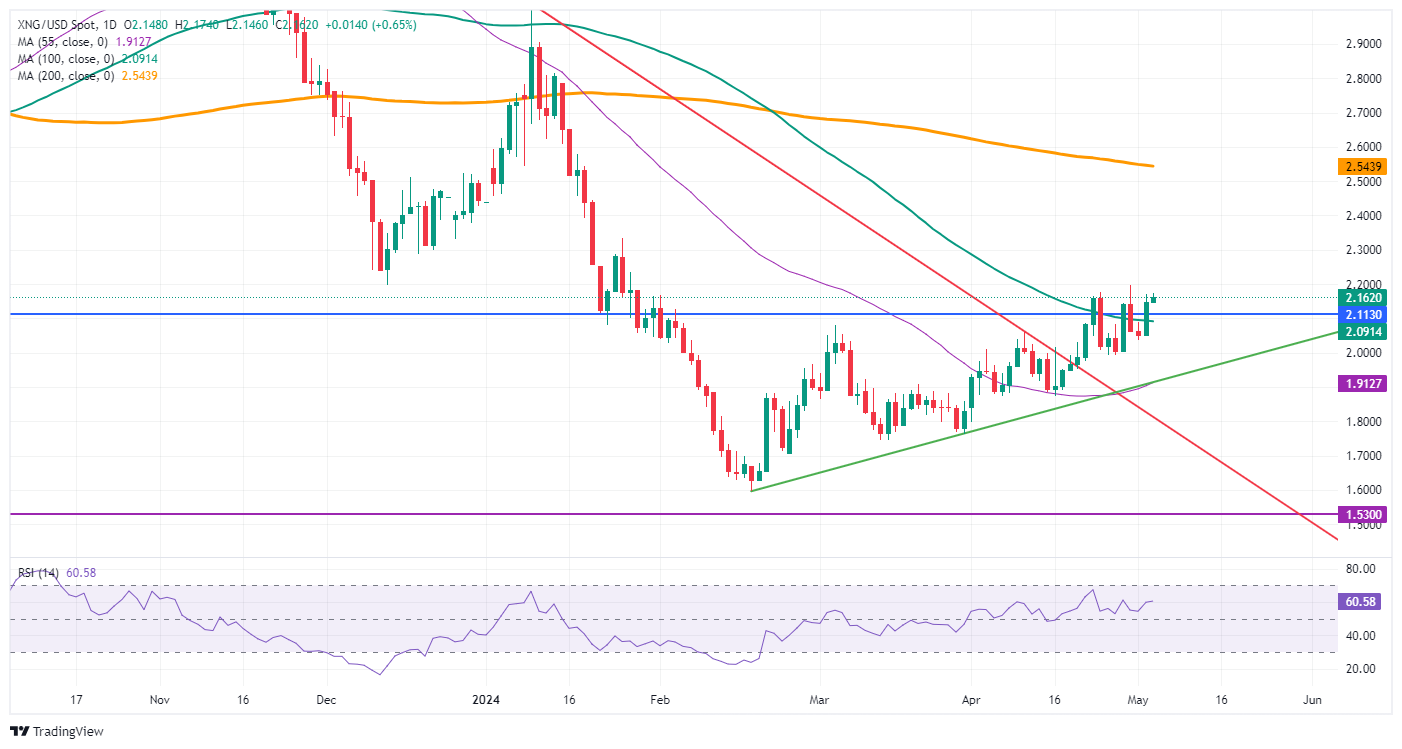
- Natural Gas price are rallying on the back of surging demand in the Middle East.
- Several African and Middle Eastern countries use Gas to power air conditioning.
- The US Dollar Index slips further, barely holding above 105.00.
Natural Gas (XNG/USD) prices are heading higher for a second consecutive day driven by a pickup in demand from the Middle East and some North African countries. The best example is Egypt, where Gas exports have already decreased to meet local demand. The need for Gas is growing because of the usage of Liquified Natural Gas (LNG) to power air conditioning units amid an ongoing heatwave w in the region.
Meanwhile, the US Dollar Index (DXY) is hanging by a thread after yet another possible intervention to propel the Japanese Yen (JPY). The JPY has appreciated more than 3% since last Friday against the Greenback, and that is reverberating in the US Dollar Index. Looking at the economic calendar, the US Employment Report is due later on Friday.
Natural Gas is trading at $2.16 per MMBtu at the time of writing.
Natural Gas news and market movers: Qatar ramps up production
- The biggest winner from Europe’s shift away from Russian Gas is Qatar. The kingdom is ramping up its production and expanding its mining of LNG to fulfill fresh demand.
- Gazprom, the Russian biggest Gas company, reported a $7 billion loss after diminishing flows to Europe and with Asian demand not enough to fill the void, the Financial Times reports.
- The US is set to lose Gas inflows from Canada as the country is set to unveil its own LNG export terminal.
- The recent lower Gas prices were becoming an issue for ConocoPhillips, which missed earnings estimates in the first quarter of this year, Dow Jones reports.
Natural Gas Technical Analysis: A brief spill over
Natural Gas has jumped back above $2.11, which remains a firm line in the sand. With plenty of false breaks in recent weeks around this level, the main question is whether the hot weather in the Middle East is substantial enough to push prices higher. As with these elements, rallies are likely to be very short-lived and Gas prices are soon to retreat below $2.11 again once the temperatures are mildening again.
On the upside, the blue line at $2.11, the 2023 low, and the 100-day Simple Moving Average (SMA) at $2.10 are still to be considered, seeing the several false breakouts during the recent weeks. Further up, the next level to watch is the January 25 high at $2.33 before looking at the 200-day SMA at $2.54.
On the other side, the $2.00 handle has worked as nearby support for now. Further down, a trifecta of support is formed at $1.88, with the ascending and descending trend lines crossing and the 55-day SMA. Should that level break, expect a quick downward movement to the year-to-date low at $1.60.
Natural Gas: Daily Chart
Natural Gas FAQs
Supply and demand dynamics are a key factor influencing Natural Gas prices, and are themselves influenced by global economic growth, industrial activity, population growth, production levels, and inventories. The weather impacts Natural Gas prices because more Gas is used during cold winters and hot summers for heating and cooling. Competition from other energy sources impacts prices as consumers may switch to cheaper sources. Geopolitical events are factors as exemplified by the war in Ukraine. Government policies relating to extraction, transportation, and environmental issues also impact prices.
The main economic release influencing Natural Gas prices is the weekly inventory bulletin from the Energy Information Administration (EIA), a US government agency that produces US gas market data. The EIA Gas bulletin usually comes out on Thursday at 14:30 GMT, a day after the EIA publishes its weekly Oil bulletin. Economic data from large consumers of Natural Gas can impact supply and demand, the largest of which include China, Germany and Japan. Natural Gas is primarily priced and traded in US Dollars, thus economic releases impacting the US Dollar are also factors.
The US Dollar is the world’s reserve currency and most commodities, including Natural Gas are priced and traded on international markets in US Dollars. As such, the value of the US Dollar is a factor in the price of Natural Gas, because if the Dollar strengthens it means less Dollars are required to buy the same volume of Gas (the price falls), and vice versa if USD strengthens.
- EUR/GBP is stuck in a tight range around 0.8550 as the focus shifts to the BoE monetary policy announcement.
- The Euro struggles to extend the upside as the ECB is expected to announce rate cuts sooner than the BoE.
- ECB Stournaras see three rate cuts this year.
The EUR/GBP pair trades inside Thursday’s trading range in Friday’s European session. The cross struggles to extend its three-day winning spell on firm speculation that the European Central Bank (ECB) will start reducing interest rates from the June meeting.
The ECB has yet not announced a victory over price pressures in the Eurozone. However, ECB policymakers believe that inflation is on course to return to the desired rate of 2%. ECB Chief Economist Philip Lane said in a virtual guest lecture at the University of Stanford that inflation has declined at a faster pace than the ECB had initially expected. However, he warned that the next phase of disinflation will be more gradual.
For the entire year, investors see the ECB reducing interest rates three times. The speculation for three rate cuts strengthened after ECB Governing Council member and Governor of the Bank of Greece, Yannis Stournaras, said in Friday’s Asian session, “We now consider three rate cuts in 2024 as the more likely scenario”, Bloomberg reported.
Meanwhile, firm expectations for ECB rate cuts combined with stronger than expected Q1 Gross Domestic Product (GDP) numbers have improved the Eurozone economic outlook. Quantitative easing will result in a sharp increase in leakage of liquidity into the economy as businesses would be able to tap advances from commercial banks at lower borrowing rates.
On the United Kingdom front, investors shift focus to the Bank of England’s (BoE) interest rate decision, which will be announced on May 9. The BoE is widely anticipated to keep interest rates steady at 5.25% for the sixth time in a row. Therefore, investors will focus on fresh cues about when the BoE will start lowering borrowing rates. Traders have priced in the September meeting as the earliest point for pivoting to policy normalization.
- EUR/GBP price is rising within its range after bouncing off support at the range floor.
- The trend is sideways and likely to extend, with price oscillating within the range.
- EUR/GBP has just been pushed back by resistance from a cluster of Moving Averages in the 0.8560s.
EUR/GBP price is rising up within a multi-month range after bouncing off support at the lows.
The pair is in a sideways trend and given the old traders adage that “the trend is your friend,” is tipped to continue unfolding within the range.
EUR/GBP 4-hour Chart
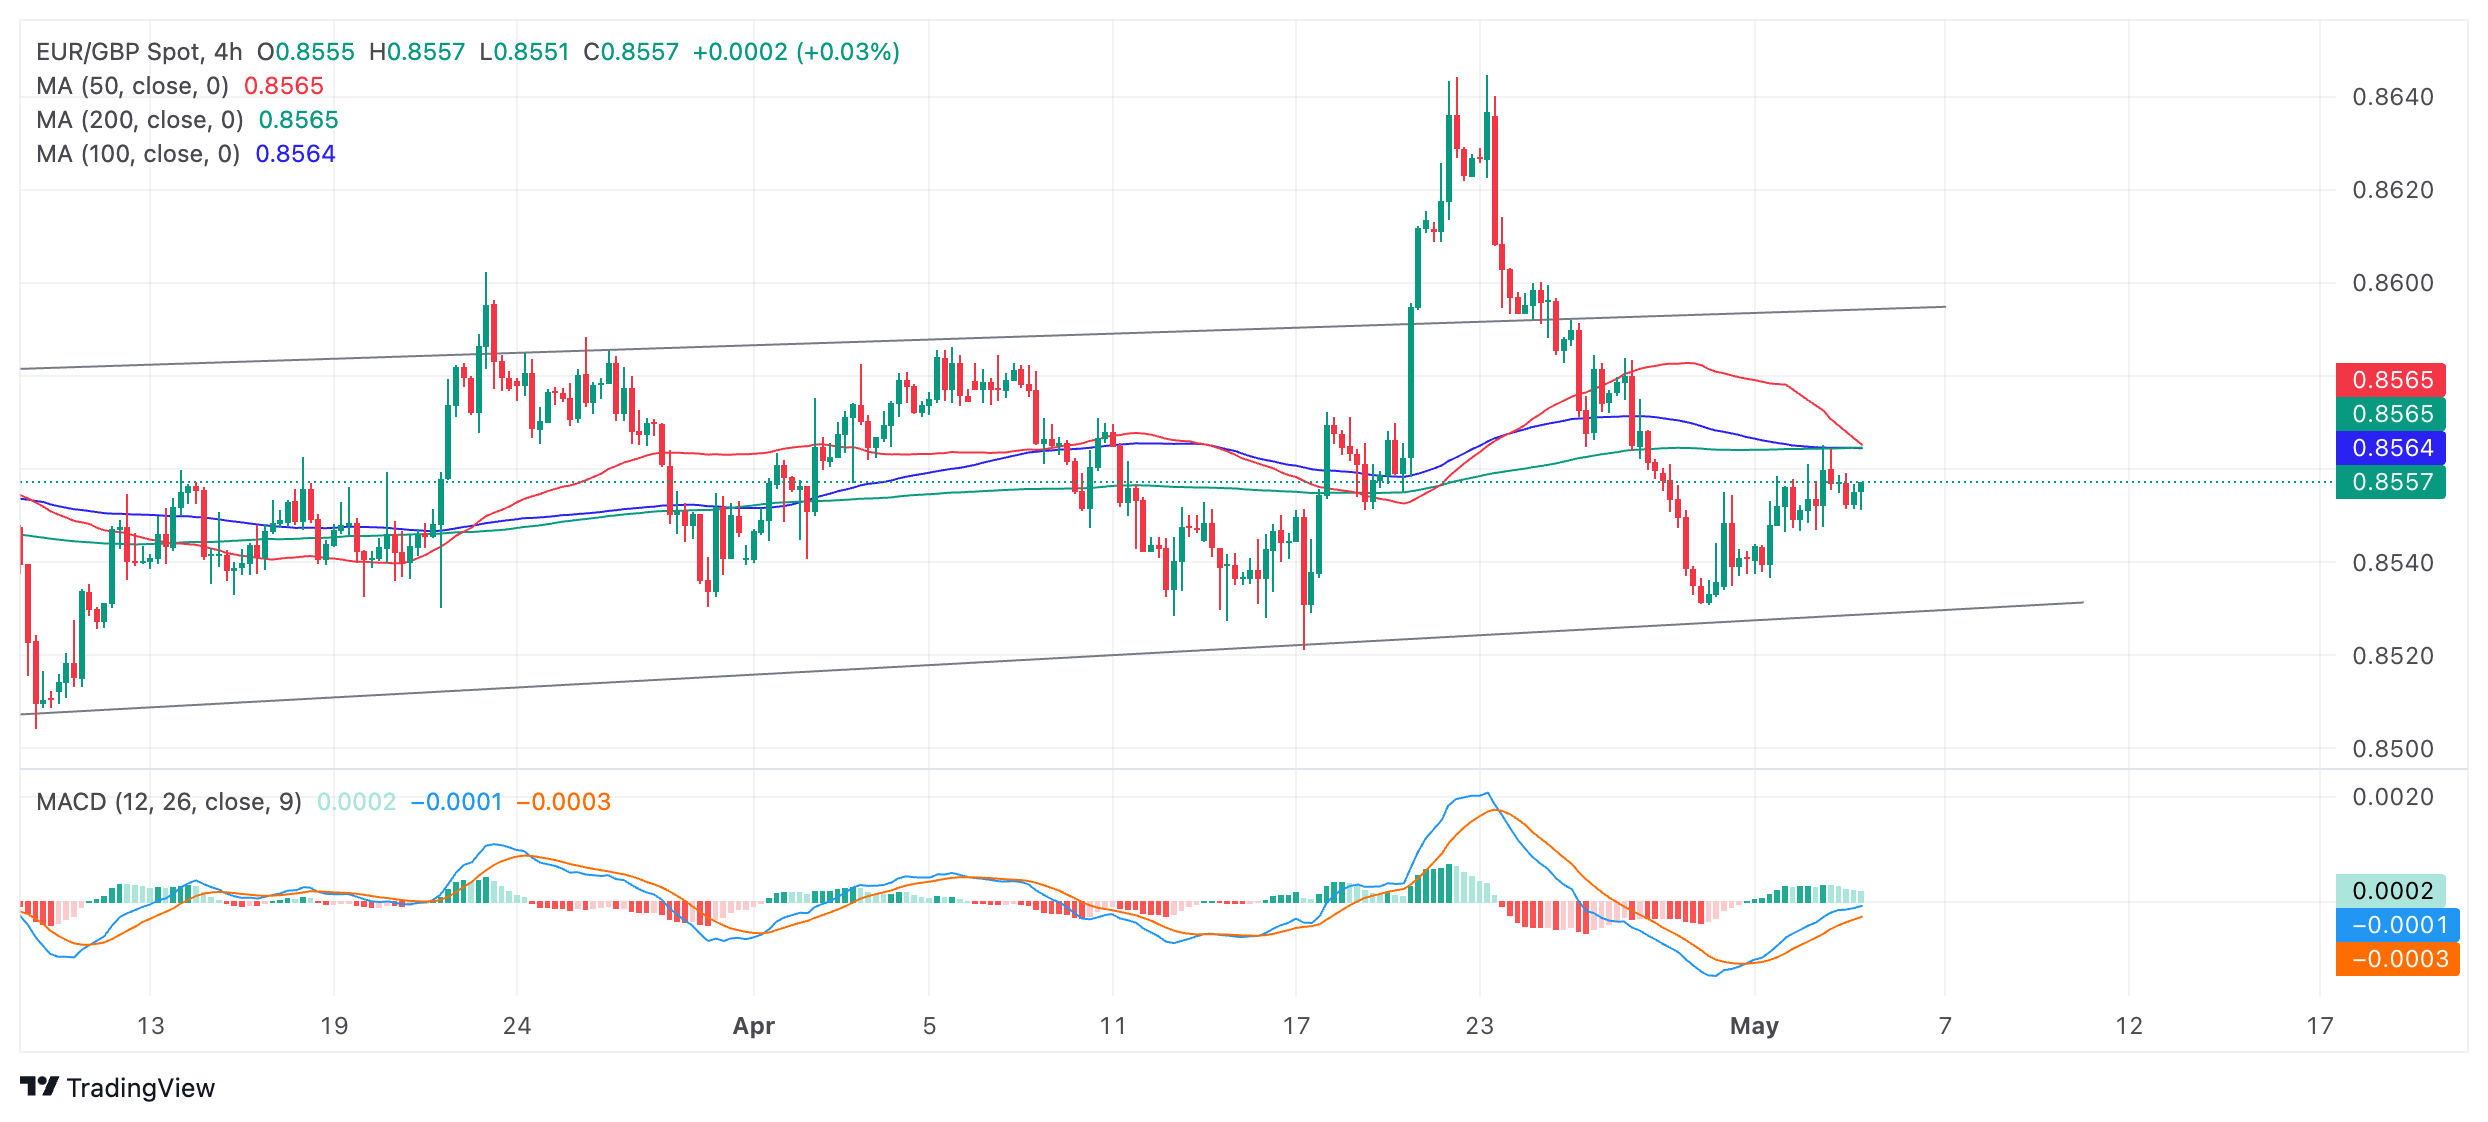
EUR/GBP has just pulled back after touching resistance from the cluster of Moving Averages in the 0.8560s. It would have to break decisively above the MAs at 0.8565 to confirm more upside, to a target at the ceiling of the range at roughly 0.8595.
The Moving Average Convergence Divergence (MACD) indicator recently crossed above its signal line giving a buy signal. This confirmed the rotation from off the range lows back up within the range. The signal was enhanced by the fact the pair was in a sideways trend and MACD is proven to be a more reliable indicator in non-trending markets.
EUR/GBP is expected to remain range-bound until a strong directional move breaks the trend.
A decisive break below the range low would open the way for more downside to the next target at 0.8486. This is the 0.681 Fibonacci ratio of the height of the range extrapolated lower from the channel’s base. This is the method used by technical analysts to estimate range breakouts. Further weakness could even see price reach the next target at 0.8460, the full height of the range extrapolated lower (1.000).
Likewise a decisive break above the range high at 0.8595 would signal a breakout with an initial target at 0.8635 followed by the 0.8645 highs.
A decisive break would be one characterized by a long candlestick that broke completely above or below the range floor and closed near its high or low, or three consecutive red candlesticks that broke clearly through the level.
- The Japanese Yen is set to lock in a staggering performance for this week against the US Dollar.
- The Yen has appreciated over 3% following Japan’s intervention to propel the currency and the Fed’s less-hawkish rhetoric.
- The US Dollar Index holds ground above 105.00 but downside pressure builds up.
The Japanese Yen (JPY) is set to book one of its best weeks in history against the US Dollar. Since last Friday, a string of (un)confirmed interventions have pushed the USD/JPY pair from roughly 160.00 to 153.00. As the dust settles, the question is for how long the effect from these interventions will linger, and if they can keep USD/JPY trading at current levels or lower.
Meanwhile, the DXY US Dollar Index – which gauges the value of the US Dollar (USD) against a basket of six foreign currencies – is holding up around 105.00 as markets are stepping away in order not to get steamrolled by the Japanese interventions. Still, the recent depreciation of the Greenback could offer a window of opportunity for US Dollar buyers to step in and gear up for a profitable ride higher. This upturn could already happen on Friday with the US Jobs Report data for April on the docket. More broadly, the significant rate differential between the US and Japan isn’t likely to allow this big appreciation of the JPY against the USD to last long.
Daily digest market movers: US Jobs report ahead
- At 12:30 GMT, the US Employment Report for April is set to be released:
- US Nonfarm Payrolls changes are expected to increase by 243,000, lower than the 303,000 rise seen in March.
- Monthly Average Hourly Earnings are expected to grow at a stable 0.3%.
- The Unemployment Rate is set to remain at 3.8%.
- Several Japanese companies have reported to Bloomberg that they are facing substantial issues due to the recent weakness in the Japanese Yen. A boom in tourism is also putting pressure on local inflation.
- Japanese markets are closed on Friday for the Greenery Day bank holiday.
- Equities are trading in the green with both European indexes and US Futures up near 0.5% on average.
- The CME Fedwatch Tool suggests an 85.5% probability that June will still see no change to the Federal Reserve's fed fund rate. Odds of a rate cut in July are also broadly out of the cards, while for September the tool shows a 60% chance that rates will be lower than current levels.
- The benchmark 10-year US Treasury Note trades around 4.57%, the lowest level this week, while Japanese 10-year JGB are trading at the high for this week near 0.889%.
USD/JPY Technical Analysis: Dollar buyers will be trembling to get in
The USD/JPY pair has still some room to fall, though a very lucrative entry level for Dollar bulls is just around the corner. Around 152.00, not only a pivotal level and the 55-day Simple Moving Average (SMA) is nearby, but also there is a long-term ascending trend line just beneath to provide support. This makes it the perfect entry level for any US Dollar buyers who foresee USD/JPY heading back to 160.00.
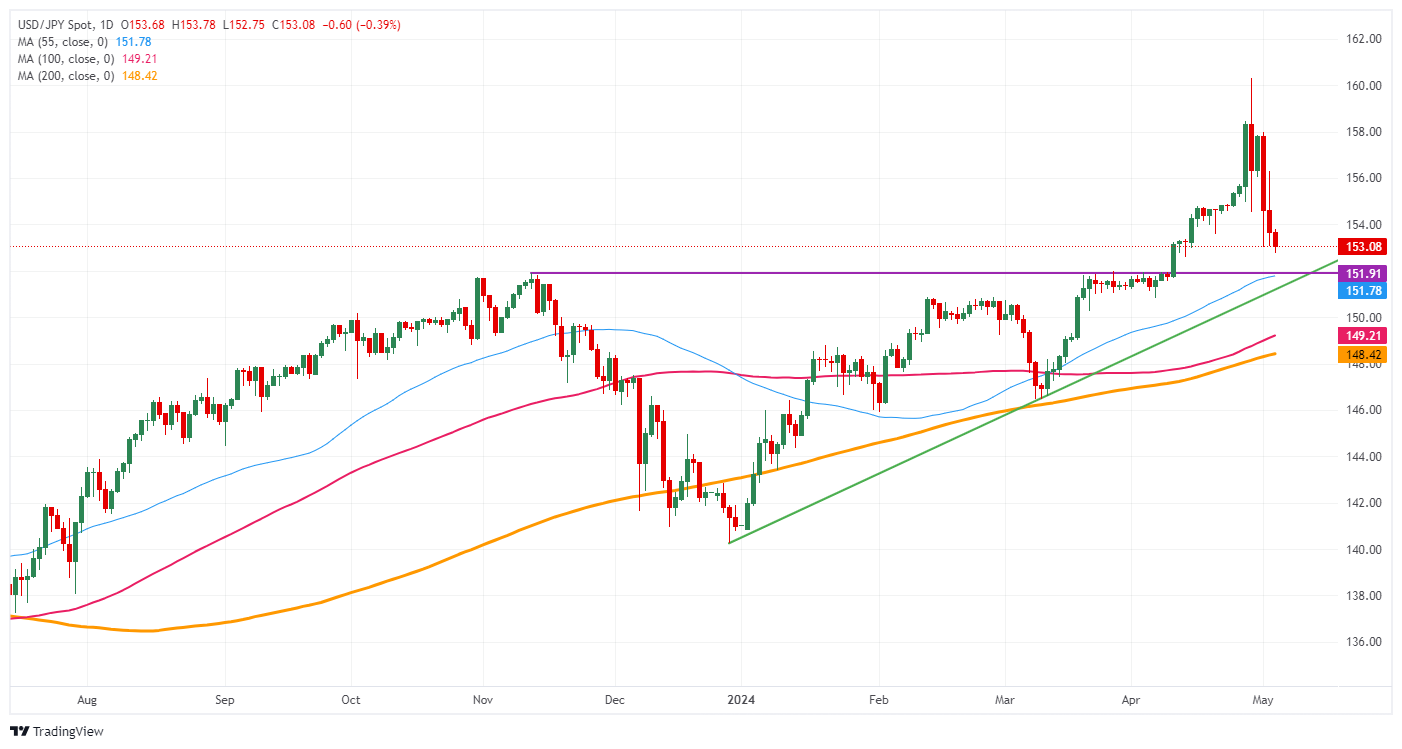
USD/JPY (daily chart)
- NZD/USD moves higher to 0.5980 as US Dollar remains on backfoot ahead of US economic data.
- The US NFP will influence speculation for Fed rate cuts, which are expected in September.
- NZ’s steady Labor Cost Index growth boosts expectations of the RBNZ delaying rate cuts.
The NZD/USD pair extends its two-day winning spell on Friday as the US Dollar hits a fresh three-week low ahead of the United States Nonfarm Payrolls (NFP) and the ISM Services PMI report for April, which will be published in the New York session.
The economic indicators will exhibit the current status of labor demand and economic health, which will be Federal Reserve (Fed) for decision-making on interest rates. This will also drive the speculation about when the Fed will start reducing interest rates. Currently, investors expect that the Fed will start reducing interest rates from the September meeting.
The consensus shows that US nonfarm employers hired 243K job-seekers, lower than robust joining of 303K payrolls in March. Investors will also focus on the Average Hourly Earnings, which is a leading indicator of wage growth that reflects the inflation outlook. The Services PMI is forecasted to have improved to 52.0 from the prior reading of 51.4.
Meanwhile, the New Zealand Dollar strengthens as the Reserve Bank of New Zealand (RBNZ) is expected to start reducing interest rates later this year. The Labor Cost Index data, which reflects wage growth and influence the consumer spending grew in line with estimates in the first quarter this year. This has boosted expectations for the RBNZ delaying rate cuts later this year.
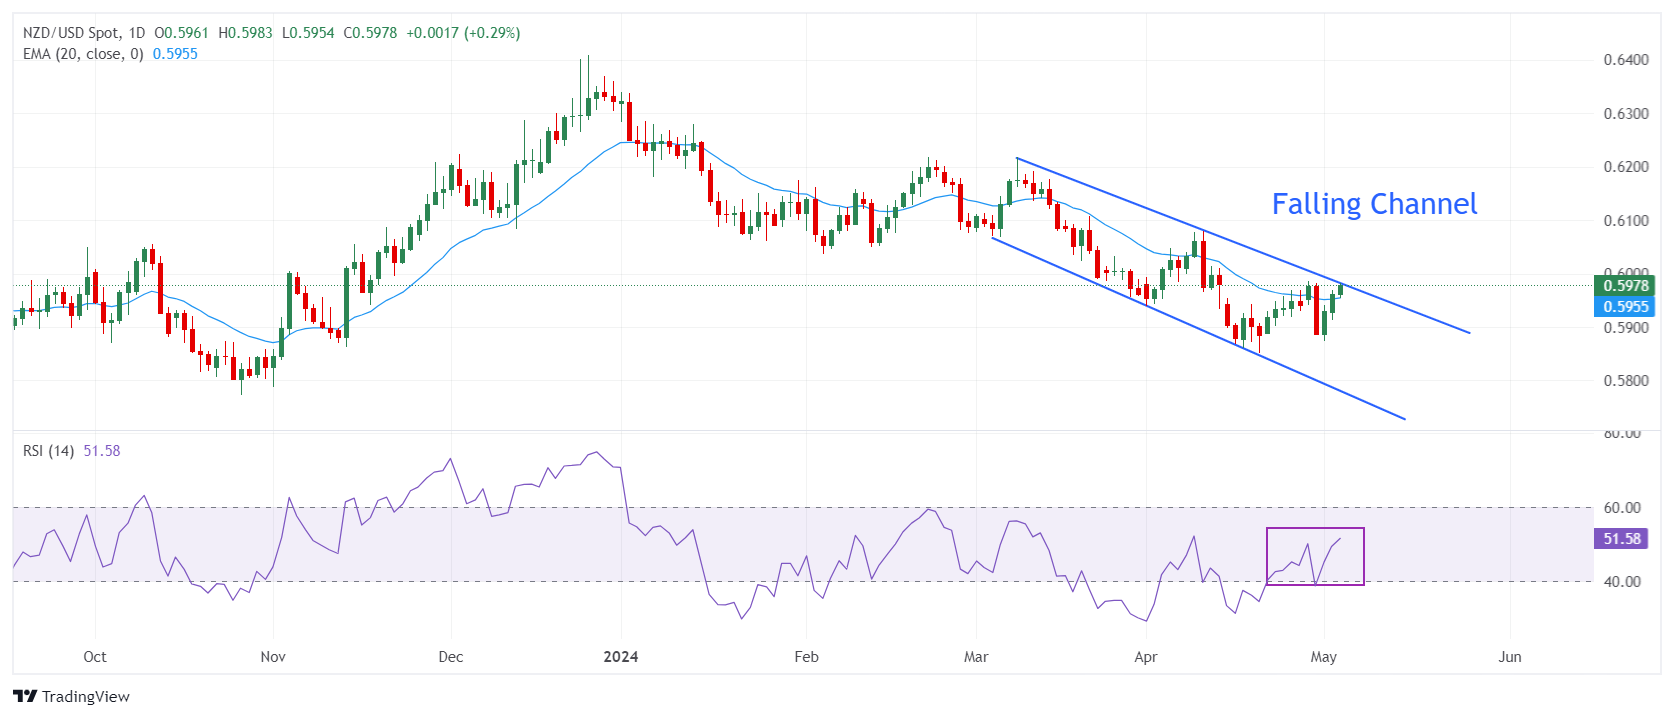
NZD/USD rises to the upward border of the Falling Channel formation on a daily timeframe. The Kiwi asset is at a make or a break near 0.5980 as momentum oscillators exhibit signs of a bullish reversal while a pullback move to the upward border of the above-mentioned chart pattern emerges as a selling opportunity for the market participants knowing that the broader trend is still bearish.
The 14-Relative Strength Index (RSI) rebounds from 40.00, which indicates that the trend is not bearish anymore.
The near-term outlook of the asset improves as it holds above the 20-day Exponential Moving Average (EMA), which trades around 0.5954.
An upside above the psychological resistance of 0.6000 will drive the asset towards April 4 high around 0.6050 and the round-level resistance of 0.6100.
On the contrary, fresh downside would appear if the asset breaks below April 16 low at 0.5860. This would drag the asset toward 8 September 2023 low at 0.5847, followed by the round-level support of 0.5900.
NZD/USD daily chart
- EUR/USD approaches 1.0750 as the US Dollar weakens ahead of crucial US economic data.
- The ECB is widely anticipated to start reducing interest rates in June.
- The Fed sees rate cuts this year despite little progress in disinflation in the first quarter.
EUR/USD advances to 1.0740 in Friday’s European session. The major currency pair strengthens as the US Dollar (USD) is under pressure due to weak Q1 Nonfarm productivity growth and as the Federal Reserve (Fed) delivered less hawkish guidance on interest rates than feared.
The US Dollar Index (DXY), which tracks the Greenback’s value against six major currencies, trades near a three-week low of around 105.20. Still, investors should remain cautious about EUR/USD longs as the market sentiment could turn sour depending on the outcome of two key data points: the United States Nonfarm Payrolls (NFP) and the ISM Services Purchasing Managers Index (PMI) data for April, which are due in the New York session.
These US economic indicators will provide fresh cues about the state of the labor market and the health of the services sector, two key elements that the Fed takes into account when deciding on interest rates. Currently, traders have increased their bets in favor of the Federal Reserve (Fed) starting to reduce interest rates in the September meeting. These expectations were boosted after Federal Reserve Chair Jerome Powell sounded slightly less hawkish than expected in the latest monetary policy statement and the press conference.
Jerome Powell said that his forecast remained for inflation to fall over the course of the year, but that "my confidence in that is lower than it was." He also acknowledged that inflation “is still too high," adding that "further progress in bringing it down is not assured and the path forward is uncertain", Reuters reported. The Fed also decided to slow down the pace of the balance sheet drawdown, which is another indication that the US central bank leaned toward policy normalization by this year.
Daily digest market movers: EUR/USD rises despite firm ECB rate cut bets for June
- EUR/USD prints a fresh four-day high at 1.0740 due to a sharp decline in the US Dollar. The strength in the major currency pair could fizzle out amid uncertainty ahead of the US NFP and firm speculation that the European Central Bank (ECB) will start reducing interest rates in June.
- The US NFP data will significantly influence market expectations for the Fed’s interest-rate outlook. The consensus shows that fresh payrolls were at 243K, lower than the former reading of 303K. The Unemployment Rate is expected to steady at 3.8%.
- Investors will also focus on the Average Hourly Earnings data, which will provide fresh clues about the inflation outlook. Monthly wage growth is forecasted to have grown steadily by 0.3%. In the same period, annual wage growth is estimated to have dipped to 4.0% from 4.1%.
- Generally, higher wage growth and strong labor demand result in robust consumer spending momentum, which eventually boosts inflationary pressures. This situation would be favorable for the US Dollar and bond yields and would likely weigh on the EUR/USD pair, as it would allow the Fed to maintain a restrictive interest rate framework for a longer period.
- Investors will also focus on the US ISM Services PMI data, a survey that gauges the performance in the services sector, which accounts for two-thirds of the economy. The Services PMI is seen improving to 52.0 from the prior reading of 51.4. Investors will also focus on subcomponents like the New Orders Index and Prices Paid Index, which will reflect the status of new business and service price inflation, respectively.
- On the Eurozone front, the European Central Bank is widely expected to reduce interest rates in June provided there isn’t any surprise with inflation as price growth in the Eurozone is on course to return to the desired rate of 2%. The expectations for the ECB achieving a “soft landing” have improved as the old continent’s economy expanded by 0.3% in the first quarter of this year, outperforming the consensus of 0.1%.
Technical Analysis: EUR/USD advances toward 1.0750
EUR/USD extends its winning spell for the third trading session on Friday and is looking to move higher to near three-week high around 1.0750. The near-term appeal of the currency pair has improved as it has broken above the 20-period Exponential Moving Average (EMA), which trades around 1.0720.
On the daily time frame, EUR/USD exhibits a sharp volatility contraction as price action has formed a Symmetrical Triangle formation. The upward-sloping border of the triangle pattern is plotted from October 3 low at 1.0448, and the downward-sloping border is placed from December 28 high around 1.1140.
The 14-period Relative Strength Index (RSI) shifts into the 40.00-60.00 range, suggesting indecisiveness among market participants.
Euro FAQs
The Euro is the currency for the 20 European Union countries that belong to the Eurozone. It is the second most heavily traded currency in the world behind the US Dollar. In 2022, it accounted for 31% of all foreign exchange transactions, with an average daily turnover of over $2.2 trillion a day. EUR/USD is the most heavily traded currency pair in the world, accounting for an estimated 30% off all transactions, followed by EUR/JPY (4%), EUR/GBP (3%) and EUR/AUD (2%).
The European Central Bank (ECB) in Frankfurt, Germany, is the reserve bank for the Eurozone. The ECB sets interest rates and manages monetary policy. The ECB’s primary mandate is to maintain price stability, which means either controlling inflation or stimulating growth. Its primary tool is the raising or lowering of interest rates. Relatively high interest rates – or the expectation of higher rates – will usually benefit the Euro and vice versa. The ECB Governing Council makes monetary policy decisions at meetings held eight times a year. Decisions are made by heads of the Eurozone national banks and six permanent members, including the President of the ECB, Christine Lagarde.
Eurozone inflation data, measured by the Harmonized Index of Consumer Prices (HICP), is an important econometric for the Euro. If inflation rises more than expected, especially if above the ECB’s 2% target, it obliges the ECB to raise interest rates to bring it back under control. Relatively high interest rates compared to its counterparts will usually benefit the Euro, as it makes the region more attractive as a place for global investors to park their money.
Data releases gauge the health of the economy and can impact on the Euro. Indicators such as GDP, Manufacturing and Services PMIs, employment, and consumer sentiment surveys can all influence the direction of the single currency. A strong economy is good for the Euro. Not only does it attract more foreign investment but it may encourage the ECB to put up interest rates, which will directly strengthen the Euro. Otherwise, if economic data is weak, the Euro is likely to fall. Economic data for the four largest economies in the euro area (Germany, France, Italy and Spain) are especially significant, as they account for 75% of the Eurozone’s economy.
Another significant data release for the Euro is the Trade Balance. This indicator measures the difference between what a country earns from its exports and what it spends on imports over a given period. If a country produces highly sought after exports then its currency will gain in value purely from the extra demand created from foreign buyers seeking to purchase these goods. Therefore, a positive net Trade Balance strengthens a currency and vice versa for a negative balance.
- Gold price edges lower as safety demand lessens amid market good cheer.
- A feel-good factor has set in following the Fed’s slightly dovish messaging on Wednesday.
- Gold price lurches sideways as traders tense, poised for the release of the US Nonfarm Payroll labor report.
The Gold price (XAU/USD) edges lower on Friday, trading down to just above $2,300, as safe-haven demand for the precious metal diminishes amid an overall upbeat market mood.
Gold price fluctuates lower as safe-haven demand softens
Gold price fluctuates lower as market sentiment remains positive on Friday, tempting investors away from the safe and secure. Asian stocks followed Wall Street higher overnight after investor fears that the Federal Reserve (Fed) might threaten to raise interest rates eased.
The Fed’s May policy meeting on Wednesday reflected an easing bias amongst Fed committee members who decided to slow down quantitative tightening by reducing their holdings of US Treasuries at a slower rate. In his press conference after the meeting, Federal Reserve Chairman Powell also stated that it was “unlikely” the central bank would raise interest rates despite persistent inflation.
Whilst expectations that US interest rates are not likely to rise helped Gold price immediately after the meeting because of its condition as a non-yielding asset, the good feeling that followed in broader global markets curtailed a key source of demand for the precious metal as a safe store of value.
Investors now await key data out on Friday in the form of the US Nonfarm Payrolls (NFP) labor report for April, which could tone the outlook for the US economy and impact continued concerns around inflation.
If the NFP shows a higher-than-expected number of nonfarm workers joined the ranks of the employed in the US in April, or if wages are shown to have risen sharply, it could change the outlook for inflation and interest rates.
Economists’ expectations are for NFPs to come in at 243K from 303K in March, and for Average Hourly Earnings to rise by 0.3% MoM and 4.0% YoY. A marked rise – especially in these two metrics – could cause downside volatility for Gold price, and vice versa for a fall.
Technical Analysis: Gold price tracks sideways ahead of NFPs
Gold price (XAU/USD) appears to be tracking sideways on the 4-hour Chart. It has stopped declining after meeting the conservative requirement for completing its bearish Measured Move price pattern at the Fibonacci 0.681 price objective for wave C, at $2,286.
XAU/USD 4-hour Chart
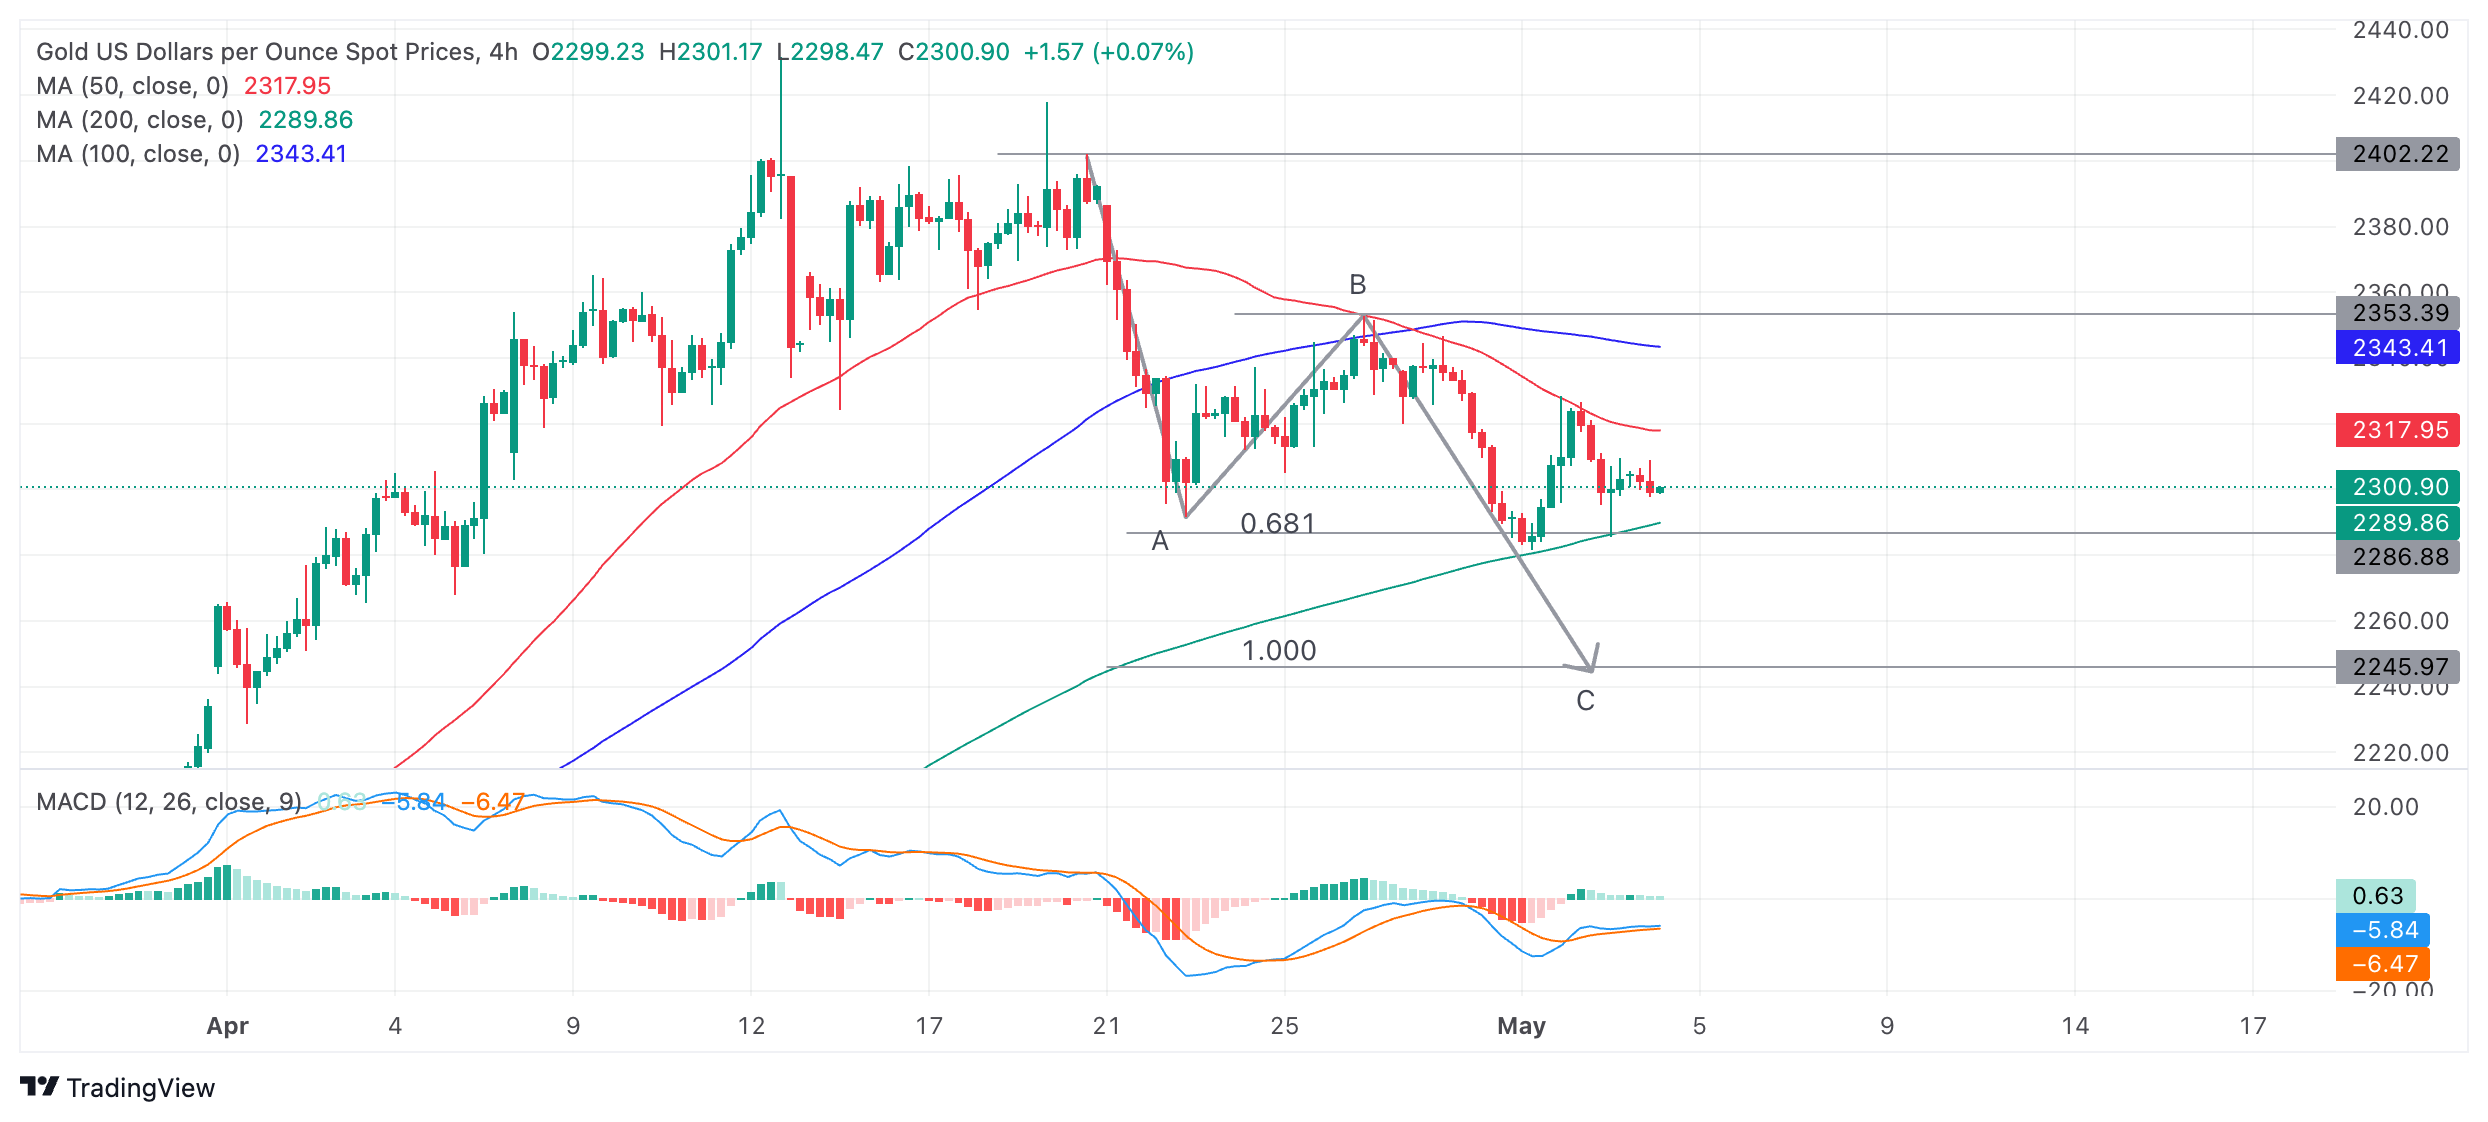
The Measured Move, a zig-zag type pattern, could still unfold if wave C has lower to go. Although it has met its conservative objective at the 0.681 Fibonacci target, it could still fall to a second target at the point where wave C equals the length of wave A. Alternatively, it may have finished unfolding altogether – both outcomes are possible.
Directionally, Gold is in a bit of a no-man’s land: a break below the 0.681 Fibonacci target lows at $2,285 would be needed to confirm more downside to a target at $2,245 (1.000 or where A=C).
Alternatively, a break above the cluster of Moving Averages and the peak of wave B at around $2,350 would potentially usher in a new more bullish environment. This could then see a retest of the $2,400 highs.
Additionally, the trend for Gold price is up on both the medium and long-term charts (daily and weekly), overall supporting the outlook on lower time frames.
Gold FAQs
Gold has played a key role in human’s history as it has been widely used as a store of value and medium of exchange. Currently, apart from its shine and usage for jewelry, the precious metal is widely seen as a safe-haven asset, meaning that it is considered a good investment during turbulent times. Gold is also widely seen as a hedge against inflation and against depreciating currencies as it doesn’t rely on any specific issuer or government.
Central banks are the biggest Gold holders. In their aim to support their currencies in turbulent times, central banks tend to diversify their reserves and buy Gold to improve the perceived strength of the economy and the currency. High Gold reserves can be a source of trust for a country’s solvency. Central banks added 1,136 tonnes of Gold worth around $70 billion to their reserves in 2022, according to data from the World Gold Council. This is the highest yearly purchase since records began. Central banks from emerging economies such as China, India and Turkey are quickly increasing their Gold reserves.
Gold has an inverse correlation with the US Dollar and US Treasuries, which are both major reserve and safe-haven assets. When the Dollar depreciates, Gold tends to rise, enabling investors and central banks to diversify their assets in turbulent times. Gold is also inversely correlated with risk assets. A rally in the stock market tends to weaken Gold price, while sell-offs in riskier markets tend to favor the precious metal.
The price can move due to a wide range of factors. Geopolitical instability or fears of a deep recession can quickly make Gold price escalate due to its safe-haven status. As a yield-less asset, Gold tends to rise with lower interest rates, while higher cost of money usually weighs down on the yellow metal. Still, most moves depend on how the US Dollar (USD) behaves as the asset is priced in dollars (XAU/USD). A strong Dollar tends to keep the price of Gold controlled, whereas a weaker Dollar is likely to push Gold prices up.
- EUR/JPY continues to lose ground amid potential market intervention by Japanese authorities.
- BoJ data showed that Japanese authorities possibly expended approximately ¥6.0 and ¥3.66 trillion on Monday and Wednesday, respectively, to bolster the JPY.
- ECB Chief Economist Philip Lane underlined the central bank's commitment to maintaining a data-dependent approach.
EUR/JPY extends its losses for the third consecutive session, trading around 164.60 during the European session on Friday. The Japanese Yen (JPY) strengthened on Friday following a rally on Thursday attributed to potential Japanese government intervention, marking the second such incident this week, according to a Reuters report. It is worth noting that Japanese banks will be closed due to Greenery Day on Friday.
Reuters reported that the Bank of Japan (BoJ) data showed on Thursday that Japanese authorities possibly expended approximately ¥3.66 trillion on Wednesday to bolster the JPY. Earlier in the week, on Monday, Japan's Ministry of Finance intervened in the market, potentially investing around ¥6.0 trillion to support the Japanese Yen. Masato Kanda, Japan's top currency diplomat, refrained from directly confirming the intervention but mentioned that the Ministry of Finance intends to disclose related data by the end of the month.
On Thursday, the Bank of Japan (BoJ) released Minutes from the March meeting with insights into the monetary policy outlook. One member noted that the economy's reaction to a short-term rate increase to approximately 0.1% is expected to be minimal. Additionally, several members believed that market forces should primarily determine long-term rates.
In the European Union, the Unemployment Rate, as reported by Eurostat, remained unchanged at 6.5% in March, aligning with market forecasts and consistent with the preceding three months. The figure reflects a decline of 94,000 unemployed individuals compared to the previous month, bringing the total to 11.08 million.
During a virtual guest lecture at Stanford University on Thursday, European Central Bank (ECB) Chief Economist Philip Lane noted that although inflation has declined more rapidly than initially projected by the ECB, the transmission of policy effects is lagging. Lane emphasized that the ECB is not bound to a specific rate trajectory and will maintain a data-dependent approach moving forward, as per Bloomberg’s report.
Gold prices fell in India on Friday, according to data from India's Multi Commodity Exchange (MCX).
Gold price stood at 70,906 Indian Rupees (INR) per 10 grams, down INR 384 compared with the INR 71,290 it cost on Thursday.
As for futures contracts, Gold prices decreased to INR 70,647 per 10 gms from INR 70,701 per 10 gms.
Prices for Silver futures contracts decreased to INR 81,119 per kg from INR 81,313 per kg.
| Major Indian city | Gold Price |
|---|---|
| Ahmedabad | 73,480 |
| Mumbai | 73,260 |
| New Delhi | 73,350 |
| Chennai | 73,420 |
| Kolkata | 73,435 |
Global Market Movers: Gold price traders seem non-committed as the focus remains glued to the US NFP
- Expectations that the Federal Reserve will keep interest rates higher for longer, along with the upbeat market mood, turn out to be key factors undermining demand for the safe haven Comex Gold price.
- The Fed signaled on Wednesday that the next move will be to lower the policy rate, though it was in no hurry to begin cutting borrowing costs as the disinflationary process has slowed in recent months.
- The Fed's less hawkish outlook led to the broad-based US Dollar weakness and helps limit the downside for the XAU/USD, warranting some caution before positioning for any meaningful downfall.
- Traders might also prefer to wait for the release of the closely watched US monthly employment details, or the NFP report, which is expected to show that the economy added 243K new jobs in April.
- Meanwhile, the Unemployment Rate is anticipated to remain steady at 3.8% during the reported month, while Average Hourly Earnings probably eased to the 4.0% YoY rate from 4.1% in March.
- The crucial jobs data might influence market expectations about the Fed's future policy decisions, which, in turn, will drive the USD and provide some meaningful impetus to the non-yielding metal.
(An automation tool was used in creating this post.)
Gold FAQs
Gold has played a key role in human’s history as it has been widely used as a store of value and medium of exchange. Currently, apart from its shine and usage for jewelry, the precious metal is widely seen as a safe-haven asset, meaning that it is considered a good investment during turbulent times. Gold is also widely seen as a hedge against inflation and against depreciating currencies as it doesn’t rely on any specific issuer or government.
Central banks are the biggest Gold holders. In their aim to support their currencies in turbulent times, central banks tend to diversify their reserves and buy Gold to improve the perceived strength of the economy and the currency. High Gold reserves can be a source of trust for a country’s solvency. Central banks added 1,136 tonnes of Gold worth around $70 billion to their reserves in 2022, according to data from the World Gold Council. This is the highest yearly purchase since records began. Central banks from emerging economies such as China, India and Turkey are quickly increasing their Gold reserves.
Gold has an inverse correlation with the US Dollar and US Treasuries, which are both major reserve and safe-haven assets. When the Dollar depreciates, Gold tends to rise, enabling investors and central banks to diversify their assets in turbulent times. Gold is also inversely correlated with risk assets. A rally in the stock market tends to weaken Gold price, while sell-offs in riskier markets tend to favor the precious metal.
The price can move due to a wide range of factors. Geopolitical instability or fears of a deep recession can quickly make Gold price escalate due to its safe-haven status. As a yield-less asset, Gold tends to rise with lower interest rates, while higher cost of money usually weighs down on the yellow metal. Still, most moves depend on how the US Dollar (USD) behaves as the asset is priced in dollars (XAU/USD). A strong Dollar tends to keep the price of Gold controlled, whereas a weaker Dollar is likely to push Gold prices up.
Silver prices (XAG/USD) fell on Friday, according to FXStreet data. Silver trades at $26.55 per troy ounce, down 0.49% from the $26.68 it cost on Thursday.
Silver prices have increased by 4.24% since the beginning of the year.
| Unit measure | Today Price |
|---|---|
| Silver price per troy ounce | $26.55 |
| Silver price per gram | $0.85 |
The Gold/Silver ratio, which shows the number of troy ounces of Silver needed to equal the value of one troy ounce of Gold, stood at 86.68 on Friday, up from 86.35 on Thursday.
Investors might use this ratio to determine the relative valuation of Gold and Silver. Some may consider a high ratio as an indicator that Silver is undervalued – or Gold is overvalued – and might buy Silver or sell Gold accordingly. Conversely, a low ratio might suggest that Gold is undervalued relative to Silver.
Silver FAQs
Silver is a precious metal highly traded among investors. It has been historically used as a store of value and a medium of exchange. Although less popular than Gold, traders may turn to Silver to diversify their investment portfolio, for its intrinsic value or as a potential hedge during high-inflation periods. Investors can buy physical Silver, in coins or in bars, or trade it through vehicles such as Exchange Traded Funds, which track its price on international markets.
Silver prices can move due to a wide range of factors. Geopolitical instability or fears of a deep recession can make Silver price escalate due to its safe-haven status, although to a lesser extent than Gold's. As a yieldless asset, Silver tends to rise with lower interest rates. Its moves also depend on how the US Dollar (USD) behaves as the asset is priced in dollars (XAG/USD). A strong Dollar tends to keep the price of Silver at bay, whereas a weaker Dollar is likely to propel prices up. Other factors such as investment demand, mining supply – Silver is much more abundant than Gold – and recycling rates can also affect prices.
Silver is widely used in industry, particularly in sectors such as electronics or solar energy, as it has one of the highest electric conductivity of all metals – more than Copper and Gold. A surge in demand can increase prices, while a decline tends to lower them. Dynamics in the US, Chinese and Indian economies can also contribute to price swings: for the US and particularly China, their big industrial sectors use Silver in various processes; in India, consumers’ demand for the precious metal for jewellery also plays a key role in setting prices.
Silver prices tend to follow Gold's moves. When Gold prices rise, Silver typically follows suit, as their status as safe-haven assets is similar. The Gold/Silver ratio, which shows the number of ounces of Silver needed to equal the value of one ounce of Gold, may help to determine the relative valuation between both metals. Some investors may consider a high ratio as an indicator that Silver is undervalued, or Gold is overvalued. On the contrary, a low ratio might suggest that Gold is undervalued relative to Silver.
FX option expiries for May 3 NY cut at 10:00 Eastern Time, via DTCC, can be found below
- EUR/USD: EUR amounts
- 1.0500 1.1b
- 1.0550 714m
- 1.0600 899m
- 1.0650 618m
- 1.0675 1.4b
- 1.0700 1.2b
- 1.0705 741m
- 1.0730 460m
- 1.0735 480m
- 1.0750 1.1b
- 1.0785 442m
- 1.0795 606m
- 1.0800 745m
- 1.0810 447m
- 1.0815 553m
- GBP/USD: GBP amounts
- 1.2500 450m
- USD/JPY: USD amounts
- 154.00 969m
- 154.15 515m
- 1550.00 531m
- 155.75 510m
- 156.50 651m
- 157.00 896m
- 158.00 462m
- USD/CHF: USD amounts
- 0.9100 402m
- AUD/USD: AUD amounts
- 0.6300 1.2b
- 0.6400 761m
- 0.6450 1.4b
- 0.6475 487m
- 0.6490 741m
- 0.6500 1.4b
- 0.6525 775m
- 0.6600 1.6b
- USD/CAD: USD amounts
- 1.3535 444m
- 1.3700 450m
- 1.3850 878m
- 1.3855 424m
- NZD/USD: NZD amounts
- 0.5950 942m
- Silver price faced challenges as traders adopt caution ahead of US Nonfarm Payrolls due on Friday.
- A softer US NFP report could support the Fed's adopting a less hawkish stance on its rate trajectory.
- Egypt has taken the lead in revitalizing stalled peace between Israel and Hamas, undermining the safe-haven Silver.
Silver price snaps its two-day winning streak, trading around $26.50 per troy ounce during the European session on Friday. The prices of the white metal faced challenges as traders exercised caution ahead of the Nonfarm Payrolls (NFP) data from the United States (US) due later in the day. The US NFP report is expected to print a reading of 243K for April, compared to 303K prior, which could offer support for the Federal Reserve’s (Fed) stance to be less hawkish on interest rate policy.
On Thursday, the report of the US Initial Jobless Claims indicated that the number of Americans filing new claims for unemployment benefits for the week ending April 26, showed no change from the previous week. It remained at 208K, the lowest level in two months and significantly below market expectations of 212K. This could give the Federal Reserve flexibility to delay interest rate cuts. The higher interest rates for a longer period could dampen the demand for non-yielding assets like Silver.
The US Federal Reserve kept interest rates unchanged at 5.25-5.50% on Wednesday, signaling a continued inclination toward future rate cuts. The downside for the Silver price remains limited in the wake of the prevalent US Dollar (USD) selling bias, led by Fed Chair Jerome Powell's less hawkish remarks. Powell dismissed any further interest rate hike during the FOMC conference after the policy decision. This, in turn, acted as a tailwind for the Silver price.
In the Middle East, the decreasing geopolitical tensions are weighing on safe-haven Silver, fueled by hopes for a ceasefire deal between Israel and Hamas. Egypt has taken the lead in revitalizing stalled peace talks this week, supported by US Secretary of State Antony Blinken's call for Hamas to accept Israel's ceasefire proposal in exchange for the release of hostages.
- The Mexican Peso edges higher in most pairs on an upbeat market mood.
- Investors are relieved the Fed did not suddenly change course and threatened to raise interest rates at its May meeting.
- Mexico S&P Global Manufacturing PMI data eases lower but remains in expansionary territory.
The Mexican Peso (MXN) edges higher in most pairs on Friday as investor risk appetite remains strong, supporting commodity-related currencies and risk-sensitive FX such as the Mexican Peso.
Asian markets tracked Wall Street higher overnight as fears melted away following the slightly dovish outcome of Wednesday’s Federal Reserve (Fed) meeting. Investors had started to fear the Fed might suddenly change its course and start raising interest rates amid persistent inflation.
USD/MXN is trading at 16.96, EUR/MXN at 18.22 and GBP/MXN at 21.28, at the time of publication during the European session.
Mexican Peso temporarily weakens after release of Manufacturing PMI
The Mexican Peso weakened temporarily on Thursday after the release of the S&P Global Manufacturing PMI for Mexico. The survey of purchasing managers in the Manufacturing sector showed a fall to 51.0 in April, down from 52.2 in March and 52.3 in February. It was the third monthly decline in a row, although the metric remains in expansive territory (above 50) – and at historic highs for the Index.
Fierce competition from rival firms in China and weak overseas demand were seen as major factors in the slowdown.
“A renewed fall in production volumes is a strong indication of how detrimental competitive conditions and weak international sales were to Mexican manufacturers at the start of the second quarter,” said Pollyanna De Lima, Economics Associate Director at S&P Global Market Intelligence.
The fall in overseas demand was offset to a certain degree by continued robust domestic demand.
“Mexico's domestic market fared better in comparison, neutralizing the weakness in overseas demand. Total new orders rose for the third consecutive month in April, amid
reports of successful advertising, demand resilience and the upcoming elections,” the report said.
Inflation absorbed
Although respondents in the PMI survey reported a rise in the cost of components, manufacturers on the whole absorbed the rise themselves, keeping prices of finished goods stable.
“Input price inflation remained elevated, but manufacturers kept prices charged from customers broadly unchanged amid ongoing efforts to secure new work," noted Pollyanna de Lima.
Also on Thursday, Business Confidence for Mexico’s industrial sector fell to 54.2 from an upwardly revised 54.4 in March, according to data from INEGI.
Foreign Exchange Reserves held by Banxico remained unchanged at $220B in March, and Mexico’s fiscal balance showed a widening of the deficit to $437.2B, according to the Secretaría de Hacienda y Crédito Público.
In a poll of private analysts, headline inflation was expected to rise to 4.20% in 2024, up from the March estimate of 4.10%, revealed Banxico.
Technical Analysis: USD/MXN in sideways short-term trend
USD/MXN continues its short-term sideways trend, oscillating between the parameters of a range with a floor at 16.86 and a ceiling at 17.40.
USD/MXN 4-hour Chart
The pair is currently trading close to the range lows.
Given the established sideways trend is tipped to continue, the next move will probably be a leg back up towards the range highs.
The pair formed a bullish Japanese Hammer candlestick reversal pattern (circled) on Thursday which could mark the beginning of the new up leg within the range, however, it is still early to say with any confidence and candlesticks are only very short-term signals.
The Moving Average Convergence Divergence (MACD) indicator is poised to cross above its signal line offering a buy signal and potentially adding weight of evidence to the bullish Hammer.
More upside could take the USD/MXN up to the 50 Simple Moving Average (SMA) on the 4-hour chart at 17.07, followed by the lower high at 17.15. A clear break above the zone of resistance around 17.15-17.18 might see further gains up towards the range highs again.
A decisive breakout of the range – either below the floor at 16.86, or the ceiling at 17.40 – would change the directional bias of the pair.
A break below the floor could see further downside to a target at 16.50, followed by the April 9 low at 16.26.
On the other side, a break above the top would activate an upside target first at 17.67, piercing a long-term trendline and then possibly reaching a further target at around 18.15.
A decisive break would be one characterized by a longer-than-average green or red daily candlestick that pierces above or below the range high or low, and that closes near its high or low for the period; or three green/red candlesticks in a row that pierce above/below the respective levels.
Banxico FAQs
The Bank of Mexico, also known as Banxico, is the country’s central bank. Its mission is to preserve the value of Mexico’s currency, the Mexican Peso (MXN), and to set the monetary policy. To this end, its main objective is to maintain low and stable inflation within target levels – at or close to its target of 3%, the midpoint in a tolerance band of between 2% and 4%.
The main tool of the Banxico to guide monetary policy is by setting interest rates. When inflation is above target, the bank will attempt to tame it by raising rates, making it more expensive for households and businesses to borrow money and thus cooling the economy. Higher interest rates are generally positive for the Mexican Peso (MXN) as they lead to higher yields, making the country a more attractive place for investors. On the contrary, lower interest rates tend to weaken MXN. The rate differential with the USD, or how the Banxico is expected to set interest rates compared with the US Federal Reserve (Fed), is a key factor.
Banxico meets eight times a year, and its monetary policy is greatly influenced by decisions of the US Federal Reserve (Fed). Therefore, the central bank’s decision-making committee usually gathers a week after the Fed. In doing so, Banxico reacts and sometimes anticipates monetary policy measures set by the Federal Reserve. For example, after the Covid-19 pandemic, before the Fed raised rates, Banxico did it first in an attempt to diminish the chances of a substantial depreciation of the Mexican Peso (MXN) and to prevent capital outflows that could destabilize the country.
- The Pound Sterling recovers further to 1.2550 amid an improved market mood and a decline in the US Dollar.
- The BoE is expected to start reducing interest rates from the September meeting.
- Investors should brace for high volatility ahead of US NFP at 12:30 GMT.
The Pound Sterling (GBP) rises to 1.2550 against the US Dollar (USD) in Friday’s London session. The GBP/USD pair strengthens as financial markets see the Bank of England (BoE) reducing interest rates from the September meeting, more or less in line with expectations of the US Federal Reserve making a similar move. Earlier, investors were divided between the June or August meeting.
The speculation about the BoE pivoting to interest rate cuts has been postponed as investors remain worried about strong wage growth in the United Kingdom, which is feeding the core Consumer Price Index (CPI), the central bank’s preferred inflation measure.
For the headline inflation, BoE Governor Andrew Bailey said he is confident that it will return to the desired rate of 2%. The next BoE’s monetary policy decisionich will be announced on May 9, and markets expect the bank to hold interest rates steady at 5.25%. Investors will keenly focus on whether Andrew Bailey sticks to its statement that expectations for two or three rate cuts are reasonable this year, as stated in March’s policy meeting.
Daily digest market movers: Pound Sterling holds strength while US Dollar trades around three-week low
- The Pound Sterling extends its recovery to 1.2550 against the US Dollar as the market sentiment is positive despite uncertainty ahead of the release of the United States Nonfarm Payrolls (NFP) and the ISM Services Purchasing Managers Index (PMI) reports for April. The S&P 500 sharply recovered on Thursday gaining around 0.90% and suggesting a higher risk appetite of investors.
- US nonfarm employers are expected to have recruited 238K workers in April, lower than the former reading of 303K. The Unemployment Rate is estimated to remain steady at 3.8%. Investors will keenly focus on the Average Hourly Earnings data, which will provide a fresh inflation outlook. The annual wage growth is expected to have softened to 4.0% from 4.1% in March, with monthly figures increasing steadily by 0.3%.
- Strong labor demand and higher wage growth would allow the Federal Reserve to delay rate cut plans while signs of labor market conditions easing will boost rate cut bets, which are currently anticipated in the September meeting.
- The ISM Services PMI, which represents the service sector that accounts for two-thirds of the economy, is expected to rise to 52.0 from 51.4 in March.
- Apart from the cheerful market mood, a sharp decline in the US Dollar has also strengthened the GBP/USD pair. The US Dollar Index (DXY) trades close to a three-week low around 105.20, weighed down by weak Q1 Nonfarm Productivity data combined with Fed’s less hawkish guidance on interest rates than feared.
- The Q1 Nonfarm Productivity data, which reflects hourly output per worker, grew at a significantly slower pace of 0.3% from expectations of 0.8% and a strong reading of 3.5% in the last quarter of 2023.
- On Wednesday, investors observed that the Fed remains leaning towards easing restrictive policy this year after listening to the monetary policy statement and Fed Chair Jerome Powell’s press conference. Jerome Powell acknowledged that progress in disinflation has stalled but remains hopeful that rate cuts are eventual this year. The Fed also slowed the pace of tapering the balance sheet. The Fed said that starting on June 1 it will reduce the cap on Treasury securities it allows to mature and not be replaced to $25 billion from its current cap of up to $60 billion per month, Reuters reported.
Technical Analysis: Pound Sterling extends winning streak and rises to 1.2550
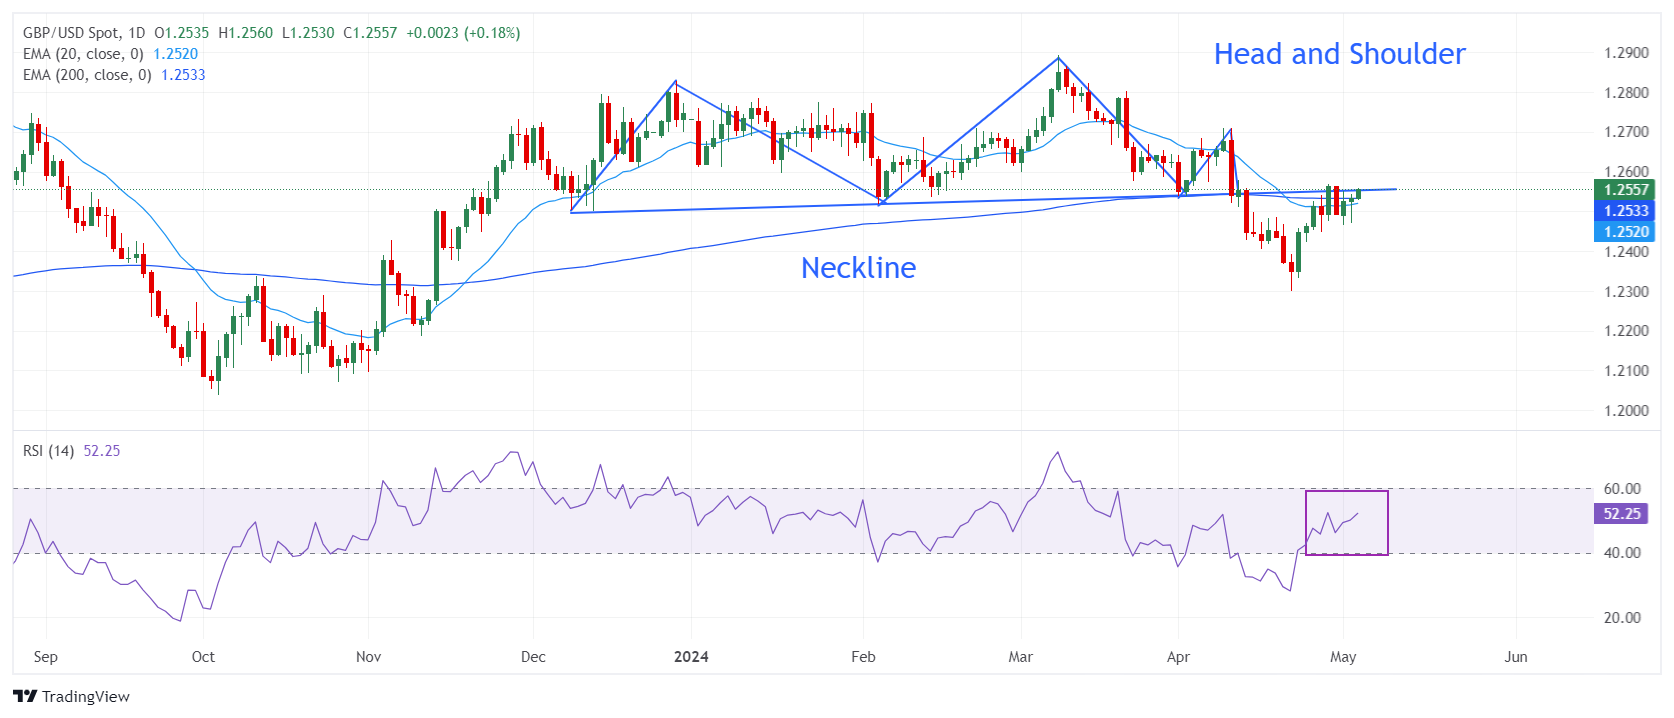
The Pound Sterling extends its winning spell for the third trading day on Friday. The GBP/USD pair holds gains above the psychological support of 1.2500. The near-term outlook of the Cable is upbeat as it holds above the 20-day Exponential Moving Average (EMA), which trades around 1.2520. While the long-term outlook is uncertain as the asset has yet not delivered a decisive break above the 200-day EMA near 1.2555.
The pair continues to face pressure near the neckline of the Head and Shoulder pattern. On April 12, Cable witnessed an intense sell-off after breaking below the neckline of the H&S pattern plotted from December 8 low around 1.2500.
The 14-period Relative Strength Index (RSI) oscillates in the 40.00-60.00 range, suggesting indecisiveness among market participants.
Pound Sterling FAQs
The Pound Sterling (GBP) is the oldest currency in the world (886 AD) and the official currency of the United Kingdom. It is the fourth most traded unit for foreign exchange (FX) in the world, accounting for 12% of all transactions, averaging $630 billion a day, according to 2022 data. Its key trading pairs are GBP/USD, aka ‘Cable’, which accounts for 11% of FX, GBP/JPY, or the ‘Dragon’ as it is known by traders (3%), and EUR/GBP (2%). The Pound Sterling is issued by the Bank of England (BoE).
The single most important factor influencing the value of the Pound Sterling is monetary policy decided by the Bank of England. The BoE bases its decisions on whether it has achieved its primary goal of “price stability” – a steady inflation rate of around 2%. Its primary tool for achieving this is the adjustment of interest rates. When inflation is too high, the BoE will try to rein it in by raising interest rates, making it more expensive for people and businesses to access credit. This is generally positive for GBP, as higher interest rates make the UK a more attractive place for global investors to park their money. When inflation falls too low it is a sign economic growth is slowing. In this scenario, the BoE will consider lowering interest rates to cheapen credit so businesses will borrow more to invest in growth-generating projects.
Data releases gauge the health of the economy and can impact the value of the Pound Sterling. Indicators such as GDP, Manufacturing and Services PMIs, and employment can all influence the direction of the GBP. A strong economy is good for Sterling. Not only does it attract more foreign investment but it may encourage the BoE to put up interest rates, which will directly strengthen GBP. Otherwise, if economic data is weak, the Pound Sterling is likely to fall.
Another significant data release for the Pound Sterling is the Trade Balance. This indicator measures the difference between what a country earns from its exports and what it spends on imports over a given period. If a country produces highly sought-after exports, its currency will benefit purely from the extra demand created from foreign buyers seeking to purchase these goods. Therefore, a positive net Trade Balance strengthens a currency and vice versa for a negative balance.
- EUR/JPY attracts some sellers to 164.40 in Friday’s early European session.
- The cross is below the key EMA with an oversold RSI condition.
- The first downside target is located at 163.67; the immediate resistance level is seen in the 165.90–166.00 zone.
The EUR/JPY cross loses momentum around 164.40 on Friday during the early European trading hours. The cross trades on a softer note for the third consecutive day, despite bouncing off weekly lows of 164.00. The speculation that Japanese authorities will further intervene in the foreign exchange (FX) provides some support to the Japanese Yen (JPY) and creates a headwind for EUR/JPY.
According to the four-hour chart, EUR/JPY keeps the bearish vibe unchanged as the cross holds below the 100-period Exponential Moving Averages (EMA). The Relative Strength Index (RSI) holds in bearish territory below 30. However, the oversold RSI condition indicates that further consolidation cannot be ruled out before positioning for any near-term EUR/JPY depreciation.
The first downside target will emerge near the lower limit of the Bollinger Band at 163.67. Any follow-through selling below the latter will see a drop to a low of April 19 near 163.00. The next contention level to watch is a low of April 12 at 162.28.
On the other hand, the immediate resistance level for the cross is located at the 165.90–166.00 region, representing the 100-period EMA and psychological level. Further north, the next hurdle is seen near a high of May 2 at 167.38. A break above the latter could see a rally to a yearly high of 2007 at 168.95, en route to the upper boundary of the Bollinger Band at 170.18.
EUR/JPY four-hour chart
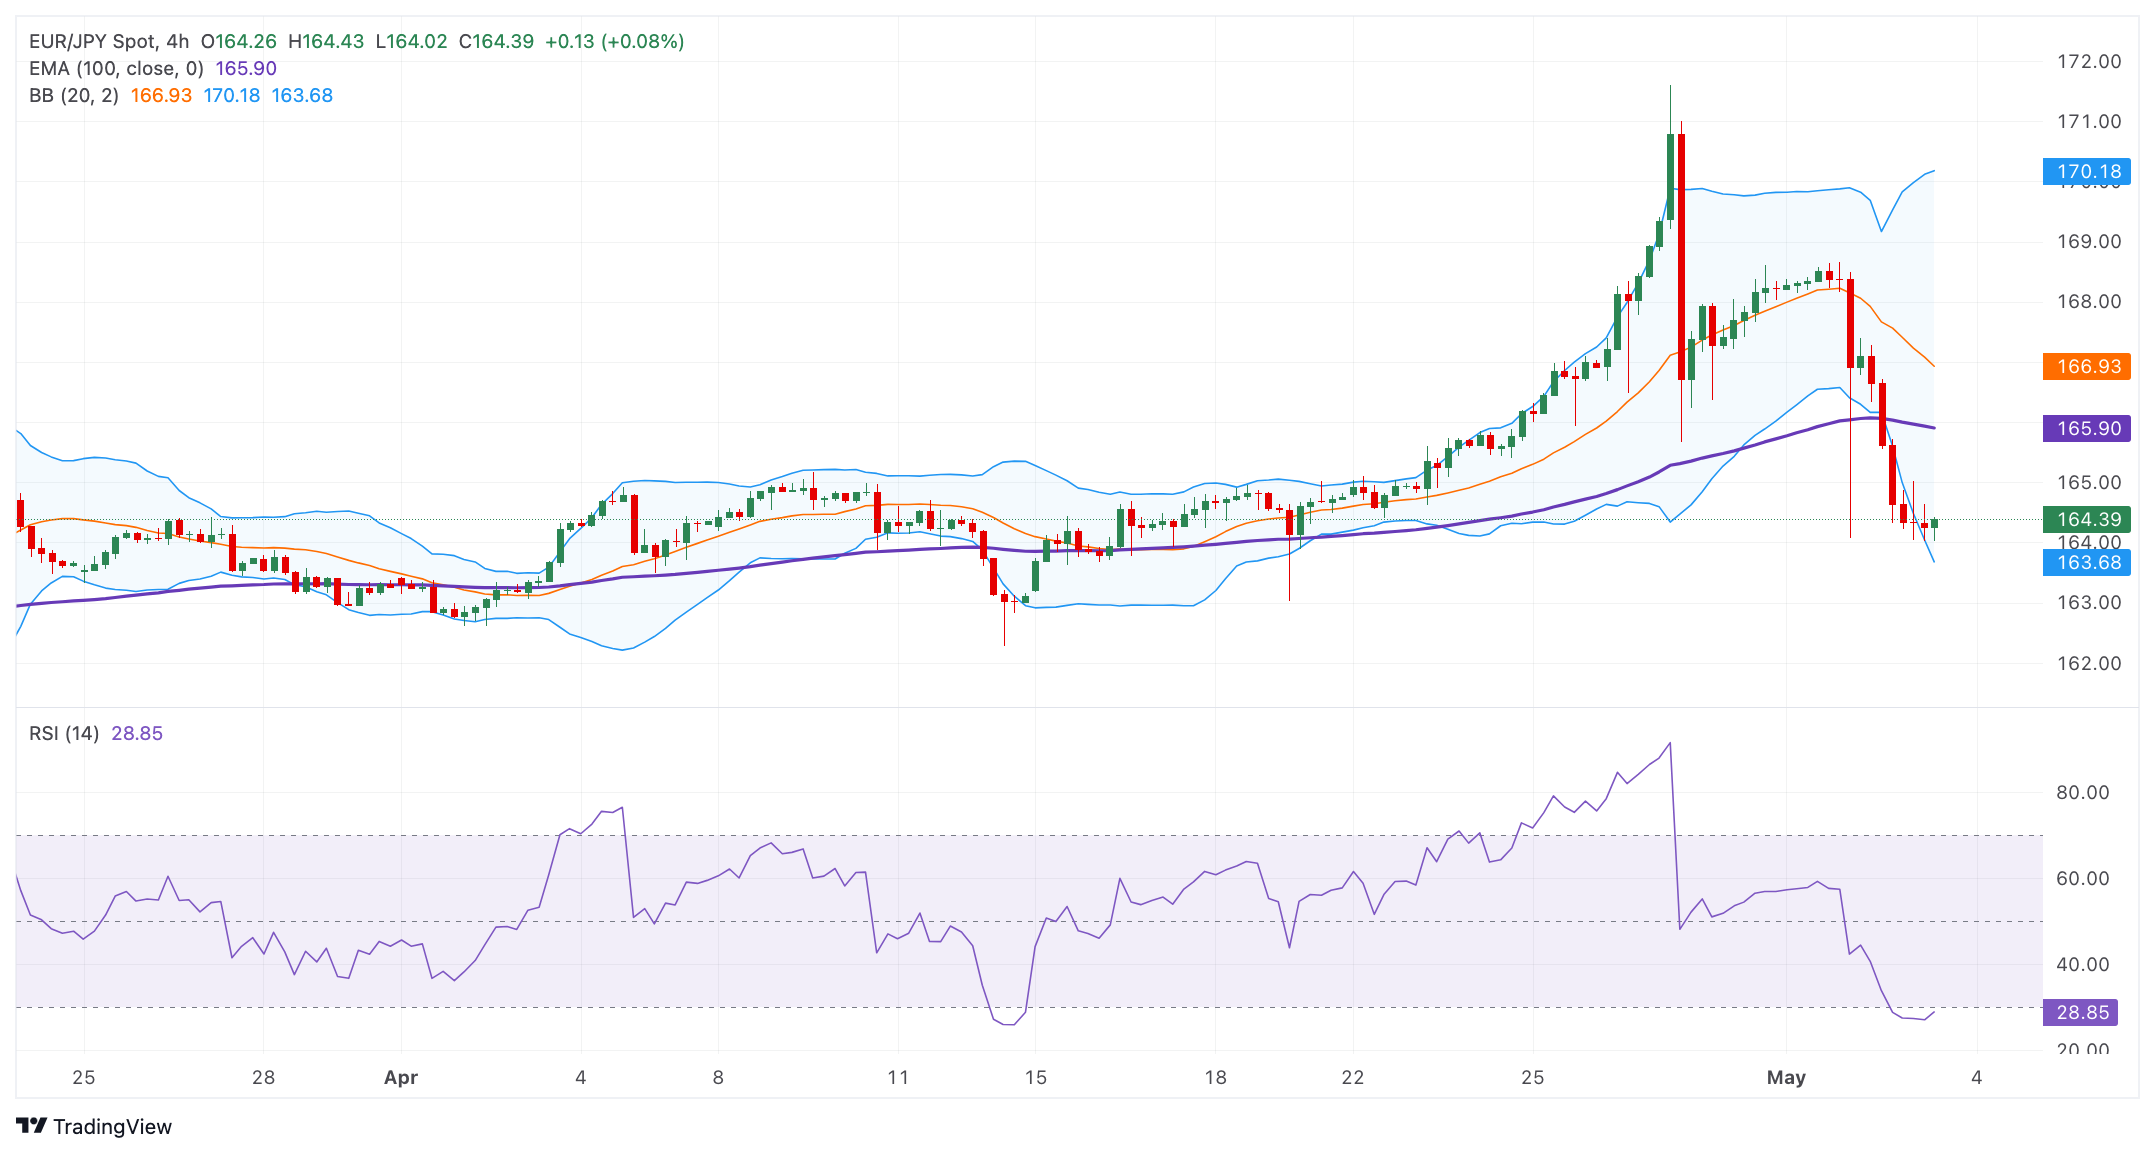
Here is what you need to know on Friday, May 3:
The US Dollar (USD) stays under modest bearish pressure early Friday, with the USD Index (DXY) trading at its lowest level in three weeks, slightly above 105.00. In the second half of the day, the US Bureau of Labor Statistics will release April jobs report, which will include Nonfarm Payrolls, Unemployment Rate and wage inflation figures. The ISM Services PMI report for April will also be featured in the US economic docket ahead of the weekend.
After the decline seen following the Federal Reserve's (Fed) policy announcements late Wednesday, the DXY recovered modestly during the European trading hours on Thursday. The positive shift seen in risk sentiment, however, triggered another leg lower later in the American session. Wall Street's main indexes registered strong gains, with the Nasdaq Composite leading the winners with a 1.3% increase. Early Friday, US stock index futures trade in positive territory, while the 10-year US yield stays below 4.6%.
US Dollar price this week
The table below shows the percentage change of US Dollar (USD) against listed major currencies this week. US Dollar was the weakest against the Japanese Yen.
| USD | EUR | GBP | CAD | AUD | JPY | NZD | CHF | |
| USD | -0.24% | -0.30% | 0.07% | -0.52% | -3.33% | -0.34% | -0.61% | |
| EUR | 0.24% | -0.06% | 0.31% | -0.27% | -3.09% | -0.09% | -0.37% | |
| GBP | 0.31% | 0.06% | 0.37% | -0.22% | -3.03% | -0.04% | -0.30% | |
| CAD | -0.07% | -0.32% | -0.37% | -0.59% | -3.41% | -0.41% | -0.70% | |
| AUD | 0.51% | 0.27% | 0.21% | 0.58% | -2.81% | 0.17% | -0.10% | |
| JPY | 3.24% | 2.99% | 2.93% | 3.30% | 2.71% | 2.90% | 2.65% | |
| NZD | 0.34% | 0.09% | 0.03% | 0.41% | -0.18% | -3.00% | -0.27% | |
| CHF | 0.62% | 0.38% | 0.31% | 0.68% | 0.09% | -2.71% | 0.27% |
The heat map shows percentage changes of major currencies against each other. The base currency is picked from the left column, while the quote currency is picked from the top row. For example, if you pick the Euro from the left column and move along the horizontal line to the Japanese Yen, the percentage change displayed in the box will represent EUR (base)/JPY (quote).
Nonfarm Payrolls (NFP) are forecast to rise 238,000 in April following the 303,000 growth recorded in March. The Unemployment Rate is expected to hold steady at 3.8% and the Average Hourly Earnings are seen rising 4% on a yearly basis.
NFP Forecast: Nonfarm Payrolls set for another solid increase in April, albeit cooling from March.
EUR/USD registered marginal gains on Thursday and continued to stretch higher early Friday. At the time of press, the pair was trading slightly above 1.0730.
After spending a large portion of the day below 1.2500, GBP/USD reversed its direction in the American session and closed in positive territory. The pair holds its ground in the European morning and trades modestly higher on the day near 1.2550.
Following Wednesday's sharp decline, which was seemingly caused by a Japanese intervention in the foreign exchange market, USD/JPY extended its slide in closed in negative territory on Thursday. The pair stays on the back foot early Friday and was last seen losing 0.4% on the day near 153.00.
Japanese Yen sticks to gains near near multi-week top, looks to US NFP for fresh impetus.
Gold failed to build on Wednesday's gains but managed to close the day slightly above $2,300 on Thursday. XAU/USD stays relatively quiet near this level in the European morning.
Gold price consolidates around $2,300 as traders remain on sidelines ahead of US NFP.
Economic Indicator
Nonfarm Payrolls
The Nonfarm Payrolls release presents the number of new jobs created in the US during the previous month in all non-agricultural businesses; it is released by the US Bureau of Labor Statistics (BLS). The monthly changes in payrolls can be extremely volatile. The number is also subject to strong reviews, which can also trigger volatility in the Forex board. Generally speaking, a high reading is seen as bullish for the US Dollar (USD), while a low reading is seen as bearish, although previous months' reviews and the Unemployment Rate are as relevant as the headline figure. The market's reaction, therefore, depends on how the market assesses all the data contained in the BLS report as a whole.
Read more.Last release: Fri Apr 05, 2024 12:30
Frequency: Monthly
Actual: 303K
Consensus: 200K
Previous: 275K
Source: US Bureau of Labor Statistics
America’s monthly jobs report is considered the most important economic indicator for forex traders. Released on the first Friday following the reported month, the change in the number of positions is closely correlated with the overall performance of the economy and is monitored by policymakers. Full employment is one of the Federal Reserve’s mandates and it considers developments in the labor market when setting its policies, thus impacting currencies. Despite several leading indicators shaping estimates, Nonfarm Payrolls tend to surprise markets and trigger substantial volatility. Actual figures beating the consensus tend to be USD bullish.
- GBP/USD could test the immediate throwback support at the 1.2518 level and the nine-day EMA at 1.2514.
- The momentum indicator MACD could offer a clear bullish direction once it breaks above the centerline.
- The pair could test the upper boundary of the descending channel around 1.2570 level.
GBP/USD extends its gains for the third successive session on Friday, trading around 1.2550 during the Asian session. The pair consolidates within the descending channel on a daily chart, with the 14-day Relative Strength Index (RSI) moving above the 50-level. indicating the weakening of a bearish bias.
Additionally, the Moving Average Convergence Divergence (MACD) indicates a momentum shift as it is positioned above the signal line but below the centerline. This momentum indicator could confirm a clear direction for the GBP/USD pair once it breaks above the centerline.
The GBP/USD pair could test the immediate throwback support at the 1.2518 level, aligned with the nine-day Exponential Moving Average (EMA) at 1.2514. The next support appears at the psychological level of 1.2500. A break below this level could exert pressure on the pair to navigate the region around the six-month low of 1.2300.
On the upside, the immediate resistance appears at the upper boundary of the descending channel around the level of 1.2570 followed by the 50% retracement level at 1.2597 level, plotting between the range of 1.2894 and 1.2300.
GBP/USD: Daily Chart
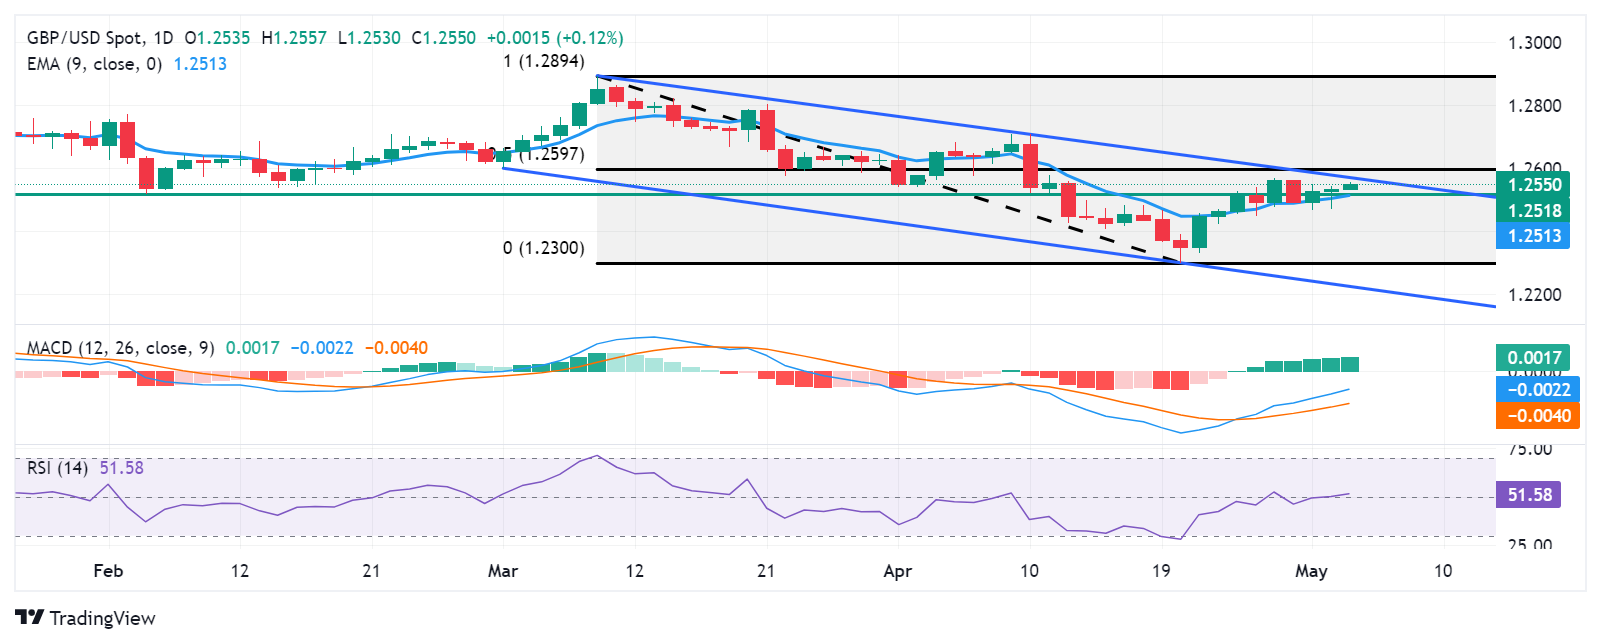
- USD/CHF extends its downside near 0.9095 amid softer USD on Friday.
- The Fed kept its benchmark rate on Wednesday as inflation remains high.
- Swiss CPI inflation was hotter than expected in April, climbing to 1.4% YoY from a rise of 1.0% in March.
The USD/CHF pair trades in negative territory for the third consecutive day on Friday during the early European session. The pair edges lower to 0.9095 after retreating from a seven-month high of nearly 0.9224 due to the softer US Dollar (USD) broadly. Investors await the highly-anticipated US Nonfarm Payrolls (NFP) for April on Friday, which is forecast to show 243K job additions in the US economy.
The US Federal Reserve (Fed) decided to keep monetary policy on hold on Wednesday. During the press conference, Fed Chair Powell noted that progress on inflation has stalled recently and that it would take longer to gain confidence that inflation is moving towards the 2% target. The higher-for-longer US rate narrative is likely to lift the Greenback and cap the pair’s downside in the near term. Apart from this, the US central bank announced a slowing in its balance sheet runoff (QT).
The annual inflation in Switzerland accelerated faster than expected in April, the Federal Statistics Office reported on Thursday. The Swiss Consumer Price Index (CPI) inflation climbed to 1.4% YoY in April from a rise of 1.0% in March, above the market consensus of 1.1%. The Swiss Franc (CHF) gained traction after the data was released and created a headwind for the USD/CHF pair. Last week, Swiss National Bank (SNB) chairman Thomas Jordan said the central bank had brought inflation under control, with the bank estimating price rises to be within its target band for the next few years.
- EUR/USD advances due to positive market sentiment ahead of US Nonfarm Payrolls on Friday.
- The weekly US Initial Jobless Claims remained at the lowest level in two months, prompting the Fed to delay rate cuts.
- ECB Chief Economist Philip Lane emphasized that the central bank will continue to adopt a data-dependent approach.
EUR/USD extends its winning streak for the third successful day on Friday, trading around 1.0730 during the Asian session on Friday. The risk-sensitive currencies like the Euro gain ground as risk appetite regains balance ahead of US Nonfarm Payrolls (NFP). US Nonfarm Payrolls is expected to print a reading of 243K for April, compared to 303K prior. Additionally, Average Hourly Earnings and ISM Services PMI will be released later on Friday. These releases are expected to offer additional insights into the condition of the United States (US) economy.
On Thursday, US Initial Jobless Claims data for the week ending April 26 showed no change from the previous week, remaining at 208K, the lowest level in two months and significantly below market expectations of 212K. This could give the Federal Reserve flexibility to delay interest rate cuts.
US Nonfarm Productivity increased by 0.3% in the first quarter, following an upwardly revised 3.5% rise in the previous quarter, but falling short of the expected increase of 0.8%. This marks the slowest pace of productivity growth since the January-March quarter in 2023.
In the Eurozone, European Central Bank (ECB) Chief Economist Philip Lane said in a virtual guest lecture at the University of Stanford that while inflation has decreased more rapidly than initially anticipated by the ECB, the transmission of policy effects lags. and the tightening impacts from previous rate hikes are still unfolding. Lane emphasized that the ECB is not committed to a specific rate trajectory and will continue to adopt a data-dependent approach.
- US Nonfarm Payrolls are forecast to rise by 243K in April, down from March’s 303K gain.
- The United States Employment report will be released by the Bureau of Labor Statistics at 12:30 GMT.
- The US Dollar looks to employment data after the Fed signaled its intention to hold rates higher for longer on Wednesday.
Following Wednesday’s US Federal Reserve (Fed) policy announcements, attention turns toward the high-impact Nonfarm Payrolls (NFP) data, slated for release on Friday at 12:30 GMT.
The US labor market data will be published by the Bureau of Labor Statistics (BLS) and will help determine the scope and timing of the Fed interest rate cuts this year, having a significant impact on the market sentiment and the US Dollar in the near term.
What to expect in the next Nonfarm Payrolls report?
The Nonfarm Payrolls report is expected to show that the US economy added 243,000 jobs last month, sharply lower than the 303,000 job creation seen in March.
The Unemployment Rate is set to stay unchanged at 3.8% in the same period. Meanwhile, Average Hourly Earnings, an important gauge of wage inflation, is expected to extend its downtrend, foreseen to grow by 4.0% in the year through April after rising 4.1% in the twelve months to March.
The headline NFP number combined with the wage inflation data will be closely scrutinized to gauge the Fed rate cut timing after Chair Jerome Powell on Wednesday kept everyone guessing about the same.
The world’s most powerful central bank held the Fed Funds Rate in the range of 5.25% to 5.5% following its May policy meeting. The Fed decided to cut the Treasury runoff from its balance sheet to $25 billion from $60 billion.
Powell acknowledged a broader shift in the Fed’s thinking toward holding borrowing costs at a two-decade high for longer, adding that central bankers want “greater confidence” that inflation is falling toward 2%.
A recent series of economic data from the US justified the Fed’s higher rates for a longer stance, especially after hot core PCE inflation data and a higher-than-expected increase in the US Employment Cost Index (ECI) for the first quarter. Data published by the BLS on Tuesday showed that the ECI, the broadest measure of labor costs, increased by 1.2% last quarter after rising by 0.9% in the fourth quarter.
However, Fed Chairman Jerome Powell ruled out a rate hike as the next move. This, paired with the Fed’s plans to slow the speed of its balance sheet drawdown, was perceived as a dovish lean by the bank toward eventual rate cuts later this year. The probability of the first Fed rate cut, likely in September, rose to 53% from about 47% pre-Fed announcements, according to the CME Group’s FedWatch Tool.
Meanwhile, the US private sector added 192,000 jobs in April, a modest decrease from the upwardly revised 208,000 figure in March, the ADP reported on Wednesday. The data beat the analysts’ estimates of a 175,000 job addition. It’s worth mentioning that NFP has outperformed ADP for eight straight months. On the contrary, US job openings fell by 325,000 to 8.488 million on the last day of March, the BLS said the same day. The market forecast was for an 8.69 million readout.
Previewing the April jobs report, BBH analysts said: “Data highlight will be the jobs report Friday. Consensus sees 250k jobs added vs. 303k in March, while the unemployment rate is expected to remain steady at 3.8%. The pace of wage growth, a key driver of core services CPI inflation, will also draw plenty of attention. Average hourly earnings are expected to slow a tick to 4.0% y/y.”
How will US April Nonfarm Payrolls affect EUR/USD?
Dovish Fed signals smashed the US Dollar across the board alongside the US Treasury bond yields, driving the EUR/USD pair back above the 1.0700 threshold. The focus now shifts to the US NFP report for a fresh directional move in the main currency pair.
A strong-than-expected NFP headline figure combined with hotter-than-expected wage inflation data could push back against expectations of a September Fed rate cut, lifting the US Dollar against the Euro back toward 1.0600. Conversely, if the US employment data strongly indicates loosening labor market conditions, the Greenback could see a fresh leg down on a potential confirmation of rate cuts this year. In such a case, EUR/USD could advance through the 1.0800 threshold.
Dhwani Mehta, Analyst at FXStreet, offers a brief technical outlook for EUR/USD:
“The EUR/USD pair is struggling at around the 21-day Simple Moving Average (SMA) at 1.0715, while the 14-day Relative Strength Index (RSI) sits beneath the 50 level, suggesting that downside risks remain in play.”
“Buyers need to find a strong foothold above 1.0800, the convergence of the 200-day and 50-day SMAs, to unleash further recovery. The next upside barrier for EUR/USD will then be seen at the 100-day SMA at 1.0842. Conversely, the initial demand area is seen at the April 16 low of 1.0619, below which the 1.0550 psychological level will be tested en route to the November 2023 low of 1.0517,” Dhwani adds.
Economic Indicator
Nonfarm Payrolls
The Nonfarm Payrolls release presents the number of new jobs created in the US during the previous month in all non-agricultural businesses; it is released by the US Bureau of Labor Statistics (BLS). The monthly changes in payrolls can be extremely volatile. The number is also subject to strong reviews, which can also trigger volatility in the Forex board. Generally speaking, a high reading is seen as bullish for the US Dollar (USD), while a low reading is seen as bearish, although previous months' reviews and the Unemployment Rate are as relevant as the headline figure. The market's reaction, therefore, depends on how the market assesses all the data contained in the BLS report as a whole.
Read more.Next release: Fri May 03, 2024 12:30
Frequency: Monthly
Consensus: 243K
Previous: 303K
Source: US Bureau of Labor Statistics
America’s monthly jobs report is considered the most important economic indicator for forex traders. Released on the first Friday following the reported month, the change in the number of positions is closely correlated with the overall performance of the economy and is monitored by policymakers. Full employment is one of the Federal Reserve’s mandates and it considers developments in the labor market when setting its policies, thus impacting currencies. Despite several leading indicators shaping estimates, Nonfarm Payrolls tend to surprise markets and trigger substantial volatility. Actual figures beating the consensus tend to be USD bullish.
Nonfarm Payrolls FAQs
Nonfarm Payrolls (NFP) are part of the US Bureau of Labor Statistics monthly jobs report. The Nonfarm Payrolls component specifically measures the change in the number of people employed in the US during the previous month, excluding the farming industry.
The Nonfarm Payrolls figure can influence the decisions of the Federal Reserve by providing a measure of how successfully the Fed is meeting its mandate of fostering full employment and 2% inflation. A relatively high NFP figure means more people are in employment, earning more money and therefore probably spending more. A relatively low Nonfarm Payrolls’ result, on the either hand, could mean people are struggling to find work. The Fed will typically raise interest rates to combat high inflation triggered by low unemployment, and lower them to stimulate a stagnant labor market.
Nonfarm Payrolls generally have a positive correlation with the US Dollar. This means when payrolls’ figures come out higher-than-expected the USD tends to rally and vice versa when they are lower. NFPs influence the US Dollar by virtue of their impact on inflation, monetary policy expectations and interest rates. A higher NFP usually means the Federal Reserve will be more tight in its monetary policy, supporting the USD.
Nonfarm Payrolls are generally negatively-correlated with the price of Gold. This means a higher-than-expected payrolls’ figure will have a depressing effect on the Gold price and vice versa. Higher NFP generally has a positive effect on the value of the USD, and like most major commodities Gold is priced in US Dollars. If the USD gains in value, therefore, it requires less Dollars to buy an ounce of Gold. Also, higher interest rates (typically helped higher NFPs) also lessen the attractiveness of Gold as an investment compared to staying in cash, where the money will at least earn interest.
Nonfarm Payrolls is only one component within a bigger jobs report and it can be overshadowed by the other components. At times, when NFP come out higher-than-forecast, but the Average Weekly Earnings is lower than expected, the market has ignored the potentially inflationary effect of the headline result and interpreted the fall in earnings as deflationary. The Participation Rate and the Average Weekly Hours components can also influence the market reaction, but only in seldom events like the “Great Resignation” or the Global Financial Crisis.
- Gold price struggles to gain any meaningful traction amid mixed fundamental cues.
- The Fed’s less hawkish outlook drags the USD to a multi-week low and lends support.
- Bets for a delayed Fed rate cut and a positive risk tone cap gains ahead of the US NFP.
Gold price (XAU/USD) remains on the defensive during the Asian session on Friday, albeit manages to hold its neck above a nearly one-month low touched earlier this week. Traders opt to wait on the sidelines ahead of the release of the closely watched US monthly jobs data, popularly known as the Nonfarm Payrolls (NFP) report, for cues about the Federal Reserve's (Fed) rate-cut path and before placing fresh directional bets. Heading into the key data risk, a combination of diverging forces fails to provide any meaningful impetus to the precious metal, which is seen extending its consolidative price move in a multi-day-old trading range.
Despite still-sticky inflation in the US, Fed Chair Jerome Powell ruled out the possibility of any further interest rate hikes. This, in turn, drags the US Dollar (USD) to a three-week low and acts as a tailwind for the non-yielding Gold price. The Fed, however, indicated that it is in no hurry to cut rates in the near term. Apart from this, the prevalent risk-on environment – as depicted by a generally positive tone around the equity markets – holds back traders from placing fresh bullish bets around the safe-haven XAU/USD. Hence, a sustained break through a short-term trading range is needed to determine the near-term trajectory for the metal.
Daily Digest Market Movers: Gold price struggles to gain traction, traders await cues on Fed’s rate-cut path
- Expectations that the Federal Reserve will keep interest rates higher for longer, along with the upbeat market mood, turn out to be key factors undermining demand for the safe haven Gold price.
- The Fed signaled on Wednesday that the next move will be to lower the policy rate, though it was in no hurry to begin cutting borrowing costs as the disinflationary process has slowed in recent months.
- The Fed's less hawkish outlook led to the broad-based US Dollar weakness and helps limit the downside for the XAU/USD, warranting some caution before positioning for any meaningful downfall.
- Traders might also prefer to wait for the release of the closely watched US monthly employment details, or the NFP report, which is expected to show that the economy added 243K new jobs in April.
- Meanwhile, the Unemployment Rate is anticipated to remain steady at 3.8% during the reported month, while Average Hourly Earnings probably eased to the 4.0% YoY rate from 4.1% in March.
- The crucial jobs data might influence market expectations about the Fed's future policy decisions, which, in turn, will drive the USD and provide some meaningful impetus to the non-yielding metal.
Technical Analysis: Gold price consolidates in current-week range
From a technical perspective, the range-bound price action witnessed since the beginning of the current week constitutes the formation of a rectangle on short-term charts and points to a consolidation phase. Moreover, neutral oscillators on the daily chart warrant some caution for aggressive traders and confirm the near-term trajectory for the Gold price. Hence, any further weakness below the $2,300 mark might continue to find decent support near the $2,285-2,280 region, which if broken decisively should pave the way for deeper losses. The XAU/USD might then accelerate the fall towards the next relevant support near the $2,268-2,265 area en route to the $2,230-2,25 region and the $2,200 round figure.
On the flip side, the $2,326-2,328 region now seems to act as an immediate hurdle ahead of the $2,335 supply zone and the weekly top, around the $2,346-2,347 area. A sustained strength beyond will confirm a breakout through the short-term trading range and lift the Gold price to the $2,371-2,372 resistance. The momentum could extend further towards the $2,400 mark and the all-time peak, around the $2,431-2,432 area touched on April 12.
Gold FAQs
Gold has played a key role in human’s history as it has been widely used as a store of value and medium of exchange. Currently, apart from its shine and usage for jewelry, the precious metal is widely seen as a safe-haven asset, meaning that it is considered a good investment during turbulent times. Gold is also widely seen as a hedge against inflation and against depreciating currencies as it doesn’t rely on any specific issuer or government.
Central banks are the biggest Gold holders. In their aim to support their currencies in turbulent times, central banks tend to diversify their reserves and buy Gold to improve the perceived strength of the economy and the currency. High Gold reserves can be a source of trust for a country’s solvency. Central banks added 1,136 tonnes of Gold worth around $70 billion to their reserves in 2022, according to data from the World Gold Council. This is the highest yearly purchase since records began. Central banks from emerging economies such as China, India and Turkey are quickly increasing their Gold reserves.
Gold has an inverse correlation with the US Dollar and US Treasuries, which are both major reserve and safe-haven assets. When the Dollar depreciates, Gold tends to rise, enabling investors and central banks to diversify their assets in turbulent times. Gold is also inversely correlated with risk assets. A rally in the stock market tends to weaken Gold price, while sell-offs in riskier markets tend to favor the precious metal.
The price can move due to a wide range of factors. Geopolitical instability or fears of a deep recession can quickly make Gold price escalate due to its safe-haven status. As a yield-less asset, Gold tends to rise with lower interest rates, while higher cost of money usually weighs down on the yellow metal. Still, most moves depend on how the US Dollar (USD) behaves as the asset is priced in dollars (XAU/USD). A strong Dollar tends to keep the price of Gold controlled, whereas a weaker Dollar is likely to push Gold prices up.
- The Australian Dollar rises on hawkish sentiment surrounding the RBA prolonging higher interest rates.
- Australia’s central bank is expected to maintain its current rate at 4.35% until the end of September.
- US Nonfarm Payrolls is expected to print a reading of 243K for April, compared to 303K prior.
The Australian Dollar (AUD) continues its winning streak for the third successive session on Friday. The hawkish sentiment surrounding the Reserve Bank of Australia (RBA) bolsters the strength of the Aussie Dollar, consequently, underpinning the AUD/USD pair.
Australia’s central bank is expected to maintain its key policy rate at 4.35% for a fourth consecutive meeting on Tuesday, and likely until the end of September, as per a Reuters poll of economists. These economists predict only one interest rate cut this year. The higher-than-expected domestic inflation data released last week has raised expectations that the RBA may delay interest rate cuts.
The US Dollar Index (DXY), which gauges the performance of the US Dollar (USD) against six major currencies, remains under pressure following the dovish comments from US Federal Reserve (Fed) Chairman Jerome Powell after Wednesday's decision to maintain interest rate range of 5.25%-5.50%. Powell's dismissal of the possibility of another rate hike has contributed to the USD's weakening.
Market attention has now turned to the US employment data for April, scheduled for later on Friday, which includes Average Hourly Earnings, Nonfarm Payrolls, and ISM Services PMI. These releases are expected to offer additional insights into the condition of the United States (US) economy.
Daily Digest Market Movers: Australian Dollar appreciates due to positive market sentiment
- The Judo Bank Australia Composite Purchasing Managers Index (PMI) declined to 53.0 in April from the previous reading of 53.3. This indicates a slightly slower growth in Australian private sector output. The growth in business activity was mainly confined to the service sector while manufacturing output continued to decrease. Specifically, the Services PMI fell to 53.6 from 54.4 in the previous month.
- The ASX 200 Index saw gains for the second consecutive session on Friday, propelled by positive movements on Wall Street overnight. These gains were driven by reassurances from the US Federal Reserve, which dismissed concerns about another interest rate hike.
- US Initial Jobless Claims data reported that the number of individuals claiming unemployment benefits remained unchanged from the previous week at 208K for the week ending April 26. This figure stays at the lowest level in two months and is notably below market expectations of 212K, potentially providing the Federal Reserve with the flexibility to postpone interest rate cuts.
- US Nonfarm Productivity rose by 0.3% in the first quarter, following an upwardly revised 3.5% increase in the previous quarter and falling short of the expected increase of 0.8%. It was the weakest pace of productivity increase since the January-March quarter in 2023.
- On Thursday, Australia's Trade Balance (MoM) data posted a surplus, however, it was lower than market expectations for April. Additionally, Building Permits data showed an increase in the number of permits for new construction projects in March, albeit falling short of expectations.
- Federal Reserve Chairman Jerome Powell highlighted that progress on inflation has recently stalled, suggesting that it would take more time than previously anticipated before the Fed could confidently expect inflation to approach its 2% target. Powell mentioned that if robust hiring persisted and inflation remained stagnant, it would justify delaying rate cuts.
- According to the CME FedWatch Tool, the probability of the Federal Reserve keeping interest rates within their current range of 5.25%-5.50% during the June meeting has decreased to 85.8%, down from 90.0% a week ago. Conversely, the likelihood of a 25-basis point rate cut has increased to 14.2% from 9.7% compared to a week ago.
Technical Analysis: Australian Dollar could test the psychological level of 0.6600
The Australian Dollar trades around 0.6570 on Friday. The pair is positioned in a symmetrical triangle pattern, with the 14-day Relative Strength Index (RSI) above the 50-level, indicating a bullish bias.
The AUD/USD pair might test the psychological level of 0.6600, followed by the upper boundary around the level of 0.6630. A breakthrough above this level could lead the pair to explore the region around March’s high of 0.6667.
On the downside, the AUD/USD pair could move toward the nine-day Exponential Moving Average (EMA) at 0.6528, followed by the lower boundary of the symmetrical triangle around the psychological level of 0.6500. A break below the latter could exert pressure on the pair to test the throwback support at the 0.6480 level.
AUD/USD: Daily Chart
Australian Dollar price today
The table below shows the percentage change of Australian Dollar (AUD) against listed major currencies today. Australian Dollar was the strongest against the US Dollar.
| USD | EUR | GBP | CAD | AUD | JPY | NZD | CHF | |
| USD | -0.03% | -0.09% | -0.02% | -0.06% | -0.06% | -0.09% | -0.04% | |
| EUR | 0.04% | -0.04% | 0.02% | -0.01% | 0.02% | -0.02% | -0.01% | |
| GBP | 0.08% | 0.05% | 0.07% | 0.03% | 0.04% | 0.01% | 0.05% | |
| CAD | 0.02% | -0.02% | -0.07% | -0.03% | -0.02% | -0.05% | -0.02% | |
| AUD | 0.06% | 0.01% | -0.04% | 0.03% | 0.02% | -0.03% | 0.02% | |
| JPY | 0.06% | 0.00% | -0.06% | 0.00% | 0.00% | 0.00% | -0.02% | |
| NZD | 0.07% | 0.02% | -0.01% | 0.07% | 0.03% | 0.04% | 0.05% | |
| CHF | 0.04% | 0.01% | -0.05% | 0.01% | -0.01% | 0.01% | -0.05% |
The heat map shows percentage changes of major currencies against each other. The base currency is picked from the left column, while the quote currency is picked from the top row. For example, if you pick the Euro from the left column and move along the horizontal line to the Japanese Yen, the percentage change displayed in the box will represent EUR (base)/JPY (quote).
Australian Dollar FAQs
One of the most significant factors for the Australian Dollar (AUD) is the level of interest rates set by the Reserve Bank of Australia (RBA). Because Australia is a resource-rich country another key driver is the price of its biggest export, Iron Ore. The health of the Chinese economy, its largest trading partner, is a factor, as well as inflation in Australia, its growth rate, and Trade Balance. Market sentiment – whether investors are taking on more risky assets (risk-on) or seeking safe havens (risk-off) – is also a factor, with risk-on positive for AUD.
The Reserve Bank of Australia (RBA) influences the Australian Dollar (AUD) by setting the level of interest rates that Australian banks can lend to each other. This influences the level of interest rates in the economy as a whole. The main goal of the RBA is to maintain a stable inflation rate of 2-3% by adjusting interest rates up or down. Relatively high interest rates compared to other major central banks support the AUD, and the opposite for relatively low. The RBA can also use quantitative easing and tightening to influence credit conditions, with the former AUD-negative and the latter AUD-positive.
China is Australia’s largest trading partner so the health of the Chinese economy is a major influence on the value of the Australian Dollar (AUD). When the Chinese economy is doing well it purchases more raw materials, goods and services from Australia, lifting demand for the AUD, and pushing up its value. The opposite is the case when the Chinese economy is not growing as fast as expected. Positive or negative surprises in Chinese growth data, therefore, often have a direct impact on the Australian Dollar and its pairs.
Iron Ore is Australia’s largest export, accounting for $118 billion a year according to data from 2021, with China as its primary destination. The price of Iron Ore, therefore, can be a driver of the Australian Dollar. Generally, if the price of Iron Ore rises, AUD also goes up, as aggregate demand for the currency increases. The opposite is the case if the price of Iron Ore falls. Higher Iron Ore prices also tend to result in a greater likelihood of a positive Trade Balance for Australia, which is also positive of the AUD.
The Trade Balance, which is the difference between what a country earns from its exports versus what it pays for its imports, is another factor that can influence the value of the Australian Dollar. If Australia produces highly sought after exports, then its currency will gain in value purely from the surplus demand created from foreign buyers seeking to purchase its exports versus what it spends to purchase imports. Therefore, a positive net Trade Balance strengthens the AUD, with the opposite effect if the Trade Balance is negative.
- Indian Rupee drifts higher on Friday amid the softer Greenback.
- The positive outlook in the Indian economy and capital inflows support the INR.
- Investors await the US ISM Services PMI and the employment data on Friday.
Indian Rupee (INR) gains momentum on Friday as the cautious comments by the Federal Reserve (Fed) Chair Jerome Powell exert further selling pressure on the US Dollar (USD). Furthermore, the positive sentiment in the Indian equity markets and the inflow of foreign capital boost the INR and cap the pair’s upside.
Market players will keep an eye on the US ISM Services PMI and the employment data for April, due on Friday. The Nonfarm Payrolls (NFP) is estimated to show 243K job additions in the US economy, while the Unemployment Rate is projected to remain steady at 3.8% in April. The unexpected weakening in the labor market could warrant a rate cut from the Fed, which weighs on the Greenback.
Daily Digest Market Movers: Indian Rupee remains strong amid the positive sentiment
- The HSBC final India Manufacturing Purchasing Managers' Index (PMI) declined to 58.8 in April from a 16-year high of 59.1 in March.
- FX intervention from the RBI in February was the lowest in six months, about one-eighth of the average monthly intervention from October to December, per Reuters.
- QuantEco Research economist, Vivek Kumar, said that pressures on the Indian Rupee eased in the January-March compared to October-December, reducing the magnitude of intervention.
- The Organisation for Economic Co-operation and Development (OECD) raised its growth forecast for India by 40 basis points (bps) to 6.6% for 2024-25.
- The Initial Jobless Claims in the US for the week ended April 27 remained unchanged at 208K, better than the expectation of 212K.
- The US Fed left interest rates unchanged on Wednesday and noted that it doesn’t plan to cut interest rates until it has “greater confidence” that price increases are easing sustainably to its 2% target.
Technical analysis: USD/INR keeps the bullish outlook in the longer term
The Indian Rupee trades weaker on the day. The constructive stance of USD/INR remains unchanged on the daily timeframe as the pair is forming an ascending triangle and holds above the key 100-day Exponential Moving Average (EMA). Nonetheless, the 14-day Relative Strength Index (RSI) holds in the bullish territory around the 50 midline, indicating that further consolidation looks favorable for the time being.
The confluence of the lower limit of the ascending triangle and the 100-day EMA at 83.15 act as an initial support level for USD/INR. A decisive break below this level will expose a low of January 15 at 82.78 and then pave the way to a low of March 11 at 82.65. On the upside, a high of May 1 at 83.50 will be the first upside target for the pair. A bullish breakout above the upper boundary of the ascending triangle of 83.71 will see a rally to the 84.00 psychological round mark.
Indian Rupee FAQs
The Indian Rupee (INR) is one of the most sensitive currencies to external factors. The price of Crude Oil (the country is highly dependent on imported Oil), the value of the US Dollar – most trade is conducted in USD – and the level of foreign investment, are all influential. Direct intervention by the Reserve Bank of India (RBI) in FX markets to keep the exchange rate stable, as well as the level of interest rates set by the RBI, are further major influencing factors on the Rupee.
The Reserve Bank of India (RBI) actively intervenes in forex markets to maintain a stable exchange rate, to help facilitate trade. In addition, the RBI tries to maintain the inflation rate at its 4% target by adjusting interest rates. Higher interest rates usually strengthen the Rupee. This is due to the role of the ‘carry trade’ in which investors borrow in countries with lower interest rates so as to place their money in countries’ offering relatively higher interest rates and profit from the difference.
Macroeconomic factors that influence the value of the Rupee include inflation, interest rates, the economic growth rate (GDP), the balance of trade, and inflows from foreign investment. A higher growth rate can lead to more overseas investment, pushing up demand for the Rupee. A less negative balance of trade will eventually lead to a stronger Rupee. Higher interest rates, especially real rates (interest rates less inflation) are also positive for the Rupee. A risk-on environment can lead to greater inflows of Foreign Direct and Indirect Investment (FDI and FII), which also benefit the Rupee.
Higher inflation, particularly, if it is comparatively higher than India’s peers, is generally negative for the currency as it reflects devaluation through oversupply. Inflation also increases the cost of exports, leading to more Rupees being sold to purchase foreign imports, which is Rupee-negative. At the same time, higher inflation usually leads to the Reserve Bank of India (RBI) raising interest rates and this can be positive for the Rupee, due to increased demand from international investors. The opposite effect is true of lower inflation.
US Dollar price today
The table below shows the percentage change of US Dollar (USD) against listed major currencies today. US Dollar was the weakest against the Pound Sterling.
| USD | EUR | GBP | CAD | AUD | JPY | NZD | CHF | |
| USD | -0.01% | -0.08% | -0.02% | -0.03% | 0.00% | -0.05% | -0.02% | |
| EUR | 0.02% | -0.05% | 0.00% | 0.01% | 0.05% | 0.00% | -0.01% | |
| GBP | 0.07% | 0.06% | 0.06% | 0.06% | 0.09% | 0.04% | 0.05% | |
| CAD | 0.02% | 0.00% | -0.04% | 0.00% | 0.04% | -0.01% | 0.00% | |
| AUD | 0.03% | 0.00% | -0.05% | 0.00% | 0.04% | -0.01% | 0.00% | |
| JPY | -0.01% | -0.04% | -0.10% | -0.06% | -0.02% | -0.03% | -0.05% | |
| NZD | 0.04% | 0.00% | -0.03% | 0.03% | 0.03% | 0.05% | 0.02% | |
| CHF | 0.02% | 0.01% | -0.05% | 0.00% | 0.00% | 0.05% | -0.02% |
The heat map shows percentage changes of major currencies against each other. The base currency is picked from the left column, while the quote currency is picked from the top row. For example, if you pick the Euro from the left column and move along the horizontal line to the Japanese Yen, the percentage change displayed in the box will represent EUR (base)/JPY (quote).
- The Japanese Yen continues to draw support from speculated government intervention.
- The post-FOMC USD selling turns out to be another factor weighing on the USD/JPY pair.
- Investors now look forward to the crucial US NFP report for a fresh directional impetus.
The Japanese Yen (JPY) strengthens against its American counterpart for the third successive day on Friday, marking the fifth day of a positive move in the previous six, and climbs to a nearly three-week high during the Asian session. Speculations that Japan's financial authorities intervened again on Thursday, for the second time this week, with an intention to prop up the domestic currency, turn out to be a key factor lending support to the JPY. This, along with the post-FOMC US Dollar (USD) selling bias, is seen exerting downward pressure on the USD/JPY pair.
That said, growing acceptance that the wide gap in interest rates between Japan and the United States (US) might cap gains for the JPY. Apart from this, the prevalent risk-on mood – as depicted by a generally positive tone around the equity markets – might hold back traders from placing aggressive bullish bets around the safe-haven JPY and help limit losses for the USD/JPY pair. Investors might also prefer to move to the sidelines ahead of the release of the closely-watched US monthly employment details – popularly known as the Nonfarm Payrolls (NFP) report later today.
Daily Digest Market Movers: Japanese Yen benefits from the recent alleged intervention by authorities
- Bank of Japan data showed on Thursday that Japanese officials may have spent around ¥3.66 trillion on Wednesday to boost the domestic currency, lending support to the Japanese Yen.
- Japan's top currency diplomat, Masato Kanda, declined to directly confirm that intervention had occurred and said that the Ministry of Finance will disclose data at the end of this month.
- The Federal Reserve dismissed the prospects for any further interest rate hikes despite sticky inflation, which continues to weigh on the US Dollar and exerts pressure on the USD/JPY pair.
- Meanwhile, Fed Chair Jerome Powell flagged no intention to cut interest rates in the near term, citing the lack of progress in the fight to bring inflation back to the central bank's 2% target.
- In contrast, the BoJ has indicated that accommodative financial conditions will be maintained for an extended period, which, in turn, might hold back the JPY bulls from placing aggressive bets.
- Japan's finance minister, Shunichi Suzuki, and BoJ Governor Kazuo Ueda will hold a press conference on the sidelines of the ADB meeting at 13:45 GMT, which should provide some impetus.
- Later, during the North American session, the release of the US jobs data, or the Nonfarm Payrolls (NFP) report, will influence the USD and determine the near-term trajectory for the USD/JPY pair.
Technical Analysis: USD/JPY seems vulnerable to extend the slide towards testing the 152.00 confluence support
From a technical perspective, a break below the 50% Fibonacci retracement level of the March-April rally might have already set the stage for deeper losses. The outlook is reinforced by the fact that oscillators on the daily chart have just started gaining negative traction. This, in turn, suggests a subsequent fall toward testing the 152.00 confluence, comprising the 50-day Simple Moving Average (SMA) and the 61.8% Fibo. level, looks like a distinct possibility. The said handle also marks a previous strong resistance breakpoint, but it has now turned support. Hence, a convincing break below will be seen as a fresh trigger for bearish trades and pave the way for an extension of the recent sharp pullback from the all-time peak touched in April.
On the flip side, any recovery back above the 153.00 mark now seems to confront some resistance near the 153.50 area ahead of the Asian session peak, around the 153.75 region. This is followed by the 154.00 round figure, which if cleared decisively, might trigger a short-covering rally. The subsequent move-up should allow the USD/JPY pair to reclaim the 155.00 psychological mark, with some intermediate resistance near the 154.45-154.50 zone.
Japanese Yen FAQs
The Japanese Yen (JPY) is one of the world’s most traded currencies. Its value is broadly determined by the performance of the Japanese economy, but more specifically by the Bank of Japan’s policy, the differential between Japanese and US bond yields, or risk sentiment among traders, among other factors.
One of the Bank of Japan’s mandates is currency control, so its moves are key for the Yen. The BoJ has directly intervened in currency markets sometimes, generally to lower the value of the Yen, although it refrains from doing it often due to political concerns of its main trading partners. The current BoJ ultra-loose monetary policy, based on massive stimulus to the economy, has caused the Yen to depreciate against its main currency peers. This process has exacerbated more recently due to an increasing policy divergence between the Bank of Japan and other main central banks, which have opted to increase interest rates sharply to fight decades-high levels of inflation.
The BoJ’s stance of sticking to ultra-loose monetary policy has led to a widening policy divergence with other central banks, particularly with the US Federal Reserve. This supports a widening of the differential between the 10-year US and Japanese bonds, which favors the US Dollar against the Japanese Yen.
The Japanese Yen is often seen as a safe-haven investment. This means that in times of market stress, investors are more likely to put their money in the Japanese currency due to its supposed reliability and stability. Turbulent times are likely to strengthen the Yen’s value against other currencies seen as more risky to invest in.
| Raw materials | Closed | Change, % |
|---|---|---|
| Silver | 26.648 | 0.03 |
| Gold | 2303.11 | -0.71 |
| Palladium | 936.66 | -1.12 |
- AUD/JPY depreciated as JPY continued to gain ground amid possible market intervention by Japanese authorities.
- Japan's vice finance minister for international affairs, Masato Kanda declined to comment on whether Japan had intervened in the market.
- Australian Composite PMI declined in April, indicating a slower pace of growth in private sector output.
AUD/JPY declined as the Japanese Yen (JPY) strengthened on Friday, following a rally on Thursday attributed to potential Japanese government intervention, marking the second such incident this week, according to a Reuters report. Masato Kanda, Japan's vice finance minister for international affairs, declined to comment on whether Japan had intervened in the market. It is worth noting that Japanese banks will be closed due to Greenery Day on Friday.
On Thursday, the Bank of Japan (BoJ) released Minutes from the March meeting with insights into the monetary policy outlook. One member noted that the economy's reaction to a short-term rate increase to approximately 0.1% is expected to be minimal. Additionally, several members expressed the opinion that market forces should primarily determine long-term rates.
The Australian Dollar (AUD) may strengthen due to the hawkish sentiment surrounding the Reserve Bank of Australia (RBA). It is widely anticipated that the RBA will maintain its key policy rate at 4.35% for a fourth consecutive meeting on Tuesday, and likely until the end of September, according to a Reuters poll of economists. These economists forecast only one interest rate cut this year. This shift in expectations, from two 25 basis point cuts in an April survey, follows news that inflation declined less than expected in the last quarter and the labor market remains tight.
Daily Digest Market Movers: AUD/JPY depreciates after softer Aussie PMI data
- The Judo Bank Australia Composite Purchasing Managers Index (PMI) fell to 53.0 in April from 53.3 prior. The Australian private sector output grew slightly slower. Business activity growth was primarily limited to the service sector, as manufacturing output continued to decline. The Services PMI fell to 53.6 from 54.4 in the previous month.
- The ASX 200 Index advanced on Friday, marking its second consecutive session of gains. The rise followed positive movements on Wall Street overnight, driven by reassurances from the US Federal Reserve that dismissed concerns about another interest rate hike.
- On Thursday, Australia’s Trade Balance (MoM) showed a surplus but lower than the market expectations in April. Additionally, the Building Permits showed the number of permits for new construction projects rose but fell short of the expectations in March.
- The Consumer Confidence Index fell to 38.3 in April from 39.5 in March and came below the market expectations of 39.7. This decline marks the lowest level in three months, reflecting weakened sentiment among households.
- According to Reuters, the Sankei newspaper reported on Tuesday that Japan is considering implementing tax breaks for repatriation of corporate profits into the Yen. This measure may potentially be included in the annual mid-year policy blueprint.
Technical Analysis: AUD/JPY falls to near 100.50 aligned with channel’s lower boundary
The AUD/JPY trades around 100.50 on Friday, testing to break below the lower boundary of the ascending channel. However, the 14-day Relative Strength Index (RSI) is positioned above the 50 level. A further decline could commence the weakening of the bullish bias.
A break below the lower boundary of the ascending channel could lead the AUD/JPY cross to navigate the region around the psychological level of 100.00. A further decline could strengthen the bearish bias and put pressure on the currency cross to reach April’s low at 97.78.
The key resistance is observed at the lower boundary of the wedge around the psychological level of 103.80. A rebound back into the ascending wedge could potentially strengthen the bullish bias and push the AUD/JPY cross toward the psychological level of 105.00, followed by the upper boundary of the wedge.
AUD/JPY: Daily Chart
Japanese Yen price today
The table below shows the percentage change of the Japanese Yen (JPY) against listed major currencies today. Japanese Yen was the strongest against the US Dollar.
| USD | EUR | GBP | CAD | AUD | JPY | NZD | CHF | |
| USD | -0.05% | -0.13% | -0.05% | -0.12% | -0.18% | -0.16% | -0.07% | |
| EUR | 0.07% | -0.05% | 0.01% | -0.05% | -0.09% | -0.06% | -0.02% | |
| GBP | 0.12% | 0.06% | 0.08% | 0.01% | -0.06% | -0.03% | 0.05% | |
| CAD | 0.05% | -0.02% | -0.07% | -0.06% | -0.11% | -0.09% | -0.02% | |
| AUD | 0.12% | 0.04% | -0.01% | 0.06% | -0.05% | -0.03% | 0.04% | |
| JPY | 0.18% | 0.08% | 0.04% | 0.10% | 0.04% | 0.05% | 0.08% | |
| NZD | 0.14% | 0.07% | 0.03% | 0.11% | 0.04% | -0.03% | 0.08% | |
| CHF | 0.07% | 0.02% | -0.05% | 0.02% | -0.05% | -0.09% | -0.08% |
The heat map shows percentage changes of major currencies against each other. The base currency is picked from the left column, while the quote currency is picked from the top row. For example, if you pick the Euro from the left column and move along the horizontal line to the Japanese Yen, the percentage change displayed in the box will represent EUR (base)/JPY (quote).
Japanese Yen FAQs
The Japanese Yen (JPY) is one of the world’s most traded currencies. Its value is broadly determined by the performance of the Japanese economy, but more specifically by the Bank of Japan’s policy, the differential between Japanese and US bond yields, or risk sentiment among traders, among other factors.
One of the Bank of Japan’s mandates is currency control, so its moves are key for the Yen. The BoJ has directly intervened in currency markets sometimes, generally to lower the value of the Yen, although it refrains from doing it often due to political concerns of its main trading partners. The current BoJ ultra-loose monetary policy, based on massive stimulus to the economy, has caused the Yen to depreciate against its main currency peers. This process has exacerbated more recently due to an increasing policy divergence between the Bank of Japan and other main central banks, which have opted to increase interest rates sharply to fight decades-high levels of inflation.
The BoJ’s stance of sticking to ultra-loose monetary policy has led to a widening policy divergence with other central banks, particularly with the US Federal Reserve. This supports a widening of the differential between the 10-year US and Japanese bonds, which favors the US Dollar against the Japanese Yen.
The Japanese Yen is often seen as a safe-haven investment. This means that in times of market stress, investors are more likely to put their money in the Japanese currency due to its supposed reliability and stability. Turbulent times are likely to strengthen the Yen’s value against other currencies seen as more risky to invest in.
- USD/CAD trades on a softer note around 1.3660 on Friday.
- The US Initial Jobless Claims remained steady at 208,000 last week.
- The BoC Governor said there’s a limit to how much Canadian monetary policy can diverge from the US.
The USD/CAD pair extends its downside near 1.3660 amid the weaker US Dollar (USD) on Friday during the Asian trading hours. The Greenback has edged lower since the Federal Reserve left interest rates unchanged on Wednesday, as Fed Chair Jerome Powell was less hawkish than many feared. The highlight will shift to the US April employment data, due later on Friday.
The Fed kept monetary policy on hold on Wednesday but signaled that it would take longer to gain confidence that inflation is moving towards the 2% target. Powell said that it’s unlikely that the next policy rate move will be a hike” and that the Fed would need additional data to decide on the rate cuts. Apart from this, the US central bank announced a slowing in its balance sheet runoff (QT).
On Thursday, the US Department of Labor (DOL) showed that the Initial Jobless Claims in the US for the week ended April 27 remained unchanged at 208,000, better than the expectation of 212,000.
On the Loonie front, Bank of Canada (BoC) Governor Tiff Macklem said on Thursday that there’s a “limit” to how much Canadian monetary policy can diverge from the US, they’re not close to that limit. Financial markets expect the BoC to cut interest rates in June or July, as inflation has eased significantly in Canada. The divergence of US and Canadian interest rates could exert some selling pressure on the Canadian Dollar (CAD) in the months to come and cap the downside of USD/CAD.
- WTI prices recover to $79.00, gaining 0.28% on Friday.
- A surprise build in US crude stocks exerts some selling pressure on black gold prices.
- WTI prices edge lower amid weaker global demand and easing Middle East geopolitical risks.
Western Texas Intermediate (WTI), the US crude oil benchmark, is trading around $79.00 on Friday. The black gold rebounds modestly from a seven-week low. However, the upside might be limited due to rising crude inventories in the United States and fading hopes for rate cuts from the US Federal Reserve (Fed).
The Fed left interest rates unchanged on Wednesday amid stubborn inflation. The US central bank noted that it doesn’t plan to cut interest rates until it has “greater confidence” that price increases are easing sustainably to its 2% target, adding that it might take longer than previously expected. The higher-for-longer Fed stance could drag WTI prices lower, as it translates to less demand for oil as activity declines.
On Wednesday, the US Energy Information Administration (EIA) revealed that US crude inventories for the week ending April 26 increased by 7.256 million barrels from a 6.368 million barrel draw in the previous week. The market consensus estimated that stocks would decrease by 2.3 million barrels. This figure registered the highest since June 2023, adding to concerns about a weakening oil demand.
Furthermore, easing geopolitical tensions in the Middle East and the prospect of a ceasefire between Israel and Hamas in Gaza lead to narrow trading in crude oil prices. However, market players will monitor the developments surrounding geopolitical risks. Any rising tension might raise the fear of oil supply disruption in the region and boost the black gold price.
| Index | Change, points | Closed | Change, % |
|---|---|---|---|
| NIKKEI 225 | -37.98 | 38236.07 | -0.1 |
| Hang Seng | 444.1 | 18207.13 | 2.5 |
| KOSPI | -8.41 | 2683.65 | -0.31 |
| ASX 200 | 17.1 | 7587 | 0.23 |
| DAX | -35.67 | 17896.5 | -0.2 |
| CAC 40 | -70.28 | 7914.65 | -0.88 |
| Dow Jones | 322.37 | 38225.66 | 0.85 |
| S&P 500 | 45.81 | 5064.2 | 0.91 |
| NASDAQ Composite | 235.48 | 15840.96 | 1.51 |
| Pare | Closed | Change, % |
|---|---|---|
| AUDUSD | 0.65656 | 0.54 |
| EURJPY | 164.822 | -0.78 |
| EURUSD | 1.07238 | 0.03 |
| GBPJPY | 192.606 | -0.85 |
| GBPUSD | 1.25326 | -0.02 |
| NZDUSD | 0.59597 | 0.44 |
| USDCAD | 1.36733 | -0.42 |
| USDCHF | 0.91019 | -0.67 |
| USDJPY | 153.686 | -0.82 |
- NZD/USD gains ground around 0.5965 on softer USD in Friday’s early Asian session.
- There were 208,000 initial jobless claims in the US for the week ending April 27.
- RBNZ stated there’s a risk that renewed inflation pressures could keep global interest rates high for longer.
The NZD/USD pair trades in positive territory for the third consecutive day near 0.5965 during the early Asian trading hours on Friday. The uptick of the pair is bolstered by the further selling pressure of the US Dollar (USD). The releases of the US Nonfarm Payrolls (NFP) and Unemployment Rate for April will be in the spotlight later on Friday.
The number of Americans filing new claims for unemployment benefits for the week ended April 27 held steady at a seasonally adjusted 208,000, better than the forecast of 212,000, the US Department of Labor (DOL) reported on Thursday.
The US Federal Reserve (Fed) noted on Wednesday that inflation remained high in recent months and the Fed doesn’t plan to cut interest rates until it has “greater confidence” that price increases are easing sustainably to its 2% target. The Fed Chair Jerome Powell added that it “will take longer than previously expected. Investors now expect just one rate cut this year, in November, according to futures prices tracked by CME FedWatch. The delay rate cut prospect from the Fed provides some support to the USD and acts as a headwind for the NZD/USD pair.
On the Kiwi front, the Reserve Bank of New Zealand (RBNZ) said in its semi-annual Financial Stability Report on Wednesday that “global inflation is declining from elevated levels and financial markets have priced in lower policy rates over the next year.” Nonetheless, there is a risk that fresh or persistent inflationary pressures could cause global interest rates to stay restrictive for longer. The New Zealand central bank indicated that it doesn’t plan to pivot to monetary easing until 2025, as inflation pressures were higher than expected in the first quarter. This, in turn, continues to support the New Zealand Dollar (NZD) for the time being.


© 2000-2026. Bản quyền Teletrade.
Trang web này được quản lý bởi Teletrade D.J. LLC 2351 LLC 2022 (Euro House, Richmond Hill Road, Kingstown, VC0100, St. Vincent and the Grenadines).
Thông tin trên trang web không phải là cơ sở để đưa ra quyết định đầu tư và chỉ được cung cấp cho mục đích làm quen.
Giao dịch trên thị trường tài chính (đặc biệt là giao dịch sử dụng các công cụ biên) mở ra những cơ hội lớn và tạo điều kiện cho các nhà đầu tư sẵn sàng mạo hiểm để thu lợi nhuận, tuy nhiên nó mang trong mình nguy cơ rủi ro khá cao. Chính vì vậy trước khi tiến hành giao dịch cần phải xem xét mọi mặt vấn đề chấp nhận tiến hành giao dịch cụ thể xét theo quan điểm của nguồn lực tài chính sẵn có và mức độ am hiểu thị trường tài chính.
Sử dụng thông tin: sử dụng toàn bộ hay riêng biệt các dữ liệu trên trang web của công ty TeleTrade như một nguồn cung cấp thông tin nhất định. Việc sử dụng tư liệu từ trang web cần kèm theo liên kết đến trang teletrade.vn. Việc tự động thu thập số liệu cũng như thông tin từ trang web TeleTrade đều không được phép.
Xin vui lòng liên hệ với pr@teletrade.global nếu có câu hỏi.
ngân hàng