- Phân tích
- Tin tức và các công cụ
- Tin tức thị trường
Tin tức thì trường
- EUR/USD found a foothold near 1.1050 on quiet Monday.
- US markets were dark to kick off trading week, bringing thin volumes.
- Key EU data this week threatens to get overshadowed by US NFP.
EUR/USD found a thin bid on Monday, kicking off the new trading week finding a foothold near 1.1050 as the Fiber tries to hang onto near-term gains. Markets kicked off Monday on a notably thin volume profile, with US markets shuttered for the Labor Day holiday. An extended weekend will see US markets return to the fold on Tuesday just in time to stare down the barrel of a heavy docket full of US labor figures throughout the rest of the week.
EU Retail Sales and Gross Domestic Product (GDP) growth figures are due later in the week, on Thursday and Friday, respectively. However, the big news for the trading week will be a slate of US labor figures, kicking off with Wednesday’s JOLTS Job Openings for July, which is forecast to hold steady at 8.1M MoM.
Thursday’s US ADP Employment Change for August is expected to bounce to 145K from the previous month’s 122K, but the key labor print from the US this week will be Friday’s US Nonfarm Payrolls (NFP) report for August. The US is expected to deliver a healthy print of 165K compared to the previous month’s 114K, and special attention will be paid to the release figures and any historical revisions as this represents the last round of NFP jobs numbers before the Federal Reserve (Fed) gathers on September 18 to deliver a hotly-expected opening volley in a new rate cutting cycle.
EUR/USD price forecast
Fiber managed to eke out an intraday bid on Monday, finding slim gains from the 1.1050 level after paring back for three consecutive trading days. EUR/USD popped into a 13-month high just above 1.1200 early last week, and a near-term pullback in Greenback flows sees bids scrambling to hold onto bullish chart paper.
The pair is still trading well north of the 200-day Exponential Moving Average (EMA) at 1.0845. Despite holding deep in bull country, EUR/USD is still facing a steepening bearish pullback as shorts congregate targets just above the 50-day EMA at 1.0956.
EUR/USD daily chart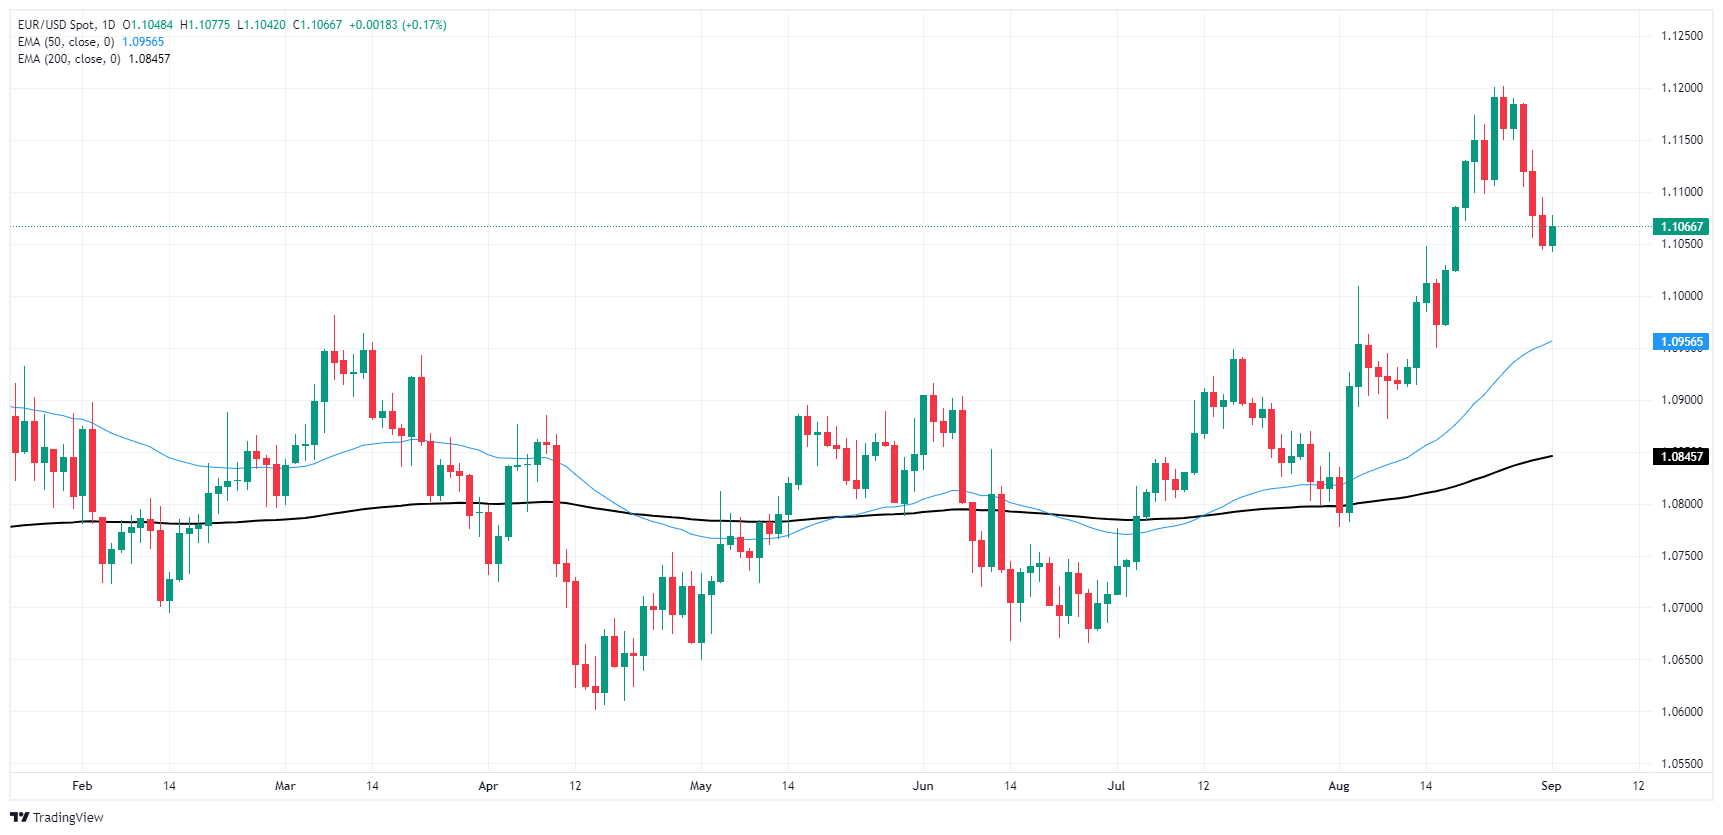
Euro FAQs
The Euro is the currency for the 20 European Union countries that belong to the Eurozone. It is the second most heavily traded currency in the world behind the US Dollar. In 2022, it accounted for 31% of all foreign exchange transactions, with an average daily turnover of over $2.2 trillion a day. EUR/USD is the most heavily traded currency pair in the world, accounting for an estimated 30% off all transactions, followed by EUR/JPY (4%), EUR/GBP (3%) and EUR/AUD (2%).
The European Central Bank (ECB) in Frankfurt, Germany, is the reserve bank for the Eurozone. The ECB sets interest rates and manages monetary policy. The ECB’s primary mandate is to maintain price stability, which means either controlling inflation or stimulating growth. Its primary tool is the raising or lowering of interest rates. Relatively high interest rates – or the expectation of higher rates – will usually benefit the Euro and vice versa. The ECB Governing Council makes monetary policy decisions at meetings held eight times a year. Decisions are made by heads of the Eurozone national banks and six permanent members, including the President of the ECB, Christine Lagarde.
Eurozone inflation data, measured by the Harmonized Index of Consumer Prices (HICP), is an important econometric for the Euro. If inflation rises more than expected, especially if above the ECB’s 2% target, it obliges the ECB to raise interest rates to bring it back under control. Relatively high interest rates compared to its counterparts will usually benefit the Euro, as it makes the region more attractive as a place for global investors to park their money.
Data releases gauge the health of the economy and can impact on the Euro. Indicators such as GDP, Manufacturing and Services PMIs, employment, and consumer sentiment surveys can all influence the direction of the single currency. A strong economy is good for the Euro. Not only does it attract more foreign investment but it may encourage the ECB to put up interest rates, which will directly strengthen the Euro. Otherwise, if economic data is weak, the Euro is likely to fall. Economic data for the four largest economies in the euro area (Germany, France, Italy and Spain) are especially significant, as they account for 75% of the Eurozone’s economy.
Another significant data release for the Euro is the Trade Balance. This indicator measures the difference between what a country earns from its exports and what it spends on imports over a given period. If a country produces highly sought after exports then its currency will gain in value purely from the extra demand created from foreign buyers seeking to purchase these goods. Therefore, a positive net Trade Balance strengthens a currency and vice versa for a negative balance.
- GBP/USD remains buoyed above 1.3100 on holiday market start to the trading week.
- UK data remains thin this week, Pound Sterling to rise and fall at the mercy of market flows.
- One last key US NFP print looms on Friday before upcoming Fed rate call.
GBP/USD turned into the midrange on Monday, plagued by a thin economic calendar on the UK side and shuttered US markets for the Labor day holiday. Despite a middling open to the trading week, Cable looks poised to continue a near-term pullback, assuming markets aren’t thrown into a tailspin by US jobs figures due later in the week.
The UK is poorly represented on the economic calendar throughout the week, with only low-tier prints on the offer for GBP traders. US Purchasing Managers Index (PMI) figures are dotted throughout the week, but US labor figures will be the key prints on both Thursday and Friday. US ADP Employment Change slated for Thursday represents the first hurdle on the road to Friday’s US NFP jobs data dump. This week represents the last major labor update for the US economy before the Fed delivers its hotly-anticipated rate call on September 18.
Before both of those, however, US JOLTS job openings due on Wednesday are expected to hold steady near 8.1M in July, in-line with the previous month’s 8.184M.
GBP/USD price forecast
Cable has backslid from multi-month highs above 1.3250 back below the 1.3150 level as Greenback selling pressure cools, but the pair is stubbornly sticking to recent highs after vaulting to a peak 29-month bid in August. Price action is still tilted firmly into the bullish side above the 200-day Exponential Moving Average (EMA) at 1.2725, while the immediate downside technical target for shorts will be the 50-day EMA just above the 1.2900 handle.
GBP/USD daily chart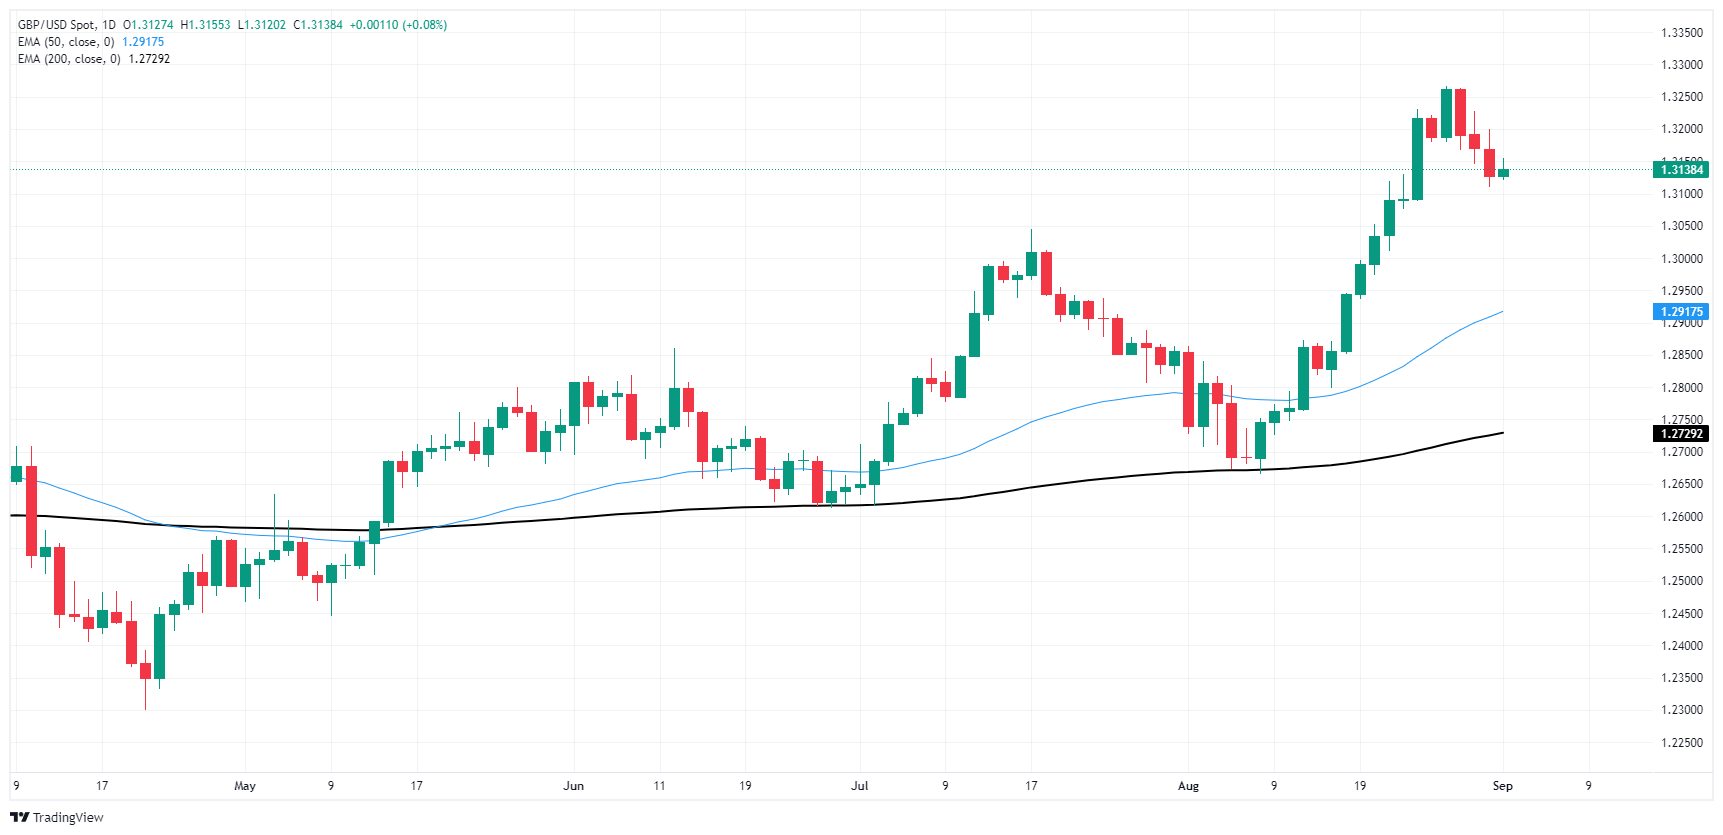
Pound Sterling FAQs
The Pound Sterling (GBP) is the oldest currency in the world (886 AD) and the official currency of the United Kingdom. It is the fourth most traded unit for foreign exchange (FX) in the world, accounting for 12% of all transactions, averaging $630 billion a day, according to 2022 data. Its key trading pairs are GBP/USD, aka ‘Cable’, which accounts for 11% of FX, GBP/JPY, or the ‘Dragon’ as it is known by traders (3%), and EUR/GBP (2%). The Pound Sterling is issued by the Bank of England (BoE).
The single most important factor influencing the value of the Pound Sterling is monetary policy decided by the Bank of England. The BoE bases its decisions on whether it has achieved its primary goal of “price stability” – a steady inflation rate of around 2%. Its primary tool for achieving this is the adjustment of interest rates. When inflation is too high, the BoE will try to rein it in by raising interest rates, making it more expensive for people and businesses to access credit. This is generally positive for GBP, as higher interest rates make the UK a more attractive place for global investors to park their money. When inflation falls too low it is a sign economic growth is slowing. In this scenario, the BoE will consider lowering interest rates to cheapen credit so businesses will borrow more to invest in growth-generating projects.
Data releases gauge the health of the economy and can impact the value of the Pound Sterling. Indicators such as GDP, Manufacturing and Services PMIs, and employment can all influence the direction of the GBP. A strong economy is good for Sterling. Not only does it attract more foreign investment but it may encourage the BoE to put up interest rates, which will directly strengthen GBP. Otherwise, if economic data is weak, the Pound Sterling is likely to fall.
Another significant data release for the Pound Sterling is the Trade Balance. This indicator measures the difference between what a country earns from its exports and what it spends on imports over a given period. If a country produces highly sought-after exports, its currency will benefit purely from the extra demand created from foreign buyers seeking to purchase these goods. Therefore, a positive net Trade Balance strengthens a currency and vice versa for a negative balance.
- USD/CAD trades in positive territory for the fifth consecutive day around 1.3500 in Monday's early Asian session.
- Traders await the US August ISM Manufacturing PMI on Tuesday ahead of US employment data.
- The rebound of crude oil prices might support the CAD and cap the pair’s upside.
The USD/CAD pair trades on a stronger note near 1.3500 during the early Asian session on Tuesday. The USD Index (DXY), which measures the USD’s value against a basket of six major currencies, consolidated around 101.60 as traders prefer to wait on the sidelines ahead of the key labor data this week. On Tuesday, the US ISM Manufacturing PMI will be in the spotlight.
The Greenback remains on the defensive, marking its biggest monthly drop this year in August amid the expectation that the US Federal Reserve (Fed) will cut interest rates in September. "The dollar has been under pressure and it will remain under pressure over the remainder of this year," said Guy Miller, chief market strategist, Zurich Insurance Group.
The US ISM Manufacturing PMI for August, which is due on Tuesday, is expected to improve to 47.5 in August from 46.8 in July. If the reading shows a stronger-than-expected outcome, this could provide some support to the US Dollar (USD) against the Canadian Dollar (CAD).
The attention will shift to the US August Nonfarm Payrolls (NFP) on Friday, which is estimated to rise to 165K in August from 114K in July. This report could provide some hints about the size and pace of the US interest rate cut by the Fed this year.
Meanwhile, supply concerns surrounding Libya's oil output could underpin the crude oil prices and boost the commodity-linked Loonie. It's worth noting that Canada is the largest Oil exporter to the United States (US), and higher crude oil prices tend to have a positive impact on the CAD value.
Canadian Dollar FAQs
The key factors driving the Canadian Dollar (CAD) are the level of interest rates set by the Bank of Canada (BoC), the price of Oil, Canada’s largest export, the health of its economy, inflation and the Trade Balance, which is the difference between the value of Canada’s exports versus its imports. Other factors include market sentiment – whether investors are taking on more risky assets (risk-on) or seeking safe-havens (risk-off) – with risk-on being CAD-positive. As its largest trading partner, the health of the US economy is also a key factor influencing the Canadian Dollar.
The Bank of Canada (BoC) has a significant influence on the Canadian Dollar by setting the level of interest rates that banks can lend to one another. This influences the level of interest rates for everyone. The main goal of the BoC is to maintain inflation at 1-3% by adjusting interest rates up or down. Relatively higher interest rates tend to be positive for the CAD. The Bank of Canada can also use quantitative easing and tightening to influence credit conditions, with the former CAD-negative and the latter CAD-positive.
The price of Oil is a key factor impacting the value of the Canadian Dollar. Petroleum is Canada’s biggest export, so Oil price tends to have an immediate impact on the CAD value. Generally, if Oil price rises CAD also goes up, as aggregate demand for the currency increases. The opposite is the case if the price of Oil falls. Higher Oil prices also tend to result in a greater likelihood of a positive Trade Balance, which is also supportive of the CAD.
While inflation had always traditionally been thought of as a negative factor for a currency since it lowers the value of money, the opposite has actually been the case in modern times with the relaxation of cross-border capital controls. Higher inflation tends to lead central banks to put up interest rates which attracts more capital inflows from global investors seeking a lucrative place to keep their money. This increases demand for the local currency, which in Canada’s case is the Canadian Dollar.
Macroeconomic data releases gauge the health of the economy and can have an impact on the Canadian Dollar. Indicators such as GDP, Manufacturing and Services PMIs, employment, and consumer sentiment surveys can all influence the direction of the CAD. A strong economy is good for the Canadian Dollar. Not only does it attract more foreign investment but it may encourage the Bank of Canada to put up interest rates, leading to a stronger currency. If economic data is weak, however, the CAD is likely to fall.
Banxico’s Deputy Governor Omar Mejia Castelazo said that the central bank needs to reduce borrowing costs as higher rates could cause distortions in the markets and the economy, he said in an interview with Larissa Garcia of Market News International (MNI).
Mejia said that “it is necessary to adjust the level of restriction” and added the central bank would lower rates gradually as “the ongoing disinflationary process reduces the costs of restrictive monetary policy for the economy.”
Even though Banxico’s mandate is fixed on price stability, Mejia shows signs of concern for economic activity. He said the “risk of weak activity is already materializing. We've had three quarters with growth below projections. I had already seen this coming, which is why my vote was dissenting to lower interest rates in June.”
In the last monetary policy decision, Banxico reduced the main reference rates by 25 basis points (bps) on a 3-2 split vote decision. Governor Rodriguez and Deputy Governors Galia Borja and Omar Mejia favored a cut, contrary to Deputy Governors Irene Espinosa and Jonathan Heath.
Most bank analysts estimate Banxico will lower interest rates by at least 50 basis points (bps) for the remainder of 2024.
When asked about the upcoming September meeting, he commented the bank is considering several factors, while acknowledging that services inflation remains stickier than expected. Mehia added that “Some components in services inflation have shown higher persistence due to the lagged effects of pandemic-related shocks.”
Banxico FAQs
The Bank of Mexico, also known as Banxico, is the country’s central bank. Its mission is to preserve the value of Mexico’s currency, the Mexican Peso (MXN), and to set the monetary policy. To this end, its main objective is to maintain low and stable inflation within target levels – at or close to its target of 3%, the midpoint in a tolerance band of between 2% and 4%.
The main tool of the Banxico to guide monetary policy is by setting interest rates. When inflation is above target, the bank will attempt to tame it by raising rates, making it more expensive for households and businesses to borrow money and thus cooling the economy. Higher interest rates are generally positive for the Mexican Peso (MXN) as they lead to higher yields, making the country a more attractive place for investors. On the contrary, lower interest rates tend to weaken MXN. The rate differential with the USD, or how the Banxico is expected to set interest rates compared with the US Federal Reserve (Fed), is a key factor.
Banxico meets eight times a year, and its monetary policy is greatly influenced by decisions of the US Federal Reserve (Fed). Therefore, the central bank’s decision-making committee usually gathers a week after the Fed. In doing so, Banxico reacts and sometimes anticipates monetary policy measures set by the Federal Reserve. For example, after the Covid-19 pandemic, before the Fed raised rates, Banxico did it first in an attempt to diminish the chances of a substantial depreciation of the Mexican Peso (MXN) and to prevent capital outflows that could destabilize the country.
- USD/JPY closed August above Kijun-Sen and Ichimoku Cloud, showing buyer strength; break above 152.00 needed to target YTD high of 161.95.
- Pair consolidates within 140.78-147.30 range inside Ichimoku Cloud, indicating potential for sideways trading. Break above 149.39 required for uptrend continuation; a dip to 141.69 could test Kumo bottom at 140.78.
- Buyer momentum picking up, targeting Kijun-Sen at 148.46. Watch resistance at 147.00 and 148.00; a fall below Senkou Span A at 146.90 may lead to levels at 146.00 and Tenkan-Sen at 145.31, nearing the 145.00 support.
The USD/JPY rises for the fourth straight day on Monday as September commences, up by 0.49% amid thin liquidity conditions during the North American session. At the time of writing, the pair trades at 146.87 after bouncing off a daily low of 145.78.
USD/JPY Price Forecast: Technical outlook
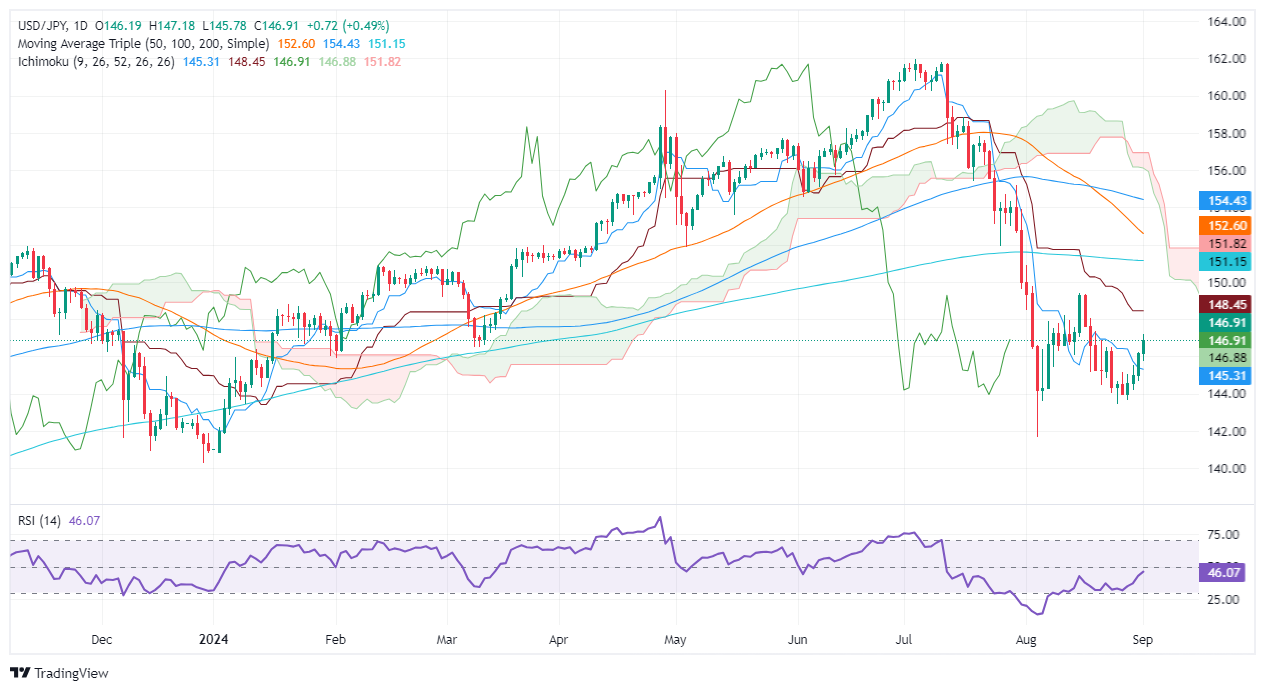
The USD/JPY monthly chart shows the pair dipping toward 141.69 but recovering late and closing at 146.17, above the Kijun-Sen and the Ichimoku Cloud (Kumo). Even though this hints that buyers are in charge, the pair should clear 152.00 to re-test the year-to-date (YTD) high at 161.95.
From a weekly standpoint, the USD/JPY consolidates at around the top of the 140.78-147.30 range inside the Kumo, an indication of sideways trading. For buyers to resume the uptrend, they need to push prices above the latest cycle high of 149.39. On the other hand, sellers need to clear 141.69 before testing the Kumo's bottom at 140.78.
Meanwhile, the USD/JPY daily chart shows that buyers are regaining control. They could push prices toward the Kijun-Sen at 148.46, but first, they need to clear key resistance levels. The first would be the 147.00 figure, followed by the 148.00 threshold.
Conversely, if sellers move in and drag the price below the Senkou Span A at 146.90, that can pave the way for further downside. The next support would be the 146.00 mark, followed by the Tenkan-Sen at 145.31, before challenging 145.00.
USD/JPY Price Action – Daily Chart
Japanese Yen PRICE Today
The table below shows the percentage change of Japanese Yen (JPY) against listed major currencies today. Japanese Yen was the strongest against the US Dollar.
| USD | EUR | GBP | JPY | CAD | AUD | NZD | CHF | |
|---|---|---|---|---|---|---|---|---|
| USD | 0.00% | 0.00% | -0.03% | -0.02% | -0.02% | 0.18% | 0.00% | |
| EUR | 0.00% | -0.01% | -0.02% | -0.03% | -0.03% | 0.08% | 0.00% | |
| GBP | -0.01% | 0.00% | 0.00% | -0.02% | -0.02% | 0.09% | 0.00% | |
| JPY | 0.03% | 0.02% | 0.00% | -0.01% | -0.00% | 0.00% | 0.00% | |
| CAD | 0.02% | 0.03% | 0.02% | 0.01% | -0.02% | 0.01% | 0.03% | |
| AUD | 0.02% | 0.03% | 0.02% | 0.00% | 0.02% | -0.01% | 0.03% | |
| NZD | -0.18% | -0.08% | -0.09% | -0.01% | -0.01% | 0.00% | 0.03% | |
| CHF | -0.00% | 0.00% | -0.01% | -0.01% | -0.03% | -0.03% | -0.03% |
The heat map shows percentage changes of major currencies against each other. The base currency is picked from the left column, while the quote currency is picked from the top row. For example, if you pick the Japanese Yen from the left column and move along the horizontal line to the US Dollar, the percentage change displayed in the box will represent JPY (base)/USD (quote).
- The NZD/USD is showing signs of a technical pullback, with the RSI still near 70.
- The MACD's histogram prints lower green bars which hints at a weakening momentum.
The NZD/USD pair is showing signs of a technical pullback, trading at 0.6235, down 0.25% for the day, with technical indicators suggesting a potential consolidation in the near term.
The Relative Strength Index (RSI) is currently at 63, indicating that the pair is trading close to the overbought area and is pointing down. The Moving Average Convergence Divergence (MACD) is printing lower green bars, also signaling that the bullish strength is weakening.
NZD/USD daily chart
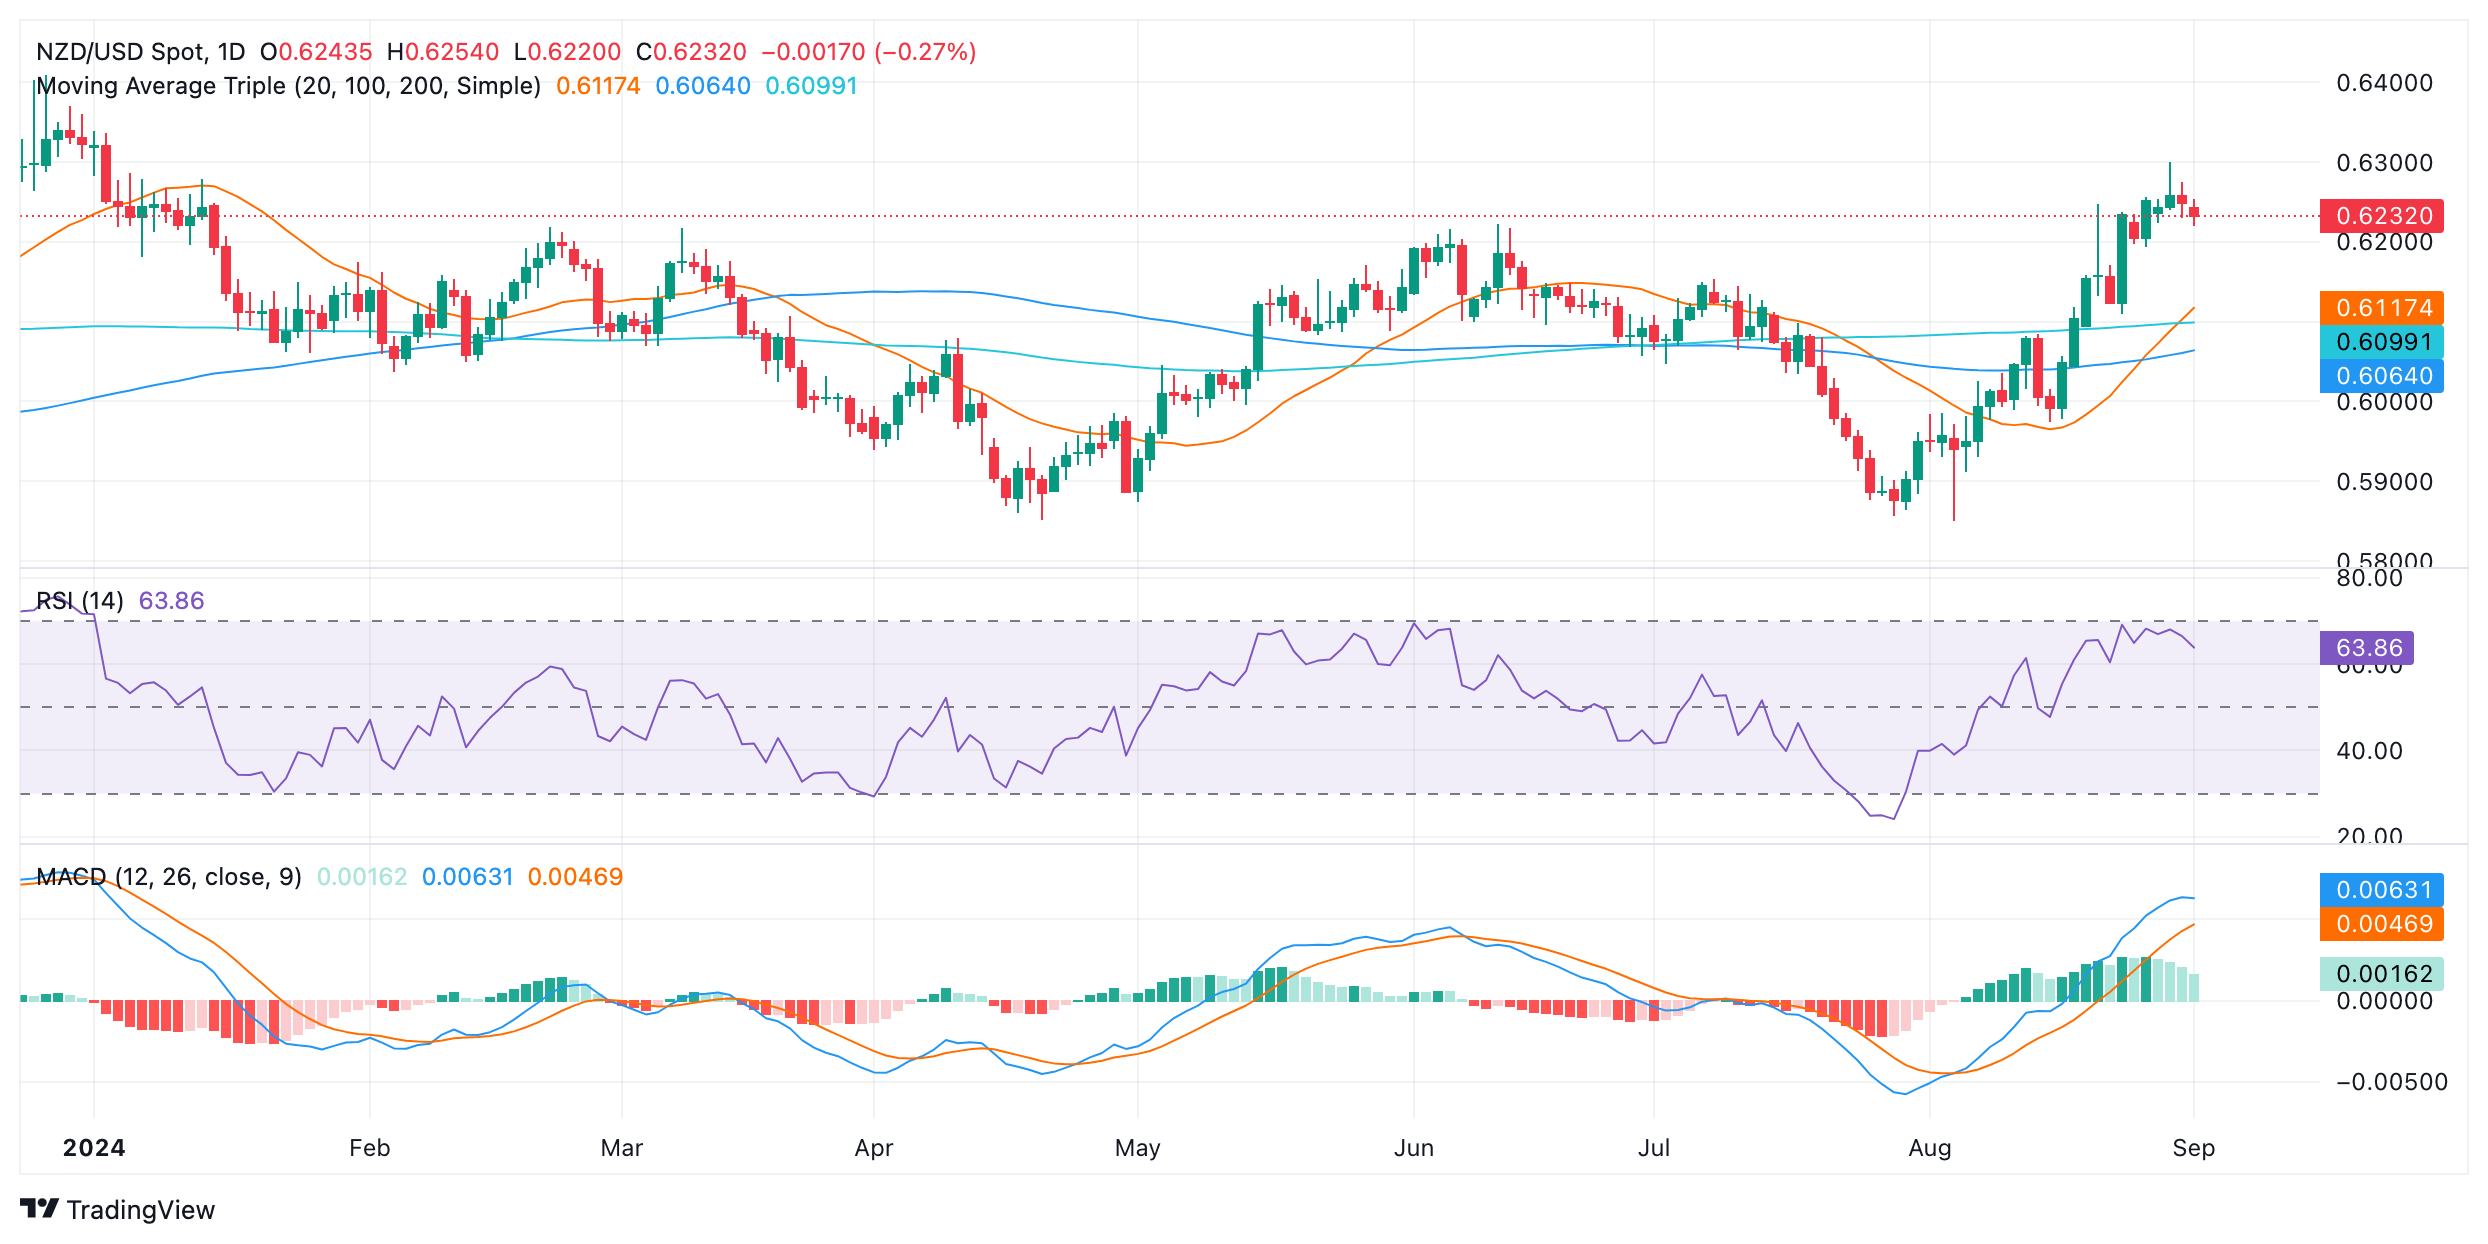
Looking at the daily chart, the NZD/USD pair is facing resistance at the 0.6270 level. A break above this level could open the door for further gains. On the downside, the pair is facing support at the 0.6200 level. A break below this level could shift the tide in favor of the bears. Overall, the technical outlook remains positive, but the bullish traction needs to take a breather after pushing the pair to multi-month highs last week which favors a brief period of consolidation before the next upwards leg.
- WTI scrambled to keep afloat of $73.00 on Monday.
- Crude Oil markets are looking to see if Libya cuts balance OPEC boost.
- Declines in China business activity are also weighing on Crude Oil bids.
West Texas Intermediate (WTI) US Crude Oil held roughly on-balance to kick off the new trading week, finding a foothold and keeping intraday action on the north side of $73.00 per barrel. Libya announced a halt of Crude Oil exports out of the country on Monday as political sections grapple over who controls Libya’s Crude Oil balance sheets while the Organization for the Petroleum Exporting Countries (OPEC) is expected to ease restrictions on member state production caps, and slowing activity figures in China are weighing on Crude Oil demand expectations.
According to reporting, Libya has halted all Crude Oil exports from the nation as political rivals battle over who controls Libya’s Crude Oil production assets, and more importantly, profits. Production levels from Libya rea also expected to draw down in the immediate future.
OPEC’s extended league of non-member allies, OPEC+, is set to beginning easing back on voluntary production caps as smaller countries buckle under the weight of lopsided pumping limits meant to keep global Crude Oil prices buoyed. Energy markets are broadly hoping that Libya’s sudden plunge in exports and production will help to at least partially offset the expected upswing in OPEC+ production figures.
China’s recent raft of Purchasing Managers Index (PMI) activity surveys are increasingly tilting toward the low end as the country’s economic activity draws down much faster and steeper than many expected. With Chinese business activity stumbling into a steeper-than-forecast rut, markets are growing apprehensive that a drag in Chinese Crude Oil demand growth could leave the global oil market with a permanent overhang.
WTI price forecast
Crude Oil markets have once again found themselves trapped in a volatile range. WTI prices are bouncing between $72.00 and $77.00 per barrel, but a medium-term slide from July’s peaks near $84.00 per barrel has price action stuck on the low side of the 200-day Exponential Moving Average (EMA) near $78.00.
WTI daily chart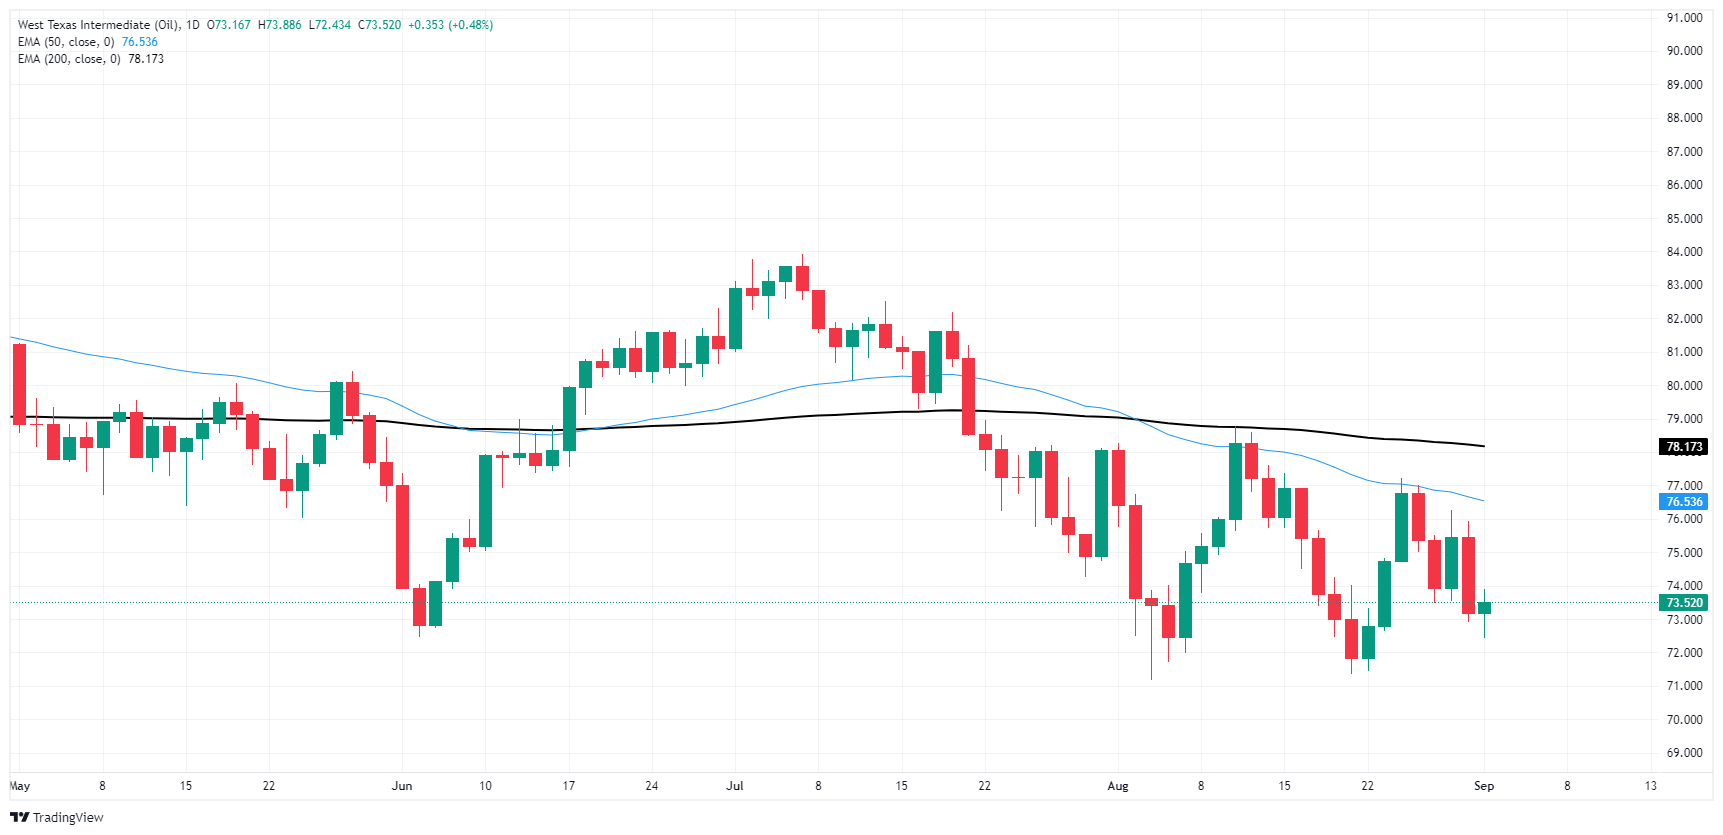
WTI Oil FAQs
WTI Oil is a type of Crude Oil sold on international markets. The WTI stands for West Texas Intermediate, one of three major types including Brent and Dubai Crude. WTI is also referred to as “light” and “sweet” because of its relatively low gravity and sulfur content respectively. It is considered a high quality Oil that is easily refined. It is sourced in the United States and distributed via the Cushing hub, which is considered “The Pipeline Crossroads of the World”. It is a benchmark for the Oil market and WTI price is frequently quoted in the media.
Like all assets, supply and demand are the key drivers of WTI Oil price. As such, global growth can be a driver of increased demand and vice versa for weak global growth. Political instability, wars, and sanctions can disrupt supply and impact prices. The decisions of OPEC, a group of major Oil-producing countries, is another key driver of price. The value of the US Dollar influences the price of WTI Crude Oil, since Oil is predominantly traded in US Dollars, thus a weaker US Dollar can make Oil more affordable and vice versa.
The weekly Oil inventory reports published by the American Petroleum Institute (API) and the Energy Information Agency (EIA) impact the price of WTI Oil. Changes in inventories reflect fluctuating supply and demand. If the data shows a drop in inventories it can indicate increased demand, pushing up Oil price. Higher inventories can reflect increased supply, pushing down prices. API’s report is published every Tuesday and EIA’s the day after. Their results are usually similar, falling within 1% of each other 75% of the time. The EIA data is considered more reliable, since it is a government agency.
OPEC (Organization of the Petroleum Exporting Countries) is a group of 13 Oil-producing nations who collectively decide production quotas for member countries at twice-yearly meetings. Their decisions often impact WTI Oil prices. When OPEC decides to lower quotas, it can tighten supply, pushing up Oil prices. When OPEC increases production, it has the opposite effect. OPEC+ refers to an expanded group that includes ten extra non-OPEC members, the most notable of which is Russia.
- Gold prices fall during a quiet North American session with US markets closed for Labor Day.
- Upcoming US economic reports — ISM PMIs, JOLTS job openings, ADP Employment Change, and Nonfarm Payrolls — set to influence Fed rate decision.
- Fed Chair Powell at Jackson Hole noted that inflation was easing but increasing employment risks, raising recession concerns.
- Geopolitical tensions linger as President Biden may propose a ceasefire deal between Israel and Hamas, potentially affecting markets.
Gold prices dipped during the North American session amid thin volumes due to US markets being closed during Labor Day observance. Conversely, the Greenback remains firm as traders brace for a jobs report that could influence the Federal Reserve's decision on the size of September’s rate cut. The XAU/USD trades at $2,499, down by 0.14%.
The US economic docket will be busy this week with the release of the Institute for Supply Management’s (ISM) Manufacturing and Services PMIs, JOLTS job openings, the ADP National Employment Change, and the Nonfarm Payrolls (NFP) figures.
During his speech at Jackson Hole, Federal Reserve Chairman Jerome Powell commented that the risks of inflation are skewed to the downside, while the employment risks are tilted to the upside.
Last Friday, the Fed’s preferred inflation gauge, the Core Personal Consumption Expenditures Price Index (PCE), remained unchanged at around 2.5%, hinting that inflation remains controlled. On the other hand, during the last four NFP reports, the Unemployment Rate has risen from around 3.8% to 4.3%, spurring fears among Fed officials that the labor market could be cooling faster than expected.
That reignited recession fears, which had faded following last week’s solid US data. Initial Jobless Claims fell from their levels in late July, Retail Sales rose sharply, and the economy grew at a 3% pace, according to the second estimate of the second quarter's Gross Domestic Product (GDP) print.
After the data, Bullion prices drooped as investors bought the US Dollar on waning recession fears.
Despite this, geopolitical risks loom even though US President Biden is considering presenting Israel and Hamas a final proposal for a hostage release and ceasefire in Gaza deal later this week, according to Axios sources.
Daily digest market movers: Gold price traders await busy US economic calendar
- ISM Manufacturing PMI for August is expected to improve from 46.8 to 47.8. The Services PMI is estimated to expand from 51.4 to 51.5
- July’s JOLTS job openings are expected at 8.10 million, down from 8.184 million in June.
- Private hiring, revealed by the ADP National Employment Change report, is foreseen increasing from 122K in July to 150K in August.
- August’s NFP figures are expected to rise from 114K to 163K, while the Unemployment Rate could dip, according to the consensus, from 4.3% to 4.2%.
- December 2024 Chicago Board of Trade (CBOT) fed funds future rates contract hints that investors are eyeing 97 basis points of Fed easing this year.
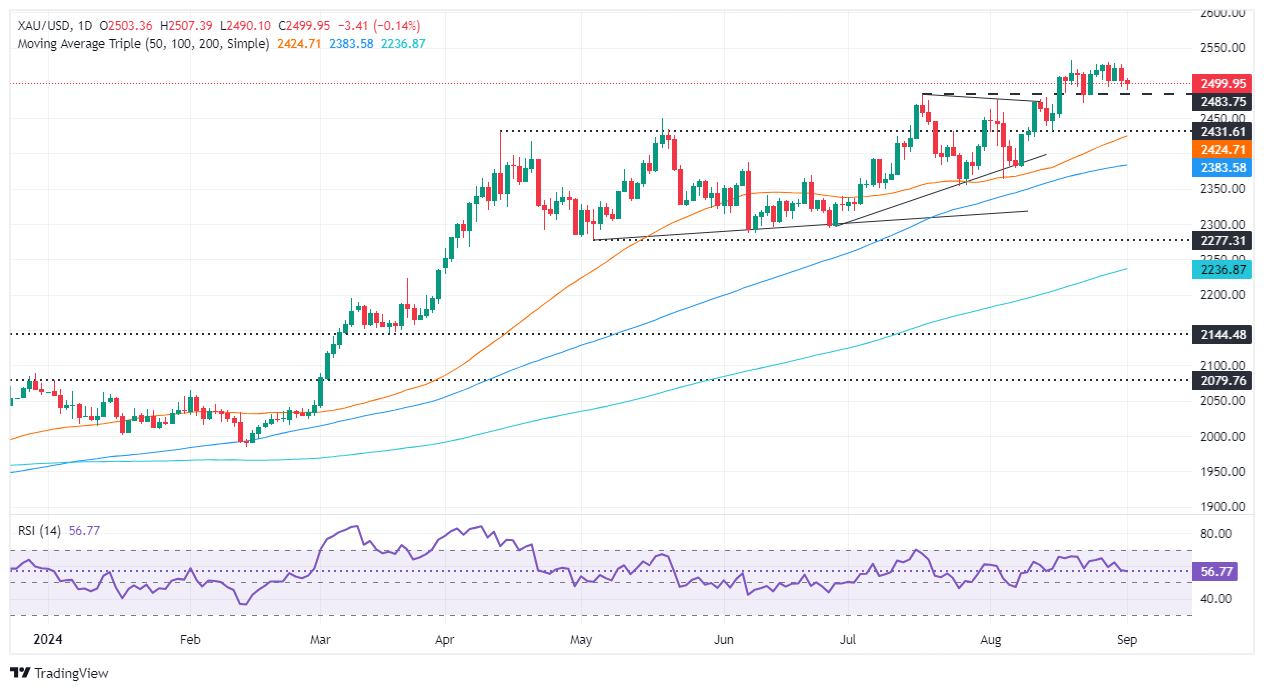
Technical outlook: Gold price set to dive further below $2,500
Gold prices are upwardly biased, though momentum has shifted negatively, as shown by the Relative Strength Index (RSI). Although the RSI is bullish, its slope aims downward, approaching the neutral level. Therefore, in the short term, XAU/USD is downwardly biased.
If XAU/USD drops below $2,500, the next support would be the August 22 low at $2,470. Once surpassed, the next stop would be the confluence of the August 15 swing low and the 50-day Simple Moving Average (SMA) near the $2,424-$2,431 area.
Conversely, if XAU/USD stays above $2,500, the next resistance would be the ATH, and the following resistance would be the $2,550 mark. A breach of the latter will expose $2,600.
Gold FAQs
Gold has played a key role in human’s history as it has been widely used as a store of value and medium of exchange. Currently, apart from its shine and usage for jewelry, the precious metal is widely seen as a safe-haven asset, meaning that it is considered a good investment during turbulent times. Gold is also widely seen as a hedge against inflation and against depreciating currencies as it doesn’t rely on any specific issuer or government.
Central banks are the biggest Gold holders. In their aim to support their currencies in turbulent times, central banks tend to diversify their reserves and buy Gold to improve the perceived strength of the economy and the currency. High Gold reserves can be a source of trust for a country’s solvency. Central banks added 1,136 tonnes of Gold worth around $70 billion to their reserves in 2022, according to data from the World Gold Council. This is the highest yearly purchase since records began. Central banks from emerging economies such as China, India and Turkey are quickly increasing their Gold reserves.
Gold has an inverse correlation with the US Dollar and US Treasuries, which are both major reserve and safe-haven assets. When the Dollar depreciates, Gold tends to rise, enabling investors and central banks to diversify their assets in turbulent times. Gold is also inversely correlated with risk assets. A rally in the stock market tends to weaken Gold price, while sell-offs in riskier markets tend to favor the precious metal.
The price can move due to a wide range of factors. Geopolitical instability or fears of a deep recession can quickly make Gold price escalate due to its safe-haven status. As a yield-less asset, Gold tends to rise with lower interest rates, while higher cost of money usually weighs down on the yellow metal. Still, most moves depend on how the US Dollar (USD) behaves as the asset is priced in dollars (XAU/USD). A strong Dollar tends to keep the price of Gold controlled, whereas a weaker Dollar is likely to push Gold prices up.
- AUD/USD started the week on the right foot on a quiet Monday.
- Australia will release Q2 GDP data on Wednesday, which will be key.
- RBA Governor Bullock is expected to reiterate hawkish guidance on Thursday despite market expectations of a rate cut in December.
The AUD/USD gained 0.30% in Monday's session, advancing to 0.6790. The pair is trading slightly higher on a quiet Monday as markets look ahead to key US labor market data this week, culminating in the Nonfarm Payrolls (NFP) report on Friday. On the domestic front, Gross Domestic Product (GDP) data and Reserve Bank of Australia (RBA) Governor Bullock's speech on Thursday are the key events to watch.
The Australian economic outlook remains uncertain, with both positive and negative indicators. The RBA has taken a hawkish stance due to elevated inflation, leading financial markets to anticipate only a modest 25 basis points of easing in interest rates by 2024.
Daily digest market movers: Australian Dollar gains amid quiet trading, anticipation of key data
- Australia's Q2 GDP data will be released on Wednesday, with expectations of a 0.2% QoQ growth (vs. 0.1% in Q1) and a 0.9% YoY rate (vs. 1.1% in Q1).
- However, recent data on retail sales and private capital expenditure suggest downside risks to the GDP forecast.
- RBA Governor Bullock will speak on Thursday, likely reiterating the RBA's hawkish stance. Markets will look for clues on whether the bank is open to cutting or not this year.
- Despite the RBA's hawkish guidance, market expectations point to an 80% chance of a rate cut in December, reflecting concerns about slower economic growth.
AUD/USD technical outlook: Momentum flattens despite gains
The Relative Strength Index (RSI) rose back to 64 as the Moving Average Convergence Divergence (MACD) is green and flat, suggesting that the momentum is strong. The pair is approaching a resistance level at 0.6800, and if it breaks above this level, it could continue to rise toward 0.6830-0.6850. Support levels can be found at 0.6760 and 0.6740.
Australian Dollar FAQs
One of the most significant factors for the Australian Dollar (AUD) is the level of interest rates set by the Reserve Bank of Australia (RBA). Because Australia is a resource-rich country another key driver is the price of its biggest export, Iron Ore. The health of the Chinese economy, its largest trading partner, is a factor, as well as inflation in Australia, its growth rate and Trade Balance. Market sentiment – whether investors are taking on more risky assets (risk-on) or seeking safe-havens (risk-off) – is also a factor, with risk-on positive for AUD.
The Reserve Bank of Australia (RBA) influences the Australian Dollar (AUD) by setting the level of interest rates that Australian banks can lend to each other. This influences the level of interest rates in the economy as a whole. The main goal of the RBA is to maintain a stable inflation rate of 2-3% by adjusting interest rates up or down. Relatively high interest rates compared to other major central banks support the AUD, and the opposite for relatively low. The RBA can also use quantitative easing and tightening to influence credit conditions, with the former AUD-negative and the latter AUD-positive.
China is Australia’s largest trading partner so the health of the Chinese economy is a major influence on the value of the Australian Dollar (AUD). When the Chinese economy is doing well it purchases more raw materials, goods and services from Australia, lifting demand for the AUD, and pushing up its value. The opposite is the case when the Chinese economy is not growing as fast as expected. Positive or negative surprises in Chinese growth data, therefore, often have a direct impact on the Australian Dollar and its pairs.
Iron Ore is Australia’s largest export, accounting for $118 billion a year according to data from 2021, with China as its primary destination. The price of Iron Ore, therefore, can be a driver of the Australian Dollar. Generally, if the price of Iron Ore rises, AUD also goes up, as aggregate demand for the currency increases. The opposite is the case if the price of Iron Ore falls. Higher Iron Ore prices also tend to result in a greater likelihood of a positive Trade Balance for Australia, which is also positive of the AUD.
The Trade Balance, which is the difference between what a country earns from its exports versus what it pays for its imports, is another factor that can influence the value of the Australian Dollar. If Australia produces highly sought after exports, then its currency will gain in value purely from the surplus demand created from foreign buyers seeking to purchase its exports versus what it spends to purchase imports. Therefore, a positive net Trade Balance strengthens the AUD, with the opposite effect if the Trade Balance is negative.
Scarce volatility due to the inactivity in the US markets allowed the appetite for the risk-linked assets to regain some traction at the beginning of a data-packed week, while expectations of a Fed rate cut in September remained well in place.
Here is what you need to know on Tuesday, September 3:
The US Dollar Index (DXY) retreated modestly, although it maintained its trade well above the 101.00 barrier. On September 3, the ISM Manufacturing PMI will take centre stage, seconded by the final S&P Global Manufacturing PMI, Construction Spending and the RCM/TIPP Economic Optimism Index.
EUR/USD reversed part of the recent leg lower and retested the 1.1080 zone following renewed downward bias in the Greenback. The ECB’s af Jochnick, Nagel, and Buch are due to speak on September 3.
GBP/USD mirrored the performance of its risk peers and bounced off recent peaks near 1.3100. The BRC Retail Sales Monitor is expected on September 3.
USD/JPY climbed to two-week highs past 147.00 in response to further depreciation of the Yen. The next data release on the Japanese docket will be the final Jibun Bank Services PMI on September 4.
AUD/USD flirted once again with the key 0.6800 the figure in response to Dollar weakness. The Australian Current Account figures will be published on September 3.
Supply concerns mainly stemming from Libya underpinned the small recovery in WTI prices to the area beyond the $74.00 mark per barrel, managing to partially leave behind Friday’s pronounced pullback.
Gold prices added to Friday’s decline, slightly receding to the area below the $2,500 mark per ounce troy. Silver prices dropped to three-week lows near $28.30 on the back of discouraging prints from Chinese business activity.
- US Dollar takes a breather after last week's rally.
- August jobs report on Friday is anticipated to show a significant increase in Nonfarm Payrolls.
- Market expectations for 100 bps of easing from the Fed by year-end remain unchanged.
On Monday, the US Dollar Index (DXY), which measures the US Dollar’s value against a basket of six major currencies, consolidated above 101.50, extending after last week's gain of more than 1%. Markets await key labor data this week, and the August jobs report, due for release on Friday, is anticipated to show a robust increase in Nonfarm Payrolls (NFP), which might provide support to the US Dollar.
Despite ongoing economic growth that exceeds expectations, the market's anticipation of aggressive monetary easing appears to have become excessive. However, a cut by the Federal Reserve (Fed) in September is a done deal, but its size will depend on the incoming data.
Daily digest market movers: DXY flat on quiet Monday ahead of key data
- Consensus estimates for August's Nonfarm Payrolls is 165K, with a whisper number of 150K.
- Unemployment Rate is expected to fall to 4.2%, while Average Hourly Earnings are expected to rise to 3.7%.
- Other data this week, including ISM manufacturing and services PMIs, are expected to decline slightly but remain in expansionary territory.
- Moreover, the Fed's Beige Book report is expected to show that the labor market remains tight.
- Dovish bets on the Fed remain steady, and investors are still seeing 100 bps of cuts by year-end.
DXY technical outlook: Index consolidates after last week's rally, DXY must hold 101.50 line
The DXY Index experienced a consolidation phase after last week's rally, which resulted in weekly gains of nearly 1%. Currently, the Relative Strength Index (RSI) is below 50, while the Moving Average Convergence Divergence (MACD) is displaying rising green bars, indicating a potential bullish trend. Both indicators point to bullish momentum flattening out but recovering overall.
The key support levels for the DXY are 101.50, 101.30 and 101.00, while the resistance levels are 101.80, 102.00 and 102.30.
US Dollar FAQs
The US Dollar (USD) is the official currency of the United States of America, and the ‘de facto’ currency of a significant number of other countries where it is found in circulation alongside local notes. It is the most heavily traded currency in the world, accounting for over 88% of all global foreign exchange turnover, or an average of $6.6 trillion in transactions per day, according to data from 2022. Following the second world war, the USD took over from the British Pound as the world’s reserve currency. For most of its history, the US Dollar was backed by Gold, until the Bretton Woods Agreement in 1971 when the Gold Standard went away.
The most important single factor impacting on the value of the US Dollar is monetary policy, which is shaped by the Federal Reserve (Fed). The Fed has two mandates: to achieve price stability (control inflation) and foster full employment. Its primary tool to achieve these two goals is by adjusting interest rates. When prices are rising too quickly and inflation is above the Fed’s 2% target, the Fed will raise rates, which helps the USD value. When inflation falls below 2% or the Unemployment Rate is too high, the Fed may lower interest rates, which weighs on the Greenback.
In extreme situations, the Federal Reserve can also print more Dollars and enact quantitative easing (QE). QE is the process by which the Fed substantially increases the flow of credit in a stuck financial system. It is a non-standard policy measure used when credit has dried up because banks will not lend to each other (out of the fear of counterparty default). It is a last resort when simply lowering interest rates is unlikely to achieve the necessary result. It was the Fed’s weapon of choice to combat the credit crunch that occurred during the Great Financial Crisis in 2008. It involves the Fed printing more Dollars and using them to buy US government bonds predominantly from financial institutions. QE usually leads to a weaker US Dollar.
Quantitative tightening (QT) is the reverse process whereby the Federal Reserve stops buying bonds from financial institutions and does not reinvest the principal from the bonds it holds maturing in new purchases. It is usually positive for the US Dollar.
- The Canadian Dollar found little reason to move at the outset of the new trading week.
- Despite a soft start, plenty of key events loom in the week ahead.
- The BoC is expected to cut rates again, and US NFP jobs data lurks on Friday.
The Canadian Dollar (CAD) pulled into the midrange on Monday, kicking off the new trading week with a notable lack of momentum. Canadian and US markets are both dark for the Labor Day holiday, but key calendar events for both will keep USD/CAD traders close to their terminals.
The Bank of Canada (BoC) is set to deliver another rate decision this week, and markets are broadly anticipating another quarter-point trim. On the US side of the data docket, US Purchasing Managers Index (PMI) figures are dotted throughout the week, with the economic calendar slated to culminate in another fresh round of US Nonfarm Payrolls figures.
Daily digest market movers
- Canada and the US are both out on Monday on holidays, market flows remain crimped.
- BoC expected to trim rates another quarter point to 4.25%.
- At the current cut, rate markets expect the Canadian interest rate to land somewhere near 3.75% by the year’s end.
- US ADP Employment Change slated for Thursday represents the first hurdle on the road to Friday’s US NFP jobs data dump.
- This week represents the last major labor update for the US economy before the Fed delivers its hotly-anticipated rate call on September 18.
Canadian Dollar price forecast
Monday’s holiday showing for both the Canadian Dollar (CAD) and the US Dollar (USD) leaves USD/CAD bids in a bit of a lurch. Price action has been hobbled on holiday markets flows and the pair is trading water near the 1.3500 handle.
The CAD’s four-week bull run against the Greenback appears to have fizzled out. The Canadian Dollar chalked in a 3.62% bottom-to-top rally against the USD, rising from 22-month lows to five-month highs within four weeks. Near-term action favors Greenback bulls once again as USD/CAD bids look poised for a fresh run back towards the 200-day Exponential Moving Average (EMA) 1.3616.
USD/CAD daily chart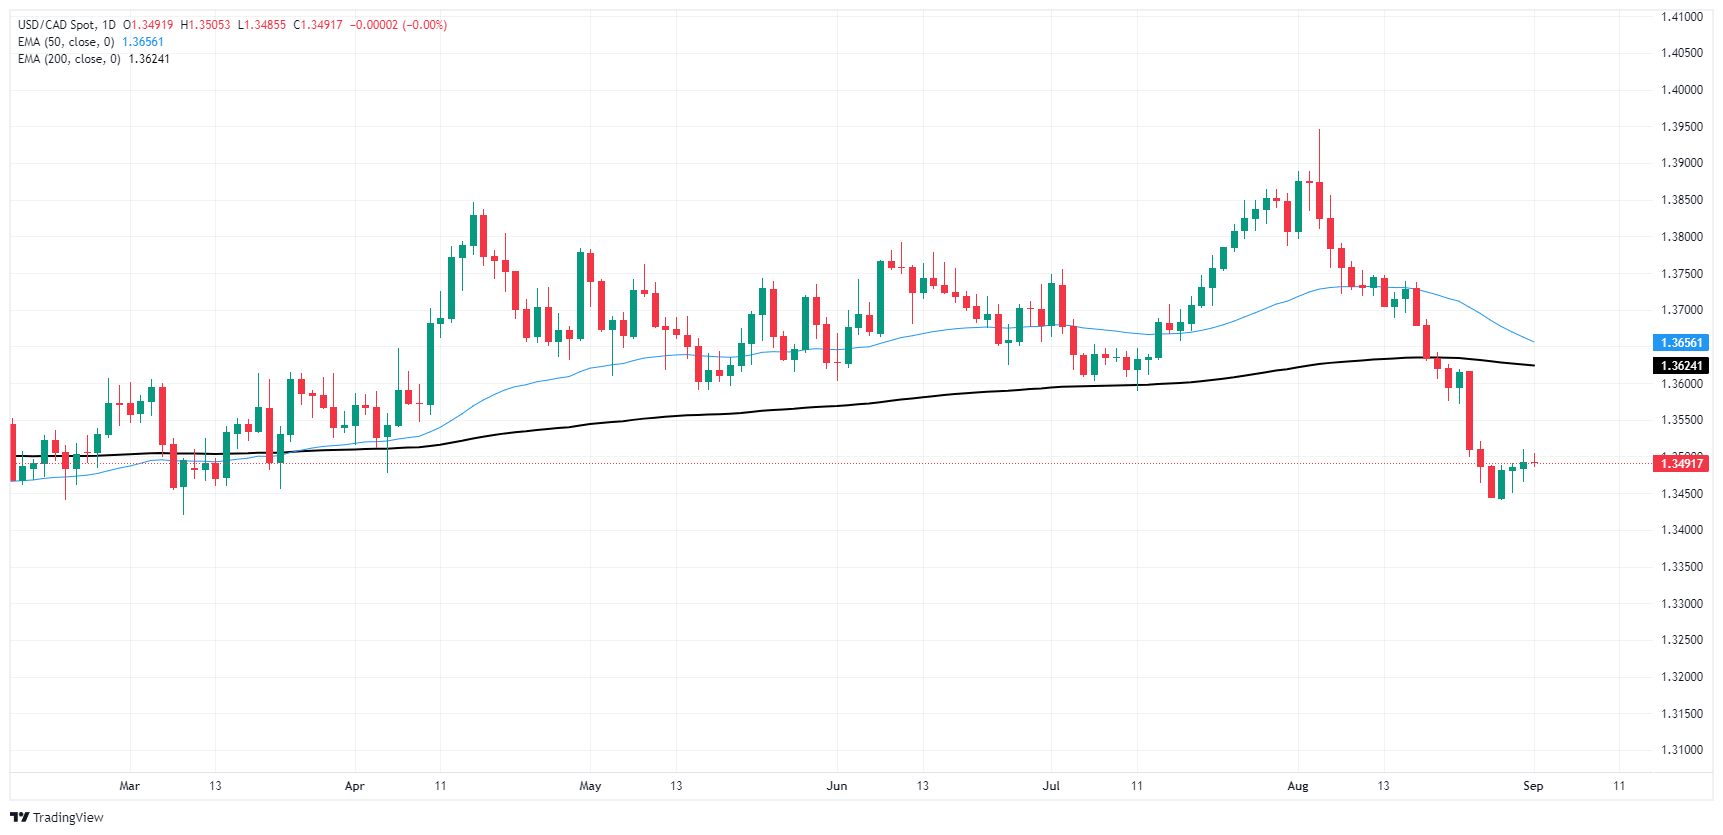
Canadian Dollar FAQs
The key factors driving the Canadian Dollar (CAD) are the level of interest rates set by the Bank of Canada (BoC), the price of Oil, Canada’s largest export, the health of its economy, inflation and the Trade Balance, which is the difference between the value of Canada’s exports versus its imports. Other factors include market sentiment – whether investors are taking on more risky assets (risk-on) or seeking safe-havens (risk-off) – with risk-on being CAD-positive. As its largest trading partner, the health of the US economy is also a key factor influencing the Canadian Dollar.
The Bank of Canada (BoC) has a significant influence on the Canadian Dollar by setting the level of interest rates that banks can lend to one another. This influences the level of interest rates for everyone. The main goal of the BoC is to maintain inflation at 1-3% by adjusting interest rates up or down. Relatively higher interest rates tend to be positive for the CAD. The Bank of Canada can also use quantitative easing and tightening to influence credit conditions, with the former CAD-negative and the latter CAD-positive.
The price of Oil is a key factor impacting the value of the Canadian Dollar. Petroleum is Canada’s biggest export, so Oil price tends to have an immediate impact on the CAD value. Generally, if Oil price rises CAD also goes up, as aggregate demand for the currency increases. The opposite is the case if the price of Oil falls. Higher Oil prices also tend to result in a greater likelihood of a positive Trade Balance, which is also supportive of the CAD.
While inflation had always traditionally been thought of as a negative factor for a currency since it lowers the value of money, the opposite has actually been the case in modern times with the relaxation of cross-border capital controls. Higher inflation tends to lead central banks to put up interest rates which attracts more capital inflows from global investors seeking a lucrative place to keep their money. This increases demand for the local currency, which in Canada’s case is the Canadian Dollar.
Macroeconomic data releases gauge the health of the economy and can have an impact on the Canadian Dollar. Indicators such as GDP, Manufacturing and Services PMIs, employment, and consumer sentiment surveys can all influence the direction of the CAD. A strong economy is good for the Canadian Dollar. Not only does it attract more foreign investment but it may encourage the Bank of Canada to put up interest rates, leading to a stronger currency. If economic data is weak, however, the CAD is likely to fall.
- Mexican Peso weakens as USD/MXN climbs on judiciary reform concerns after new Congress convenes.
- Mexico's Business Confidence improves slightly in August, while Manufacturing PMI hits a two-year low, indicating sectoral challenges.
- S&P Global cites weak sales, competition from China, and highway insecurity as key issues for Mexican manufacturers.
The Mexican Peso begins September on a lower note, tumbling more than 0.50% amid renewed fears that the judiciary reform is a go and could be approved during the first week of the new Mexican Congress that took office on September 1. The USD/MXN trades at 19.80 after jumping from a daily low of 19.60.
Mexico’s economic docket featured Business Confidence in August, which improved slightly compared to July’s data. In the meantime, business activity in August, as measured by the S&P Global Manufacturing PMI, slumped to its lowest level in two years, the agency revealed.
Pollyanna De Lima, Economics Associate Director at S&P Global Market Intelligence, commented: “August proved to be another difficult month for Mexican manufacturers, with firms trimming output, employment, and stocks due to subdued sales in both the domestic and international markets. Total order book volumes dropped to the greatest extent in two years, boding ill for near-term production prospects.”
De Lima added that companies became concerned about “intense competition from China and highway insecurity.”
At the same time, Mexican Business Confidence improved, driven by a minimal improvement in investment propensity, revealed the Instituto Nacional de Estadistica Geografia e Informatica (INEGI).
Across the border, Wall Street remains closed due to the observance of the Labor Day holiday. Activities will resume on Tuesday, though traders are eyeing the release of employment data on Friday. Nonfarm Payrolls (NFP) for August are expected to exceed July’s data.
In the meantime, the latest inflation report by the US Bureau of Economic Analysis (BEA) revealed that the Core Personal Consumption Expenditures Price Index (Fed), the Fed’s preferred inflation gauge, remained unchanged at around 2.5% YoY.
Daily digest market movers: Mexican Peso on the defensive amid political turmoil
- Business Confidence improved from 53 to 53.2, expanding for the third straight month, yet it remains below the highest level reached in January of 54.4.
- S&P Global Manufacturing PMI contracted for the second consecutive month, from 49.6 to 48.5, hinting that Mexico’s economic slowdown is more profound than expected.
- Most banks expect the Bank of Mexico (Banxico) to reduce rates by at least 50 basis points (bps) for the remainder of 2024. This would pressure the Mexican currency, which has already depreciated 15.38% year to date (YTD).
- USD/MXN rally extends on fears of an approval of the judiciary reform, sparking a flight of safety to the US Dollar.
- Regarding this, a judge granted a stay over the weekend to prevent debate on the proposal. The initiative has sparked a strike in the judicial sector, strained relations with the United States, and shaken local markets amid widespread doubts it generates.
- Mexican President Andres Manuel Lopez Obrador's decision to pause relations with the US and Canadian ambassadors this week will continue to weigh on the Mexican Peso.
- US Nonfarm Payrolls in August are expected to grow from 114K to 163K, while the Unemployment Rate is foreseen ticking lower from 4.3% to 4.2%.
- Data from the Chicago Board of Trade (CBOT) suggests the Fed will cut at least 96.5 basis points (bps), according to the fed funds rate futures contract for December 2024.
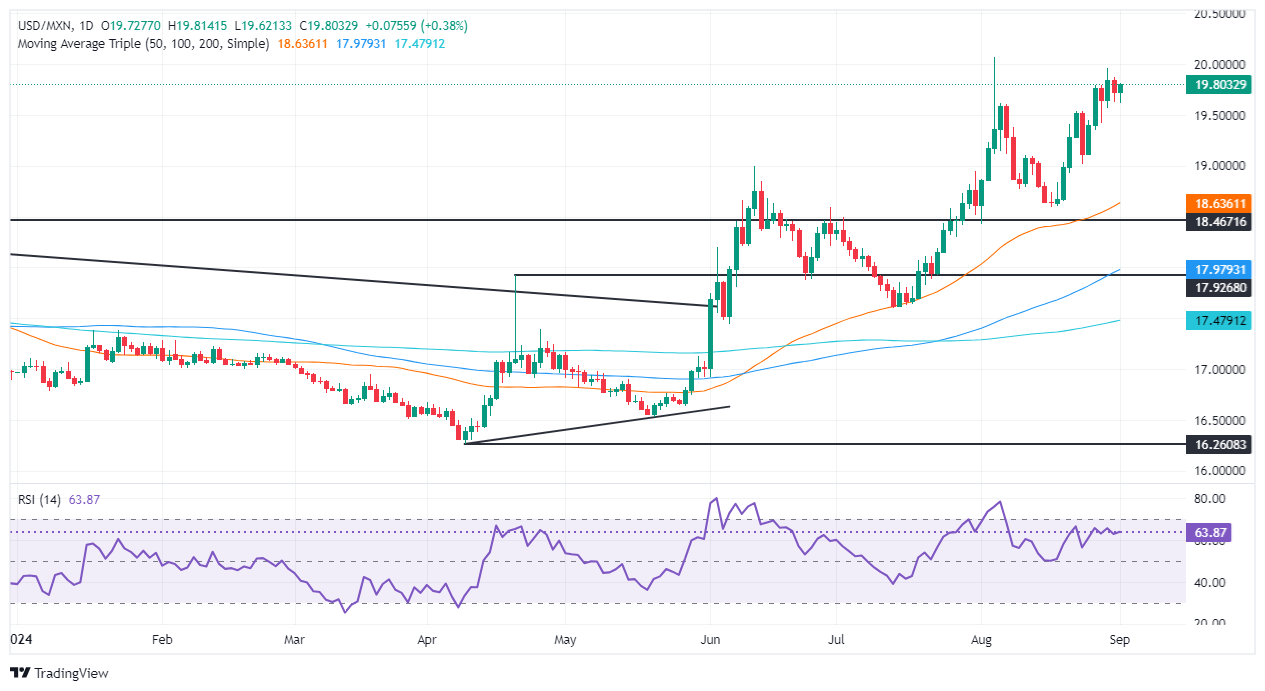
Technical outlook: Mexican Peso weakens as USD/MXN climbs above 19.70
The USD/MXN uptrend remains in place, with the pair consolidating within the 19.50-20.00 range for the first trading day in September. Momentum shows further upside as the Relative Strength Index (RSI) is bullish and shifted flat from being tilted to the downside.
If USD/MXN buyers clear the 20.00 figure, there are plenty of additional topside targets. The next resistance would be the YTD high at 20.22, followed by the September 28, 2022, daily high at 20.57. If those two levels are surrendered, the next stop would be August 2, 2022, swing high at 20.82, ahead of 21.00.
On further USD/MXN weakness, the first support would be 19.50. A breach of the latter will expose the August 23 swing low of 19.02 before giving way for sellers eyeing a test of the 50-day Simple Moving Average (SMA) at 18.62.
Mexican Peso FAQs
The Mexican Peso (MXN) is the most traded currency among its Latin American peers. Its value is broadly determined by the performance of the Mexican economy, the country’s central bank’s policy, the amount of foreign investment in the country and even the levels of remittances sent by Mexicans who live abroad, particularly in the United States. Geopolitical trends can also move MXN: for example, the process of nearshoring – or the decision by some firms to relocate manufacturing capacity and supply chains closer to their home countries – is also seen as a catalyst for the Mexican currency as the country is considered a key manufacturing hub in the American continent. Another catalyst for MXN is Oil prices as Mexico is a key exporter of the commodity.
The main objective of Mexico’s central bank, also known as Banxico, is to maintain inflation at low and stable levels (at or close to its target of 3%, the midpoint in a tolerance band of between 2% and 4%). To this end, the bank sets an appropriate level of interest rates. When inflation is too high, Banxico will attempt to tame it by raising interest rates, making it more expensive for households and businesses to borrow money, thus cooling demand and the overall economy. Higher interest rates are generally positive for the Mexican Peso (MXN) as they lead to higher yields, making the country a more attractive place for investors. On the contrary, lower interest rates tend to weaken MXN.
Macroeconomic data releases are key to assess the state of the economy and can have an impact on the Mexican Peso (MXN) valuation. A strong Mexican economy, based on high economic growth, low unemployment and high confidence is good for MXN. Not only does it attract more foreign investment but it may encourage the Bank of Mexico (Banxico) to increase interest rates, particularly if this strength comes together with elevated inflation. However, if economic data is weak, MXN is likely to depreciate.
As an emerging-market currency, the Mexican Peso (MXN) tends to strive during risk-on periods, or when investors perceive that broader market risks are low and thus are eager to engage with investments that carry a higher risk. Conversely, MXN tends to weaken at times of market turbulence or economic uncertainty as investors tend to sell higher-risk assets and flee to the more-stable safe havens.
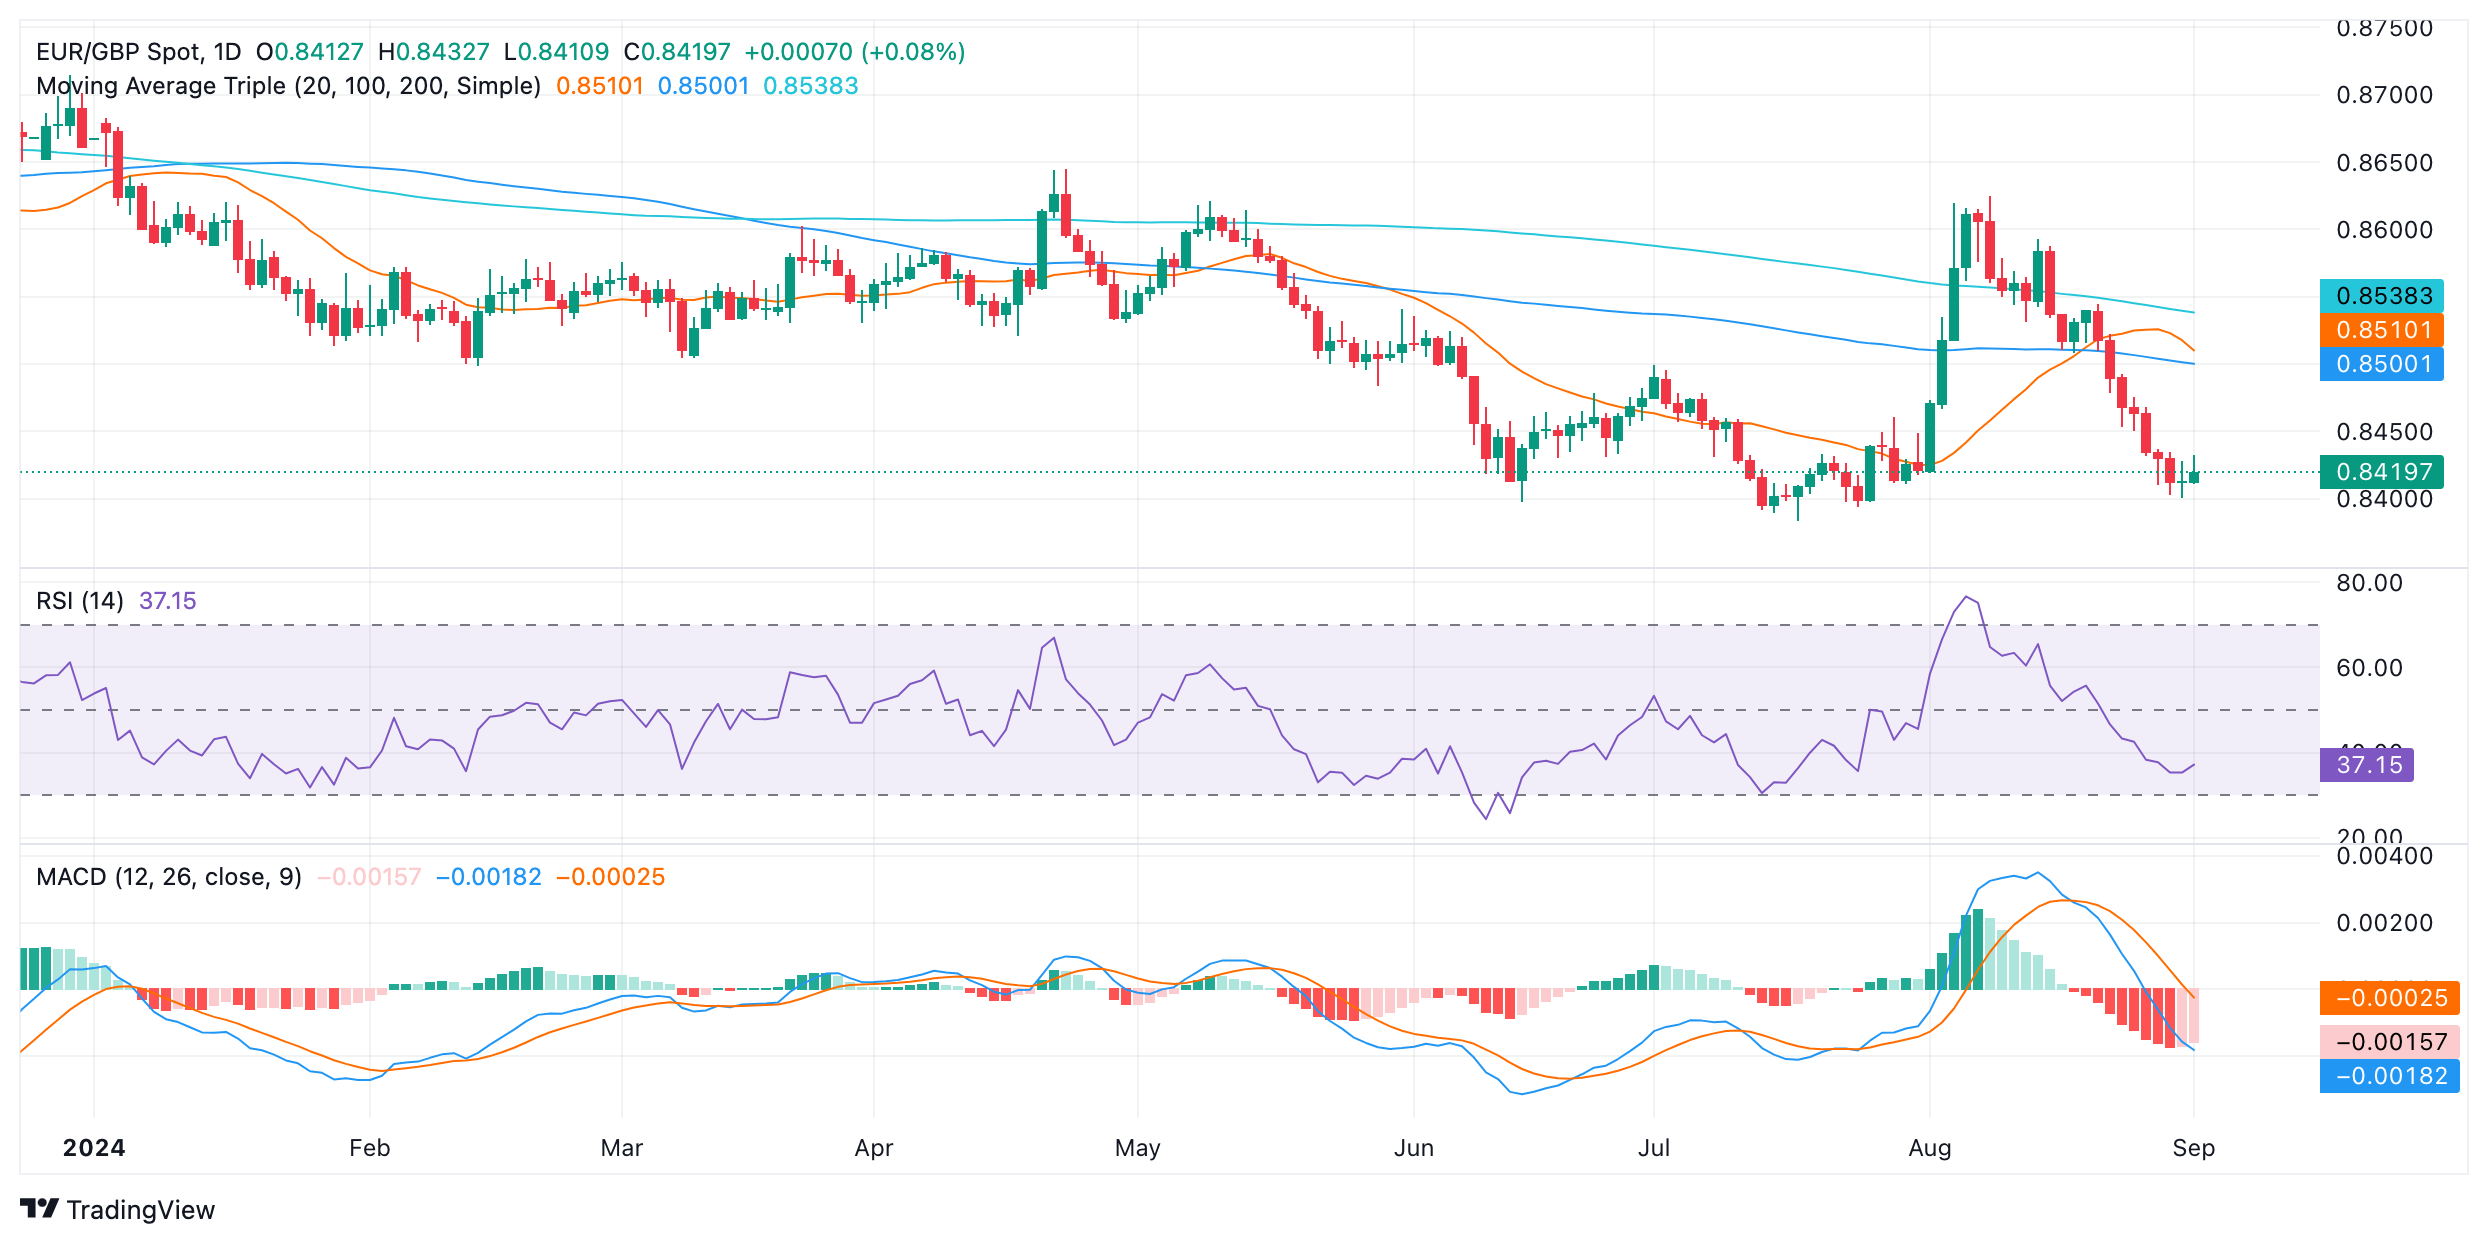
- EUR/GBP attempts a recovery but technicals support the downside.
- Near oversold RSI and bearish MACD signals and overall bearish outlook.
- The pair might side-ways trade in the next sessions above 0.8400.
In Monday's session, the EUR/GBP mildly rose to 0.8430, but sellers quickly regained control, pushing the pair back to the 0.8420 level. Technical indicators remain aligned with the prevailing bearish trend, suggesting further downside is likely. However, it all points down that the sellers will take a breather in the next sessions, and the pair might side-ways trade above the 0.8400 area.
The Relative Strength Index (RSI) is hovering near the oversold territory at around 37, with a flat slope indicating no clear momentum. The Moving Average Convergence Divergence (MACD) continues to print red bars, reinforcing the selling pressure. Volume has been decreasing in recent sessions, indicating a stagnant selling momentum.
Overall, while extreme oversold conditions may provide some temporary support, the technical outlook remains bearish. The EUR/GBP could attempt to test the immediate support at 0.8400, followed by 0.8380 and 0.8360. On the upside, resistance lies at 0.8430, followed by 0.8450 and 0.8470. In case of a consolidation, traders should eye the 0.8400-0.8450 channel for side-ways movements.
EUR/GBP daily chart
The debate on whether the FOMC should cut by 25 or 50bps could well become clearer by the end of the week when the non-farm payrolls data report for August arrives. There are plenty of economic indicators that point to a weakening labour market and if that is confirmed by a lower-than-expected print on Friday, it will likely trigger another big rates and dollar move given the OIS market pricing is currently well short of pricing in a 50bps cut at the meeting on 18th September, MUFG FX analysts note.
US inflation eases with FOMC focus now on jobs data
“Last week the consumer confidence data revealed an upturn in confidence but despite this the jobs index worsened and further underlined the prospect of the unemployment rate continuing to drift higher. The Fed’s thinking on the labour market certainly seems to have shifted following the benchmark revision of the NFP data that revealed a 818k downward revision to payrolls in the year to March 2024 – the second largest on record. That data may harden the Fed’s view on the unemployment rate rising and average hourly earnings growth slowing. Both of those indicators haven’t changed due to the NFP revision but will likely alter the Fed’s projections of labour market spare capacity that may shape the Summary of Economic Projections (SEP) to be released at the September meeting.”
“In the last SEP release in June, which would have been based in part on the non-farm payrolls data that we now know was over-stating employment growth by an average of 68k per month, the unemployment rate was forecast to be at 4.0% in Q4 2024 and the core PCE inflation at 2.8% which we can now see is overdone. The core PCE inflation on Friday for July came in at 2.7% while the unemployment rate is already at 4.3%. Average hourly earnings growth for July fell to 3.6% YoY, close to the 3.5% roughly consistent with price stability. So, another weak print on Friday could see even bigger revisions to the SEPs on 18th September that could compel the FOMC to cut by 50bps. So, the jobs report on Friday will be crucial in shaping those expectations.”
“Ahead of Friday we will get plenty of the other labour market indicators (ISM employment indices; JOLTS; Challenger; ADP) so those data points will shape expectations into the payrolls on Friday. If weaker than expected you would expect yields to drift lower to better price the risk of 50bps. Our bias this week is for the dollar to weaken back again given we see a bigger risk of a 50bp cut than currently implied by OIS pricing. Our payroll's forecasting model which uses the latest estimations of seasonal and trend components of the series, predicts surprise to the downside in the august payrolls report.”
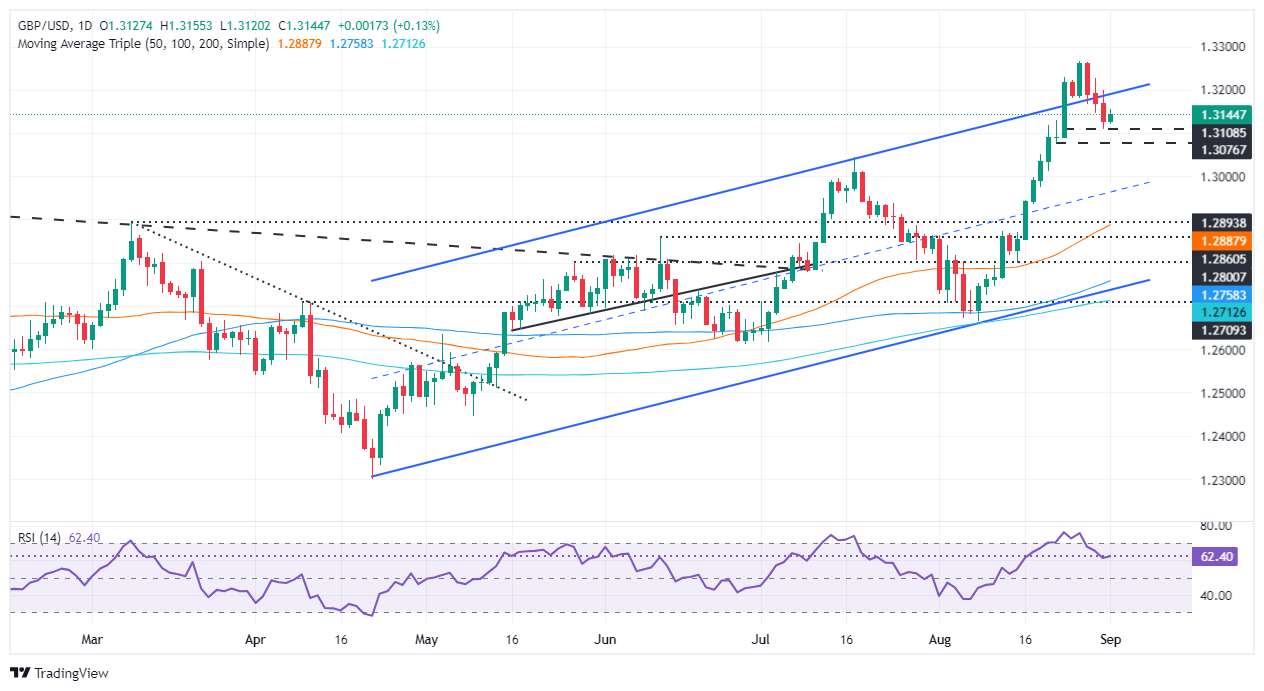
- GBP/USD fails to hold above July high of 1.3142, closing August at 1.3122, hinting at possible consolidation.
- Daily chart reveals a ‘bullish-harami’ pattern; clearing 1.3199 could aim for YTD high of 1.3266.
- Downside break below 1.3109 risks fall to 1.3044 and further to the 50-DMA at 1.2894.
- Momentum leans neutral to bullish, with RSI positive but stabilizing.
The GBP/USD begins September on a slight positive tone and trades at 1.3152, up by over 0.20% during the North American session. The session is expected to be light as US financial markets remain closed in observance of Labor Day.
GBP/USD Price Forecast: Technical outlook
The GBP/USD monthly chart witnessed a breakout failure of the July 2023 monthly high of 1.3142. Traders failed to achieve a daily close above the latter, ending August at 1.3122.
From a weekly chart standpoint, the GBP/USD is set for consolidation at around the 1.3140-1.3270 range before the release of US Nonfarm Payrolls data, which would be crucial for the US Federal Reserve to determine the size of the first-rate cut at the September 18 meeting.
Meanwhile, from a daily chart point of view, the GBP/USD is forming a ‘bullish-harami’ candle chart pattern, though traders must clear last Friday’s peak at 1.3199 before the pair can aim toward the year-to-date (YTD) highs of 1.3266.
Conversely, if GBP/USD consolidates and breaks below the August 29 swing low of 1.3109, this could exacerbate a drop toward the latest support level seen at the July 17 swing high of 1.3044 before slumping to the 50-day moving average (DMA) at 1.2894.
Momentum is neutral to bullish biased, as the Relative Strength Index (RSI) is in bullish territory but has turned flat.
GBP/USD Price Action – Daily Chart
British Pound PRICE Today
The table below shows the percentage change of British Pound (GBP) against listed major currencies today. British Pound was the strongest against the Japanese Yen.
| USD | EUR | GBP | JPY | CAD | AUD | NZD | CHF | |
|---|---|---|---|---|---|---|---|---|
| USD | -0.15% | -0.13% | 0.60% | 0.07% | -0.31% | 0.23% | 0.32% | |
| EUR | 0.15% | 0.03% | 0.75% | 0.20% | -0.14% | 0.37% | 0.46% | |
| GBP | 0.13% | -0.03% | 0.70% | 0.15% | -0.20% | 0.37% | 0.39% | |
| JPY | -0.60% | -0.75% | -0.70% | -0.58% | -0.87% | -0.24% | -0.36% | |
| CAD | -0.07% | -0.20% | -0.15% | 0.58% | -0.33% | 0.15% | 0.24% | |
| AUD | 0.31% | 0.14% | 0.20% | 0.87% | 0.33% | 0.51% | 0.60% | |
| NZD | -0.23% | -0.37% | -0.37% | 0.24% | -0.15% | -0.51% | 0.08% | |
| CHF | -0.32% | -0.46% | -0.39% | 0.36% | -0.24% | -0.60% | -0.08% |
The heat map shows percentage changes of major currencies against each other. The base currency is picked from the left column, while the quote currency is picked from the top row. For example, if you pick the British Pound from the left column and move along the horizontal line to the US Dollar, the percentage change displayed in the box will represent GBP (base)/USD (quote).
As is happening in France with the extremes on the left and right of the political spectrum taking a larger proportion of votes in the parliamentary elections, this weekend saw a similar pattern in two regional elections in Germany yesterday. AfD is on course to win 32.8% in the state of Thuringia and marks the first win for a far-right party since World War II. The CDU/CSU was a second with 23.6% of the vote. It was the other way around in Saxony with the AfD falling short with 30.6% of the vote while the CDU/CSU won a slightly larger share with 31.9%. The SPD did appallingly bad winning just 6.1% in Thuringia, the worst result in postwar Germany while both the Greens and the FDP both fell below the 5% threshold required in order to be represented in the state parliament, MUFG FX analysts note.
A political gridlock comes to Germany
“The evidence of disaffection was highlighted by the surge in popularity on the left as well with a new far-left party BSW winning 15.8% of the vote in Thuringia and 11.8% in Saxony. Given the performance of the two extreme parties it is clear that Germany is heading slowly toward the very same political outcome as in France – political gridlock. AfD will not be in a position to govern in Thuringia given all other parties have stated they would not enter a coalition with AfD which mean the CDU/CSU would be required to consider governing with other parties including the far-left party BSW. BSW are more supportive of Russia and are calling for a change in policy on Ukraine.”
“The next general election is scheduled for autumn 2025 and based on these results it seems difficult to see a strong government emerging. The political backdrop in the euro-zone has never been as bad since the single currency emerged. Weak GDP growth in Germany for a sustained period is at the heart of voter anger. Five of the last ten quarters for GDP growth has seen a contraction. Incredibly, Germany’s economy is a mere 0.2% larger than in Q4 2019 ahead of the covid pandemic. In the US, real GDP is 9.4% larger over the same period.”
“We will be releasing our monthly Foreign Exchange Outlook this afternoon and we will be showing a weaker US dollar forecast profile but the mixed global economic backdrop – commodity prices are down 10% since May, the elevated geopolitical risks and the complete political gridlock at the heart of the euro-zone all point to reasons to remain cautious over the extent to which the dollar will weaken going forward.”
- USD/CAD is showing bullish signs but lacks upside momentum and remains in a downtrend.
- It would have to rise more strongly and break above some key levels to indicate a reversal of the dominant bear trend.
USD/CAD is showing some bullish reversal insignia but it is still too soon to be confident that bulls are back in the driving seat.
The risks, therefore, continue to be to the downside as the bear trend remains intact. A break below the 1.3440 lows would extend the downtrend, possibly to the next target at 1.3380.
USD/CAD Daily Chart
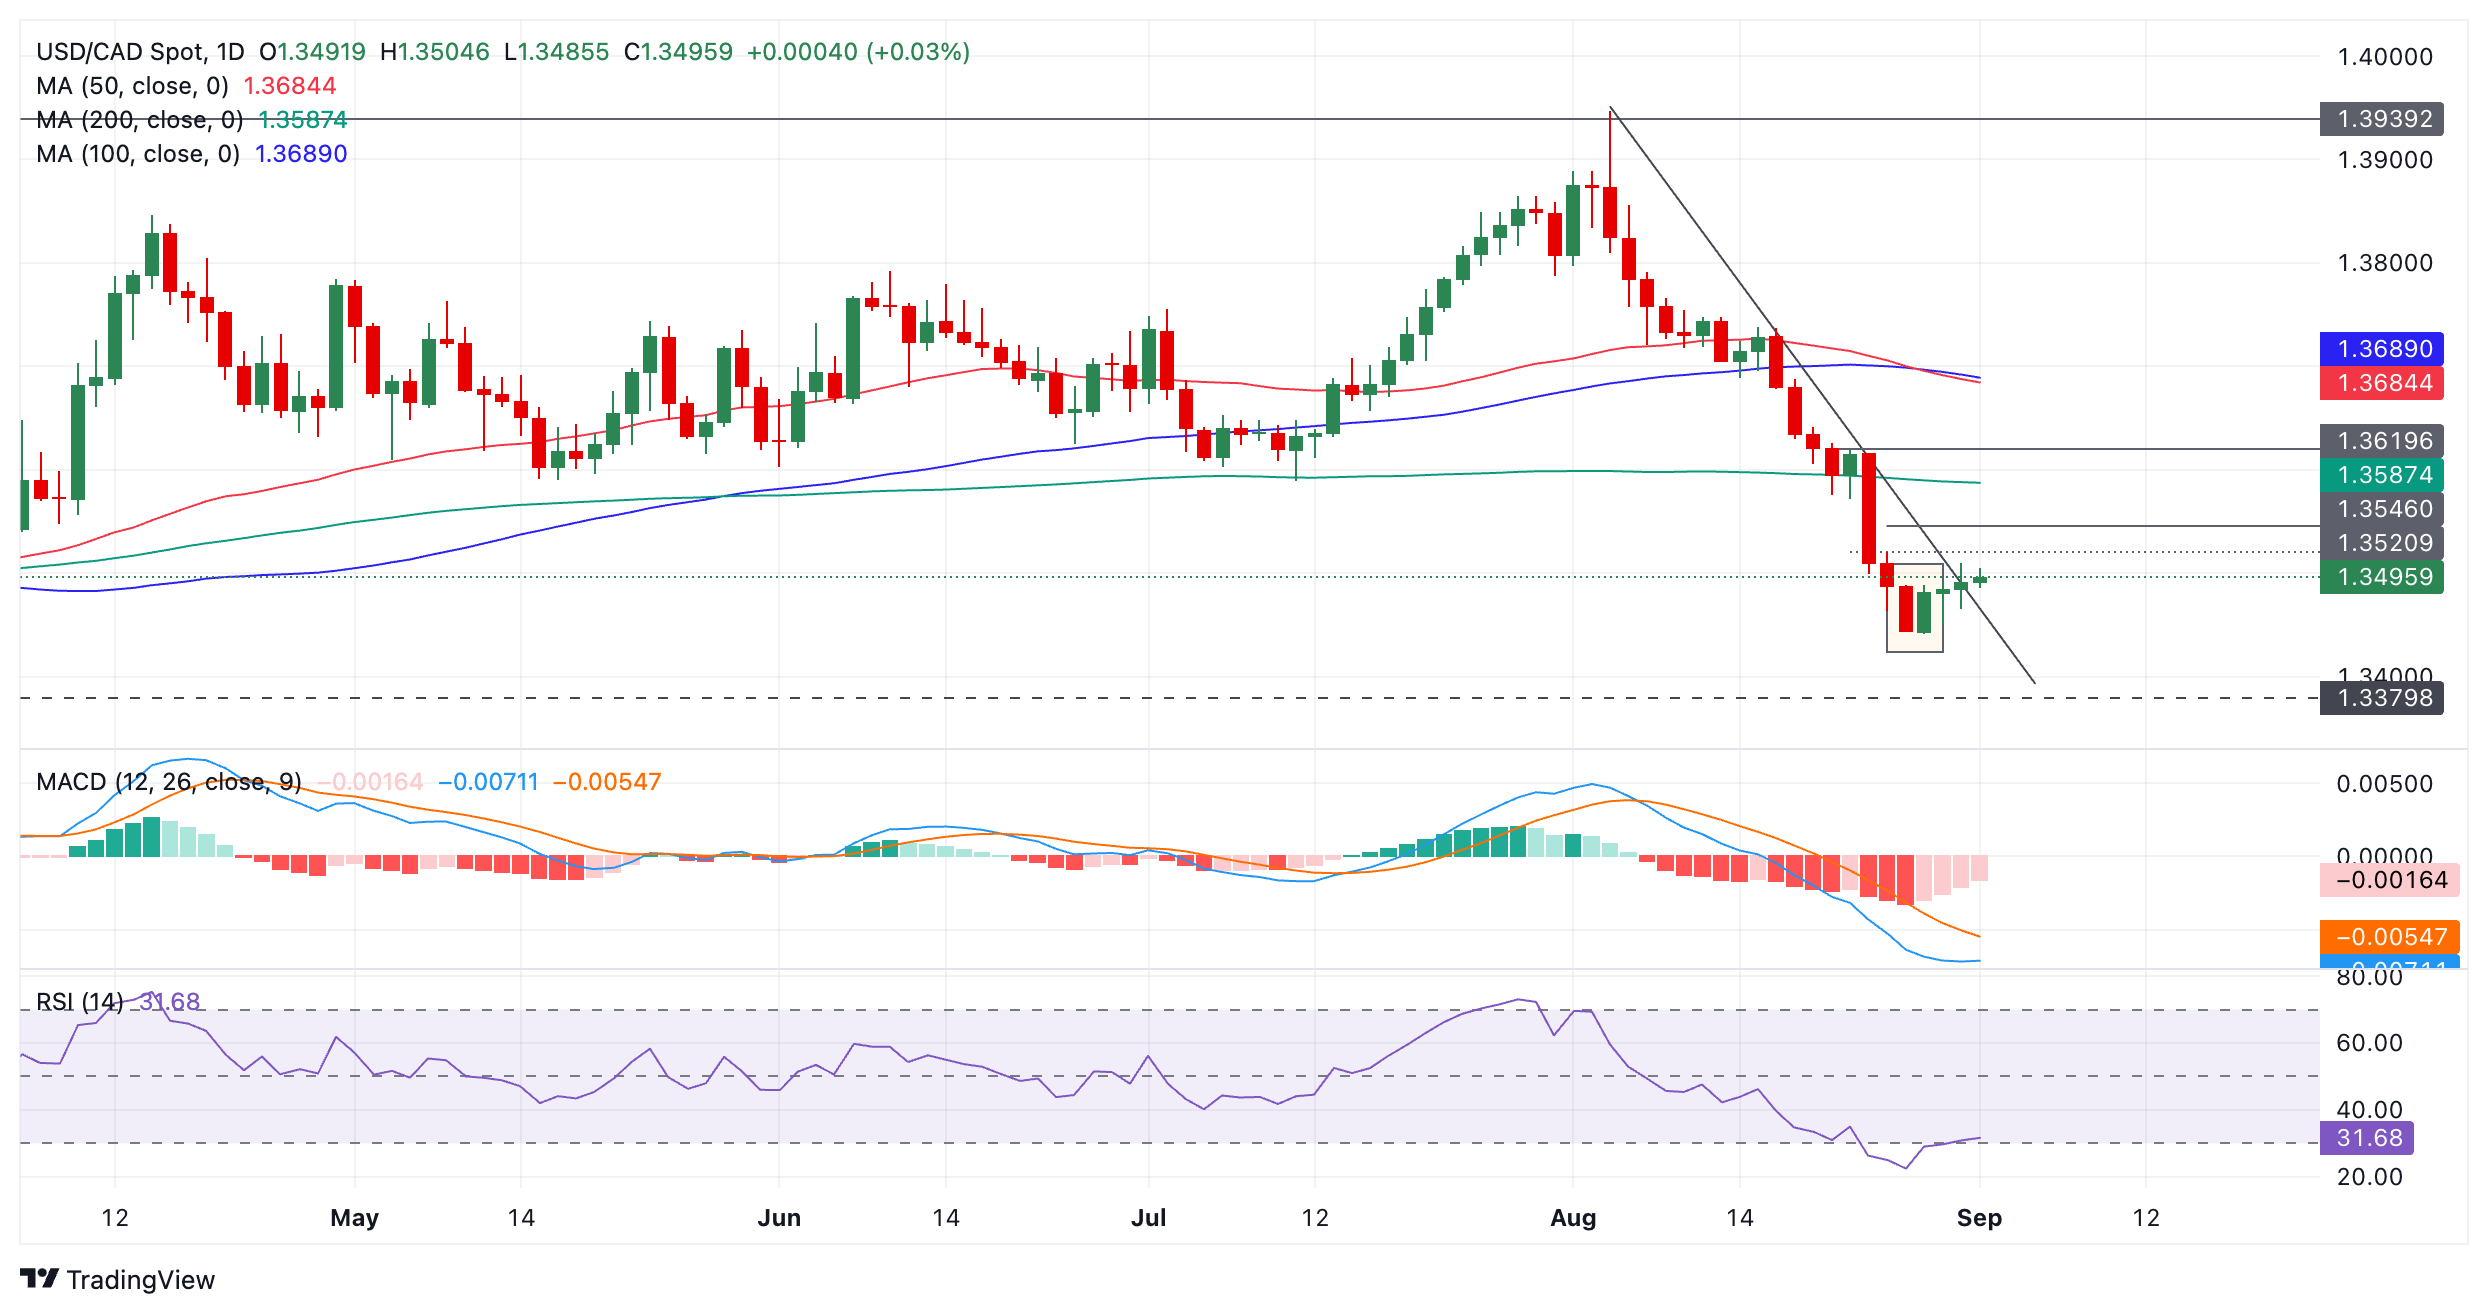
USD/CAD formed a Two-Bar reversal pattern at the August 27 and 28 lows (rectangle on chart). This pattern indicates a short-term reversal higher. The pattern occurs at the end of a down move when a long red candle is followed by a green candle of a similar shape and size. It was followed by two small up days.
USD/CAD also broke above the trendline for the move down and this was accompanied by the Relative Strength Index (RSI) momentum indicator rising out of its oversold zone, and providing a buy signal. This adds further evidence to the possibility of a reversal evolving.
A close above 1.3520-25 would help confirm a bullish reversal and bring into doubt the validity of the bear trend. Such a break might see the pair move up to 1.3593. A move above the latter would give a surer sign of a reversal of the trend.
The recovery has been sluggish and weak so far, however, and there is every possibility the bear trend could resume. A break back down below the trendline would indicate renewed weakness. The next bearish target is situated at 1.3380 – the swing lows of October 2023 and January 2024. This is followed by the bottom of the range at 1.3222.
- The US Dollar Index is flashing signs it could be changing trend and moving higher.
- The weekly and daily charts are showing bullish Japanese candlestick patterns after the recent touchdown on support at 100.
- The 4-hour chart is showing the formation of a possible new short-term uptrend.
The US Dollar Index (DXY) has bounced off support at the floor of its multi-year range and formed some reversal patterns which indicate the possibility it may be reversing the bearish move down from the July highs. Overall, however, it is still a little too early to say for sure and there remains a risk bears could take hold of the reins again and push price back down.
US Dollar Index Weekly Chart
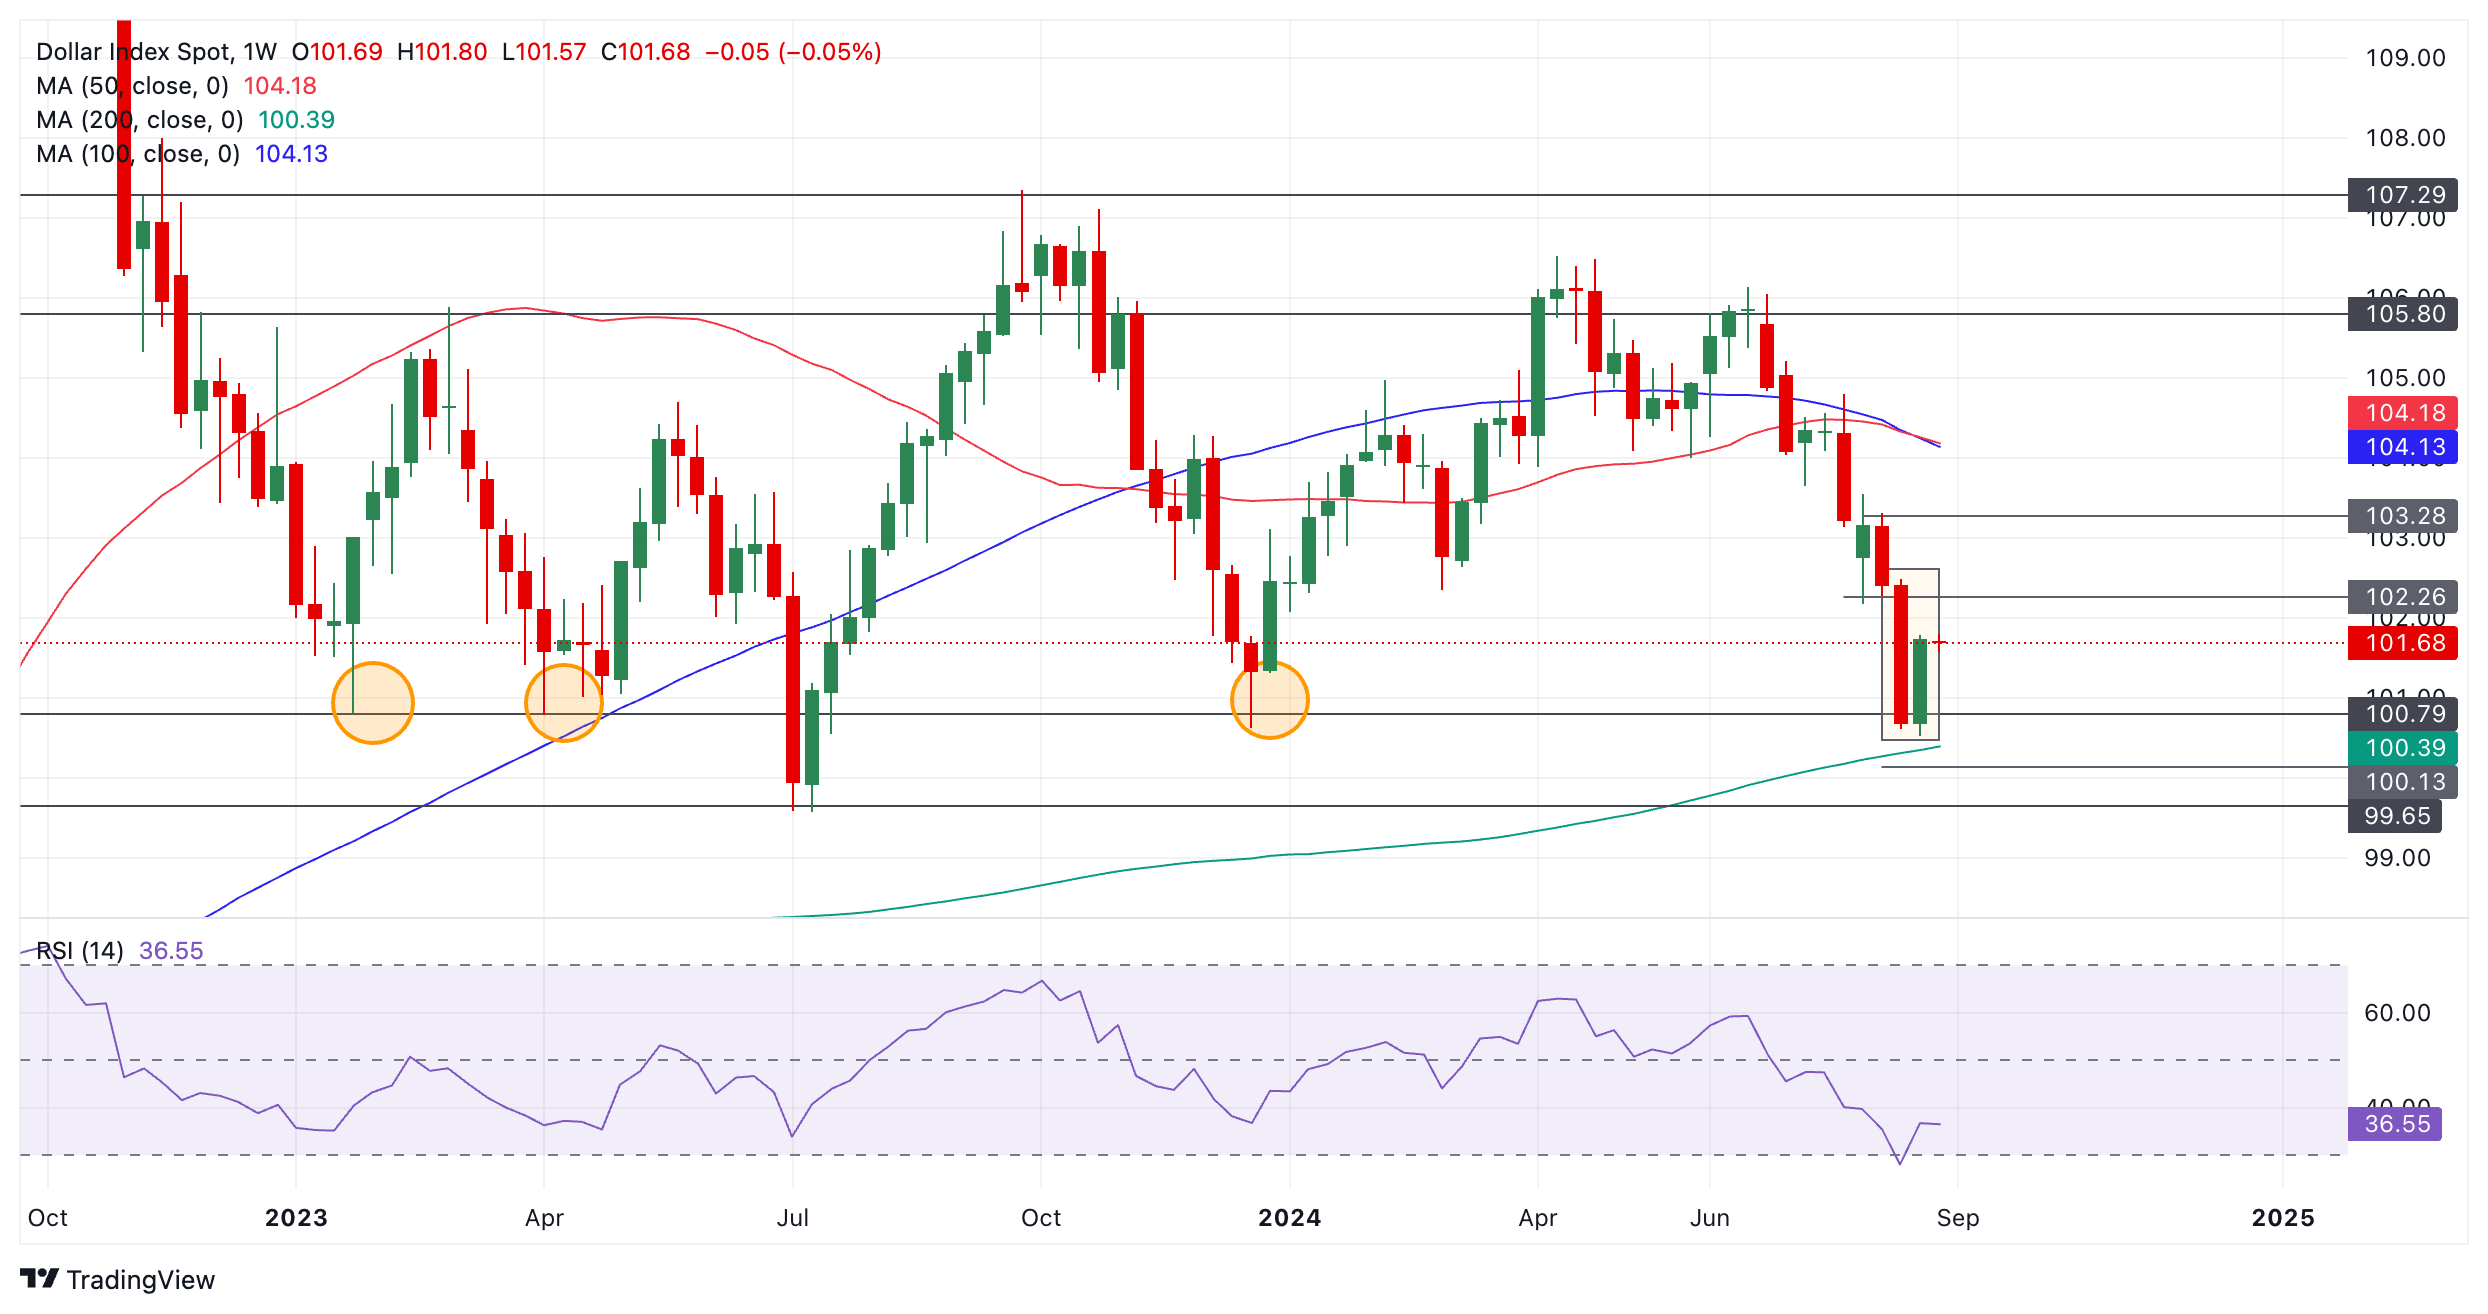
DXY has formed an unconfirmed bullish Piercing Line Japanese candlestick pattern (shaded rectangle) on the weekly chart at a historic support level in the 100s. This level has been tested multiple times in the past (orange bubbles).
The Piercing Line pattern forms after a down move when a red candlestick is followed by a green candlestick that closes above the midpoint of the initial red candle. It is a sign of a bullish reversal. For confirmation, however, the pattern should be followed by another green candlestick which cannot be verified until the end of the current week.
The Relative Strength Index (RSI) momentum indicator exited oversold last week providing a buy signal and adding further evidence to the possibility of a bullish recovery evolving.
Dollar Index Daily Chart
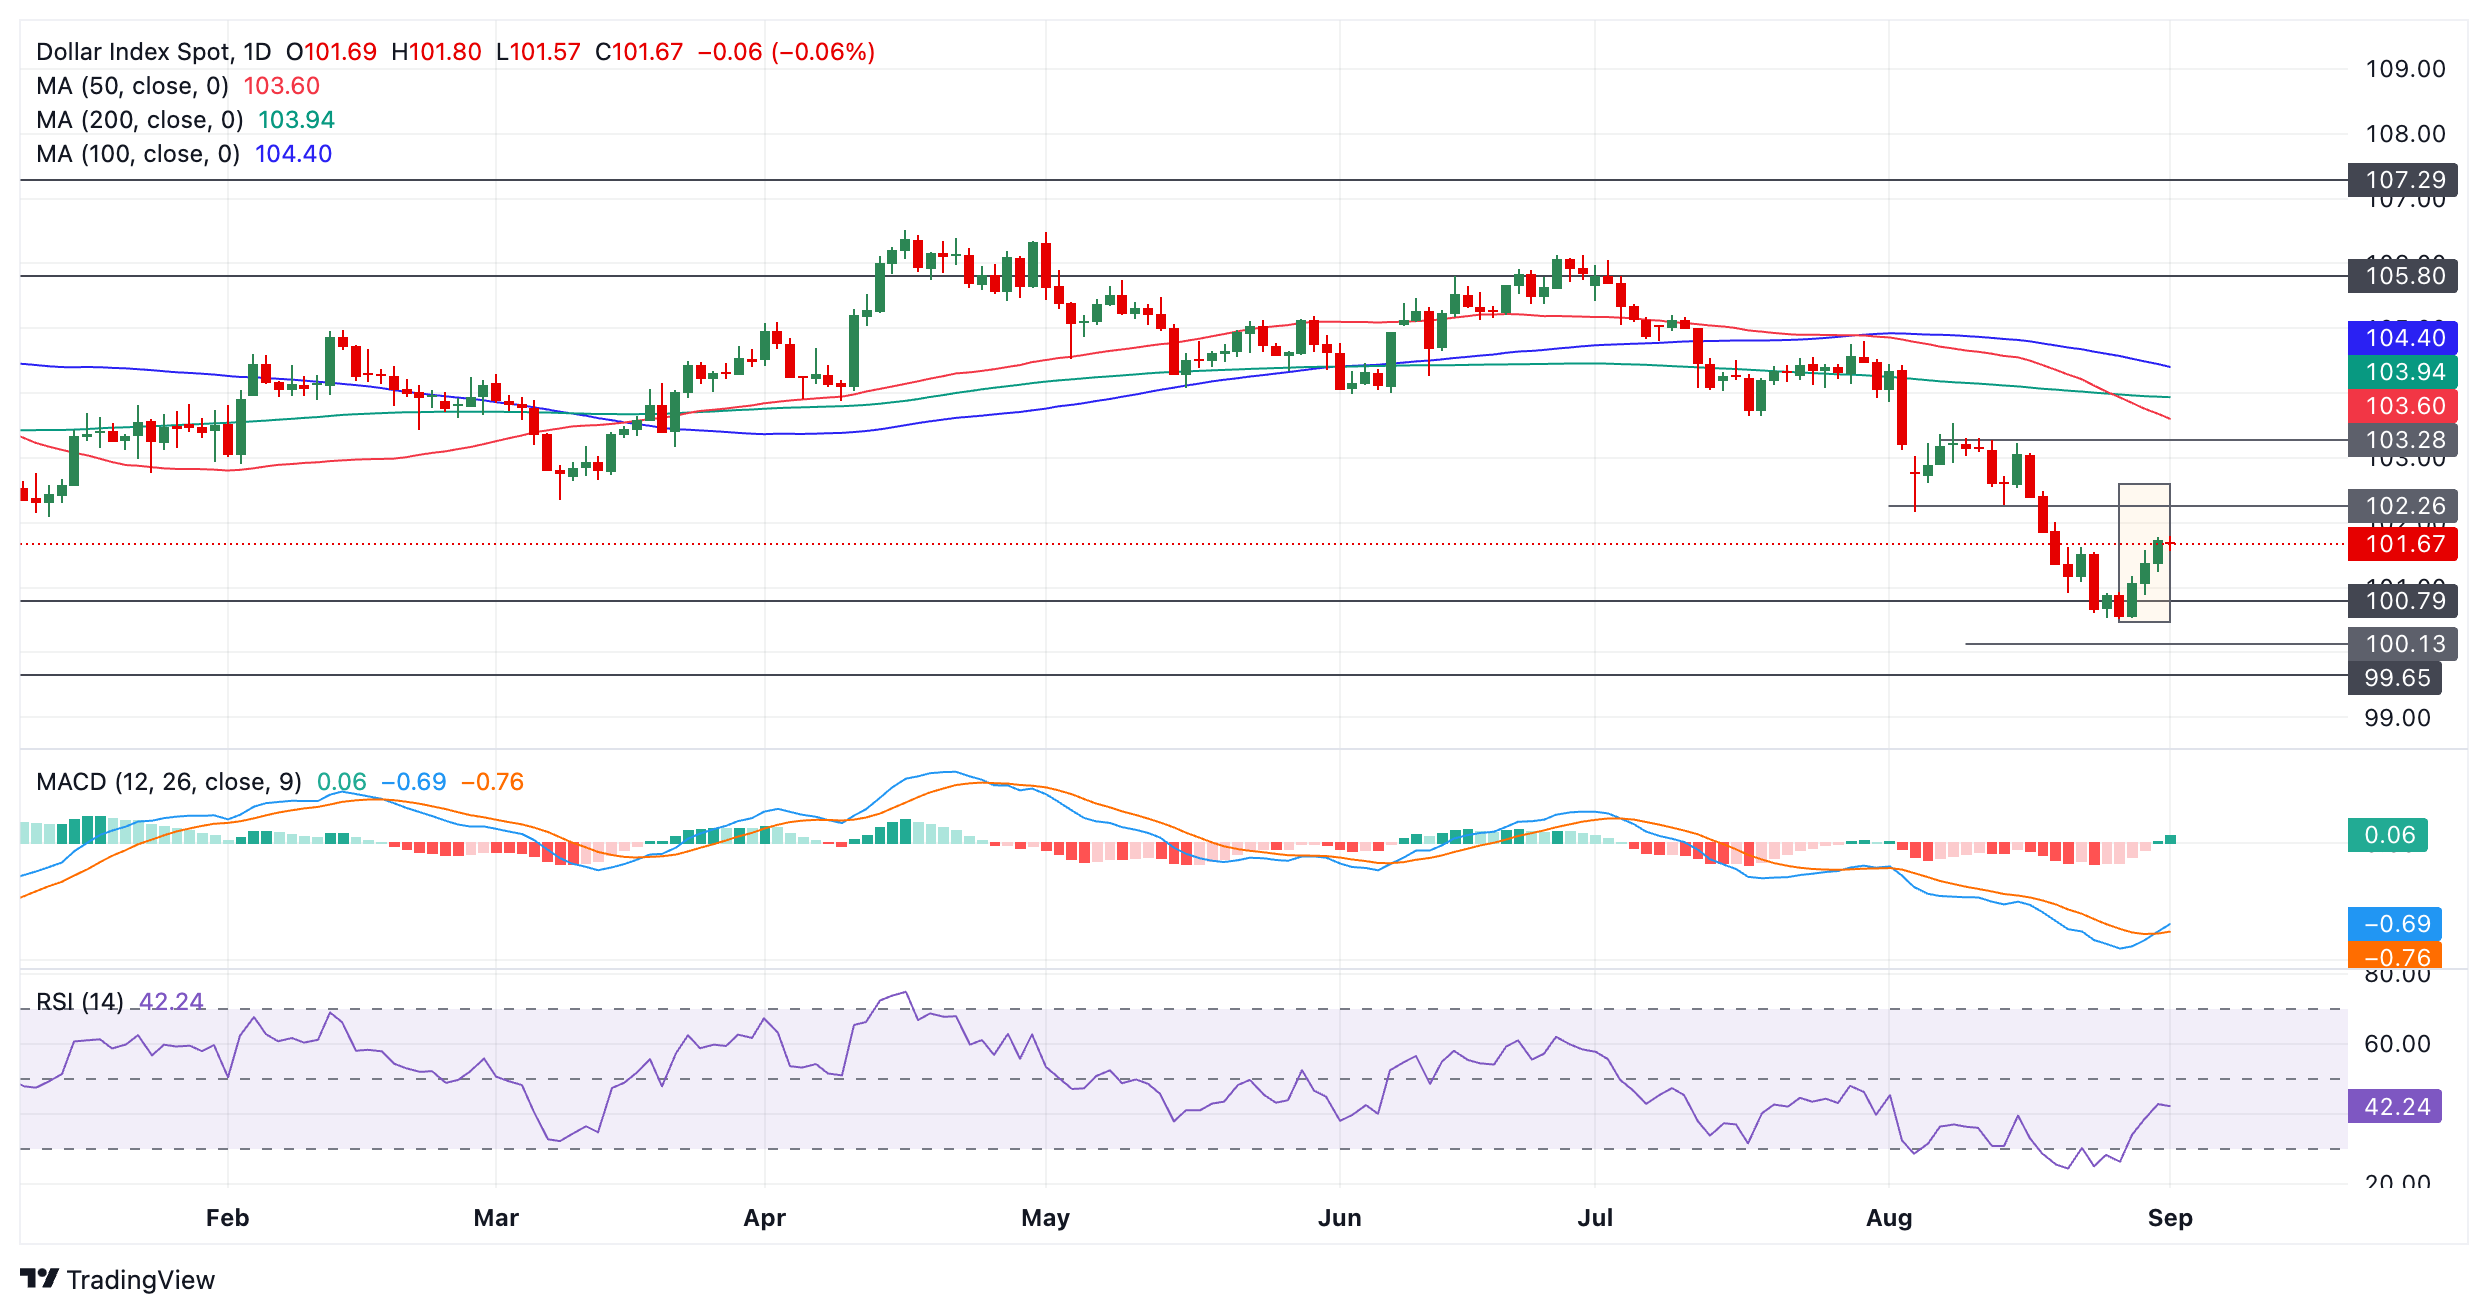
The DXY daily chart is showing that a Three White Soldiers Japanese candlestick pattern has formed during the recovery over the last three days. Such a pattern forms after a market bottom when three rising green candlesticks form in a row that are of a similar size. It is a bullish reversal sign.
The Moving Average Convergence Divergence (MACD) momentum oscillator has crossed above its red signal line giving further evidence to the bullish hypothesis.
The RSI also recently exited oversold, providing a buy signal.
Dollar Index 4-hour Chart
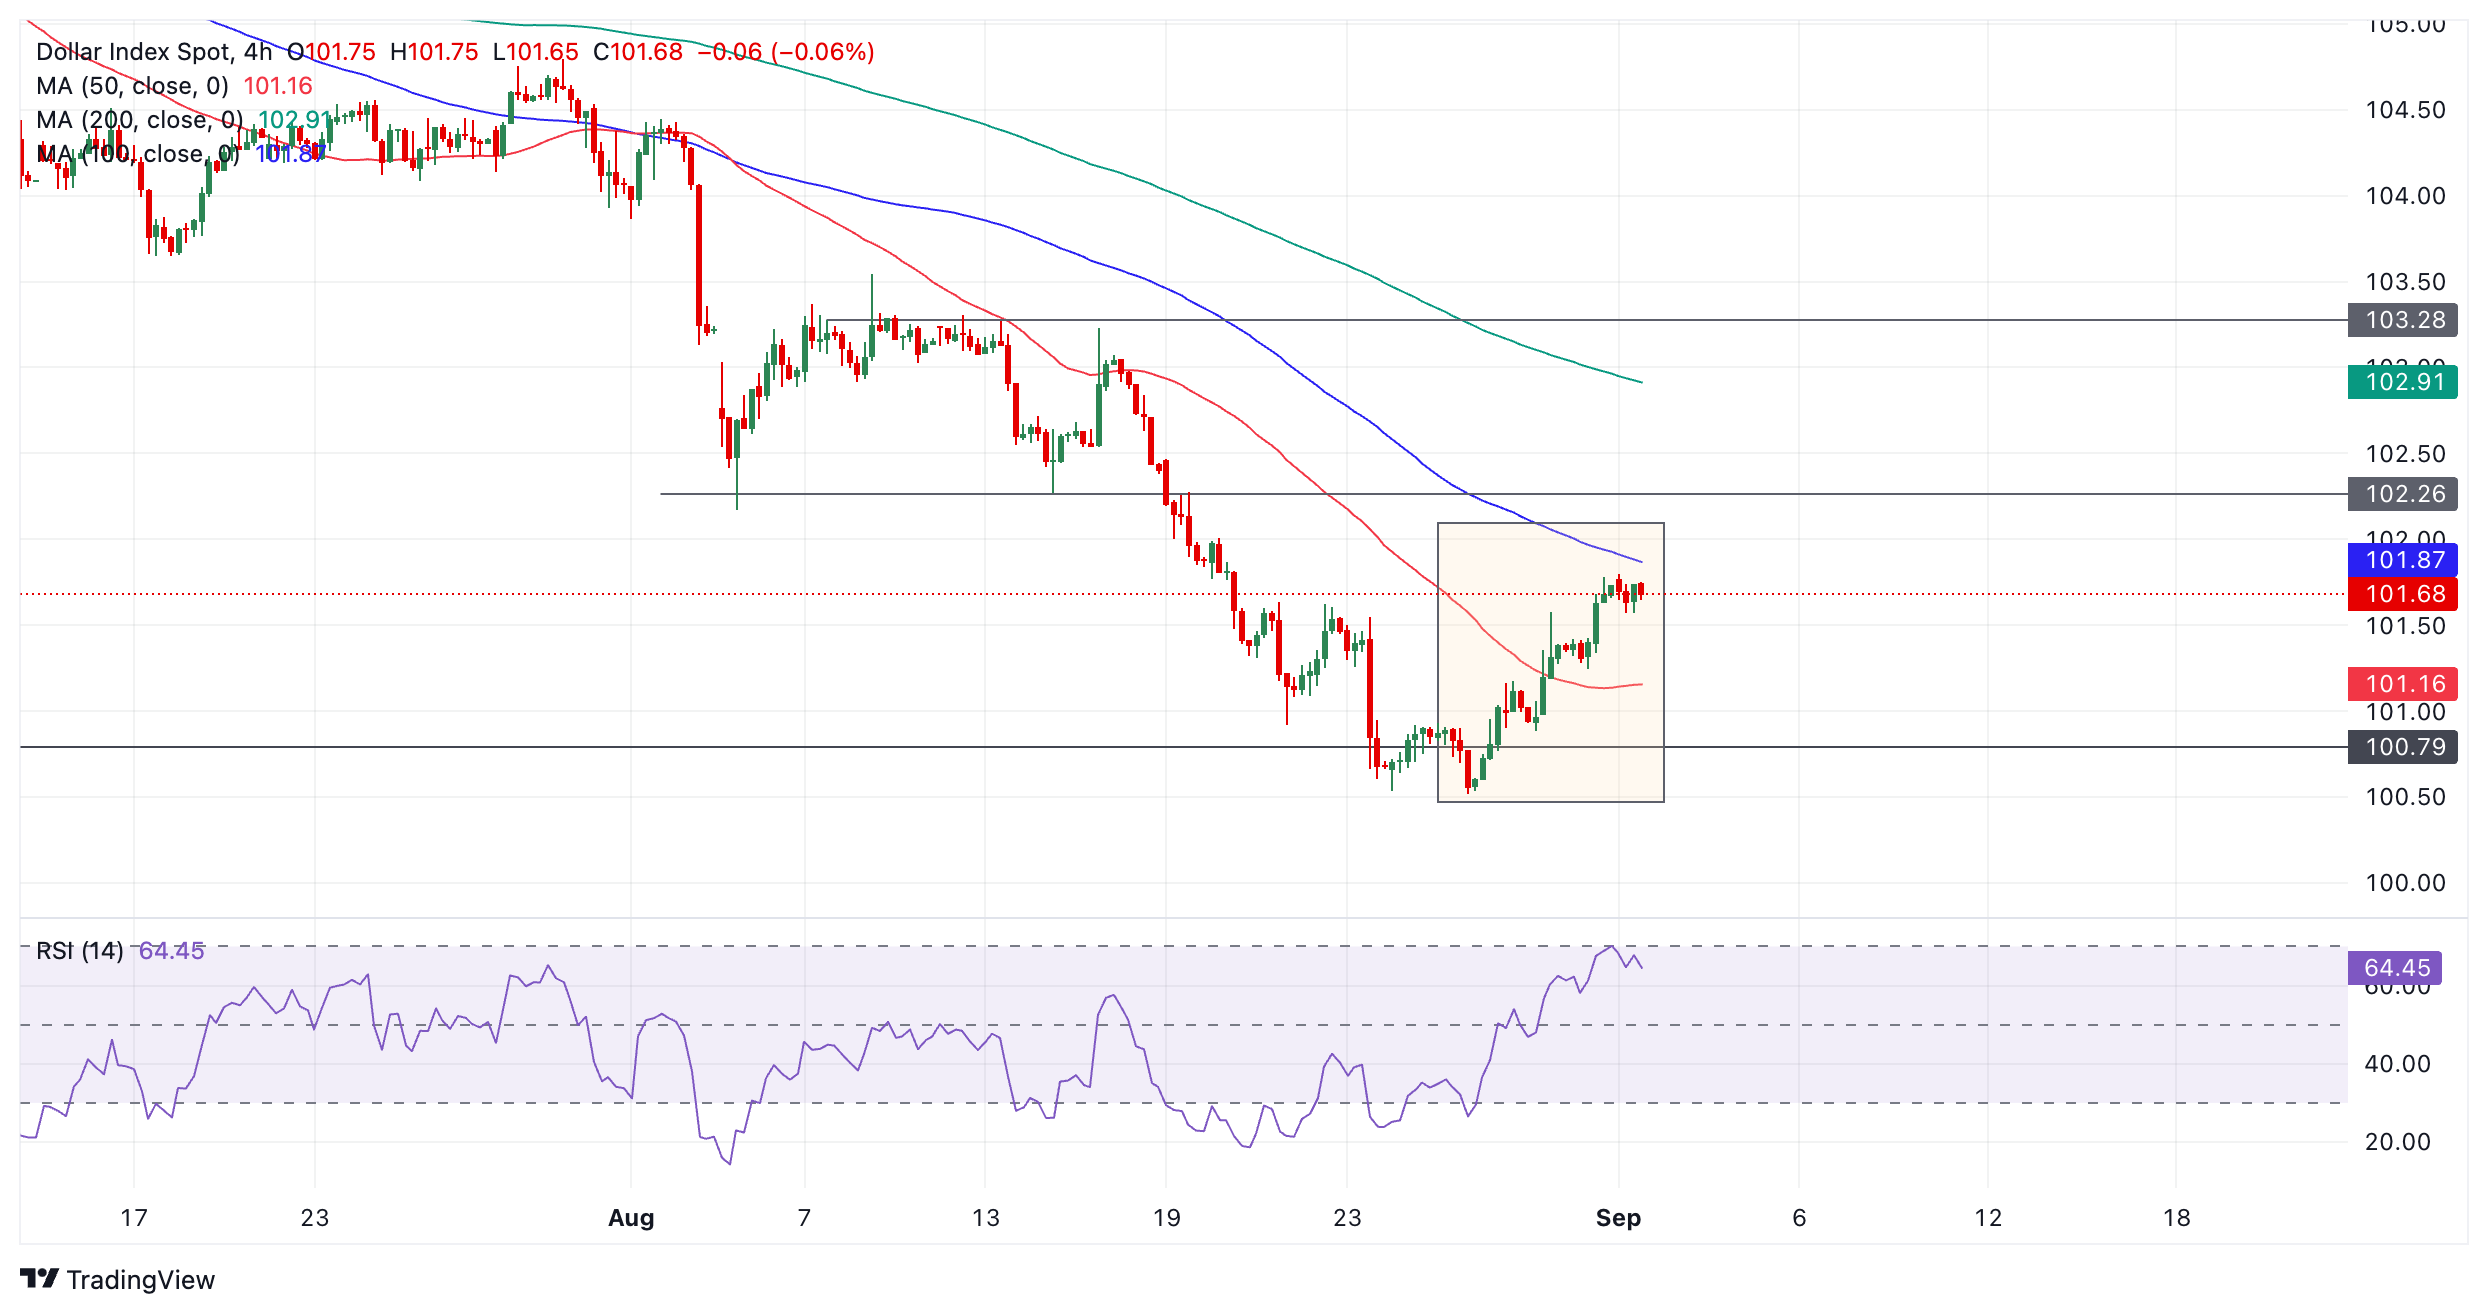
The 4-hour chart of DXY is showing the possible formation of a tender, new uptrend (shaded box). The sequence of peaks and troughs is now rising suggesting the short-term trend may be bullish. DXY has also broken above the key August 22 high.
Given “the trend is your friend” this could indicate the evolution of higher highs, with the next target at the 102.26 level (August 14 low).
The RSI has just exited overbought, however, raising the risk of a deeper pull back evolving.
The outcome of the US elections could have a large impact on Gold prices. If there is a Democratic Victory (partial or full) the impact on Gold prices would be limited. In case of a universal tariff under a Trump presidency, we would likely see lower Gold prices, while over the longer-term these moves would likely be reversed, ABN AMRO’s FX strategist Georgette Boele note.
Gold prices to fall if Republicans win
“The evolution of the Gold market from merely a safe haven and jewellery market to a market where investment decisions play a more crucial role is important. Indeed, since the introduction of Gold ETFs (March 2003) Gold has developed more into a speculative asset and behaved less as a safe haven asset. As a result, developments in the US Dollar, monetary policy and real yields have become dominant drivers over time.”
“Of course, there are still investors buying physical Gold for safe haven purpose but the flows into non-physical Gold have often been dominant. What do we expect for Gold prices under the different scenarios? If there is a Democratic Victory (partial or full) we think the Gold prices could be very modestly supported because we expect a modest decline in or a neutral USD and some lower real yields. We expect Gold prices to stay around $2,500 per ounce.”
“A Republican Victory brings more complicated dynamics. In the scenario of a full tariff implementation, we expect in the first years of the of the presidential term inflation to increase, the Fed to hike and the USD to rally because monetary policy divergence and weakness elsewhere. As a result, Gold prices will suffer, and Gold prices could decline below the 200-DMA and move towards $2,000 per ounce. Afterwards we expect the USD to weaken and real rates to come down. This will give room for Gold prices to rally again and move beyond the highs set earlier in 2024.”
- USD/JPY is rising on the back of a strengthening US Dollar as traders grow more optimistic about the US economic outlook.
- US employment data out this week will be key in their evaluations and will probably impact the pair.
- The Japanese Yen remains supported by a run of positive data and expectations the BoJ will soon raise interest rates.
USD/JPY is trading up a half a percent in the 146.90s on Monday as the US Dollar (USD) continues its recovery from the late August lows, whilst the Japanese Yen (JPY) treads water.
The US Dollar’s bounce gained some impetus after the release of July’s US Personal Consumption Expenditures (PCE) Price Index on Friday. The PCE is the Federal Reserve’s (Fed) preferred inflation gauge. The data showed that US inflation remained unchanged compared to the previous month and helped reassure investors that the US economy was probably not deccelerating as quickly as some had feared. In a “soft-landing” scenario the US Dollar is likely to hold its strength better than if the economy crashes.
USD/JPY may see its gains capped, however, as the JPY finds support from a run of strong data out of Japan. Capital expenditure by Japanese companies expanded by 7.4% in the second quarter, marking the thirteenth consecutive quarter of growth, data showed on Sunday. Jibun Manufacturing PMI, meanwhile, was revised up to 49.8 from 49.5 in August, moving closer to 50 above which it would mark expansion.
Data out last week further increased the chances of the Bank of Japan (BoJ) raising interest rates in the coming months, a move that would support the Japanese Yen by increasing foreign capital inflows. Annual flash Tokyo CPI ex fresh food for July came out at 2.4% compared to 2.2% in the previous month and beating expectations of 2.2%, according to data from the Statistics Bureau of Japan on Thursday. The Tokyo data suggested that Japan-wide inflation could show a similar rise.
Japan employment data, however, was not as strong. The Japanese Unemployment Rate unexpectedly rose to 2.7% in July from 2.5% in June.
Analysts at Capital Economics, however, dismissed the rise in unemployment saying “our conviction that the Bank (BoJ) will press ahead with another rate hike is growing.”
“The jump in the unemployment rate in July is a lagged response to the weakness in economic activity around the turn of the year,” said Marcel Thieliant, Head of Asia-Pacific at Capital Economics.
US employment data key for USD/JPY
Unlike the Yen, employment data could be key for the Dollar, however, after the Fed Chairman Jerome Powell highlighted risks to the labor market in his pivotal speech in Jackson Hole. Popwell stated that the risks to the labor market now outweighed risks from high inflation.
The week ahead sees a batch of US employment metrics released that will provide more detail on how bad the US employment situation is. These include ADP Employment Change, Initial and Continuing Jobless Claims and the main event – the US Bureau of Labor Statistics Nonfarm Payrolls (NFP) report for August, released on Friday.
If US employment data paints a negative picture of the labor market in the US it could prompt a sell-off in USD/JPY as the Dollar depreciates from traders pricing in steeper interest rate cuts from the Fed.
Currently the probabilities of the Fed making a large 0.50% cut at their September 18 meeting are still only about 30% with a 0.25% cut fully priced in, however, weak employment data could increase the chances of a larger cut with negative effects on USD pairs.
Friday was an exciting day for the Brazilian real. It began with the news that the Brazilian Central Bank (BCB) had intervened in the spot market to the tune of USD 1.5 billion to support the Brazilian real. The reason given by outgoing Governor Campos Neto was that the intervention was made to offset the effects of the regular rebalancing of the MSCI index. This is expected to lead to BRL outflows this month, Commerzbank’s FX strategist Michael Pfister notes.
BСB confuses market players
“We remain skeptical that the BCB is sending the right signal. Almost as if it wanted to make it clear that there was no fundamental reason for the intervention. The central bank chief tried to capture market expectations on Friday by stressing that any rate hikes would be ‘gradual’. Expectations had taken on a life of their own in recent months. The market is now pricing in just about 100 basis points of rate hikes over the next three months, with further hikes to follow.”
“Friday saw more news on the budget, although not too many details have been released yet, but it seems that policymakers are focusing on increasing revenues rather than reducing spending. This has caused some concern in the market. While the details of the budget plan remain to be seen, there are concerns that the authorities will not use the new budget to reassure the market, but rather to deliver a plan that is not yet fully developed.”
“The BCB later announced that it was offering additional FX swaps in its regular swap auction to sell an additional USD 1.5bn and support the BRL. It was not entirely clear whether the swap auction had been planned all along and was intended to work in conjunction with the original spot action, or whether it had been announced at short notice to capture the renewed BRL depreciation in response to Neto's comments and the budget hints.”
The Caixin manufacturing PMI for China rose somewhat unexpectedly this morning to 50.4 from 49.8 last month, but the market seems to be focusing on the official PMI. The official PMI was released on Saturday and showed a further decline in economic momentum, Commerzbank’s FX strategist Volkmar Baur notes.
The risk of deflation in China remains intact
“The decline in the official PMI was also broad-based. In the manufacturing sector, both production and new orders fell. In addition, both the subcomponents for the labor market and for price developments showed continued weakness. The price components suggest that producer prices fell quite sharply again in August on a month-on-month basis, which is likely to push the annual rate back towards -2.0%. The risk of deflation in China itself therefore remains, as does the disinflationary impetus for the rest of the world.”
“In order to limit the impact of the weak economy on government bonds yields, the PBoC began actively buying and selling government bonds in the market last week. This was done to lower the current interest rate at the short end and keep it high at the long end. The idea was to steepen the yield curve without withdrawing liquidity from the market as a whole. It seems that the central bank wants to prevent the current interest rates on long-term government bonds from falling further.”
“By supporting the interest rate level, the aim is to prevent the spread over 10-year US Treasuries from becoming too large, which would put pressure on the CNY. However, in this case, the timing would be suspect as the CNY has tended to appreciate against the US dollar recently. Another suspicion is that the PBoC wants to prevent the current yield on 30-year Chinese government bonds from falling below that of Japanese government bonds of the same maturity.”
The Dollar Index (DXY) faces resistance around 102.20 after its rebound from its 101.50 support level to 101.70 last week, DBS’ Senior FX Strategist Philip Wee notes.
DXY has a resistance at 102.20 before Friday’s US jobs report
”This Friday’s US monthly jobs report will likely affirm the Fed’s desire to prevent a further cooling in the US labour market. Although consensus sees US nonfarm payrolls rising to 165k in August from 114k in July, they remain below the 200k level. The unemployment rate should stay above 4% despite expectations for a decline to 4.2% from 4.3%.”
“Speaking after the jobs data, New York Fed President John Williams and Fed Governor Christopher Waller should support the Fed’s telegraphed rate cut at the FOMC meeting on September 18. Williams was one of the two Fed Presidents who voted to reduce the discount lending rate in July, according to last week’s Fed discount minutes.”
Brazil's central bank, BACEN, intervened on Friday to support the real, ING’s FX strategist Chris Turner notes.
BACEN intervenes on Friday to support the real
“BACEN said the move was to offset pressure on the real due to the rebalancing of the MSCI equity index which takes place today.”
“Yet the real was also under pressure after Friday saw the July primary budget deficit come in three times higher than expected. The news comes at a bad time for the Brazilian government as it remains under pressure to deliver fiscal consolidation into 2025.”
“The market is now pricing a 25bp Brazil rate hike for 18 September – the day that the Fed is expected to cut. That may help stabilise the real, but we remain concerned that with high levels of floating rate date, Brazil's challenge to roll its debt at 12% per annum rates will keep the real on the back foot.”
USD/CAD found support around 1.3450 ahead of the Bank of Canada’s third consecutive rate cut expected this week, DBS’ Senior FX Strategist Philip Wee notes.
BOC to pause after three consecutive rate cuts
“On September 4, we anticipate the overnight lending rate to fall another 25 bps to 4.25%. CPI core trimmed inflation extended its decline inside the official 1-3% target to 2.7% YoY in July, its lowest level since April 2021.”
“On September 6, consensus expects the August unemployment rate to keep rising to 6.5%, its highest level since January 2022. The Trudeau government has moved to protect Canadian jobs by halving the share of low-wage temporary foreign workers that employers can hire to 10% of their overall workforce, effective September 26.”
“However, Canada’s GDP growth surprised by accelerating a third quarter to an annualized 2.1% QoQ saar in 2Q24 vs. the 1.8% consensus; first quarter growth was also revised to 1.8% from 1.7%. Hence, we remain alert to any inclination by the BOC to pause after three consecutive rate cuts.”
- AUD/USD is at a critical level for the uptrend.
- Whilst a recovery is possible, more downside could also signal a reversal.
- The pair has reached the top of a range at a similar level to where it rotated in July.
AUD/USD has been in an uptrend all through August. It reached a new peak of 0.6824 on August 29 and then pulled back.
The correction so far is a three wave structure, perhaps an ABC correction, suggesting it is just a counter-trend reaction and the uptrend will probably resume.
If AUD/USD can close back above 0.6800 it will signal a continuation of the uptrend back up to the 0.6824 high first, then possibly higher.
AUD/USD 4-hour Chart
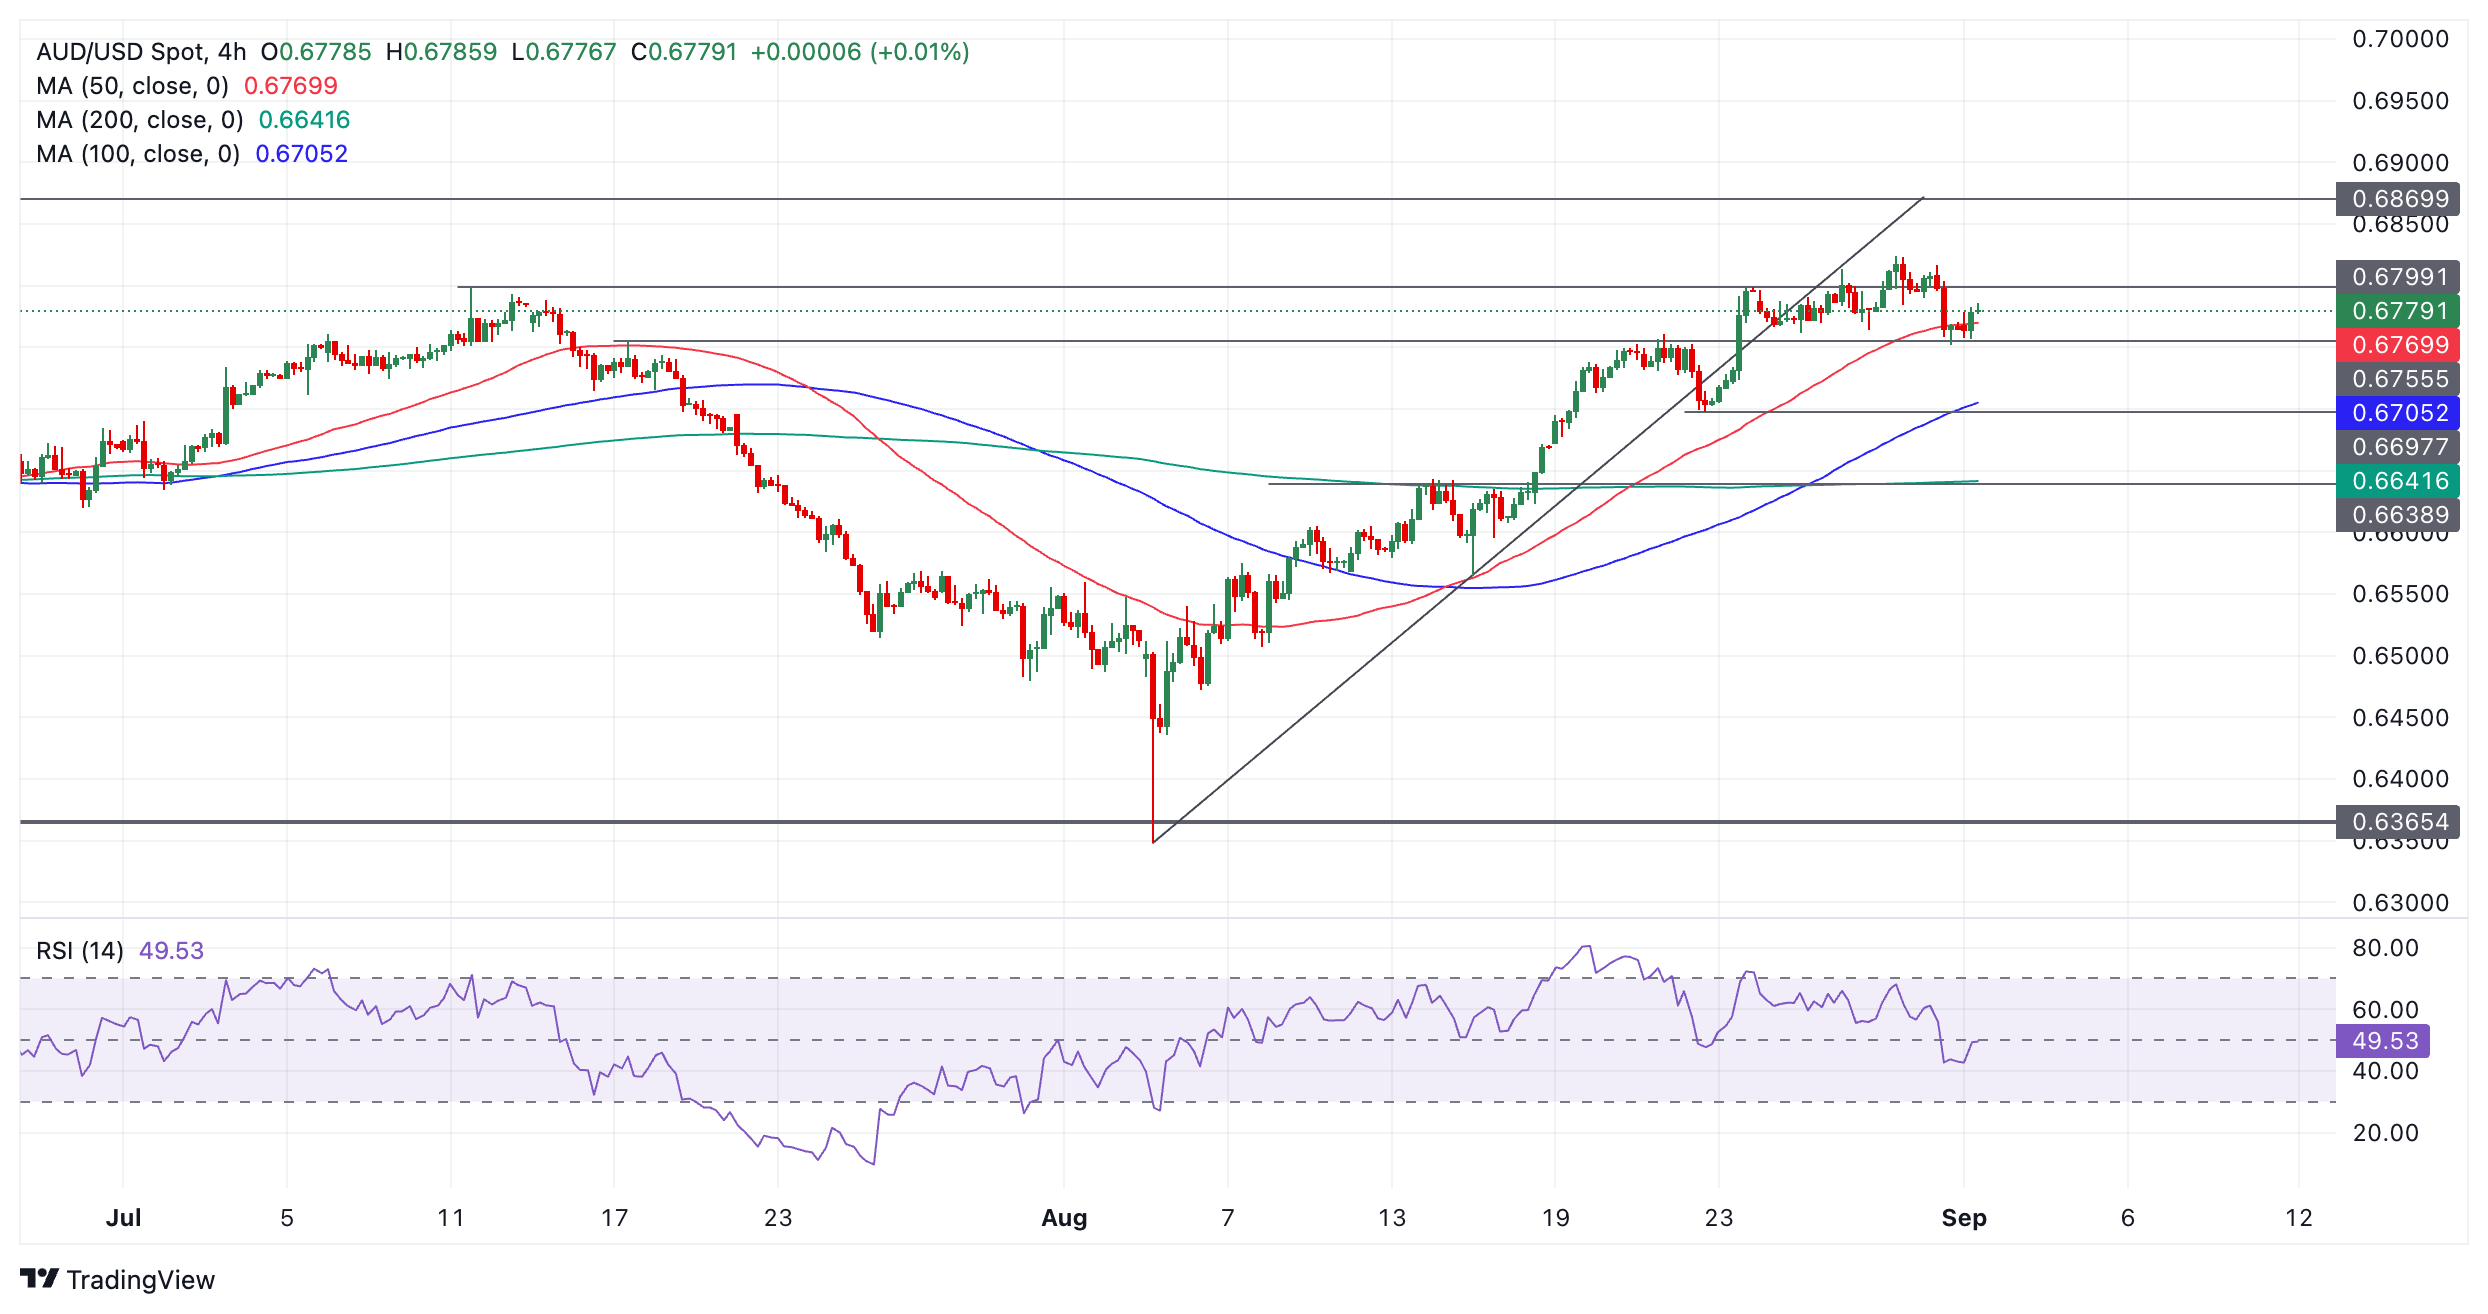
An extension lower, however, would bring into question this hypothesis and possibly suggest the correction might actually be the start of a new downtrend.
For confirmation price would need to close below 0.6751, (low of August 30). That would likely be followed by a move down to 0.6700-05 and the 200-period Simple Moving Average (SMA).
AUD/USD is a broad sideways range and it has retested resistance at the top of the range like it did in July. This could be another indication the short-term trend may be about to change and price could start declining again.
The Relative Strength Index (RSI) momentum indicator is in the lower half of its range. It is showing quite strong bearish momentum accompanied the pull back from the August 29 high.
The CEE region will become interesting again after a few rather quiet weeks. Today we will see PMIs in the region still confirming the pessimism in the industry. Tomorrow the Czech Republic will release second quarter wages where we expect a slight decline from 7.0% to 6.8% YoY in nominal terms, below Czech National Bank (CNB) expectations, ING’s FX strategist Frantisek Taborsky notes.
CEE FX seems fairly priced
“In Turkey, August inflation continues to fall from 61.8% to 51.9% YoY, according to our estimates, and in Hungary we will see the 2Q24 GDP breakdown. On Wednesday, we expect the National Bank of Poland to leave rates unchanged at 5.75% in line with market expectations. Thursday as usual will be followed by the National Bank of Poland governor's press conference. On Friday, the Czech Republic and Hungary will release industrial production for July and Romania's second quarter GDP breakdown.”
“Several speakers are also scheduled this week. On Thursday in Hungary, the finance minister and the central bank governor will speak at a local conference. Also in Hungary, there is a meeting of EU ministers in the second half of the week to discuss cohesion policy and EU money.”
“CEE FX seems fairly priced to us at the moment. On the negative side, EUR/USD has been going down in recent days which has not yet fully translated into CEE FX. On the other side, rate differentials remain the highest in several weeks which should keep CEE FX at stronger levels. Overall, we are slightly bullish on the CZK, which has been gradually heading below 25.00 EUR/CZK for the last few days, which has been our view for a long time. We are also slightly bullish on PLN, which is recovering from a quick sell-off last week. On the other hand, the HUF potential is hitting a ceiling in our view and we are more likely to see a EUR/HUF reversal to the upside here.”
- The British Pound is still in snooze mode on Monday.
- UK Manufacturing PMI comes in line with expectations at 52.5 in August.
- The US Dollar Index opens up steadily, with US markets closed for public holidays.
The British Pound (GBP) holds on to marginal gains during the European trading session on Monday, with US markets closed in observance of Labor Day. This means very slim volumes, even thinner than on a typical Monday. However, the UK market already had to digest the S&P Global/CIPS Purchasing Managers Index (PMI) for the manufacturing sector this morning, which fell in line as expected at 52.5.
Meanwhile, the US Dollar Index (DXY) – which gauges the value of the US Dollar against a basket of six foreign currencies – is still recovering from a chunky selloff over a week ago. Last week, though, the Greenback recovered on some strong US economic data, which might limit the initial rate cut from the US Federal Reserve (Fed) to only 25 basis points in September. With more PMI data set to come out this week and the US Jobs reports on Friday, it will all depend on this week’s data to confirm the interest rate cut size next week.
Daily digest market movers: A very slow start for all
- S&P Global released its Manufacturing Purchasing Managers Index (PMI) for August, coming at 52.5, the same pace as the previous month.
- US markets are closed in observance of Labor Day on Monday.
- The CME Fedwatch Tool shows a 69.0% chance of a 25 basis points (bps) interest rate cut by the Fed in September against a 31.0% chance for a 50 bps cut. Another 25 bps cut (if September is a 25 bps cut) is expected in November by 48.9%, while there is a 42.0% chance that rates will be 75 bps (25 bps + 50 bps) below the current levels and a 9.1% probability of rates being 100 (25 bps + 75 bps) basis points lower.
- Regarding the Bank of England (BoE), markets are pricing in no rate cut for the September 19 meeting, while the November 7 decision has an 87.2% near certainty of seeing the BoE cut rates by 25 basis points.
- The US 10-year benchmark rate trades at 3.90% and will not move on Monday due to the US bank holidays.
- The UK 10-year Gilt Benchmark trades at 4.06% and popped higher on Monday after closing at 4.01% on Friday.
- European equities are eking out more losses, losing over 1% on the day. The UK’s FTSE 100 is less negative and flirts with less than 0.5% of losses.
GBP/USD Technical Analysis: That is quite high
The British Pound trades phenomenally high, at levels not seen since July 2023 against the US Dollar. The recent retracement last week is more than welcome, and now traders who want to go long GBP/USD will need to identify support levels on where it makes sense to get in for a retest of at least the year-to-date high, near 1.3237, or 1.33 for a fresh high.
On the downside, the moving averages are too far for now to offer any kind of support. It is better to look at a bounce off the upper band of the trend channel that was well respected during the past six months, at around 1.3120. In case that level does not hold, 1.3044 looks to be a nice nearby platform that worked as a resistance in August. Should more downfall occur, the 55-day Simple Moving Average (SMA) at 1.2869 falls nicely in line with a pivotal level since June 2023 at 1.2849, just 20 pips away from each other as a strong support area.
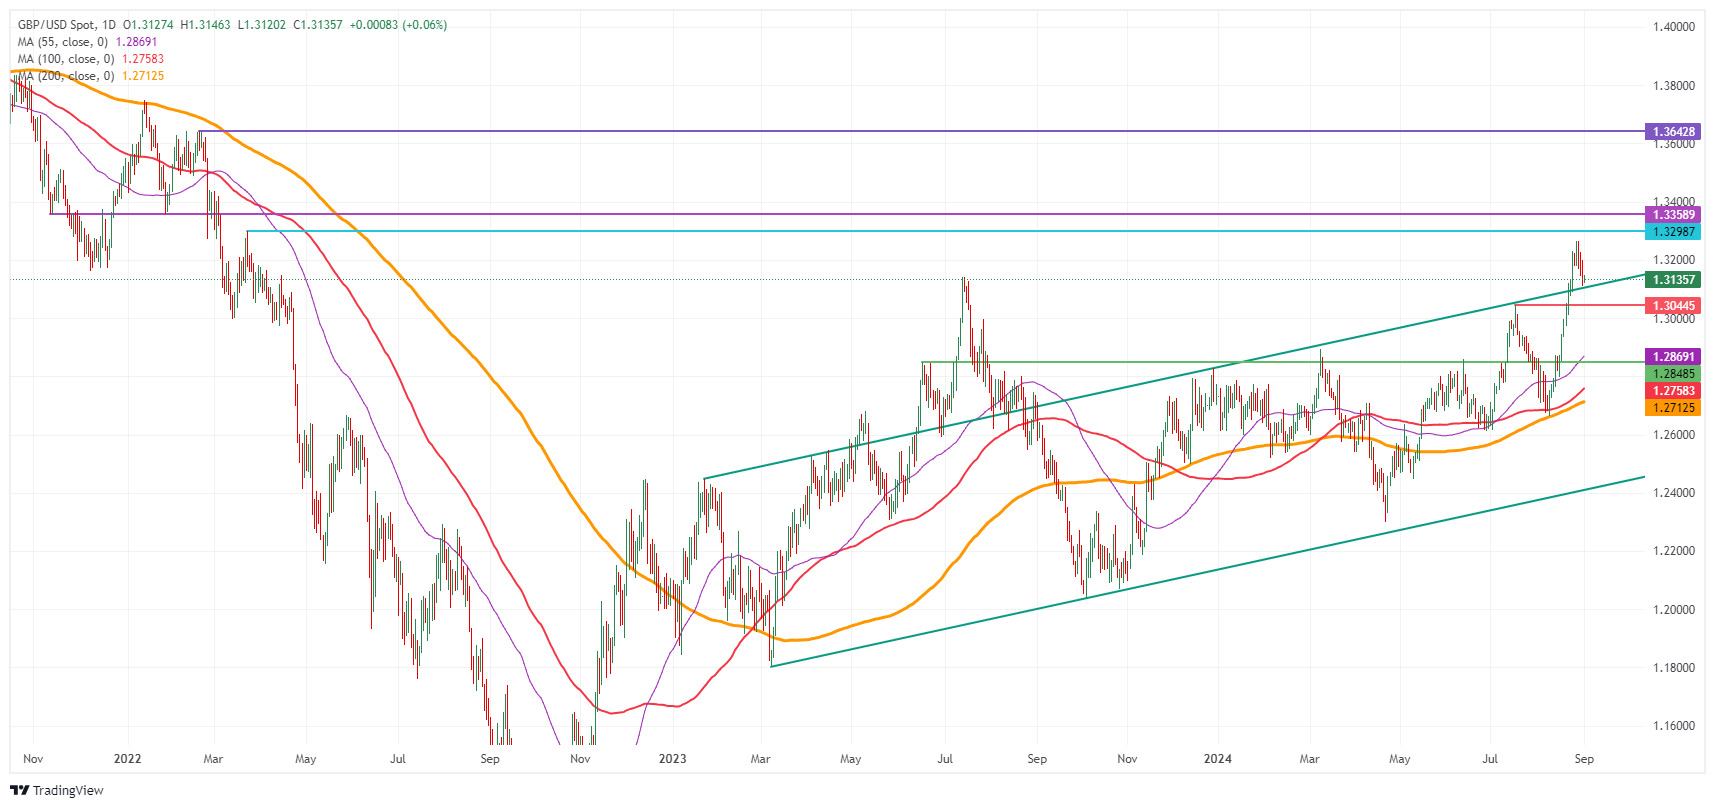
GBP/USD Daily Chart
UK gilt yields FAQs
UK Gilt Yields measure the annual return an investor can expect from holding UK government bonds, or Gilts. Like other bonds, Gilts pay interest to holders at regular intervals, the ‘coupon’, followed by the full value of the bond at maturity. The coupon is fixed but the Yield varies as it takes into account changes in the bond's price. For example, a Gilt worth 100 Pounds Sterling might have a coupon of 5.0%. If the Gilt's price were to fall to 98 Pounds, the coupon would still be 5.0%, but the Gilt Yield would rise to 5.102% to reflect the decline in price.
Many factors influence Gilt yields, but the main ones are interest rates, the strength of the British economy, the liquidity of the bond market and the value of the Pound Sterling. Rising inflation will generally weaken Gilt prices and lead to higher Gilt yields because Gilts are long-term investments susceptible to inflation, which erodes their value. Higher interest rates impact existing Gilt yields because newly-issued Gilts will carry a higher, more attractive coupon. Liquidity can be a risk when there is a lack of buyers or sellers due to panic or preference for riskier assets.
Probably the most important factor influencing the level of Gilt yields is interest rates. These are set by the Bank of England (BoE) to ensure price stability. Higher interest rates will raise yields and lower the price of Gilts because new Gilts issued will bear a higher, more attractive coupon, reducing demand for older Gilts, which will see a corresponding decline in price.
Inflation is a key factor affecting Gilt yields as it impacts the value of the principal received by the holder at the end of the term, as well as the relative value of the repayments. Higher inflation deteriorates the value of Gilts over time, reflected in a higher yield (lower price). The opposite is true of lower inflation. In rare cases of deflation, a Gilt may rise in price – represented by a negative yield.
Foreign holders of Gilts are exposed to exchange-rate risk since Gilts are denominated in Pound Sterling. If the currency strengthens investors will realize a higher return and vice versa if it weakens. In addition, Gilt yields are highly correlated to the Pound Sterling. This is because yields are a reflection of interest rates and interest rate expectations, a key driver of Pound Sterling. Higher interest rates, raise the coupon on newly-issued Gilts, attracting more global investors. Since they are priced in Pounds, this increases demand for Pound Sterling.
USD/SGD continued to trade a subdued range near recent lows, OCBC’s FX analyst Christopher Wong notes.
Bearish momentum on daily chart is waning
“RMB strength, broad USD softness are some factors that continued to underpin SGD strength to some extent. S$NEER was last estimated at ~1.85% above our model-implied mid, with implied lower bound at 1.3010.”
“S$NEER near the stronger side of its band somewhat suggests that additional gains in SGD may continue to “lose pace” vs. its peers although SGD may still appreciate vs a broadly softer USD.”
“USD/SGD was last at 1.3074. Bearish momentum on daily chart is waning while RSI rose from near oversold conditions. We remain somewhat cautious of rebound risks. Resistance here at 1.31 and 1.3210 (21 DMA). Support at 1.30, 1.2960 levels.”
USD/CNH traded a low of 7.0710 last Fri following the break below 7.10 psychological level, OCBC’s FX analyst Christopher Wong notes.
It’s appreciation time for USD/CNH
“Market chatters of exporters caught long USD, rushing to offload after the pair broke key levels and month-end distortion. Daily momentum is flat while RSI shows signs of turning higher near oversold conditions. Rebound risk is not ruled out but technical levels can be breached if the USD bear trend continues.”
“Ongoing market chatters of USD conversion flows from exporters, funds may see bigger slippage if there is a panic rush and typically the break of downside key level can accelerate this move. Potential unwinding of Trump bets/hedges may also be another driver adding to the sell-off in USD/CNH. Key support at 7.07/7.08. If broken puts next support at 7.03, 7 levels (major support). Resistance at 7.14.”
“We will also pay close attention to USD/CNY daily fix for gauge on how comfortable policymakers are with regards to the pace of RMB appreciation. Today’s fix was set at 7.1027 even though USD/CNH was trading around 7.09. This may imply that policymakers are trying to slow the pace of appreciation this time.”
Why should a currency trader in Connecticut or Singapore care how the people of Saxony or Thuringia vote in a regional election? At first glance, this seems far-fetched. And so, it is not surprising at first glance that the currency market started this morning with exactly the same EUR levels at which trading ended on Friday, Commerzbank’s Head of FX and Commodity Research Ulrich Leuchtmann notes.
German state elections don’t move the markets, yet
“If you think about it a little bit further, it's no longer so clear. You don't have to imagine a scenario of EU-skeptical to EU-hostile parties in Germany getting ever stronger (although this is likely to be gradually more convincing today than it was recently). Even now, in some political fields, the strengthening of these political movements is forcing the established political parties – who fear further voter losses – to make concessions.”
“Therefore, one might rightly ask whether, in the hypothetical case of a new eurozone crisis, a German government would be willing to implement a rescue policy à la 2010/12. Of course, a new eurozone crisis is not currently on the cards. Nevertheless, should the lack of crisis-fighting mechanisms not increase the risk premium for EUR positions at all times? And, as long as Bunds are the eurozone's safe haven, there is hardly any chance of a government-organized rescue without Germany's participation.”
“But we should bear in mind that in 2012 it was not governments that ultimately succeeded in combating the crisis. The redemptive “whatever it takes” had to come from the ECB. It is the ECB that provides the backstop which prevents a critical escalation in the sovereign bond market. And because its promise is credible, such crises do not even arise. As long as the currency market believes that this will not change even when EU-critical parties get stronger, it has no reason to reevaluate the euro due to some election results.”
The Australian Dollar (AUD) fell on growth concerns in China (weaker NBS PMI seen over the weekend), softer iron ore prices while USD broadly rebounded, OCBC’s FX analyst Christopher Wong notes.
AUD may suffer a corrective pullback in the near term
The move lower remains in line with our technical caution for the pullback lower. Pair was last at 0.6783 levels. Bullish momentum on daily chart is fading while RSI eased from near overbought conditions. We remain cautious of a corrective pullback in the near term.
Support at 0.6730, 0.6660. Resistance at 0.6830, 0.6870. Data focus this week on 2Q GDP (Wed). A softer print may see AUD come under pressure.
- The US Dollar trades broadly stable at levels near Friday’s close.
- US markets are closed on Monday due to the Labor Day holiday.
- The US Dollar Index resides in the higher 101.00 region.
The US Dollar (USD) sidelines on Monday with a very mixed picture on the quote board against most major currencies. The US Dollar kicks off this week with a calm due to the Labor Day holiday in the US, but the economic calendar will be picking up speed towards the main event on Friday. The first Friday of the month will bring the US Jobs Report, with the Nonfarm Payrolls and other wage data for markets to move on.
Apart from the all-important payroll data, the calendar will also feature the Purchasing Managers Index (PMI) data, which tends to move markets as it gives fresh clues about the state of the economy. This could mean that the US Dollar Index might have moved already substantially ahead of Friday’s main event.
Daily digest market movers: Take it easy
- US markets are closed on Monday in observance of Labor Day.
- China has warned Japan over economic retaliation over potential chip curbs, according to Bloomberg.
- On Saturday, the release of China’s Purchasing Managers Index numbers for August signaled that the contraction in the country’s manufacturing sector persists. The PMI came in at 49.1, lower than the 49.4 seen a month earlier.
- Equities are struggling across the board, with minor losses for all European indices and US futures on the back foot as well.
- The CME Fedwatch Tool shows a 69.0% chance of a 25 basis points (bps) interest rate cut by the Fed in September against a 31.0% chance for a 50 bps cut. Another 25 bps cut (if September is a 25 bps cut) is expected in November by 48.9%, while there is a 42.0% chance that rates will be 75 bps (25 bps + 50 bps) below the current levels and a 9.1% probability of rates being 100 (25 bps + 75 bps) basis points lower.
- The US 10-year benchmark rate trades at 3.90% and will not move as bond trading in the US is closed on Monday.
US Dollar Index Technical Analysis: A big fail
Pure technical traders, those who do not look at data or take no headline risk, will tell you that the US Dollar Index (DXY) failed to deliver on Friday. Although the recovery looked solid, the DXY closed below 101.90, which could mean more trouble ahead. A rejection could now take place, stalling the recovery rally, pushing down the DXY back towards 100.62 from a pure technical trading point of view.
Looking up, 101.90 still remains the first level to reclaim. A steep 2% uprising would be needed to get the index to 103.18. A very heavy resistance level near 104.00 not only holds a pivotal technical value, but it also bears the 200-day Simple Moving Average (SMA) as the second heavyweight to cap price action.
On the downside, 100.62 (the low from December 28) holds as support, although it looks rather feeble. Should it break, the low from July 14, 2023, at 99.58 will be the ultimate level to look out for. Once that level gives way, early levels from 2023 are coming in near 97.73.
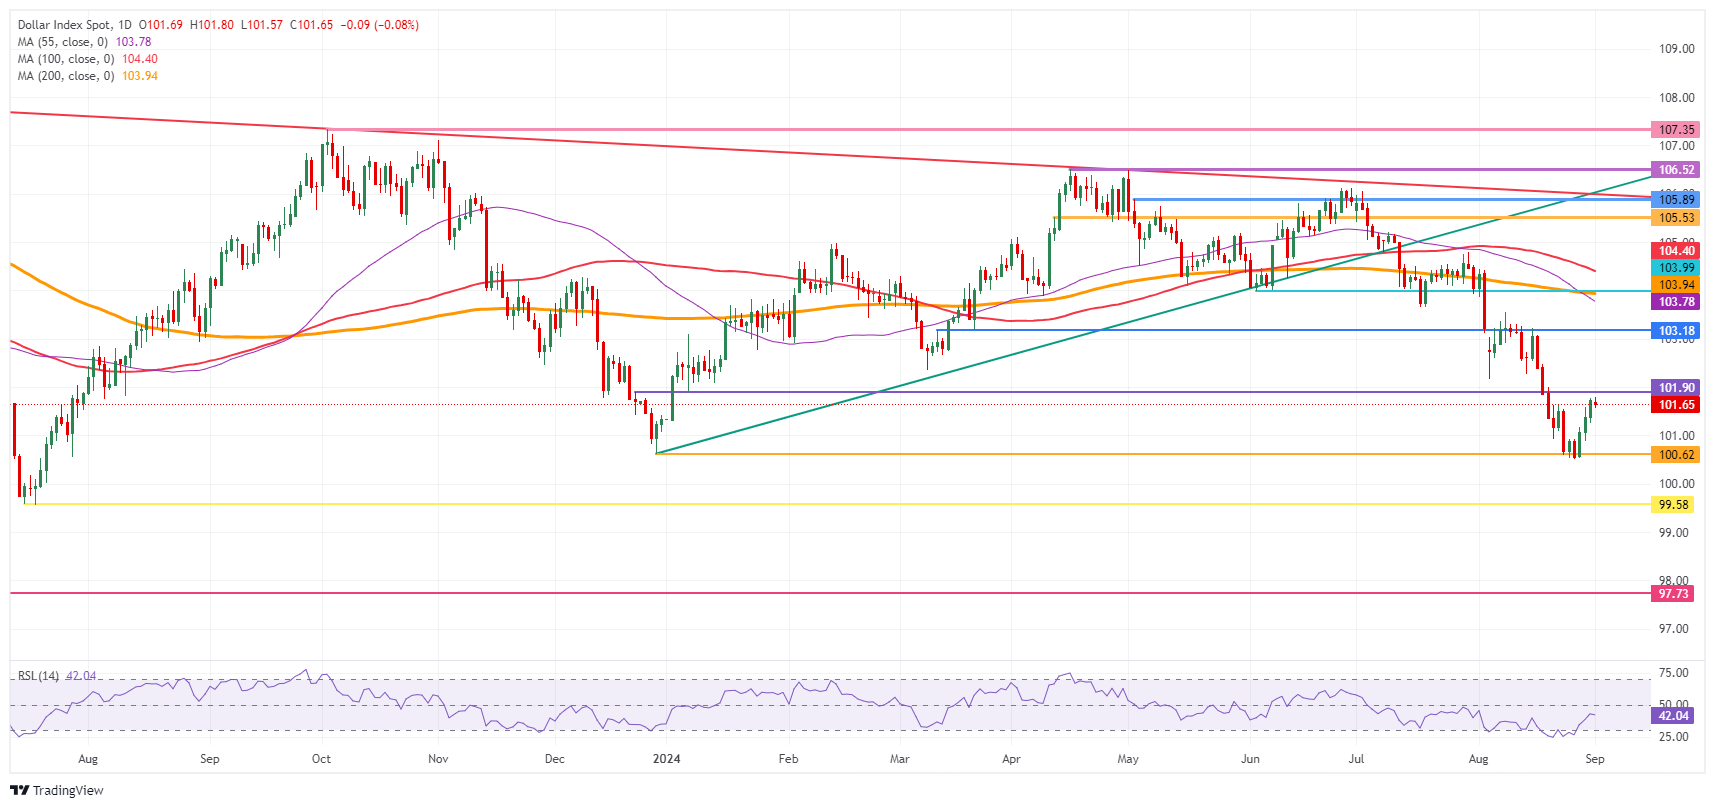
US Dollar Index: Daily Chart
US Dollar FAQs
The US Dollar (USD) is the official currency of the United States of America, and the ‘de facto’ currency of a significant number of other countries where it is found in circulation alongside local notes. It is the most heavily traded currency in the world, accounting for over 88% of all global foreign exchange turnover, or an average of $6.6 trillion in transactions per day, according to data from 2022. Following the second world war, the USD took over from the British Pound as the world’s reserve currency. For most of its history, the US Dollar was backed by Gold, until the Bretton Woods Agreement in 1971 when the Gold Standard went away.
The most important single factor impacting on the value of the US Dollar is monetary policy, which is shaped by the Federal Reserve (Fed). The Fed has two mandates: to achieve price stability (control inflation) and foster full employment. Its primary tool to achieve these two goals is by adjusting interest rates. When prices are rising too quickly and inflation is above the Fed’s 2% target, the Fed will raise rates, which helps the USD value. When inflation falls below 2% or the Unemployment Rate is too high, the Fed may lower interest rates, which weighs on the Greenback.
In extreme situations, the Federal Reserve can also print more Dollars and enact quantitative easing (QE). QE is the process by which the Fed substantially increases the flow of credit in a stuck financial system. It is a non-standard policy measure used when credit has dried up because banks will not lend to each other (out of the fear of counterparty default). It is a last resort when simply lowering interest rates is unlikely to achieve the necessary result. It was the Fed’s weapon of choice to combat the credit crunch that occurred during the Great Financial Crisis in 2008. It involves the Fed printing more Dollars and using them to buy US government bonds predominantly from financial institutions. QE usually leads to a weaker US Dollar.
Quantitative tightening (QT) is the reverse process whereby the Federal Reserve stops buying bonds from financial institutions and does not reinvest the principal from the bonds it holds maturing in new purchases. It is usually positive for the US Dollar.
- EUR/USD rises as investors continue to price in the possibility the US economy may be slowing rapidly.
- The chances remain high that the Federal Reserve might have to make steep cuts to interest rates, weighing on the USD.
- The Euro gains support as interest rates in the Eurozone could stay higher for longer due to persistent wage inflation.
EUR/USD trades higher by about a quarter of a percent in the 1.1070s on Monday, as the Euro (EUR) strengthens against the US Dollar (USD) on the back of still-high probabilities the Federal Reserve (Fed) could implement a sharp cut in interest rates at their September meeting. This, in turn, weighs on the USD because lower interest rates make it less attractive to foreign investors, lowering capital inflows.
EUR/USD mildly higher on survival of chances of half-a-percent rate cut
EUR/USD edges higher as traders attempt to assess the future path of interest rates in the US. The probability that the Fed could cut the fed funds rate by 0.50% – to a range between 4.75% and 5.00% – at their September 18 meeting remains above 30% whilst the chances of a 0.25% reduction is fully priced in, according to the CME FedWatch Tool. The still fairly high chance of a 0.50% “mega cut” remains a headwind for the Greenback and supports EUR/USD.
US inflation data out on Friday showed the Personal Consumption Expenditures (PCE) Price Index remained unchanged at 2.5% in July, with core PCE still at 2.6%. Expectations had been for them both to rise a basis point. The data might have slightly eased concerns the US economy could be heading for a hard landing. Still, it will not be until US employment data comes out this week that investors will have all the “test results in for the patient” and can confidently assess what the Fed is likely to do. Friday’s Nonfarm Payrolls data for August will be particularly key in this respect.
EUR/USD recovers after Eurozone inflation data keeps investors guessing
The previous week was volatile for the Euro. German and Spanish annualized preliminary Consumer Price Index (CPI) data for August showed on Thursday inflation falling lower than the previous month and missing expectations, and this initially caused some weakness in the single currency as investors started to price a steeper fall in interest rates. However, when Eurozone-wide data was released the day after – at 2.2% and 2.8% for core – although they fell, they met economists’ expectations, helping the Euro to recover.
The data failed to alter perceptions that the European Central Bank (ECB) will reduce interest rates in Europe at a steady and cautious pace, which contrasts with the still relatively high chance of a steeper rate-cut trajectory in the US.
“Headline inflation dropped to 2.2% y/y in August – the closest it has been to the ECB’s inflation target since 2021 – but risks remain: Wage growth remains high and will keep core inflation sticky for the rest of this year,” said on Friday Anders Svendson, Chief Analyst at Nordea Bank.
Wages in the Eurozone are expected to continue rising strongly in the second half of 2024 before easing in 2025-2026, said ECB Executive Board Member Philip Lane in a recent speech. In the short term, this is likely to put upside pressure on inflation which, in turn, is likely to keep the ECB cautious and data-dependent regarding interest rates – a supportive factor for EUR/USD.
Technical Analysis: EUR/USD rolls over into a short-term downtrend
EUR/USD has established a declining sequence of peaks and troughs since peaking at 1.1202 on August 26. This sequence probably indicates the pair is in a short-term downtrend and, since “the trend is your friend,” odds now probably favor lower prices to come.
EUR/USD 4-hour Chart
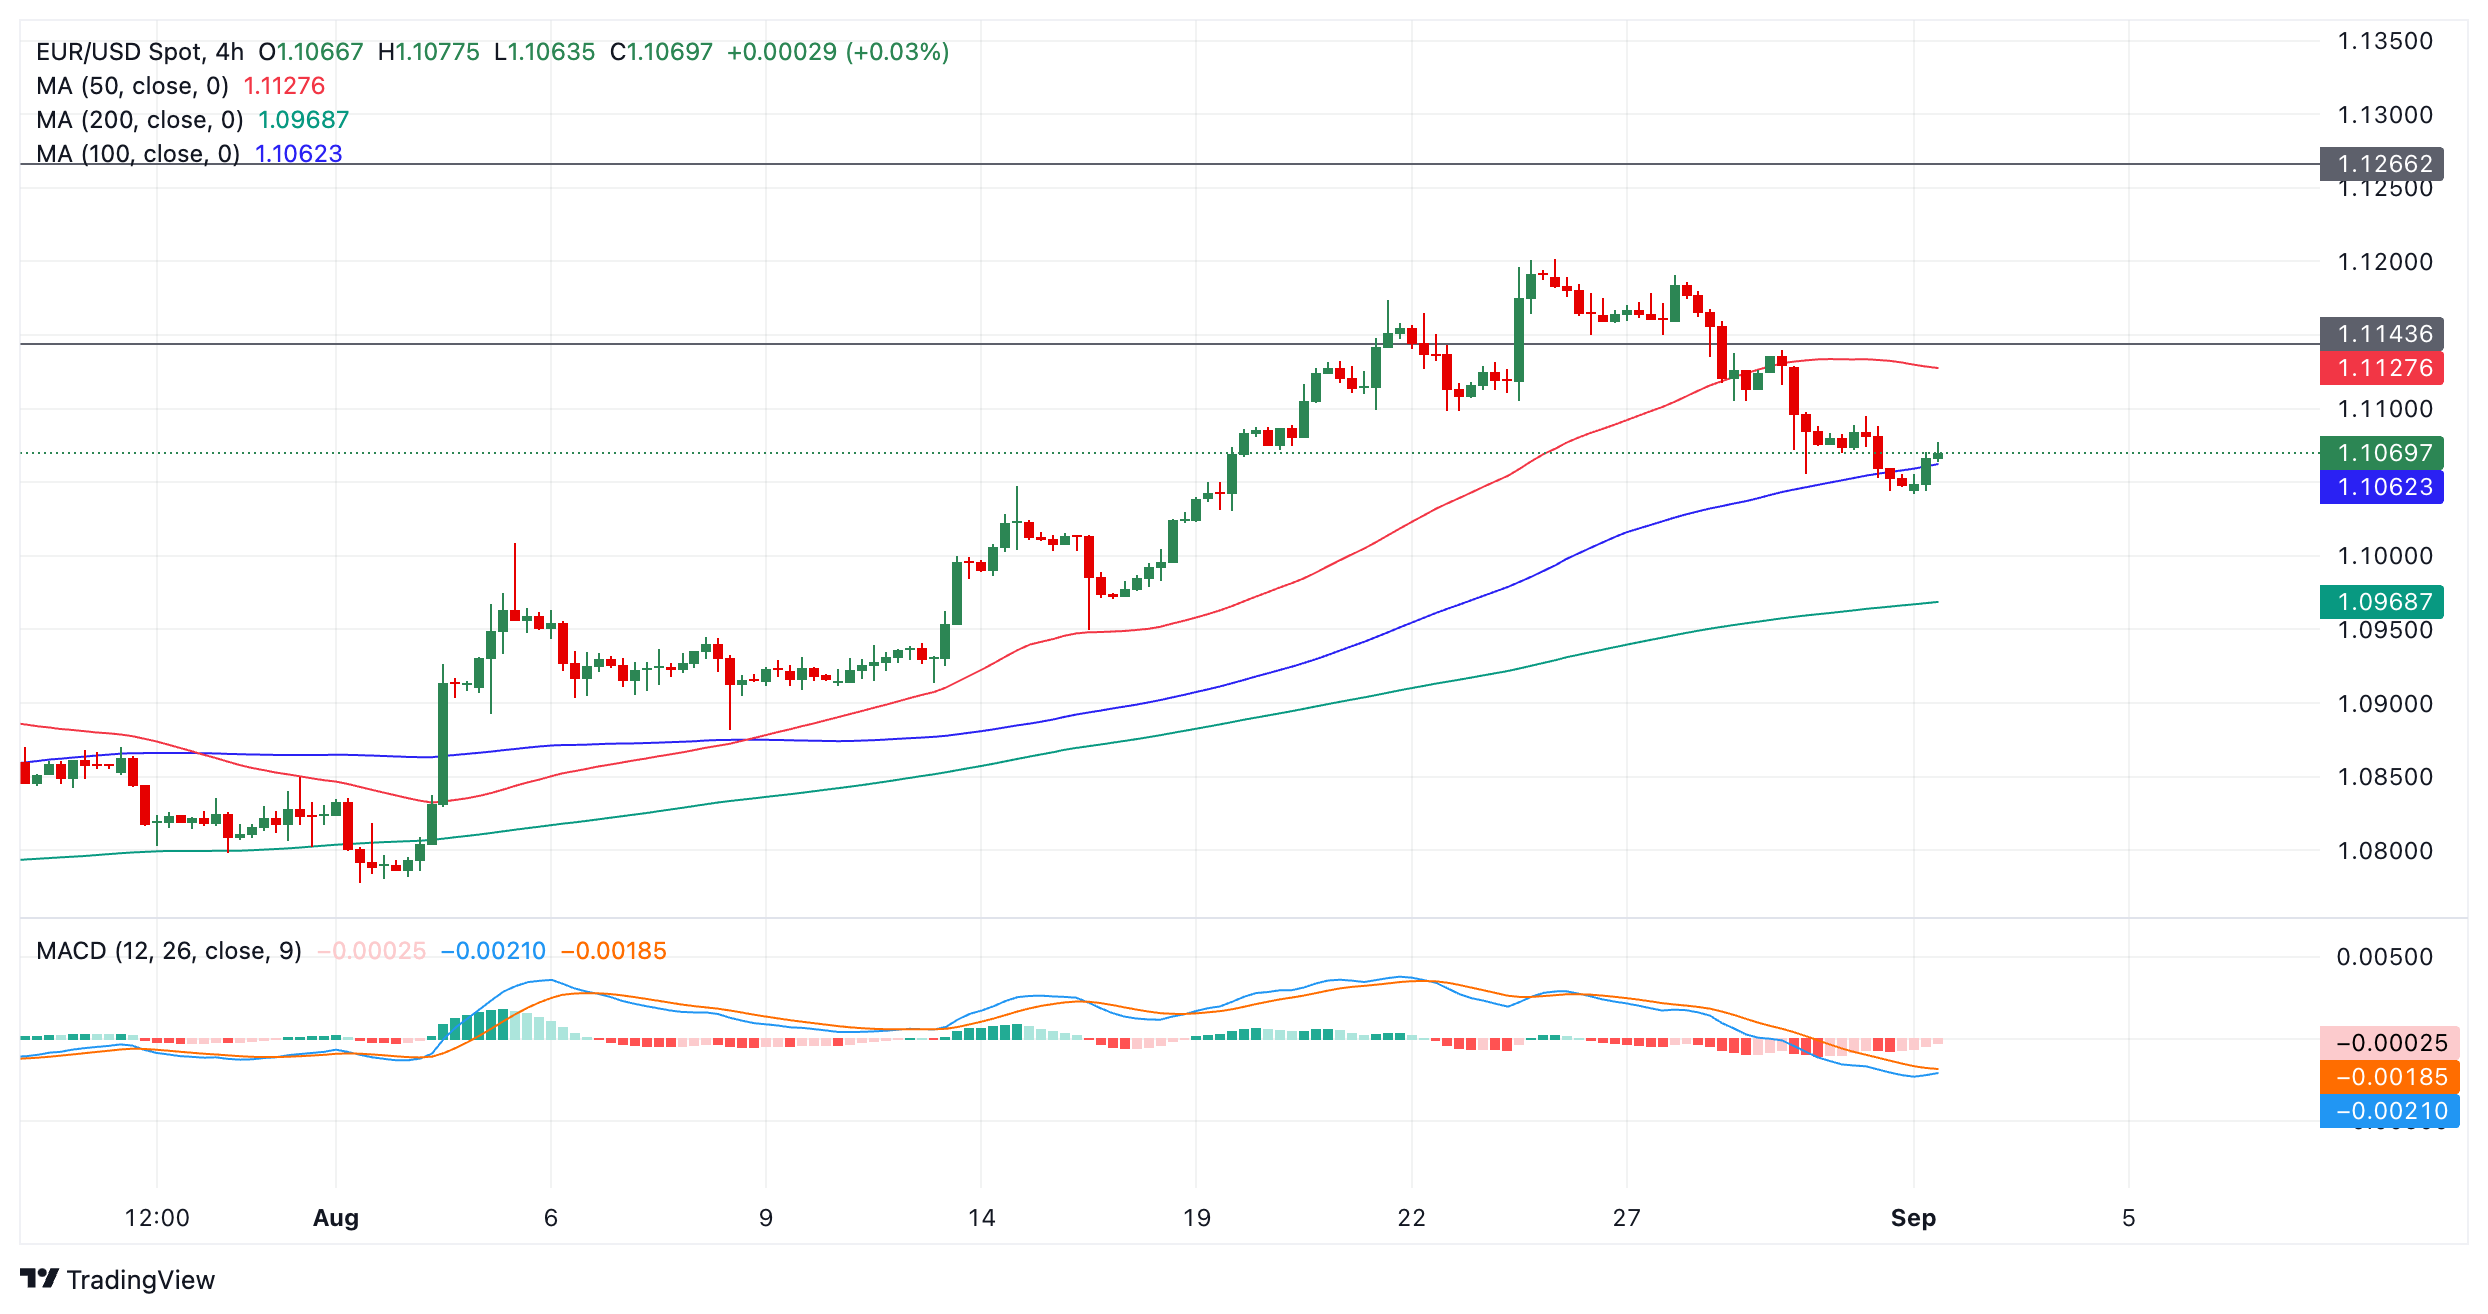
A break below 1.1040 would provide added confirmation of more downside, to a potential initial target at 1.1000, a psychological level of support.
Conversely, a close above 1.1100 would bring the short-term downtrend into doubt and suggest the possibility of higher prices.
EUR/USD Daily Chart
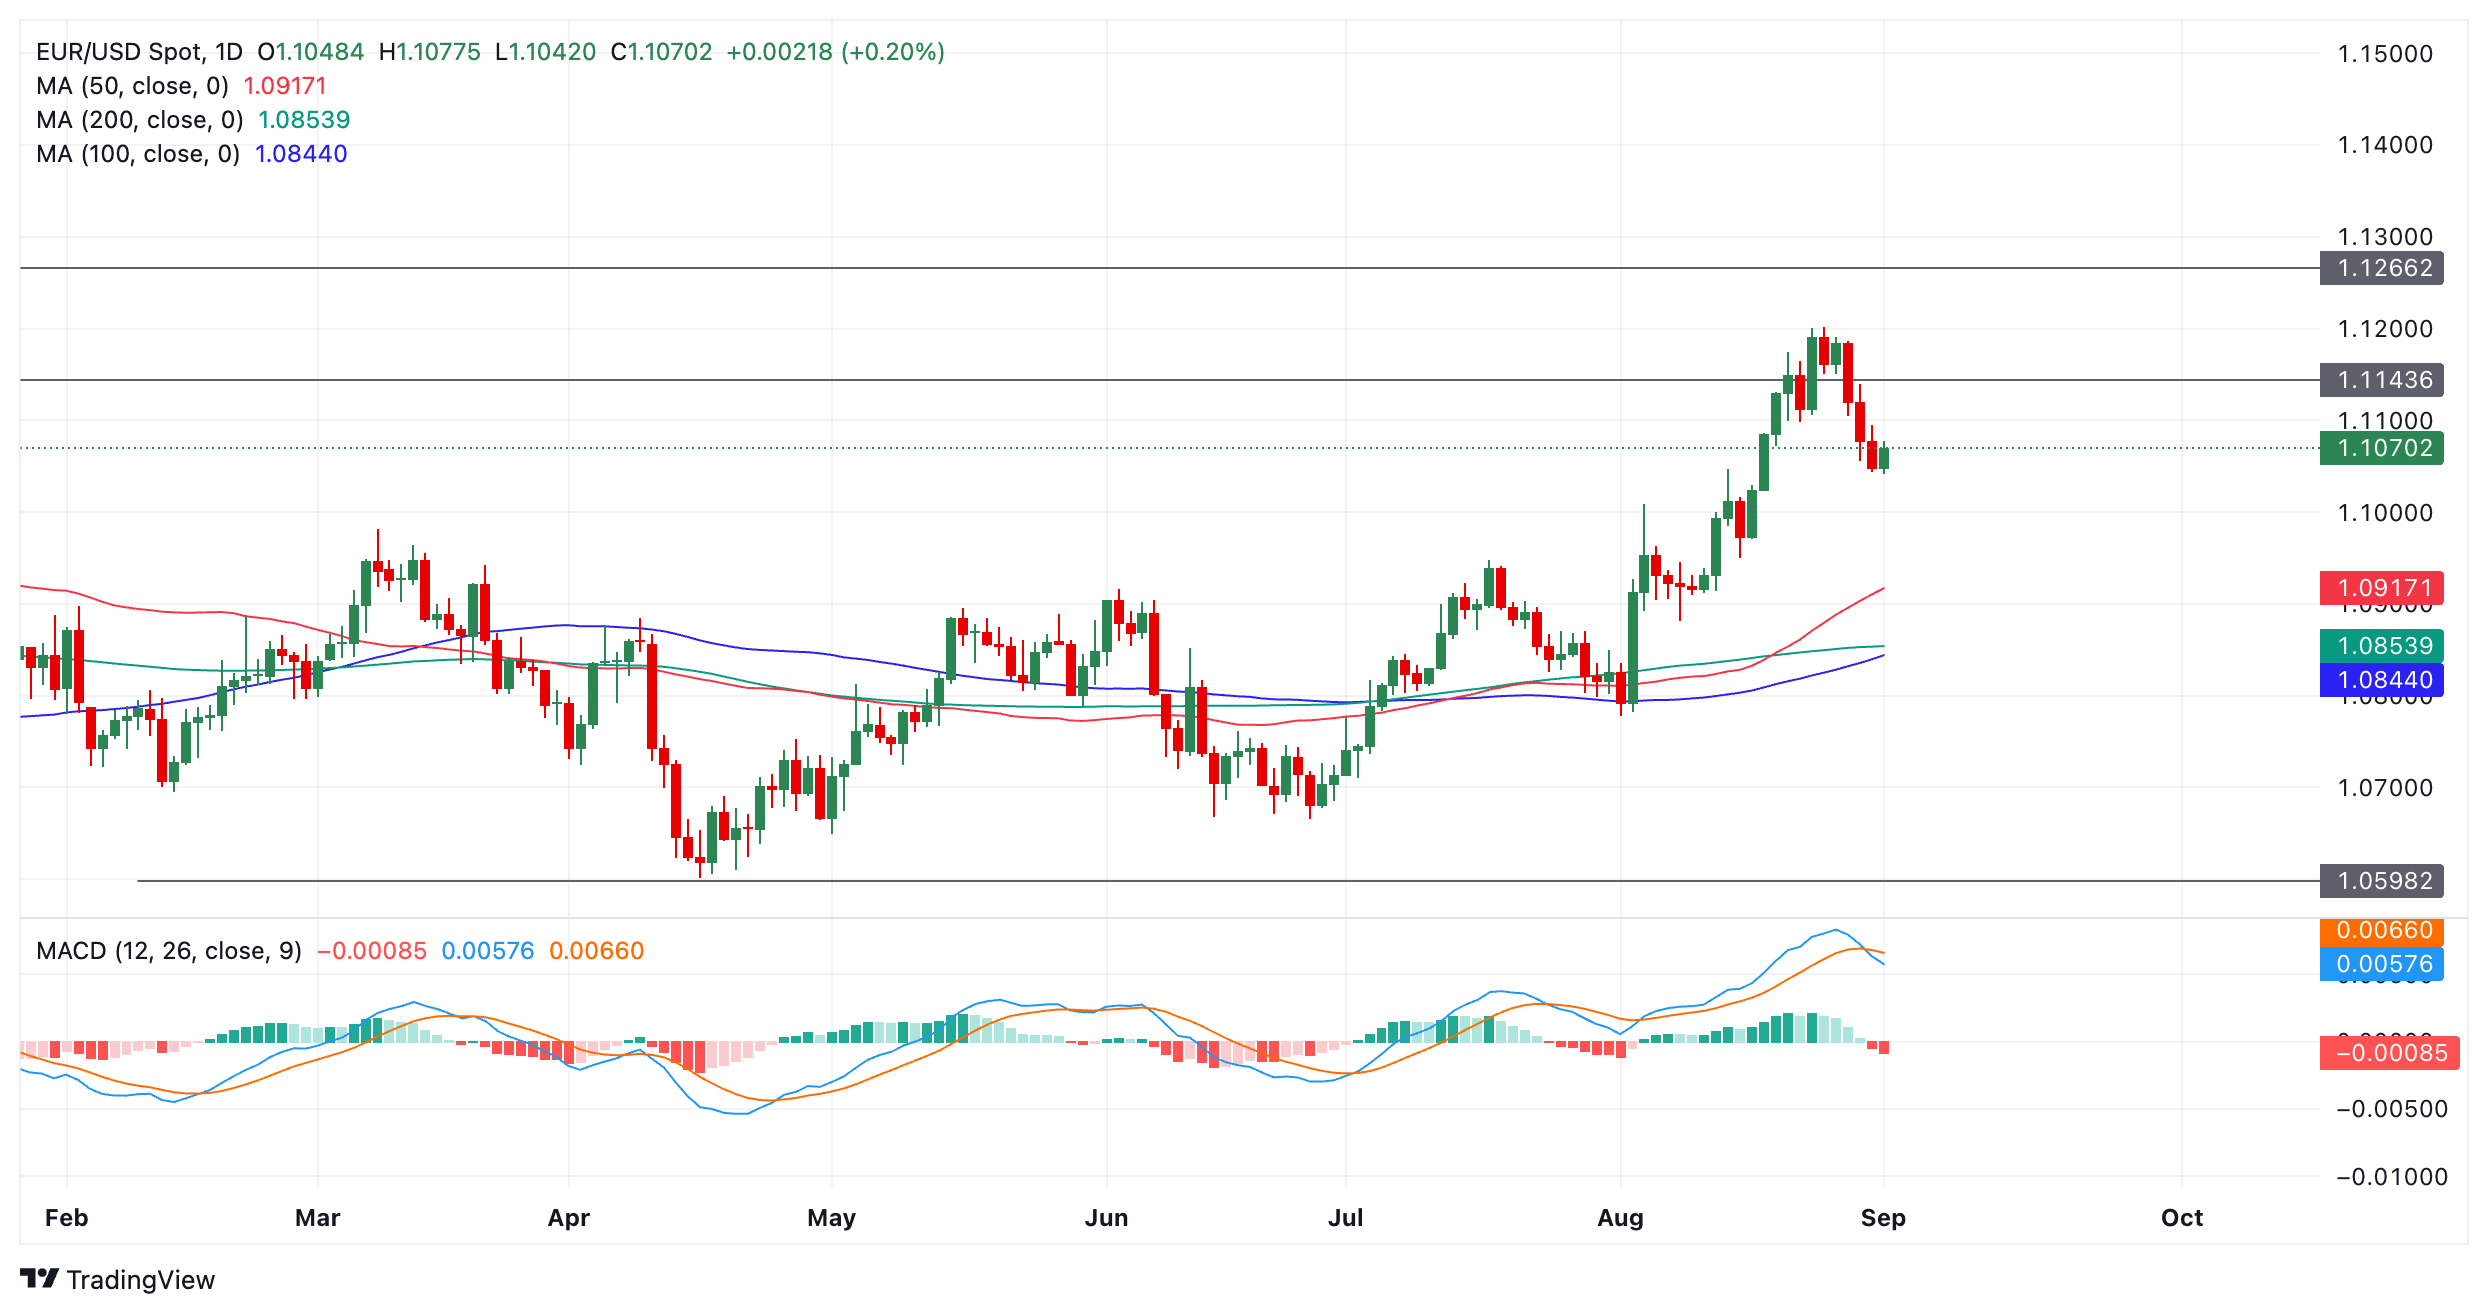
The daily chart shows that the Moving Average Convergence Divergence (MACD) momentum indicator has crossed below its signal line, further indicating the possibility a new down move is evolving.
EUR/USD Weekly Chart
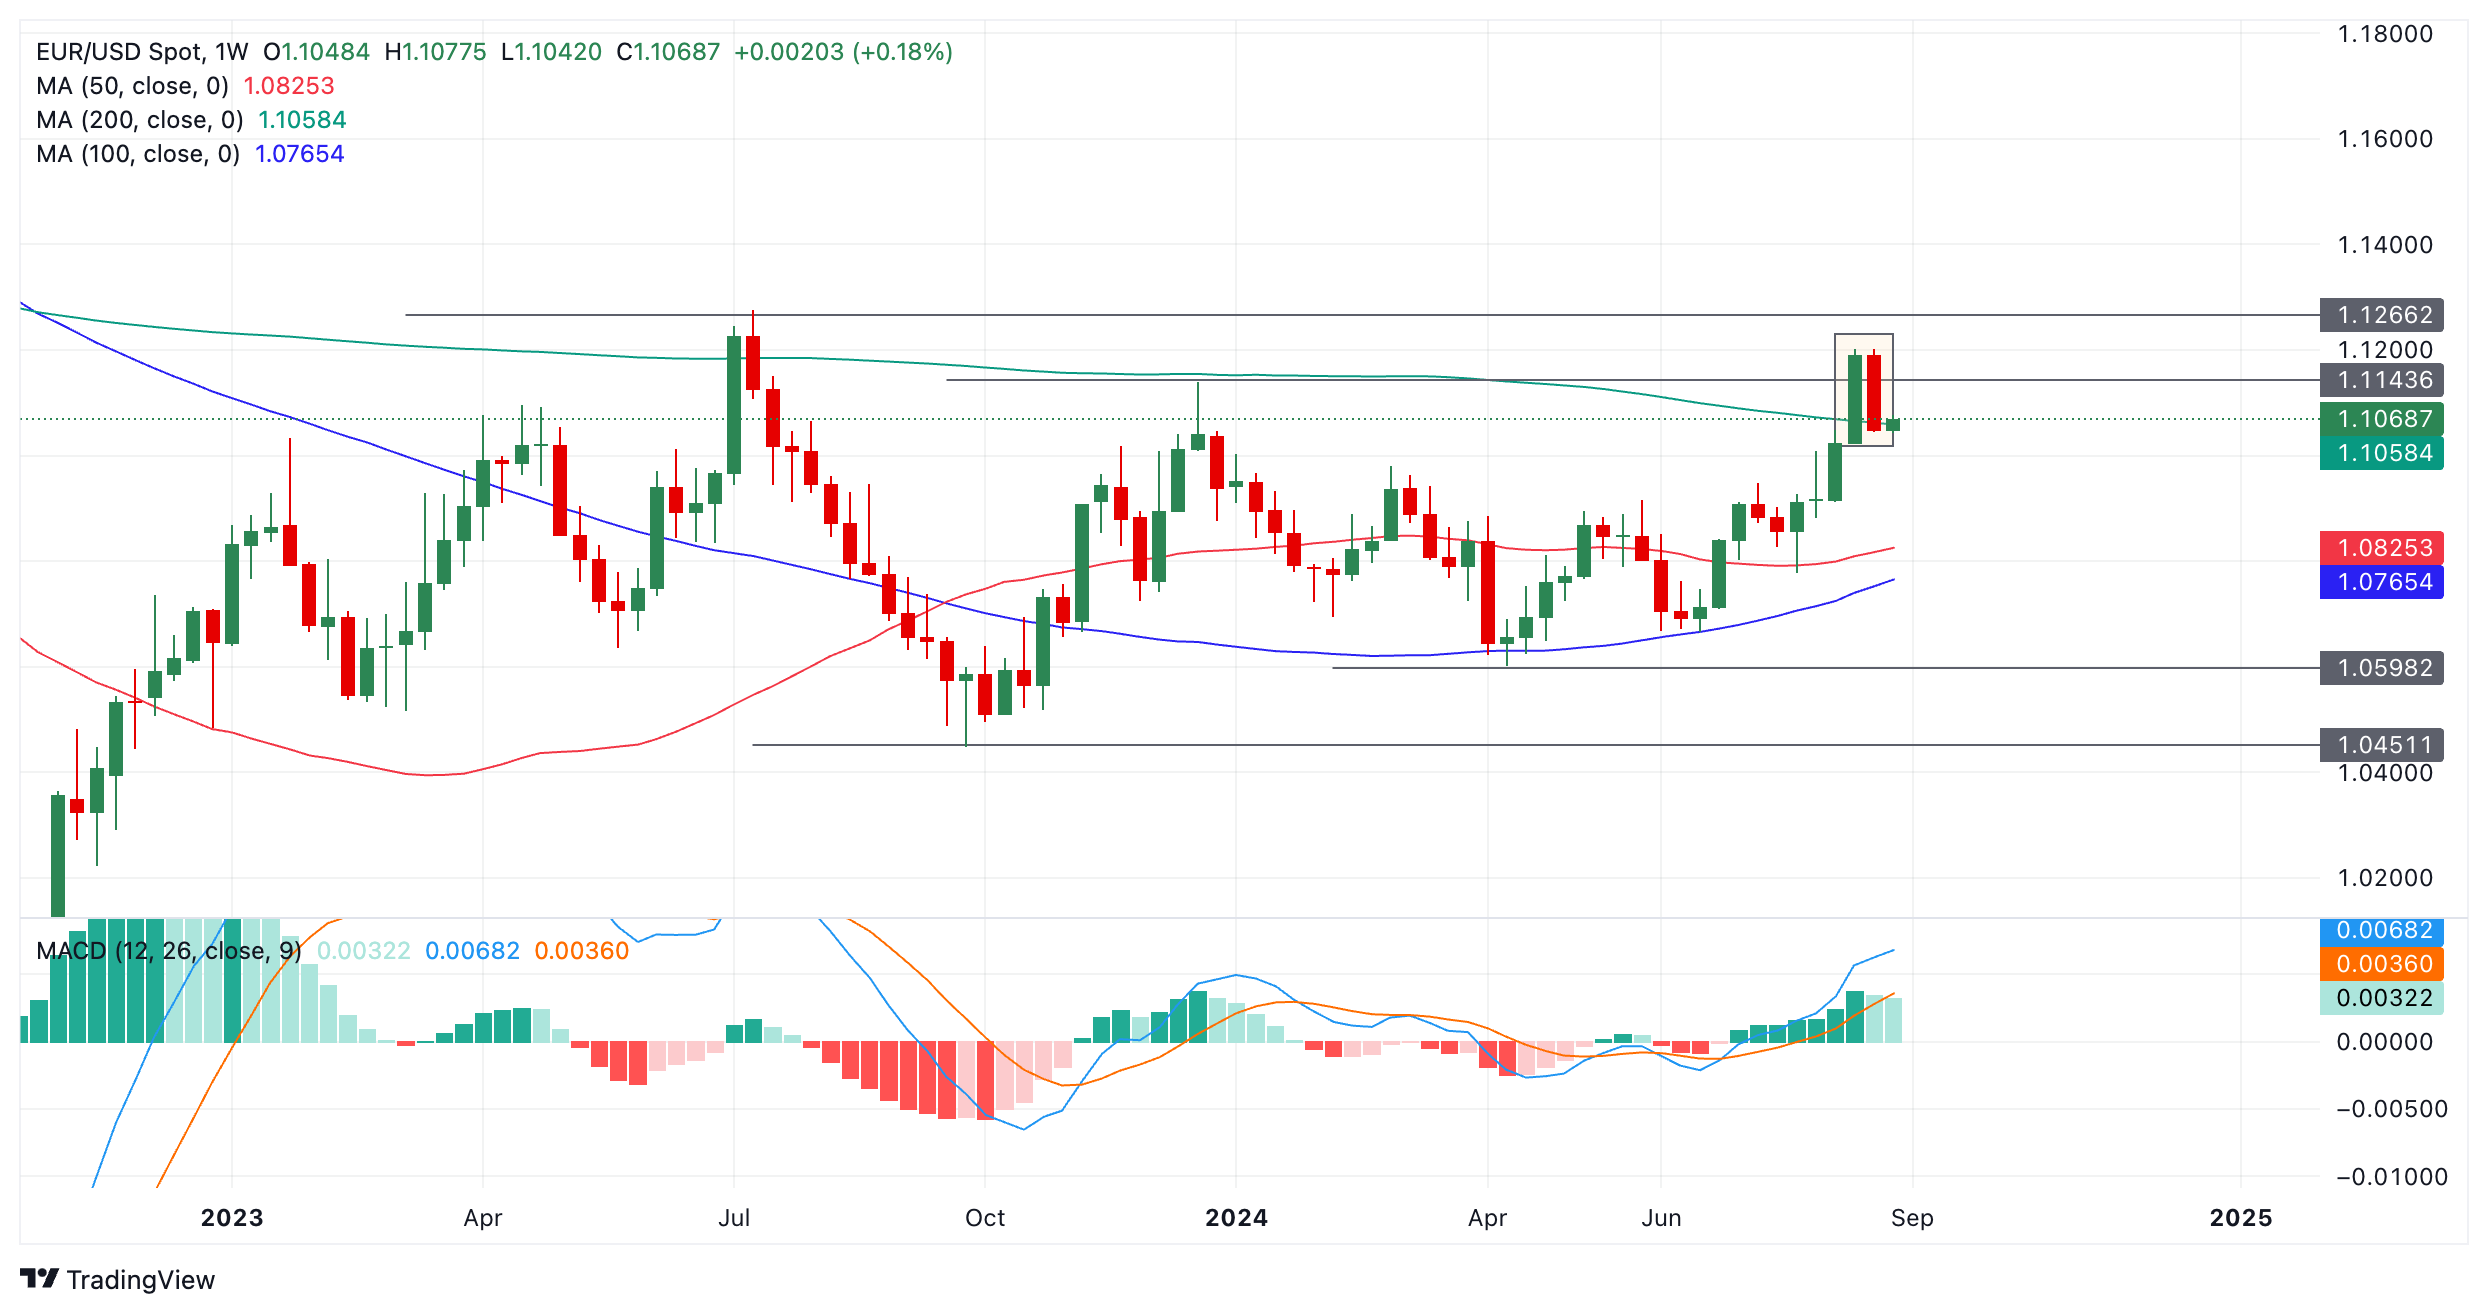
The weekly chart shows a bearish Two-Bar reversal pattern formed at the recent August highs (shaded rectangle). These occur when a long green-up week is followed by a similar-length red-down week. The pattern is a reliable indication of a reversal in the trend. The fact it formed at the 200-week Simple Moving Average level adds further evidence of a possibility of a move lower developing.
Euro FAQs
The Euro is the currency for the 20 European Union countries that belong to the Eurozone. It is the second most heavily traded currency in the world behind the US Dollar. In 2022, it accounted for 31% of all foreign exchange transactions, with an average daily turnover of over $2.2 trillion a day. EUR/USD is the most heavily traded currency pair in the world, accounting for an estimated 30% off all transactions, followed by EUR/JPY (4%), EUR/GBP (3%) and EUR/AUD (2%).
The European Central Bank (ECB) in Frankfurt, Germany, is the reserve bank for the Eurozone. The ECB sets interest rates and manages monetary policy. The ECB’s primary mandate is to maintain price stability, which means either controlling inflation or stimulating growth. Its primary tool is the raising or lowering of interest rates. Relatively high interest rates – or the expectation of higher rates – will usually benefit the Euro and vice versa. The ECB Governing Council makes monetary policy decisions at meetings held eight times a year. Decisions are made by heads of the Eurozone national banks and six permanent members, including the President of the ECB, Christine Lagarde.
Eurozone inflation data, measured by the Harmonized Index of Consumer Prices (HICP), is an important econometric for the Euro. If inflation rises more than expected, especially if above the ECB’s 2% target, it obliges the ECB to raise interest rates to bring it back under control. Relatively high interest rates compared to its counterparts will usually benefit the Euro, as it makes the region more attractive as a place for global investors to park their money.
Data releases gauge the health of the economy and can impact on the Euro. Indicators such as GDP, Manufacturing and Services PMIs, employment, and consumer sentiment surveys can all influence the direction of the single currency. A strong economy is good for the Euro. Not only does it attract more foreign investment but it may encourage the ECB to put up interest rates, which will directly strengthen the Euro. Otherwise, if economic data is weak, the Euro is likely to fall. Economic data for the four largest economies in the euro area (Germany, France, Italy and Spain) are especially significant, as they account for 75% of the Eurozone’s economy.
Another significant data release for the Euro is the Trade Balance. This indicator measures the difference between what a country earns from its exports and what it spends on imports over a given period. If a country produces highly sought after exports then its currency will gain in value purely from the extra demand created from foreign buyers seeking to purchase these goods. Therefore, a positive net Trade Balance strengthens a currency and vice versa for a negative balance.
The morning starts with much focus on German state elections. This is the first state election win for an extreme right-wing party since the Second World War, ING’s FX strategist Chris Turner notes.
The 1.1040 support is under threat of breaching
“The main fall-out, however, will be felt by the very poor results of the ruling federal coalition and whether they have any plans to boost spending into federal elections next year. None are expected, which leaves the German economy in a malaise as the manufacturing sector continues to stagnate. That should be confirmed today with another round of weak manufacturing PMIs across Europe – which have already seen the Dutch PMI drop this morning.”
“With August eurozone inflation data surprising on the downside, the ECB has a green light to cut rates 25bp at its 12 September rate meeting. However, two-year EUR:USD interest rate swap differentials are still trading inside of 100bp and support EUR/USD trading around 1.10/1.11. For today, let's see whether intra-day support at 1.1040 can hold. If not, the case builds further that EUR/USD remains a 1.05-1.11 story until further notice.”
Euro (EUR) further slipped amid softer CPI prints out of Euro-area, Germany and Spain, ING’s FX strategist Chris Turner notes.
EUR/USD to trade lower
“This adds to expectation that ECB may lower rate again at its upcoming meeting on 12 Sep. This week, focus is on mfg PMI (today), services PMI, PPI (Wed), retail sales (Thu) and GDP (Fri). ECBspeaks this week is largely quiet with Nagel tomorrow, Villeroy on Thu.”
“It is perhaps worth mentioning that ECBspeaks lately have not been outright dovish and officials seemed to posture for a more gradual pace when it comes to policy easing. That said, markets have priced in a 25bp cut at this meeting and about 37bp cut for remainder of the year (another 1.5 cut). Another series of underwhelming data print could move the needle for markets to price in a more dovish ECB and for the EURO to trade lower.”
“EUR was last at 1.1070 levels. Daily momentum turned mild bearish while RSI fell. Support at 1.1040 (21 DMA), 1.10, 1.0930 (61.8% fibo retracement of 2024 high to low). Resistance at 1.12 (recent high) and 1.1280 (2023 high).”
Having sold off around 5% since the start of July, the US D (USD) rebounded last week. Clearly, the USD bear trend needs to be fed and there was little on offer last week. It is a different story this week. After today's US Labor Day public holiday, the US data calendar picks up with ISM manufacturing data (Tuesday), JOLTS job opening data Wednesday, ADP, jobless claims, and ISM services (Thursday), and then the main event of the week, the August jobs report on Friday, ING’s FX strategist Chris Turner notes.
DXY to trade quietly amid the US holidays
If the consensus is right about Friday's jobs report (165,000 job gains and a drop in the unemployment rate back to 4.2%) then market pricing will firm up just a 25bp cut as the start to the Fed easing cycle on 18 September. Payrolls could come in at just 125k, but the unemployment rate could tick up to 4.4%. If so, the USD will be back to test recent lows as the pendulum swings back to a 50bp Fed rate cut in September.
We'll also see this week whether US opinion polls start to register in FX markets. Arguably, the dollar sell-off since July has been assisted by the improved polling performance of the Democrats. As we now enter the run-up to November, opinion polls will become ever more important and certainly, this will be a hot topic next week after the first Harris-Trump TV debate which takes place on 10 September.
Expect the Labor Day holiday to keep FX trading subdued today and we doubt DXY has the legs to get over the 101.85/102.00 region.
US data last Thursday/Friday where core inflation, 1y inflation expectations eased, 2Q GDP was revised higher and personal spending rose – suggested that US economy is on course for soft-landing. Such a scenario remains consistent with our house call for no panic and gradual pace of Fed cut – 50bps cut for this year, starting in September, OCBC’s FX analyst Christopher Wong notes.
Three scenarios exist for US data
“The US Dollar (USD) and markets can be more sensitive to a busy week of US labour market-related releases including ISM employment data (Tue), JOLTs job openings (Wed), ADP employment, ISM services employment (Thu), and the highlight US payrolls report on Fri. Data interpretation may be tricky this time, given that markets are already pricing in a very dovish outcome for the Fed this year (about 100bps cut; 31% probability of 50bp cut in Sep).”
“We identified 3 possible scenarios: 1/ if US data comes in much better than expected. US equities can rally, USD can go up while dovish Fed cut expectations can unwind. 2/ If US data comes in much worse than expected. Then the soft-landing view may be in doubt. US equities are at risk of being sold off (recall the 5 Aug market crash). 3/ If US data comes in largely in line with estimates – not good, not bad. This supports soft landing story.”
“DXY was last at 101.66. Daily momentum turned mild bullish but rise in RSI moderated. We still see some risks of further short squeeze but bias to fade rallies. Resistance at 102 (21 DMA), 102.20 (23.6% fibo retracement of 2023 high to 2024 low). Support at 100.50 levels. Clean break puts 99.60 in focus. US markets are closed for labour market holiday today.”
Caixin and official manufacturing PMIs diverged while official nonmanufacturing PMI picked up marginally in August, UOB Group Economist Ho Woei Chen notes.
Signs of weaker activities in manufacturing
“The Caixin and official manufacturing PMIs diverged while the official nonmanufacturing PMI picked up marginally in Aug after falling consecutively in the four preceding months. Employment and prices weakened for both the manufacturing and nonmanufacturing sectors in Aug.”
“Signs of weaker activities particularly for the manufacturing sector suggest that it will be challenging for China to sustain 1H24’s growth rate of 5.0% for the remainder of the year, likely missing the official growth target of “around 5.0%” this year.”
“We maintain our forecast for 2024 GDP growth at 4.9% with risks still biased to the downside.”
Silver prices (XAG/USD) fell on Monday, according to FXStreet data. Silver trades at $28.65 per troy ounce, down 0.75% from the $28.86 it cost on Friday.
Silver prices have increased by 20.38% since the beginning of the year.
| Unit measure | Silver Price Today in USD |
|---|---|
| Troy Ounce | 28.65 |
| 1 Gram | 0.92 |
The Gold/Silver ratio, which shows the number of ounces of Silver needed to equal the value of one ounce of Gold, stood at 87.32 on Monday, up from 86.74 on Friday.
Silver FAQs
Silver is a precious metal highly traded among investors. It has been historically used as a store of value and a medium of exchange. Although less popular than Gold, traders may turn to Silver to diversify their investment portfolio, for its intrinsic value or as a potential hedge during high-inflation periods. Investors can buy physical Silver, in coins or in bars, or trade it through vehicles such as Exchange Traded Funds, which track its price on international markets.
Silver prices can move due to a wide range of factors. Geopolitical instability or fears of a deep recession can make Silver price escalate due to its safe-haven status, although to a lesser extent than Gold's. As a yieldless asset, Silver tends to rise with lower interest rates. Its moves also depend on how the US Dollar (USD) behaves as the asset is priced in dollars (XAG/USD). A strong Dollar tends to keep the price of Silver at bay, whereas a weaker Dollar is likely to propel prices up. Other factors such as investment demand, mining supply – Silver is much more abundant than Gold – and recycling rates can also affect prices.
Silver is widely used in industry, particularly in sectors such as electronics or solar energy, as it has one of the highest electric conductivity of all metals – more than Copper and Gold. A surge in demand can increase prices, while a decline tends to lower them. Dynamics in the US, Chinese and Indian economies can also contribute to price swings: for the US and particularly China, their big industrial sectors use Silver in various processes; in India, consumers’ demand for the precious metal for jewellery also plays a key role in setting prices.
Silver prices tend to follow Gold's moves. When Gold prices rise, Silver typically follows suit, as their status as safe-haven assets is similar. The Gold/Silver ratio, which shows the number of ounces of Silver needed to equal the value of one ounce of Gold, may help to determine the relative valuation between both metals. Some investors may consider a high ratio as an indicator that Silver is undervalued, or Gold is overvalued. On the contrary, a low ratio might suggest that Gold is undervalued relative to Silver.
(An automation tool was used in creating this post.)
- NZD/USD extends its losses as US PCE Index data diminish odds of an aggressive Fed rate cut in September.
- According to the CME FedWatch Tool suggests a 70.0% chance of at least a 25 basis point Fed rate cut in September.
- The Kiwi Dollar may depreciate further as the RBNZ is expected to deliver a 25 basis points rate cut in 2024.
NZD/USD continues to lose ground, trading around 0.6230 during the European hours on Monday. The NZD/USD pair depreciates as the US Dollar (USD) receives support amid diminishing odds of an aggressive interest rate cut by the US Federal Reserve rate in September.
The dovish sentiment regarding the Fed’s policy outlook was tempered after the release of July's US Personal Consumption Expenditures (PCE) Index data on Friday. The PCE Price Index showed a 2.5% year-over-year increase in July, matching the previous reading but falling short of the expected 2.6%. Similarly, the core PCE rose by 2.6% year-over-year, in line with the prior figure but slightly below the forecasted 2.7%.
According to the CME FedWatch Tool, markets are 70% confident of at least a 25 basis point (bps) rate cut by the Fed at its September meeting. Traders are now expected to focus on the upcoming US employment data, particularly the Nonfarm Payrolls (NFP) for August, to gain more clarity on the potential size and timing of the Fed's rate cuts.
In New Zealand, the Reserve Bank of New Zealand (RBNZ) unexpectedly cut its benchmark rate in August, earlier than previously indicated, citing a slowing economy that has increased confidence that inflation will return to its 1-3% target range. Markets are now anticipating further quarter-point rate cuts in October and November, which could place downward pressure on the New Zealand Dollar (NZD) and weaken the NZD/USD pair.
New Zealand Dollar FAQs
The New Zealand Dollar (NZD), also known as the Kiwi, is a well-known traded currency among investors. Its value is broadly determined by the health of the New Zealand economy and the country’s central bank policy. Still, there are some unique particularities that also can make NZD move. The performance of the Chinese economy tends to move the Kiwi because China is New Zealand’s biggest trading partner. Bad news for the Chinese economy likely means less New Zealand exports to the country, hitting the economy and thus its currency. Another factor moving NZD is dairy prices as the dairy industry is New Zealand’s main export. High dairy prices boost export income, contributing positively to the economy and thus to the NZD.
The Reserve Bank of New Zealand (RBNZ) aims to achieve and maintain an inflation rate between 1% and 3% over the medium term, with a focus to keep it near the 2% mid-point. To this end, the bank sets an appropriate level of interest rates. When inflation is too high, the RBNZ will increase interest rates to cool the economy, but the move will also make bond yields higher, increasing investors’ appeal to invest in the country and thus boosting NZD. On the contrary, lower interest rates tend to weaken NZD. The so-called rate differential, or how rates in New Zealand are or are expected to be compared to the ones set by the US Federal Reserve, can also play a key role in moving the NZD/USD pair.
Macroeconomic data releases in New Zealand are key to assess the state of the economy and can impact the New Zealand Dollar’s (NZD) valuation. A strong economy, based on high economic growth, low unemployment and high confidence is good for NZD. High economic growth attracts foreign investment and may encourage the Reserve Bank of New Zealand to increase interest rates, if this economic strength comes together with elevated inflation. Conversely, if economic data is weak, NZD is likely to depreciate.
The New Zealand Dollar (NZD) tends to strengthen during risk-on periods, or when investors perceive that broader market risks are low and are optimistic about growth. This tends to lead to a more favorable outlook for commodities and so-called ‘commodity currencies’ such as the Kiwi. Conversely, NZD tends to weaken at times of market turbulence or economic uncertainty as investors tend to sell higher-risk assets and flee to the more-stable safe havens.
- Gold continues unfolding a mini-range above $2,500.
- The upside is capped by a recovering US Dollar on the back of easing concerns about the US economy.
- Labor market data out this week could be key, with Nonfarm Payrolls the main release on Friday.
Gold (XAU/USD) continues trading in a familiar range just above $2,500 on Monday even as Asian stocks fall due to China-growth fears following the release of mixed Manufacturing Purchasing Managers Index (PMI) data. Whilst China’s official NBS Manufacturing PMI fell deeper into contraction territory, the Caixin Manufacturing PMI beat estimates and rose into expansion territory.
Gold’s wings clipped by recovery of US Dollar
Gold’s price is facing a little bit of a headwind from the US Dollar (USD), which has bounced back from the year-to-date lows that reached last Tuesday when the US Dollar Index (DXY) touched down at 100.52. It is now trading back up in the 101.60s after the release of July’s US Personal Consumption Expenditures (PCE) data on Friday showed inflation unchanged from the previous month. This, in turn, reassured markets that the US economy is probably heading for a “soft” rather than a “hard” landing.
The outlook for US interest rates, another major driver for the precious metal, remains about the same, with the probabilities of a 50 basis point (bps) cut in September still just above 30% and a 25 bps cut fully priced in, according to the CME FedWatch Tool.
Trading conditions will be thin on Monday as both the US and Canada are on holiday due to Labor Day. Employment data out this week – culminating in Nonfarm Payrolls (NFP) on Friday – however, will be a key deciding factor as to whether the Federal Reserve (Fed) will opt for a big half percent cut or a more standard quarter percent reduction.
Technical Analysis: Continues trading in mini-range
Gold (XAU/USD) continues trading within a mini-range between $2,500 and $2,531. The short-term trend could now probably be characterized as “sideways” and, therefore, is more likely than not to continue oscillating until a breakout occurs.
Gold’s medium and long-term trends remain bullish, which, given “the trend is your friend,” means the odds favor an eventual breakout higher materializing.
XAU/USD 4-hour Chart
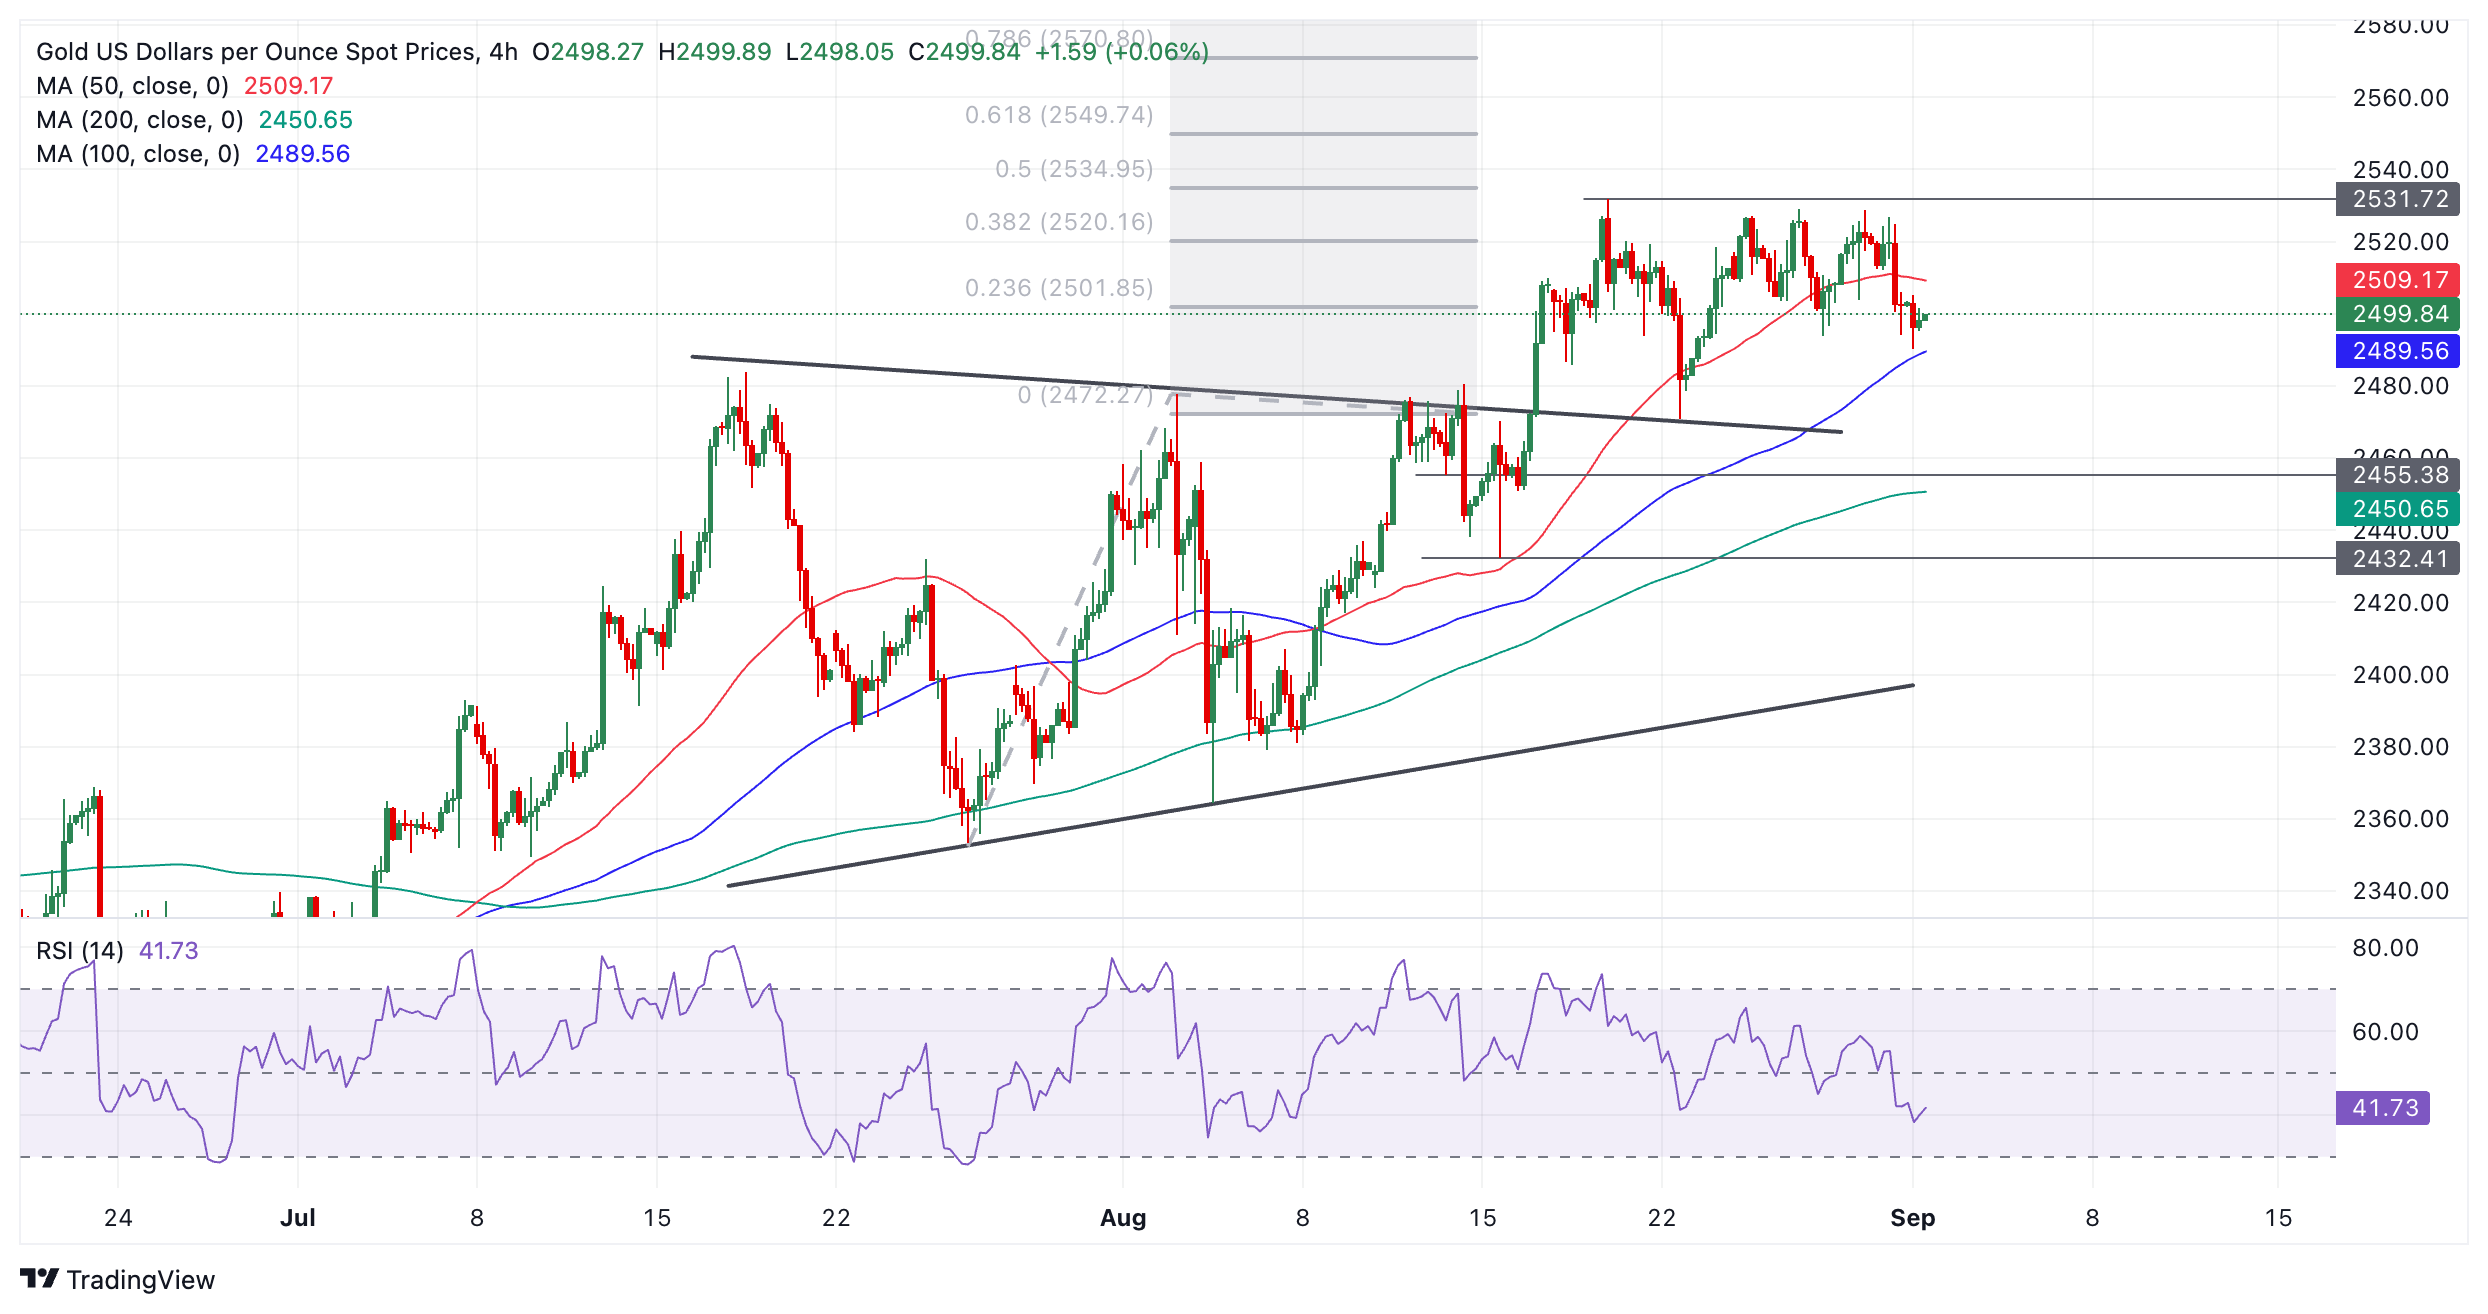
The breakout from the prior range (which resembles an incomplete triangle pattern) that occurred on August 14 generated an upside target at roughly $2,550, calculated by taking the 0.618 Fibonacci ratio of the range’s height and extrapolating it higher. This target is the minimum expectation for the follow-through from a breakout based on principles of technical analysis.
A break above the August 20 all-time high of $2,531 would provide confirmation of a continuation higher toward the $2,550 target.
Alternatively, a break back inside the previous range would negate the projected upside target. Such a move would be confirmed on a daily close below $2,470 (August 22 low). It would change the picture for Gold and suggest that the commodity might start a short-term downtrend.
Gold FAQs
Gold has played a key role in human’s history as it has been widely used as a store of value and medium of exchange. Currently, apart from its shine and usage for jewelry, the precious metal is widely seen as a safe-haven asset, meaning that it is considered a good investment during turbulent times. Gold is also widely seen as a hedge against inflation and against depreciating currencies as it doesn’t rely on any specific issuer or government.
Central banks are the biggest Gold holders. In their aim to support their currencies in turbulent times, central banks tend to diversify their reserves and buy Gold to improve the perceived strength of the economy and the currency. High Gold reserves can be a source of trust for a country’s solvency. Central banks added 1,136 tonnes of Gold worth around $70 billion to their reserves in 2022, according to data from the World Gold Council. This is the highest yearly purchase since records began. Central banks from emerging economies such as China, India and Turkey are quickly increasing their Gold reserves.
Gold has an inverse correlation with the US Dollar and US Treasuries, which are both major reserve and safe-haven assets. When the Dollar depreciates, Gold tends to rise, enabling investors and central banks to diversify their assets in turbulent times. Gold is also inversely correlated with risk assets. A rally in the stock market tends to weaken Gold price, while sell-offs in riskier markets tend to favor the precious metal.
The price can move due to a wide range of factors. Geopolitical instability or fears of a deep recession can quickly make Gold price escalate due to its safe-haven status. As a yield-less asset, Gold tends to rise with lower interest rates, while higher cost of money usually weighs down on the yellow metal. Still, most moves depend on how the US Dollar (USD) behaves as the asset is priced in dollars (XAU/USD). A strong Dollar tends to keep the price of Gold controlled, whereas a weaker Dollar is likely to push Gold prices up.
- Silver price loses ground as US PCE Index data diminish odds of an aggressive Fed rate cut in September.
- According to the CME FedWatch Tool suggests a 70.0% chance of at least a 25 basis point Fed rate cut in September.
- Safe-haven Silver may come under downward pressure following widespread protests that erupted in Israel on Sunday.
Silver price (XAG/USD) extends its losses for the second consecutive session, trading around $28.50 per troy ounce during the early hours on Monday. This downside could be attributed to the improved risk sentiment following Friday’s US Personal Consumption Expenditures (PCE) Index data for July led traders to scale back expectations of an aggressive Federal Reserve rate cut in September.
Federal Reserve Atlanta President Raphael Bostic, a prominent hawk on the FOMC, indicated last week that it might be "time to move" on rate cuts due to further cooling inflation and a higher-than-expected unemployment rate. FXStreet’s FedTracker, which gauges the tone of Fed officials’ speeches on a dovish-to-hawkish scale from 0 to 10 using a custom AI model, rated Bostic’s words as neutral with a score of 5.6.
According to the CME FedWatch Tool, markets are 70.0% anticipating at least a 25 basis point (bps) rate cut by the Fed at its September meeting. Traders are now likely to focus on the upcoming US employment figures, including the Nonfarm Payrolls (NFP) for August, to gain further insights into the potential size and pace of Fed rate cuts.
Safe-haven Silver could face downward pressure as widespread protests erupted in Israel on Sunday, fueled by growing frustration over the government's inability to secure a ceasefire agreement. Israeli media estimated that up to 500,000 people demonstrated in Jerusalem, Tel Aviv, and other cities, urging Prime Minister Benjamin Netanyahu to take stronger action to bring home the remaining 101 hostages, according to Reuters.
Silver FAQs
Silver is a precious metal highly traded among investors. It has been historically used as a store of value and a medium of exchange. Although less popular than Gold, traders may turn to Silver to diversify their investment portfolio, for its intrinsic value or as a potential hedge during high-inflation periods. Investors can buy physical Silver, in coins or in bars, or trade it through vehicles such as Exchange Traded Funds, which track its price on international markets.
Silver prices can move due to a wide range of factors. Geopolitical instability or fears of a deep recession can make Silver price escalate due to its safe-haven status, although to a lesser extent than Gold's. As a yieldless asset, Silver tends to rise with lower interest rates. Its moves also depend on how the US Dollar (USD) behaves as the asset is priced in dollars (XAG/USD). A strong Dollar tends to keep the price of Silver at bay, whereas a weaker Dollar is likely to propel prices up. Other factors such as investment demand, mining supply – Silver is much more abundant than Gold – and recycling rates can also affect prices.
Silver is widely used in industry, particularly in sectors such as electronics or solar energy, as it has one of the highest electric conductivity of all metals – more than Copper and Gold. A surge in demand can increase prices, while a decline tends to lower them. Dynamics in the US, Chinese and Indian economies can also contribute to price swings: for the US and particularly China, their big industrial sectors use Silver in various processes; in India, consumers’ demand for the precious metal for jewellery also plays a key role in setting prices.
Silver prices tend to follow Gold's moves. When Gold prices rise, Silver typically follows suit, as their status as safe-haven assets is similar. The Gold/Silver ratio, which shows the number of ounces of Silver needed to equal the value of one ounce of Gold, may help to determine the relative valuation between both metals. Some investors may consider a high ratio as an indicator that Silver is undervalued, or Gold is overvalued. On the contrary, a low ratio might suggest that Gold is undervalued relative to Silver.
Here is what you need to know on Monday, September 2:
Major currency pairs fluctuate in narrow channels at the beginning of the week. The European economic docket will feature revisions to August HCOB Manufacturing PMI data for the Eurozone and Germany, alongside the S&P Global/CIPS Manufacturing PMI for the UK. Financial markets in the US and Canada will remain closed in observance of the Labor Day holiday.
US Dollar PRICE Last 7 days
The table below shows the percentage change of US Dollar (USD) against listed major currencies last 7 days. US Dollar was the strongest against the Japanese Yen.
| USD | EUR | GBP | JPY | CAD | AUD | NZD | CHF | |
|---|---|---|---|---|---|---|---|---|
| USD | 1.18% | 0.62% | 1.46% | -0.10% | 0.29% | -0.05% | 0.09% | |
| EUR | -1.18% | -0.61% | 0.28% | -1.25% | -0.97% | -1.18% | -1.05% | |
| GBP | -0.62% | 0.61% | 0.79% | -0.71% | -0.36% | -0.64% | -0.51% | |
| JPY | -1.46% | -0.28% | -0.79% | -1.52% | -1.07% | -1.25% | -1.26% | |
| CAD | 0.10% | 1.25% | 0.71% | 1.52% | 0.38% | 0.11% | 0.20% | |
| AUD | -0.29% | 0.97% | 0.36% | 1.07% | -0.38% | -0.23% | -0.09% | |
| NZD | 0.05% | 1.18% | 0.64% | 1.25% | -0.11% | 0.23% | 0.12% | |
| CHF | -0.09% | 1.05% | 0.51% | 1.26% | -0.20% | 0.09% | -0.12% |
The heat map shows percentage changes of major currencies against each other. The base currency is picked from the left column, while the quote currency is picked from the top row. For example, if you pick the US Dollar from the left column and move along the horizontal line to the Japanese Yen, the percentage change displayed in the box will represent USD (base)/JPY (quote).
Inflation in the US, as measured by the change in the Personal Consumption Expenditures (PCE) Price Index, held steady at 2.5% on a yearly basis in July, the US Bureau of Economic Analysis reported ahead of the weekend. The core PCE Price Index, which excludes volatile food and energy prices, rose 0.2% on a monthly basis, as anticipated. The US Dollar (USD) Index extended its recovery on Friday and gained about 1% for the week, closing in positive territory for the first time since mid-July.
EUR/USD lost 1.3% in the previous week, pressured by the broad-based USD strength. The pair struggles to stage a rebound early Monday and was last seen trading at around 1.1050.
GBP/USD continued to decline on Friday and closed the third consecutive day in negative territory. The pair seems to have gone into a consolidation phase below 1.3150 in the European morning on Monday.
The data from China showed earlier in the day that the Caixin Manufacturing PMI edged higher to 50.4 in August from 49.8 in July. This reading came in slightly better than the market expectation of 50. Meanwhile, the Australian Bureau of Statistics reported that Building Permits increased by 10.4% on a monthly basis in July, following the 6.4% decline recorded in June. AUD/USD showed no reaction to these figures and was last seen trading marginally higher on the day near 0.6770.
After rising more than 1% in the previous week, USD/JPY stays relatively quiet early Monday and fluctuates in a narrow band slightly below 146.50.
Gold failed to make a decisive move in either direction and closed virtually unchanged last week. XAU/USD stays under modest bearish pressure to start the week and trades below $2,500.
Inflation FAQs
Inflation measures the rise in the price of a representative basket of goods and services. Headline inflation is usually expressed as a percentage change on a month-on-month (MoM) and year-on-year (YoY) basis. Core inflation excludes more volatile elements such as food and fuel which can fluctuate because of geopolitical and seasonal factors. Core inflation is the figure economists focus on and is the level targeted by central banks, which are mandated to keep inflation at a manageable level, usually around 2%.
The Consumer Price Index (CPI) measures the change in prices of a basket of goods and services over a period of time. It is usually expressed as a percentage change on a month-on-month (MoM) and year-on-year (YoY) basis. Core CPI is the figure targeted by central banks as it excludes volatile food and fuel inputs. When Core CPI rises above 2% it usually results in higher interest rates and vice versa when it falls below 2%. Since higher interest rates are positive for a currency, higher inflation usually results in a stronger currency. The opposite is true when inflation falls.
Although it may seem counter-intuitive, high inflation in a country pushes up the value of its currency and vice versa for lower inflation. This is because the central bank will normally raise interest rates to combat the higher inflation, which attract more global capital inflows from investors looking for a lucrative place to park their money.
Formerly, Gold was the asset investors turned to in times of high inflation because it preserved its value, and whilst investors will often still buy Gold for its safe-haven properties in times of extreme market turmoil, this is not the case most of the time. This is because when inflation is high, central banks will put up interest rates to combat it. Higher interest rates are negative for Gold because they increase the opportunity-cost of holding Gold vis-a-vis an interest-bearing asset or placing the money in a cash deposit account. On the flipside, lower inflation tends to be positive for Gold as it brings interest rates down, making the bright metal a more viable investment alternative.
(This story was corrected on September 2 at 07:53 GMT to say in the first paragraph that the European economic docket will feature revisions to August Manufacturing PMI data only, not Manufacturing and Services PMI data both.)
- GBP/USD breaks its three-day losing streak due to improved risk sentiment.
- July's US PCE Index data has diminished expectations of an aggressive Fed rate cut in September.
- The Pound Sterling may advance further as the BoE is expected to reduce rates gradually in 2024.
GBP/USD halts its three-day losing streak, trading around 1.3140 during the Asian hours on Monday. The US Dollar (USD) faces challenges due to improved market optimism amid rising dovish expectations surrounding the US Federal Reserve (Fed).
However, July's US Personal Consumption Expenditures (PCE) Index data led traders to scale back expectations of an aggressive Federal Reserve rate cut in September. PCE Price Index increased by 2.5% year-over-year in July, matching the previous reading of 2.5% but falling short of the estimated 2.6%. Meanwhile, the core PCE, rose by 2.6% year-over-year in July, consistent with the prior figure of 2.6% but slightly below the consensus forecast of 2.7%.
According to the CME FedWatch Tool, markets are 70.0% anticipating at least a 25 basis point (bps) rate cut by the Fed at its September meeting. Traders are now likely to focus on the upcoming US employment figures, including the Nonfarm Payrolls (NFP) for August, to gain further insights into the potential size and pace of Fed rate cuts.
On the GBP front, the Bank of England (BoE) is expected to reduce interest rates gradually in the remainder of the year, which might help the Pound Sterling (GBP) hold its position. At the Jackson Hole Symposium, BoE Governor Andrew Bailey stated that the second-round effects of inflationary pressures would be less significant than anticipated. However, Bailey also advised against hastening additional interest rate cuts, according to Reuters.
Pound Sterling FAQs
The Pound Sterling (GBP) is the oldest currency in the world (886 AD) and the official currency of the United Kingdom. It is the fourth most traded unit for foreign exchange (FX) in the world, accounting for 12% of all transactions, averaging $630 billion a day, according to 2022 data. Its key trading pairs are GBP/USD, aka ‘Cable’, which accounts for 11% of FX, GBP/JPY, or the ‘Dragon’ as it is known by traders (3%), and EUR/GBP (2%). The Pound Sterling is issued by the Bank of England (BoE).
The single most important factor influencing the value of the Pound Sterling is monetary policy decided by the Bank of England. The BoE bases its decisions on whether it has achieved its primary goal of “price stability” – a steady inflation rate of around 2%. Its primary tool for achieving this is the adjustment of interest rates. When inflation is too high, the BoE will try to rein it in by raising interest rates, making it more expensive for people and businesses to access credit. This is generally positive for GBP, as higher interest rates make the UK a more attractive place for global investors to park their money. When inflation falls too low it is a sign economic growth is slowing. In this scenario, the BoE will consider lowering interest rates to cheapen credit so businesses will borrow more to invest in growth-generating projects.
Data releases gauge the health of the economy and can impact the value of the Pound Sterling. Indicators such as GDP, Manufacturing and Services PMIs, and employment can all influence the direction of the GBP. A strong economy is good for Sterling. Not only does it attract more foreign investment but it may encourage the BoE to put up interest rates, which will directly strengthen GBP. Otherwise, if economic data is weak, the Pound Sterling is likely to fall.
Another significant data release for the Pound Sterling is the Trade Balance. This indicator measures the difference between what a country earns from its exports and what it spends on imports over a given period. If a country produces highly sought-after exports, its currency will benefit purely from the extra demand created from foreign buyers seeking to purchase these goods. Therefore, a positive net Trade Balance strengthens a currency and vice versa for a negative balance.
- USD/CHF loses traction around 0.8490 in Monday’s early European session.
- The US NFP for August will take center stage on Friday.
- The rising Middle East geopolitical tensions might lift the Swiss Franc against the US Dollar.
The USD/CHF pair edges lower to near 0.8490 during the early European trading hours on Monday. The downtick of the pair is backed by the weakening of the US Dollar (USD) amid the growing speculation that the US Federal Reserve (Fed) will cut the rate in the September meeting. The Swiss August Consumer Price Index (CPI) and Gross Domestic Product (GDP) for the second quarter will be released on Tuesday. The Swiss economy is projected to grow 0.5% QoQ in Q2.
The US Federal Reserve’s (Fed) dovish stance continues to weigh on the Greenback. Atlanta Fed President Raphael Bostic, a prominent hawk on the FOMC, said last week that it might be time to lower its borrowing cost due to further cooling inflation and a higher-than-expected Unemployment Rate.
Alex Ebkarian, chief operating officer at Allegiance Gold, said that the PCE report confirmed inflation is no longer the Fed's main concern, as they have shifted their focus to unemployment data, which further validates the potential rate cuts in September. Investors will closely watch the release of US employment data on Friday, including the Nonfarm Payrolls (NFP), Unemployment Rate and Average Hourly Earnings for August.
The NFP is forecasted to show 163K job additions in August, while the Unemployment Rate is estimated to tick lower to 4.2% in the same period. Any signs of the weakness in the US labor market might prompt the expectation of a Fed rate cut, which further exerts some selling pressure on the USD.
The ongoing geopolitical tensions in the Middle East could boost the safe-haven currency like the Swiss Franc (CHF). The news agency CNN reported early Monday that protests have broken out across Israel after the country’s military recovered the bodies of six hostages it said Hamas had killed in Gaza. Israel’s largest labor group has called for a strike, saying the “entire Israeli economy will shut down.”
Swiss Franc FAQs
The Swiss Franc (CHF) is Switzerland’s official currency. It is among the top ten most traded currencies globally, reaching volumes that well exceed the size of the Swiss economy. Its value is determined by the broad market sentiment, the country’s economic health or action taken by the Swiss National Bank (SNB), among other factors. Between 2011 and 2015, the Swiss Franc was pegged to the Euro (EUR). The peg was abruptly removed, resulting in a more than 20% increase in the Franc’s value, causing a turmoil in markets. Even though the peg isn’t in force anymore, CHF fortunes tend to be highly correlated with the Euro ones due to the high dependency of the Swiss economy on the neighboring Eurozone.
The Swiss Franc (CHF) is considered a safe-haven asset, or a currency that investors tend to buy in times of market stress. This is due to the perceived status of Switzerland in the world: a stable economy, a strong export sector, big central bank reserves or a longstanding political stance towards neutrality in global conflicts make the country’s currency a good choice for investors fleeing from risks. Turbulent times are likely to strengthen CHF value against other currencies that are seen as more risky to invest in.
The Swiss National Bank (SNB) meets four times a year – once every quarter, less than other major central banks – to decide on monetary policy. The bank aims for an annual inflation rate of less than 2%. When inflation is above target or forecasted to be above target in the foreseeable future, the bank will attempt to tame price growth by raising its policy rate. Higher interest rates are generally positive for the Swiss Franc (CHF) as they lead to higher yields, making the country a more attractive place for investors. On the contrary, lower interest rates tend to weaken CHF.
Macroeconomic data releases in Switzerland are key to assessing the state of the economy and can impact the Swiss Franc’s (CHF) valuation. The Swiss economy is broadly stable, but any sudden change in economic growth, inflation, current account or the central bank’s currency reserves have the potential to trigger moves in CHF. Generally, high economic growth, low unemployment and high confidence are good for CHF. Conversely, if economic data points to weakening momentum, CHF is likely to depreciate.
As a small and open economy, Switzerland is heavily dependent on the health of the neighboring Eurozone economies. The broader European Union is Switzerland’s main economic partner and a key political ally, so macroeconomic and monetary policy stability in the Eurozone is essential for Switzerland and, thus, for the Swiss Franc (CHF). With such dependency, some models suggest that the correlation between the fortunes of the Euro (EUR) and the CHF is more than 90%, or close to perfect.
FX option expiries for Sept 2 NY cut at 10:00 Eastern Time, via DTCC, can be found below.
EUR/USD: EUR amounts
- 1.0900 672m
- 1.1100 618m
GBP/USD: GBP amounts
- 1.2800 688m
AUD/USD: AUD amounts
- 0.6500 464m
USD/CAD: USD amounts
- 1.3410 540m
- 1.3900 1.4b
NZD/USD: NZD amounts
- 0.6115 785m
- EUR/USD strengthens near 1.1055 in Monday’s early European session.
- The pair maintains the positive view above the key 100-day EMA, but RSI indicator shows the neutral momentum.
- The first upside barrier emerges at 1.1185; the crucial support level is seen at 1.1000.
The EUR/USD pair trades with mild gains around 1.1055, snapping the three-day losing streak during the early European session on Monday. The dovish stance of the US Federal Reserve (Fed) undermines the Greenback and provides some support to EUR/USD.
Financial markets are now pricing in a nearly 70% odds of a 25 basis points (bps) rate cut by the Fed in September, while the chance of a 50 bps reduction stands at 30%, according to the CME FedWatch tool. The attention will shift to the US employment data on Friday for further insights about the potential rate cuts in September.
Technically, the bullish outlook of EUR/USD remains intact as the major pair holds above the key 100-day Exponential Moving Averages (EMA) on the daily timeframe. Nonetheless, further consolidation cannot be ruled out as the 14-day Relative Strength Index (RSI) hovers around the midline, suggesting the neutral momentum of the trend.
The immediate resistance level for the major pair emerges at 1.1185, the high of August 28. Further north, the next hurdle is seen at the upper boundary of the Bollinger Band at 1.1230. A decisive break above this level will see a rally to 1.1275, the high of July 18.
In the bearish event, the potential downside support level is located at the 1.1000 psychological mark. A breach of this level will see a drop to 1.0950, the low of August 15. The additional downside filter to watch is near the 100-day EMA at 1.0893, followed by the lower limit of the Bollinger Band at 1.0863.
EUR/USD daily chart
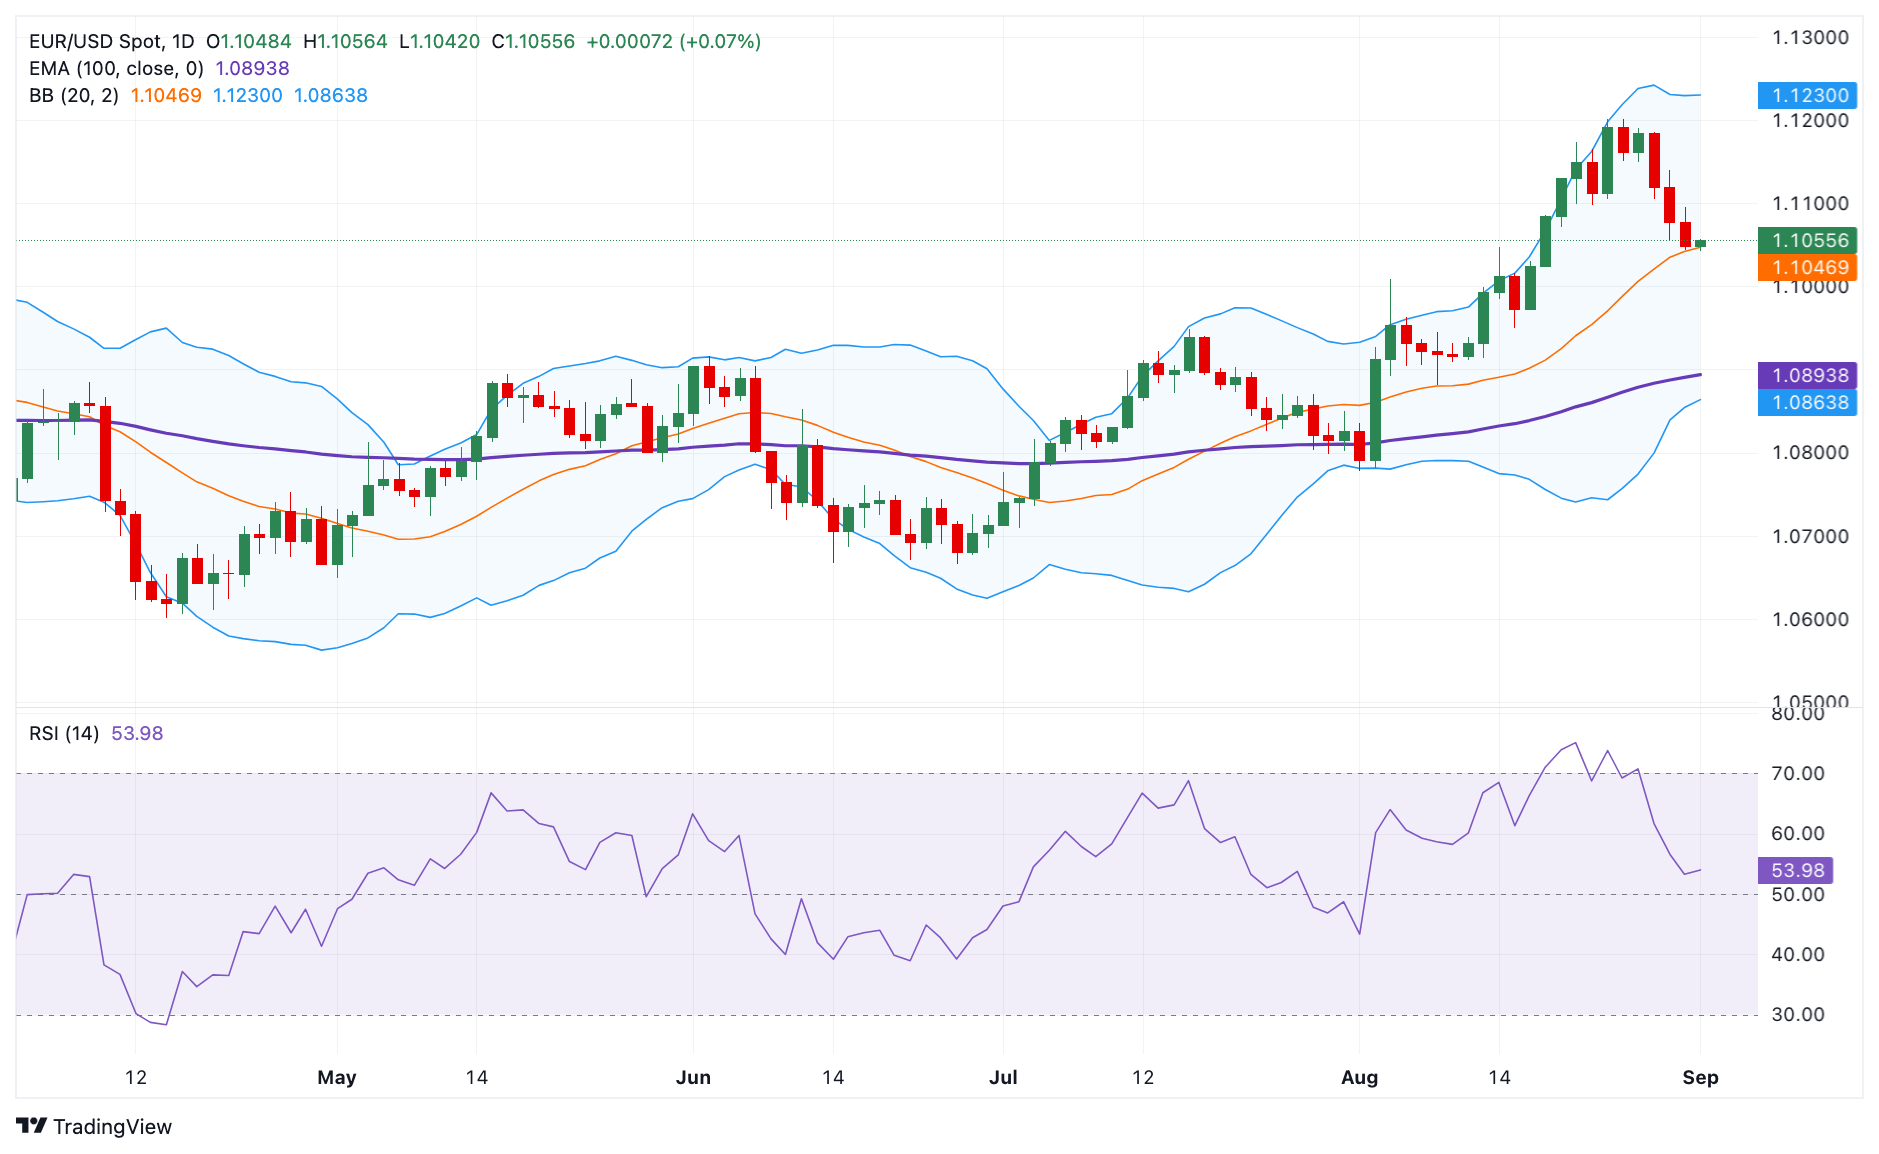
Euro FAQs
The Euro is the currency for the 20 European Union countries that belong to the Eurozone. It is the second most heavily traded currency in the world behind the US Dollar. In 2022, it accounted for 31% of all foreign exchange transactions, with an average daily turnover of over $2.2 trillion a day. EUR/USD is the most heavily traded currency pair in the world, accounting for an estimated 30% off all transactions, followed by EUR/JPY (4%), EUR/GBP (3%) and EUR/AUD (2%).
The European Central Bank (ECB) in Frankfurt, Germany, is the reserve bank for the Eurozone. The ECB sets interest rates and manages monetary policy. The ECB’s primary mandate is to maintain price stability, which means either controlling inflation or stimulating growth. Its primary tool is the raising or lowering of interest rates. Relatively high interest rates – or the expectation of higher rates – will usually benefit the Euro and vice versa. The ECB Governing Council makes monetary policy decisions at meetings held eight times a year. Decisions are made by heads of the Eurozone national banks and six permanent members, including the President of the ECB, Christine Lagarde.
Eurozone inflation data, measured by the Harmonized Index of Consumer Prices (HICP), is an important econometric for the Euro. If inflation rises more than expected, especially if above the ECB’s 2% target, it obliges the ECB to raise interest rates to bring it back under control. Relatively high interest rates compared to its counterparts will usually benefit the Euro, as it makes the region more attractive as a place for global investors to park their money.
Data releases gauge the health of the economy and can impact on the Euro. Indicators such as GDP, Manufacturing and Services PMIs, employment, and consumer sentiment surveys can all influence the direction of the single currency. A strong economy is good for the Euro. Not only does it attract more foreign investment but it may encourage the ECB to put up interest rates, which will directly strengthen the Euro. Otherwise, if economic data is weak, the Euro is likely to fall. Economic data for the four largest economies in the euro area (Germany, France, Italy and Spain) are especially significant, as they account for 75% of the Eurozone’s economy.
Another significant data release for the Euro is the Trade Balance. This indicator measures the difference between what a country earns from its exports and what it spends on imports over a given period. If a country produces highly sought after exports then its currency will gain in value purely from the extra demand created from foreign buyers seeking to purchase these goods. Therefore, a positive net Trade Balance strengthens a currency and vice versa for a negative balance.
- USD/CAD appreciates as commodity-linked CAD faces challenges due to lower Oil prices.
- WTI price falls as Eight OPEC+ members are set to raise production by 180,000 barrels per day in October.
- The US Dollar advanced following July's US Personal Consumption Expenditures Index data.
USD/CAD retraces its recent losses, trading around 1.3500 during the Asian session on Monday. This upside is attributed to the tepid commodity-linked Canadian Dollar (CAD) following the lower crude Oil prices. Given the fact that Canada is the largest Oil exporter to the United States (US).
West Texas Intermediate (WTI) Oil price falls for the second successive session, trading around $72.50 per barrel at the time of writing. This decline may be linked to the Organization of the Petroleum Exporting Countries and their allies (OPEC+) plans to increase production in the coming quarter.
Reuters reported, citing six sources, that OPEC+ is poised to move forward with a planned increase in Oil output starting in October. Eight OPEC+ members are set to raise production by 180,000 barrels per day (bpd) next month as part of a strategy to begin unwinding their most recent reduction of 2.2 million bpd, while maintaining other cuts until the end of 2025.
US Dollar (USD) received support as July's US Personal Consumption Expenditures (PCE) Index data led traders to scale back expectations of an aggressive Federal Reserve rate cut in September. According to the CME FedWatch Tool, markets are fully anticipating at least a 25 basis point (bps) rate cut by the Fed at its September meeting.
Traders are now likely to focus on the upcoming US employment figures, including the Nonfarm Payrolls (NFP) for August, to gain further insights into the potential size and pace of Fed rate cuts. On the Loonie front, S&P Global Manufacturing PMI will be eyed on Tuesday.
Canadian Dollar FAQs
The key factors driving the Canadian Dollar (CAD) are the level of interest rates set by the Bank of Canada (BoC), the price of Oil, Canada’s largest export, the health of its economy, inflation and the Trade Balance, which is the difference between the value of Canada’s exports versus its imports. Other factors include market sentiment – whether investors are taking on more risky assets (risk-on) or seeking safe-havens (risk-off) – with risk-on being CAD-positive. As its largest trading partner, the health of the US economy is also a key factor influencing the Canadian Dollar.
The Bank of Canada (BoC) has a significant influence on the Canadian Dollar by setting the level of interest rates that banks can lend to one another. This influences the level of interest rates for everyone. The main goal of the BoC is to maintain inflation at 1-3% by adjusting interest rates up or down. Relatively higher interest rates tend to be positive for the CAD. The Bank of Canada can also use quantitative easing and tightening to influence credit conditions, with the former CAD-negative and the latter CAD-positive.
The price of Oil is a key factor impacting the value of the Canadian Dollar. Petroleum is Canada’s biggest export, so Oil price tends to have an immediate impact on the CAD value. Generally, if Oil price rises CAD also goes up, as aggregate demand for the currency increases. The opposite is the case if the price of Oil falls. Higher Oil prices also tend to result in a greater likelihood of a positive Trade Balance, which is also supportive of the CAD.
While inflation had always traditionally been thought of as a negative factor for a currency since it lowers the value of money, the opposite has actually been the case in modern times with the relaxation of cross-border capital controls. Higher inflation tends to lead central banks to put up interest rates which attracts more capital inflows from global investors seeking a lucrative place to keep their money. This increases demand for the local currency, which in Canada’s case is the Canadian Dollar.
Macroeconomic data releases gauge the health of the economy and can have an impact on the Canadian Dollar. Indicators such as GDP, Manufacturing and Services PMIs, employment, and consumer sentiment surveys can all influence the direction of the CAD. A strong economy is good for the Canadian Dollar. Not only does it attract more foreign investment but it may encourage the Bank of Canada to put up interest rates, leading to a stronger currency. If economic data is weak, however, the CAD is likely to fall.
Gold prices fell in India on Monday, according to data compiled by FXStreet.
The price for Gold stood at 6,734.82 Indian Rupees (INR) per gram, down compared with the INR 6,751.38 it cost on Friday.
The price for Gold decreased to INR 78,553.60 per tola from INR 78,746.75 per tola on friday.
| Unit measure | Gold Price in INR |
|---|---|
| 1 Gram | 6,734.82 |
| 10 Grams | 67,348.19 |
| Tola | 78,553.60 |
| Troy Ounce | 209,476.40 |
FXStreet calculates Gold prices in India by adapting international prices (USD/INR) to the local currency and measurement units. Prices are updated daily based on the market rates taken at the time of publication. Prices are just for reference and local rates could diverge slightly.
Gold FAQs
Gold has played a key role in human’s history as it has been widely used as a store of value and medium of exchange. Currently, apart from its shine and usage for jewelry, the precious metal is widely seen as a safe-haven asset, meaning that it is considered a good investment during turbulent times. Gold is also widely seen as a hedge against inflation and against depreciating currencies as it doesn’t rely on any specific issuer or government.
Central banks are the biggest Gold holders. In their aim to support their currencies in turbulent times, central banks tend to diversify their reserves and buy Gold to improve the perceived strength of the economy and the currency. High Gold reserves can be a source of trust for a country’s solvency. Central banks added 1,136 tonnes of Gold worth around $70 billion to their reserves in 2022, according to data from the World Gold Council. This is the highest yearly purchase since records began. Central banks from emerging economies such as China, India and Turkey are quickly increasing their Gold reserves.
Gold has an inverse correlation with the US Dollar and US Treasuries, which are both major reserve and safe-haven assets. When the Dollar depreciates, Gold tends to rise, enabling investors and central banks to diversify their assets in turbulent times. Gold is also inversely correlated with risk assets. A rally in the stock market tends to weaken Gold price, while sell-offs in riskier markets tend to favor the precious metal.
The price can move due to a wide range of factors. Geopolitical instability or fears of a deep recession can quickly make Gold price escalate due to its safe-haven status. As a yield-less asset, Gold tends to rise with lower interest rates, while higher cost of money usually weighs down on the yellow metal. Still, most moves depend on how the US Dollar (USD) behaves as the asset is priced in dollars (XAU/USD). A strong Dollar tends to keep the price of Gold controlled, whereas a weaker Dollar is likely to push Gold prices up.
(An automation tool was used in creating this post.)
- WTI price depreciates as Eight OPEC+ members are set to raise production by 180,000 barrels per day next month.
- Crude Oil prices may find support due to supply concerns arising from export disruptions in Libya's Oilfields.
- Oil faces challenges due to weak demand in China and the United States.
West Texas Intermediate (WTI) Oil price falls for the second successive session, trading around $72.50 per barrel during Monday’s Asian hours. This decline may be linked to the Organization of the Petroleum Exporting Countries and their allies (OPEC+) plans to increase production in the coming quarter.
Reuters reported, citing six sources, that OPEC+ is poised to move forward with a planned increase in Oil output starting in October. Eight OPEC+ members are set to raise production by 180,000 barrels per day (bpd) next month as part of a strategy to begin unwinding their most recent reduction of 2.2 million bpd, while maintaining other cuts until the end of 2025.
However, the decline in crude Oil prices may be limited due to supply concerns stemming from export disruptions in Libya's Oilfields caused by a standoff between factions. Nevertheless, the Arabian Gulf Oil Company has resumed production at up to 120,000 barrels per day to meet domestic demand.
Weak demand in China and the United States (US), the world's two largest Oil consumers, could exert downward pressure on WTI prices. An official survey showed that China's manufacturing activity fell to a six-month low in August, with factory gate prices dropping significantly. This has prompted Chinese policymakers to push forward with plans to increase stimulus for households.
In June, Oil consumption slowed to its lowest seasonal levels in the US since the coronavirus pandemic of 2020, according to data from the US Energy Information Administration (EIA) released on Friday. ANZ analysts noted a potential downside in growth for 2025, influenced by economic challenges in China and the US. They believe OPEC may have to postpone the phase-out of voluntary production cuts if it aims to achieve higher prices.
WTI Oil FAQs
WTI Oil is a type of Crude Oil sold on international markets. The WTI stands for West Texas Intermediate, one of three major types including Brent and Dubai Crude. WTI is also referred to as “light” and “sweet” because of its relatively low gravity and sulfur content respectively. It is considered a high quality Oil that is easily refined. It is sourced in the United States and distributed via the Cushing hub, which is considered “The Pipeline Crossroads of the World”. It is a benchmark for the Oil market and WTI price is frequently quoted in the media.
Like all assets, supply and demand are the key drivers of WTI Oil price. As such, global growth can be a driver of increased demand and vice versa for weak global growth. Political instability, wars, and sanctions can disrupt supply and impact prices. The decisions of OPEC, a group of major Oil-producing countries, is another key driver of price. The value of the US Dollar influences the price of WTI Crude Oil, since Oil is predominantly traded in US Dollars, thus a weaker US Dollar can make Oil more affordable and vice versa.
The weekly Oil inventory reports published by the American Petroleum Institute (API) and the Energy Information Agency (EIA) impact the price of WTI Oil. Changes in inventories reflect fluctuating supply and demand. If the data shows a drop in inventories it can indicate increased demand, pushing up Oil price. Higher inventories can reflect increased supply, pushing down prices. API’s report is published every Tuesday and EIA’s the day after. Their results are usually similar, falling within 1% of each other 75% of the time. The EIA data is considered more reliable, since it is a government agency.
OPEC (Organization of the Petroleum Exporting Countries) is a group of 13 Oil-producing nations who collectively decide production quotas for member countries at twice-yearly meetings. Their decisions often impact WTI Oil prices. When OPEC decides to lower quotas, it can tighten supply, pushing up Oil prices. When OPEC increases production, it has the opposite effect. OPEC+ refers to an expanded group that includes ten extra non-OPEC members, the most notable of which is Russia.
- The Japanese Yen appreciates following the positive economic data on Monday.
- Japan’s Manufacturing PMI posted a 49.8 reading for August, against the previous 49.5.
- The latest US Personal Consumption Expenditures Index data diminish the odds of an aggressive Fed rate cut in September.
The Japanese Yen (JPY) remains stable against the US Dollar (USD) after the release of July's US Personal Consumption Expenditures (PCE) Index data, which led traders to scale back expectations of an aggressive Federal Reserve rate cut in September.
According to the CME FedWatch Tool, markets are fully anticipating at least a 25 basis point (bps) rate cut by the Fed at its September meeting. Traders are now likely to focus on the upcoming US employment figures, including the Nonfarm Payrolls (NFP) for August, to gain further insights into the potential size and pace of Fed rate cuts.
On Monday, Japanese companies reported a 7.4% increase in Capital Spending for the second quarter. Additionally, the country’s Manufacturing PMI for August was revised upward to 49.8 from 49.5, indicating a trend toward stabilization. On Friday, a rise in Tokyo inflation reinforced the Bank of Japan's (BoJ) hawkish monetary policy stance, boosting the JPY and capping gains in the USD/JPY pair.
Daily Digest Market Movers: Japanese Yen appreciates due to a hawkish BoJ
- The US Bureau of Economic Analysis reported on Friday that the headline Personal Consumption Expenditures (PCE) Price Index increased by 2.5% year-over-year in July, matching the previous reading of 2.5% but falling short of the estimated 2.6%. Meanwhile, the core PCE, which excludes volatile food and energy prices, rose by 2.6% year-over-year in July, consistent with the prior figure of 2.6% but slightly below the consensus forecast of 2.7%.
- Tokyo's Consumer Price Index (CPI) increased to 2.6% year-on-year in August, up from 2.2% in July. Core CPI also rose to 1.6% YoY in August, compared to the previous 1.5%. Additionally, Japan’s Unemployment Rate unexpectedly climbed to 2.7% in July, up from both the market estimate and June's 2.5%, marking the highest jobless rate since August 2023.
- Federal Reserve Atlanta President Raphael Bostic, a prominent hawk on the FOMC, indicated last week that it might be "time to move" on rate cuts due to further cooling inflation and a higher-than-expected unemployment rate. FXStreet’s FedTracker, which gauges the tone of Fed officials’ speeches on a dovish-to-hawkish scale from 0 to 10 using a custom AI model, rated Kashkari’s words as neutral with a score of 5.6.
- The US Gross Domestic Product (GDP) grew at an annualized rate of 3.0% in the second quarter, exceeding both the expected and previous growth rate of 2.8%. Additionally, Initial Jobless Claims showed that the number of people filing for unemployment benefits fell to 231,000 for the week ending August 23, down from the previous 233,000 and slightly below the expected 232,000.
- Japan’s Finance Minister Shunichi Suzuki stated last week that foreign exchange rates are influenced by a variety of factors, including monetary policies, interest rate differentials, geopolitical risks, and market sentiment. Suzuki added that it is difficult to predict how these factors will impact FX rates.
Technical Analysis: USD/JPY holds ground around 146.00
USD/JPY trades around 146.00 on Monday. Daily chart analysis shows the pair is situated above the downtrend line, suggesting a diminishing bearish bias. However, the 14-day Relative Strength Index (RSI) remains below 50, indicating that the bearish trend is still in effect.
In terms of support, the USD/JPY pair might first test the nine-day Exponential Moving Average (EMA) at around 145.53, followed by the downtrend line near 144.00. If the pair falls below this level, it could move toward the seven-month low of 141.69, recorded on August 5, and subsequently find support around 140.25.
On the upside, the USD/JPY pair might approach the psychological level of 150.00 level. A break above this level could lead the pair to navigate the area around the 154.50 level, which has shifted from support to resistance.
USD/JPY: Daily Chart
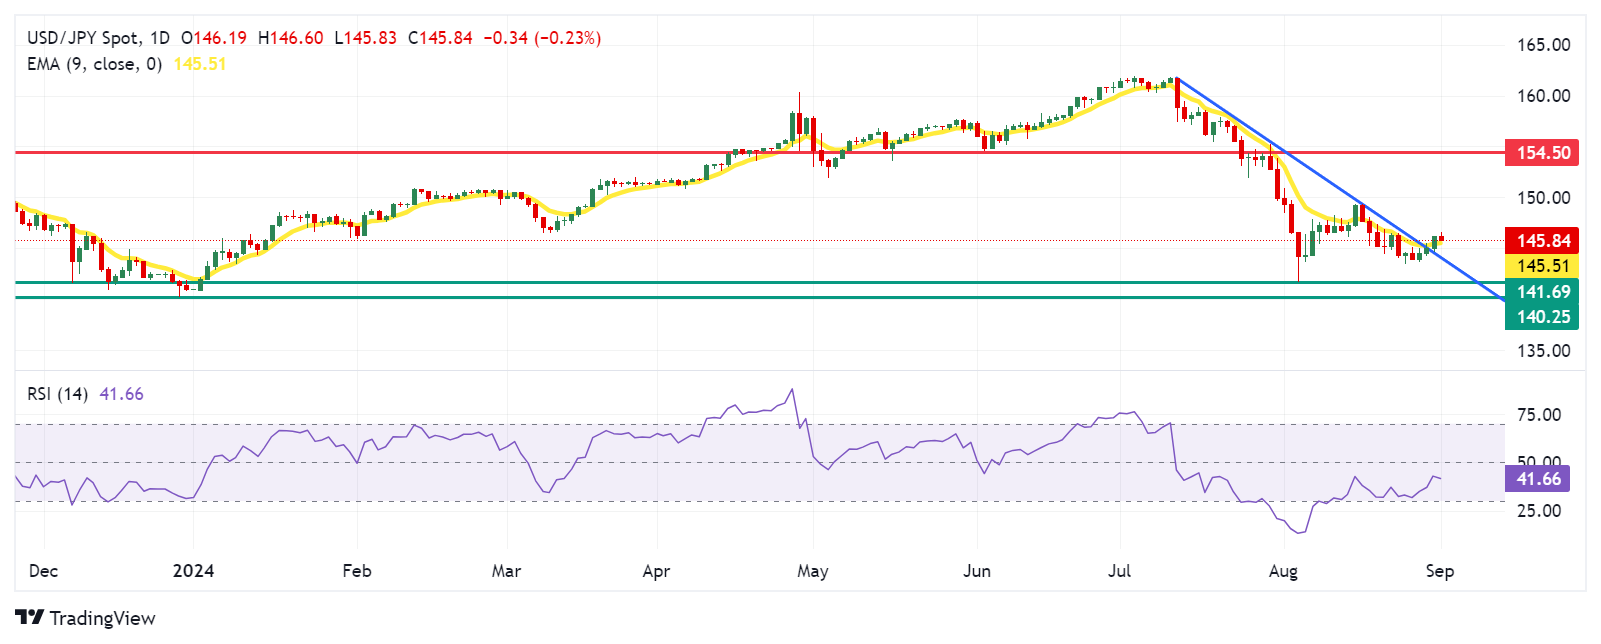
Japanese Yen PRICE Today
The table below shows the percentage change of Japanese Yen (JPY) against listed major currencies today. Japanese Yen was the strongest against the New Zealand Dollar.
| USD | EUR | GBP | JPY | CAD | AUD | NZD | CHF | |
|---|---|---|---|---|---|---|---|---|
| USD | -0.05% | -0.04% | -0.19% | 0.06% | -0.01% | 0.06% | 0.03% | |
| EUR | 0.05% | 0.03% | -0.16% | 0.09% | 0.05% | 0.11% | 0.07% | |
| GBP | 0.04% | -0.03% | -0.19% | 0.04% | -0.01% | 0.09% | 0.01% | |
| JPY | 0.19% | 0.16% | 0.19% | 0.20% | 0.22% | 0.38% | 0.15% | |
| CAD | -0.06% | -0.09% | -0.04% | -0.20% | -0.03% | 0.00% | -0.03% | |
| AUD | 0.00% | -0.05% | 0.00% | -0.22% | 0.03% | 0.04% | 0.03% | |
| NZD | -0.06% | -0.11% | -0.09% | -0.38% | 0.00% | -0.04% | -0.03% | |
| CHF | -0.03% | -0.07% | -0.01% | -0.15% | 0.03% | -0.03% | 0.03% |
The heat map shows percentage changes of major currencies against each other. The base currency is picked from the left column, while the quote currency is picked from the top row. For example, if you pick the Japanese Yen from the left column and move along the horizontal line to the US Dollar, the percentage change displayed in the box will represent JPY (base)/USD (quote).
Japanese Yen FAQs
The Japanese Yen (JPY) is one of the world’s most traded currencies. Its value is broadly determined by the performance of the Japanese economy, but more specifically by the Bank of Japan’s policy, the differential between Japanese and US bond yields, or risk sentiment among traders, among other factors.
One of the Bank of Japan’s mandates is currency control, so its moves are key for the Yen. The BoJ has directly intervened in currency markets sometimes, generally to lower the value of the Yen, although it refrains from doing it often due to political concerns of its main trading partners. The current BoJ ultra-loose monetary policy, based on massive stimulus to the economy, has caused the Yen to depreciate against its main currency peers. This process has exacerbated more recently due to an increasing policy divergence between the Bank of Japan and other main central banks, which have opted to increase interest rates sharply to fight decades-high levels of inflation.
The BoJ’s stance of sticking to ultra-loose monetary policy has led to a widening policy divergence with other central banks, particularly with the US Federal Reserve. This supports a widening of the differential between the 10-year US and Japanese bonds, which favors the US Dollar against the Japanese Yen.
The Japanese Yen is often seen as a safe-haven investment. This means that in times of market stress, investors are more likely to put their money in the Japanese currency due to its supposed reliability and stability. Turbulent times are likely to strengthen the Yen’s value against other currencies seen as more risky to invest in.
- The Indian Rupee loses momentum, snapping the two-day winning streak in Monday’s Asian trading hours.
- USD demand weighs on the INR, while foreign equity inflows and lower crude oil prices could underpin the local currency.
- The Indian August HSBC Manufacturing PMI is due on Monday.
The Indian Rupee (INR) drifts lower on the stronger US Dollar (USD) on Monday. The INR was the second-worst-performing Asian currency in August, pressured by strong USD from state-run banks. However, the downside might be limited amid likely inflows into local equities and a further decline in crude oil prices.
Investors await the Indian HSBC Manufacturing PMI for August on Monday, which is estimated to remain unchanged at 47.9. On the US docket, ISM Manufacturing PMI for August is due on Tuesday. The US Nonfarm Payrolls (NFP) will be closely watched on Friday. This data might offer some cues about the size and pace of the Federal Reserve (Fed) interest rate cuts. Another weaker reading might exert some selling pressure on the USD.
Daily Digest Market Movers: Indian Rupee weakens amid the renewed USD demand
- “The rupee depreciated by 0.2 percent in August to currently trade at 83.87 per dollar, close to its lifetime low of 83.97 per dollar. This was despite the weakening of the US dollar. The factors that impacted the rupee are a slowdown in FPI inflows (mainly the equity segment), and increased dollar demand by importers. In contrast to most global currencies, which rose against the dollar, the rupee declined,” noted Sonal Badhan, economist at Bank of Baroda.
- India's economic growth slowed to a 15-month low of 6.7% in the April-June quarter, according to data released by the statistics ministry on Friday. This follows a 7.8% expansion in the previous quarter.
- The US Personal Consumption Expenditures (PCE) Price Index rose 0.2% MoM in July, matching the market expectation, the Commerce Department reported on Friday. On a yearly basis, the PCE inflation remained unchanged at 2.5% in July.
- The core PCE, excluding volatile food and energy prices, increased 0.2% for the month but rose 2.6% from a year ago. The annual figure was slightly softer than the 2.7% expected.
- Traders slightly raised bets of a 25 basis points (bps) rate cut by the Fed in September to around 70%, with a 50 bps reduction possibility standing at 30% following the PCE inflation report, according to the CME FedWatch tool.
Technical Analysis: USD/INR’s longer-term outlook points to bullish momentum
The Indian Rupee trades on a weaker note on the day. The USD/INR remains capped under the 84.00 barrier. However, the positive view of the USD/INR remains in play as the pair is well-supported above the key 100-day Exponential Moving Average (EMA) on the daily chart. The 14-day Relative Strength Index (RSI) holds in the bullish zone near 54.50, indicating the overall momentum is strongly in favor of the bulls.
The crucial upside barrier for USD/INR is located at the 84.00 round figure. Extended gains will attract some buyers to 84.50.
On the other hand, the low of August 20 at 83.77 acts as an initial support level for the pair. Any follow-through selling will see a drop to the 100-day EMA at 83.61.
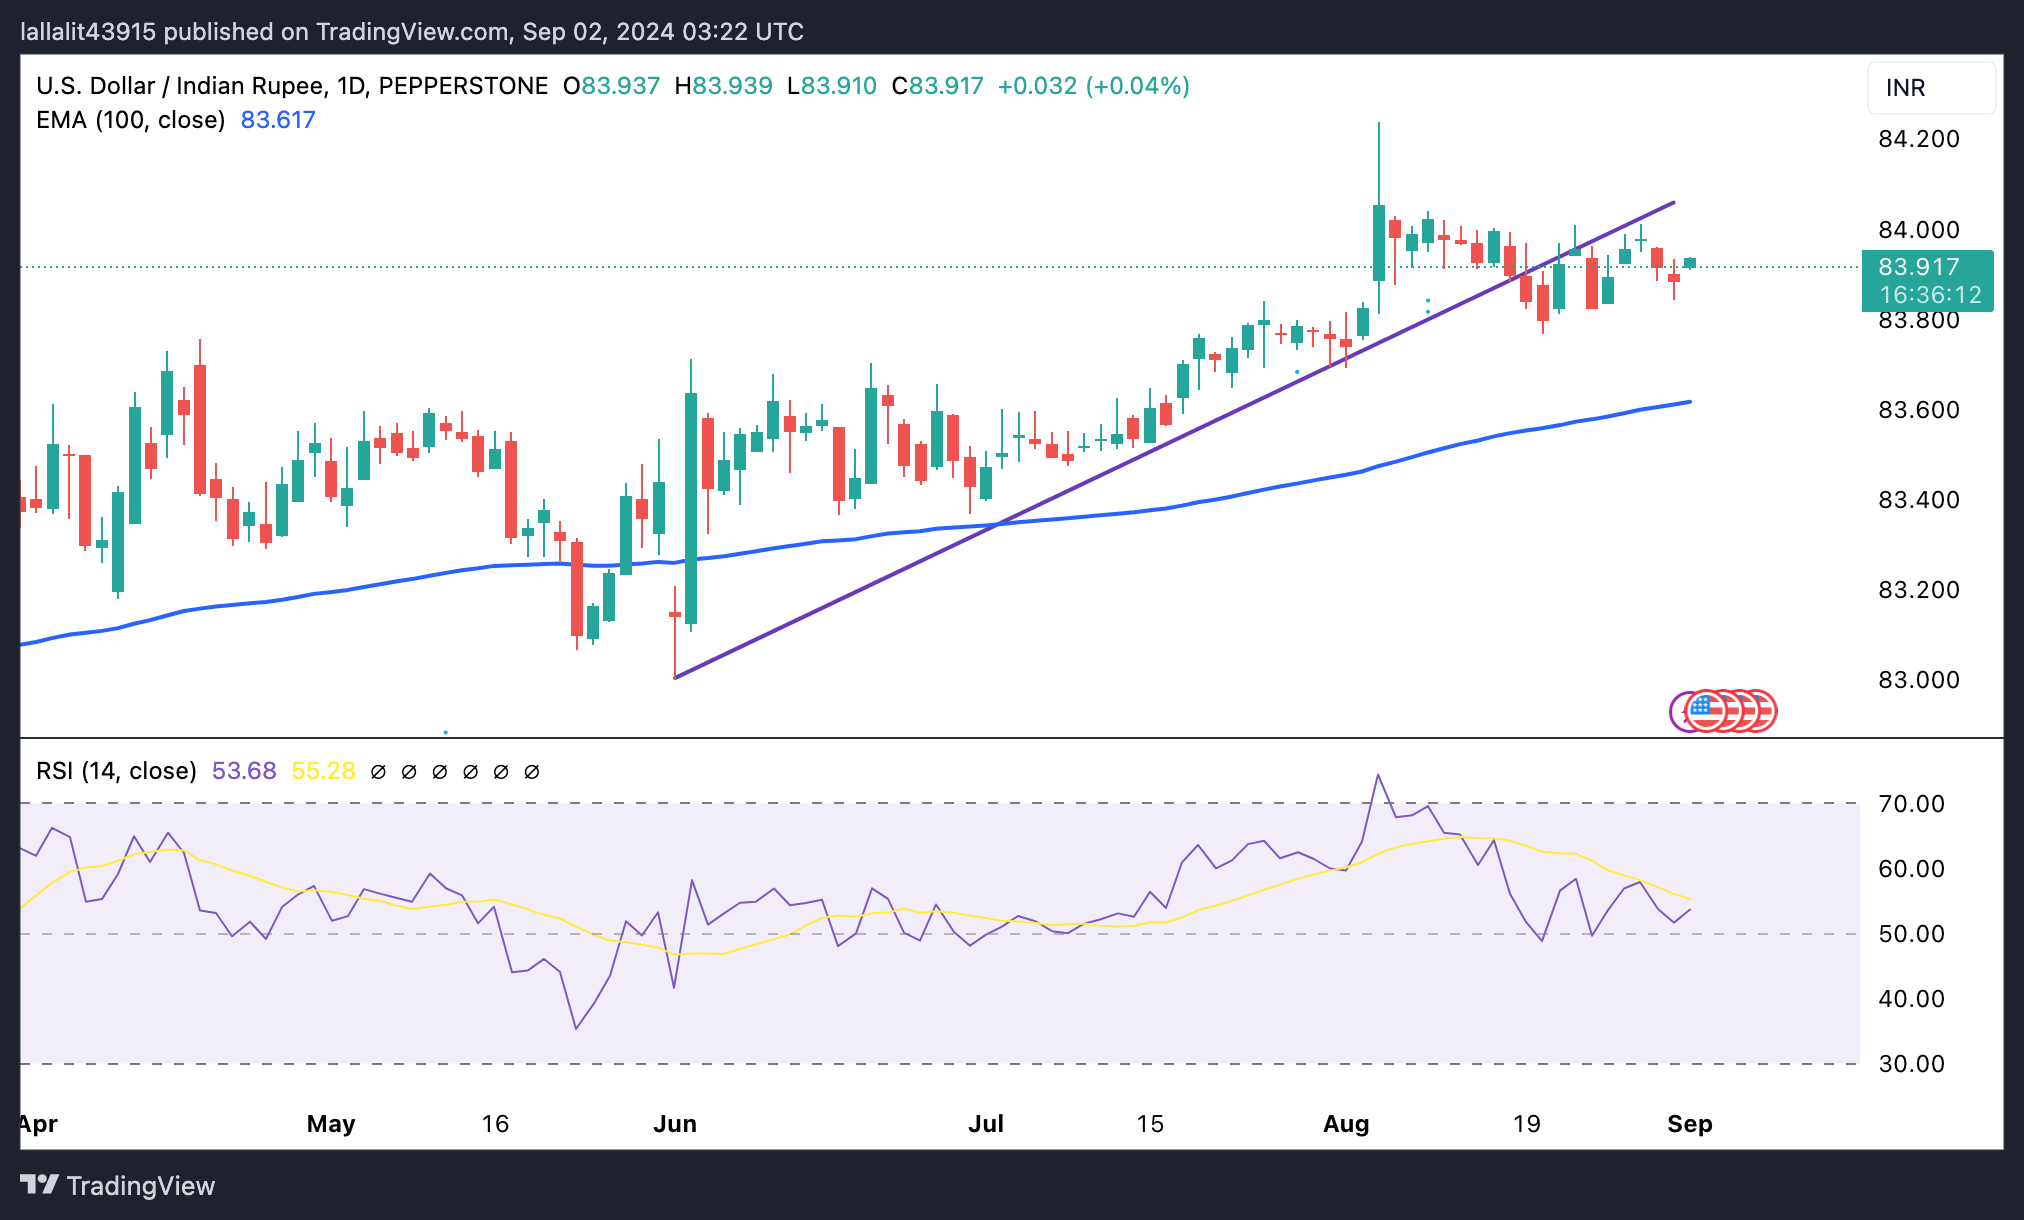
Indian Rupee FAQs
The Indian Rupee (INR) is one of the most sensitive currencies to external factors. The price of Crude Oil (the country is highly dependent on imported Oil), the value of the US Dollar – most trade is conducted in USD – and the level of foreign investment, are all influential. Direct intervention by the Reserve Bank of India (RBI) in FX markets to keep the exchange rate stable, as well as the level of interest rates set by the RBI, are further major influencing factors on the Rupee.
The Reserve Bank of India (RBI) actively intervenes in forex markets to maintain a stable exchange rate, to help facilitate trade. In addition, the RBI tries to maintain the inflation rate at its 4% target by adjusting interest rates. Higher interest rates usually strengthen the Rupee. This is due to the role of the ‘carry trade’ in which investors borrow in countries with lower interest rates so as to place their money in countries’ offering relatively higher interest rates and profit from the difference.
Macroeconomic factors that influence the value of the Rupee include inflation, interest rates, the economic growth rate (GDP), the balance of trade, and inflows from foreign investment. A higher growth rate can lead to more overseas investment, pushing up demand for the Rupee. A less negative balance of trade will eventually lead to a stronger Rupee. Higher interest rates, especially real rates (interest rates less inflation) are also positive for the Rupee. A risk-on environment can lead to greater inflows of Foreign Direct and Indirect Investment (FDI and FII), which also benefit the Rupee.
Higher inflation, particularly, if it is comparatively higher than India’s peers, is generally negative for the currency as it reflects devaluation through oversupply. Inflation also increases the cost of exports, leading to more Rupees being sold to purchase foreign imports, which is Rupee-negative. At the same time, higher inflation usually leads to the Reserve Bank of India (RBI) raising interest rates and this can be positive for the Rupee, due to increased demand from international investors. The opposite effect is true of lower inflation.
- The Australian Dollar depreciates despite positive economic data on Monday.
- Australia’s Building Permits increased by 10.4% MoM in July, marking the strongest growth since May 2023.
- The US Dollar may depreciate due to the rising odds of a 25 basis point rate cut by the Fed.
The Australian Dollar (AUD) extends its losses against the US Dollar (USD) following the release of key economic data on Monday. However, improved risk sentiment could limit the downside of the risk-sensitive AUD, as dovish expectations surrounding the US Federal Reserve (Fed) continued to rise.
Australia’s Building Permits surged by 10.4% month-over-month in July, sharply rebounding from a 6.5% decline in June, marking the strongest growth since May 2023. On an annual basis, the growth rate reached 14.3%, a significant recovery from the previous 3.7% decline. Additionally, China’s Caixin Manufacturing PMI rose to 50.4 in August, up from 49.8 in July, which is particularly noteworthy given China’s close trade relationship with Australia.
The US Dollar receives downward pressure following the rising expectations of a 25 basis point rate cut by the Fed in September. However, the Greenback found support from the US July Personal Consumption Expenditures (PCE) Index data released on Friday.
Traders are now likely to focus on the upcoming US employment figures, including the Nonfarm Payrolls (NFP) for August, to gain further insights into the potential size and pace of Fed rate cuts.
Daily Digest Market Movers: Australian Dollar declines following the key economic figures
- The US Bureau of Economic Analysis reported on Friday that the headline Personal Consumption Expenditures (PCE) Price Index increased by 2.5% year-over-year in July, matching the previous reading of 2.5% but falling short of the estimated 2.6%. Meanwhile, the core PCE, which excludes volatile food and energy prices, rose by 2.6% year-over-year in July, consistent with the prior figure of 2.6% but slightly below the consensus forecast of 2.7%.
- The US Gross Domestic Product (GDP) grew at an annualized rate of 3.0% in the second quarter, exceeding both the expected and previous growth rate of 2.8%. Additionally, Initial Jobless Claims showed that the number of people filing for unemployment benefits fell to 231,000 for the week ending August 23, down from the previous 233,000 and slightly below the expected 232,000.
- Australia's Private Capital Expenditure unexpectedly declined by 2.2% in the second quarter, reversing from an upwardly revised 1.9% expansion in the previous period and falling short of market expectations for a 1.0% increase. This marks the first contraction in new capital expenditure since the third quarter of 2023.
- Australia's Monthly Consumer Price Index (CPI) increased by 3.5% year-on-year in July, down from June's 3.8% but slightly above the market consensus of 3.4%. Despite the slight decrease, this marks the lowest CPI figure since March.
- Federal Reserve Atlanta President Raphael Bostic, a prominent hawk on the FOMC, indicated last week that it might be "time to move" on rate cuts due to further cooling inflation and a higher-than-expected unemployment rate. FXStreet’s FedTracker, which gauges the tone of Fed officials’ speeches on a dovish-to-hawkish scale from 0 to 10 using a custom AI model, rated Kashkari’s words as neutral with a score of 5.6.
Technical Analysis: Australian Dollar falls to near 0.6750
The Australian Dollar trades around 0.6760 on Monday. Analyzing the daily chart, the AUD/USD pair is positioned below an uptrend line, suggesting a potential weakening of the bullish bias. However, the 14-day Relative Strength Index (RSI) remains above the 50 level, which continues to support the overall bullish trend.
Regarding resistance, the AUD/USD pair may test the immediate barrier at the seven-month high of 0.6798, followed by the uptrend line around the level of 0.6860. A break above this level could reinforce the ongoing bullish bias and lead the pair to navigate the area around the psychological level of 0.6900.
On the downside, the AUD/USD pair may find support around the 14-day Exponential Moving Average (EMA) at the 0.6732 level. A break below this EMA could undermine the bullish bias and increase downward pressure, potentially driving the pair toward the throwback level at 0.6575, with a further decline possibly targeting the lower support at 0.6470.
AUD/USD: Daily Chart
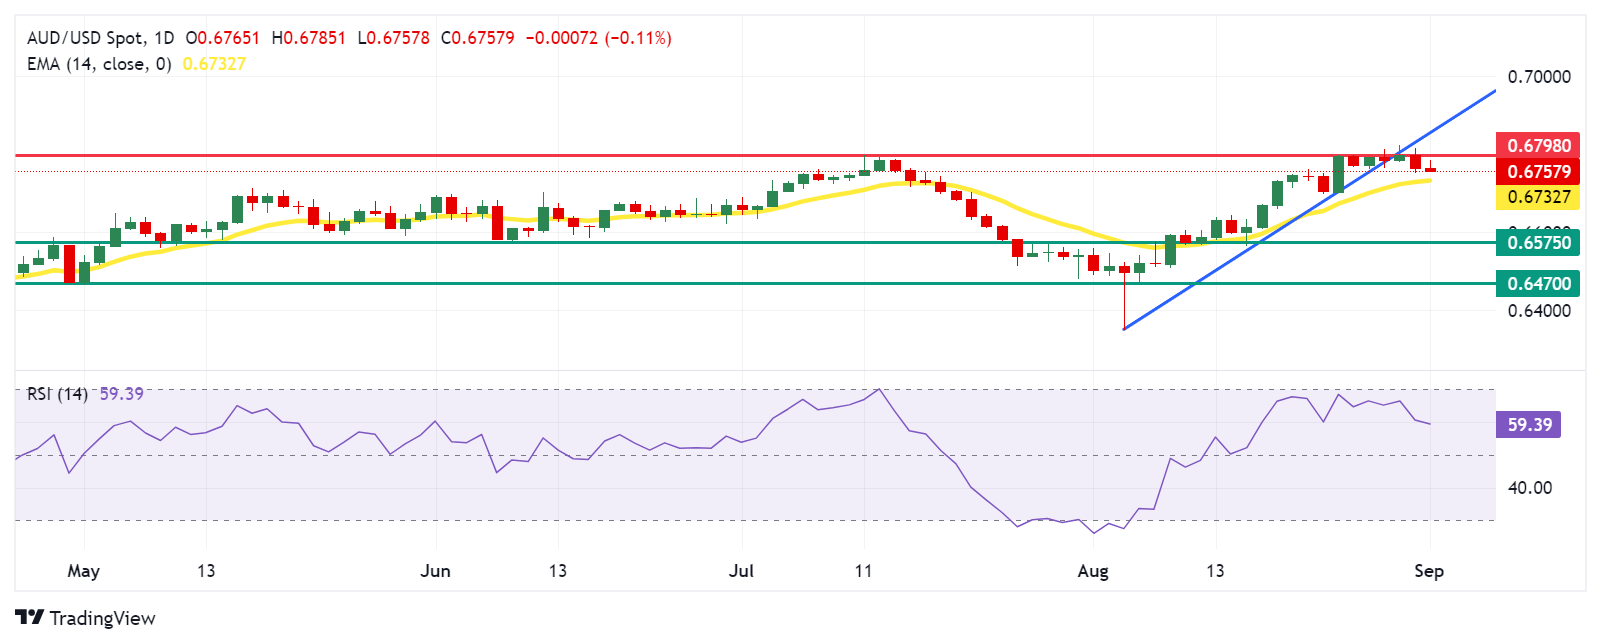
Australian Dollar PRICE Today
The table below shows the percentage change of Australian Dollar (AUD) against listed major currencies today. Australian Dollar was the weakest against the Japanese Yen.
| USD | EUR | GBP | JPY | CAD | AUD | NZD | CHF | |
|---|---|---|---|---|---|---|---|---|
| USD | -0.03% | 0.00% | -0.06% | 0.08% | 0.03% | 0.11% | 0.10% | |
| EUR | 0.03% | 0.06% | -0.03% | 0.09% | 0.06% | 0.13% | 0.12% | |
| GBP | -0.01% | -0.06% | -0.12% | 0.02% | -0.02% | 0.10% | 0.04% | |
| JPY | 0.06% | 0.03% | 0.12% | 0.09% | 0.12% | 0.29% | 0.09% | |
| CAD | -0.08% | -0.09% | -0.02% | -0.09% | -0.01% | 0.01% | 0.02% | |
| AUD | -0.03% | -0.06% | 0.02% | -0.12% | 0.01% | 0.06% | 0.05% | |
| NZD | -0.11% | -0.13% | -0.10% | -0.29% | -0.01% | -0.06% | -0.01% | |
| CHF | -0.10% | -0.12% | -0.04% | -0.09% | -0.02% | -0.05% | 0.01% |
The heat map shows percentage changes of major currencies against each other. The base currency is picked from the left column, while the quote currency is picked from the top row. For example, if you pick the Australian Dollar from the left column and move along the horizontal line to the US Dollar, the percentage change displayed in the box will represent AUD (base)/USD (quote).
Australian Dollar FAQs
One of the most significant factors for the Australian Dollar (AUD) is the level of interest rates set by the Reserve Bank of Australia (RBA). Because Australia is a resource-rich country another key driver is the price of its biggest export, Iron Ore. The health of the Chinese economy, its largest trading partner, is a factor, as well as inflation in Australia, its growth rate and Trade Balance. Market sentiment – whether investors are taking on more risky assets (risk-on) or seeking safe-havens (risk-off) – is also a factor, with risk-on positive for AUD.
The Reserve Bank of Australia (RBA) influences the Australian Dollar (AUD) by setting the level of interest rates that Australian banks can lend to each other. This influences the level of interest rates in the economy as a whole. The main goal of the RBA is to maintain a stable inflation rate of 2-3% by adjusting interest rates up or down. Relatively high interest rates compared to other major central banks support the AUD, and the opposite for relatively low. The RBA can also use quantitative easing and tightening to influence credit conditions, with the former AUD-negative and the latter AUD-positive.
China is Australia’s largest trading partner so the health of the Chinese economy is a major influence on the value of the Australian Dollar (AUD). When the Chinese economy is doing well it purchases more raw materials, goods and services from Australia, lifting demand for the AUD, and pushing up its value. The opposite is the case when the Chinese economy is not growing as fast as expected. Positive or negative surprises in Chinese growth data, therefore, often have a direct impact on the Australian Dollar and its pairs.
Iron Ore is Australia’s largest export, accounting for $118 billion a year according to data from 2021, with China as its primary destination. The price of Iron Ore, therefore, can be a driver of the Australian Dollar. Generally, if the price of Iron Ore rises, AUD also goes up, as aggregate demand for the currency increases. The opposite is the case if the price of Iron Ore falls. Higher Iron Ore prices also tend to result in a greater likelihood of a positive Trade Balance for Australia, which is also positive of the AUD.
The Trade Balance, which is the difference between what a country earns from its exports versus what it pays for its imports, is another factor that can influence the value of the Australian Dollar. If Australia produces highly sought after exports, then its currency will gain in value purely from the surplus demand created from foreign buyers seeking to purchase its exports versus what it spends to purchase imports. Therefore, a positive net Trade Balance strengthens the AUD, with the opposite effect if the Trade Balance is negative.
- Gold price loses traction in Monday’s Asian session.
- The stronger USD undermines the yellow metal, while the dovish Fed might cap its downside.
- Traders will focus on the US PMI data ahead of the employment report on Friday.
The Gold price (XAU/USD) extends its decline below the $2,500 psychological level on Monday. The firmer Greenback after the US July's Personal Consumption Expenditures (PCE) Index has weighed on the precious metal. Furthermore, the concerns about the sluggish economy in China, the world’s top buyer of Gold, contribute to the precious metal’s downside.
Nonetheless, the rising expectation of an interest rate cut by the US Federal Reserve (Fed) in its September meeting might help limit Gold’s losses as lower interest rates reduce the opportunity cost of holding non-yielding gold. Looking ahead, the US ISM Manufacturing PMI for August is due on Tuesday, while the Services PMI will be released on Thursday. The attention will shift to the US employment data on Friday, including the Nonfarm Payrolls (NFP), Unemployment Rate and Average Hourly Earnings for August.
Daily Digest Market Movers: Gold price retreats after US PCE inflation report
- Protests have broken out across Israel after the country’s military recovered the bodies of six hostages it said Hamas had killed in Gaza. Israel’s largest labor group has called for a strike, saying the “entire Israeli economy will shut down” Monday, per CNN.
- Chinese NBS Manufacturing Purchasing Managers' Index (PMI) declined to 49.1 in August from 49.54 in July, missing the market consensus of 49.5. Non-Manufacturing PMI rose to 50.3 in August versus 50.2 prior, better than the estimates of 50.0.
- Data released by the US Bureau of Economic Analysis on Friday showed that the US headline Personal Consumption Expenditures (PCE) Price Index rose 2.5% YoY in July, compared to the previous reading of 2.5%, softer than the market expectations of 2.6%.
- The core PCE, which strips out volatile food and energy prices, climbed 2.6% YoY in July versus 2.6% prior, below the consensus of 2.7%.
- The markets are now pricing in a nearly 70% of 25 basis points (bps) rate cut by the Fed in September, while the odds of a 50 bps reduction are standing at 30%, according to the CME FedWatch tool.
Technical Analysis: Gold price maintains the constructive broader picture
The Gold price trades in negative territory on the day. The precious metal keeps the broader bullish context on the daily timeframe as the price holds above the key 100-day Exponential Moving Average (EMA). The 14-day Relative Strength Index (RSI) positions above the midline around 56.30, suggesting the path of least resistance is to the upside.
A five-month-old ascending channel’s upper boundary and the all-time high of $2,530-$2,540 appear to be a tough nut to crack for Gold bulls. A bullish breakout above this level could pave the way to the $2,600 psychological mark.
On the downside, the first downside target for yellow metal emerges at $2,470, the low of August 22. Sustained bearish momentum could set off a prolonged downward towards $2,432, the low of August 15. The next contention level to watch is $2,372, the 100-day EMA.
Gold FAQs
Gold has played a key role in human’s history as it has been widely used as a store of value and medium of exchange. Currently, apart from its shine and usage for jewelry, the precious metal is widely seen as a safe-haven asset, meaning that it is considered a good investment during turbulent times. Gold is also widely seen as a hedge against inflation and against depreciating currencies as it doesn’t rely on any specific issuer or government.
Central banks are the biggest Gold holders. In their aim to support their currencies in turbulent times, central banks tend to diversify their reserves and buy Gold to improve the perceived strength of the economy and the currency. High Gold reserves can be a source of trust for a country’s solvency. Central banks added 1,136 tonnes of Gold worth around $70 billion to their reserves in 2022, according to data from the World Gold Council. This is the highest yearly purchase since records began. Central banks from emerging economies such as China, India and Turkey are quickly increasing their Gold reserves.
Gold has an inverse correlation with the US Dollar and US Treasuries, which are both major reserve and safe-haven assets. When the Dollar depreciates, Gold tends to rise, enabling investors and central banks to diversify their assets in turbulent times. Gold is also inversely correlated with risk assets. A rally in the stock market tends to weaken Gold price, while sell-offs in riskier markets tend to favor the precious metal.
The price can move due to a wide range of factors. Geopolitical instability or fears of a deep recession can quickly make Gold price escalate due to its safe-haven status. As a yield-less asset, Gold tends to rise with lower interest rates, while higher cost of money usually weighs down on the yellow metal. Still, most moves depend on how the US Dollar (USD) behaves as the asset is priced in dollars (XAU/USD). A strong Dollar tends to keep the price of Gold controlled, whereas a weaker Dollar is likely to push Gold prices up.
| Raw materials | Closed | Change, % |
|---|---|---|
| Silver | 28.842 | -1.89 |
| Gold | 250.326 | -0.69 |
| Palladium | 966.17 | -1.26 |
China's Caixin Manufacturing Purchasing Managers' Index (PMI) jumped to 50.4 in August after recording 49.8 in July, the latest data showed on Monday.
The market forecast was for a 50.0 figure in the reported month.
Key highlights (via Caixin)
Faster output expansion in August.
Employment stabilises following 11-month run of decline.
Average selling prices fall alongside input costs.
“Supply and demand expanded at different paces. Manufacturers’ output grew for the 10th straight month in August, accelerating slightly from the previous month,” said Wang Zhe, an economist at Caixin Insight Group.
Wang added, “Demand picked up as total new orders resumed growth, with stronger demand for intermediate goods.”
Data released by China’s National Bureau of Statistics (NBS) showed Saturday that the official Manufacturing Purchasing Managers' Index (PMI) fell to 49.1 in August, missing estimates of 49.5. The Non-Manufacturing PMI rose to 50.3 in the same period vs. July’s 50.2 and the expected 50.0 print.
AUD/USD reaction to China’s PMI data
The upbeat Chinese Manufacturing PMI failed to have little to no impact on the Aussie Dollar, as AUD/USD keeps its range near 0.6770 at the time of writing, up 0.12% on the day.
Australian Dollar FAQs
One of the most significant factors for the Australian Dollar (AUD) is the level of interest rates set by the Reserve Bank of Australia (RBA). Because Australia is a resource-rich country another key driver is the price of its biggest export, Iron Ore. The health of the Chinese economy, its largest trading partner, is a factor, as well as inflation in Australia, its growth rate and Trade Balance. Market sentiment – whether investors are taking on more risky assets (risk-on) or seeking safe-havens (risk-off) – is also a factor, with risk-on positive for AUD.
The Reserve Bank of Australia (RBA) influences the Australian Dollar (AUD) by setting the level of interest rates that Australian banks can lend to each other. This influences the level of interest rates in the economy as a whole. The main goal of the RBA is to maintain a stable inflation rate of 2-3% by adjusting interest rates up or down. Relatively high interest rates compared to other major central banks support the AUD, and the opposite for relatively low. The RBA can also use quantitative easing and tightening to influence credit conditions, with the former AUD-negative and the latter AUD-positive.
China is Australia’s largest trading partner so the health of the Chinese economy is a major influence on the value of the Australian Dollar (AUD). When the Chinese economy is doing well it purchases more raw materials, goods and services from Australia, lifting demand for the AUD, and pushing up its value. The opposite is the case when the Chinese economy is not growing as fast as expected. Positive or negative surprises in Chinese growth data, therefore, often have a direct impact on the Australian Dollar and its pairs.
Iron Ore is Australia’s largest export, accounting for $118 billion a year according to data from 2021, with China as its primary destination. The price of Iron Ore, therefore, can be a driver of the Australian Dollar. Generally, if the price of Iron Ore rises, AUD also goes up, as aggregate demand for the currency increases. The opposite is the case if the price of Iron Ore falls. Higher Iron Ore prices also tend to result in a greater likelihood of a positive Trade Balance for Australia, which is also positive of the AUD.
The Trade Balance, which is the difference between what a country earns from its exports versus what it pays for its imports, is another factor that can influence the value of the Australian Dollar. If Australia produces highly sought after exports, then its currency will gain in value purely from the surplus demand created from foreign buyers seeking to purchase its exports versus what it spends to purchase imports. Therefore, a positive net Trade Balance strengthens the AUD, with the opposite effect if the Trade Balance is negative.
- GBP/USD holds positive ground near 1.3135 in Monday’s early Asian session.
- Fed rate cut expectations continue to undermine the US Dollar.
- The BoE is expected to cut one more 25 bps for the remaining year, according to a Reuters poll.
The GBP/USD pair gains ground around 1.3135, snapping the three-day losing streak during the early Asian session on Monday. In the absence of top-tier economic data releases from the UK this week, the USD price dynamic will be the main driver for the GBP/USD. The US Nonfarm Payrolls (NFP) for August will take center stage on Friday.
The US Federal Reserve (Fed) easing expectations remain weigh on the Greenback. Fed Chair Jerome Powell last week signalled that a rate cut was imminent, citing labor market concerns. According to the CME FedWatch tool, traders are now pricing in a nearly 70% of the 25 basis points (bps) rate cut by the Fed in September, while the odds of a 50 bps reduction stand at 30%.
The key US employment data on Friday will help determine whether the US Dollar (USD) recovery can continue. The US economy is expected to see 163K job additions in August, while the Unemployment Rate is expected to tick lower to 4.2%. Average Hourly Earnings are projected to rise to 0.3% MoM in July. In case of weaker-than-expected outcomes, this could raise concern about an economic slowdown in the US economy and drag the Greenback lower.
On the other hand, investors are gaining confidence that the policy-easing cycle by the Bank of England (BoE) will be gradual in the remainder of the year, which might lift the Pound Sterling (GBP). Economists anticipate one more 25 basis points (bps) rate cut from the BoE this year, according to a Reuters poll.
Euro FAQs
The Euro is the currency for the 20 European Union countries that belong to the Eurozone. It is the second most heavily traded currency in the world behind the US Dollar. In 2022, it accounted for 31% of all foreign exchange transactions, with an average daily turnover of over $2.2 trillion a day. EUR/USD is the most heavily traded currency pair in the world, accounting for an estimated 30% off all transactions, followed by EUR/JPY (4%), EUR/GBP (3%) and EUR/AUD (2%).
The European Central Bank (ECB) in Frankfurt, Germany, is the reserve bank for the Eurozone. The ECB sets interest rates and manages monetary policy. The ECB’s primary mandate is to maintain price stability, which means either controlling inflation or stimulating growth. Its primary tool is the raising or lowering of interest rates. Relatively high interest rates – or the expectation of higher rates – will usually benefit the Euro and vice versa. The ECB Governing Council makes monetary policy decisions at meetings held eight times a year. Decisions are made by heads of the Eurozone national banks and six permanent members, including the President of the ECB, Christine Lagarde.
Eurozone inflation data, measured by the Harmonized Index of Consumer Prices (HICP), is an important econometric for the Euro. If inflation rises more than expected, especially if above the ECB’s 2% target, it obliges the ECB to raise interest rates to bring it back under control. Relatively high interest rates compared to its counterparts will usually benefit the Euro, as it makes the region more attractive as a place for global investors to park their money.
Data releases gauge the health of the economy and can impact on the Euro. Indicators such as GDP, Manufacturing and Services PMIs, employment, and consumer sentiment surveys can all influence the direction of the single currency. A strong economy is good for the Euro. Not only does it attract more foreign investment but it may encourage the ECB to put up interest rates, which will directly strengthen the Euro. Otherwise, if economic data is weak, the Euro is likely to fall. Economic data for the four largest economies in the euro area (Germany, France, Italy and Spain) are especially significant, as they account for 75% of the Eurozone’s economy.
Another significant data release for the Euro is the Trade Balance. This indicator measures the difference between what a country earns from its exports and what it spends on imports over a given period. If a country produces highly sought after exports then its currency will gain in value purely from the extra demand created from foreign buyers seeking to purchase these goods. Therefore, a positive net Trade Balance strengthens a currency and vice versa for a negative balance.
- EUR/USD gains ground as the Fed is expected to deliver at least a 25-basis point rate cut in September.
- The US Dollar received support from July's Personal Consumption Expenditures (PCE) Index data released on Friday.
- ECB Governing Council member Francois Villeroy de Galhau favors the central bank considering a rate cut in September.
EUR/USD breaks its three-day losing streak, trading around 1.1050 during the Asian session on Monday. The upside of the EUR/USD pair could be attributed to the tepid US Dollar (USD) following the dovish sentiment surrounding the US Federal Reserve (Fed). However, the US July's Personal Consumption Expenditures (PCE) Index might have provided support for the Greenback and limited the upside of the pair.
On Friday, the US Bureau of Economic Analysis reported that the headline Personal Consumption Expenditures (PCE) Price Index increased by 2.5% year-over-year in July, matching the previous reading of 2.5% but falling short of the estimated 2.6%. Meanwhile, the core PCE, which excludes volatile food and energy prices, rose by 2.6% year-over-year in July, consistent with the prior figure of 2.6% but slightly below the consensus forecast of 2.7%.
According to the CME FedWatch Tool, markets are fully anticipating at least a 25 basis point (bps) rate cut by the Fed at its September meeting. Federal Reserve Atlanta President Raphael Bostic, a prominent hawk on the FOMC, indicated last week that it might be "time to move" on rate cuts due to further cooling inflation and a higher-than-expected unemployment rate. FXStreet’s FedTracker, which gauges the tone of Fed officials’ speeches on a dovish-to-hawkish scale from 0 to 10 using a custom AI model, rated Kashkari’s words as neutral with a score of 5.6.
European Central Bank (ECB) Governing Council member Francois Villeroy de Galhau stated on Friday, according to Bloomberg, that there are "good reasons" for the central bank to consider cutting its key interest rates in September. Galhau suggested that action should be taken at the upcoming meeting on September 12, noting that it would be both fair and prudent to decide on a new rate cut.
Euro FAQs
The Euro is the currency for the 20 European Union countries that belong to the Eurozone. It is the second most heavily traded currency in the world behind the US Dollar. In 2022, it accounted for 31% of all foreign exchange transactions, with an average daily turnover of over $2.2 trillion a day. EUR/USD is the most heavily traded currency pair in the world, accounting for an estimated 30% off all transactions, followed by EUR/JPY (4%), EUR/GBP (3%) and EUR/AUD (2%).
The European Central Bank (ECB) in Frankfurt, Germany, is the reserve bank for the Eurozone. The ECB sets interest rates and manages monetary policy. The ECB’s primary mandate is to maintain price stability, which means either controlling inflation or stimulating growth. Its primary tool is the raising or lowering of interest rates. Relatively high interest rates – or the expectation of higher rates – will usually benefit the Euro and vice versa. The ECB Governing Council makes monetary policy decisions at meetings held eight times a year. Decisions are made by heads of the Eurozone national banks and six permanent members, including the President of the ECB, Christine Lagarde.
Eurozone inflation data, measured by the Harmonized Index of Consumer Prices (HICP), is an important econometric for the Euro. If inflation rises more than expected, especially if above the ECB’s 2% target, it obliges the ECB to raise interest rates to bring it back under control. Relatively high interest rates compared to its counterparts will usually benefit the Euro, as it makes the region more attractive as a place for global investors to park their money.
Data releases gauge the health of the economy and can impact on the Euro. Indicators such as GDP, Manufacturing and Services PMIs, employment, and consumer sentiment surveys can all influence the direction of the single currency. A strong economy is good for the Euro. Not only does it attract more foreign investment but it may encourage the ECB to put up interest rates, which will directly strengthen the Euro. Otherwise, if economic data is weak, the Euro is likely to fall. Economic data for the four largest economies in the euro area (Germany, France, Italy and Spain) are especially significant, as they account for 75% of the Eurozone’s economy.
Another significant data release for the Euro is the Trade Balance. This indicator measures the difference between what a country earns from its exports and what it spends on imports over a given period. If a country produces highly sought after exports then its currency will gain in value purely from the extra demand created from foreign buyers seeking to purchase these goods. Therefore, a positive net Trade Balance strengthens a currency and vice versa for a negative balance.
The People’s Bank of China (PBOC) set the USD/CNY central rate for the trading session ahead on Monday at 7.1027, as against the previous day's fix of 7.1124 and 7.1030 Reuters estimates.
Protests have broken out across Israel after the country’s military recovered the bodies of six hostages it said Hamas had killed in Gaza. Israel’s largest labor group has called for a strike, saying the “entire Israeli economy will shut down” Monday, per CNN.
Prime Minister Benjamin Netanyahu faces fresh anger from critics who say he is prolonging the war rather than prioritizing the safe return of the roughly 100 remaining hostages in Gaza. The military conflict has already expanded to the West Bank and neighboring Lebanon, posing an imminent risk to the region in a wider war.
Market reaction
At the time of writing, the gold price (XAU/USD) is trading 0.02% lower on the day to trade at $2,502.
Risk sentiment FAQs
In the world of financial jargon the two widely used terms “risk-on” and “risk off'' refer to the level of risk that investors are willing to stomach during the period referenced. In a “risk-on” market, investors are optimistic about the future and more willing to buy risky assets. In a “risk-off” market investors start to ‘play it safe’ because they are worried about the future, and therefore buy less risky assets that are more certain of bringing a return, even if it is relatively modest.
Typically, during periods of “risk-on”, stock markets will rise, most commodities – except Gold – will also gain in value, since they benefit from a positive growth outlook. The currencies of nations that are heavy commodity exporters strengthen because of increased demand, and Cryptocurrencies rise. In a “risk-off” market, Bonds go up – especially major government Bonds – Gold shines, and safe-haven currencies such as the Japanese Yen, Swiss Franc and US Dollar all benefit.
The Australian Dollar (AUD), the Canadian Dollar (CAD), the New Zealand Dollar (NZD) and minor FX like the Ruble (RUB) and the South African Rand (ZAR), all tend to rise in markets that are “risk-on”. This is because the economies of these currencies are heavily reliant on commodity exports for growth, and commodities tend to rise in price during risk-on periods. This is because investors foresee greater demand for raw materials in the future due to heightened economic activity.
The major currencies that tend to rise during periods of “risk-off” are the US Dollar (USD), the Japanese Yen (JPY) and the Swiss Franc (CHF). The US Dollar, because it is the world’s reserve currency, and because in times of crisis investors buy US government debt, which is seen as safe because the largest economy in the world is unlikely to default. The Yen, from increased demand for Japanese government bonds, because a high proportion are held by domestic investors who are unlikely to dump them – even in a crisis. The Swiss Franc, because strict Swiss banking laws offer investors enhanced capital protection.
| Index | Change, points | Closed | Change, % |
|---|---|---|---|
| NIKKEI 225 | 285.22 | 38647.75 | 0.74 |
| Hang Seng | 202.75 | 17989.07 | 1.14 |
| KOSPI | 12.03 | 2674.31 | 0.45 |
| ASX 200 | 46.8 | 8091.9 | 0.58 |
| DAX | -5.65 | 18906.92 | -0.03 |
| CAC 40 | -10 | 7630.95 | -0.13 |
| Dow Jones | 228.03 | 41563.08 | 0.55 |
| S&P 500 | 56.44 | 5648.4 | 1.01 |
| NASDAQ Composite | 197.19 | 17713.62 | 1.13 |
European Central Bank (ECB) Governing Council member Francois Villeroy de Galhau said on Friday that there are "good reasons" for the central bank to consider cutting its key interest rates in September, per Bloomberg.
Key quotes
Our meeting on Sept. 12 should in my view take action.
It would be fair and wise to decide on a new rate cut.
I’m calling for active and pragmatic gradualism, which means being guided both by data — observed inflation — but also expectations and forecasts.
The market expects interest rates in the euro area next year between 2% and 2.5%.
Market reaction
At the time of press, the EUR/USD pair was down 0.01% on the day at 1.1047.
ECB FAQs
The European Central Bank (ECB) in Frankfurt, Germany, is the reserve bank for the Eurozone. The ECB sets interest rates and manages monetary policy for the region. The ECB primary mandate is to maintain price stability, which means keeping inflation at around 2%. Its primary tool for achieving this is by raising or lowering interest rates. Relatively high interest rates will usually result in a stronger Euro and vice versa. The ECB Governing Council makes monetary policy decisions at meetings held eight times a year. Decisions are made by heads of the Eurozone national banks and six permanent members, including the President of the ECB, Christine Lagarde.
In extreme situations, the European Central Bank can enact a policy tool called Quantitative Easing. QE is the process by which the ECB prints Euros and uses them to buy assets – usually government or corporate bonds – from banks and other financial institutions. QE usually results in a weaker Euro. QE is a last resort when simply lowering interest rates is unlikely to achieve the objective of price stability. The ECB used it during the Great Financial Crisis in 2009-11, in 2015 when inflation remained stubbornly low, as well as during the covid pandemic.
Quantitative tightening (QT) is the reverse of QE. It is undertaken after QE when an economic recovery is underway and inflation starts rising. Whilst in QE the European Central Bank (ECB) purchases government and corporate bonds from financial institutions to provide them with liquidity, in QT the ECB stops buying more bonds, and stops reinvesting the principal maturing on the bonds it already holds. It is usually positive (or bullish) for the Euro.
| Pare | Closed | Change, % |
|---|---|---|
| AUDUSD | 0.67648 | -0.48 |
| EURJPY | 161.515 | 0.58 |
| EURUSD | 1.10477 | -0.27 |
| GBPJPY | 191.936 | 0.58 |
| GBPUSD | 1.31288 | -0.28 |
| NZDUSD | 0.62478 | -0.15 |
| USDCAD | 1.34918 | 0.06 |
| USDCHF | 0.84983 | 0.32 |
| USDJPY | 146.192 | 0.86 |
China’s official Manufacturing Purchasing Managers' Index (PMI) dropped to 49.1 in August, compared to 49.5 in the previous reading. The reading missed the market consensus of 49.5 in the reported month.
The NBS Non-Manufacturing PMI rose to 50.3 in August versus July’s 50.2 figure and the estimates of 50.0.
Market reaction
At the time of writing, the AUD/USD pair is trading around 0.6767, up 0.03% on the day.
Australian Dollar FAQs
One of the most significant factors for the Australian Dollar (AUD) is the level of interest rates set by the Reserve Bank of Australia (RBA). Because Australia is a resource-rich country another key driver is the price of its biggest export, Iron Ore. The health of the Chinese economy, its largest trading partner, is a factor, as well as inflation in Australia, its growth rate and Trade Balance. Market sentiment – whether investors are taking on more risky assets (risk-on) or seeking safe-havens (risk-off) – is also a factor, with risk-on positive for AUD.
The Reserve Bank of Australia (RBA) influences the Australian Dollar (AUD) by setting the level of interest rates that Australian banks can lend to each other. This influences the level of interest rates in the economy as a whole. The main goal of the RBA is to maintain a stable inflation rate of 2-3% by adjusting interest rates up or down. Relatively high interest rates compared to other major central banks support the AUD, and the opposite for relatively low. The RBA can also use quantitative easing and tightening to influence credit conditions, with the former AUD-negative and the latter AUD-positive.
China is Australia’s largest trading partner so the health of the Chinese economy is a major influence on the value of the Australian Dollar (AUD). When the Chinese economy is doing well it purchases more raw materials, goods and services from Australia, lifting demand for the AUD, and pushing up its value. The opposite is the case when the Chinese economy is not growing as fast as expected. Positive or negative surprises in Chinese growth data, therefore, often have a direct impact on the Australian Dollar and its pairs.
Iron Ore is Australia’s largest export, accounting for $118 billion a year according to data from 2021, with China as its primary destination. The price of Iron Ore, therefore, can be a driver of the Australian Dollar. Generally, if the price of Iron Ore rises, AUD also goes up, as aggregate demand for the currency increases. The opposite is the case if the price of Iron Ore falls. Higher Iron Ore prices also tend to result in a greater likelihood of a positive Trade Balance for Australia, which is also positive of the AUD.
The Trade Balance, which is the difference between what a country earns from its exports versus what it pays for its imports, is another factor that can influence the value of the Australian Dollar. If Australia produces highly sought after exports, then its currency will gain in value purely from the surplus demand created from foreign buyers seeking to purchase its exports versus what it spends to purchase imports. Therefore, a positive net Trade Balance strengthens the AUD, with the opposite effect if the Trade Balance is negative.


© 2000-2026. Bản quyền Teletrade.
Trang web này được quản lý bởi Teletrade D.J. LLC 2351 LLC 2022 (Euro House, Richmond Hill Road, Kingstown, VC0100, St. Vincent and the Grenadines).
Thông tin trên trang web không phải là cơ sở để đưa ra quyết định đầu tư và chỉ được cung cấp cho mục đích làm quen.
Giao dịch trên thị trường tài chính (đặc biệt là giao dịch sử dụng các công cụ biên) mở ra những cơ hội lớn và tạo điều kiện cho các nhà đầu tư sẵn sàng mạo hiểm để thu lợi nhuận, tuy nhiên nó mang trong mình nguy cơ rủi ro khá cao. Chính vì vậy trước khi tiến hành giao dịch cần phải xem xét mọi mặt vấn đề chấp nhận tiến hành giao dịch cụ thể xét theo quan điểm của nguồn lực tài chính sẵn có và mức độ am hiểu thị trường tài chính.
Sử dụng thông tin: sử dụng toàn bộ hay riêng biệt các dữ liệu trên trang web của công ty TeleTrade như một nguồn cung cấp thông tin nhất định. Việc sử dụng tư liệu từ trang web cần kèm theo liên kết đến trang teletrade.vn. Việc tự động thu thập số liệu cũng như thông tin từ trang web TeleTrade đều không được phép.
Xin vui lòng liên hệ với pr@teletrade.global nếu có câu hỏi.
ngân hàng