- Phân tích
- Tin tức và các công cụ
- Tin tức thị trường
Tin tức thì trường
- EUR/USD bumps back over 1.0900 after bad US NFP print.
- Broad-market concerns of a US slowdown jumped on Friday.
- Coming up next week: US ISM Manufacturing PMI, EU Retail Sales
EUR/USD caught a ride higher on Friday after the Greenback got pummeled following a bad data beat in US Nonfarm Payroll (NFP) figures. Market fears of an accelerating economic slowdown in the US sparked a firm risk-off bid throughout global markets, but with US data going too far into the red too fast, the US Dollar got caught up in the stampede and tumbled across the board.
Forecasting the Coming Week: Focus remains on data and rate cut bets
The latest US NFP labor data revealed that the US added 114K net new jobs in July, falling short of the expected 175K. Additionally, the previous month's figure was revised down to 179K from the initial 206K. The US Unemployment Rate also increased to 4.3%, the highest level since November 2021, while the U6 Underemployment Rate rose to 7.8% from 7.4% as employed individuals faced challenges in securing jobs with sufficient hours.
Average Hourly Earnings growth slowed to 0.2% month-over-month, below the anticipated 0.3%, and the year-over-year wages growth decreased to 3.6% from the previous 3.8%.
Friday’s US NFP labor data dump showed the US added 114K net new jobs in July, well below the forecast 175K and the previous month’s figure was revised to 179K from the initial print of 206K. The US Unemployment Rate also ticked higher to 4.3%, the highest reading since November of 2021, while the U6 Underemployment Rate rose to 7.8% from 7.4% as employed people struggle to find jobs that provide enough hours.
Average Hourly Earnings growth also eased to 0.2% MoM from the expected hold at 0.3%, with YoY wages growth cooling to 3.6% from the previous 3.8%.
Economic Indicator
Nonfarm Payrolls
The Nonfarm Payrolls release presents the number of new jobs created in the US during the previous month in all non-agricultural businesses; it is released by the US Bureau of Labor Statistics (BLS). The monthly changes in payrolls can be extremely volatile. The number is also subject to strong reviews, which can also trigger volatility in the Forex board. Generally speaking, a high reading is seen as bullish for the US Dollar (USD), while a low reading is seen as bearish, although previous months' reviews and the Unemployment Rate are as relevant as the headline figure. The market's reaction, therefore, depends on how the market assesses all the data contained in the BLS report as a whole.
Read more.Last release: Fri Aug 02, 2024 12:30
Frequency: Monthly
Actual: 114K
Consensus: 175K
Previous: 206K
Source: US Bureau of Labor Statistics
America’s monthly jobs report is considered the most important economic indicator for forex traders. Released on the first Friday following the reported month, the change in the number of positions is closely correlated with the overall performance of the economy and is monitored by policymakers. Full employment is one of the Federal Reserve’s mandates and it considers developments in the labor market when setting its policies, thus impacting currencies. Despite several leading indicators shaping estimates, Nonfarm Payrolls tend to surprise markets and trigger substantial volatility. Actual figures beating the consensus tend to be USD bullish.
With US economic data turning broadly sour, investors extended a two-day decline on growing fears of a broad recession within the domestic US economy, sparking a flight out of risk assets and sending equity indexes broadly lower. According to the CME’s FedWatch Tool, rate traders have fully priced in a rate cut in September, with 70% odds of a double-cut for 50 basis points when the Fed gives its rate call on September 18.
Coming up next week, the US will see July’s ISM Manufacturing Purchasing Managers Index (PMI) Figures on Monday, which is forecast to increase to 51.0 MoM and cross back over into expansion territory compared to June’s contractionary 48.8. Pan-European Retail Sales for the year ended in June are slated for early Tuesday, and median market forecasts expect a slight cooling to 0.2% from the previous 0.3%.
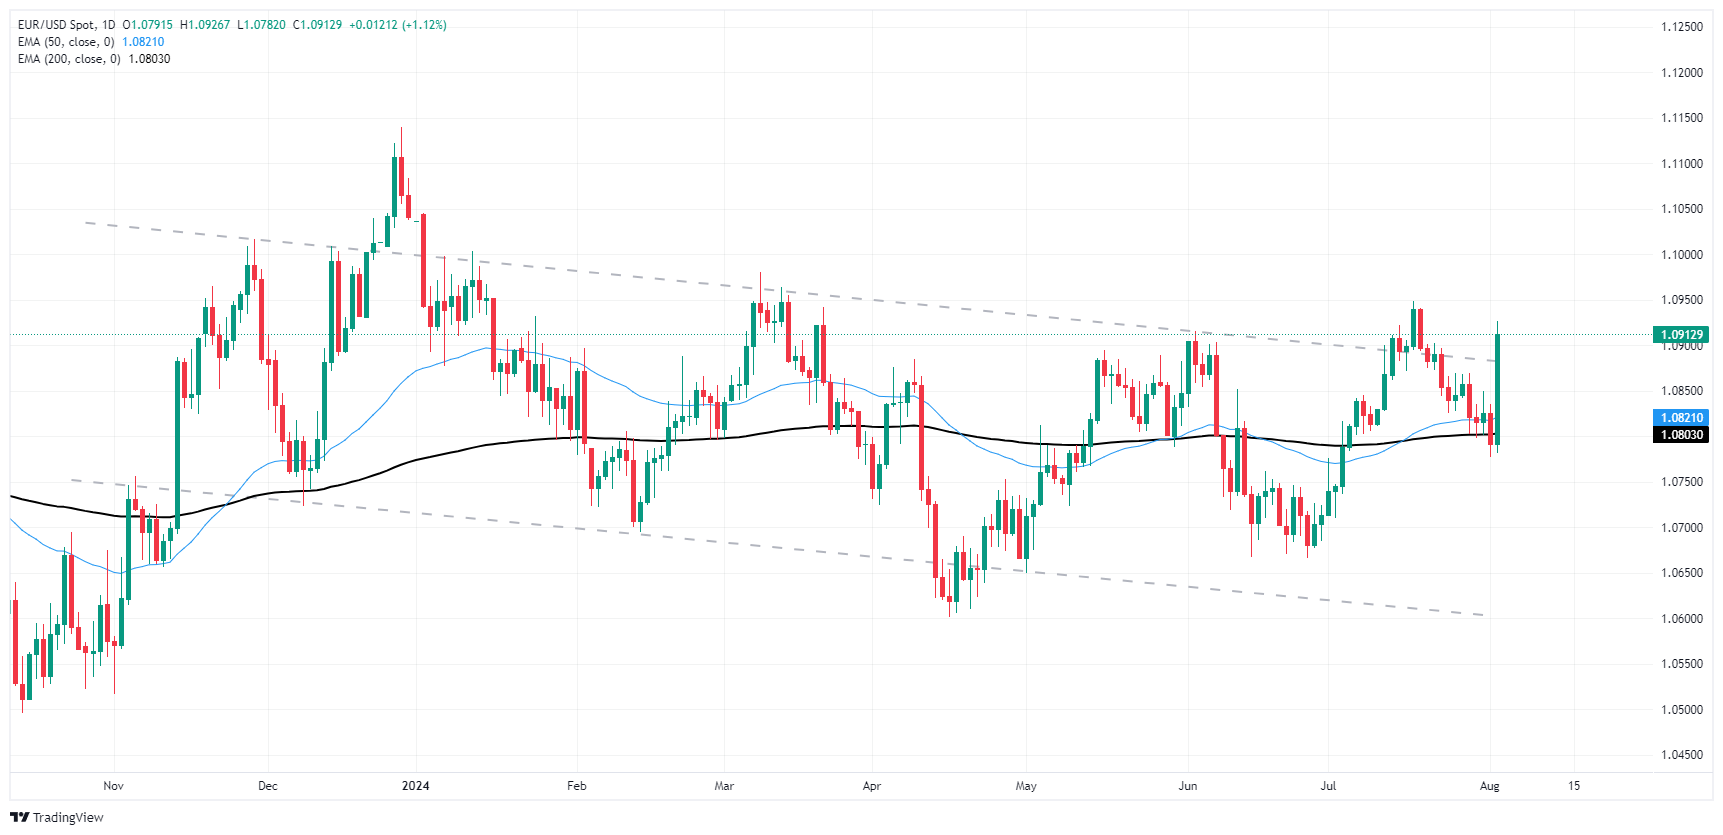
EUR/USD technical outlook
The Fiber’s Friday breakout shot EUR/USD back out the top end of a sloppy descending channel on daily candlesticks, bit price action still has ground to cover before recovering enough ground to make another attempt at cracking through 1.0950.
If bidders are able to extend momentum, EUR/USD is on pace to bake in a technical rejection from the 200-day Exponential Moving Average (EMA) at 1.0802, while sellers will be looking to push bids back down into a short side move back towards the last swing low below 1.0700.
EUR/USD daily chart
Euro FAQs
The Euro is the currency for the 20 European Union countries that belong to the Eurozone. It is the second most heavily traded currency in the world behind the US Dollar. In 2022, it accounted for 31% of all foreign exchange transactions, with an average daily turnover of over $2.2 trillion a day. EUR/USD is the most heavily traded currency pair in the world, accounting for an estimated 30% off all transactions, followed by EUR/JPY (4%), EUR/GBP (3%) and EUR/AUD (2%).
The European Central Bank (ECB) in Frankfurt, Germany, is the reserve bank for the Eurozone. The ECB sets interest rates and manages monetary policy. The ECB’s primary mandate is to maintain price stability, which means either controlling inflation or stimulating growth. Its primary tool is the raising or lowering of interest rates. Relatively high interest rates – or the expectation of higher rates – will usually benefit the Euro and vice versa. The ECB Governing Council makes monetary policy decisions at meetings held eight times a year. Decisions are made by heads of the Eurozone national banks and six permanent members, including the President of the ECB, Christine Lagarde.
Eurozone inflation data, measured by the Harmonized Index of Consumer Prices (HICP), is an important econometric for the Euro. If inflation rises more than expected, especially if above the ECB’s 2% target, it obliges the ECB to raise interest rates to bring it back under control. Relatively high interest rates compared to its counterparts will usually benefit the Euro, as it makes the region more attractive as a place for global investors to park their money.
Data releases gauge the health of the economy and can impact on the Euro. Indicators such as GDP, Manufacturing and Services PMIs, employment, and consumer sentiment surveys can all influence the direction of the single currency. A strong economy is good for the Euro. Not only does it attract more foreign investment but it may encourage the ECB to put up interest rates, which will directly strengthen the Euro. Otherwise, if economic data is weak, the Euro is likely to fall. Economic data for the four largest economies in the euro area (Germany, France, Italy and Spain) are especially significant, as they account for 75% of the Eurozone’s economy.
Another significant data release for the Euro is the Trade Balance. This indicator measures the difference between what a country earns from its exports and what it spends on imports over a given period. If a country produces highly sought after exports then its currency will gain in value purely from the extra demand created from foreign buyers seeking to purchase these goods. Therefore, a positive net Trade Balance strengthens a currency and vice versa for a negative balance.
- Despite the predominantly bearish trend, NZD/USD exhibits signs of a mild rebound.
- Key resistance is noted at 0.5980, with a substantial support level observed around 0.5760.
- Daily RSI fluctuates under the 50-mark, indicating lasting bearish sentiment, but a recent recovery above 40 shows traces of bullish momentum.
The NZD/USD pair, while majorly sticking to its bearish course, has been showing signs of a mild uptrend over the end of the week and rose to 0.5960. The lows and highs are reaching slightly higher values, which, coupled with the formation of a slight handle-like pattern, indicates a probable bullish rally in the near future.
The daily Relative Strength Index (RSI) has largely been stationed below the mid-point although recent trading sessions have shown some recovery with the index breaching the 40-threshold mark. This incremental shift from the prevalent trend, while indicating ongoing bearish influence, provides a glimpse of potential bullish sentiment in future sessions.
The Moving Average Convergence Divergence (MACD) continues its stance below the signal line. However, the histogram's diminishing red bars could potentially reveal an impending bullish crossover.
NZD/USD daily chart
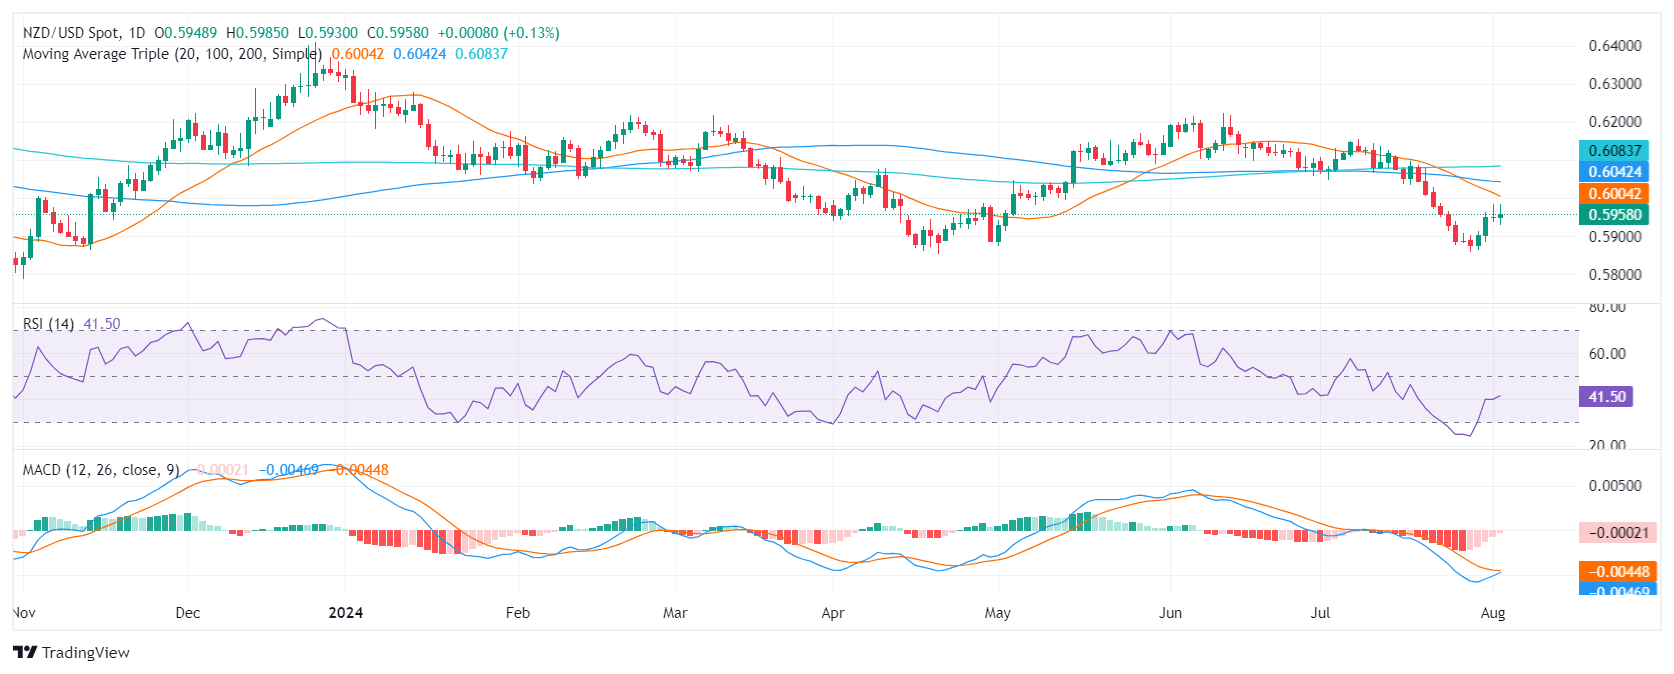
The pair has solidified its new support level around 0.5760, 0.5800, and 0.5850, now facing resistance at 0.5980, 0.6000 and 0.6030.
- The NZD/JPY maintains its bearish outlook, shattering key support levels with consistent negative sessions.
- The chance for any salvation relies on the drastic dip in the RSI in the oversold terrain.
The NZD/JPY pair persists in its downward movement, now slipping below the key 89.00 level. The cross pair has consecutively recorded losses, exhibiting a bearish image, and reinforcing a robust bearish momentum. Compared to recent weeks, the currency pair has declined by over 7%, beneath the crucial 200-day Simple Moving Average (SMA).
Even as the pair continues its steady drop, daily technical indicators such as the Relative Strength Index (RSI) are indicating extreme oversold conditions. Such conditions potentially hint towards a nearing phase of stable trading, despite the persistent falling. The RSI is marked well below 20, suggesting a prolonged period of selling pressure. This extended sell-off may also be indicative of an impending reversal in trend. Correspondingly, the Moving Average Convergence Divergence (MACD) reveals a series of rising red bars, illustrating an increase in selling momentum.
NZD/JPY daily chart
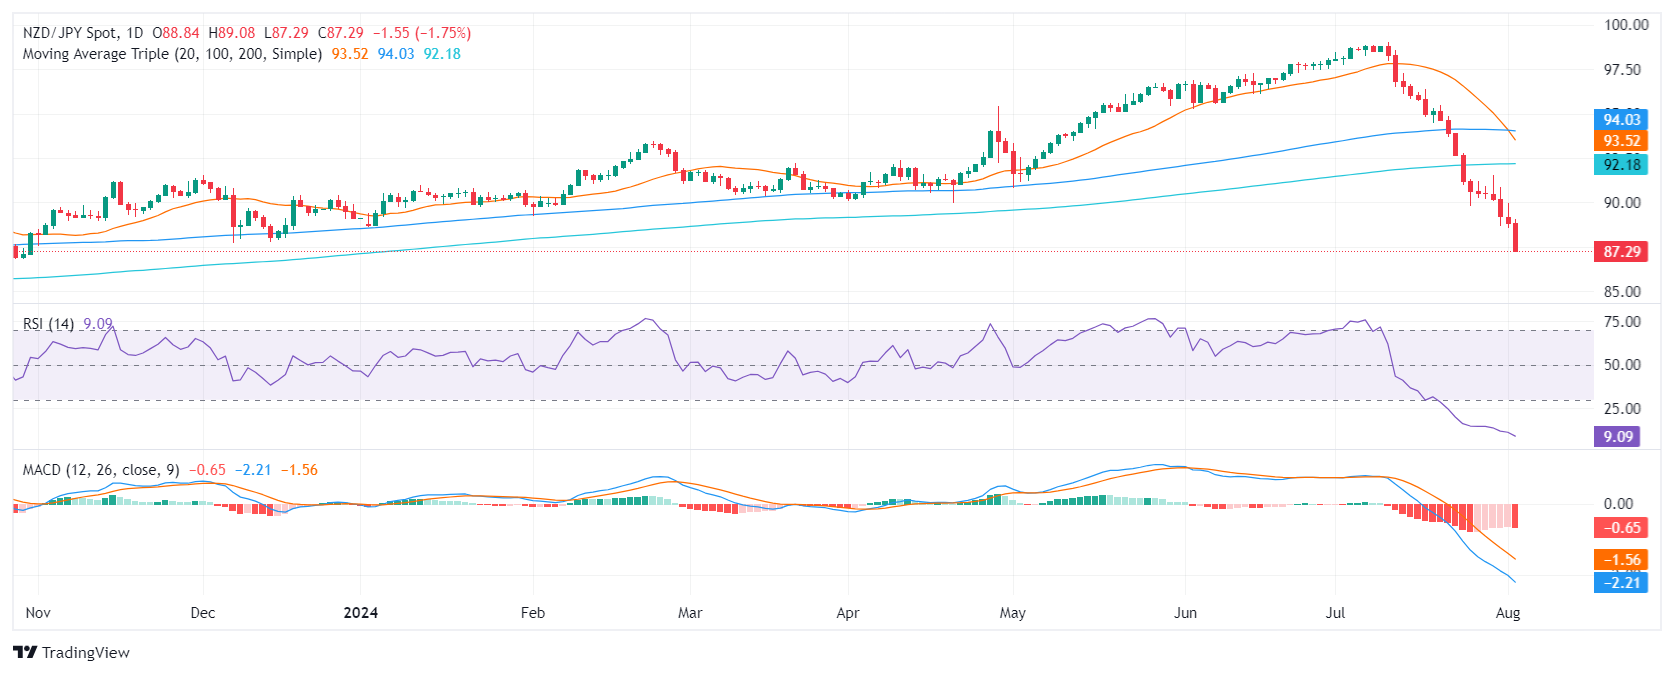
Located below the 90.00 level, the pair is striving to hold a significant support level at 87.00, 86.50, and 86.00. Conversely, resistances are observed around 89.00, followed by more robust resistance around the 200-day SMA, potentially near 92.00.
- GBP/USD found a foothold on Friday after wide miss in US data.
- US NFP showed the lowest initial print in years as job market cools.
- Coming up next week: US ISM Services PMI, UK BRC Retail Sales.
GBP/USD wrapped up the trading week with a last-minute win after a misfire in US Nonfarm Payrolls (NFP) kicked the Greenback lower across the board. This gave the Pound Sterling a foothold, but still ended the week lower against the USD.
Forecasting the Coming Week: Focus remains on data and rate cut bets
The Pound Sterling deflated this week after the Bank of England (BoE) delivered a widely-expected quarter-point rate cut early Thursday, while US jobs data flashed further warning signs that the US economy may be turning south quicker than investors initially expected.
The latest US NFP labor data revealed that the US added 114K net new jobs in July, falling short of the expected 175K. Additionally, the previous month's figure was revised down to 179K from the initial 206K. The US Unemployment Rate also increased to 4.3%, the highest level since November 2021, while the U6 Underemployment Rate rose to 7.8% from 7.4% as employed individuals faced challenges in securing jobs with sufficient hours.
Average Hourly Earnings growth slowed to 0.2% month-over-month, below the anticipated 0.3%, and the year-over-year wages growth decreased to 3.6% from the previous 3.8%.
Economic Indicator
Nonfarm Payrolls
The Nonfarm Payrolls release presents the number of new jobs created in the US during the previous month in all non-agricultural businesses; it is released by the US Bureau of Labor Statistics (BLS). The monthly changes in payrolls can be extremely volatile. The number is also subject to strong reviews, which can also trigger volatility in the Forex board. Generally speaking, a high reading is seen as bullish for the US Dollar (USD), while a low reading is seen as bearish, although previous months' reviews and the Unemployment Rate are as relevant as the headline figure. The market's reaction, therefore, depends on how the market assesses all the data contained in the BLS report as a whole.
Read more.Last release: Fri Aug 02, 2024 12:30
Frequency: Monthly
Actual: 114K
Consensus: 175K
Previous: 206K
Source: US Bureau of Labor Statistics
America’s monthly jobs report is considered the most important economic indicator for forex traders. Released on the first Friday following the reported month, the change in the number of positions is closely correlated with the overall performance of the economy and is monitored by policymakers. Full employment is one of the Federal Reserve’s mandates and it considers developments in the labor market when setting its policies, thus impacting currencies. Despite several leading indicators shaping estimates, Nonfarm Payrolls tend to surprise markets and trigger substantial volatility. Actual figures beating the consensus tend to be USD bullish.
Given the generally disappointing US economic data, investors reacted by extending a two-day decline amidst increasing concerns about a potential widespread recession in the domestic US economy. This prompted a move away from risky assets and led to broad declines in equity indexes. As per the CME's FedWatch Tool, rate traders have completely priced in a rate cut in September, with a 70% chance of a double-cut amounting to 50 basis points, when the Fed announces its rate decision on September 18.
Coming up next week, the US will see July’s ISM Manufacturing Purchasing Managers Index (PMI) Figures on Monday, which is forecast to increase to 51.0 MoM and cross back over into expansion territory compared to June’s contractionary 48.8. On the UK side, BRC Like-For-Like Retail Sales for the year ended in July is expected to recover to 0.3% after the previous period’s -0.5% contraction.
GBP/USD technical outlook
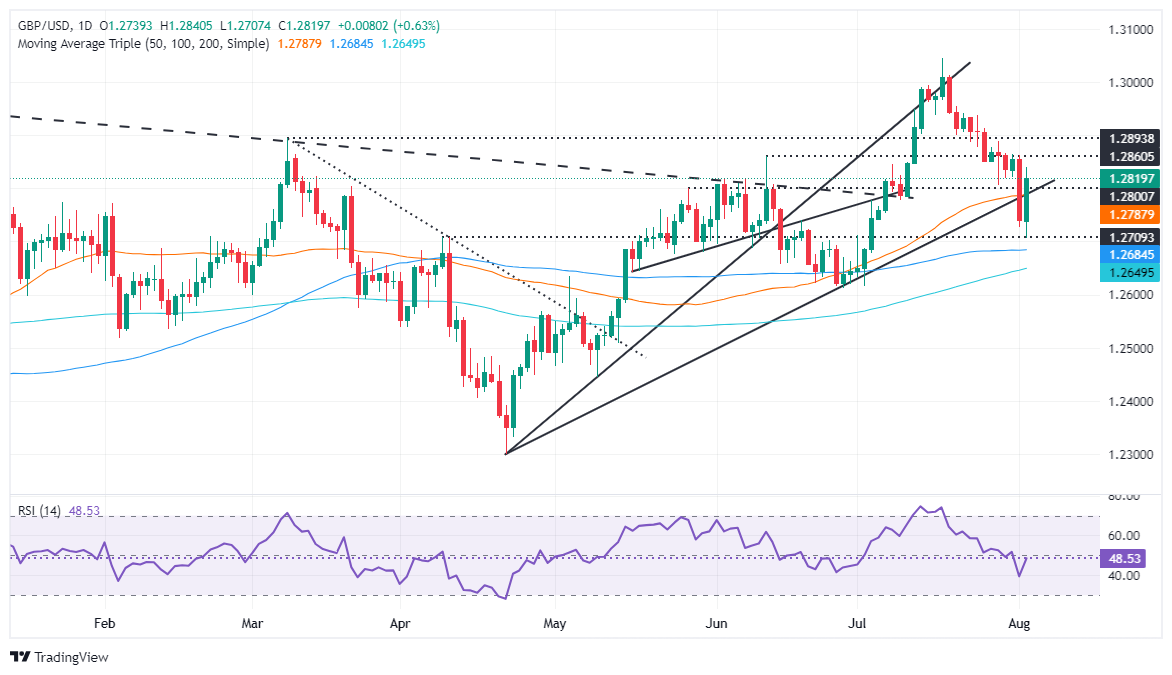
The Cable chalked in a third straight down week, falling -2.58% peak-to-trough after setting a 12-month peak of 1.3045 in mid-July. Bidders are coming out of the woodwork to keep GBP buoyed into the 1.2800 handle, but downside momentum remains strong.
Price action continues to hold on the high side of the 200-day Exponential Moving Average (EMA) at 1.2645, but intraday bids are struggling to vault back over the 50-day EMA at 1.2790.
GBP/USD daily chart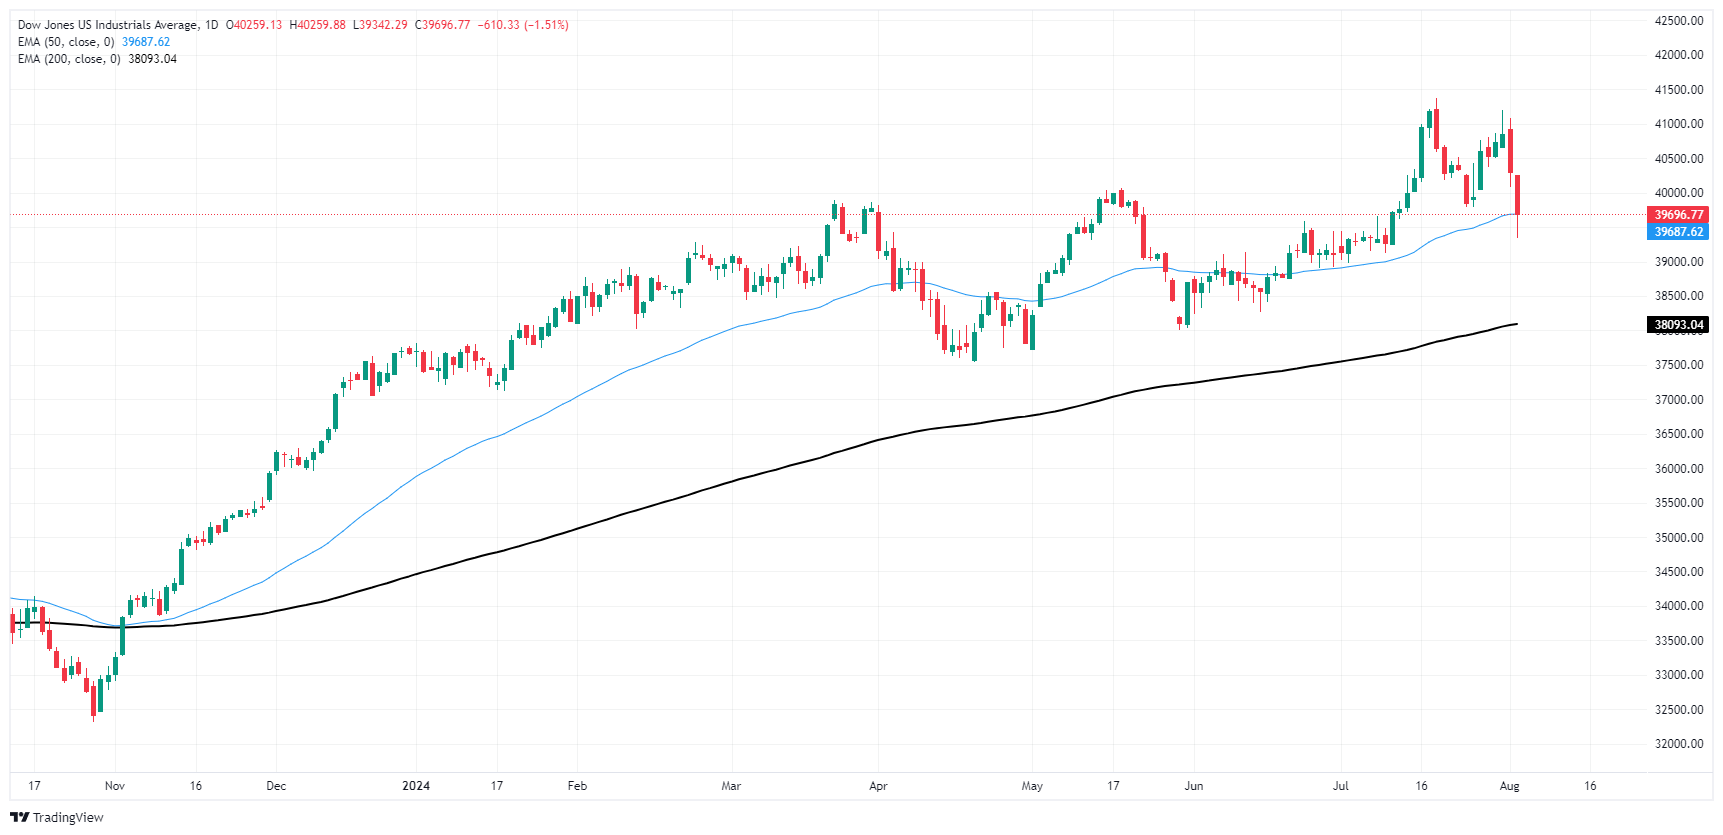
Pound Sterling FAQs
The Pound Sterling (GBP) is the oldest currency in the world (886 AD) and the official currency of the United Kingdom. It is the fourth most traded unit for foreign exchange (FX) in the world, accounting for 12% of all transactions, averaging $630 billion a day, according to 2022 data. Its key trading pairs are GBP/USD, aka ‘Cable’, which accounts for 11% of FX, GBP/JPY, or the ‘Dragon’ as it is known by traders (3%), and EUR/GBP (2%). The Pound Sterling is issued by the Bank of England (BoE).
The single most important factor influencing the value of the Pound Sterling is monetary policy decided by the Bank of England. The BoE bases its decisions on whether it has achieved its primary goal of “price stability” – a steady inflation rate of around 2%. Its primary tool for achieving this is the adjustment of interest rates. When inflation is too high, the BoE will try to rein it in by raising interest rates, making it more expensive for people and businesses to access credit. This is generally positive for GBP, as higher interest rates make the UK a more attractive place for global investors to park their money. When inflation falls too low it is a sign economic growth is slowing. In this scenario, the BoE will consider lowering interest rates to cheapen credit so businesses will borrow more to invest in growth-generating projects.
Data releases gauge the health of the economy and can impact the value of the Pound Sterling. Indicators such as GDP, Manufacturing and Services PMIs, and employment can all influence the direction of the GBP. A strong economy is good for Sterling. Not only does it attract more foreign investment but it may encourage the BoE to put up interest rates, which will directly strengthen GBP. Otherwise, if economic data is weak, the Pound Sterling is likely to fall.
Another significant data release for the Pound Sterling is the Trade Balance. This indicator measures the difference between what a country earns from its exports and what it spends on imports over a given period. If a country produces highly sought-after exports, its currency will benefit purely from the extra demand created from foreign buyers seeking to purchase these goods. Therefore, a positive net Trade Balance strengthens a currency and vice versa for a negative balance.
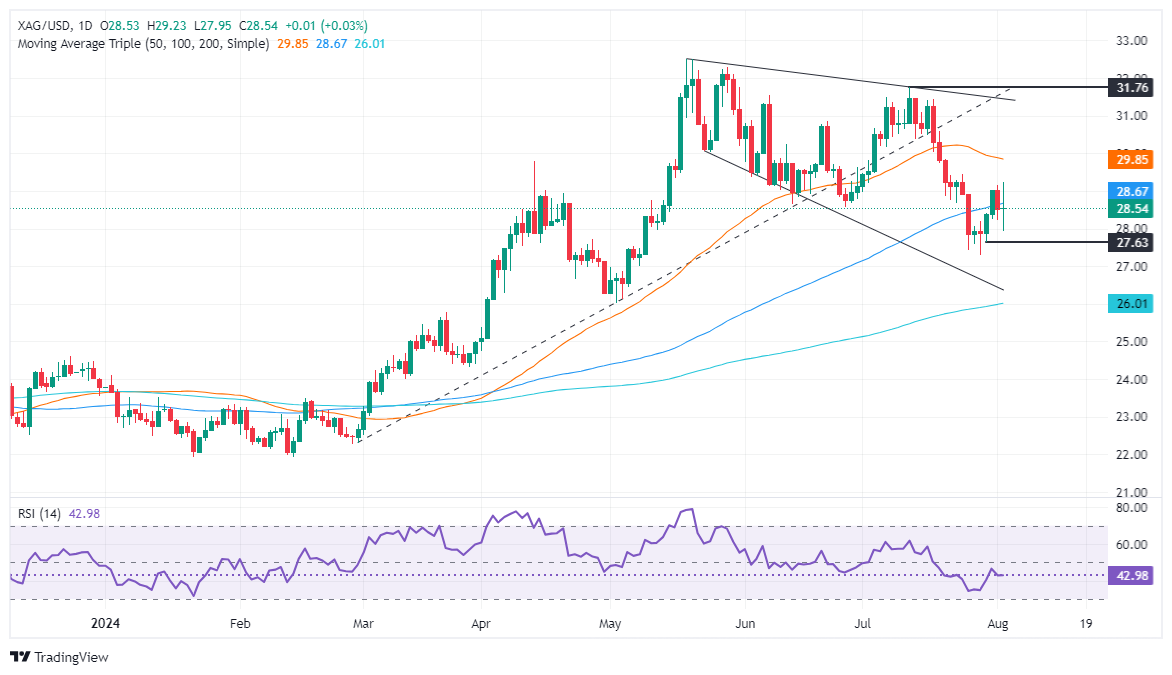
- Silver hits weekly high of $29.22 before stabilizing at $28.49, down 0.02%.
- Technical outlook: Closing above 100-DMA ($28.69) may trigger rally to $29.00 and $29.50.
- Bearish scenario if XAG/USD falls below $28.00, targeting $27.95, July 29 low ($27.31), and 200-DMA ($26.00).
Silver's price was virtually unchanged late in the North American session after whipsawing following US Nonfarm Payrolls data. The grey metal-stabilized below the 100-day moving average (DMA) and traded at $28.49, registering minimal losses of 0.02%.
XAG/USD Price Analysis: Technical outlook
Silver trades at around its opening price after hitting a new weekly high of $29.22, a move that was quickly rejected amid profit-taking in the precious metal segment, led by Gold. The XAG/USD dived below $28.00 following the spike on NFP release before buyers recovered the latter and lifted spot prices to the current price level.
If Silver closes above the 100-DMA at $28.69, that could sponsor a rally toward $29.00 in the upcoming week, followed by the $29.50 mark, which capped prices from July 22 to 24, before collapsing.
Conversely, bears would be in play if they drag XAG/USD below $28.00, exposing the day’s low of $27.95. Further losses hover underneath that level and push Silver to test the July 29 bottom at $27.31, ahead of dropping to the 200-DMA at $26.00.
XAG/USD Price Action – Daily Chart
Silver FAQs
Silver is a precious metal highly traded among investors. It has been historically used as a store of value and a medium of exchange. Although less popular than Gold, traders may turn to Silver to diversify their investment portfolio, for its intrinsic value or as a potential hedge during high-inflation periods. Investors can buy physical Silver, in coins or in bars, or trade it through vehicles such as Exchange Traded Funds, which track its price on international markets.
Silver prices can move due to a wide range of factors. Geopolitical instability or fears of a deep recession can make Silver price escalate due to its safe-haven status, although to a lesser extent than Gold's. As a yieldless asset, Silver tends to rise with lower interest rates. Its moves also depend on how the US Dollar (USD) behaves as the asset is priced in dollars (XAG/USD). A strong Dollar tends to keep the price of Silver at bay, whereas a weaker Dollar is likely to propel prices up. Other factors such as investment demand, mining supply – Silver is much more abundant than Gold – and recycling rates can also affect prices.
Silver is widely used in industry, particularly in sectors such as electronics or solar energy, as it has one of the highest electric conductivity of all metals – more than Copper and Gold. A surge in demand can increase prices, while a decline tends to lower them. Dynamics in the US, Chinese and Indian economies can also contribute to price swings: for the US and particularly China, their big industrial sectors use Silver in various processes; in India, consumers’ demand for the precious metal for jewellery also plays a key role in setting prices.
Silver prices tend to follow Gold's moves. When Gold prices rise, Silver typically follows suit, as their status as safe-haven assets is similar. The Gold/Silver ratio, which shows the number of ounces of Silver needed to equal the value of one ounce of Gold, may help to determine the relative valuation between both metals. Some investors may consider a high ratio as an indicator that Silver is undervalued, or Gold is overvalued. On the contrary, a low ratio might suggest that Gold is undervalued relative to Silver.
- AUD/JPY pair sustains a dominant bearish trend, eying significant support around 95.30.
- Daily indicators signal a possible market exhaustion with RSI dropping to 18.
- Pair spirals through the support level of 97.00, directing attention to the critical 95.30 support line.
On Friday, the AUD/JPY pair magnifies the bearish sentiment, recording substantial losses with a 5% weekly loss. The decreasing trading volume reinforces the apparent weakening interest among traders and with the pair breaking through the secondary support of 97.00, the market now keeps an eye on the critical 95.30 benchmark.
The Relative Strength Index (RSI) has dived drastically below the 30 mark and is now deep in the oversold zone. This extreme selling activity hints at a potential price reversal due to market exhaustion. Meanwhile, the Moving Average Convergence Divergence (MACD) continues printing red bars.
AUD/JPY daily chart
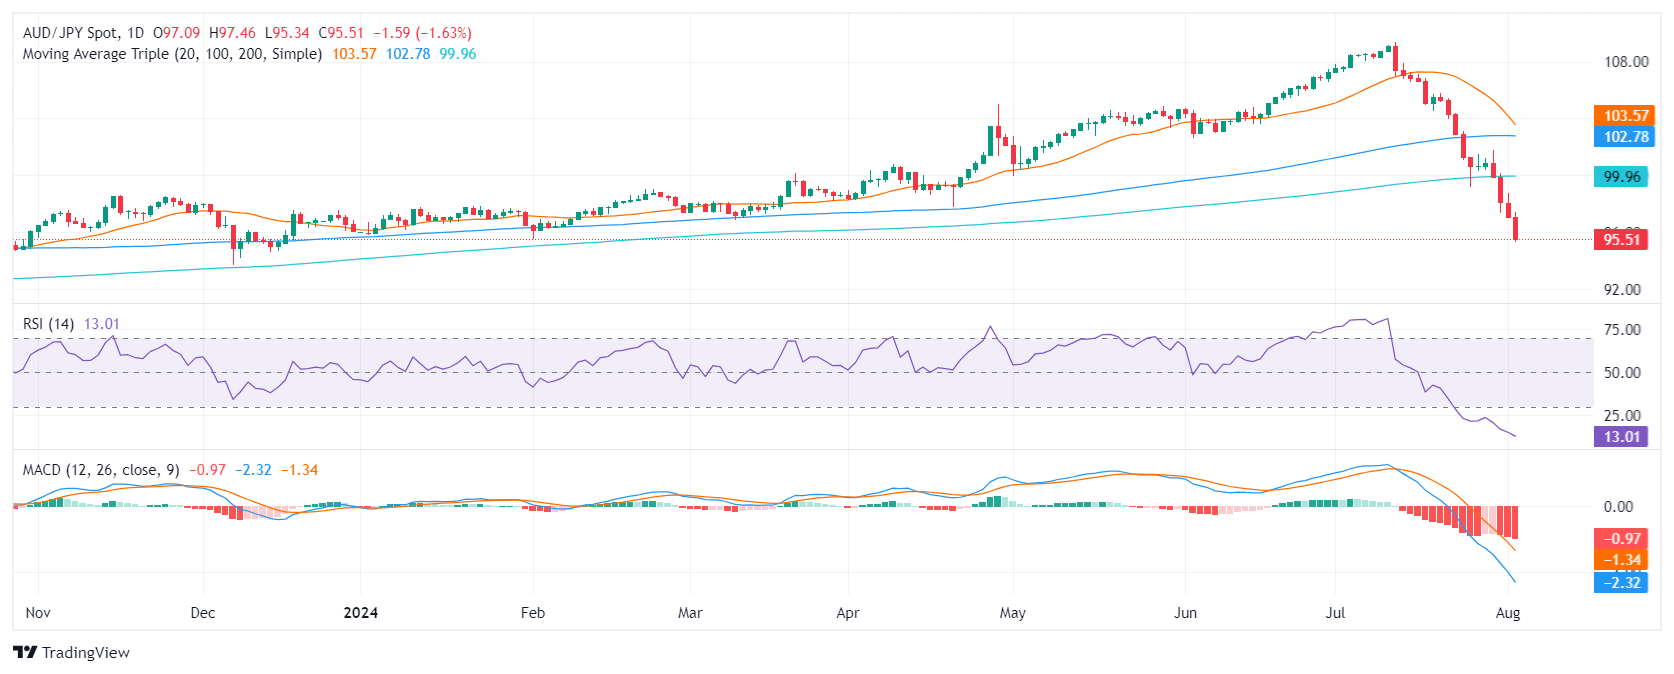
Currently, the AUD/JPY pair is trying to establish a strong base around the major support line at 95.30, which will be crucial in minimizing further losses. The loss of this line could send the pair spiralling further downwards towards 94.00 or even 93.00, while a bounce back could see the 99.00 - 101.00 marks functioning as strong resistance levels.
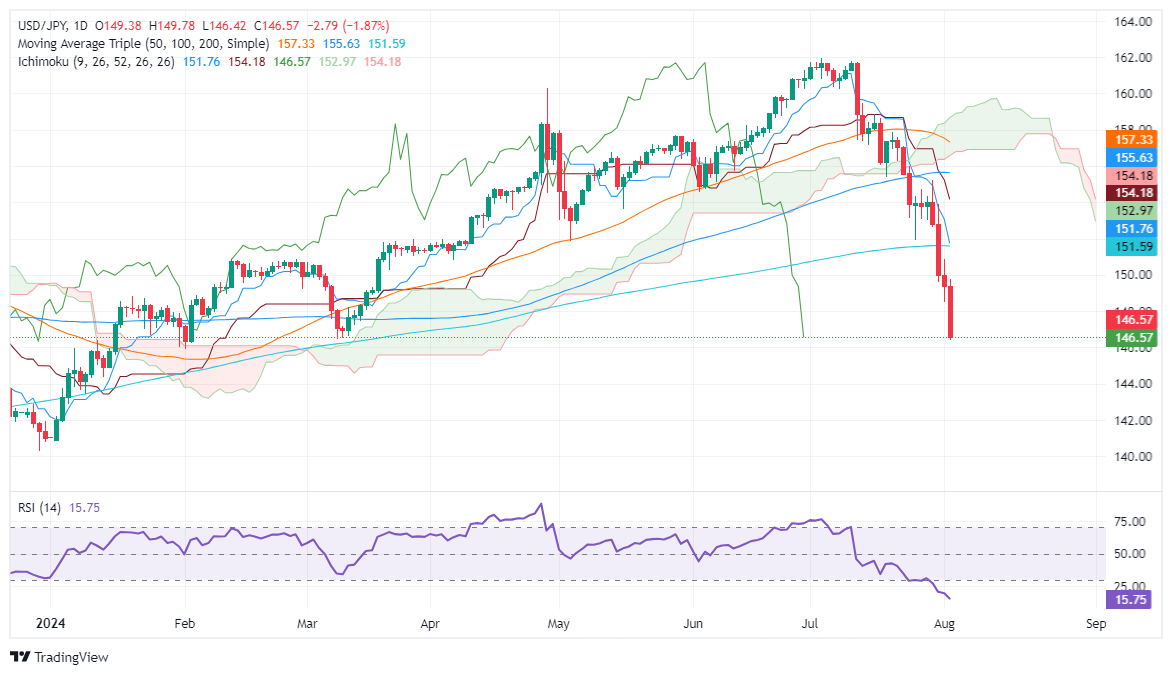
- USD/JPY falls to 146.41, lowest since March, amid worse-than-expected US economic data.
- Technical outlook: Strong support at 146.48; a close below targets 146.00, 145.50, and 145.00 levels.
- RSI indicates potential for upward correction; resistance at 147.00 and cycle low at 151.86 if buyers regain control.
The USD/JPY collapsed to a five-month low of 146.41 on Friday following the release of worse-than-expected US economic data that increased the odds for a Federal Reserve cut at the September meeting. Hence, the US 10-year Treasury bond yield, closely correlated to this pair, tumbled sharply below the 4% threshold, while the major dropped after hitting a daily high of 149.77. At the time of writing, the pair exchanges hands at 146.62, down by more than 1.80%.
USD/JPY Price Analysis: Technical outlook
After clearing key support levels, the USD/JPY is set to test lower prices, though it faces strong support at the March 11 pivot low of 146.48. Sellers will need to push the spot price below the latter so they have the chance to test lower prices.
The Relative Strength Index (RSI) suggests that prices are overextended, which could lead to an upward correction in USD/JPY.
For a bearish continuation, sellers need a daily close below 146.48. Once achieved, the next support would be the 146.00 figure, followed by the 145.50. A further downside lies at the 145.00 mark
On the other hand, if buyers lift the exchange rate past 147.00, they could threaten to push the spot price above until they can face the latest cycle low turned resistance located at 151.86.
USD/JPY Price Action – Daily Chart
Japanese Yen PRICE Today
The table below shows the percentage change of Japanese Yen (JPY) against listed major currencies today. Japanese Yen was the strongest against the US Dollar.
| USD | EUR | GBP | JPY | CAD | AUD | NZD | CHF | |
|---|---|---|---|---|---|---|---|---|
| USD | -1.14% | -0.56% | -1.88% | -0.10% | -0.27% | -0.28% | -1.62% | |
| EUR | 1.14% | 0.58% | -0.74% | 1.04% | 0.88% | 0.86% | -0.48% | |
| GBP | 0.56% | -0.58% | -1.33% | 0.47% | 0.28% | 0.29% | -1.04% | |
| JPY | 1.88% | 0.74% | 1.33% | 1.83% | 1.64% | 1.62% | 0.28% | |
| CAD | 0.10% | -1.04% | -0.47% | -1.83% | -0.17% | -0.16% | -1.50% | |
| AUD | 0.27% | -0.88% | -0.28% | -1.64% | 0.17% | 0.00% | -1.35% | |
| NZD | 0.28% | -0.86% | -0.29% | -1.62% | 0.16% | -0.01% | -1.32% | |
| CHF | 1.62% | 0.48% | 1.04% | -0.28% | 1.50% | 1.35% | 1.32% |
The heat map shows percentage changes of major currencies against each other. The base currency is picked from the left column, while the quote currency is picked from the top row. For example, if you pick the Japanese Yen from the left column and move along the horizontal line to the US Dollar, the percentage change displayed in the box will represent JPY (base)/USD (quote).
- Gold price peaks at $2,477 before falling to $2,430, down 0.60%.
- US Nonfarm Payrolls miss expectations, Unemployment Rate rises, and Average Hourly Earnings dip.
- Weak economic data fuels speculation of Fed rate cuts in September, with US 10-year Treasury yield dropping to 3.815%.
Gold prices are under pressure after hitting a two-week high of $2,477 earlier during the North American session. Data showed that the US jobs market feels the effects of higher borrowing costs set by the Federal Reserve as the number of Americans applying for work dipped. This bolstered the golden metal, which rallied over 1% before retreating. The XAU/USD trades at $2,430, down 0.60%.
Wall Street’s trade with substantial losses, as most equity indices plunged at least 2.20% after the US Bureau of Labor Statistics (BLS) revealed that July’s Nonfarm Payrolls (NFP) figures missed the mark, while June data was revised downward.
Given the backdrop of a dismal Manufacturing PMI report revealed by the Institute of Supply Management (ISM) on Thursday, which was still digested by traders, along with today’s NFP figures, the chances that the Fed might lower interest rates at the September meeting are increasing.
Additional data showed that the Unemployment Rate ticked higher, while Average Hourly Earnings (AHE), a measure of wage inflation, edged lower.
After the data, US Treasury bond yields plummeted sharply, with the US 10-year benchmark note falling 16 basis points to 3.815%, its lowest level since March. and a tailwind for Bullion prices.
Consequently, the US Dollar Index (DXY), a measure of the dollar’s performance against other six currencies, dropped over 1% to 103.23.
US data in the last two days justified Fed Chairman Jerome Powell's statement that the federal fund rates could be cut in September if the US economy cools down.
Another reason driving precious metals prices is geopolitical risks. Tensions in the Middle East remain high as Israel awaits a response from Iran and Lebanon following the assassination of the Hamas leader earlier in the week.
Daily digest market movers: Gold price stumbles amid recession fears
- The Federal Reserve decided to hold rates unchanged but indicated that favorable data on inflation and further weakening in the labor market could prompt action.
- The US Department of Labor revealed that Nonfarm Payrolls (NFPs) were 114K in July, missing estimates of 175K, with previous figures revised downward from 206K to 179K.
- The US Unemployment Rate increased from 4.1% to 4.3%, and Average Hourly Earnings dipped from 0.3% to 0.2%.
- After the data, most banks began to price in more aggressive monetary policy easing by the Fed. Bank of America expects the first cut in September instead of December, while Citi and JP Morgan expect the Fed to lower rates by 50 bps in September and November.
- The CME FedWatch tool shows the odds for a 50 bps Fed rate cut at the September meeting at 70%.
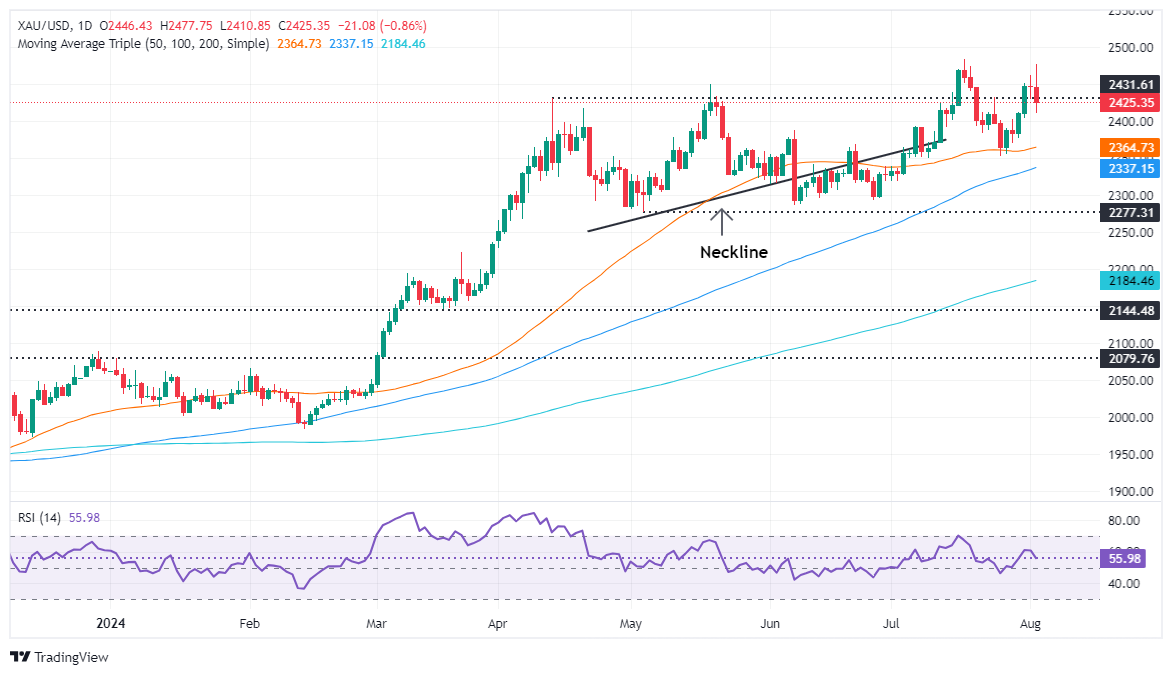
Technical analysis: Gold price retraces from daily highs, below $2,450
Gold price has retreated toward the July 31 lows of $2,404-$2,410, which could be attributed to profit-taking ahead of the weekend, as US yields and the Greenback remain at weekly lows.
From a technical standpoint, XAU/USD is set to remain bullish, and if buyers achieve a daily close above $2,450, this could exacerbate a challenge towards the all-time high, ahead of the $2,500 mark.
On further weakness, prices could fall below $2,400, which could pave the way for a pullback to the 50-day moving average (DMA) at $2,364, before testing the 100-DMA at $2,337.

Gold FAQs
Gold has played a key role in human’s history as it has been widely used as a store of value and medium of exchange. Currently, apart from its shine and usage for jewelry, the precious metal is widely seen as a safe-haven asset, meaning that it is considered a good investment during turbulent times. Gold is also widely seen as a hedge against inflation and against depreciating currencies as it doesn’t rely on any specific issuer or government.
Central banks are the biggest Gold holders. In their aim to support their currencies in turbulent times, central banks tend to diversify their reserves and buy Gold to improve the perceived strength of the economy and the currency. High Gold reserves can be a source of trust for a country’s solvency. Central banks added 1,136 tonnes of Gold worth around $70 billion to their reserves in 2022, according to data from the World Gold Council. This is the highest yearly purchase since records began. Central banks from emerging economies such as China, India and Turkey are quickly increasing their Gold reserves.
Gold has an inverse correlation with the US Dollar and US Treasuries, which are both major reserve and safe-haven assets. When the Dollar depreciates, Gold tends to rise, enabling investors and central banks to diversify their assets in turbulent times. Gold is also inversely correlated with risk assets. A rally in the stock market tends to weaken Gold price, while sell-offs in riskier markets tend to favor the precious metal.
The price can move due to a wide range of factors. Geopolitical instability or fears of a deep recession can quickly make Gold price escalate due to its safe-haven status. As a yield-less asset, Gold tends to rise with lower interest rates, while higher cost of money usually weighs down on the yellow metal. Still, most moves depend on how the US Dollar (USD) behaves as the asset is priced in dollars (XAU/USD). A strong Dollar tends to keep the price of Gold controlled, whereas a weaker Dollar is likely to push Gold prices up.
- Dow Jones plummeted over 900 points top-to-bottom on Friday.
- US NFP jobs data came in well below forecasts, worst initial print since 2019.
- Souring US economic data sends investors piling into rate cut bets.
The Dow Jones Industrial Average (DJIA) plummeted over 900 points peak-to-trough on Friday after the monthly US Nonfarm Payrolls (NFP) printed its lowest initial figure since May of 2019. Steep revisions to previous figures further depressed the market’s outlook on the US employment landscape, and a rising US unemployment rate has sent investors scrambling to bet on an accelerated pace of rate cuts from the Federal Reserve (Fed).
Friday’s US NFP labor data dump showed the US added 114K net new jobs in July, well below the forecast 175K and the previous month’s figure was revised to 179K from the initial print of 206K. The US Unemployment Rate also ticked higher to 4.3%, the highest reading since November of 2021, while the U6 Underemployment Rate rose to 7.8% from 7.4% as employed people struggle to find jobs that provide enough hours.
Average Hourly Earnings growth also eased to 0.2% MoM from the expected hold at 0.3%, with YoY wages growth cooling to 3.6% from the previous 3.8%.
With US economic data turning broadly sour, investors extended a two-day decline on growing fears of a broad recession within the domestic US economy, sparking a flight out of risk assets and sending equity indexes broadly lower. According to the CME’s FedWatch Tool, rate traders have fully priced in a rate cut in September, with 70% odds of a double-cut for 50 basis points when the Fed gives its rate call on September 18.
Dow Jones news
Over two-thirds of the Dow Jones is in the red on Friday, with slim gains getting entirely swamped out by steep losses in key tech stocks. Intel Inc. (INTC) plummeted nearly 30% on Friday, tumbling to almost $21.00 per share after the major software company announced quarterly revenue that missed guidance, earning $12.83 billion in the second quarter, down 1% from the same time last year and missing the analyst forecast of $12.94 billion. Intel also revised their current-quarter revenue forecast to between $12.5 billion and $13.5 billion, less than the analyst expectation of $14.35 billion. In a bid to appeal to the markets, Intel announced plans to lay off 15% of their workforce in the coming months in order to trim labor costs.
Dow Jones technical outlook
Dow Jones plummeted into a second day of losses, falling over 900 points at Friday’s absolute bottom and slipping below the 40,000.00 major price handle. DJIA is struggling to find the brakes as bids fall below the 50-day Exponential Moving Average (EMA) at 39,683.02, and bulls will be looking to restore balance before price action can extend a decline back to the 200-day EMA at 37,982.00.
Dow Jones five minute chart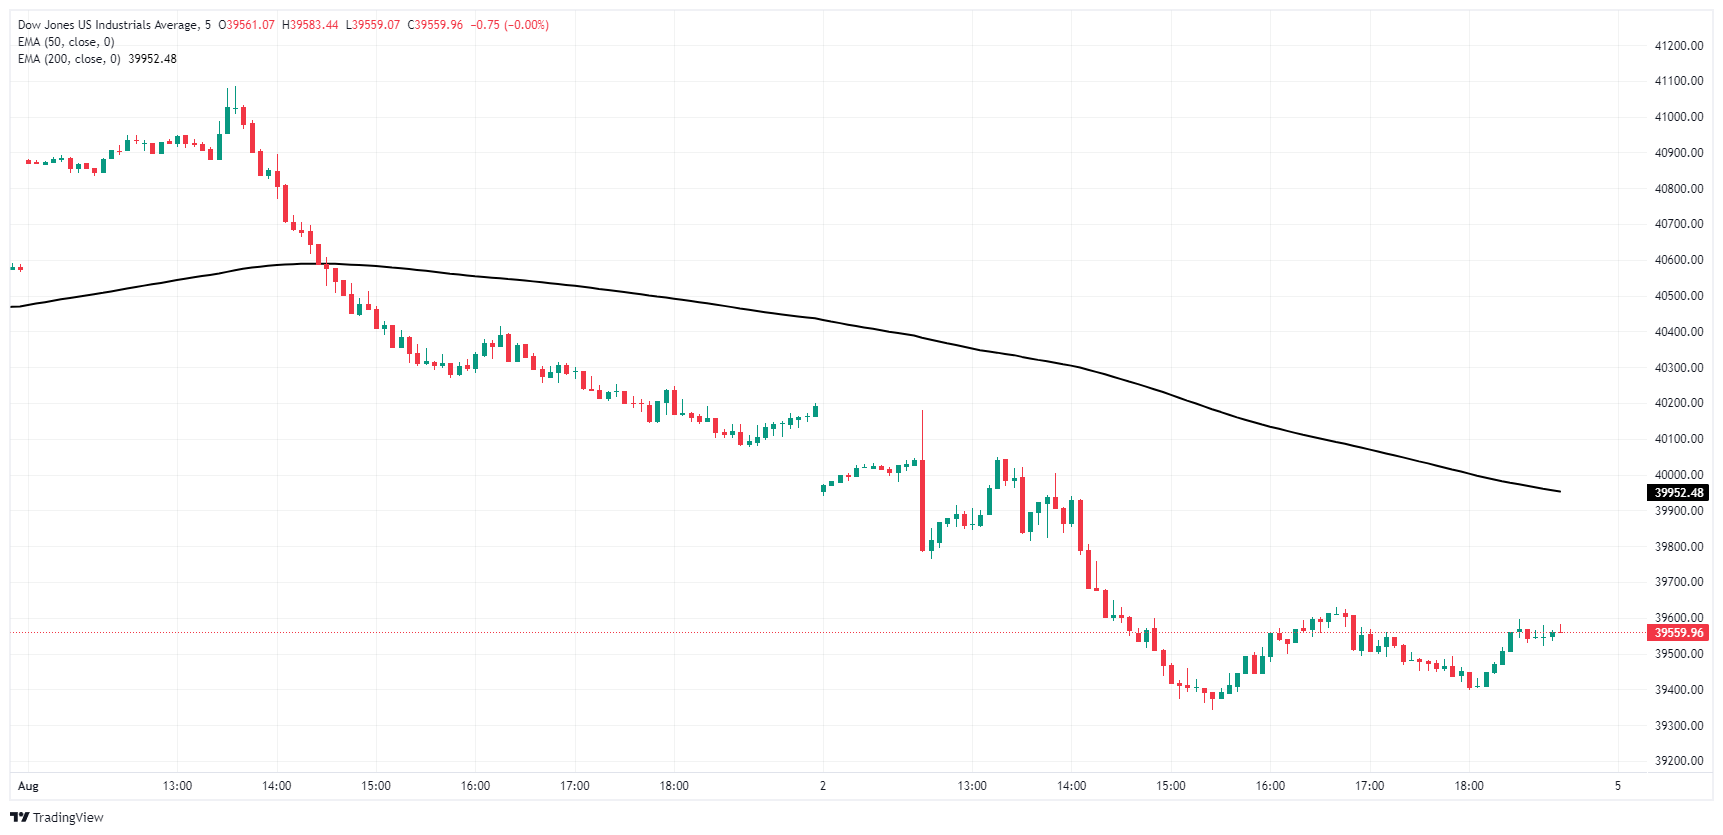
Dow Jones daily chart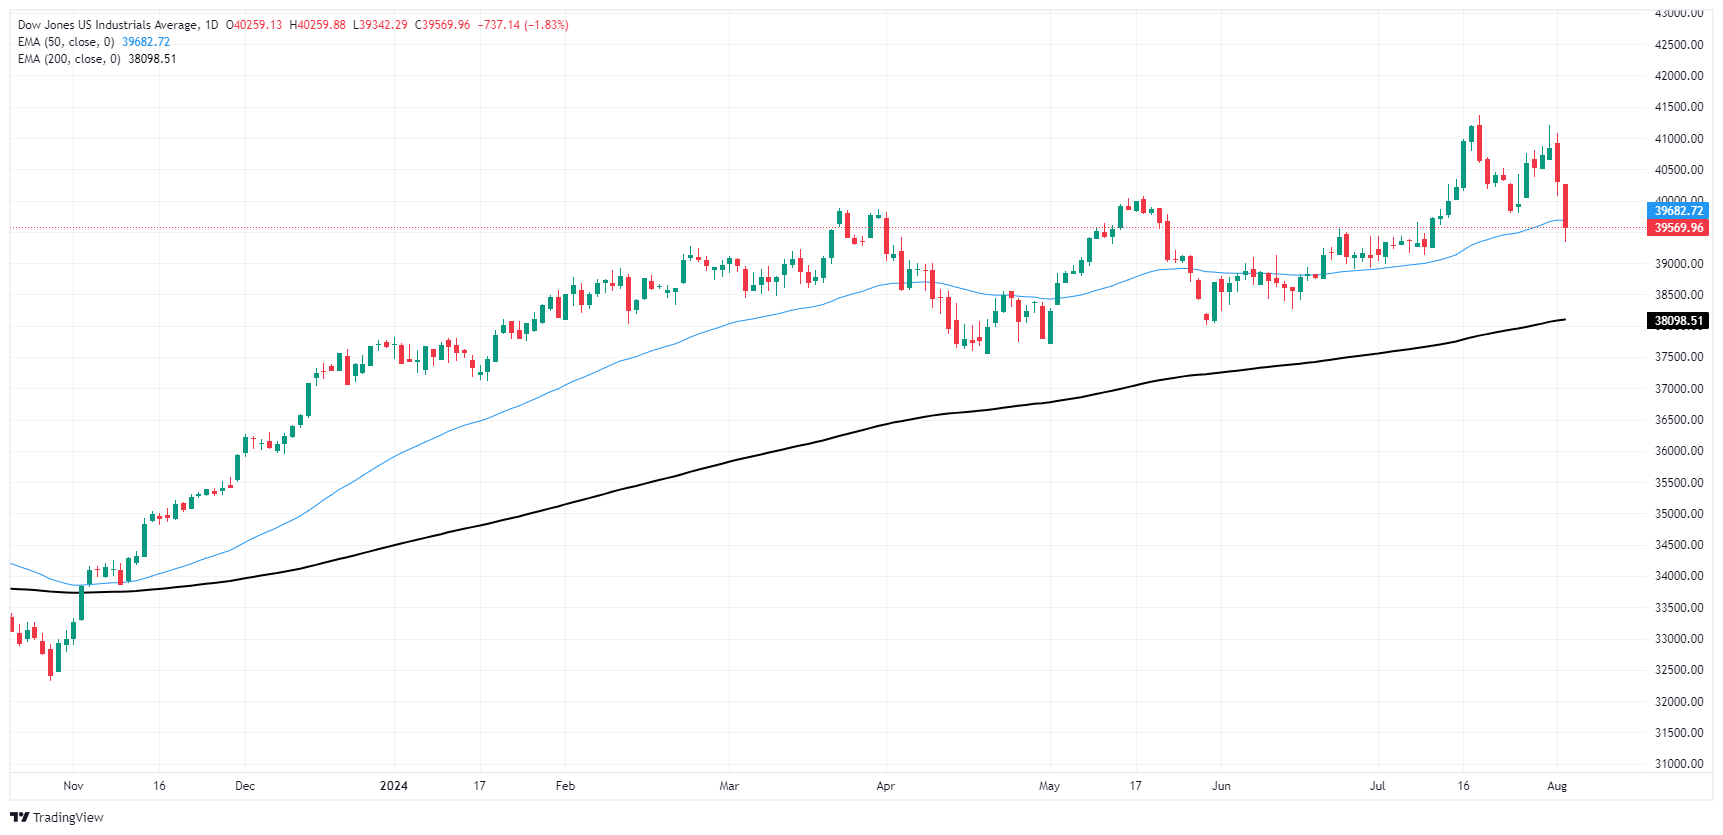
Dow Jones FAQs
The Dow Jones Industrial Average, one of the oldest stock market indices in the world, is compiled of the 30 most traded stocks in the US. The index is price-weighted rather than weighted by capitalization. It is calculated by summing the prices of the constituent stocks and dividing them by a factor, currently 0.152. The index was founded by Charles Dow, who also founded the Wall Street Journal. In later years it has been criticized for not being broadly representative enough because it only tracks 30 conglomerates, unlike broader indices such as the S&P 500.
Many different factors drive the Dow Jones Industrial Average (DJIA). The aggregate performance of the component companies revealed in quarterly company earnings reports is the main one. US and global macroeconomic data also contributes as it impacts on investor sentiment. The level of interest rates, set by the Federal Reserve (Fed), also influences the DJIA as it affects the cost of credit, on which many corporations are heavily reliant. Therefore, inflation can be a major driver as well as other metrics which impact the Fed decisions.
Dow Theory is a method for identifying the primary trend of the stock market developed by Charles Dow. A key step is to compare the direction of the Dow Jones Industrial Average (DJIA) and the Dow Jones Transportation Average (DJTA) and only follow trends where both are moving in the same direction. Volume is a confirmatory criteria. The theory uses elements of peak and trough analysis. Dow’s theory posits three trend phases: accumulation, when smart money starts buying or selling; public participation, when the wider public joins in; and distribution, when the smart money exits.
There are a number of ways to trade the DJIA. One is to use ETFs which allow investors to trade the DJIA as a single security, rather than having to buy shares in all 30 constituent companies. A leading example is the SPDR Dow Jones Industrial Average ETF (DIA). DJIA futures contracts enable traders to speculate on the future value of the index and Options provide the right, but not the obligation, to buy or sell the index at a predetermined price in the future. Mutual funds enable investors to buy a share of a diversified portfolio of DJIA stocks thus providing exposure to the overall index.
- Aussie finds some relief after mixed Australian PPI figures.
- Traders are keeping vigilance on job data disappointment from the US.
- Markets adjust their stance on the Reserve Bank of Australia's monetary policy and now expect a cut in 2024.
The Australian Dollar shows a minor recovery against the US Dollar (USD), which is experiencing a sharp drop after disappointing US jobs data. That being said, economic frailties in Australia and increasing rate cut expectations for the Reserve Bank of Australia (RBA) provide a limited upside for the Aussie.
Despite high inflation, weaknesses in Australian economic activity have caused markets to amend their expectations from a rate hike to a rate cut from the RBA by the end of the year. Predictions now propose that the RBA will introduce a cut to tackle economic sluggishness, which could potentially limit further escalation for the Aussie.
Daily digest market movers: Aussie gains ground despite increased RBA cut odds
- Australia's Q2 Producer Price Index (PPI) unveiled this week displayed an increase of 4.8% YoY, a substantial leap from Q1's 4.3%.
- This continued acceleration, hitting its highest point since Q1 of 2023, places the RBA under scrutiny to respond accordingly.
- With the market attributing an 80% chance of an RBA cut by year-end, the Aussie’s upside is limited.
- Across the Pacific, US Nonfarm Payrolls increased by 114K, far less than the predicted 175K.
- The Unemployment Rate climbed to 4.3% as compared to June's 4.1%, and the Labor Force Participation Rate noted a marginal increase to 62.7% from the previous 62.6%.
- The Average Hourly Earnings report showed a drop from 3.8% to 3.6% YoY, which has affected the currency market adversely by adding weight to USD.
- In light of this data, the Federal Reserve (Fed) is expected to initiate interest rate reduction measures starting in September, with a 90% chance priced in according to the CME FedWatch Tool.
AUD/USD Technical Analysis: Bearish tendencies challenged, still room for potential corrections
The AUD/USD trading beneath the 20, 100 and 200-day Simple Moving Average (SMA) prolongs predominantly bearish sentiment. The daily Relative Strength Index (RSI) saw values between 30 and 37 during the past week, reinforcing the bearish perspective. The Moving Average Convergence Divergence (MACD) maintains flat red bars, signaling enduring bearish momentum.
However, the AUD/USD pair seems to exhibit resilience near the 0.6480 mark, indicating a potential key support level. Conversely, resistance is speculated to be around the 0.6560-0.6570 zone, where selling pressure has so far capped the rally.
Australian Dollar FAQs
One of the most significant factors for the Australian Dollar (AUD) is the level of interest rates set by the Reserve Bank of Australia (RBA). Because Australia is a resource-rich country another key driver is the price of its biggest export, Iron Ore. The health of the Chinese economy, its largest trading partner, is a factor, as well as inflation in Australia, its growth rate and Trade Balance. Market sentiment – whether investors are taking on more risky assets (risk-on) or seeking safe-havens (risk-off) – is also a factor, with risk-on positive for AUD.
The Reserve Bank of Australia (RBA) influences the Australian Dollar (AUD) by setting the level of interest rates that Australian banks can lend to each other. This influences the level of interest rates in the economy as a whole. The main goal of the RBA is to maintain a stable inflation rate of 2-3% by adjusting interest rates up or down. Relatively high interest rates compared to other major central banks support the AUD, and the opposite for relatively low. The RBA can also use quantitative easing and tightening to influence credit conditions, with the former AUD-negative and the latter AUD-positive.
China is Australia’s largest trading partner so the health of the Chinese economy is a major influence on the value of the Australian Dollar (AUD). When the Chinese economy is doing well it purchases more raw materials, goods and services from Australia, lifting demand for the AUD, and pushing up its value. The opposite is the case when the Chinese economy is not growing as fast as expected. Positive or negative surprises in Chinese growth data, therefore, often have a direct impact on the Australian Dollar and its pairs.
Iron Ore is Australia’s largest export, accounting for $118 billion a year according to data from 2021, with China as its primary destination. The price of Iron Ore, therefore, can be a driver of the Australian Dollar. Generally, if the price of Iron Ore rises, AUD also goes up, as aggregate demand for the currency increases. The opposite is the case if the price of Iron Ore falls. Higher Iron Ore prices also tend to result in a greater likelihood of a positive Trade Balance for Australia, which is also positive of the AUD.
The Trade Balance, which is the difference between what a country earns from its exports versus what it pays for its imports, is another factor that can influence the value of the Australian Dollar. If Australia produces highly sought after exports, then its currency will gain in value purely from the surplus demand created from foreign buyers seeking to purchase its exports versus what it spends to purchase imports. Therefore, a positive net Trade Balance strengthens the AUD, with the opposite effect if the Trade Balance is negative.
President of the Federal Reserve (Fed) Bank of Chicago Austan Goolsbee reiterated the importance of the Fed not reacting to a single data point on Friday after US Nonfarm Payrolls came in widely under forecasts, but noted that inflation and jobs data have both made significant progress in recent months.
Key highlights
The jobs data follows the trend of cooling labor market.
We had multiple good months of inflation, broad-based.
If inflation and the job market continue to cool, the Fed should cut.
We need to balance policy with the economy in short order.
- Mexican Peso weakens to a yearly low of 19.22 against the USD amid US economic worries.
- Mixed Mexican data: higher unemployment rate, solid but slowing Gross Fixed Investment.
- US Nonfarm Payrolls and Manufacturing PMI disappoint, heightening recession fears.
The Mexican Peso weakened further throughout the week against the Greenback and hit a new yearly low of 19.22, as fears that the United States (US) economy might slow down further hurt the outlook of its largest partner, Mexico. As market participants shifted risk-averse, the USD/MXN trades at 19.00 and gains over 0.70%.
Data from Mexico was mixed as the unemployment rate ticked higher by two-tenths, while Gross Fixed Investment remained solid in May, yet trailed April’s double-digit figures. Even though this could’ve boosted the Peso, market players were aware of the release of July’s US employment report.
The US Nonfarm Payrolls (NFP) plunged below estimates and trailed June’s data, while the Unemployment Rate edged up and Average Hourly Earnings dipped. Today’s data, along with Thursday’s dismal Manufacturing PMI figures revealed by the Institute for Supply Management (ISM), reignited recession worries.
Following the data, traders ditched risk-sensitive assets in the FX space, which hurt the Peso's emerging market status. Besides that, market participants expect the Federal Reserve (Fed) to cut rates for the first time at the upcoming September meeting, and even some Wall Street banks consider 50 basis points (bps) of easing.
Recently, some Fed officials had crossed the wires. Richmond’s Fed President Thomas Barkin disregarded a 50 bps cut, saying the Fed considers this “with an economy that feels like it’s deteriorating rapidly.” At the same time, Chicago’s Fed Austan Goolsbee stated, “They’d never want to overreact to one month’s data.”
Daily digest market movers: Mexican Peso extends its weekly losing streak to three
- Mexico’s Unemployment Rate in June was 2.8% MoM, exceeding estimates and May’s 2.6% reading. Further data showed that Gross Fixed Investment in May dropped from 0.8% to 0.7% MoM.
- Mexico’s S&P Global Manufacturing PMI for July contracted to 49.60, below June’s 51.10 expansion, underscoring the economy’s undergoing a slowdown.
- Given the backdrop, Mexico’s economy is beginning to weaken further, which could be the reason the Bank of Mexico (Banxico) needs to cut rates.
- The US Department of Labor revealed that NFPs came at 114K in July, missing estimates of 175K, with previous figures downwardly revised from 206K to 179K. Additional data showed the Unemployment Rate increased from 4.1% to 4.3%, and Average Hourly Earnings dipped from 0.3% to 0.2%.
- The Fed decided to hold rates unchanged yet commented that goodish inflation data and further weakening in the labor market could trigger action.
- Following the data release, most banks anticipate more aggressive monetary policy easing by the Fed. Bank of America now expects the first rate cut in September instead of December, while Citi and JP Morgan project the Fed will lower rates by 50 bps in September and November.
- Data from the Chicago Board of Trade (CBOT) shows that the December 2024 fed funds rates futures contract suggests that policymakers will ease policy at least 117 basis points.
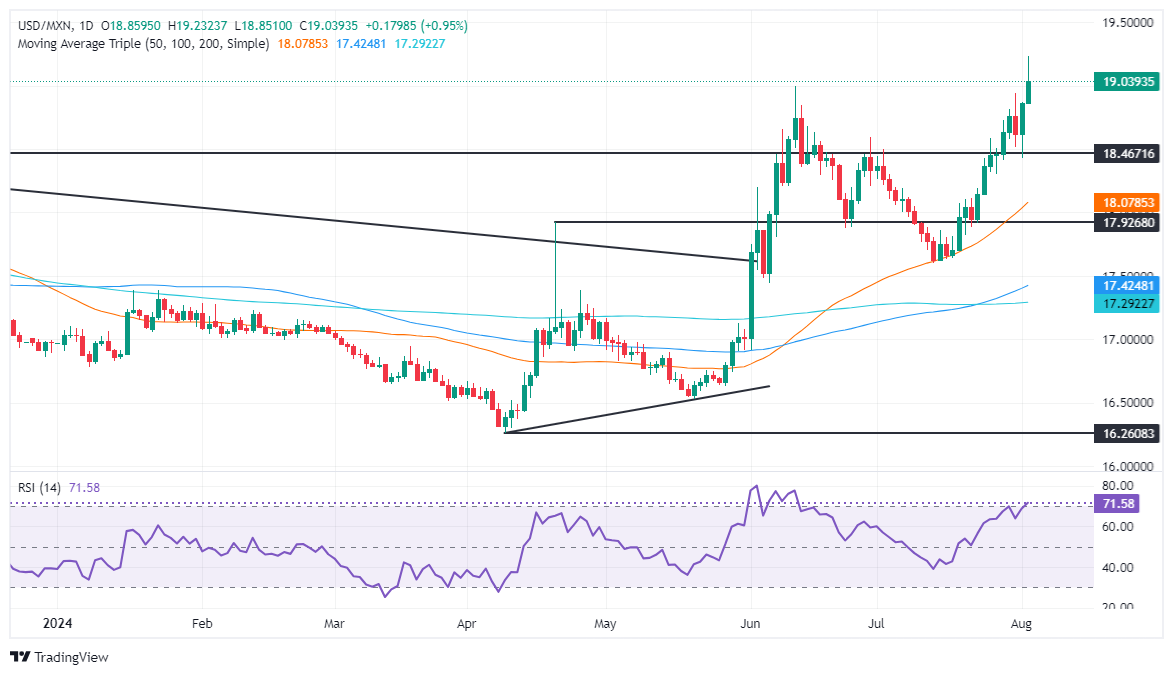
Technical analysis: Mexican Peso depreciates sharply as USD/MXN rises above 19.00
The USD/MXN rallied sharply above the 19.00 psychological level and hit a new year-to-date (YTD) high of 19.22 before retreating to the figure. The Relative Strength Index (RSI) shows momentum favors buyers, as the RSI stands in overbought territory. But due to the strength of the uptrend, the most extreme reading will be 80.
If USD/MXN extends its gains past the YTD high, up next would be the 19.50 area. Once cleared, the next stop would be the 20.00 mark.
Conversely, a drop below the August 1 low of 18.42 could sponsor a dip toward the 50-day Simple Moving Average (SMA) at 17.99. In further weakness, the exotic pair could challenge the 17.50 mark.
Mexican Peso FAQs
The Mexican Peso (MXN) is the most traded currency among its Latin American peers. Its value is broadly determined by the performance of the Mexican economy, the country’s central bank’s policy, the amount of foreign investment in the country and even the levels of remittances sent by Mexicans who live abroad, particularly in the United States. Geopolitical trends can also move MXN: for example, the process of nearshoring – or the decision by some firms to relocate manufacturing capacity and supply chains closer to their home countries – is also seen as a catalyst for the Mexican currency as the country is considered a key manufacturing hub in the American continent. Another catalyst for MXN is Oil prices as Mexico is a key exporter of the commodity.
The main objective of Mexico’s central bank, also known as Banxico, is to maintain inflation at low and stable levels (at or close to its target of 3%, the midpoint in a tolerance band of between 2% and 4%). To this end, the bank sets an appropriate level of interest rates. When inflation is too high, Banxico will attempt to tame it by raising interest rates, making it more expensive for households and businesses to borrow money, thus cooling demand and the overall economy. Higher interest rates are generally positive for the Mexican Peso (MXN) as they lead to higher yields, making the country a more attractive place for investors. On the contrary, lower interest rates tend to weaken MXN.
Macroeconomic data releases are key to assess the state of the economy and can have an impact on the Mexican Peso (MXN) valuation. A strong Mexican economy, based on high economic growth, low unemployment and high confidence is good for MXN. Not only does it attract more foreign investment but it may encourage the Bank of Mexico (Banxico) to increase interest rates, particularly if this strength comes together with elevated inflation. However, if economic data is weak, MXN is likely to depreciate.
As an emerging-market currency, the Mexican Peso (MXN) tends to strive during risk-on periods, or when investors perceive that broader market risks are low and thus are eager to engage with investments that carry a higher risk. Conversely, MXN tends to weaken at times of market turbulence or economic uncertainty as investors tend to sell higher-risk assets and flee to the more-stable safe havens.
- Canadian Dollar markets swamped out by NFP release.
- Canada has limited data releases on the scope.
- US data broadly softened, fanning the flames of recession fears.
The Canadian Dollar (CAD) was tossed around on Friday as global markets roiled following a broad downside miss in US labor and wages figures released early in the US trading session. US Nonfarm Payrolls (NFP), wages, and unemployment figures all missed forecasts, raising investor concerns that the US may be headed for a “hard landing” scenario in the coming months.
Canada has little of note slated for immediate release on the economic calendar, leaving CAD traders adrift until next Friday’s Canadian labor data. As markets roil under deflating US economic figures, market flows should be expected to continue tossing the CAD around as traders scramble to adjust their exposure.
Daily digest market movers: US NFP misfire all but guarantees Fed rate cut in September
- US NFP jobs data showed the US added 114K net new employment positions in July, well below the forecast 175K and easing back from the previous month’s 179K, which was also revised lower from 206K.
- The US Unemployment Rate ticked higher to 4.3% in July, the highest rate of measured unemployment since November of 2021.
- Average Hourly Earnings also grew by less than expected in July, notching in 0.2% MoM against the forecast hold at 0.3%.
- Annualized wages rose 3.6%, below the forecast 3.7% and easing further back from the previous 3.8% (revised from 3.9%).
- US Factory Orders contracted in June, printing -3.3% MoM versus the forecast for -2.9% and accelerating down from the previous month’s print of -0.5%.
- Rate markets are now pricing in 75% odds of a double cut from the Federal Reserve (Fed) in September, with a rate cut now a forgone conclusion when the Fed delivers its rate call on September 18.
Canadian Dollar PRICE Today
The table below shows the percentage change of Canadian Dollar (CAD) against listed major currencies today. Canadian Dollar was the strongest against the US Dollar.
| USD | EUR | GBP | JPY | CAD | AUD | NZD | CHF | |
|---|---|---|---|---|---|---|---|---|
| USD | -1.10% | -0.43% | -1.57% | -0.16% | -0.26% | -0.27% | -1.39% | |
| EUR | 1.10% | 0.67% | -0.48% | 0.93% | 0.85% | 0.82% | -0.30% | |
| GBP | 0.43% | -0.67% | -1.17% | 0.27% | 0.16% | 0.16% | -0.96% | |
| JPY | 1.57% | 0.48% | 1.17% | 1.45% | 1.33% | 1.32% | 0.18% | |
| CAD | 0.16% | -0.93% | -0.27% | -1.45% | -0.10% | -0.09% | -1.23% | |
| AUD | 0.26% | -0.85% | -0.16% | -1.33% | 0.10% | 0.00% | -1.13% | |
| NZD | 0.27% | -0.82% | -0.16% | -1.32% | 0.09% | 0.00% | -1.11% | |
| CHF | 1.39% | 0.30% | 0.96% | -0.18% | 1.23% | 1.13% | 1.11% |
The heat map shows percentage changes of major currencies against each other. The base currency is picked from the left column, while the quote currency is picked from the top row. For example, if you pick the Canadian Dollar from the left column and move along the horizontal line to the US Dollar, the percentage change displayed in the box will represent CAD (base)/USD (quote).
Technical analysis: Canadian Dollar finds some upside against deflating Greenback, but overall lower
The Canadian Dollar (CAD) is broadly lower on Friday as traders pivot away from the CAD into more interesting assets. The CAD tumbled a full percent against the Euro, the Japanese Yen, and the Swiss Franc on Friday, but was able to eke out a slim quarter-percent gain against the floundering US Dollar.
USD/CAD continues to splash around the 1.3850 level, churning close to the top end of 2024’s peak bids. The pair is up a little over 2% after the last swing low into the 1.2600 handle rolled over into a technical bounce off of the 200-day Exponential Moving Average (EMA). Bullish momentum appears set to wither as USD/CAD bids fail to capture the 1.3900 region, but short pressure still needs more percolation before knocking bidders off of a three-week winning streak.
USD/CAD daily chart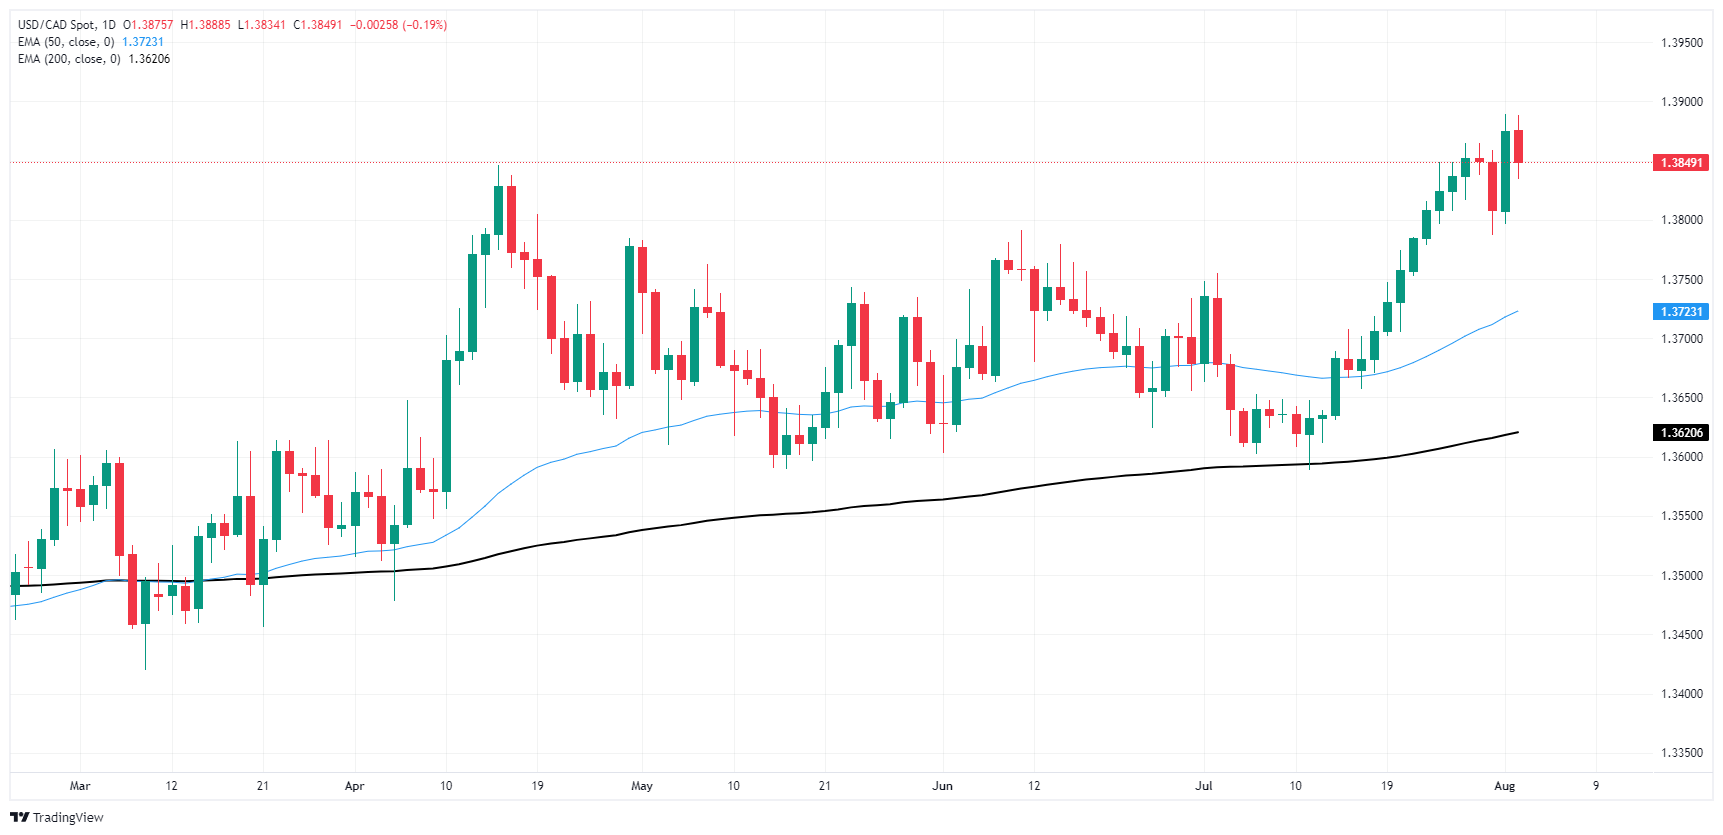
Canadian Dollar FAQs
The key factors driving the Canadian Dollar (CAD) are the level of interest rates set by the Bank of Canada (BoC), the price of Oil, Canada’s largest export, the health of its economy, inflation and the Trade Balance, which is the difference between the value of Canada’s exports versus its imports. Other factors include market sentiment – whether investors are taking on more risky assets (risk-on) or seeking safe-havens (risk-off) – with risk-on being CAD-positive. As its largest trading partner, the health of the US economy is also a key factor influencing the Canadian Dollar.
The Bank of Canada (BoC) has a significant influence on the Canadian Dollar by setting the level of interest rates that banks can lend to one another. This influences the level of interest rates for everyone. The main goal of the BoC is to maintain inflation at 1-3% by adjusting interest rates up or down. Relatively higher interest rates tend to be positive for the CAD. The Bank of Canada can also use quantitative easing and tightening to influence credit conditions, with the former CAD-negative and the latter CAD-positive.
The price of Oil is a key factor impacting the value of the Canadian Dollar. Petroleum is Canada’s biggest export, so Oil price tends to have an immediate impact on the CAD value. Generally, if Oil price rises CAD also goes up, as aggregate demand for the currency increases. The opposite is the case if the price of Oil falls. Higher Oil prices also tend to result in a greater likelihood of a positive Trade Balance, which is also supportive of the CAD.
While inflation had always traditionally been thought of as a negative factor for a currency since it lowers the value of money, the opposite has actually been the case in modern times with the relaxation of cross-border capital controls. Higher inflation tends to lead central banks to put up interest rates which attracts more capital inflows from global investors seeking a lucrative place to keep their money. This increases demand for the local currency, which in Canada’s case is the Canadian Dollar.
Macroeconomic data releases gauge the health of the economy and can have an impact on the Canadian Dollar. Indicators such as GDP, Manufacturing and Services PMIs, employment, and consumer sentiment surveys can all influence the direction of the CAD. A strong economy is good for the Canadian Dollar. Not only does it attract more foreign investment but it may encourage the Bank of Canada to put up interest rates, leading to a stronger currency. If economic data is weak, however, the CAD is likely to fall.
- US Dollar suffers following July's disappointing jobs report, which sparks increased expectation in September rate cut.
- If data continues to show progress, the Fed signals readiness to respond to signs of weakness in the US economy.
- CME FedWatchTool indicates a 90% chance of a cut in September.
The US Dollar (USD), as gauged by the DXY index, experienced heavy selling pressure following the July jobs report on Friday, sliding to lows not seen since March near 103.20.
With a September rate cut seemingly in sight, any signs of vulnerability in the US economic landscape could weigh on the USD and increase dovish sentiment toward the Federal Reserve (Fed).
Daily digest market movers: The US Dollar dips on July's weak jobs growth
- US Nonfarm Payrolls (NFP) grew by just 114K in July, falling short of the market expectation of 175K and significantly below June's downwardly revised growth of 179K (from 206K), according to the US Bureau of Labor Statistics (BLS) report on Friday.
- Additional figures from the report showed that the Unemployment Rate inched up to 4.3% in July from 4.1% in June.
- Concurrently, Average Hourly Earnings' annual wage inflation decreased to 3.6% from 3.8%.
- The weak demand for labor in the US, underscored by these figures, has piled pressure on the USD, increasing expectations that the Fed will start to cut interest rates in September.
- The CME FedWatch Tool now shows that traders predict a 90% chance of a half-point Fed rate cut in September.
DXY technical outlook: Index outlook turns bearish amid concerning data
The DXY outlook has taken a turn for the worse after the disappointing jobs report. The index slid significantly below both the 20-day and 200-day Simple Moving Averages (SMAs), which are on the brink of a bearish crossover near 104.00.
The momentum-based Relative Strength Index (RSI) and the Moving Average Convergence Divergence (MACD) also took substantial hits, indicating a surge in selling pressure.
The DXY index now finds support at 103.00, 102.50 and 102.30, with resistance levels positioned at 103.50 and 104.00.
US Dollar FAQs
The US Dollar (USD) is the official currency of the United States of America, and the ‘de facto’ currency of a significant number of other countries where it is found in circulation alongside local notes. It is the most heavily traded currency in the world, accounting for over 88% of all global foreign exchange turnover, or an average of $6.6 trillion in transactions per day, according to data from 2022. Following the second world war, the USD took over from the British Pound as the world’s reserve currency. For most of its history, the US Dollar was backed by Gold, until the Bretton Woods Agreement in 1971 when the Gold Standard went away.
The most important single factor impacting on the value of the US Dollar is monetary policy, which is shaped by the Federal Reserve (Fed). The Fed has two mandates: to achieve price stability (control inflation) and foster full employment. Its primary tool to achieve these two goals is by adjusting interest rates. When prices are rising too quickly and inflation is above the Fed’s 2% target, the Fed will raise rates, which helps the USD value. When inflation falls below 2% or the Unemployment Rate is too high, the Fed may lower interest rates, which weighs on the Greenback.
In extreme situations, the Federal Reserve can also print more Dollars and enact quantitative easing (QE). QE is the process by which the Fed substantially increases the flow of credit in a stuck financial system. It is a non-standard policy measure used when credit has dried up because banks will not lend to each other (out of the fear of counterparty default). It is a last resort when simply lowering interest rates is unlikely to achieve the necessary result. It was the Fed’s weapon of choice to combat the credit crunch that occurred during the Great Financial Crisis in 2008. It involves the Fed printing more Dollars and using them to buy US government bonds predominantly from financial institutions. QE usually leads to a weaker US Dollar.
Quantitative tightening (QT) is the reverse process whereby the Federal Reserve stops buying bonds from financial institutions and does not reinvest the principal from the bonds it holds maturing in new purchases. It is usually positive for the US Dollar.
The Japanese Yen (JPY) started the month of July at the weakest levels seen in over 30 years (162 to the US Dollar (USD)). From there the island-nation currency has surged more than 9%, settling below 148 per USD, NBC FX analysts Stéfane Marion and Kyle Dahms note.
The potential for JPY strength later this year
“The factors underpinning the current bout of strength were twofold, firstly the unwinding of carry trades brought an initial surge which was then compounded by a surprise decision from the Bank of Japan to raise rates to their highest level in 15 years. In addition, the central bank showed a path towards slowing asset purchases, a sizeable shift in stance from previously easy money.”
“With inflation still above target, the contrast in the conduct of monetary policy between Japan and the rest of the world should become more apparent especially if the Federal Reserve (Fed) starts easing in September.”
“The events of July have confirmed our view that the JPY was set for appreciation. We continue to see the potential for JPY strength later this year, but it should be said that a lot of ground has already been covered in little time.”
The Bank of Canada (BoC) lowered the target for the overnight rate by 25 basis points in July. A soft landing scenario for the Canadian economy is not a foregone conclusion, NBC FX analysts Stéfane Marion and Kyle Dahms note.
Global economic growth weighs on the price of commodities
“For the second time in as many meetings, the Bank of Canada lowered the target for the overnight rate by 25 basis points in July. Driving the decision to cut was ‘broad price pressures continuing to ease’ and ‘ongoing excess supply lowering inflationary pressures’.
“In our view, a soft landing scenario for the Canadian economy is not a foregone conclusion. If incoming data soften more in line with our outlook, there will be a strong case for another cut in September.”
“At this stage, we still see USD/CAD rising above 1.40 in the coming months as weaker global economic growth weighs on the price of commodities.”
The US Dollar (USD) is under pressure as the US labour market continues to deteriorate, NBC FX analysts Stéfane Marion and Kyle Dahms note.
Weakness in the USD to be temporary
“The Greenback is under pressure as the US labour market continues to deteriorate. The unemployment rate rose to 4.3% in July, the fourth consecutive month of higher-than-expected readings, shattering the FOMC's year-end projection of 4%.”
“With Mr Powell now openly focusing on the full employment side of his dual mandate, the Fed is likely to feel comfortable easing more than previously envisaged.”
“Nevertheless, we expect the weakness in the USD to be temporary, as a slowdown in the world's largest economy reverberates through global financial markets via the risk-off trade that usually accompanies a strengthening of the greenback.”
- Gold price drops to $2,420 after peaking at $2,477, down nearly 0.80%.
- US Nonfarm Payrolls for July miss expectations, unemployment rate rises to 4.3%.
- Treasury yields and USD plunge, prompting banks to anticipate faster Fed rate cuts.
Gold price reversed its course and tumbled almost 1% after hitting a two-week high of $2477 following weaker-than-expected data from the United States (US). This weighed on the Greenback and sent US Treasury yields plummeting as investors expected the Federal Reserve could cut rates faster than they thought. The XAU/USD trades at $2,420 at the time of writing
XAU/USD whipsaws as disappointing US economic indicators weigh on the Greenback and Treasury yields
Friday’s US Nonfarm Payrolls figures disappointed investors, which were still digesting a dismal ISM Manufacturing PMI report that spurred concerns about the health of the US economy.
The US Department of Labor revealed that 114K people were added to the workforce in July, missing estimates of 175K, and the previous figures were downward revised from 206K to 179K. Further data showed the Unemployment Rate ticked up from 4.1% to 4.3% and Average Hourly Earnings dipped a tenth from 0.3% to 0.2%.
Bullion rallied sharply, capitalizing on the fall of the US 10-year Treasury bond yield, which tanked over 15 basis points to 3.815%. The Greenback was also hurt, collapsing more than 1.13% according to the US Dollar Index (DXY), which is at 103.16.
After the data, most banks began to price in more aggressive monetary policy easing by the Fed. Bank of America expects the first cut in September instead of December, while Citi and JP Morgan expect the Fed to lower rates by 50 bps in September and November.
XAU/USD Price Analysis: Technical outlook
Gold price has retreated toward the July 31 lows of $2,404-$2,410, which could be attributed to profit-taking ahead of the weekend, as US yields and the Greenback remain at weekly lows. From a technical standpoint, XAU/USD is set to remain bullish and if buyers achieve a daily close above $2,450, this could exacerbate a challenge towards the all-time high, ahead of the $2,500 mark. On further weakness, prices could fall below $2,400, which could pave the way for a pullback to the 50-day moving average (DMA) at $2,364, before testing the 100-DMA at $2,337.
Gold FAQs
Gold has played a key role in human’s history as it has been widely used as a store of value and medium of exchange. Currently, apart from its shine and usage for jewelry, the precious metal is widely seen as a safe-haven asset, meaning that it is considered a good investment during turbulent times. Gold is also widely seen as a hedge against inflation and against depreciating currencies as it doesn’t rely on any specific issuer or government.
Central banks are the biggest Gold holders. In their aim to support their currencies in turbulent times, central banks tend to diversify their reserves and buy Gold to improve the perceived strength of the economy and the currency. High Gold reserves can be a source of trust for a country’s solvency. Central banks added 1,136 tonnes of Gold worth around $70 billion to their reserves in 2022, according to data from the World Gold Council. This is the highest yearly purchase since records began. Central banks from emerging economies such as China, India and Turkey are quickly increasing their Gold reserves.
Gold has an inverse correlation with the US Dollar and US Treasuries, which are both major reserve and safe-haven assets. When the Dollar depreciates, Gold tends to rise, enabling investors and central banks to diversify their assets in turbulent times. Gold is also inversely correlated with risk assets. A rally in the stock market tends to weaken Gold price, while sell-offs in riskier markets tend to favor the precious metal.
The price can move due to a wide range of factors. Geopolitical instability or fears of a deep recession can quickly make Gold price escalate due to its safe-haven status. As a yield-less asset, Gold tends to rise with lower interest rates, while higher cost of money usually weighs down on the yellow metal. Still, most moves depend on how the US Dollar (USD) behaves as the asset is priced in dollars (XAU/USD). A strong Dollar tends to keep the price of Gold controlled, whereas a weaker Dollar is likely to push Gold prices up.
More often than not, central banks have little to gain by shocking markets. That said, on occasion, the element of surprise can be a useful policy tool, Rabobank’s senior FX strategist Jane Foley notes.
USD/JPY bears push to test 145
“Earlier this year, the SNB took full advantage of an unprepared market by cutting rates to undermine the value of the CHF after Swiss CPI inflation fell back to the central bank’s target. This week the hawkishness of the BoJ has led to the market re-evaluating its expectations about its monetary policy outlook through to the end of this year and beyond.”
“This reappraisal has had a significant impact on the value of the Japanese Yen (JPY). In the coming sessions key Japanese economic data releases could either vindicate or undermine the hawkish signals provided by the BoJ. This week’s coincident surge in market expectations about the number of Fed rate cuts before the end of this year has added to the downside pressure on USD/JPY.”
“Our medium-term target is USD/JPY145. This week’s moves suggest that this level may be hit far sooner than we had expected. Dependent on the outcome of next week’s key Japanese economic data, we will be re-evaluating our USD/JPY forecasts.”
- GBP/USD rallies from daily low of 1.2707 to trade above the 1.2800 mark.
- Key resistance levels reclaimed: 50-DMA at 1.2787 and 1.2800 mark; next targets are 1.2860, 1.2900, and 1.2950.
- If GBP/USD falls below 1.2800, it may range between 1.2800 and 1.2700, with further support at 100-DMA (1.2683).
The Pound Sterling rallied sharply against the US Dollar after recent economic data from the United States (US) sparked speculation that the US Federal Reserve might cut interest rates faster than expected. The GBP/USD trades at 1.2833 after hitting a daily low of 1.2707.
The Greenback is being battered, given the backdrop of the July ISM Manufacturing PMI plunging to its lowest level since December 2023 and Nonfarm Payrolls missing the mark. Market participants had begun to price in a larger rate cut at the upcoming September meeting.
GBP/USD Price Analysis: Technical outlook
After diving throughout the week, the GBP/USD reclaimed key resistance levels like the 50-day moving average (DMA) at 1.2787 and the 1.2800 mark. Momentum shifted in buyers' favor as the Relative Strength Index (RSI) turned bullish
If GBP/USD closes above 1.2800, that can pave the way for testing the June 12 high at 1.2860 and expose the 1.2900 psychological figure. Once surpassed, further upside is seen, with the next stop being 1.2950, which capped price action for four consecutive days before buyers could challenge 1.3000.
Conversely, if sellers drag the GBP/USD pair below 1.2800, then the pair could stay range-bound within the 1.2800-1.2700 mark, which, if broken, will expose the 100-DMA at 1.2683.
GBP/USD Price Action – Daily Chart
Pound Sterling FAQs
The Pound Sterling (GBP) is the oldest currency in the world (886 AD) and the official currency of the United Kingdom. It is the fourth most traded unit for foreign exchange (FX) in the world, accounting for 12% of all transactions, averaging $630 billion a day, according to 2022 data. Its key trading pairs are GBP/USD, aka ‘Cable’, which accounts for 11% of FX, GBP/JPY, or the ‘Dragon’ as it is known by traders (3%), and EUR/GBP (2%). The Pound Sterling is issued by the Bank of England (BoE).
The single most important factor influencing the value of the Pound Sterling is monetary policy decided by the Bank of England. The BoE bases its decisions on whether it has achieved its primary goal of “price stability” – a steady inflation rate of around 2%. Its primary tool for achieving this is the adjustment of interest rates. When inflation is too high, the BoE will try to rein it in by raising interest rates, making it more expensive for people and businesses to access credit. This is generally positive for GBP, as higher interest rates make the UK a more attractive place for global investors to park their money. When inflation falls too low it is a sign economic growth is slowing. In this scenario, the BoE will consider lowering interest rates to cheapen credit so businesses will borrow more to invest in growth-generating projects.
Data releases gauge the health of the economy and can impact the value of the Pound Sterling. Indicators such as GDP, Manufacturing and Services PMIs, and employment can all influence the direction of the GBP. A strong economy is good for Sterling. Not only does it attract more foreign investment but it may encourage the BoE to put up interest rates, which will directly strengthen GBP. Otherwise, if economic data is weak, the Pound Sterling is likely to fall.
Another significant data release for the Pound Sterling is the Trade Balance. This indicator measures the difference between what a country earns from its exports and what it spends on imports over a given period. If a country produces highly sought-after exports, its currency will benefit purely from the extra demand created from foreign buyers seeking to purchase these goods. Therefore, a positive net Trade Balance strengthens a currency and vice versa for a negative balance.
- Silver price refreshes weekly high at $29.20 as weak US NFP data sends US yields down.
- The US NFP report showed that labor demand has slowed and wage growth has softened.
- Investors see the Fed pivoting to policy normalization in September.
Silver price (XAG/USD) posts a fresh weekly high at $29.20 in Friday’s North American trading hours. The white metal gains as US yields sink after the United States (US) Nonfarm Payrolls (NFP) report for July showed signs of cooling labor market conditions.
10-year US Treasury yields witness a bloodbath and dives to multi-month low near 3.82%. The US Dollar Index (DXY), which tracks the Greenback’s value against six major currencies, plunges below 103.30. Lower yields on interest-bearing assets bode strongly for the Gold price as they reduce the opportunity cost of investment in non-yielding assets.
The report showed that labor demand has softened as number of individuals hired by employers in July came in lower at 114K than estimates of 175K and June’s reading of 179K. The Unemployment Rate jumps to 4.3%, the highest since November 2021, from expectations and the prior release of 4.1%. The report clearly indicates that the labor market struggles to bear the consequences of higher interest rates by the Federal Reserve (Fed).
Meanwhile, Average Hourly Earnings have also grown at a slower pace, pointing to a slowdown in consumer spending that eventually cools down inflationary pressures. Annually, the wage growth measure decelerated at a faster-than-expected pace to 3.6%. While the labor market has cooled down, it will add to reasons prompting expectations of sooner rate cuts by the Fed. The Fed is widely anticipated to start reducing interest rates from the September meeting.
Silver technical analysis
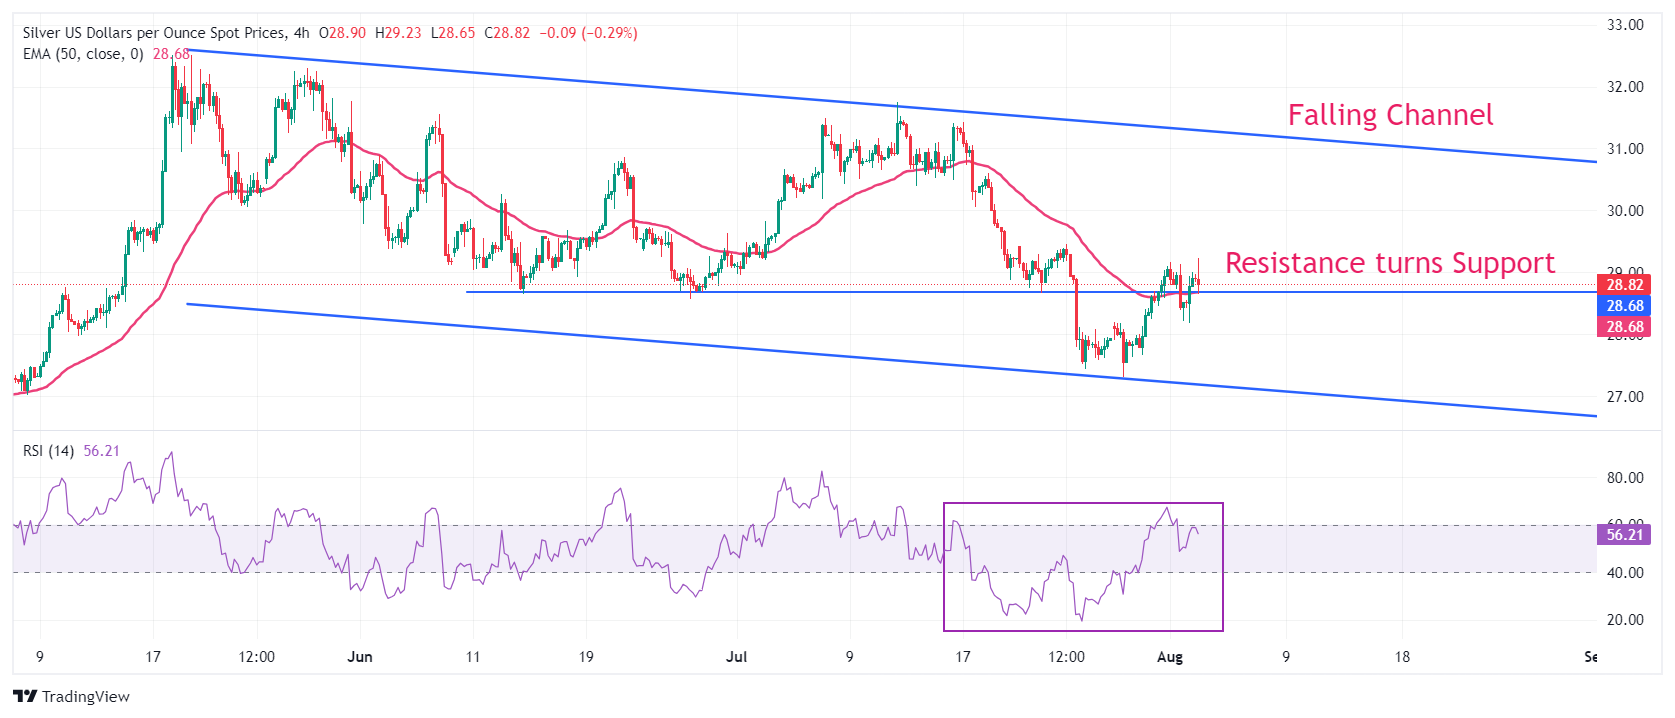
Silver price breaks above the horizontal resistance plotted from June 13 low at $28.66 on a four-hour timeframe, which has become a support now. The asset climbs above the 50-period Exponential Moving Average (EMA) near $28.70, suggesting that the near-term trend is upbeat.
The 14-period Relative Strength Index (RSI) moves higher to near 60.00. If the RSI breaks above 60.00, the momentum will shift to the upside.
Silver four-hour chart
Silver FAQs
Silver is a precious metal highly traded among investors. It has been historically used as a store of value and a medium of exchange. Although less popular than Gold, traders may turn to Silver to diversify their investment portfolio, for its intrinsic value or as a potential hedge during high-inflation periods. Investors can buy physical Silver, in coins or in bars, or trade it through vehicles such as Exchange Traded Funds, which track its price on international markets.
Silver prices can move due to a wide range of factors. Geopolitical instability or fears of a deep recession can make Silver price escalate due to its safe-haven status, although to a lesser extent than Gold's. As a yieldless asset, Silver tends to rise with lower interest rates. Its moves also depend on how the US Dollar (USD) behaves as the asset is priced in dollars (XAG/USD). A strong Dollar tends to keep the price of Silver at bay, whereas a weaker Dollar is likely to propel prices up. Other factors such as investment demand, mining supply – Silver is much more abundant than Gold – and recycling rates can also affect prices.
Silver is widely used in industry, particularly in sectors such as electronics or solar energy, as it has one of the highest electric conductivity of all metals – more than Copper and Gold. A surge in demand can increase prices, while a decline tends to lower them. Dynamics in the US, Chinese and Indian economies can also contribute to price swings: for the US and particularly China, their big industrial sectors use Silver in various processes; in India, consumers’ demand for the precious metal for jewellery also plays a key role in setting prices.
Silver prices tend to follow Gold's moves. When Gold prices rise, Silver typically follows suit, as their status as safe-haven assets is similar. The Gold/Silver ratio, which shows the number of ounces of Silver needed to equal the value of one ounce of Gold, may help to determine the relative valuation between both metals. Some investors may consider a high ratio as an indicator that Silver is undervalued, or Gold is overvalued. On the contrary, a low ratio might suggest that Gold is undervalued relative to Silver.
EUR/USD edged a little higher in European trade, reflecting the general drift in the US Dollar (USD), and broke above 1.09, Scotiabank’s FX strategist Shaun Osborne notes.
EUR trades above 1.09 intraday
“The Euro (EUR) has steadied against the CHF after the cross fell sharply overall this week as havens have been in demand amid geo-political worries and weak stocks. European sovereign debt spreads have widened somewhat as Italian and Greek debt underperform in the broader wave of risk aversion.”
“The EUR has picked up a little support in European trade, reflecting a firm zone of support for the EUR around the 1.08—where all the major moving averages and retracement support (61.8% of the June/July rally at 1.0774) coalesce. EUR broke above 1.09 intraday and trades around 1.0911 level.”
Soft stocks are helping keep the Canadian Dollar (CAD) tone defensive but whether weaker equity markets are enough of a justification for driving the CAD significantly lower at the moment remains to be seen, Scotiabank’s FX strategist Shaun Osborne notes.
Heightened CAD volatility is possible
“Thinner liquidity Monday, when local markets are closed, might open the door for heightened CAD volatility in response to still weaker equities but that is not necessarily something that is well grounded in fundamentals.”
“Beyond weak stocks, underlying factors (spreads, crude oil and the general USD tone) have moved in the CAD’s favour in the past few days, leaving spot trading a big figure above our fair value estimate (1.3785). That should help constrain the USD’s ability to push higher to some extent but the CAD is unlikely to pick up too much ground while stocks are trading defensively.”
“The CAD got clobbered yesterday, driving spot to near the late 1.2023 high just under 1.39. Spot has consolidated below the figure this morning but there is scant sign of any CAD-positive price developments on the intraday chart. Rather, the USD appears to be pausing ahead of another attempt higher from a technical point of view. Support is 1.3790/00. Resistance is 1.3890/00 and 1.40.”
Although the Copper price has already recovered somewhat, the numerous poor sentiment indicators in the manufacturing sector left their mark, Commerzbank’s commodity analyst Carsten Fritsch notes.
Weak construction sector acts as a brake for Copper
“Not only did sentiment in China deteriorate further – the Caixin index even fell slightly below 50 and thus back into the range that signals a contraction – but yesterday afternoon the ISM index in the US also disappointed and fell further significantly below 50.”
“In addition, assessments from the Chinese, state-backed research group Antaike, which according to a Reuters report has forecast falling Copper prices in the second half of the year, had a negative impact. After all, steady production growth in the Copper refining industry is encountering weak demand growth.”
“After an increase of 5.3% in the previous year, demand in China is only expected to grow by 2.3% this year. The weak construction sector is acting as a brake. A global supply surplus of 300 thousand tons is expected on the Copper market. Antaike was more optimistic about the base metals aluminium and zinc. The greatest price potential is seen for tin.”
- GBP/USD rises above 1.2800 on disappointing US NFP and higher jobless rate.
- The USD Index posts a fresh four-month low near 103.30 after a weak labor market report.
- The BoE commenced its policy-easing campaign on Thursday.
The GBP/USD pair recovers at a strong pace from an intraday low of 1.2707 above the round-level resistance of 1.2800 in Friday’s New York session. The Cable discovers strong buying interest on disappointing United States (US) Nonfarm Payrolls (NFP) data for July, which boosts already firm speculation of Federal Reserve (Fed) September interest rate cuts.
Fresh payrolls came in lower at 114K than estimates of 175K and June’s reading of 179K. The Unemployment Rate jumps to 4.3%, the highest since November 2021, from expectations and the prior release of 4.1%. The report suggests the consequences of higher interest rates by the Fed on the labor market.
The NFP report cleared that risks have now widened to both factors of the Fed’s dual mandate. Meanwhile, annual Average Hourly Earnings have decelerated at as faster-than-expected pace to 3.6% from the estimates of 3.7% and the former release of 3.8%. Also, the wage growth measure rose at a slower pace of 0.2%. A steep cut on individuals’ finances will weaken overall spending.
In the monetary policy announcement, Fed Chair Jerome Powell commented that rate cuts could be sooner rather than later if the labor market faces unexpected risks.
Weak employment data has weighed heavily on the US Dollar (USD). The US Dollar Index (DXY), which tracks the Greenback’s value against six major currencies, dives to a fresh four-month low near 103.30.
On the other side of the Atlantic, the Pound Sterling remains mixed against its major peers after the expected interest rate-cut decision by the Bank of England (BoE) on Thursday. The BoE reduced key borrowing rates by 25 basis points (bps) to 5%, with a 5-4 vote split. Over the interest rate outlook, BoE Governor Andrew Bailey commented in the press conference that the central bank won’t follow an aggressive policy-easing stance.
Pound Sterling FAQs
The Pound Sterling (GBP) is the oldest currency in the world (886 AD) and the official currency of the United Kingdom. It is the fourth most traded unit for foreign exchange (FX) in the world, accounting for 12% of all transactions, averaging $630 billion a day, according to 2022 data. Its key trading pairs are GBP/USD, aka ‘Cable’, which accounts for 11% of FX, GBP/JPY, or the ‘Dragon’ as it is known by traders (3%), and EUR/GBP (2%). The Pound Sterling is issued by the Bank of England (BoE).
The single most important factor influencing the value of the Pound Sterling is monetary policy decided by the Bank of England. The BoE bases its decisions on whether it has achieved its primary goal of “price stability” – a steady inflation rate of around 2%. Its primary tool for achieving this is the adjustment of interest rates. When inflation is too high, the BoE will try to rein it in by raising interest rates, making it more expensive for people and businesses to access credit. This is generally positive for GBP, as higher interest rates make the UK a more attractive place for global investors to park their money. When inflation falls too low it is a sign economic growth is slowing. In this scenario, the BoE will consider lowering interest rates to cheapen credit so businesses will borrow more to invest in growth-generating projects.
Data releases gauge the health of the economy and can impact the value of the Pound Sterling. Indicators such as GDP, Manufacturing and Services PMIs, and employment can all influence the direction of the GBP. A strong economy is good for Sterling. Not only does it attract more foreign investment but it may encourage the BoE to put up interest rates, which will directly strengthen GBP. Otherwise, if economic data is weak, the Pound Sterling is likely to fall.
Another significant data release for the Pound Sterling is the Trade Balance. This indicator measures the difference between what a country earns from its exports and what it spends on imports over a given period. If a country produces highly sought-after exports, its currency will benefit purely from the extra demand created from foreign buyers seeking to purchase these goods. Therefore, a positive net Trade Balance strengthens a currency and vice versa for a negative balance.
The price of Silver is still a long way off the multi-year high recorded in May, Commerzbank’s commodity analyst Carsten Fritsch notes.
Low Silver price fuels buying interest
“The price of Silver is still a long way off the multi-year high recorded in May. The price increase to $29 per troy ounce merely made up for the losses since the middle of last week. The Gold/Silver ratio therefore remains at a high level of 85. By comparison, it was 73 at the end of May and 75 ounces at the beginning of July.”
“Apparently, the comparatively low Silver price is fueling buying interest among ETF investors. According to Bloomberg data, Silver ETFs have seen strong inflows since mid-July. In the last two and a half weeks, these have totalled around 1,030 tons. Most of the inflows took place on days immediately following sharp price falls, which supports the aforementioned thesis.”
“However, the purchases did not have a visible positive effect on the Silver price. The recent price increase was more due to hopes of an upcoming interest rate turnaround in the US. Weaker US labor market data this afternoon could therefore also cause the Silver price to rise further.”
The price of Gold rose to just under $2,470 per troy ounce this morning, approaching the record high of mid-July, boosted by comments made by Fed Chairman Powell on Wednesday evening, Commerzbank’s commodity analyst Carsten Fritsch notes.
Market expects a first Fed rate cut in September
“The price of Gold rose to just under $2,470 per troy ounce this morning, approaching the record high of mid-July. The price was boosted by comments made by Fed Chairman Powell on Wednesday evening, who opened the door to a rate cut in September at the press conference following the Fed meeting. According to Fed Funds Futures, the market now firmly expects a first rate cut in September.”
“After the weak US data yesterday, the market even started to price in a rate cut of 50 basis points, although Powell had actually ruled this out at the press conference. Today's US labor market data are therefore interesting, especially as Powell had shifted the Fed's focus more towards the labor market on Wednesday. Disappointing data may intencify the interest rate speculation, and the Gold price could in this case may rise further.”
“However, we are skeptical that the price increase will last. This is because we expect only two interest rate cuts by the Fed by the end of the year, while the market is already pricing in three rate cuts. However, Gold is also receiving support from the increasing tensions in the Middle East (see above), which is benefiting from its role as a safe haven.”
The Joint Ministerial Monitoring Committee (JMMC) of OPEC+ did not decide to change production policy at its virtual meeting yesterday, Commerzbank’s commodity analyst Carsten Fritsch notes.
OPEC+ keeps production policy intact
“The JMMC of OPEC+ did not decide to change production policy at its virtual meeting yesterday This had already been expected from statements made by informed sources in the run-up to the meeting. This means that the planned gradual increase in oil production from the 4th quarter onwards will remain in place for the time being.”
“Whether this will actually happen, however, depends on market conditions, as representatives of Saudi Arabia and Russia have repeatedly emphasized. The 8% drop in oil prices since mid-July, triggered by demand concerns, is likely to have made OPEC+ aware of how ambitious the intended supply increase is, should demand grow less strongly than expected.”
“The last word on this has therefore not yet been spoken. Iraq, Kazakhstan and Russia have once again pledged to fully comply with the agreed production cuts. So far, this has not happened despite repeated assurances. Iraq in particular has continued to produce significantly more than agreed until recently.”
Oil prices have had a volatile week. At the beginning of the week, they were under pressure due to demand concerns. As a result, Brent fell to a seven-week low of $78.5 per barrel on Tuesday. The losses were subsequently erased before prices slipped again yesterday, Commerzbank’s commodity analyst Carsten Fritsch notes.
Oil prices have a volatile week
“At the beginning of the week, oil prices were under pressure due to demand concerns. As a result, Brent fell to a seven-week low of $78.5 per barrel on Tuesday. The mid-week reversal was triggered by increasing tensions in the Middle East after a high-ranking commander of the Shiite terrorist militia Hezbollah and a leader of the radical Islamic Hamas were killed near Beirut and Tehran, presumably in retaliatory Israeli actions.”
“Hamas, Hezbollah and Iran have in turn announced retaliation. The US expects Iran to attack Israel in the coming days. Depending on how strong this attack is, Israel could retaliate again and the conflict could escalate further. If the conflict spreads, the supply of oil from the region could also be affected. At the very least, further attacks by the Houthi rebels on merchant ships and oil tankers in the Red Sea are to be expected.”
“The ultimate risk would be a disruption to shipping through the Strait of Hormuz in the Persian Gulf. A higher risk premium on the oil price therefore seems appropriate. However, this is currently being overshadowed by demand concerns, which came back into focus yesterday following the publication of weak US economic data.”
- USD/JPY stays deep in negative territory on Friday.
- US Dollar weakens against its major rivals after July jobs report.
- Nonfarm Payrolls in the US rose by 114,000, missing the market expectation of 175,000.
USD/JPY extended its weekly slide and touched its weakest level since March near 147.00 on Friday. At the time of press, USD/JPY was trading at 147.80, where it was down 1% on a daily basis.
Japanese Yen PRICE This week
The table below shows the percentage change of Japanese Yen (JPY) against listed major currencies this week. Japanese Yen was the strongest against the British Pound.
| USD | EUR | GBP | JPY | CAD | AUD | NZD | CHF | |
|---|---|---|---|---|---|---|---|---|
| USD | -0.36% | 0.38% | -3.69% | 0.07% | 0.11% | -1.48% | -2.00% | |
| EUR | 0.36% | 0.70% | -3.40% | 0.45% | 0.50% | -1.14% | -1.62% | |
| GBP | -0.38% | -0.70% | -4.12% | -0.27% | -0.20% | -1.82% | -2.31% | |
| JPY | 3.69% | 3.40% | 4.12% | 3.87% | 3.97% | 2.28% | 1.79% | |
| CAD | -0.07% | -0.45% | 0.27% | -3.87% | 0.07% | -1.58% | -2.04% | |
| AUD | -0.11% | -0.50% | 0.20% | -3.97% | -0.07% | -1.60% | -2.11% | |
| NZD | 1.48% | 1.14% | 1.82% | -2.28% | 1.58% | 1.60% | -0.50% | |
| CHF | 2.00% | 1.62% | 2.31% | -1.79% | 2.04% | 2.11% | 0.50% |
The heat map shows percentage changes of major currencies against each other. The base currency is picked from the left column, while the quote currency is picked from the top row. For example, if you pick the Japanese Yen from the left column and move along the horizontal line to the US Dollar, the percentage change displayed in the box will represent JPY (base)/USD (quote).
US jobs report disappoints
The broad-based selling pressure surrounding the US Dollar (USD) on dismal labor market data caused USD/JPY to push lower in the early American session. Reflecting the USD weakness, the US Dollar Index was last seen losing 0.85% on the day at 103.46.
The US Bureau of Labor Statistics (BLS) reported that Nonfarm Payrolls (NFP) rose 114,000 in July, falling short of the market expectation of 175,000. Additionally, June’s increase of 206,000 got revised lower to 179,000. The Unemployment Rate edged higher to 4.3% from 4.2% in June and annual wage inflation, as measured by the change in Average Hourly Earnings, softened to 3.6% from 3.8%.
Earlier in the week, the Bank of Japan unexpectedly decided to raise its policy rate by 15 basis points, fuelling a Japanese Yen rally. On a weekly basis, USD/JPY is down over 3.5%.
Japanese Yen FAQs
The Japanese Yen (JPY) is one of the world’s most traded currencies. Its value is broadly determined by the performance of the Japanese economy, but more specifically by the Bank of Japan’s policy, the differential between Japanese and US bond yields, or risk sentiment among traders, among other factors.
One of the Bank of Japan’s mandates is currency control, so its moves are key for the Yen. The BoJ has directly intervened in currency markets sometimes, generally to lower the value of the Yen, although it refrains from doing it often due to political concerns of its main trading partners. The current BoJ ultra-loose monetary policy, based on massive stimulus to the economy, has caused the Yen to depreciate against its main currency peers. This process has exacerbated more recently due to an increasing policy divergence between the Bank of Japan and other main central banks, which have opted to increase interest rates sharply to fight decades-high levels of inflation.
The BoJ’s stance of sticking to ultra-loose monetary policy has led to a widening policy divergence with other central banks, particularly with the US Federal Reserve. This supports a widening of the differential between the 10-year US and Japanese bonds, which favors the US Dollar against the Japanese Yen.
The Japanese Yen is often seen as a safe-haven investment. This means that in times of market stress, investors are more likely to put their money in the Japanese currency due to its supposed reliability and stability. Turbulent times are likely to strengthen the Yen’s value against other currencies seen as more risky to invest in.
- AUD/USD gathered bullish momentum and turned positive on the day above 0.6500.
- Nonfarm Payrolls in the US rose by 114,000 in July.
- US Dollar stays under strong selling pressure after disappointing jobs data.
AUD/USD gained traction during the American trading hours on Friday and climbed above 0.6500. At the time of press, the pair was up 0.4% on the day at 0.6530.
US jobs data weigh heavily on USD
The US Dollar (USD) came under heavy selling pressure and fuelled AUD/USD's rebound. The data published by the US Bureau of Labor Statistics (BLS) showed that Nonfarm Payrolls (NFP) rose 114,000 in July. This reading followed June's increase of 179,000 (revised from 206,000) and missed the market expectation of 175,000 by a wide margin. Moreover, the Unemployment Rate climbed to 4.3% from 4.1% in June.
US Dollar PRICE Today
The table below shows the percentage change of US Dollar (USD) against listed major currencies today. US Dollar was the weakest against the Japanese Yen.
| USD | EUR | GBP | JPY | CAD | AUD | NZD | CHF | |
|---|---|---|---|---|---|---|---|---|
| USD | -0.93% | -0.48% | -1.09% | -0.12% | -0.36% | -0.30% | -0.93% | |
| EUR | 0.93% | 0.45% | -0.13% | 0.80% | 0.57% | 0.62% | -0.00% | |
| GBP | 0.48% | -0.45% | -0.62% | 0.37% | 0.10% | 0.18% | -0.43% | |
| JPY | 1.09% | 0.13% | 0.62% | 0.99% | 0.73% | 0.78% | 0.17% | |
| CAD | 0.12% | -0.80% | -0.37% | -0.99% | -0.24% | -0.16% | -0.79% | |
| AUD | 0.36% | -0.57% | -0.10% | -0.73% | 0.24% | 0.08% | -0.56% | |
| NZD | 0.30% | -0.62% | -0.18% | -0.78% | 0.16% | -0.08% | -0.60% | |
| CHF | 0.93% | 0.00% | 0.43% | -0.17% | 0.79% | 0.56% | 0.60% |
The heat map shows percentage changes of major currencies against each other. The base currency is picked from the left column, while the quote currency is picked from the top row. For example, if you pick the US Dollar from the left column and move along the horizontal line to the Japanese Yen, the percentage change displayed in the box will represent USD (base)/JPY (quote).
The benchmark 10-year US Treasury bond yield is down more than 3% on the day below 3.9%, putting additional weight on the USD's shoulders.
Meanwhile, disappointing labor market data seem to be hurting the risk sentiment. As we head to Wall Street's opening bell, US stock index futures are down between 1.1% and 2.15%. Since the economic calendar will not offer any other high-impact data releases ahead of the weekend, the risk-averse market atmosphere could help the USD limit its losses.
Nonfarm Payrolls FAQs
Nonfarm Payrolls (NFP) are part of the US Bureau of Labor Statistics monthly jobs report. The Nonfarm Payrolls component specifically measures the change in the number of people employed in the US during the previous month, excluding the farming industry.
The Nonfarm Payrolls figure can influence the decisions of the Federal Reserve by providing a measure of how successfully the Fed is meeting its mandate of fostering full employment and 2% inflation. A relatively high NFP figure means more people are in employment, earning more money and therefore probably spending more. A relatively low Nonfarm Payrolls’ result, on the either hand, could mean people are struggling to find work. The Fed will typically raise interest rates to combat high inflation triggered by low unemployment, and lower them to stimulate a stagnant labor market.
Nonfarm Payrolls generally have a positive correlation with the US Dollar. This means when payrolls’ figures come out higher-than-expected the USD tends to rally and vice versa when they are lower. NFPs influence the US Dollar by virtue of their impact on inflation, monetary policy expectations and interest rates. A higher NFP usually means the Federal Reserve will be more tight in its monetary policy, supporting the USD.
Nonfarm Payrolls are generally negatively-correlated with the price of Gold. This means a higher-than-expected payrolls’ figure will have a depressing effect on the Gold price and vice versa. Higher NFP generally has a positive effect on the value of the USD, and like most major commodities Gold is priced in US Dollars. If the USD gains in value, therefore, it requires less Dollars to buy an ounce of Gold. Also, higher interest rates (typically helped higher NFPs) also lessen the attractiveness of Gold as an investment compared to staying in cash, where the money will at least earn interest.
Nonfarm Payrolls is only one component within a bigger jobs report and it can be overshadowed by the other components. At times, when NFP come out higher-than-forecast, but the Average Weekly Earnings is lower than expected, the market has ignored the potentially inflationary effect of the headline result and interpreted the fall in earnings as deflationary. The Participation Rate and the Average Weekly Hours components can also influence the market reaction, but only in seldom events like the “Great Resignation” or the Global Financial Crisis.
As expected, the Bank of England (BoE) started the rate cut process yesterday. However, the vote was extremely close, with five policymakers voting for the move and four against, with BoE Governor Andrew Bailey appearing to be the swing vote. At the same time, it was stressed that there was no predetermined path for further rate cuts, but that it would be decided meeting by meeting whether the degree of monetary tightening could be eased further, Commerzbank’s FX strategist Volkmar Baur notes.
BoE is worried about further growth
“The overall impression was therefore that this was more of a hawkish rate cut. It was also emphasised several times that inflation remains stubborn, especially with regard to services inflation, and that we should see higher year-on-year rates again towards the end of the year due to base effects.”
“Unless there is a surprisingly sharp fall in inflation in the coming months, the BoE is likely to be cautious about cutting rates for the time being. The two further rate cuts this year, which the market priced in yesterday, do not really fit into this picture. Although expectations have now corrected somewhat, it is more likely that the BoE will make one more cut this year and that further rate cuts will be gradual.”
“Bailey emphasised several times that growth in the first few months of the year was stronger than expected, but that this distorts the true situation upwards. Other signals suggest that underlying growth is weaker. So they are also expecting a slowdown again. This is something to watch out for in the coming months.”
The fact that the Japanese Yen (JPY) only really started to appreciate at the end of the press conference, after the initial reaction to the rate hike was rather muted. But when the appreciation started, it was quite pronounced. It is clear that the Bank of Japan (BoJ) has made a political decision to support the currency, Commerzbank’s FX strategist Volkmar Baur notes.
Intervention or not intervention
“First of all, we won't know for a while whether BoJ intervened on behalf of the MOF at that exact moment. But it certainly looks that way. This makes the BoJ the only central bank that has to intervene within hours of a rate hike in order for the currency to react as it ‘should’. By intervening, the BoJ is betting that inflation will remain high and the economy robust. If this is not the case - the JPY could go the other way again.”
“Second, at least one of Governor Ueda's answers during the press conference was surprising. When asked why rates were being raised now and not later, given the weak economy and falling inflation, he said that the rate hike would only slow down the economy a bit. But shouldn't the economy be supported in such an environment?”
“And third, there is still talk about the positive feedback loop between rising wages and rising domestic inflationary pressures. Buy, within the data, real wages continue to fall because inflation is higher than wage growth, which is also burdened by higher social security contributions. So, there is no sense of optimism, higher consumption and the resulting demand-driven inflation.”
It could be pointed out again that the US employment report is a very volatile time series and therefore tends to contain more noise than signal. One could also point out that the time series tends to be revised a lot after the first publication, which adds to the noise, Commerzbank’s FX strategist Volkmar Baur notes.
The labor market is now more in the Fed's focus
“But you could also just admit that it's just the way it is: every first Friday of the month, the market is transfixed by the US employment report. And so, it will be today. Especially after the Federal Reserve (Fed) Chairman Powell emphasized on Wednesday that the labor market is now more in the Fed's focus. We already got a small taste of this yesterday.”
“A weak ISM manufacturing report and in particular a very weak employment component (which fell from 49.3 to 43.4) caused the dollar to weaken briefly on a day when the greenback was otherwise in demand. However, traders seemed to quickly remember that less than one in ten (8.2%) people in the US work in manufacturing and that the labor market is dominated by the service sector.”
“This month the market will be paying more attention than usual to all components of the report. In particular, wage growth and the unemployment rate are likely to attract attention, the latter to see if the so-called Sahm rule is triggered. This rule states that a recession has historically followed when the three-month moving average of the unemployment rate is more than 0.5 percentage points below the 12-month low. In June it was 0.43. I think it is unlikely that it will be triggered today, but the market will be watching closely.”
- USD/CAD trades near a non-month high near 1.3900 ahead of US NFP data for July.
- Market sentiment remains risk-averse amid potential slowdown fears in the US.
- The BoC could cut interest rates again.
The USD/CAD pair trades close to a nine-month high at 1.3890 in Friday’s European session. The Loonie asset exhibits strength amid dismal market moods. Fears of a severe slowdown in the United States (US) economy have deepened after the US ISM Manufacturing PMI report showed a sharp contraction in factory activities in July and Initial jobless claims reading came in highest in 11 months for the week ending July 26.
S&P 500 futures have posted significant losses in European trading hours, exhibiting a sharp decline in investors’ risk appetite. Meanwhile, investors jumped for the Japanese Yen (JPY) and the Swiss Franc (CHF) as safe-haven bets.
The US Dollar Index (DXY), which tracks the Greenback’s value against six major currencies, slumps to near 104.10. 10-year US Treasury yields have plummeted further to 3.94% as speculation for the Federal Reserve (Fed) to begin reducing interest rates from the September meeting appears certain.
In Friday’s session, the US Dollar (USD) will be impacted by the US Nonfarm Payrolls (NFP) data for July, which will be published at 12:30 GMT. The Employment data is expected to show that 175K fresh workers were hired in July, lower than the 206K payrolls recorded in June. Annual Average Hourly Earnings data is expected to have decelerated to 3.7%.
Meanwhile, the Canadian Dollar (CAD) weakens on expectations that the Bank of Canada (BoC) could cut interest rates again. Price pressures in the Canadian economy have softened significantly, and investors remain concerned over deteriorating spending and investment. This would force the BoE to extend the policy-easing spell.
Canadian Dollar FAQs
The key factors driving the Canadian Dollar (CAD) are the level of interest rates set by the Bank of Canada (BoC), the price of Oil, Canada’s largest export, the health of its economy, inflation and the Trade Balance, which is the difference between the value of Canada’s exports versus its imports. Other factors include market sentiment – whether investors are taking on more risky assets (risk-on) or seeking safe-havens (risk-off) – with risk-on being CAD-positive. As its largest trading partner, the health of the US economy is also a key factor influencing the Canadian Dollar.
The Bank of Canada (BoC) has a significant influence on the Canadian Dollar by setting the level of interest rates that banks can lend to one another. This influences the level of interest rates for everyone. The main goal of the BoC is to maintain inflation at 1-3% by adjusting interest rates up or down. Relatively higher interest rates tend to be positive for the CAD. The Bank of Canada can also use quantitative easing and tightening to influence credit conditions, with the former CAD-negative and the latter CAD-positive.
The price of Oil is a key factor impacting the value of the Canadian Dollar. Petroleum is Canada’s biggest export, so Oil price tends to have an immediate impact on the CAD value. Generally, if Oil price rises CAD also goes up, as aggregate demand for the currency increases. The opposite is the case if the price of Oil falls. Higher Oil prices also tend to result in a greater likelihood of a positive Trade Balance, which is also supportive of the CAD.
While inflation had always traditionally been thought of as a negative factor for a currency since it lowers the value of money, the opposite has actually been the case in modern times with the relaxation of cross-border capital controls. Higher inflation tends to lead central banks to put up interest rates which attracts more capital inflows from global investors seeking a lucrative place to keep their money. This increases demand for the local currency, which in Canada’s case is the Canadian Dollar.
Macroeconomic data releases gauge the health of the economy and can have an impact on the Canadian Dollar. Indicators such as GDP, Manufacturing and Services PMIs, employment, and consumer sentiment surveys can all influence the direction of the CAD. A strong economy is good for the Canadian Dollar. Not only does it attract more foreign investment but it may encourage the Bank of Canada to put up interest rates, leading to a stronger currency. If economic data is weak, however, the CAD is likely to fall.
- NZD/USD trades sideways around 0.5950, with investors focusing on the US NFP report for July.
- The Fed is expected to roll back its restrictive policy framework from September.
- Risk aversion market mood has dampened the New Zealand Dollar’s near-term outlook.
The NZD/USD pair trades in a tight range near 0.5950 in Friday’s European session. The Kiwi asset exhibits indecisiveness among market participants as investors await the United States (US) Nonfarm Payrolls (NFP) data for July, which will be published at 12:30 GMT.
The NFP report will indicate the current status of the labor market, which will influence market speculation for Federal Reserve’s (Fed) September interest rate cuts. According to the estimates, US employers are expected to have hired 175K fresh workers, lower than 206K payrolls recorded in June. The Unemployment Rate is expected to remain steady at 4.1%.
Apart from Employment numbers, investors will focus on the Average Hourly Earnings data, a key measure to wage growth that fuels consumer spending which eventually influence price pressures. Annually, the wage growth measure is estimated to have decelerated to 3.7% from the prior reading of 3.9%, with monthly figure growing steadily by 0.3%.
Meanwhile, market expectations for the Fed reducing interest rates are firm as Fed Chair Jerome Powell acknowledged that policymakers have gained greater confidence that inflation will return to the desired rate of 2% from Consumer Price Index (CPI) reports released in the second quarter. Jerome Powell said rate cuts will be on the table in September if inflation continues to decline consistently with bank’s expectations.
In the Asia-Pacific region, the overall outlook of the New Zealand Dollar (NZD) remains weak as investors become risk-averse amid fears of slowdown in the US economy. Also, China’s vulnerable economic prospects have dampened investors’ risk appetite.
Going forward, the major trigger for the Kiwi Dollar will be the Q2 Employment and Labor Cost Index data, which will be published on Tuesday. The Employment data will influence market expectations for Reserve Bank of New Zealand (RBNZ) rate cuts this year.
New Zealand Dollar FAQs
The New Zealand Dollar (NZD), also known as the Kiwi, is a well-known traded currency among investors. Its value is broadly determined by the health of the New Zealand economy and the country’s central bank policy. Still, there are some unique particularities that also can make NZD move. The performance of the Chinese economy tends to move the Kiwi because China is New Zealand’s biggest trading partner. Bad news for the Chinese economy likely means less New Zealand exports to the country, hitting the economy and thus its currency. Another factor moving NZD is dairy prices as the dairy industry is New Zealand’s main export. High dairy prices boost export income, contributing positively to the economy and thus to the NZD.
The Reserve Bank of New Zealand (RBNZ) aims to achieve and maintain an inflation rate between 1% and 3% over the medium term, with a focus to keep it near the 2% mid-point. To this end, the bank sets an appropriate level of interest rates. When inflation is too high, the RBNZ will increase interest rates to cool the economy, but the move will also make bond yields higher, increasing investors’ appeal to invest in the country and thus boosting NZD. On the contrary, lower interest rates tend to weaken NZD. The so-called rate differential, or how rates in New Zealand are or are expected to be compared to the ones set by the US Federal Reserve, can also play a key role in moving the NZD/USD pair.
Macroeconomic data releases in New Zealand are key to assess the state of the economy and can impact the New Zealand Dollar’s (NZD) valuation. A strong economy, based on high economic growth, low unemployment and high confidence is good for NZD. High economic growth attracts foreign investment and may encourage the Reserve Bank of New Zealand to increase interest rates, if this economic strength comes together with elevated inflation. Conversely, if economic data is weak, NZD is likely to depreciate.
The New Zealand Dollar (NZD) tends to strengthen during risk-on periods, or when investors perceive that broader market risks are low and are optimistic about growth. This tends to lead to a more favorable outlook for commodities and so-called ‘commodity currencies’ such as the Kiwi. Conversely, NZD tends to weaken at times of market turbulence or economic uncertainty as investors tend to sell higher-risk assets and flee to the more-stable safe havens.
The Federal Reserve (Fed) left rates unchanged in Jul as widely expected, Powell puts Sep rate cut on the table assuming conditions are met, UOB Group economist Lee Sue Ann notes.
Risk to delay cuts further is now better balanced
“The Fed in its 30/31 Jul 2024 Federal Open Market Committee (FOMC) meeting, unanimously agreed to keep the target range of its Fed Funds Target Rate (FFTR) unchanged at 5.25%-5.50%. This was widely expected and marked the eighth consecutive pause. The Fed also voted unanimously to keep the interest rate paid on reserves (IOER) balances unchanged at 5.40%.”
“The significant change in the Jul monetary policy statement (MPS) was the shift in the Fed’s focus to the dual mandate instead of just on inflation. Powell’s subsequent commentary was viewed as dovish, putting a Sep rate cut on the table, if inflation cools in line with expectations, and the solid labor market conditions are maintained.”
“After keeping the FFTR steady at 5.25-5.50% in the Jul FOMC, we continue to hold the view the Fed will subsequently start to ease monetary policy in late 3Q, where we factor in 50 bps of rate cuts for the remainder of 2024, (i.e. two 25- bps cuts, one each in Sep and Dec FOMC). The risk for the Fed to delay cuts further if the inflation descent is stalled again is now better balanced by the evident cooling of the labor market.”
Preliminary figures showed that inflation in the Eurozone accelerated to 2.6% in Jul, from 2.5% in Jun. Core inflation, which excludes volatile components like food and energy, held at 2.9% for a third month, which was a tad higher than expectations of 2.8%, UOB Group economist Lee Sue Ann notes.
Inflation in the Eurozone accelerates
“Eurozone headline inflation unexpectedly rose to 2.6% y/y in Jul. Core inflation, which excludes more volatile energy, food, alcohol and tobacco prices, hit 2.9% y/y in Jul, which was higher than expected. The widely watched services inflation came in at 4.0% y/y for July, easing slightly from the 4.1% reading in Jun.”
“The latest inflation report is one of two crucial monthly inflation readings that will inform ECB officials before the next ECB meeting on 12 Sep. Discussions among policymakers at the ECB are likely to intensify, as it mulls its next steps on the direction of interest rates in the 20-member region.”
“At this juncture, we keep to our view of another two 25bps cuts in 2024, one each in Sep and Dec; but would like to highlight that a Sep rate cut is a close call, and anything but certain.”
The Bank of England (BOE) decided to reduce its Bank Rate by 25 bps from 5.25% (where it has stood since Aug 2023) to 5.00% at its Aug meeting. While Thu’s move was in line with our expectations, it was a close call, UOB Group economist Lee Sue Ann notes.
A close call from the BoE
“BOE kicked off its easing cycle on 1 Aug with a 25bps rate cut to its Bank Rate from 5.25% to 5.00% in a 5-4 vote split. While the move was in line with our expectations, it was a close call.”
“The narrow vote, as well as hawkish elements throughout the accompanying press release and minutes; Monetary Policy Statement (MPS), as well as Governor Andrew Bailey’s press conference; reinforces our view that the BOE is in no rush to reduce rates again.”
“We see a rate hold at the next meeting on 19 Sep, and another rate cut at its 7 Nov meeting, on the premise that data on services inflation and wage growth will improve in the coming months, making the committee more comfortable with proceeding with one more cut this year.”
Downward momentum is picking up; the risk of the US Dollar (USD) breaking below 7.2037 is increasing.
USD has the capacity to break below 7.2027
24-HOUR VIEW: “Our view for USD to decline yesterday was incorrect, as it rebounded, reaching a high of 7.2579. Despite the advance, there is no clear increase in momentum, and USD is unlikely to rise much further. Today, USD is more likely to trade in a range, probably between 7.2300 and 7.2600.”
1-3 WEEKS VIEW: “After USD fell sharply two days ago, we indicated yesterday that ‘short-term downward momentum is picking up, and the risk of USD breaking below 7.2037 is increasing.’ We also indicated that the risk of USD breaking clearly below 7.2037 will remain intact as long at 7.2600 (no change ‘strong resistance’ level) is not breached. While USD subsequently rebounded strongly (high of 7.2579), we will continue to hold the same view for now.”
Outlook is mixed; the US Dollar (USD) could trade choppily between 148.20 and 150.50, UOB Group FX analysts Quek Ser Leang and Lee Sue Ann note.
The next support is at 148.20
24-HOUR VIEW: “The following are the excerpts from our update yesterday: ‘Further USD weakness is not ruled today. However, severely oversold conditions suggest the significant support level at 148.20 is likely out of reach. There is another support level at 149.00. To maintain the momentum, USD must remain below 151.30 with minor resistance at 150.50.’ USD then fluctuated wildly, as it dropped to 148.48, bounced strongly to 150.89, and then dropped back down to close at 149.36 (-0.41%). The choppy price action has resulted in a mixed outlook. Today, USD could continue to trade in a choppy manner, likely between 148.20 and 150.50.”
1-3 WEEKS VIEW: “Our update from yesterday (01 Aug, spot at 149.90) is still valid. As highlighted, the recent USD weakness is still intact, and the next level to watch is 148.20. The USD weakness is intact as long as 152.00 (‘strong resistance level was at 152.80 yesterday) is not breached.”
Two-week weakness has ended. The New Zealand Dollar (NZD) is likely to trade in a sideways range of 0.5915/0.5955, or, alternatively, the current recovery phase could extend to 0.5990, UOB Group FX analysts Quek Ser Leang and Lee Sue Ann note.
Closest resistance is at 0.5955
24-HOUR VIEW: “While we expected further NZD strength yesterday, we indicated that ‘it is unclear if it can break the solid resistance level at 0.5990.’ NZD subsequently rose briefly to 0.5985 before pulling back to close largely unchanged at 0.5951 (-0.01%). The pullback in overbought conditions and slowing momentum suggests the upside risk has faded for now. Today, NZD is likely to trade sideways, probably in a range of 0.5915/0.5955.”
1-3 WEEKS VIEW: “We indicated yesterday (01 Aug, spot at 0.5950) that the recent two-week NZD weakness has ended. We also indicated that ‘the current recovery phase could extend to 0.5990.’ We continue to hold the same view. Note that NZD rose to 0.5985 in NY trade before pulling back. Overall, only a breach of 0.5890 (no change in ‘strong support’ level) would suggest that 0.5990 is out of reach.”
The Australian Dollar (AUD) is likely to weaken; the significant support at 0.6425 is not expected to come into view (there is another support at 0.6455), UOB Group FX analysts Quek Ser Leang and Lee Sue Ann note.
Bears may try to push towards 0.6455
24-HOUR VIEW: “We expected AUD to trade in a range between 0.6515 and 0.6565 yesterday. However, after rising to 0.6560, it fell sharply to a low of 0.6490. Downward momentum is building, and today, AUD is likely to weaken even though the significant support level at 0.6425 is not expected to come into view (there is another support at 0.6455). To maintain the momentum buildup, AUD must remain below 0.6525, with minor resistance at 0.6510.”
1-3 WEEKS VIEW: “Yesterday (01 Aug, spot at 0.6545), we indicated that ‘if AUD breaches 0.6565, it would suggest that the weakness in AUD from two weeks ago has stabilised.’ AUD subsequently rose to 0.6560, then dropped sharply to close at 0.6502 (-0.52%). While conditions are severely oversold, from here, only a breach of 0.6550 (‘strong resistance’ was at 0.6565 yesterday) would mean that the weakness has stabilised. Until then, AUD could continue to weaken; even though it is unclear if it has enough momentum to break the significant support level at 0.6425.”
- EUR/USD rises above 1.0800 as the US Dollar slides on firm Fed rate-cut prospects.
- The Euro fails to capitalize on increased doubts over market expectations for two more ECB rate cuts this year.
- Investors await the US NFP for July.
EUR/USD hovers near the round-level figure of 1.0800 in Friday’s European session. The major currency pair is expected to remain on the sidelines as investors await the United States (US) Nonfarm Payrolls (NFP) data for July, which will be published at 12:30 GMT.
Economists estimate that 175K new workers were hired in July, lower than the former addition of 206K. The Unemployment Rate is expected to remain steady at 4.1%.
Investors will also focus on the Average Hourly Earnings data, a key measure of wage growth that fuels consumer spending and eventually influences price pressures. Annually, the wage growth measure is estimated to have decelerated to 3.7% from the prior reading of 3.9%, with the monthly figure growing steadily by 0.3%.
Ahead of the US NFP report, the US Dollar (USD) exhibits a subdued performance as a string of weak US economic data has pointed to a slowdown in the economy, which will add to reasons prompting the Federal Reserve (Fed) to begin reducing interest rates in September. The US Dollar Index (DXY), which tracks the Greenback’s value against six major currencies, drops to near 104.20.
On Thursday, the US ISM Manufacturing Purchasing Managers Index (PMI) report for July showed that factory activities unexpectedly contracted at a faster pace to 46.8. Economists estimated the Manufacturing PMI to contract at a slower pace to 48.8 from June’s reading of 48.5. Also, Initial Jobless Claims for the week ending July 26 came out highest in 11 months. Individuals claiming jobless benefits for the first time were higher at 249K than estimates of 236K and the former release of 235K.
Daily digest market movers: EUR/USD rises despite Euro remains on the backfoot
- EUR/USD edges higher to near the round-level resistance of 1.0800 in European trading hours on Friday. The performance of the shared currency pair has remained weak in the past few trading sessions. The asset fails to discover significant buying interest even though the Fed has leaned towards pivoting to policy normalization in September.
- On Wednesday, the Fed kept interest rates unchanged in the range of 5.25%-5.50% but delivered a dovish guidance, as expected. Fed Chair Jerome Powell said, "If we were to see inflation moving down more or less in line with expectations, growth remains reasonably strong, and the labor market remains consistent with current conditions, then I think a rate cut could be on the table at the September meeting”, Reuters reported.
- On the other side of the Atlantic, the Euro struggles to recover despite the hotter-than-expected Eurozone preliminary Harmonized Index of Consumer Prices (HICP) in July. The headline HICP unexpectedly rose to 2.6%, while economists expected the inflation figure to decelerate to 2.4% from June’s reading of 2.5%. The core HICP, which strips off volatile items such as food, energy, alcohol, and tobacco, grew steadily 2.9% against expectations of 2.8%.
- Also, the old continent’s preliminary Gross Domestic Product (GDP) growth in the second quarter was higher than expected. The Eurozone economy expanded steadily by 0.3%, while investors anticipated a slower growth rate of 0.2%.
- A scenario of stubborn inflation and steady growth is unfavorable for market expectations for interest rate cuts. Financial markets currently expect the European Central Bank (ECB) to cut its key borrowing rates two times more this year. A few ECB policymakers are comfortable with market expectations, while others refrain from committing to a specific rate-cut path.
Technical Analysis: EUR/USD hovers inside Symmetrical Triangle pattern
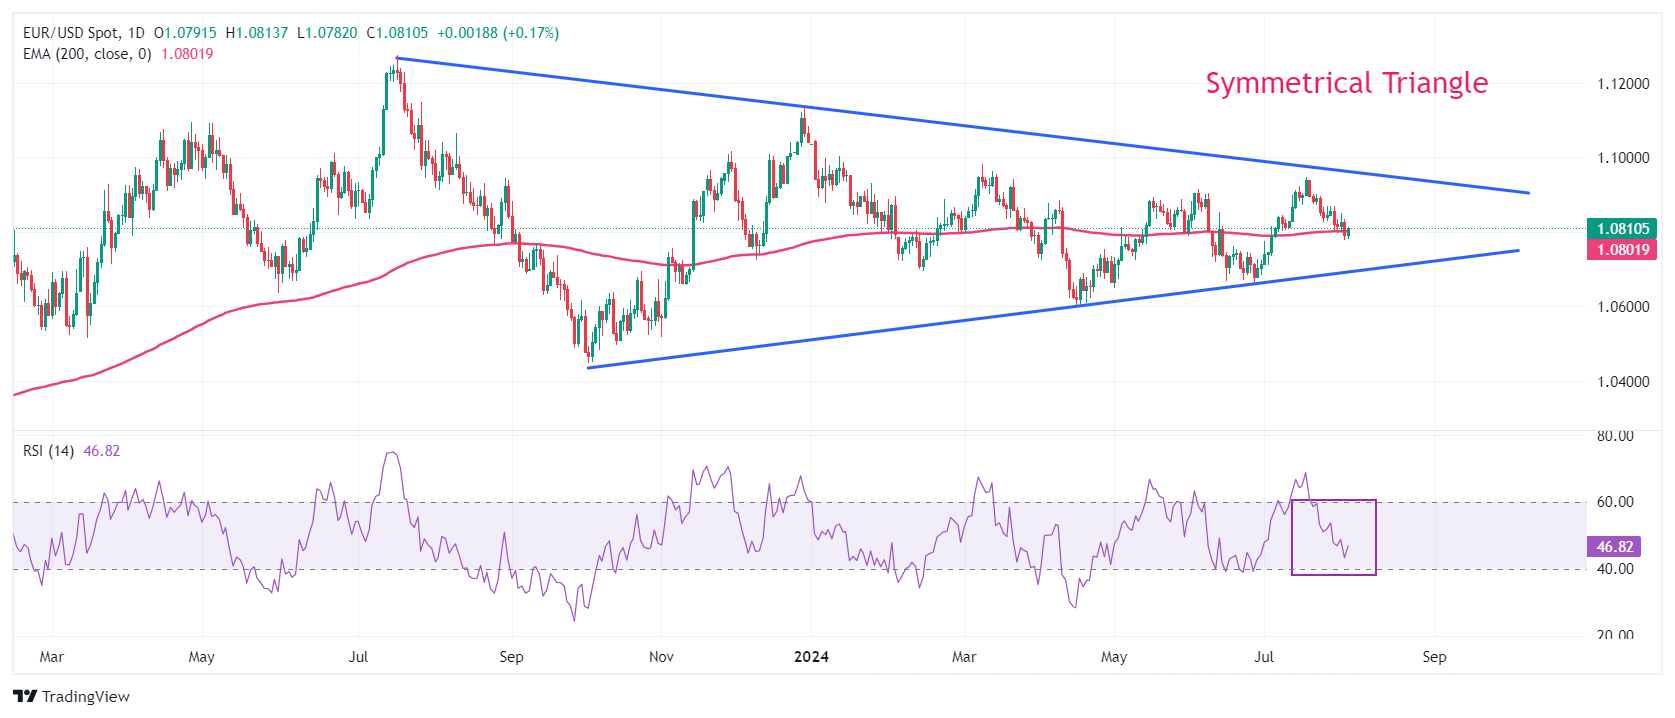
EUR/USD trades inside a Symmetrical Triangle formation on a daily timeframe, exhibiting a sideways trend. The aforementioned chart pattern signifies a sharp volatility contraction, which is expected to remain for a while amid the absence of clear signals of a breakout or a breakdown.
The shared currency pair faces selling pressure near the 20-day Exponential Moving Average (EMA) around 1.0835, suggesting that the near-term trend is bearish.
The 14-day Relative Strength Index (RSI) oscillates in the 40.00-60.00 range, indicating indecisiveness among market participants.
Euro FAQs
The Euro is the currency for the 20 European Union countries that belong to the Eurozone. It is the second most heavily traded currency in the world behind the US Dollar. In 2022, it accounted for 31% of all foreign exchange transactions, with an average daily turnover of over $2.2 trillion a day. EUR/USD is the most heavily traded currency pair in the world, accounting for an estimated 30% off all transactions, followed by EUR/JPY (4%), EUR/GBP (3%) and EUR/AUD (2%).
The European Central Bank (ECB) in Frankfurt, Germany, is the reserve bank for the Eurozone. The ECB sets interest rates and manages monetary policy. The ECB’s primary mandate is to maintain price stability, which means either controlling inflation or stimulating growth. Its primary tool is the raising or lowering of interest rates. Relatively high interest rates – or the expectation of higher rates – will usually benefit the Euro and vice versa. The ECB Governing Council makes monetary policy decisions at meetings held eight times a year. Decisions are made by heads of the Eurozone national banks and six permanent members, including the President of the ECB, Christine Lagarde.
Eurozone inflation data, measured by the Harmonized Index of Consumer Prices (HICP), is an important econometric for the Euro. If inflation rises more than expected, especially if above the ECB’s 2% target, it obliges the ECB to raise interest rates to bring it back under control. Relatively high interest rates compared to its counterparts will usually benefit the Euro, as it makes the region more attractive as a place for global investors to park their money.
Data releases gauge the health of the economy and can impact on the Euro. Indicators such as GDP, Manufacturing and Services PMIs, employment, and consumer sentiment surveys can all influence the direction of the single currency. A strong economy is good for the Euro. Not only does it attract more foreign investment but it may encourage the ECB to put up interest rates, which will directly strengthen the Euro. Otherwise, if economic data is weak, the Euro is likely to fall. Economic data for the four largest economies in the euro area (Germany, France, Italy and Spain) are especially significant, as they account for 75% of the Eurozone’s economy.
Another significant data release for the Euro is the Trade Balance. This indicator measures the difference between what a country earns from its exports and what it spends on imports over a given period. If a country produces highly sought after exports then its currency will gain in value purely from the extra demand created from foreign buyers seeking to purchase these goods. Therefore, a positive net Trade Balance strengthens a currency and vice versa for a negative balance.
Silver prices (XAG/USD) rose on Friday, according to FXStreet data. Silver trades at $28.91 per troy ounce, up 1.34% from the $28.53 it cost on Thursday.
Silver prices have increased by 21.49% since the beginning of the year.
| Unit measure | Silver Price Today in USD |
|---|---|
| Troy Ounce | 28.91 |
| 1 Gram | 0.93 |
The Gold/Silver ratio, which shows the number of ounces of Silver needed to equal the value of one ounce of Gold, stood at 85.21 on Friday, down from 85.76 on Thursday.
Silver FAQs
Silver is a precious metal highly traded among investors. It has been historically used as a store of value and a medium of exchange. Although less popular than Gold, traders may turn to Silver to diversify their investment portfolio, for its intrinsic value or as a potential hedge during high-inflation periods. Investors can buy physical Silver, in coins or in bars, or trade it through vehicles such as Exchange Traded Funds, which track its price on international markets.
Silver prices can move due to a wide range of factors. Geopolitical instability or fears of a deep recession can make Silver price escalate due to its safe-haven status, although to a lesser extent than Gold's. As a yieldless asset, Silver tends to rise with lower interest rates. Its moves also depend on how the US Dollar (USD) behaves as the asset is priced in dollars (XAG/USD). A strong Dollar tends to keep the price of Silver at bay, whereas a weaker Dollar is likely to propel prices up. Other factors such as investment demand, mining supply – Silver is much more abundant than Gold – and recycling rates can also affect prices.
Silver is widely used in industry, particularly in sectors such as electronics or solar energy, as it has one of the highest electric conductivity of all metals – more than Copper and Gold. A surge in demand can increase prices, while a decline tends to lower them. Dynamics in the US, Chinese and Indian economies can also contribute to price swings: for the US and particularly China, their big industrial sectors use Silver in various processes; in India, consumers’ demand for the precious metal for jewellery also plays a key role in setting prices.
Silver prices tend to follow Gold's moves. When Gold prices rise, Silver typically follows suit, as their status as safe-haven assets is similar. The Gold/Silver ratio, which shows the number of ounces of Silver needed to equal the value of one ounce of Gold, may help to determine the relative valuation between both metals. Some investors may consider a high ratio as an indicator that Silver is undervalued, or Gold is overvalued. On the contrary, a low ratio might suggest that Gold is undervalued relative to Silver.
(An automation tool was used in creating this post.)
Severely oversold conditions suggest any further decline is likely to be limited to a test of 1.2695. The significant support at 1.2645 is unlikely to come into view today. While outsized decline seems to be overdone, further Pound Sterling (GBP) weakness is not ruled out, UOB Group FX analysts Quek Ser Leang and Lee Sue Ann note.
Immediate support is at 1.2695
24-HOUR VIEW: “We expected GBP to trade in a range yesterday. The sudden sharp lurch lower that sent it plunging by 0.94% (NY close 1.2735) was surprising. The outsized decline is the biggest 1-day drop in about four months. While the weakness has not stabilised, severely oversold conditions suggest any further decline is likely to be limited to a test of 1.2695. The significant support level at 1.2645 is unlikely to come into view today. Resistance is at 1.2765; a breach of 1.2795 would mean that the weakness in GBP has stabilised.”
1-3 WEEKS VIEW: “Last Friday (26 Jul, spot at 1.2855), we highlighted that ‘downward momentum is building, but at this time, it is premature to expect a significant decline.’ We held the view that GBP ‘is likely to trade with a downward bias towards 1.2780.’ GBP subsequently traded slightly lower. Yesterday (01 Aug, spot at 1.2855), we noted that ‘the buildup in momentum is beginning to ease, and if GBP breaks above 1.2895, it would indicate that the downward bias has faded.’ We did not anticipate the subsequent outsized drop, as GBP plunged below 1.2780, reaching a low of 1.2727. While the price action seems to be overdone, further GBP weakness is not ruled out. The next level to monitor is 1.2645. On the upside, the ‘strong resistance’ level has moved lower to 1.2840 from 1.2895.”
Room for the Euro (EUR) to test the major support at 1.0760 before a recovery can be expected, UOB Group FX analysts Quek Ser Leang and Lee Sue Ann note.
May try to test 1.0760
24-HOUR VIEW: "Our view for EUR to trade sideways yesterday was incorrect. Instead of trading sideways, it fell to 1.0775 before closing at 1.0791 (- 0.31%). Downward momentum has increased, albeit not much. Today, there is room for EUR to test the major support at 1.0760 before a recovery can be expected. A sustained break below this level seems unlikely. The next support at 1.0745 is also unlikely to come under threat. Resistance levels are at 1.0805 and 1.0820."
1-3 WEEKS VIEW: "We turned negative in EUR in the middle of last week (see annotations in the chart below). After EUR struggled to extend its decline, we highlighted yesterday (01 Aug, spot at 1.0820) that “downward momentum is showing tentative signs of slowing, and the chance of EUR dropping further to 1.0760 is diminishing.” However, we pointed out that “only a breach of 1.0870 would mean that 1.0760 is out of reach this time round.” In London trade, EUR lurched lower and fell to 1.0775. The slowing momentum has been rejuvenated somewhat, but it remains to be seen if EUR has enough momentum to break clearly below 1.0760. Note that below 1.0760, there is another rather strong support at 1.0745. On the upside, the ‘strong resistance’ level has moved lower from 1.0870 to 1.0850."
- Gold price climbs above $2,460 as the US bond yields and the US Dollar face pressure ahead of the US NFP for July.
- The Fed appears comfortable with market speculation for interest rate cuts in September.
- Higher jobless claims and lower Unit Labor Costs point to a slowdown in US labor demand.
Gold price (XAU/USD) exhibits sheer strength in Friday’s European session ahead of the US Nonfarm Payrolls (NFP) data for July, which will be published at 12:30 GMT. The official Employment data will indicate the current status of the labor market, which will influence market speculation for a US Federal Reserve (Fed) rate cut in September.
The US NFP report is expected to show that 175K new workers were hired in July, a decrease from the previous addition of 206K. The Unemployment Rate is expected to remain steady at 4.1%.
Investors will also focus on the Average Hourly Earnings data, a key measure of wage growth that fuels consumer spending and eventually drives price pressures. Annually, the wage growth measure is estimated to have decelerated to 3.7% from the prior reading of 3.9%, with the monthly figure growing steadily by 0.3%. Softer-than-expected wage growth data will diminish fears of persistent inflation, which will strengthen Fed rate-cut prospects. On the contrary, stubborn numbers would weaken them.
Meanwhile, deepening risks of an all-out war between Iran and Israel have improved the Gold’s safe-haven appeal. Iran vows to retaliate against the killing of Hamas leader Ismail Haniyeh by an Israeli air strike in Tehran.
Daily digest market movers: Gold eyes all-time highs on multiple tailwinds
- Gold price rises further to near $2,470 in Friday’s European session. The precious metal aims to recapture all-time highs above $2,480 as the US bond yields and the US Dollar (USD) have weakened.
- 10-year US Treasury yields post a fresh six-month low near 3.95%, as speculation for the Federal Reserve to begin reducing interest rates in September appears to be certain. Lower yields on interest-bearing assets reduce the opportunity cost of holding an investment in non-yielding assets, such as Gold. Meanwhile, the US Dollar Index (DXY), which tracks the Greenback’s value against six major currencies, edges lower to near 104.25.
- The expectations for the Fed to pivot to policy normalization in September were prompted after Fed Chair Jerome Powell delivered a dovish guidance on interest rates. On Wednesday, the Fed left interest rates steady in the range of 5.25%-5.50% but said that rate cuts would be on the table in September if inflation declines more or less in line with expectations, growth remains reasonably strong, and the labor market remains consistent with current conditions.
- Also, weak United States (US) ISM Manufacturing Purchasing Managers’ Index (PMI) for July, the highest Initial Jobless Claims in 11 months for the week ending July 26, and lower preliminary Q2 Unit Labor Costs have spurted upside risks to a slowdown in the economy and labor demand.
- The PMI report showed that activity in the manufacturing sector contracted at a faster pace to 46.8. Individuals claiming jobless benefits for the first time were higher at 249K than estimates of 236K and the former release of 235K. Unit Labor Costs, a key measure of total cost borne by employers for onboarding workers, grew at a very slower pace of 0.9% from expectations of 1.8% and the prior release of 3.8%.
Technical Analysis: Gold price rises above $2,460
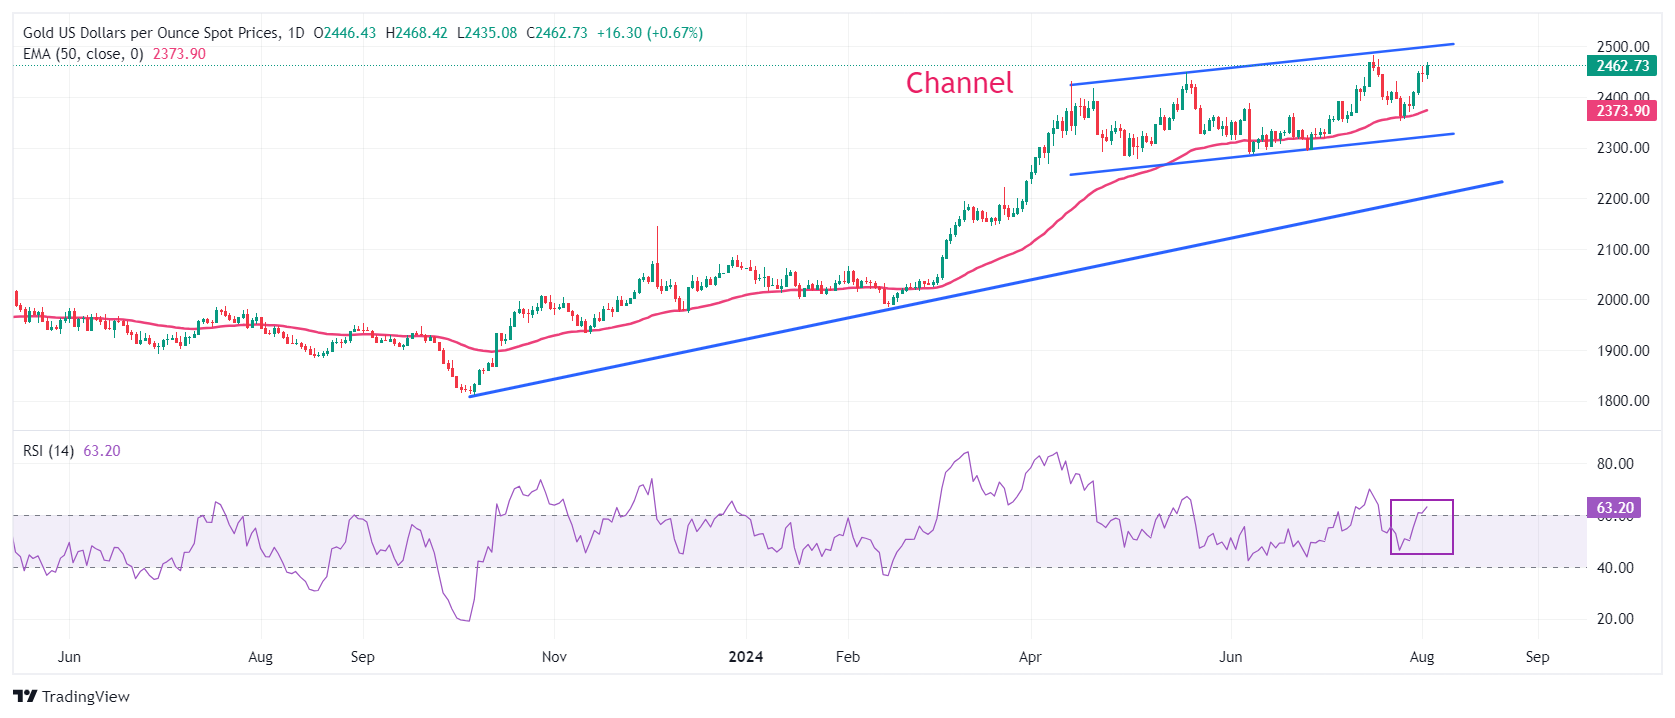 `
`
Gold price trades in a channel pattern on a daily timeframe, which is slightly rising but broadly exhibited a sideways performance for more than three months. The 50-day Exponential Moving Average (EMA) near $2,370 continues to provide support to the Gold price bulls.
The 14-day Relative Strength Index (RSI) moves higher to near 60.00. If the RSI climbs above that level, the momentum will shift to the upside.
A fresh upside would appear if the Gold price breaks above its all-time high of $2,483.75, which will send it into unchartered territory.
On the downside, the upward-sloping trendline at $2,225, plotted from the October 6 low near $1,810.50, will be a major support in the longer term.
Gold FAQs
Gold has played a key role in human’s history as it has been widely used as a store of value and medium of exchange. Currently, apart from its shine and usage for jewelry, the precious metal is widely seen as a safe-haven asset, meaning that it is considered a good investment during turbulent times. Gold is also widely seen as a hedge against inflation and against depreciating currencies as it doesn’t rely on any specific issuer or government.
Central banks are the biggest Gold holders. In their aim to support their currencies in turbulent times, central banks tend to diversify their reserves and buy Gold to improve the perceived strength of the economy and the currency. High Gold reserves can be a source of trust for a country’s solvency. Central banks added 1,136 tonnes of Gold worth around $70 billion to their reserves in 2022, according to data from the World Gold Council. This is the highest yearly purchase since records began. Central banks from emerging economies such as China, India and Turkey are quickly increasing their Gold reserves.
Gold has an inverse correlation with the US Dollar and US Treasuries, which are both major reserve and safe-haven assets. When the Dollar depreciates, Gold tends to rise, enabling investors and central banks to diversify their assets in turbulent times. Gold is also inversely correlated with risk assets. A rally in the stock market tends to weaken Gold price, while sell-offs in riskier markets tend to favor the precious metal.
The price can move due to a wide range of factors. Geopolitical instability or fears of a deep recession can quickly make Gold price escalate due to its safe-haven status. As a yield-less asset, Gold tends to rise with lower interest rates, while higher cost of money usually weighs down on the yellow metal. Still, most moves depend on how the US Dollar (USD) behaves as the asset is priced in dollars (XAU/USD). A strong Dollar tends to keep the price of Gold controlled, whereas a weaker Dollar is likely to push Gold prices up.
- USD/MXN may depreciate as the momentum indicator 14-day RSI indicates a potential correction.
- A four-month high of 18.99 acts as an immediate resistance level.
- The pair could find support at the lower boundary of the ascending channel around the 18.70 level.
USD/MXN extends its gains for the second session, trading around 18.90 during the European hours on Friday. The analysis of the daily chart indicates the bullish bias as the pair is moving higher within an ascending channel.
However, the 14-day Relative Strength Index (RSI), a momentum indicator, is positioned at the 70 level, indicating that the USD/MXN pair is overbought. This suggests that a correction could be imminent.
On the upside, the USD/MXN pair tests a four-month high of 18.99 recorded on June 12. A breakthrough above this level could reinforce the bullish bias to test the upper boundary of the ascending channel near the level of 19.20.
In terms of support, the lower boundary of the ascending channel around the level of 18.70 could act as immediate support. Next support appears at the nine-day Exponential Moving Average (EMA) at 18.59. A break below this level could weaken the bullish sentiment and lead the USD/MXN pair to navigate the area around throwback support at the level of 17.60.
USD/MXN: Daily Chart
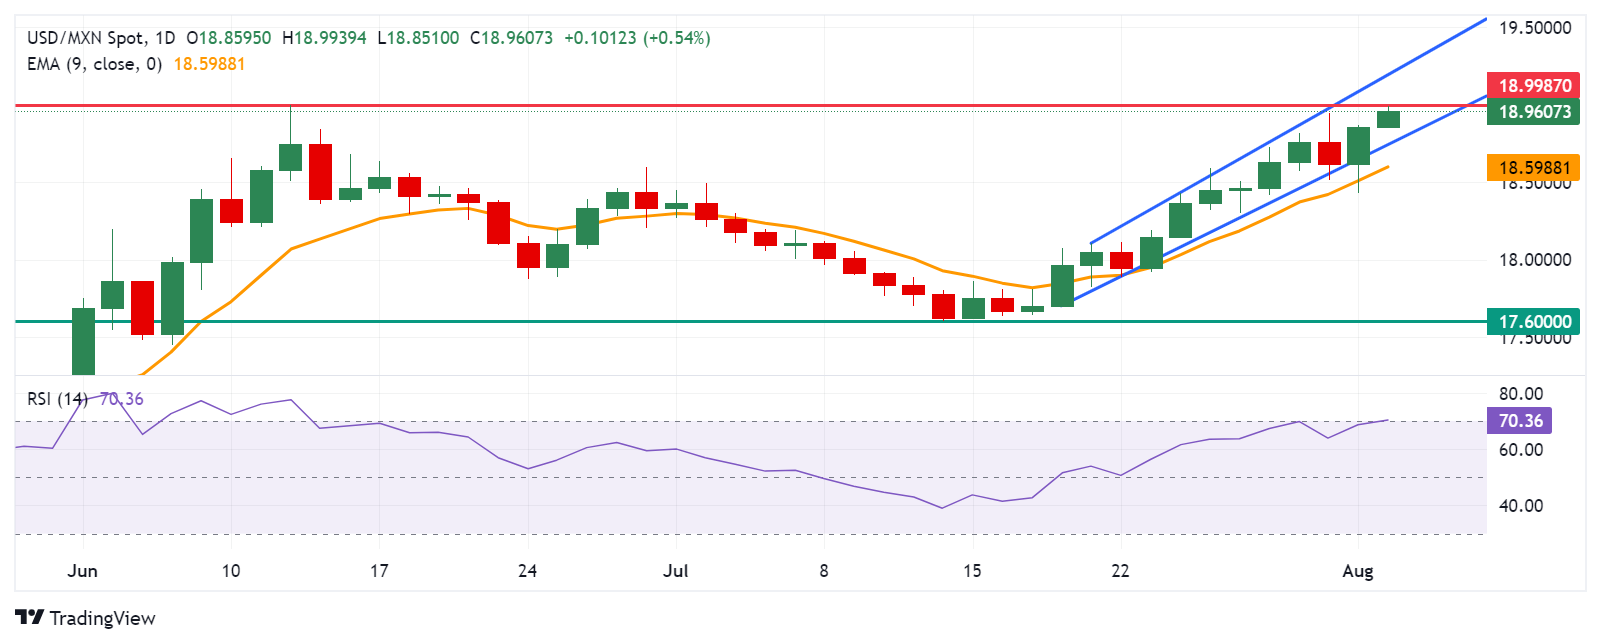
Mexican Peso FAQs
The Mexican Peso (MXN) is the most traded currency among its Latin American peers. Its value is broadly determined by the performance of the Mexican economy, the country’s central bank’s policy, the amount of foreign investment in the country and even the levels of remittances sent by Mexicans who live abroad, particularly in the United States. Geopolitical trends can also move MXN: for example, the process of nearshoring – or the decision by some firms to relocate manufacturing capacity and supply chains closer to their home countries – is also seen as a catalyst for the Mexican currency as the country is considered a key manufacturing hub in the American continent. Another catalyst for MXN is Oil prices as Mexico is a key exporter of the commodity.
The main objective of Mexico’s central bank, also known as Banxico, is to maintain inflation at low and stable levels (at or close to its target of 3%, the midpoint in a tolerance band of between 2% and 4%). To this end, the bank sets an appropriate level of interest rates. When inflation is too high, Banxico will attempt to tame it by raising interest rates, making it more expensive for households and businesses to borrow money, thus cooling demand and the overall economy. Higher interest rates are generally positive for the Mexican Peso (MXN) as they lead to higher yields, making the country a more attractive place for investors. On the contrary, lower interest rates tend to weaken MXN.
Macroeconomic data releases are key to assess the state of the economy and can have an impact on the Mexican Peso (MXN) valuation. A strong Mexican economy, based on high economic growth, low unemployment and high confidence is good for MXN. Not only does it attract more foreign investment but it may encourage the Bank of Mexico (Banxico) to increase interest rates, particularly if this strength comes together with elevated inflation. However, if economic data is weak, MXN is likely to depreciate.
As an emerging-market currency, the Mexican Peso (MXN) tends to strive during risk-on periods, or when investors perceive that broader market risks are low and thus are eager to engage with investments that carry a higher risk. Conversely, MXN tends to weaken at times of market turbulence or economic uncertainty as investors tend to sell higher-risk assets and flee to the more-stable safe havens.
- The US Dollar Index keeps the vacillating price action in the low 104.00s.
- US slowdown concerns lent support to the Greenback post-Fed.
- The July Nonfarm Payrolls will be the salient event on Friday.
The US Dollar (USD) kicks off the European session in an inconclusive fashion around the 104.20-104.30 band when tracked by the USD Index (DXY) at the end of the week, giving away part of Thursday’s marked advance, although maintaining in place the range-bound trade seen in the past couple of weeks.
In fact, the Greenback managed to set aside part of the post-FOMC weakness on Thursday, after further cooling of the domestic labour market (as per weekly Jobless Claims), and a disenchanting print from the ISM Manufacturing PMI for the month of July (46.8) reignited fears of a potential slowdown in the US economy, jeopardizing the view of a soft landing following the hiking cycle by the Federal Reserve (Fed).
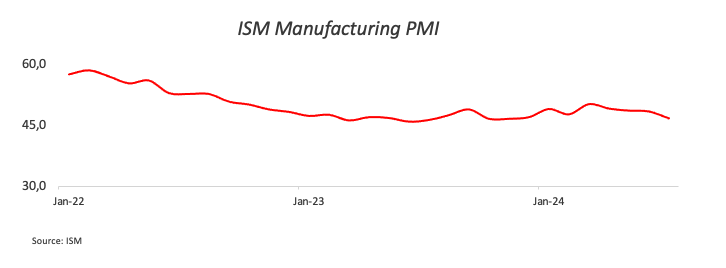
In addition, the resurgence of geopolitical jitters, especially in the Middle East, favoured the demand for the safe haven US Dollar, which in turn kept the risk-linked complex depressed. The incessant move lower in US yields across different time frames also reinforced the flight-to-safety sentiment.
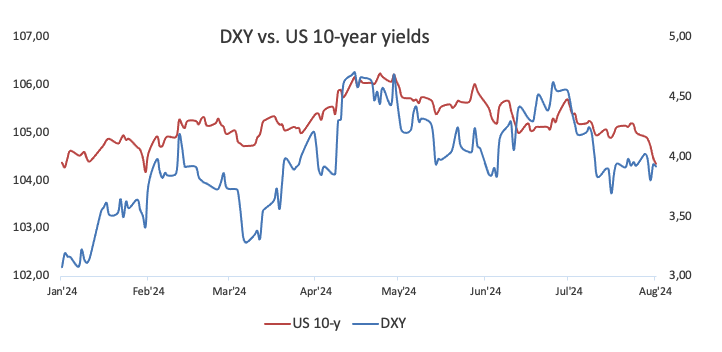
Moving forward, the FX universe is expected to enter the usual pre-NFP lull around current levels, while the outcome of the jobs report should have a temporary impact on bets around a September interest rate cut.
Absent a FOMC event this month, market participants and the Fed will have two inflation prints and two more labour market reports to further evaluate the likelihood, or not, of an interest rate reduction beyond the summer.
Despite the Fed’s Jerome Powell's dovish message on Wednesday, opening the door to lower rates in September, the statement of the central bank reiterated that further confidence that inflation is heading towards the 2% target is needed to start an easing cycle.
Daily digest market movers: NFP impact could be limited
- Further weakness in the risk complex keeps supporting the US Dollar.
- The US economy is expected to have created 175K jobs in July.
- The US Unemployment Rate is seen holding steady at 4.1% during last month.
- Factory Orders will also be under scrutiny amidst renewed slowdown concerns.
- Yields maintain their firm downtrend and navigate multi-week lows across different maturity periods.
- Unabated geopolitical concerns in the Middle East remain a source of strength for the Greenback for the time being.
- CME Group’s FedWatch Tool continues to fully price in lower rates in September.
Short-term technicals on the US Dollar
The US Dollar Index (DXY) maintains the trade around the key 200-day SMA at 104.29. A convincing breakdown of this region should leave the index vulnerable to extra losses in the short-term horizon. That said, initial support emerges at the July low of 103.65 (July 17) prior to the weekly low of 103.17 (March 21) and the March bottom of 102.35 (March 8).
Bouts of strength, on the other hand, face interim barrier at the 55-day and 100-day SMAs of 104.83 and 104.91, respectively, ahead of the June top of 106.13 (June 26). Once the latter is cleared, DXY could attempt a move to the 2024 peak of 106.51 (April 16).
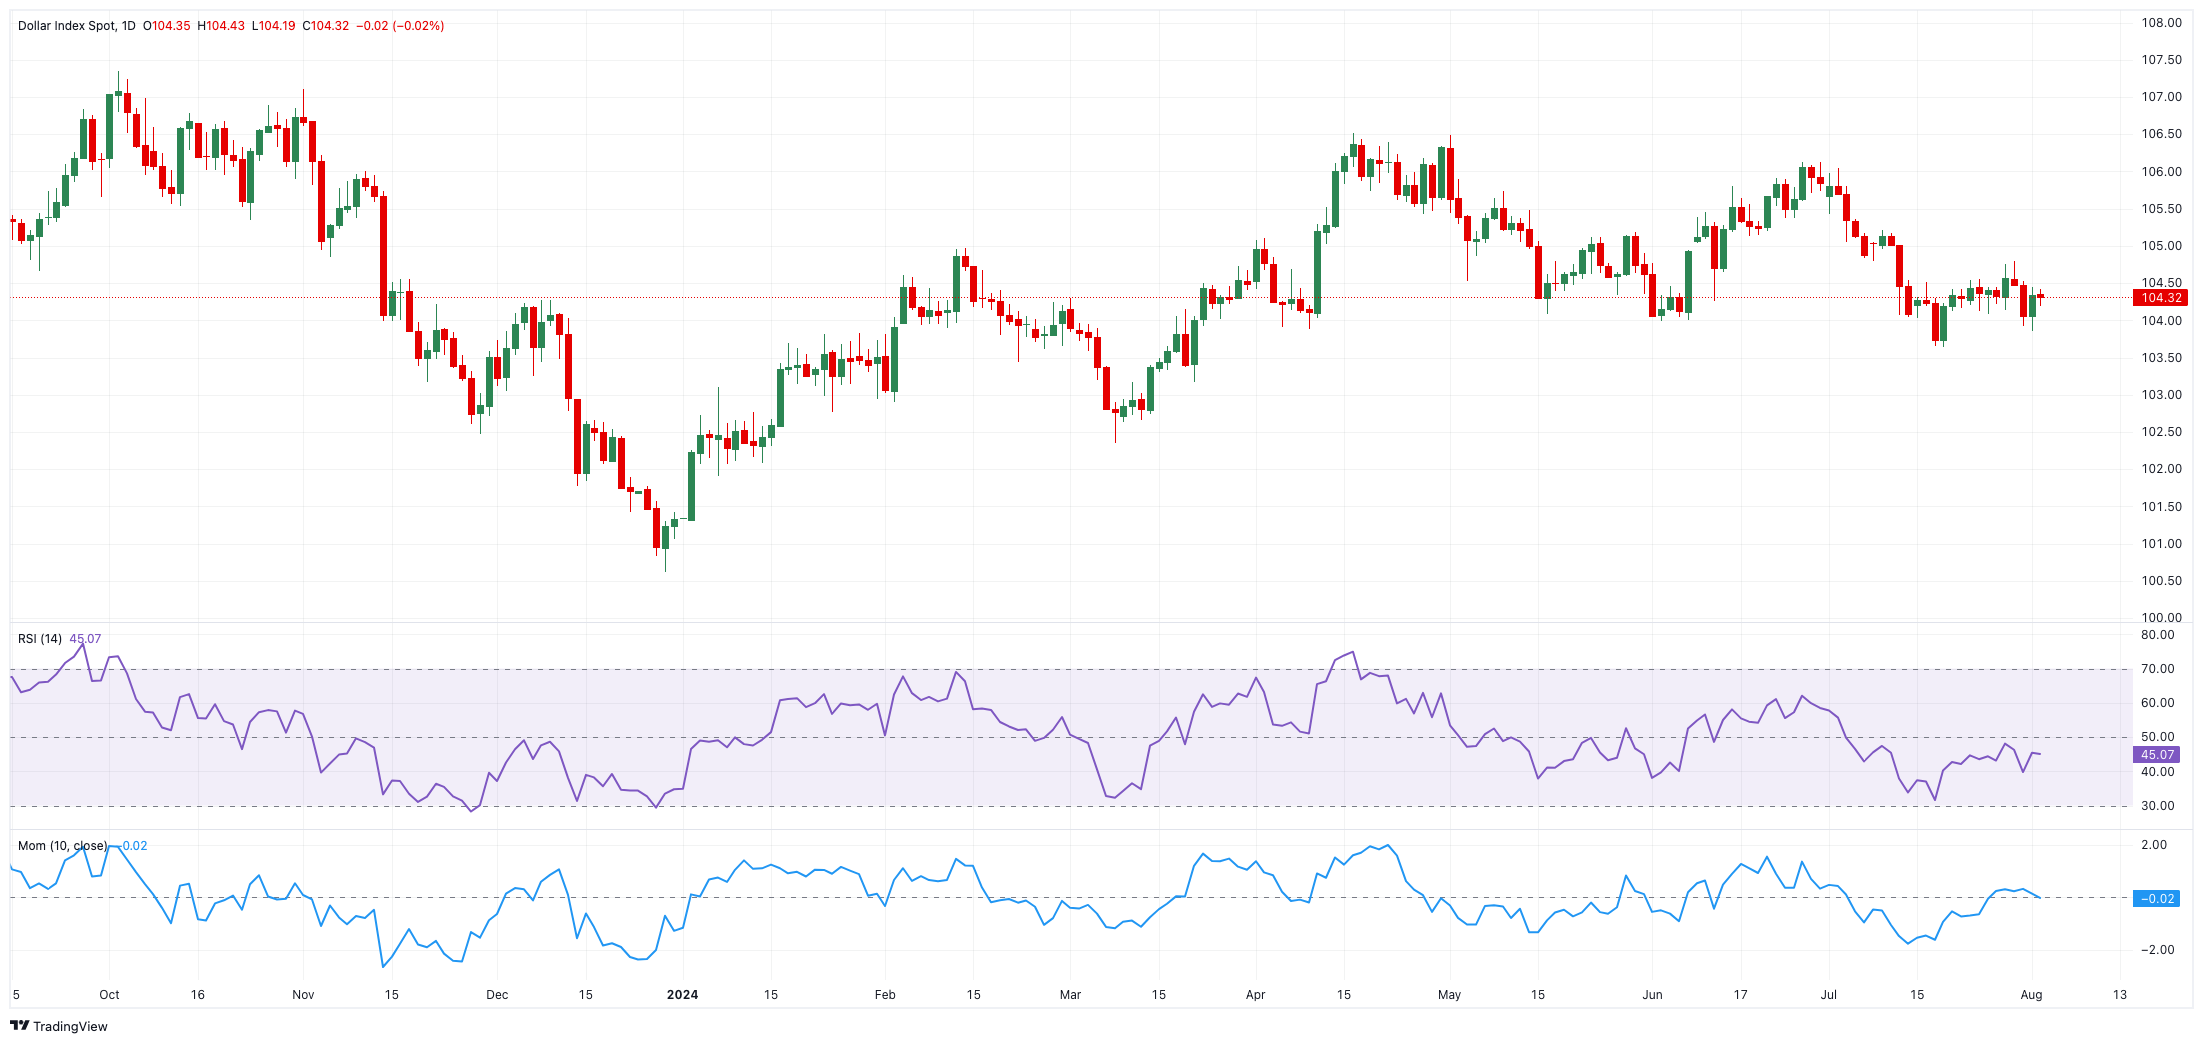
Economic Indicator
Nonfarm Payrolls
The Nonfarm Payrolls release presents the number of new jobs created in the US during the previous month in all non-agricultural businesses; it is released by the US Bureau of Labor Statistics (BLS). The monthly changes in payrolls can be extremely volatile. The number is also subject to strong reviews, which can also trigger volatility in the Forex board. Generally speaking, a high reading is seen as bullish for the US Dollar (USD), while a low reading is seen as bearish, although previous months' reviews and the Unemployment Rate are as relevant as the headline figure. The market's reaction, therefore, depends on how the market assesses all the data contained in the BLS report as a whole.
Read more.Next release: Fri Aug 02, 2024 12:30
Frequency: Monthly
Consensus: 175K
Previous: 206K
Source: US Bureau of Labor Statistics
America’s monthly jobs report is considered the most important economic indicator for forex traders. Released on the first Friday following the reported month, the change in the number of positions is closely correlated with the overall performance of the economy and is monitored by policymakers. Full employment is one of the Federal Reserve’s mandates and it considers developments in the labor market when setting its policies, thus impacting currencies. Despite several leading indicators shaping estimates, Nonfarm Payrolls tend to surprise markets and trigger substantial volatility. Actual figures beating the consensus tend to be USD bullish.
Here is what you need to know on Friday, August 2:
After falling sharply during the Federal Reserve (Fed) event on Wednesday, the US Dollar (USD) staged a rebound but struggled to gather bullish momentum following disappointing US data. The US Bureau of Labor Statistics will release July jobs report on Friday, which will feature Nonfarm Payrolls (NFP), Unemployment Rate and wage inflation figures.
US Dollar PRICE This week
The table below shows the percentage change of US Dollar (USD) against listed major currencies this week. US Dollar was the strongest against the British Pound.
| USD | EUR | GBP | JPY | CAD | AUD | NZD | CHF | |
|---|---|---|---|---|---|---|---|---|
| USD | 0.58% | 1.25% | -3.08% | 0.25% | 0.58% | -1.00% | -1.33% | |
| EUR | -0.58% | 0.63% | -3.60% | -0.31% | 0.04% | -1.59% | -1.90% | |
| GBP | -1.25% | -0.63% | -4.24% | -0.96% | -0.59% | -2.20% | -2.50% | |
| JPY | 3.08% | 3.60% | 4.24% | 3.38% | 3.78% | 2.11% | 1.81% | |
| CAD | -0.25% | 0.31% | 0.96% | -3.38% | 0.36% | -1.28% | -1.56% | |
| AUD | -0.58% | -0.04% | 0.59% | -3.78% | -0.36% | -1.60% | -1.96% | |
| NZD | 1.00% | 1.59% | 2.20% | -2.11% | 1.28% | 1.60% | -0.31% | |
| CHF | 1.33% | 1.90% | 2.50% | -1.81% | 1.56% | 1.96% | 0.31% |
The heat map shows percentage changes of major currencies against each other. The base currency is picked from the left column, while the quote currency is picked from the top row. For example, if you pick the US Dollar from the left column and move along the horizontal line to the Japanese Yen, the percentage change displayed in the box will represent USD (base)/JPY (quote).
The Bank of England (BoE) announced on Thursday that it lowered the policy rate by 25 basis points (bps) to 5%. In the post-meeting press conference, BoE Governor Andrew Bailey adopted a cautious tone and refrained from confirming additional policy easing, helping Pound Sterling limit its losses. Early Friday, GBP/USD stays under modest bearish pressure and declines toward 1.2700.
The data from the US showed on Thursday that weekly Initial Jobless Claims rose to 249,000 in the week ending July 27 from 235,000 in the previous week. Meanwhile, the ISM Manufacturing PMI dropped to 46.8 in July from 48.5 in June, pointing to an ongoing contraction at an accelerating pace in the manufacturing sector's business activity. The Unemployment Rate is forecast to stay unchanged at 4.1% in July and NFP is seen rising 175,000 following the 206,000 increase recorded in June. The annual wage inflation, as measured by the change in the Average Hourly Earnings, is expected to declined to 3.7% from 3.9%. Ahead of the labor market data, the US Dollar (USD) Index holds steady above 104.00, while the benchmark 10-year US Treasury bond yield continues to push lower after breaking below 4% on Thursday.
Following a short-lasting recovery attempt in the early Asian session, USD/JPY turned south and declined below 149.00. The Japanese Yen seems to be benefiting from the Bank of Japan's unexpected decision to hike the policy rate earlier in the week. In the meantime, Japan's Nikkei 225 Index is down nearly 6% on the day.
EUR/USD failed to build on Wednesday's recovery gains and dropped to multi-week lows below 1.0800 on Thursday. The pair stays in a consolidation phase at around 1.0790 in the European morning on Friday.
Gold closed little changed on Thursday but managed to gather bullish momentum during the Asian trading hours on Friday. At the time of press, XAU/USD was up more than 0.5% on the day, trading slightly above $2,460.
Nonfarm Payrolls FAQs
Nonfarm Payrolls (NFP) are part of the US Bureau of Labor Statistics monthly jobs report. The Nonfarm Payrolls component specifically measures the change in the number of people employed in the US during the previous month, excluding the farming industry.
The Nonfarm Payrolls figure can influence the decisions of the Federal Reserve by providing a measure of how successfully the Fed is meeting its mandate of fostering full employment and 2% inflation. A relatively high NFP figure means more people are in employment, earning more money and therefore probably spending more. A relatively low Nonfarm Payrolls’ result, on the either hand, could mean people are struggling to find work. The Fed will typically raise interest rates to combat high inflation triggered by low unemployment, and lower them to stimulate a stagnant labor market.
Nonfarm Payrolls generally have a positive correlation with the US Dollar. This means when payrolls’ figures come out higher-than-expected the USD tends to rally and vice versa when they are lower. NFPs influence the US Dollar by virtue of their impact on inflation, monetary policy expectations and interest rates. A higher NFP usually means the Federal Reserve will be more tight in its monetary policy, supporting the USD.
Nonfarm Payrolls are generally negatively-correlated with the price of Gold. This means a higher-than-expected payrolls’ figure will have a depressing effect on the Gold price and vice versa. Higher NFP generally has a positive effect on the value of the USD, and like most major commodities Gold is priced in US Dollars. If the USD gains in value, therefore, it requires less Dollars to buy an ounce of Gold. Also, higher interest rates (typically helped higher NFPs) also lessen the attractiveness of Gold as an investment compared to staying in cash, where the money will at least earn interest.
Nonfarm Payrolls is only one component within a bigger jobs report and it can be overshadowed by the other components. At times, when NFP come out higher-than-forecast, but the Average Weekly Earnings is lower than expected, the market has ignored the potentially inflationary effect of the headline result and interpreted the fall in earnings as deflationary. The Participation Rate and the Average Weekly Hours components can also influence the market reaction, but only in seldom events like the “Great Resignation” or the Global Financial Crisis.
- Silver price gains ground ahead of the release of US economic data including Nonfarm Payrolls on Friday.
- The complex US economic scenario could boost the demand for less-riskier assets like Silver.
- Heightened concerns over China's economic outlook could negatively impact the demand for industrial metal.
Silver price (XAG/USD) appreciates to near $29.00 per troy ounce during the early European hours on Friday. Traders assess the upcoming July US Nonfarm Payrolls and Average Hourly Earnings data, set to be released later in the North American session, for insights into the US labor market.
The latest manufacturing and labor market data have created a complex scenario involving an economic slowdown in the United States and rising expectations for a Federal Reserve rate cut. If the economic downturn worsens significantly, it could dampen market sentiment, making any Fed rate cuts less impactful. In this context, demand for safer assets like Silver could increase.
US ISM Manufacturing Purchasing Managers Index (PMI) tumbled to an eight-month low of 46.8 in July, compared to the previous 48.5 reading and the forecasted move up to 48.8. US Initial Jobless Claims for the week ended July 26 rose to 249K from the previous week’s 235K, exceeding the forecast uptick to 236K.
In China, Caixin Manufacturing PMI for July came in at 49.8, below the expected 51.5 and down from the previous 51.8. Weak China’s Purchasing Managers Index (PMI) data raise concerns about economic activity in the world’s manufacturing hub. This situation could negatively impact Silver demand, as the precious metal is crucial in various industrial applications, including electronics, solar panels, and automotive components.
Additionally, the safe-haven demand for grey metal increased due to escalated geopolitical tensions in the Middle East. Tensions in the Middle East remain high following the assassination of Hamas leader Ismail Haniyeh in Iran.
According to the New York Times on Wednesday, Haniyeh was killed in Iran's capital after attending the new president's inauguration. Both Iranian officials and Hamas have accused Israel of being behind the strike.
Silver FAQs
Silver is a precious metal highly traded among investors. It has been historically used as a store of value and a medium of exchange. Although less popular than Gold, traders may turn to Silver to diversify their investment portfolio, for its intrinsic value or as a potential hedge during high-inflation periods. Investors can buy physical Silver, in coins or in bars, or trade it through vehicles such as Exchange Traded Funds, which track its price on international markets.
Silver prices can move due to a wide range of factors. Geopolitical instability or fears of a deep recession can make Silver price escalate due to its safe-haven status, although to a lesser extent than Gold's. As a yieldless asset, Silver tends to rise with lower interest rates. Its moves also depend on how the US Dollar (USD) behaves as the asset is priced in dollars (XAG/USD). A strong Dollar tends to keep the price of Silver at bay, whereas a weaker Dollar is likely to propel prices up. Other factors such as investment demand, mining supply – Silver is much more abundant than Gold – and recycling rates can also affect prices.
Silver is widely used in industry, particularly in sectors such as electronics or solar energy, as it has one of the highest electric conductivity of all metals – more than Copper and Gold. A surge in demand can increase prices, while a decline tends to lower them. Dynamics in the US, Chinese and Indian economies can also contribute to price swings: for the US and particularly China, their big industrial sectors use Silver in various processes; in India, consumers’ demand for the precious metal for jewellery also plays a key role in setting prices.
Silver prices tend to follow Gold's moves. When Gold prices rise, Silver typically follows suit, as their status as safe-haven assets is similar. The Gold/Silver ratio, which shows the number of ounces of Silver needed to equal the value of one ounce of Gold, may help to determine the relative valuation between both metals. Some investors may consider a high ratio as an indicator that Silver is undervalued, or Gold is overvalued. On the contrary, a low ratio might suggest that Gold is undervalued relative to Silver.
- USD/CHF extends its losing streak following the release of Swiss Consumer Price Index data on Friday.
- Swiss CPI rose by 1.3% as expected to be consistent in July.
- The US Dollar loses ground ahead of employment data including Nonfarm Payrolls and Average Hourly Earnings.
USD/CHF holds its losses for the fourth successive session following the Swiss Consumer Price Index (CPI) data released on Friday. Swiss Federal Statistical Office declined by 0.2% month-over-month in July, as expected. Meanwhile, inflation year-over-year rose by 1.3% as expected, remaining consistent as compared to the previous rise. The USD/CHF pair trades around 0.8710 during the Asian session.
On Wednesday, the Swiss investors’ sentiment index dropped to 9.4 in June, from June’s 17.5 readings. Despite the decline, the index remains in positive territory, suggesting that the outlook continues to be moderately optimistic.
The downside of the USD/CHF pair could be attributed to the tepid US Dollar (USD) due to the dovish sentiment surrounding the Federal Reserve’s (Fed) policy outlook. The CME's FedWatch Tool shows that traders are fully anticipating a 25-basis point rate cut on September 18.
Additionally, the latest manufacturing and labor market data have erected a complex situation involving an economic slowdown in the United States (US) and increased expectations for a Federal Reserve rate cut. If the economic downturn becomes too severe, it could negatively impact market sentiment, rendering any rate cuts from the Fed irrelevant.
US ISM Manufacturing Purchasing Managers Index (PMI) tumbled to an eight-month low of 46.8 in July, compared to the previous 48.5 reading and the forecasted move up to 48.8. US Initial Jobless Claims for the week ended July 26 rose to 249K from the previous week’s 235K, exceeding the forecast uptick to 236K.
Traders are likely to closely watch the upcoming July US Nonfarm Payrolls and Average Hourly Earnings data, set to be released later in the North American session, for insights into the US labor market.
Swiss Franc FAQs
The Swiss Franc (CHF) is Switzerland’s official currency. It is among the top ten most traded currencies globally, reaching volumes that well exceed the size of the Swiss economy. Its value is determined by the broad market sentiment, the country’s economic health or action taken by the Swiss National Bank (SNB), among other factors. Between 2011 and 2015, the Swiss Franc was pegged to the Euro (EUR). The peg was abruptly removed, resulting in a more than 20% increase in the Franc’s value, causing a turmoil in markets. Even though the peg isn’t in force anymore, CHF fortunes tend to be highly correlated with the Euro ones due to the high dependency of the Swiss economy on the neighboring Eurozone.
The Swiss Franc (CHF) is considered a safe-haven asset, or a currency that investors tend to buy in times of market stress. This is due to the perceived status of Switzerland in the world: a stable economy, a strong export sector, big central bank reserves or a longstanding political stance towards neutrality in global conflicts make the country’s currency a good choice for investors fleeing from risks. Turbulent times are likely to strengthen CHF value against other currencies that are seen as more risky to invest in.
The Swiss National Bank (SNB) meets four times a year – once every quarter, less than other major central banks – to decide on monetary policy. The bank aims for an annual inflation rate of less than 2%. When inflation is above target or forecasted to be above target in the foreseeable future, the bank will attempt to tame price growth by raising its policy rate. Higher interest rates are generally positive for the Swiss Franc (CHF) as they lead to higher yields, making the country a more attractive place for investors. On the contrary, lower interest rates tend to weaken CHF.
Macroeconomic data releases in Switzerland are key to assessing the state of the economy and can impact the Swiss Franc’s (CHF) valuation. The Swiss economy is broadly stable, but any sudden change in economic growth, inflation, current account or the central bank’s currency reserves have the potential to trigger moves in CHF. Generally, high economic growth, low unemployment and high confidence are good for CHF. Conversely, if economic data points to weakening momentum, CHF is likely to depreciate.
As a small and open economy, Switzerland is heavily dependent on the health of the neighboring Eurozone economies. The broader European Union is Switzerland’s main economic partner and a key political ally, so macroeconomic and monetary policy stability in the Eurozone is essential for Switzerland and, thus, for the Swiss Franc (CHF). With such dependency, some models suggest that the correlation between the fortunes of the Euro (EUR) and the CHF is more than 90%, or close to perfect.
- USD/JPY extends its losing streak for the fourth trading session and shifts below 150.00 ahead of US NFP.
- The US NFP report is expected to show slowing labor demand, a decline in wage growth, and a steady Unemployment Rate.
- BoJ’s hawkish monetary policy sparked strength in the Japanese Yen.
The USD/JPY pair trades inside Thursday’s trading range below the psychological figure of 150.00 in Friday’s late Asian session. The asset remains on the backfoot as Federal’s Reserve’s (Fed) expected dovish guidance on interest rates has dampened the US Dollar’s appeal. Also, sheer strength in the Japanese Yen due to Bank of Japan’s aggressive-than-expected policy-tightening has weighed on the major.
The market sentiment remains risk-off ahead of the release of the United States (US) Nonfarm Payrolls (NFP) data for July, which will be published at 12:30 GMT. S&P 500 futures have posted significant losses in the Asian trading hours.
Economists have estimated that 175K new workers were hired in July, lower than the former addition of 206K. The Unemployment Rate is expected to remain steady at 4.1%.
Investors will keenly focus on the Average Hourly Earnings data, a key measure to wage growth that fuels consumer spending which eventually influence price pressures. Annually, the wage growth measure is estimated to have decelerated to 3.9% from the prior reading of 3.7%, with monthly figure growing steadily by 0.3%.
Meanwhile, the US Dollar Index (DXY), which tracks the Greenback’s value against six major currencies, edges lower to 104.23.
The Japanese Yen, however, is performing strongly since the BoJ raised interest rates by 25 basis points (bps) against estimated of 10 bps. Also, the BoJ pledged to halve bond-buying operations by early 2026. BoJ Governor Kazuo Ueda kept door open for more rate hikes this year and remained confident on further increase in price pressures and an improvement in economic conditions.
Japanese Yen FAQs
The Japanese Yen (JPY) is one of the world’s most traded currencies. Its value is broadly determined by the performance of the Japanese economy, but more specifically by the Bank of Japan’s policy, the differential between Japanese and US bond yields, or risk sentiment among traders, among other factors.
One of the Bank of Japan’s mandates is currency control, so its moves are key for the Yen. The BoJ has directly intervened in currency markets sometimes, generally to lower the value of the Yen, although it refrains from doing it often due to political concerns of its main trading partners. The current BoJ ultra-loose monetary policy, based on massive stimulus to the economy, has caused the Yen to depreciate against its main currency peers. This process has exacerbated more recently due to an increasing policy divergence between the Bank of Japan and other main central banks, which have opted to increase interest rates sharply to fight decades-high levels of inflation.
The BoJ’s stance of sticking to ultra-loose monetary policy has led to a widening policy divergence with other central banks, particularly with the US Federal Reserve. This supports a widening of the differential between the 10-year US and Japanese bonds, which favors the US Dollar against the Japanese Yen.
The Japanese Yen is often seen as a safe-haven investment. This means that in times of market stress, investors are more likely to put their money in the Japanese currency due to its supposed reliability and stability. Turbulent times are likely to strengthen the Yen’s value against other currencies seen as more risky to invest in.
- EUR/USD tests a lower boundary of the descending channel around the level of 1.0800.
- The momentum indicator 14-day RSI confirms the bearish sentiment for the pair.
- The pair may find key resistance around the nine-day EMA at 1.0825.
EUR/USD retraces its recent losses from the previous session, trading around 1.0800 during the Asian hours on Friday. The analysis of the daily chart indicates that the pair is following the lower boundary of a descending channel, which suggests a reinforcement of the bearish trend.
Additionally, the 14-day Relative Strength Index (RSI), a momentum indicator, remains below the 50 level, confirming the bearish sentiment for the EUR/USD pair. Should the RSI approach the 50 level, it could diminish the bearish bias and offer some support for the pair.
On the downside, a break below the lower boundary of the descending channel around the level of 1.0800 could reinforce the bearish sentiment and exert pressure on the EUR/USD pair to navigate the region around the key level of 1.0670, potentially serving as a throwback support level.
In terms of resistance, the EUR/GBP pair may face a barrier around the nine-day Exponential Moving Average (EMA) at 1.0825, and further resistance could be at the upper boundary of the descending channel around 1.0850. A breakout above this level might drive the pair back to the four-month high of 1.0948.
EUR/USD: Daily Chart
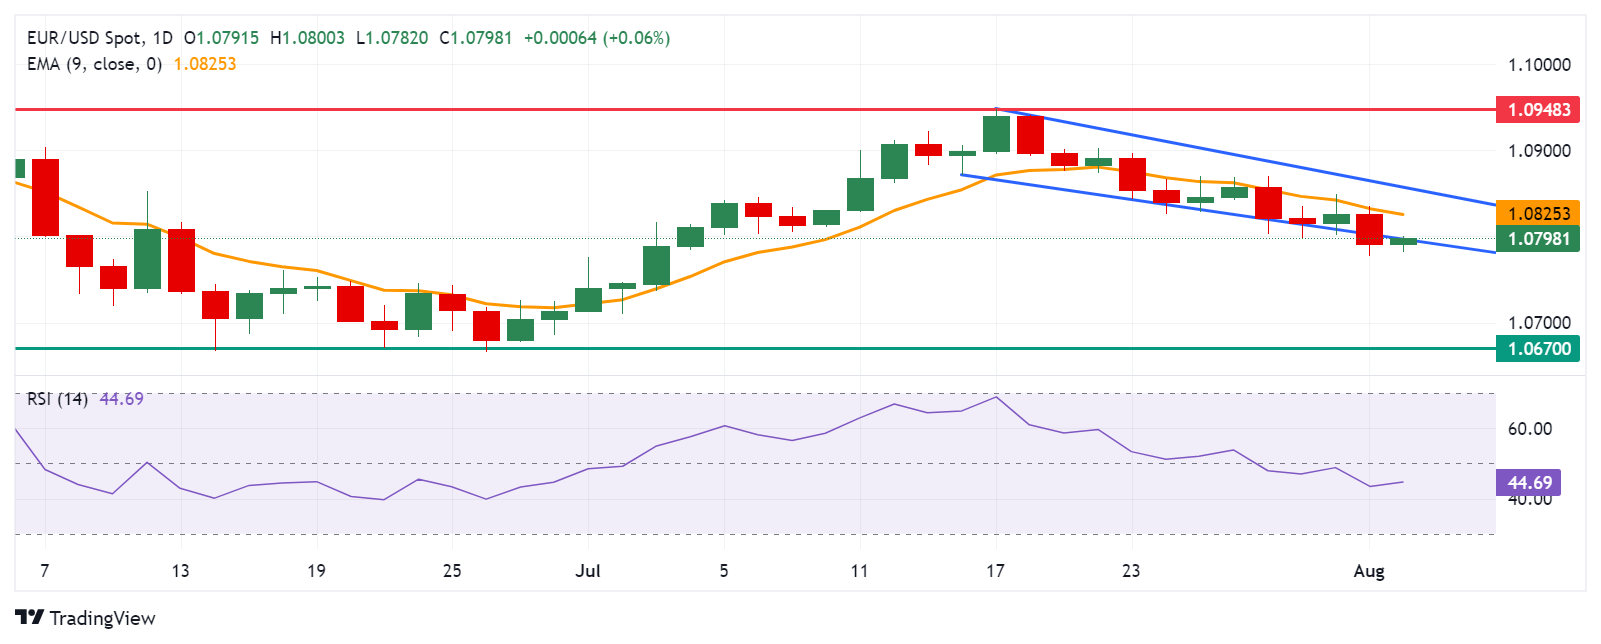
Euro PRICE Today
The table below shows the percentage change of Euro (EUR) against listed major currencies today. Euro was the strongest against the British Pound.
| USD | EUR | GBP | JPY | CAD | AUD | NZD | CHF | |
|---|---|---|---|---|---|---|---|---|
| USD | -0.06% | 0.09% | -0.10% | -0.08% | -0.14% | -0.02% | -0.17% | |
| EUR | 0.06% | 0.15% | -0.05% | -0.03% | -0.07% | 0.04% | -0.10% | |
| GBP | -0.09% | -0.15% | -0.21% | -0.17% | -0.24% | -0.10% | -0.23% | |
| JPY | 0.10% | 0.05% | 0.21% | 0.03% | -0.04% | 0.07% | -0.05% | |
| CAD | 0.08% | 0.03% | 0.17% | -0.03% | -0.06% | 0.08% | -0.07% | |
| AUD | 0.14% | 0.07% | 0.24% | 0.04% | 0.06% | 0.14% | -0.02% | |
| NZD | 0.02% | -0.04% | 0.10% | -0.07% | -0.08% | -0.14% | -0.12% | |
| CHF | 0.17% | 0.10% | 0.23% | 0.05% | 0.07% | 0.02% | 0.12% |
The heat map shows percentage changes of major currencies against each other. The base currency is picked from the left column, while the quote currency is picked from the top row. For example, if you pick the Euro from the left column and move along the horizontal line to the US Dollar, the percentage change displayed in the box will represent EUR (base)/USD (quote).
Gold prices rose in India on Friday, according to data compiled by FXStreet.
The price for Gold stood at 6,617.76 Indian Rupees (INR) per gram, up compared with the INR 6,585.70 it cost on Thursday.
The price for Gold increased to INR 77,189.78 per tola from INR 76,816.43 per tola a day earlier.
| Unit measure | Gold Price in INR |
|---|---|
| 1 Gram | 6,617.76 |
| 10 Grams | 66,178.64 |
| Tola | 77,189.78 |
| Troy Ounce | 205,835.60 |
FXStreet calculates Gold prices in India by adapting international prices (USD/INR) to the local currency and measurement units. Prices are updated daily based on the market rates taken at the time of publication. Prices are just for reference and local rates could diverge slightly.
Gold FAQs
Gold has played a key role in human’s history as it has been widely used as a store of value and medium of exchange. Currently, apart from its shine and usage for jewelry, the precious metal is widely seen as a safe-haven asset, meaning that it is considered a good investment during turbulent times. Gold is also widely seen as a hedge against inflation and against depreciating currencies as it doesn’t rely on any specific issuer or government.
Central banks are the biggest Gold holders. In their aim to support their currencies in turbulent times, central banks tend to diversify their reserves and buy Gold to improve the perceived strength of the economy and the currency. High Gold reserves can be a source of trust for a country’s solvency. Central banks added 1,136 tonnes of Gold worth around $70 billion to their reserves in 2022, according to data from the World Gold Council. This is the highest yearly purchase since records began. Central banks from emerging economies such as China, India and Turkey are quickly increasing their Gold reserves.
Gold has an inverse correlation with the US Dollar and US Treasuries, which are both major reserve and safe-haven assets. When the Dollar depreciates, Gold tends to rise, enabling investors and central banks to diversify their assets in turbulent times. Gold is also inversely correlated with risk assets. A rally in the stock market tends to weaken Gold price, while sell-offs in riskier markets tend to favor the precious metal.
The price can move due to a wide range of factors. Geopolitical instability or fears of a deep recession can quickly make Gold price escalate due to its safe-haven status. As a yield-less asset, Gold tends to rise with lower interest rates, while higher cost of money usually weighs down on the yellow metal. Still, most moves depend on how the US Dollar (USD) behaves as the asset is priced in dollars (XAU/USD). A strong Dollar tends to keep the price of Gold controlled, whereas a weaker Dollar is likely to push Gold prices up.
(An automation tool was used in creating this post.)
FX option expiries for Aug 2 NY cut at 10:00 Eastern Time, via DTCC, can be found below.
EUR/USD: EUR amounts
- 1.0740 1.6b
- 1.0785 690m
- 1.0850 670m
- 1.0990 1.6b
GBP/USD: GBP amounts
- 1.2850 500m
USD/JPY: USD amounts
- 151.00 1.2b
- 153.00 798m
- 155.00 2.5b
- 155.25 765m
USD/CHF: USD amounts
- 0.8835 452m
- 0.9050 530m
AUD/USD: AUD amounts
- 0.6625 403m
USD/CAD: USD amounts
- 1.3800 518m
- 1.3900 815m
NZD/USD: NZD amounts
- 0.5975 582m
EUR/GBP: EUR amounts
- 0.8360 530m
- 0.8420 627m
- 0.8425 553m
- 0.8460 1b
- GBP/USD loses ground following the BoE’s decision to deliver a 25-basis point rate cut.
- BoE Governor Andrew Bailey noted that the overall inflation trajectory is closer to the 2% target compared to the median forecast.
- The recent US PMI data have created a complex situation, highlighting an economic slowdown and increased odds for a Fed rate cut.
GBP/USD extends its losses following the Bank of England‘s (BoE) decision to deliver a broadly expected 25-basis point rate cut at its August meeting held on Thursday. The GBP/USD pair trades around 1.2720 during the Asian session on Friday.
BoE Governor Andrew Bailey explained the decision to reduce the policy rate to 5% and addressed media questions. Bailey noted that the increase in the minimum wage has not been detrimental from their viewpoint. According to Bailey, while firms often cite higher minimum wages as compressing pay scales, the overall inflation trajectory, including upside risks, is now closer to the 2% target compared to the median forecast.
The US Dollar (USD) may advance against its peers due to increased risk aversion. Recent manufacturing and labor market data have erected a complex situation involving an economic slowdown in the United States (US) and increased expectations for a Federal Reserve rate cut. If the economic downturn becomes too severe, it could negatively impact market sentiment, rendering any rate cuts from the Fed irrelevant.
US ISM Manufacturing Purchasing Managers Index (PMI) tumbled to an eight-month low of 46.8 in July, compared to the previous 48.5 reading and the forecasted move up to 48.8. US Initial Jobless Claims for the week ended July 26 rose to 249K from the previous week’s 235K, exceeding the forecast uptick to 236K.
The CME's FedWatch Tool shows that traders are fully anticipating a 25-basis point rate cut on September 18. Traders are likely to closely watch the upcoming July US Nonfarm Payrolls and Average Hourly Earnings data, set to be released later in the North American session, for insights into the US labor market.
Pound Sterling FAQs
The Pound Sterling (GBP) is the oldest currency in the world (886 AD) and the official currency of the United Kingdom. It is the fourth most traded unit for foreign exchange (FX) in the world, accounting for 12% of all transactions, averaging $630 billion a day, according to 2022 data. Its key trading pairs are GBP/USD, aka ‘Cable’, which accounts for 11% of FX, GBP/JPY, or the ‘Dragon’ as it is known by traders (3%), and EUR/GBP (2%). The Pound Sterling is issued by the Bank of England (BoE).
The single most important factor influencing the value of the Pound Sterling is monetary policy decided by the Bank of England. The BoE bases its decisions on whether it has achieved its primary goal of “price stability” – a steady inflation rate of around 2%. Its primary tool for achieving this is the adjustment of interest rates. When inflation is too high, the BoE will try to rein it in by raising interest rates, making it more expensive for people and businesses to access credit. This is generally positive for GBP, as higher interest rates make the UK a more attractive place for global investors to park their money. When inflation falls too low it is a sign economic growth is slowing. In this scenario, the BoE will consider lowering interest rates to cheapen credit so businesses will borrow more to invest in growth-generating projects.
Data releases gauge the health of the economy and can impact the value of the Pound Sterling. Indicators such as GDP, Manufacturing and Services PMIs, and employment can all influence the direction of the GBP. A strong economy is good for Sterling. Not only does it attract more foreign investment but it may encourage the BoE to put up interest rates, which will directly strengthen GBP. Otherwise, if economic data is weak, the Pound Sterling is likely to fall.
Another significant data release for the Pound Sterling is the Trade Balance. This indicator measures the difference between what a country earns from its exports and what it spends on imports over a given period. If a country produces highly sought-after exports, its currency will benefit purely from the extra demand created from foreign buyers seeking to purchase these goods. Therefore, a positive net Trade Balance strengthens a currency and vice versa for a negative balance.
- US Nonfarm Payrolls are seen rising by 175K in July after June’s 206K increase.
- The Bureau of Labor Statistics will publish the high-impact United States jobs report on Friday at 12:30 GMT.
- The employment data could exacerbate the US Dollar’s pain after the Fed’s dovish hold on Wednesday.
Attention now turns to the high-impact Nonfarm Payrolls (NFP) data for July, slated for release on Friday at 12:30 GMT, as markets continue to assess this week’s US Federal Reserve (Fed) policy decision.
The US labor market data will be released by the Bureau of Labor Statistics (BLS), which could hint at another interest-rate cut by the Fed before the year’s end, as a September lift-off is a done deal. The US Dollar (USD) is poised for heightened volatility on the data release.
What to expect in the next Nonfarm Payrolls report?
The Nonfarm Payrolls report is expected to show that the US economy added 175,000 jobs in July, following a better-than-expected gain of 206,000 in June.
The Unemployment Rate is likely to stay unchanged at 4.1% in the same period. Meanwhile, a closely-watched measure of wage inflation, Average Hourly Earnings, is seen rising by 3.7% in the year through July after reporting a 3.9% increase in June.
The US labor market report is more significant this time around, especially after the Fed tweaked its July policy statement to mention that it is "attentive to the risks to both sides of its dual mandate", rather than previously only noting its attention to inflation risks.
On Wednesday, the Fed kept the fed funds rate at 5.25% to 5.5%, acknowledging “some further progress” toward its 2% inflation goal.
During the press conference, Fed’s Chair Jerome Powell said that “the broad sense of the committee is that the economy is moving closer to the point at which it would be appropriate to reduce our policy rate,” cementing an interest rate cut in September.
On the employment front, Powell said indicators show the job market has gradually normalized from “overheated” conditions. Although he tried to be rather cautious with his message, his take on inflation and employment only made markets believe that another rate cut could be on the table this year beyond September.
Meanwhile, the US private sector saw an employment gain of 122,000 in July after advancing by an upwardly revised 155,000 in June, the ADP National Employment Report showed on Wednesday. The data missed the market expectations of 150,000 in the reported period. Additionally, the BLS reported in the Job Openings and Labor Turnover Survey (JOLTS) on Tuesday that the number of job openings on the last business day of June stood at 8.184 million, against the 8.03 million expected.
Previewing the July employment situation report, TD Securities analysts said: “We look for July payrolls to move largely sideways vs June, printing 200k at the start of Q3. High-frequency data suggest employment growth has continued to hold up. Separately, the UE rate likely stayed unchanged at 4.1%, but the risk is that it drops back to 4.0% after its recent gains.”
“We also look for wage growth to cool by a tenth to 0.2% m/m, and down to 3.6% YoY,” the analysts added.
How will US July Nonfarm Payrolls affect EUR/USD?
The Fed’s dovish outlook fuelled a US Dollar (USD) correction across the board while the benchmark 10-year US Treasury bond yields attacked the key 4.0% level, lifting the EUR/USD pair back on the 1.0800 threshold. Will the pair sustain the rebound on the key US NFP release?
An upside surprise in the NFP headline figure and wage inflation data would pour cold water on additional rate cut prospects this year, allowing the US Dollar to come for air. This, in turn, could reinforce fresh EUR/USD selling back toward 1.0700. However, if the US employment data affirms loosening labor market conditions and the disinflationary trend in wage inflation, the Greenback could accelerate its corrective downside on renewed dovish Fed bets. In such a case, EUR/USD could extend the recovery toward the 1.0900 level.
Dhwani Mehta, Analyst at FXStreet, offers a brief technical outlook for EUR/USD:
“The EUR/USD pair faced stiff resistance at the 21-day Simple Moving Average (SMA), aligned at 1.0856 and returned to negative territory. The 14-day Relative Strength Index (RSI) turned south below the 50 level, currently near 42, suggesting that sellers could retain control in the near term.”
“A strong foothold below the July low of 1.0713 is critical to unleashing further downside toward the 1.0650 psychological barrier. On the flip side, buyers need to find acceptance above the 21-day SMA at 1.0856 for an extended recovery toward the 1.0900 round figure. Further up, the July high of 1.0948 could be challenged,” Dhwani adds.
Economic Indicator
Nonfarm Payrolls
The Nonfarm Payrolls release presents the number of new jobs created in the US during the previous month in all non-agricultural businesses; it is released by the US Bureau of Labor Statistics (BLS). The monthly changes in payrolls can be extremely volatile. The number is also subject to strong reviews, which can also trigger volatility in the Forex board. Generally speaking, a high reading is seen as bullish for the US Dollar (USD), while a low reading is seen as bearish, although previous months' reviews and the Unemployment Rate are as relevant as the headline figure. The market's reaction, therefore, depends on how the market assesses all the data contained in the BLS report as a whole.
Read more.Next release: Fri Aug 02, 2024 12:30
Frequency: Monthly
Consensus: 175K
Previous: 206K
Source: US Bureau of Labor Statistics
America’s monthly jobs report is considered the most important economic indicator for forex traders. Released on the first Friday following the reported month, the change in the number of positions is closely correlated with the overall performance of the economy and is monitored by policymakers. Full employment is one of the Federal Reserve’s mandates and it considers developments in the labor market when setting its policies, thus impacting currencies. Despite several leading indicators shaping estimates, Nonfarm Payrolls tend to surprise markets and trigger substantial volatility. Actual figures beating the consensus tend to be USD bullish.
Nonfarm Payrolls FAQs
Nonfarm Payrolls (NFP) are part of the US Bureau of Labor Statistics monthly jobs report. The Nonfarm Payrolls component specifically measures the change in the number of people employed in the US during the previous month, excluding the farming industry.
The Nonfarm Payrolls figure can influence the decisions of the Federal Reserve by providing a measure of how successfully the Fed is meeting its mandate of fostering full employment and 2% inflation. A relatively high NFP figure means more people are in employment, earning more money and therefore probably spending more. A relatively low Nonfarm Payrolls’ result, on the either hand, could mean people are struggling to find work. The Fed will typically raise interest rates to combat high inflation triggered by low unemployment, and lower them to stimulate a stagnant labor market.
Nonfarm Payrolls generally have a positive correlation with the US Dollar. This means when payrolls’ figures come out higher-than-expected the USD tends to rally and vice versa when they are lower. NFPs influence the US Dollar by virtue of their impact on inflation, monetary policy expectations and interest rates. A higher NFP usually means the Federal Reserve will be more tight in its monetary policy, supporting the USD.
Nonfarm Payrolls are generally negatively-correlated with the price of Gold. This means a higher-than-expected payrolls’ figure will have a depressing effect on the Gold price and vice versa. Higher NFP generally has a positive effect on the value of the USD, and like most major commodities Gold is priced in US Dollars. If the USD gains in value, therefore, it requires less Dollars to buy an ounce of Gold. Also, higher interest rates (typically helped higher NFPs) also lessen the attractiveness of Gold as an investment compared to staying in cash, where the money will at least earn interest.
Nonfarm Payrolls is only one component within a bigger jobs report and it can be overshadowed by the other components. At times, when NFP come out higher-than-forecast, but the Average Weekly Earnings is lower than expected, the market has ignored the potentially inflationary effect of the headline result and interpreted the fall in earnings as deflationary. The Participation Rate and the Average Weekly Hours components can also influence the market reaction, but only in seldom events like the “Great Resignation” or the Global Financial Crisis.
- USD/CAD has retreated from an eight-month high at 1.3889 marked on Thursday.
- The slight increase in Oil prices is providing support for the commodity-linked Canadian Dollar.
- The downside of the pair could be restrained due to increased risk aversion amid raised concerns about the US economy.
USD/CAD edges lower to near 1.3860 during the Asian session on Friday. However, the USD/CAD pair maintains its position near an eight-month high at 1.3889 recorded on Thursday. The commodity-linked Canadian Dollar (CAD) holds mild gains due to a slight upside of the crude Oil prices as Canada is the biggest crude exporter to the United States (US).
West Texas Intermediate (WTI) crude Oil price inches higher to near $76.50 per barrel at the time of writing. The price of crude Oil may find support from supply risks arising from heightened geopolitical tensions in the Middle East, despite ongoing global concerns about Oil demand.
The downside of the USD/CAD could be limited as the US Dollar (USD) may advance against its peers due to increased risk aversion. Recent manufacturing and labor market data have created a complex scenario with an economic slowdown in the US and growing expectations for a Federal Reserve rate cut. The CME's FedWatch Tool shows that traders are fully anticipating a 25-basis point rate cut on September 18.
US ISM Manufacturing Purchasing Managers Index (PMI) tumbled to an eight-month low of 46.8 in July, compared to the previous 48.5 reading and the forecasted move up to 48.8. US Initial Jobless Claims for the week ended July 26 rose to 249K from the previous week’s 235K, exceeding the forecast uptick to 236K.
Traders are likely to closely watch the upcoming July US Nonfarm Payrolls and Average Hourly Earnings data, set to be released later in the North American session, for insights into the US labor market.
Canadian Dollar FAQs
The key factors driving the Canadian Dollar (CAD) are the level of interest rates set by the Bank of Canada (BoC), the price of Oil, Canada’s largest export, the health of its economy, inflation and the Trade Balance, which is the difference between the value of Canada’s exports versus its imports. Other factors include market sentiment – whether investors are taking on more risky assets (risk-on) or seeking safe-havens (risk-off) – with risk-on being CAD-positive. As its largest trading partner, the health of the US economy is also a key factor influencing the Canadian Dollar.
The Bank of Canada (BoC) has a significant influence on the Canadian Dollar by setting the level of interest rates that banks can lend to one another. This influences the level of interest rates for everyone. The main goal of the BoC is to maintain inflation at 1-3% by adjusting interest rates up or down. Relatively higher interest rates tend to be positive for the CAD. The Bank of Canada can also use quantitative easing and tightening to influence credit conditions, with the former CAD-negative and the latter CAD-positive.
The price of Oil is a key factor impacting the value of the Canadian Dollar. Petroleum is Canada’s biggest export, so Oil price tends to have an immediate impact on the CAD value. Generally, if Oil price rises CAD also goes up, as aggregate demand for the currency increases. The opposite is the case if the price of Oil falls. Higher Oil prices also tend to result in a greater likelihood of a positive Trade Balance, which is also supportive of the CAD.
While inflation had always traditionally been thought of as a negative factor for a currency since it lowers the value of money, the opposite has actually been the case in modern times with the relaxation of cross-border capital controls. Higher inflation tends to lead central banks to put up interest rates which attracts more capital inflows from global investors seeking a lucrative place to keep their money. This increases demand for the local currency, which in Canada’s case is the Canadian Dollar.
Macroeconomic data releases gauge the health of the economy and can have an impact on the Canadian Dollar. Indicators such as GDP, Manufacturing and Services PMIs, employment, and consumer sentiment surveys can all influence the direction of the CAD. A strong economy is good for the Canadian Dollar. Not only does it attract more foreign investment but it may encourage the Bank of Canada to put up interest rates, leading to a stronger currency. If economic data is weak, however, the CAD is likely to fall.
- WTI price holds mild gains due to escalated geopolitical tensions in the Middle East.
- Concerns over a weak global economy weaken the demand for Oil.
- US and China Manufacturing PMIs dropped to 46.8 and 49.8, respectively, in July.
West Texas Intermediate (WTI) crude Oil price inches higher to near $76.50 per barrel during Friday’s Asian session. The price of crude Oil may find support from supply risks arising from heightened geopolitical tensions in the Middle East, despite ongoing global concerns about Oil demand.
Markets are closely watching Iran's reaction to the assassination of Hamas leader Ismail Haniyeh. According to the New York Times, Haniyeh was killed in Tehran after attending the inauguration of Iran's new president. Both Iranian officials and Hamas have attributed the attack to Israel.
Weak Purchasing Managers Index (PMI) data from both the United States (US) and China are raising concerns about Oil demand. The US ISM Manufacturing PMI fell to an eight-month low of 46.8 in July, down from 48.5 and below the forecasted 48.8. Similarly, China's Caixin Manufacturing PMI came in at 49.8 for July, missing the expected 51.5 and dropping from the previous 51.8.
Oil traders face uncertainty as they navigate a complex situation involving an economic slowdown and increased expectations for a Federal Reserve rate cut. The CME's FedWatch Tool shows that traders fully anticipate a 25-basis point rate cut on September 18. Additionally, traders are closely watching the upcoming July US Nonfarm Payrolls and Average Hourly Earnings data, set to be released later in the North American session, for insights into the US labor market.
WTI Oil FAQs
WTI Oil is a type of Crude Oil sold on international markets. The WTI stands for West Texas Intermediate, one of three major types including Brent and Dubai Crude. WTI is also referred to as “light” and “sweet” because of its relatively low gravity and sulfur content respectively. It is considered a high quality Oil that is easily refined. It is sourced in the United States and distributed via the Cushing hub, which is considered “The Pipeline Crossroads of the World”. It is a benchmark for the Oil market and WTI price is frequently quoted in the media.
Like all assets, supply and demand are the key drivers of WTI Oil price. As such, global growth can be a driver of increased demand and vice versa for weak global growth. Political instability, wars, and sanctions can disrupt supply and impact prices. The decisions of OPEC, a group of major Oil-producing countries, is another key driver of price. The value of the US Dollar influences the price of WTI Crude Oil, since Oil is predominantly traded in US Dollars, thus a weaker US Dollar can make Oil more affordable and vice versa.
The weekly Oil inventory reports published by the American Petroleum Institute (API) and the Energy Information Agency (EIA) impact the price of WTI Oil. Changes in inventories reflect fluctuating supply and demand. If the data shows a drop in inventories it can indicate increased demand, pushing up Oil price. Higher inventories can reflect increased supply, pushing down prices. API’s report is published every Tuesday and EIA’s the day after. Their results are usually similar, falling within 1% of each other 75% of the time. The EIA data is considered more reliable, since it is a government agency.
OPEC (Organization of the Petroleum Exporting Countries) is a group of 13 Oil-producing nations who collectively decide production quotas for member countries at twice-yearly meetings. Their decisions often impact WTI Oil prices. When OPEC decides to lower quotas, it can tighten supply, pushing up Oil prices. When OPEC increases production, it has the opposite effect. OPEC+ refers to an expanded group that includes ten extra non-OPEC members, the most notable of which is Russia.
Japan’s Industry Minister Ken Saito said on Friday that “economic fundamentals aren't bad,” when asked about the sharp fall in local stock markets.
Saito added, “strong movement seen in investment and wage hike continuing.”
- USD/JPY bounced back from a four-month low of 148.50 recorded on Thursday.
- The US ISM Manufacturing PMI dropped to an eight-month low of 46.8 in July, down from 48.5 in June.
- The Japanese Yen may advance as BoJ indicated that it may further increase rates if the economy requires it.
USD/JPY trades around 149.40 during the Asian session on Friday after rebounding from a four-month low of 148.50 recorded on Thursday. This upside of the USD/JPY pair could be attributed to the improved US Dollar (USD), which could be attributed to the increased risk-off mood following the recent manufacturing and employment data raising concerns about the US economy.
US Dollar (USD) receives support as markets are grappling with a delicate balancing act. However, an economic downturn heightens expectations for a rate cut by the Federal Reserve. The CME's FedWatch Tool indicates that traders are fully pricing in a 25-basis point rate cut on September 18. Furthermore, traders await upcoming US Nonfarm Payrolls and Average Hourly Earnings data for July, due to be released later in the North American session.
US ISM Manufacturing Purchasing Managers Index (PMI) tumbled to an eight-month low of 46.8 in July, compared to the previous 48.5 reading and the forecasted move up to 48.8. US Initial Jobless Claims for the week ended July 26 rose to 249K from the previous week’s 235K, exceeding the forecast uptick to 236K.
The Japanese Yen (JPY) has received support following the Bank of Japan's (BoJ) decision to raise its policy rate to a 16-year high of 0.25%. This move, along with the BoJ's indication that it may further increase rates if the economy requires it, could drive the JPY higher. Market expectations are now factoring in two additional rate hikes before the end of the fiscal year in March 2025, with the next increase anticipated in December. This outlook might limit the upside potential of the USD/JPY pair.
Japanese Yen FAQs
The Japanese Yen (JPY) is one of the world’s most traded currencies. Its value is broadly determined by the performance of the Japanese economy, but more specifically by the Bank of Japan’s policy, the differential between Japanese and US bond yields, or risk sentiment among traders, among other factors.
One of the Bank of Japan’s mandates is currency control, so its moves are key for the Yen. The BoJ has directly intervened in currency markets sometimes, generally to lower the value of the Yen, although it refrains from doing it often due to political concerns of its main trading partners. The current BoJ ultra-loose monetary policy, based on massive stimulus to the economy, has caused the Yen to depreciate against its main currency peers. This process has exacerbated more recently due to an increasing policy divergence between the Bank of Japan and other main central banks, which have opted to increase interest rates sharply to fight decades-high levels of inflation.
The BoJ’s stance of sticking to ultra-loose monetary policy has led to a widening policy divergence with other central banks, particularly with the US Federal Reserve. This supports a widening of the differential between the 10-year US and Japanese bonds, which favors the US Dollar against the Japanese Yen.
The Japanese Yen is often seen as a safe-haven investment. This means that in times of market stress, investors are more likely to put their money in the Japanese currency due to its supposed reliability and stability. Turbulent times are likely to strengthen the Yen’s value against other currencies seen as more risky to invest in.
- Gold price gains ground due to increased risk aversion amid raised concerns about the US economy.
- The safe-haven demand for the yellow metal received support from escalated geopolitical tensions in the Middle East.
- The dovish mood surrounding the Fed’s policy outlook supports non-yielding assets like Gold.
Gold price (XAU/USD) edges higher to near $2,450 per troy ounce during the Asian session on Friday. Traders await upcoming US labor market data, including the Nonfarm Payrolls and Average Hourly Earnings data for July. Recent manufacturing and employment data have raised concerns about the US economy, boosting risk aversion and supporting the safe-haven Gold.
US ISM Manufacturing Purchasing Managers Index (PMI) tumbled to an eight-month low of 46.8 in July, compared to the previous 48.5 reading and the forecasted move up to 48.8. US Initial Jobless Claims for the week ended July 26 rose to 249K from the previous week’s 235K, lurching past the forecast uptick to 236K.
Additionally, the safe-haven demand for Gold increases due to escalated geopolitical tensions in the Middle East. Tensions in the Middle East remain high following the assassination of Hamas leader Ismail Haniyeh in Iran.
According to the New York Times on Wednesday, Haniyeh was killed in Iran's capital after attending the new president's inauguration. Both Iranian officials and Hamas have accused Israel of being behind the strike.
The price of the yellow metal gained ground due to the dovish sentiment surrounding the Federal Reserve’s (Fed) policy trajectory. Fed decided to keep rates unchanged in the 5.25%-5.50% range at its July meeting on Wednesday. Lower interest rates tend to increase the appeal of non-yielding assets like Gold.
Gold FAQs
Gold has played a key role in human’s history as it has been widely used as a store of value and medium of exchange. Currently, apart from its shine and usage for jewelry, the precious metal is widely seen as a safe-haven asset, meaning that it is considered a good investment during turbulent times. Gold is also widely seen as a hedge against inflation and against depreciating currencies as it doesn’t rely on any specific issuer or government.
Central banks are the biggest Gold holders. In their aim to support their currencies in turbulent times, central banks tend to diversify their reserves and buy Gold to improve the perceived strength of the economy and the currency. High Gold reserves can be a source of trust for a country’s solvency. Central banks added 1,136 tonnes of Gold worth around $70 billion to their reserves in 2022, according to data from the World Gold Council. This is the highest yearly purchase since records began. Central banks from emerging economies such as China, India and Turkey are quickly increasing their Gold reserves.
Gold has an inverse correlation with the US Dollar and US Treasuries, which are both major reserve and safe-haven assets. When the Dollar depreciates, Gold tends to rise, enabling investors and central banks to diversify their assets in turbulent times. Gold is also inversely correlated with risk assets. A rally in the stock market tends to weaken Gold price, while sell-offs in riskier markets tend to favor the precious metal.
The price can move due to a wide range of factors. Geopolitical instability or fears of a deep recession can quickly make Gold price escalate due to its safe-haven status. As a yield-less asset, Gold tends to rise with lower interest rates, while higher cost of money usually weighs down on the yellow metal. Still, most moves depend on how the US Dollar (USD) behaves as the asset is priced in dollars (XAU/USD). A strong Dollar tends to keep the price of Gold controlled, whereas a weaker Dollar is likely to push Gold prices up.
| Raw materials | Closed | Change, % |
|---|---|---|
| Silver | 28.493 | -1.85 |
| Gold | 244.627 | -0.05 |
| Palladium | 903.35 | -2.7 |
- The Australian Dollar appreciates after the release of higher Producer Price Index figures.
- Australia's PPI rose by 4.8% YoY in Q2, against the previous quarter’s reading of 4.3%.
- The US Dollar received support due to increased risk aversion amid raised concerns about the US economy.
The Australian Dollar (AUD) recovers its daily losses against the US Dollar (US) following the higher Producer Price Index (PPI) data released on Friday. However, this upside could be limited due to increased risk aversion ahead of upcoming US labor market data, including the Nonfarm Payrolls report for July.
The Aussie Dollar faces challenges as second-quarter inflation data has diminished expectations for another rate hike by the Reserve Bank of Australia (RBA) at its policy meeting next week. Markets now estimate about a 50% chance of an RBA rate cut in November, a move anticipated much earlier than previously forecasted for April next year. These factors are contributing to the downward pressure on the Australian Dollar.
Recent manufacturing and employment data have raised concerns about the US economy, boosting risk aversion and supporting the US Dollar. Markets are grappling with a delicate balancing act, as an economic downturn heightens expectations for a rate cut by the Federal Reserve. The CME's FedWatch Tool indicates that traders are fully pricing in a 25 basis point rate cut on September 18, with a one-in-five chance of a 50 basis point cut.
Daily Digest Market Movers: Australian Dollar advances following PPI data
- US ISM Manufacturing Purchasing Managers Index (PMI) tumbled to an eight-month low of 46.8 in July, compared to the previous 48.5 reading and the forecasted move up to 48.8.
- US Initial Jobless Claims for the week ended July 26 rose to 249K from the previous week’s 235K, lurching past the forecast uptick to 236K.
- China’s Caixin Manufacturing Purchasing Managers Index (PMI) posted a reading of 49.8 for July, falling short of the expected reading of 51.5 and the previous reading of 51.8. Since both nations are close trade partners, changes in the Chinese economy can significantly impact the Australian market.
- The Australian Bureau of Statistics (ABS) reported a trade surplus of 5,589 million for June, surpassing the anticipated 5,000 million but still below the previous reading of 5,773 million.
- During a press conference, Federal Reserve Chair Jerome Powell stated that a rate cut in September is "on the table." Powell added that the central bank will closely monitor the labor market and remain vigilant for signs of a potential sharp downturn, per Reuters.
- The ABS reported on Wednesday that the Monthly CPI rose by 3.8% in the year to June, easing from the 4% posted in May. The quarterly CPI rose 1% QoQ and up 3.8% YoY in the second quarter of the year. The RBA Trimmed Mean CPI, the central bank’s preferred gauge, rose by 3.9% YoY in Q2, against the expected and previous reading of 4.0%.
Technical Analysis: Australian Dollar holds position around 0.6500
The Australian Dollar trades around 0.6510 on Friday. The daily chart analysis shows that the AUD/USD pair consolidates within a descending channel, indicating a bearish bias. The 14-day Relative Strength Index (RSI) is near the oversold 30 level, suggesting a potential upward correction might be imminent.
Immediate support for the AUD/USD pair is around the lower boundary of the descending channel at 0.6470, followed by the throwback support at approximately 0.6470.
On the upside, the upper boundary of the descending channel at 0.6530 serves as the immediate resistance, followed by the nine-day Exponential Moving Average (EMA) at 0.6555. The next barrier for the AUD/USD pair appears at the “throwback support turned resistance” at 0.6575. A break above this resistance could drive the AUD/USD pair toward a six-month high of 0.6798.
AUD/USD: Daily Chart
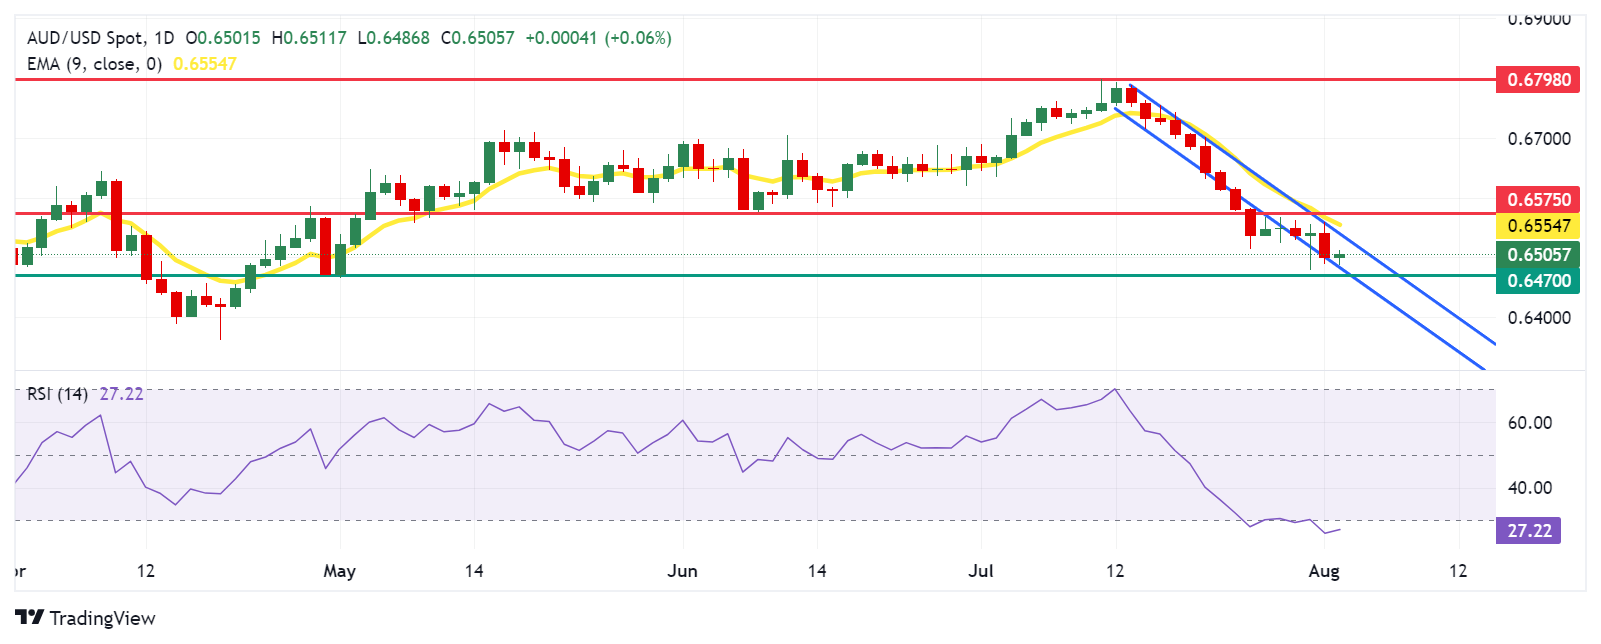
Australian Dollar PRICE Today
The table below shows the percentage change of Australian Dollar (AUD) against listed major currencies today. Australian Dollar was the strongest against the British Pound.
| USD | EUR | GBP | JPY | CAD | AUD | NZD | CHF | |
|---|---|---|---|---|---|---|---|---|
| USD | 0.03% | 0.17% | 0.06% | -0.01% | -0.03% | 0.11% | -0.02% | |
| EUR | -0.03% | 0.13% | 0.03% | -0.05% | -0.06% | 0.06% | -0.05% | |
| GBP | -0.17% | -0.13% | -0.11% | -0.18% | -0.20% | -0.06% | -0.16% | |
| JPY | -0.06% | -0.03% | 0.11% | -0.06% | -0.09% | 0.02% | -0.07% | |
| CAD | 0.01% | 0.05% | 0.18% | 0.06% | -0.02% | 0.13% | 0.01% | |
| AUD | 0.03% | 0.06% | 0.20% | 0.09% | 0.02% | 0.14% | 0.02% | |
| NZD | -0.11% | -0.06% | 0.06% | -0.02% | -0.13% | -0.14% | -0.09% | |
| CHF | 0.02% | 0.05% | 0.16% | 0.07% | -0.01% | -0.02% | 0.09% |
The heat map shows percentage changes of major currencies against each other. The base currency is picked from the left column, while the quote currency is picked from the top row. For example, if you pick the Australian Dollar from the left column and move along the horizontal line to the US Dollar, the percentage change displayed in the box will represent AUD (base)/USD (quote).
Australian Dollar FAQs
One of the most significant factors for the Australian Dollar (AUD) is the level of interest rates set by the Reserve Bank of Australia (RBA). Because Australia is a resource-rich country another key driver is the price of its biggest export, Iron Ore. The health of the Chinese economy, its largest trading partner, is a factor, as well as inflation in Australia, its growth rate and Trade Balance. Market sentiment – whether investors are taking on more risky assets (risk-on) or seeking safe-havens (risk-off) – is also a factor, with risk-on positive for AUD.
The Reserve Bank of Australia (RBA) influences the Australian Dollar (AUD) by setting the level of interest rates that Australian banks can lend to each other. This influences the level of interest rates in the economy as a whole. The main goal of the RBA is to maintain a stable inflation rate of 2-3% by adjusting interest rates up or down. Relatively high interest rates compared to other major central banks support the AUD, and the opposite for relatively low. The RBA can also use quantitative easing and tightening to influence credit conditions, with the former AUD-negative and the latter AUD-positive.
China is Australia’s largest trading partner so the health of the Chinese economy is a major influence on the value of the Australian Dollar (AUD). When the Chinese economy is doing well it purchases more raw materials, goods and services from Australia, lifting demand for the AUD, and pushing up its value. The opposite is the case when the Chinese economy is not growing as fast as expected. Positive or negative surprises in Chinese growth data, therefore, often have a direct impact on the Australian Dollar and its pairs.
Iron Ore is Australia’s largest export, accounting for $118 billion a year according to data from 2021, with China as its primary destination. The price of Iron Ore, therefore, can be a driver of the Australian Dollar. Generally, if the price of Iron Ore rises, AUD also goes up, as aggregate demand for the currency increases. The opposite is the case if the price of Iron Ore falls. Higher Iron Ore prices also tend to result in a greater likelihood of a positive Trade Balance for Australia, which is also positive of the AUD.
The Trade Balance, which is the difference between what a country earns from its exports versus what it pays for its imports, is another factor that can influence the value of the Australian Dollar. If Australia produces highly sought after exports, then its currency will gain in value purely from the surplus demand created from foreign buyers seeking to purchase its exports versus what it spends to purchase imports. Therefore, a positive net Trade Balance strengthens the AUD, with the opposite effect if the Trade Balance is negative.
Japan Finance Minister Shunichi Suzuki said on Friday that they “will analyze the impact of forex volatility on the economy, respond appropriately.”
Further comments
Will continue to closely monitor forex movements.
Stock prices are determined in the market based on various factors such as economic conditions.
Closely watching stock movements with a sense of urgency.
Desirable for currencies to move in a stable manner reflecting fundamentals.
Important to keep proper debt management through close dialogue with markets.
Reduction in BoJ’s JGB purchases would increase need for financial institutions to buy JGBs, raising importance of dialogue with markets.
Correction in Yen's weakness could push down import prices, tame consumer prices.
Need conviction that japan won’t go back to deflation before announcing complete exit from deflation.
Market reaction
The Japanese Yen is catching a fresh bid on the above headlines, as USD/JPY fades its recovery momentum toward 150.00. The pair is currently trading at 149.45, still up 0.06% on the day.
People’s Bank of China (PBOC) adviser Huang Yiping calls for bolder stimulus and lower inflation target.
Key quotes
Urge more fiscal stimulus and consumption boost.
Warn of "low inflation trap" risk for Chinese economy.
Suggest lowering CPI target to 2%-3% from current 3%.
Rare public critique of Beijing's conservative economic policies.
Market reaction
As of writing, AUD/USD is battling 0.6500, fading the move higher, following the Australian PPI inflation data release.
Australian Dollar FAQs
One of the most significant factors for the Australian Dollar (AUD) is the level of interest rates set by the Reserve Bank of Australia (RBA). Because Australia is a resource-rich country another key driver is the price of its biggest export, Iron Ore. The health of the Chinese economy, its largest trading partner, is a factor, as well as inflation in Australia, its growth rate and Trade Balance. Market sentiment – whether investors are taking on more risky assets (risk-on) or seeking safe-havens (risk-off) – is also a factor, with risk-on positive for AUD.
The Reserve Bank of Australia (RBA) influences the Australian Dollar (AUD) by setting the level of interest rates that Australian banks can lend to each other. This influences the level of interest rates in the economy as a whole. The main goal of the RBA is to maintain a stable inflation rate of 2-3% by adjusting interest rates up or down. Relatively high interest rates compared to other major central banks support the AUD, and the opposite for relatively low. The RBA can also use quantitative easing and tightening to influence credit conditions, with the former AUD-negative and the latter AUD-positive.
China is Australia’s largest trading partner so the health of the Chinese economy is a major influence on the value of the Australian Dollar (AUD). When the Chinese economy is doing well it purchases more raw materials, goods and services from Australia, lifting demand for the AUD, and pushing up its value. The opposite is the case when the Chinese economy is not growing as fast as expected. Positive or negative surprises in Chinese growth data, therefore, often have a direct impact on the Australian Dollar and its pairs.
Iron Ore is Australia’s largest export, accounting for $118 billion a year according to data from 2021, with China as its primary destination. The price of Iron Ore, therefore, can be a driver of the Australian Dollar. Generally, if the price of Iron Ore rises, AUD also goes up, as aggregate demand for the currency increases. The opposite is the case if the price of Iron Ore falls. Higher Iron Ore prices also tend to result in a greater likelihood of a positive Trade Balance for Australia, which is also positive of the AUD.
The Trade Balance, which is the difference between what a country earns from its exports versus what it pays for its imports, is another factor that can influence the value of the Australian Dollar. If Australia produces highly sought after exports, then its currency will gain in value purely from the surplus demand created from foreign buyers seeking to purchase its exports versus what it spends to purchase imports. Therefore, a positive net Trade Balance strengthens the AUD, with the opposite effect if the Trade Balance is negative.
Japan’s Chief Cabinet Secretary Yoshimasa Hayashi said on Friday that “stock prices are determined in the market based on various factors such as economic conditions and corporate activities.”
Additional comments
Will continue to pay close attention to markets with sense of urgency.
Important for currencies to move in stable manner reflecting fundamentals.
Closely watching FX moves.
Won't comment on forex levels.
Market reaction
At press time, USD/JPY is off the highs but traders near 149.50, up 0.13% on the day. The pair continues its wild swings amid a 4% slump in the Japanese indices.
The People’s Bank of China (PBOC) set the USD/CNY central rate for the trading session ahead on Friday at 7.1376, as against the previous day's fix of 7.1323 and 7.2437 Reuters estimates.
| Index | Change, points | Closed | Change, % |
|---|---|---|---|
| NIKKEI 225 | -975.49 | 38126.33 | -2.49 |
| Hang Seng | -39.64 | 17304.96 | -0.23 |
| KOSPI | 6.99 | 2777.68 | 0.25 |
| ASX 200 | 22.4 | 8114.7 | 0.28 |
| DAX | -425.6 | 18083.05 | -2.3 |
| CAC 40 | -161.04 | 7370.45 | -2.14 |
| Dow Jones | -494.82 | 40347.97 | -1.21 |
| S&P 500 | -75.62 | 5446.68 | -1.37 |
| NASDAQ Composite | -405.26 | 17194.14 | -2.3 |
| Pare | Closed | Change, % |
|---|---|---|
| AUDUSD | 0.64984 | -0.75 |
| EURJPY | 161.133 | -0.78 |
| EURUSD | 1.07907 | -0.36 |
| GBPJPY | 190.18 | -1.39 |
| GBPUSD | 1.27363 | -0.97 |
| NZDUSD | 0.59441 | -0.18 |
| USDCAD | 1.38697 | 0.5 |
| USDCHF | 0.8729 | -0.52 |
| USDJPY | 149.319 | -0.42 |


© 2000-2026. Bản quyền Teletrade.
Trang web này được quản lý bởi Teletrade D.J. LLC 2351 LLC 2022 (Euro House, Richmond Hill Road, Kingstown, VC0100, St. Vincent and the Grenadines).
Thông tin trên trang web không phải là cơ sở để đưa ra quyết định đầu tư và chỉ được cung cấp cho mục đích làm quen.
Giao dịch trên thị trường tài chính (đặc biệt là giao dịch sử dụng các công cụ biên) mở ra những cơ hội lớn và tạo điều kiện cho các nhà đầu tư sẵn sàng mạo hiểm để thu lợi nhuận, tuy nhiên nó mang trong mình nguy cơ rủi ro khá cao. Chính vì vậy trước khi tiến hành giao dịch cần phải xem xét mọi mặt vấn đề chấp nhận tiến hành giao dịch cụ thể xét theo quan điểm của nguồn lực tài chính sẵn có và mức độ am hiểu thị trường tài chính.
Sử dụng thông tin: sử dụng toàn bộ hay riêng biệt các dữ liệu trên trang web của công ty TeleTrade như một nguồn cung cấp thông tin nhất định. Việc sử dụng tư liệu từ trang web cần kèm theo liên kết đến trang teletrade.vn. Việc tự động thu thập số liệu cũng như thông tin từ trang web TeleTrade đều không được phép.
Xin vui lòng liên hệ với pr@teletrade.global nếu có câu hỏi.
ngân hàng