- Phân tích
- Tin tức và các công cụ
- Tin tức thị trường
Tin tức thì trường
| Time | Country | Event | Period | Previous value | Forecast |
|---|---|---|---|---|---|
| 00:00 (GMT) | Australia | RBA's Governor Philip Lowe Speaks | |||
| 00:30 (GMT) | Australia | Gross Domestic Product (YoY) | Quarter III | -6.3% | -4.5% |
| 00:30 (GMT) | Australia | Gross Domestic Product (QoQ) | Quarter III | -7% | 2.5% |
| 05:00 (GMT) | Japan | Consumer Confidence | November | 33.6 | |
| 07:00 (GMT) | Germany | Retail sales, real adjusted | October | -2.2% | 1.2% |
| 07:00 (GMT) | Germany | Retail sales, real unadjusted, y/y | October | 6.5% | 5.9% |
| 07:30 (GMT) | Switzerland | Consumer Price Index (MoM) | November | 0% | -0.1% |
| 07:30 (GMT) | Switzerland | Consumer Price Index (YoY) | November | -0.6% | -0.5% |
| 10:00 (GMT) | Eurozone | Producer Price Index, MoM | October | 0.3% | 0.2% |
| 10:00 (GMT) | Eurozone | Producer Price Index (YoY) | October | -2.4% | -2.4% |
| 10:00 (GMT) | Eurozone | Unemployment Rate | October | 8.3% | 8.4% |
| 13:15 (GMT) | U.S. | ADP Employment Report | November | 365 | 500 |
| 13:30 (GMT) | Canada | Labor Productivity | Quarter III | 9.8% | |
| 14:00 (GMT) | U.S. | FOMC Member Williams Speaks | |||
| 15:00 (GMT) | U.S. | FOMC Member Harker Speaks | |||
| 15:00 (GMT) | U.S. | Fed Chair Powell Testimony | |||
| 15:30 (GMT) | U.S. | Crude Oil Inventories | November | -0.754 | -2.272 |
| 18:00 (GMT) | U.S. | FOMC Member Williams Speaks | |||
| 19:00 (GMT) | U.S. | Fed's Beige Book | |||
| 21:30 (GMT) | Australia | AiG Performance of Construction Index | November | 52.7 | |
| 21:45 (GMT) | New Zealand | Building Permits, m/m | October | 3.6% |
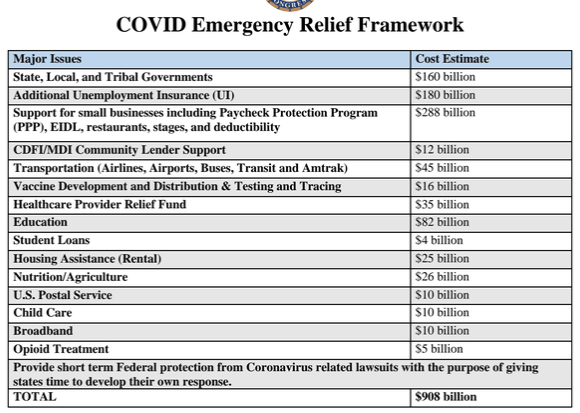
- Says Congress should provide restaurant industry grants, not loans
- Urges Congress to provide another $300 billion for Paycheck Protection Program (PPP)
- Says decision to not to extend Fed's COVID lending facilities was not an economic decision
- U.S. economy has performed better than expected
- Economy has a long way to go to recovery
- There are 10 mln people unemployed
- There is risk of small business closure during the winter
- In the medium term, there is upside risk
- Fed remains committed to using all of its tools to support the economy
- We will need more fiscal support
- Inequality is important problem in our economy, it holds our economy back
The Commerce
Department announced on Tuesday that construction spending climbed 1.3 percent
m-o-m in October after a revised 0.5 percent m-o-m drop in September
(originally a 0.3 percent m-o-m gain). This was the largest monthly advance in
construction spending since January.
Economists had
forecast construction spending increasing 0.8 percent m-o-m in October.
According to
the report, spending on private construction rose 1.4 percent m-o-m, while
investment in public construction increased 1.0 percent m-o-m.
A report from
the Institute for Supply Management (ISM) showed on Tuesday the U.S.
manufacturing sector’s activity continued to expand in November, albeit at
slower pace than in October.
The ISM's index
of manufacturing activity came in at 57.5 percent last month, 1.8 percentage
points from the October reading of 59.3 percent. The November reading pointed
to the seventh straight month of expansion in factory activity.
Economists' had
forecast the indicator to decrease to 58.0 percent.
A reading above
50 percent indicates expansion, while a reading below 50 percent indicates
contraction.
According to
the report, the New Orders Index stood at 65.1 percent, down 2.8 percentage
points from the October reading, while the Production Index registered 60.8
percent, a decrease of 2.2 percentage points compared to the October reading,
the Employment Index was at 48.4 percent, 4.8 percentage points down from the
October reading, returning to contraction territory. Meanwhile, the Supplier
Deliveries Index stood at 61.7 percent, up 1.2 percentage points from the October
figure and the Backlog of Orders Index registered 56.9 percent, 1.2 percentage
points higher compared to the October reading.
Timothy R. Fiore, Chair of the ISM Manufacturing Business Survey Committee, noted that the manufacturing economy continued its recovery in November. “Survey Committee members reported that their companies and suppliers continue to operate in reconfigured factories, but absenteeism, short-term shutdowns to sanitize facilities and difficulties in returning and hiring workers are causing strains that will likely limit future manufacturing growth potential,” he added. “Panel sentiment, however, is optimistic (2.5 positive comments for every cautious comment), an improvement compared to October”. He also said that the past relationship between the PMI and the overall economy indicated that the PMI for November (57.5 percent) corresponds to a 4.3-percent increase in real gross domestic product (GDP) on an annualized basis.
The latest
report by IHS Markit revealed on Tuesday the seasonally adjusted IHS Markit
final U.S. Manufacturing Purchasing Managers’ Index(PMI) rose to 56.7 in November,
up from 53.4 in September, matching the earlier released ”flash” estimate. The November
reading pointed to the sharpest growth in factory activity since September 2014.
Economists had
forecast the index to stay unrevised at 56.7.
According to
the report, the uptick in the headline index reflected a substantial gain in
output at manufacturing firms in November. The advance in production was the
steepest in over six years, amid stronger new order inflows.
U.S. stock-index futures rose on Tuesday, indicating that the U.S. equity market will start December continuing its November rally.
Global Stocks:
Index/commodity | Last | Today's Change, points | Today's Change, % |
Nikkei | 26,787.54 | +353.92 | +1.34% |
Hang Seng | 26,567.68 | +226.19 | +0.86% |
Shanghai | 3,451.94 | +60.18 | +1.77% |
S&P/ASX | 6,588.50 | +70.70 | +1.08% |
FTSE | 6,374.44 | +108.25 | +1.73% |
CAC | 5,568.34 | +49.79 | +0.90% |
DAX | 13,408.98 | +117.82 | +0.89% |
Crude oil | $45.20 | -0.31% | |
Gold | $1,814.20 | +1.87% |
(company / ticker / price / change ($/%) / volume)
3M Co | MMM | 174.57 | 1.84(1.07%) | 2206 |
ALCOA INC. | AA | 20.13 | 0.23(1.16%) | 13088 |
ALTRIA GROUP INC. | MO | 40.14 | 0.31(0.78%) | 13055 |
Amazon.com Inc., NASDAQ | AMZN | 3,189.98 | 21.94(0.69%) | 52805 |
American Express Co | AXP | 120.8 | 2.21(1.86%) | 2359 |
AMERICAN INTERNATIONAL GROUP | AIG | 39.25 | 0.81(2.11%) | 4051 |
Apple Inc. | AAPL | 121.09 | 2.04(1.71%) | 1488857 |
AT&T Inc | T | 28.97 | 0.22(0.77%) | 159075 |
Boeing Co | BA | 214.35 | 3.64(1.73%) | 169586 |
Caterpillar Inc | CAT | 175.95 | 2.36(1.36%) | 4297 |
Chevron Corp | CVX | 89.25 | 2.07(2.37%) | 49172 |
Cisco Systems Inc | CSCO | 43.17 | 0.15(0.35%) | 62294 |
Citigroup Inc., NYSE | C | 56.38 | 1.31(2.38%) | 122701 |
E. I. du Pont de Nemours and Co | DD | 64.27 | 0.83(1.31%) | 586 |
Exxon Mobil Corp | XOM | 39.03 | 0.90(2.36%) | 240265 |
Facebook, Inc. | FB | 278.49 | 1.52(0.55%) | 83509 |
FedEx Corporation, NYSE | FDX | 291 | 4.42(1.54%) | 21343 |
Ford Motor Co. | F | 9.15 | 0.07(0.77%) | 408849 |
Freeport-McMoRan Copper & Gold Inc., NYSE | FCX | 24.05 | 0.66(2.82%) | 136485 |
General Electric Co | GE | 10.31 | 0.13(1.28%) | 592474 |
General Motors Company, NYSE | GM | 44.68 | 0.84(1.92%) | 99764 |
Goldman Sachs | GS | 232.56 | 3.23(1.41%) | 20664 |
Hewlett-Packard Co. | HPQ | 22.05 | 0.12(0.55%) | 1449 |
Home Depot Inc | HD | 279.37 | 1.96(0.71%) | 12750 |
Intel Corp | INTC | 48.59 | 0.24(0.50%) | 107486 |
International Business Machines Co... | IBM | 124.84 | 1.32(1.07%) | 13233 |
International Paper Company | IP | 49.86 | 0.38(0.77%) | 3128 |
Johnson & Johnson | JNJ | 145.74 | 1.06(0.73%) | 15569 |
JPMorgan Chase and Co | JPM | 120.2 | 2.32(1.97%) | 64994 |
McDonald's Corp | MCD | 218.88 | 1.44(0.66%) | 6127 |
Merck & Co Inc | MRK | 80.63 | 0.24(0.29%) | 13223 |
Microsoft Corp | MSFT | 214.9 | 0.83(0.39%) | 137878 |
Nike | NKE | 136.2 | 1.50(1.11%) | 10731 |
Pfizer Inc | PFE | 39.31 | 1.00(2.61%) | 1386156 |
Procter & Gamble Co | PG | 139.13 | 0.26(0.19%) | 3681 |
Starbucks Corporation, NASDAQ | SBUX | 98.71 | 0.69(0.70%) | 7654 |
Tesla Motors, Inc., NASDAQ | TSLA | 595.74 | 28.14(4.96%) | 1158363 |
The Coca-Cola Co | KO | 52.07 | 0.47(0.91%) | 21097 |
Twitter, Inc., NYSE | TWTR | 46.6 | 0.09(0.19%) | 36846 |
UnitedHealth Group Inc | UNH | 342.8 | 6.46(1.92%) | 11830 |
Verizon Communications Inc | VZ | 60.59 | 0.18(0.30%) | 7432 |
Visa | V | 212.75 | 2.40(1.14%) | 11243 |
Wal-Mart Stores Inc | WMT | 153.65 | 0.86(0.56%) | 22550 |
Walt Disney Co | DIS | 149.7 | 1.69(1.14%) | 16614 |
Yandex N.V., NASDAQ | YNDX | 70.3 | 1.34(1.94%) | 35257 |
Statistics
Canada announced on Tuesday that the country’s gross domestic product (GDP) grew
0.8 percent m-o-m in September after a revised 0.9 m-o-m advance in August
(originally a gain of 1.2 percent m-o-m).
That was slightly
below economists’ forecast for an increase of 0.9 percent m-o-m.
In the third
quarter of 2020, the Canadian GDP surged 8.9 percent q-o-q, following a revised
11.3 percent q-o-q tumble in the second quarter (originally an 11.5 percent
q-o-q plunge). That was the steepest growth since quarterly data were first
recorded in 1961.
According to
the report, the q-o-q increase in GDP reflected reopening of the economy, with
substantial upturns in housing investment, household spending on durable goods,
and exports. These upturns were influenced by favourable mortgage rates,
governments' continued support to households and businesses affected by the COVID-19
pandemic, and recovery in major trading partners' economies in the third
quarter.
Expressed at an
annualized rate, Canada’s GDP climbed 40.5 percent in the third quarter after a
revised 38.1 percent contraction in the previous quarter. This marked a record
expansion but was worse than economists’ forecast of a 47.6 percent surge.
| Time | Country | Event | Period | Previous value | Forecast | Actual |
|---|---|---|---|---|---|---|
| 08:30 | Switzerland | Manufacturing PMI | November | 52.3 | 51.3 | 55.2 |
| 08:50 | France | Manufacturing PMI | November | 51.3 | 49.1 | 49.6 |
| 08:55 | Germany | Manufacturing PMI | November | 58.2 | 57.9 | 57.8 |
| 08:55 | Germany | Unemployment Change | November | -38 | 8 | -39 |
| 08:55 | Germany | Unemployment Rate s.a. | November | 6.2% | 6.3% | 6.1% |
| 09:00 | Eurozone | Manufacturing PMI | November | 54.8 | 53.6 | 53.8 |
| 09:30 | United Kingdom | Purchasing Manager Index Manufacturing | November | 53.7 | 55.2 | 55.6 |
| 10:00 | Eurozone | Harmonized CPI, Y/Y | November | -0.3% | -0.2% | -0.3% |
| 10:00 | Eurozone | Harmonized CPI ex EFAT, Y/Y | November | 0.2% | 0.2% | 0.2% |
| 10:00 | Eurozone | Harmonized CPI | November | 0.2% | -0.3% | |
| 13:30 | Canada | GDP (m/m) | September | 0.9% | 0.9% | 0.8% |
| 13:30 | Canada | GDP QoQ | Quarter III | -11.3% | 8.9% | |
| 13:30 | Canada | GDP (YoY) | Quarter III | -38.1% | 47.6% | 40.5% |
USD fell against most of its major rivals in the European session on Tuesday as market participants bet that the Federal Reserve will take actions to support the U.S. economy during the months it will likely take before the effective coronavirus vaccines are produced and distributed at the scale needed to allow the activity to return to pre-pandemic levels.
The Fed chairman Jerome Powell is set to testify in front of the Senate Banking Committee today at 15:00 GMT. In prepared remarks, Powell said that the U.S. economy faces a "challenging" few months due to a resurgence of coronavirus infections. "A full economic recovery is unlikely until people are confident that it is safe to re-engage in a broad range of activities,” he added. Powell also noted that "recent news on the vaccine front is very positive for the medium term" but "for now, significant challenges and uncertainties remain, including timing, production and distribution, and efficacy across different groups".
Powell's cautious assessment, as well as the continued gridlock on additional fiscal stimulus, has markets betting that the Fed will take actions to support the U.S. economy, when its policymakers gather on December 15-16.
FXStreet reports that FX Strategists at UOB Group expect further gains in EUR/USD as long as it trades above the 1.1980 level in the next couple of days.
24-hour view: “EUR rose to an overnight high of 1.2003, the subsequent sharp selloff that sent it tumbling to a low of 1.1922 came as a surprise. The rapid loss in momentum suggests that the 1.2003 high is a short-term top and this level is not expected to come into the picture for today. Overall, EUR is likely to consolidate and trade between 1.1900 and 1.1980.”
Next 1-3 weeks: “Yesterday, we indicated that ‘a break of 1.1980 would shift the focus to the year-to-date high at 1.2011’. While EUR strengthened as expected, the sharp sell-off from an overnight high of 1.2003 has dented the upward momentum considerably. The odds for further EUR strength have diminished unless EUR can move and stay above 1.1980 within these 1 to 2 days. Otherwise, a break of 1.1900 (no change in ‘strong support’ level) would indicate that 1.2003 is a short-term top and EUR could trade sideways for a period of time.”
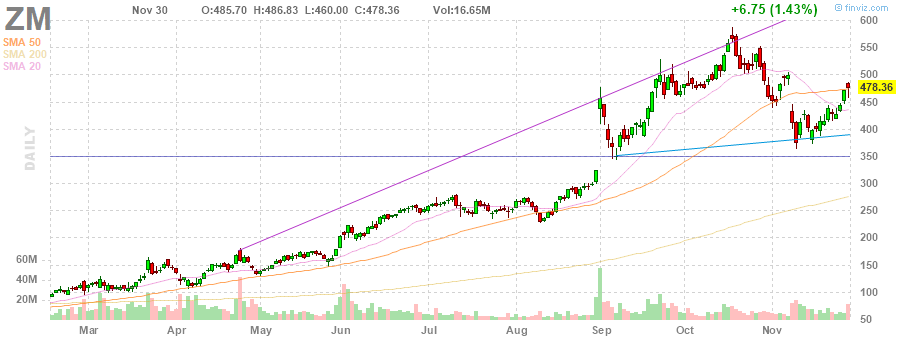
Zoom Video (ZM) reported Q3 FY 2020 earnings of $0.99 per share (versus $0.09 per share in Q3 FY 2019), beating analysts’ consensus estimate of $0.76 per share.
The company’s quarterly revenues amounted to $777.20 mln (+366.5% y/y), beating analysts’ consensus estimate of $694.13 mln.
The company also issued upside guidance for Q4 FY 2020, projecting EPS of $0.77-0.79 versus analysts’ consensus estimate of $0.63 and revenues of $806-811 mln versus analysts’ consensus estimate of $721.24 mln.
ZM fell to $442.13 (-7.57%) in pre-market trading.
Bert Colijn, a Senior Economist at ING, notes that inflation in the eurozone remains stable at -0.3% in November. But with inflation this low for quite some time and not much improvement expected ahead, the ECB will certainly take action next week, he suggested.
"The inflation rate has been stable at -0.3% since September in the eurozone and the same holds for core inflation at 0.2%. The underlying differences between October and November were small..."
"Still, the overall trend is clear, inflation will remain depressed. With a vaccine around the corner, there is room for recovery but unemployment has been trending up, which makes the outlook for inflation recovery slow at best. The lengthening of lockdown measures into December or in some cases even January certainly does not help."
"Given that core inflation is stubbornly low and will recover even more slowly than previously expected due to the second lockdown- this will be reflected in the macroeconomic projections that the ECB will present next week."
"As this has been the base case for some time now, it will without a doubt make the ECB loosen policy once again."
FXStreet reports that in the opinion of FX Strategists at UOB Group, NZD/USD could edge higher to the 0.7100 area in the next weeks.
24-hour view: “We expected NZD to strengthen yesterday but we were of the view that ‘0.7060 could be just out of reach’. Our view was not wrong as NZD topped out at 0.7050. Upward momentum has waned and NZD is unlikely to strengthen today.”
Next 1-3 weeks: “The positive phase in NZD that started on 06 Nov (spot at 0.6765) is still intact. Our latest narrative was from last Wednesday (25 Nov, spot at 0.6975) wherein ‘further NZD strength is not ruled but the next major resistance at 0.7060 may not come into the picture so soon’. Shorter-term momentum has improved and a break of 0.7060 would not be surprising and would shift the focus to 0.7100.”
- ECB is considering PEPP extension by 12 months as one of the options
- ECB may consider longer duration of favourable TLTRO rate
- ECB isn't obliged to do what markets expect from us
- Euro area Q4 economic contraction is very likely
- Stimulus must reflect more protracted pandemic crisis
FXStreet reports that economist at UOB Group Ho Woei Chen, CFA, reviewed the recent data releases in the Chinese economy.
“The manufacturing PMI from CFLP surged by 0.7 point to 52.1 in November, its highest reading since September 2017. The CFLP non-manufacturing PMI also came in above expectation at 56.4 in November, up 0.2 point from October. The reading is at its highest since June 2012. Both readings suggest that there is no letting up in China’s economic recovery momentum in 4Q, supported by strong seasonal demand with higher spendings expected in lieu of holiday travel.”
“We maintain our 4Q20 GDP growth forecast at 6.2% y/y (3Q20: 4.9%) with our full-year 2020 GDP growth at 1.9%.”
Reuters reports that the Organisation for Economic Cooperation and Development (OECD) said that the outlook for the global economy is improving as vaccines emerge and a Chinese-led recovery takes hold.
The global economy will grow 4.2% next year and ease to 3.7% in 2022, after shrinking 4.2% this year, the OECD said in its latest Economic Outlook.
"We're not out of the woods. We're still in the midst of a pandemic crisis, which means that policy still has a lot to do," said OECD chief economist Laurence Boone.
Overall global gross domestic product will return to pre-crisis levels by the end of 2021, led by a strong recovery in China, the OECD said.
But that masked wide variations among countries, with output in many economies expected to remain about 5% below pre-crisis levels in 2022.
China will be the only country covered by the OECD to see any growth at all this year, at 1.8%, unchanged from the last forecast in September. It will gain speed to 8% in 2021 - also unchanged - before easing to 4.9% in 2022.
The United States and Europe are expected to contribute less to the recovery than their weight in the global economy.
According to the report from Eurostat, euro area annual inflation is expected to be -0.3% in November 2020, stable compared to October.
Meanwhile, the core figures came in at 0.2% when compared to +0.2% expectations and +0.2% previous.
Looking at the main components of euro area inflation, food, alcohol & tobacco is expected to have the highest annual rate in November (1.9%, compared with 2.0% in October), followed by services (0.6%, compared with 0.4% in October), non-energy industrial goods (-0.3%, compared with -0.1% in October) and energy (-8.4%, compared with -8.2% in October).
According to the report from IHS Markit/CIPS, the upturn in the UK manufacturing economy strengthened during November, as rates of growth in output and new business accelerated and the downturn in employment slowed. The upcoming end to the Brexit transition period meanwhile led to rising levels of input purchasing, stockpiling of raw materials and stronger gains in new export business as EU-based clients brought forward orders.
The seasonally adjusted IHS Markit/CIPS Purchasing Managers’ Index (PMI®) rose to a 35-month high of 55.6 in November, up from 53.7 in October. The PMI has now signalled expansion for six successive months. Manufacturing production increased again in November. Although the rate of expansion was both solid and above that registered in the prior survey month, it was also weaker than those seen through the third quarter of the year. The upturn in production volumes was linked to companies reopening following COVID-19 closures earlier in the year and improving demand.
November saw a marked divergence between different sectors within manufacturing. The intermediate and investment goods industries both registered robust and accelerated growth of output. In contrast, the downturn in the consumer goods sector continued, with back-to back decreases in both production and new business.
The overall volume of incoming new business rose during November, albeit to a slightly lesser extent than the prior survey month. Manufacturers saw higher inflows of new work from overseas, in part boosted by EU clients bringing forward purchases before the Brexit transition period ends. There were also reports of higher intakes from Asia and the US.
According to the report from IHS Markit, the seasonally adjusted Eurozone Manufacturing PMI fell slightly during November but remained at a level indicative of strong growth. Although the headline index slipped to 53.8, from 54.8 in October, it was slightly better than the earlier flash reading and signalled an improvement in manufacturing operating conditions for the fifth successive month. Moreover, growth remained well above the long-run survey average.
There was some notable divergence in performance across the broad market groups data during November. On the one hand, the capital and intermediate goods sectors continued to expand at marked monthly rates. However, in contrast, consumer goods producers registered a modest deterioration in operating conditions for the first time in six months.
For the fifth successive month an increase in manufacturing production was recorded, although growth eased on October’s two and-a-half year peak and was the slowest since July. A similar trend was seen for new orders, where growth eased to the weakest in the current five-month sequence amid a slowdown in gains across domestic and external markets. Indeed, new export orders rose at the slowest pace since August, though growth remained solid.
Increased production and order requirements meant that firms continued to increase their purchasing activity, with growth amongst the best seen in the past two-and-a-half years. This served to further add pressure on suppliers, with average lead times for the delivery of inputs deteriorating to the greatest extent for seven months.
Finally, looking ahead to the coming 12 months, business confidence improved to its highest for over two-and-a-half years. Dutch, Italian and German companies were the most confident manufacturers in November.
FXStreet reports that UOB Group’s FX Strategists noted the probability of extra declines in USD/JPY could be running out of steam.
Next 1-3 weeks: “We highlighted yesterday that ‘downward momentum is beginning to improve but USD has to close below 103.50 in order to indicate that it is ready to tackle the month-to-date low at 103.18’. We added, ‘the odds for such a move appear to be quite high as long as USD does not move above 104.50 within these 1 to 2 days’. USD dropped to a low of 103.81 before staging a surprisingly sharp rebound (overnight high of 104.40). There is no change in our view for now but unless USD can stay below 104.00 within these 1 to 2 days, the odds for further weakness would diminish quickly.”
Reuters reports that British Prime Minister Boris Johnson's Brexit supremo, Michael Gove, said that Brexit trade talks are still stuck on fishing, governance rules and dispute resolution because the European Union is asking too much.
"The EU still wants to take the lion's share of the fishing in our waters - which is just not fair given that we are leaving the EU," Chancellor of the Duchy of Lancaster Gove told Sky.
"The EU still want us to be tied to their way of doing things," Gove said. "The EU are at the moment reserving the right if there is any sort of dispute not quite to rip everything up but to impose some really penal and tough restrictions on us and we don't think that's fair."
A trade deal would not only safeguard trade but also buttress peace in British-ruled Northern Ireland, though some disruption is almost certain at the busiest EU-UK border points.
| Time | Country | Event | Period | Previous value | Forecast | Actual |
|---|---|---|---|---|---|---|
| 00:30 | Australia | Current Account, bln | Quarter III | 16.3 | 7.1 | 10 |
| 00:30 | Australia | Building Permits, m/m | October | 16.2% | -3% | 3.8% |
| 00:30 | Japan | Manufacturing PMI | November | 48.7 | 48.3 | 49 |
| 01:45 | China | Markit/Caixin Manufacturing PMI | November | 53.6 | 53.5 | 54.9 |
| 03:30 | Australia | Announcement of the RBA decision on the discount rate | 0.1% | 0.10% | 0.1% | |
| 06:45 | Switzerland | Gross Domestic Product (YoY) | Quarter III | -7.8% | -3.3% | -1.6% |
| 06:45 | Switzerland | Gross Domestic Product (QoQ) | Quarter III | -7% | 5.9% | 7.2% |
| 07:00 | United Kingdom | Nationwide house price index, y/y | November | 5.8% | 5.5% | 6.5% |
| 07:00 | United Kingdom | Nationwide house price index | November | 0.8% | 0.3% | 0.9% |
During today's Asian trading, the US dollar fell against the euro, but rose slightly against the yen.
Strong statistical data from China supports risk appetite, which limits demand for the dollar, yen and other safe haven assets.
Experts note that statistical data increases confidence in the economy and eases fears that the situation will worsen due to the continued increase in the incidence of COVID-19 worldwide.
The Purchasing managers ' index (PMI) for China's industrial sector, calculated by Caixin Media Co. and Markit, rose to its highest in a decade in November. The indicator increased to 54.9 points - the highest value since November 2010 - compared to 53.6 points a month earlier. Experts expected it to fall to 53.5 points.
The ICE index, which tracks the dollar's performance against six currencies (the euro, swiss franc, yen, canadian dollar, pound sterling and swedish krona), fell 0.15%.
The Australian dollar is up 0.31 against the US dollar. The Reserve Bank of Australia kept the benchmark interest rate unchanged at the end of the last meeting in 2020 at 0.1%, and did not change the target yield of three - year government bonds, which is 0.1%.
RTTNews reports that Australia's central bank maintained its key interest rate near zero and pledged to avoid a rate hike for at least three years in order to support employment growth and to bring inflation back to the target range.
The policy board of the Reserve Bank of Australia decided to leave its cash rate unchanged at a record low of 0.10 percent.
The central bank retained the target yield on the 3-year Australian Government bond at around 0.1 percent, asset purchases of A$100 billion and also the parameters of the Term Funding Facility.
The RBA today said it will not increase the cash rate until actual inflation is sustainably within the 2 to 3 percent target range, the bank said. For this to occur, wages growth will have to be materially higher than it is currently.
This will require significant gains in employment and a return to a tight labor market. Given the outlook, the board is not expecting to increase the cash rate for at least three years.
The board will keep the size of the bond purchase program under review, particularly in light of the evolving outlook for jobs and inflation. The board said it is prepared to do more if necessary.
EUR/USD
Resistance levels (open interest**, contracts)
$1.2058 (1577)
$1.2018 (4553)
$1.1987 (1178)
Price at time of writing this review: $1.1961
Support levels (open interest**, contracts):
$1.1933 (267)
$1.1914 (186)
$1.1883 (686)
Comments:
- Overall open interest on the CALL options and PUT options with the expiration date December, 4 is 106026 contracts (according to data from November, 30) with the maximum number of contracts with strike price $1,1200 (6560);
GBP/USD
Resistance levels (open interest**, contracts)
$1.3516 (2770)
$1.3477 (926)
$1.3443 (1175)
Price at time of writing this review: $1.3385
Support levels (open interest**, contracts):
$1.3279 (1033)
$1.3251 (225)
$1.3217 (742)
Comments:
- Overall open interest on the CALL options with the expiration date December, 4 is 23563 contracts, with the maximum number of contracts with strike price $1,3500 (2770);
- Overall open interest on the PUT options with the expiration date December, 4 is 41750 contracts, with the maximum number of contracts with strike price $1,2700 (11992);
- The ratio of PUT/CALL was 1.77 versus 1.77 from the previous trading day according to data from November, 30
* - The Chicago Mercantile Exchange bulletin (CME) is used for the calculation.
** - Open interest takes into account the total number of option contracts that are open at the moment.
According to the report from Nationwide Building Society, annual house price growth rose to 6.5% in November, the highest rate since January 2015. Economists had expected a 5.5% increase.
Prices up 0.9% month-on-month, after taking account of seasonal factors. Economists had expected a 0.3% increase.
Commenting on the figures, Robert Gardner, Nationwide's Chief Economist, said: “Annual house price growth accelerated from 5.8% in October to 6.5% in November – the highest outturn since January 2015. House prices rose by 0.9% month-on-month in November after taking account of seasonal effects, following a 0.8% rise in October.
“Data suggests that the economic recovery had lost momentum even before the latest lockdown came into effect. Economic growth slowed sharply from 6.3% in the month of July to 2.2% in August and 1.1% in September, even though the economy was still around 8% smaller than its prepandemic level at that point. Rising infection rates and tighter social restrictions will have resulted in a further hit to growth in October and November.
“Labour market conditions also weakened with the unemployment rate rising to 4.8% in the three months to September – still low by historic standards, but up from an average of 3.8% in 2019. The extension of the furlough scheme to March 2021 will help limit job losses in the short term by enabling firms to retain more staff that they would have done otherwise.
“Despite these headwinds, housing market activity has remained robust. October saw property transactions rise to 105,600, the highest level since 2016, while mortgage approvals for house purchase in the same month were at their highest level since 2007 at 97,500".
The Federal Statistical Office said that Switzerland’s GDP grew by 7.2 % in the 3rd quarter of 2020, after decreasing by a total of 8.6 % in the first half of the year. Economists had expected a 5.9% increase.
Domestic demand and parts of the service sector recovered significantly, while international developments had an adverse impact on exports.
In the 3rd quarter, Switzerland’s GDP grew vigorously, making up around three quarters of the ground lost in the first half of the year. GDP therefore still stands at some 2 % below the precrisis level at the end of 2019. Compared with neighbouring countries, the Swiss economy has made it through the coronavirus crisis relatively unscathed so far.
Following the gradual easing of the coronavirus measures, private consumption (+11. 9%) recovered significantly in the 3rd quarter, as expected. Various consumer sectors that were unavailable or difficult to access during the lockdown came back on stream. Investment in equipment (+8.8 %) and investment in construction (+5.1 %) also expanded considerably once more. As expected, final domestic demand registered record growth of 8.9%, still falling short of its pre crisis level at the end of 2019 by around 2%. Imports of goods (+11.2 %) and services (+9.9 %) grew substantially in line with this.
| Raw materials | Closed | Change, % |
|---|---|---|
| Brent | 47.51 | -0.31 |
| Silver | 22.619 | -0.41 |
| Gold | 1777.397 | -0.66 |
| Palladium | 2375.77 | -2.03 |
| Index | Change, points | Closed | Change, % |
|---|---|---|---|
| NIKKEI 225 | -211.09 | 26433.62 | -0.79 |
| Hang Seng | -553.19 | 26341.49 | -2.06 |
| KOSPI | -42.11 | 2591.34 | -1.6 |
| ASX 200 | -83.3 | 6517.8 | -1.26 |
| FTSE 100 | -101.39 | 6266.19 | -1.59 |
| DAX | -44.52 | 13291.16 | -0.33 |
| CAC 40 | -79.63 | 5518.55 | -1.42 |
| Dow Jones | -271.73 | 29638.64 | -0.91 |
| S&P 500 | -16.72 | 3621.63 | -0.46 |
| NASDAQ Composite | -7.11 | 12198.74 | -0.06 |
| Time | Country | Event | Period | Previous value | Forecast |
|---|---|---|---|---|---|
| 00:30 (GMT) | Australia | Current Account, bln | Quarter III | 17.7 | 7.1 |
| 00:30 (GMT) | Australia | Building Permits, m/m | October | 15.4% | -3% |
| 00:30 (GMT) | Japan | Manufacturing PMI | November | 48.7 | 48.3 |
| 01:45 (GMT) | China | Markit/Caixin Manufacturing PMI | November | 53.6 | 53.5 |
| 03:30 (GMT) | Australia | Announcement of the RBA decision on the discount rate | 0.1% | 0.10% | |
| 06:45 (GMT) | Switzerland | Gross Domestic Product (YoY) | Quarter III | -8.3% | -3.3% |
| 06:45 (GMT) | Switzerland | Gross Domestic Product (QoQ) | Quarter III | -7.3% | 5.8% |
| 07:00 (GMT) | United Kingdom | Nationwide house price index, y/y | November | 5.8% | 5.5% |
| 07:00 (GMT) | United Kingdom | Nationwide house price index | November | 0.8% | 0.3% |
| 08:30 (GMT) | Switzerland | Manufacturing PMI | November | 52.3 | 51.3 |
| 08:50 (GMT) | France | Manufacturing PMI | November | 51.3 | 49.1 |
| 08:55 (GMT) | Germany | Manufacturing PMI | November | 58.2 | 57.9 |
| 08:55 (GMT) | Germany | Unemployment Change | November | -35 | |
| 08:55 (GMT) | Germany | Unemployment Rate s.a. | November | 6.2% | |
| 09:00 (GMT) | Eurozone | Manufacturing PMI | November | 54.8 | 53.6 |
| 09:30 (GMT) | United Kingdom | Purchasing Manager Index Manufacturing | November | 53.7 | 55.2 |
| 10:00 (GMT) | Eurozone | Harmonized CPI, Y/Y | November | -0.3% | -0.2% |
| 10:00 (GMT) | Eurozone | Harmonized CPI ex EFAT, Y/Y | November | 0.2% | 0.2% |
| 10:00 (GMT) | Eurozone | Harmonized CPI | November | 0.2% | |
| 13:30 (GMT) | Canada | GDP (m/m) | September | 1.2% | 0.9% |
| 13:30 (GMT) | Canada | GDP QoQ | Quarter III | -11.5% | |
| 13:30 (GMT) | Canada | GDP (YoY) | Quarter III | -38.7% | 47% |
| 14:45 (GMT) | U.S. | Manufacturing PMI | November | 53.4 | 56.7 |
| 15:00 (GMT) | U.S. | Construction Spending, m/m | October | 0.3% | 0.8% |
| 15:00 (GMT) | U.S. | ISM Manufacturing | November | 59.3 | 57.9 |
| 15:00 (GMT) | U.S. | Fed Chair Powell Testimony | |||
| 17:00 (GMT) | U.S. | FOMC Member Brainard Speaks | |||
| 17:00 (GMT) | Eurozone | ECB President Lagarde Speaks | |||
| 18:15 (GMT) | U.S. | FOMC Member Daly Speaks | |||
| 20:00 (GMT) | U.S. | FOMC Member Charles Evans Speaks |
| Pare | Closed | Change, % |
|---|---|---|
| AUDUSD | 0.73411 | -0.56 |
| EURJPY | 124.429 | 0.04 |
| EURUSD | 1.19243 | -0.32 |
| GBPJPY | 139.013 | 0.27 |
| GBPUSD | 1.33222 | -0.03 |
| NZDUSD | 0.70091 | -0.22 |
| USDCAD | 1.30069 | 0.1 |
| USDCHF | 0.90907 | 0.56 |
| USDJPY | 104.343 | 0.32 |


© 2000-2026. Bản quyền Teletrade.
Trang web này được quản lý bởi Teletrade D.J. LLC 2351 LLC 2022 (Euro House, Richmond Hill Road, Kingstown, VC0100, St. Vincent and the Grenadines).
Thông tin trên trang web không phải là cơ sở để đưa ra quyết định đầu tư và chỉ được cung cấp cho mục đích làm quen.
Giao dịch trên thị trường tài chính (đặc biệt là giao dịch sử dụng các công cụ biên) mở ra những cơ hội lớn và tạo điều kiện cho các nhà đầu tư sẵn sàng mạo hiểm để thu lợi nhuận, tuy nhiên nó mang trong mình nguy cơ rủi ro khá cao. Chính vì vậy trước khi tiến hành giao dịch cần phải xem xét mọi mặt vấn đề chấp nhận tiến hành giao dịch cụ thể xét theo quan điểm của nguồn lực tài chính sẵn có và mức độ am hiểu thị trường tài chính.
Sử dụng thông tin: sử dụng toàn bộ hay riêng biệt các dữ liệu trên trang web của công ty TeleTrade như một nguồn cung cấp thông tin nhất định. Việc sử dụng tư liệu từ trang web cần kèm theo liên kết đến trang teletrade.vn. Việc tự động thu thập số liệu cũng như thông tin từ trang web TeleTrade đều không được phép.
Xin vui lòng liên hệ với pr@teletrade.global nếu có câu hỏi.
ngân hàng