- Phân tích
- Tin tức và các công cụ
- Tin tức thị trường
- USD/JPY Price Forecast: Clings to gains after failing to clear 144.00
USD/JPY Price Forecast: Clings to gains after failing to clear 144.00
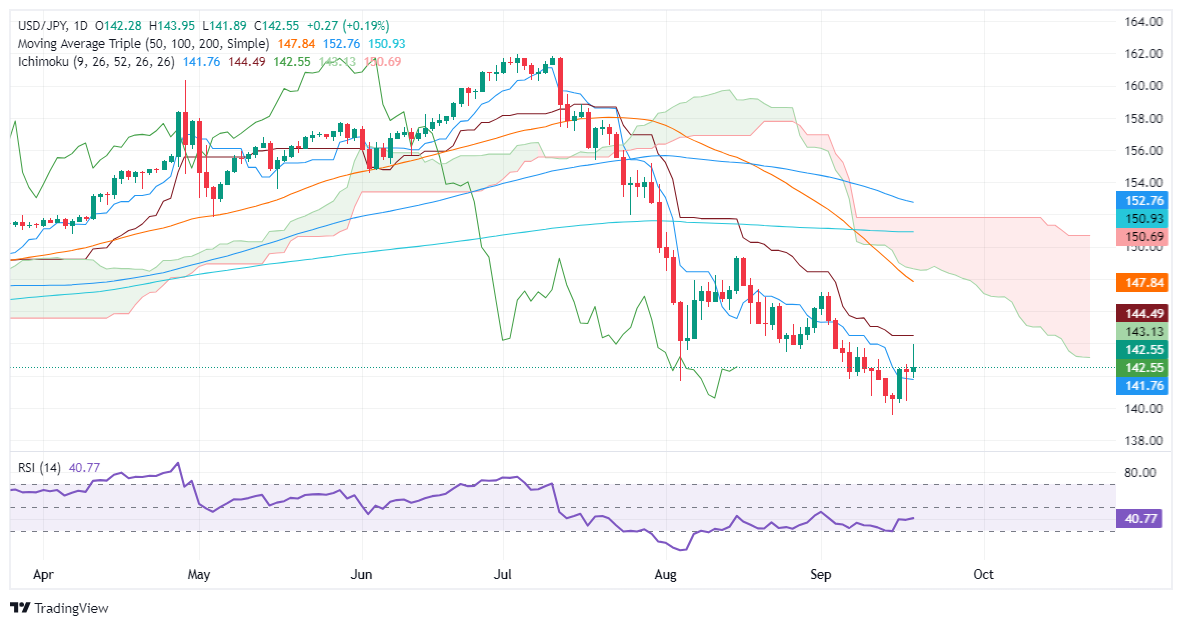
- USD/JPY's ‘shooting star’ candlestick hints at a possible bearish continuation despite current buyer momentum.
- Key supports: September 19 low at 141.88, 140.44, and YTD low at 139.58.
- Buyers need to surpass 143.94 resistance, with next target at Kijun-Sen at 144.48 for bullish control.
The USD/JPY held on to gains following Wednesday’s Federal Reserve decision but traded well below its daily peak of 143.94 as the Greenback registered losses.
Data-wise, the US docker featured initial jobless Claims for the last week, which fared better than expected but failed to boost the US Dollar. Meanwhile, traders eye the release of Japanese inflation data and the Bank of Japan's monetary policy decision.
USD/JPY Price Forecast: Technical outlook
The downtrend is set to continue despite recovering some ground. As Thursday’s session finishes, the USD/JPY retreated from the weekly high, forming a ‘shooting star’ candlestick. This means that bears are stepping into the market, paving the way for a re-test of the year-to-date (YTD) low of 139.58.
In the short term, momentum favors buyers, as depicted by the Relative Strength Index (RSI), though in the long term, the RSI is bearish.
For a bearish continuation, the USD/JPY must clear the September 19 low of 141.88, immediately followed by the Tenkan-Sen at 141.76. Those levels cleared, and the next demand zone would be the September 18 daily low of 140.44, followed by the YTD low of 139.58
Conversely, buyers must clear the September 19 high of 143.94 before testing the Kijun-Sen at 144.48.
USD/JPY Price Action – Daily Chart
Japanese Yen PRICE Today
The table below shows the percentage change of Japanese Yen (JPY) against listed major currencies today. Japanese Yen was the strongest against the Swiss Franc.
| USD | EUR | GBP | JPY | CAD | AUD | NZD | CHF | |
|---|---|---|---|---|---|---|---|---|
| USD | -0.40% | -0.51% | 0.20% | -0.34% | -0.71% | -0.53% | 0.10% | |
| EUR | 0.40% | -0.11% | 0.62% | 0.07% | -0.29% | -0.12% | 0.51% | |
| GBP | 0.51% | 0.11% | 0.72% | 0.17% | -0.20% | -0.01% | 0.60% | |
| JPY | -0.20% | -0.62% | -0.72% | -0.51% | -0.90% | -0.74% | -0.11% | |
| CAD | 0.34% | -0.07% | -0.17% | 0.51% | -0.37% | -0.19% | 0.43% | |
| AUD | 0.71% | 0.29% | 0.20% | 0.90% | 0.37% | 0.18% | 0.80% | |
| NZD | 0.53% | 0.12% | 0.01% | 0.74% | 0.19% | -0.18% | 0.63% | |
| CHF | -0.10% | -0.51% | -0.60% | 0.11% | -0.43% | -0.80% | -0.63% |
The heat map shows percentage changes of major currencies against each other. The base currency is picked from the left column, while the quote currency is picked from the top row. For example, if you pick the Japanese Yen from the left column and move along the horizontal line to the US Dollar, the percentage change displayed in the box will represent JPY (base)/USD (quote).


© 2000-2026. Bản quyền Teletrade.
Trang web này được quản lý bởi Teletrade D.J. LLC 2351 LLC 2022 (Euro House, Richmond Hill Road, Kingstown, VC0100, St. Vincent and the Grenadines).
Thông tin trên trang web không phải là cơ sở để đưa ra quyết định đầu tư và chỉ được cung cấp cho mục đích làm quen.
Giao dịch trên thị trường tài chính (đặc biệt là giao dịch sử dụng các công cụ biên) mở ra những cơ hội lớn và tạo điều kiện cho các nhà đầu tư sẵn sàng mạo hiểm để thu lợi nhuận, tuy nhiên nó mang trong mình nguy cơ rủi ro khá cao. Chính vì vậy trước khi tiến hành giao dịch cần phải xem xét mọi mặt vấn đề chấp nhận tiến hành giao dịch cụ thể xét theo quan điểm của nguồn lực tài chính sẵn có và mức độ am hiểu thị trường tài chính.
Sử dụng thông tin: sử dụng toàn bộ hay riêng biệt các dữ liệu trên trang web của công ty TeleTrade như một nguồn cung cấp thông tin nhất định. Việc sử dụng tư liệu từ trang web cần kèm theo liên kết đến trang teletrade.vn. Việc tự động thu thập số liệu cũng như thông tin từ trang web TeleTrade đều không được phép.
Xin vui lòng liên hệ với pr@teletrade.global nếu có câu hỏi.
ngân hàng