- Phân tích
- Tin tức và các công cụ
- Tin tức thị trường
- NZD/USD Price Forecast: Advances to near 0.6200; next barrier at seven-month highs
NZD/USD Price Forecast: Advances to near 0.6200; next barrier at seven-month highs
- The daily chart analysis of the NZD/USD pair suggests that selling pressure is weakening and signals a potential bullish reversal.
- The pair may explore the area around its seven-month high of 0.6247.
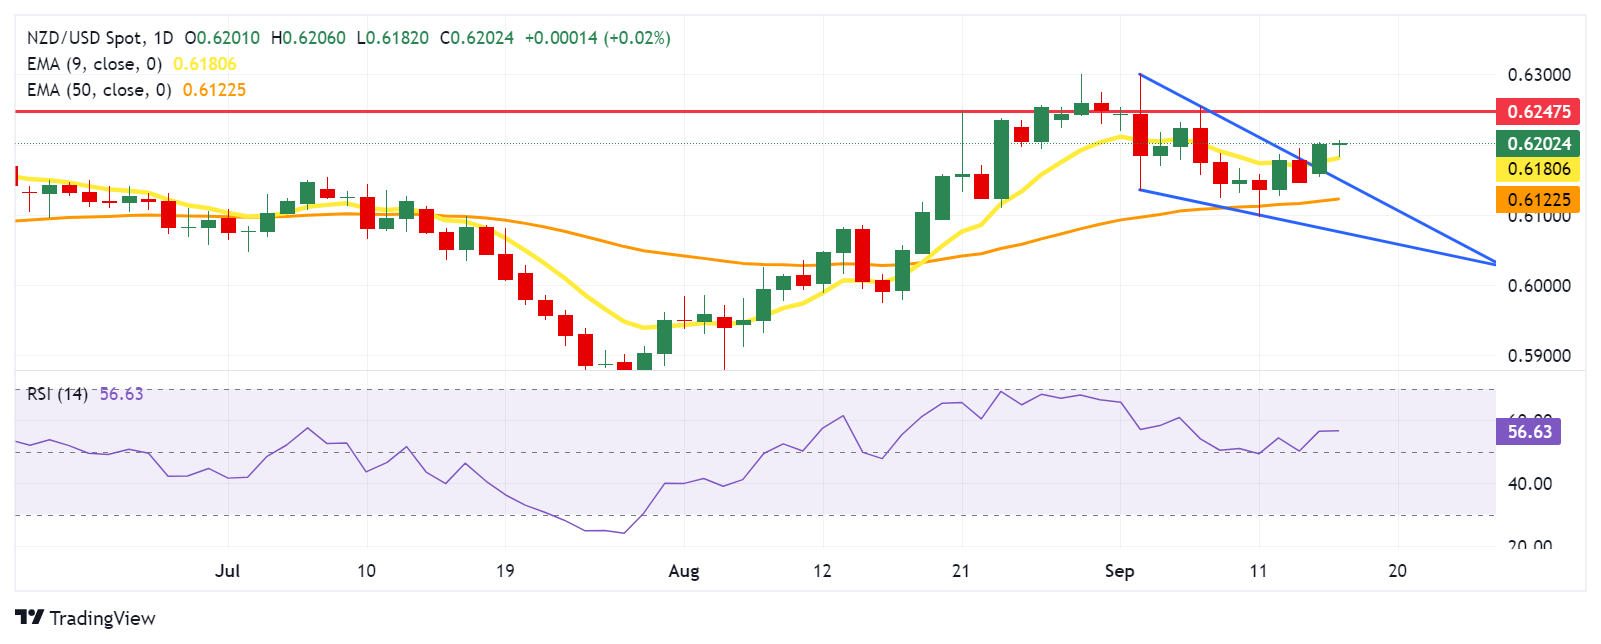
- The nine-day EMA at 0.6181 level appears as an immediate support, followed by the upper boundary of the descending wedge.
NZD/USD trades around 0.6200 during the European session on Tuesday. On the daily chart, the NZD/USD pair has breached the upper boundary of the descending wedge. This suggests that selling pressure is weakening, and it can signal a potential bullish reversal, especially if followed by an upward breakout.
The 14-day Relative Strength Index (RSI) remains above the 50 level, signaling a bullish trend. Furthermore, the nine-day Exponential Moving Average (EMA) is above the 14-day EMA, indicating that the NZD/USD pair is experiencing short-term upward momentum and is expected to continue its rise.
On the upside, the NZD/USD pair seems to explore the region around its seven-month high of 0.6247 recorded on August 21. A break above this level could drive the pair toward the psychological level of 0.6300.
In terms of support, the NZD/USD pair may test the immediate nine-day EMA at 0.6181 level, followed by the upper boundary of the descending wedge at 0.6150 level. A return to the descending wedge may reinforce the bearish bias and put pressure on the pair to test the 50-day EMA at the 0.6122 level, followed by the lower boundary of the descending wedge at the 0.6080 level.
NZD/USD: Daily Chart
New Zealand Dollar PRICE Today
The table below shows the percentage change of New Zealand Dollar (NZD) against listed major currencies today. New Zealand Dollar was the strongest against the US Dollar.
| USD | EUR | GBP | JPY | CAD | AUD | NZD | CHF | |
|---|---|---|---|---|---|---|---|---|
| USD | -0.03% | -0.01% | 0.00% | -0.01% | -0.15% | -0.05% | -0.16% | |
| EUR | 0.03% | 0.02% | 0.02% | -0.01% | -0.14% | -0.03% | -0.12% | |
| GBP | 0.00% | -0.02% | 0.00% | 0.00% | -0.16% | -0.04% | -0.18% | |
| JPY | 0.00% | -0.02% | 0.00% | -0.01% | -0.15% | -0.05% | -0.19% | |
| CAD | 0.00% | 0.01% | -0.00% | 0.01% | -0.14% | -0.03% | -0.18% | |
| AUD | 0.15% | 0.14% | 0.16% | 0.15% | 0.14% | 0.10% | -0.05% | |
| NZD | 0.05% | 0.03% | 0.04% | 0.05% | 0.03% | -0.10% | -0.14% | |
| CHF | 0.16% | 0.12% | 0.18% | 0.19% | 0.18% | 0.05% | 0.14% |
The heat map shows percentage changes of major currencies against each other. The base currency is picked from the left column, while the quote currency is picked from the top row. For example, if you pick the New Zealand Dollar from the left column and move along the horizontal line to the US Dollar, the percentage change displayed in the box will represent NZD (base)/USD (quote).


© 2000-2026. Bản quyền Teletrade.
Trang web này được quản lý bởi Teletrade D.J. LLC 2351 LLC 2022 (Euro House, Richmond Hill Road, Kingstown, VC0100, St. Vincent and the Grenadines).
Thông tin trên trang web không phải là cơ sở để đưa ra quyết định đầu tư và chỉ được cung cấp cho mục đích làm quen.
Giao dịch trên thị trường tài chính (đặc biệt là giao dịch sử dụng các công cụ biên) mở ra những cơ hội lớn và tạo điều kiện cho các nhà đầu tư sẵn sàng mạo hiểm để thu lợi nhuận, tuy nhiên nó mang trong mình nguy cơ rủi ro khá cao. Chính vì vậy trước khi tiến hành giao dịch cần phải xem xét mọi mặt vấn đề chấp nhận tiến hành giao dịch cụ thể xét theo quan điểm của nguồn lực tài chính sẵn có và mức độ am hiểu thị trường tài chính.
Sử dụng thông tin: sử dụng toàn bộ hay riêng biệt các dữ liệu trên trang web của công ty TeleTrade như một nguồn cung cấp thông tin nhất định. Việc sử dụng tư liệu từ trang web cần kèm theo liên kết đến trang teletrade.vn. Việc tự động thu thập số liệu cũng như thông tin từ trang web TeleTrade đều không được phép.
Xin vui lòng liên hệ với pr@teletrade.global nếu có câu hỏi.
ngân hàng