- Phân tích
- Tin tức và các công cụ
- Tin tức thị trường
- US Dollar Index Price Forecast: Flashing signs the trend could be changing
US Dollar Index Price Forecast: Flashing signs the trend could be changing
- The US Dollar Index is flashing signs it could be changing trend and moving higher.
- The weekly and daily charts are showing bullish Japanese candlestick patterns after the recent touchdown on support at 100.
- The 4-hour chart is showing the formation of a possible new short-term uptrend.
The US Dollar Index (DXY) has bounced off support at the floor of its multi-year range and formed some reversal patterns which indicate the possibility it may be reversing the bearish move down from the July highs. Overall, however, it is still a little too early to say for sure and there remains a risk bears could take hold of the reins again and push price back down.
US Dollar Index Weekly Chart
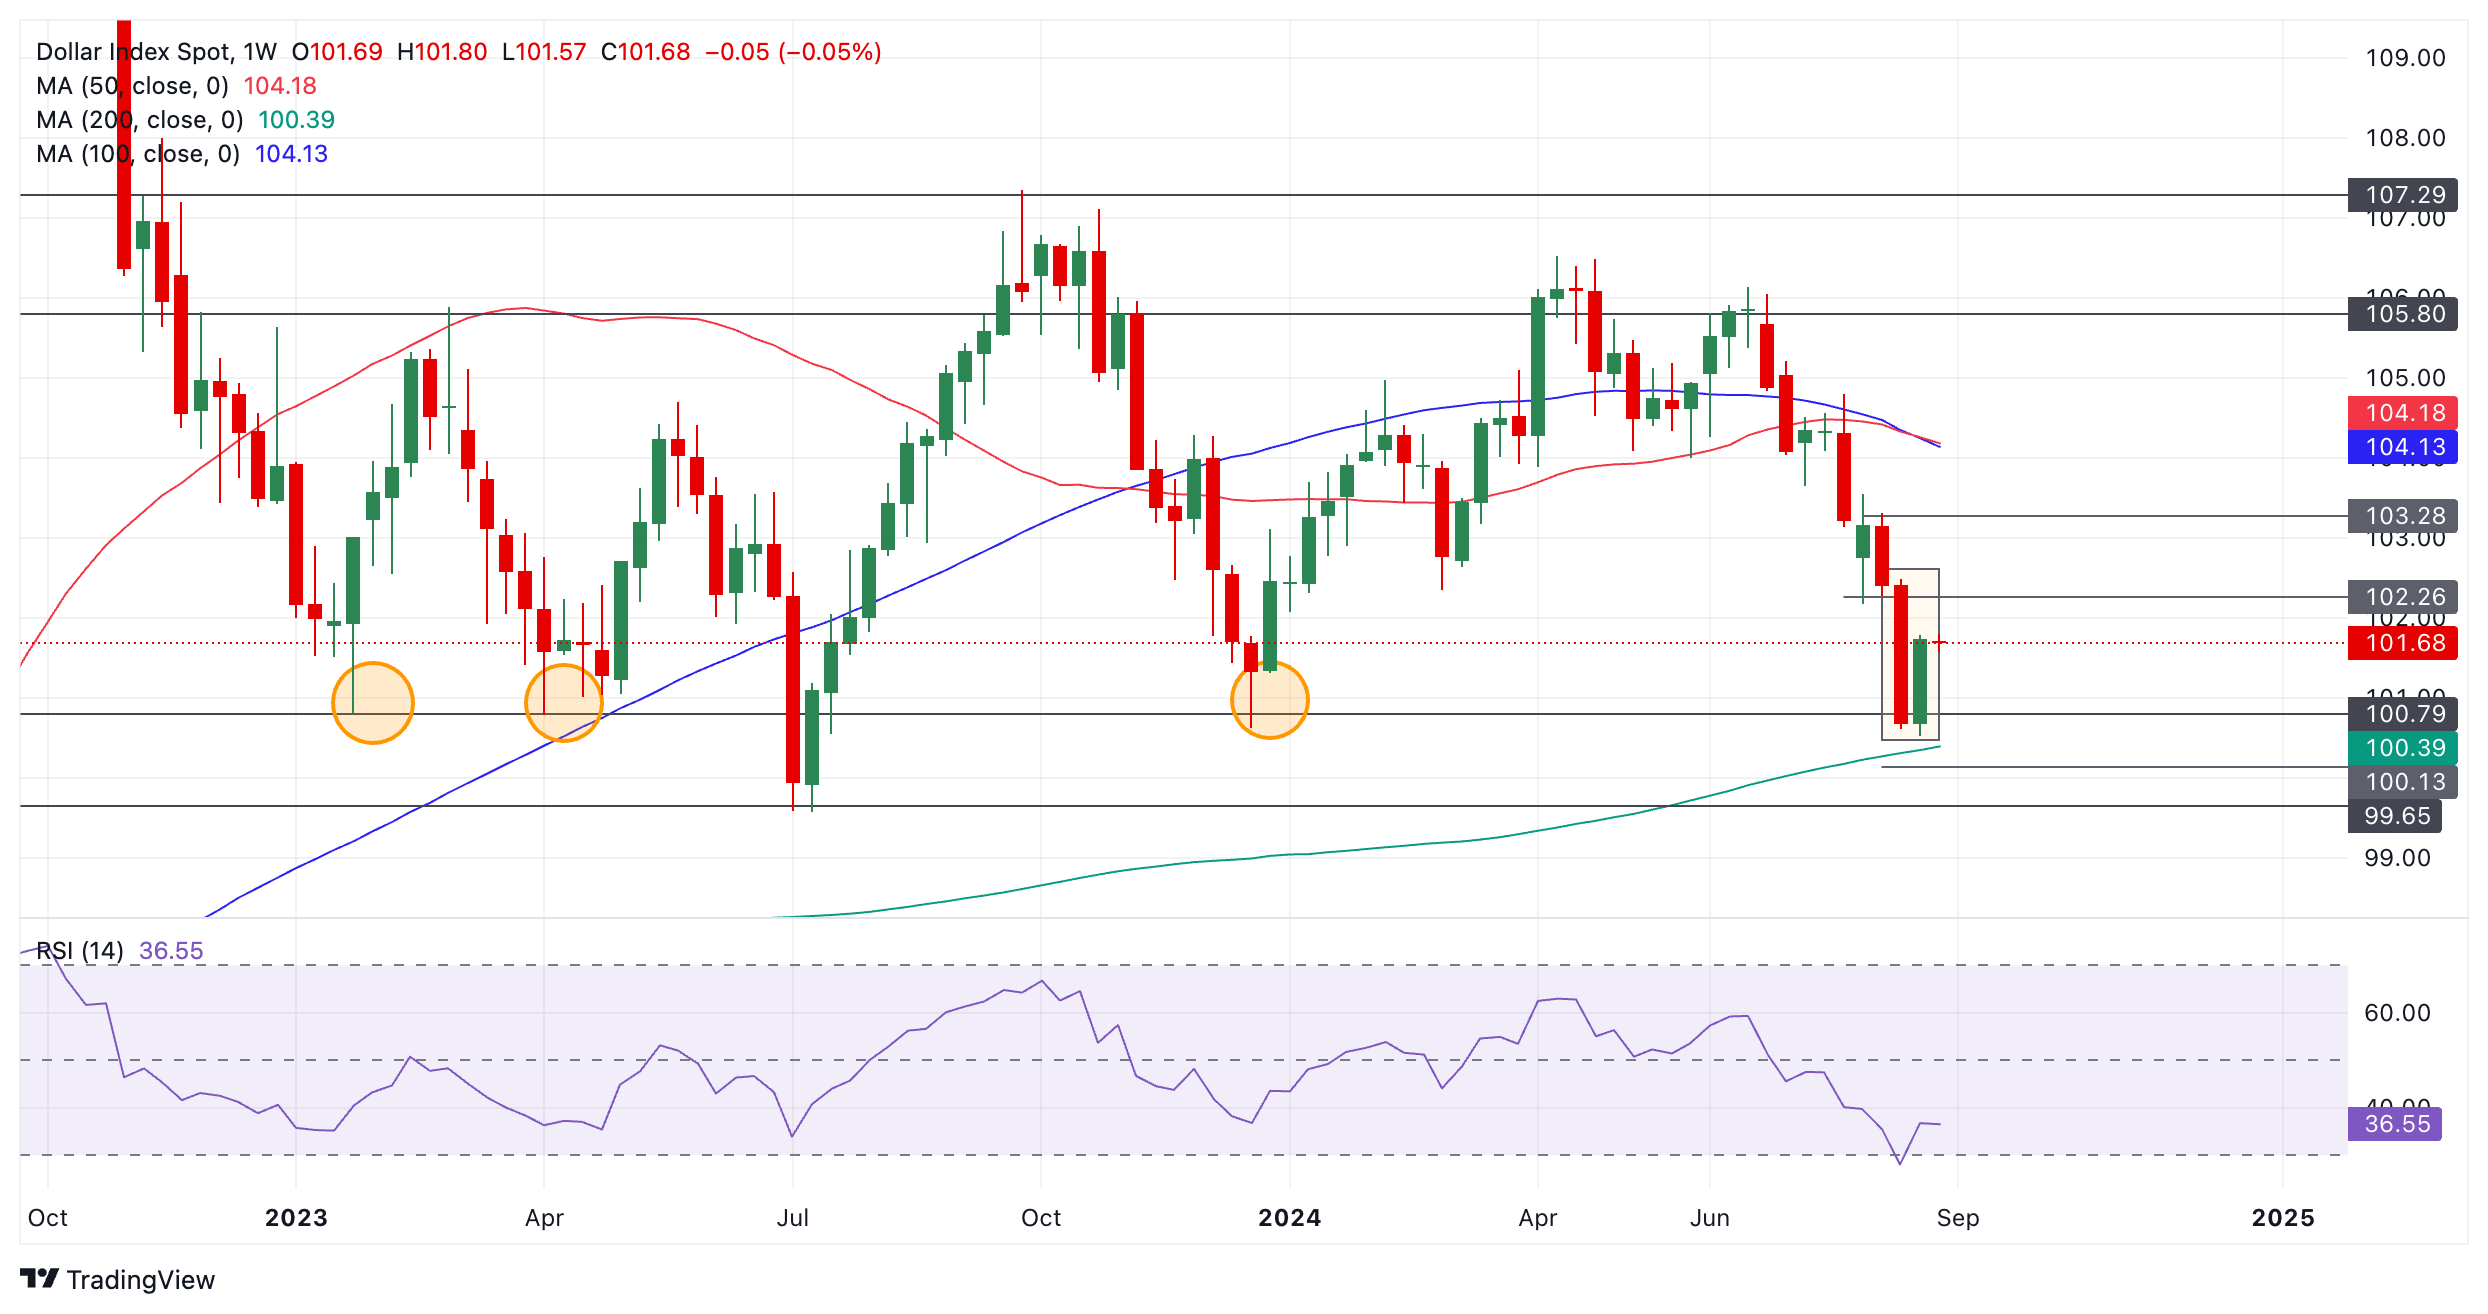
DXY has formed an unconfirmed bullish Piercing Line Japanese candlestick pattern (shaded rectangle) on the weekly chart at a historic support level in the 100s. This level has been tested multiple times in the past (orange bubbles).
The Piercing Line pattern forms after a down move when a red candlestick is followed by a green candlestick that closes above the midpoint of the initial red candle. It is a sign of a bullish reversal. For confirmation, however, the pattern should be followed by another green candlestick which cannot be verified until the end of the current week.
The Relative Strength Index (RSI) momentum indicator exited oversold last week providing a buy signal and adding further evidence to the possibility of a bullish recovery evolving.
Dollar Index Daily Chart
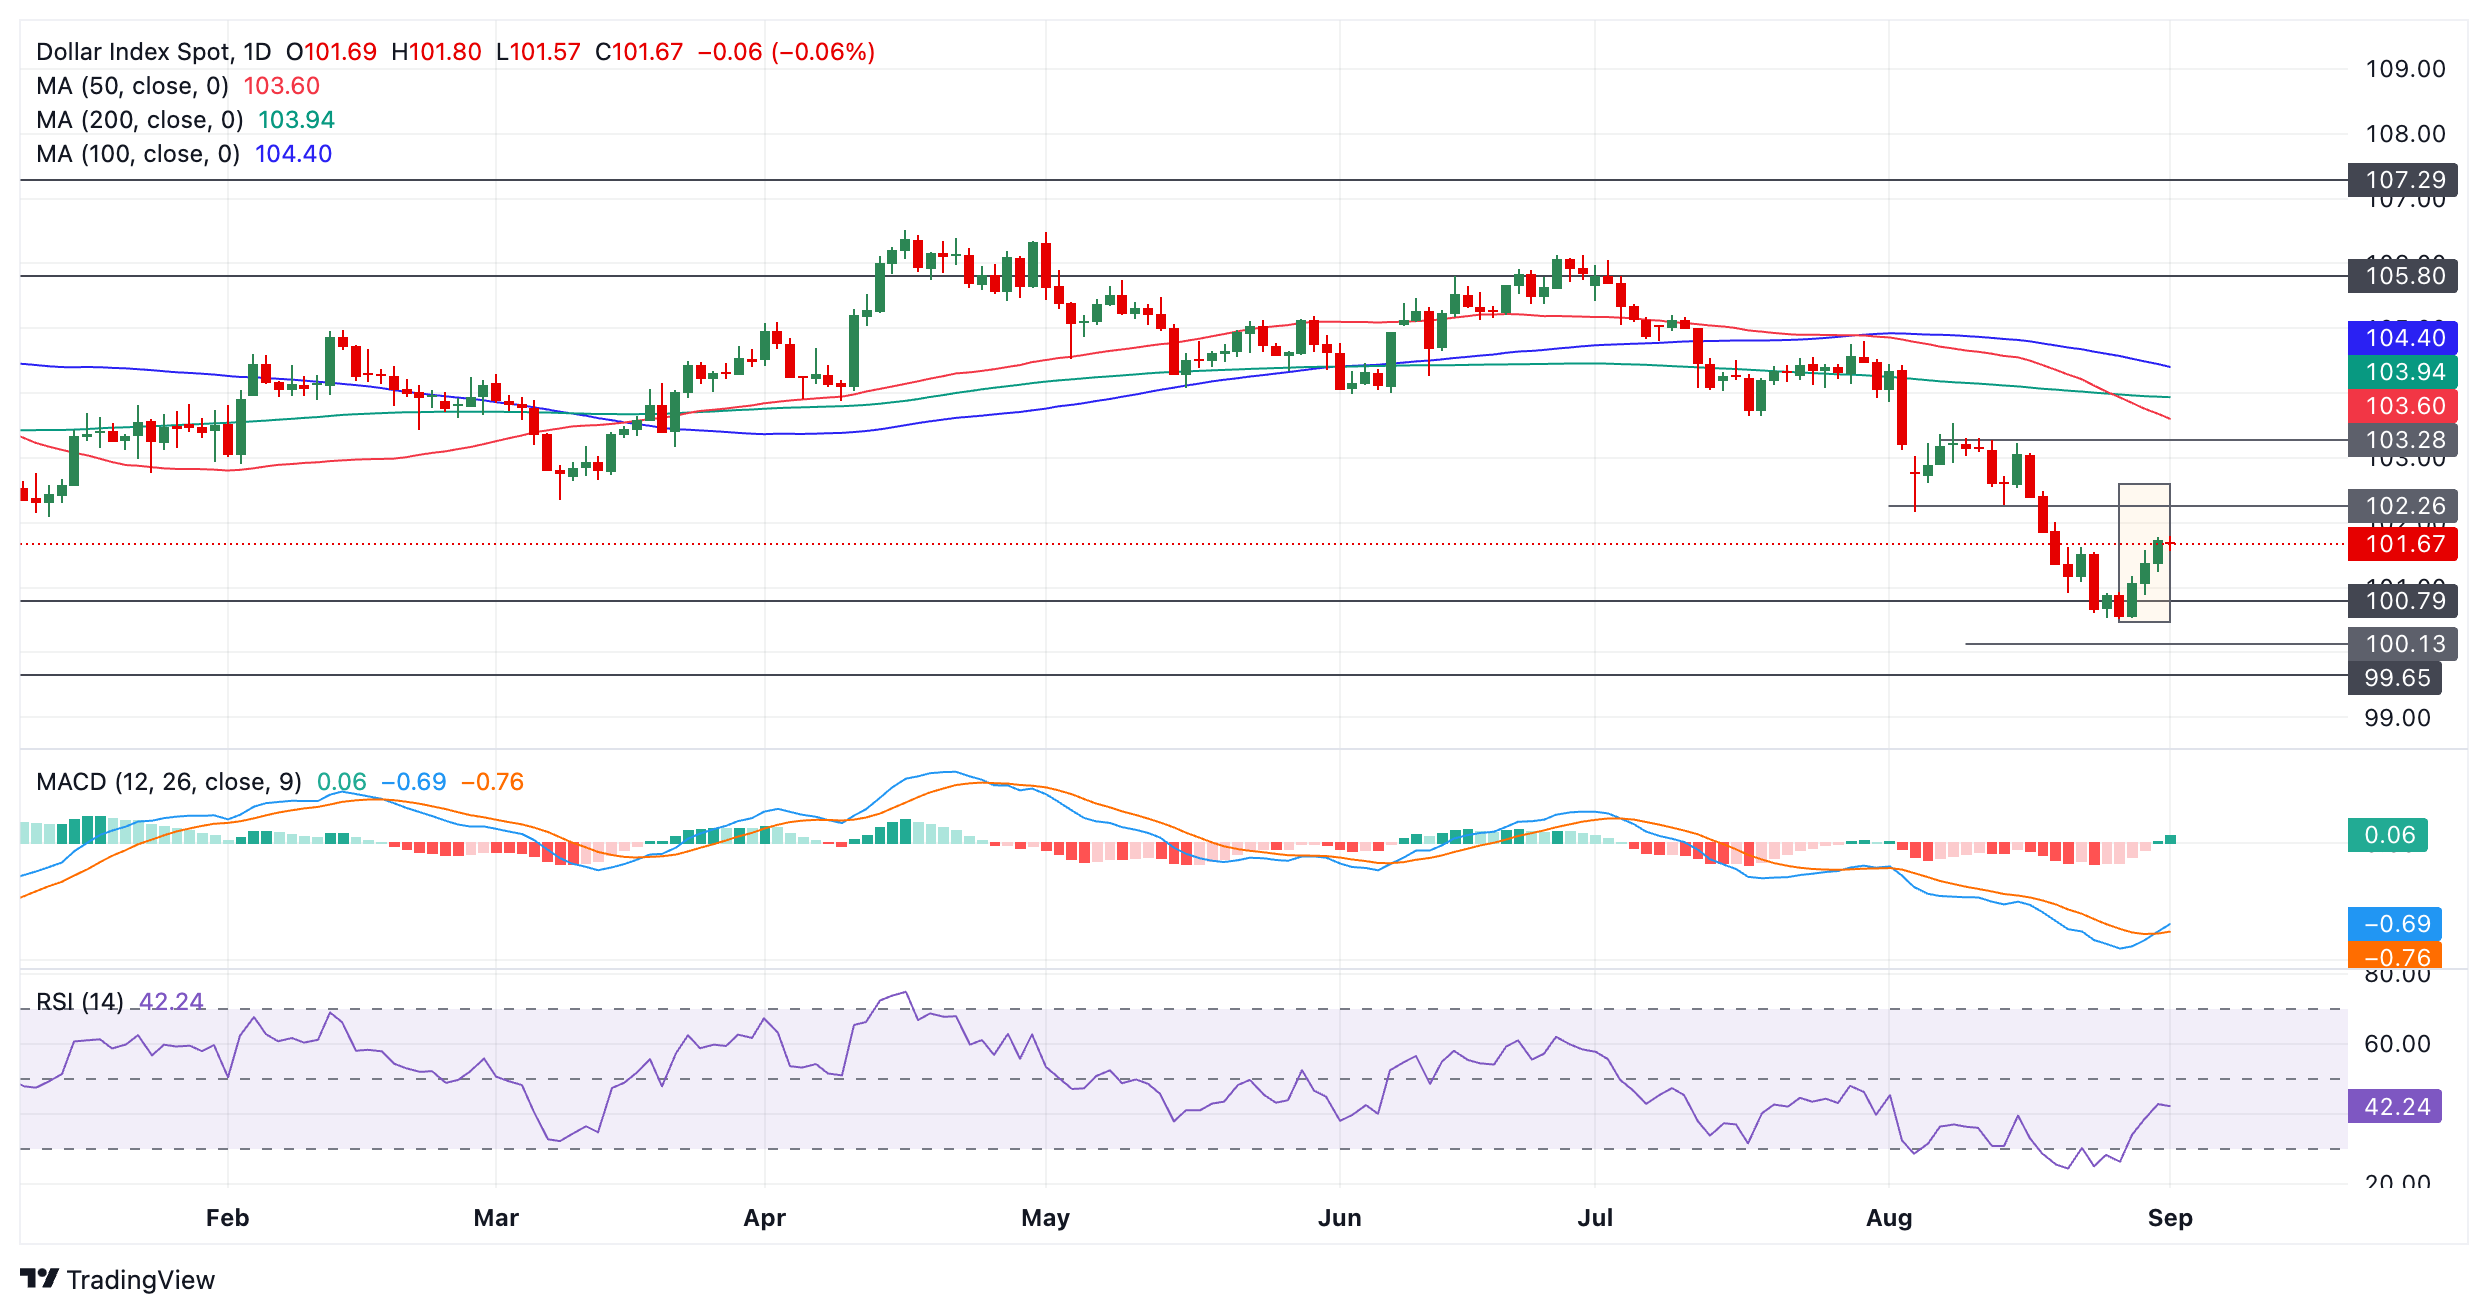
The DXY daily chart is showing that a Three White Soldiers Japanese candlestick pattern has formed during the recovery over the last three days. Such a pattern forms after a market bottom when three rising green candlesticks form in a row that are of a similar size. It is a bullish reversal sign.
The Moving Average Convergence Divergence (MACD) momentum oscillator has crossed above its red signal line giving further evidence to the bullish hypothesis.
The RSI also recently exited oversold, providing a buy signal.
Dollar Index 4-hour Chart
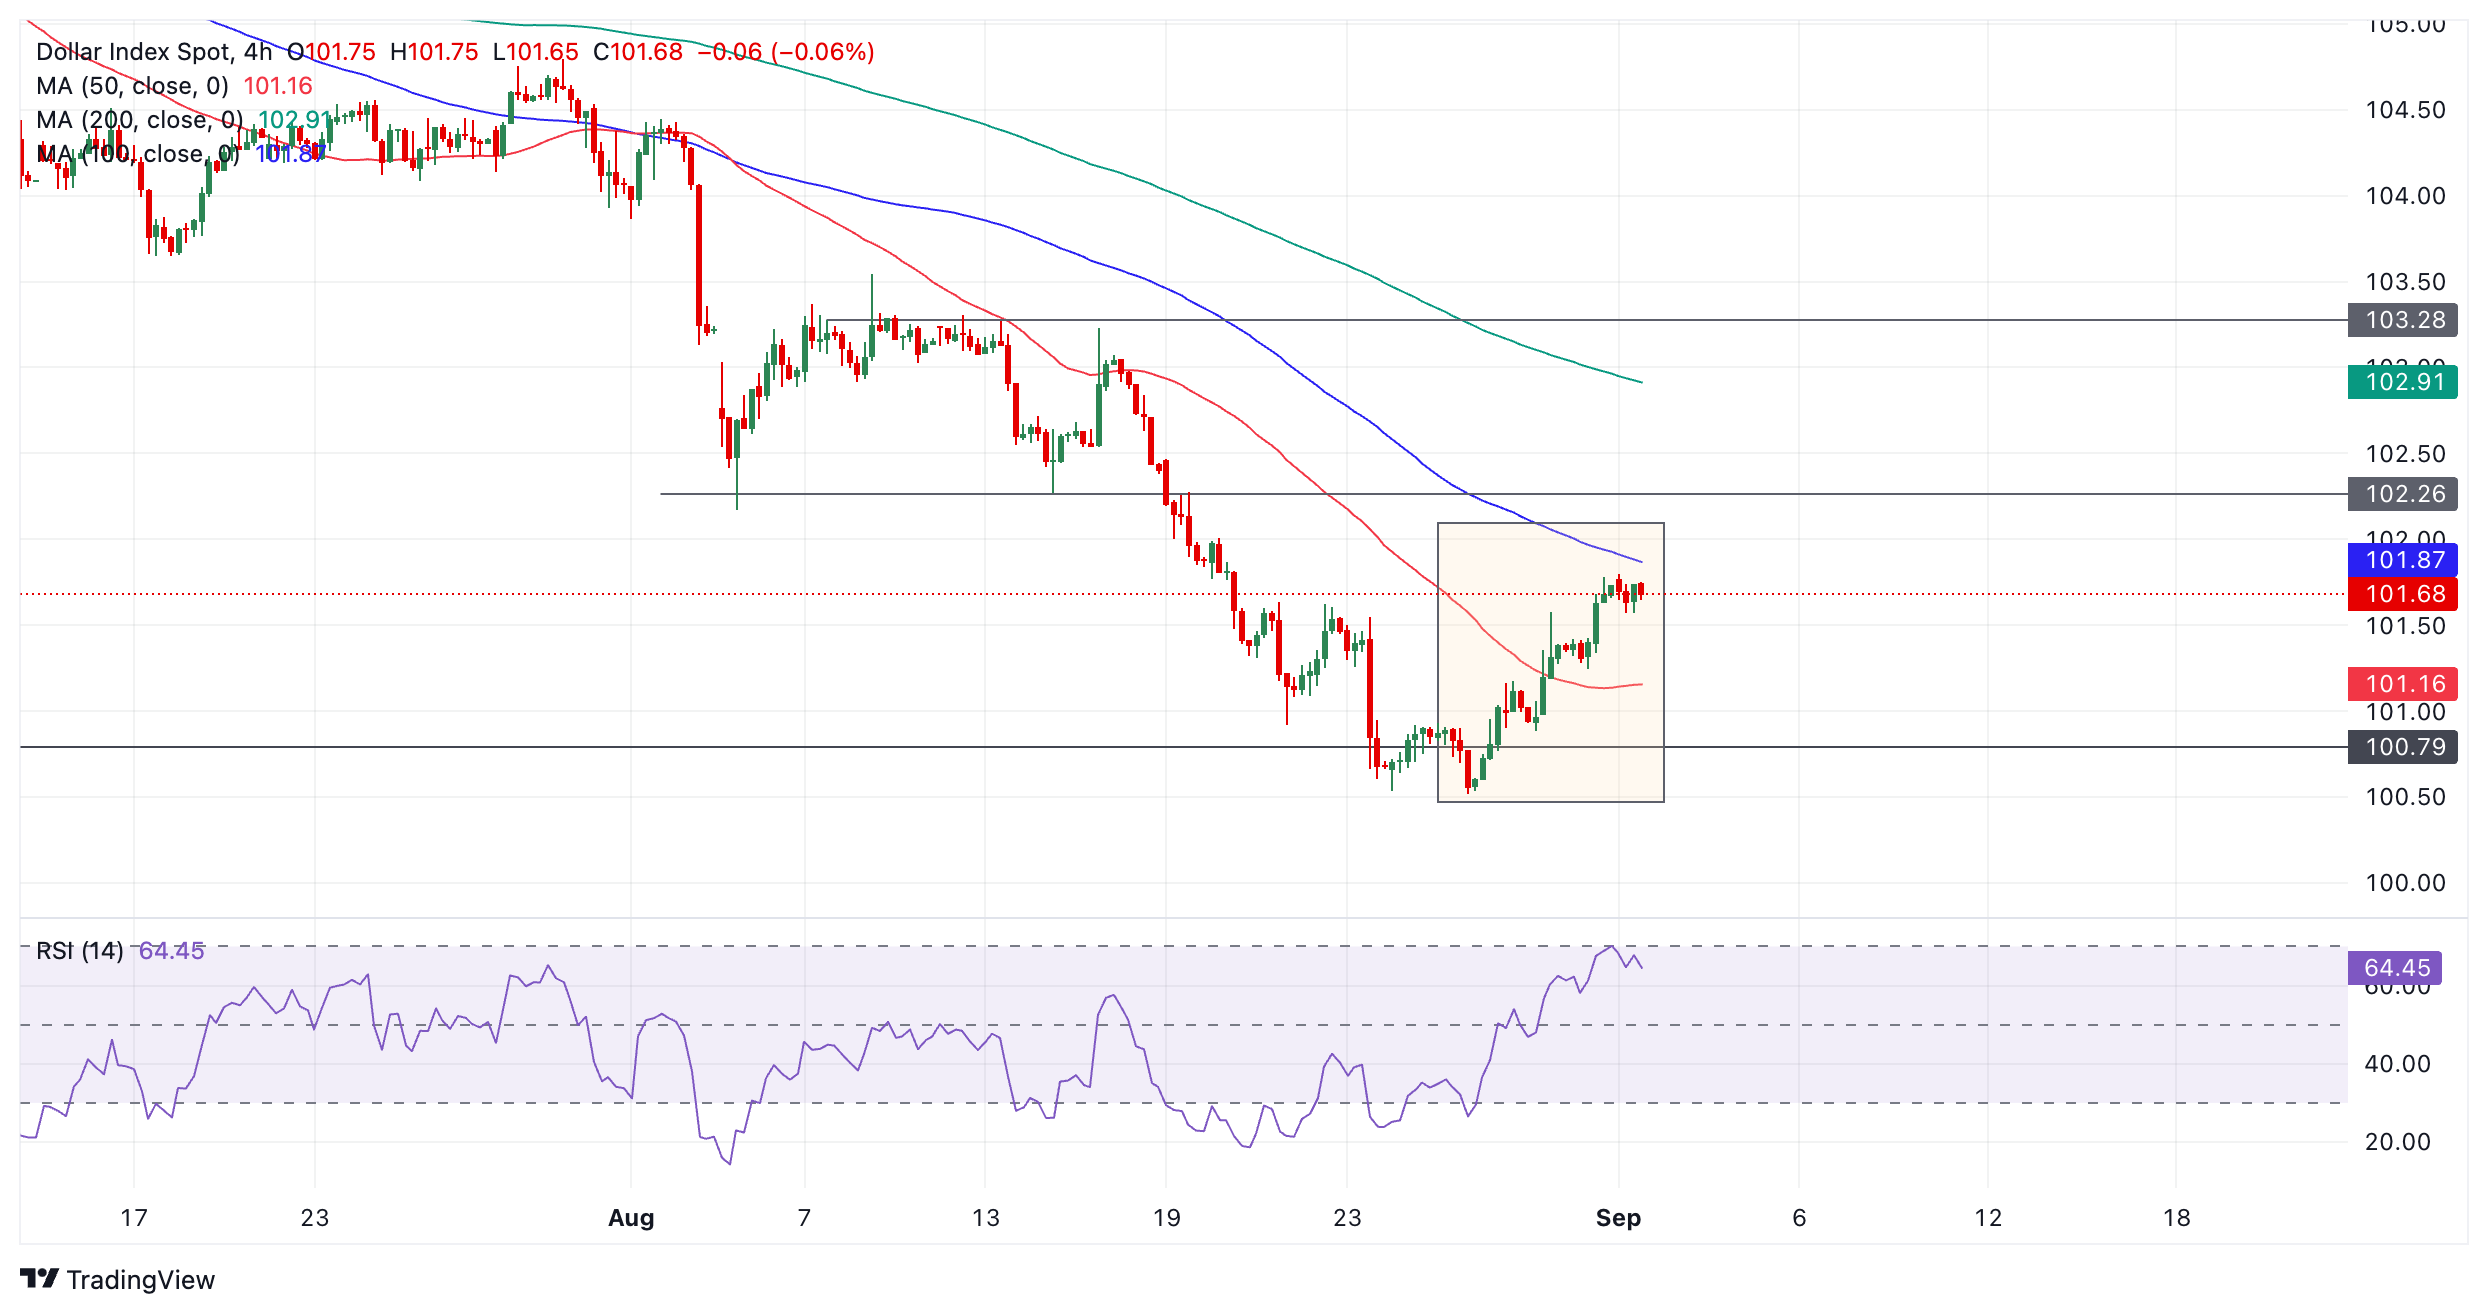
The 4-hour chart of DXY is showing the possible formation of a tender, new uptrend (shaded box). The sequence of peaks and troughs is now rising suggesting the short-term trend may be bullish. DXY has also broken above the key August 22 high.
Given “the trend is your friend” this could indicate the evolution of higher highs, with the next target at the 102.26 level (August 14 low).
The RSI has just exited overbought, however, raising the risk of a deeper pull back evolving.


© 2000-2026. Bản quyền Teletrade.
Trang web này được quản lý bởi Teletrade D.J. LLC 2351 LLC 2022 (Euro House, Richmond Hill Road, Kingstown, VC0100, St. Vincent and the Grenadines).
Thông tin trên trang web không phải là cơ sở để đưa ra quyết định đầu tư và chỉ được cung cấp cho mục đích làm quen.
Giao dịch trên thị trường tài chính (đặc biệt là giao dịch sử dụng các công cụ biên) mở ra những cơ hội lớn và tạo điều kiện cho các nhà đầu tư sẵn sàng mạo hiểm để thu lợi nhuận, tuy nhiên nó mang trong mình nguy cơ rủi ro khá cao. Chính vì vậy trước khi tiến hành giao dịch cần phải xem xét mọi mặt vấn đề chấp nhận tiến hành giao dịch cụ thể xét theo quan điểm của nguồn lực tài chính sẵn có và mức độ am hiểu thị trường tài chính.
Sử dụng thông tin: sử dụng toàn bộ hay riêng biệt các dữ liệu trên trang web của công ty TeleTrade như một nguồn cung cấp thông tin nhất định. Việc sử dụng tư liệu từ trang web cần kèm theo liên kết đến trang teletrade.vn. Việc tự động thu thập số liệu cũng như thông tin từ trang web TeleTrade đều không được phép.
Xin vui lòng liên hệ với pr@teletrade.global nếu có câu hỏi.
ngân hàng