- Phân tích
- Tin tức và các công cụ
- Tin tức thị trường
- US Dollar Index Price Forecast: Finds floor at long-term historical support level
US Dollar Index Price Forecast: Finds floor at long-term historical support level
- The US Dollar Index has touched down on a key support level at the 100 mark.
- This has historically provided a springboard for a recovery, however, it is too early to say whether history will repeat itself.
The US Dollar Index (DXY) is in a medium and long-term sideways trend within a multi-year range. Since late July it has been steadily unfolding a down leg within that range from the ceiling at around 105, to the range floor at the 100 level.
100 is important. Apart from being a key psychological level, 100 is also a major historical support level which has provided a safety net to falling prices on three prior occasions since 2023 (circled below). The question is, will 100 come to the rescue again on this occasion?
US Dollar Index Daily Chart
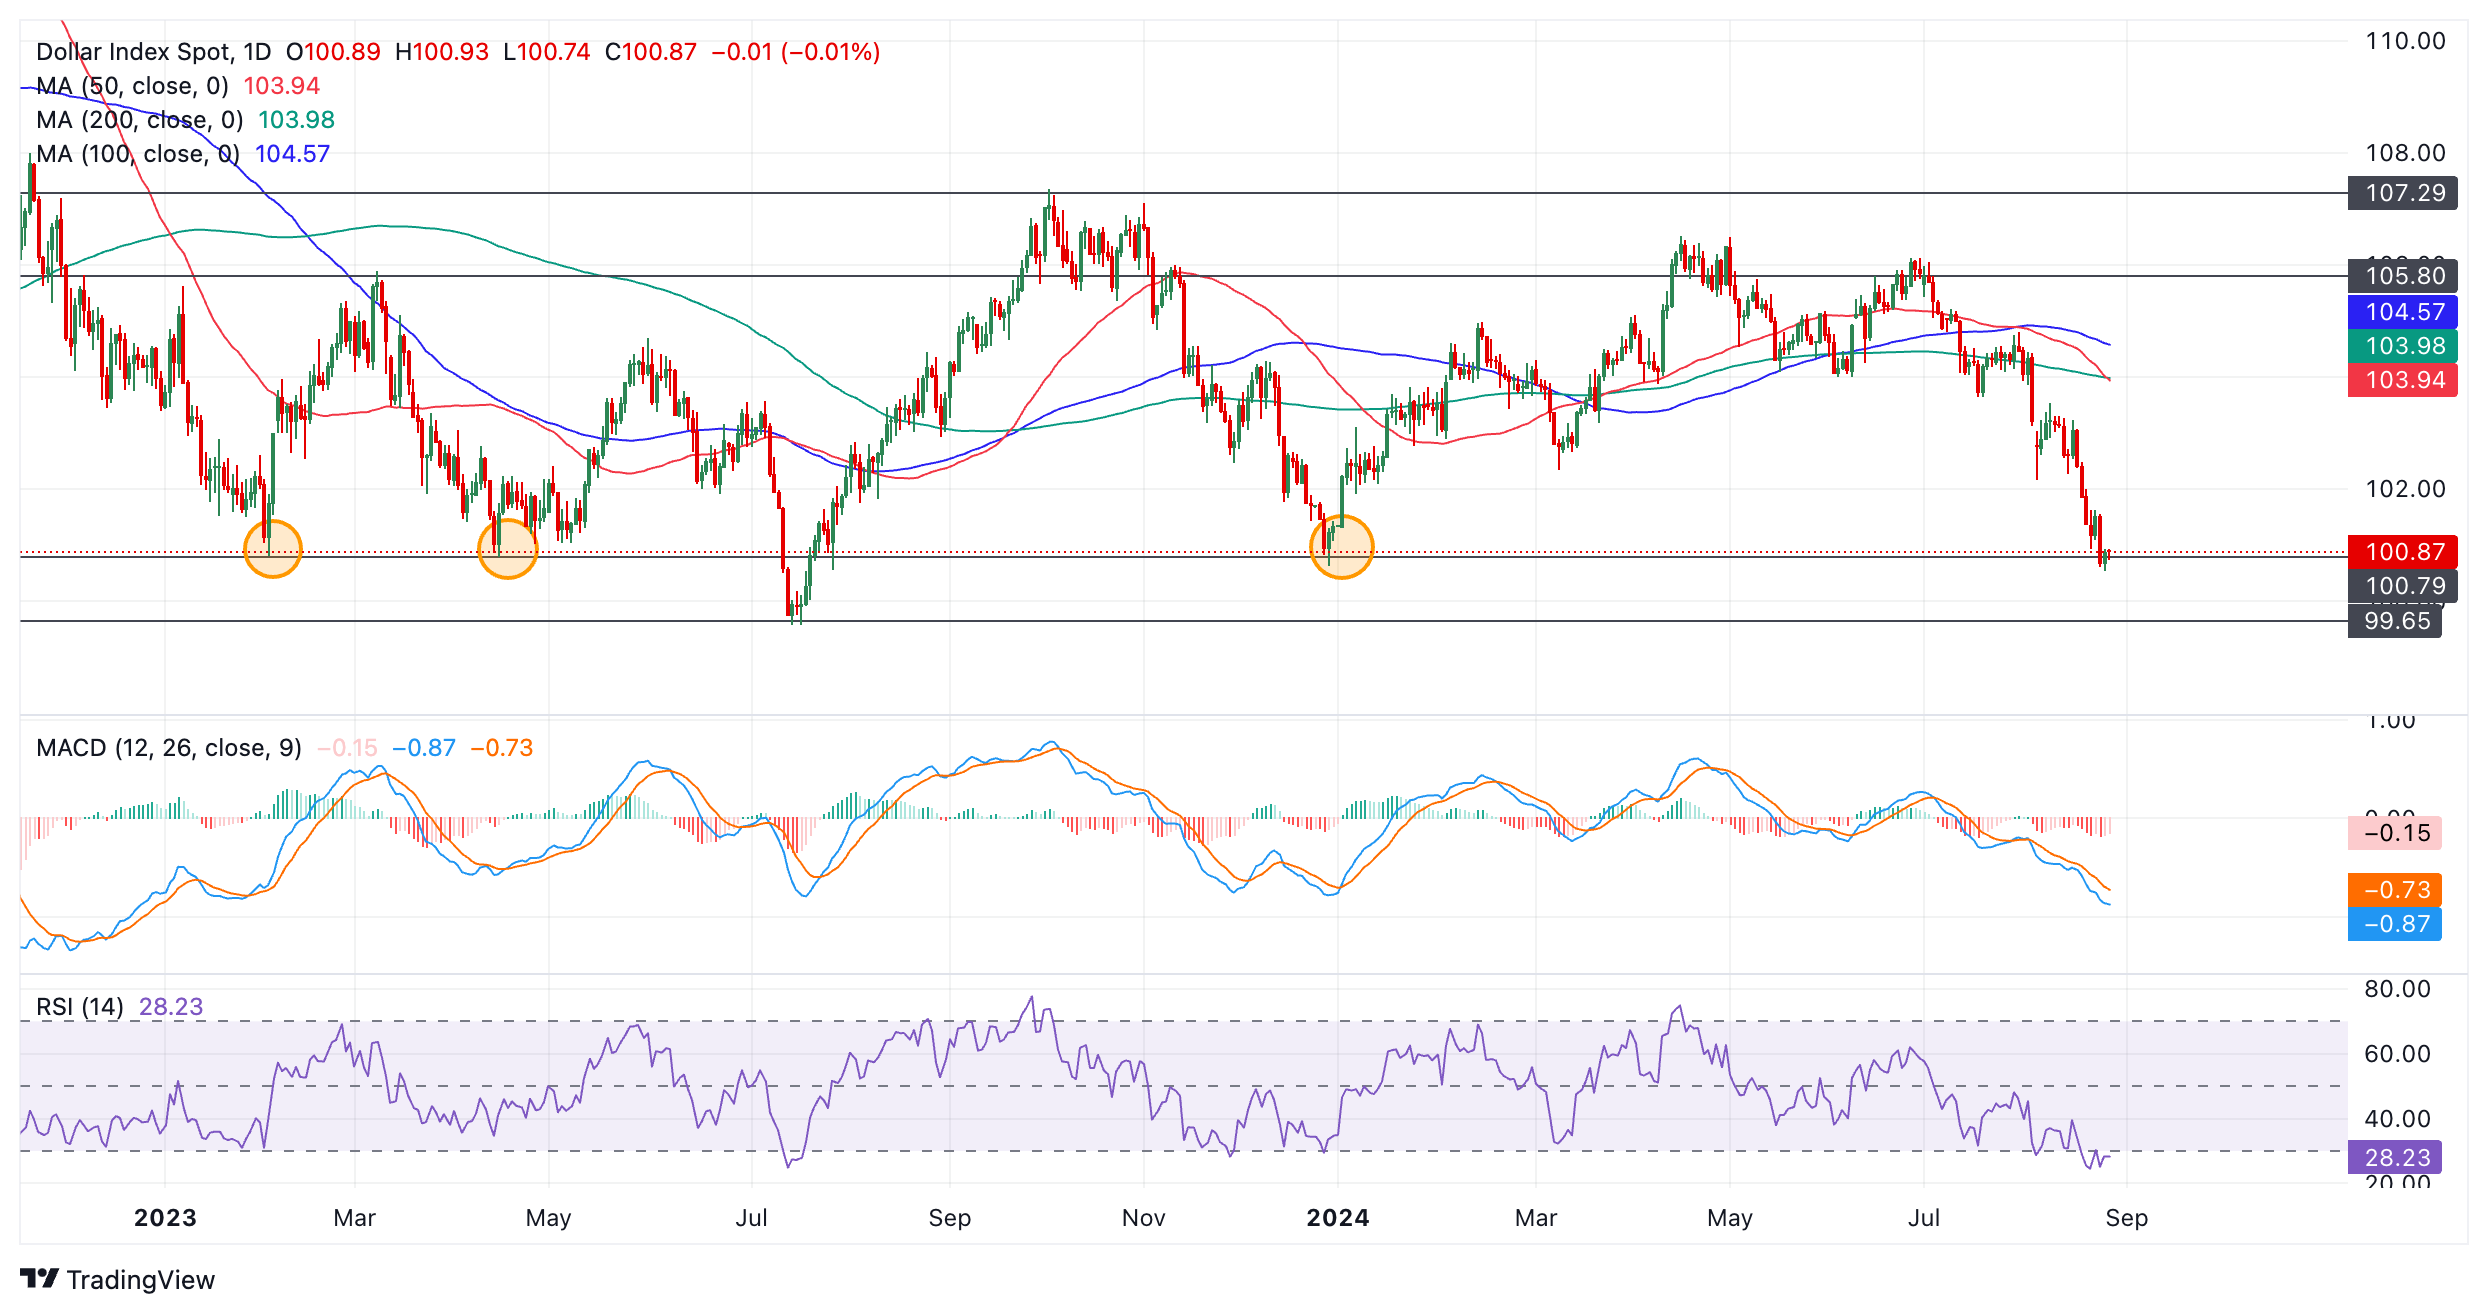
Price action is still bearish and there are no strong bullish reversal patterns forming – neither of the shape or the candlestick variety. This suggests a risk of more downside. A continuation south would probably see DXY reach the next support level at the 99.57, the July 2023 low. This is the lowest floor of the range – a decisive break below there would be a very bearish sign.
The Relative Strength Index (RSI) momentum indicator is oversold on both the daily chart and weekly chart (not shown). This suggests prices are overextended to the downside and there is a greater risk of a pull back occurring.
However, RSI has not yet exited the oversold zone, a necessary prerequisite for a buy signal. As things stand, the fact the RSI is oversold is merely a warning for bears not to add to their short positions, it would have to fully rise out of oversold to provide a reversal signal.
The Moving Average Convergence Divergence (MACD) momentum oscillator has not crossed above its red signal line yet either. This too would be required to provide a buy signal.
To conclude, there is a risk that although the US Dollar Index has reached a historic low it could simply continue falling unless price action forms a reversal pattern or momentum indicators provide firm buy signals.


© 2000-2026. Bản quyền Teletrade.
Trang web này được quản lý bởi Teletrade D.J. LLC 2351 LLC 2022 (Euro House, Richmond Hill Road, Kingstown, VC0100, St. Vincent and the Grenadines).
Thông tin trên trang web không phải là cơ sở để đưa ra quyết định đầu tư và chỉ được cung cấp cho mục đích làm quen.
Giao dịch trên thị trường tài chính (đặc biệt là giao dịch sử dụng các công cụ biên) mở ra những cơ hội lớn và tạo điều kiện cho các nhà đầu tư sẵn sàng mạo hiểm để thu lợi nhuận, tuy nhiên nó mang trong mình nguy cơ rủi ro khá cao. Chính vì vậy trước khi tiến hành giao dịch cần phải xem xét mọi mặt vấn đề chấp nhận tiến hành giao dịch cụ thể xét theo quan điểm của nguồn lực tài chính sẵn có và mức độ am hiểu thị trường tài chính.
Sử dụng thông tin: sử dụng toàn bộ hay riêng biệt các dữ liệu trên trang web của công ty TeleTrade như một nguồn cung cấp thông tin nhất định. Việc sử dụng tư liệu từ trang web cần kèm theo liên kết đến trang teletrade.vn. Việc tự động thu thập số liệu cũng như thông tin từ trang web TeleTrade đều không được phép.
Xin vui lòng liên hệ với pr@teletrade.global nếu có câu hỏi.
ngân hàng