- Phân tích
- Tin tức và các công cụ
- Tin tức thị trường
- USD/JPY Price Forecast: Edges up amid rising US yields, yet remains bearish
USD/JPY Price Forecast: Edges up amid rising US yields, yet remains bearish
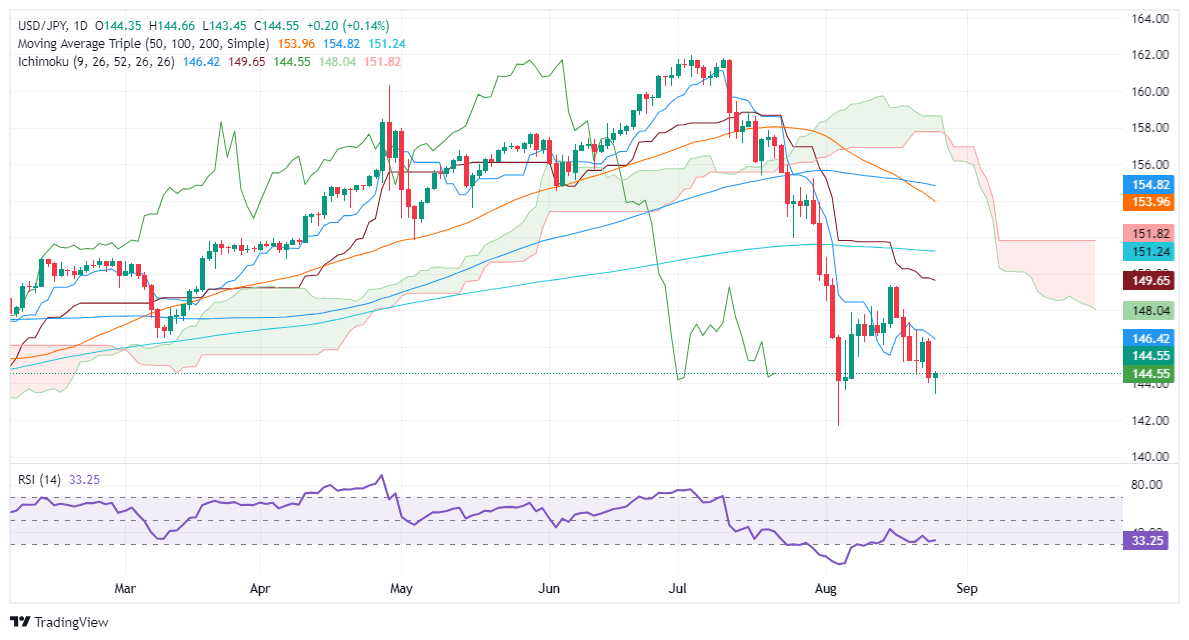
- USD/JPY stays under Ichimoku Cloud and 200-DMA at 151.22, maintaining downtrend with easing selling pressure.
- RSI trends upward, suggesting a potential short-term rally if USD/JPY surpasses 145.00.
- Resistance levels at 146.42 (Tenkan-Sen), 147.91 (Senkou Span A), and 149.39 (August 15 high).
- Below 144.00, key support at 141.69; further drop could target psychological 140.00 level.
The Japanese Yen (JPY) lost ground against the Greenback on Monday as the USD/JPY pair edged up 0.13% amid an uptick in US Treasury bond yields. At the time of writing, the pair was at 144.59 after bouncing off daily lows of 143.44.
USD/JPY Price Forecast: Technical outlook
The USD/JPY downtrend is intact as the exchange rate remains below the Ichimoku Cloud and the 200-day moving average (DMA) at 151.22. Nevertheless, sellers are losing some momentum, as depicted by the Relative Strength Index (RSI), remaining bearish, yet aiming up. That could pave the way for a leg-up before testing lower prices.
If USD/JPY clears 145.00, the next resistance emerges at the Tenkan-Sen at 146.42, followed by the Senkou Span A at 147.91. Further upside is seen at the confluence of the Kijun-Sen and the August 15 daily high of 149.39.
Conversely, if USD/JPY slumps below the 144.00 figure and the pair could tumble towards the latest cycle low seen at 141.69, before challenging 140.00.
USD/JPY Price Action – Daily Chart
Japanese Yen PRICE Today
The table below shows the percentage change of Japanese Yen (JPY) against listed major currencies today. Japanese Yen was the strongest against the US Dollar.
| USD | EUR | GBP | JPY | CAD | AUD | NZD | CHF | |
|---|---|---|---|---|---|---|---|---|
| USD | -0.02% | 0.00% | 0.01% | -0.01% | 0.00% | -0.00% | -0.01% | |
| EUR | 0.02% | 0.03% | 0.03% | -0.00% | 0.04% | -0.01% | -0.01% | |
| GBP | -0.01% | -0.03% | 0.02% | 0.00% | -0.02% | -0.02% | -0.05% | |
| JPY | -0.01% | -0.03% | -0.02% | -0.06% | -0.02% | -0.05% | -0.02% | |
| CAD | 0.01% | 0.00% | -0.00% | 0.06% | 0.03% | 0.00% | -0.01% | |
| AUD | -0.01% | -0.04% | 0.02% | 0.02% | -0.03% | -0.04% | -0.02% | |
| NZD | 0.00% | 0.00% | 0.02% | 0.05% | -0.00% | 0.04% | -0.03% | |
| CHF | 0.01% | 0.01% | 0.05% | 0.02% | 0.00% | 0.02% | 0.03% |
The heat map shows percentage changes of major currencies against each other. The base currency is picked from the left column, while the quote currency is picked from the top row. For example, if you pick the Japanese Yen from the left column and move along the horizontal line to the US Dollar, the percentage change displayed in the box will represent JPY (base)/USD (quote).


© 2000-2026. Bản quyền Teletrade.
Trang web này được quản lý bởi Teletrade D.J. LLC 2351 LLC 2022 (Euro House, Richmond Hill Road, Kingstown, VC0100, St. Vincent and the Grenadines).
Thông tin trên trang web không phải là cơ sở để đưa ra quyết định đầu tư và chỉ được cung cấp cho mục đích làm quen.
Giao dịch trên thị trường tài chính (đặc biệt là giao dịch sử dụng các công cụ biên) mở ra những cơ hội lớn và tạo điều kiện cho các nhà đầu tư sẵn sàng mạo hiểm để thu lợi nhuận, tuy nhiên nó mang trong mình nguy cơ rủi ro khá cao. Chính vì vậy trước khi tiến hành giao dịch cần phải xem xét mọi mặt vấn đề chấp nhận tiến hành giao dịch cụ thể xét theo quan điểm của nguồn lực tài chính sẵn có và mức độ am hiểu thị trường tài chính.
Sử dụng thông tin: sử dụng toàn bộ hay riêng biệt các dữ liệu trên trang web của công ty TeleTrade như một nguồn cung cấp thông tin nhất định. Việc sử dụng tư liệu từ trang web cần kèm theo liên kết đến trang teletrade.vn. Việc tự động thu thập số liệu cũng như thông tin từ trang web TeleTrade đều không được phép.
Xin vui lòng liên hệ với pr@teletrade.global nếu có câu hỏi.
ngân hàng