- Phân tích
- Tin tức và các công cụ
- Tin tức thị trường
- EUR/GBP Price Analysis: Falls to cluster of major support levels and lower channel line
EUR/GBP Price Analysis: Falls to cluster of major support levels and lower channel line
- EUR/GBP has fallen to a cluster of support at the level of the lower trendline of its falling channel.
- There is a good chance the pair could find its feet and recover from this key technical level.
EUR/GBP continues descending within a falling channel, clearly visible on the 4-hour chart below.
The declining sequence of peaks and troughs supposes the pair is in a short-term downtrend, and given “the trend is your friend” this biases prices to further weakness.
However, even strongly trending prices experience pull backs from time to time, and EUR/GBP has reached the lower channel line of the channel where previously it found support and began counter-trend reactions back up inside the channel. There is a chance the same may happen again.
EUR/GBP 4-hour Chart
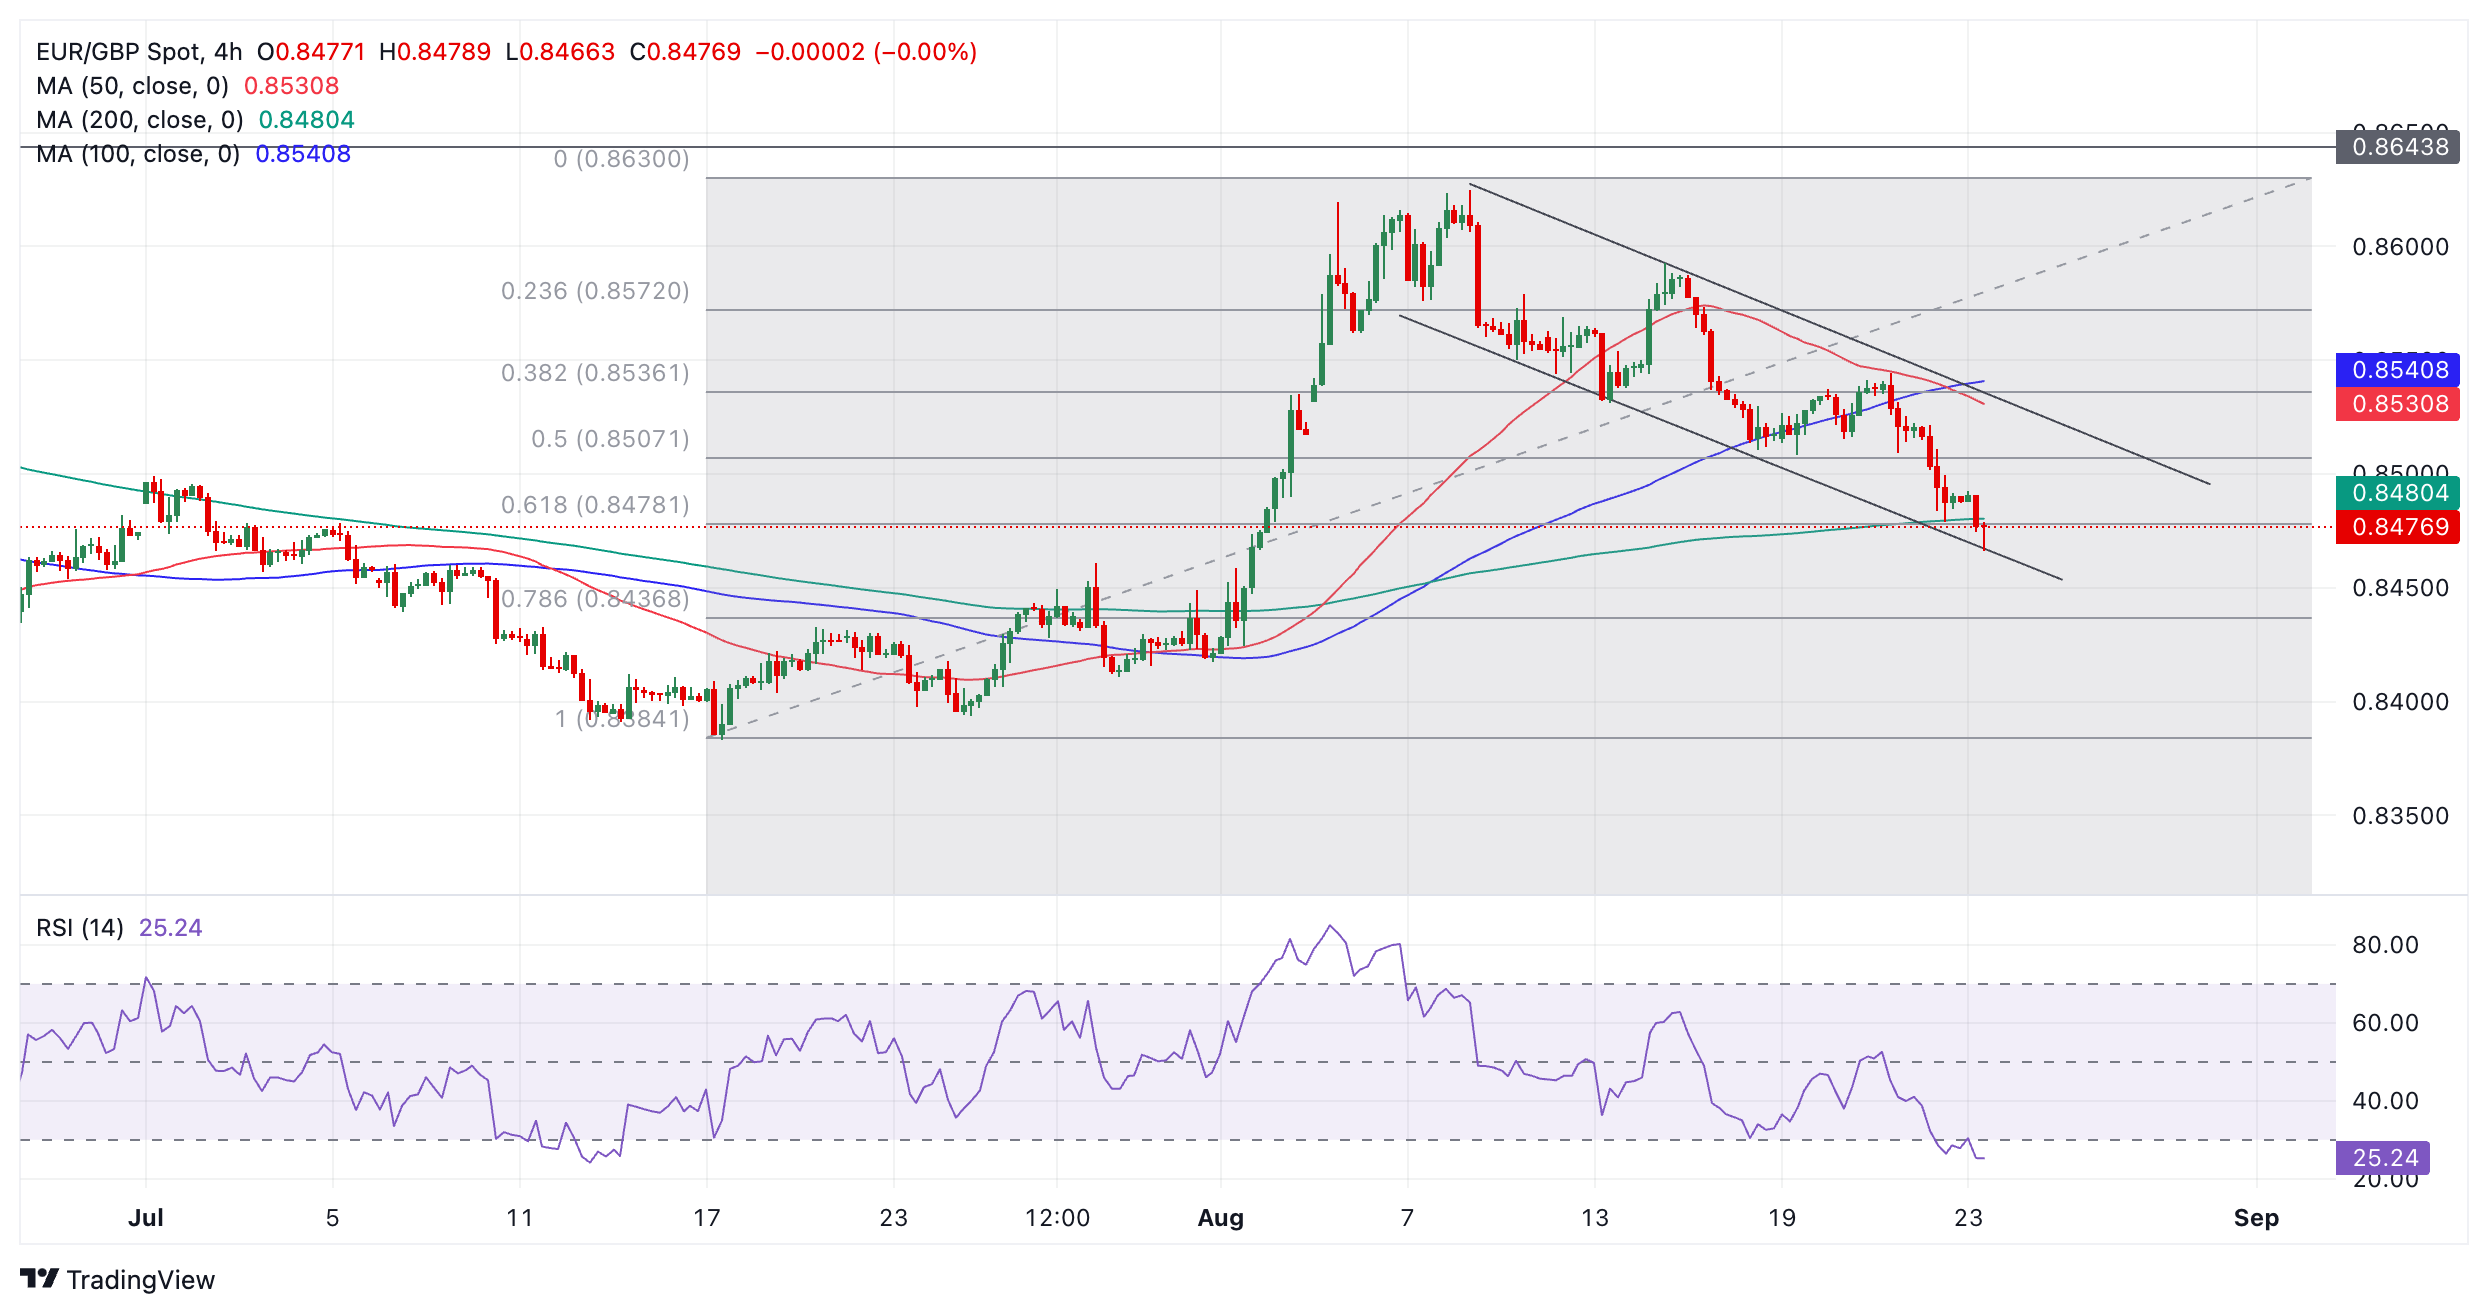
Further supporting the pull-back hypothesis is the fact the Relative Strength Index (RSI) is heavily oversold. Although this alone is not enough to signal a recovery it does caution traders not to add to their short positions. Those wishing to trade the counter-trend rally should wait for RSI to exit oversold and re-enter neutral territory before placing buy orders.
EUR/GBP is also testing both the 200-period Simple Moving Average (SMA) and the 0.618 Fibonacci retracement level of the late-June and early-August rally at 0.8478. On the daily chart (not shown) it is also testing the key 50-day SMA. This confluence of support further increases the probability of a recovery unfolding.
The price itself is forming what might end up as a bullish Hammer Japanese candlestick reversal pattern on the current 4-hour bar, however, until the period ends it is not possible to be certain. For such patterns to gain confirmation they also need to be followed by a bullish green candle.
It is possible – given the short-term downtrend – that EUR/GBP could break below the channel line and continue falling. A decisive break below the lower channel line would validate such a breakout. It would be a very bearish sign but unlikely to last as such moves are often signs of exhaustion.
A decisive break would be one accompanied by a longer-than-average red candlestick which closed below the channel line near its low, or three red candlesticks in a row that broke below the level.
The long-term trend (weekly chart) is still bearish whilst the medium-term trend is bullish.


© 2000-2026. Bản quyền Teletrade.
Trang web này được quản lý bởi Teletrade D.J. LLC 2351 LLC 2022 (Euro House, Richmond Hill Road, Kingstown, VC0100, St. Vincent and the Grenadines).
Thông tin trên trang web không phải là cơ sở để đưa ra quyết định đầu tư và chỉ được cung cấp cho mục đích làm quen.
Giao dịch trên thị trường tài chính (đặc biệt là giao dịch sử dụng các công cụ biên) mở ra những cơ hội lớn và tạo điều kiện cho các nhà đầu tư sẵn sàng mạo hiểm để thu lợi nhuận, tuy nhiên nó mang trong mình nguy cơ rủi ro khá cao. Chính vì vậy trước khi tiến hành giao dịch cần phải xem xét mọi mặt vấn đề chấp nhận tiến hành giao dịch cụ thể xét theo quan điểm của nguồn lực tài chính sẵn có và mức độ am hiểu thị trường tài chính.
Sử dụng thông tin: sử dụng toàn bộ hay riêng biệt các dữ liệu trên trang web của công ty TeleTrade như một nguồn cung cấp thông tin nhất định. Việc sử dụng tư liệu từ trang web cần kèm theo liên kết đến trang teletrade.vn. Việc tự động thu thập số liệu cũng như thông tin từ trang web TeleTrade đều không được phép.
Xin vui lòng liên hệ với pr@teletrade.global nếu có câu hỏi.
ngân hàng