- Phân tích
- Tin tức và các công cụ
- Tin tức thị trường
- US Dollar flattens as markets turn all in about Fed rate cut
US Dollar flattens as markets turn all in about Fed rate cut
- The US Dollar struggles to find support as traders see Fed rate cuts as a given.
- All eyes will be on the Fed’s Chair Jerome Powell at Jackson Hole to confirm the cuts.
- The US Dollar index trades just above 101.00 and could fall to 100.00 if weak sentiment persists.
The US Dollar (USD) trades broadly flat after it saw heavy selling at the start of the US session on Wednesday, triggering another leg lower towards a fresh 2024 low. The Nonfarm Payrolls revision highlighted 818,000 fewer jobs than previously estimated, the largest downward revision in over a decade, confirming market concerns about the US job market. Later, the release of the Fed Minutes for the July meeting confirmed that some members of the Federal Open Market Committee (FOMC) vowed for a rate cut back then, making this move almost certain in September.
Although it looks like nothing can go wrong, big warning signs still need to be issued here. The Federal Reserve and Fed Chairman Jerome Powell have already advocated plenty of times that the risk of cutting too soon is one of their biggest fears. With the preliminary August Purchasing Managers Index (PMI) numbers, any strong figures might dampen the hope for either a big cut in September or further cuts down the line.
Daily digest market movers: Cat’s out of the bag
- Markets are having difficulties to read the Purchasing Managers Index numbers from Europe. France saw an uptick in its Services PMIs driven by the Olympic Games taking place, while Germany saw its Services PMIs come in below expectations. The German Manufacturing component even fell further into contraction, which is bad news for Europe’s main economy.
- At 12:30 GMT, the weekly US Jobless Claims are due:
- Initial Jobless Claims are expected to rise to 230,000 from 227,000.
- Continuing Claims stood at 1.864 million last week. No forecast available.
- At 13:45 GMT, S&P Global will release the US preliminary PMIs for August:
- The Services index is expected to remain quite stable, falling to 54 from 55 a month earlier.
- The Manufacturing index is not expected to move, remaining in contraction territory at 49.6.
- The Composite index is seen declining to 53.5 from 54.3.
- At 14:00 GMT, Existing Home Sales are due to come out. Seeing the recent sharp decline in mortgage applications from the Mortgage Bankers Association data released Wednesday, a decline in Existing Home Sales for July is expected as well. Sales fell by 5.4% the previous month.
- The Kansas Fed Manufacturing Activity tracker for August will be released at 15:00 GMT. The previous print was -12.
- Asian equity markets are in the green across the board in anticipation that rate cuts from the Fed are now unavoidable. US futures are lagging, though, by trading rather flat.
- The CME Fedwatch Tool shows a 67.5% chance of a 25 basis points (bps) interest rate cut by the Fed in September against a 32.5% chance for a 50 bps cut. Another 25 bps cut (if September is a 25 bps cut) is expected in November by 39.7%, while there is a 46.9% chance that rates will be 75 bps below the current levels and a 13.4% probability of rates being 100 basis points lower.
- The US 10-year benchmark rate trades at 3.81%, printing a fresh low for the week.
Economic Indicator
S&P Global Services PMI
The S&P Global Services Purchasing Managers Index (PMI), released on a monthly basis, is a leading indicator gauging business activity in the US services sector. As the services sector dominates a large part of the economy, the Services PMI is an important indicator gauging the state of overall economic conditions. The data is derived from surveys of senior executives at private-sector companies from the services sector. Survey responses reflect the change, if any, in the current month compared to the previous month and can anticipate changing trends in official data series such as Gross Domestic Product (GDP), industrial production, employment and inflation. A reading above 50 indicates that the services economy is generally expanding, a bullish sign for the US Dollar (USD). Meanwhile, a reading below 50 signals that activity among service providers is generally declining, which is seen as bearish for USD.
Read more.Next release: Thu Aug 22, 2024 13:45 (Prel)
Frequency: Monthly
Consensus: 54
Previous: 55
Source: S&P Global
US Dollar Index Technical Analysis: It could all end in tears
The US Dollar Index (DXY) has been falling like a rock this week and will very likely be unable to avoid a weekly loss. However, traders should refrain from diving in massively in trying to jump on the “sell the dollar” train as there are some elements to keep in the back of one's mind. As it stands, markets are expecting a 75 bps rate cut by November. That is a very big cut considering that the Fed is until this date still data dependent.
In this context, there is a big risk for a sharp upward correction in the DXY to recover some earlier losses. If US PMI numbers remain strong or even tick up further andFed Chairman Jerome Powell says that the Fed still remains data dependent and will want to watch recent data first before considering to start cutting, that would be a huge disappointment for markets. Traders seem to be expecting too many toys from Santa, while Santa might say he will want to wait with his deliveries of gifts in order to be sure that the market has been good enough.
Looking up, the DXY faces a long road to recovery. First, 101.90 is the level to reclaim. A steep 2% uprising would be needed to get the DXY to 103.18 from where it is trading now, around 101.00. A very heavy resistance level near 104.00 not only holds a pivotal technical value, but it also bears the 200-day Simple Moving Average (SMA) as the second heavyweight to cap price action.
On the downside, 100.62 (low from December 28) will be the next vital support in order to avoid another meltdown. Should it break, the low of July 14, 2023, at 99.58 will be the ultimate level to look out for.
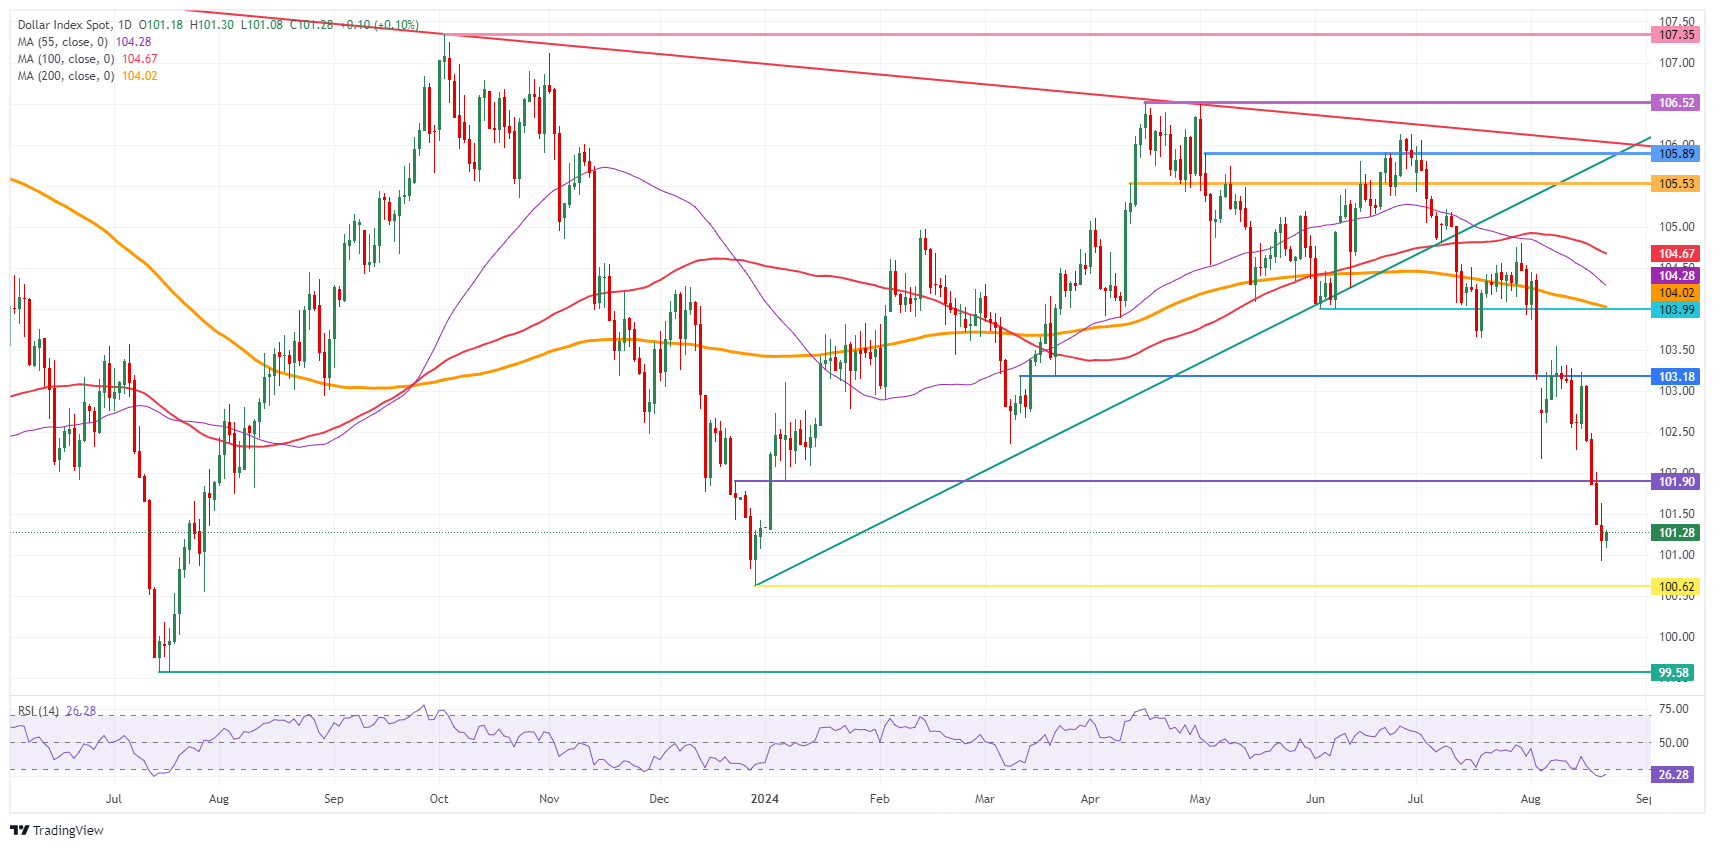
US Dollar Index: Daily Chart
US Dollar FAQs
The US Dollar (USD) is the official currency of the United States of America, and the ‘de facto’ currency of a significant number of other countries where it is found in circulation alongside local notes. It is the most heavily traded currency in the world, accounting for over 88% of all global foreign exchange turnover, or an average of $6.6 trillion in transactions per day, according to data from 2022. Following the second world war, the USD took over from the British Pound as the world’s reserve currency. For most of its history, the US Dollar was backed by Gold, until the Bretton Woods Agreement in 1971 when the Gold Standard went away.
The most important single factor impacting on the value of the US Dollar is monetary policy, which is shaped by the Federal Reserve (Fed). The Fed has two mandates: to achieve price stability (control inflation) and foster full employment. Its primary tool to achieve these two goals is by adjusting interest rates. When prices are rising too quickly and inflation is above the Fed’s 2% target, the Fed will raise rates, which helps the USD value. When inflation falls below 2% or the Unemployment Rate is too high, the Fed may lower interest rates, which weighs on the Greenback.
In extreme situations, the Federal Reserve can also print more Dollars and enact quantitative easing (QE). QE is the process by which the Fed substantially increases the flow of credit in a stuck financial system. It is a non-standard policy measure used when credit has dried up because banks will not lend to each other (out of the fear of counterparty default). It is a last resort when simply lowering interest rates is unlikely to achieve the necessary result. It was the Fed’s weapon of choice to combat the credit crunch that occurred during the Great Financial Crisis in 2008. It involves the Fed printing more Dollars and using them to buy US government bonds predominantly from financial institutions. QE usually leads to a weaker US Dollar.
Quantitative tightening (QT) is the reverse process whereby the Federal Reserve stops buying bonds from financial institutions and does not reinvest the principal from the bonds it holds maturing in new purchases. It is usually positive for the US Dollar.


© 2000-2026. Bản quyền Teletrade.
Trang web này được quản lý bởi Teletrade D.J. LLC 2351 LLC 2022 (Euro House, Richmond Hill Road, Kingstown, VC0100, St. Vincent and the Grenadines).
Thông tin trên trang web không phải là cơ sở để đưa ra quyết định đầu tư và chỉ được cung cấp cho mục đích làm quen.
Giao dịch trên thị trường tài chính (đặc biệt là giao dịch sử dụng các công cụ biên) mở ra những cơ hội lớn và tạo điều kiện cho các nhà đầu tư sẵn sàng mạo hiểm để thu lợi nhuận, tuy nhiên nó mang trong mình nguy cơ rủi ro khá cao. Chính vì vậy trước khi tiến hành giao dịch cần phải xem xét mọi mặt vấn đề chấp nhận tiến hành giao dịch cụ thể xét theo quan điểm của nguồn lực tài chính sẵn có và mức độ am hiểu thị trường tài chính.
Sử dụng thông tin: sử dụng toàn bộ hay riêng biệt các dữ liệu trên trang web của công ty TeleTrade như một nguồn cung cấp thông tin nhất định. Việc sử dụng tư liệu từ trang web cần kèm theo liên kết đến trang teletrade.vn. Việc tự động thu thập số liệu cũng như thông tin từ trang web TeleTrade đều không được phép.
Xin vui lòng liên hệ với pr@teletrade.global nếu có câu hỏi.
ngân hàng