- Phân tích
- Tin tức và các công cụ
- Tin tức thị trường
- EUR/GBP Price Forecast: Breaks below 0.8550; 14-day EMA appears as a next support
EUR/GBP Price Forecast: Breaks below 0.8550; 14-day EMA appears as a next support
- EUR/GBP broke below the nine-day EMA at 0.8539 level, suggesting a short-term bearish trend.
- The momentum indicator 14-day RSI still suggests a bullish bias for the currency cross.
- The 14-day EMA at 0.8520 level could act as immediate support.
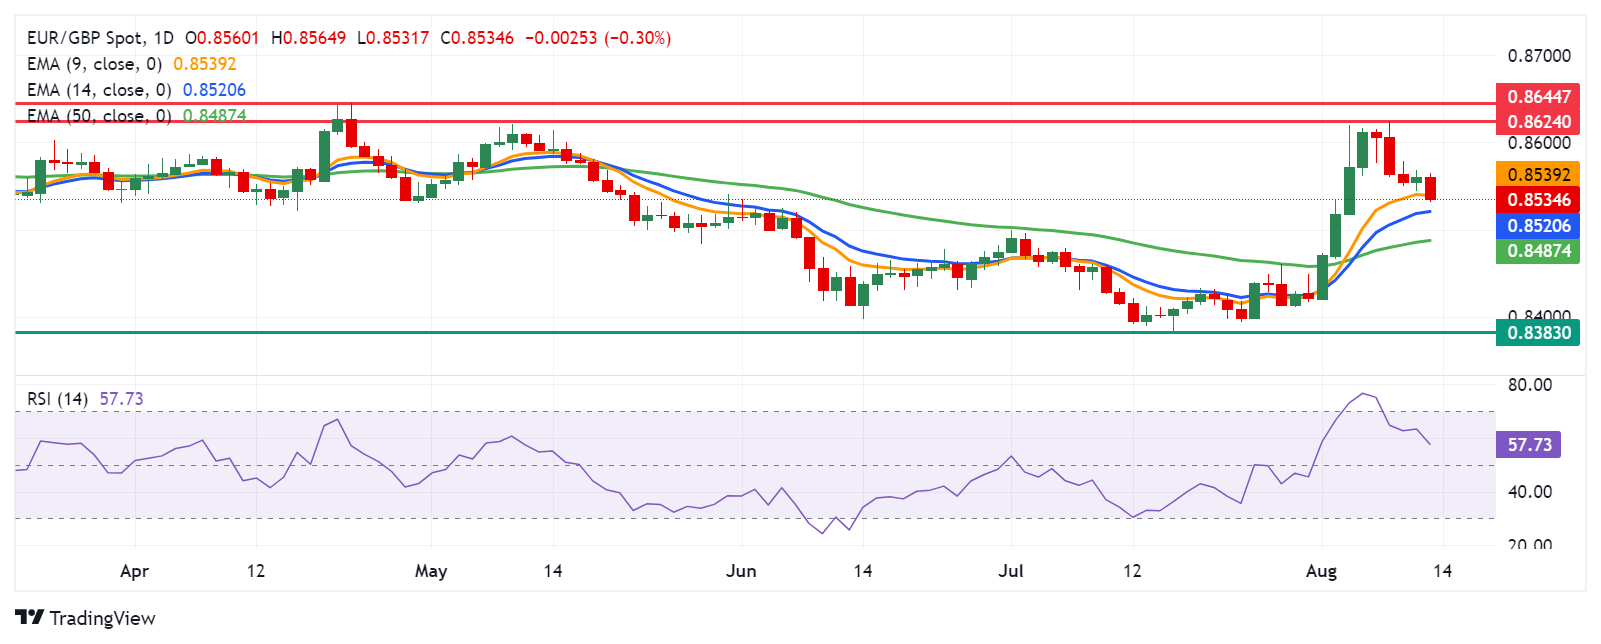
EUR/GBP retraces its recent gains from the previous session, trading around 0.8530 during the European hours on Tuesday. The daily chart analysis shows the EUR/GBP cross has broken below the nine-day Exponential Moving Average (EMA) at 0.8539 level, signaling the onset of a bearish trend in the short term.
However, the momentum indicator 14-day Relative Strength Index (RSI) remains above the 50 level, suggesting a bullish bias for the EUR/GBP cross. Further depreciation toward the 50 level would suggest the easing of bullish momentum.
In terms of resistance, the EUR/GBP cross could find an immediate barrier at a three-month high of 0.8624 level marked on August 8, followed by a seven-month high of 0.8644 level recorded on April 23. A break above the latter could strengthen the currency cross to explore the region around the psychological level of 0.8700.
On the downside, the immediate support appears at the 14-day EMA at 0.8520 level, followed by the EUR/GBP cross to test the 50-day EMA at 0.8487 level. A break below this support could suggest a confirmation of a bearish trend, potentially driving the cross toward a throwback support level at 0.8383.
EUR/GBP: Daily Chart
Euro PRICE Today
The table below shows the percentage change of Euro (EUR) against listed major currencies today. Euro was the weakest against the New Zealand Dollar.
| USD | EUR | GBP | JPY | CAD | AUD | NZD | CHF | |
|---|---|---|---|---|---|---|---|---|
| USD | 0.15% | -0.18% | 0.37% | -0.04% | -0.17% | 0.19% | 0.27% | |
| EUR | -0.15% | -0.32% | 0.21% | -0.22% | -0.33% | -0.47% | 0.12% | |
| GBP | 0.18% | 0.32% | 0.55% | 0.12% | -0.01% | -0.13% | 0.47% | |
| JPY | -0.37% | -0.21% | -0.55% | -0.44% | -0.53% | -0.67% | -0.09% | |
| CAD | 0.04% | 0.22% | -0.12% | 0.44% | -0.12% | -0.26% | 0.33% | |
| AUD | 0.17% | 0.33% | 0.00% | 0.53% | 0.12% | -0.11% | 0.47% | |
| NZD | -0.19% | 0.47% | 0.13% | 0.67% | 0.26% | 0.11% | 0.59% | |
| CHF | -0.27% | -0.12% | -0.47% | 0.09% | -0.33% | -0.47% | -0.59% |
The heat map shows percentage changes of major currencies against each other. The base currency is picked from the left column, while the quote currency is picked from the top row. For example, if you pick the Euro from the left column and move along the horizontal line to the US Dollar, the percentage change displayed in the box will represent EUR (base)/USD (quote).


© 2000-2026. Bản quyền Teletrade.
Trang web này được quản lý bởi Teletrade D.J. LLC 2351 LLC 2022 (Euro House, Richmond Hill Road, Kingstown, VC0100, St. Vincent and the Grenadines).
Thông tin trên trang web không phải là cơ sở để đưa ra quyết định đầu tư và chỉ được cung cấp cho mục đích làm quen.
Giao dịch trên thị trường tài chính (đặc biệt là giao dịch sử dụng các công cụ biên) mở ra những cơ hội lớn và tạo điều kiện cho các nhà đầu tư sẵn sàng mạo hiểm để thu lợi nhuận, tuy nhiên nó mang trong mình nguy cơ rủi ro khá cao. Chính vì vậy trước khi tiến hành giao dịch cần phải xem xét mọi mặt vấn đề chấp nhận tiến hành giao dịch cụ thể xét theo quan điểm của nguồn lực tài chính sẵn có và mức độ am hiểu thị trường tài chính.
Sử dụng thông tin: sử dụng toàn bộ hay riêng biệt các dữ liệu trên trang web của công ty TeleTrade như một nguồn cung cấp thông tin nhất định. Việc sử dụng tư liệu từ trang web cần kèm theo liên kết đến trang teletrade.vn. Việc tự động thu thập số liệu cũng như thông tin từ trang web TeleTrade đều không được phép.
Xin vui lòng liên hệ với pr@teletrade.global nếu có câu hỏi.
ngân hàng