- Phân tích
- Tin tức và các công cụ
- Tin tức thị trường
- USD/JPY Price Analysis: Plummets below 150.00, hits 5-month low and turns bearish
USD/JPY Price Analysis: Plummets below 150.00, hits 5-month low and turns bearish
- USD/JPY closes below 150.00 for the first time since March, hitting a five-month low of 148.51.
- Technical indicators show strong downtrend, with RSI suggesting potential for oversold rebound.
- Key resistance at 150.00 and 151.00, with support levels at 148.51, 148.00, and March low of 146.48.
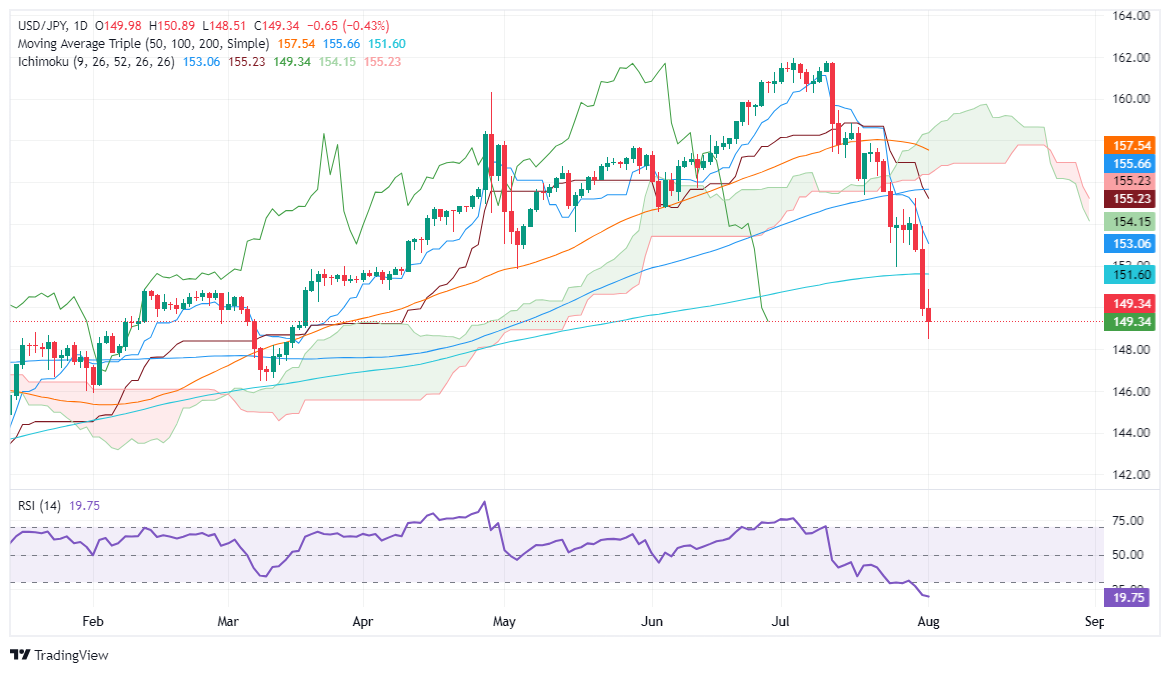
The USD/JPY descended on Thursday trading, breaking below the 150.00 psychological figure and achieving a daily close below the latter for the first time since March. The pair whipsawed in a 200-pip range, sending the Japanese Yen to a five-month high of 148.51. As Friday’s Asian session kicks in, the major trades at 149.34, virtually unchanged.
USD/JPY Price Analysis: Technical outlook
The USD/JPY pair has broken below the 200-day moving average (DMA) and is 500-plus pips below the Ichimoku Cloud (Kumo), confirming a strong downtrend. However, it has begun to show some signs of being overextended.
The Relative Strength Index (RSI) has pierced below the 20 reading, and when that happens on a strong downtrend, RSI becomes oversold meaning the USD/JPY is subject to a mean reversion move.
If USD/JPY climbs past the 150.00 psychological figure, the first resistance would be the 151.00 mark. Once cleared, the 200-DMA emerges as the next resistance at 151.59, ahead of the 152.00 mark.
On the other hand, and the path of least resistance, if the pair drops below 148.51, the next demand zone would be 148.00, and with the Average True Range (ATR) being at 169 pips, the next support would be the March 8 bottom at 146.48.
USD/JPY Price Action – Daily Chart
Japanese Yen PRICE Today
The table below shows the percentage change of Japanese Yen (JPY) against listed major currencies today. Japanese Yen was the strongest against the Australian Dollar.
| USD | EUR | GBP | JPY | CAD | AUD | NZD | CHF | |
|---|---|---|---|---|---|---|---|---|
| USD | -0.01% | 0.00% | -0.03% | -0.02% | 0.04% | 0.02% | 0.00% | |
| EUR | 0.00% | 0.00% | 0.00% | -0.04% | 0.05% | 0.01% | 0.02% | |
| GBP | -0.01% | -0.00% | -0.04% | -0.03% | 0.03% | 0.00% | 0.03% | |
| JPY | 0.03% | 0.00% | 0.04% | 0.01% | 0.06% | 0.02% | 0.05% | |
| CAD | 0.02% | 0.04% | 0.03% | -0.01% | 0.06% | 0.06% | 0.06% | |
| AUD | -0.04% | -0.05% | -0.03% | -0.06% | -0.06% | -0.02% | -0.01% | |
| NZD | -0.02% | -0.01% | 0.00% | -0.02% | -0.06% | 0.02% | 0.03% | |
| CHF | -0.00% | -0.02% | -0.03% | -0.05% | -0.06% | 0.01% | -0.03% |
The heat map shows percentage changes of major currencies against each other. The base currency is picked from the left column, while the quote currency is picked from the top row. For example, if you pick the Japanese Yen from the left column and move along the horizontal line to the US Dollar, the percentage change displayed in the box will represent JPY (base)/USD (quote).


© 2000-2026. Bản quyền Teletrade.
Trang web này được quản lý bởi Teletrade D.J. LLC 2351 LLC 2022 (Euro House, Richmond Hill Road, Kingstown, VC0100, St. Vincent and the Grenadines).
Thông tin trên trang web không phải là cơ sở để đưa ra quyết định đầu tư và chỉ được cung cấp cho mục đích làm quen.
Giao dịch trên thị trường tài chính (đặc biệt là giao dịch sử dụng các công cụ biên) mở ra những cơ hội lớn và tạo điều kiện cho các nhà đầu tư sẵn sàng mạo hiểm để thu lợi nhuận, tuy nhiên nó mang trong mình nguy cơ rủi ro khá cao. Chính vì vậy trước khi tiến hành giao dịch cần phải xem xét mọi mặt vấn đề chấp nhận tiến hành giao dịch cụ thể xét theo quan điểm của nguồn lực tài chính sẵn có và mức độ am hiểu thị trường tài chính.
Sử dụng thông tin: sử dụng toàn bộ hay riêng biệt các dữ liệu trên trang web của công ty TeleTrade như một nguồn cung cấp thông tin nhất định. Việc sử dụng tư liệu từ trang web cần kèm theo liên kết đến trang teletrade.vn. Việc tự động thu thập số liệu cũng như thông tin từ trang web TeleTrade đều không được phép.
Xin vui lòng liên hệ với pr@teletrade.global nếu có câu hỏi.
ngân hàng