- Phân tích
- Tin tức và các công cụ
- Tin tức thị trường
- Silver Price Analysis: XAG/USD seems vulnerable to slide further while below 100-day SMA
Silver Price Analysis: XAG/USD seems vulnerable to slide further while below 100-day SMA
- Silver attracts some buyers and moves away from over a two-month low set on Thursday.
- The technical setup supports prospects for the emergence of fresh selling at higher levels.
- Strength beyond the 100-day SMA support breakpoint is needed to negate the negative bias.
Silver (XAG/USD) edges higher during the Asian session on Friday and for now, seems to have snapped a two-day losing streak to its lowest level since May 9, around the $27.45 region touched the previous day. The white metal, however, struggles to build on the strength beyond the $28.00 mark and remains on track to register losses for the third successive week.
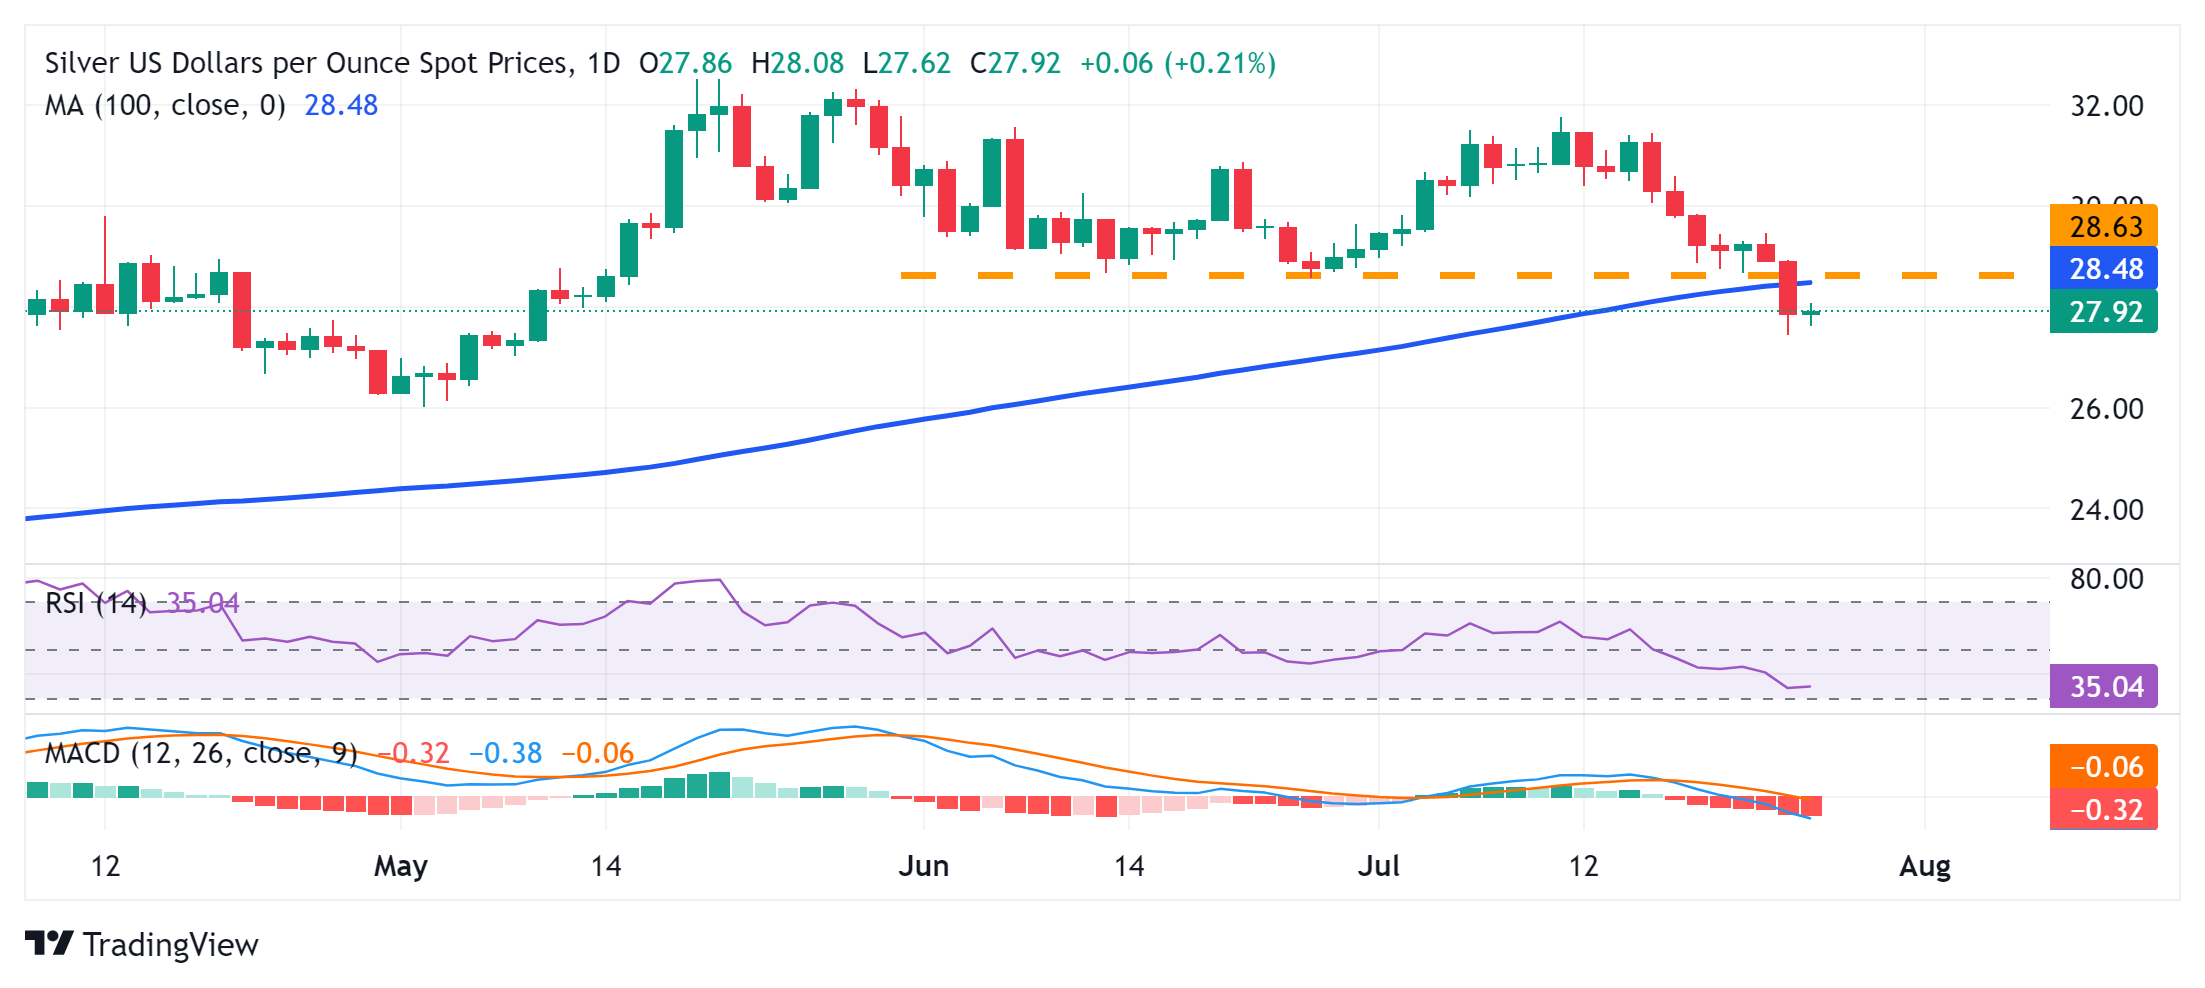
From a technical perspective, the overnight breakdown through the June swing low, around the $28.60-$28.55 region, which coincided with the 100-day Simple Moving Average (SMA), was seen as a fresh trigger for bearish traders. Moreover, oscillators on the daily chart have been gaining negative traction and are still away from being in the oversold territory, suggesting that the path of least resistance for the XAG/USD is to the downside.
Hence, any subsequent move up is more likely to attract fresh sellers and remain capped near the $28.55-$28.60 zone, or the 100-day SMA support breakpoint. The said area should now act as a key pivotal point, which if cleared decisively might trigger a short-covering rally. The XAG/USD might then surpass the $29.00 round-figure mark and accelerate the momentum towards the next relevant hurdle near the $29.40-$29.45 region, or the weekly peak.
Some follow-through buying should allow bulls to aim back to reclaim the $30.00 psychological mark. The upward trajectory could extend further towards the $30.35-$30.40 intermediate hurdle before the XAG/USD climbs to the $31.00 round-figure mark en route to the $31.40-$31.45 supply zone and the monthly peak, around the $31.75 region.
On the flip side, the Asian session low, around the $27.65-$27.60 area, could protect the immediate downside ahead of the $27.45 region, or the multi-month low touched on Thursday. A convincing break below the latter could make the XAG/USD vulnerable to accelerate the fall to the $27.00 mark, en route to the $26.60-$26.55 intermediate support, before eventually dropping to the 200-day SMA support, currently pegged near the $26.00 round figure.
Silver daily chart
Silver FAQs
Silver is a precious metal highly traded among investors. It has been historically used as a store of value and a medium of exchange. Although less popular than Gold, traders may turn to Silver to diversify their investment portfolio, for its intrinsic value or as a potential hedge during high-inflation periods. Investors can buy physical Silver, in coins or in bars, or trade it through vehicles such as Exchange Traded Funds, which track its price on international markets.
Silver prices can move due to a wide range of factors. Geopolitical instability or fears of a deep recession can make Silver price escalate due to its safe-haven status, although to a lesser extent than Gold's. As a yieldless asset, Silver tends to rise with lower interest rates. Its moves also depend on how the US Dollar (USD) behaves as the asset is priced in dollars (XAG/USD). A strong Dollar tends to keep the price of Silver at bay, whereas a weaker Dollar is likely to propel prices up. Other factors such as investment demand, mining supply – Silver is much more abundant than Gold – and recycling rates can also affect prices.
Silver is widely used in industry, particularly in sectors such as electronics or solar energy, as it has one of the highest electric conductivity of all metals – more than Copper and Gold. A surge in demand can increase prices, while a decline tends to lower them. Dynamics in the US, Chinese and Indian economies can also contribute to price swings: for the US and particularly China, their big industrial sectors use Silver in various processes; in India, consumers’ demand for the precious metal for jewellery also plays a key role in setting prices.
Silver prices tend to follow Gold's moves. When Gold prices rise, Silver typically follows suit, as their status as safe-haven assets is similar. The Gold/Silver ratio, which shows the number of ounces of Silver needed to equal the value of one ounce of Gold, may help to determine the relative valuation between both metals. Some investors may consider a high ratio as an indicator that Silver is undervalued, or Gold is overvalued. On the contrary, a low ratio might suggest that Gold is undervalued relative to Silver.


© 2000-2026. Bản quyền Teletrade.
Trang web này được quản lý bởi Teletrade D.J. LLC 2351 LLC 2022 (Euro House, Richmond Hill Road, Kingstown, VC0100, St. Vincent and the Grenadines).
Thông tin trên trang web không phải là cơ sở để đưa ra quyết định đầu tư và chỉ được cung cấp cho mục đích làm quen.
Giao dịch trên thị trường tài chính (đặc biệt là giao dịch sử dụng các công cụ biên) mở ra những cơ hội lớn và tạo điều kiện cho các nhà đầu tư sẵn sàng mạo hiểm để thu lợi nhuận, tuy nhiên nó mang trong mình nguy cơ rủi ro khá cao. Chính vì vậy trước khi tiến hành giao dịch cần phải xem xét mọi mặt vấn đề chấp nhận tiến hành giao dịch cụ thể xét theo quan điểm của nguồn lực tài chính sẵn có và mức độ am hiểu thị trường tài chính.
Sử dụng thông tin: sử dụng toàn bộ hay riêng biệt các dữ liệu trên trang web của công ty TeleTrade như một nguồn cung cấp thông tin nhất định. Việc sử dụng tư liệu từ trang web cần kèm theo liên kết đến trang teletrade.vn. Việc tự động thu thập số liệu cũng như thông tin từ trang web TeleTrade đều không được phép.
Xin vui lòng liên hệ với pr@teletrade.global nếu có câu hỏi.
ngân hàng