- Phân tích
- Tin tức và các công cụ
- Tin tức thị trường
- USD/JPY Price Analysis: Correction from top of channel finds support
USD/JPY Price Analysis: Correction from top of channel finds support
- USD/JPY has corrected back after touching the top of a rising channel.
- It has found support at a key support and resistance level and found its feet.
- The outlook remains bearish on balance in the short-term but the risk of a recovery has increased.
USD/JPY has corrected back after touching the top of a rising channel it has been in since the start of 2023.
USD/JPY Daily Chart
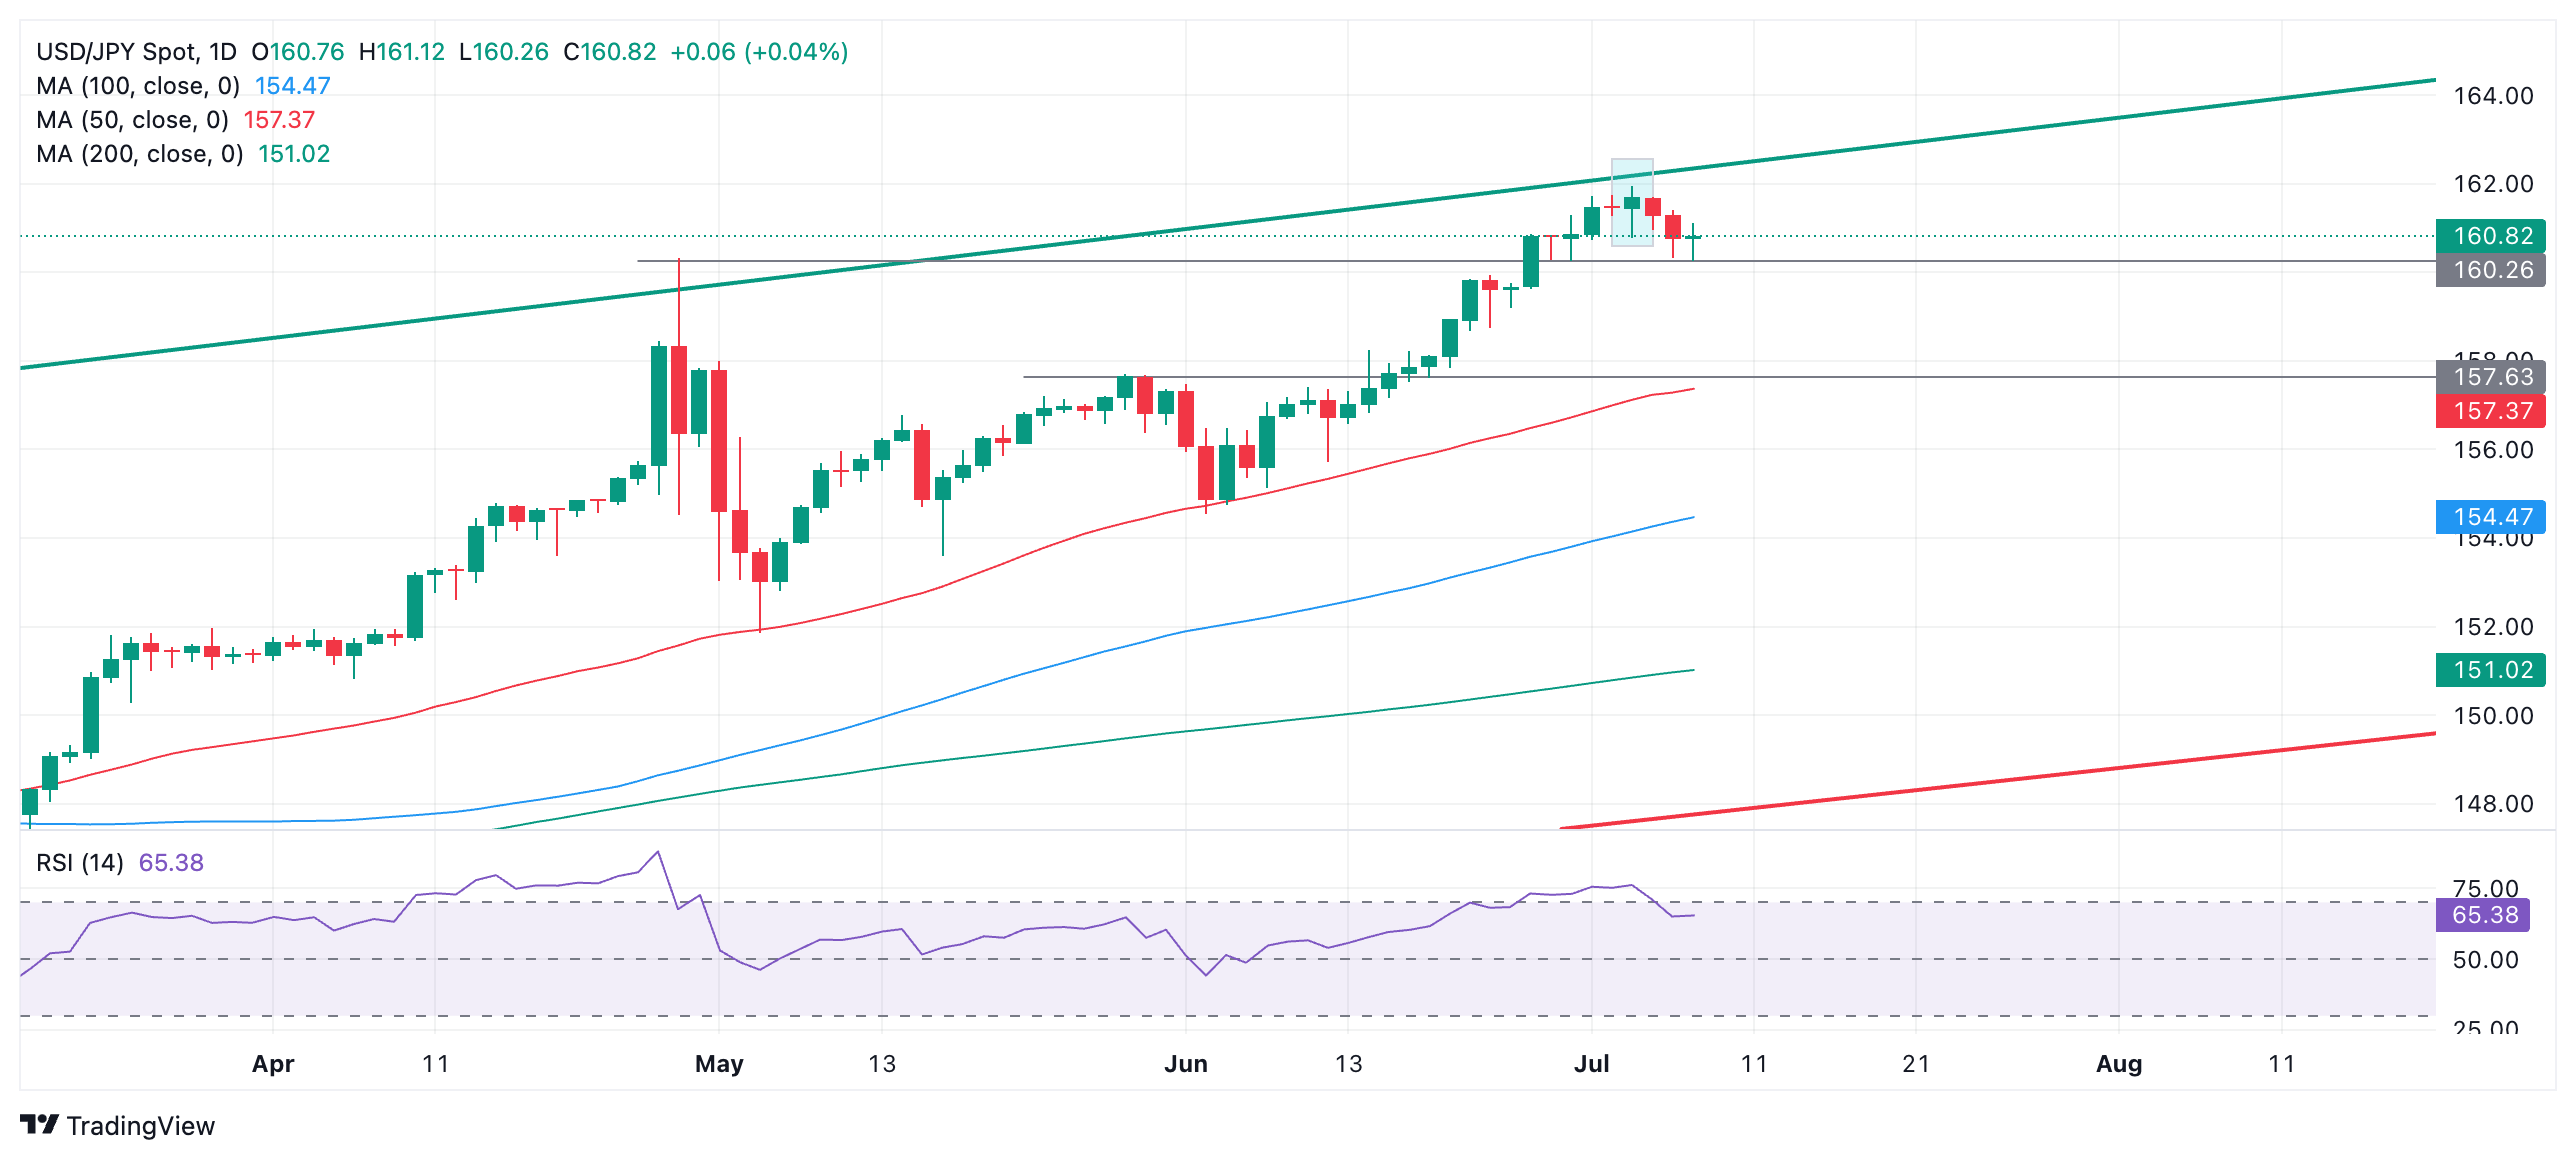
USD/JPY posted a bearish Hanging Man Japanese candlestick pattern on Wednesday July 3 (blue-shaded rectangle). The Hanging Man develops when a candle forms at a peak with a small body near its high and a long wick below. It was followed by a bearish down day, providing bearish confirmation.
USD/JPY proceeded to sell-off down to support from the April 29 high at 160.32, forming a price gap at the end of the move down – a possible sign of exhaustion.
USD/JPY 4-hour Chart
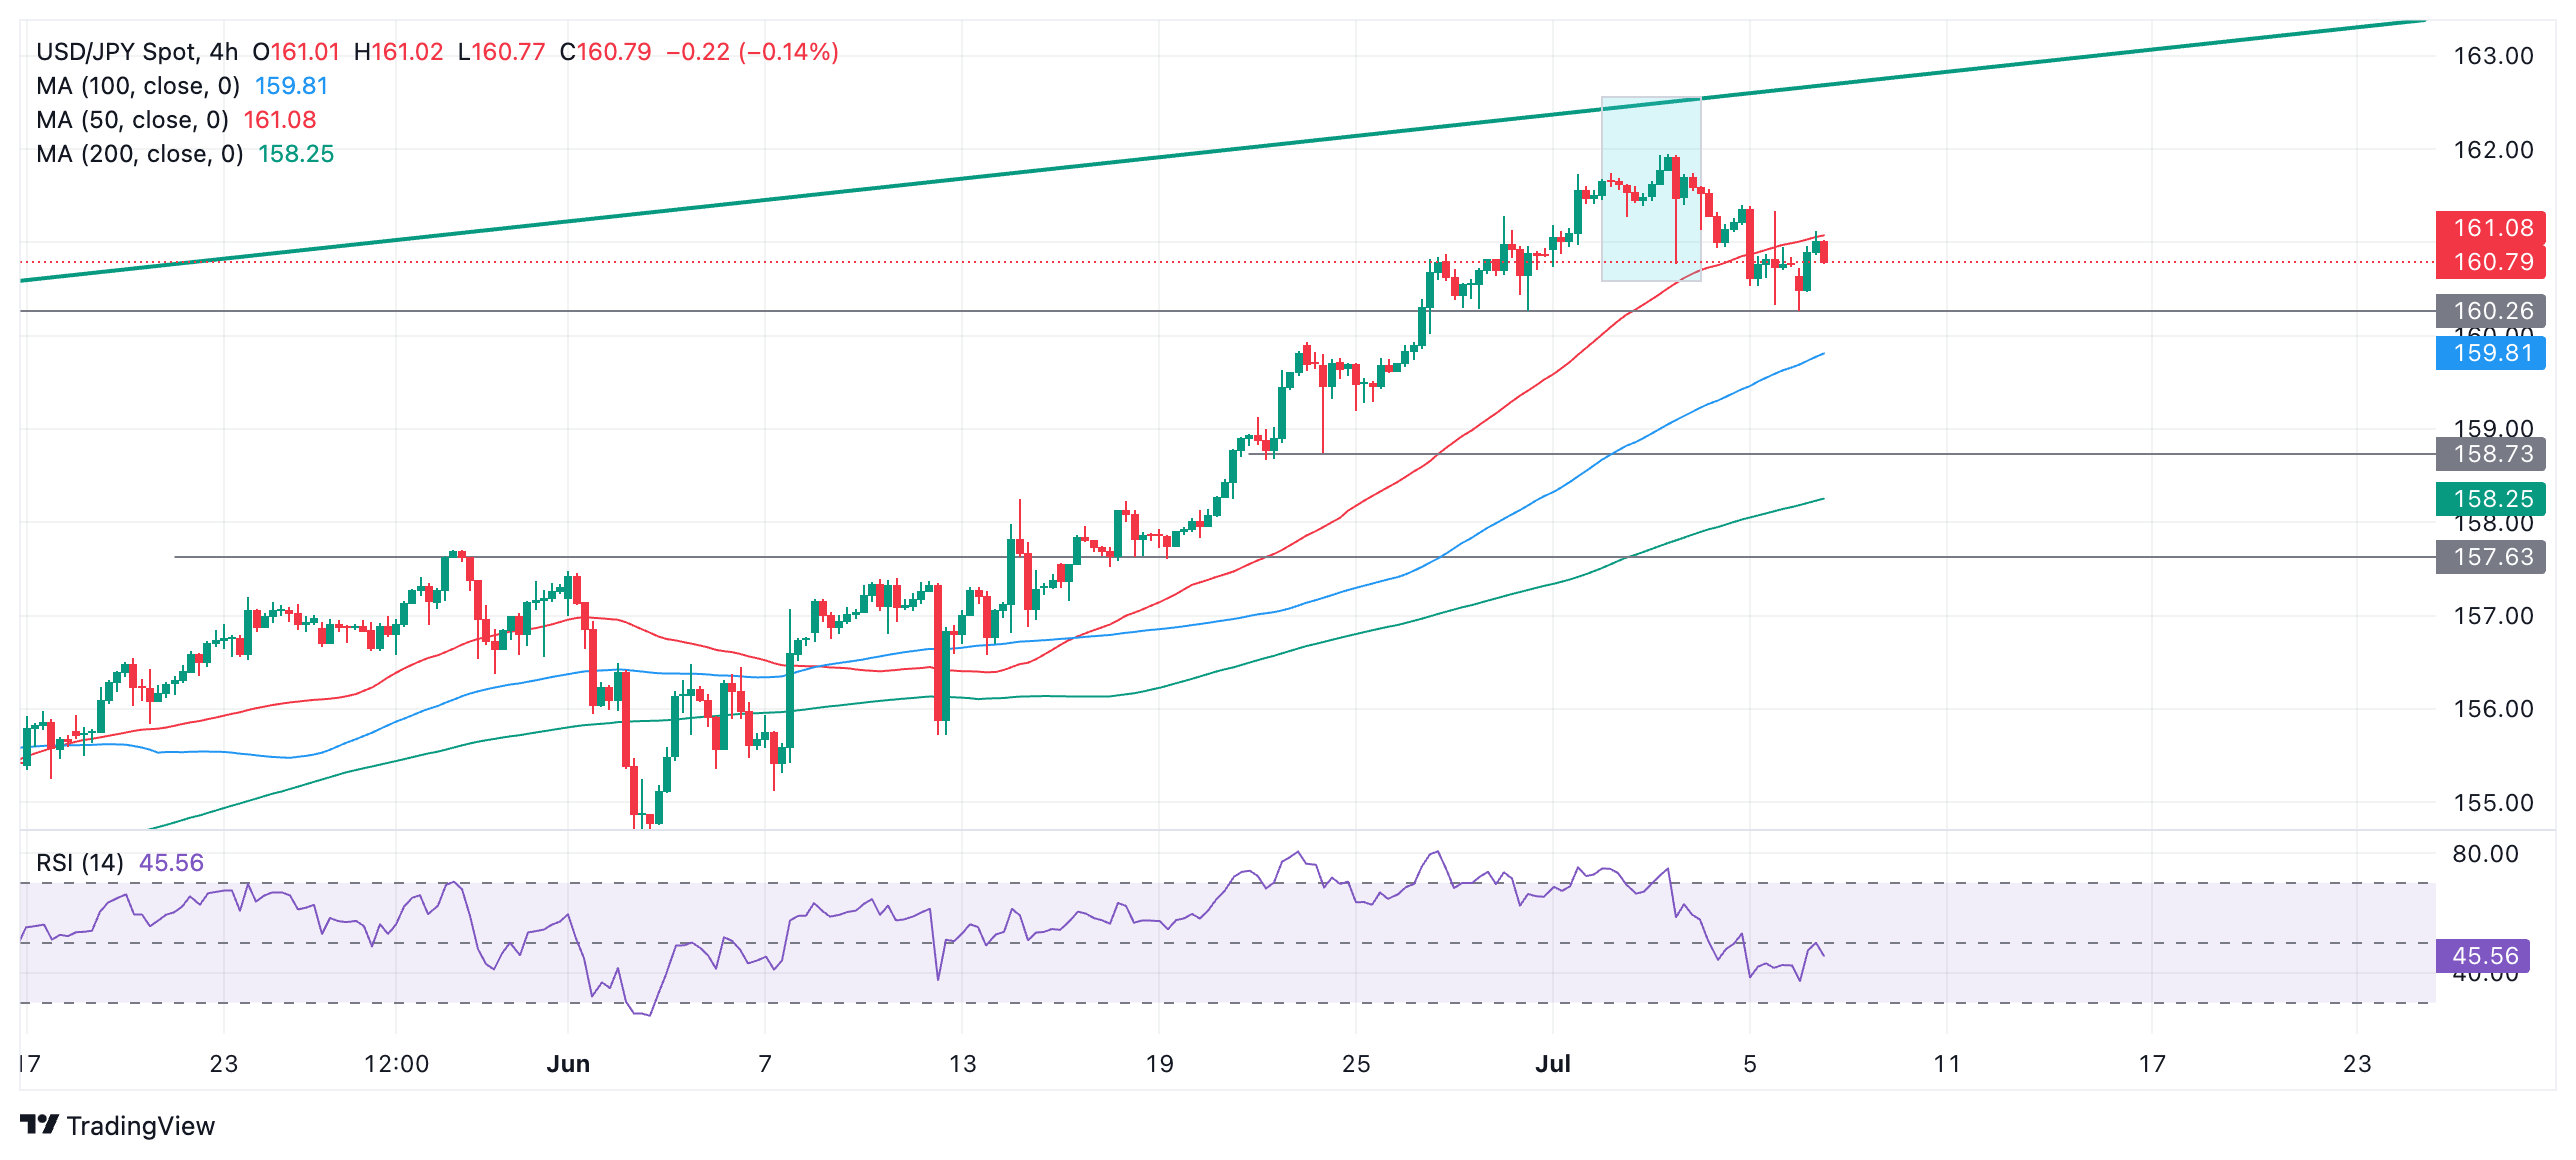
The pair has since recovered on July 8 (today) and filled the gap in the process. It is currently trading up against resistance from the 50-period Simple Moving Average (SMA).
Given the possible exhaustion gap that formed at the end of the sell-off, and the fact that it is in a strong medium and long-term uptrend, there is a risk the pair could continue recovering. Most corrections are composed of three waves and so far the rebound has only formed one complete wave. It is possible it could at the least recover even higher, to a target at 161.40, the July 5 high, as it completes.
As things stand the pair technically remains in short-term downtrend which given “the trend is your friend” could also potentially extend.
A break below 160.26, the July 8 lows, would provide confirmation of more downside to a probable target at 158.73, the June 24 low.
On the other hand, a break above 161.50 would be a bullish sign, and above 161.95 (July 3 high) would establish a higher high and indicate a resumption of the dominant uptrend. Such a move would probably reach the 162.70s initially, at the top of the rising channel, where it would again encounter resistance.


© 2000-2026. Bản quyền Teletrade.
Trang web này được quản lý bởi Teletrade D.J. LLC 2351 LLC 2022 (Euro House, Richmond Hill Road, Kingstown, VC0100, St. Vincent and the Grenadines).
Thông tin trên trang web không phải là cơ sở để đưa ra quyết định đầu tư và chỉ được cung cấp cho mục đích làm quen.
Giao dịch trên thị trường tài chính (đặc biệt là giao dịch sử dụng các công cụ biên) mở ra những cơ hội lớn và tạo điều kiện cho các nhà đầu tư sẵn sàng mạo hiểm để thu lợi nhuận, tuy nhiên nó mang trong mình nguy cơ rủi ro khá cao. Chính vì vậy trước khi tiến hành giao dịch cần phải xem xét mọi mặt vấn đề chấp nhận tiến hành giao dịch cụ thể xét theo quan điểm của nguồn lực tài chính sẵn có và mức độ am hiểu thị trường tài chính.
Sử dụng thông tin: sử dụng toàn bộ hay riêng biệt các dữ liệu trên trang web của công ty TeleTrade như một nguồn cung cấp thông tin nhất định. Việc sử dụng tư liệu từ trang web cần kèm theo liên kết đến trang teletrade.vn. Việc tự động thu thập số liệu cũng như thông tin từ trang web TeleTrade đều không được phép.
Xin vui lòng liên hệ với pr@teletrade.global nếu có câu hỏi.
ngân hàng