- Phân tích
- Tin tức và các công cụ
- Tin tức thị trường
- Silver Price Analysis: XAG/USD climbs above $29.00 on soft US PCE
Silver Price Analysis: XAG/USD climbs above $29.00 on soft US PCE
- Silver up 0.49, boosted by lower US inflation data and Fed rate cut prospects.
- Technical analysis shows bearish trends; RSI indicates selling pressure with lower highs, lower lows.
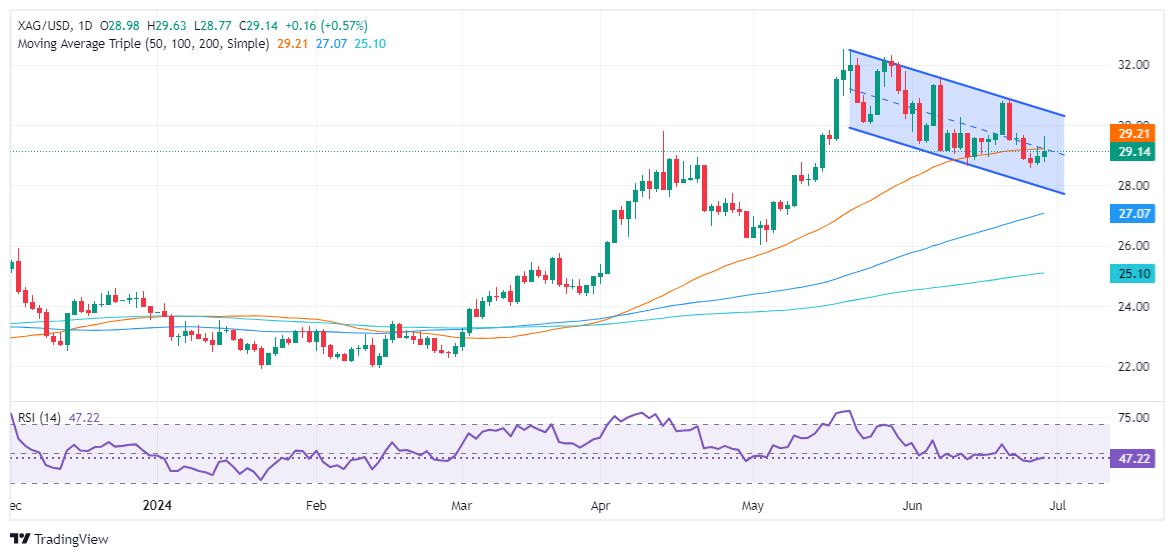
- Resistance levels: $29.19 (50-DMA), $31.54 (June 7 high), $32.00, $32.51 (YTD high).
- Support points: $29.00, $28.28 (June 10, 2021, high), $28.00, $27.01 (May 8 low), $26.82 (100-DMA).
Silver price registered gains of 0.49% as inflationary figures released by the US Bureau of Economic Analysis (BEA) dipped as expected, reigniting Fed rate cut hopes amongst investors. Therefore, the Greenback edged lower, while XAG/USD traded at $29.13 after hitting a daily low of $28.78.
XAG/USD Price Analysis: Technical outlook
After forming a quasi ‘double top,’ the Silver price extended its losses, which amounted to more than 10% after it peaked at around $32.51 on May 20. The uptrend seems exhausted, as shown by different signals: momentum shifted bearishly as the Relative Strength Index (RSI) entered seller territory, while successive series of lower highs and lower lows confirm the change of the trend.
If buyers want to regain control, they must clear the 50-day moving average (DMA) at $29.19. Once hurdle, the next level would be the June 7 high of $31.54. Clearing this would aim for $32.00 before challenging the year-to-date (YTD) high of $32.51.
Conversely, and the path of least resistance, if XAG/USD slides below $29.00 that could put into play the June 10, 2021, high turned support at $28.28, ahead of exposing the psychological $28.00 mark.
Key support levels lie underneath the latter, with the May 8 swing low of $27.01 up next before challenging the 100-DMA at $26.82.
XAG/USD Price Action – Daily Chart
Economic Indicator
Personal Consumption Expenditures - Price Index (MoM)
The Personal Consumption Expenditures (PCE), released by the US Bureau of Economic Analysis on a monthly basis, measures the changes in the prices of goods and services purchased by consumers in the United States (US).. The MoM figure compares prices in the reference month to the previous month. Price changes may cause consumers to switch from buying one good to another and the PCE Deflator can account for such substitutions. This makes it the preferred measure of inflation for the Federal Reserve. Generally speaking, a high reading is bullish for the US Dollar (USD), while a low reading is bearish.
Read more.Last release: Fri Jun 28, 2024 12:30
Frequency: Monthly
Actual: 0%
Consensus: 0%
Previous: 0.3%
Source: US Bureau of Economic Analysis


© 2000-2026. Bản quyền Teletrade.
Trang web này được quản lý bởi Teletrade D.J. LLC 2351 LLC 2022 (Euro House, Richmond Hill Road, Kingstown, VC0100, St. Vincent and the Grenadines).
Thông tin trên trang web không phải là cơ sở để đưa ra quyết định đầu tư và chỉ được cung cấp cho mục đích làm quen.
Giao dịch trên thị trường tài chính (đặc biệt là giao dịch sử dụng các công cụ biên) mở ra những cơ hội lớn và tạo điều kiện cho các nhà đầu tư sẵn sàng mạo hiểm để thu lợi nhuận, tuy nhiên nó mang trong mình nguy cơ rủi ro khá cao. Chính vì vậy trước khi tiến hành giao dịch cần phải xem xét mọi mặt vấn đề chấp nhận tiến hành giao dịch cụ thể xét theo quan điểm của nguồn lực tài chính sẵn có và mức độ am hiểu thị trường tài chính.
Sử dụng thông tin: sử dụng toàn bộ hay riêng biệt các dữ liệu trên trang web của công ty TeleTrade như một nguồn cung cấp thông tin nhất định. Việc sử dụng tư liệu từ trang web cần kèm theo liên kết đến trang teletrade.vn. Việc tự động thu thập số liệu cũng như thông tin từ trang web TeleTrade đều không được phép.
Xin vui lòng liên hệ với pr@teletrade.global nếu có câu hỏi.
ngân hàng